Embed Size (px)
Citation preview
SRR-CWDA-2011-00117 Revision 1
Liquid Waste Tank Residuals Sampling- Quality Assurance Program Plan
July 2013
Prepared by: Savannah River Remediation LLC Closure and Waste Disposal Authority Aiken, SC 29808
Prepared for U.S. Department of Energy Under Contract No. DE-AC09-09SR22505
Liquid Waste Tank Residuals Sampling- SRR-CWDA-2011-00117 Quality Assurance Program Plan Revision 1 July 2013
Page 2 of 99
REVISION SUMMARY
REV. # DESCRIPTION DATE OF ISSUE
0 Initial Submittal 2/29/2012
1 Document updated to incorporate changes, corrections, clarifications and additional information since initial submittal. Many updates reflect insight gained from LWTRSAPP and LWTRS-QAPP implementation for Tank 16 residuals sampling.
7/31/2013
Liquid Waste Tank Residuals Sampling- SRR-CWDA-2011-00117 Quality Assurance Program Plan Revision 1 July 2013
Page 3 of 99
SECTION A PROJECT MANAGEMENT
A1 Title and Approvals
Title: Liquid Waste Tank Residuals Sampling-Quality Assurance Program Plan
Site Location: F- and H-Area Tank Farms Savannah River Site Aiken, South Carolina
Lead Organization: Savannah River Remediation LLC Closure and Waste Disposal Authority
Preparer: J. P. Pavletich Closure and Waste Disposal Authority Savannah River Remediation LLC 803-557-9355
Preparation Date: July 2013
Liquid Waste Tank Residuals Sampling- SRR-CWDA-2011-00117 Quality Assurance Program Plan Revision 1 July 2013
Page 5 of 99
A2 Table of Contents
REVISION SUMMARY .............................................................................................................. 2
SECTION A PROJECT MANAGEMENT ............................................................................. 3
A1 Title and Approvals ......................................................................................................... 3
APPROVALS ................................................................................................................................ 4
A2 Table of Contents ............................................................................................................ 5
LIST OF FIGURES ...................................................................................................................... 8
LIST OF TABLES ........................................................................................................................ 8
ACRONYMS/ABBREVIATIONS .............................................................................................. 9
A3 Distribution List1 ........................................................................................................... 12
A4 Project Organization .................................................................................................... 13 A4.1 Key Individuals ........................................................................................................13 A4.2 Roles and Responsibilities .......................................................................................13 A4.3 Organization Responsible for Quality Assurance Program Plan Maintenance,
Updating and Distribution .......................................................................................14 A4.4 Organization Chart ...................................................................................................14
A5 Problem Definition/Background ................................................................................... 15 A5.1 Reason for the Study ................................................................................................15 A5.2 Explanation of Decisions and Actions to be taken with the Information
Obtained ..................................................................................................................16 A5.3 Identification of Regulatory Information, Applicable Criteria, or Action Limits
that will Impact the Study .......................................................................................16
A6 Project/Task Description and Schedule ........................................................................ 17 A6.1 Summary of Work to be Completed ........................................................................17 A6.2 Project Schedule .......................................................................................................20 A6.3 Location of Study Area ............................................................................................20 A6.4 Resource Management .............................................................................................21
A7 Data Quality Objectives and Data Quality Indicators ................................................. 22 A7.1 Identification of Measurement Performance Criteria ..............................................22 A7.2 Data Quality Indicators ............................................................................................22 A7.3 Data Quality Objectives Process ..............................................................................41
A8 Training and Certification ............................................................................................ 44
A9 Documentation and Records ......................................................................................... 45 A9.1 QAPP Distribution ...................................................................................................45 A9.2 Data Report Package ................................................................................................45 A9.3 Other Applicable Records and Documents ..............................................................49 A9.4 Project Information Retention ..................................................................................49 A9.5 Data Records Backup ...............................................................................................49
Liquid Waste Tank Residuals Sampling- SRR-CWDA-2011-00117 Quality Assurance Program Plan Revision 1 July 2013
Page 6 of 99
SECTION B MEASUREMENT/DATA ACQUISITION .................................................... 50
B1 Sampling Process/Experimental Design ....................................................................... 50
B2 Sampling Methods ......................................................................................................... 53
B3 Sampling Handling and Custody .................................................................................. 56
B4 Analytical Methods ....................................................................................................... 58 B4.1 Identify Standard Operating Procedures ..................................................................58 B4.2 Identify Equipment and Instrumentation .................................................................58 B4.3 Specify Measurement Performance Criteria ............................................................58 B4.4 Identify Procedures to Follow When Failures Occur ..............................................58 B4.7 Provide Method Validation and SOPs for Nonstandard Methods ...........................66
B5 Quality Control Requirements ...................................................................................... 66 B5.1 Quality Control Samples ..........................................................................................67 B5.2 Quality Control Limit Exceedance and Corrective Action ......................................70 B5.3 Quality Control Statistical Analysis .........................................................................70
B6 Instrument/Equipment Testing, Inspection, and Maintenance ..................................... 71 B6.1 Identification of Field and Laboratory Equipment ..................................................71 B6.2 Identification of Equipment Testing Criteria ...........................................................72 B6.3 Availability and Location of Equipment Spare Parts ..............................................73 B6.4 Procedures for Inspecting Equipment Prior to Use ..................................................73 B6.5 Responsibility for Testing, Inspection and Maintenance .........................................73 B6.6 Equipment Deficiency Corrective Action ................................................................73
B7 Instrument Calibration and Frequency ........................................................................ 73 B7.1 Instruments, Equipment and Tools to be Calibrated and Frequency .......................73 B7.2 Calibration Performance and Documentation ..........................................................77 B7.3 Deficiency Resolution and Documentation .............................................................77
B8 Inspection/Acceptance Requirements for Supplies and Consumables.......................... 77 B8.1 Identification of Critical Supplies and Consumables ...............................................78 B8.2 Responsibility for Critical Supply and Consumables Acquisition ..........................78
B9 Data Acquisition Requirements (Non-Direct Measurement) ........................................ 78 B9.1 Identification of Data Sources .................................................................................79 B9.2 Intended Use of Information and Selection Rationale .............................................79 B9.3 Data Acceptance Criteria .........................................................................................79 B9.4 Identification of Key Resources/Support Facilities Needed ....................................79
B10 Data Management ......................................................................................................... 80 B10.1 Describe Data Management Scheme .......................................................................80 B10.2 Standard Record-Keeping Practices and Document Control System ......................82 B10.3 Data Handling Equipment/Procedures .....................................................................82 B10.4 Responsibility for Data Management ......................................................................85 B10.5 Process for Data Archiving and Retrieval ...............................................................85 B10.6 Hardware and Software Configuration Acceptability ..............................................85 B10.7 Data Management Checklists and Forms ................................................................86
Liquid Waste Tank Residuals Sampling- SRR-CWDA-2011-00117 Quality Assurance Program Plan Revision 1 July 2013
Page 7 of 99
SECTION C ASSESSMENT AND OVERSIGHT ................................................................ 87
C1 Assessment and Response Actions ................................................................................ 87
C2 Reports to Management ................................................................................................ 90
SECTION D DATA VERIFICATION AND USABILITY .................................................. 91
D1 Data Review and Verification ....................................................................................... 91
D2 Data Validation and Verification Methods ................................................................... 93 D2.1 Process for Laboratory Data Validation ..................................................................93 D2.2 Responsibilities for Verifying and Validating Project Data ....................................94 D2.3 Identify Issue Resolution Process ............................................................................94 D2.4 Identify Checklists, Forms and Calculations ...........................................................94
D3 Reconciliation with User Requirements ........................................................................ 94 D3.1 Procedures to Evaluate the Usability of the Data ....................................................94 D3.2 Limitations on Data Use ..........................................................................................96
REFERENCES ............................................................................................................................ 97
Attachment 1: Liquid Waste Tank Residuals Sampling: Chain-of-Custody Form ....... A.1-1
Attachment 2: SRNL Analytical Method Descriptions and Analytical Operating Procedures ................................................................................................................. A.2-1
Attachment 3: Analytical Data Verification Checklists .................................................... A.3-1
Attachment 4: Records Completeness Checklists .............................................................. A.4-1
Attachment 5: Data Validation Protocols and Checklists ................................................. A.5-1
Liquid Waste Tank Residuals Sampling- SRR-CWDA-2011-00117 Quality Assurance Program Plan Revision 1 July 2013
Page 8 of 99
LIST OF FIGURES
Figure A4-1: Functional Organization Structure for Liquid Waste Tank Residuals Sampling Program ..............................................................................................................................15
Figure A6-1: Liquid Waste Tank Residuals Sampling and Analysis Program Process ...............18
Figure A6-2: General Layout of F-Area Tank Farm ....................................................................20
Figure A6-3: General Layout of H-Area Tank Farm ....................................................................21
Figure B1-1: Waste Tank Sampling and Analysis Planning Process ...........................................51
Figure B2-1: Sample Collection Cup Being Placed in the Retrieval Basket ................................54
Figure B2-2: Sample Collection Using a Vacuum .......................................................................55
Figure B10-1: Data Management Scheme for Waste Tank Residual Sampling and Analysis ......81
Figure B10-2: Roles and Responsibilities for Waste Tank Characterization Implementing Procedure/Activity/Document ...........................................................................................83
LIST OF TABLES
Table A6-1: Tasks Scheduled for Each Waste Tank ....................................................................19
Table A7-1: Typical Measurement Performance Criteria for Residuals Sample Analyses ..........23
Table A9-1: Sample Analysis Report Content ..............................................................................46
Table A9-2: Project Records, Record Copy Location, Retention Period, and Backup Schedule .............................................................................................................................47
Table B1-1: Waste Tank Sampling Design ..................................................................................52
Table B3-1: Sampling Methods and Sample Handling Requirements .........................................57
Table B4-1: Typical Laboratory Analytical Operating Procedures ..............................................60
Table B5-1: Field Quality Control Samples .................................................................................69
Table B5-2: Laboratory Analytical Quality Control Indicators ....................................................70
Table B6-1: Laboratory Instrument Maintenance .........................................................................72
Table B7-1: Laboratory Instrument Calibration Criteria ..............................................................74
Table B8-1: List of Key Consumables and Acceptance Criteria ..................................................78
Table C1-1: Liquid Waste Tank Residuals Sampling Program Planned Project Audits and Assessments .......................................................................................................................88
Table D1-1: Waste Tank Characterization Process Data Verification .........................................92
Table D3-1: Items and Activities Evaluated During the Data Quality Assessment .....................95
Liquid Waste Tank Residuals Sampling- SRR-CWDA-2011-00117 Quality Assurance Program Plan Revision 1 July 2013
Page 9 of 99
ACRONYMS/ABBREVIATIONS
AA Atomic Absorption AD Analytical Development ALARA As Low As Reasonably Achievable AOP Analytical Operating Procedure ARG Analyzed Reference Glass AFM Analyte-Free Matrix Blank ASME American Society of Mechanical Engineers C&WDA Closure and Waste Disposal Authority CA Corrective Action CCB Continuing Calibration Blank CCV Continuing Calibration Verification CERCLA Comprehensive Environmental Response, Compensation, and Liability Act CM Closure Module CPC Characterization Project Coordinator COC Chain-of-Custody CQF Cognizant Quality Function CTF Cognizant Technical Function CTS Concentrate Transfer System DB Diversion Box DOE U.S. Department of Energy DOE-SR U.S. Department of Energy-Savannah River DQA Data Quality Assessment DQI Data Quality Indicator DQO Data Quality Objective E&CPT Environmental and Chemical Process Technology EDWS Electronic Document Workflow System EPA U.S. Environmental Protection Agency ESH&QA Environment, Safety, Health and Quality Assurance FE Fundamental Error FFA Federal Facility Agreement FTF F-Area Tank Farm FWHM Full Width at Half Maximum GCP General Closure Plan
HPGe Gamma High-Purity Germanium Detector Gamma Spectrometer and Associated Electronics
HRR Highly Radioactive Radionuclide HSWA Hazardous and Solid Waste Amendments HTF H-Area Tank Farm
Liquid Waste Tank Residuals Sampling- SRR-CWDA-2011-00117 Quality Assurance Program Plan Revision 1 July 2013
Page 10 of 99
ICB Initial Calibration Blank ICP-ES Inductively Coupled Plasma - Atomic Emission Spectroscopy ICP-MS Inductively Coupled Plasma - Mass Spectroscopy ICV Initial Calibration Verification ISO International Organization for Standardization LCS Laboratory Control Standard LIMS Laboratory Information Management System LOD Level of Detection LSC Liquid Scintillation Counting LWO Liquid Waste Organization LWTRS Liquid Waste Tank Residuals Sampling LWTRSAPP Liquid Waste Tank Residuals Sampling and Analysis Program Plan LWTRS-QAPP Liquid Waste Tank Residuals Sampling-Quality Assurance Program Plan M&TE Measuring and Test Equipment MAC Material Acquisition Center MAPEP Mixed Analyte Performance Evaluation Program MARLAP Multi-Agency Radiological Laboratory Analytical Protocols MCP Measurement Control Program MDA Minimum Detectable Activity MDC Minimum Detectable Concentration MFPPTP Mixed Fission Product Proficiency Test Program MPC Measurement Performance Criteria MRP Management Requirements and Procedure MS&E Measurement Systems and Equipment NaI Gamma Sodium Iodide Detector Gamma Spectrometer and Associated Electronics N/A Not Applicable NA Not Applied to the Method for This Program NAA Neutron Activation Analysis NARA National Archives and Records Administration NIST National Institute of Standards and Technology PA Performance Assessment PHA Pulse-Height Analysis PIC Person-In-Charge PM Project Manager PL Project Lead PMMD Procurement and Materials Management Department PP Pump Pit PSQ Principal Study Question QA Quality Assurance
Liquid Waste Tank Residuals Sampling- SRR-CWDA-2011-00117 Quality Assurance Program Plan Revision 1 July 2013
Page 11 of 99
QAPP Quality Assurance Program Plan QC Quality Control r Correlation Coefficient R&D Research and Development RadCon Radiological Controls RCRA Resource Conservation and Recovery Act SA Special Analysis SCDHEC South Carolina Department of Health and Environmental Control SCO Shielded Cell Operations SET Sample Extraction Team SLDR Sample Location Determination Report SME Subject Matter Expert SOP Standard Operating Procedure SQL Structured Query Language SRNL Savannah River National Laboratory SRNS Savannah River Nuclear Solutions, LLC SRR Savannah River Remediation LLC SRS Savannah River Site SRSL Savannah River Standards Laboratory STAR Site Tracking, Analysis, and Reporting TBD To Be Determined TCW Tank Closure Wallet TFO Tank Farm Operations TRAIN Training Records and Information Network TSA Technical System Audit TSAP Tank-Specific Sampling and Analysis Plan TTR Technical Task Request TTQAP Task Technical and Quality Assurance Plan VOC Volatile Organic Compound WCS Waste Characterization System
Liquid Waste Tank Residuals Sampling- SRR-CWDA-2011-00117 Quality Assurance Program Plan Revision 1 July 2013
Page 12 of 99
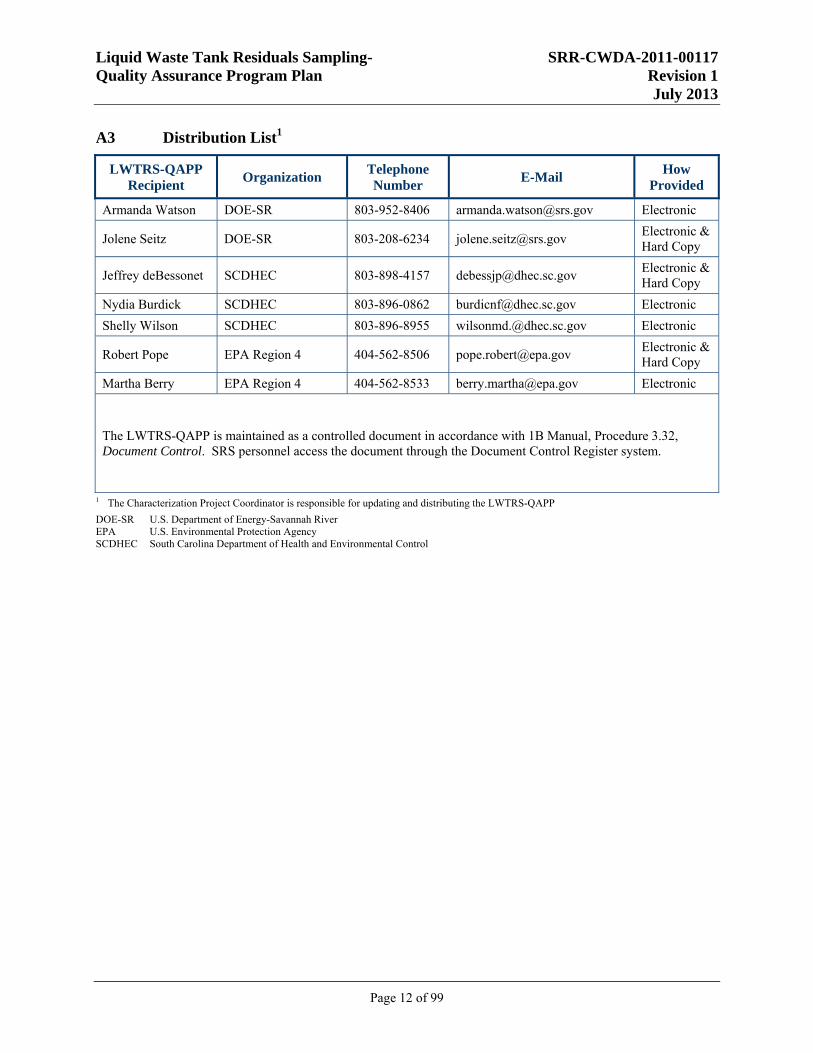
A3 Distribution List1
LWTRS-QAPP Recipient
Organization Telephone Number
E-Mail How
Provided
Armanda Watson DOE-SR 803-952-8406 [email protected] Electronic
Jolene Seitz DOE-SR 803-208-6234 [email protected] Electronic & Hard Copy
Jeffrey deBessonet SCDHEC 803-898-4157 [email protected] Electronic & Hard Copy
Nydia Burdick SCDHEC 803-896-0862 [email protected] Electronic
Shelly Wilson SCDHEC 803-896-8955 [email protected] Electronic
Robert Pope EPA Region 4 404-562-8506 [email protected] Electronic & Hard Copy
Martha Berry EPA Region 4 404-562-8533 [email protected] Electronic
The LWTRS-QAPP is maintained as a controlled document in accordance with 1B Manual, Procedure 3.32, Document Control. SRS personnel access the document through the Document Control Register system.
1 The Characterization Project Coordinator is responsible for updating and distributing the LWTRS-QAPP
DOE-SR U.S. Department of Energy-Savannah River EPA U.S. Environmental Protection Agency SCDHEC South Carolina Department of Health and Environmental Control
Liquid Waste Tank Residuals Sampling- SRR-CWDA-2011-00117 Quality Assurance Program Plan Revision 1 July 2013
Page 13 of 99
A4 Project Organization
A4.1 Key Individuals
Due to the extended time-period (i.e., greater than 10 years) anticipated to remove all the waste tanks from service, key individuals are not specified. Organizations may be restructured; priorities, budgets, and schedules may change; and the workforce will adjust accordingly to best perform the operational closure of the waste tanks. Regardless, Savannah River Site (SRS) will always maintain a Quality Assurance Function independent of the performing organizations. Activities related to waste tank residuals sampling and analysis are currently the responsibility of the organizations listed below. Managers and their appointees will function within the organizations to implement the requirements of the Liquid Waste Tank Residuals Sampling and Analysis Program Plan (LWTRSAPP) and Liquid Waste Tank Residuals Sampling - Quality Assurance Program Plan (LWTRS-QAPP).
Program Management: Waste Removal and Tank Closure Waste Tank Sampling Management: SRR Engineering Waste Tank Sampling: Tank Farm Operations (TFO) Laboratory Analyses: Savannah River National Laboratory (SRNL) Regulatory Reporting: Savannah River Remediation LLC (SRR), Closure and Waste
Disposal Authority (C&WDA) (under Waste Determinations) Data Management: SRR and SRNL for their respective areas of responsibility Records Management: SRR and SRNL are responsible for records management under
their respective programs. C&WDA will generally oversee and verify sampling and analysis record inventorying and filing.
Quality Assurance: SRR Quality Assurance (QA) for overall program reporting; SRNL QA for laboratory analyses and reporting
A4.2 Roles and Responsibilities
C&WDA has the responsibility for maintaining, updating, and distributing the LWTRSAPP and LWTRS-QAPP. The specific organizations involved will be responsible for activities and coordination under their area of operation. The specific organizations designate individuals to oversee sampling and analysis activities or interface with the other performing organizations. The operational areas are briefly described below.
The Waste Removal and Tank Closure Project Manager (PM) will be responsible for the overall work scope, schedule, and budget.
The SRR Engineering Project Lead (PL), with C&WDA input, manages the interfaces with SRNL regarding sample analyses, and with TFO on the waste tank residual volume determinations, sample collection, sample shipment to SRNL, and documenting sampling activities.
TFO is responsible for residuals sampling, scheduling and planning, ensuring adequate safety and health support personnel are available, and that work is performed by trained personnel. The TFO Sample Extraction Team (SET) collects the samples and prepares them for transport to the laboratory.
Liquid Waste Tank Residuals Sampling- SRR-CWDA-2011-00117 Quality Assurance Program Plan Revision 1 July 2013
Page 14 of 99
The C&WDA Manager leads the preparation of various closure documents, such as the sample-location determination report, sample compositing instructions, the waste-tank inventory determination report, special analyses (SAs) and closure modules (CMs).
The SRR and SRNL Cognizant Quality Function (CQF) oversee implementation of the QA/Quality Control (QC) actions in accordance with SRS 12Q Manual, Assessment Manual. In addition, the CQFs are responsible for approving the LWTSR-QAPP, including subsequent revisions. The SRR and SRNL CQFs are independent from the generation of data.
The SRNL Laboratory Manager will have ultimate responsibility for overall laboratory technical quality, cost control and laboratory personnel management including personnel training and qualification.
The SRNL PL serves as the principal point-of-contact for coordinating laboratory activities, records management, and for ensuring that the sample analyses meet the requirements in the LWTRS-QAPP, Task Technical and Quality Assurance Plan (TTQAP), and Technical Task Request (TTR). The SRNL PL has the responsibility for compiling and verifying the laboratory data and records described in Section D that will be submitted to C&WDA.
Additional information on the roles and responsibilities are presented in Section 2 of the LWTRSAPP. An organizational chart for the Liquid Waste Tanks Residuals Sampling Program is provided in Section A4.4.
A4.3 Organization Responsible for Quality Assurance Program Plan Maintenance, Updating and Distribution
C&WDA is responsible for LWTRS-QAPP maintenance, update and distribution. Cognizant Technical Functions (CTFs) within the participating organizations are responsible for implementation of the LWTRS-QAPP and identifying any needed changes. The QAPP will be reviewed annually and revised at a minimum of every five years as required by South Carolina Department of Health and Environmental Control (SCDHEC) guidance. When QAPP updating becomes necessary, individuals from the approving organizations will review and agree upon any changes. The C&WDA Characterization Project Coordinator (CPC) will be responsible for preparing and distributing the updated document as described in Section A9.1.
A4.4 Organization Chart
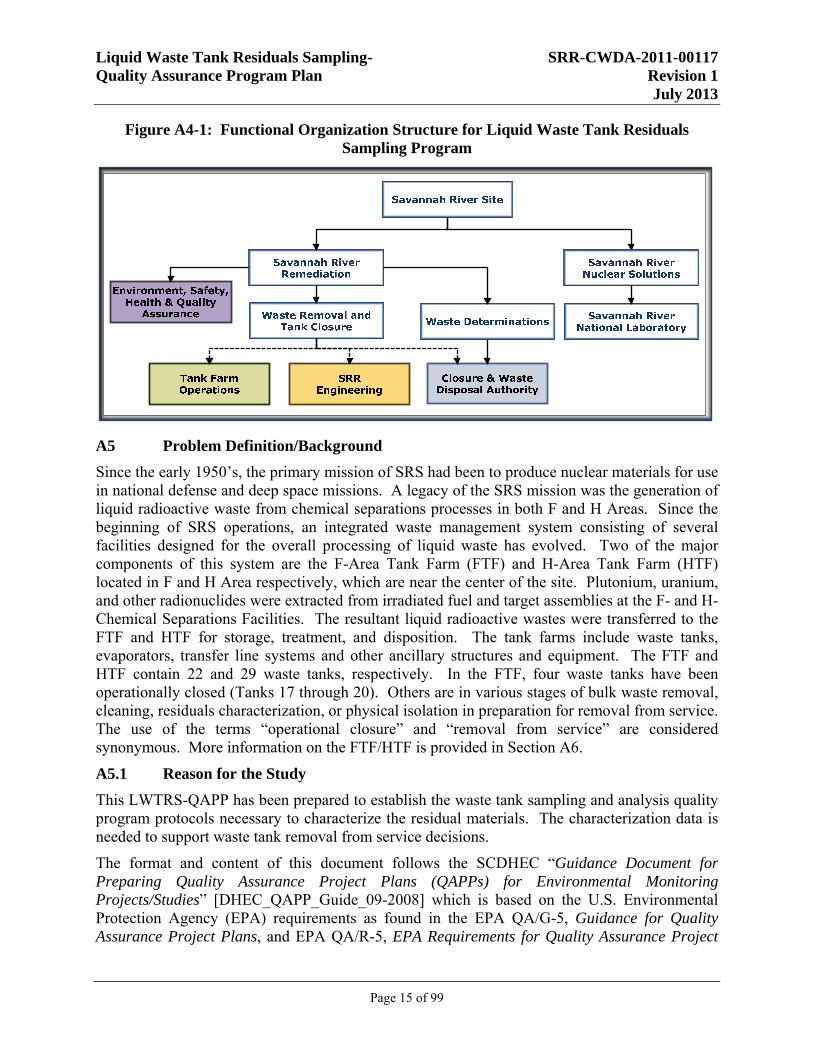
The functional organization structure for the Liquid Waste Tank Residuals Sampling program is presented in Figure A4-1.
Liquid Waste Tank Residuals Sampling- SRR-CWDA-2011-00117 Quality Assurance Program Plan Revision 1 July 2013
Page 15 of 99
Figure A4-1: Functional Organization Structure for Liquid Waste Tank Residuals Sampling Program
A5 Problem Definition/Background
Since the early 1950’s, the primary mission of SRS had been to produce nuclear materials for use in national defense and deep space missions. A legacy of the SRS mission was the generation of liquid radioactive waste from chemical separations processes in both F and H Areas. Since the beginning of SRS operations, an integrated waste management system consisting of several facilities designed for the overall processing of liquid waste has evolved. Two of the major components of this system are the F-Area Tank Farm (FTF) and H-Area Tank Farm (HTF) located in F and H Area respectively, which are near the center of the site. Plutonium, uranium, and other radionuclides were extracted from irradiated fuel and target assemblies at the F- and H-Chemical Separations Facilities. The resultant liquid radioactive wastes were transferred to the FTF and HTF for storage, treatment, and disposition. The tank farms include waste tanks, evaporators, transfer line systems and other ancillary structures and equipment. The FTF and HTF contain 22 and 29 waste tanks, respectively. In the FTF, four waste tanks have been operationally closed (Tanks 17 through 20). Others are in various stages of bulk waste removal, cleaning, residuals characterization, or physical isolation in preparation for removal from service. The use of the terms “operational closure” and “removal from service” are considered synonymous. More information on the FTF/HTF is provided in Section A6.
A5.1 Reason for the Study
This LWTRS-QAPP has been prepared to establish the waste tank sampling and analysis quality program protocols necessary to characterize the residual materials. The characterization data is needed to support waste tank removal from service decisions.
The format and content of this document follows the SCDHEC “Guidance Document for Preparing Quality Assurance Project Plans (QAPPs) for Environmental Monitoring Projects/Studies” [DHEC_QAPP_Guide_09-2008] which is based on the U.S. Environmental Protection Agency (EPA) requirements as found in the EPA QA/G-5, Guidance for Quality Assurance Project Plans, and EPA QA/R-5, EPA Requirements for Quality Assurance Project
Liquid Waste Tank Residuals Sampling- SRR-CWDA-2011-00117 Quality Assurance Program Plan Revision 1 July 2013
Page 16 of 99
Plans for Environmental Data Operations. These reference documents were used to establish a recognized process for characterizing the residual materials remaining in the waste tanks at the time of removal from service, even though the samples are not environmental compliance samples.
The U.S. Department of Energy (DOE) has a priority to remove from service first the waste tanks that do not meet the standards established in Appendix B of the SRS Federal Facility Agreement (FFA). [WSRC-OS-94-42] Removal of these waste tanks from service reduces the risk of a potential release of radionuclides and chemicals to the environment and provides a stable form that is protective of human health and environment.
A5.2 Explanation of Decisions and Actions to be taken with the Information Obtained
The waste tank residuals material sampling and analyses generate the concentration data used to support the waste tank inventory determination. The characterization data is used in analyses to demonstrate conformance with both qualitative and quantitative Federal and State performance objectives and allow DOE to make closure decisions related to waste tank removals from service. For FTF, the protocol DOE uses to remove waste tanks from service is given in the FTF Industrial Waste Water General Closure Plan (GCP), which has been approved by SCDHEC. [LWO-RIP-2009-00009] A similar HTF GCP provides the protocol for HTF waste tank and ancillary structure removals from service. [SRR-CWDA-2011-00022] The characterization data for the radiological and hazardous constituents together with the final residuals volume determination and uncertainty estimate are used to develop the waste tank-specific residuals inventory determination report.
A5.3 Identification of Regulatory Information, Applicable Criteria, or Action Limits that will Impact the Study
In support of environmental remediation activities at SRS, the DOE, EPA, and SCDHEC signed a FFA pursuant to Section 120 of the Comprehensive Environmental Response, Compensation, and Liability Act (CERCLA) and Sections 3008(h) and 6001 of the Resource Conservation and Recovery Act (RCRA), as amended by the Hazardous and Solid Waste Amendments of 1984 (HSWA) (usually jointly referred to as RCRA) and the Atomic Energy Act of 1954 as amended. The agreement became effective in August 1993. As part of this comprehensive agreement, DOE has committed to remove from service those waste tank systems that do not meet the standards set forth in Appendix B of the FFA. Appendix B of the FFA also defines the specific waste tank systems that are subject to the agreement. [WSRC-OS-94-42]
After completion of waste removal activities from individual waste tank systems, the waste tank systems are operationally closed under the industrial wastewater permit that regulates their operation. SCDHEC regulates the process of waste tank system removal from service via applicable South Carolina law and regulation, and the SRS FFA. The use of the terms “operational closure” and “removal from service” are considered synonymous.
Liquid Waste Tank Residuals Sampling- SRR-CWDA-2011-00117 Quality Assurance Program Plan Revision 1 July 2013
Page 17 of 99
This LWTRS-QAPP applies to the waste tank residuals sampling and analysis process, as described in the LWTRSAPP (SRR-CWDA-2011-00050), beginning with the start of sampling through the Data Quality Assessment (DQA). This LWTRS-QAPP was not applicable to Tanks 5, 6, 18, or 19 which have been, or are currently undergoing removal from service activities. The SRS QA Program governs additional removal from service activities for those waste tanks.
A6 Project/Task Description and Schedule
The objective of this LWTRS-QAPP is to describe the general procedures to sample and analyze waste tank residuals and the QA/QC requirements necessary to perform and document this work.
A6.1 Summary of Work to be Completed
Information determined in the field, or directly from field measurements, consists of:
The preliminary and final waste tank residuals material volume, uncertainty estimate, and distribution maps
Sampling plan design necessary to represent the residuals material populations Documentation of the sample collection locations and justification of any departures from
the initial sampling design Calculation of the volume-proportioning amounts for analytical sample compositing
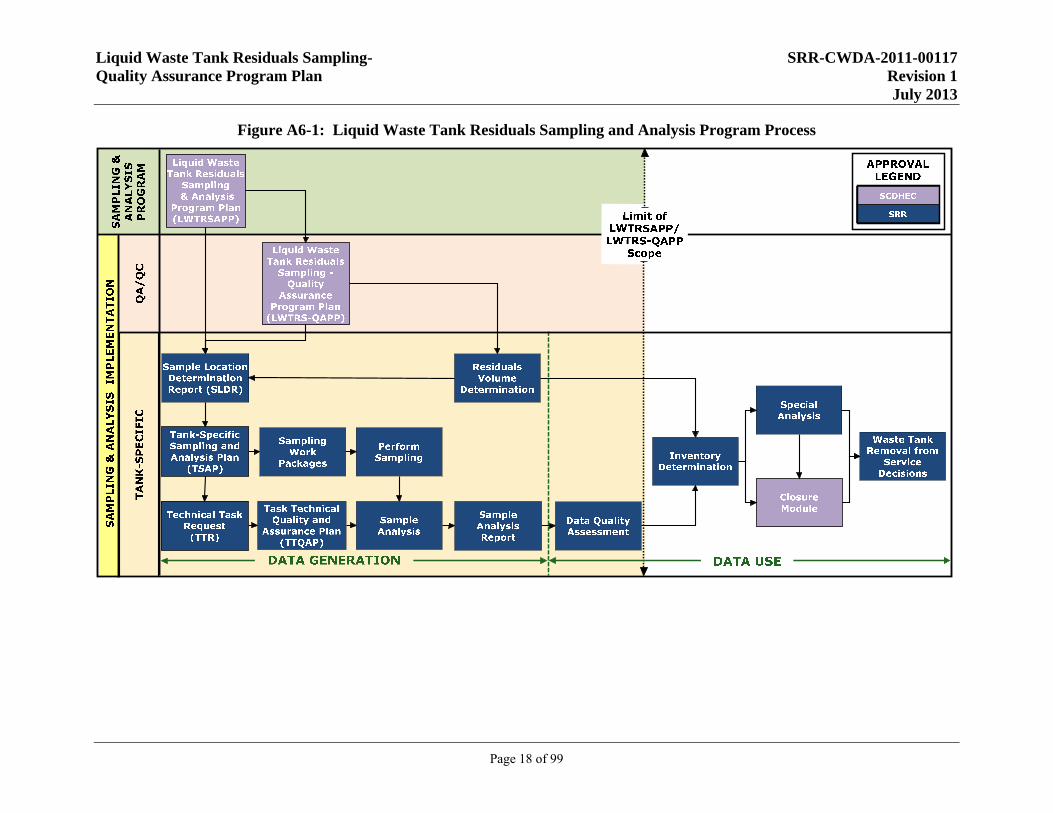
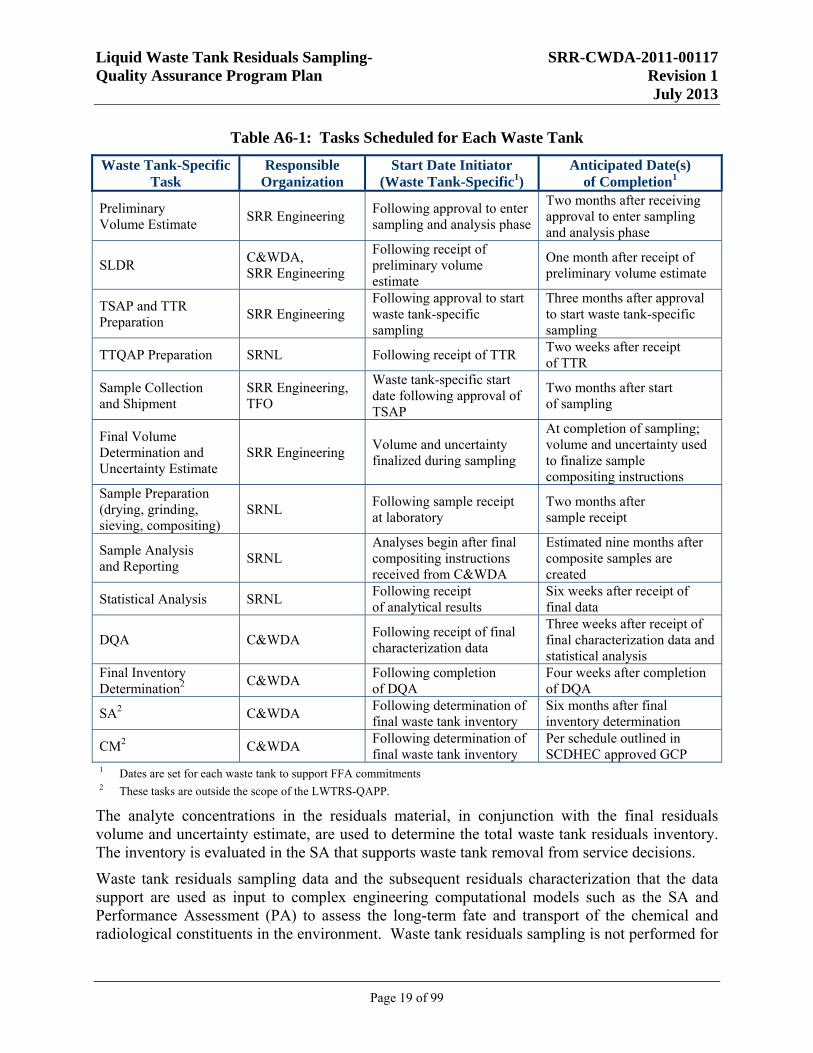
Details on the methodology and approach used for sampling a waste tank are presented in the Liquid Waste Tank Residuals Sampling and Analysis Program Plan. [SRR-CWDA-2011-00050] The process followed to characterize waste tanks for removal from service decisions is summarized on Figure A6-1. The activity, organization responsible, and start date initiator for the tank-specific task is summarized in Table A6-1.
The Sample Location Determination Report (SLDR) explains and documents the rationale for the sampling approach used on a specific waste tank. The SLDR uses the preliminary residuals volume and distribution map to design the tank-specific sampling arrays for the volume-proportional compositing approach described in the LWTRSAPP. If applicable, it justifies and documents the low-volume sampling approach implementation. The SLDR takes into account any residual material variations and accessibility issues to address in order to meet the DQOs.
Tank-specific Sampling and Analysis Plans (TSAPs) are developed using the SLDR. TSAPs are consistent with the LWTRSAPP and LWTRS-QAPP and are revised to incorporate sampling plan changes required to address actual material variations and distributions encountered during the sampling. The analyte lists included in the TSAPs will be determined based on waste tank usage history.
A copy of the TSAP, and any revised versions reflecting any changes required by field conditions, will be provided to SCDHEC. SCDHEC will be given an update on waste tank sampling and analysis in progress at the liquid waste quarterly FFA meetings, or as needed. Information to be presented at these meetings is normally transmitted as part of the meeting notification.
Liquid Waste Tank Residuals Sampling- SRR-CWDA-2011-00117 Quality Assurance Program Plan Revision 1 July 2013
Page 18 of 99
Figure A6-1: Liquid Waste Tank Residuals Sampling and Analysis Program Process
Liquid Waste Tank Residuals Sampling- SRR-CWDA-2011-00117 Quality Assurance Program Plan Revision 1 July 2013
Page 19 of 99
Table A6-1: Tasks Scheduled for Each Waste Tank
Waste Tank-Specific Task
Responsible Organization
Start Date Initiator (Waste Tank-Specific1)
Anticipated Date(s) of Completion1
Preliminary Volume Estimate
SRR Engineering Following approval to enter sampling and analysis phase
Two months after receiving approval to enter sampling and analysis phase
SLDR C&WDA, SRR Engineering
Following receipt of preliminary volume estimate
One month after receipt of preliminary volume estimate
TSAP and TTR Preparation
SRR Engineering Following approval to start waste tank-specific sampling
Three months after approval to start waste tank-specific sampling
TTQAP Preparation SRNL Following receipt of TTR Two weeks after receipt of TTR
Sample Collection and Shipment
SRR Engineering, TFO
Waste tank-specific start date following approval of TSAP
Two months after start of sampling
Final Volume Determination and Uncertainty Estimate
SRR Engineering Volume and uncertainty finalized during sampling
At completion of sampling; volume and uncertainty used to finalize sample compositing instructions
Sample Preparation (drying, grinding, sieving, compositing)
SRNL Following sample receipt at laboratory
Two months after sample receipt
Sample Analysis and Reporting
SRNL Analyses begin after final compositing instructions received from C&WDA
Estimated nine months after composite samples are created
Statistical Analysis SRNL Following receipt of analytical results
Six weeks after receipt of final data
DQA C&WDA Following receipt of final characterization data
Three weeks after receipt of final characterization data and statistical analysis
Final Inventory Determination2 C&WDA
Following completion of DQA
Four weeks after completion of DQA
SA2 C&WDA Following determination of final waste tank inventory
Six months after final inventory determination
CM2 C&WDA Following determination of final waste tank inventory
Per schedule outlined in SCDHEC approved GCP
1 Dates are set for each waste tank to support FFA commitments 2 These tasks are outside the scope of the LWTRS-QAPP.
The analyte concentrations in the residuals material, in conjunction with the final residuals volume and uncertainty estimate, are used to determine the total waste tank residuals inventory. The inventory is evaluated in the SA that supports waste tank removal from service decisions.
Waste tank residuals sampling data and the subsequent residuals characterization that the data support are used as input to complex engineering computational models such as the SA and Performance Assessment (PA) to assess the long-term fate and transport of the chemical and radiological constituents in the environment. Waste tank residuals sampling is not performed for
Liquid Waste Tank Residuals Sampling- SRR-CWDA-2011-00117 Quality Assurance Program Plan Revision 1 July 2013
Page 20 of 99
comparing residual concentrations against prescribed environmental limits and, as such, the samples collected and analyzed under this program are not environmental compliance samples and are not used for environmental monitoring.
A6.2 Project Schedule
Waste tank-specific schedules will be generated to support the overall FTF/HTF closure program. The overall closure project schedule is driven by the Liquid Waste System Plan (SRR-LWP-2009-00001) as described in Section A6.4 in support of FFA commitments.
A6.3 Location of Study Area
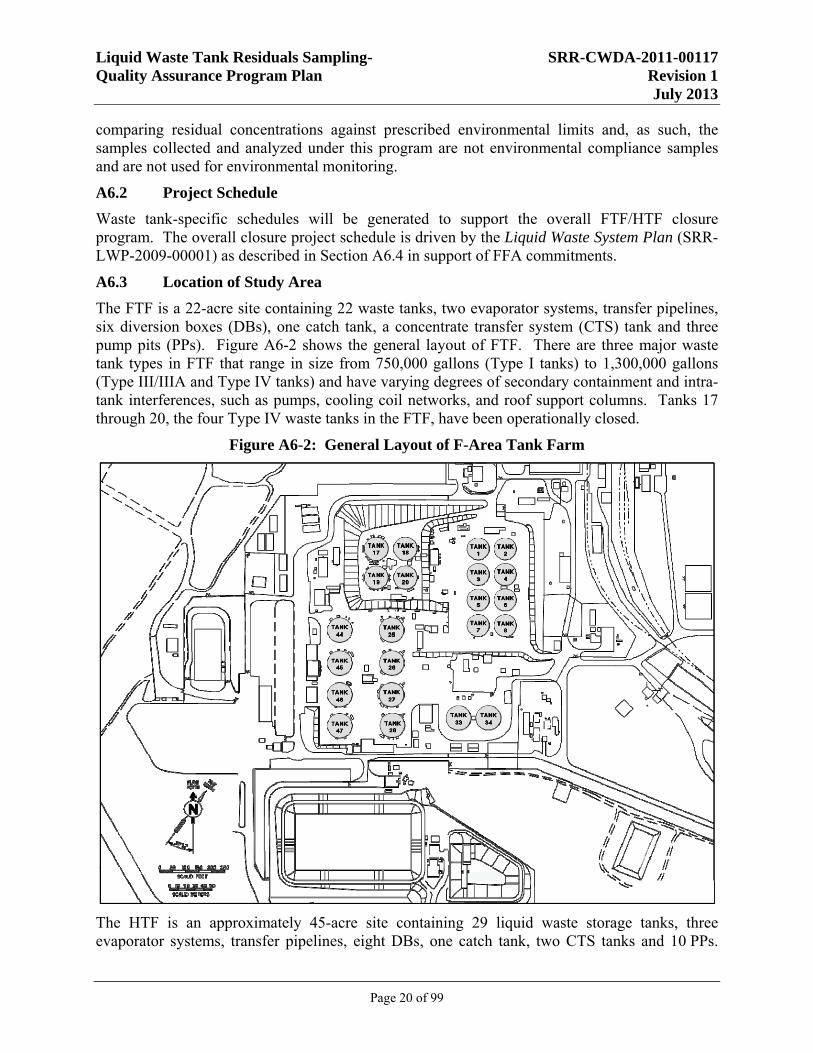
The FTF is a 22-acre site containing 22 waste tanks, two evaporator systems, transfer pipelines, six diversion boxes (DBs), one catch tank, a concentrate transfer system (CTS) tank and three pump pits (PPs). Figure A6-2 shows the general layout of FTF. There are three major waste tank types in FTF that range in size from 750,000 gallons (Type I tanks) to 1,300,000 gallons (Type III/IIIA and Type IV tanks) and have varying degrees of secondary containment and intra-tank interferences, such as pumps, cooling coil networks, and roof support columns. Tanks 17 through 20, the four Type IV waste tanks in the FTF, have been operationally closed.
Figure A6-2: General Layout of F-Area Tank Farm
The HTF is an approximately 45-acre site containing 29 liquid waste storage tanks, three evaporator systems, transfer pipelines, eight DBs, one catch tank, two CTS tanks and 10 PPs.
Liquid Waste Tank Residuals Sampling- SRR-CWDA-2011-00117 Quality Assurance Program Plan Revision 1 July 2013
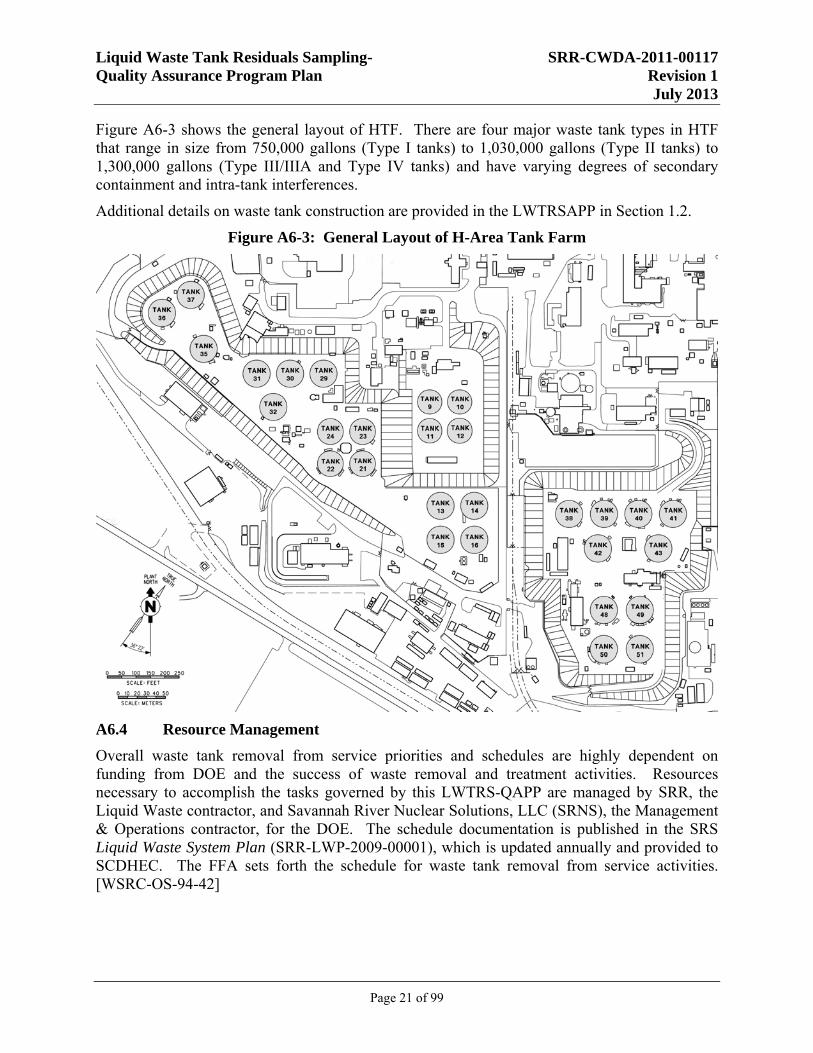
Page 21 of 99
Figure A6-3 shows the general layout of HTF. There are four major waste tank types in HTF that range in size from 750,000 gallons (Type I tanks) to 1,030,000 gallons (Type II tanks) to 1,300,000 gallons (Type III/IIIA and Type IV tanks) and have varying degrees of secondary containment and intra-tank interferences.
Additional details on waste tank construction are provided in the LWTRSAPP in Section 1.2.
Figure A6-3: General Layout of H-Area Tank Farm
A6.4 Resource Management
Overall waste tank removal from service priorities and schedules are highly dependent on funding from DOE and the success of waste removal and treatment activities. Resources necessary to accomplish the tasks governed by this LWTRS-QAPP are managed by SRR, the Liquid Waste contractor, and Savannah River Nuclear Solutions, LLC (SRNS), the Management & Operations contractor, for the DOE. The schedule documentation is published in the SRS Liquid Waste System Plan (SRR-LWP-2009-00001), which is updated annually and provided to SCDHEC. The FFA sets forth the schedule for waste tank removal from service activities. [WSRC-OS-94-42]
Liquid Waste Tank Residuals Sampling- SRR-CWDA-2011-00117 Quality Assurance Program Plan Revision 1 July 2013
Page 22 of 99
A7 Data Quality Objectives and Data Quality Indicators
A7.1 Identification of Measurement Performance Criteria
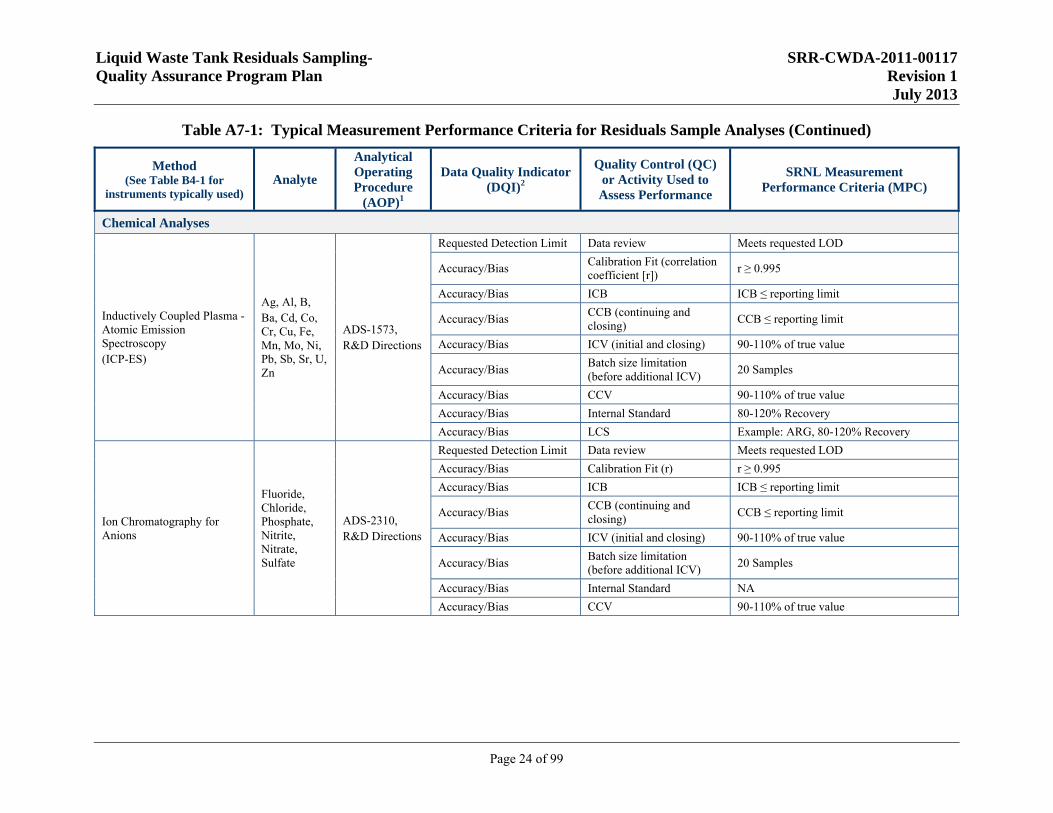
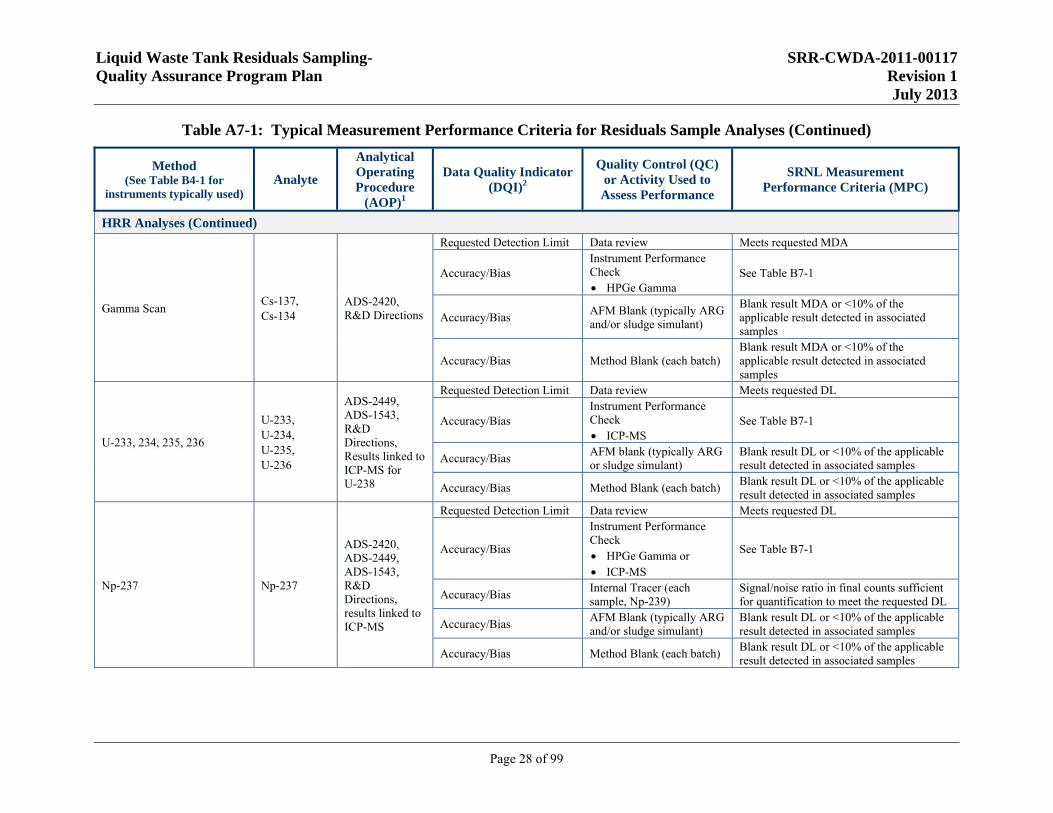
The analytical measurements and associated Measurement Performance Criteria (MPC) typically used for waste tank residuals samples are summarized in Table A7-1 and are divided into two categories: 1) the chemical, physical, and Highly Radioactive Radionuclide (HRR) measurements for which enhanced MPCs are defined, and 2) additional radionuclides.
The additional radionuclides may require enhanced or additional MPCs. The MPCs will take into account that the methods are unique and are developed to accommodate the variable material matrices present in the waste tanks. Any radionuclides not on the waste tank-specific analyte list detected during the gamma spectroscopy analysis will also be reported.
A7.2 Data Quality Indicators
Typical data quality indicators (DQIs) are presented in Table A7-1 for chemical, physical, and radionuclide measurements. Additional DQIs may be developed as necessary to assess analytical difficulties associated with challenging radionuclides and matrices.
The sample analyses use standard methods and instrumentation, but due to the complex and radioactive matrices, material preparations and analyses can be difficult. Many of the radiochemical methods require that radionuclides be separated chemically from their sample matrix and purified before measurement. During chemical separation, some of the analyte radionuclide may be lost due to sample transfer, evaporation, or incomplete chemical precipitation or extraction reactions. Losses are particularly prevalent during aggressive separation processes that are necessary to remove highly-radioactive species from the matrix prior to quantifying very low-activity radionuclide species or confirming radionuclide absence. With the complex matrices encountered in the residual material samples, these losses are often sample-specific and highly variable. For quantitative analysis, it is necessary to correct the observed instrument responses for these losses for each analytical sample whenever possible. Corrections are made using compounds that are stable (carriers) or radioactive (tracers). The ratio of the carrier or tracer recovered to the amount added is the recovery, or yield. The QA measures for the chemical analyses are shown in Table A7-1.
In accordance with Multi-Agency Radiological Laboratory Analytical Protocols (MARLAP), guidelines, the major sources of uncertainty receive the most focus during uncertainty calculations. The major sources of error are propagated to calculate a sample-specific uncertainty, which is reported (1) with the sample result. For situations where the propagated error is below 5%, the reported uncertainty is conservatively assigned to be 5%.
For radioanalytical measurements, the measurement uncertainty is calculated based on the uncertainty associated with a variety of possible sources:
Uncertainty in standard preparation Uncertainty in tracer preparation Uncertainty in sample preparation Counting uncertainty for the analyte peak(s) and associated background(s) Counting uncertainty for the tracer peak and associated background Uncertainty in detector calibration Other
Liquid Waste Tank Residuals Sampling- SRR-CWDA-2011-00117 Quality Assurance Program Plan Revision 1 July 2013
Page 23 of 99
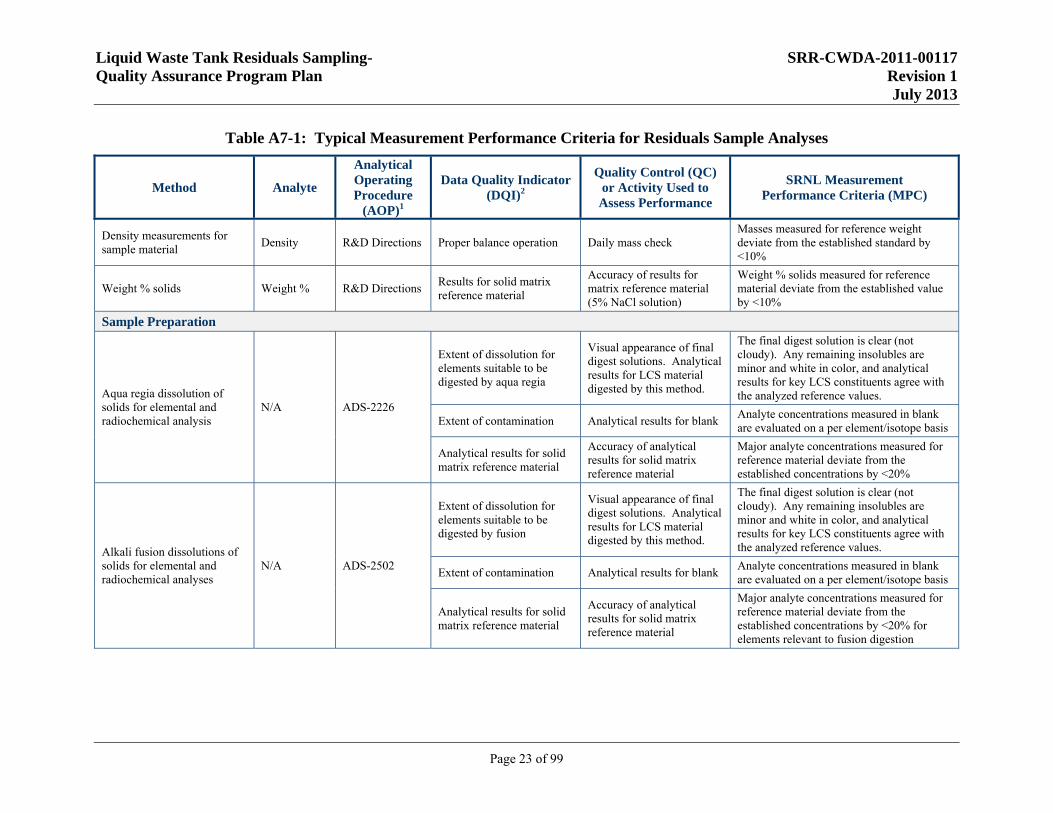
Table A7-1: Typical Measurement Performance Criteria for Residuals Sample Analyses
Method Analyte
Analytical Operating Procedure
(AOP)1
Data Quality Indicator (DQI)2
Quality Control (QC) or Activity Used to Assess Performance
SRNL Measurement Performance Criteria (MPC)
Density measurements for sample material
Density R&D Directions Proper balance operation Daily mass check Masses measured for reference weight deviate from the established standard by <10%
Weight % solids Weight % R&D Directions Results for solid matrix reference material
Accuracy of results for matrix reference material (5% NaCl solution)
Weight % solids measured for reference material deviate from the established value by <10%
Sample Preparation
Aqua regia dissolution of solids for elemental and radiochemical analysis
N/A ADS-2226
Extent of dissolution for elements suitable to be digested by aqua regia
Visual appearance of final digest solutions. Analytical results for LCS material digested by this method.
The final digest solution is clear (not cloudy). Any remaining insolubles are minor and white in color, and analytical results for key LCS constituents agree with the analyzed reference values.
Extent of contamination Analytical results for blank Analyte concentrations measured in blank are evaluated on a per element/isotope basis
Analytical results for solid matrix reference material
Accuracy of analytical results for solid matrix reference material
Major analyte concentrations measured for reference material deviate from the established concentrations by <20%
Alkali fusion dissolutions of solids for elemental and radiochemical analyses
N/A ADS-2502
Extent of dissolution for elements suitable to be digested by fusion
Visual appearance of final digest solutions. Analytical results for LCS material digested by this method.
The final digest solution is clear (not cloudy). Any remaining insolubles are minor and white in color, and analytical results for key LCS constituents agree with the analyzed reference values.
Extent of contamination Analytical results for blank Analyte concentrations measured in blank are evaluated on a per element/isotope basis
Analytical results for solid matrix reference material
Accuracy of analytical results for solid matrix reference material
Major analyte concentrations measured for reference material deviate from the established concentrations by <20% for elements relevant to fusion digestion
Liquid Waste Tank Residuals Sampling- SRR-CWDA-2011-00117 Quality Assurance Program Plan Revision 1 July 2013
Page 24 of 99
Table A7-1: Typical Measurement Performance Criteria for Residuals Sample Analyses (Continued)
Method (See Table B4-1 for
instruments typically used) Analyte
Analytical Operating Procedure
(AOP)1
Data Quality Indicator (DQI)2
Quality Control (QC) or Activity Used to Assess Performance
SRNL Measurement Performance Criteria (MPC)
Chemical Analyses
Inductively Coupled Plasma - Atomic Emission Spectroscopy (ICP-ES)
Ag, Al, B, Ba, Cd, Co, Cr, Cu, Fe, Mn, Mo, Ni, Pb, Sb, Sr, U, Zn
ADS-1573, R&D Directions
Requested Detection Limit Data review Meets requested LOD
Accuracy/Bias Calibration Fit (correlation coefficient [r])
r ≥ 0.995
Accuracy/Bias ICB ICB ≤ reporting limit
Accuracy/Bias CCB (continuing and closing)
CCB ≤ reporting limit
Accuracy/Bias ICV (initial and closing) 90-110% of true value
Accuracy/Bias Batch size limitation (before additional ICV)
20 Samples
Accuracy/Bias CCV 90-110% of true value
Accuracy/Bias Internal Standard 80-120% Recovery
Accuracy/Bias LCS Example: ARG, 80-120% Recovery
Ion Chromatography for Anions
Fluoride, Chloride, Phosphate, Nitrite, Nitrate, Sulfate
ADS-2310, R&D Directions
Requested Detection Limit Data review Meets requested LOD
Accuracy/Bias Calibration Fit (r) r ≥ 0.995
Accuracy/Bias ICB ICB ≤ reporting limit
Accuracy/Bias CCB (continuing and closing)
CCB ≤ reporting limit
Accuracy/Bias ICV (initial and closing) 90-110% of true value
Accuracy/Bias Batch size limitation (before additional ICV)
20 Samples
Accuracy/Bias Internal Standard NA
Accuracy/Bias CCV 90-110% of true value
Liquid Waste Tank Residuals Sampling- SRR-CWDA-2011-00117 Quality Assurance Program Plan Revision 1 July 2013
Page 25 of 99
Table A7-1: Typical Measurement Performance Criteria for Residuals Sample Analyses (Continued)
Method (See Table B4-1 for
instruments typically used) Analyte
Analytical Operating Procedure
(AOP)1
Data Quality Indicator (DQI)2
Quality Control (QC) or Activity Used to Assess Performance
SRNL Measurement Performance Criteria (MPC)
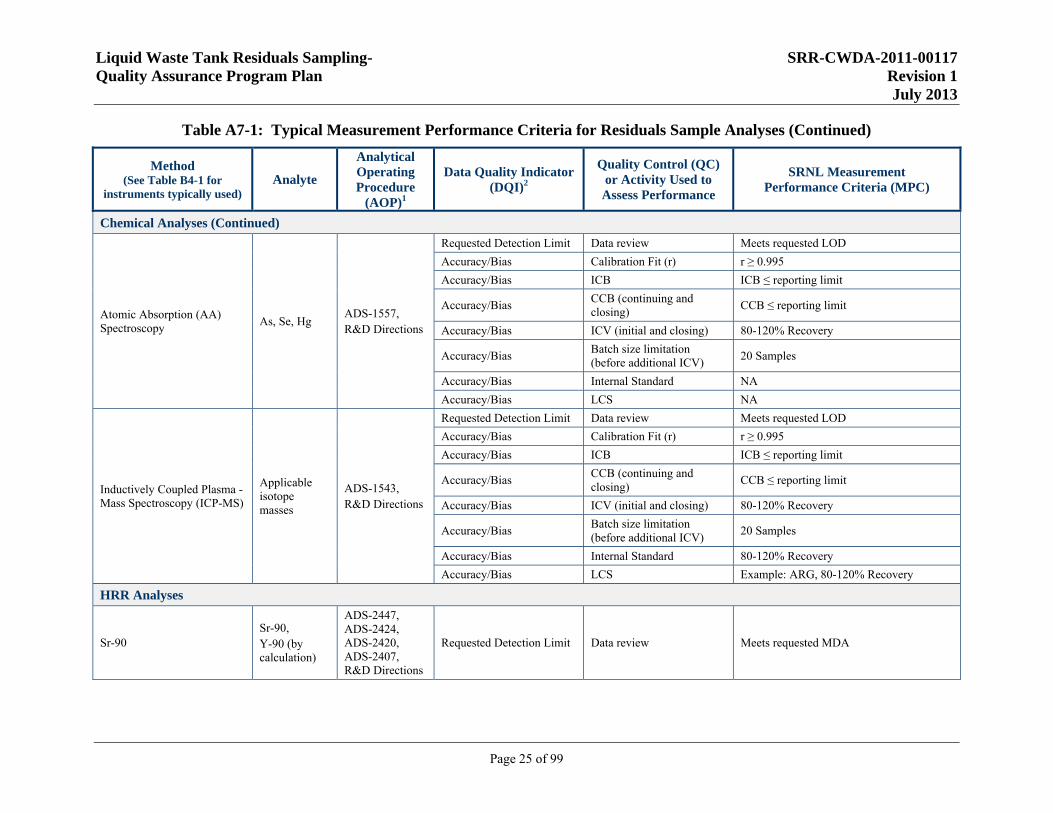
Chemical Analyses (Continued)
Atomic Absorption (AA) Spectroscopy
As, Se, Hg ADS-1557, R&D Directions
Requested Detection Limit Data review Meets requested LOD
Accuracy/Bias Calibration Fit (r) r ≥ 0.995
Accuracy/Bias ICB ICB ≤ reporting limit
Accuracy/Bias CCB (continuing and closing)
CCB ≤ reporting limit
Accuracy/Bias ICV (initial and closing) 80-120% Recovery
Accuracy/Bias Batch size limitation (before additional ICV)
20 Samples
Accuracy/Bias Internal Standard NA
Accuracy/Bias LCS NA
Inductively Coupled Plasma -Mass Spectroscopy (ICP-MS)
Applicable isotope masses
ADS-1543, R&D Directions
Requested Detection Limit Data review Meets requested LOD
Accuracy/Bias Calibration Fit (r) r ≥ 0.995
Accuracy/Bias ICB ICB ≤ reporting limit
Accuracy/Bias CCB (continuing and closing)
CCB ≤ reporting limit
Accuracy/Bias ICV (initial and closing) 80-120% Recovery
Accuracy/Bias Batch size limitation (before additional ICV)
20 Samples
Accuracy/Bias Internal Standard 80-120% Recovery
Accuracy/Bias LCS Example: ARG, 80-120% Recovery
HRR Analyses
Sr-90 Sr-90, Y-90 (by calculation)
ADS-2447, ADS-2424, ADS-2420, ADS-2407, R&D Directions
Requested Detection Limit Data review Meets requested MDA
Liquid Waste Tank Residuals Sampling- SRR-CWDA-2011-00117 Quality Assurance Program Plan Revision 1 July 2013
Page 26 of 99
Table A7-1: Typical Measurement Performance Criteria for Residuals Sample Analyses (Continued)
Method (See Table B4-1 for
instruments typically used) Analyte
Analytical Operating Procedure
(AOP)1
Data Quality Indicator (DQI)2
Quality Control (QC) or Activity Used to Assess Performance
SRNL Measurement Performance Criteria (MPC)
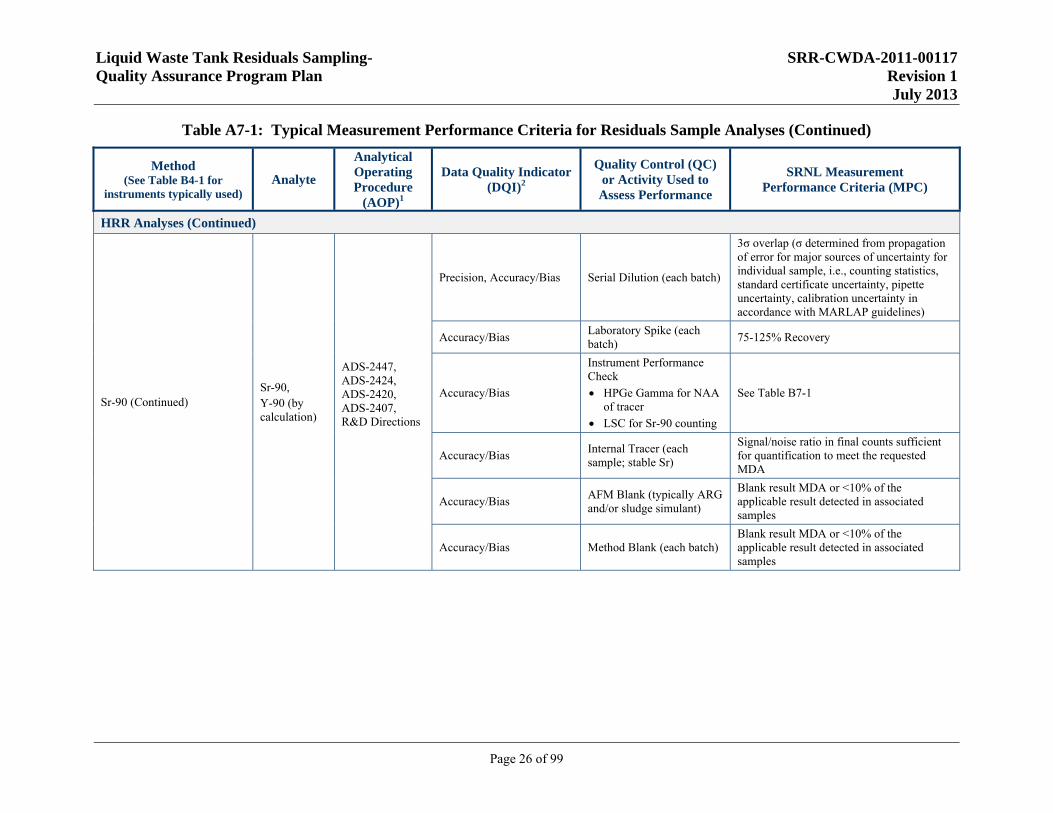
HRR Analyses (Continued)
Sr-90 (Continued) Sr-90, Y-90 (by calculation)
ADS-2447, ADS-2424, ADS-2420, ADS-2407, R&D Directions
Precision, Accuracy/Bias Serial Dilution (each batch)
3σ overlap (σ determined from propagation of error for major sources of uncertainty for individual sample, i.e., counting statistics, standard certificate uncertainty, pipette uncertainty, calibration uncertainty in accordance with MARLAP guidelines)
Accuracy/Bias Laboratory Spike (each batch)
75-125% Recovery
Accuracy/Bias
Instrument Performance Check
HPGe Gamma for NAA of tracer
LSC for Sr-90 counting
See Table B7-1
Accuracy/Bias Internal Tracer (each sample; stable Sr)
Signal/noise ratio in final counts sufficient for quantification to meet the requested MDA
Accuracy/Bias AFM Blank (typically ARG and/or sludge simulant)
Blank result MDA or <10% of the applicable result detected in associated samples
Accuracy/Bias Method Blank (each batch) Blank result MDA or <10% of the applicable result detected in associated samples
Liquid Waste Tank Residuals Sampling- SRR-CWDA-2011-00117 Quality Assurance Program Plan Revision 1 July 2013
Page 27 of 99
Table A7-1: Typical Measurement Performance Criteria for Residuals Sample Analyses (Continued)
Method (See Table B4-1 for
instruments typically used) Analyte
Analytical Operating Procedure
(AOP)1
Data Quality Indicator (DQI)2
Quality Control (QC) or Activity Used to Assess Performance
SRNL Measurement Performance Criteria (MPC)
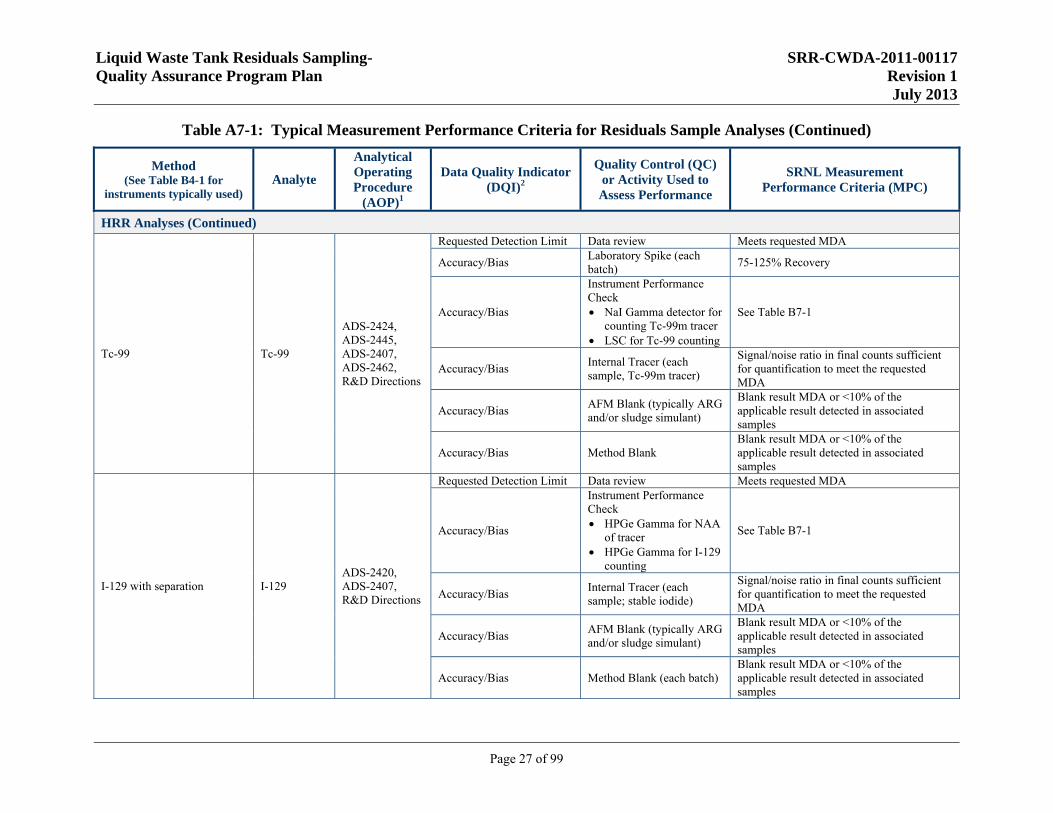
HRR Analyses (Continued)
Tc-99 Tc-99
ADS-2424, ADS-2445, ADS-2407, ADS-2462, R&D Directions
Requested Detection Limit Data review Meets requested MDA
Accuracy/Bias Laboratory Spike (each batch)
75-125% Recovery
Accuracy/Bias
Instrument Performance Check NaI Gamma detector for
counting Tc-99m tracer LSC for Tc-99 counting
See Table B7-1
Accuracy/Bias Internal Tracer (each sample, Tc-99m tracer)
Signal/noise ratio in final counts sufficient for quantification to meet the requested MDA
Accuracy/Bias AFM Blank (typically ARG and/or sludge simulant)
Blank result MDA or <10% of the applicable result detected in associated samples
Accuracy/Bias Method Blank Blank result MDA or <10% of the applicable result detected in associated samples
I-129 with separation I-129 ADS-2420, ADS-2407, R&D Directions
Requested Detection Limit Data review Meets requested MDA
Accuracy/Bias
Instrument Performance Check HPGe Gamma for NAA
of tracer HPGe Gamma for I-129
counting
See Table B7-1
Accuracy/Bias Internal Tracer (each sample; stable iodide)
Signal/noise ratio in final counts sufficient for quantification to meet the requested MDA
Accuracy/Bias AFM Blank (typically ARG and/or sludge simulant)
Blank result MDA or <10% of the applicable result detected in associated samples
Accuracy/Bias Method Blank (each batch) Blank result MDA or <10% of the applicable result detected in associated samples
Liquid Waste Tank Residuals Sampling- SRR-CWDA-2011-00117 Quality Assurance Program Plan Revision 1 July 2013
Page 28 of 99
Table A7-1: Typical Measurement Performance Criteria for Residuals Sample Analyses (Continued)
Method (See Table B4-1 for
instruments typically used) Analyte
Analytical Operating Procedure
(AOP)1
Data Quality Indicator (DQI)2
Quality Control (QC) or Activity Used to Assess Performance
SRNL Measurement Performance Criteria (MPC)
HRR Analyses (Continued)
Gamma Scan Cs-137, Cs-134
ADS-2420, R&D Directions
Requested Detection Limit Data review Meets requested MDA
Accuracy/Bias Instrument Performance Check HPGe Gamma
See Table B7-1
Accuracy/Bias AFM Blank (typically ARG and/or sludge simulant)
Blank result MDA or <10% of the applicable result detected in associated samples
Accuracy/Bias Method Blank (each batch) Blank result MDA or <10% of the applicable result detected in associated samples
U-233, 234, 235, 236
U-233, U-234, U-235, U-236
ADS-2449, ADS-1543, R&D Directions, Results linked to ICP-MS for U-238
Requested Detection Limit Data review Meets requested DL
Accuracy/Bias Instrument Performance Check ICP-MS
See Table B7-1
Accuracy/Bias AFM blank (typically ARG or sludge simulant)
Blank result DL or <10% of the applicable result detected in associated samples
Accuracy/Bias Method Blank (each batch) Blank result DL or <10% of the applicable result detected in associated samples
Np-237 Np-237
ADS-2420, ADS-2449, ADS-1543, R&D Directions, results linked to ICP-MS
Requested Detection Limit Data review Meets requested DL
Accuracy/Bias
Instrument Performance Check HPGe Gamma or ICP-MS
See Table B7-1
Accuracy/Bias Internal Tracer (each sample, Np-239)
Signal/noise ratio in final counts sufficient for quantification to meet the requested DL
Accuracy/Bias AFM Blank (typically ARG and/or sludge simulant)
Blank result DL or <10% of the applicable result detected in associated samples
Accuracy/Bias Method Blank (each batch) Blank result DL or <10% of the applicable result detected in associated samples
Liquid Waste Tank Residuals Sampling- SRR-CWDA-2011-00117 Quality Assurance Program Plan Revision 1 July 2013
Page 29 of 99
Table A7-1: Typical Measurement Performance Criteria for Residuals Sample Analyses (Continued)
Method (See Table B4-1 for
instruments typically used) Analyte
Analytical Operating Procedure
(AOP)1
Data Quality Indicator (DQI)2
Quality Control (QC) or Activity Used to Assess Performance
SRNL Measurement Performance Criteria (MPC)
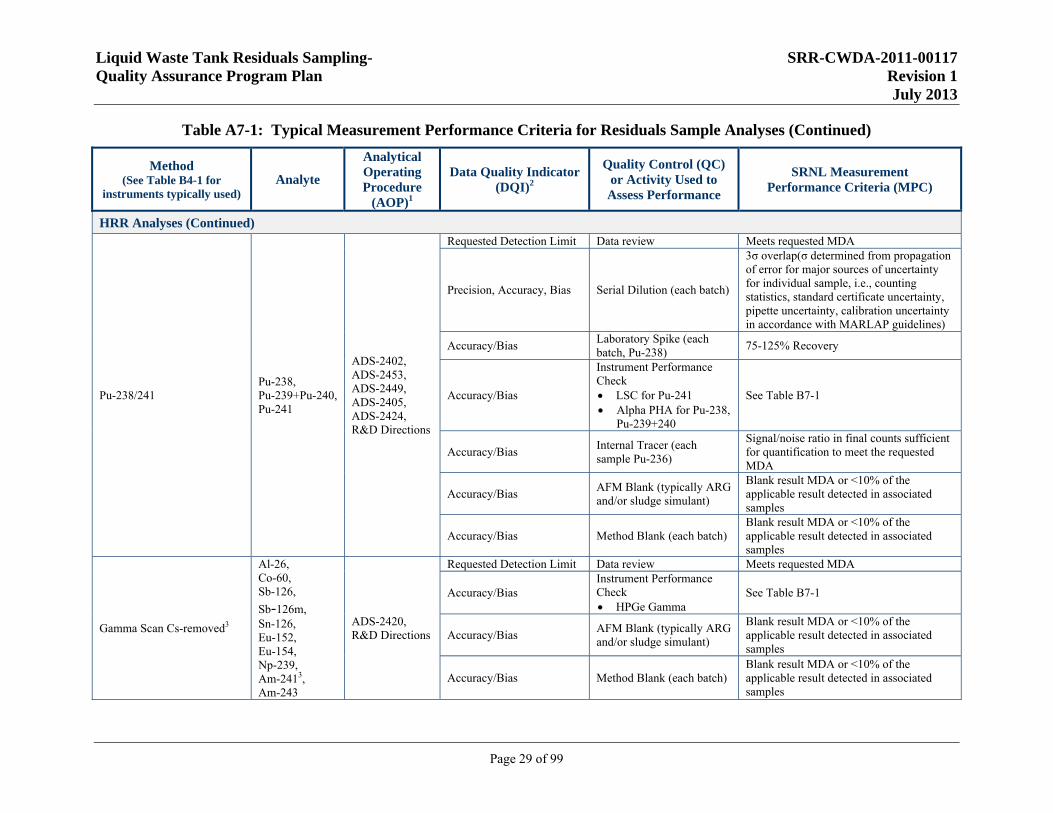
HRR Analyses (Continued)
Pu-238/241 Pu-238, Pu-239+Pu-240, Pu-241
ADS-2402, ADS-2453, ADS-2449, ADS-2405, ADS-2424, R&D Directions
Requested Detection Limit Data review Meets requested MDA
Precision, Accuracy, Bias Serial Dilution (each batch)
3σ overlap(σ determined from propagation of error for major sources of uncertainty for individual sample, i.e., counting statistics, standard certificate uncertainty, pipette uncertainty, calibration uncertainty in accordance with MARLAP guidelines)
Accuracy/Bias Laboratory Spike (each batch, Pu-238)
75-125% Recovery
Accuracy/Bias
Instrument Performance Check LSC for Pu-241 Alpha PHA for Pu-238,
Pu-239+240
See Table B7-1
Accuracy/Bias Internal Tracer (each sample Pu-236)
Signal/noise ratio in final counts sufficient for quantification to meet the requested MDA
Accuracy/Bias AFM Blank (typically ARG and/or sludge simulant)
Blank result MDA or <10% of the applicable result detected in associated samples
Accuracy/Bias Method Blank (each batch) Blank result MDA or <10% of the applicable result detected in associated samples
Gamma Scan Cs-removed3
Al-26, Co-60, Sb-126,
Sb-126m, Sn-126, Eu-152, Eu-154, Np-239, Am-2413, Am-243
ADS-2420, R&D Directions
Requested Detection Limit Data review Meets requested MDA
Accuracy/Bias Instrument Performance Check HPGe Gamma
See Table B7-1
Accuracy/Bias AFM Blank (typically ARG and/or sludge simulant)
Blank result MDA or <10% of the applicable result detected in associated samples
Accuracy/Bias Method Blank (each batch) Blank result MDA or <10% of the applicable result detected in associated samples
Liquid Waste Tank Residuals Sampling- SRR-CWDA-2011-00117 Quality Assurance Program Plan Revision 1 July 2013
Page 30 of 99
Table A7-1: Typical Measurement Performance Criteria for Residuals Sample Analyses (Continued)
Method (See Table B4-1 for
instruments typically used) Analyte
Analytical Operating Procedure
(AOP)1
Data Quality Indicator (DQI)2
Quality Control (QC) or Activity Used to Assess Performance
SRNL Measurement Performance Criteria (MPC)
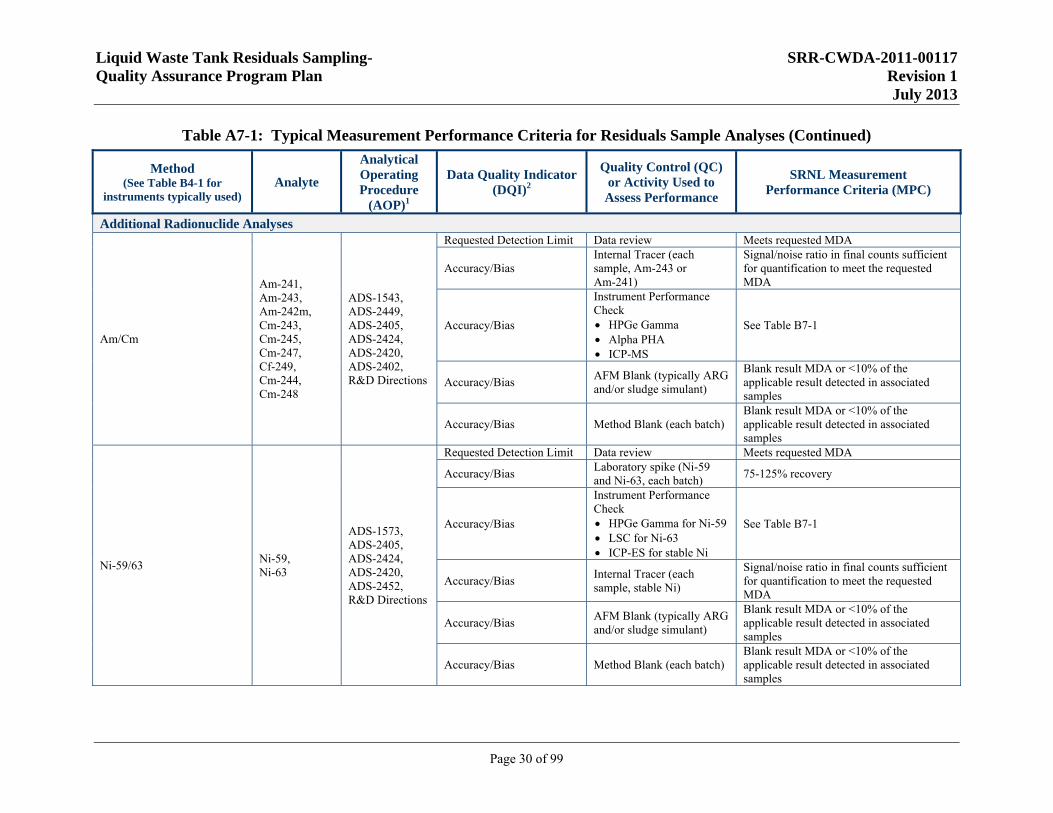
Additional Radionuclide Analyses
Am/Cm
Am-241, Am-243, Am-242m, Cm-243, Cm-245, Cm-247, Cf-249, Cm-244, Cm-248
ADS-1543, ADS-2449, ADS-2405, ADS-2424, ADS-2420, ADS-2402, R&D Directions
Requested Detection Limit Data review Meets requested MDA
Accuracy/Bias Internal Tracer (each sample, Am-243 or Am-241)
Signal/noise ratio in final counts sufficient for quantification to meet the requested MDA
Accuracy/Bias
Instrument Performance Check HPGe Gamma Alpha PHA ICP-MS
See Table B7-1
Accuracy/Bias AFM Blank (typically ARG and/or sludge simulant)
Blank result MDA or <10% of the applicable result detected in associated samples
Accuracy/Bias Method Blank (each batch) Blank result MDA or <10% of the applicable result detected in associated samples
Ni-59/63 Ni-59, Ni-63
ADS-1573, ADS-2405, ADS-2424, ADS-2420, ADS-2452, R&D Directions
Requested Detection Limit Data review Meets requested MDA
Accuracy/Bias Laboratory spike (Ni-59 and Ni-63, each batch)
75-125% recovery
Accuracy/Bias
Instrument Performance Check HPGe Gamma for Ni-59 LSC for Ni-63 ICP-ES for stable Ni
See Table B7-1
Accuracy/Bias Internal Tracer (each sample, stable Ni)
Signal/noise ratio in final counts sufficient for quantification to meet the requested MDA
Accuracy/Bias AFM Blank (typically ARG and/or sludge simulant)
Blank result MDA or <10% of the applicable result detected in associated samples
Accuracy/Bias Method Blank (each batch) Blank result MDA or <10% of the applicable result detected in associated samples
Liquid Waste Tank Residuals Sampling- SRR-CWDA-2011-00117 Quality Assurance Program Plan Revision 1 July 2013
Page 31 of 99
Table A7-1: Typical Measurement Performance Criteria for Residuals Sample Analyses (Continued)
Method (See Table B4-1 for
instruments typically used) Analyte
Analytical Operating Procedure
(AOP)1
Data Quality Indicator (DQI)2
Quality Control (QC) or Activity Used to Assess Performance
SRNL Measurement Performance Criteria (MPC)
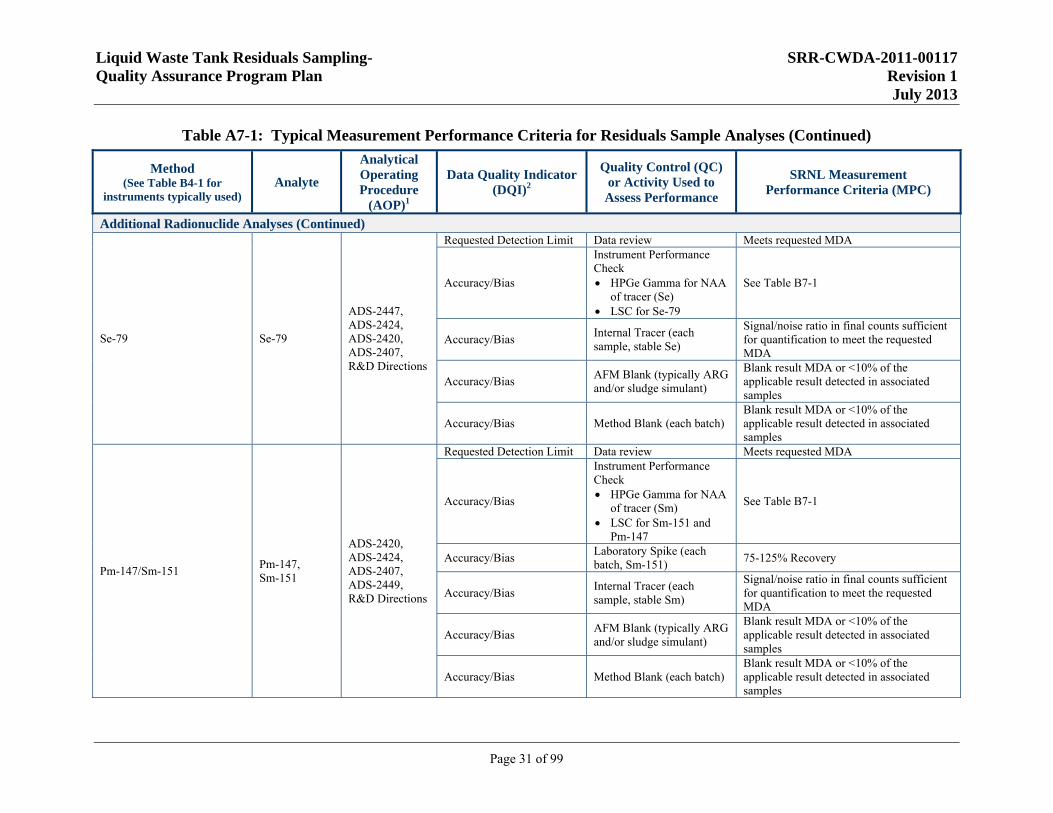
Additional Radionuclide Analyses (Continued)
Se-79 Se-79
ADS-2447, ADS-2424, ADS-2420, ADS-2407, R&D Directions
Requested Detection Limit Data review Meets requested MDA
Accuracy/Bias
Instrument Performance Check HPGe Gamma for NAA
of tracer (Se) LSC for Se-79
See Table B7-1
Accuracy/Bias Internal Tracer (each sample, stable Se)
Signal/noise ratio in final counts sufficient for quantification to meet the requested MDA
Accuracy/Bias AFM Blank (typically ARG and/or sludge simulant)
Blank result MDA or <10% of the applicable result detected in associated samples
Accuracy/Bias Method Blank (each batch) Blank result MDA or <10% of the applicable result detected in associated samples
Pm-147/Sm-151 Pm-147, Sm-151
ADS-2420, ADS-2424, ADS-2407, ADS-2449, R&D Directions
Requested Detection Limit Data review Meets requested MDA
Accuracy/Bias
Instrument Performance Check HPGe Gamma for NAA
of tracer (Sm) LSC for Sm-151 and
Pm-147
See Table B7-1
Accuracy/Bias Laboratory Spike (each batch, Sm-151)
75-125% Recovery
Accuracy/Bias Internal Tracer (each sample, stable Sm)
Signal/noise ratio in final counts sufficient for quantification to meet the requested MDA
Accuracy/Bias AFM Blank (typically ARG and/or sludge simulant)
Blank result MDA or <10% of the applicable result detected in associated samples
Accuracy/Bias Method Blank (each batch) Blank result MDA or <10% of the applicable result detected in associated samples
Liquid Waste Tank Residuals Sampling- SRR-CWDA-2011-00117 Quality Assurance Program Plan Revision 1 July 2013
Page 32 of 99
Table A7-1: Typical Measurement Performance Criteria for Residuals Sample Analyses (Continued)
Method (See Table B4-1 for
instruments typically used) Analyte
Analytical Operating Procedure
(AOP)1
Data Quality Indicator (DQI)2
Quality Control (QC) or Activity Used to Assess Performance
SRNL Measurement Performance Criteria (MPC)
Additional Radionuclide Analyses (Continued)
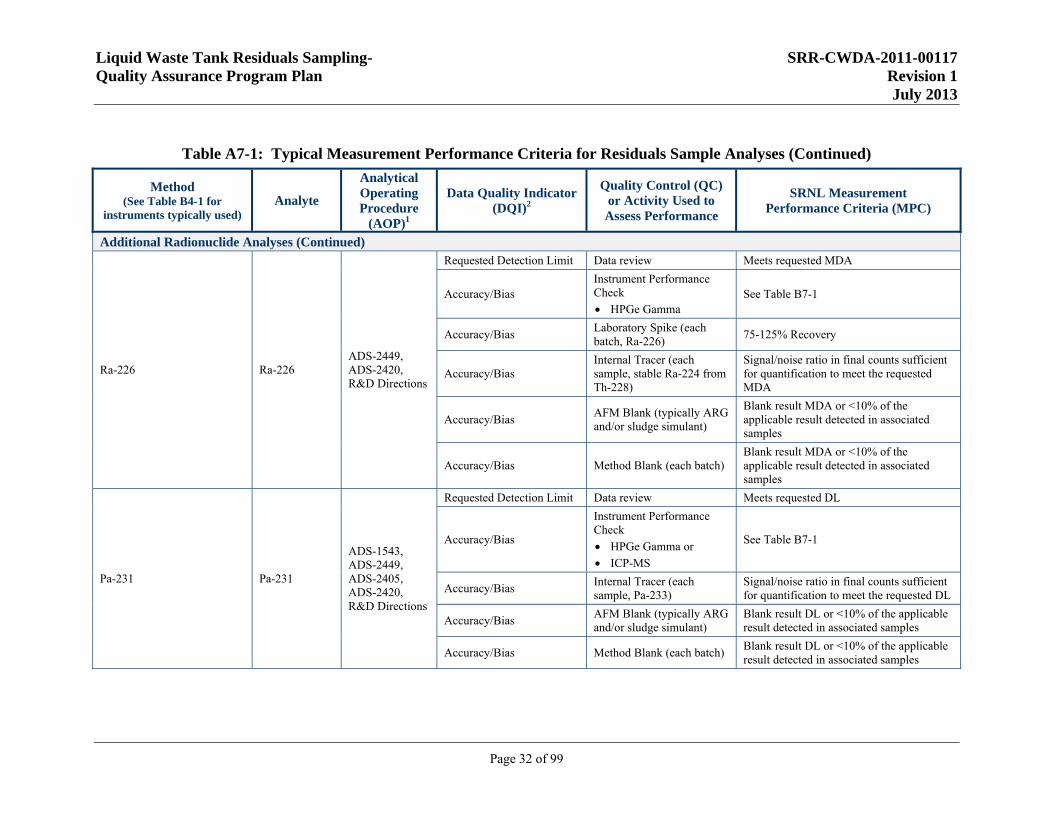
Ra-226 Ra-226 ADS-2449, ADS-2420, R&D Directions
Requested Detection Limit Data review Meets requested MDA
Accuracy/Bias Instrument Performance Check
HPGe Gamma See Table B7-1
Accuracy/Bias Laboratory Spike (each batch, Ra-226)
75-125% Recovery
Accuracy/Bias Internal Tracer (each sample, stable Ra-224 from Th-228)
Signal/noise ratio in final counts sufficient for quantification to meet the requested MDA
Accuracy/Bias AFM Blank (typically ARG and/or sludge simulant)
Blank result MDA or <10% of the applicable result detected in associated samples
Accuracy/Bias Method Blank (each batch) Blank result MDA or <10% of the applicable result detected in associated samples
Pa-231 Pa-231
ADS-1543, ADS-2449, ADS-2405, ADS-2420, R&D Directions
Requested Detection Limit Data review Meets requested DL
Accuracy/Bias
Instrument Performance Check
HPGe Gamma or
ICP-MS
See Table B7-1
Accuracy/Bias Internal Tracer (each sample, Pa-233)
Signal/noise ratio in final counts sufficient for quantification to meet the requested DL
Accuracy/Bias AFM Blank (typically ARG and/or sludge simulant)
Blank result DL or <10% of the applicable result detected in associated samples
Accuracy/Bias Method Blank (each batch) Blank result DL or <10% of the applicable result detected in associated samples
Liquid Waste Tank Residuals Sampling- SRR-CWDA-2011-00117 Quality Assurance Program Plan Revision 1 July 2013
Page 33 of 99
Table A7-1: Typical Measurement Performance Criteria for Residuals Sample Analyses (Continued)
Method (See Table B4-1 for
instruments typically used) Analyte
Analytical Operating Procedure
(AOP)1
Data Quality Indicator (DQI)2
Quality Control (QC) or Activity Used to Assess Performance
SRNL Measurement Performance Criteria (MPC)
Additional Radionuclide Analyses (Continued)
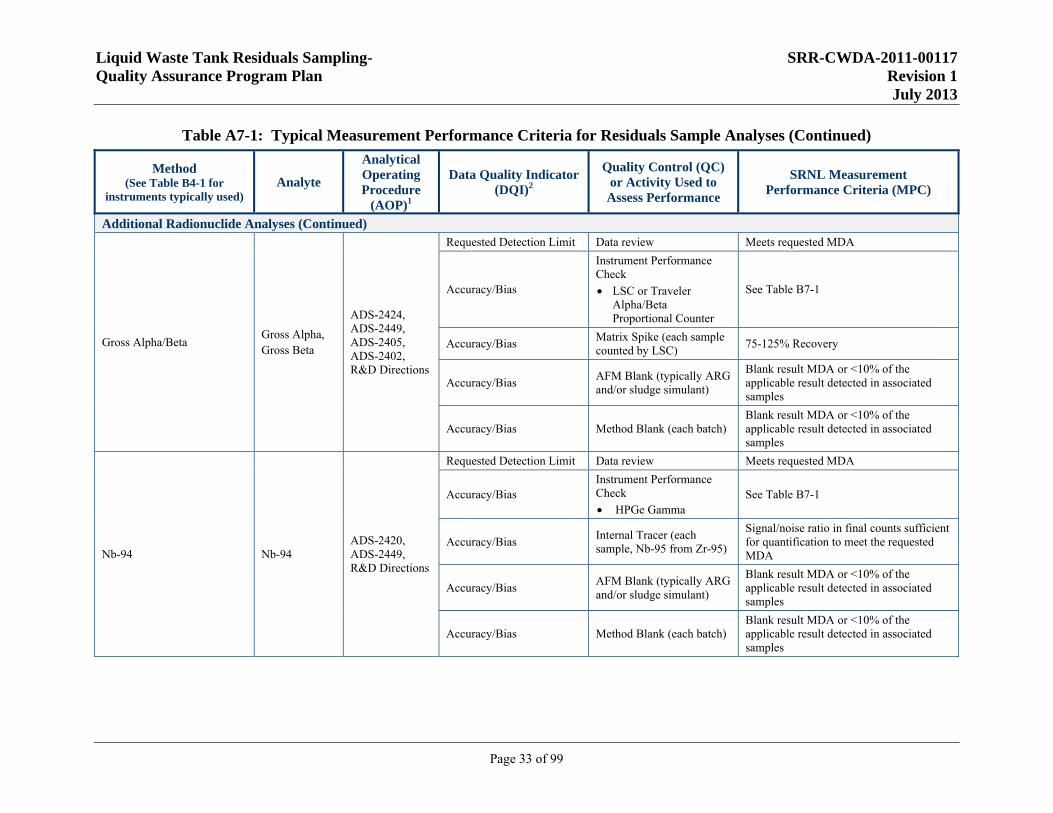
Gross Alpha/Beta Gross Alpha, Gross Beta
ADS-2424, ADS-2449, ADS-2405, ADS-2402, R&D Directions
Requested Detection Limit Data review Meets requested MDA
Accuracy/Bias
Instrument Performance Check
LSC or Traveler Alpha/Beta Proportional Counter
See Table B7-1
Accuracy/Bias Matrix Spike (each sample counted by LSC)
75-125% Recovery
Accuracy/Bias AFM Blank (typically ARG and/or sludge simulant)
Blank result MDA or <10% of the applicable result detected in associated samples
Accuracy/Bias Method Blank (each batch) Blank result MDA or <10% of the applicable result detected in associated samples
Nb-94 Nb-94 ADS-2420, ADS-2449, R&D Directions
Requested Detection Limit Data review Meets requested MDA
Accuracy/Bias Instrument Performance Check
HPGe Gamma See Table B7-1
Accuracy/Bias Internal Tracer (each sample, Nb-95 from Zr-95)
Signal/noise ratio in final counts sufficient for quantification to meet the requested MDA
Accuracy/Bias AFM Blank (typically ARG and/or sludge simulant)
Blank result MDA or <10% of the applicable result detected in associated samples
Accuracy/Bias Method Blank (each batch) Blank result MDA or <10% of the applicable result detected in associated samples
Liquid Waste Tank Residuals Sampling- SRR-CWDA-2011-00117 Quality Assurance Program Plan Revision 1 July 2013
Page 34 of 99
Table A7-1: Typical Measurement Performance Criteria for Residuals Sample Analyses (Continued)
Method (See Table B4-1 for
instruments typically used) Analyte
Analytical Operating Procedure
(AOP)1
Data Quality Indicator (DQI)2
Quality Control (QC) or Activity Used to Assess Performance
SRNL Measurement Performance Criteria (MPC)
Additional Radionuclide Analyses (Continued)
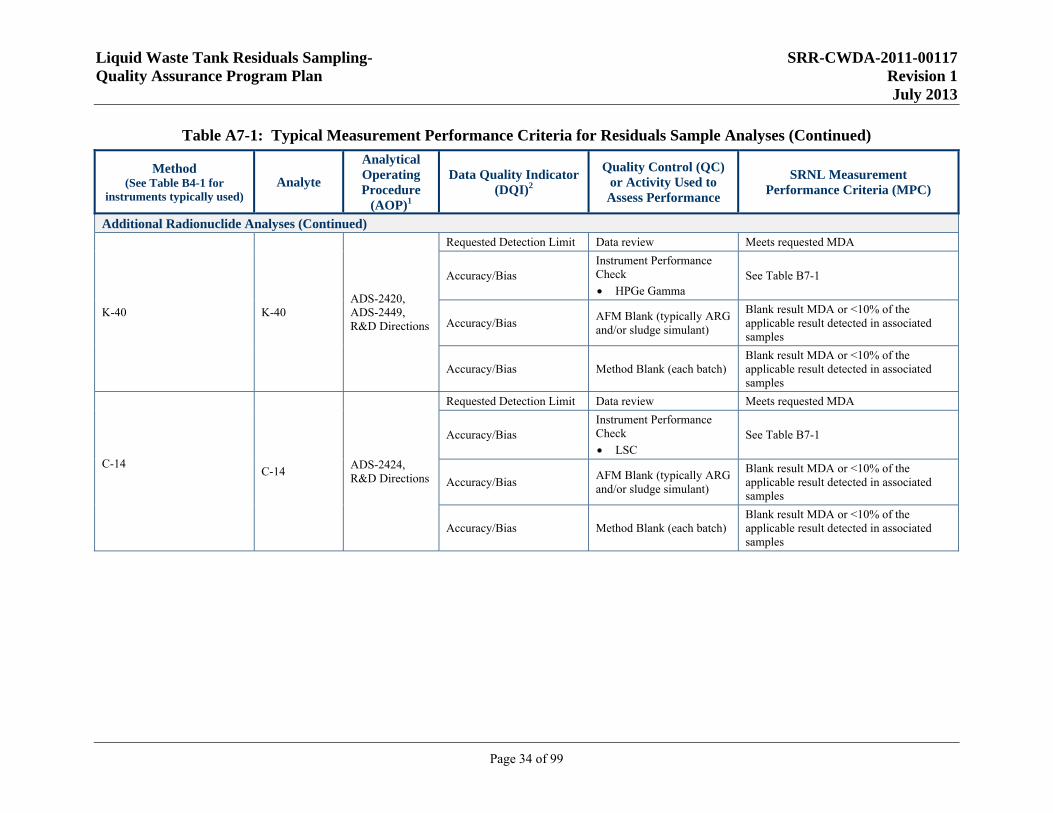
K-40 K-40 ADS-2420, ADS-2449, R&D Directions
Requested Detection Limit Data review Meets requested MDA
Accuracy/Bias Instrument Performance Check
HPGe Gamma See Table B7-1
Accuracy/Bias AFM Blank (typically ARG and/or sludge simulant)
Blank result MDA or <10% of the applicable result detected in associated samples
Accuracy/Bias Method Blank (each batch) Blank result MDA or <10% of the applicable result detected in associated samples
C-14
C-14 ADS-2424, R&D Directions
Requested Detection Limit Data review Meets requested MDA
Accuracy/Bias Instrument Performance Check
LSC See Table B7-1
Accuracy/Bias AFM Blank (typically ARG and/or sludge simulant)
Blank result MDA or <10% of the applicable result detected in associated samples
Accuracy/Bias Method Blank (each batch) Blank result MDA or <10% of the applicable result detected in associated samples
Liquid Waste Tank Residuals Sampling- SRR-CWDA-2011-00117 Quality Assurance Program Plan Revision 1 July 2013
Page 35 of 99
Table A7-1: Typical Measurement Performance Criteria for Residuals Sample Analyses (Continued)
Method (See Table B4-1 for
instruments typically used) Analyte
Analytical Operating Procedure
(AOP)1
Data Quality Indicator (DQI)2
Quality Control (QC) or Activity Used to
Assess Performance
SRNL Measurement Performance Criteria (MPC)
Additional Radionuclide Analyses (Continued)
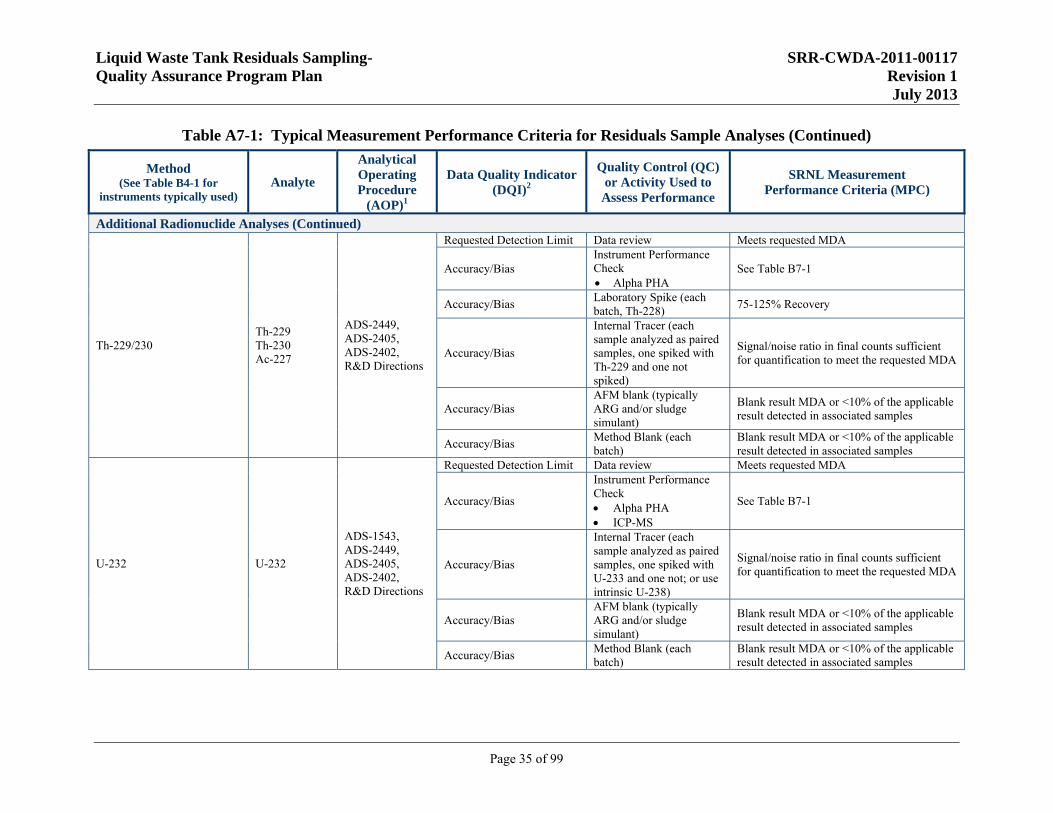
Th-229/230 Th-229 Th-230 Ac-227
ADS-2449, ADS-2405, ADS-2402, R&D Directions
Requested Detection Limit Data review Meets requested MDA
Accuracy/Bias Instrument Performance Check Alpha PHA
See Table B7-1
Accuracy/Bias Laboratory Spike (each batch, Th-228)
75-125% Recovery
Accuracy/Bias
Internal Tracer (each sample analyzed as paired samples, one spiked with Th-229 and one not spiked)
Signal/noise ratio in final counts sufficient for quantification to meet the requested MDA
Accuracy/Bias AFM blank (typically ARG and/or sludge simulant)
Blank result MDA or <10% of the applicable result detected in associated samples
Accuracy/Bias Method Blank (each batch)
Blank result MDA or <10% of the applicable result detected in associated samples
U-232 U-232
ADS-1543, ADS-2449, ADS-2405, ADS-2402, R&D Directions
Requested Detection Limit Data review Meets requested MDA
Accuracy/Bias
Instrument Performance Check Alpha PHA ICP-MS
See Table B7-1
Accuracy/Bias
Internal Tracer (each sample analyzed as paired samples, one spiked with U-233 and one not; or use intrinsic U-238)
Signal/noise ratio in final counts sufficient for quantification to meet the requested MDA
Accuracy/Bias AFM blank (typically ARG and/or sludge simulant)
Blank result MDA or <10% of the applicable result detected in associated samples
Accuracy/Bias Method Blank (each batch)
Blank result MDA or <10% of the applicable result detected in associated samples
Liquid Waste Tank Residuals Sampling- SRR-CWDA-2011-00117 Quality Assurance Program Plan Revision 1 July 2013
Page 36 of 99
Table A7-1: Typical Measurement Performance Criteria for Residuals Sample Analyses (Continued)
Method (See Table B4-1 for
instruments typically used) Analyte
Analytical Operating Procedure
(AOP)1
Data Quality Indicator (DQI)2
Quality Control (QC) or Activity Used to
Assess Performance
SRNL Measurement Performance Criteria (MPC)
Additional Radionuclide Analyses (Continued)
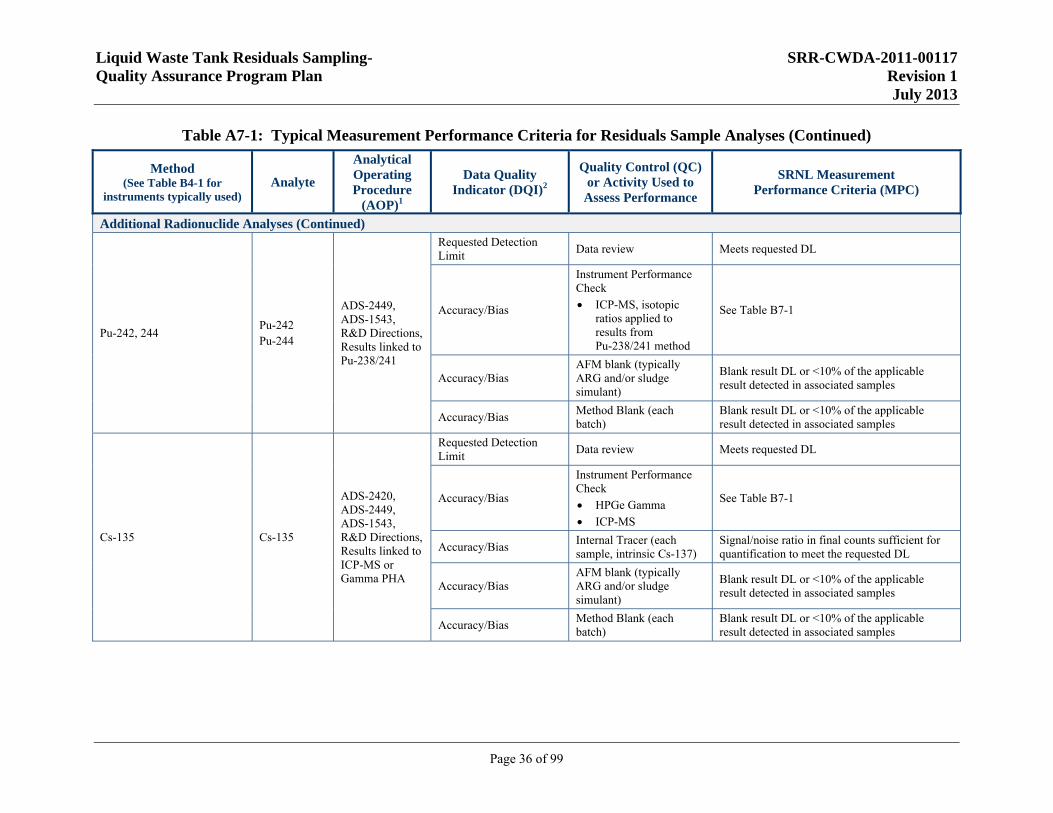
Pu-242, 244 Pu-242 Pu-244
ADS-2449, ADS-1543, R&D Directions, Results linked to Pu-238/241
Requested Detection Limit
Data review Meets requested DL
Accuracy/Bias
Instrument Performance Check
ICP-MS, isotopic ratios applied to results from Pu-238/241 method
See Table B7-1
Accuracy/Bias AFM blank (typically ARG and/or sludge simulant)
Blank result DL or <10% of the applicable result detected in associated samples
Accuracy/Bias Method Blank (each batch)
Blank result DL or <10% of the applicable result detected in associated samples
Cs-135 Cs-135
ADS-2420, ADS-2449, ADS-1543, R&D Directions, Results linked to ICP-MS or Gamma PHA
Requested Detection Limit
Data review Meets requested DL
Accuracy/Bias
Instrument Performance Check
HPGe Gamma
ICP-MS
See Table B7-1
Accuracy/Bias Internal Tracer (each sample, intrinsic Cs-137)
Signal/noise ratio in final counts sufficient for quantification to meet the requested DL
Accuracy/Bias AFM blank (typically ARG and/or sludge simulant)
Blank result DL or <10% of the applicable result detected in associated samples
Accuracy/Bias Method Blank (each batch)
Blank result DL or <10% of the applicable result detected in associated samples
Liquid Waste Tank Residuals Sampling- SRR-CWDA-2011-00117 Quality Assurance Program Plan Revision 1 July 2013
Page 37 of 99
Table A7-1: Typical Measurement Performance Criteria for Residuals Sample Analyses (Continued)
Method (See Table B4-1 for
instruments typically used) Analyte
Analytical Operating Procedure
(AOP)1
Data Quality Indicator (DQI)2
Quality Control (QC) or Activity Used to
Assess Performance
SRNL Measurement Performance Criteria (MPC)
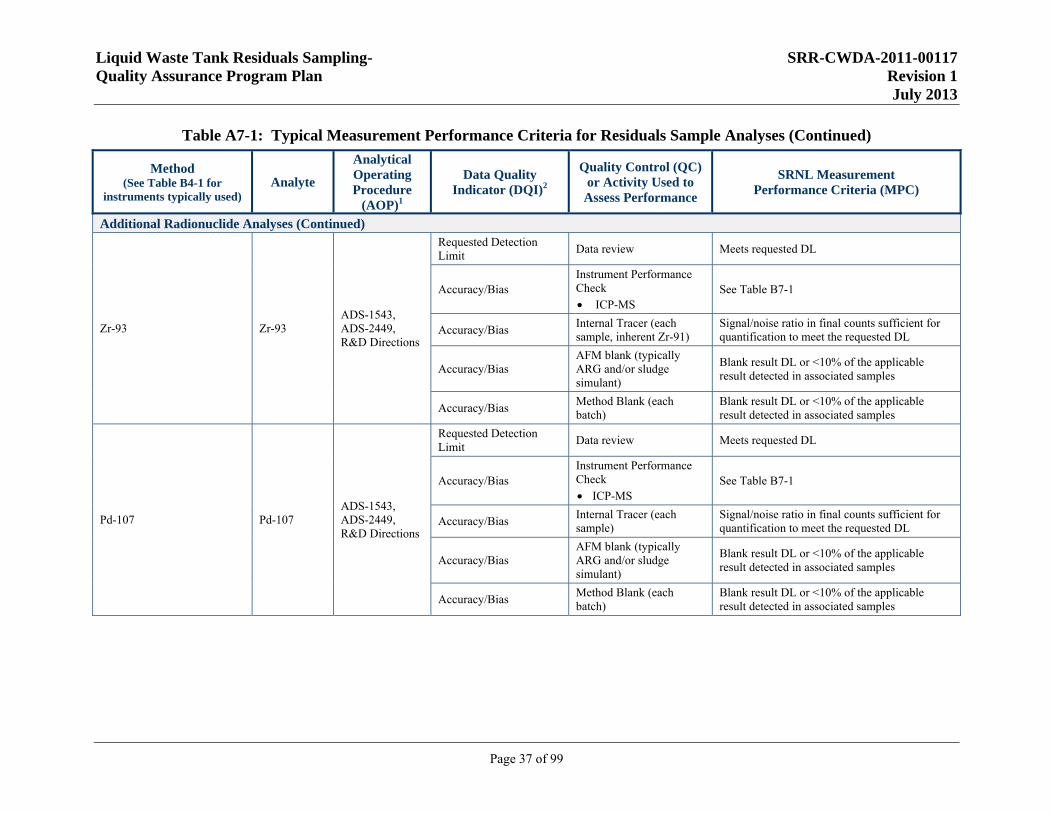
Additional Radionuclide Analyses (Continued)
Zr-93 Zr-93 ADS-1543, ADS-2449, R&D Directions
Requested Detection Limit
Data review Meets requested DL
Accuracy/Bias Instrument Performance Check
ICP-MS See Table B7-1
Accuracy/Bias Internal Tracer (each sample, inherent Zr-91)
Signal/noise ratio in final counts sufficient for quantification to meet the requested DL
Accuracy/Bias AFM blank (typically ARG and/or sludge simulant)
Blank result DL or <10% of the applicable result detected in associated samples
Accuracy/Bias Method Blank (each batch)
Blank result DL or <10% of the applicable result detected in associated samples
Pd-107 Pd-107 ADS-1543, ADS-2449, R&D Directions
Requested Detection Limit
Data review Meets requested DL
Accuracy/Bias Instrument Performance Check
ICP-MS See Table B7-1
Accuracy/Bias Internal Tracer (each sample)
Signal/noise ratio in final counts sufficient for quantification to meet the requested DL
Accuracy/Bias AFM blank (typically ARG and/or sludge simulant)
Blank result DL or <10% of the applicable result detected in associated samples
Accuracy/Bias Method Blank (each batch)
Blank result DL or <10% of the applicable result detected in associated samples
Liquid Waste Tank Residuals Sampling- SRR-CWDA-2011-00117 Quality Assurance Program Plan Revision 1 July 2013
Page 38 of 99
Table A7-1: Typical Measurement Performance Criteria for Residuals Sample Analyses (Continued)
Method (See Table B4-1 for
instruments typically used) Analyte
Analytical Operating Procedure
(AOP)1
Data Quality Indicator (DQI)2
Quality Control (QC) or Activity Used to
Assess Performance
SRNL Measurement Performance Criteria (MPC)
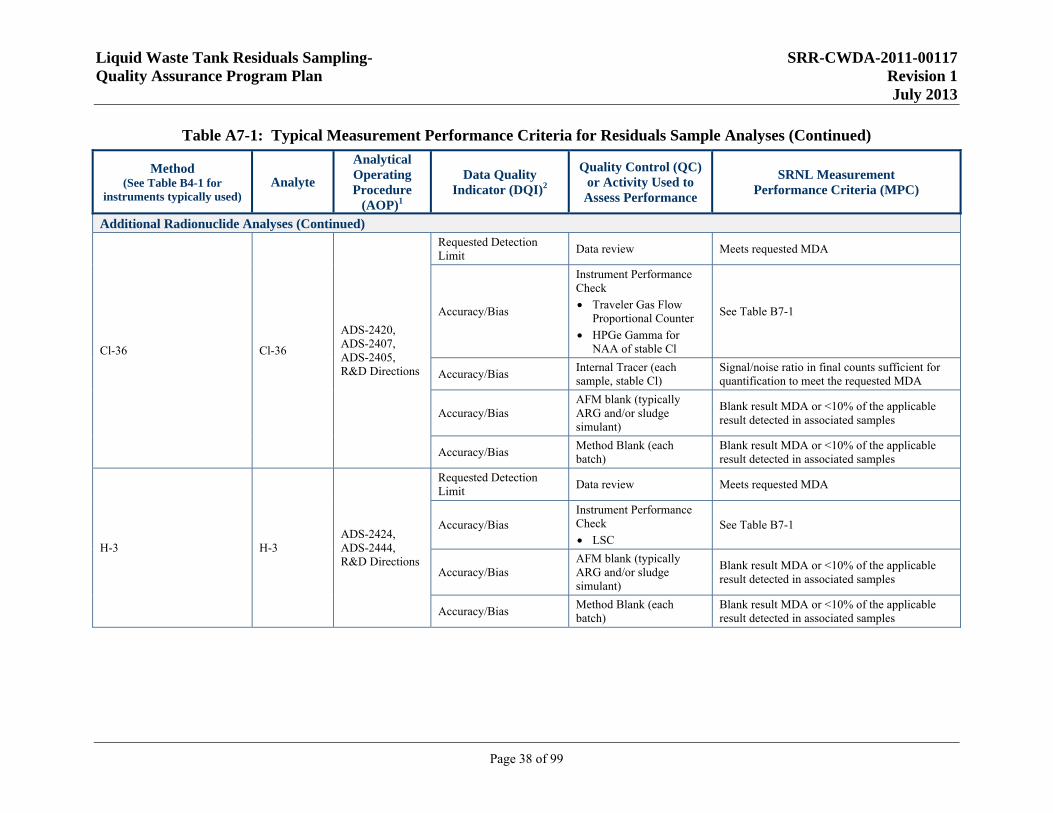
Additional Radionuclide Analyses (Continued)
Cl-36 Cl-36
ADS-2420, ADS-2407, ADS-2405, R&D Directions
Requested Detection Limit
Data review Meets requested MDA
Accuracy/Bias
Instrument Performance Check
Traveler Gas Flow Proportional Counter
HPGe Gamma for NAA of stable Cl
See Table B7-1
Accuracy/Bias Internal Tracer (each sample, stable Cl)
Signal/noise ratio in final counts sufficient for quantification to meet the requested MDA
Accuracy/Bias AFM blank (typically ARG and/or sludge simulant)
Blank result MDA or <10% of the applicable result detected in associated samples
Accuracy/Bias Method Blank (each batch)
Blank result MDA or <10% of the applicable result detected in associated samples
H-3 H-3 ADS-2424, ADS-2444, R&D Directions
Requested Detection Limit
Data review Meets requested MDA
Accuracy/Bias Instrument Performance Check
LSC See Table B7-1
Accuracy/Bias AFM blank (typically ARG and/or sludge simulant)
Blank result MDA or <10% of the applicable result detected in associated samples
Accuracy/Bias Method Blank (each batch)
Blank result MDA or <10% of the applicable result detected in associated samples
Liquid Waste Tank Residuals Sampling- SRR-CWDA-2011-00117 Quality Assurance Program Plan Revision 1 July 2013
Page 39 of 99
Table A7-1: Typical Measurement Performance Criteria for Residuals Sample Analyses (Continued)
Method (See Table B4-1 for
instruments typically used) Analyte
Analytical Operating Procedure
(AOP)1
Data Quality Indicator (DQI)2
Quality Control (QC) or Activity Used to
Assess Performance
SRNL Measurement Performance Criteria (MPC)
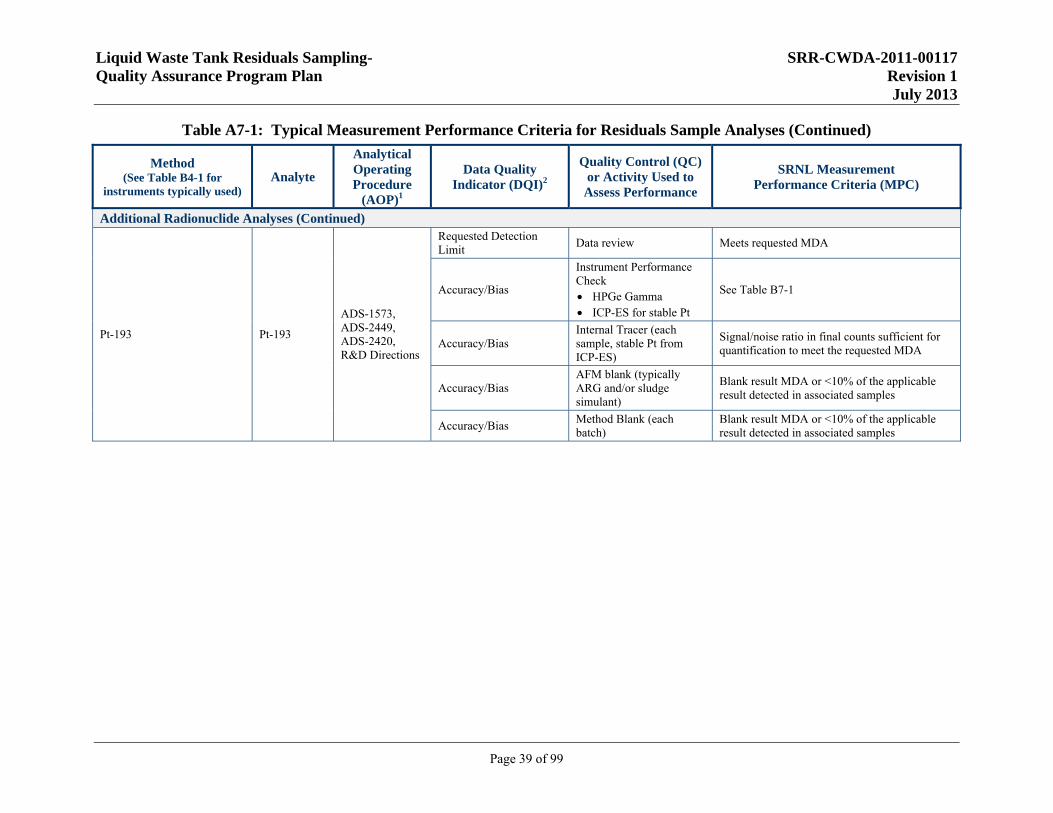
Additional Radionuclide Analyses (Continued)
Pt-193 Pt-193
ADS-1573, ADS-2449, ADS-2420, R&D Directions
Requested Detection Limit
Data review Meets requested MDA
Accuracy/Bias
Instrument Performance Check HPGe Gamma ICP-ES for stable Pt
See Table B7-1
Accuracy/Bias Internal Tracer (each sample, stable Pt from ICP-ES)
Signal/noise ratio in final counts sufficient for quantification to meet the requested MDA
Accuracy/Bias AFM blank (typically ARG and/or sludge simulant)
Blank result MDA or <10% of the applicable result detected in associated samples
Accuracy/Bias Method Blank (each batch)
Blank result MDA or <10% of the applicable result detected in associated samples
Liquid Waste Tank Residuals Sampling- SRR-CWDA-2011-00117 Quality Assurance Program Plan Revision 1 July 2013
Page 40 of 99
1 The Analytical Operating Procedures and summary of the analytical methods used are in Attachment 2 of this document. 2 Measurement uncertainty is used as a DQI and will be reported for radionuclides and reviewed by the data user to ensure that it meets the user needs. It will be addressed in
the case narrative and in the DQA. 3 Am-241 is the only HRR measured in this analysis.
Notes: ARG Analyzed Reference Glass AFM Analyte-Free Matrix Blank CCB Continuing Calibration Blank CCV Continuing Calibration Verification DL Detection Limit (equivalent to LOD) HPGe Gamma High-Purity Germanium Detector Gamma Spectrometer and associated electronics ICB Initial Calibration Blank ICV Initial Calibration Verification LCS Laboratory Control Standard LOD Level of Detection (equivalent to DL) LSC Liquid Scintillation Counting MDA Minimum Detectable Activity (typically used to express detection limits for measurement of radionuclides) MARLAP Multi-Agency Radiological Laboratory Analytical Protocols N/A Not Applicable NA Not applied to the method for this program NAA Neutron Activation Analysis NaCl Sodium Chloride NaI Gamma Sodium Iodide Detector Gamma Spectrometer and associated electronics PHA Pulse-Height Analysis r correlation coefficient R&D Research and Development
Liquid Waste Tank Residuals Sampling- SRR-CWDA-2011-00117 Quality Assurance Program Plan Revision 1 July 2013
Page 41 of 99
Evaluations of uncertainties for each individual sample are carried out and a combined measurement uncertainty is reported with each analytical result. While all possible sources of measurement uncertainty are evaluated, the most significant sources receive the most stringent focus. Inordinate effort is not expended on the evaluation of small components of uncertainty when much larger components are known to dominate. In general, the uncertainty propagation for sources of error considered significant is carried out as described in MARLAP Section 19.4, Example 19.9. [EPA 402-B-04-001C] The calculations are performed using spreadsheets originated and maintained in accordance with ADS-WI00023, “Spreadsheet Quality Control for Analytical Development Section.” The spreadsheets are part of the analytical records maintained in the laboratory.
In accordance with MARLAP, acceptance limits for yields should be specified in some manner. The required yields for carriers and tracers are not defined numerically; rather, they are based upon their quantification above the minimum detectable concentration (MDC) or minimum detectable activity (MDA). As the instrument’s signal to noise ratio worsens, the uncertainty in the reported result increases due to counting statistics and error propagation. A low yield will increase the overall measurement uncertainty and decrease the effective detection capability. Provided the tracer recovery provides a tracer signal that is quantifiable above the MDC or MDA, and the low yield does not increase the reported analyte MDA to a value that exceeds the customer-requested MDA, the tracer recovery is considered acceptable. The propagated measurement uncertainty increases as the tracer recovery (and signal) decreases. This increase in analysis uncertainty caused by low yield is reflected in the uncertainty reported with the result.
For metals and anions, control charting is used to determine analytical uncertainties. For Inductively Coupled Plasma - Atomic Emission Spectroscopy (ICP-ES) and Ion Chromatography the reported uncertainties would be a minimum of 10%. For Atomic Absorption (AA) and Inductively Coupled Plasma - Mass Spectroscopy (ICP-MS), the reported uncertainties would be a minimum of 20%. For radiological analyses, the uncertainties are quantified as described in this section.
In the DQA, the analytical uncertainty will be evaluated against the measurement uncertainty for the triplicate measurement analyses for each sample. In general, the analytical uncertainty should be less than the uncertainty between the triplicate measurement results, indicating the analytical uncertainty does not need to be taken into account separately. The measurement uncertainty for each analyte is calculated by dividing the standard deviation of the mean by the square root of n, where n is the number of replicate aliquots of an individual sample analyzed.
A7.3 Data Quality Objectives Process
Consistent with the DOE Guide 435.1-1 and EPA/240/B-06/001, the seven-step Data Quality Objectives (DQOs) development process was followed to identify the type, quantity, and quality of residuals characterization data needed to support the FTF/HTF waste tank removal from service activities. Details on the development of the DQOs are provided in Chapter 3 of the LWTRSAPP. [SRR-CWDA-2011-00050] The DQO process is summarized below.
The scope of the DQOs is outlined in the following statements:
The DQO process will only address the sampling plan design and sample analyses for waste tank residuals material.
Liquid Waste Tank Residuals Sampling- SRR-CWDA-2011-00117 Quality Assurance Program Plan Revision 1 July 2013
Page 42 of 99
The waste tank system within the footprint of the tank is the sampling and analysis action boundary. These DQOs will not address any closure actions associated with contaminated soil or ancillary tank farm structures or equipment.
A7.3.1 State the Problem
Based on the intent and commitments of DOE and compliance with relevant and appropriate guidelines listed in the FTF and HTF PAs [SRS-REG-2007-00002, SRR-CWDA-2010-00128], the problem to be addressed can be written as:
Provide waste tank residuals material characterization (concentrations) that enable residuals material inventory determinations to support tank closure decisions.
The Principal Study Question (PSQ) that addresses the problem statement follows:
Do the sample analyses provide the necessary concentration data to support the residuals material inventory determination?
A7.3.2 Identify the Decision
Residuals sampling is not performed for comparing residuals concentrations against prescribed environmental limits. The characterization data is used to determine the waste tank residuals inventory, which is then compared in the Special Analysis (SA) to the inventory used in the PA, and to support operational closure decisions.
This LWTRS-QAPP is designed to support the waste tank residuals sampling and analysis documented in the LWTRSAPP. This LWTRS-QAPP is not applicable to Tanks 5, 6, 18, or 19 where characterization activities have been completed.
A7.3.3 Identify Inputs to the Decision
Four types of data are required to address the problem statement and the decision statement for the waste-tank residuals characterization to enable tank closure decisions:
Radionuclide concentrations Chemical constituent concentrations Density of the samples Residuals volume data
Residuals volume data, along with sample densities and concentrations are used to determine the constituent inventory in the waste tank.
A7.3.4 Define the Study Boundaries
The spatial boundary defined in the LWTRSAPP is the waste tank system within the footprint of the waste tank. This would include the annular space for applicable waste tanks. Samples of the tank residuals will be collected after SCDHEC, EPA, and DOE reach mutual agreement that DOE can proceed to the sampling and analysis phase. Other than additional drying resulting from waste tank ventilation system operation and radioactive decay, minimal changes in concentration are expected to occur in the residuals material after the temporary cessation of waste removal and before sample analysis.
Liquid Waste Tank Residuals Sampling- SRR-CWDA-2011-00117 Quality Assurance Program Plan Revision 1 July 2013
Page 43 of 99
A7.3.5 Develop an Analytical Approach and a Decision Rule
For the LWTRSAPP PSQ, if the necessary concentration data are not obtained, the operational closure decisions may be impacted and alternative actions to finalize the residuals inventory may be necessary. If necessary, any required action will be decided on a case-by-case basis in consultation with the appropriate regulatory authorities.
A7.3.6 Specify Limits on Decision Error
The probability of determining an incorrect waste tank-specific inventory is related to inaccuracies in the volume determination, the sampling representativeness, and the residuals material analyses.
The residual mapping and volume estimation process is intended to not only determine the residuals volume and uncertainty in the volume estimate; it also looks for areas of possible heterogeneity. The sampling plan design requires a sufficient number of samples of adequate size from the segments present in the residuals material for the sample compositing. Incomplete sampling and/or insufficient material recovery could impact the data usability for the waste tank inventory determination. Those impacts would need evaluation before the tank-specific sampling finishes so that steps can be taken to ensure that the sampling representativeness and completeness goals are met.
Uncertainty in the final residuals volume determination is incorporated into the sample compositing as described in Appendix A of the LWTRSAPP. However, the usability of a large uncertainty in the volume determination would need to be evaluated for its impact on the inventory determination.
The samples are complex mixtures of particulate material, and their analysis is influenced by the Fundamental Error (FE) of sampling that originates from the particulate material size, shape, chemical properties, and other physical factors. FE can be controlled by meeting the required material conditions as described in Appendix A of the LWTRSAPP.
Historical data from the Waste Characterization System (WCS) that tracks individual waste tank receipts and removals, gives a general accounting of the radionuclide and chemical inventory for a waste tank at the time the system is updated. This data is used to develop the waste tank-specific analyte lists, and is not used for inventory determinations. Conservative assumptions in the WCS would not impact the waste tank-specific inventory since that is determined using the actual residuals analytical data.
The inventory determination could be affected by analytical uncertainties related to interferences and the overwhelming of minor constituents by large amounts of other constituents all of which would influence the method detection limits. Precision and accuracy criteria for the acceptance of the data are presented in Table A7-1. Recoveries for some of the minor radionuclides may introduce a large uncertainty in the concentration measured that will need evaluation in the DQA. The DQA will also review the DQIs and evaluate any nonconformity for impacts on the data.
The decision error (i.e., errors in the inventory) resulting from the uncertainties described above is difficult to quantify. Since the inventory determination is an estimation problem, and the data generated is limited by what material can be collected and by analytical success,
Liquid Waste Tank Residuals Sampling- SRR-CWDA-2011-00117 Quality Assurance Program Plan Revision 1 July 2013
Page 44 of 99
data uncertainties do not necessary result in data rejection. When data uncertainties are recognized, or cannot be quantified, the impact is evaluated and typically biased towards conservatism.
A7.3.7 Optimize the Design for Obtaining Data
The basis for the sampling approach for residuals characterization is presented in Appendix A of the LWTRSAPP. The residual material areas remaining after waste removal activities have ceased are delineated into segments based on similarity, appearance, or possible heterogeneity. The material within each segment is then randomly sampled. This stratified random sampling with volume-proportional compositing is used to characterize the residual material. The material distribution and volume is used to design the sampling arrays, and to calculate a volume-proportional mass needed from each of the sample locations per array for compositing. The number of arrays and sample locations per array planned depends on the tank-specific material distribution and volume per segment. This approach was statistically evaluated and determined that the built-in variations in the volumetric proportions produced valid statistical sampling results for the residual material concentrations. [SRNL-STI-2011-00323]
The waste tank-specific sampling design and sampling locations will be developed based on the preliminary residuals material volume and distribution. The sampling design will be documented in the SLDR and TSAP.
A8 Training and Certification
Site 4B Manual, Training and Qualification Program Manual, implements a training and qualification program meeting DOE requirements that is tailored to SRS operations. SRNL and SRR personnel receive training applicable to their technical area and job requirements in accordance with 4B Manual. Training history records are documented and maintained in an SRS database, the Training Records and Information Network (TRAIN). The date for re-training is tracked by TRAIN, and an employee is not permitted to perform a task if their training has expired.
SRNL personnel are qualified to perform tasks through a combination of training (on-site and off-site), education, and experience. On-site training consists of a combination of classroom and computer-based training as well as on-the-job training. SRNL utilizes subject matter experts (SMEs) and technical analysts who are qualified for each of the activities for which they are responsible. All training is maintained up-to-date as specified in each worker’s Automated Qualification Matrix and is documented in TRAIN.
The SET members are experienced in the operation of the appropriate sampling equipment and other requirements for sampling FTF/HTF waste tank systems. They are familiar with the applicable sampling procedures and work instructions as well as appropriate SRR and SRS procedures and policies.
A training program has been implemented for the waste tank residual material mappers to standardize the mapping process, minimize uncertainty in the residuals volume determination, and ensure consistency for the lifetime of the project.
Liquid Waste Tank Residuals Sampling- SRR-CWDA-2011-00117 Quality Assurance Program Plan Revision 1 July 2013
Page 45 of 99
A9 Documentation and Records
The documentation for the waste-tank characterization program is generated, reviewed, and approved by the organizations as discussed in Section 2 of the LWTRSAPP.
Records are processed in accordance with existing SRS and SRR site-wide requirements as described in 1B Manual, Procedure 3.31, Records Management. SRNL QA records will be processed in accordance with 1Q Manual, Procedure 17-1, Quality Assurance Records Management. SRR QA records will be processed in accordance with 1Q Manual, Procedure 17-1Q, Quality Assurance Records Management. Preparation and processing of any controlled documents required will be in accordance with 1B Manual, Procedure 3.32, Document Control.
In addition to the SRS document control requirements described above, the C&WDA, SRR Engineering, and SRNL PLs are responsible for preparing and submitting Records Completeness Checklists for the records described in Section D. The Records Completeness Checklists provide an inventory of the applicable waste tank sampling records generated by the organization.
A9.1 QAPP Distribution
The C&WDA CPC is responsible for preparation and distribution of the LWTRS-QAPP and for conducting the annual LWTRS-QAPP review by soliciting comments and preparing any revisions. If changes are extensive, the LWTRS-QAPP will be revised. If only minor changes are necessary, the revisions may be distributed using change pages. A revisions list and/or pages with track change bars will be used to indicate changed material. The LWTRS-QAPP revisions will be provided to the DOE-SR and off-site recipients shown on the Section A3 distribution list. Because the LWTRSAPP and LWTRS-QAPP are maintained as controlled documents, in accordance with 1B Manual, Procedure 3.32, Document Control, SRS personnel access the documents through the Document Control Register system.
A9.2 Data Report Package
Laboratory Information Management System (LIMS) reports generated from SRNL Analytical Development (AD) contain the analytical method, final analytical results and reported uncertainty. Information on results or the analytical method is provided to the Environmental and Chemical Process Technology (E&CPT) SME.
Once the data are received by the E&CPT SME, the SME compiles and reviews the data and prepares a Sample Analysis Report for submission to SRR. The elements and organization of a technical report are provided in E7 Manual, Conduct of Engineering, Procedure 3.60, Technical Reports.
Drafts of these reports are reviewed by independent E&CPT SMEs using the technical report design-check process in place at SRNL for all baseline facility studies. [E7 Manual, Procedure 2.60, WSRC-IM-2002-00011] The sample analysis reports are reviewed using the key elements of a design check:
Review of analytical/experimental approach Mathematical check Review for correct use of analytical/experimental input Review of the justification for assumptions
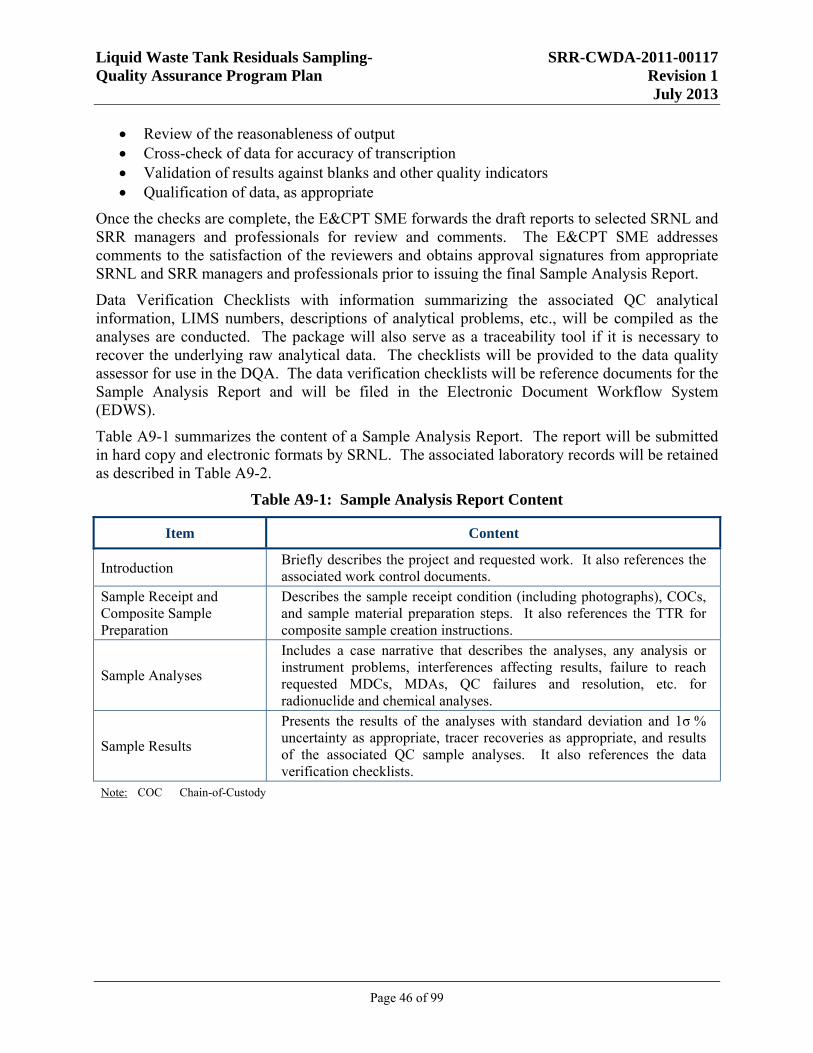
Liquid Waste Tank Residuals Sampling- SRR-CWDA-2011-00117 Quality Assurance Program Plan Revision 1 July 2013
Page 46 of 99
Review of the reasonableness of output Cross-check of data for accuracy of transcription Validation of results against blanks and other quality indicators Qualification of data, as appropriate
Once the checks are complete, the E&CPT SME forwards the draft reports to selected SRNL and SRR managers and professionals for review and comments. The E&CPT SME addresses comments to the satisfaction of the reviewers and obtains approval signatures from appropriate SRNL and SRR managers and professionals prior to issuing the final Sample Analysis Report.
Data Verification Checklists with information summarizing the associated QC analytical information, LIMS numbers, descriptions of analytical problems, etc., will be compiled as the analyses are conducted. The package will also serve as a traceability tool if it is necessary to recover the underlying raw analytical data. The checklists will be provided to the data quality assessor for use in the DQA. The data verification checklists will be reference documents for the Sample Analysis Report and will be filed in the Electronic Document Workflow System (EDWS).
Table A9-1 summarizes the content of a Sample Analysis Report. The report will be submitted in hard copy and electronic formats by SRNL. The associated laboratory records will be retained as described in Table A9-2.
Table A9-1: Sample Analysis Report Content
Item Content
Introduction Briefly describes the project and requested work. It also references the associated work control documents.
Sample Receipt and Composite Sample Preparation
Describes the sample receipt condition (including photographs), COCs, and sample material preparation steps. It also references the TTR for composite sample creation instructions.
Sample Analyses
Includes a case narrative that describes the analyses, any analysis or instrument problems, interferences affecting results, failure to reach requested MDCs, MDAs, QC failures and resolution, etc. for radionuclide and chemical analyses.
Sample Results
Presents the results of the analyses with standard deviation and 1σ % uncertainty as appropriate, tracer recoveries as appropriate, and results of the associated QC sample analyses. It also references the data verification checklists.
Note: COC Chain-of-Custody
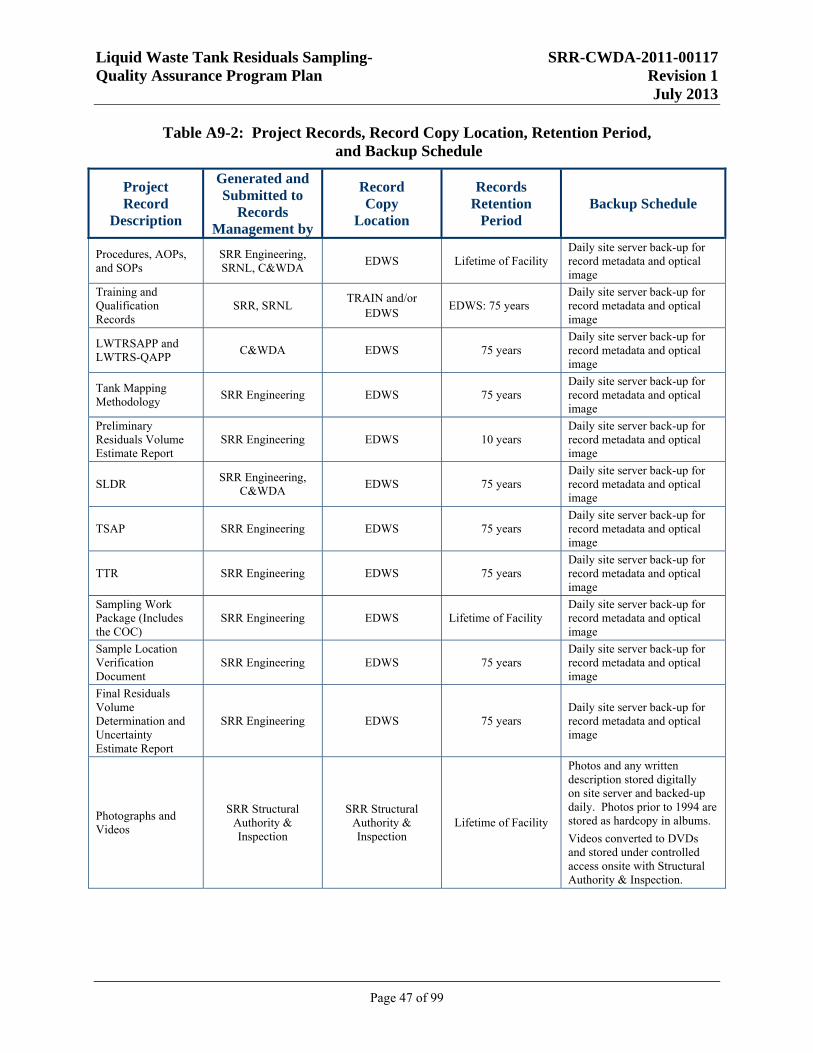
Liquid Waste Tank Residuals Sampling- SRR-CWDA-2011-00117 Quality Assurance Program Plan Revision 1 July 2013
Page 47 of 99
Table A9-2: Project Records, Record Copy Location, Retention Period, and Backup Schedule
Project Record
Description
Generated and Submitted to
Records Management by
Record Copy
Location
Records Retention
Period Backup Schedule
Procedures, AOPs, and SOPs
SRR Engineering, SRNL, C&WDA
EDWS Lifetime of Facility Daily site server back-up for record metadata and optical image
Training and Qualification Records
SRR, SRNL TRAIN and/or
EDWS EDWS: 75 years
Daily site server back-up for record metadata and optical image
LWTRSAPP and LWTRS-QAPP
C&WDA EDWS 75 years Daily site server back-up for record metadata and optical image
Tank Mapping Methodology
SRR Engineering EDWS 75 years Daily site server back-up for record metadata and optical image
Preliminary Residuals Volume Estimate Report
SRR Engineering EDWS 10 years Daily site server back-up for record metadata and optical image
SLDR SRR Engineering,
C&WDA EDWS 75 years
Daily site server back-up for record metadata and optical image
TSAP SRR Engineering EDWS 75 years Daily site server back-up for record metadata and optical image
TTR SRR Engineering EDWS 75 years Daily site server back-up for record metadata and optical image
Sampling Work Package (Includes the COC)
SRR Engineering EDWS Lifetime of Facility Daily site server back-up for record metadata and optical image
Sample Location Verification Document
SRR Engineering EDWS 75 years Daily site server back-up for record metadata and optical image
Final Residuals Volume Determination and Uncertainty Estimate Report
SRR Engineering EDWS 75 years Daily site server back-up for record metadata and optical image
Photographs and Videos
SRR Structural Authority & Inspection
SRR Structural Authority & Inspection
Lifetime of Facility
Photos and any written description stored digitally on site server and backed-up daily. Photos prior to 1994 are stored as hardcopy in albums.
Videos converted to DVDs and stored under controlled access onsite with Structural Authority & Inspection.
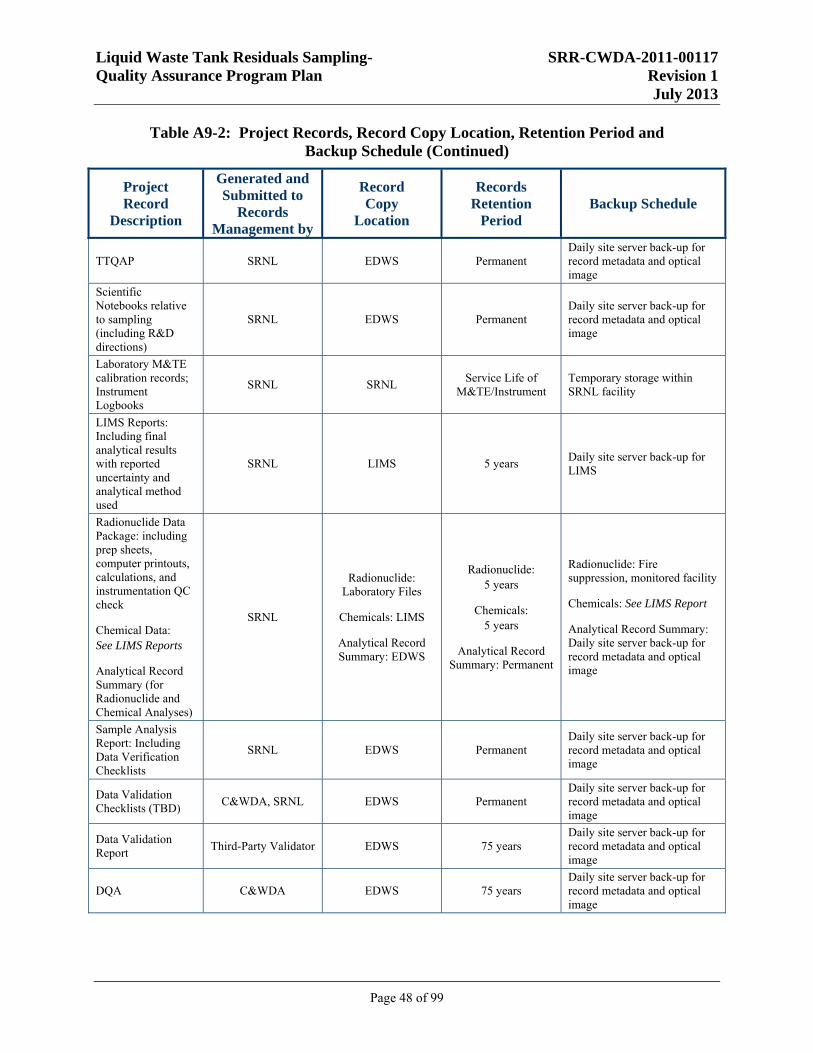
Liquid Waste Tank Residuals Sampling- SRR-CWDA-2011-00117 Quality Assurance Program Plan Revision 1 July 2013
Page 48 of 99
Table A9-2: Project Records, Record Copy Location, Retention Period and Backup Schedule (Continued)
Project Record
Description
Generated and Submitted to
Records Management by
Record Copy
Location
Records Retention
Period Backup Schedule
TTQAP SRNL EDWS Permanent Daily site server back-up for record metadata and optical image
Scientific Notebooks relative to sampling (including R&D directions)
SRNL EDWS Permanent Daily site server back-up for record metadata and optical image
Laboratory M&TE calibration records; Instrument Logbooks
SRNL SRNL Service Life of
M&TE/Instrument Temporary storage within SRNL facility
LIMS Reports: Including final analytical results with reported uncertainty and analytical method used
SRNL LIMS 5 years Daily site server back-up for LIMS
Radionuclide Data Package: including prep sheets, computer printouts, calculations, and instrumentation QC check
Chemical Data: See LIMS Reports
Analytical Record Summary (for Radionuclide and Chemical Analyses)
SRNL
Radionuclide: Laboratory Files
Chemicals: LIMS
Analytical Record Summary: EDWS
Radionuclide: 5 years
Chemicals: 5 years
Analytical Record Summary: Permanent
Radionuclide: Fire suppression, monitored facility
Chemicals: See LIMS Report
Analytical Record Summary: Daily site server back-up for record metadata and optical image
Sample Analysis Report: Including Data Verification Checklists
SRNL EDWS Permanent Daily site server back-up for record metadata and optical image
Data Validation Checklists (TBD)
C&WDA, SRNL EDWS Permanent Daily site server back-up for record metadata and optical image
Data Validation Report
Third-Party Validator EDWS 75 years Daily site server back-up for record metadata and optical image
DQA C&WDA EDWS 75 years Daily site server back-up for record metadata and optical image
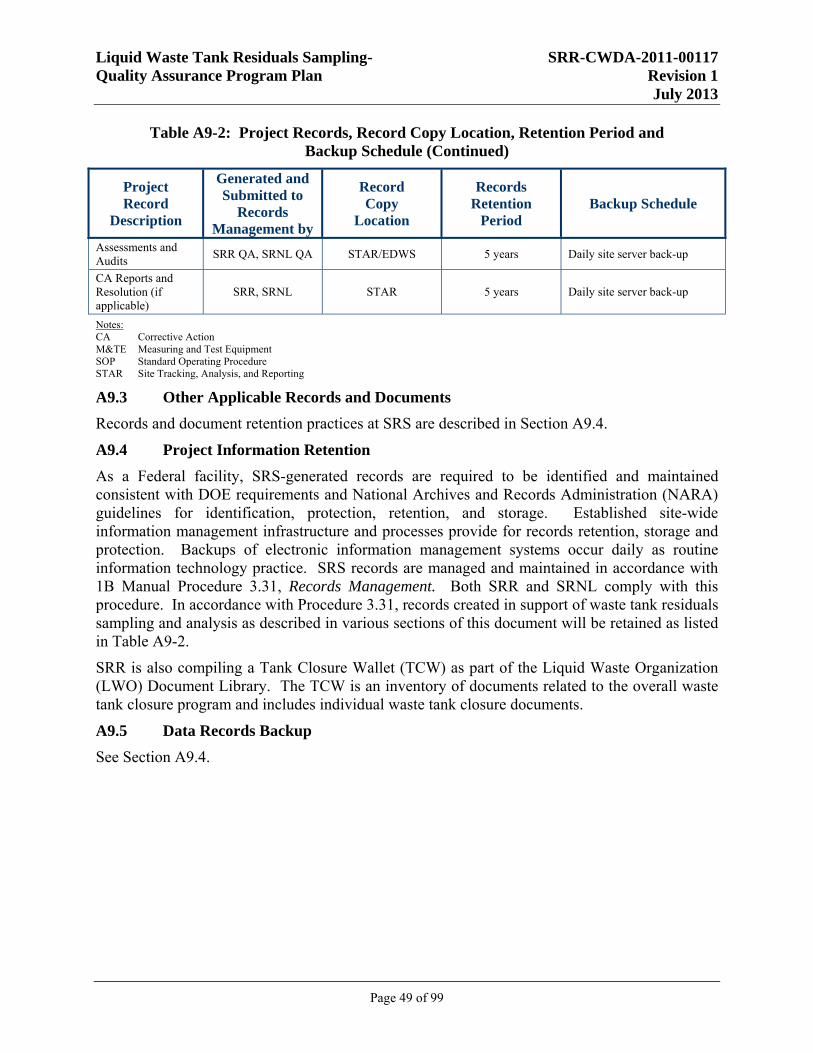
Liquid Waste Tank Residuals Sampling- SRR-CWDA-2011-00117 Quality Assurance Program Plan Revision 1 July 2013
Page 49 of 99
Table A9-2: Project Records, Record Copy Location, Retention Period and Backup Schedule (Continued)
Project Record
Description
Generated and Submitted to
Records Management by
Record Copy
Location
Records Retention
Period Backup Schedule
Assessments and Audits
SRR QA, SRNL QA STAR/EDWS 5 years Daily site server back-up
CA Reports and Resolution (if applicable)
SRR, SRNL STAR 5 years Daily site server back-up
Notes: CA Corrective Action M&TE Measuring and Test Equipment SOP Standard Operating Procedure STAR Site Tracking, Analysis, and Reporting
A9.3 Other Applicable Records and Documents
Records and document retention practices at SRS are described in Section A9.4.
A9.4 Project Information Retention
As a Federal facility, SRS-generated records are required to be identified and maintained consistent with DOE requirements and National Archives and Records Administration (NARA) guidelines for identification, protection, retention, and storage. Established site-wide information management infrastructure and processes provide for records retention, storage and protection. Backups of electronic information management systems occur daily as routine information technology practice. SRS records are managed and maintained in accordance with 1B Manual Procedure 3.31, Records Management. Both SRR and SRNL comply with this procedure. In accordance with Procedure 3.31, records created in support of waste tank residuals sampling and analysis as described in various sections of this document will be retained as listed in Table A9-2.
SRR is also compiling a Tank Closure Wallet (TCW) as part of the Liquid Waste Organization (LWO) Document Library. The TCW is an inventory of documents related to the overall waste tank closure program and includes individual waste tank closure documents.
A9.5 Data Records Backup
See Section A9.4.
Liquid Waste Tank Residuals Sampling- SRR-CWDA-2011-00117 Quality Assurance Program Plan Revision 1 July 2013
Page 50 of 99
SECTION B MEASUREMENT/DATA ACQUISITION
Samples of waste tank residuals are collected and analyzed for a specific list of analytes to generate the data necessary to satisfy South Carolina and DOE requirements for removing FTF/HTF waste tanks from service. None of the data collected or generated is for informational purposes. All of the data is necessary to determine the final waste tank residuals inventory, although, within limits, allowances for missing samples or insufficient material recovery can be made. Because of the difficulty, high cost, and As Low as Reasonably Achievable (ALARA) issues, resampling for additional material collection would be unlikely.
Because the final residuals material composition, volume, distribution, and accessibility in a waste tank can be highly variable, the sampling plan design, sampling methods used, and analytical success can also be highly variable. Adjustments to the original sampling plan caused by inability to reach sampling locations or recognition of new material accumulations will be described in the final TSAP. Final sample locations will be authenticated in a sample location verification document. Any analytical problems will be documented in the Sample Analysis Report case narrative. The DQA will address any impacts on the data resulting from sampling and analysis plan deviations.
B1 Sampling Process/Experimental Design
Sample collection and analysis will be designed to satisfy the DQOs by implementing the stratified random sampling with volume-proportional compositing approach. The sampling and analysis planning process and decisions are described in LWTRSAPP Section 4.1 and shown on Figure B1-1. The basis for the sampling approach is presented in LWTRSAPP Appendix A.
The sample planning process evaluates waste tank-specific material distribution variables, such as low-volume conditions, material area accessibility, or presence of annular materials to determine the sample numbers and locations necessary to characterize the residuals material present. The characterization information is then used to determine the tank-specific inventory that supports the removal from service decisions.
The waste tank characterization DQOs are to determine the radionuclide and chemical concentrations in the waste tank residuals. To accomplish the objective, samples are collected where the material is present and not on a systematic grid pattern. In order to represent any possible material heterogeneity, multiple locations are sampled to create composite samples for analysis. The material sampled (location) is represented in the composite sample using a volume-proportioning scheme.
Table B1-1 provides a general description of the type(s) and number of samples expected for residuals material characterization. The general sampling approach uses three arrays, each with five sample locations, to produce three composite samples for laboratory analysis. If sufficient material thickness is present in an area, depth sampling may be appropriate to characterize the residuals. Additional details on the sample location determination and compositing are contained in the LWTRSAPP Appendix A and Section 4.1.
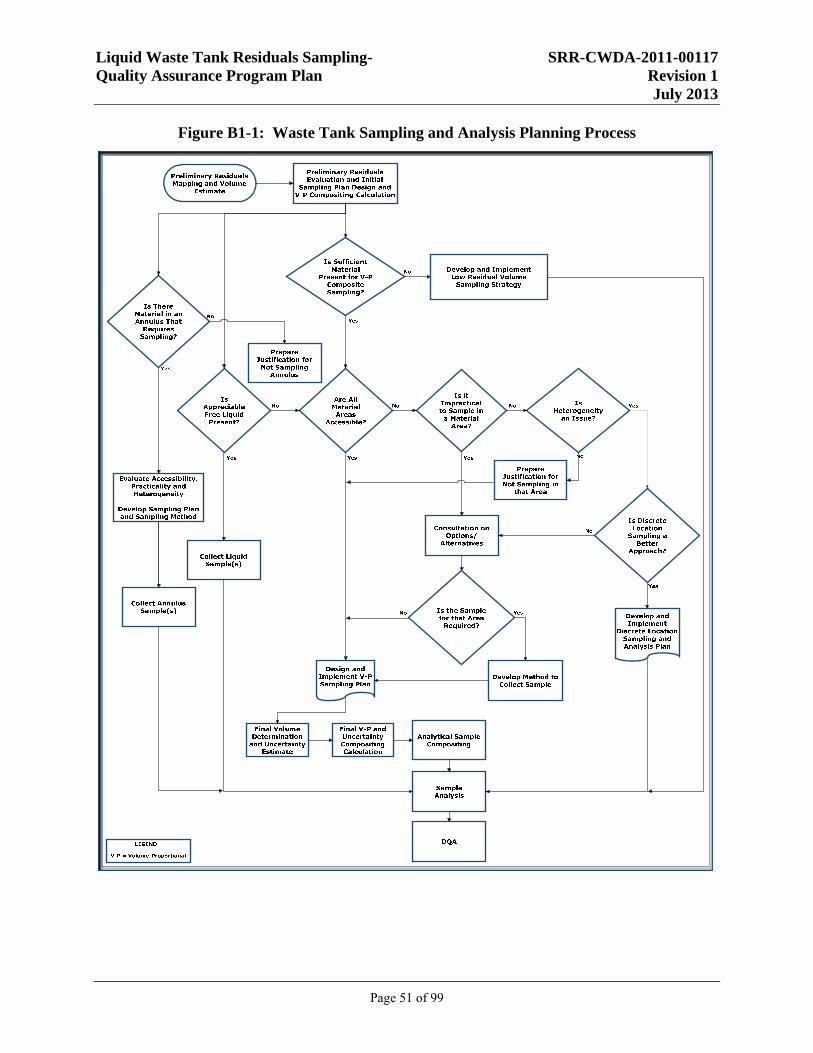
Liquid Waste Tank Residuals Sampling- SRR-CWDA-2011-00117 Quality Assurance Program Plan Revision 1 July 2013
Page 51 of 99
Figure B1-1: Waste Tank Sampling and Analysis Planning Process
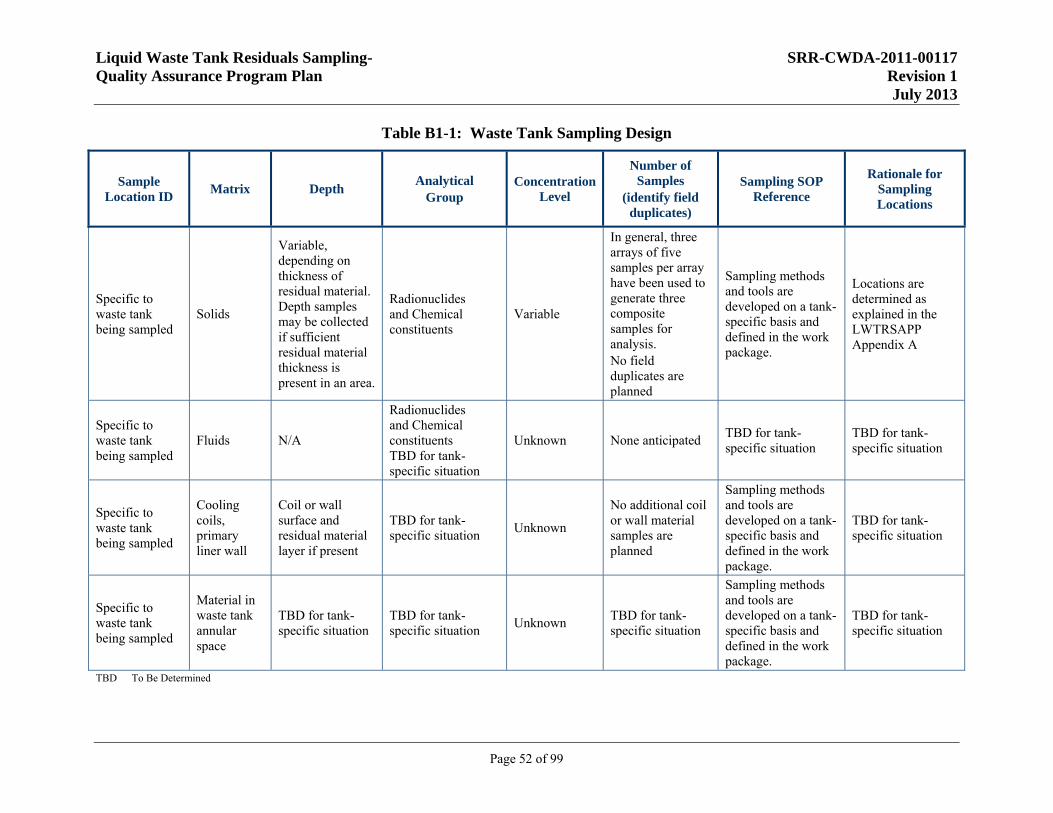
Liquid Waste Tank Residuals Sampling- SRR-CWDA-2011-00117 Quality Assurance Program Plan Revision 1 July 2013
Page 52 of 99
Table B1-1: Waste Tank Sampling Design
Sample Location ID
Matrix Depth Analytical
Group Concentration
Level
Number of Samples
(identify field duplicates)
Sampling SOP Reference
Rationale for Sampling Locations
Specific to waste tank being sampled
Solids
Variable, depending on thickness of residual material. Depth samples may be collected if sufficient residual material thickness is present in an area.
Radionuclides and Chemical constituents
Variable
In general, three arrays of five samples per array have been used to generate three composite samples for analysis. No field duplicates are planned
Sampling methods and tools are developed on a tank-specific basis and defined in the work package.
Locations are determined as explained in the LWTRSAPP Appendix A
Specific to waste tank being sampled
Fluids N/A
Radionuclides and Chemical constituents TBD for tank-specific situation
Unknown None anticipated TBD for tank-specific situation
TBD for tank-specific situation
Specific to waste tank being sampled
Cooling coils, primary liner wall
Coil or wall surface and residual material layer if present
TBD for tank-specific situation
Unknown
No additional coil or wall material samples are planned
Sampling methods and tools are developed on a tank-specific basis and defined in the work package.
TBD for tank-specific situation
Specific to waste tank being sampled
Material in waste tank annular space
TBD for tank-specific situation
TBD for tank-specific situation
Unknown TBD for tank-specific situation
Sampling methods and tools are developed on a tank-specific basis and defined in the work package.
TBD for tank-specific situation
TBD To Be Determined
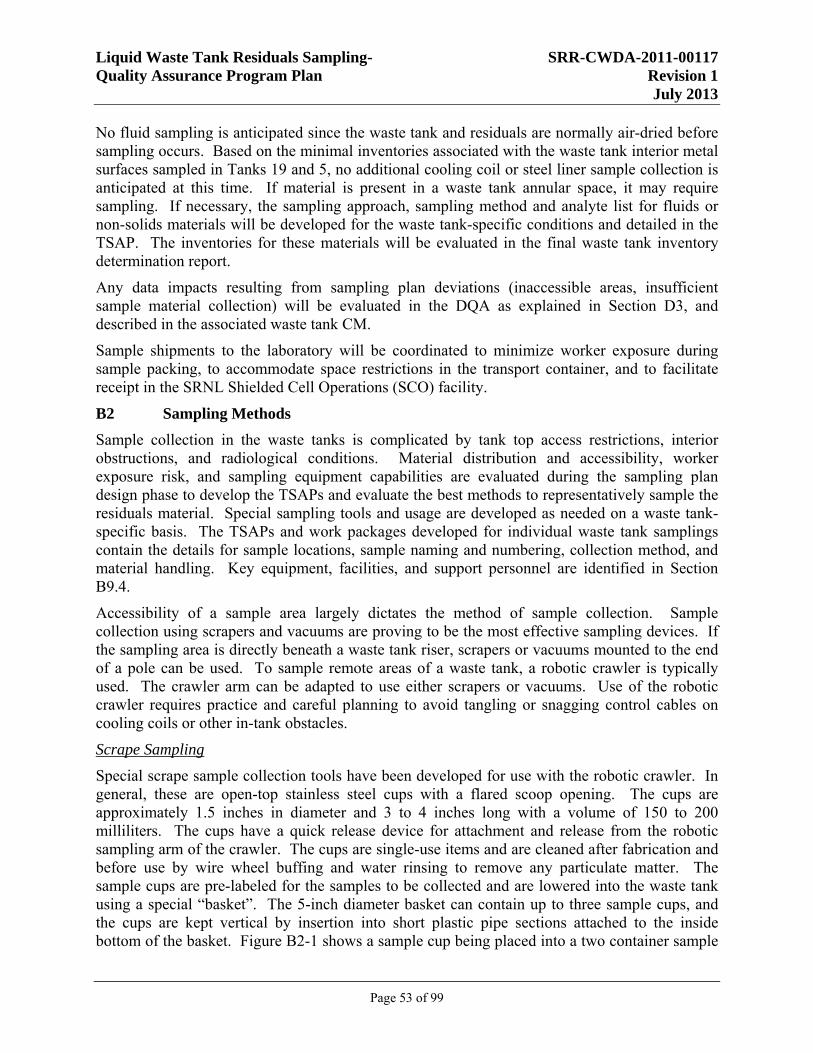
Liquid Waste Tank Residuals Sampling- SRR-CWDA-2011-00117 Quality Assurance Program Plan Revision 1 July 2013
Page 53 of 99
No fluid sampling is anticipated since the waste tank and residuals are normally air-dried before sampling occurs. Based on the minimal inventories associated with the waste tank interior metal surfaces sampled in Tanks 19 and 5, no additional cooling coil or steel liner sample collection is anticipated at this time. If material is present in a waste tank annular space, it may require sampling. If necessary, the sampling approach, sampling method and analyte list for fluids or non-solids materials will be developed for the waste tank-specific conditions and detailed in the TSAP. The inventories for these materials will be evaluated in the final waste tank inventory determination report.
Any data impacts resulting from sampling plan deviations (inaccessible areas, insufficient sample material collection) will be evaluated in the DQA as explained in Section D3, and described in the associated waste tank CM.
Sample shipments to the laboratory will be coordinated to minimize worker exposure during sample packing, to accommodate space restrictions in the transport container, and to facilitate receipt in the SRNL Shielded Cell Operations (SCO) facility.
B2 Sampling Methods
Sample collection in the waste tanks is complicated by tank top access restrictions, interior obstructions, and radiological conditions. Material distribution and accessibility, worker exposure risk, and sampling equipment capabilities are evaluated during the sampling plan design phase to develop the TSAPs and evaluate the best methods to representatively sample the residuals material. Special sampling tools and usage are developed as needed on a waste tank-specific basis. The TSAPs and work packages developed for individual waste tank samplings contain the details for sample locations, sample naming and numbering, collection method, and material handling. Key equipment, facilities, and support personnel are identified in Section B9.4.
Accessibility of a sample area largely dictates the method of sample collection. Sample collection using scrapers and vacuums are proving to be the most effective sampling devices. If the sampling area is directly beneath a waste tank riser, scrapers or vacuums mounted to the end of a pole can be used. To sample remote areas of a waste tank, a robotic crawler is typically used. The crawler arm can be adapted to use either scrapers or vacuums. Use of the robotic crawler requires practice and careful planning to avoid tangling or snagging control cables on cooling coils or other in-tank obstacles.
Scrape Sampling
Special scrape sample collection tools have been developed for use with the robotic crawler. In general, these are open-top stainless steel cups with a flared scoop opening. The cups are approximately 1.5 inches in diameter and 3 to 4 inches long with a volume of 150 to 200 milliliters. The cups have a quick release device for attachment and release from the robotic sampling arm of the crawler. The cups are single-use items and are cleaned after fabrication and before use by wire wheel buffing and water rinsing to remove any particulate matter. The sample cups are pre-labeled for the samples to be collected and are lowered into the waste tank using a special “basket”. The 5-inch diameter basket can contain up to three sample cups, and the cups are kept vertical by insertion into short plastic pipe sections attached to the inside bottom of the basket. Figure B2-1 shows a sample cup being placed into a two container sample
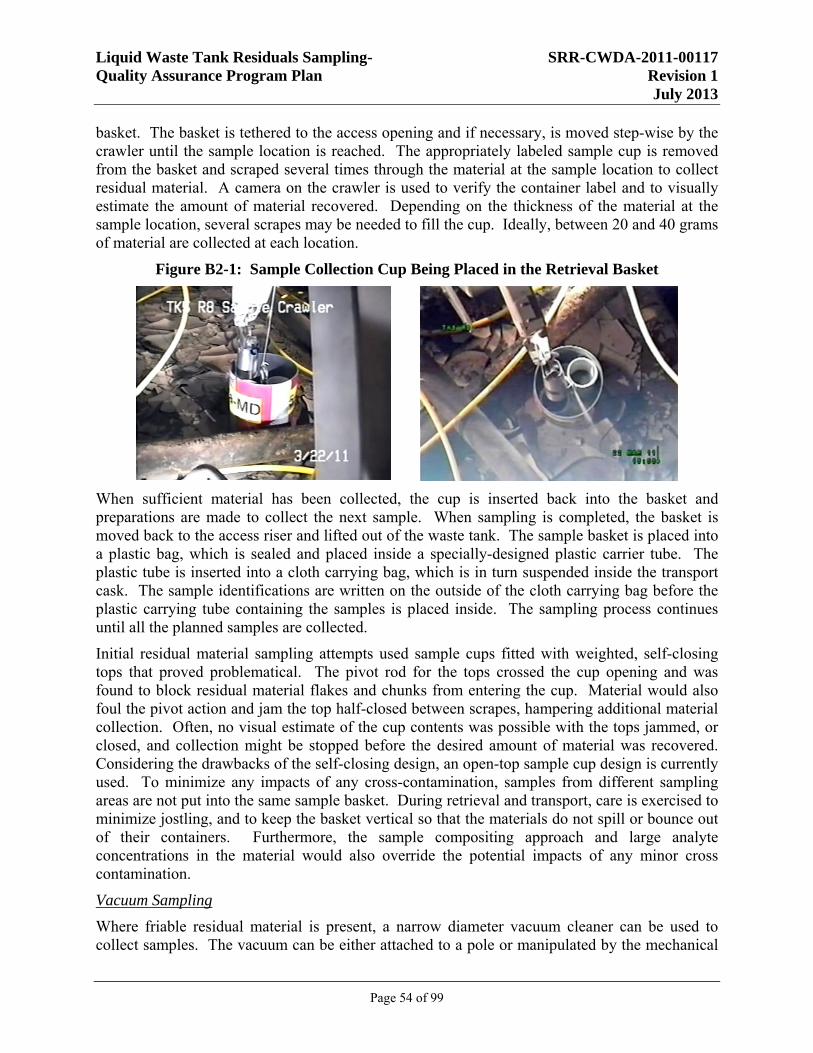
Liquid Waste Tank Residuals Sampling- SRR-CWDA-2011-00117 Quality Assurance Program Plan Revision 1 July 2013
Page 54 of 99
basket. The basket is tethered to the access opening and if necessary, is moved step-wise by the crawler until the sample location is reached. The appropriately labeled sample cup is removed from the basket and scraped several times through the material at the sample location to collect residual material. A camera on the crawler is used to verify the container label and to visually estimate the amount of material recovered. Depending on the thickness of the material at the sample location, several scrapes may be needed to fill the cup. Ideally, between 20 and 40 grams of material are collected at each location.
Figure B2-1: Sample Collection Cup Being Placed in the Retrieval Basket
When sufficient material has been collected, the cup is inserted back into the basket and preparations are made to collect the next sample. When sampling is completed, the basket is moved back to the access riser and lifted out of the waste tank. The sample basket is placed into a plastic bag, which is sealed and placed inside a specially-designed plastic carrier tube. The plastic tube is inserted into a cloth carrying bag, which is in turn suspended inside the transport cask. The sample identifications are written on the outside of the cloth carrying bag before the plastic carrying tube containing the samples is placed inside. The sampling process continues until all the planned samples are collected.
Initial residual material sampling attempts used sample cups fitted with weighted, self-closing tops that proved problematical. The pivot rod for the tops crossed the cup opening and was found to block residual material flakes and chunks from entering the cup. Material would also foul the pivot action and jam the top half-closed between scrapes, hampering additional material collection. Often, no visual estimate of the cup contents was possible with the tops jammed, or closed, and collection might be stopped before the desired amount of material was recovered. Considering the drawbacks of the self-closing design, an open-top sample cup design is currently used. To minimize any impacts of any cross-contamination, samples from different sampling areas are not put into the same sample basket. During retrieval and transport, care is exercised to minimize jostling, and to keep the basket vertical so that the materials do not spill or bounce out of their containers. Furthermore, the sample compositing approach and large analyte concentrations in the material would also override the potential impacts of any minor cross contamination.
Vacuum Sampling
Where friable residual material is present, a narrow diameter vacuum cleaner can be used to collect samples. The vacuum can be either attached to a pole or manipulated by the mechanical
Liquid Waste Tank Residuals Sampling- SRR-CWDA-2011-00117 Quality Assurance Program Plan Revision 1 July 2013
Page 55 of 99
arm of the robotic crawler. The vacuums are pre-labeled before use and have a capacity of about 250 grams of material. Figure B2-2 shows a vacuum being lowered into a waste tank and being used by the crawler to collect residual material. The vacuum suction is sufficient to retrieve a wide range of residual material sizes.
Figure B2-2: Sample Collection Using a Vacuum
Any problems encountered during the sampling are communicated to the SRR Engineering PL, and the impacts and resolution are discussed with the responsible parties from SRR Engineering, C&WDA, and TFO. The decisions reached are documented as necessary in sample collection records, memorandums, or revisions to the TSAP, TTR, and TTQAP.
To the degree possible, the sampling process is observed and recorded using the on-board crawler camera or other camera systems deployed during waste tank sampling. Video footage may be supplemented by still photographs. Loss of the on-board crawler camera does not necessarily end sampling operations with that crawler. If the in-tank camera can provide sufficient visual coverage, sampling will continue.
Because of the high sample radioactivity, special handling and transport procedures are required as described in LWTRSAPP Section 4.1.8. Sample preservation limitations are discussed below in Section B3.
At the laboratory, the samples are thoroughly dried, ground, sieved, and homogenized. The sample density is measured in the “as received” material, again after drying, and in final composite sample. As described in the LWTRSAPP Section 5.1, after the final residual volume is determined, composite sample creation instructions are provided to the laboratory. This includes any special compositing instructions to account for sampling problems, such as low sample recovery or inability to collect sample(s). If necessary, the explanation and justification for the special compositing instructions may be documented in a separate report. The impact on the final residual characterization results will be evaluated in the DQA.
As the project progresses, “lessons learned” will be used to develop and modify the sampling tools and procedures for more effective sampling. The LWTRSAPP and LWTRS-QAPP will be updated to reflect any changes implemented.
Vacuum being lowered for use by crawler
Crawler collecting material with the vacuum
Liquid Waste Tank Residuals Sampling- SRR-CWDA-2011-00117 Quality Assurance Program Plan Revision 1 July 2013
Page 56 of 99
B3 Sampling Handling and Custody
Sample collection will be performed and documented using procedures described in the SET work package. The SET team leader (Person-In-Charge [PIC]) is responsible for recording the required information and filing the completed records with the SRR Engineering PM. When sampling ends, SRR Engineering issues a sample location verification document to authenticate the actual sample locations and samples collected.
Samples will be uniquely identified as specified in the TSAP. For example, assuming the sampling approach using three arrays with five samples per array can be applied to a waste tank having three residual material areas to be sampled; the samples would be identified using the following four character scheme:
1. The waste tank where the sample was collected (e.g., 5 for Tank 5).
2. The residuals material area of the waste tank where the sample is collected. This is based on the preliminary mapping and sample plan design (e.g., A, B, C).
3. The sample array number (e.g., 1, 2, or 3), which uniquely identifies the samples supporting the same composite sample.
4. If more than one sample per array will be collected in an area, another identifier (e.g., a, b, or c) would be added to correspond to the 1st, 2nd, or 3rd sample collected for the respective array in that waste tank area.
For example, the sample identification for a sample collected for Tank 5, which represents the 3rd sample collected for the 2nd composite sample set in Area B would be designated as 5-B2c.
The sample identification will be permanently marked on the outside of the sample collection container or device. That sample identification will also be marked on the exterior of the overpack bag for the plastic carrier tube into which the sample is placed after removal from the waste tank. Sample collection locations will be authenticated in the sample location verification document prepared by SRR Engineering.
Shipping containers are surveyed by Radiological Controls (RadCon) personnel before use to verify they are within contamination limits. The exterior of the overpack bag holding the plastic carrier tube is also surveyed before placement inside the shipping container. Sample transport is described in LWTRSAPP Section 4.1.8.
Sample custody is tracked using a chain-of-custody (COC) specially developed for the residuals sampling program and incorporated into the existing CST Sample Manual. [SW11.1-SAMPLE] The COC form is provided as Attachment 1. As required by the CST Sample Manual procedures, additional transportation shipping documents also record the material transfer from the tank farm to the SCO. Sample identifications are verified when the containers are placed in the hot cell and can be examined. Sample receipt in the SCO is documented on a sample receipt form in accordance with L7.7 Manual, Procedure 1.15, SRNL Receipt of Radioactive Material. The laboratory uses internal tracking and LIMS procedures to track material and aliquots used for analysis.
Once activated in LIMS, each sample aliquot is assigned a unique identification number that is correlated to a sample identification number provided by the E&CPT SME. The E&CPT
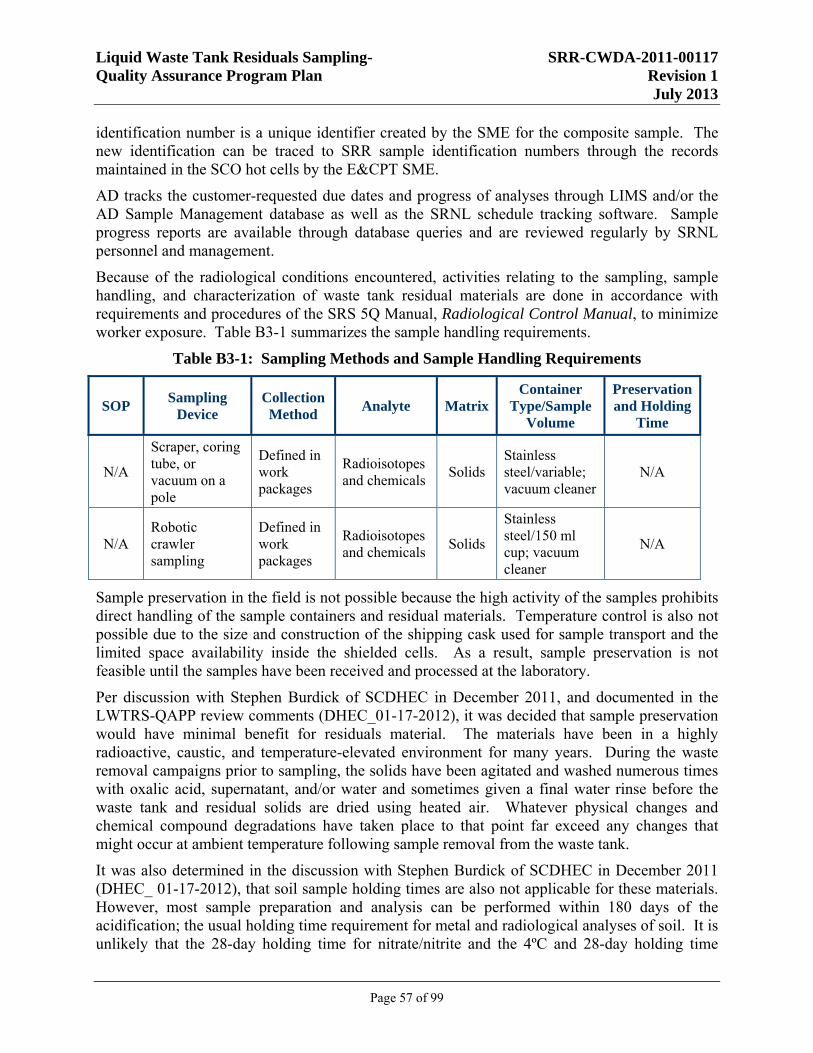
Liquid Waste Tank Residuals Sampling- SRR-CWDA-2011-00117 Quality Assurance Program Plan Revision 1 July 2013
Page 57 of 99
identification number is a unique identifier created by the SME for the composite sample. The new identification can be traced to SRR sample identification numbers through the records maintained in the SCO hot cells by the E&CPT SME.
AD tracks the customer-requested due dates and progress of analyses through LIMS and/or the AD Sample Management database as well as the SRNL schedule tracking software. Sample progress reports are available through database queries and are reviewed regularly by SRNL personnel and management.
Because of the radiological conditions encountered, activities relating to the sampling, sample handling, and characterization of waste tank residual materials are done in accordance with requirements and procedures of the SRS 5Q Manual, Radiological Control Manual, to minimize worker exposure. Table B3-1 summarizes the sample handling requirements.
Table B3-1: Sampling Methods and Sample Handling Requirements
SOP Sampling
Device Collection Method
Analyte MatrixContainer
Type/Sample Volume
Preservation and Holding
Time
N/A
Scraper, coring tube, or vacuum on a pole
Defined in work packages
Radioisotopes and chemicals
Solids Stainless steel/variable; vacuum cleaner
N/A
N/A Robotic crawler sampling
Defined in work packages
Radioisotopes and chemicals
Solids
Stainless steel/150 ml cup; vacuum cleaner
N/A
Sample preservation in the field is not possible because the high activity of the samples prohibits direct handling of the sample containers and residual materials. Temperature control is also not possible due to the size and construction of the shipping cask used for sample transport and the limited space availability inside the shielded cells. As a result, sample preservation is not feasible until the samples have been received and processed at the laboratory.
Per discussion with Stephen Burdick of SCDHEC in December 2011, and documented in the LWTRS-QAPP review comments (DHEC_01-17-2012), it was decided that sample preservation would have minimal benefit for residuals material. The materials have been in a highly radioactive, caustic, and temperature-elevated environment for many years. During the waste removal campaigns prior to sampling, the solids have been agitated and washed numerous times with oxalic acid, supernatant, and/or water and sometimes given a final water rinse before the waste tank and residual solids are dried using heated air. Whatever physical changes and chemical compound degradations have taken place to that point far exceed any changes that might occur at ambient temperature following sample removal from the waste tank.
It was also determined in the discussion with Stephen Burdick of SCDHEC in December 2011 (DHEC_ 01-17-2012), that soil sample holding times are also not applicable for these materials. However, most sample preparation and analysis can be performed within 180 days of the acidification; the usual holding time requirement for metal and radiological analyses of soil. It is unlikely that the 28-day holding time for nitrate/nitrite and the 4ºC and 28-day holding time
Liquid Waste Tank Residuals Sampling- SRR-CWDA-2011-00117 Quality Assurance Program Plan Revision 1 July 2013
Page 58 of 99
requirements for mercury and sulfate analyses will be met due to the sample handling requirements.
Key resources, individuals, and facilities to support the residuals sampling project are presented in Section B9.4.
B4 Analytical Methods
SRNL utilizes Analytical Operating Procedures (AOPs), designated as Technical Reference Procedures, coupled with R&D directions for their analytical work. Both types of documents are written by SRNL SMEs. The AOPs describe routine activities or generalized instructional material while the R&D directions provide customized instruction for the completion of matrix-specific preparations by well-trained personnel. The waste tank residuals analyses require special protocols to reduce worker exposure and meet the complex analytical requirements for some radioisotope measurements.
B4.1 Identify Standard Operating Procedures
Procedures are peer-reviewed and approved by management while R&D directions are prepared by technical experts that decide if review is required. These procedures and R&D directions are based on widely-accepted analytical protocols, such as EPA for chemical methods and MARLAP for radioanalytical methods, and allow flexibility to analyze these material matrices to meet project expectations. Any additional technical or quality requirements will be specified in a technical task document (TTR or TTQAP).
Examples of some analytical methods and corresponding instrumentation used are presented in Table B4-1. The AOPs and summary method descriptions for typical residuals material analyses are included in Attachment 2. The latest revision of the AOP or procedure will be used. The actual method utilized for future sample analyses cannot be predetermined due to the complex nature of the sample matrices. A significant amount of method development may take place as the samples are analyzed. The complete details for each analysis performed are contained in the final data packets referenced in LIMS, and detailed in the case narrative of the Sample Analysis Report.
B4.2 Identify Equipment and Instrumentation
Equipment and instrumentation typically used for the sample analyses are listed in Table B4-1.
B4.3 Specify Measurement Performance Criteria
Specific MPC typically used for the analyses are listed in Table A7-1. Refer to Section A7.2 for additional discussion of MPCs and DQIs.
B4.4 Identify Procedures to Follow When Failures Occur
Noncompliant work includes occurrences outside of specified limits. Equipment failures or concerns are reviewed, evaluated for significance, and resolved by the SME. When appropriate and feasible, reanalysis may be performed, as determined by the SME. Radiochemistry instrument failures are noted via a combination of documentation steps in the instrument log book and instrument history file. For chemical analyses, the task supervisor documents failures in the instrument’s maintenance laboratory notebook.
Liquid Waste Tank Residuals Sampling- SRR-CWDA-2011-00117 Quality Assurance Program Plan Revision 1 July 2013
Page 59 of 99
Instruments or equipment that have generated suspect data are tagged, segregated, or otherwise controlled to prevent use until they are repaired and recalibrated, if required. The SME is responsible for evaluating the validity of any sample results generated, and developing a course of action for instrument repair or servicing.
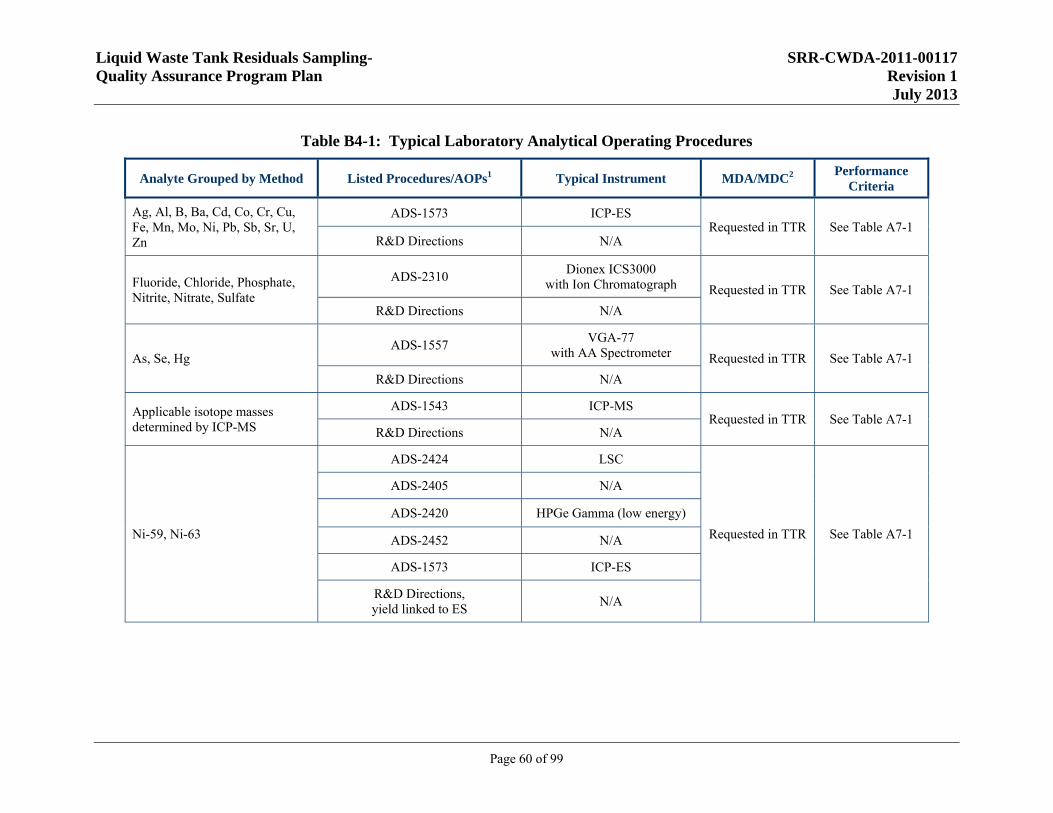
Liquid Waste Tank Residuals Sampling- SRR-CWDA-2011-00117 Quality Assurance Program Plan Revision 1 July 2013
Page 60 of 99
Table B4-1: Typical Laboratory Analytical Operating Procedures
Analyte Grouped by Method Listed Procedures/AOPs1 Typical Instrument MDA/MDC2 Performance Criteria
Ag, Al, B, Ba, Cd, Co, Cr, Cu, Fe, Mn, Mo, Ni, Pb, Sb, Sr, U, Zn
ADS-1573 ICP-ES Requested in TTR See Table A7-1
R&D Directions N/A
Fluoride, Chloride, Phosphate, Nitrite, Nitrate, Sulfate
ADS-2310 Dionex ICS3000
with Ion Chromatograph Requested in TTR See Table A7-1
R&D Directions N/A
As, Se, Hg ADS-1557
VGA-77 with AA Spectrometer Requested in TTR See Table A7-1
R&D Directions N/A
Applicable isotope masses determined by ICP-MS
ADS-1543 ICP-MS Requested in TTR See Table A7-1
R&D Directions N/A
Ni-59, Ni-63
ADS-2424 LSC
Requested in TTR See Table A7-1
ADS-2405 N/A
ADS-2420 HPGe Gamma (low energy)
ADS-2452 N/A
ADS-1573 ICP-ES
R&D Directions, yield linked to ES
N/A
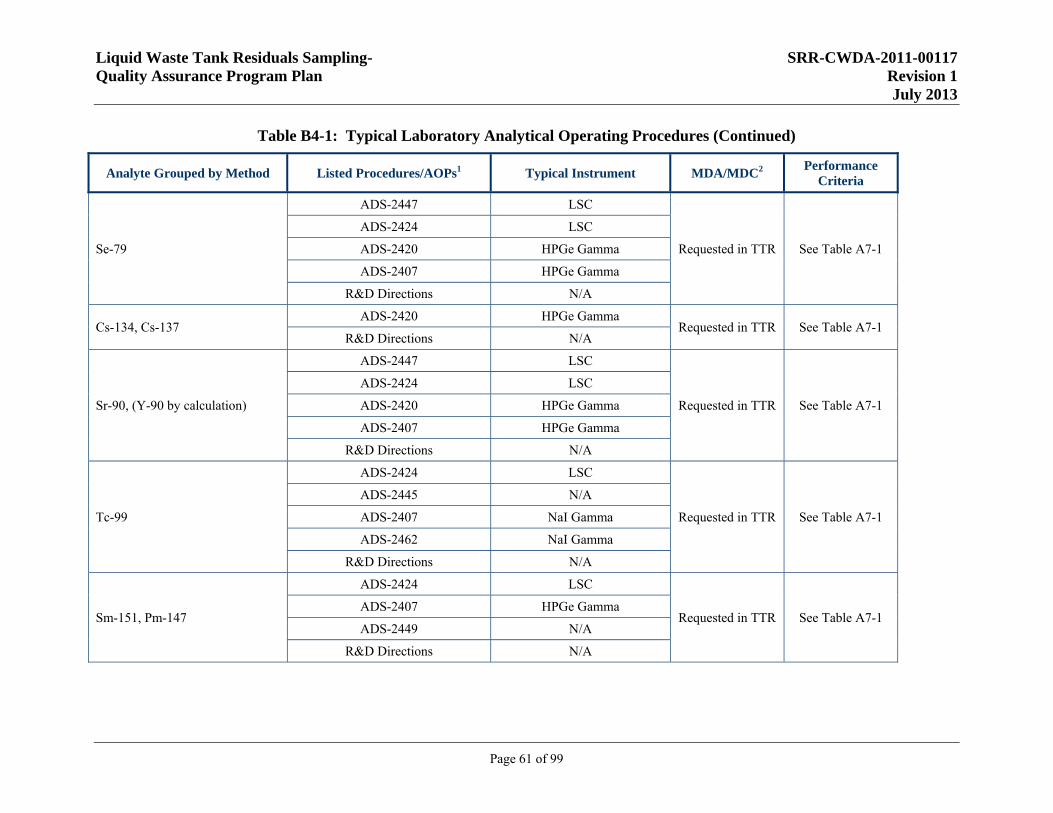
Liquid Waste Tank Residuals Sampling- SRR-CWDA-2011-00117 Quality Assurance Program Plan Revision 1 July 2013
Page 61 of 99
Table B4-1: Typical Laboratory Analytical Operating Procedures (Continued)
Analyte Grouped by Method Listed Procedures/AOPs1 Typical Instrument MDA/MDC2 Performance Criteria
Se-79
ADS-2447 LSC
Requested in TTR See Table A7-1
ADS-2424 LSC
ADS-2420 HPGe Gamma
ADS-2407 HPGe Gamma
R&D Directions N/A
Cs-134, Cs-137 ADS-2420 HPGe Gamma
Requested in TTR See Table A7-1 R&D Directions N/A
Sr-90, (Y-90 by calculation)
ADS-2447 LSC
Requested in TTR See Table A7-1
ADS-2424 LSC
ADS-2420 HPGe Gamma
ADS-2407 HPGe Gamma
R&D Directions N/A
Tc-99
ADS-2424 LSC
Requested in TTR See Table A7-1
ADS-2445 N/A
ADS-2407 NaI Gamma
ADS-2462 NaI Gamma
R&D Directions N/A
Sm-151, Pm-147
ADS-2424 LSC
Requested in TTR See Table A7-1 ADS-2407 HPGe Gamma
ADS-2449 N/A
R&D Directions N/A
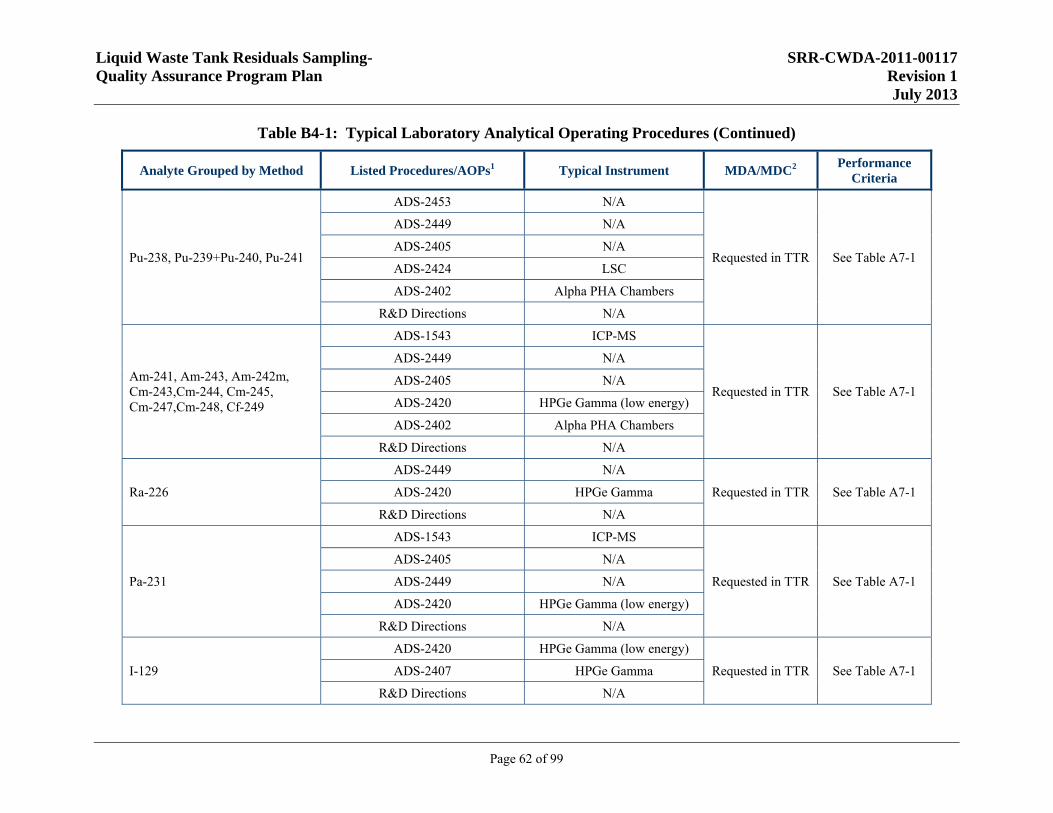
Liquid Waste Tank Residuals Sampling- SRR-CWDA-2011-00117 Quality Assurance Program Plan Revision 1 July 2013
Page 62 of 99
Table B4-1: Typical Laboratory Analytical Operating Procedures (Continued)
Analyte Grouped by Method Listed Procedures/AOPs1 Typical Instrument MDA/MDC2 Performance Criteria
Pu-238, Pu-239+Pu-240, Pu-241
ADS-2453 N/A
Requested in TTR See Table A7-1
ADS-2449 N/A
ADS-2405 N/A
ADS-2424 LSC
ADS-2402 Alpha PHA Chambers
R&D Directions N/A
Am-241, Am-243, Am-242m, Cm-243,Cm-244, Cm-245, Cm-247,Cm-248, Cf-249
ADS-1543 ICP-MS
Requested in TTR See Table A7-1
ADS-2449 N/A
ADS-2405 N/A
ADS-2420 HPGe Gamma (low energy)
ADS-2402 Alpha PHA Chambers
R&D Directions N/A
Ra-226
ADS-2449 N/A
Requested in TTR See Table A7-1 ADS-2420 HPGe Gamma
R&D Directions N/A
Pa-231
ADS-1543 ICP-MS
Requested in TTR See Table A7-1
ADS-2405 N/A
ADS-2449 N/A
ADS-2420 HPGe Gamma (low energy)
R&D Directions N/A
I-129
ADS-2420 HPGe Gamma (low energy)
Requested in TTR See Table A7-1 ADS-2407 HPGe Gamma
R&D Directions N/A
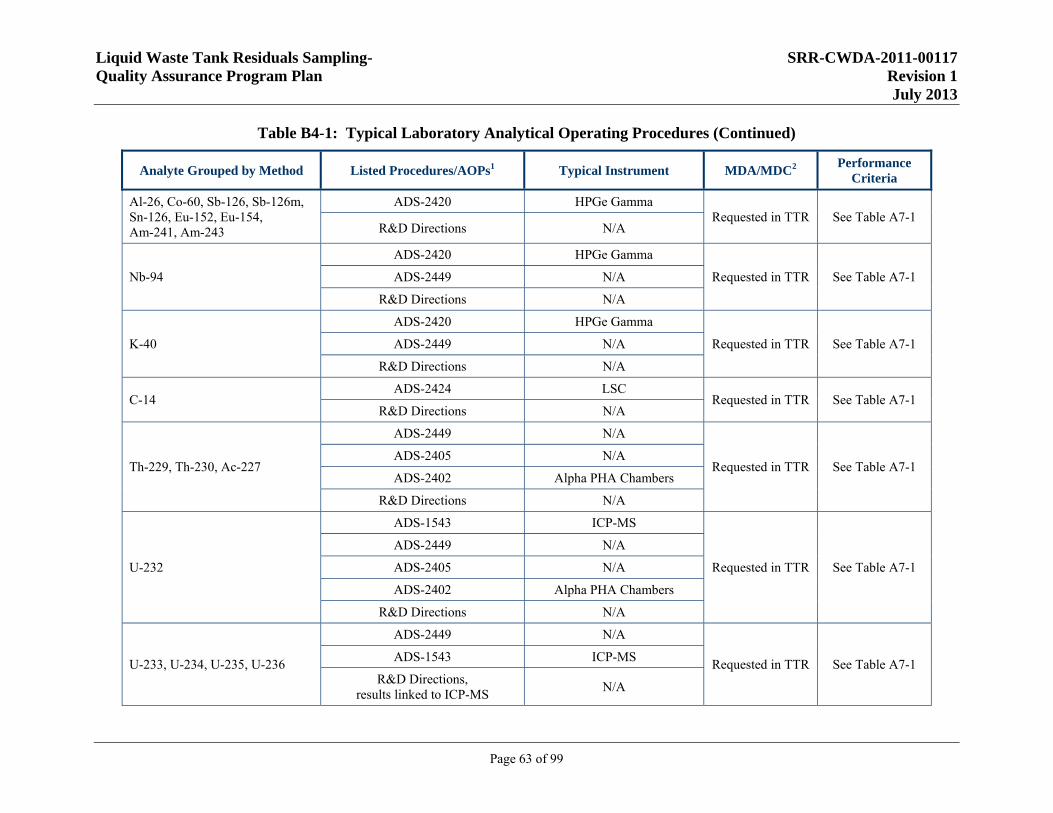
Liquid Waste Tank Residuals Sampling- SRR-CWDA-2011-00117 Quality Assurance Program Plan Revision 1 July 2013
Page 63 of 99
Table B4-1: Typical Laboratory Analytical Operating Procedures (Continued)
Analyte Grouped by Method Listed Procedures/AOPs1 Typical Instrument MDA/MDC2 Performance Criteria
Al-26, Co-60, Sb-126, Sb-126m, Sn-126, Eu-152, Eu-154, Am-241, Am-243
ADS-2420 HPGe Gamma Requested in TTR See Table A7-1
R&D Directions N/A
Nb-94
ADS-2420 HPGe Gamma
Requested in TTR See Table A7-1 ADS-2449 N/A
R&D Directions N/A
K-40
ADS-2420 HPGe Gamma
Requested in TTR See Table A7-1 ADS-2449 N/A
R&D Directions N/A
C-14 ADS-2424 LSC
Requested in TTR See Table A7-1 R&D Directions N/A
Th-229, Th-230, Ac-227
ADS-2449 N/A
Requested in TTR See Table A7-1 ADS-2405 N/A
ADS-2402 Alpha PHA Chambers
R&D Directions N/A
U-232
ADS-1543 ICP-MS
Requested in TTR See Table A7-1
ADS-2449 N/A
ADS-2405 N/A
ADS-2402 Alpha PHA Chambers
R&D Directions N/A
U-233, U-234, U-235, U-236
ADS-2449 N/A
Requested in TTR See Table A7-1 ADS-1543 ICP-MS
R&D Directions, results linked to ICP-MS
N/A
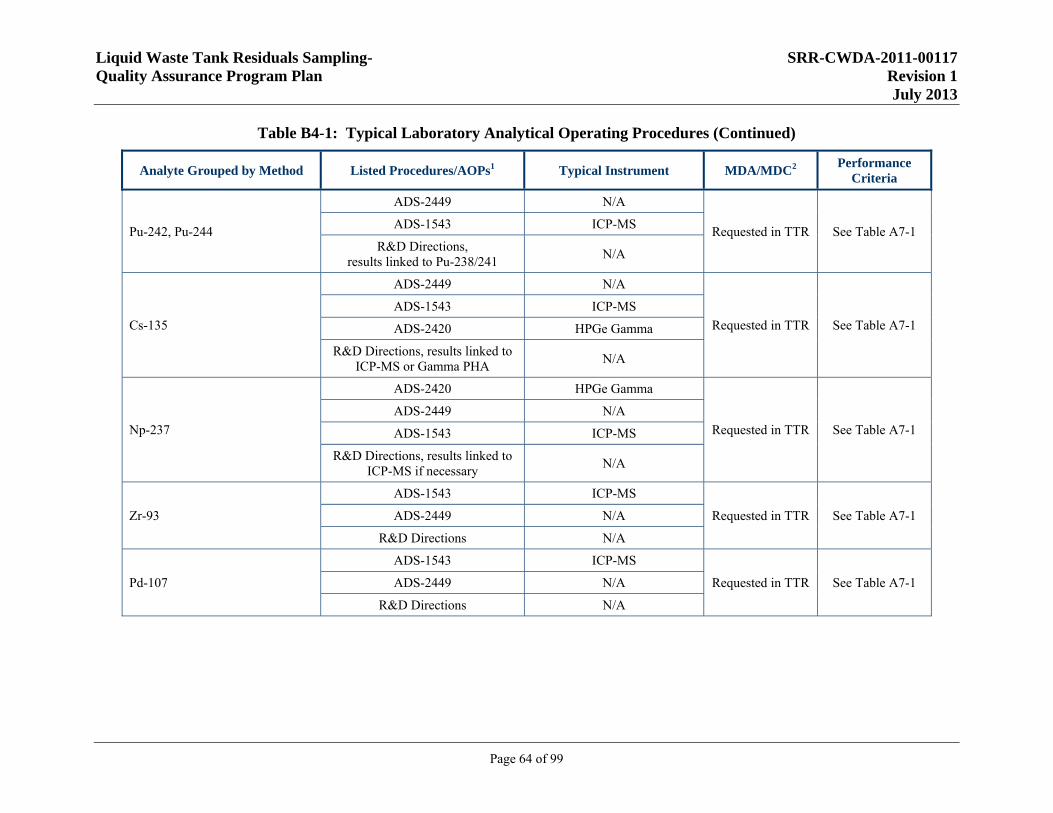
Liquid Waste Tank Residuals Sampling- SRR-CWDA-2011-00117 Quality Assurance Program Plan Revision 1 July 2013
Page 64 of 99
Table B4-1: Typical Laboratory Analytical Operating Procedures (Continued)
Analyte Grouped by Method Listed Procedures/AOPs1 Typical Instrument MDA/MDC2 Performance Criteria
Pu-242, Pu-244
ADS-2449 N/A
Requested in TTR See Table A7-1 ADS-1543 ICP-MS
R&D Directions, results linked to Pu-238/241
N/A
Cs-135
ADS-2449 N/A
Requested in TTR See Table A7-1
ADS-1543 ICP-MS
ADS-2420 HPGe Gamma
R&D Directions, results linked to ICP-MS or Gamma PHA
N/A
Np-237
ADS-2420 HPGe Gamma
Requested in TTR See Table A7-1
ADS-2449 N/A
ADS-1543 ICP-MS
R&D Directions, results linked to ICP-MS if necessary
N/A
Zr-93
ADS-1543 ICP-MS
Requested in TTR See Table A7-1 ADS-2449 N/A
R&D Directions N/A
Pd-107
ADS-1543 ICP-MS
Requested in TTR See Table A7-1 ADS-2449 N/A
R&D Directions N/A
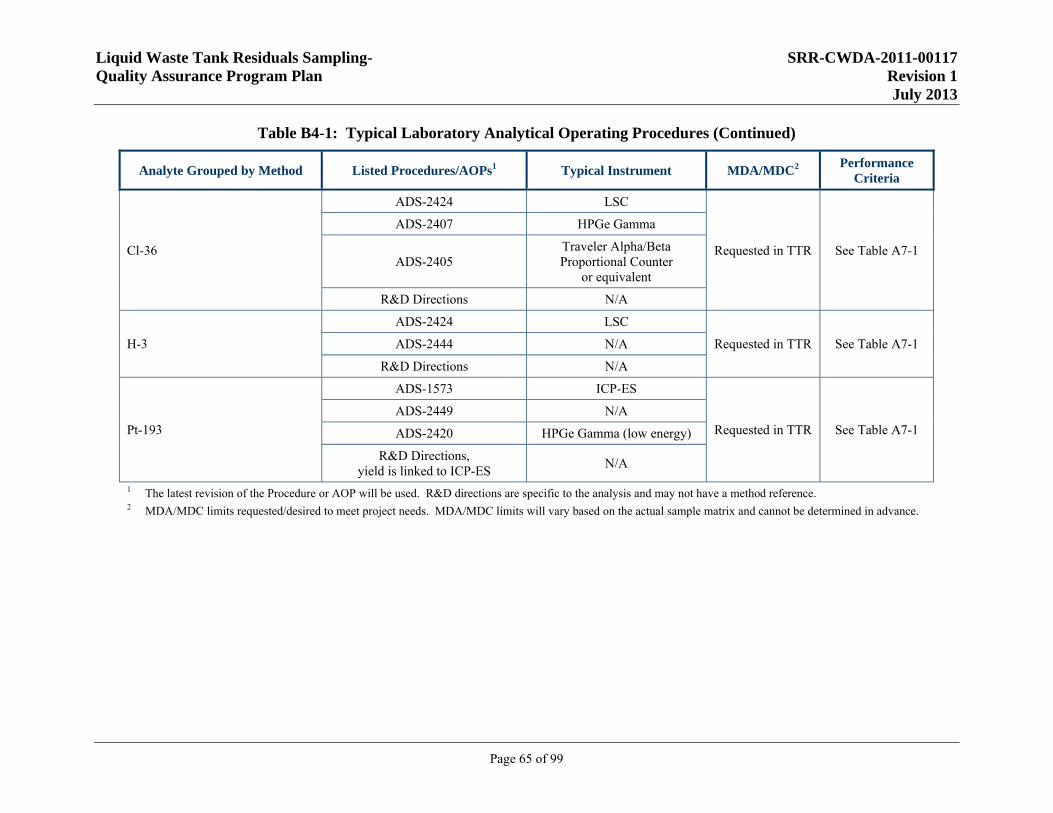
Liquid Waste Tank Residuals Sampling- SRR-CWDA-2011-00117 Quality Assurance Program Plan Revision 1 July 2013
Page 65 of 99
Table B4-1: Typical Laboratory Analytical Operating Procedures (Continued)
Analyte Grouped by Method Listed Procedures/AOPs1 Typical Instrument MDA/MDC2 Performance Criteria
Cl-36
ADS-2424 LSC
Requested in TTR See Table A7-1
ADS-2407 HPGe Gamma
ADS-2405 Traveler Alpha/Beta Proportional Counter
or equivalent
R&D Directions N/A
H-3
ADS-2424 LSC
Requested in TTR See Table A7-1 ADS-2444 N/A
R&D Directions N/A
Pt-193
ADS-1573 ICP-ES
Requested in TTR See Table A7-1
ADS-2449 N/A
ADS-2420 HPGe Gamma (low energy)
R&D Directions, yield is linked to ICP-ES
N/A
1 The latest revision of the Procedure or AOP will be used. R&D directions are specific to the analysis and may not have a method reference. 2 MDA/MDC limits requested/desired to meet project needs. MDA/MDC limits will vary based on the actual sample matrix and cannot be determined in advance.
Liquid Waste Tank Residuals Sampling- SRR-CWDA-2011-00117 Quality Assurance Program Plan Revision 1 July 2013
Page 66 of 99
B4.7 Provide Method Validation and SOPs for Nonstandard Methods
Due to the uniquely complex and variable nature of the waste tank residual materials, standard method validation procedures cannot be routinely applied for these analyses.
Typical analytical methods and instruments are listed in Tables A7-1 and B4-1. AOPs and summaries of typical analytical methods are included in Attachment 2. These AOPs and methods, with modifications as needed for variations in matrix and radionuclide content, will be those used for future waste tank residual material analyses. For cases where sample characterization requires additional analyte-specific performance criteria, those requirements will be specified in TTRs, TSAPs, and TTQAPs.
SRNL SMEs may supplement the AOPs with additional specific implementing information for the method procedures in R&D directions.
R&D directions are developed and managed in accordance with SRNL L1 Manual, Procedure 7.26, Conduct of Research & Development (R&D) Work Control Document. Flowcharts showing general separation processes that may be used for specific radionuclide analyses are available upon request.
B5 Quality Control Requirements
Procedures at SRS are written instructions used to guide administrative, management, and technical activities. All procedures are intended to implement quality policies contained in the SRS 1Q Manual. Procedures are reviewed at least every five years for technical, operational, administrative, safety, and QA information. Additional specific technical and quality requirements desired by the customer may be specified in TTRs.
For residuals samples, matrix spikes for risk-driving constituents are often impractical, since these constituents are normally radionuclides present at such high concentrations that the spike quantities would need to be on the order of a curie or more. Additionally, residuals samples contain some of the nuclides that are traditionally used as tracers in environmental samples, making use of those tracers ineffective. Due to the difficulty of waste tank sampling and ALARA concerns, replicate samples are not collected and analyzed; however, replicate aliquots of individual samples are analyzed (usually in triplicate) to provide precision information on the analytical methods.
Alternative QA measures are also utilized in SRNL to assure confidence in the analytical results. Included among these measures are hybrid analysis techniques utilizing independent measurement techniques, addition of spikes after sufficient dilution of the sample such that the spike quantity would dominate, and usage of alternative spike/tracer materials. As appropriate, laboratory blanks, laboratory replicates, lab control spikes, and serial dilutions are also used as part of the routine QA/QC protocols. Such approaches are method specific and refined to assure analytical adequacy for a given waste tank residual matrix and constituent. An overview of typical QC samples used for the residuals sample analyses are listed in Table A7-1.
For chemical measurements, the analytical methods are qualified by a prior method detection limit study per AD procedures, statistical evaluation of control-charted standards, and validation for a few analytes by performance evaluation studies (e.g., Mixed Analyte Performance Evaluation Program [MAPEP]). Each batch of samples contains appropriate blanks and QCs to
Liquid Waste Tank Residuals Sampling- SRR-CWDA-2011-00117 Quality Assurance Program Plan Revision 1 July 2013
Page 67 of 99
verify acceptable instrument performance. In some cases, the results obtained from two different instruments are compared to judge acceptability of the reported data (e.g., metal concentrations measured by ICP-ES and ICP-MS on separate aliquots from different types of dissolution).
For radioanalytical methods, the preparative work needs to be customized (in the form of R&D directions) for the specific waste tank matrix due to the highly-variable composition of the waste tanks. Following customized method protocols, the samples are typically traced (spiked) with a non-target radionuclide or chemical species so that each sample preparation, when possible, can be corrected for the losses that occur during multiple preparative steps. Each batch of samples also contains blanks (such as the Analyzed Reference Glass [ARG] sample), serial dilutions, and spiked samples, as feasible, to verify preparative and analytical performance. In some cases, data from two or more instruments are combined to obtain the tracer recovery, spike recovery, and yield-corrected sample results.
B5.1 Quality Control Samples
QC is assured for each method through a combination of blanks, spikes, duplicates, serial dilutions, reference standards, and control charting, as applicable for the technique. A sample batch size is 20 samples or less and for the chemical analyses, QC samples are typically placed at the beginning and end of the batch. For radiological analyses, the QC samples are randomly inserted into the batch run. For chemical or radiological analyses, additional QC samples may be placed within the batch as required by the method as described in Table A7-1.
Raw sample material is used when the analysis technique and sample dose rates allow. Otherwise, samples are digested in the shielded cells to provide digestates that are transferred to the AD lab modules for chemical and selected radioanalytical analyses. During the digestion in the cells, matrix appropriate sample blanks are prepared as a negative control to monitor for sample cross-contamination. The blank is carried through the complete sample preparation and analytical procedures.
As an alternative to matrix and laboratory control spikes, SRNL may analyze a well-characterized ARG sample. The ARG standard is also dissolved along with the samples in the shielded cells and carried through the complete sample preparation and analytical procedures. The ARG contains oxides of Al, B, Ca, Fe, K, Li, Mn, Na, Ni, Si, and Ti as major components. The oxides of Ba, Cr, Cu, Mg, P, Sr, Zn, and Zr are minor components.
For the elemental methods (ICP-ES and ICP-MS), the matrix appropriate cell blank and ARG sample constitute the batch QC. The analysis QC introduced at the instrument includes the initial and continuing calibration verifications (blanks and check standards). Both the ICP-ES and ICP-MS utilize internal standards added to each sample, blank, and standard to monitor and/or correct for sample matrix effects.
For some radioanalytical methods (examples include Sr-90 and Pu isotopes), radionuclides are separated from other interfering radionuclides, as needed, using separation techniques applied to the digestates from the shielded cells. In these cases, QA samples (ARG, sludge simulants, and/or reagent blanks) are analyzed as negative batch controls to determine if cross-contamination is an issue in the cell. These QA samples cannot function as a positive control because they do not contain radionuclides. During the separation process in AD radiological containment units, additional controls are added, as feasible, to the sample batch to monitor
Liquid Waste Tank Residuals Sampling- SRR-CWDA-2011-00117 Quality Assurance Program Plan Revision 1 July 2013
Page 68 of 99
losses in the separation steps, monitor potential contamination, and assess matrix effects. These controls include tracers to provide yield, blank spikes for spike recovery, and serial dilutions for matrix effects.
For many other radionuclides, SRNL cannot analyze aliquots of the digested sample dilutions because the process would dilute the sample too much to meet SRR-requested detection limits. For a few radionuclides, such as C-14 and Tc-99, a digestion would volatilize some of the target analyte and bias the measurement. In these cases, solid aliquots are weighed in the shielded cells or AD radiological containment units, thereby allowing a larger starting mass to be dissolved and processed though separations. The same types of QC samples, as described previously, are used at the outset of these sample preparations.
Reference materials, such as vendor-supplied elemental standards (e.g., Cr, Fe, Hg, etc.) and radiochemical standards (e.g., Pu-236, Sr-90, etc.), used in SRNL are uniquely identified and of sufficient accuracy to meet the requirements of the customer, SRR, and the requirements of 1Q Manual, Procedure 2-7, QA Program Requirements for Analytical Measurement Systems. Reference materials are procured from external suppliers and are traceable to a national or international standard (National Institute of Standards and Technology [NIST], for example). Purchased reference materials require a Certificate of Analysis from the manufacturer, if available. In the case of radioactive sources used in calibration, an allowance is made for the correction of the assigned value due to the half-life of the source.
Standards from reference materials are prepared and analyzed with customer samples to calibrate or verify control of the measurement system and analytical instrumentation. Reference material working solutions are prepared from stock solutions. All stock solutions or reagents used are within their expiration date. However, certain specific conditions (completion of testing progress, production cycle timing, etc.) may require the use of chemicals or reagents beyond their expiration date. For these limited instances, the CTF will document the technical justification per SRNL L1 Manual, Procedure 8.02, Attachment 8-1, Identification and Control of Items. Standard preparation records are maintained in analytical notebooks and indicated traceability to purchased stocks or neat compounds, reference to the method of preparation, date of preparation, expiration date, and preparer initials.
SRNL participates in several performance testing programs. SRNL routinely analyzes samples distributed for the MAPEP. Participation in the MAPEP routinely tests gamma pulse-height analysis (PHA), ICP-ES, ICP-MS, and AA methods. In the past, the MAPEP sample was submitted as a single-blind performance testing sample and analyzed for gross alpha and gross beta analysis; the results were not reported formally to MAPEP but were compared to the published acceptable results from the MAPEP website by an independent third party. The reported gross alpha and gross beta results were both within the documented acceptance range for the MAPEP. In addition to participation in the MAPEP, blind samples are routinely analyzed for International Organization for Standardization (ISO) 17025 continued accreditation. The SRNL ISO 17025 performance testing program utilizes blind, pedigreed standards or documented performance testing samples which are analyzed using ISO-accredited procedures. The ISO 17025 performance testing matrix has been used for gross alpha and gross beta analysis by gas flow proportional counting, gamma PHA, gross alpha and gross beta by liquid scintillation counting (LSC), Sr-90 separation and analysis, plutonium separation and analysis,
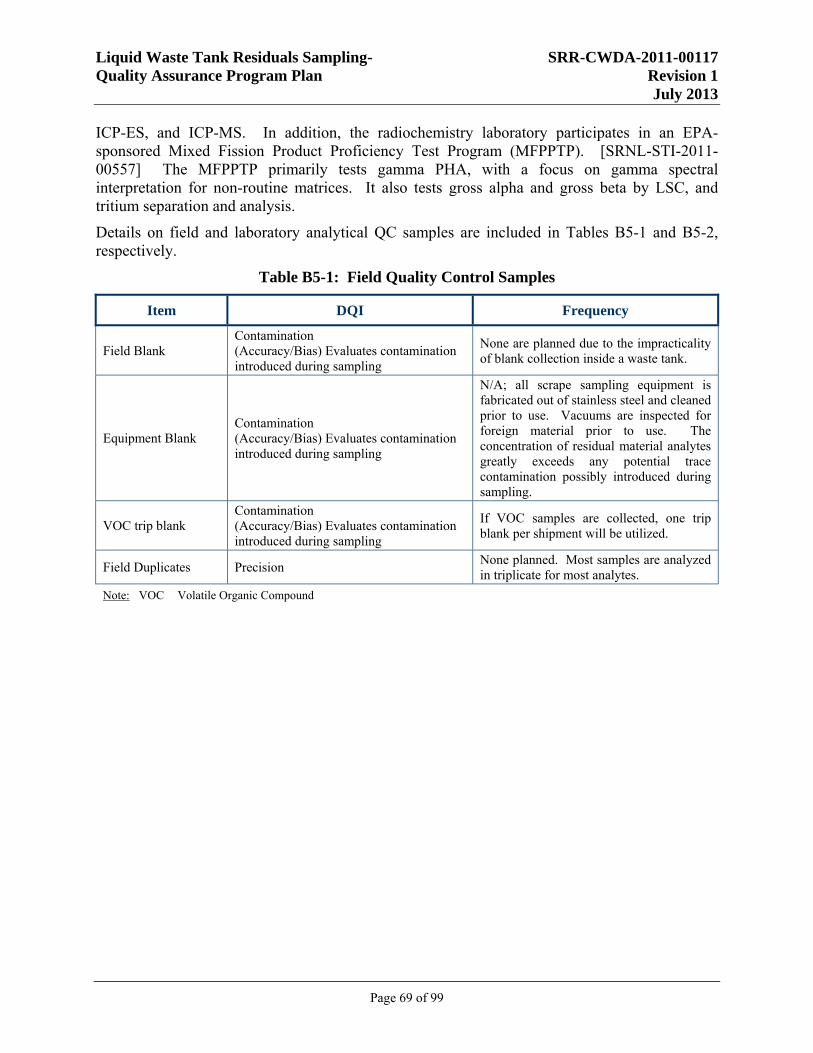
Liquid Waste Tank Residuals Sampling- SRR-CWDA-2011-00117 Quality Assurance Program Plan Revision 1 July 2013
Page 69 of 99
ICP-ES, and ICP-MS. In addition, the radiochemistry laboratory participates in an EPA-sponsored Mixed Fission Product Proficiency Test Program (MFPPTP). [SRNL-STI-2011-00557] The MFPPTP primarily tests gamma PHA, with a focus on gamma spectral interpretation for non-routine matrices. It also tests gross alpha and gross beta by LSC, and tritium separation and analysis.
Details on field and laboratory analytical QC samples are included in Tables B5-1 and B5-2, respectively.
Table B5-1: Field Quality Control Samples
Item DQI Frequency
Field Blank Contamination (Accuracy/Bias) Evaluates contamination introduced during sampling
None are planned due to the impracticality of blank collection inside a waste tank.
Equipment Blank Contamination (Accuracy/Bias) Evaluates contamination introduced during sampling
N/A; all scrape sampling equipment is fabricated out of stainless steel and cleaned prior to use. Vacuums are inspected for foreign material prior to use. The concentration of residual material analytes greatly exceeds any potential trace contamination possibly introduced during sampling.
VOC trip blank Contamination (Accuracy/Bias) Evaluates contamination introduced during sampling
If VOC samples are collected, one trip blank per shipment will be utilized.
Field Duplicates Precision None planned. Most samples are analyzed in triplicate for most analytes.
Note: VOC Volatile Organic Compound
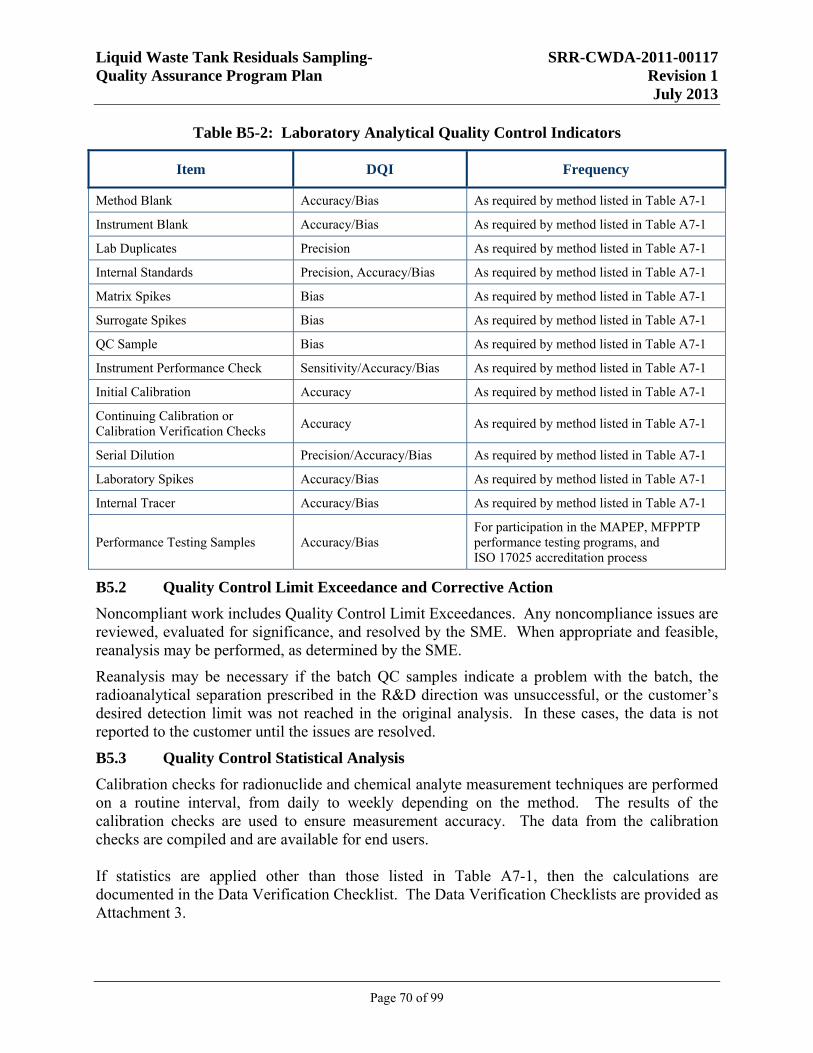
Liquid Waste Tank Residuals Sampling- SRR-CWDA-2011-00117 Quality Assurance Program Plan Revision 1 July 2013
Page 70 of 99
Table B5-2: Laboratory Analytical Quality Control Indicators
Item DQI Frequency
Method Blank Accuracy/Bias As required by method listed in Table A7-1
Instrument Blank Accuracy/Bias As required by method listed in Table A7-1
Lab Duplicates Precision As required by method listed in Table A7-1
Internal Standards Precision, Accuracy/Bias As required by method listed in Table A7-1
Matrix Spikes Bias As required by method listed in Table A7-1
Surrogate Spikes Bias As required by method listed in Table A7-1
QC Sample Bias As required by method listed in Table A7-1
Instrument Performance Check Sensitivity/Accuracy/Bias As required by method listed in Table A7-1
Initial Calibration Accuracy As required by method listed in Table A7-1
Continuing Calibration or Calibration Verification Checks
Accuracy As required by method listed in Table A7-1
Serial Dilution Precision/Accuracy/Bias As required by method listed in Table A7-1
Laboratory Spikes Accuracy/Bias As required by method listed in Table A7-1
Internal Tracer Accuracy/Bias As required by method listed in Table A7-1
Performance Testing Samples Accuracy/Bias For participation in the MAPEP, MFPPTP performance testing programs, and ISO 17025 accreditation process
B5.2 Quality Control Limit Exceedance and Corrective Action
Noncompliant work includes Quality Control Limit Exceedances. Any noncompliance issues are reviewed, evaluated for significance, and resolved by the SME. When appropriate and feasible, reanalysis may be performed, as determined by the SME.
Reanalysis may be necessary if the batch QC samples indicate a problem with the batch, the radioanalytical separation prescribed in the R&D direction was unsuccessful, or the customer’s desired detection limit was not reached in the original analysis. In these cases, the data is not reported to the customer until the issues are resolved.
B5.3 Quality Control Statistical Analysis
Calibration checks for radionuclide and chemical analyte measurement techniques are performed on a routine interval, from daily to weekly depending on the method. The results of the calibration checks are used to ensure measurement accuracy. The data from the calibration checks are compiled and are available for end users. If statistics are applied other than those listed in Table A7-1, then the calculations are documented in the Data Verification Checklist. The Data Verification Checklists are provided as Attachment 3.
Liquid Waste Tank Residuals Sampling- SRR-CWDA-2011-00117 Quality Assurance Program Plan Revision 1 July 2013
Page 71 of 99
B6 Instrument/Equipment Testing, Inspection, and Maintenance
Analytical measurements at SRNL are performed on instruments that are managed according to the 1Q Manual, Procedure 2-7, QA Program Requirements for Analytical Measurement Systems or Procedure 12-1, Control of Measuring and Test Equipment. Typically, the more complex instruments are covered by Procedure 2-7 as analytical Measurement Systems and Equipment (MS&E) while balances, thermocouples, and temperature controllers are covered by Procedure 12-1 as Measuring and Test Equipment (M&TE).
B6.1 Identification of Field and Laboratory Equipment
Field equipment typically used for waste tank residuals sampling consists of the robotic crawler with associated scrape sample cups and sampling basket, and small-diameter commercially-available vacuum cleaners. If appropriate, scrapers, core samplers, or vacuum cleaners attached to poles, may be used. The types of sampling equipment typically used are described in Section 4.1.3 of the LWTRSAPP.
Except for the vendor-provided crawler platform and vacuum cleaners, all sampling equipment is fabricated as needed by SRR Tank Farm Maintenance. The crawler platform is modified by SRR Tank Farm Maintenance to accommodate cameras, lights, and robotic sampling arm requirements for use in the waste tanks. All sampling equipment is inspected and operation checked before insertion into the waste tank being sampled.
All analytical instruments are properly maintained, inspected, and cleaned. SRNL SMEs may perform routine maintenance and adjustments as needed to ensure reliable analytical results. Alternatively, a service contract from a vendor may be in place to regularly service instrumentation. An instrument history log or file is maintained by the SME for analytical instrumentation. Detailed information on instrument maintenance is documented in accordance with the instrument Technical Reference Procedure. The instrument manufacturer’s manuals are also typically kept available as in-laboratory references. Instrumentation subject to maintenance is presented in Table B6-1.
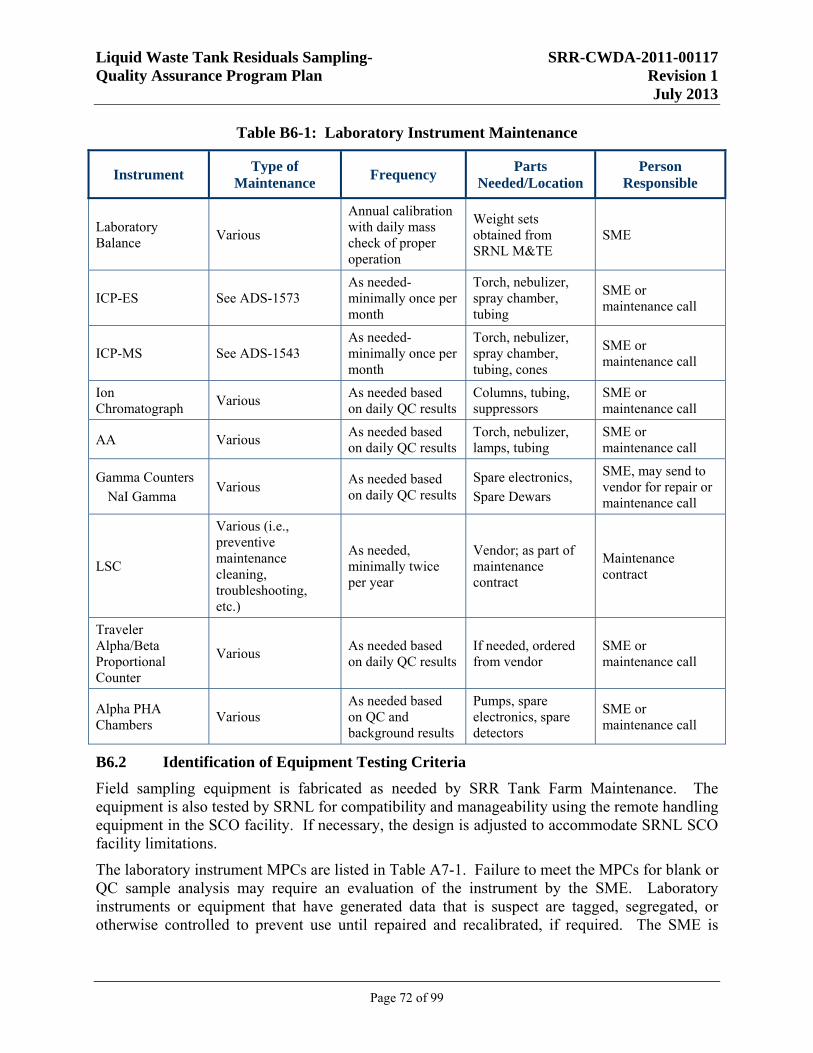
Liquid Waste Tank Residuals Sampling- SRR-CWDA-2011-00117 Quality Assurance Program Plan Revision 1 July 2013
Page 72 of 99
Table B6-1: Laboratory Instrument Maintenance
Instrument Type of Maintenance Frequency Parts
Needed/Location Person
Responsible
Laboratory Balance
Various
Annual calibration with daily mass check of proper operation
Weight sets obtained from SRNL M&TE
SME
ICP-ES See ADS-1573 As needed- minimally once per month
Torch, nebulizer, spray chamber, tubing
SME or maintenance call
ICP-MS See ADS-1543 As needed- minimally once per month
Torch, nebulizer, spray chamber, tubing, cones
SME or maintenance call
Ion Chromatograph
Various As needed based on daily QC results
Columns, tubing, suppressors
SME or maintenance call
AA Various As needed based on daily QC results
Torch, nebulizer, lamps, tubing
SME or maintenance call
Gamma Counters NaI Gamma
Various As needed based on daily QC results
Spare electronics, Spare Dewars
SME, may send to vendor for repair or maintenance call
LSC
Various (i.e., preventive maintenance cleaning, troubleshooting, etc.)
As needed, minimally twice per year
Vendor; as part of maintenance contract
Maintenance contract
Traveler Alpha/Beta Proportional Counter
Various As needed based on daily QC results
If needed, ordered from vendor
SME or maintenance call
Alpha PHA Chambers
Various As needed based on QC and background results
Pumps, spare electronics, spare detectors
SME or maintenance call
B6.2 Identification of Equipment Testing Criteria
Field sampling equipment is fabricated as needed by SRR Tank Farm Maintenance. The equipment is also tested by SRNL for compatibility and manageability using the remote handling equipment in the SCO facility. If necessary, the design is adjusted to accommodate SRNL SCO facility limitations.
The laboratory instrument MPCs are listed in Table A7-1. Failure to meet the MPCs for blank or QC sample analysis may require an evaluation of the instrument by the SME. Laboratory instruments or equipment that have generated data that is suspect are tagged, segregated, or otherwise controlled to prevent use until repaired and recalibrated, if required. The SME is
Liquid Waste Tank Residuals Sampling- SRR-CWDA-2011-00117 Quality Assurance Program Plan Revision 1 July 2013
Page 73 of 99
responsible for evaluating the validity of any sample results and developing a course of action for instrument repair or servicing.
B6.3 Availability and Location of Equipment Spare Parts
Field sampling equipment is modified or fabricated as needed by SRR Tank Farm Maintenance.
Spare parts, equipment, and consumable laboratory materials are obtained through the SRNL procurement system according to 1Q Manual, Procedure 7-2, Control of Purchased Items and Services. When feasible, spare parts and equipment redundancy are maintained to minimize lost productivity in the event of equipment problems.
B6.4 Procedures for Inspecting Equipment Prior to Use
See Section B7.1.
B6.5 Responsibility for Testing, Inspection and Maintenance
Field sampling equipment is tested and inspected by SRR Engineering and TFO before use. Due to the difficulty of decontamination, most equipment is for single use, and is properly disposed of, after that use. The high radiation fields in a waste tank slowly degrade the robotic crawler’s optical and electrical systems. Due to the high crawler cost, crawlers may be decontaminated and reused if judged to still be serviceable.
All laboratory analytical instruments are properly maintained, inspected, and cleaned. As shown on Table B6-1, SRNL SMEs may perform routine maintenance and adjustments to instruments as needed to ensure reliable analytical results. Alternately, a service contract from a vendor may be in place to regularly service instrumentation. An instrument history log or file is maintained by the SME for analytical instrumentation.
B6.6 Equipment Deficiency Corrective Action
All field sampling equipment is inspected and tested prior to use. Any defective part or system is repaired and retested before insertion into a waste tank for sampling.
At SRNL, noncompliances include any equipment behavior outside of specified limits. Any noncompliance issues are reviewed and evaluated for significance with the SRNL PM, and if necessary, the CQF, and resolved by the SME. The SME is responsible for evaluating the validity of any sample results and developing a course of action for instrument repair or servicing. When appropriate and feasible, reanalysis may be performed, as determined by the SME.
B7 Instrument Calibration and Frequency
B7.1 Instruments, Equipment and Tools to be Calibrated and Frequency
Field radiation monitoring equipment requires routine calibration. RadCon personnel will be responsible for determining and using the correct radiation monitoring equipment and performing and documenting the required tests and calibrations. All work will be conducted, and documented in accordance with the 5Q Manual, Radiological Control Manual, requirements.
Table B7-1 identifies the laboratory instrument calibration criteria.
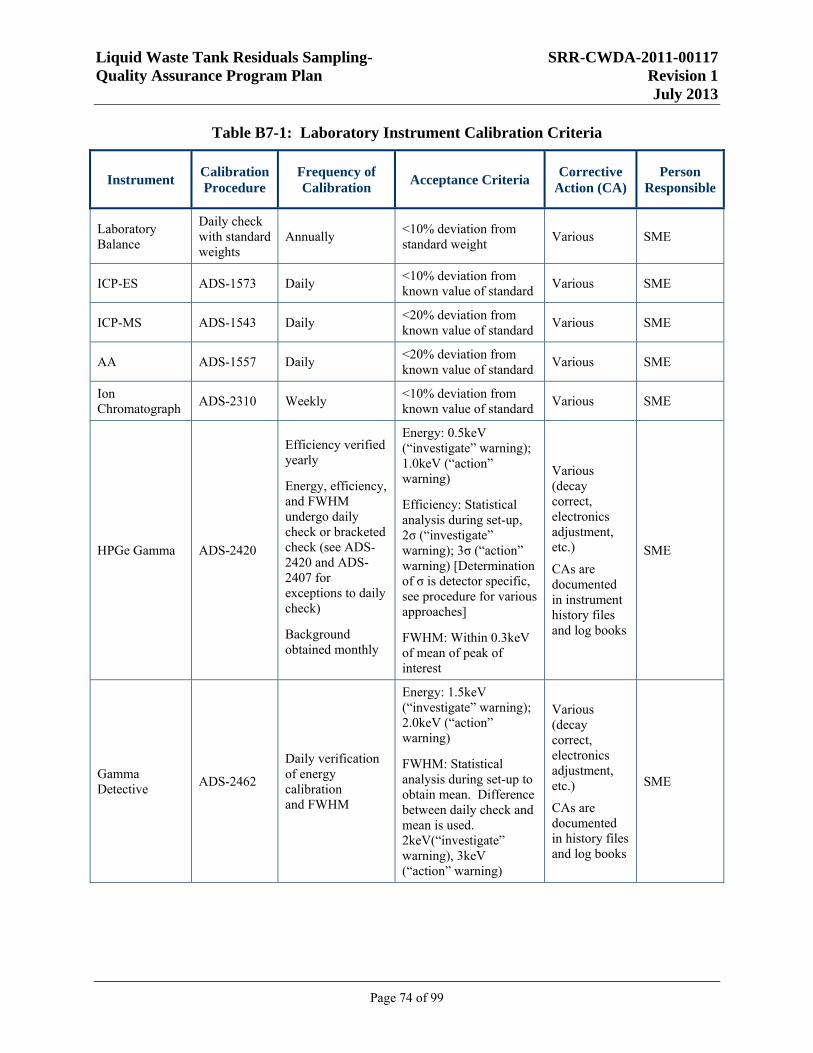
Liquid Waste Tank Residuals Sampling- SRR-CWDA-2011-00117 Quality Assurance Program Plan Revision 1 July 2013
Page 74 of 99
Table B7-1: Laboratory Instrument Calibration Criteria
Instrument Calibration Procedure
Frequency of Calibration
Acceptance Criteria Corrective
Action (CA) Person
Responsible
Laboratory Balance
Daily check with standard weights
Annually <10% deviation from standard weight
Various SME
ICP-ES ADS-1573 Daily <10% deviation from known value of standard
Various SME
ICP-MS ADS-1543 Daily <20% deviation from known value of standard
Various SME
AA ADS-1557 Daily <20% deviation from known value of standard
Various SME
Ion Chromatograph
ADS-2310 Weekly <10% deviation from known value of standard
Various SME
HPGe Gamma ADS-2420
Efficiency verified yearly
Energy, efficiency, and FWHM undergo daily check or bracketed check (see ADS-2420 and ADS-2407 for exceptions to daily check)
Background obtained monthly
Energy: 0.5keV (“investigate” warning); 1.0keV (“action” warning)
Efficiency: Statistical analysis during set-up, 2σ (“investigate” warning); 3σ (“action” warning) [Determination of σ is detector specific, see procedure for various approaches]
FWHM: Within 0.3keV of mean of peak of interest
Various (decay correct, electronics adjustment, etc.)
CAs are documented in instrument history files and log books
SME
Gamma Detective
ADS-2462
Daily verification of energy calibration and FWHM
Energy: 1.5keV (“investigate” warning); 2.0keV (“action” warning)
FWHM: Statistical analysis during set-up to obtain mean. Difference between daily check and mean is used. 2keV(“investigate” warning), 3keV (“action” warning)
Various (decay correct, electronics adjustment, etc.)
CAs are documented in history files and log books
SME
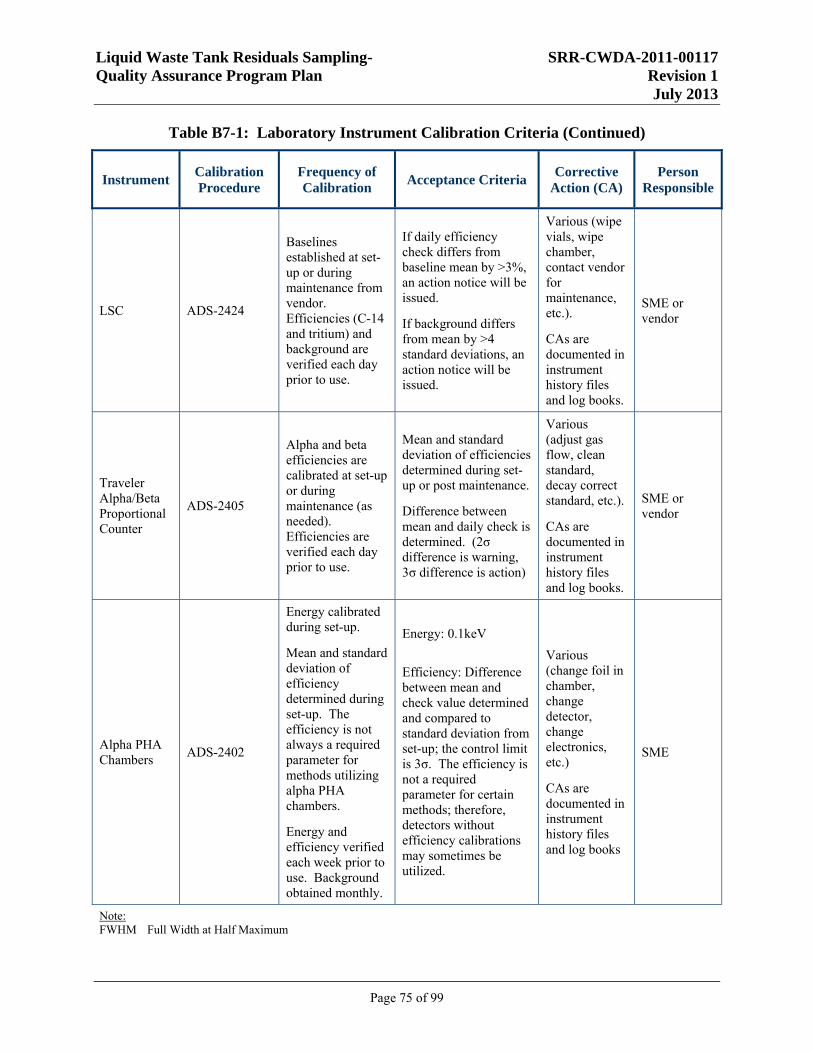
Liquid Waste Tank Residuals Sampling- SRR-CWDA-2011-00117 Quality Assurance Program Plan Revision 1 July 2013
Page 75 of 99
Table B7-1: Laboratory Instrument Calibration Criteria (Continued)
Instrument Calibration Procedure
Frequency of Calibration
Acceptance Criteria Corrective
Action (CA) Person
Responsible
LSC ADS-2424
Baselines established at set-up or during maintenance from vendor. Efficiencies (C-14 and tritium) and background are verified each day prior to use.
If daily efficiency check differs from baseline mean by >3%, an action notice will be issued.
If background differs from mean by >4 standard deviations, an action notice will be issued.
Various (wipe vials, wipe chamber, contact vendor for maintenance, etc.).
CAs are documented in instrument history files and log books.
SME or vendor
Traveler Alpha/Beta Proportional Counter
ADS-2405
Alpha and beta efficiencies are calibrated at set-up or during maintenance (as needed). Efficiencies are verified each day prior to use.
Mean and standard deviation of efficiencies determined during set-up or post maintenance.
Difference between mean and daily check is determined. (2σ difference is warning, 3σ difference is action)
Various (adjust gas flow, clean standard, decay correct standard, etc.).
CAs are documented in instrument history files and log books.
SME or vendor
Alpha PHA Chambers
ADS-2402
Energy calibrated during set-up.
Mean and standard deviation of efficiency determined during set-up. The efficiency is not always a required parameter for methods utilizing alpha PHA chambers.
Energy and efficiency verified each week prior to use. Background obtained monthly.
Energy: 0.1keV
Efficiency: Difference between mean and check value determined and compared to standard deviation from set-up; the control limit is 3σ. The efficiency is not a required parameter for certain methods; therefore, detectors without efficiency calibrations may sometimes be utilized.
Various (change foil in chamber, change detector, change electronics, etc.)
CAs are documented in instrument history files and log books
SME
Note: FWHM Full Width at Half Maximum
Liquid Waste Tank Residuals Sampling- SRR-CWDA-2011-00117 Quality Assurance Program Plan Revision 1 July 2013
Page 76 of 99
All laboratory equipment and instrumentation are maintained in accordance with Technical Reference Procedures and the appropriate 1Q Manual procedure to ensure proper operation. Traceability is ensured by calibration with a national or international standard. As appropriate, instrumentation is checked with reference materials from varying lots or manufacturers on a batch basis.
As specified in 1Q Manual, Procedure 2-7, SRNL MS&E instrumentation is managed by a Measurement Control Program (MCP), which encompasses the procedures and activities used to ensure that the measurement process generates measurements of sufficient quality for their intended use. For each system, a documented MCP is established and implemented for determining, maintaining, and assuring the accuracy and precision of measurements involving MS&E. The SMEs are responsible for evaluating and documenting MS&E requirements via procedures and an MCP to ensure that a systematic approach is utilized, and that the appropriate degree of control and/or verification is accomplished based upon the complexity of the system and the consequences of failure.
SRNL calibrates and verifies analytical instrumentation by analyzing NIST-traceable (or equivalent) standards, when available, containing known concentrations of target analytes. The calibration procedures and frequencies are described in the Technical Reference Procedures.
All SRNL instruments undergo an initial calibration process prior to the analysis of samples. The frequency of the initial calibration process varies, but the initial calibration is repeated when instrument configuration or maintenance impacts detection capability or instrument response or, in some instances, when a corrective action is needed to resolve a QC failure. For example, the ICP-ES and ICP-MS are calibrated daily prior to sample analysis, while the efficiency calibration for gamma spectrometers are verified on an annual basis. All chemical analysis and radioanalytical instruments are calibrated per the specified frequency.
Subsequent to the initial calibration but prior to analysis of samples on a specific workday, SRNL instruments (with the exception of alpha and gamma spectrometers) are checked with a calibration check standard. This check provides initial calibration verification prior to the analysis of samples. Alpha spectrometers are checked with a calibration check standard on a weekly basis. Gamma spectrometers are checked prior to analysis of samples on a specific workday, unless precluded by long count durations or the use of automated sample changers, in which case bracketing calibration verifications are utilized. If commercially available and economically feasible, the initial calibration check standard is prepared from a lot that is different from that used to prepare the calibration verification standards.
For the chemical analysis instruments, including the ICP-ES and ICP-MS, the instruments are checked after sample analysis has commenced for a specific workday with a continuing calibration verification standard or independent calibration standard. The SME determines at what point in the batch sequence the continuing calibration blank and calibration standard are analyzed.
M&TE is used for acceptance, calibration, measurement, gauging, testing, and/or inspection. SRNL M&TE is calibrated by the Savannah River Standards Laboratory (SRSL), which maintains ISO 17025 accreditation for numerous calibration methods. M&TE is calibrated at
Liquid Waste Tank Residuals Sampling- SRR-CWDA-2011-00117 Quality Assurance Program Plan Revision 1 July 2013
Page 77 of 99
prescribed intervals and is labeled with an equipment identification number and the expiration date for the calibration.
SRNL balances are calibrated annually by SRSL. At the time the calibration certificate is issued, the balance is labeled with its M&TE identification number, date of calibration, date of next calibration due, and identification of the metrologist performing the calibration.
American Society for Testing and Materials Class 1 weights are used for calibration verification before use on each working day the balance will be in operation. Weights are calibrated either annually, or, in the case of weights used in radiological containment units or the shielded cells, assigned a three year expiration date, at which time the weights are discarded. At the time of calibration, the weight set is labeled with its M&TE identification number, date of calibration, date of next calibration due, and identification of the metrologist performing the calibration. The results of before-use balance checks are recorded either in a laboratory notebook or electronically.
Pipettes may be managed as M&TE or MS&E at the discretion of the SME. M&TE electronic pipettes are calibrated every six months, using purchased pipette calibration software. M&TE pipettes are verified with an accuracy check by weight on each working day the pipette is used. Tolerance limits for accuracy checks are standardized for commonly used verification volumes.
MS&E electronic pipettes are determined by the SME to demonstrate sufficient control within the measurement system. These pipettes are verified by the instrument recovery of the QC standards prepared with the pipette. Thermocouples and temperature controllers are calibrated by SRSL against a NIST-traceable standard at a frequency determined by the SME.
B7.2 Calibration Performance and Documentation
An instrument history log or file is maintained by the SME for analytical instrumentation. Detailed information on instrument maintenance is documented per the Technical Reference Procedure.
B7.3 Deficiency Resolution and Documentation
Deficiencies and resolution are described in B6.6.
B8 Inspection/Acceptance Requirements for Supplies and Consumables
Reference materials, such as vendor-supplied elemental standards (e.g., Cr, Fe, Hg, etc.) and radiochemical standards (e.g., Pu-236, Sr-90, etc.) used in SRNL are uniquely identified and of sufficient accuracy to meet the TTR requirements of the customer, SRR, and the requirements of 1Q Manual, Procedure 2-7. Suppliers are prequalified for procurement, and materials are inspected upon receipt to verify material traceability.
Reference materials are procured from external suppliers and are traceable to a national or international standard. Purchased reference materials require a Certificate of Analysis from the manufacturer, if available. For some radioanalytical methods, radionuclide reference materials are not available.
In the case of radioactive sources used in calibration, an allowance is made for the correction of the assigned value due to the half-life of the source.
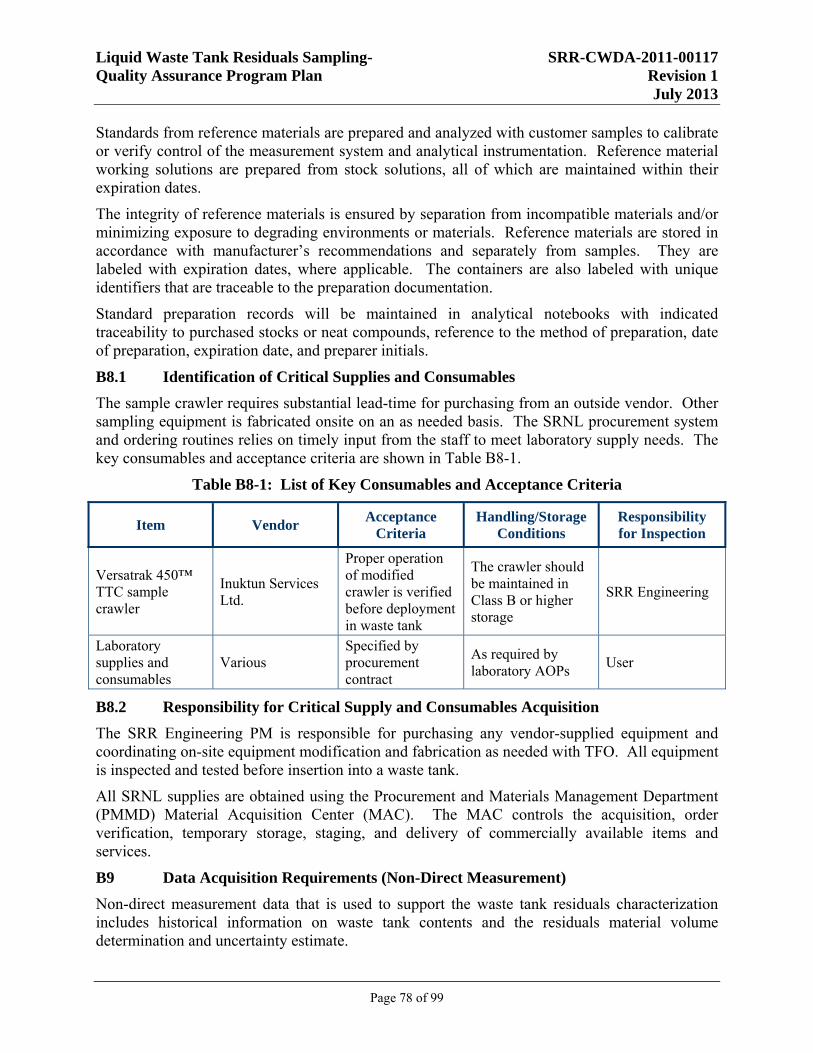
Liquid Waste Tank Residuals Sampling- SRR-CWDA-2011-00117 Quality Assurance Program Plan Revision 1 July 2013
Page 78 of 99
Standards from reference materials are prepared and analyzed with customer samples to calibrate or verify control of the measurement system and analytical instrumentation. Reference material working solutions are prepared from stock solutions, all of which are maintained within their expiration dates.
The integrity of reference materials is ensured by separation from incompatible materials and/or minimizing exposure to degrading environments or materials. Reference materials are stored in accordance with manufacturer’s recommendations and separately from samples. They are labeled with expiration dates, where applicable. The containers are also labeled with unique identifiers that are traceable to the preparation documentation.
Standard preparation records will be maintained in analytical notebooks with indicated traceability to purchased stocks or neat compounds, reference to the method of preparation, date of preparation, expiration date, and preparer initials.
B8.1 Identification of Critical Supplies and Consumables
The sample crawler requires substantial lead-time for purchasing from an outside vendor. Other sampling equipment is fabricated onsite on an as needed basis. The SRNL procurement system and ordering routines relies on timely input from the staff to meet laboratory supply needs. The key consumables and acceptance criteria are shown in Table B8-1.
Table B8-1: List of Key Consumables and Acceptance Criteria
Item Vendor Acceptance Criteria
Handling/Storage Conditions
Responsibility for Inspection
Versatrak 450™ TTC sample crawler
Inuktun Services Ltd.
Proper operation of modified crawler is verified before deployment in waste tank
The crawler should be maintained in Class B or higher storage
SRR Engineering
Laboratory supplies and consumables
Various Specified by procurement contract
As required by laboratory AOPs User
B8.2 Responsibility for Critical Supply and Consumables Acquisition
The SRR Engineering PM is responsible for purchasing any vendor-supplied equipment and coordinating on-site equipment modification and fabrication as needed with TFO. All equipment is inspected and tested before insertion into a waste tank.
All SRNL supplies are obtained using the Procurement and Materials Management Department (PMMD) Material Acquisition Center (MAC). The MAC controls the acquisition, order verification, temporary storage, staging, and delivery of commercially available items and services.
B9 Data Acquisition Requirements (Non-Direct Measurement)
Non-direct measurement data that is used to support the waste tank residuals characterization includes historical information on waste tank contents and the residuals material volume determination and uncertainty estimate.
Liquid Waste Tank Residuals Sampling- SRR-CWDA-2011-00117 Quality Assurance Program Plan Revision 1 July 2013
Page 79 of 99
B9.1 Identification of Data Sources
Historical data from the WCS, that tracks individual waste tank receipts and removals, was used to develop the waste tank inventories for the FTF/HTF PA modeling. The WCS gives a general accounting of the radionuclide and chemical inventory for a waste tank, at the time the system is updated. This data is used to develop the analyte list for waste tank-specific characterization.
After the agreement to temporarily cease waste removal has been reached, the residual material distribution and volume is determined by a trained team of SRR Engineering and C&WDA personnel. The height (thickness) of residuals material is estimated for waste tank floor areas and input into a Microsoft Excel spreadsheet that calculates the volume for that area. At the end of the mapping, the total volume is calculated. As part of the final volume determination, an uncertainty estimate for the volume is also developed as described in the Tank Mapping Methodology. [SRR-LWE-2010-00240] The volume uncertainty estimate is also incorporated into the composite sample creation as described in Appendix A of the LWTRSAPP. [SRR-CWDA-2011-00050]
B9.2 Intended Use of Information and Selection Rationale
The general waste tank radionuclide and chemical inventory from the WCS is used to develop the analyte list for tank-specific characterizations. This allows the analyte list to be tailored for the expected residuals material constituents.
The residuals mapping and volume determination is necessary to implement the sampling plan design, described in Section 4 of the LWTRSAPP, in order to representatively characterize the residual materials. The final volume determination and uncertainty estimate are used to determine the analytical sample compositing instructions as described in Appendix A of the LWTRSAPP. [SRR-CWDA-2011-00050]
The analyte measurements, residual volume determination, and uncertainty estimate are the key inputs used to establish the actual individual waste tank inventory. That inventory is then compared to the inventory used in the respective tank farm PA by way of an (SA).
B9.3 Data Acceptance Criteria
The chemical and radionuclide data from the WCS are used only to develop the waste tank-specific analyte lists. The concentrations in the WCS are not specific enough to be used for final residual material characterization.
The preliminary residual volume estimate is subsequently reviewed by the SRR Engineering and C&WDA mapping team engineers. Using additional photographic evidence collected with the crawler camera during waste tank sampling, residual material areas are re-evaluated until all parties are in agreement on the final volume, and a final volume determination report is issued. As part of the review process, the uncertainty associated with the mapping process is estimated as described in the Tank Mapping Methodology report. [SRR-LWE-2010-00240] The uncertainty in the volume estimate is incorporated into the composite sample creation as described in Appendix A of the LWTRSAPP. [SRR-CWDA-2011-00050]
B9.4 Identification of Key Resources/Support Facilities Needed
Key resources for sampling the waste tank residuals include:
Liquid Waste Tank Residuals Sampling- SRR-CWDA-2011-00117 Quality Assurance Program Plan Revision 1 July 2013
Page 80 of 99
Trained personnel from SRR Engineering and C&WDA for residual material mapping, volume determination, and uncertainty estimation
Experienced personnel from SRR Engineering and C&WDA for sampling plan design Personnel from TFO to construct, procure, and/or modify sampling equipment to collect
the residual materials for analysis Personnel from TFO to operate the specialized sampling equipment (i.e., crawler) for
material collection, transfer the samples from the waste tank to shipping containers, and transport the containers to the SCO
Trained personnel from RadCon for screening materials and personnel involved with sample collection, transfer, and transport
The SCO facility where the sample shipping containers are received and opened, and staff that open the actual sample containers to initially process the sample material
Trained laboratory staff that perform the chemical and radiological analyses and verify the analytical data
Data quality assessors to evaluate the usability of the data for project decisions
B10 Data Management
None of the data collected or generated is for informational purposes. All of the data is necessary to determine the final waste tank residuals inventory.
B10.1 Describe Data Management Scheme
The data management scheme for waste tank residuals sampling and analysis is shown in Figure B10-1. The preliminary residual volume estimate and distribution is used as the basis to design the sampling plan and generate the TSAP, TTR, and subsequently the TTQAP. The samples are collected and locations documented. Sample transport to, and receipt at the laboratory, is tracked using SRS transportation records and a COC. The final residuals volume and uncertainty estimate is used to generate the compositing instructions for the samples which are incorporated into TTR and TTQAP revisions. The laboratory data is reviewed and verified. In some cases, the laboratory may not be able to meet a requested detection limit, and SRR Engineering and C&WDA will document the acceptance of that data. In the case of other acceptance criteria issues, a reanalysis using additional experimental process development may be necessary. When all data issues have been resolved, and the data verified, the laboratory will issue a Sample Analysis Report.
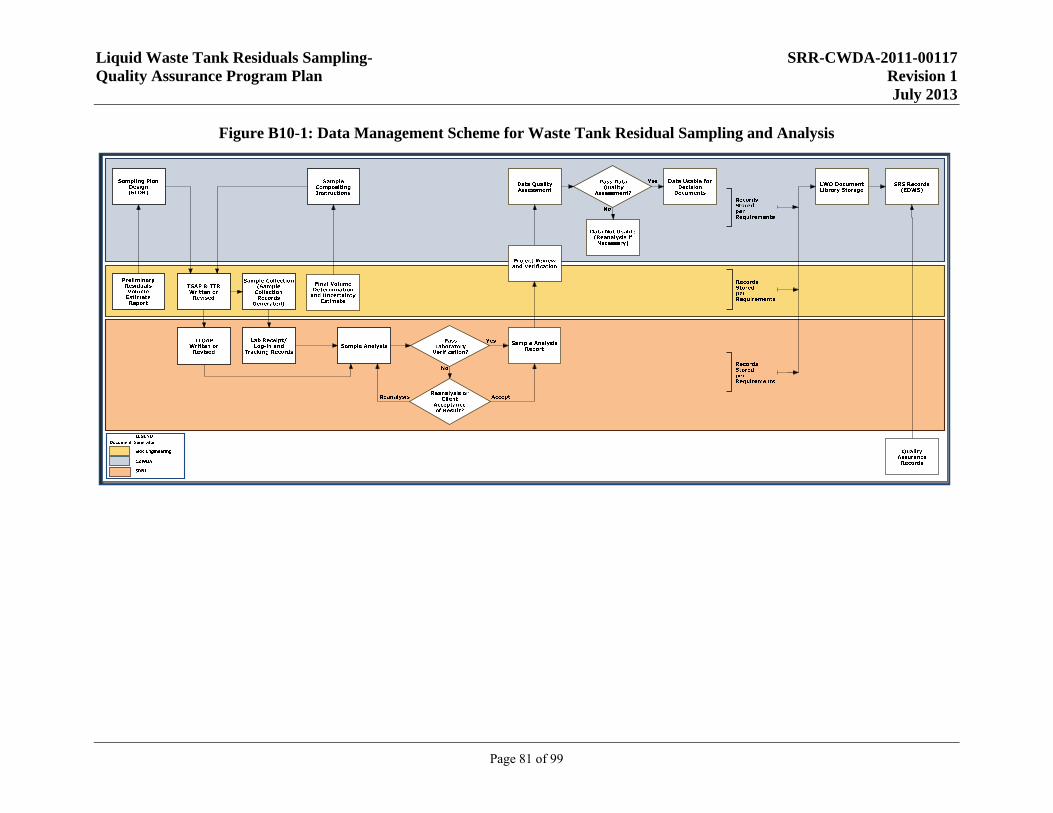
Liquid Waste Tank Residuals Sampling- SRR-CWDA-2011-00117 Quality Assurance Program Plan Revision 1 July 2013
Page 81 of 99
Figure B10-1: Data Management Scheme for Waste Tank Residual Sampling and Analysis
Liquid Waste Tank Residuals Sampling- SRR-CWDA-2011-00117 Quality Assurance Program Plan Revision 1 July 2013
Page 82 of 99
Laboratory records documenting the sample preparation and analyses will be stored and maintained per the requirements of 1B Manual Procedure 3.31, Records Management. Laboratory records are stored and retained as described in Section A9.4.
SRR Engineering and C&WDA will review the sample results. C&WDA will perform a DQA to determine the data usability. If the data is determined to be unusable, a reanalysis may be requested or other alternatives to resolve the issue will be explored. When all data issues have been resolved, C&WDA will use the data in decision documents.
SRNL QA records will be processed in accordance with 1Q Manual, Procedure 17-1, Quality Assurance Records Management. SRR QA records will be processed in accordance with 1Q Manual, Procedure 17-1Q, Quality Assurance Records Management.
B10.2 Standard Record-Keeping Practices and Document Control System
The roles and responsibilities for field and laboratory records that implement and document the residuals characterization are presented in Figure B10-2.
SRNL maintains written and electronic documentation needed to support analytical results by several means. This documentation includes laboratory notebooks and logbooks, R&D directions, sample submission forms, instrument data sheets, and control charts. Analytical and sample preparation methods used for each sample are documented. All analytical results reported to SRR are stored electronically in the AD LIMS system, which is backed up regularly. Written records generated are legible and made with indelible ink. Records are stored and retained as described in Section A9.4.
B10.3 Data Handling Equipment/Procedures
SRR uses a Lotus Notes-based system to store electronic copies of documents in the LWO Document Library. Records are scanned and input into the system and linked using standardized menu-based classification criteria for archiving and searching. SRR is also compiling a TCW as part of the LWO Document Library. The TCW is an inventory of the documents related to the overall waste tank closure program and includes individual waste tank closure documents.
Certain record types are also electronically transferred to the EDWS system for storage and retention. EDWS is a custom application built on the Documentum Platform and is used to manage records for SRS. It is maintained by Information Technology Services according to the 12B1 Manual, Information Technologies Policies, Procedures, Standards, and Guidelines, which requires the routine preventative and regular maintenance on the component of an information system. EDWS is a Class C application available 24/7 and is mirrored to another site server to ensure backup in a disaster recovery scenario. Prior to the final transfer of records into EDWS, the classification and other indexing criteria are validated.
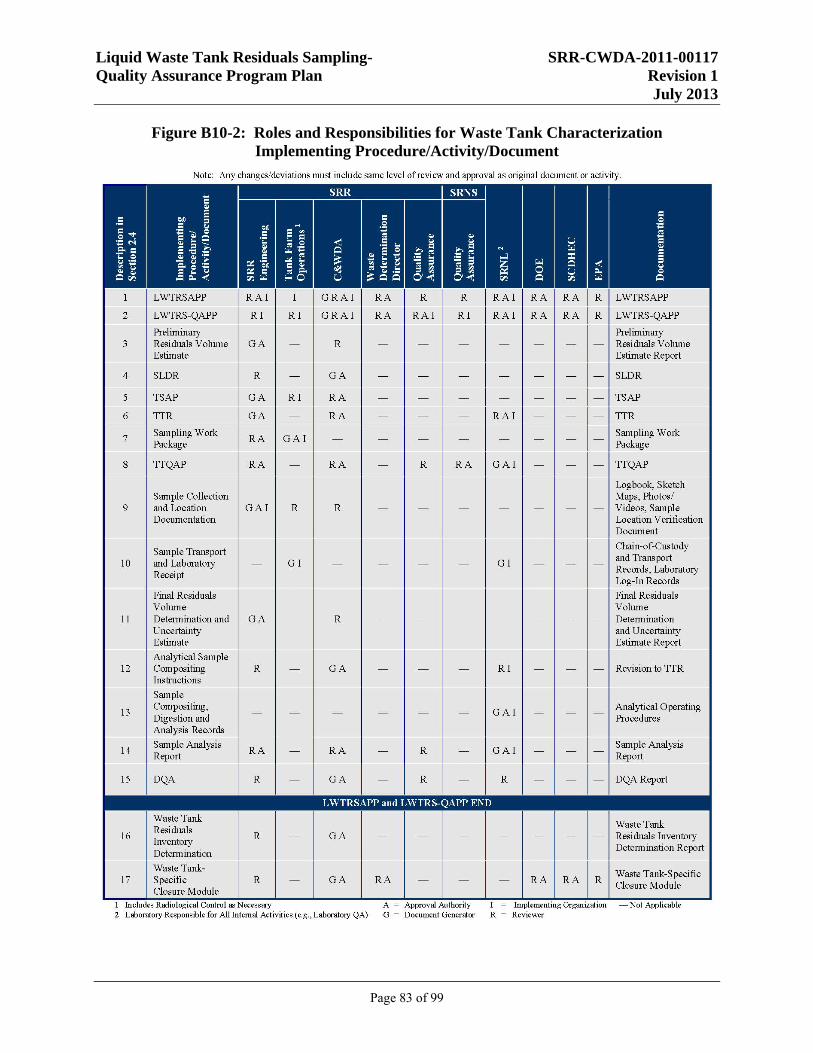
Liquid Waste Tank Residuals Sampling- SRR-CWDA-2011-00117 Quality Assurance Program Plan Revision 1 July 2013
Page 83 of 99
Figure B10-2: Roles and Responsibilities for Waste Tank Characterization Implementing Procedure/Activity/Document
Liquid Waste Tank Residuals Sampling- SRR-CWDA-2011-00117 Quality Assurance Program Plan Revision 1 July 2013
Page 84 of 99
SRNL utilizes two electronic databases to manage the information associated with samples. The first is a customized Filemaker Pro Sample Management database designed to allow customers to generate a travel copy, which provides a variety of parameters including sample identification, the requested analytical methods, sample hazards, turnaround time requirements, and initial weight and final volume of any digested samples. The database tracks the location of the sample at all times within AD lab modules and documents how and when the sample residue is disposed.
The second database is an Oracle Structured Query Language (SQL) LIMS system which has features commonly found in other laboratory LIMS systems. Via an electronic link with the Sample Management database, the LIMS is able to capture relevant customer information about the sample without data re-entry. The LIMS is the official repository for the measurements on the individual aliquots for each of the analytical methods. The LIMS contains a cross reference to the laboratory notebook that contains the R&D directions used to prepare samples for a method. For radiochemical and chemical analyses, a packet containing the R&D directions, preparation sheets, instrument printouts, spreadsheet identification, and traceability to all instruments utilized for the analysis (e.g., pipettes, balances, counting instruments) is prepared to support the Sample Analysis Report, data verification, data validation, and DQA.
The LIMS software in use has been developed in accordance with ISO 9001 quality system guidelines. Each LIMS user is required to sign on with a unique username and password. The AD organization appoints a LIMS Manager who is responsible for the management of the LIMS software. The LIMS Manager also executes appropriate updates and revisions to the LIMS software in accordance with AD procedures and maintains a service contract with the software vendor.
AD sample results are entered into the LIMS system either manually or using an automated results entry program. As each result is entered, an automated routine sends an electronic message to forward the data to the identified customer. Any subsequent change to a LIMS result generates an audit trail entry, documenting the reason for the change.
Analytical calculations are performed using spreadsheets which are governed by ADS-WI00023, Spreadsheet Quality Control for Analytical Development Section. Spreadsheets used repeatedly containing calculations that do not change are created and assigned a revision number. The calculation cells are protected (locked) or results are verified by an alternate calculation. The spreadsheet is validated using test data or hand calculations performed by a CTF familiar with the subject matter to ensure the correct result is obtained when the spreadsheet is used. The spreadsheet validation is documented in writing. Any changes to the spreadsheet are performed by the CTF or a designee and documented by the CTF or a designee.
Single-use spreadsheets are often utilized because of the varying types of calculations required with many of the analytical methods. Single-use spreadsheets are controlled as follows.
The CTF reviews and verifies all calculations, and signs and dates the printed spreadsheet containing the calculations
The spreadsheet, and the calculations, are then peer reviewed by a SME who signs and dates the printed spreadsheet
Liquid Waste Tank Residuals Sampling- SRR-CWDA-2011-00117 Quality Assurance Program Plan Revision 1 July 2013
Page 85 of 99
Reference data may be used to verify correct spreadsheet operation and output and to check for transcription and transformation errors
Data outputs to the Sample Analysis Report are reviewed and verified as described in Section A9.2.
B10.4 Responsibility for Data Management
Data management consists of compiling and controlling the data generated during the waste tank residuals sampling and analysis effort. All data is reviewed by the responsible SRR Engineering PL or SRNL PL for completeness and accuracy before use, distribution, or storage.
Records are managed using the processes in accordance with existing SRS/SRR site-wide requirements as described in 1B Manual, Procedure 3.31, Records Management. SRNL QA records will be processed in accordance with 1Q Manual, Procedure 17-1, Quality Assurance Records Management. SRR QA records will be processed in accordance with 1Q Manual, Procedure 17-1Q, Quality Assurance Records Management. Preparation and processing of any controlled documents required is in accordance with 1B Manual, Procedure 3.32, Document Control. Additional details are presented in Section D.
B10.5 Process for Data Archiving and Retrieval
C&WDA receives the SRR Engineering and SRNL Records Completeness Checklists. The C&WDA CPC will review them and complete the C&WDA Records Completeness Checklist. The C&WDA Records Custodian will scan and enter all three checklists into the LWO Document Library as part of the TCW.
SRNL is responsible for compiling and storing the laboratory analytical records and documentation associated with the sample analysis per SRS requirements and their records control procedures. SRNL will also provide data verification checklists that will document the analytical data review and identify applicable LIMS numbers should it be necessary to recover the underlying analytical information.
B10.6 Hardware and Software Configuration Acceptability
SRS maintains the EDWS system described in Section B10.3 in accordance with the requirements of DOE Order 200.1A, Information Management Program, and DOE Order 243.1A, Records Management Program.
In addition to EDWS, SRR uses the LWO Document Library to store and access records necessary to support the waste tank removals from service. The LWO Document Library is a Lotus Notes-based system and records are input as electronic files. Records required by contract for long-term storage are automatically forwarded to the EDWS.
SRNL utilizes a LIMS designed to store data about customer samples and the tests performed on them. The LIMS software in use has been developed in accordance with ISO 9001 quality system guidelines. Each LIMS user is required to sign on with a unique username and password. The AD organization appoints a LIMS Manager who maintains responsibility for the management of the LIMS software. The LIMS Manager also executes appropriate updates and revisions to the LIMS software in accordance with AD procedures and maintains a service contract with the software vendor.
Liquid Waste Tank Residuals Sampling- SRR-CWDA-2011-00117 Quality Assurance Program Plan Revision 1 July 2013
Page 86 of 99
LIMS data may be output in a variety of customer reports utilizing various query options. The LIMS data is stored on a secure server and is regularly backed up on electronic storage media.
AD sample results are entered into the LIMS either manually or using an automated results entry program. As each result is entered into LIMS, an automated routine spawns an electronic message to forward the data to the identified customer. Any subsequent change to a LIMS result generates an audit trail entry, documenting the reason for the change.
B10.7 Data Management Checklists and Forms
The records generated to support the waste tank residuals sampling are shown on Figure B10-2. Records completeness checklists to support the waste tank sampling and analysis are provided as Attachment 4.
Liquid Waste Tank Residuals Sampling- SRR-CWDA-2011-00117 Quality Assurance Program Plan Revision 1 July 2013
Page 87 of 99
SECTION C ASSESSMENT AND OVERSIGHT
C1 Assessment and Response Actions
Table C1-1 lists the types of assessment activities conducted and the approximate frequency. The table also identifies the individual(s) or organizations responsible for conducting assessments, other possible participants in the assessment process, describes how and to whom assessment information will be reported, and identifies the authority ultimately responsible for the implementation of CAs. The assessments are all independent assessments - conducted by organizations/personnel that are not directly responsible for performance of the work.
Issues identified during assessment and oversight activities are identified, documented, and managed to resolution according to the SRS CA Program, 1B Manual, Procedure 4.23, Corrective Action Program, using the Site Tracking, Analysis, and Reporting (STAR) database. Verification of CAs to prevent recurrence is performed by QA. The CA Program (American Society of Mechanical Engineers [ASME] NQA-1-2008 with 2009 addendum compliant) manages issues in a tailored manner based on the significance of the issue and includes the following elements:
Issue identification Significance determination Issue evaluation CA development CA closure verification CA effectiveness review
If the situation so warrants, a “Stop Work” may be issued by QA. The situation is investigated by the appropriate organization and resolved using 1B Manual, Procedure 4.23 before the stop work is closed by QA and work is allowed to resume.
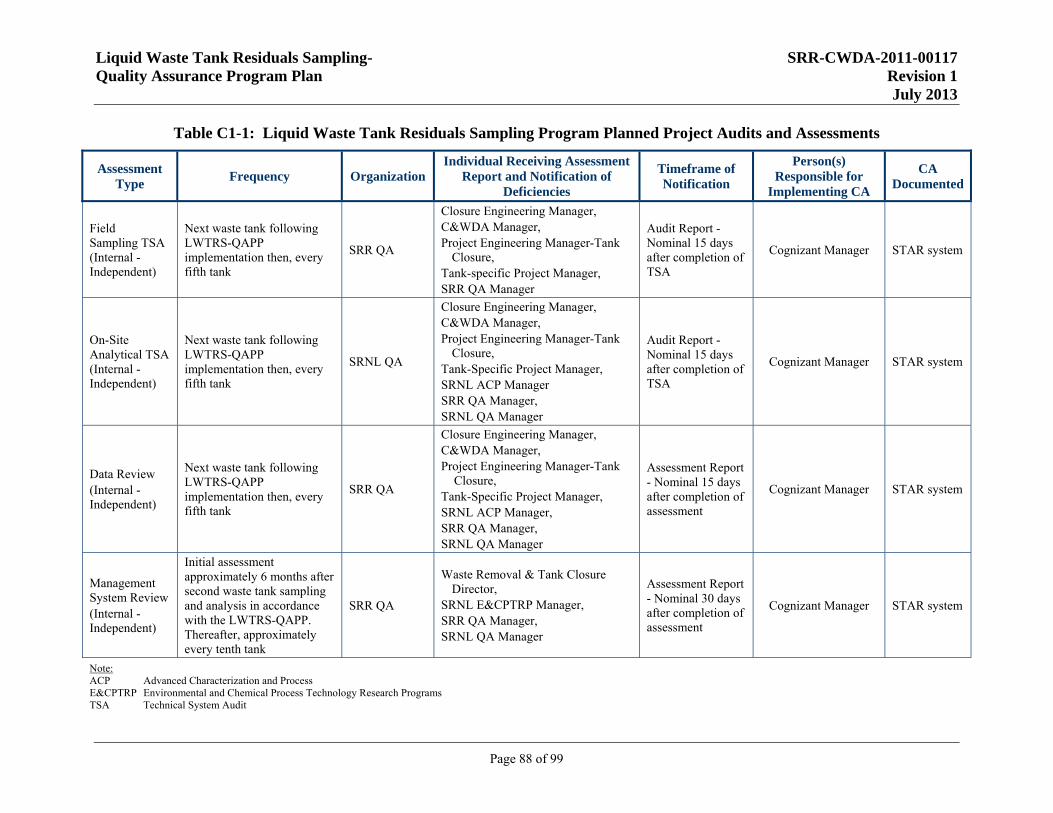
Liquid Waste Tank Residuals Sampling- SRR-CWDA-2011-00117 Quality Assurance Program Plan Revision 1 July 2013
Page 88 of 99
Table C1-1: Liquid Waste Tank Residuals Sampling Program Planned Project Audits and Assessments
Assessment Type
Frequency Organization Individual Receiving Assessment
Report and Notification of Deficiencies
Timeframe of Notification
Person(s) Responsible for
Implementing CA
CA Documented
Field Sampling TSA (Internal - Independent)
Next waste tank following LWTRS-QAPP implementation then, every fifth tank
SRR QA
Closure Engineering Manager, C&WDA Manager, Project Engineering Manager-Tank
Closure, Tank-specific Project Manager, SRR QA Manager
Audit Report - Nominal 15 days after completion of TSA
Cognizant Manager STAR system
On-Site Analytical TSA (Internal - Independent)
Next waste tank following LWTRS-QAPP implementation then, every fifth tank
SRNL QA
Closure Engineering Manager, C&WDA Manager, Project Engineering Manager-Tank
Closure, Tank-Specific Project Manager, SRNL ACP Manager SRR QA Manager, SRNL QA Manager
Audit Report - Nominal 15 days after completion of TSA
Cognizant Manager STAR system
Data Review (Internal - Independent)
Next waste tank following LWTRS-QAPP implementation then, every fifth tank
SRR QA
Closure Engineering Manager, C&WDA Manager, Project Engineering Manager-Tank
Closure, Tank-Specific Project Manager, SRNL ACP Manager, SRR QA Manager, SRNL QA Manager
Assessment Report - Nominal 15 days after completion of assessment
Cognizant Manager STAR system
Management System Review (Internal - Independent)
Initial assessment approximately 6 months after second waste tank sampling and analysis in accordance with the LWTRS-QAPP. Thereafter, approximately every tenth tank
SRR QA
Waste Removal & Tank Closure Director,
SRNL E&CPTRP Manager, SRR QA Manager, SRNL QA Manager
Assessment Report - Nominal 30 days after completion of assessment
Cognizant Manager STAR system
Note: ACP Advanced Characterization and Process E&CPTRP Environmental and Chemical Process Technology Research Programs TSA Technical System Audit
Liquid Waste Tank Residuals Sampling- SRR-CWDA-2011-00117 Quality Assurance Program Plan Revision 1 July 2013
Page 89 of 99
Types of Assessments and Audits
The types and frequencies of assessments and audits specified in Table C1-1 will be performed and continue throughout the duration of the waste tank residuals sampling program.
Readiness Review
A Readiness Review is not applicable to the waste tank residuals sampling as it does not represent startup or continued use of a facility, process, or activity, and it is not an initial startup or recovery/return to service project. Waste tank sampling and sample analysis are not new activities for the SRS. Periodic assessments of specific tasks for Liquid Waste Tank Residuals Sampling (LWTRS) will be addressed in other assessment types.
Field Sampling Technical System Audit (TSA)
A TSA of the field activities will be performed to assess conformance with the LWTRSAPP and LWTRS-QAPP for field activities related to waste tank residual mapping and volume determination, sample location determination, sample collection, and sample handling through shipment to the SCO facility.
On-Site Analytical TSA
A TSA of SRNL analytical procedures will be performed during which M&TE, personnel qualification and training, analytical methods and procedures, general laboratory procedures, sample handling and tracking, data reporting, data handling and management, data control, and data review procedures will be checked for conformance with the LWTRS-QAPP.
Off-Site Laboratory TSA
Not applicable to LWTRS. No off-site laboratory support will be used due to the high activity and unique nature of the waste tank residual samples. If off-site laboratory capability becomes possible, a TSA will be conducted to check for conformance with the LWTRS-QAPP.
Split Sampling and Analysis Audit
Not applicable to LWTRS. Due to the high activity and unique nature of the waste tank residuals samples, it is not possible to send split samples to an off-site laboratory for independent analysis. If off-site laboratory capability becomes possible, a split sampling and analysis audit may be conducted.
Performance Test Sample Tracking and Analysis
Not applicable to LWTRS. There is no performance evaluation program for the unique high-activity waste solids matrices found in SRS waste tanks. Performance test sample analyses routinely performed by SRNL for participation in other programs are described in Section B5.2.
Data Review
An assessment will be performed of the data review process, including a review of the sample analysis data verification, sampling and analysis data validation (when performed), and data quality (usability) assessment steps, to ensure that the process conforms to the procedures specified in the LWTRS-QAPP and is effective.
Liquid Waste Tank Residuals Sampling- SRR-CWDA-2011-00117 Quality Assurance Program Plan Revision 1 July 2013
Page 90 of 99
Management System Reviews
Management system reviews are performed to ensure the effectiveness of the structure, plans, and procedures related to quality.
C2 Reports to Management
The results of the assessments and audits identified in Table C1-1 are documented by the organization performing the assessment. Assessment report copies that include a description of any identified deficiency are distributed as identified in Table C1-1. The organization performing the assessment will initiate a STAR item for any identified issue or opportunity for improvement in accordance with 1B Manual, Procedure 4.23, Corrective Action Program, as described in C1.
Detailed integrated schedules are maintained on residual waste sampling and analysis and related activities to remove waste tanks from service. Schedules are reviewed weekly with SRR and SRNS management. The status updates include, but are not limited to:
Schedule performance Results for previous activities Planned activities Problems Status of any CAs
Liquid Waste Tank Residuals Sampling- SRR-CWDA-2011-00117 Quality Assurance Program Plan Revision 1 July 2013
Page 91 of 99
SECTION D DATA VERIFICATION AND USABILITY
Waste tank residuals characterization relies on data generated during the sample planning and collection activities. The data for these activities is documented in reports and is verified as part of the report generation and approval process. The laboratory data verification takes place during, and after, sample analyses are complete in order to substantiate that the data are known and of sufficient quality to support waste tank removal from service decisions. Data are considered known when all components associated with the generation are thoroughly documented, and such documentation is verifiable and defensible. The DQA evaluates the analytical data and data generated in earlier waste tank characterization steps to determine if the DQOs have been met.
Roles and responsibilities for document generation, reviews, and approvals are described in Section 2.4 of the LWTRSAPP and shown on Figure B10-2.
D1 Data Review and Verification
Sample Planning and Collection Data
Table D1-1 shows the data that are verified as part of the sample planning and collection process for residuals characterization.
Laboratory Analytical Data
The general data that are reviewed and verified by SRNL as part of the sample analysis phase are listed in Table D1-1.
SRNL verifies 100% of the analytical results through internal reviews to ensure completeness, correctness, and conformance/compliance of each data set against the method or procedural specifications. As appropriate, the analytical data are entered into data reduction spreadsheets by a qualified laboratory professional who reviews batch QC samples for acceptable results. The data are then verified for completeness and correctness by an independent qualified laboratory professional prior to reporting to the SRNL PL. Using data verification checklists, the laboratory staff evaluates each specific data set to determine its conformance with the DQIs, MPCs, and other criteria listed in Section A7. Any anomalies, QC problems, or other analytical issues that could affect data quality are noted and discussed in the case narrative section of the data verification checklists.
A statistician from the Applied Computational Engineering and Statistics section of SRNL performs a simple statistical analysis on the data to identify outliers, calculate the sample mean and standard deviations of the composite sample concentrations and the 95% upper confidence limit for the true mean concentrations when there are measurements above the detection limits. Tests for heterogeneity of the measurement variances are also performed if there are enough measurements above the MDCs or MDAs.
The SRNL PL examines the data to ensure that the requested analytes are reported and were analyzed according to the requirements of the LWTRS-QAPP, TTR and TTQAP. QC data are examined for completeness and adherence to the DQI and MPC. This review also evaluates
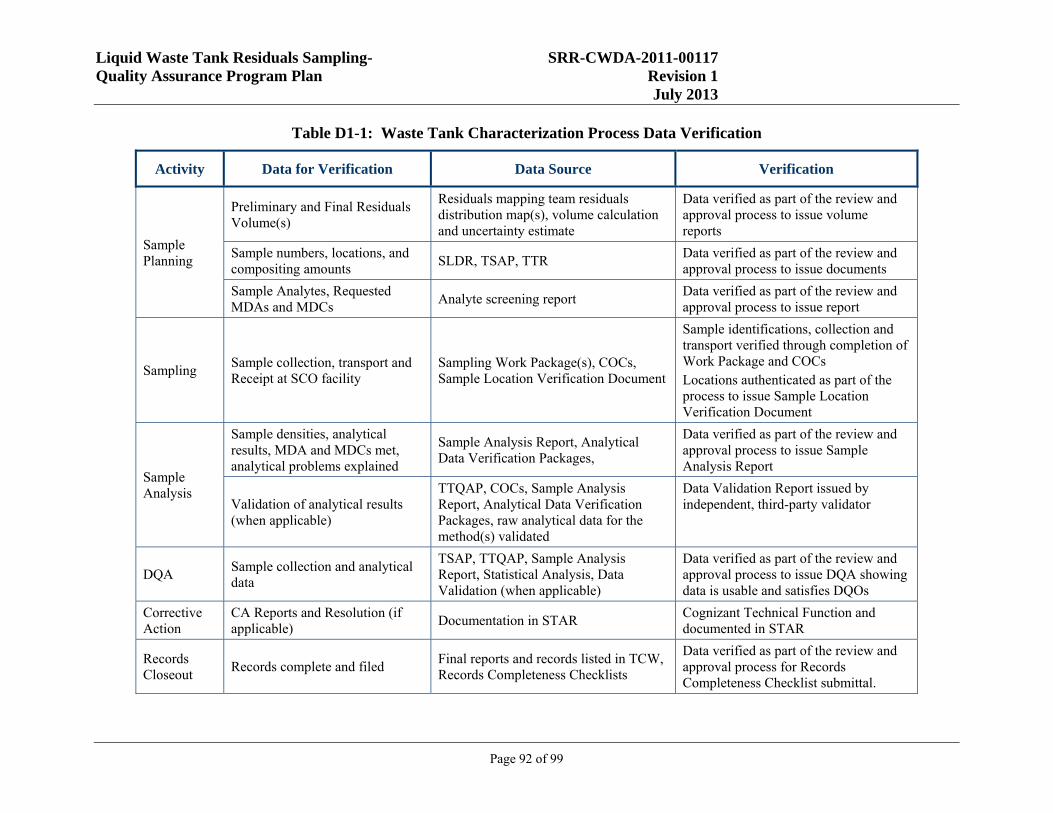
Liquid Waste Tank Residuals Sampling- SRR-CWDA-2011-00117 Quality Assurance Program Plan Revision 1 July 2013
Page 92 of 99
Table D1-1: Waste Tank Characterization Process Data Verification
Activity Data for Verification Data Source Verification
Sample Planning
Preliminary and Final Residuals Volume(s)
Residuals mapping team residuals distribution map(s), volume calculation and uncertainty estimate
Data verified as part of the review and approval process to issue volume reports
Sample numbers, locations, and compositing amounts
SLDR, TSAP, TTR Data verified as part of the review and approval process to issue documents
Sample Analytes, Requested MDAs and MDCs
Analyte screening report Data verified as part of the review and approval process to issue report
Sampling Sample collection, transport and Receipt at SCO facility
Sampling Work Package(s), COCs, Sample Location Verification Document
Sample identifications, collection and transport verified through completion of Work Package and COCs Locations authenticated as part of the process to issue Sample Location Verification Document
Sample Analysis
Sample densities, analytical results, MDA and MDCs met, analytical problems explained
Sample Analysis Report, Analytical Data Verification Packages,
Data verified as part of the review and approval process to issue Sample Analysis Report
Validation of analytical results (when applicable)
TTQAP, COCs, Sample Analysis Report, Analytical Data Verification Packages, raw analytical data for the method(s) validated
Data Validation Report issued by independent, third-party validator
DQA Sample collection and analytical data
TSAP, TTQAP, Sample Analysis Report, Statistical Analysis, Data Validation (when applicable)
Data verified as part of the review and approval process to issue DQA showing data is usable and satisfies DQOs
Corrective Action
CA Reports and Resolution (if applicable)
Documentation in STAR Cognizant Technical Function and documented in STAR
Records Closeout
Records complete and filed Final reports and records listed in TCW, Records Completeness Checklists
Data verified as part of the review and approval process for Records Completeness Checklist submittal.
Liquid Waste Tank Residuals Sampling- SRR-CWDA-2011-00117 Quality Assurance Program Plan Revision 1 July 2013
Page 93 of 99
any actions that were taken when the analysis QC did not meet the LWTRS-QAPP or analytical method requirements. The SRNL PL is responsible for ensuring that data verification is completed and that the QC requirements were met. Any analytical data failing to meet the requirements of the LWTRS-QAPP will be discussed in the Sample Analysis Report case narrative. The SRNL PL coordinates and reviews the final sample analysis report, data verification checklists, and other documentation associated with sample characterization.
The data quality assessor reviews the analytical data verification checklists and case narrative for a discussion of any anomalies or QC problems occurring during the analyses. Depending on the nature of any problems identified, an independent data validation going back to the raw data may be necessary to identify the source of the problem. The verification decision and/or validation finding is documented and evaluated as part of the DQA.
Records management is described in Section A9.4 and is conducted in accordance with 1B Manual, Procedure 3.31, Records Management.
The laboratory data verification checklists identify the analytical requirements reviewed to ensure consistency for the life of the project. These checklists are provided as Attachment 3.
D2 Data Validation and Verification Methods
The process for data verification is described in Section D1. The process for data validation is described below.
D2.1 Process for Laboratory Data Validation
For the Liquid Waste Tank Residuals Sampling Program, data validation will be performed on every tenth waste tank following Tank 6 for a limited suite of radionuclides and chemicals similar to the validation performed for the Tanks 5 and 6 Data Quality Summary Report. [SRR-CWDA-2012-00114] The choice of analytes validated will be determined at the time of validation but will include at least four radionuclides from the HRR list and one metal. Validation may also be performed if significant anomalies are discovered during the data verification or DQA steps. Validation will be performed by an independent evaluator. For data validation, the “independent evaluator” is defined as a person not directly involved in the data generation (either laboratory analysis or data verification steps), the DQA, or data end use steps.
When data validation is performed, it will use data validation protocols and checklists developed specifically for this waste tank residuals sampling program. The protocols and checklists are currently under revision and will be provided as Attachment 5 in a future LWTRS-QAPP update.
The data validation will include a check on:
Completeness of the data Proper sample collection documentation and transport procedures, including COC Documentation of sample material compositing and preparation for analyses Documentation of the required QC measures during analyses Documentation of all analytical results and verification Traceability of the analytical data generated in the Sample Analysis Report to specific
waste tank sample locations
Liquid Waste Tank Residuals Sampling- SRR-CWDA-2011-00117 Quality Assurance Program Plan Revision 1 July 2013
Page 94 of 99
If any apparent data anomalies or departures from the LWTRS-QAPP requirements are identified during the data verification or DQA processes, they will be evaluated, and corrected if practicable, or evaluated for impact on data usability. Data validation may be performed and the validation report will be distributed to the organizations involved and to the data quality assessor.
D2.2 Responsibilities for Verifying and Validating Project Data
Data verification is the responsibility of the organizations involved with the residuals characterization as described in Section D1.
The laboratory data validation will be performed by an independent evaluator not involved with data generation, the DQA, or data end use. The validator will be identified in the DQA.
Completion of the final characterization data compilation, documented by review of the respective Records Completeness Checklists, is the responsibility of the C&WDA CPC.
D2.3 Identify Issue Resolution Process
Any problems, errors, or omissions discovered during the data verification by the organization involved will be transmitted verbally or by e-mail to the respective PM, and if impactive of the data, to the data quality assessor. The respective PL will be responsible for taking appropriate actions to resolve the issue.
If a data validation is performed, any problems discovered will be transmitted verbally or by e-mail by the validator to the SRR Engineering and SRNL PLs and to the data quality assessor. Additional information or clarification may be requested to resolve the issue. The final validation report will be sent to the SRR Engineering and SRNL PLs, and the data quality assessor. Preliminary results may also be transmitted by email or by phone in advance of the final validation report. The data qualifiers used will be based on those in the EPA functional guidelines for data validation.
D2.4 Identify Checklists, Forms and Calculations
The basic records necessary to document residuals sampling and analysis are presented in Figure B10-2. Attachment 3 contains the laboratory analytical data verification checklists. Attachment 4 contains the SRNL, SRR Engineering, and C&WDA Records Completeness Checklists. The data validation protocols and validation checklists are under revision and will be provided as Attachment 5 in a future LWTRS-QAPP update.
D3 Reconciliation with User Requirements
D3.1 Procedures to Evaluate the Usability of the Data
The respective PLs shall ensure that the data collected is sufficient to address the DQOs to characterize the waste tank residuals material. This includes the data verification and any data validation. The DQA is part of this evaluation. The DQA discusses and evaluates the impacts of any sampling problems, any CAs, any analytical results that appear to be anomalous, and the possible impacts on the usability of the data. Because of the nature of the project, all analytical data is expected to be of the same quality and will be used. Any unexpected or additional uncertainties will be accounted for in the final data use.
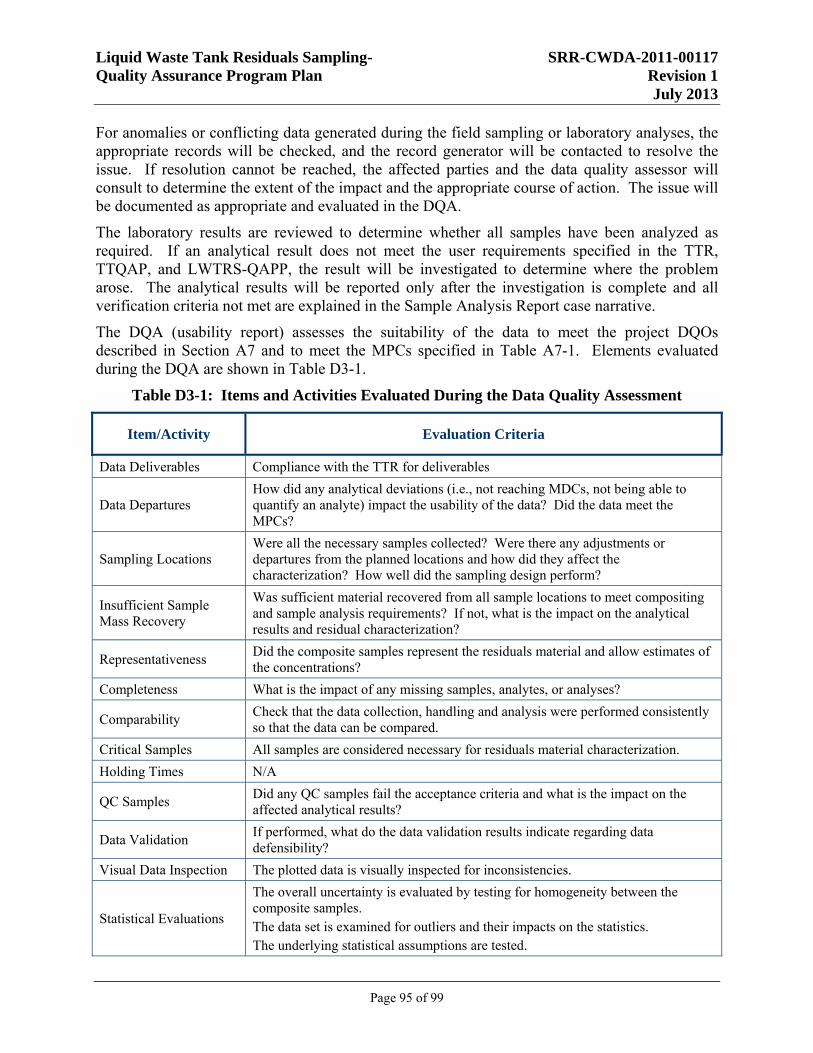
Liquid Waste Tank Residuals Sampling- SRR-CWDA-2011-00117 Quality Assurance Program Plan Revision 1 July 2013
Page 95 of 99
For anomalies or conflicting data generated during the field sampling or laboratory analyses, the appropriate records will be checked, and the record generator will be contacted to resolve the issue. If resolution cannot be reached, the affected parties and the data quality assessor will consult to determine the extent of the impact and the appropriate course of action. The issue will be documented as appropriate and evaluated in the DQA.
The laboratory results are reviewed to determine whether all samples have been analyzed as required. If an analytical result does not meet the user requirements specified in the TTR, TTQAP, and LWTRS-QAPP, the result will be investigated to determine where the problem arose. The analytical results will be reported only after the investigation is complete and all verification criteria not met are explained in the Sample Analysis Report case narrative.
The DQA (usability report) assesses the suitability of the data to meet the project DQOs described in Section A7 and to meet the MPCs specified in Table A7-1. Elements evaluated during the DQA are shown in Table D3-1.
Table D3-1: Items and Activities Evaluated During the Data Quality Assessment
Item/Activity Evaluation Criteria
Data Deliverables Compliance with the TTR for deliverables
Data Departures How did any analytical deviations (i.e., not reaching MDCs, not being able to quantify an analyte) impact the usability of the data? Did the data meet the MPCs?
Sampling Locations Were all the necessary samples collected? Were there any adjustments or departures from the planned locations and how did they affect the characterization? How well did the sampling design perform?
Insufficient Sample Mass Recovery
Was sufficient material recovered from all sample locations to meet compositing and sample analysis requirements? If not, what is the impact on the analytical results and residual characterization?
Representativeness Did the composite samples represent the residuals material and allow estimates of the concentrations?
Completeness What is the impact of any missing samples, analytes, or analyses?
Comparability Check that the data collection, handling and analysis were performed consistently so that the data can be compared.
Critical Samples All samples are considered necessary for residuals material characterization.
Holding Times N/A
QC Samples Did any QC samples fail the acceptance criteria and what is the impact on the affected analytical results?
Data Validation If performed, what do the data validation results indicate regarding data defensibility?
Visual Data Inspection The plotted data is visually inspected for inconsistencies.
Statistical Evaluations
The overall uncertainty is evaluated by testing for homogeneity between the composite samples. The data set is examined for outliers and their impacts on the statistics. The underlying statistical assumptions are tested.
Liquid Waste Tank Residuals Sampling- SRR-CWDA-2011-00117 Quality Assurance Program Plan Revision 1 July 2013
Page 96 of 99
Data Restrictions Describes how any data that does not meet the MPCs will be handled.
Usability Decision Discusses how data may or may not be sufficient for use in the decision-making process (i.e., inventory determination).
Usability Summary Discusses and compares overall precision, accuracy/bias, representativeness, comparability, and completeness. Describes the limitations on the project data use if the DQIs are not met.
To evaluate uncertainty, the considerations in the DQA focus on:
Any anomalies in the sample collection, transport, and preparation steps that might influence the material properties and increase the sampling error. The results from data validation, when performed, will also be evaluated for impacts to the analytical results.
The individual composite sample analysis measurements will be used to determine the statistics, mainly averages, for the composite samples.
The total uncertainty will be used for calculating the confidence limits on the statistics calculated for the composite samples. As the uncertainty increases, so will the confidence limits.
The measurement uncertainties will be evaluated against each composite sample’s variation to determine if this variation totally accounts for the measurement uncertainty. The variation between the multiple measurements of an individual composite sample is expected to vary more than the analytical uncertainty. In this case, no adjustment would be needed. In the case where the analytical uncertainty is greater than the variation between the multiple measurements of an individual composite sample, a greater variability would need to be reflected in the total uncertainty, and ultimately reflected in the confidence limits.
An additional evaluation of the uncertainty would be a review for outliers in the data. The influence of any outliers on a data set would need to be considered before using the data.
D3.2 Limitations on Data Use
Data usability for residuals characterization is evaluated and documented during the DQA as described above. It is anticipated that all data will be used, and the uncertainties arising from sampling or analytical problems will be taken into account for the final waste tank inventory determination. The inventory determination, and other closure decisions the data support are outside the scope of this LWTRS-QAPP.
Liquid Waste Tank Residuals Sampling- SRR-CWDA-2011-00117 Quality Assurance Program Plan Revision 1 July 2013
Page 97 of 99
REFERENCES
Note: References identified as (Copyright) were used in the development of this document, but are protected by copyright laws. No part of those publications may be reproduced in any form or by any means, including photocopying or electronic transmittal in any form by any means, without permission in writing from the copyright owner.
1B Manual, Management Requirements and Procedures, Savannah River Site, Aiken, SC, June 25, 2013 (Table of Contents).
1B Manual, Procedure 3.31, Management Requirements and Procedures (MRP), Records Management, Savannah River Site, Aiken, SC, Rev 10, January 17, 2013.
1B Manual, Procedure 3.32, Management Requirements and Procedures (MRP), Document Control, Savannah River Site, Aiken, SC, Rev 7, July 30, 2003.
1B Manual, Procedure 4.23, Corrective Action Program, Savannah River Site, Aiken, SC, Rev 9, June 25, 2013.
1Q Manual, Quality Assurance Manual, Savannah River Site, Aiken, SC, July 24, 2013 (Table of Contents).
1Q Manual, Procedure 2-7, QA Program Requirements for Analytical Measurement Systems, Savannah River Site, Aiken, SC, Rev. 8, December 17, 2008.
1Q Manual, Procedure 7-2, Control of Purchased Items and Services [NQA-1 2008 with 2009 addendum], Savannah River Site, Aiken, SC, Rev. 21, June 21, 2012.
1Q Manual, Procedure 12-1, Control of Measuring and Test Equipment, Savannah River Site, Aiken, SC, Rev. 17, July 23, 2013.
1Q Manual, Procedure 17-1, Quality Assurance Records Management [NQA1-2008 with 2009 addendum], Savannah River Site, Aiken, SC, Rev 14, November 30, 2012.
1Q Manual, Procedure 17-1Q, Quality Assurance Records Management [NQA-1 2000], Savannah River Site, Aiken, SC, Rev 2, November 30, 2012.
4B Manual, Training and Qualification Program Manual, Savannah River Site, Aiken, SC, September 28, 2011 (Table of Contents).
5Q Manual, Radiological Control Manual, Savannah River Site, Aiken, SC, October 24, 2012 (Table of Contents).
12B1 Manual, Information Technology Policies, Procedures, Standards, and Guidelines (U), Savannah River Site, Aiken, SC, accessed July 25, 2013 (Table of Contents).
12Q Manual, Assessment Manual, Savannah River Site. Aiken, SC, May 28, 2013 (Table of Contents).
ADS-WI00023, Spreadsheet Quality Control for Analytical Development Section (AD), Analytical Development Instruction Manual, AD Work Instructions, Savannah River National Laboratory, Aiken, SC, Rev. 1, February 28, 2008.
Liquid Waste Tank Residuals Sampling- SRR-CWDA-2011-00117 Quality Assurance Program Plan Revision 1 July 2013
Page 98 of 99
ASME NQA-1-2000 (Copyright), Quality Assurance Requirements for Nuclear Facility Applications, The American Society of Mechanical Engineers, New York, NY, May 21, 2001.
ASME NQA-1-2008 with 2009 addendum (Copyright), Quality Assurance Requirements for Nuclear Facility Applications, The American Society of Mechanical Engineers, New York, NY, March 14, 2008.
DHEC_01-17-2012, Quality Assurance Program Plan, Revision A and the Liquid Waste Tank Residuals Sampling and Analysis Program Plan, Revision 0A, South Carolina Department of Health and Environmental Control, Columbia, SC, January 17, 2012.
DHEC_QAPP_Guide_09-2008, Guidance Document for Preparing Quality Assurance Project Plans (QAPPs) for Environmental Monitoring Projects/Studies, South Carolina Department of Health and Environmental Control, Office of Quality Assurance, State Park, SC, Rev. 1.1, September 2008.
DOE G 435.1-1, Implementation Guide for use with DOE M 435.1-1, U.S. Department of Energy, Washington DC, July 9, 1999.
DOE O 200.1A, Information Management Program, U.S. Department of Energy, Washington DC, December 23, 2008.
DOE O 243.1A, Records Management Program, U.S. Department of Energy, Washington DC, November 7, 2011.
E7 Manual, Procedure 2.60, Technical Reviews, Savannah River Site, Aiken, SC, Rev. 14, April 24, 2010.
E7 Manual, Procedure 3.60, Technical Reports, Savannah River Site, Aiken, SC, Rev. 4, July 1, 2004.
EPA QA/G-5, Guidance for Quality Assurance Project Plans, United States Environmental Protection Agency, Washington DC, December 2002.
EPA QA/R-5, EPA Requirements for Quality Assurance Project Plans for Environmental Data Operations, United States Environmental Protection Agency, Washington DC, March 2001.
EPA 402-B-04-001C, Multi-Agency Radiological Laboratory Analytical Protocols Manual (Final) Volume III: Chapter 18-20 and Appendix G, U.S. Environmental Protection Agency, Washington DC, July 2004.
EPA/240/B-06/001, Guidance on Systematic Planning Using the Data Quality Objectives Process, U.S. Environmental Protection Agency, February 2006.
L1 Manual, Procedure 7.26, Conduct of Research & Development (R&D) - Work Control Document, Savannah River National Laboratory, Aiken, SC, Rev. 1, November 10, 2009.
L1 Manual, Procedure 8.02, Attachment 8.8-1, QAP 8-1 Identification and Control of Items, Savannah River National Laboratory, Aiken, SC, Rev. 13, December 13, 2010.
L7.7 Manual, Procedure 1.15, SRNL Receipt of Radioactive Material, Savannah River National Laboratory, Aiken, SC, Rev. 9, June 12, 2011.
Liquid Waste Tank Residuals Sampling- SRR-CWDA-2011-00117 Quality Assurance Program Plan Revision 1 July 2013
Page 99 of 99
LWO-RIP-2009-00009, Industrial Wastewater General Closure Plan for F-Area Waste Tank Systems, Industrial Wastewater Construction Permit #17,424-IW, Savannah River Site, Aiken, SC, Rev. 3, January 24, 2011.
SRNL-STI-2011-00323, Technical Review of the Method of Constructing Composite Samples with Uncertain Volumetric Proportions, Savannah River Site, Aiken, SC, Rev. 0, May 2011.
SRNL-STI-2011-00557, SRNL Quality Assurance & Quality Control Summary for Tanks 18 and 19 Liquid Waste Tank Residuals Samples (LWTRS), Savannah River Site, Aiken SC, Rev. 1, February 7, 2012.
SRR-CWDA-2010-00128, Performance Assessment for the H-Area Tank Farm at the Savannah River Site, Savannah River Site, Aiken, SC, Rev. 1, November 2012.
SRR-CWDA-2011-00022, Industrial Wastewater General Closure Plan for the H-Area Waste Tank Systems, Industrial Wastewater Construction Permit #17,424-IW, Savannah River Site, Aiken, SC, Rev. 0, May 2012.
SRR-CWDA-2011-00050, Liquid Waste Tank Residuals Sampling and Analysis Program Plan, Savannah River Site, Aiken, SC, Rev. 2, July 2013.
SRR-CWDA-2012-00114, Savannah River Site F-Area Tank Farm Tanks 5 and 6 Data Quality Summary Report, Savannah River Site, Aiken, SC, Rev. 1, January 2013.
SRR-LWE-2010-00240, Tank Mapping Methodology, Savannah River Site, Aiken, SC, Rev. 1, November 2012.
SRR-LWP-2009-00001, Liquid Waste System Plan, Savannah River Site, Aiken, SC, Rev. 18, June 2013.
SRS-REG-2007-00002, Performance Assessment for the F-Tank Farm at the Savannah River Site, Savannah River Site, Aiken, SC, Rev. 1, March 31, 2010.
SW11.1-SAMPLE, Section 7.18, CST Sample Manual, Savannah River Site, Aiken, SC, Rev. 0, April 23, 2013.
WSRC-IM-2002-00011, Savannah River National Laboratory Technical Report Design Check Guidelines, Savannah River Site, Aiken, SC, Rev. 2, August 2004.
WSRC-OS-94-42, Federal Facility Agreement for the Savannah River Site, Savannah River Site, Aiken, SC, August 16, 1991, Rev. 1, January 16, 2013.
Liquid Waste Tank Residuals Sampling- SRR-CWDA-2011-00117 Quality Assurance Program Plan Revision 1 July 2013
Page A.1-1 of A.1-4
ATTACHMENT 1
LIQUID WASTE TANK RESIDUALS SAMPLING: CHAIN-OF-CUSTODY FORM
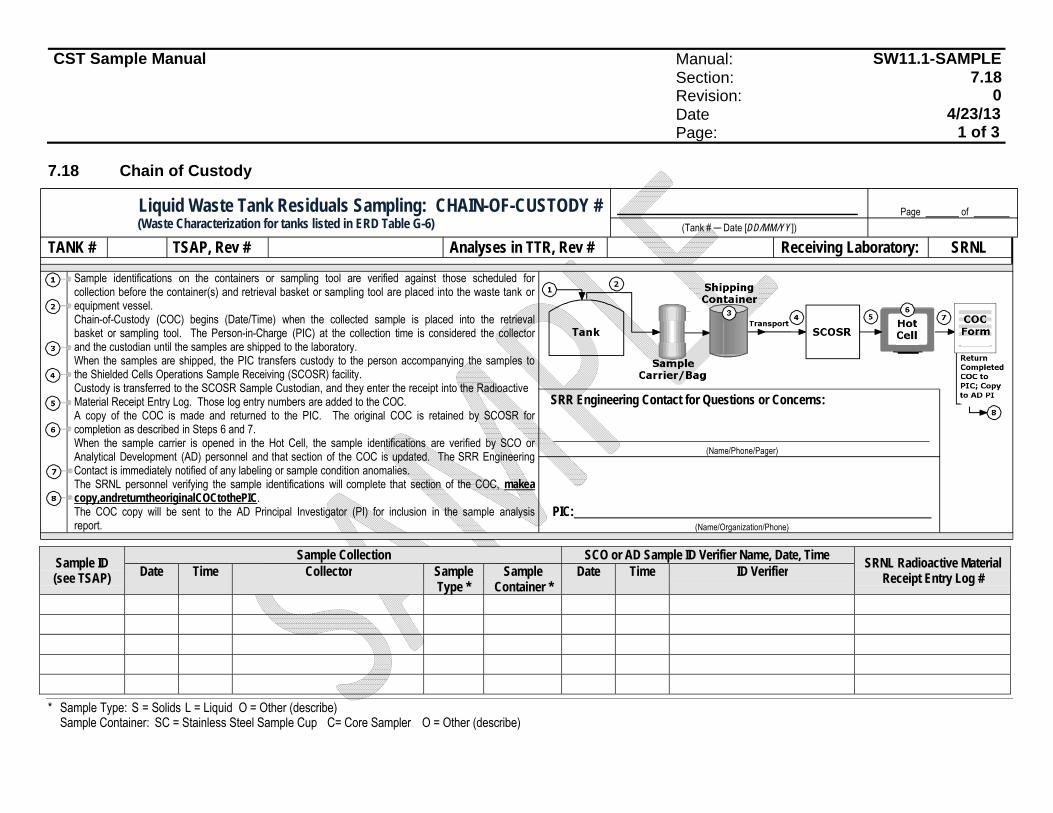
CST Sample Manual Manual:Section: Revision:
SW11.1-SAMPLE 7.18
0
Date 4/23/13 Page: 1 of 3
7.18 Chain of Custody
Liquid Waste Tank Residuals Sampling: CHAIN-OF-CUSTODY #
Page of
(Waste Characterization for tanks listed in ERD Table G-6) (Tank # Date [DD/MM/YY])
TANK # TSAP, Rev # Analyses in TTR, Rev # Receiving Laboratory: SRNL
Sample identifications on the containers or sampling tool are verified against those scheduled for collection before the container(s) and retrieval basket or sampling tool are placed into the waste tank or equipment vessel. Chain-of-Custody (COC) begins (Date/Time) when the collected sample is placed into the retrieval basket or sampling tool. The Person-in-Charge (PIC) at the collection time is considered the collector and the custodian until the samples are shipped to the laboratory. When the samples are shipped, the PIC transfers custody to the person accompanying the samples to the Shielded Cells Operations Sample Receiving (SCOSR) facility. Custody is transferred to the SCOSR Sample Custodian, and they enter the receipt into the Radioactive Material Receipt Entry Log. Those log entry numbers are added to the COC. A copy of the COC is made and returned to the PIC. The original COC is retained by SCOSR for completion as described in Steps 6 and 7. When the sample carrier is opened in the Hot Cell, the sample identifications are verified by SCO or Analytical Development (AD) personnel and that section of the COC is updated. The SRR Engineering Contact is immediately notified of any labeling or sample condition anomalies. The SRNL personnel verifying the sample identifications will complete that section of the COC, make a copy, and return the original COC to the PIC. The COC copy will be sent to the AD Principal Investigator (PI) for inclusion in the sample analysis report.
SRR Engineering Contact for Questions or Concerns:
(Name/Phone/Pager)
PIC:
(Name/Organization/Phone)
Sample ID (see TSAP)
Sample Collection SCO or AD Sample ID Verifier Name, Date, Time SRNL Radioactive Material Receipt Entry Log # Date Time Collector Sample
Type * Sample
Container * Date Time ID Verifier
* Sample Type: S = Solids L = Liquid O = Other (describe) Sample Container: SC = Stainless Steel Sample Cup C= Core Sampler O = Other (describe)
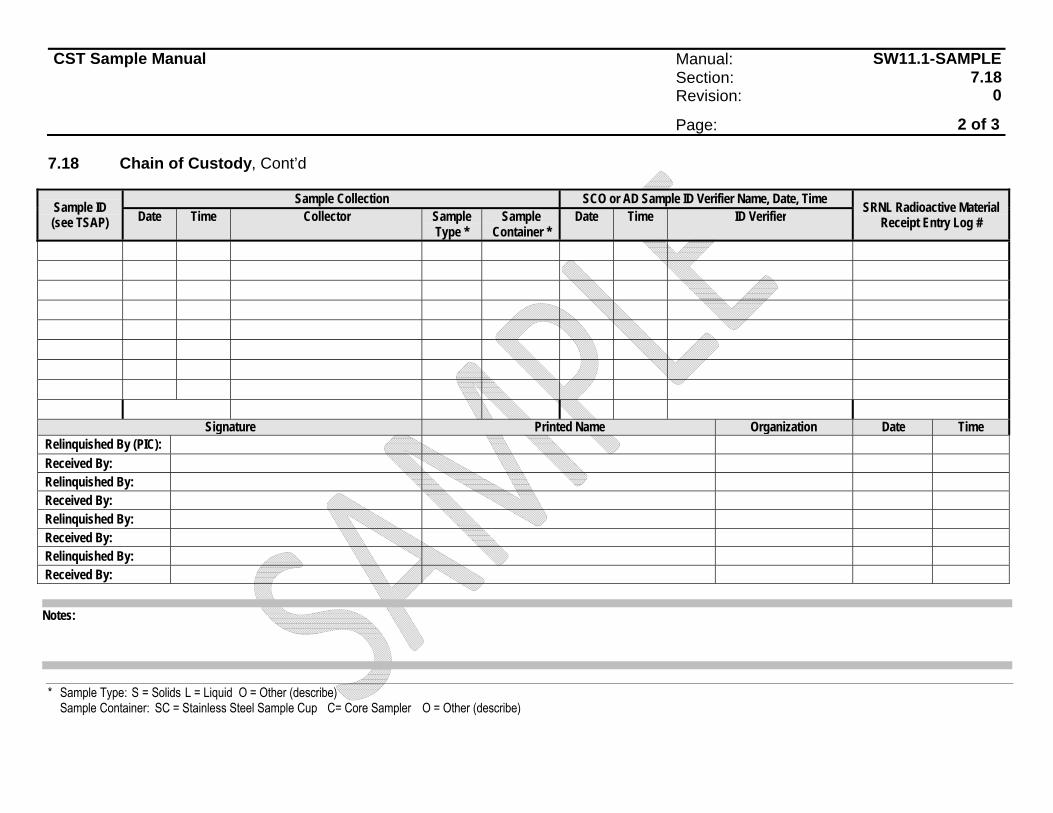
CST Sample Manual Manual:Section: Revision:
SW11.1-SAMPLE 7.18
0
Page: 2 of 3
7.18 Chain of Custody, Cont’d
Sample ID (see TSAP)
Sample Collection SCO or AD Sample ID Verifier Name, Date, Time SRNL Radioactive Material Receipt Entry Log # Date Time Collector Sample
Type * Sample
Container * Date Time ID Verifier
Signature Printed Name Organization Date Time Relinquished By (PIC): Received By: Relinquished By: Received By: Relinquished By: Received By: Relinquished By: Received By:
Notes:
* Sample Type: S = Solids L = Liquid O = Other (describe) Sample Container: SC = Stainless Steel Sample Cup C= Core Sampler O = Other (describe)
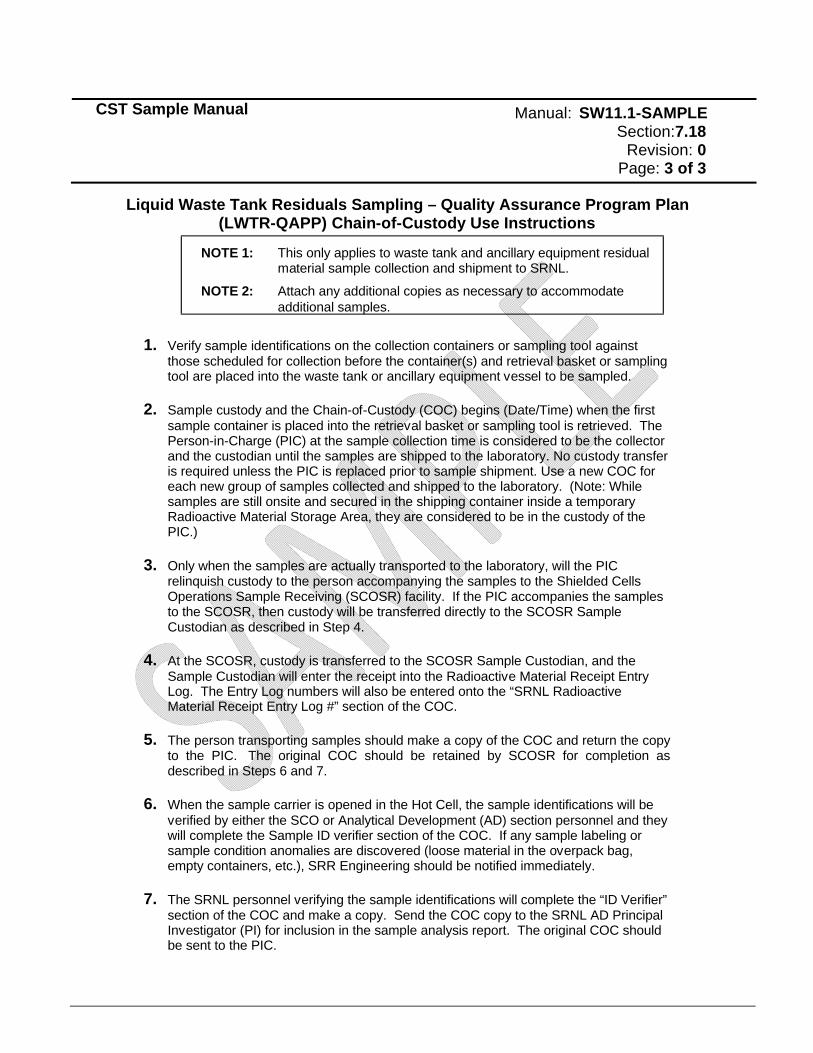
CST Sample Manual Manual: SW11.1-SAMPLE Section:7.18
Revision: 0 Page: 3 of 3
Liquid Waste Tank Residuals Sampling – Quality Assurance Program Plan
(LWTR-QAPP) Chain-of-Custody Use Instructions
NOTE 1: This only applies to waste tank and ancillary equipment residual material sample collection and shipment to SRNL.
NOTE 2: Attach any additional copies as necessary to accommodate additional samples.
1. Verify sample identifications on the collection containers or sampling tool against
those scheduled for collection before the container(s) and retrieval basket or sampling tool are placed into the waste tank or ancillary equipment vessel to be sampled.
2. Sample custody and the Chain-of-Custody (COC) begins (Date/Time) when the first
sample container is placed into the retrieval basket or sampling tool is retrieved. The Person-in-Charge (PIC) at the sample collection time is considered to be the collector and the custodian until the samples are shipped to the laboratory. No custody transfer is required unless the PIC is replaced prior to sample shipment. Use a new COC for each new group of samples collected and shipped to the laboratory. (Note: While samples are still onsite and secured in the shipping container inside a temporary Radioactive Material Storage Area, they are considered to be in the custody of the PIC.)
3. Only when the samples are actually transported to the laboratory, will the PIC
relinquish custody to the person accompanying the samples to the Shielded Cells Operations Sample Receiving (SCOSR) facility. If the PIC accompanies the samples to the SCOSR, then custody will be transferred directly to the SCOSR Sample Custodian as described in Step 4.
4. At the SCOSR, custody is transferred to the SCOSR Sample Custodian, and the
Sample Custodian will enter the receipt into the Radioactive Material Receipt Entry Log. The Entry Log numbers will also be entered onto the “SRNL Radioactive Material Receipt Entry Log #” section of the COC.
5. The person transporting samples should make a copy of the COC and return the copy
to the PIC. The original COC should be retained by SCOSR for completion as described in Steps 6 and 7.
6. When the sample carrier is opened in the Hot Cell, the sample identifications will be
verified by either the SCO or Analytical Development (AD) section personnel and they will complete the Sample ID verifier section of the COC. If any sample labeling or sample condition anomalies are discovered (loose material in the overpack bag, empty containers, etc.), SRR Engineering should be notified immediately.
7. The SRNL personnel verifying the sample identifications will complete the “ID Verifier”
section of the COC and make a copy. Send the COC copy to the SRNL AD Principal Investigator (PI) for inclusion in the sample analysis report. The original COC should be sent to the PIC.
Liquid Waste Tank Residuals Sampling- SRR-CWDA-2011-00117 Quality Assurance Program Plan Revision 1 July 2013
Page A.2-1 of A.2-265
ATTACHMENT 2
SRNL ANALYTICAL METHOD DESCRIPTIONS AND
ANALYTICAL OPERATING PROCEDURES
SRNL ANALYTICAL METHOD DESCRIPTIONS
The individual analytical method descriptions provided below contain standard information on the application of the AOPs, DQIs, and MPCs provided in Table A7-1. The Sample Analysis Report will contain detailed case narratives reporting the specific analytical methods used, including, any analytical problems and resolution, the results for the QC protocols and comparison back to the DQIs, and MPCs in Table A7-1.
Gross Alpha/Gross Beta
Aliquots of dissolution are added to liquid scintillation cocktail and analyzed for gross alpha and gross beta activity using liquid scintillation analysis. Alpha/beta spillover is determined for each sample by preparing two separate aliquots of each sample for analysis, one spiked with plutonium (matrix spike) and one without the spike. The spillover value is determined using the matrix spike and is subsequently used for accurately determining alpha and beta activity. Results are reported as disintegrations per minute (dpm) by converting counts per minute (cpm) from the instrument to dpm using appropriate efficiencies as described in the AOP.
Each batch contains a method blank, a matrix spike for each sample, and ≤20 samples. Results are reported with 1-sigma uncertainty, which is determined for each sample based on counting statistics and other known sources of uncertainty (pipet, standard certificate value, etc). Calculations are carried out using a spreadsheet maintained in accordance with ADS-WI00023.
Ni-59/63
Aliquots of dissolution are spiked with an elemental nickel carrier which will be used to trace the separation efficiency on a sample-by-sample basis. The nickel species are extracted from the matrix using dimethylglyoxime (DMG)-based extractant. An aliquot of the extracted Ni-containing material is transferred to a stainless-steel plate (for Ni-59 analysis), and an aliquot is added to liquid scintillation cocktail (for Ni-63 analysis). An additional aliquot is sent to the inductively coupled plasma emission spectroscopy (ICP-ES) laboratory to determine the nickel content in the separated material, and thus the separation yield.
Ni-59 concentrations are measured using low energy photon/x-ray, thin-windowed, semi-planar high purity germanium spectrometers with an appropriate efficiency calibration to convert peak size and counting duration to dpm. Ni-63 concentrations are measured by liquid scintillation analysis with an appropriate quench curve/efficiency calibration to convert cpm to dpm.
Elemental nickel carrier yields are measured by ICP-ES, and are used to correct the radioactive nickel species’ analyses for any nickel losses from the radiochemical separations.
The quality of the tracing is indicated by the successful laboratory spikes containing Ni-59 and Ni-63.
Each batch contains a method blank, ≤20 samples, a traced Ni-59 laboratory spike, and a traced Ni-63 laboratory spike. Results are reported with 1-sigma uncertainty, which is determined for each sample based on counting statistics and other known dominant sources of uncertainty (pipet, standard certificate value, etc.). The percent (%) recovery for the Ni-59 and the Ni-63
[(measured dpm/added dpm)*100] for the laboratory spikes are used as data quality indicators. Calculations are carried out using a spreadsheet maintained in accordance with ADS-WI00023.
Cs-137/Cs-134
Aliquots of dissolution are analyzed by coaxial high purity germanium gamma-ray spectrophotometers with an appropriate efficiency calibration to convert peak energy, peak size and counting duration to dpm.
Each batch contains a method blank and ≤20 samples. Results are reported with 1-sigma uncertainty, which is determined for each sample based on counting statistics and other known dominant sources of uncertainty (pipet, standard certificate value, etc.), or a minimum of 5% uncertainty, as described in the AOP. Calculations are carried out using a spreadsheet maintained in accordance with ADS-WI00023.
Sr-90
Aliquots of dissolution are spiked with an elemental strontium carrier which will be used to trace the separation efficiency on a sample-by-sample basis. The strontium species are extracted from the matrix using a crown-ether-based solid phase extractant. Sr-90 concentrations are measured by liquid scintillation analysis and an appropriate efficiency to convert cpm to dpm. Elemental strontium carrier yields are measured by neutron activation analysis (NAA), and are used to correct the Sr-90 analyses for any strontium losses from the radiochemical separations. The quality of the tracing is indicated by the successful laboratory spike containing Sr-90.
Each batch contains a method blank, ≤20 samples, a traced Sr-90 laboratory spike which contains a known amount of Sr-90, and a serial dilution of one of the samples being analyzed. Results are reported with 1-sigma uncertainty, which is determined for each sample based on counting statistics and other known dominant sources of uncertainty (pipet, standard certificate value, etc.). The % recovery for the Sr-90 [(measured dpm/added dpm)*100] for the laboratory spike is used as a data quality indicator. In addition, when comparing the serial dilution aliquot and its counterpart, the concentration for Sr-90 must overlap within the limit established by each sample’s 3-sigma range. Calculations are carried out using a spreadsheet maintained in accordance with ADS-WI00023.
Pm-147/Sm-151
Aliquots of dissolution are spiked with an elemental samarium carrier which will be used to trace the separation efficiency on a sample-by-sample basis. The promethium and samarium species are extracted from the matrix using a combination of Octylphenyl-N,N-di-isobutyl carbamoylphosphine oxide/tri-n-butyl phosphate (CMPO/TBP) and di(2-ethylhexyl) orthophosphoric acid (HDEHP). The separation is designed to extract both Sm and Pm together.
Sm-151 concentrations are measured by liquid scintillation analysis with an appropriate quench curve/efficiency calibration to convert cpm to dpm. Pm-147 concentrations are also measured by liquid scintillation analysis. Elemental samarium carrier yields are measured by NAA, and are used to correct the analyses for any samarium and promethium losses from the radiochemical
separations. The quality of the tracing is indicated by the successful laboratory spike containing Sm-151.
Each batch contains a method blank, ≤20 samples, and a traced Sm-151 laboratory spike. Results are reported with 1-sigma uncertainty, which is determined for each sample based on counting statistics and other known dominant sources of uncertainty (pipet, standard certificate value, etc.). The % recovery for the Sm-151 [(measured dpm/added dpm)*100] for the laboratory spike is used as a data quality indicator. Calculations are carried out using a spreadsheet maintained in accordance with ADS-WI00023.
Na-22, Al-26, Co-60, Nb-94, Rh-106, Ru-106, Sb-125, Sb-126, Sn-126, Sb-126m, Te-125m, Ce-144, Pr-144, Eu-152, Eu-154, Eu-155, Am-241, Ra-228, Ac-227 (Cs-removed Gamma Analysis)
Aliquots of dissolution are subjected to a cesium-removal process utilizing BioRad Ammonium Molybdophosphate (AMP) resin. Following the resin extraction (which selectively removes the cesium in the matrix yet does not impact the analytes of interest), the samples are analyzed by coaxial high purity germanium spectrophotometers with an appropriate efficiency and energy calibration to convert peak energy, peak size and counting duration to dpm.
Each batch contains a method blank and ≤20 samples. Results are reported with 1-sigma uncertainty, which is determined for each sample based on counting statistics and other known dominant sources of uncertainty (pipet, standard certificate value, etc), or a minimum of 5% uncertainty, as described in the AOP. Calculations are carried out using a spreadsheet maintained in accordance with ADS-WI00023.
Pu-238, 239/240, 241
Aliquots of dissolution are spiked with Pu-236 tracer which will be used to trace the separation efficiency on a sample-by-sample basis. The plutonium is extracted from the matrix using thenoyltrifluoroacetone (TTA) following a series of oxidation state adjustments. The TTA extracts are mounted on stainless steel counting plates and counted using passivated implanted planar silicon (PIPS) detectors (alpha PHA chambers) to determine peak areas for the Pu-238, Pu-239+Pu-240, and Pu-236 peaks. Peak areas, coupled with the known amount of Pu-236 added to each sample, are used to provide traced results for Pu-238 and Pu-239+240.
Each batch contains a method blank, a traced Pu-238 laboratory spike, a serial dilution of one of the samples being analyzed, and ≤20 samples. Results are reported with 1-sigma uncertainty, which is determined for each sample based on counting statistics and other known dominant sources of uncertainty (pipet, standard certificate value, etc.). Calculations are carried out using a spreadsheet maintained in accordance with ADS-WI00023.
Each separation is traced based on the Pu-236 recovery. The quality of the tracing is indicated by the successful laboratory spike containing Pu-238. The % recovery for the Pu-238 [(measured dpm/added dpm)*100] for the Pu-238 laboratory spike is used as a data quality indicator. In addition, when comparing the serial dilution aliquot and its counterpart, the concentration for the major Pu isotope must overlap within the limit established by each sample’s 3-sigma range.
In order to quantify the Pu-241, aliquots of each sample are subjected to Cs-removal with BioRad Ammonium Molybdophosphate (AMP) resin and extracted using Eichrom TEVA resin columns. The Pu-containing extracts are then measured by liquid scintillation analysis to determine Pu-241 concentration. The region of interest for Pu-241 is equivalent to that of tritium due to similar beta-energies. The tritium quench-curve is used to convert from counts per minute to dpm. The Pu-241 value is obtained by applying the ratio of Pu-241 (dpm) to Pu-alpha (dpm) from the LSC analysis to the total Pu-alpha (dpm) from the alpha analysis. This provides a traced (and yield corrected) value for Pu-241.
Am-241, 242m, 243; Cm-242, 243, 244, 245, 247, 248; Cf-249, 251, 252
Paired aliquots of dissolved material are extracted using a CMPO/TBP-based solid phase extractant, and are further purified with an HDEHP-based solid phase extractant. One aliquot of the pair is analyzed without a spike, and one aliquot of the pair is spiked with a known quantity of Am-243 to determine separation yield. Aliquots of the extracted material are mounted on a stainless-steel plate and counted using PIPS detectors (for Am-242m, Cm-242, Cm-244, Cm-248, and Cf-252) as well as low energy photon/x-ray, thin-windowed, semi-planar high purity germanium spectrometers (for Am-241, Am-243, Cm-243, Cm-245, Cm-247, Cf-249 and Cf-251) with an appropriate efficiency calibration to convert peak size and counting duration to dpm. Some of the Am, Cm and Cf isotopes are also measured using inductively coupled plasma mass spectrometry (ICP-MS).
For simplicity, Am-241 quantities measured from the cesium-removed gamma analyses are used, when possible, instead of the matrix spikes to trace the separation yields for this method. This is accomplished by determining a multiplier for the Am-241 value from the extracted aliquot to the Am-241 value from the straight-forward Cs-removed gamma analysis. In turn, all Am, Cm, and Cf results are traced back to the Am-241 concentration present in the sample matrix. If the Am-241 from non-extracted sample cannot be used as a yield monitor, the yield of the Am-243 from the matrix spike for each sample (in paired analyses) is used to correct for losses during the separation process.
Each batch contains a method blank, a matrix spike for each sample analyzed (for sample-specific tracing), and ≤20 samples. Results are reported with 1-sigma uncertainty, which is determined for each sample based on counting statistics and other known dominant sources of uncertainty (pipet, standard certificate value, etc.). Calculations are carried out using a spreadsheet maintained in accordance with ADS-WI00023.
U-232
Paired aliquots of dissolved material for each sample undergo radiochemical separations and analyses. One aliquot of the pair is analyzed without a spike, and one aliquot of the pair is spiked with a known quantity of U-233 to determine separation yield. Uranium is extracted from the matrix using two stages of a diamyl, amylphosphonate-based (DAAP) solid phase extraction and purified further via co-precipitation with cerium. The uranium-containing precipitates are analyzed using PIPS alpha spectrometers (alpha PHA chambers) with known efficiencies to quantify U-232, U-233, and U-238. [dpm=((peak area-background peak area)/efficiency/count duration in minutes)/yield]
Each batch contains a method blank, ≤20 samples, and matrix spike for each sample. Results are reported with 1-sigma uncertainty, which is determined for each sample based on counting statistics and other known dominant sources of uncertainty (pipet, standard certificate value, etc). Calculations are carried out using a spreadsheet maintained in accordance with ADS-WI00023.
Often, the U-233 matrix spike cannot be used for yield corrections because the U-234 inherent in the sample swamps out the U-233 signal. U-233 and U-234 have the same characteristic alpha energy. In this case, the U-232/U-238 activity ratios are determined from the alpha analysis, and are multiplied by the U-238 activities measured by the ICP-MS to determine U-232 activities in the samples.
Cs-135
Aliquots of dissolved material are purified using a solvent-solvent caustic side solvent extraction-based (CSSX) extraction system. The purified Cs-containing aliquots are analyzed using ICP-MS to measure Cs-135/Cs-137 mass ratios. These ratios are then converted to activity ratios using the specific activities. The Cs-135/Cs-137 activity ratio for each sample is then multiplied by the Cs-137 activity of the dissolved, non-purified sample which was obtained by simple coaxial high purity germanium gamma-ray spectrometry as previously described in the Cs-137/Cs-134 section.
Each batch contains a method blank and ≤20 samples. Results are reported with 1-sigma uncertainty, which is determined for each sample based on counting statistics and other known dominant sources of uncertainty (pipet, standard certificate value, etc.). Calculations are carried out using a spreadsheet maintained in accordance with ADS-WI00023.
Np-237
Quantification of Np-237 can be carried out in a number of ways. The simplest process utilizes ICP-MS or gamma pulse height analysis using coaxial high purity germanium gamma-ray spectrophotometers on dissolved material to provide a Np-237 concentration.
In the event that the uranium content of the matrix is high enough to cause possible biases in the Np-237 peak, aliquots of the material are purified using a radiochemical separation scheme prior to ICP-MS and/or gamma pulse height analysis. Aliquots of dissolved material are spiked with Np-239 tracer (in the form of Am-243, which decays to Np-239) and then extracted with a quaternary amine-based solid phase extraction. If the matrix contains sufficient quantities of Am-243 (and thus Np-239) then the addition of a radiochemical tracer is not necessary since the yield of the separated fraction can be determined using the inherent Np-239. The purified Np-containing aliquots are analyzed either 1)using a low energy photon/x-ray, thin-windowed, semi-planar high purity germanium spectrometer with an appropriate efficiency calibration to convert peak size and counting duration to dpm or 2) with ICP-MS, or 3) with a combination of the two. Np-239 yields are calculated [dpm in final separated material divided by dpm added to material], and are used to correct the Np-237 result for each sample for any losses from the radiochemical separations.
Each batch contains a method blank, ≤20 samples, and, when necessary, a Np-237 laboratory standard. Results are reported with 1-sigma uncertainty, which is determined for each sample
based on counting statistics and other known dominant sources of uncertainty (pipet, standard certificate value, etc.). The % recovery for the Np-237 [(measured dpm/added dpm)*100] for the laboratory spike is used as a data quality indicator. Calculations are carried out using a spreadsheet maintained in accordance with ADS-WI00023.
Tritium
Aliquots of dissolved material are subjected to tritium separations via steam distillation. The distillation separates the tritium from non-volatile radionuclides. Aliquots of the tritium-containing distillates are added to liquid scintillation cocktail and analyzed by liquid scintillation analysis with an appropriate quench curve/efficiency calibration to convert cpm to dpm.
Each batch contains a method blank and ≤20 samples. Results are reported with 1-sigma uncertainty, which is determined for each sample based on counting statistics and other known dominant sources of uncertainty (pipet, standard certificate value, etc.). Calculations are carried out using a spreadsheet maintained in accordance with ADS-WI00023.
Se-79
Aliquots of material are spiked with an elemental selenium carrier, which is used to trace the separation efficiency on a sample-by-sample basis, and dissolved. The selenium species are extracted from the matrix using a combination of resin decontamination, selenium metal precipitation, and TBP-based liquid-liquid extractions.
Aliquots of the purified selenium-containing extracts are analyzed by liquid scintillation counting (to measure Se-79), as well as by NAA (to measure elemental selenium carrier yields). The region of interest for Se-79 is equivalent to that of C-14 due to their similar beta-energies. The C-14 quench-curve is used to convert from cpm to dpm. The selenium carrier yields for each individual sample are used to correct for selenium losses from the radiochemical separations. The quality of the tracing is indicated by the successful quantification of the activated tracer (tracer activity is greater than the minimum detectable activity (MDA) for each individual count) as well as sufficient recovery to provide the customer-requested sensitivity. For instance, if the separation yield is low, and the Se-79 concentration is less than the minimum detectable activity, then the low yield could elevate the MDA to a value above the customer-requested detection limit.
Each batch contains a method blank and ≤20 samples. Results are reported with 1-sigma uncertainty, which is determined for each sample based on counting statistics and other known dominant sources of uncertainty (pipet, standard certificate value, etc.). Calculations are carried out using a spreadsheet maintained in accordance with ADS-WI00023.
Tc-99
Aliquots of material are spiked with Tc-99m (which is produced in-house using the NAA facility) to trace the separation efficiency on a sample-by-sample basis, and dissolved. The technetium species are extracted from the matrix using an Aliquat-336-based solid phase extractant. Aliquots of the purified Tc-containing extracts are added to liquid scintillation
cocktail for quantification. Tc-99m yields for each individual sample are measured with a NaI gamma spectrometer, and are used to correct the Tc-99 analyses for any technetium losses from the radiochemical separations. Following a sufficient delay to allow the Tc-99m to decay, the Tc-99 concentrations are then measured by liquid scintillation analysis. NIST-traceable-standard-based efficiencies are used to convert from cpm to dpm. The LSC results are corrected for losses using the Tc-99m yield monitor. The quality of the tracing is indicated by the successful laboratory spikes containing Tc-99. The % recovery for the Tc-99 [(measured dpm/added dpm)*100] for the laboratory spike is used as data quality indicator.
Each batch contains a method blank, a traced laboratory spike, and ≤20 samples. Results are reported with 1-sigma uncertainty, which is determined for each sample based on counting statistics and other known dominant sources of uncertainty (pipet, standard certificate value, etc.). Calculations are carried out using a spreadsheet maintained in accordance with ADS-WI00023.
Ra-226
Paired aliquots of material for each sample undergo radiochemical separations and analyses. One aliquot of the pair is analyzed without a spike, and one aliquot of the pair is spiked with a known quantity of Ra-224 (from Th-228) to determine separation yield. The radium is extracted from the matrix using a combination of resin decontamination and ion exchange. The purified material containing Ra-226 is sealed in a polypropylene tube and rapidly analyzed for Ra-224 using a high purity germanium well gamma-ray detector and an appropriate efficiency calibration to convert peak energy, peak size and counting duration to dpm. The sealed tubes are then stored for at least several Rn-222 half-lives (Rn-222 is a daughter of Ra-226 which then decays to Pb-214). The Ra-226 progeny daughter isotope Pb-214 is then quantified using a high purity germanium well gamma ray detector. Ra-226 results are corrected for the tracer Ra-224 recoveries.
Each batch contains a method blank, a traced laboratory spike, and ≤20 samples. Results are reported with 1-sigma uncertainty, which is determined for each sample based on counting statistics and other known dominant sources of uncertainty (pipet, standard certificate value, etc.). Calculations are carried out using a spreadsheet maintained in accordance with ADS-WI00023.
Pa-231
Aliquots of dissolution are spiked with Pa-233 tracer (in the form of Np-237) which will be used to trace the separation efficiency on a sample-by-sample basis. The dissolutions are decontaminated with AMP- and quaternary amine-based resins to facilitate the removal of interfering radionuclides. Protactinium species are then extracted from the matrix using a CMPO/TBP-based extraction scheme. Pa-233 tracer concentrations are measured using a high purity germanium spectrometer with an appropriate efficiency calibration to convert peak size and counting duration to dpm. The Pa-231 is measured using ICP-MS. The Pa-separation yields determined for each sample are used to correct the ICP-MS result for losses during the radiochemical separation process.
Each batch contains a method blank and ≤20 samples. Results are reported with 1-sigma uncertainty, which is determined for each sample based on counting statistics and other known dominant sources of uncertainty (pipet, standard certificate value, etc.). Calculations are carried out using a spreadsheet maintained in accordance with ADS-WI00023.
I-129
Aliquots of material are spiked with an elemental iodide carrier which will be used to trace the separation efficiency on a sample-by-sample basis. Samples, with the added KI carrier, are then are dissolved in concentrated acid. Actinide and AMP resins are added to the mixture to facilitate removal of interfering radionuclides. Sodium sulfite is added to the material to reduce the iodine. Silver nitrate is added to the solution to precipitate the iodine as AgI, which is separated via filtration. The purified iodide-containing precipitate is analyzed for I-129 content using low energy photon/x-ray, thin-windowed, semi-planar, high purity germanium spectrometer with an appropriate efficiency calibration to convert peak size and counting duration to dpm.
Iodide carrier yields are measured by NAA, and are used to correct the I-129 analyses for any iodide losses from the radiochemical separation. The quality of the tracing is indicated by the successful quantification of the activated tracer (tracer activity is greater than MDA for each individual count) as well as sufficient recovery to provide the customer-requested sensitivity. For instance, if the separation yield is low, and the I-129 concentration is less than the minimum detectable activity, then the low yield could elevate the MDA to a value above the customer requested detection limit.
When possible, an I-129 laboratory standard is analyzed with the batch of samples. The quality of the tracing is indicated by the successful laboratory spike containing I-129. The % recovery for the I-129 [(measured dpm/added dpm)*100] for the I-129 laboratory spike is used as a data quality indicator.
Each batch contains a method blank, a laboratory spike (when possible), and ≤20 samples. Results are reported with 1-sigma uncertainty, which is determined for each sample based on counting statistics and other known dominant sources of uncertainty (pipet, standard certificate value, etc.). Calculations are carried out using a spreadsheet maintained in accordance with ADS-WI00023.
C-14
When carrying out C-14 analyses, the material is added to a mixture of sodium hydroxide and sodium carbonate/sodium hydroxide. A series of oxidation and reduction steps designed to liberate C-14 containing carbon dioxide are carried out, which selectively traps the volatile C-14 in a basic solution. Finally, carbon dioxide containing the purified C-14 is captured in Carbosorb E and measured by liquid scintillation analysis. Aliquots of the C-14 containing Carbosorb E are added to liquid scintillation cocktail and analyzed by liquid scintillation analysis with an appropriate quench curve/efficiency calibration to convert cpm to dpm.
Each batch contains a method blank and ≤20 samples. Results are reported with 1-sigma uncertainty, which is determined for each sample based on counting statistics and other known
dominant sources of uncertainty (pipet, standard certificate value, etc.). Calculations are carried out using a spreadsheet maintained in accordance with ADS-WI00023.
Th-229, Th-230, Ac-227
Paired aliquots of material for each sample undergo radiochemical separations and analyses. One aliquot of the pair is analyzed without a spike, and one aliquot of the pair is spiked with a known quantity of Th-229 to determine separation yield.
Thorium is extracted from the matrix using two stages of a quaternary amine-based solid phase extraction and purified further via co-precipitation with cerium. Th-227, Th-229 and Th-230 concentrations in the final purified precipitate are measured using PIPS alpha spectrometers with known efficiencies. The Th-229 tracer yields are used to correct the results of each sample for any thorium losses from the radiochemical separations. Ac-227 activities are calculated from the Th-227 results.
Each batch contains a method blank, a matrix spike for each sample, a laboratory spike (Th-228), and ≤20 samples. Results are reported with 1-sigma uncertainty, which is determined for each sample based on counting statistics and other known dominant sources of uncertainty (pipet, standard certificate value, etc.). Calculations are carried out using a spreadsheet maintained in accordance with ADS-WI00023.
Cl-36
Aliquots of each sample are dissolved using known quantities of hydrochloric acid and nitric acid. The dissolved material is then aggressively decontaminated from interfering radionuclides. Eventually, the samples are distilled to further decontaminate by isolating the chlorine-containing fraction. Following the distillation, Cl-36 is precipitated as AgCl. The AgCl precipitate is counted for gross beta activity using a gas flow proportional counter and an accompanying Cl-36 counting efficiency. The same precipitate is then analyzed by NAA to trace the separation. The yield of the radiochemical separation is determined for each individual sample using NAA of the chlorine which was added during the dissolution.
Each batch contains a method blank and ≤20 samples. Results are reported with 1-sigma uncertainty, which is determined for each sample based on counting statistics and other known dominant sources of uncertainty (pipet, standard certificate value, etc.), as described in the AOP. Calculations are carried out using a spreadsheet maintained in accordance with ADS-WI00023.
K-40
Aliquots of dissolved material are subjected to a series of decontamination processes to remove cesium, strontium, and tri-, tetra-, and hexavalent radionuclides. Following the extractions (which selectively remove interferences in the matrix yet do not impact the potassium), the samples are analyzed by coaxial high purity germanium spectrophotometers with an appropriate efficiency and energy calibration to convert peak energy, peak size and counting duration to dpm.
Each batch contains a method blank and ≤20 samples. Results are reported with 1-sigma uncertainty, which is determined for each sample based on counting statistics and other known dominant sources of uncertainty (pipet, standard certificate value, etc.), or a minimum of 5% uncertainty, as described in the AOP. Calculations are carried out using a spreadsheet maintained in accordance with ADS-WI00023.
Pt-193
Aliquots of dissolution are spiked with stable platinum which will be used to trace the separation efficiency on a sample-by-sample basis. The platinum species are extracted from the matrix using several types of extractant (AMP to remove cesium and TEVA to separate the platinum from other interferences). Following the radiochemical separation schemes, an aliquot of the extracted platinum-containing material is transferred to a stainless-steel plate (for Pt-193 analysis). An additional aliquot is sent to the ICP-ES laboratory to determine the platinum content in the separated material, and thus the separation yield.
Pt-193 concentrations are measured using low energy photon/x-ray, thin-windowed, semi-planar high purity germanium spectrometers with an appropriate efficiency to convert peak size and counting duration to dpm. Elemental platinum carrier yields are measured by ICP-ES, and are used to correct the Pt-193 analyses for any platinum losses from the radiochemical separations. The quality of the tracing is indicated by the successful quantification of the tracer (tracer activity is greater than MDA for each individual count) as well as sufficient recovery to provide the customer-requested sensitivity. For instance, if the separation yield is low, and the Pt-193 concentration is less than the minimum detectable activity, then the low yield could elevate the MDA to a value above the customer requested detection limit.
Each batch contains a method blank and ≤20 samples. Results are reported with 1-sigma uncertainty, which is determined for each sample based on counting statistics and other known dominant sources of uncertainty (pipet, standard certificate value, etc.), or a minimum of 5% uncertainty, as described in the AOP. Calculations are carried out using a spreadsheet maintained in accordance with ADS-WI00023.
Nb-94
Aliquots of dissolved material are spiked with Zr-95 (which decays to Nb-95) which will be used to trace the separation efficiency on a sample-by-sample basis. The niobium species are extracted from the matrix using an anion exchange process following decontamination from interfering radionuclides. Aliquots of the niobium-containing aliquots are analyzed using a high purity germanium gamma-ray spectrophotometer with an appropriate efficiency calibration to convert peak energy, peak size and counting duration to dpm for both Nb-94 and Nb-95. Yields for Nb-95 are used to correct the radioactive niobium species’ analyses for any losses from the radiochemical separations. The Nb-94 values are yield-corrected using the Nb-95 recoveries [(dpm Nb-94/(dpm Nb-95 recovered/dpm Nb-95 added)]. The quality of the tracing is indicated by the successful quantification of the tracer (tracer activity is greater than MDA for each individual count) as well as sufficient recovery to provide the customer-requested sensitivity. For instance, if the Nb-94 concentration is less than the minimum detectable activity and the
separation yield is low, then the low yield could elevate the MDA to a value above the customer requested detection limit.
Each batch contains a method blank and ≤20 samples. Results are reported with 1-sigma uncertainty, which is determined for each sample based on counting statistics and other known dominant sources of uncertainty (pipet, standard certificate value, etc.), or a minimum of 5% uncertainty, as described in the AOP. Calculations are carried out using a spreadsheet maintained in accordance with ADS-WI00023.
Pd-107
Aliquots of dissolved material are decontaminated from interfering radionuclides using a combination of resins. Eventually, the palladium is extracted from the samples using a DMG-based extractant. The purified palladium-containing aliquots are analyzed using the ICP-MS to measure Pd-107/Pd-105 mass ratios. After accounting for the mass-107 interference from silver, the ratio for each sample is then multiplied by the Pd-105 concentration for the same sample which was obtained by simple ICP-MS analysis of dissolved material which did not undergo the radiochemical separation steps. This results in a Pd-107 result which has been traced using Pd-105 inherent to each individual sample’s matrix.
Each batch contains a method blank and ≤20 samples. Results are reported with 1-sigma uncertainty, as reported by the ICP-MS results reports. Calculations are carried out using a spreadsheet maintained in accordance with ADS-WI00023.
Zr-93
Zirconium is extracted from aliquots of dissolved material using a CMPO/TBP based extraction system. The purified ziconium-containing aliquots are analyzed using the ICP-MS to measure Zr-93/Zr-91 mass ratios. The ratio for each sample is then multiplied by the Zr-91 concentration for the dissolved, un-extracted sample which was obtained by simple ICP-MS analysis of dissolved material. This results in a Zr-93 result which has been traced using Zr-91 inherent to each individual sample’s matrix.
Each batch contains a method blank and ≤20 samples. Results are reported with 1-sigma uncertainty, as reported by the ICP-MS results reports. Calculations are carried out using a spreadsheet maintained in accordance with ADS-WI00023.
Pu-242, 244
Plutonium is extracted from aliquots of dissolved material using Eichrom TEVA resin. The purified plutonium-containing aliquots are analyzed using the ICP-MS to measure Pu-242, Pu-244 and Pu-239 mass ratios. The ratios for each sample are then multiplied by the Pu-239 concentration for the same sample which was obtained by the traced radiochemical separation and analysis scheme discussed previously in the Pu-238, 239/240, 241 section. This provides Pu-242 and Pu-244 results which have been traced by virtue of the Pu-239 value determined by an independent method.
Each batch contains a method blank and ≤20 samples. Results are reported with 1-sigma uncertainty, as reported by the ICP-MS results reports. Calculations are carried out using a spreadsheet maintained in accordance with ADS-WI00023.
U-233, U-234, U-235, U-236
Uranium is extracted from aliquots of dissolved material using Eichrom UTEVA resin. The purified uranium-containing aliquots are analyzed using the ICP-MS to measure U-233, U-234, U-235, U-236, and U-238 mass ratios. The mass ratios for each sample are then multiplied by the concentration of the best uranium isotope option (which is matrix dependent) in the same sample which was obtained by the simple ICP-MS analysis of dissolved, un-extracted material. This results in uranium results which have been traced using uranium inherent to each individual sample’s matrix. For example, if the ICP-MS of dissolved material provides a mass concentration for U-235, then the U-233/U-235 mass ratio from the U-extract would be multiplied by the U-235 mass concentration in the dissolved, un-extracted sample to obtain a U-233 mass concentration. This would then be converted to U-233 activity concentration using the specific activity of U-233.
Each batch contains a method blank and ≤20 samples. Results are reported with 1-sigma uncertainty, as reported by the ICP-MS results reports. Calculations are carried out using a spreadsheet maintained in accordance with ADS-WI00023.
Liquid Waste Tank Residuals Sampling- SRR-CWDA-2011-00117 Quality Assurance Program Plan Revision 1 July 2013
Page A.2-14 of A.2-265
ANALYTICAL OPERATING PROCEDURES
Analytical Development Section Analytical Operating Procedures
Manual: L16.1 Procedure: ADS-1543
Volume 2 Revision: 5 Inductively Coupled Plasma – Mass Spectrometer Elemental and Isotopic Analysis for Aqueous Liquid Samples Plasmaquad II RADICPMS Major Revision
Effective Date: 06/29/11 Type-Category: Technical Page: 1 of 29
Electronic Approval on File: Author/Task Supervisor: __________________________ L. C. Johnson Peer Reviewer: __________________________ M. A. Jones ADS Spectroscopy & Separations Group Manager __________________________ C. M. Gregory ADS Procedure Coordinator __________________________ M. S. Hanks
Procedure: ADS-1543 Inductively Coupled Plasma – Mass Spectrometer Elemental and Isotopic Analysis for Aqueous Liquid Samples Plasmaquad II RADICPMS Major Revision
Revision: 5 Page: 2 of 29
1.0 INTRODUCTION
1.1 Purpose The purpose of this procedure is to provide a basic operating format for the Rad Plasma Quad II Inductively Coupled Plasma Mass Spectrometer (ICPMS). The instrument is used to analyze liquid samples for support of site processes as well as research and development efforts being performed to support these processes.
1.2 Scope
This procedure describes the minimum requirements for the use of the ICPMS for the quantitative analysis of elements or isotopes in aqueous solutions at low concentrations (µg/L to low mg/L), or for the semi-quantitative measurement of inorganic elements and isotopes in aqueous solutions. There are different modes of operation, such as scan, peak jump, and isotope ratio. The Task Supervisor reviews the requested analysis to determine if it is suitable for the instrument. Problems such as the matrix interference, high concentrations of interfering elements and oxide interference may require the sample be directed to other analytical techniques. The solution to be analyzed must be in the form of an aqueous liquid with few or no insoluble particles present. Dissolved elements will be determined in heterogeneous samples, once they are filtered and acidified
, except in the case of analyses for iodide which are performed in an alkaline matrix. Upon request, total elements can be determined after appropriate digestion procedures are performed.
Organic samples may be analyzed under certain conditions, with the direction of the task supervisor or technical personnel. The matrix for iodide analyses is a 5% proprietary tertiary amine reducing solution and its use for these analyses is outlined below.
Procedure: ADS-1543 Inductively Coupled Plasma – Mass Spectrometer Elemental and Isotopic Analysis for Aqueous Liquid Samples Plasmaquad II RADICPMS Major Revision
Revision: 5 Page: 3 of 29
2.0 GENERAL INFORMATION
2.1 Definitions and Abbreviations
1. Scan
- This mode of operation collects data for a complete spectrum containing information for all the isotopes within the mass range selected. Data is collected for large number of points (20 per peak), so that the peak shape is defined for each isotope and the area under the peak is integrated.
2. Peak Jump -
3.
In this mode, the mass spectrometer is used to collect data for isotopes of interest. This mode often used when analyses are being performed on a few analytes in low concentrations.
Quantitative
4.
- A set of external calibration standards containing the analytes of interest are used for calibration. The standards cover the range of concentrations expected in the sample.
Semi-Quantitative
5.
- A plot of mass against sensitivity yields a relatively smooth curve, this response could be used to calibrate the instrument to provide semi quantitative data.
Qualitative-
3.0 PRECAUTIONS AND LIMITATIONS
Collect data over the complete mass range and visually examine the spectra for the presence or absence of analytes.
3.1 Safety
1. The plasma source emits strong ultraviolet (UV) radiation, which can cause permanent eye damage. Do not look directly at the source unless it is viewed through UV absorbing material. Although the UV shield is interlocked to prevent its removal during plasma operation,
2. Concentrated nitric acid is an extremely corrosive and toxic chemical that must be handled with care. The acid irritates all parts of the respiratory tract and is corrosive to the skin and other tissues, especially the eyes.
do not remove the UV shield if the plasma is on. Ensure the instrument is in the Vacuum Ready state and power down the RF generator with the Power On/Off switch on the front of the RF generator if the UV shield is to be removed and hands-on work is to be performed in the torch box.
Dilutions of concentrated acids (>3molar) whether samples or pure acid shall be performed in a hood with the sash pulled below chin level while wearing safety glasses with side shields and a lab coat. If the hood sash cannot be lowered or used for face protection goggles and a face shield
Procedure: ADS-1543 Inductively Coupled Plasma – Mass Spectrometer Elemental and Isotopic Analysis for Aqueous Liquid Samples Plasmaquad II RADICPMS Major Revision
Revision: 5 Page: 4 of 29
shall be worn. Due to a portion of the torso being exposed even with the hood sash lowered a lab apron shall also be worn over a lab coat.
3. High voltages are associated with the radio frequency (RF) generators, controllers, and the posterior, enclosed portion of the torch box.
4. Troubleshooting and/or hands-on work inside the front portion of the torch box shall not be performed under any circumstances while the RF generator is powered up. (See Section 5.11, Torch Box Maintenance/Adjustment/Alignment, below).
Electrical work on these parts shall not be performed while they are powered up, except by vendor’s service representative or a qualified electrical worker who understands the schematics, circuitry, and electrical hazards of the instrument. If only mechanical work is being performed on any of these parts be they shall be powered down and disconnected, where possible, so as to avoid any contact with RF and/or electrical energy.
5. A lab coat, safety glasses with side shields, and chemical gloves shall be worn when handling open containers of samples and/or chemicals.
6. The proprietary tertiary amine reducing solution concentrate, CFA-C that is used for iodide analyses is corrosive and toxic and the preparation/dilution of this material for subsequent use in analyses is to be performed in a hood as prescribed in Section 3.1, No. 2, above.
4.0 PREREQUISITES
4.1 Description of Method
The Inductively Coupled Plasma Mass Spectrometer (ICPMS) provides multi-element analyses of aqueous solutions based on the measurement of atomic species from their ions created in the plasma. Liquid samples are nebulized and the aerosol transported to argon plasma. In the high temperature plasma (~10,000 K) metallic species are ionized. The ions generated by the plasma enter the mass spectrometer through a sampling cone set near the end of the plasma. The ions are separated by a quadrapole mass filter and focused on a detector. The detector in this instrument is a channeltron. It can provide ion count or an analog signal. These ions are detected by an electron multiplier. The signal from the detector is amplified, measured, and stored in a multi-channel analyzer. These measurements are used to calibrate the instrument, perform sample analyses, and display spectra.
Procedure: ADS-1543 Inductively Coupled Plasma – Mass Spectrometer Elemental and Isotopic Analysis for Aqueous Liquid Samples Plasmaquad II RADICPMS Major Revision
Revision: 5 Page: 5 of 29
4.2 Quality Control
1. Instrument Calibration
A. Mass Calibration
B.
- The instrument is mass calibrated on a regular basis. Mass and detector cross calibrations are performed using a multi-element standard that contains lithium and uranium, the two elements necessary to perform the mass calibration properly. Refer to the ThermoElectron software manual regarding mass and detector cross calibrations.
Analytical Calibration for Concentration Measurements
2. Measurement Control Program
-For elemental quantification the instrument is calibrated for each analyte of interest by preparing and analyzing a series of standards containing known concentrations of the analyte(s) of interest. Semi-quantitative and qualitative analyses can also be performed when deemed adequate by all parties involved.
The rad ICPMS is a part of a measurement control system as defined by Manual 1Q, Procedure 2-7. The rad ICPMS measurement control program is designed to provide a method to monitor the performance of the ICPMS measurement system, and it provides a graded to approach to establish the quality of the data appropriate to the task requirements. These requirements are negotiated between Analytical Development Section and the customer. The requirements are subsequently documented in task plans.
Procedure: ADS-1543 Inductively Coupled Plasma – Mass Spectrometer Elemental and Isotopic Analysis for Aqueous Liquid Samples Plasmaquad II RADICPMS Major Revision
Revision: 5 Page: 6 of 29
A. For routine quantitative analyses a blank and calibration standards are analyzed prior to a set of samples.
B. QC or check standards are analyzed after the initial calibration and after a set of samples, as specified by the task supervisor. These standards are prepared from standards from a lot different from the calibration standards, or they are prepared from standards procured from another manufacturer. Check standards are used to verify the calibration; hence their concentration should fall within the range of the calibration standards. The results of the analysis of the check standard shall be within the limits set by the task supervisor.
C. Pipets used to measure samples and standards are part of the Measurement Systems and Equipment (MS&E) program.
4.3 Manufacturer
ICP Mass Spectrometer, (ICP-MS) Model Number: PlasmaQuad II, PQS-995 Fisons System Number 20259 Location - 773A B067 Thermo Electron 5225 Verona Rd Madison, WI 53711 608-276-6373 800-642-6538
Procedure: ADS-1543 Inductively Coupled Plasma – Mass Spectrometer Elemental and Isotopic Analysis for Aqueous Liquid Samples Plasmaquad II RADICPMS Major Revision
Revision: 5 Page: 7 of 29
4.4 Reagents
1. Argon Gas (Ar) – Ultra High purity >
2.
99.99%
Nitric Acid (HNO3)
3.
- Used for the preparation of standards and for sample processing must be ultra-high purity grade or equivalent.
CFA-C Reducing Solution
4.
– Proprietary tertiary amine reducing solution that is diluted to a concentration of 5% vol/vol and subsequently used for the preparation of standards and the dilution of samples for iodide analyses. The concentrate is purchased from Spectrosol in Warwick, NY. Phone no. 845-987-1300.
De-ionized water
5.
- Prepared by passing water through a mixed bed of cation and anion exchange resins. This ultra-pure water must be used for the preparation of dilute acids used to make calibration and check standards as well as diluting samples.
Stability Check Solution
6.
- A multi-element solution used daily to determine the stability of the instrument.
Calibration Standard Stock Solutions
7.
- The standard stock solutions are purchased or prepared form ultrahigh purity grade chemicals. All standards should be NIST traceable, or in compliance with QAP 2-7. For the quantitative analysis of an individual element, the instrument will be calibrated for the analyte, by preparing a standard curve for that analyte. For the quantitative analysis of multi-elements standards can be prepared either from a multi-element stock standard or by combining stock standards of the individual analytes of interest.
Internal standard
8.
- An analyte, not present in samples or standards, that is put in standards and samples in a known concentration in order to account for signal or enhancements that may be caused by sample matrices and/or instrument variability.
Check Standard
9.
- An independent standard defined as a standard with the same analytes as the standard used for calibrating the instrument, but from a different source or lot.
Blank solution
5.0 PROCEDURE
- The acid matrix used for the calibration standard with the selected concentration of internal standard.
5.1 Instrument Set-up
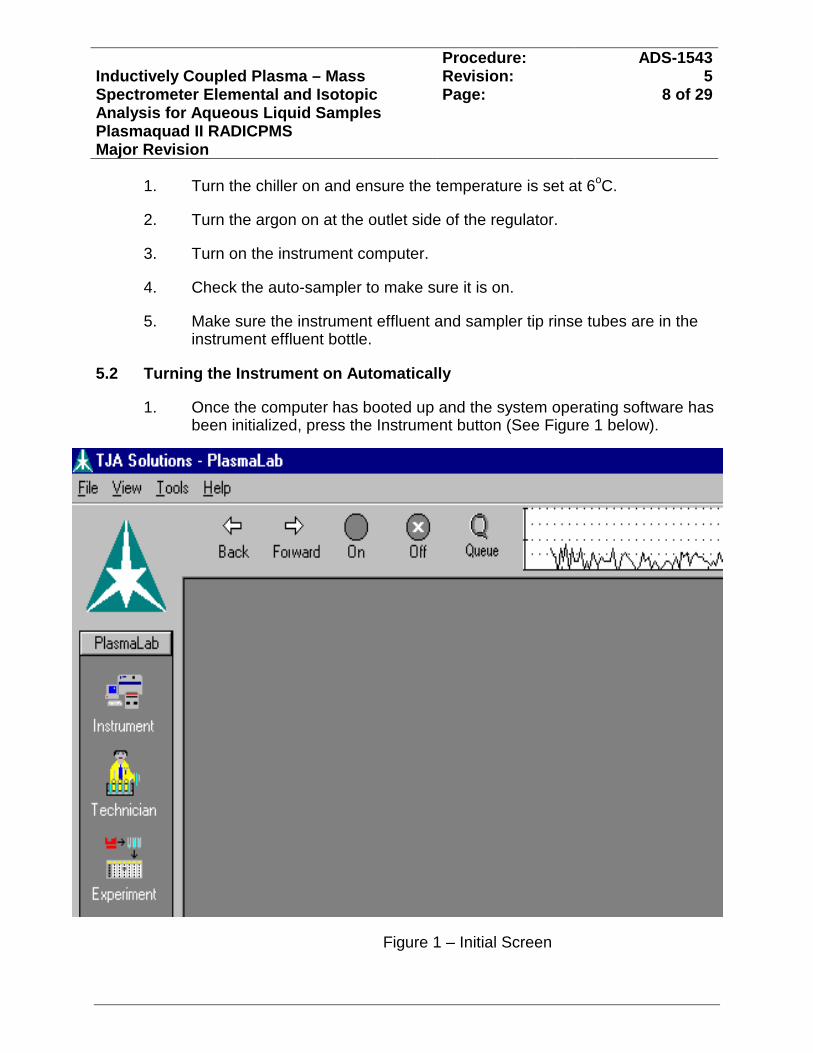
Procedure: ADS-1543 Inductively Coupled Plasma – Mass Spectrometer Elemental and Isotopic Analysis for Aqueous Liquid Samples Plasmaquad II RADICPMS Major Revision
Revision: 5 Page: 8 of 29
1. Turn the chiller on and ensure the temperature is set at 6oC.
2. Turn the argon on at the outlet side of the regulator.
3. Turn on the instrument computer.
4. Check the auto-sampler to make sure it is on.
5. Make sure the instrument effluent and sampler tip rinse tubes are in the instrument effluent bottle.
5.2 Turning the Instrument on Automatically
1. Once the computer has booted up and the system operating software has been initialized, press the Instrument button (See Figure 1 below).
Figure 1 – Initial Screen
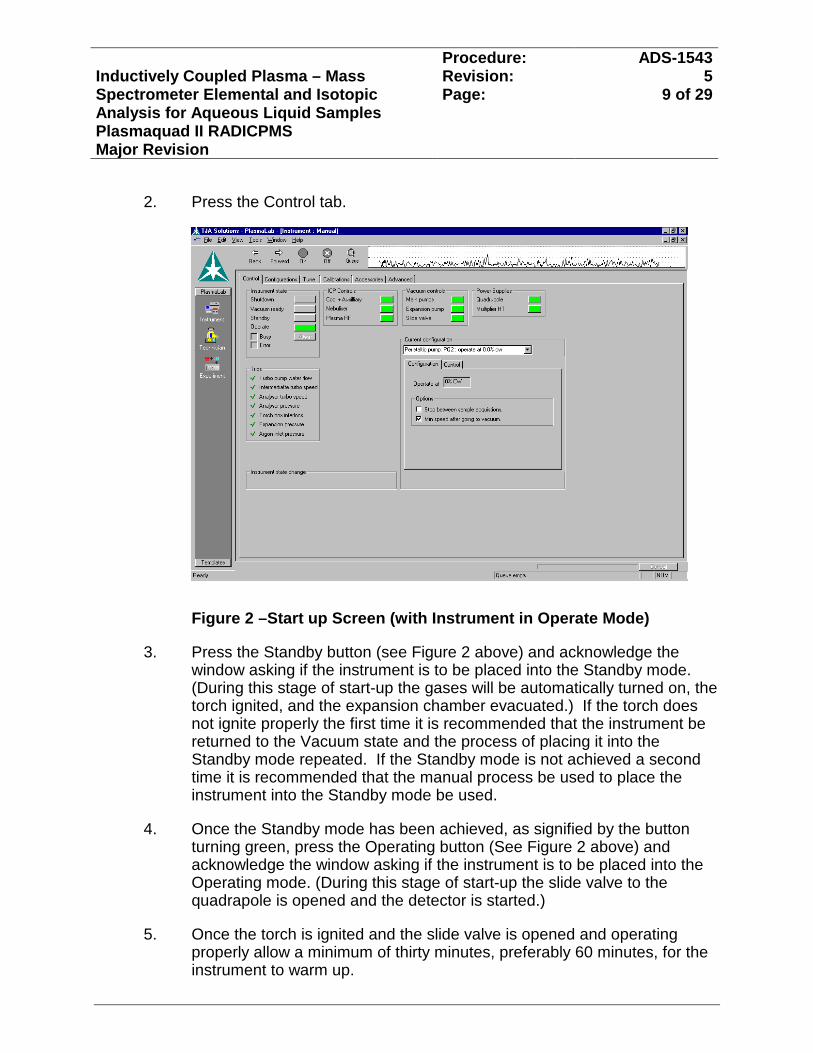
Procedure: ADS-1543 Inductively Coupled Plasma – Mass Spectrometer Elemental and Isotopic Analysis for Aqueous Liquid Samples Plasmaquad II RADICPMS Major Revision
Revision: 5 Page: 9 of 29
2. Press the Control tab.
Figure 2 –Start up Screen (with Instrument in Operate Mode)
3. Press the Standby button (see Figure 2 above) and acknowledge the window asking if the instrument is to be placed into the Standby mode. (During this stage of start-up the gases will be automatically turned on, the torch ignited, and the expansion chamber evacuated.) If the torch does not ignite properly the first time it is recommended that the instrument be returned to the Vacuum state and the process of placing it into the Standby mode repeated. If the Standby mode is not achieved a second time it is recommended that the manual process be used to place the instrument into the Standby mode be used.
4. Once the Standby mode has been achieved, as signified by the button turning green, press the Operating button (See Figure 2 above) and acknowledge the window asking if the instrument is to be placed into the Operating mode. (During this stage of start-up the slide valve to the quadrapole is opened and the detector is started.)
5. Once the torch is ignited and the slide valve is opened and operating properly allow a minimum of thirty minutes, preferably 60 minutes, for the instrument to warm up.
Procedure: ADS-1543 Inductively Coupled Plasma – Mass Spectrometer Elemental and Isotopic Analysis for Aqueous Liquid Samples Plasmaquad II RADICPMS Major Revision
Revision: 5 Page: 10 of 29
5.3 Turning the Instrument on Manually
1. With the instrument in the Vacuum mode, press the Aux. and Cool gas button (see Figure 2 above) and allow the gases to come on.
2. Press the Nebulizer gas button (see Figure 2 above) and allow the system to go through start-up and purge.
3. Press the Nebulizer gas button again to turn the nebulizer gas off and allow the system to go through the process of turning off the gas to the nebulizer.
4. Once the nebulizer pressure has reached zero, press the RF button (see Figure 2 above) to ignite the torch.
5. Once the torch ignites press the Expansion pump button (see Figure 2 above) to start the vacuum pump.
6. Press the Nebulizer gas button and allow the nebulizer gas to achieve its proper setting.
7. The system is now in the Standby mode, as signified by the Standby button being green.
8. Press the Operate button (see Figure 2 above) to open the slide valve and turn on the multiplier.
9. The system is now in the Operate mode and should be allowed at least thirty minutes (sixty minutes are preferable) for warm-up.
5.4 Tuning Ion Lenses to Optimize Sensitivity
1. Once the instrument has been allowed sufficient time to warm up, place the sample uptake tube into a stability check solution which contains the element indium, which is used to “tune” the instrument.
2. Press the Technician button and then press the Real-Time Display tab (See figure 3 below).
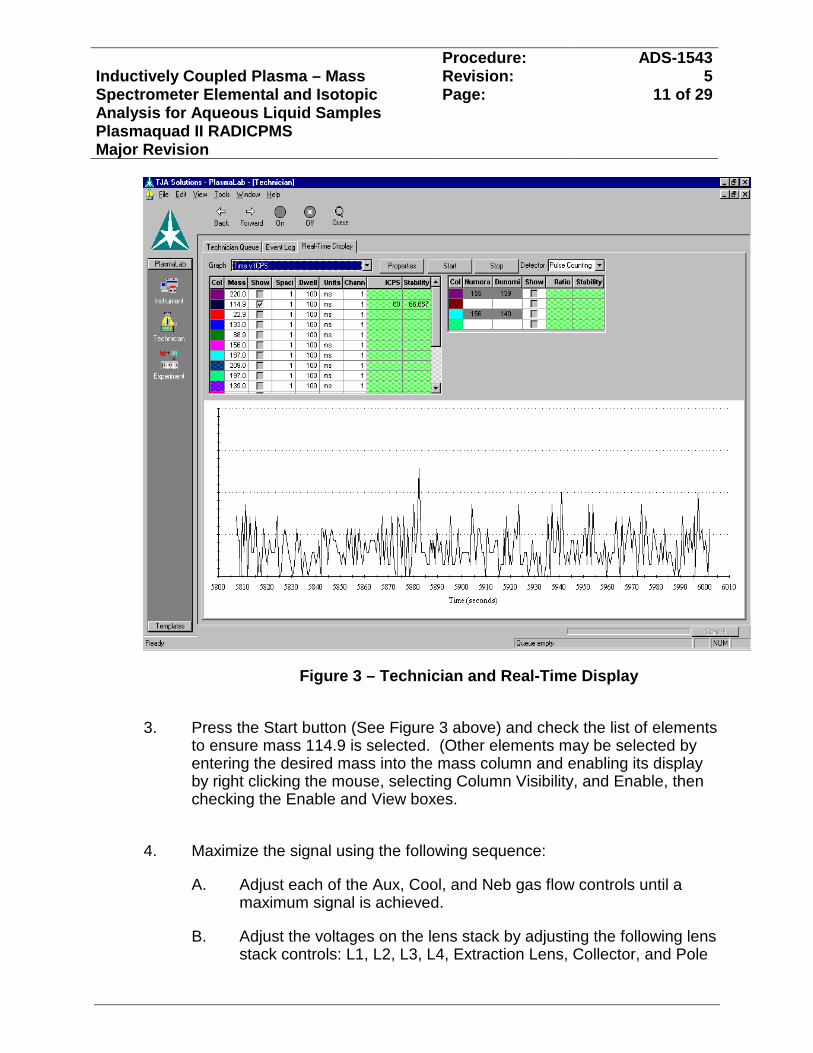
Procedure: ADS-1543 Inductively Coupled Plasma – Mass Spectrometer Elemental and Isotopic Analysis for Aqueous Liquid Samples Plasmaquad II RADICPMS Major Revision
Revision: 5 Page: 11 of 29
Figure 3 – Technician and Real-Time Display
3. Press the Start button (See Figure 3 above) and check the list of elements to ensure mass 114.9 is selected. (Other elements may be selected by entering the desired mass into the mass column and enabling its display by right clicking the mouse, selecting Column Visibility, and Enable, then checking the Enable and View boxes.
4. Maximize the signal using the following sequence:
A. Adjust each of the Aux, Cool, and Neb gas flow controls until a maximum signal is achieved.
B. Adjust the voltages on the lens stack by adjusting the following lens stack controls: L1, L2, L3, L4, Extraction Lens, Collector, and Pole
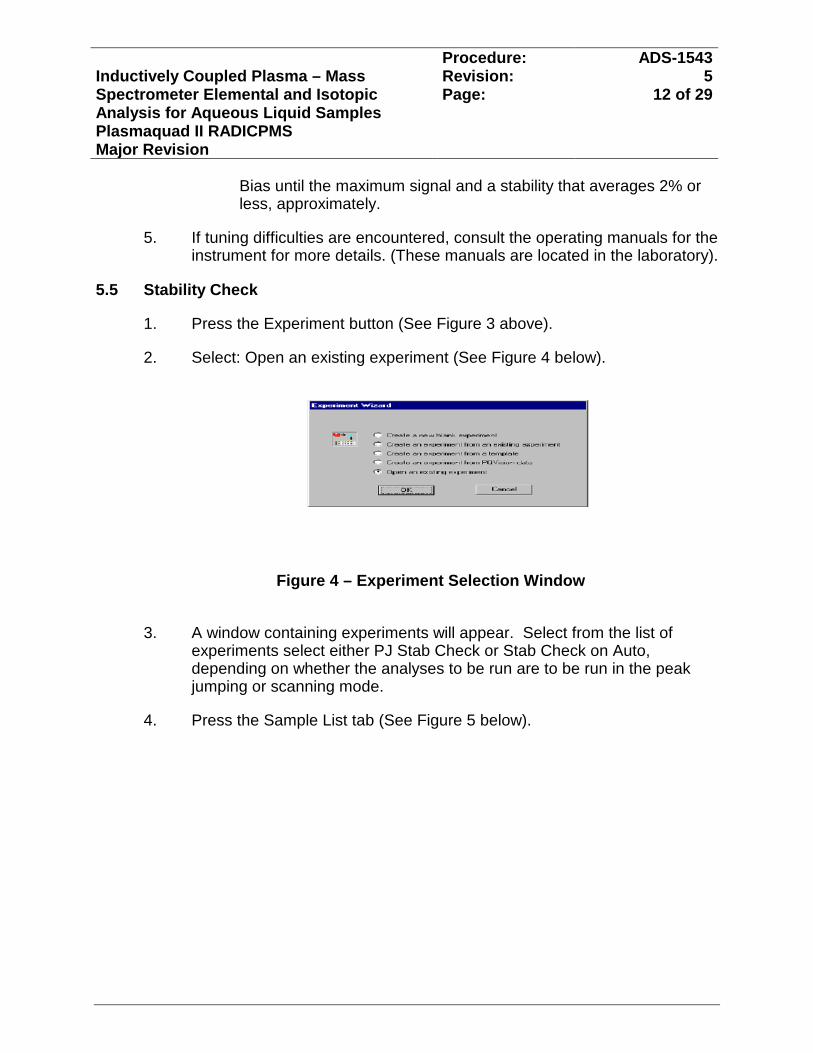
Procedure: ADS-1543 Inductively Coupled Plasma – Mass Spectrometer Elemental and Isotopic Analysis for Aqueous Liquid Samples Plasmaquad II RADICPMS Major Revision
Revision: 5 Page: 12 of 29
Bias until the maximum signal and a stability that averages 2% or less, approximately.
5. If tuning difficulties are encountered, consult the operating manuals for the instrument for more details. (These manuals are located in the laboratory).
5.5 Stability Check
1. Press the Experiment button (See Figure 3 above).
2. Select: Open an existing experiment (See Figure 4 below).
Figure 4 – Experiment Selection Window
3. A window containing experiments will appear. Select from the list of experiments select either PJ Stab Check or Stab Check on Auto, depending on whether the analyses to be run are to be run in the peak jumping or scanning mode.
4. Press the Sample List tab (See Figure 5 below).
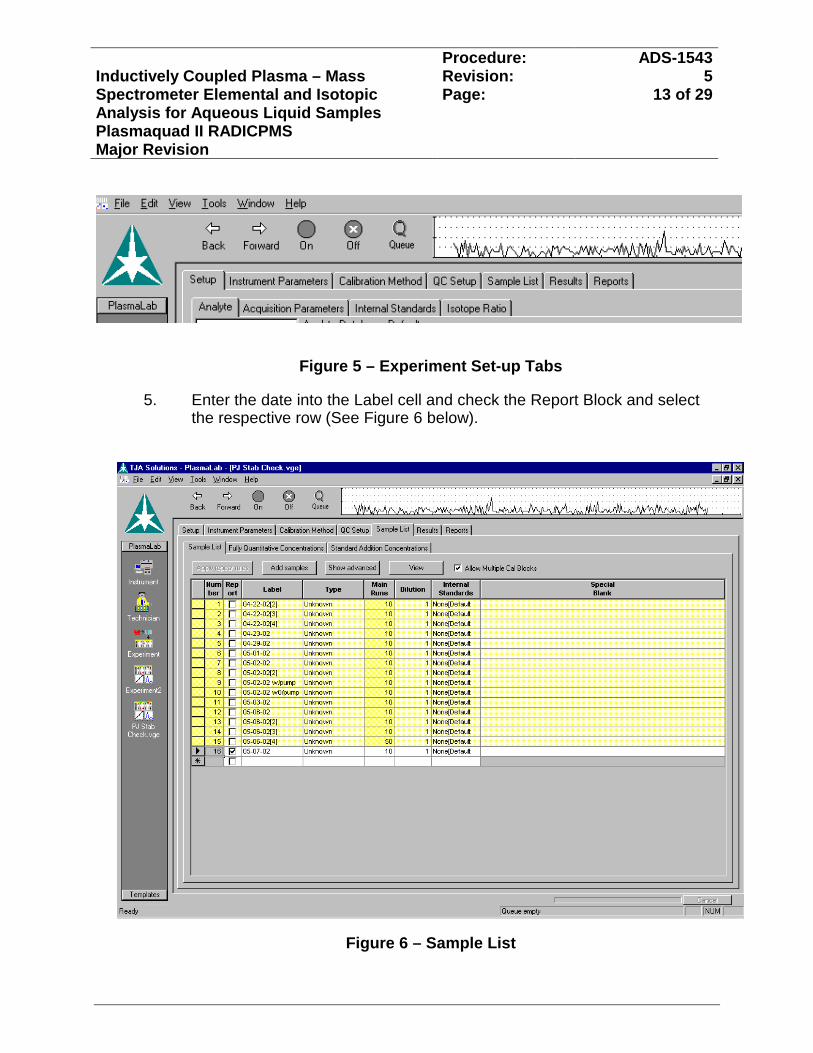
Procedure: ADS-1543 Inductively Coupled Plasma – Mass Spectrometer Elemental and Isotopic Analysis for Aqueous Liquid Samples Plasmaquad II RADICPMS Major Revision
Revision: 5 Page: 13 of 29
Figure 5 – Experiment Set-up Tabs
5. Enter the date into the Label cell and check the Report Block and select the respective row (See Figure 6 below).
Figure 6 – Sample List
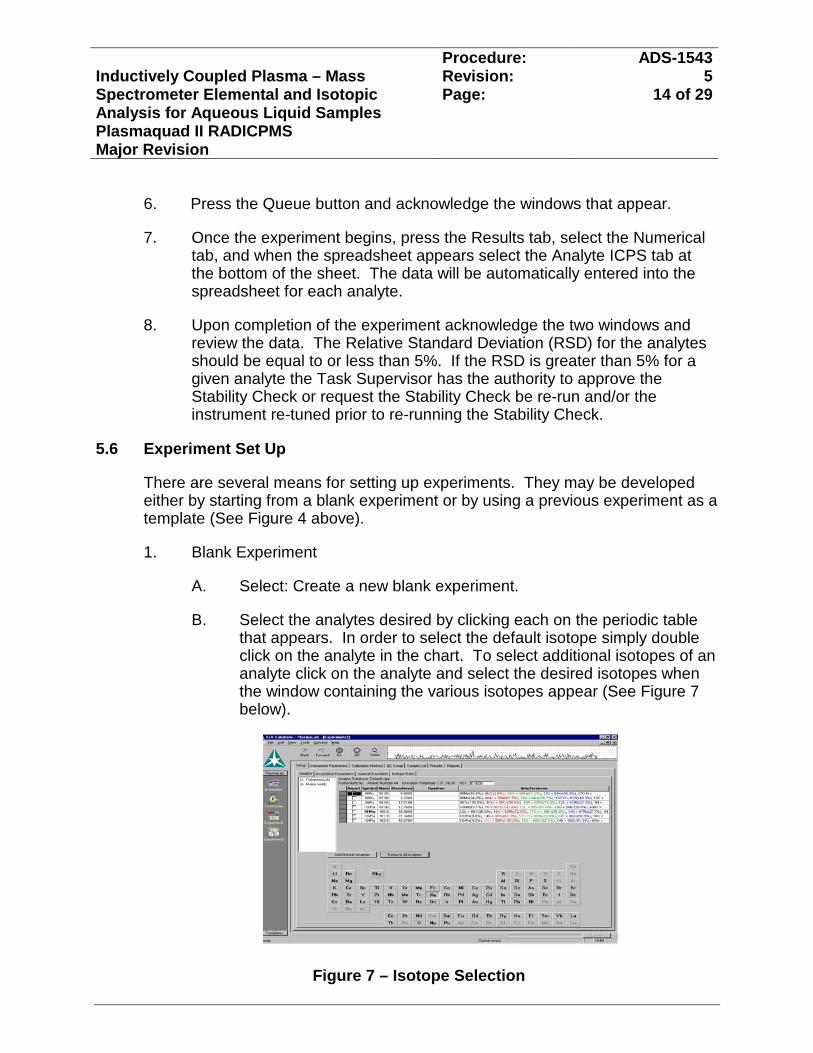
Procedure: ADS-1543 Inductively Coupled Plasma – Mass Spectrometer Elemental and Isotopic Analysis for Aqueous Liquid Samples Plasmaquad II RADICPMS Major Revision
Revision: 5 Page: 14 of 29
6. Press the Queue button and acknowledge the windows that appear.
7. Once the experiment begins, press the Results tab, select the Numerical tab, and when the spreadsheet appears select the Analyte ICPS tab at the bottom of the sheet. The data will be automatically entered into the spreadsheet for each analyte.
8. Upon completion of the experiment acknowledge the two windows and review the data. The Relative Standard Deviation (RSD) for the analytes should be equal to or less than 5%. If the RSD is greater than 5% for a given analyte the Task Supervisor has the authority to approve the Stability Check or request the Stability Check be re-run and/or the instrument re-tuned prior to re-running the Stability Check.
5.6 Experiment Set Up
There are several means for setting up experiments. They may be developed either by starting from a blank experiment or by using a previous experiment as a template (See Figure 4 above).
1. Blank Experiment
A. Select: Create a new blank experiment.
B. Select the analytes desired by clicking each on the periodic table that appears. In order to select the default isotope simply double click on the analyte in the chart. To select additional isotopes of an analyte click on the analyte and select the desired isotopes when the window containing the various isotopes appear (See Figure 7 below).
Figure 7 – Isotope Selection
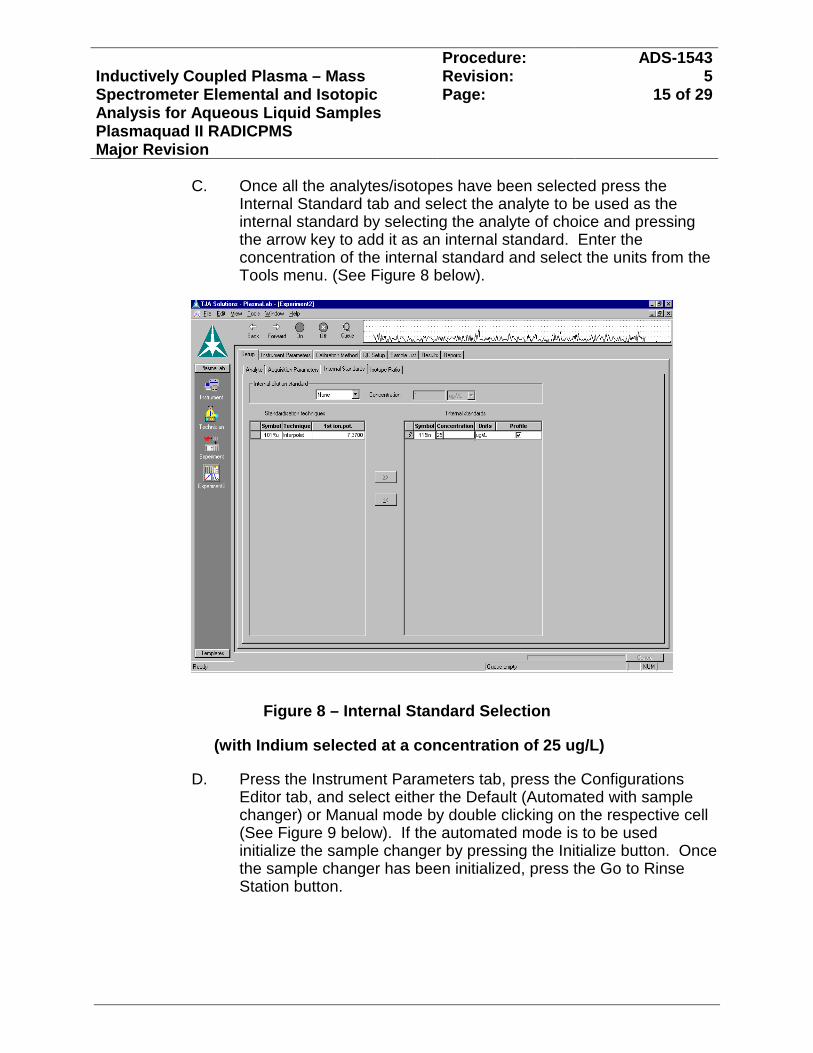
Procedure: ADS-1543 Inductively Coupled Plasma – Mass Spectrometer Elemental and Isotopic Analysis for Aqueous Liquid Samples Plasmaquad II RADICPMS Major Revision
Revision: 5 Page: 15 of 29
C. Once all the analytes/isotopes have been selected press the Internal Standard tab and select the analyte to be used as the internal standard by selecting the analyte of choice and pressing the arrow key to add it as an internal standard. Enter the concentration of the internal standard and select the units from the Tools menu. (See Figure 8 below).
Figure 8 – Internal Standard Selection
(with Indium selected at a concentration of 25 ug/L)
D. Press the Instrument Parameters tab, press the Configurations Editor tab, and select either the Default (Automated with sample changer) or Manual mode by double clicking on the respective cell (See Figure 9 below). If the automated mode is to be used initialize the sample changer by pressing the Initialize button. Once the sample changer has been initialized, press the Go to Rinse Station button.
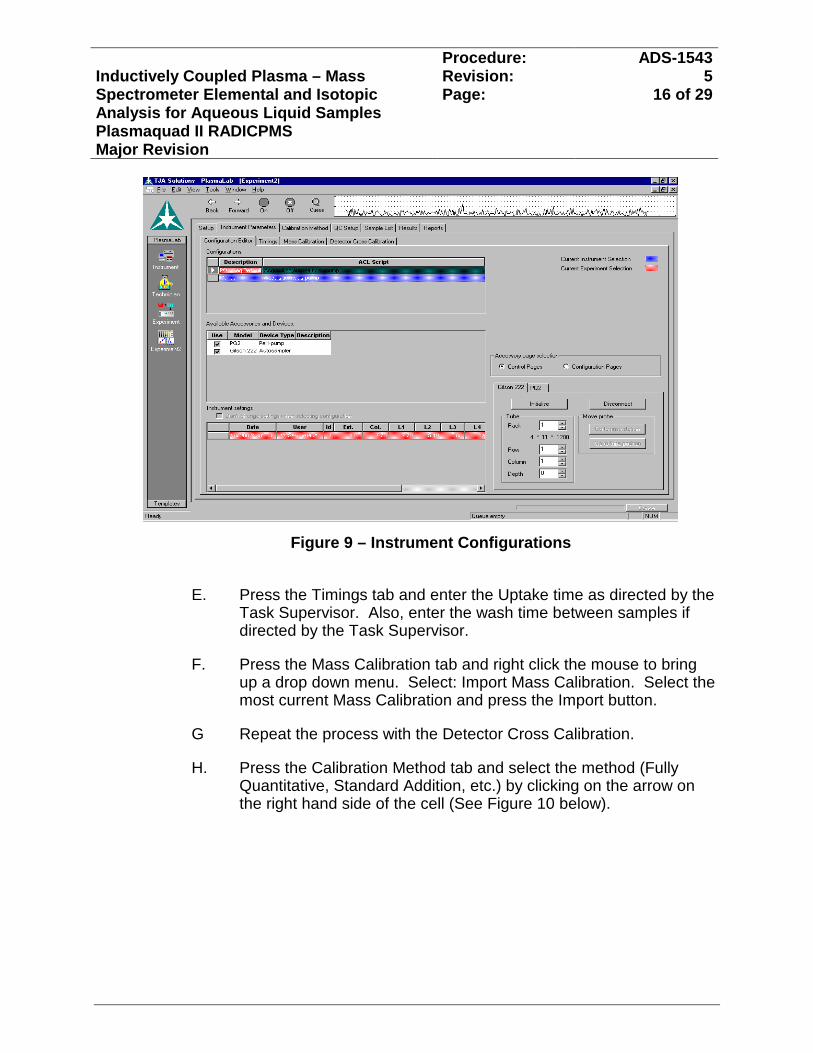
Procedure: ADS-1543 Inductively Coupled Plasma – Mass Spectrometer Elemental and Isotopic Analysis for Aqueous Liquid Samples Plasmaquad II RADICPMS Major Revision
Revision: 5 Page: 16 of 29
Figure 9 – Instrument Configurations
E. Press the Timings tab and enter the Uptake time as directed by the Task Supervisor. Also, enter the wash time between samples if directed by the Task Supervisor.
F. Press the Mass Calibration tab and right click the mouse to bring up a drop down menu. Select: Import Mass Calibration. Select the most current Mass Calibration and press the Import button.
G Repeat the process with the Detector Cross Calibration.
H. Press the Calibration Method tab and select the method (Fully Quantitative, Standard Addition, etc.) by clicking on the arrow on the right hand side of the cell (See Figure 10 below).
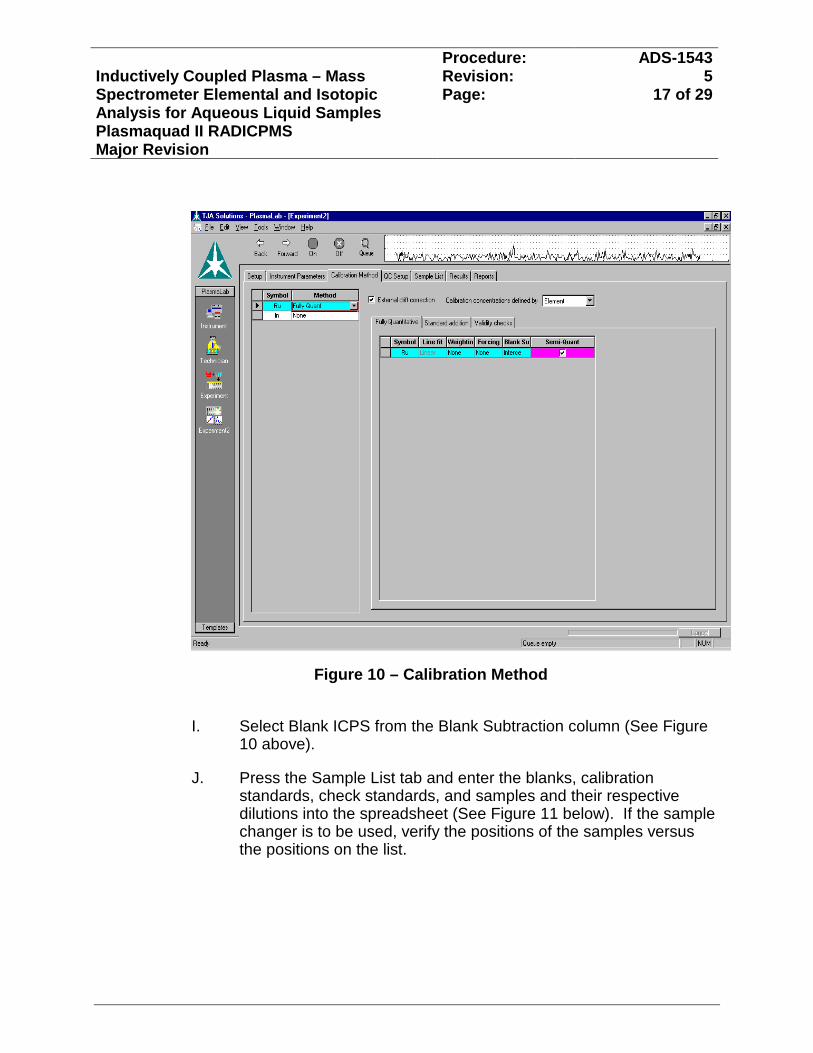
Procedure: ADS-1543 Inductively Coupled Plasma – Mass Spectrometer Elemental and Isotopic Analysis for Aqueous Liquid Samples Plasmaquad II RADICPMS Major Revision
Revision: 5 Page: 17 of 29
Figure 10 – Calibration Method
I. Select Blank ICPS from the Blank Subtraction column (See Figure 10 above).
J. Press the Sample List tab and enter the blanks, calibration standards, check standards, and samples and their respective dilutions into the spreadsheet (See Figure 11 below). If the sample changer is to be used, verify the positions of the samples versus the positions on the list.
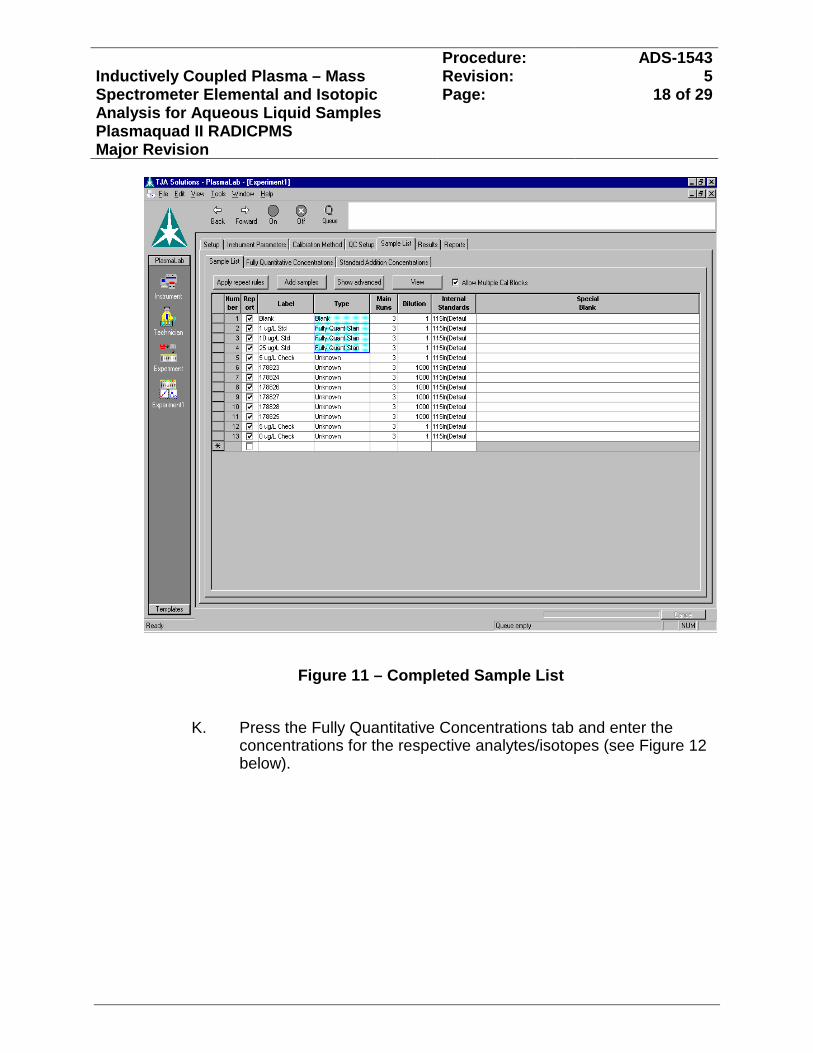
Procedure: ADS-1543 Inductively Coupled Plasma – Mass Spectrometer Elemental and Isotopic Analysis for Aqueous Liquid Samples Plasmaquad II RADICPMS Major Revision
Revision: 5 Page: 18 of 29
Figure 11 – Completed Sample List
K. Press the Fully Quantitative Concentrations tab and enter the concentrations for the respective analytes/isotopes (see Figure 12 below).
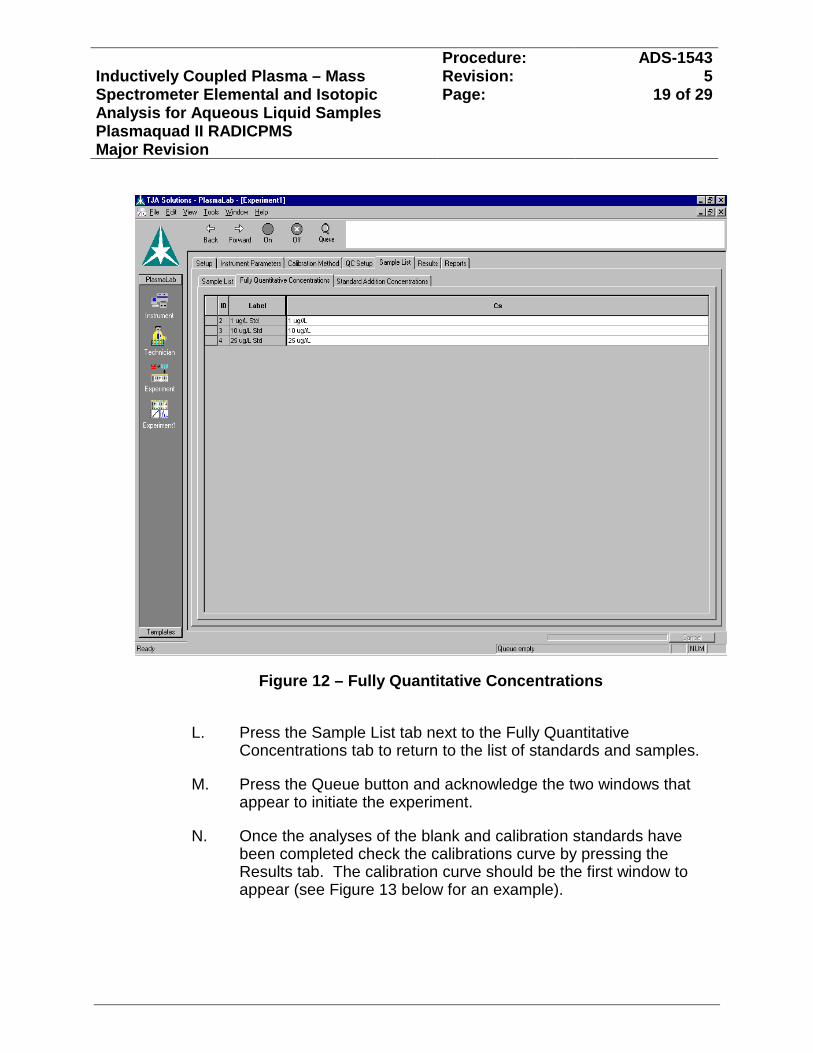
Procedure: ADS-1543 Inductively Coupled Plasma – Mass Spectrometer Elemental and Isotopic Analysis for Aqueous Liquid Samples Plasmaquad II RADICPMS Major Revision
Revision: 5 Page: 19 of 29
Figure 12 – Fully Quantitative Concentrations
L. Press the Sample List tab next to the Fully Quantitative Concentrations tab to return to the list of standards and samples.
M. Press the Queue button and acknowledge the two windows that appear to initiate the experiment.
N. Once the analyses of the blank and calibration standards have been completed check the calibrations curve by pressing the Results tab. The calibration curve should be the first window to appear (see Figure 13 below for an example).
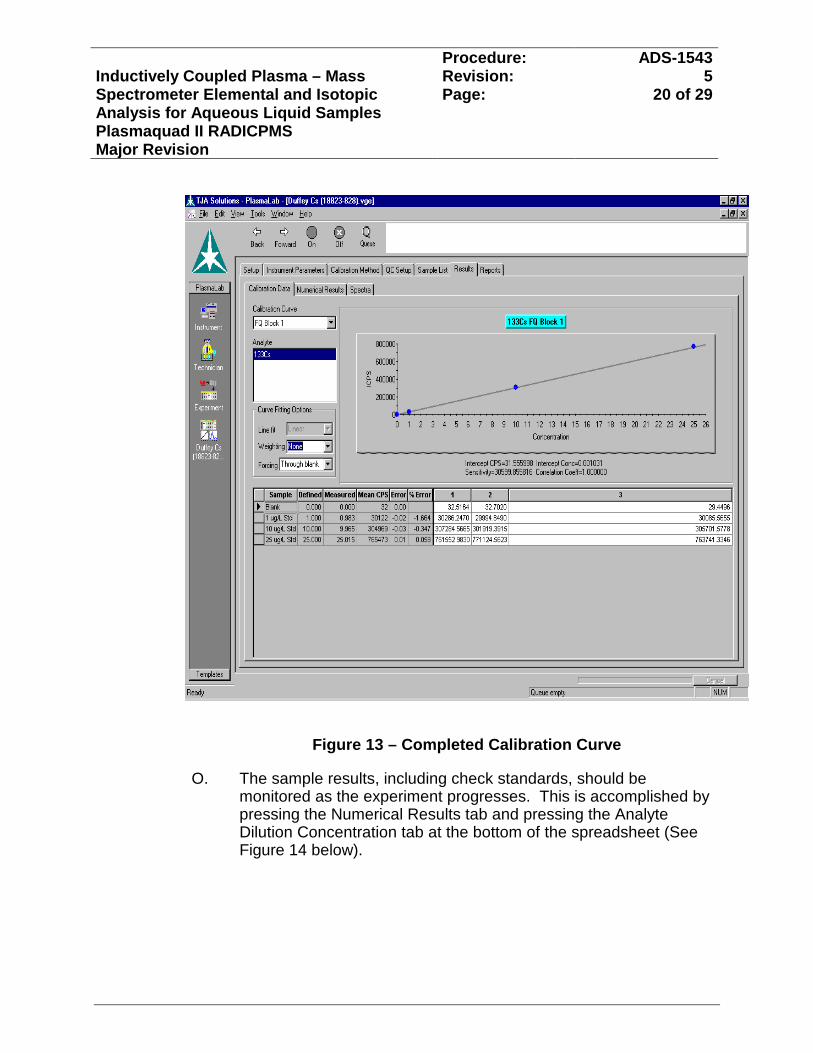
Procedure: ADS-1543 Inductively Coupled Plasma – Mass Spectrometer Elemental and Isotopic Analysis for Aqueous Liquid Samples Plasmaquad II RADICPMS Major Revision
Revision: 5 Page: 20 of 29
Figure 13 – Completed Calibration Curve
O. The sample results, including check standards, should be monitored as the experiment progresses. This is accomplished by pressing the Numerical Results tab and pressing the Analyte Dilution Concentration tab at the bottom of the spreadsheet (See Figure 14 below).
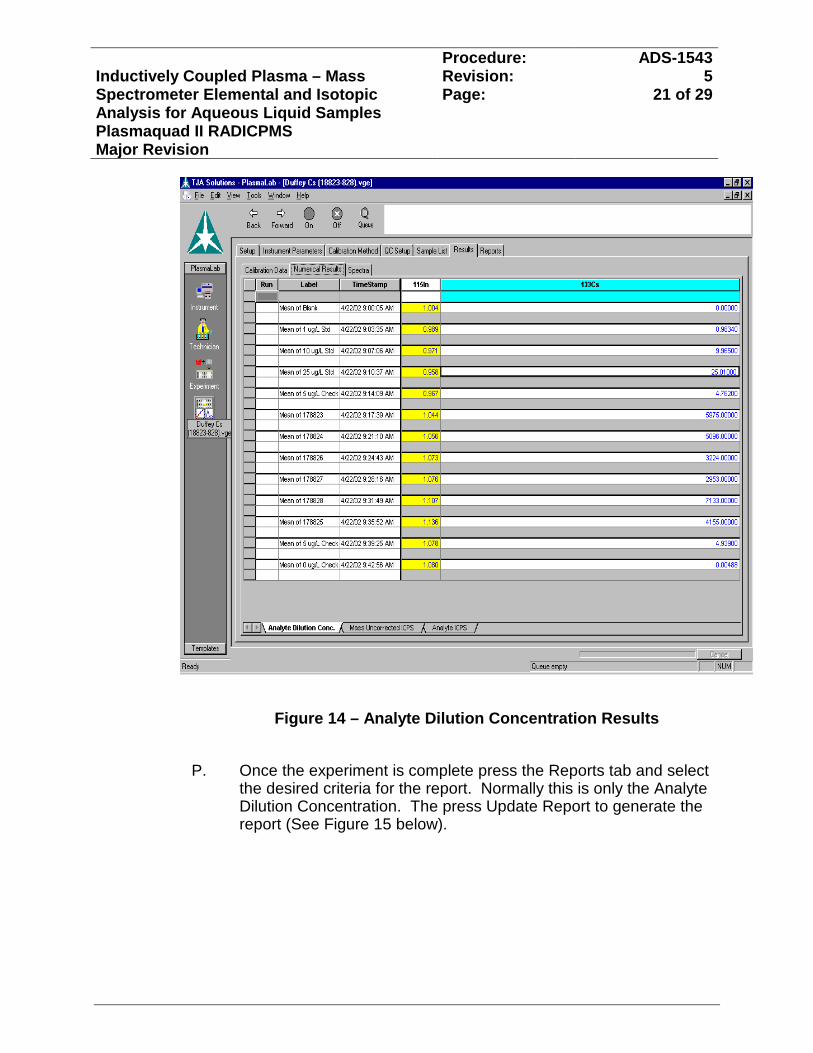
Procedure: ADS-1543 Inductively Coupled Plasma – Mass Spectrometer Elemental and Isotopic Analysis for Aqueous Liquid Samples Plasmaquad II RADICPMS Major Revision
Revision: 5 Page: 21 of 29
Figure 14 – Analyte Dilution Concentration Results
P. Once the experiment is complete press the Reports tab and select the desired criteria for the report. Normally this is only the Analyte Dilution Concentration. The press Update Report to generate the report (See Figure 15 below).
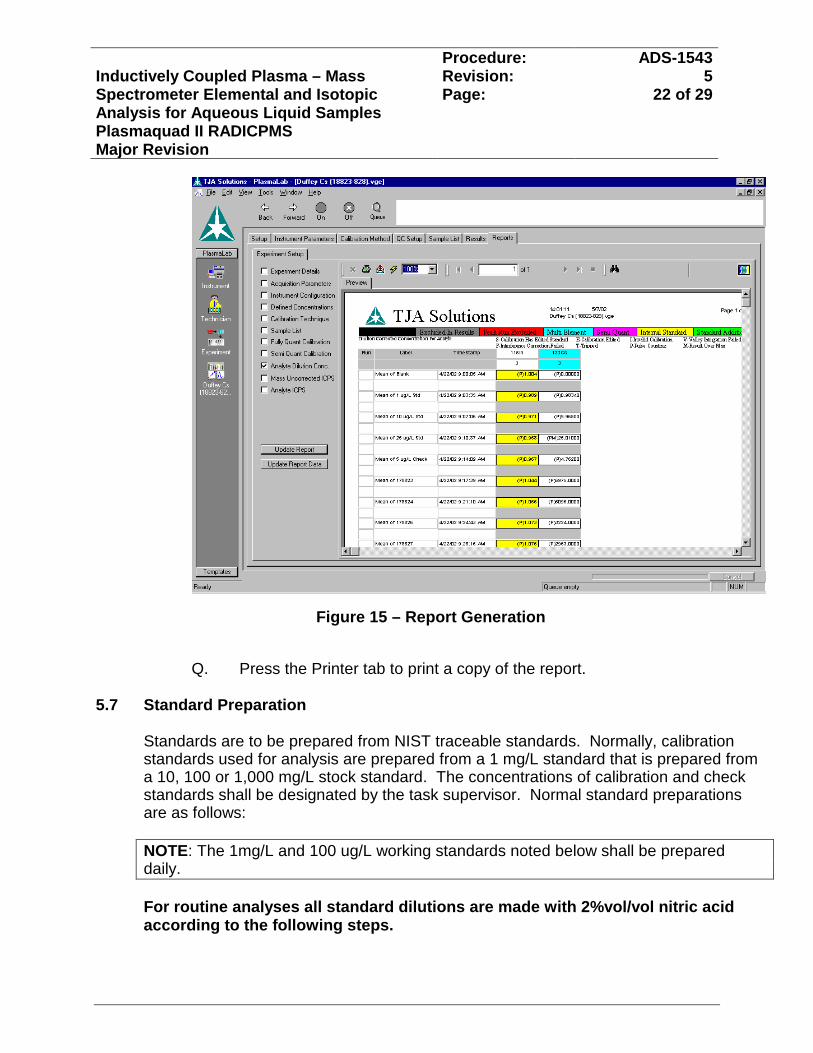
Procedure: ADS-1543 Inductively Coupled Plasma – Mass Spectrometer Elemental and Isotopic Analysis for Aqueous Liquid Samples Plasmaquad II RADICPMS Major Revision
Revision: 5 Page: 22 of 29
Figure 15 – Report Generation
Q. Press the Printer tab to print a copy of the report. 5.7 Standard Preparation
Standards are to be prepared from NIST traceable standards. Normally, calibration standards used for analysis are prepared from a 1 mg/L standard that is prepared from a 10, 100 or 1,000 mg/L stock standard. The concentrations of calibration and check standards shall be designated by the task supervisor. Normal standard preparations are as follows: NOTE: The 1mg/L and 100 ug/L working standards noted below shall be prepared daily. For routine analyses all standard dilutions are made with 2%vol/vol nitric acid according to the following steps.
Procedure: ADS-1543 Inductively Coupled Plasma – Mass Spectrometer Elemental and Isotopic Analysis for Aqueous Liquid Samples Plasmaquad II RADICPMS Major Revision
Revision: 5 Page: 23 of 29
1. Prepare a 1mg/L, working calibration standard by pipetting into a clean, dry sample tube pipette 0.1 mL each of 100 mg/L solutions A, B, and C that have been designated for calibration.
2. Pipet 9.70mL 2% vol/vol nitric acid into the bottle containing the volumes
dispensed in step 1, above. Cap the tube and thoroughly mix by shaking the tube.
3. Prepare a 100 ug/L, working calibration standard by pipetting 1 mL of the
completed solution from step 2, above into a clean, dry sample tube. 4. Pipet 9.00mL 2% nitric acid into the tube containing the solution dispensed in
step 3, above. Cap the bottle and thoroughly mix by shaking the tube. 5. Prepare a 1 mg/L working check standard by pipetting into a clean, dry sample
tube, 0.1 mL each of solutions A, B, and C that have been designated for use as a check standard.
6. Prepare a sufficient volume of 5 mg/L internal standard solution by pipetting the
specified volumes of standard into a volumetric flask and diluting to the mark with 2% nitric acid.
7. The normal calibration scheme of blank, 1, 10, 25, and 50 ug/L solutions are
prepared from the 1 mg/L and 100 ug/L working calibration standards and check standards are prepared from the 1mg/L working check standard according to the following:
a. Blank
– Pipet 0.050 mL of the 5mg/L internal standard solution into a clean, dry tube followed by pipetting 9.95 mL 2% nitric acid. Cap and shake to effect mixing.
b. 1 ug/L Calibration Standard
– Pipet the following into a clean, dry tube: 0.050 mL of 5 mg/L internal standard, 0.100 mL of 100 ug/L working calibration standard, and 9.85 mL 2% nitric acid. Cap and shake to effect mixing.
c. 10 ug/L Calibration Standard
– Pipet the following into a clean, dry tube: 0.050 mL of 5 mg/L internal standard, 1.00 mL of 100 ug/L working calibration standard, and 8.95 mL of 2% nitric acid.
d. 25 ug/L Calibration Standard
– Pipet the following into a clean, dry tube: 0.050 mL of 5 mg/L internal standard, 0.250 mL of 1 mg/L working calibration standard, and 9.70 mL of 2% nitric acid. Cap and shake to effect mixing.
Procedure: ADS-1543 Inductively Coupled Plasma – Mass Spectrometer Elemental and Isotopic Analysis for Aqueous Liquid Samples Plasmaquad II RADICPMS Major Revision
Revision: 5 Page: 24 of 29
e. 50 ug/L Calibration Standard
– Pipet the following into a clean, dry tube: 0.050 mL of 5 mg/L internal standard, 0.500 mL of 1 mg/L working calibration standard, and 9.45 mL of 2% nitric acid. Cap and shake to effect mixing.
f. 25 ug/L Check Standard
– Pipet the following into a clean, dry tube: 0.050 mL of 5 mg/L internal standard, 0.250 mL of 1 mg/L working check standard, and 9.70 mL of 2% nitric acid. Cap and shake to effect mixing.
For iodide analyses all standard dilutions are made with 5%vol/vol CFA-C Reducing Solution according to the following steps.
1. Prepare a 1 mg/L working calibration standard by pipetting 0.1 mL of the 100
mg/L NIST traceable iodide standard designated for calibration into a clean, dry sample tube followed by pipetting 9.90 mL of 5% CFA-C solution. Cap the tube and mix thoroughly by shaking.
2. Prepare a 100 ug/L working calibration standard by pipetting 1.0 mL of the 1
mg/L working calibration standard, as prepared above, into clean, dry sample tube followed by pipetting 9.00 mL of 5% CFA-C solution. Cap the tube and thoroughly mix by shaking.
3. Prepare a 1 mg/L working check standard by pipetting 0.1 mL of the 100 mg/L
NIST traceable iodide standard designated for use as check standard into a clean, dry sample tube followed by pipetting 9.90 mL of 5% CFA-C solution. Cap the tube and mix thoroughly by shaking.
4. The normal calibration scheme of blank, 0.5, 1, 10, and 25 ug/L solutions are
prepared from the 1 mg/L and 100 ug/L working calibration standards and check standards are prepared from the 1 mg/L working check standard according to the following:
a. Blank
– Pipet 0.050 mL of the 5 mg/L internal standard solution into a clean, dry tube followed by pipetting 9.95 mL 2% nitric acid. Cap and shake to effect mixing.
b. 0.5 ug/L Calibration Standard
– Pipet the following into a clean, dry sample tube: 0.050 mL of 5 mg/L internal standard solution, 0.05 mL of the 100 ug/L working calibration standard, and 9.90 mL 5% CFA-C solution. Cap and shake to effect mixing.
c. ug/L Calibration Standard – Pipet the following into a clean, dry tube: 0.050 mL of 5 mg/L internal standard, 0.100 mL of 100 ug/L working calibration standard, and 9.85 mL 5% CFA-C solution. Cap and shake to effect mixing.
Procedure: ADS-1543 Inductively Coupled Plasma – Mass Spectrometer Elemental and Isotopic Analysis for Aqueous Liquid Samples Plasmaquad II RADICPMS Major Revision
Revision: 5 Page: 25 of 29
d. 10 ug/L Calibration Standard
– Pipet the following into a clean, dry tube: 0.050 mL of 5 mg/L internal standard, 1.00 mL of 100 ug/L working calibration standard, and 8.95 mL 5% CFA-C solution. Cap and shake to effect mixing.
e. 25 ug/L Calibration Standard
– Pipet the following into a clean, dry tube: 0.050 mL of 5 mg/L internal standard, 0.250 mL of 1 mg/L working calibration standard, and 9.70 mL of 5% CFA-C solution. Cap and shake to effect mixing.
f. 5 ug/L Check Standard
– Pipet the following into a clean, dry tube: 0.050 mL of 5 mg/L internal standard, 0.050 mL of 1 mg/L working check standard, and 9.90 mL of 2% nitric acid. Cap and shake to effect mixing.
5.8 Sample Preparation and Pre-Analysis Scans
1. In order to determine the approximate concentration of the desired analyte(s), make a significant dilution (1,000X – 10,000X) of the sample which includes the desired concentration of internal standard. (using the specified diluent – 2% nitric for routine analyses and 5% CFA-C for iodide analyses).
2. Using a previously prepared scan experiment, scan the sample along with a calibration standard (as designated by the task supervisor). Determine the proper sample dilution to stay within the calibration range (as designated by the task supervisor) by comparing the integrated counts per second of the sample with the integrated counts per second of the calibration standard. (For high salts (>4 molar) a dilution of 1000X, or higher, is preferred due to the suppression of the signal of the analyte and the internal standard caused by the high salts).
3. Based on the results of the scans prepare the proper dilutions such that the concentration of the analyte(s) does not exceed the concentration of the maximum calibration standard, as designated by the task supervisor.
Procedure: ADS-1543 Inductively Coupled Plasma – Mass Spectrometer Elemental and Isotopic Analysis for Aqueous Liquid Samples Plasmaquad II RADICPMS Major Revision
Revision: 5 Page: 26 of 29
5.9 Calculations
Final results are calculated by the instrument software when the respective dilution factors are entered into the sample list. Using scientific notation where necessary, the results are rounded to two or three significant figures (as directed by the task supervisor).
5.10 Instrument Shutdown
1. Once analyses have been completed, allow the instrument to rinse with DI
water for a minimum of 5 minutes by placing the sample probe in a container of DI water or by moving the probe to the rinse station via software commands. After running iodide analyses the system is to be rinsed with 5% CFA-C for a minimum of 15 minutes followed by a minimum rinse of 30 minutes with DI water.
2. Upon completion of the rinse press the Instrument Button, followed by the pressing of the Control tab (see Figure 2).
3. Press the Standby button and acknowledge the subsequent window.
4. Once the Standby mode has been achieved, press the Vacuum ready button and acknowledge the subsequent window.
5. Turn off the chiller and shut off the argon supply at the regulator.
6. Close out the PlasmaLab software and shut down the computer.
5.11 Torch Box Maintenance/Alignment/Adjustment NOTE:
The load coil surrounding the end of the torch carries significant radio frequency (RF) power when the plasma is operating. Prior to any work in which the load coil can be contacted either directly or indirectly, the following precautions shall be taken prior to doing any work in the torch box.
1. Ensure instrument is in Vacuum Ready state as indicated by a green indicator button on the Instrument Control of the instrument software.
2. Power down the RF generator by pressing the white Power On/Off switch. The switch for the RF generator for the torch box is located just below the torch box in the upper right hand portion on the front of the instrument panel. This switch has a cover associated with it that must be lifted in order to use the switch. Allow
Procedure: ADS-1543 Inductively Coupled Plasma – Mass Spectrometer Elemental and Isotopic Analysis for Aqueous Liquid Samples Plasmaquad II RADICPMS Major Revision
Revision: 5 Page: 27 of 29
thirty minutes for any stored energy to drain before commencing work on anything in the torch box.
3. Remove the UV shield in front of the torch only after verifying that the instrument
is in Vacuum Ready and there are NO
lights or read-outs visible on the front of the RF panel.
4. Proceed with extreme caution when inserting devices near the load coil. Non-conducting tools are recommended for use in this area, when possible.
5. Once all work has been completed replace the UV shield, power up the RF
generator, and re-ignite the plasma via the prescribed routine. 6. Most of the sample handling components in the torch box are glass and should
be handled so as to avoid breakage.
Do not exert undue pressure on these components, i.e. spray chamber, elbow, torch, and nebulizer, when working with them as they can break exposing someone to injury. Chemical resistant gloves shall be worn in the event any portion of the sample handling system is disassembled in order to the potential for exposure to chemical hazards.
5.12 Routine Instrument Maintenance
1. Cone Replacement
A. Power down RF generator using Power On/Off switch on front of RF generator panel.
. When cones are replaced the following pre- requisites shall be met prior to commencing work:
B. Allow thirty minutes for any stored energy in the RF generator to drain before commencing work.
C. After thirty minutes, unbuckle the torch box and push back and place chock between torch box and front of translation table to hold box in position.
Procedure: ADS-1543 Inductively Coupled Plasma – Mass Spectrometer Elemental and Isotopic Analysis for Aqueous Liquid Samples Plasmaquad II RADICPMS Major Revision
Revision: 5 Page: 28 of 29
(1) Using the vendor supplied cone tool, remove the outer retainer ring and the outer sampler cone. Carefully remove the graphite gasket so as to avoid scratching the surface where the gasket is mounted. Using the other end of the cone tool remove the inner skimmer cone.
(2) Securely mount a new skimmer cone using the cone tool.
(3) Place a new graphite gasket in position, place the new sampler cone in position and hold in position while securing with the retainer ring. Secure the ring with the cone tool.
(4) Slide the torch box into place and re-buckle.
(5) Replace UV shield.
(6) Turn on power to RF generator and begin normal instrument start-up sequence
2.
Oil Change for Vacuum Pumps
A Instrument must be in Vacuum Ready.
B. Remove the front panel covering the vacuum pumps. C. Don lab coat and chemical gloves (safety glasses are a pre- requisite for entry into lab). D. Place a shallow pan below the drain plug of the pump.
E. Using an Allen wrench of the proper size remove the oil drain plug at the bottom of the pump.
F. Using the same Allen wrench, loosen the oil filler plug at the top of the pump until oil flows from the drain plug.
G. Once the oil has drained from the pump replace the drain plug making sure it is adequately tightened so as to avoid leaking.
H. If not already removed, remove the oil filler plug, insert a funnel, and slowly add new oil pausing to examine the fill level on the front of the pump. Once the level of new oil has reached ½ - ¾ full replace the filler plug.
Procedure: ADS-1543 Inductively Coupled Plasma – Mass Spectrometer Elemental and Isotopic Analysis for Aqueous Liquid Samples Plasmaquad II RADICPMS Major Revision
Revision: 5 Page: 29 of 29
I. Thoroughly clean up any spilled oil. Pour the used oil into a polyethylene bottle of sufficient size and label the bottle. (Submit a sample of the oil for rad screen for subsequent disposal in the appointed used oil drum.)
J. Replace the cover panel and lock in place.
K. Resume normal operations of instrument.
NOTE: No other maintenance activities are performed by SRNS employees without an assessment, documentation and mitigation of the hazards via a Job Hazards Analysis with all interested parties involved with the analysis.
6.0 REFERENCES
1. Jarvis, K. E., Gray, A. L., and Houk, R. S., Inductively Coupled Plasma Mass Spectrometry
2. Holland, G., and Eaton, A. N.,
, Blackie & Son LTD, 1992.
Applications of Plasma Source Mass Spectrometry
3. Holland, G., and Eaton, A. N.,
, Thomas Graham House, 1991.
Applications of Plasma Source Mass Spectrometry II
4. TJA Solutions VG PlasmaLab Reference Guide, Issue 1.05, July 2000
, Thomas Graham House, 1993.
5. Job Hazard Analysis for Non-Routine Maintenance on the ICPMS-974,
7.0 RECORDS Results are sent to the customer via an e-mail report. The experiment, the data work-
up spreadsheet, and the report spreadsheet are saved on the designated server in a folder with the customer’s name. The designation of the server with the folder name as well as the person or persons to whom the results were reported are entered into the ADS LIMS.
8.0 ATTACHMENTS None
ANALYTICAL DEVELOPMENT SECTION ANALYTICAL OPERATING PROCEDURES VOLUME 2
Manual: L16.1 Procedure: ADS-1557
Revision: 7 PROCEDURE FOR COLD VAPOR/HYDRIDE GENERATION ATOMIC ABSORPTION
Effective Date: 05/23/13 Type-Class: Tech-Ref Page: 1 of 27
1.0 INTRODUCTION
1.1 Purpose
This procedure provides instructions for performing analyses using the VGA-77 vapor generator attachment that accompanies the Varian SpectrAA-880 Atomic Absorption Spectrophotometer.
1.2 Scope
The VGA-77 vapor generator attachment is a mechanical device that attaches to the Varian SpectrAA-880 Atomic Absorption Spectrophotometer. The VGA-77 provides a means for the mixing and reaction of reagents with a sample followed by the liberation, via a liquid/gas separator, of the gaseous form of the analyte.
2.0 GENERAL INFORMATION
None
3.0 PRECAUTIONS AND LIMITATIONS
3.1 Safety
NOTE
All Savannah River Site (SRS), Savannah River National Lab (SRNL), and Analytical Development (AD) safety rules apply.
1. A reference file of material safety data sheets (MSDS) on all the hazardous chemicals associated with this method is available. Review the MSDS on all chemicals prior to handling.
2. Mercury vapors and many of the element-hydrides are toxic. Precautions must be taken to avoid their inhalation. The system must be vented to a fume hood, exhaust vent, or the vapor passed through an absorbing medium, such as:
Equal volumes of 0.1M KMnO4 and 10% H2SO4, or
0.25% iodine in a 3% KI solution.
3. Read and understand Safety Practices of the Varian SpectrAA880 in the operating manual.
4. Operation of these instruments involves the use of compressed gases, and hazardous materials including corrosive fluids and flammable liquids. Improper or careless use of the instrument can create explosion hazards, fire hazards, or other hazards that can result in serious injury to personnel.
Manual: L16.1 Procedure: ADS-1557 Procedure for Cold Vapor/Hydride Generation Atomic Absorption
Revision: 7 Page: 2 of 27
3.1 Safety, (cont.)
5. Exhaust system must be operational before work is performed. Fumes emitted from the vapor generation system can be hazardous to personnel.
6. If gas leaks are suspected, immediately turn off the instrument and leak check the hoses and gas connections.
7. Never leave the flame unattended. For flame determinations, always operate the instrument, with the flame shield closed and the sample compartment panel in place. In some cases for the vapor generation operation, the flame shield and sample compartment panel must be removed. Hazardous, ultraviolet radiation can be emitted by the hollow cathode lamps; therefore, wear only approved safety glasses to protect eyes from the ultraviolet radiation.
8. The instrument is to be used only with air, nitrous oxide, and acetylene compressed gases for flame operation. Use of oxygen or oxygen enriched air as the oxidant can result in an explosion. Use only atomic absorption grade acetylene (99.6% purity). For VGA operation, use only inert gases such as nitrogen, argon, or air.
9. If organic solvents are used, the drainage tubing for the waste must be solvent-resistant nitrile rubber. Also, solvents with densities less than 0.75 cannot be used; these can create flashbacks or explosion hazards.
10. This procedure requires the use of acids > 3M and/or bases > 4M which are considered concentrated in Manual 8Q, Procedure 26, General Laboratory Safety Rules, Section 5, Personal Protective Equipment. These materials are corrosive and are to be prepared using the personal protective equipment also prescribed in Section 5 of Manual 8Q, Procedure 26. Acids and bases that meet or exceed the specified description as concentrated are to be handled/prepared in a hood, the use of which is outlined in Section 6, Work Practices for Laboratory Hoods, Manual 8Q, Procedure 26.
4.0 PREREQUISITES
4.1 Tools and Equipment
SpectrAA-880
VGA-77
Volumetric flasks
Pipettes
Sample and reagent poly bottles
Pump tubing
Manual: L16.1 Procedure: ADS-1557 Procedure for Cold Vapor/Hydride Generation Atomic Absorption
Revision: 7 Page: 3 of 27
5.0 PROCEDURE
5.1 Description of Method
1. The system consists of a SpectrAA-880 Atomic Absorption Spectrophotometer with hollow cathode lamps for arsenic, mercury, and selenium, a vapor generation accessory (VGA) having a peristaltic pump, reaction coil, liquid/gas separator which is coupled to flow-through quartz cell designated for either As, Se, or Hg.
2. This atomic absorption procedure is a physical method based on the ability of the arsenic and selenium to form volatile, covalent hydrides with “nascent” hydrogen. These gaseous hydrides are separated from the original sample matrix thereby enriching the analyte element, and thus reducing and sometimes completely eliminating interference.
3. In the acidified sample the ionic element bonds with hydrogen provided by sodium borohydride thereby forming an element-hydride gas. The element-hydride gas is swept into a flow-through cell positioned in the path of the light beam emitted by a hollow cathode lamp where the amount of light absorbed by the gaseous element is measured by the spectrophotometer.
4. The mercury method takes advantage of mercury being volatile when it is reduced to its elemental state. The mercury in an acidified sample is reduced to elemental mercury in a reaction with a solution of stannous chloride. The gaseous elemental mercury is then transported into a flow-through cell positioned in the path of the light beam emitted by a hollow cathode lamp where the amount of light absorbed by the gaseous element is measured by the spectrophotometer.
5. In each case the absorbance is then translated into element concentration.
5.2 Data Quality
Scope and Application
1. This method describes the requirements for the use of atomic absorption and the vapor generation accessory for the analysis of the elements, arsenic, mercury and selenium, in aqueous solutions at low concentrations (µg/L to mg/L). Included are standard and sample preparation procedures, descriptions of possible elemental interference, required operating conditions, and quality control procedures.
2. This basic vapor generation technique for the volatile elements arsenic, mercury, and selenium is similar to methods outlined in the Standard Methods for the Examination of Water and Wastewater, Test Methods for the Analysis of Solid Waste, DOE Site Survey Manual, EPA Contract Laboratory Program; However, this procedure is only suitable for research and development samples, since it does not follow all of the requirements for compliance for regulated sample analysis.
Manual: L16.1 Procedure: ADS-1557 Procedure for Cold Vapor/Hydride Generation Atomic Absorption
Revision: 7 Page: 4 of 27
5.3 Quality Control
Calibration frequency - A calibration curve must be prepared for each element run for a series of samples with a minimum of a reagent blank and two National Institute of Standards and Technology (NIST) traceable standards.
5.4 Manufacturer
AA Spectrophotometer
Model: SpectrAA-880
Varian Instrument Group
Vapor Generation Accessory (VGA)
Model: VGA-77
Varian Instrument Group
5.5 Reagents
1. The date that chemicals, standards, and reagents are received should be written on the bottle to track their age. Prepared standards and reagents should be labeled with the name of the standard, date of preparation, and the analyst’s initials.
2. Acids used in the preparation of standards and for sample processing must be ultrahigh purity grade or equivalent. Ultra-pure acids from GFS Chemicals, Seastar Chemical, and Fisher Scientific are acceptable. Reagent grade acids can be used for cleaning glassware and plastic sample containers but must be rinsed with ultra-pure (deionized) water several times.
3. Ultra-pure Deionized Water – This is available from systems such as the Barnstead or Millipore Milli-Q de-ionizing systems.
A. Before dispensing water make sure the resistivity reading of the water is 18 Mohms/cm or higher.
B. IF the resistivity does not increase to 18 Mohms/cm after 15 minutes of re-circulation, THEN REPLACE the ion exchange cartridges. Building deionized water does not meet this specification and should not be used.
4. Hydrochloric Acid (12 M HCl) (Ultra-Pure) – Concentrated (sp. gr. 1.19)
Manual: L16.1 Procedure: ADS-1557 Procedure for Cold Vapor/Hydride Generation Atomic Absorption
Revision: 7 Page: 5 of 27
5.5 Reagents, (cont.)
5. 10 M Hydrochloric Acid –
A. In a fume hood, ADD 833 mL ultra-pure HCl to 167 mL ultra-pure deionized water.
B. CAP the container, AND SWIRL to complete mixing.
6. 8.75 M Hydrochloric Acid –
A. In a fume hood, ADD 729 mL ultra-pure HCl to 271 mL ultra-pure deionized water.
B. CAP the container, AND SWIRL to complete mixing.
7. 7.0 M Hydrochloric Acid –
A. In a fume hood, ADD 583 mL ultra-pure HCl to 417 mL ultra-pure deionized water.
B. CAP the container, AND SWIRL to complete mixing.
8. 5.0 M Hydrochloric Acid –
A. In a fume hood, ADD 417 mL ultra-pure HCl to 583 mL water.
B. CAP the container, AND SWIRL to complete mixing.
9. Nitric Acid (16 M HNO3) (Ultra-Pure) - Concentrated (sp. gr. 1.41)
10. 0.3 M Nitric Acid –
A. In a fume hood, ADD 19 mL ultra-pure HNO3 to 981 mL ultra-pure deionized water.
B. CAP the container, AND SWIRL to complete mixing.
11. Sodium Hydroxide (NaOH) – Reagent grade pellets.
Manual: L16.1 Procedure: ADS-1557 Procedure for Cold Vapor/Hydride Generation Atomic Absorption
Revision: 7 Page: 6 of 27
5.5 Reagents, (cont.)
12. 50% Sodium Hydroxide –
A. In a clean 250 mL poly bottle, WEIGH 130 g DI water.
B. In a weighing pan, WEIGH 130 g of NaOH pellets.
C. ADD pellets SLOWLY to the water, AND SWIRL to complete mixing.
D. ALLOW solution to cool to room temperature prior to use.
13. Sodium Borohydride (NaBH4) – 95% Powder.
14. Potassium Iodide (KI) – Reagent grade crystals.
15. 20% Potassium Iodide –
A. In a clean dry 125 mL poly bottle, WEIGH 20+0.1g KI.
B. ADD 100mL ultra-pure deionized water
C. INSERT magnetic stirring bar, AND AGITATE on magnetic stirrer until KI is dissolved.
16. Stannous Chloride (SnCl2Tin II Chloride) – Reagent grade crystals.
17. 25% Stannous Chloride –
A. In a fume hood, ADD 20 mL concentrated ultra-pure HCl to 80 mL ultra-pure deionized water, CAP, AND SWIRL to mix.
B. ADD 25+0.1 g stannous chloride to the solution
C. INSERT a magnetic stirring bar, PLACE on magnetic stirrer, AND STIR until stannous chloride is dissolved.
18. Potassium Permanganate (KMnO4) – Reagent grade crystals.
Manual: L16.1 Procedure: ADS-1557 Procedure for Cold Vapor/Hydride Generation Atomic Absorption
Revision: 7 Page: 7 of 27
5.5 Reagents, (cont.)
19. 5% Potassium Permanganate –
A. To a 100mL volumetric flask containing approximately 50mL ultra-pure deionized water
B. ADD 5+0.05g potassium permanganate
C. DILUTE to mark with ultra-pure deionized water
D. INSERT a magnetic stirring bar, PLACE on magnetic stirrer, AND MIX until potassium permanganate is dissolved.
20. Potassium Persulfate (K2S2O8) – Reagent grade crystals.
21. 5% Potassium Persulfate –
A. To a 100mL volumetric flask, containing approximately 50mL ultra-pure deionized water, ADD 5+0.05 g potassium persulfate
B. DILUTE to mark with ultra-pure deionized water
C. INSERT a magnetic stirring bar, PLACE on magnetic stirrer, AND MIX until potassium persulfate is dissolved.
22. Sodium Chloride (NaCl) – Reagent grade crystals.
23. Hydroxylamine Hydrochloride – Certified ACS grade.
24. 6% Sodium Chloride/6% Hydroxylamine Hydrochloride –
A. To a 100 mL volumetric flask, containing approximately 50mL ultra-pure deionized water, ADD 6+0.05 g sodium chloride and 6+0.05 g hydroxylamine hydrochloride
B. DILUTE to mark with ultra-pure deionized water
C. INSERT a magnetic stirring bar, PLACE on magnetic stirrer, AND MIX until solids are dissolved.
25. Standard Stock Solutions – These may be purchased or prepared from ultrahigh purity grade chemicals or metals. These stock standards shall be NIST traceable, and all calibration and check standards solutions shall be prepared from these stock standards, as outlined below for each element.
Manual: L16.1 Procedure: ADS-1557 Procedure for Cold Vapor/Hydride Generation Atomic Absorption
Revision: 7 Page: 8 of 27
5.6 Basic Methods for Vapor Hydride Generation Trace-Level Technique
NOTE
AA Instrument Operating Parameters - The Varian SpectAA-880 AA instrument operating parameters for startup, calibration standards and verification, blanks, analyzing duplicates and replicates, check standards can be located in Manual L16.1, Procedure ADS-1554, Procedure for Operating Varian SPECTRAA-880 Atomic Absorption.
1. Complete instructions for setting up and operating the VGA-77 are covered in the VGA operating manual.
2. Since vapor generation is a trace-level technique, it is very important that the VGA system is meticulously cleaned after use. Routine maintenance activities include cleaning of the burner head as needed with DI water, cleaning of glassware as needed with dilute nitric acid and minimal cleaning of exposed flame ignition area with cotton swab and dilute acid. For additional instructions on routine maintenance, SEE Section 5.10, Step 1. General instructions for cleaning, general maintenance, and replacement of individual components are given in the VGA operating manual.
3. SECURE the drain tube to the liquid trap outlet, AND LOCATE the tube properly in the drain vessel. FILL the trap with deionized water. MAKE sure the drain vessel is a 500mL Teflon bottle. ADD the 130mL of 50% NaOH solution to the residue bottle as specified in Section 5.14.
Manual: L16.1 Procedure: ADS-1557 Procedure for Cold Vapor/Hydride Generation Atomic Absorption
Revision: 7 Page: 9 of 27
5.6 Basic Methods for Vapor Hydride Generation Trace-Level Technique, (cont.)
4. Arsenic
The arsenic in the samples must be in the inorganic form; otherwise acid digestion will be necessary. ENSURE that arsenic present as As (V) in standards and samples has been reduced to As (III) by the action of potassium iodide at a concentration of 1% w/v. Reduction will take about thirty minutes at room temperature. The reduction can also be carried out at 50° C in about four minutes. Standards, reagents, and samples solutions should be prepare as follows:
A. 1 mg/L Working Standard –
1) PREPARE the solution in a fume hood.
2) PIPETTE 5 mL ultra-pure concentrated hydrochloric acid into a 100 mL volumetric flask containing approximately 50 mL ultra-pure deionized water.
3) PIPETTE 0.100 mL of the 1,000 mg/L stock arsenic standard designated for calibration into the flask.
4) DILUTE to the mark with ultra-pure deionized water, STOPPER the flask, AND INVERT several times to mix.
5) TRANSFER contents to a bottle with a label that contains element name, concentration, date of preparation, and the initials of the person preparing.
Manual: L16.1 Procedure: ADS-1557 Procedure for Cold Vapor/Hydride Generation Atomic Absorption
Revision: 7 Page: 10 of 27
5.6 Basic Methods for Vapor Hydride Generation Trace-Level Technique, (cont.) Step 4, (cont.)
B. 0.025 mg/L Calibration Standard –
1) PREPARE the solution in a fume hood.
2) ADD approximately 25 mL 7 M HCl to a 50 mL volumetric flask.
3) PIPETTE 0.125 mL of the 1 mg/L stock calibration standard into the flask.
4) PIPETTE 5 mL 20% KI solution, AND DILUTE to the mark with 7 M HCl, stopper, AND MIX contents.
C. 0.050 mg/L Calibration Standard –
1) ADD approximately 25 mL 7 M HCl to a 50 mL volumetric flask
2) PIPETTE 0.250mL of the 1mg/L stock calibration standard into the flask.
3) PIPETTE 5mL 20% KI solution, AND DILUTE to the mark with 7 M HCl, stopper, AND MIX contents.
D. 0.075 mg/L Calibration Standard –
1) ADD approximately 25 mL 7 M HCl to a 50 mL volumetric flask
2) PIPETTE 0.375 mL of the 1mg/L stock calibration standard into the flask.
3) PIPETTE 5 mL 20% KI solution, AND DILUTE to the mark with 7 M HCl, stopper, AND MIX contents.
Manual: L16.1 Procedure: ADS-1557 Procedure for Cold Vapor/Hydride Generation Atomic Absorption
Revision: 7 Page: 11 of 27
5.6 Basic Methods for Vapor Hydride Generation Trace-Level Technique, (cont.) Step 4, (cont.)
E. 0.050 mg/L Check Standard –
1) PREPARE the solution in a fume hood.
2) ADD approximately 25mL 7M HCl to a 50mL volumetric flask.
3) PIPETTE 0.250mL of the 1mg/L check standard.
4) PIPETTE 5mL 20% KI solution, AND DILUTE to the mark with 7mL HCl, stopper, AND MIX contents.
NOTE
The calibration and check standards may be made in larger volumes as long as the proper proportions are maintained.
F. Reductant Container: 0.6% NaBH4; 0.5% NaOH; 10% KI
1) PREPARE by weighing, into a clean, dry 250 mL, poly bottle, 1.5+0.05 g sodium borohydride, 1.25+0.05 g sodium hydroxide, and 25+0.1 g potassium iodide.
2) ADD 250 mL ultra-pure deionized water
3) INSERT magnetic stirring bar, AND PLACE on magnetic stirrer, AND STIR until all solid ingredients are dissolved. Once solids are dissolved
4) TRANSFER to reductant bottle on hydride module.
G. Acid Container: FILL with 10 M HCl.
Where arsenic and selenium are both to be determined from the same sample, separate hydride systems are to be used because any KI present from arsenic analyses will affect the selenium analyses.
Manual: L16.1 Procedure: ADS-1557 Procedure for Cold Vapor/Hydride Generation Atomic Absorption
Revision: 7 Page: 12 of 27
5.6 Basic Methods for Vapor Hydride Generation Trace-Level Technique, (cont.)
5. Selenium
Se (VI) is not quantitatively recovered by hydride generation and must be reduced to Se (IV). It may be necessary to prepare the samples in 7 M HCl acid, heat at 95ºC for about 10 minutes and cool to room temperature before analysis.
A. 1 mg/L Working Calibration Standard –
1) PREPARE the solution in a fume hood.
2) PIPETTE 2mL ultra-pure concentrated nitric acid into a 100mL volumetric flask containing approximately 50mL ultra-pure deionized water.
3) PIPETTE 0.100 mL of the 1,000mg/L stock selenium standard designated for calibration into the flask.
4) DILUTE to the mark with ultra-pure deionized water, STOPPER the flask, AND INVERT several times to mix.
5) TRANSFER contents to a bottle with a label that contains element name, concentration, date of preparation, and the initials of the person preparing.
B. 1mg/L Working Check Standard -
1) PREPARE the solution in a fume hood.
2) PIPETTE 2mL ultra-pure concentrated nitric acid into a 100mL volumetric flask containing approximately 50mL ultra-pure deionized water.
3) PIPETTE 0.100 mL of the 1,000mg/L stock selenium standard designated for calibration into the flask.
4) DILUTE to the mark with ultra-pure deionized water, STOPPER the flask, AND INVERT several times to mix.
5) TRANSFER contents to a bottle with a label that contains element name, concentration, date of preparation, and the initials of the person preparing.
Manual: L16.1 Procedure: ADS-1557 Procedure for Cold Vapor/Hydride Generation Atomic Absorption
Revision: 7 Page: 13 of 27
5.6 Basic Methods for Vapor Hydride Generation Trace-Level Technique, (cont.) Step 5, (cont.)
C. 0.0050 mg/L Calibration Standard –
1) PREPARE the solution in a fume hood.
2) ADD approximately 25 mL 7 M HCl to a 50 mL volumetric flask
3) PIPETTE 0.250 mL of the 1 mg/L working selenium calibration standard into the flask.
4) DILUTE to the mark with 7 M HCl, STOPPER, AND MIX.
D. 0.0075 mg/L Calibration Standard –
1) In a fume hood, ADD approximately 25 mL 7M HCl to a 50mL volumetric flask.
2) PIPETTE 0.375 mL of the 1 mg/L working selenium calibration standard into the flask. DILUTE to the mark, with 7 M HCl, STOPPER, AND MIX.
E. 0.0100 mg/L Calibration Standard –
1) In a fume hood, ADD approximately 25 mL 7 M HCl to a 50mL volumetric flask.
2) PIPETTE 0.500 mL of the 1 mg/L working selenium calibration standard into the flask. DILUTE to the mark with 7 M HCl, STOPPER, AND MIX.
F. 0.075 mg/L Check Standard –
1) In a fume hood, ADD approximately 25 mL 7 M HCl to a 50 mL volumetric flask
2) PIPETTE 0.375 mL of the 1mg/L working selenium check standard into the flask
3) DILUTE to the mark, with 7 M HCl, STOPPER, AND MIX.
Manual: L16.1 Procedure: ADS-1557 Procedure for Cold Vapor/Hydride Generation Atomic Absorption
Revision: 7 Page: 14 of 27
5.6 Basic Methods for Vapor Hydride Generation Trace-Level Technique, (cont.)
G. Reductant Container: 0.6% NaBH4; 0.5% NaOH
1) PREPARE by weighing, into a clean, dry 250 mL, poly bottle, 1.5+0.05 g sodium borohydride and 1.25+0.05 g sodium hydroxide.
2) ADD 250 mL ultra-pure deionized water
3) INSERT magnetic stirring bar, AND PLACE on magnetic stirrer, AND STIR until all solid ingredients are dissolved.
4) Once solids are dissolved, TRANSFER to reductant bottle on hydride module.
H. Acid Container: FILL with 10 M HCl.
5.7 Mercury Determination by Cold Vapor AA with the VGA-77
1. Information:
The cold vapor mercury technique is a flameless atomic absorption procedure that is a physical method based on the absorption of radiation at 253.7 nm by mercury vapor. Ionic mercury is reduced to the elemental state and liberated as a gas. The elemental vaporous mercury is separated from solution, via a liquid/gas separator, and passed through a flow-through cell positioned in a path of light of specific wavelength generated by a hollow cathode lamp. The amount of light absorbed by the elemental mercury vapor is then converted to concentration.
2. Standard Preparation: 10.0 mg/L Working Standard –
A. CAREFULLY PIPETTE 1.0 mL of the 1000 mg/L stock calibration standard into a 100 mL volumetric flask containing approximately 50 mL 0.3 M nitric acid.
B. DILUTE to the mark with 0.3 M nitric acid, STOPPER the flask, AND MIX.
C. TRANSFER contents to a bottle with a label that contains element name, concentration, date of preparation, and the initials of the person preparing.
Manual: L16.1 Procedure: ADS-1557 Procedure for Cold Vapor/Hydride Generation Atomic Absorption
Revision: 7 Page: 15 of 27
5.7 Mercury Determination by Cold Vapor AA with the VGA-77, (cont.)
3. Calibration Standards: 0.025 mg/L Calibration Standard –
A. PIPETTE 0.125 mL of the 10.0 mg/L working calibration standard into a 50 mL volumetric flask containing approximately 25 mL of 0.3 M nitric acid.
B. DILUTE to mark with 0.3 M nitric acid, STOPPER the flask, AND MIX.
4. 0.050 mg/L Calibration Standard –
A. PIPETTE 0.250 mL of the 10.0 mg/L working calibration standard into a 50 mL volumetric flask containing approximately 25 mL of 0.3 M nitric acid.
B. DILUTE to mark with 0.3 M nitric acid, STOPPER the flask, AND MIX.
5. 0.075 mg/L Calibration Standard –
A. PIPETTE 0.375 mL of the 10.0 mg/L working calibration standard into a 50 mL volumetric flask containing approximately 25 mL of 0.3 M nitric acid.
B. DILUTE to mark with 0.3 M nitric acid, STOPPER the flask, AND MIX.
6. Check Standard: 0.050 mg/L Check Standard –
A. PIPETTE 0.250 mL of the 10.0 mg/L working check standard into a 50 mL volumetric flask containing approximately 25 mL of 0.3 M nitric acid.
B. DILUTE to mark with 0.3 M nitric acid, STOPPER the flask, AND MIX.
Manual: L16.1 Procedure: ADS-1557 Procedure for Cold Vapor/Hydride Generation Atomic Absorption
Revision: 7 Page: 16 of 27
5.8 Sample Preparation and Analysis of Samples Containing Organics
1. This sample preparation method is applicable to drinking, surface, and saline waters, domestic and industrial wastes, soils, sediments, bottom deposits, and sludge. In addition to inorganic forms of mercury, organic mercurials may also be present.
2. Potassium permanganate oxidizes many of these compounds, but recent studies have shown that a number of organic mercurials, including phenyl mercuric acetate and methyl mercuric chloride, are only partially oxidized by this reagent.
3. Potassium persulfate has been found to give near a 100% recovery when used as the oxidant for these compounds.
4. Therefore, a persulfate oxidation step following the addition of the permanganate has been included to insure that organo-mercuric compounds, if present, will be destroyed so as to produce mercuric ions.
5. A heat step is required to oxidize methyl mercuric chloride when present in or spiked into a natural system.
A. Module Reagents:
Reductant Container – 25% Stannous chloride.
Acid Container – 5 M HCl.
NOTE
It may be necessary to prepare multiple blanks.
B. Begin preparing a blank by pipetting 10 mL 0.3 M nitric acid into a labeled, clean, dry centrifuge tube.
C. Begin preparing calibration standards by pipetting 10 mL of each standard into a clean, dry centrifuge tubes that have been labeled with the respective standard concentrations.
D. Begin preparing a check standard by pipetting 10 mL of the check standard into a labeled, clean, dry centrifuge tube.
E. PIPETTE 10 mL of each sample into their respectively labeled centrifuge tubes. For solid or semi-solid (sludge/slurry) samples weigh 6+0.1 g sample in a labeled, clean, dry centrifuge tube.
Manual: L16.1 Procedure: ADS-1557 Procedure for Cold Vapor/Hydride Generation Atomic Absorption
Revision: 7 Page: 17 of 27
5.8 Sample Preparation and Analysis of Samples Containing Organics, (cont.) Step 5, (cont.)
F. FILTER the sample if directed to do so by the task supervisor AND RECORD in the logbook. USE a 10 mL syringe and a 0.45 Micron Gelman Filter or equivalent.
G. In a hood, ADD the following to all the vials:
Liquid Samples: Solid and Semi Solid Samples: 0.500 mL concentrated 2.0 mL concentrated sulfuric acid. sulfuric acid. 0.200 mL concentrated 1.00 mL concentrated nitric acid. nitric acid. 1.5 mL potassium 6.00 mL potassium permanganate permanganate solution solution
H. ALLOW solutions to stand for 15 minutes, making sure the purple color persists. If color does not persist add up to 5 - 1.5 mL aliquots of the potassium permanganate solution, if color does not persist for 15 minutes after 5 the addition of 5 - 1.5 mL aliquots of permanganate consult the task supervisor. Once the color persists for 15 minutes, continue as outlined below.
I. ADD the following to the samples.
Liquid Samples Solid and Semi-Solid Samples 1.00 mL potassium 4.00 mL potassium persulfate solution persulfate solution
Manual: L16.1 Procedure: ADS-1557 Procedure for Cold Vapor/Hydride Generation Atomic Absorption
Revision: 7 Page: 18 of 27
5.8 Sample Preparation and Analysis of Samples Containing Organics, (cont.) Step 5, (cont.)
J. HEAT for a minimum of two hours in a water bath maintained at 95°C± 3 °C, AND ALLOW to cool to room temperature.
K. In a hood, ADD sodium chloride-hydroxylamine hydrochloride solution dropwise, AND MIX until the permanganate color is destroyed.
L. IMMEDIATELY ADD 2 mL of concentrated nitric acid, AND THEN:
Liquid Samples Solid & Semi-Solid Samples DILUTE to 30 mL with WEIGH to 30.0± 0.1 gram with deionized water. deionized water into the sample vial.
5.9 Instrument Start-up
NOTE
This instrument is controlled by ”Windows” based software and there are numerous ways to traverse through the menus in order to run a series of analyses.
1. TURN on the AA system in the following order: Instrument, computer, monitor, and printer. The AA system and the specific hollow cathode lamp should have a warm up time of approximately 15-20 minutes.
2. ALLOW MS Windows software to completely boot the system.
3. Once all the desktop icons have appeared on the computer monitor screen, DOUBLE CLICK on the SpectrAA icon, AND WAIT for the Varian AA instrument software to load.
Manual: L16.1 Procedure: ADS-1557 Procedure for Cold Vapor/Hydride Generation Atomic Absorption
Revision: 7 Page: 19 of 27
5.9 Instrument Start-up, (cont.)
4. Customer Worksheet Creation
A. The Varian AA instrument software should be displayed on the computer monitor screen. From this window there are four options to select from: Worksheet, Reports, Administrator, and Exit. Select "Worksheet." To create a customer worksheet a series of windows and menus will follow.
1) Once the "Worksheet" option has been selected the Load Worksheet window will appear on the screen. There are three options to select from: New, New from, and Open. Select "New from…"
2) The next window to appear will be New Worksheet From Worksheet menu. In this window there will be several items to select from, the symbol of various elements (As, Se, Hg, etc.) and the file names of previous customer runs. From this menu, HIGHLIGHT the symbol of the element to be analyzed with the mouse CLICK "OK."
3) The Name Worksheet window will appear on the screen next. To create the customer's worksheet, TYPE in the customer's name in the name blank using the following format: date (mm-dd-yy), customer's name (last, first). Next, TYPE in the analyst name in the analyst blank. And finally any comments related to the samples being analyzed can be entered into the comment blank. When finished CLICK "OK."
B. At this point the Instrument analysis window with the customer's worksheet should be displayed on the computer monitor screen. At the top of the screen there are four tabs to select from: Filing, Develop, Labels, and Analysis. SELECT the "Labels" tab.
1) In the Labels window, SELECT the appropriate blank and TYPE in the appropriate information (check standard, reagent blanks, sample ID, etc.) in the order they will be analyzed.
2) Once all the information has been entered this will complete the customer's worksheet.
C. At the top of the screen, SELECT the "Analysis" tab. This will bring the system back to the instrument analysis window.
Manual: L16.1 Procedure: ADS-1557 Procedure for Cold Vapor/Hydride Generation Atomic Absorption
Revision: 7 Page: 20 of 27
5.10 Signal Optimization and Igniting the Flame for Arsenic and Selenium Analyses
1. Before igniting the flame, the following must be satisfied:
A. Spray chamber pressure relief bung must be in place.
B. Liquid trap must be above the level mark. Looking at the water level from the outside, the level should be just below the drain outlet. The sensor in the liquid trap will shut down the flame if the liquid level falls below the required level. Also, the sealing gasket must be positioned correctly in the liquid trap. Arrows on the float should be pointing up.
C. The appropriate gases, acetylene, air, and nitrous oxide, must be pressurized to the spectrophotometer. The gases need to be valved open at the cylinder station and subsequently valved open at the instrument for the following pressures:
Acetylene: 15 (range 7-15 psi)
Air: 60 (range 35-65 psi)
Nitrous Oxide: 60 (range 35-65 psi)
Manual: L16.1 Procedure: ADS-1557 Procedure for Cold Vapor/Hydride Generation Atomic Absorption
Revision: 7 Page: 21 of 27
5.10 Signal Optimization and Igniting the Flame for Arsenic and Selenium Analyses, (cont.) Step 1, (cont.)
NOTE
For burner heads, the vertical and horizontal adjustments can be made either through the software or manually. Generally, the optimum height for the burner head for most elements is 5 mm below the optical path, but the optimal position will depend on the analyte (element) of interest. Reasonable optimization of the burner position, for most elements, can be performed using a white card that has a centering symbol, e.g., a cross or circle, positioned at 5 mm from the bottom edge of the card. Place the card mid length on the burner head with the centering mark over the flame slit and adjust the burner horizontally and vertically so that the light beam is centered on the white card.
NOTE
The burner head should be cleaned before every use to remove any salts or debris deposited on and in the burner head slit. This can be accomplished by slipping the white alignment card into the slit of the burner head and gently moving the card up and down and back and forth. The burner head should then be gently wiped with a damp tissue then followed by gently wiping with a dry tissue to remove any residues. Minimal cleaning is required on the exposed flame ignition area, wipe the area with a cotton swab dipped in dilute acid, if the area appears discolored.
NOTE
A cleaning wire is to be inserted into the nebulizer opening, and a cleaning wire is to be passed through the capillary tubing that is attached to the nebulizer so as to remove any impediments.
NOTE
When finished analyzing samples the SpectrAA should rinse, with flame ignited, for 5-10 minutes to reduce the amount of salt deposit and buildup on and in the burner head slit.
D. CHECK/INSTALL the air/acetylene burner head, PLACE the mount the flow-through for the gases being used for the analyses, AND OPTIMIZE its position (described below).
Manual: L16.1 Procedure: ADS-1557 Procedure for Cold Vapor/Hydride Generation Atomic Absorption
Revision: 7 Page: 22 of 27
5.10 Signal Optimization and Igniting the Flame for Arsenic and Selenium Analyses, (cont.) Step 1, (cont.)
NOTE
The flame, while aspirating distilled, deionized water or any liquid solution should be allowed to stabilize for at least 5 minutes prior to calibration. This will keep the burner head cool and operating properly.
E. PRESS the ignite button on the SpectrAA, AND KEEP it depressed until the flame ignites.
F. IF necessary, or desired, CHECK the uptake using a 10 or 25 mL graduated cylinder. The uptake should be approximately 7 ± 1 mL/min.
2. Analyte Signal
A. There are several options to choose from on the left side of the instrument analysis window: Select, Optimize, Start, Stop, Read, and Help. SELECT "Optimize."
B. SELECT "Ok" on the Optimize window. The Flame Optimization window will appear. SELECT the "Optimize Lamps" option. WAIT for the turret to rotate to the hollow cathode lamp corresponding to the element selected for analysis.
C. The lamp should be allowed to warm up for at least 5 minutes to stabilize before calibrating and performing analyses.
D. The dialog box appearing states: CONNECT tubing, CLICK "Ok".
E. The next dialog box appearing states: "Fatal Error, Auto adjuster sensor not found," CLICK "Ok".
F. SELECT "Rescale", AND THEN CLICK "Ok".
G. SELECT "Optimize" (This first optimization sequence is performed for the additional adjustments needed for the scissors lift underneath the burner assembly).
H. The dialog box appearing states: Connect tubing, CLICK "OK". (Slewing and Peaking observed on the right bottom corner of the screen.)
Manual: L16.1 Procedure: ADS-1557 Procedure for Cold Vapor/Hydride Generation Atomic Absorption
Revision: 7 Page: 23 of 27
5.10 Signal Optimization and Igniting the Flame for Arsenic and Selenium Analyses, (cont.) Step 2, (cont.)
I. Once the lamp has stabilized, SELECT the "Rescale" option. On the scale to the left in the Optimize Lamps window the green signal bar and the readout below the scale should be between .900 and 1.100. IF the readout is not within this range, SELECT the "Rescale" option again. IF it is still not within the range, CONTACT the Task Supervisor for corrective action.
J. Once the lamp has been optimized, SELECT the "Optimize Signal," AND THEN the "Inst. Zero" option.
K. SELECT "Optimize Lamp." If any change is detected, SELECT "Rescale" again, then "Instrument Zero."
L. The instrument is now optimized. SELECT "Ok" on the Flame Optimization window and "Cancel" on the next window (Optimize) that appears on the screen to return to the instrument analysis window.
5.11 Signal Optimization for Mercury
1. The mercury analytical technique does not require a flame; it is a cold vapor technique, therefore when the Hg lamp is selected the flame cannot be ignited.
2. PLACE the mounted mercury absorption cell onto the burner head.
3. Make sure the Hg lamp is selected, and ALLOW a minimum of 5 minutes for lamp warm-up.
4. OPTIMIZE the beam passing through the cell by using the manual adjustments on the instrument and noting the increase or decrease in signal displayed on the Optimization window of the software.
5. PERFORM the optimization of the signal as noted above in the instructions for arsenic and selenium.
5.12 Calibration and Sample Analysis
1. SELECT "Start" from the options on the left side of the instrument analysis window. After selecting Start, there will be a series of interactive windows that will appear on the screen.
2. SELECT "Ok" to the Confirm window to prepare for standard Zero. Once selected the instrument will be zeroed with the distilled, deionized water being aspirated into the system.
3. From this point, forward, the software will ask the operator to present various solutions (cal zero, calibration standards, check standards, reagent blanks and samples) to the instrument.
Manual: L16.1 Procedure: ADS-1557 Procedure for Cold Vapor/Hydride Generation Atomic Absorption
Revision: 7 Page: 24 of 27
5.12 Calibration and Sample Analysis, (cont.)
4. PLACE the aspirating tube into the solution the interactive window is asking for, AND SELECT "Read."
5. The instrument will take three readings and ask for the next solution.
6. Should it become necessary to repeat an analysis, the following steps are applicable:
CLICK the "Pause" button.
CLICK the "Stop" button.
HIGHLIGHT the cells associated with the sample/standard to be re-analyzed.
CLICK the "Read" button.
CLICK the "OK" button and allow the instrument to perform the analysis.
7. IF the results are acceptable, THEN CLICK the "OK" button.
8. IF a third analysis of a sample/standard is required, THEN the following steps should be followed:
CLICK the "Start" button.
CLICK the "Cancel" button.
CLICK the "Stop" button.
HIGHLIGHT the cells associated with the sample to be re-analyzed.
CLICK the "Read" button.
CLICK the "OK" button.
9. Once satisfactory results are achieved for the sample/standard in questions, the automatic run is continued by following the steps outlined below:
CLICK the "Stop" button.
CLICK the "Start" button.
CLICK the "Cancel" button.
CLICK the "Continue" button.
10. CONTINUE with the automatic run until the final sample, blank or standard entered on the worksheet has been analyzed.
Manual: L16.1 Procedure: ADS-1557 Procedure for Cold Vapor/Hydride Generation Atomic Absorption
Revision: 7 Page: 25 of 27
5.13 Preventive Maintenance
1. REFER to the manufacturer's manual for preventive maintenance.
2. RECORD all preventive maintenance and instrument repair actions in the registered AA Log Book when directed to do so by the Task Supervisor.
3. DAILY CHECK the sample introduction system and torch assembly for any noticeable problems - collapsed tubing, clogged burner head, clogged nebulizer, etc.
4. The elemental lamps housed inside the instrument on the lamp carousel periodically wear out and must be replaced. CONTACT the Task Supervisor for specific instructions on lamp replacement and disposal. These lamps must be disposed according to Environmental Compliance Authority (ECA) specifications. CONTACT the Resource Conservation Recovery Act (RCRA)-ECA, per the guidance in the Environmental Evaluation Checklist (EEC), TC-A-2013-0011.
5.14 Analytical Residue Disposal
PH Adjustment and Solidification of High Chloride Rad AA Residues for Disposal in Solid Residue:
1. In addition to the required lab coat, safety glasses and two pair of rad gloves, a face shield and plastic/rubber apron should be worn and if feasible to do so, use the horizontal hood sash for additional splash protection.
2. Prior to starting the instrument and preparation of standards and samples, FILL the 500 mL residue collection bottles with 130mL of Sodium Hydroxide (NaOH) 50% solution. Reference Section 5.5 for reagent preparation. This amount of NaOH will adjust the pH to the neutral range once the residue bottle is filled to capacity with instrument effluent. The requirement for residue solidification is that the liquid has a pH greater than 2. The requirement is stated in the EEC for the Atomic Absorption instrument operation, TC-A-2013-0011.
3. Once a residue collection bottle is full, POUR the contents into a 2L residue collection bottle. INSERT a portable pH meter that has been calibrated to pH 7 into residue to check the pH of residue, which should be at a pH greater than 2. IF necessary, use sodium hydroxide 50% solution to adjust the pH of the residue to greater than 2. IF the solution becomes hot, ALLOW the solution to cool to near room temperature before solidification.
Manual: L16.1 Procedure: ADS-1557 Procedure for Cold Vapor/Hydride Generation Atomic Absorption
Revision: 7 Page: 26 of 27
5.14 Analytical Residue Disposal, (cont.)
NOTE
A 250 mL beaker completely filled roughly equal to 250 grams of absorbent
4. THOROUGHLY CHECK the integrity of the side and bottom seams of a medium to large sized, radiological, poly bag to ensure the seams will not fail, THEN ADD approximately 750 grams of the specified absorbent (No Char A660) to the bag.
5. LINE a small paint pail with the rad bag containing the 750 grams of absorbent.
6. POUR approximately 1000 mL (approximately 1/2 of the volume of a 2 L bottle) of pH adjusted residue, which is at or near ambient temperature, to the absorbent in the bag, AND PAINT pail.
7. CAREFULLY REMOVE the bag from the pail, CAREFULLY CLOSE the mouth of the bag with one hand, AND CAREFULLY MIX the liquid and absorbent by gently kneading the outside of the bag to effect solidification.
8. INSPECT the contents of the bag to determine if any free liquid is present. If liquid is present, CAREFULLY, so as to avoid any absorbent coming out of the hood, ADD 100 - 200 more grams of absorbent to the bag, AND CAREFULLY LIFT the bags containing the absorbent and liquid from the pail, AND MANUALLY MIX the contents to remove any free liquid.
9. Should any free liquid remain after mixing, ADD an additional 100-200 grams of absorbent, AND REPEAT the mixing.
10. REPEAT steps 6 - 9 for the remaining 1,000 mL in the residue bottle.
11. Once all free liquid has been absorbed, TWIST AND TAPE shut using the J-seal.
12. PLACE the taped bag in a bag used for hood waste.
13. REPEAT the necessary steps for any additional residues requiring disposal.
14. All liquid residue created in B-143 shall be consolidated in the residue bottle in the radiological hood. No liquid residue, reagents, or samples are disposed to either HAD or LAD in B-143. Only rinses of DI water are allowed to the LAD.
Manual: L16.1 Procedure: ADS-1557 Procedure for Cold Vapor/Hydride Generation Atomic Absorption
Revision: 7 Page: 27 of 27
6.0 REFERENCES
8Q, 26, General Laboratory Safety Rules
L16.1, ADS-1554, Procedure for Operating Varian SPECTRAA-880 Atomic Absorption
DOE (U.S. Department of Energy), The Environmental Survey Manual, DOE/EH-0053, Washington, DC.
EPA (U.S. Environmental Protection Agency), Test Methods for Evaluating Solid Waste, SW-846, Cincinnati, Ohio.
EPA (U.S. Environmental Protection Agency), USEPA Contract Laboratory Program, SOW. 12/87, Las Vegas, NV.
Standard Methods for the Examination of Water and Wastewater, 16th Edition, 303 F. Determination of Mercury by the Cold Vapor Technique, pp. 171-173, APHA, AWWA, WPCF, 1985.
Varian SpectAA Operation Manual
7.0 RECORDS
None
8.0 ATTACHMENTS
None
SAVANNAH RIVER NATIONAL LABORATORY Manual: L16.1 ANALYTICAL DEVELOPMENT Procedure: ADS-1573 AD ANALYTICAL OPERATING PROCEDURES Revision: 2 Page: 1 of 51 TECHNICAL REFERENCE Effective Date: 09/30/10 _____________________________________________________________________________________________
Radioactive and Non-Radioactive Approved by: Sample Analysis on the Leeman Prodigy Inductively Coupled Plasma Approval on File Emission Spectrometer (U) AD Manager 1.0 Purpose The purpose of this procedure is to establish the requirements for the use of
inductively-coupled plasma atomic emission spectroscopy (ICP-ES) for the analysis of metals in radioactive and non-radioactive aqueous solutions at low concentrations (μg/L to mg/L).
2.0 Scope
This procedure applies to the analysis of research and development samples. Results obtained from use of this procedure do not meet requirements for compliance or regulated sample analysis reporting. This procedure applies to the following instrument: Model Number: Prodigy DV ID Number: 6048 Install Number: 63169 Teledyne Leeman Labs 6 Wentworth Drive Hudson, NH 03051 (800) 533-6267
2.1 Definitions and Abbreviations
MDL - Method Detection Limit. The minimum concentration detectable in a solution. MDLs are matrix-dependent and emission line specific. RCRA - Resource Conservation and Recovery Act. Defines eight elements as potentially hazardous and defines the maximum TCLP leachate concentration. The ICP-ES typically analyzes five of the eight (Ag, Ba, Cd, Cr and Pb.) TCLP - Toxic Characteristic Leaching Protocol. The leachate solutions are analyzed for the RCRA hazardous elements.
SAVANNAH RIVER NATIONAL LABORATORY Manual: L16.1 ANALYTICAL DEVELOPMENT Procedure: ADS-1573 AD ANALYTICAL OPERATING PROCEDURES Revision: 2 Page: 2 of 51 TECHNICAL REFERENCE Effective Date: 09/30/10 _____________________________________________________________________________________________
CTF - Cognizant Technical Function TA - Technical Analyst ADSLIMS - Analytical Development Section Laboratory Information Management System
2.2 Responsibilities 2.2.1 Cognizant Technical Function
The Chemist assigned to the Leeman Prodigy is the
Cognizant Technical Function (CTF).
The CTF is responsible for implementing the MS&E controls (1Q Manual, QAP 2-7); the selection and establishment of calibrations, calibration standards, calibration frequency, calibration ranges, acceptable uncertainties, electronic calibration records, reviewing and approving extensions of shelf lives, calibrations as well as designation of MS&E support equipment e.g. pipettes.
The CTF is responsible for data generated by the ICP-ES. The CTF is responsible for ensuring data is reviewed and
approved. The CTF is responsible for reviewing data generated by
the ICP-ES when an out-of-calibration condition is discovered, in order to ascertain when the instrument may have malfunctioned and determine the validity of the data generated by the instrument since the previous calibration.
The CTF, or designee, is responsible for the maintenance,
repair, and operation of the ICP-ES. The CTF, or designee, is responsible for training new
Technical Analyst(s).
SAVANNAH RIVER NATIONAL LABORATORY Manual: L16.1 ANALYTICAL DEVELOPMENT Procedure: ADS-1573 AD ANALYTICAL OPERATING PROCEDURES Revision: 2 Page: 3 of 51 TECHNICAL REFERENCE Effective Date: 09/30/10 _____________________________________________________________________________________________
The CTF is responsible for qualifying trained Technical Analysts on the ICP-ES and applicable methods.
The CTF is responsible for coordinating the procurement
of new components (i.e. autosampler, spray chamber) for the ICP-ES.
The CTF is responsible to ensure that standards used for
calibrating and verifying control of measurement systems shall be traceable as described in Manual 1Q, QAP 2-7.
2.2.2 Technical Analyst
The Technical Analyst (TA) assigned to the Leeman
Prodigy is responsible for operating the ICP-ES in accordance with approved procedures.
The TA is responsible for performing calibrations and
analyzing samples and instrument check standards. The TA is responsible for recording MS&E related
information in appropriate notebooks and/or logbooks. The TA is responsible for the preparation of calibration
standards and ordering chemicals and spare parts. The TA is responsible for disposing of waste and residue.
3.0 Precautions/Limitations
FOLLOW the ADD radiation safety guidelines (L1, Procedure 2.32)
Follow the ADD laboratory safety guidelines (8Q, Procedure 26) Hazard Assessment Package # SRNL-ADD-l4000-2009-00002 identified the
hazards listed in the table below and the corresponding hazard controls.
SAVANNAH RIVER NATIONAL LABORATORY Manual: L16.1 ANALYTICAL DEVELOPMENT Procedure: ADS-1573 AD ANALYTICAL OPERATING PROCEDURES Revision: 2 Page: 4 of 51 TECHNICAL REFERENCE Effective Date: 09/30/10 _____________________________________________________________________________________________
Identified Hazard Hazard Control 2 % Nitric acid preparation – contact with or spill of concentrated nitric acid
Prepare 2% nitric acid in hood with face shield and safety goggles, lab apron, neoprene or thick mil nitrile gloves, face shield, lab coat and use spill response per Manual 8Q Procedure 26.
Standards preparation – contact with or spill of 2 % HNO3 and 0.1 % HF
Prepare standards in a secondary containment tray or container with lab coat, safety glasses, and thin mil nitrile gloves.
Samples preparation, sample loading on auto-sampler, and waste handling – radioactive potentially containing HF and HNO3
Pay attention to limited-use pipets, which are labeled. Prepare samples in hood with safety glasses/side shields, lab coat and yellow gloves. Also don lab apron, neoprene or thick mil nitrile gloves, face shield and splash goggles when handling HF samples per Manual L1, Procedure 3.20. Follow safe radiological practices per Manual L1, procedure 2.32. Follow current SRWP guidelines. Use spill/contact response per Manual 8Q, Procedure 26 and Manual L1, Procedure 3.20.
Peristaltic pump pinch points Use caution when engaging peristaltic pump.
UV light/Rf power exposure and potential glass breaking during torch assembly maintenance
Switch instrument off and unplug prior to maintenance and optimization. Torch housing interlocks are also present as engineering controls. Don yellow gloves, labcoat, safety glasses/side shields per SRWP. Use care when handling glass. Do not use metal objects on the RF coil or torch.
Disposition of torch assembly components – handling beryllium contaminated waste
Torch assembly is labeled in accordance with Manual L1, procedure 3.24. Perform waste handling in accordance with Manual L1, procedure 3.24.
Auto-sampler maintenance – potential for chemical spill
Don yellow gloves, labcoat, safety glasses/side shields per SRWP and check for leaks in tubing and change if necessary.
SAVANNAH RIVER NATIONAL LABORATORY Manual: L16.1 ANALYTICAL DEVELOPMENT Procedure: ADS-1573 AD ANALYTICAL OPERATING PROCEDURES Revision: 2 Page: 5 of 51 TECHNICAL REFERENCE Effective Date: 09/30/10 _____________________________________________________________________________________________
Water spill, pinch points, and head injury during chiller maintenance
Perform rad screen on water before changing; check for leaks in tubing; don leather gloves in addition to lab coat and safety glasses; be mindful of head placement using proper position techniques.
3.1 Emergency Shutdown If conditions exist that warrant the immediate shutdown of the ICP-ES
(e.g. lab evacuation), press the red plastic button on the spectrometer housing (below green button on instrument outside of hood).
3.2 Method Hazards
3.2.1 The plasma source emits strong ultraviolet (UV) radiation, which can cause permanent eye damage. Do not look directly at the source unless it is viewed through the UV absorbing material mounted in the viewing window of the metal box that contains the torch.
3.2.2 High voltages exist inside the radio frequency (RF) power
generator and other parts of the spectrometer. Do not open the spectrometer or the power supply unless qualified to do so by the CTF.
3.2.3 Concentrated nitric acid is an extremely corrosive and toxic
chemical that must be handled with great care. The acid irritates all parts of the respiratory tract and is corrosive to the skin and other tissues, especially the eyes (see MSDS 9587-1).
3.2.4 For samples with high tritium content (up to 12 curies/L) to be
analyzed, follow special safety precaution instructions per the Special Radiological Work Permit and pre-job briefing for these analyses.
4.0 Prerequisite Actions
4.1 Calibration Frequency and Status
SAVANNAH RIVER NATIONAL LABORATORY Manual: L16.1 ANALYTICAL DEVELOPMENT Procedure: ADS-1573 AD ANALYTICAL OPERATING PROCEDURES Revision: 2 Page: 6 of 51 TECHNICAL REFERENCE Effective Date: 09/30/10 _____________________________________________________________________________________________
The instrument should be calibrated each day samples are analyzed, as needed. Calibrations must be confirmed prior to reporting results. Calibration status is established and maintained via analysis of instrument check standards (a) after calibration and (b) after a batch of samples is analyzed. For more details see the Quality Assurance and Quality Control section (See 5.1.5) and the Instrument Operation section (See 5.2).
4.2 Training Requirements
4.2.1 During training, all ADS analysts must work under direct technical supervision or under the guidance of another qualified analyst. It will be the CTF’s responsibility to decide when the analyst is suitably instructed and experienced to operate the instrument.
4.2.2 Qualification as an ICP-ES technician shall be documented by
an approved training method.
4.2.3 Advanced training offsite short courses, such as those offered by the American Chemical Society or the Society for Applied Spectroscopy, can be required of the technician. The need for this type of advanced training will be left to the discretion of the CTF. A technician operating the instrument will be required to use computers, to operate the instrument, to enter data and information on the LIMS, and may be required to prepare reports (using Microsoft Word) and to prepare data for direct transfer to the LIMS (using Microsoft Excel).
5.0 Performance
5.1 General Information
The Inductively Coupled Plasma Emission Spectrometer (ICP-ES) provides multi-elemental analyses of solutions. Measurements are based on atomic emission from excited atoms and ions. Liquid samples are nebulized. The aerosol produced is transported to an argon plasma. The plasma is created and sustained by coupling a radio frequency (RF) signal to the argon gas. In the high temperature plasma (10,000 K) atomic species are excited to higher energy states resulting in characteristic atomic and ion line emission. The spectra
SAVANNAH RIVER NATIONAL LABORATORY Manual: L16.1 ANALYTICAL DEVELOPMENT Procedure: ADS-1573 AD ANALYTICAL OPERATING PROCEDURES Revision: 2 Page: 7 of 51 TECHNICAL REFERENCE Effective Date: 09/30/10 _____________________________________________________________________________________________
are dispersed through a grating spectrometer (polychromator). The intensities of the lines, which are directly proportional to analyte concentration, are monitored by a Large Programmable Array Detector (L-PAD). The photocurrents from the L-PAD are processed, quantified and controlled by a computer system. The primary detection scheme for the Leeman Prodigy is a 0.80 Spectrometer with/L-PAD detector. For simultaneous detection, the L-PAD can be used for many elements commonly found in SRNL/SRS samples. These wavelength positions were selected by SRNL subject-matter-experts for optimum sensitivity and selectivity. Ag, Al, B, Ba, Ca, Cd, Ce, Co, Cr, Cu, Fe, Gd, K, La, Li, Mg, Mn, Mo, Na, Ni, P, Pb, Si, Sn, Sr, Ti, U, Zn, and Zr. Detection limits for the elements are generally in the ppb range, but vary with the emission line selected and the sample matrix. The choice of wavelengths used will depend on the complexity of the matrix, sensitivity needed and amount of sample available. The CTF is the final judge on analytical wavelengths.
The Leeman Prodigy ICP-ES is operated using Windows compatible software on an IBM-compatible personal computer (PC).
5.1.1 General Limitations
General Precautions: Do not run organic samples without prior authorization of
the CTF. Check for solids in samples and filter if necessary. If sample
is filtered, indicate in the sample ID by following the LIMS number with “f”.
Colored samples are to be run after dilution. Evaluate the sample following guidance of Attachment 8.1,
Sample Collection, Preservation and Preparation. Listed waste samples (i.e. F006-listed) including RPP
material must have all waste collected (including the effluent that normally goes to the High Activity Drain) and returned to the customer.
5.1.2 Interference Effects
Several types of interference may be present in the ICP-ES:
SAVANNAH RIVER NATIONAL LABORATORY Manual: L16.1 ANALYTICAL DEVELOPMENT Procedure: ADS-1573 AD ANALYTICAL OPERATING PROCEDURES Revision: 2 Page: 8 of 51 TECHNICAL REFERENCE Effective Date: 09/30/10 _____________________________________________________________________________________________
Spectral Interference is an increase or decrease in intensity caused by spectral overlap from a matrix or plasma wavelength (either atomic or molecular). Interferences can result from nearby unresolved wavelengths (either atomic or molecular), altered background contribution from changing plasma conditions or increases in stray light from high concentration elements. Background correction, which is used for trace analysis when possible with the ICP-ES, corrects for spectral changes in the background. Spectral overlap from unresolved wavelengths is corrected using Interelement Correction factors (IECs), which correct for interference based on the measured intensity of the interfering species at a second wavelength.
Physical Interference is an increase or decrease in sample
nebulization or transport, which alters the measured wavelength intensity. Physical effects are commonly found when analyzing samples, which contain high quantities of dissolved solids and/or acid concentrations. Internal standards, typically Y or Sc, can be used with the Leeman Prodigy ICP to compensate for these effects. In those instances when a sample extinguishes the plasma, the sample introduction system may require purging as described on Attachment 8.2, Troubleshooting. Consequently, the suspect sample may require additional dilution. Commonly used dilution factors are listed on Attachment 8.3 in order to facilitate this process.
Chemical Interference is an increase or decrease in measured
intensity caused by molecular compound formation, ionization of elements, and solute vaporization effects. These effects are not typically found with ICP. However, if observed they can be minimized by matrix matching. Further improvements can be obtained by careful selection of operating conditions (e.g. incident power, observation position, etc.) by buffering of the sample, matrix matching, and standard addition procedures. These types of interferences can be highly dependent on matrix type and the specific analyte element of interest.
SAVANNAH RIVER NATIONAL LABORATORY Manual: L16.1 ANALYTICAL DEVELOPMENT Procedure: ADS-1573 AD ANALYTICAL OPERATING PROCEDURES Revision: 2 Page: 9 of 51 TECHNICAL REFERENCE Effective Date: 09/30/10 _____________________________________________________________________________________________
5.1.3 Detection Range Limits
Minimum Detection Limit (MDL) - The minimum
detection limit for an element/wavelength must be determined, as directed by the CTF. Attachment 8.4, ICP-ES Method Detection Limits, lists typical MDLs for routine elements on the Leeman Prodigy.
The MDL is routinely determined by multiplying by ten the
standard deviation of ten blank measurements after calibrating the instrument in a particular matrix. Each blank measurement must be performed as though it were a separate sample. An MDL is normally measured in 2-5% HNO3.
MDL = 10 X conc)
(conc)- Standard deviation of ten blank measurements in units of either mg/L or μg/L.
MDLs can also be determined for specific matrices by measuring a blank and standards spiked with the matrix. When directed by the CTF, an alternate approach may also be utilized to determine an MDL using the calibration and QC intensities obtained during an analysis. Each time the MDL for an element is determined, the resulting number (in mg/L) shall be kept on the ICP-ES server. The MDL files are controlled by the inclusion of a revision number and are matrix specific.
Linearity Ranges - The normal linearity range for analytes in an undiluted sample is from the MDL to 10 mg/L or maximum linear concentration, whichever is lower in the diluted sample.
Line Intensities Lines presenting a low intensity during
the analysis of a standard are typically calibrated using higher concentrations of standard (e.g. Sulfur). Drift in the apparent concentration of the blank for a low intensity line should not be a concern if the drift is comparable to the
SAVANNAH RIVER NATIONAL LABORATORY Manual: L16.1 ANALYTICAL DEVELOPMENT Procedure: ADS-1573 AD ANALYTICAL OPERATING PROCEDURES Revision: 2 Page: 10 of 51 TECHNICAL REFERENCE Effective Date: 09/30/10 _____________________________________________________________________________________________
detection limit (which is higher than for more sensitive lines).
5.1.4 Quality Assurance and Quality Control
5.1.4.1 MS&E Components
A series of pipettes, component parts of the Leeman Prodigy ICPES system, are identified via their unique serial numbers in the MS&E/Maintenance History logbook. Prior to use, the pipette is checked via weighing DDI H2O on a calibrated balance. Weighing result must be within 1% of the maximum volume for that pipette. If the pipette is out of the acceptable limit contact the CTF.
5.1.4.2 Registered Notebooks
At the direction of the CTF, the following are kept in a bound registered MS&E history notebook: Unique ID of pipets incorporated as part of the
RADICPES MS&E system, instrument status data, records of preventive maintenance and instrument
repair.
5.1.4.3 Calibration Standards
The instrument is calibrated for each analyte to be quantified. A standard curve for that element is generated using standard solutions with varying concentrations and a calibration blank. Mixed calibration standard solutions are prepared by combining appropriate volumes of the stock solutions in Class A #5680 volumetric flasks, or equivalent. Stock standard solutions shall be traceable to NIST standards or in compliance with QAP 2-7. Purchased multi-element standard solutions should be replaced when beyond the manufacturer’s expiration date. (Extending the use of calibration stock standards
SAVANNAH RIVER NATIONAL LABORATORY Manual: L16.1 ANALYTICAL DEVELOPMENT Procedure: ADS-1573 AD ANALYTICAL OPERATING PROCEDURES Revision: 2 Page: 11 of 51 TECHNICAL REFERENCE Effective Date: 09/30/10 _____________________________________________________________________________________________
beyond the expiration date is accomplished via procedure 1Q, QAP 2-7.) The number of calibration standards and their concentration depends on the specific element and its estimated concentration in the samples. The lowest concentration in a calibration standard is not to be lower than the Minimum Detection Limit (MDL) for that element. The number and concentration of standards should be approved by the CTF for prior to analysis. The calibration blank should contain the appropriate acid(s) and/or other materials used for sample preparation and the calibration standards.
After receiving replacement calibration stock standards, the stock solutions should be analyzed separately to determine possible spectral interferences and to detect the presence of impurities. Care should be taken when preparing any mixed standards that the elements are compatible and stable.
Prepare the mixed calibration standard solutions and transfer to a clean LDPE (low-density polyethylene) bottle. Freshly mixed standards should be prepared only as needed with the realization that concentration can change on aging. Fresh calibration standards should be prepared monthly (every 30 days). The 30 day shelf life may be adjusted if faster degradation has been confirmed, the material is consumed, or the CTF directs otherwise. If continuity of data is better served to use a calibration standard solution beyond 30 days, contact the CTF for approval. Purchased multi-element standard solutions contain typical calibration standard analytes. To facilitate analyzing a large variety of samples several custom mix standards are used. The elements contained in each mix vary depending upon vendor determined combinations.
Note: The specific analyte combinations and matrices used in an analysis are method-specific.
SAVANNAH RIVER NATIONAL LABORATORY Manual: L16.1 ANALYTICAL DEVELOPMENT Procedure: ADS-1573 AD ANALYTICAL OPERATING PROCEDURES Revision: 2 Page: 12 of 51 TECHNICAL REFERENCE Effective Date: 09/30/10 _____________________________________________________________________________________________
All standard combinations should be approved by the CTF before use. In the situation when a standard is not commercially available, elemental concentrations must be established by an acceptable laboratory method e.g. radiological counting, mass spectrometry, etc.
5.1.4.4 Data Validation (Quality Control)
5.1.4.4.1 Quality Control (QC) standards are analyzed
for routine samples. The QC standard is made from independent dilutions of stock standards that originate from a lot number different from the calibration standards. Other sources of stock standards may be utilized when directed to do so by the CTF. For the purchased multi-element standard solutions, the respective QC standards may be made from independent dilutions of single element stock standard solutions or as directed by the CTF. This material should be matrix matched to the calibration standards and should include the elements specified by the CTF from the customer requirements. QC standards originating from the same lot as the calibration standards may be used at the discretion of the CTF if a measurement from an independent source is made at least once during the analysis.
5.1.4.4.2 QC standard results are acceptable when the
results are within +10% of the listed values (prepared concentration). If the results are outside the QC limits, indicating calibration drift (or an “out-of-calibration condition”), consult the CTF.
SAVANNAH RIVER NATIONAL LABORATORY Manual: L16.1 ANALYTICAL DEVELOPMENT Procedure: ADS-1573 AD ANALYTICAL OPERATING PROCEDURES Revision: 2 Page: 13 of 51 TECHNICAL REFERENCE Effective Date: 09/30/10 _____________________________________________________________________________________________
5.1.4.4.3 Analyze the calibration blank before the QC standard(s), as directed by the CTF. (This is the same material used for instrument calibration.).
The results should be low ppb (< ~1/3 of MDL). Results higher than this may need to be reviewed with the CTF.
5.1.4.4.4 Analyzing the QC standard(s)
QC standards are to be run such that they bracket sets of samples. This is accomplished by running the QC standards: after the calibration, every 10 to 15 samples or with every
group of samples, and at the end of the samples to be run with
that particular method Note: High concentrations of analyte may require flushing of the system and analysis of a blank after the last sample before “closing” QC standard.
5.1.4.4.5 All calibration and QC data results are
electronically stored on an Analytical Development controlled server. The server is backed up nightly. Because quality assurance requires that the Manufacturer, Expiration Date, Lot #, and dilution/matrix information be traceable on the solutions used for these measurements, documenting will be done via recording in the MS&E History notebook.
Note: EPA protocols dictate additional QC that is outside the scope of this procedure. Customer assisted Quality Assurance can be performed by acquiring these QC standards
SAVANNAH RIVER NATIONAL LABORATORY Manual: L16.1 ANALYTICAL DEVELOPMENT Procedure: ADS-1573 AD ANALYTICAL OPERATING PROCEDURES Revision: 2 Page: 14 of 51 TECHNICAL REFERENCE Effective Date: 09/30/10 _____________________________________________________________________________________________
and providing directions in a Task Plan on how to implement their use.
5.1.4.5 Traceability
Traceability of reported analytical results is documented via the pipets assigned to this MS&E system, unique LIMS sample number, and personnel identified in the electronic record stored on the ADS file server.
5.1.5 Reagents
Acids typically used in the preparation of standards and for sample processing must be ultrahigh purity grade or equivalent. Redistilled acids from Seastar Chemical, Seattle, WA are acceptable examples. Reagent grade acids can be used for cleaning glassware and sample containers.
5.1.5.1 Nitric Acid (16 M HNO3) - Concentrated (sp gr 1.41).
5.1.5.2 Deionized Water - Prepared by passing distilled or
potable water through a mixed bed of cation and anion exchange resins. Use deionized distilled water for the preparation of all reagents, calibration standards, and as dilution water. The purity of this water must be equivalent to ASTM Type II reagent water of Specification D 11931. This is available from the Millipore Milli-Q system.
Note: Building-distilled water "as is" does not meet this specification and should not be used unless it has been deionized through the Milli-Q system.
Before using the Milli-Q water make sure the resistance reading of the water on the LED meter is greater than 10 M/cm. Normal operation is in the 14-18 M range. Replace the ion exchange cartridges when the digital display indicates and allow water to run through the system until the display reads 18.2.
SAVANNAH RIVER NATIONAL LABORATORY Manual: L16.1 ANALYTICAL DEVELOPMENT Procedure: ADS-1573 AD ANALYTICAL OPERATING PROCEDURES Revision: 2 Page: 15 of 51 TECHNICAL REFERENCE Effective Date: 09/30/10 _____________________________________________________________________________________________
5.1.5.3 Calibration Standard Stock Solutions - These solutions may be purchased or prepared from ultrahigh purity grade chemicals or metals. All standards should be NIST traceable or in compliance with QAP 2-7.
5.2 Operational Steps
5.2.1 Instrument Start-up
5.2.1.1 Instrument and computer power remains on at all
times. If power is off during start-up, consult either the CTF or a Leeman representative.
5.2.1.2 Turn on the monitor.
5.2.1.3 From the windows operating system, double click on
the Salsa.exe icon and click “OK” when prompted for a password.
5.2.1.4 Click on Method and Open in order to open an ICP method.
5.2.1.5 Highlight the method of choice and click OK.
5.2.1.6 If the prompt Opening Method Lines Updating from
Library appears, then
Click OK and proceed to step 5.2.1.7, else Proceed to step 5.2.1.7.
5.2.1.7 Click on the Method tab (found at the bottom of the
navigation panel as shown in Figure A-1).
5.2.1.8 Expand method by clicking on the + symbol.
5.2.1.9 Click on the Instrument Control line (listed on the
SAVANNAH RIVER NATIONAL LABORATORY Manual: L16.1 ANALYTICAL DEVELOPMENT Procedure: ADS-1573 AD ANALYTICAL OPERATING PROCEDURES Revision: 2 Page: 16 of 51 TECHNICAL REFERENCE Effective Date: 09/30/10 _____________________________________________________________________________________________
navigation panel as shown on Attachment 8.6, Figure A-1).
5.2.1.10 Click on Air in the Autosampler control box (found on
the Instrument Control screen as shown on Attachment 8.6, Figure A-1) in order to raise the uptake sipper tube.
CAUTION!
USE CAUTION WHEN ENGAGING PERISTALTIC PUMP
DUE TO PINCH POINTS
5.2.1.11 Connect the sample tubing (black-black or equivalent) and residue tubing (red-red or equivalent) around the peristaltic pump and close the levers.
5.2.1.12 Replenish and place the rinse reservoir underneath
the sample uptake tube.
5.2.1.13 From the Instrument Control screen (Attachment 8.6, Figure A-1), click on Rinse in the Autosampler control box in order to return the uptake sipper tube to the rinse reservoir.
5.2.1.14 On the Instrument Control screen (Attachment 8.6,
Figure A-1), click on Autostart and wait 40 seconds. The plasma will automatically ignite after this 40 seconds interval.
5.2.1.15 If the plasma does not remain lit, press the
Extinguish button next to Autostart. Repeat step 5.2.1.14. If the plasma does not sustain after repeating this step, contact the CTF.
5.2.1.16 Observe the plasma, uptake and drain tubing. If any
of these are unstable, press the Extinguish button and start again at step 5.2.1.14.
SAVANNAH RIVER NATIONAL LABORATORY Manual: L16.1 ANALYTICAL DEVELOPMENT Procedure: ADS-1573 AD ANALYTICAL OPERATING PROCEDURES Revision: 2 Page: 17 of 51 TECHNICAL REFERENCE Effective Date: 09/30/10 _____________________________________________________________________________________________
5.2.1.17 Allow the system to stabilize for thirty minutes at these conditions before running calibrations or sample analyses. Conditions for normal operation are shown in 5.2.2.1.
5.2.1.18 After at least 30 minutes, select Standards and cup
33 from the pull-down cursors available in the Autosampler box and click Cup Fig. A1. This will send the uptake sipper tube to the position plasma solution (~10 ppm Mn in 2% nitric acid) in cup 33 on the standards rack (Attachment 8.6, Figure A-2).
5.2.1.19 Select the Auto-align function located on the shortcut
toolbar (Attachment 8.6, Figure A-3). 5.2.1.20 Click on Auto Align in the Auto Wavelength
Alignment box in order to automatically align on the Hg Reference Lamp (Attachment 8.6, Figure A-4).
5.2.1.21 After about a minute when the “Hg Ref alignment
fragment finished, acceptance required to continue” statement appears (Attachment 8.6, Figure A-4), highlight “Hg Ref” line (Attachment 8.6, Figure A-4) and view the dx and dy parameters.
5.2.1.22 If the dx and dy parameters are not between -4 and +4
(0 is optimum for both dx and dy), then Contact CTF, else Accept the Hg reference alignment and close the
Auto Wavelength Alignment box. 5.2.1.23 Click on the Radial option (Attachment 8.6, Figure A-
1) and the Position Plasma button (Attachment 8.6, Figure A-1) in order to peak the plasma on the intermediate Mn wavelength or wavelength of choice in the radial mode.
5.2.1.24 Select Mn 257.610 r (where r is for radial mode) or
the wavelength of choice from the scroll-down menu
SAVANNAH RIVER NATIONAL LABORATORY Manual: L16.1 ANALYTICAL DEVELOPMENT Procedure: ADS-1573 AD ANALYTICAL OPERATING PROCEDURES Revision: 2 Page: 18 of 51 TECHNICAL REFERENCE Effective Date: 09/30/10 _____________________________________________________________________________________________
located on the Position Source box and click on Peak Plasma (Attachment 8.6, Figure A-5). This will position the plasma in the radial mode. The minimum signal of Mn 257.610 r in the radial mode for 10 ppm Mn is 100,000 counts.
5.2.1.25 After the position plasma is complete (about one
minute), click on Close (Attachment 8.6, Figure A-5).
5.2.1.26 Click on the Axial option (Attachment 8.6, Figure A-1) and the Position Plasma button (Attachment 8.6, Figure A-1) in order to peak the plasma on the intermediate Mn wavelength or wavelength of choice in the axial mode.
5.2.1.27 Select Mn 257.610 (notice absence of “r” for radial) or
the wavelength of choice from the scroll-down menu located on the Position Source box and click on Peak Plasma (Attachment 8.6, Figure A-6). Note that the title in the window top must agree with the large bold print inside of the window (Attachment 8.6, Figure A-6). This will position the plasma in the axial mode. The minimum signal of Mn 257.610 in the axial mode for 10 ppm Mn is 1,000,000 counts.
5.2.1.28 After the position plasma is complete (about one
minute), click the Close button (Attachment 8.6, Figure A-6) and click on the “Rinse” button in the Autosampler box on the Instrument Control screen (Attachment 8.6, Figure A-1) in order to return the uptake sipper tube to the rinse reservoir.
5.2.2 Instrument Set-up Conditions (typical – as seen on screen shown in Attachment 8.6, Figure A-1).
5.2.2.1 At top of window: Power: 1.2 kW
Coolant gas flow: 19 L/min Auxiliary gas flow: 0.5 L/min Nebulizer gas flow: 32 psi
SAVANNAH RIVER NATIONAL LABORATORY Manual: L16.1 ANALYTICAL DEVELOPMENT Procedure: ADS-1573 AD ANALYTICAL OPERATING PROCEDURES Revision: 2 Page: 19 of 51 TECHNICAL REFERENCE Effective Date: 09/30/10 _____________________________________________________________________________________________
Pump flow rate: 1.1 mL/min Camera status: Connected; -45 ºC Within the window: Purge setting: Low
5.2.2.2 The above conditions are set for normal operation of
the instrument in most cases. However, there are occasions where other conditions will be used. These situations include analysis of alkali elements, halides and organic solutions. Consult the CTF prior to use under non-routine conditions.
5.2.3 Calibration and Analysis
5.2.3.1 Calibration and analysis are performed by using the
QC Automation function on the method tab along with the Run Sequence function on the sequence tab. Sequence files can be generated on pre-existing methods. Method generation will be discussed in Section 5.2.4. A complete understanding of the method is not needed to generate a sequence or perform an analysis.
5.2.3.2 On the Method tab, select the QC Automation line on
the navigation panel (Attachment 8.6, Figure A-7). 5.2.3.3 Check the appropriate boxes on the QC Automation
screen in order to select the calibration and QC standards of choice as depicted on Attachment 8.6, Figure A-7.
5.2.3.4 Select the Analysis tab at the bottom of the
navigation panel and click on Analysis on the Analysis screen (Attachment 8.6, Figure A-8).
5.2.3.5 Select New off the list of choices on the Analysis pull-
down menu and type today’s date (0-00-00) as shown on Attachment 8.8, Figure A-8. This will create a new daily analysis chapter.
5.2.3.6 Click OK to accept the new analysis chapter and
SAVANNAH RIVER NATIONAL LABORATORY Manual: L16.1 ANALYTICAL DEVELOPMENT Procedure: ADS-1573 AD ANALYTICAL OPERATING PROCEDURES Revision: 2 Page: 20 of 51 TECHNICAL REFERENCE Effective Date: 09/30/10 _____________________________________________________________________________________________
click on Results tab on the Analysis screen (Attachment 8.8, Figure A-8). This will allow results viewing during analysis.
5.2.3.7 Select the Sequence tab at the bottom of the
navigation panel (Attachment 8.6, Figure A-8). 5.2.3.8 Type the sample IDs to include the dilution factors on
the sequence editor and click Update (Attachment 8.6, Figure A-2). This will include the sample rack in the sequence. NOTE: An internal standard blank is placed in position 1 of the sample rack as a typical practice.
5.2.3.9 Review the sequence listed on the navigation panel to
ensure appropriate calibration and QC standards and sample identifications, etc. (Attachment 8.6, FigureA2).
CAUTION!
MOST SAMPLES ARE RADIOACTIVE AND COULD
CONTAIN HNO3 OR HF, FOLLOW SAFETY GUIDELINES THAT ARE SPECIFIED IN SECTION 3.0
OF THIS PROCEDURE
5.2.3.10 Load the standards and sample racks in accordance with the racks diagram on the sequence screen (Attachment 8.6, Figure A-2).
5.2.3.11 Click on Run Sequence on the sequence screen.
5.2.3.12 If the warning condition, the following subarrays
overlap . . . . continue?, appears, then click Yes.
5.2.3.13 Select analysis tab on the navigation panel. The Results menu will be available to view results during a run.
SAVANNAH RIVER NATIONAL LABORATORY Manual: L16.1 ANALYTICAL DEVELOPMENT Procedure: ADS-1573 AD ANALYTICAL OPERATING PROCEDURES Revision: 2 Page: 21 of 51 TECHNICAL REFERENCE Effective Date: 09/30/10 _____________________________________________________________________________________________
5.2.3.14 The method can be saved as a precaution at any point while setting up for calibration and analysis. Select the method tab on the navigation panel and click on Method from the menu bar (Attachment 8.6, Figure A-9).
5.2.3.15 The calibration curves can be reviewed at any point
during a calibration and analysis. Select the method tab on the navigation panel and click on the plus symbol next to the Element Selection line on the navigation panel. Click on the wavelength of choice and click on the Calibration tab on the displayed wavelength screen. The Rho coefficient (acceptable is >0.995) and calibration curve levels are displayed for review on this screen. (Attachment 8.6, Figure A-10).
5.2.4 Method Creation
A method is a program, which contains all pertinent information for analysis. To create a method one must define:
The element(s) to determine, The wavelength(s) by element The standards and their concentrations The rinse time between subsequent samples The transfer time from sample to plasma The plasma conditions for the instrument Method Creation is an advanced topic which is not required
for analysis. See Attachment 8.7 for procedure for Method creation
5.2.5 Calibration Frequency
The instrument requires a minimum of a daily calibration unless directed by the CTF, for each method. A previously created calibration curve may be confirmed for subsequent use by the analysis of a blank as well as the check standards required in the method of interest. The desired minimum value for the correlation coefficient for each element should be 0.995. If analysis of the check does not meet the + 10% requirement, re-calibrate. However, a method may require calibration more
SAVANNAH RIVER NATIONAL LABORATORY Manual: L16.1 ANALYTICAL DEVELOPMENT Procedure: ADS-1573 AD ANALYTICAL OPERATING PROCEDURES Revision: 2 Page: 22 of 51 TECHNICAL REFERENCE Effective Date: 09/30/10 _____________________________________________________________________________________________
frequently. If the system is left idle for extended time periods, drift can occur and the calibration should be re-checked by analyzing for all elements using a blank and the QC standards. Data is recorded and stored in the following manner (refer to Attachment 8.6, Figure A-11):
The appropriate Report Spec is loaded on the analysis tab and Report menu with the Load function.
The results of choice are selected by clicking on the appropriate boxes listed on the navigation panel on the analysis tab.
The results are exported in CSV format by clicking the CSV button on the Report menu.
All data is in an Excel export file titled with the sample identification, date and time of analysis.
The export files are archived on the ICP server for CTF review.
Section 5.1.4 outlines the requirements for frequency and acceptance of QC and Blank results.
5.2.6 Analytical Waste and Residue
CAUTION!
THE RESIDUE IS RADIOACTIVE AND COULD CONTAIN HNO3 OR HF, FOLLOW SAFETY GUIDELINES THAT ARE
SPECIFIED IN SECTION 3.0 OF THIS PROCEDURE
Discard all analytical waste and residue according to proper procedures. (L1)
5.2.6.1 Standards
Discard any RCRA standards containing the following RCRA metals in concentrated (1,000 ppm) form according to CTF instructions:
SAVANNAH RIVER NATIONAL LABORATORY Manual: L16.1 ANALYTICAL DEVELOPMENT Procedure: ADS-1573 AD ANALYTICAL OPERATING PROCEDURES Revision: 2 Page: 23 of 51 TECHNICAL REFERENCE Effective Date: 09/30/10 _____________________________________________________________________________________________
As Ag Ba Cd Cr Pb Se
5.2.6.2 Samples
Discard diluted sample material and excess standard solution according to CTF instructions.
5.2.6.3 Listed Waste Samples Listed waste samples (i.e. F006-listed) must have all
waste collected (including the effluent that normally goes to the High Activity Drain) and returned to the customer
5.2.7 Calculations
The software is NOT set up to automatically calculate elemental concentrations with adjustments for the weights and volumes of digestions and dilutions. Post-processing of the concentrations with the dilution factors prior to reporting are done by the CTF or designee.
5.2.8 Preventative Maintenance
5.2.8.1 At the direction of the CTF, record all preventive
maintenance and instrument repair actions in the registered MS&E ICP History/Maintenance Log Book. The Leeman Software provides a basic maintenance schedule.
CAUTION!
USE CAUTION WHEN REPLACING PERISTALTIC PUMP TUBING DUE TO PINCH POINTS
SAVANNAH RIVER NATIONAL LABORATORY Manual: L16.1 ANALYTICAL DEVELOPMENT Procedure: ADS-1573 AD ANALYTICAL OPERATING PROCEDURES Revision: 2 Page: 24 of 51 TECHNICAL REFERENCE Effective Date: 09/30/10 _____________________________________________________________________________________________
5.2.8.2 Daily
Check the sample introduction system and torch assembly for any noticeable problems - collapsed tubing, cracked torch, clogged nebulizer, etc.
Replace peristaltic pump tubing, as needed. Check Peri pump tension.
CAUTION!
USE CAUTION WHEN REPLACING CHILLER WATER
DUE TO PINCH POINTS AND POTENTIAL FOR WATER SPILL AND HEAD INJURY
5.2.8.3 Monthly Check drain tubing. Replace chiller and camera water, as needed.
CAUTION!
USE CARE WHEN HANDLING THE TORCH BOX
ASSEMBLY GLASS COMPONENTS DUE TO POSSIBLE GLASS BREAKING
5.2.8.4 As needed or as directed by CTF
Replace nebulizer (6-9 months max). Replace or clean torch (as needed). Replace side view mirror Clean lens between spectrometer and torch box Check condition of all tygon tubing connecting
torch with argon gas. Replace where necessary.
It should be noted that the torch box assembly is never opened without first de-energizing the unit, which is accomplished by pressing the red button on the spectrometer and switching the breaker to the “off” position on the separate power supply unit. Further
SAVANNAH RIVER NATIONAL LABORATORY Manual: L16.1 ANALYTICAL DEVELOPMENT Procedure: ADS-1573 AD ANALYTICAL OPERATING PROCEDURES Revision: 2 Page: 25 of 51 TECHNICAL REFERENCE Effective Date: 09/30/10 _____________________________________________________________________________________________
upkeep on the instrument will be maintained through regular PM service visits, which are covered under the service agreement. Record all pertinent information from vendor visit in MS&E History Logbook.
6.0 RECORDS
6.1 Raw Data A customer may request a copy of all the raw data. Long-term data
storage is the customer’s responsibility. Record copy of raw data is stored on the ADS file server and backed up daily.
6.2 Quality Control Data
Quality Control data, including diagnostics information, is stored on the ADS file server and backed up daily.
6.3 Results Printouts “Information Only” file copies of all results transmitted to customers
are maintained in the ICP laboratory. Electronic record copy is maintained on the ADS file server.
6.4 Data Control, Electronic Records, and Software
6.4.1 LIMS Carefully review the data for errors and concentrations above
the linearity ranges that are defined by the CTF or supervision. Sequential dilutions may be needed.
If the samples were submitted in solid form, the digestion
dilution factor (DF) will be addressed by the CTF. For volumetric dilutions, the aliquot is entered on the Wt. column of the sequence editor, whereas the total volume is entered on the Vol. Column of the Sequence editor (Attachment 8.6, Figure A-2). The report will generate non-dilution corrected instrument results with the appropriate dilution factors included.
Report the samples as complete and results reported to the
SAVANNAH RIVER NATIONAL LABORATORY Manual: L16.1 ANALYTICAL DEVELOPMENT Procedure: ADS-1573 AD ANALYTICAL OPERATING PROCEDURES Revision: 2 Page: 26 of 51 TECHNICAL REFERENCE Effective Date: 09/30/10 _____________________________________________________________________________________________
customer on the ADS Laboratory Information Management System (LIMS). Enter results promptly. All samples analyzed during a work week should be entered into the LIMS database by the close of the last business day of that week. A typical entry would read “to (customer name), (date), (electronic file reference)”.
6.4.2 Electronic Records Periodically, typically monthly, confirm the backup of analytical
results onto a file server followed by a purge of old files from the IBM-compatible PC computer that controls the ICP-ES.
6.4.3 Software Software validation is indirectly demonstrated by the results
obtained with the QC standards and comparison of the results for submitted analytical reference materials to the known values.
7.0 References
7.1 Annual Book of ASTM Standards, Part 31. 7.2 Teledyne Leeman Labs Prodigy/Prism ICP High Dispersion ICP
Manual, May 2006, Leeman Reference: 61 7.3 L1 Manual, Procedure 4.19, “Laboratory Notebooks and Logbooks.
8.0 Attachments
8.1 Sample Collection, Preservation, and Preparation 8.2 Troubleshooting 8.3 Commonly-Used Dilution Factors 8.4 ICP-ES Method Detection Limits (Expected Performance of Leeman
Prodigy) 8.5 Method Development 8.6 Figures A-1 to A-17
SAVANNAH RIVER NATIONAL LABORATORY Manual: L16.1 ANALYTICAL DEVELOPMENT Procedure: ADS-1573 AD ANALYTICAL OPERATING PROCEDURES Revision: 2 Page: 27 of 51 TECHNICAL REFERENCE Effective Date: 09/30/10 _____________________________________________________________________________________________
Attachment 8.1 Sample Collection, Preservation and Preparation
Page 1 of 2
8.1.1 Sample Collection
It is the customer's responsibility to ensure that representative samples are collected and stored in properly cleaned containers. This is especially important for the ultratrace determination of toxic heavy metals. Glass containers are not recommended for sample storage or submitted to AD by the customer for ICP analyses.
For the determination of trace elements, contamination and loss are prime concerns. Dust in the laboratory environment, impurities in reagents and impurities on laboratory apparatus which the sample contacts are all sources of potential contamination. Sample containers can introduce either positive or negative errors in the measurement of trace elements by (a) contributing contaminants through leaching or surface desorption, and (b) by depleting concentrations through absorption. Thus, the collection and treatment of the sample prior to analysis requires particular attention. Laboratory glassware including the sample bottle (whether polyethylene, polypropylene, or FEP-fluorocarbon) should be thoroughly washed with detergent and tap water, soaked for 30 min in HNO3(1+1), rinsed with deionized water, soaked for 30 min. in HCl (1+1), and finally rinsed thoroughly with deionized water. Containers, precleaned using EPA protocols, are commercially available from I-Chem Research, Hayward CA.
Note: If it can be documented through an active analytical quality control program using spiked samples and reagent blanks, that certain steps in the cleaning procedure are not required for routine samples, those steps may be eliminated.
8.1.2 Sample Preservation It is the customer's responsibility to properly preserve their
samples before they are submitted to ADS.
SAVANNAH RIVER NATIONAL LABORATORY Manual: L16.1 ANALYTICAL DEVELOPMENT Procedure: ADS-1573 AD ANALYTICAL OPERATING PROCEDURES Revision: 2 Page: 28 of 51 TECHNICAL REFERENCE Effective Date: 09/30/10 _____________________________________________________________________________________________
Attachment 8.1 Sample Collection, Preservation and Preparation
Page 2 of 2 8.1.3 Sample Preparation for Solid Samples
One of several dissolutions e.g. sodium peroxide fusion, closed-vessel microwave digestion, will be required for total element determination of most solids or slurries with high percentage suspended solids.
SAVANNAH RIVER NATIONAL LABORATORY Manual: L16.1 ANALYTICAL DEVELOPMENT Procedure: ADS-1573 AD ANALYTICAL OPERATING PROCEDURES Revision: 2 Page: 29 of 51 TECHNICAL REFERENCE Effective Date: 09/30/10 _____________________________________________________________________________________________
Attachment 8.2 Troubleshooting Page 1 of 2
8.2 Troubleshooting Troubleshooting discussed in this procedure is limited to adjustments
on the sample introduction system; all other troubleshooting is beyond the scope and needs technical supervision.
8.2.1 Sample Introduction System
8.2.1.1 If the plasma is extinguished when the nebulizer flow
is turned on: Run the pump for one minute prior with the sipper
uptake tube in the air position. Immerse the sipper uptake tube in rinse solution.
(Check tip of tubing - cut Teflon tube at angle if required.)
Restart the plasma by following directions in section 5.2.1.
8.2.1.2 If the plasma extinguishes during a run, check
connections for air leaks at: Nebulizer gas inlet Nebulizer o-ring seals Drain joint Joint between torch and spray chamber
8.2.1.3 If the plasma is uneven in shape (resulting in low
profile intensities or other problems), do the following: Turn off the plasma and check the alignment of the
torch relative to the coil. The torch is positioned in the center of the coil, 2 mm from air block.
Turn off the plasma and check that the injector tube is concentric with the torch body (if using the HF resistant system). If the tube is not concentric, disassemble it and reposition concentric within the torch body.
SAVANNAH RIVER NATIONAL LABORATORY Manual: L16.1 ANALYTICAL DEVELOPMENT Procedure: ADS-1573 AD ANALYTICAL OPERATING PROCEDURES Revision: 2 Page: 30 of 51 TECHNICAL REFERENCE Effective Date: 09/30/10 _____________________________________________________________________________________________
Attachment 8.2 Troubleshooting Page 2 of 2
8.2.1.4 If no spray is coming from the nebulizer (or leakage
into the catch vessel on the line from the pump to the nebulizer), do the following:
Check the connection between the pump tubing and the nebulizer tubing. Check the nebulizer for plugs. If plugged, replace the nebulizer.
Check the tube connections at the peristaltic pump, check that the tubing is not pinched in the connectors.
Note: The tubing connection between the peristaltic pump and the nebulizer is contained in an overflow container vial to catch liquid if the nebulizer clogs.
8.2.2. RF Generator
8.2.2.1 If the torch will not light or arcing occurs while trying
to light the plasma, do the following:
Check the sample introduction system for air leaks as described above.
If torch still will not light, insert another sample introduction system and try to ignite plasma again.
If torch still will not light, contact technical supervision, problem is probably related to power supply.
8.2.2.2 If salt buildup or torch erosion is noted, change torch
as necessary.
8.2.3. Spectrometer
If problems occur in the spectrometer, contact technical personnel.
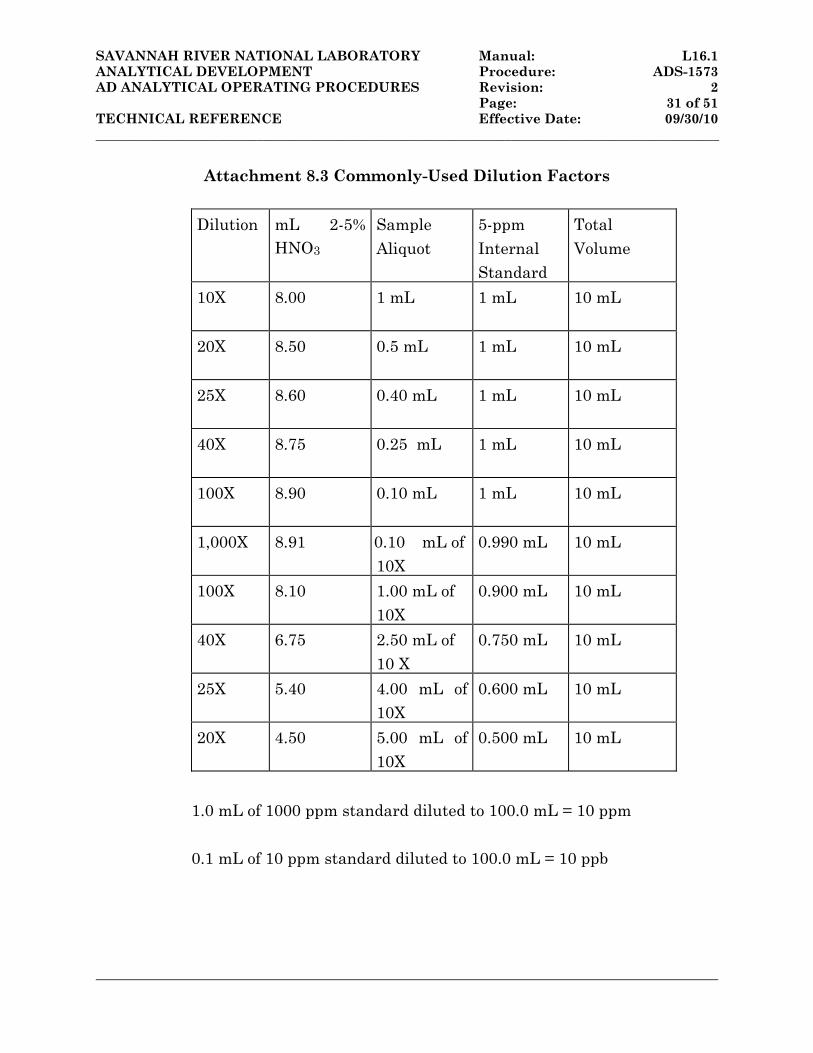
SAVANNAH RIVER NATIONAL LABORATORY Manual: L16.1 ANALYTICAL DEVELOPMENT Procedure: ADS-1573 AD ANALYTICAL OPERATING PROCEDURES Revision: 2 Page: 31 of 51 TECHNICAL REFERENCE Effective Date: 09/30/10 _____________________________________________________________________________________________
Attachment 8.3 Commonly-Used Dilution Factors
Dilution mL 2-5% HNO3
Sample Aliquot
5-ppm Internal Standard
Total Volume
10X 8.00 1 mL
1 mL 10 mL
20X 8.50 0.5 mL
1 mL 10 mL
25X 8.60 0.40 mL
1 mL 10 mL
40X 8.75 0.25 mL
1 mL 10 mL
100X 8.90 0.10 mL
1 mL 10 mL
1,000X 8.91 0.10 mL of10X
0.990 mL 10 mL
100X 8.10 1.00 mL of 10X
0.900 mL 10 mL
40X 6.75 2.50 mL of 10 X
0.750 mL 10 mL
25X 5.40 4.00 mL of 10X
0.600 mL 10 mL
20X 4.50 5.00 mL of 10X
0.500 mL 10 mL
1.0 mL of 1000 ppm standard diluted to 100.0 mL = 10 ppm
0.1 mL of 10 ppm standard diluted to 100.0 mL = 10 ppb
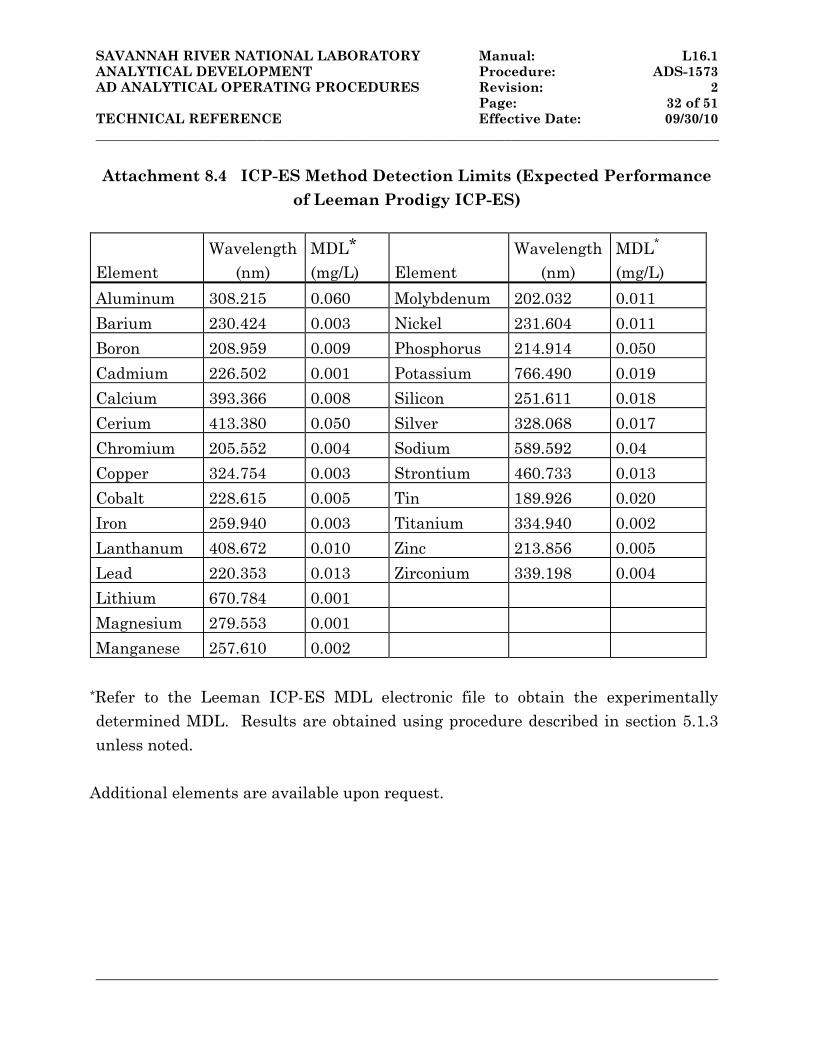
SAVANNAH RIVER NATIONAL LABORATORY Manual: L16.1 ANALYTICAL DEVELOPMENT Procedure: ADS-1573 AD ANALYTICAL OPERATING PROCEDURES Revision: 2 Page: 32 of 51 TECHNICAL REFERENCE Effective Date: 09/30/10 _____________________________________________________________________________________________
Attachment 8.4 ICP-ES Method Detection Limits (Expected Performance
of Leeman Prodigy ICP-ES)
Element
Wavelength (nm)
MDL* (mg/L)
Element
Wavelength (nm)
MDL*
(mg/L)
Aluminum 308.215 0.060 Molybdenum 202.032 0.011
Barium 230.424 0.003 Nickel 231.604 0.011
Boron 208.959 0.009 Phosphorus 214.914 0.050
Cadmium 226.502 0.001 Potassium 766.490 0.019
Calcium 393.366 0.008 Silicon 251.611 0.018
Cerium 413.380 0.050 Silver 328.068 0.017
Chromium 205.552 0.004 Sodium 589.592 0.04
Copper 324.754 0.003 Strontium 460.733 0.013
Cobalt 228.615 0.005 Tin 189.926 0.020
Iron 259.940 0.003 Titanium 334.940 0.002
Lanthanum 408.672 0.010 Zinc 213.856 0.005
Lead 220.353 0.013 Zirconium 339.198 0.004
Lithium 670.784 0.001
Magnesium 279.553 0.001
Manganese 257.610 0.002
*Refer to the Leeman ICP-ES MDL electronic file to obtain the experimentally determined MDL. Results are obtained using procedure described in section 5.1.3 unless noted.
Additional elements are available upon request.
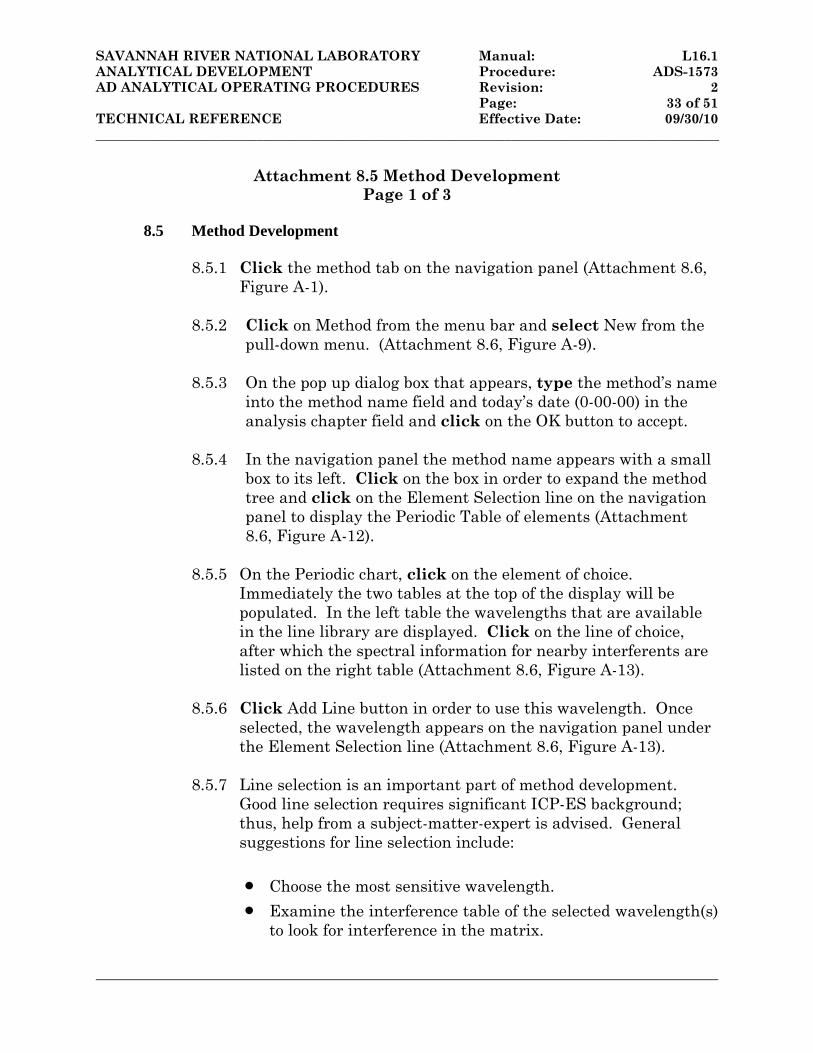
SAVANNAH RIVER NATIONAL LABORATORY Manual: L16.1 ANALYTICAL DEVELOPMENT Procedure: ADS-1573 AD ANALYTICAL OPERATING PROCEDURES Revision: 2 Page: 33 of 51 TECHNICAL REFERENCE Effective Date: 09/30/10 _____________________________________________________________________________________________
Attachment 8.5 Method Development Page 1 of 3
8.5 Method Development
8.5.1 Click the method tab on the navigation panel (Attachment 8.6, Figure A-1).
8.5.2 Click on Method from the menu bar and select New from the
pull-down menu. (Attachment 8.6, Figure A-9).
8.5.3 On the pop up dialog box that appears, type the method’s name into the method name field and today’s date (0-00-00) in the analysis chapter field and click on the OK button to accept.
8.5.4 In the navigation panel the method name appears with a small
box to its left. Click on the box in order to expand the method tree and click on the Element Selection line on the navigation panel to display the Periodic Table of elements (Attachment 8.6, Figure A-12).
8.5.5 On the Periodic chart, click on the element of choice.
Immediately the two tables at the top of the display will be populated. In the left table the wavelengths that are available in the line library are displayed. Click on the line of choice, after which the spectral information for nearby interferents are listed on the right table (Attachment 8.6, Figure A-13).
8.5.6 Click Add Line button in order to use this wavelength. Once
selected, the wavelength appears on the navigation panel under the Element Selection line (Attachment 8.6, Figure A-13).
8.5.7 Line selection is an important part of method development.
Good line selection requires significant ICP-ES background; thus, help from a subject-matter-expert is advised. General suggestions for line selection include:
Choose the most sensitive wavelength.
Examine the interference table of the selected wavelength(s) to look for interference in the matrix.
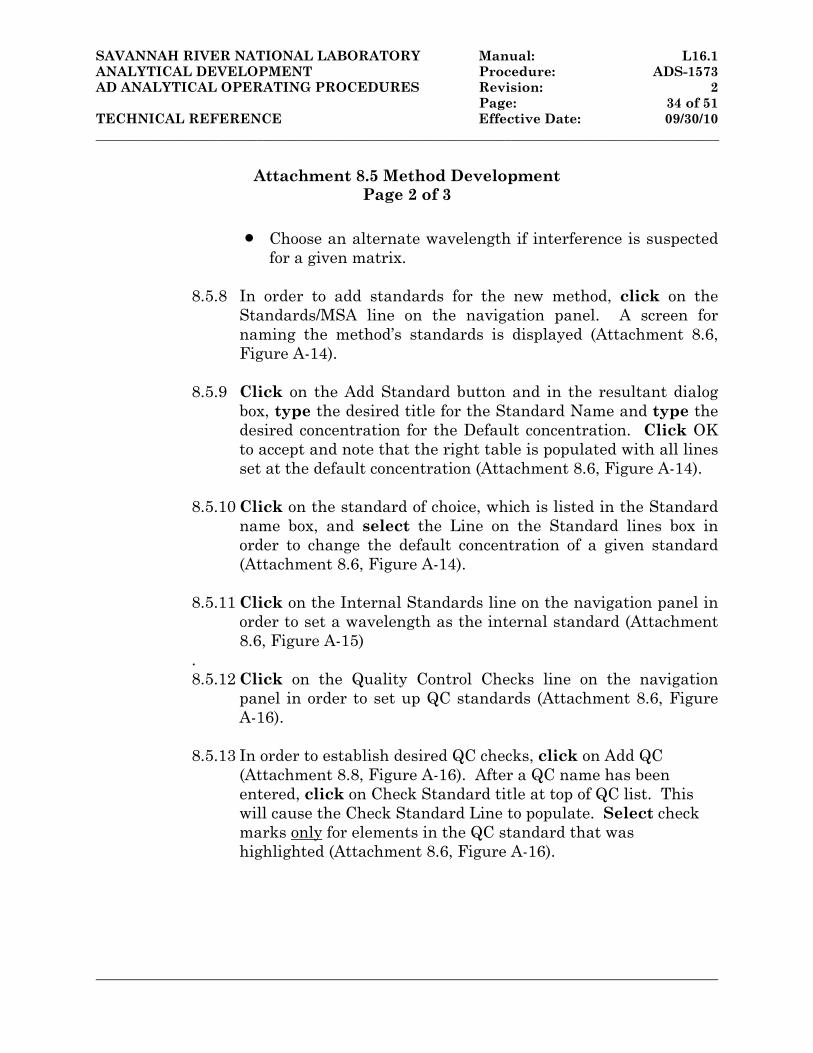
SAVANNAH RIVER NATIONAL LABORATORY Manual: L16.1 ANALYTICAL DEVELOPMENT Procedure: ADS-1573 AD ANALYTICAL OPERATING PROCEDURES Revision: 2 Page: 34 of 51 TECHNICAL REFERENCE Effective Date: 09/30/10 _____________________________________________________________________________________________
Attachment 8.5 Method Development Page 2 of 3
Choose an alternate wavelength if interference is suspected for a given matrix.
8.5.8 In order to add standards for the new method, click on the
Standards/MSA line on the navigation panel. A screen for naming the method’s standards is displayed (Attachment 8.6, Figure A-14).
8.5.9 Click on the Add Standard button and in the resultant dialog
box, type the desired title for the Standard Name and type the desired concentration for the Default concentration. Click OK to accept and note that the right table is populated with all lines set at the default concentration (Attachment 8.6, Figure A-14).
8.5.10 Click on the standard of choice, which is listed in the Standard
name box, and select the Line on the Standard lines box in order to change the default concentration of a given standard (Attachment 8.6, Figure A-14).
8.5.11 Click on the Internal Standards line on the navigation panel in
order to set a wavelength as the internal standard (Attachment 8.6, Figure A-15)
. 8.5.12 Click on the Quality Control Checks line on the navigation
panel in order to set up QC standards (Attachment 8.6, Figure A-16).
8.5.13 In order to establish desired QC checks, click on Add QC
(Attachment 8.8, Figure A-16). After a QC name has been entered, click on Check Standard title at top of QC list. This will cause the Check Standard Line to populate. Select check marks only for elements in the QC standard that was highlighted (Attachment 8.6, Figure A-16).
SAVANNAH RIVER NATIONAL LABORATORY Manual: L16.1 ANALYTICAL DEVELOPMENT Procedure: ADS-1573 AD ANALYTICAL OPERATING PROCEDURES Revision: 2 Page: 35 of 51 TECHNICAL REFERENCE Effective Date: 09/30/10 _____________________________________________________________________________________________
Attachment 8.5 Method Development Page 2 of 3
8.5.14 Click on the Analytical Parameters line on the navigation panel
in order to set up parameters for the method (Typical or default settings are illustrated on Attachment 8.6, Figure A-17). It should be noted that the uptake time is the time it takes for the sample to reach the plasma. It depends primarily on the length of tubing used for sample introduction. This time, along with the rinse and integration times, should be determined experimentally. Consult the CTF for accurate Uptake and Rinse times.
8.5.15 Save the method as described on step 5.2.3.14.
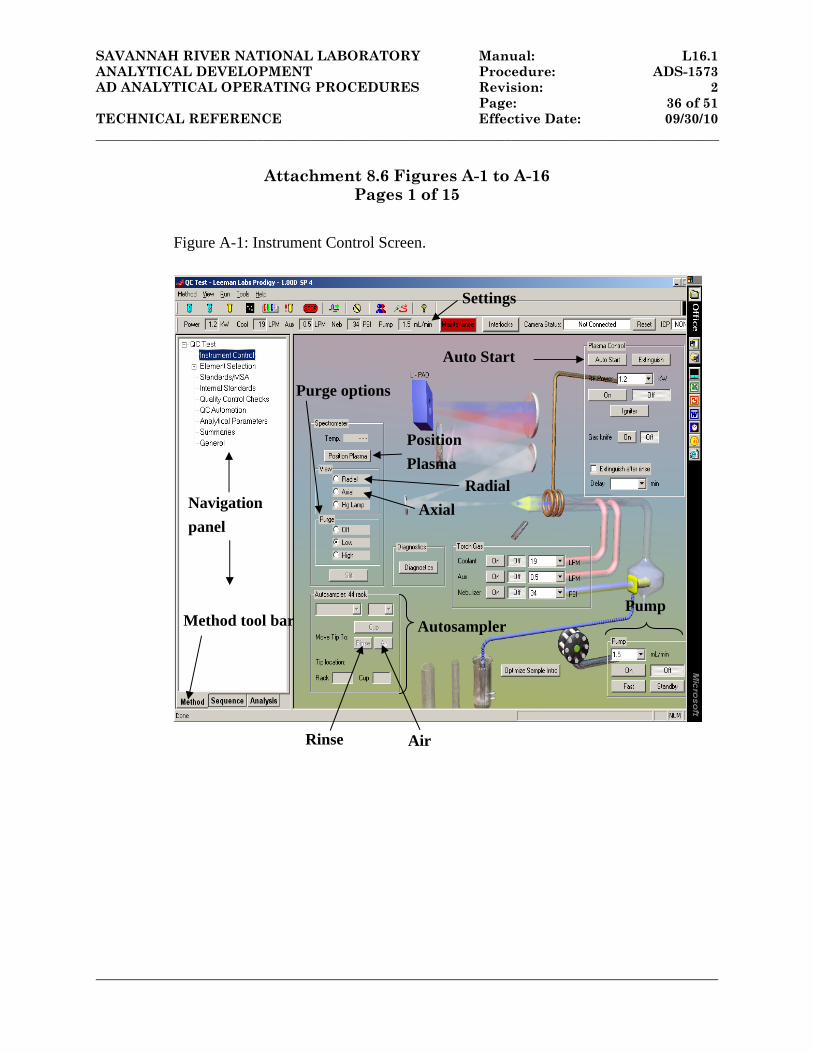
SAVANNAH RIVER NATIONAL LABORATORY Manual: L16.1 ANALYTICAL DEVELOPMENT Procedure: ADS-1573 AD ANALYTICAL OPERATING PROCEDURES Revision: 2 Page: 36 of 51 TECHNICAL REFERENCE Effective Date: 09/30/10 _____________________________________________________________________________________________
Attachment 8.6 Figures A-1 to A-16 Pages 1 of 15
Figure A-1: Instrument Control Screen.
Method tool bar
Navigation
panel
Autosampler Pump
Auto Start
Position
Plasma
Rinse Air
Radial
Axial
Settings
Purge options
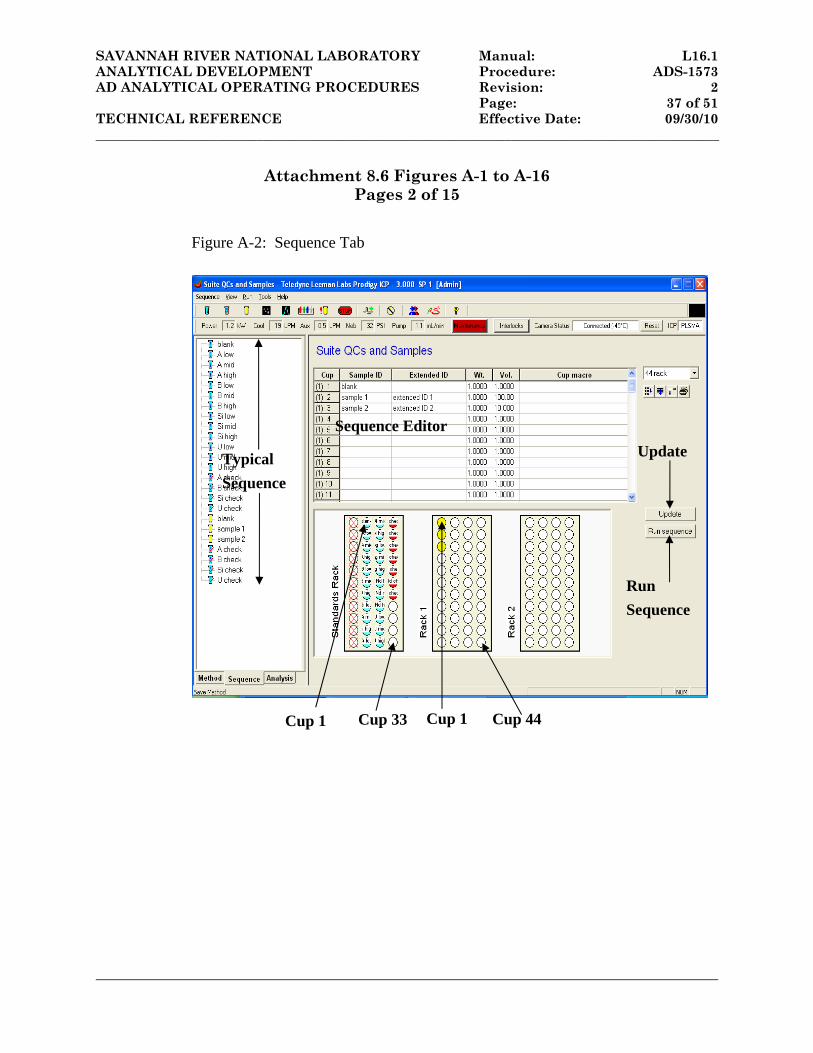
SAVANNAH RIVER NATIONAL LABORATORY Manual: L16.1 ANALYTICAL DEVELOPMENT Procedure: ADS-1573 AD ANALYTICAL OPERATING PROCEDURES Revision: 2 Page: 37 of 51 TECHNICAL REFERENCE Effective Date: 09/30/10 _____________________________________________________________________________________________
Attachment 8.6 Figures A-1 to A-16 Pages 2 of 15
Figure A-2: Sequence Tab
Run
Sequence
Sequence Editor
Update Typical
Sequence
Cup 33 Cup 1 Cup 1 Cup 44
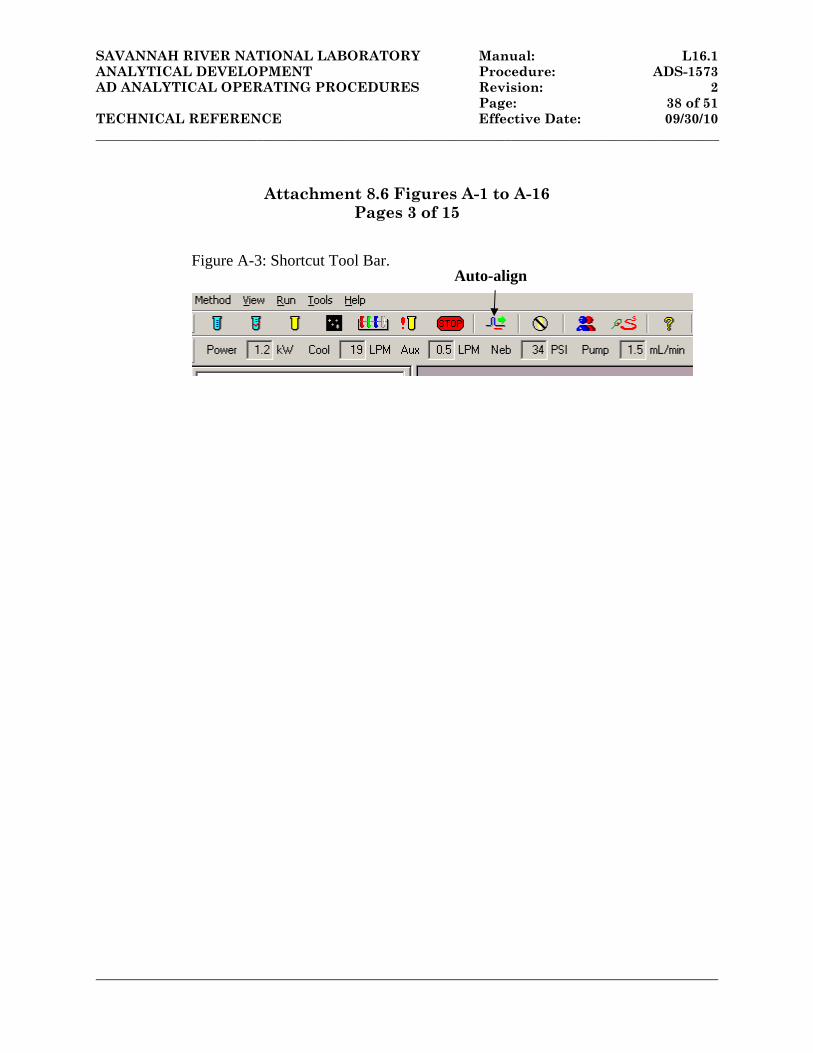
SAVANNAH RIVER NATIONAL LABORATORY Manual: L16.1 ANALYTICAL DEVELOPMENT Procedure: ADS-1573 AD ANALYTICAL OPERATING PROCEDURES Revision: 2 Page: 38 of 51 TECHNICAL REFERENCE Effective Date: 09/30/10 _____________________________________________________________________________________________
Attachment 8.6 Figures A-1 to A-16
Pages 3 of 15
Figure A-3: Shortcut Tool Bar.
Auto-align
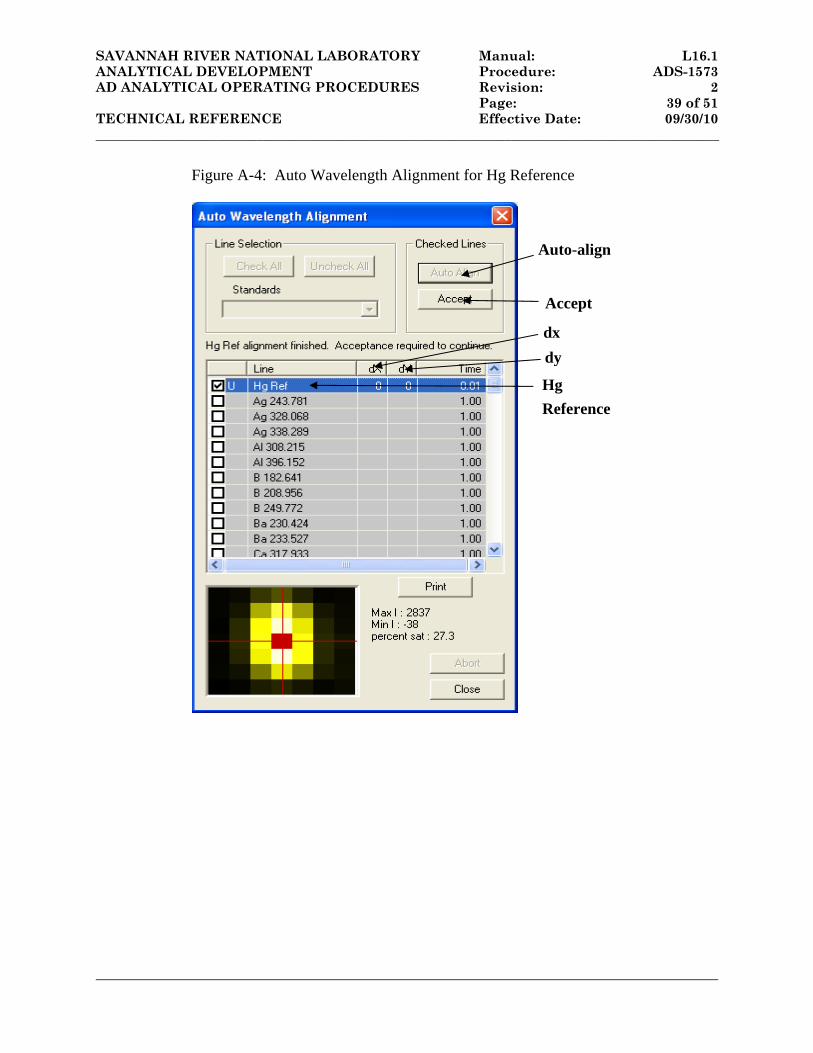
SAVANNAH RIVER NATIONAL LABORATORY Manual: L16.1 ANALYTICAL DEVELOPMENT Procedure: ADS-1573 AD ANALYTICAL OPERATING PROCEDURES Revision: 2 Page: 39 of 51 TECHNICAL REFERENCE Effective Date: 09/30/10 _____________________________________________________________________________________________
Figure A-4: Auto Wavelength Alignment for Hg Reference
Auto-align
Accept
Hg
Reference
dx
dy
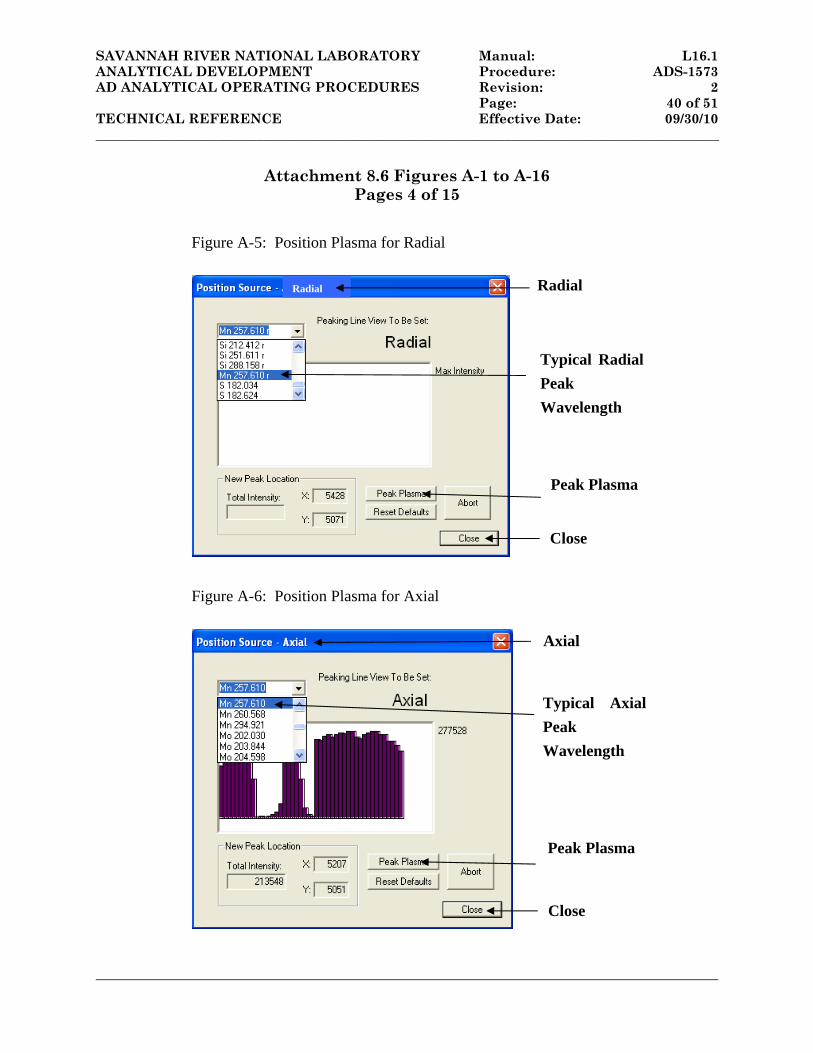
SAVANNAH RIVER NATIONAL LABORATORY Manual: L16.1 ANALYTICAL DEVELOPMENT Procedure: ADS-1573 AD ANALYTICAL OPERATING PROCEDURES Revision: 2 Page: 40 of 51 TECHNICAL REFERENCE Effective Date: 09/30/10 _____________________________________________________________________________________________
Attachment 8.6 Figures A-1 to A-16 Pages 4 of 15
Figure A-5: Position Plasma for Radial
Figure A-6: Position Plasma for Axial
Typical Radial
Peak
Wavelength
Peak Plasma
Typical Axial
Peak
Wavelength
Peak Plasma
Radial Radial
Close
Axial
Close
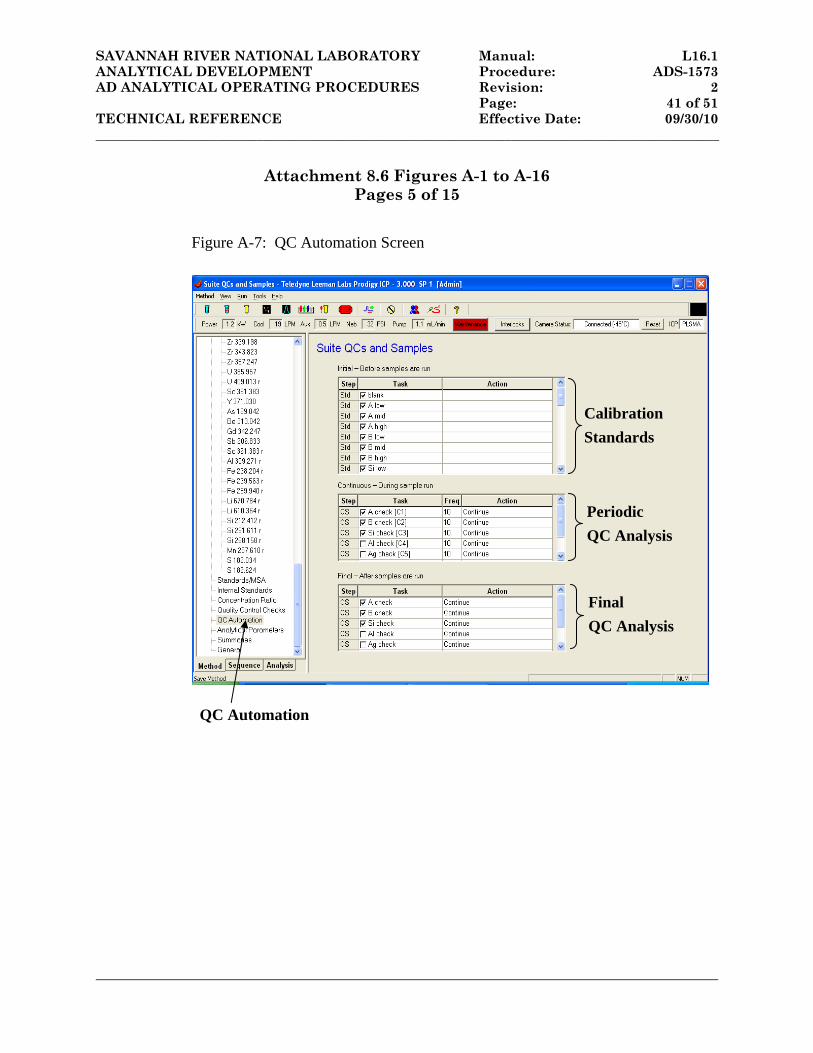
SAVANNAH RIVER NATIONAL LABORATORY Manual: L16.1 ANALYTICAL DEVELOPMENT Procedure: ADS-1573 AD ANALYTICAL OPERATING PROCEDURES Revision: 2 Page: 41 of 51 TECHNICAL REFERENCE Effective Date: 09/30/10 _____________________________________________________________________________________________
Attachment 8.6 Figures A-1 to A-16 Pages 5 of 15
Figure A-7: QC Automation Screen
QC Automation
Calibration
Standards
Periodic
QC Analysis
Final
QC Analysis
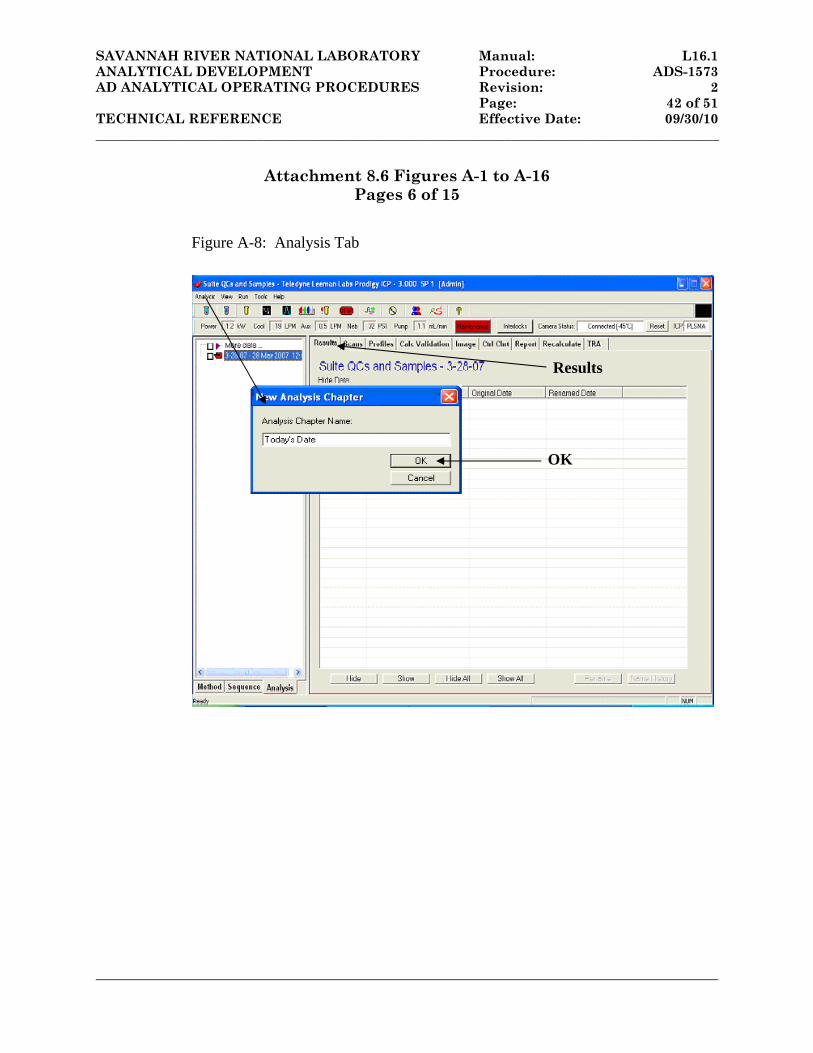
SAVANNAH RIVER NATIONAL LABORATORY Manual: L16.1 ANALYTICAL DEVELOPMENT Procedure: ADS-1573 AD ANALYTICAL OPERATING PROCEDURES Revision: 2 Page: 42 of 51 TECHNICAL REFERENCE Effective Date: 09/30/10 _____________________________________________________________________________________________
Attachment 8.6 Figures A-1 to A-16 Pages 6 of 15
Figure A-8: Analysis Tab
Results
OK
SAVANNAH RIVER NATIONAL LABORATORY Manual: L16.1 ANALYTICAL DEVELOPMENT Procedure: ADS-1573 AD ANALYTICAL OPERATING PROCEDURES Revision: 2 Page: 43 of 51 TECHNICAL REFERENCE Effective Date: 09/30/10 _____________________________________________________________________________________________
Attachment 8.6 Figures A-1 to A-16
Pages 7 of 15
Figure A-9: Method Save
SAVANNAH RIVER NATIONAL LABORATORY Manual: L16.1 ANALYTICAL DEVELOPMENT Procedure: ADS-1573 AD ANALYTICAL OPERATING PROCEDURES Revision: 2 Page: 44 of 51 TECHNICAL REFERENCE Effective Date: 09/30/10 _____________________________________________________________________________________________
Attachment 8.6 Figures A-1 to A-16
Pages 8 of 15
Figure A-10: Calibration review
Calibration
Element Selection
Wavelength of choice
Calibration R2
SAVANNAH RIVER NATIONAL LABORATORY Manual: L16.1 ANALYTICAL DEVELOPMENT Procedure: ADS-1573 AD ANALYTICAL OPERATING PROCEDURES Revision: 2 Page: 45 of 51 TECHNICAL REFERENCE Effective Date: 09/30/10 _____________________________________________________________________________________________
Attachment 8.6 Figures A-1 to A-16 Pages 9 of 15
Figure A-11: Report Menu
Analysis Tab
Load Function
Result Selection
Report
Spec
Report Menu Tab
SAVANNAH RIVER NATIONAL LABORATORY Manual: L16.1 ANALYTICAL DEVELOPMENT Procedure: ADS-1573 AD ANALYTICAL OPERATING PROCEDURES Revision: 2 Page: 46 of 51 TECHNICAL REFERENCE Effective Date: 09/30/10 _____________________________________________________________________________________________
Attachment 8.6 Figures A-1 to A-16 Pages 10 of 15
Figure A-12: Element Selection
Method Tree
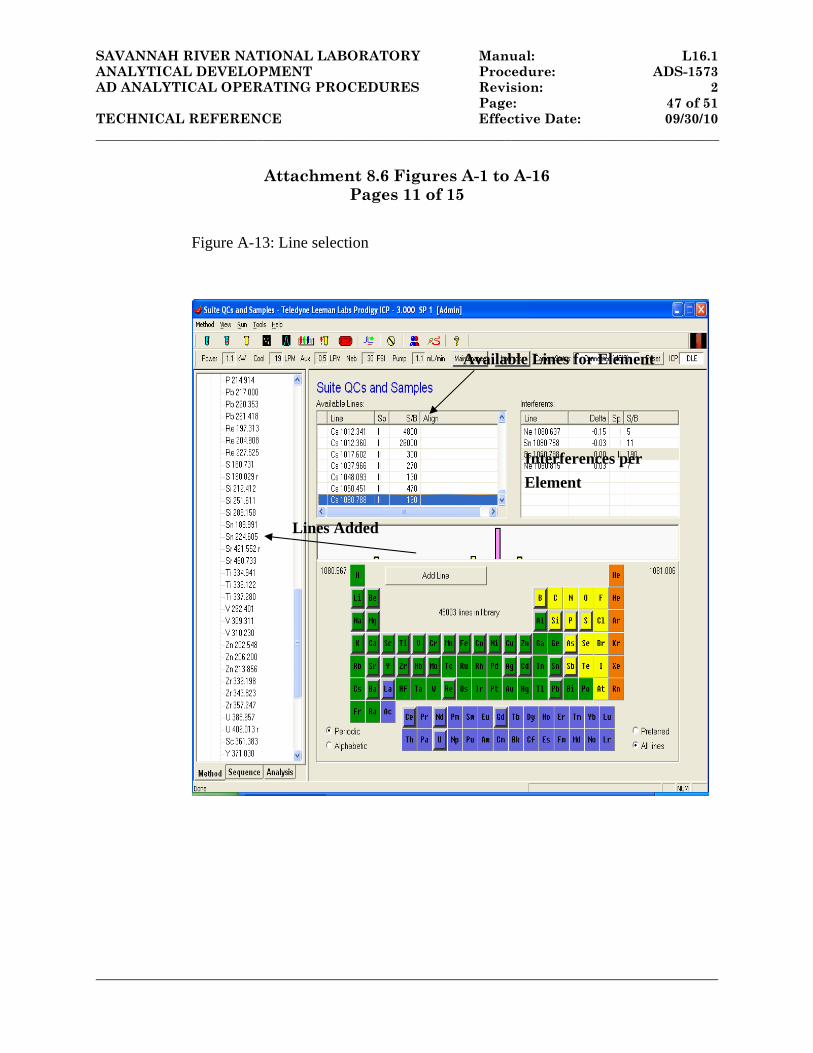
SAVANNAH RIVER NATIONAL LABORATORY Manual: L16.1 ANALYTICAL DEVELOPMENT Procedure: ADS-1573 AD ANALYTICAL OPERATING PROCEDURES Revision: 2 Page: 47 of 51 TECHNICAL REFERENCE Effective Date: 09/30/10 _____________________________________________________________________________________________
Attachment 8.6 Figures A-1 to A-16 Pages 11 of 15
Figure A-13: Line selection
Lines Added
Available Lines for Element
Interferences per
Element
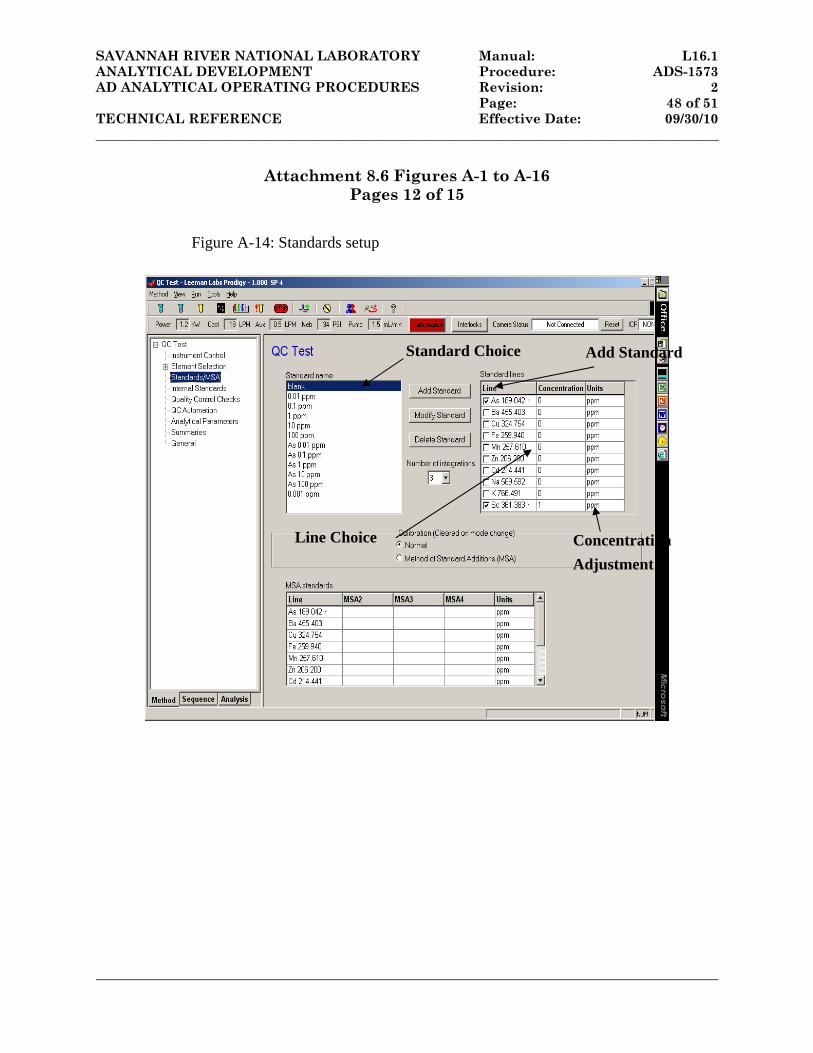
SAVANNAH RIVER NATIONAL LABORATORY Manual: L16.1 ANALYTICAL DEVELOPMENT Procedure: ADS-1573 AD ANALYTICAL OPERATING PROCEDURES Revision: 2 Page: 48 of 51 TECHNICAL REFERENCE Effective Date: 09/30/10 _____________________________________________________________________________________________
Attachment 8.6 Figures A-1 to A-16 Pages 12 of 15
Figure A-14: Standards setup
Standard Choice Add Standard
Line Choice Concentration
Adjustment
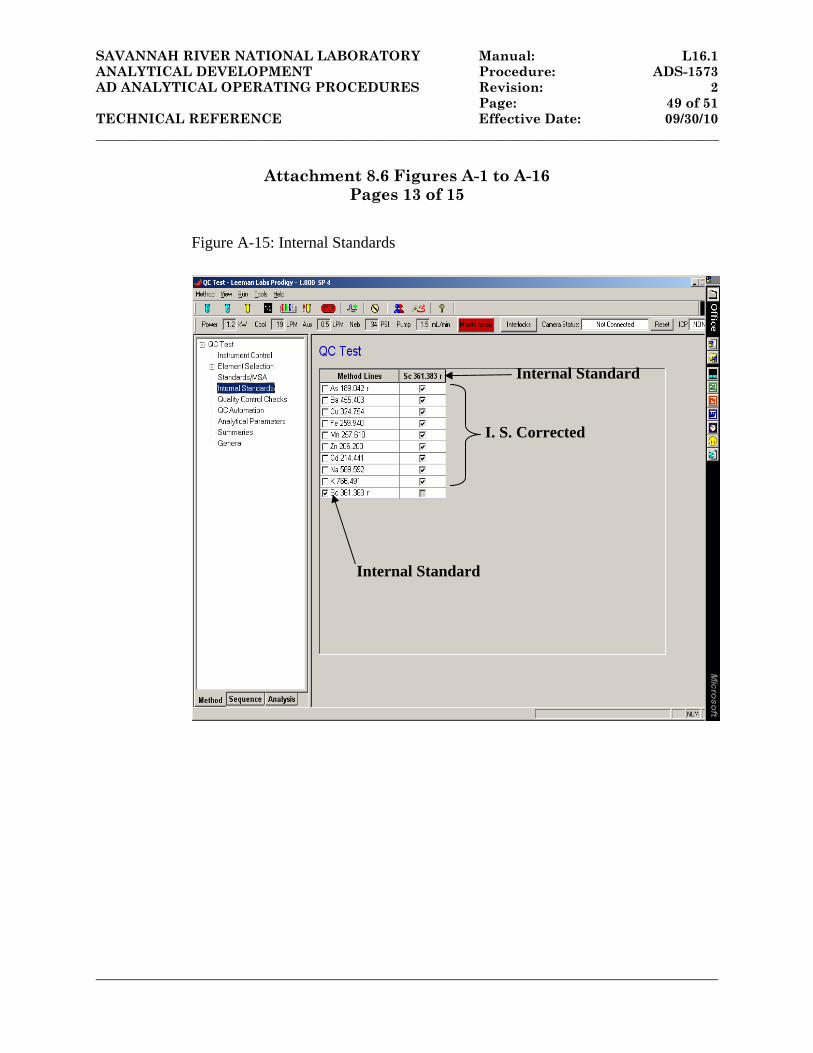
SAVANNAH RIVER NATIONAL LABORATORY Manual: L16.1 ANALYTICAL DEVELOPMENT Procedure: ADS-1573 AD ANALYTICAL OPERATING PROCEDURES Revision: 2 Page: 49 of 51 TECHNICAL REFERENCE Effective Date: 09/30/10 _____________________________________________________________________________________________
Attachment 8.6 Figures A-1 to A-16 Pages 13 of 15
Figure A-15: Internal Standards
Internal Standard
I. S. Corrected
Internal Standard
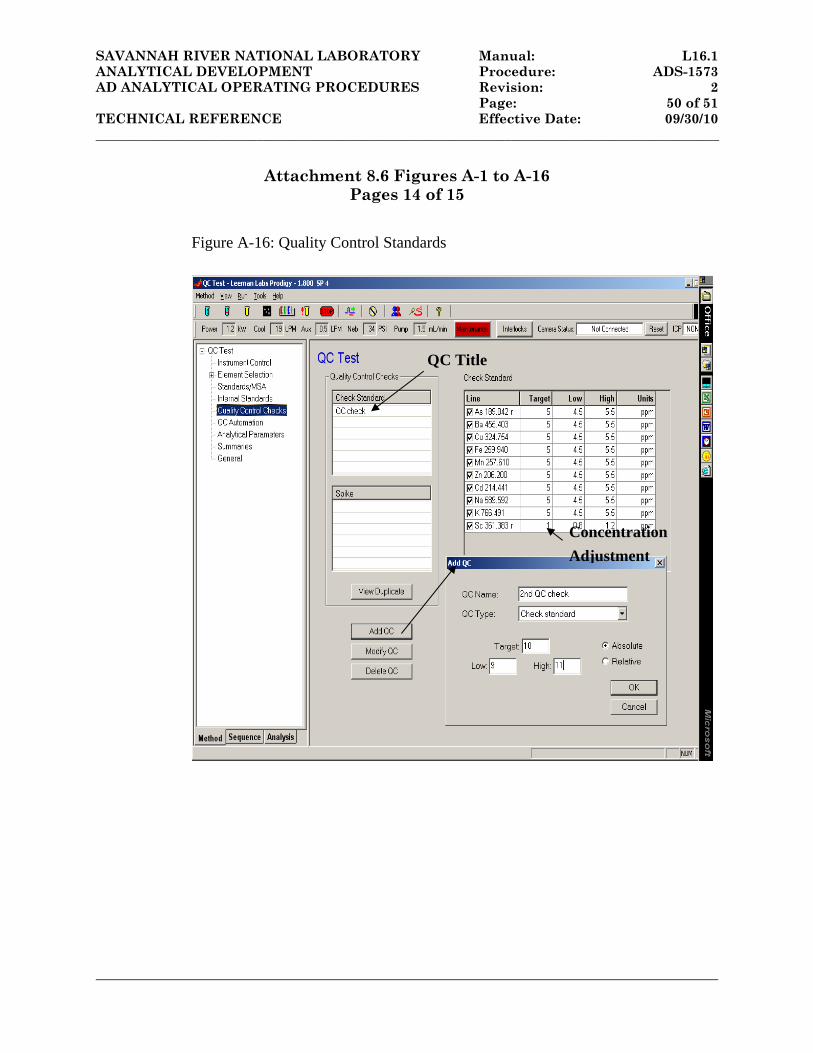
SAVANNAH RIVER NATIONAL LABORATORY Manual: L16.1 ANALYTICAL DEVELOPMENT Procedure: ADS-1573 AD ANALYTICAL OPERATING PROCEDURES Revision: 2 Page: 50 of 51 TECHNICAL REFERENCE Effective Date: 09/30/10 _____________________________________________________________________________________________
Attachment 8.6 Figures A-1 to A-16 Pages 14 of 15
Figure A-16: Quality Control Standards
QC Title
Concentration
Adjustment
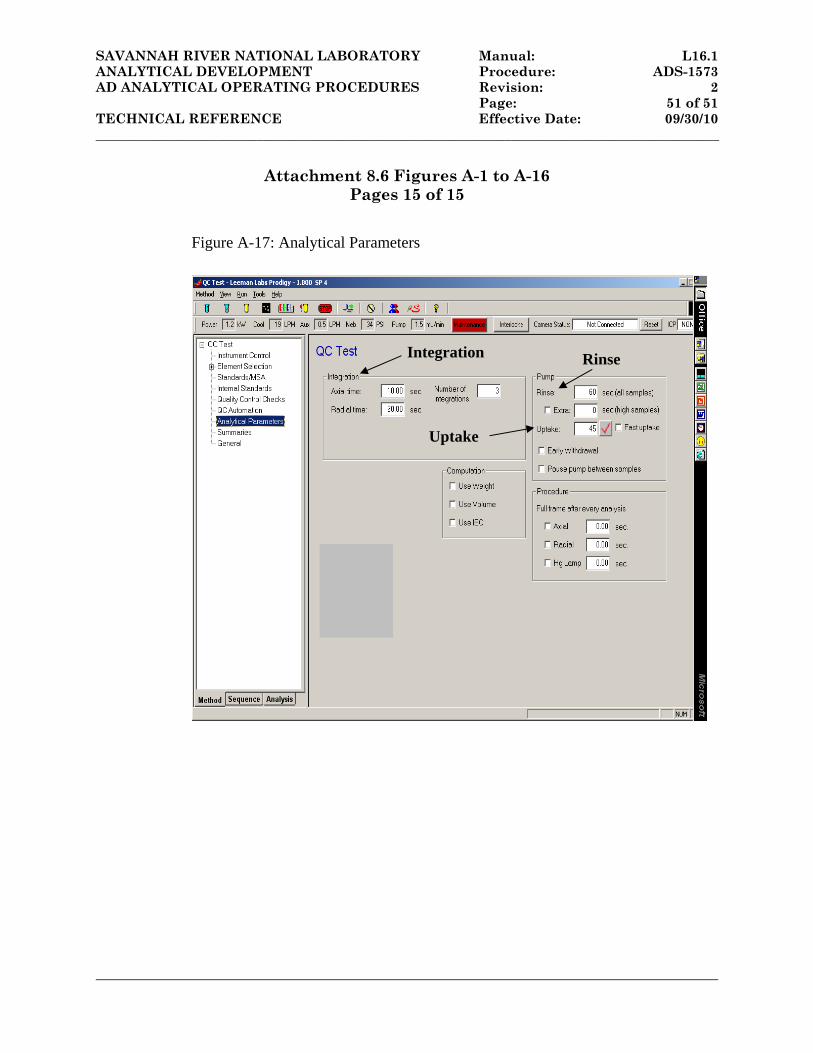
SAVANNAH RIVER NATIONAL LABORATORY Manual: L16.1 ANALYTICAL DEVELOPMENT Procedure: ADS-1573 AD ANALYTICAL OPERATING PROCEDURES Revision: 2 Page: 51 of 51 TECHNICAL REFERENCE Effective Date: 09/30/10 _____________________________________________________________________________________________
Attachment 8.6 Figures A-1 to A-16 Pages 15 of 15
Figure A-17: Analytical Parameters
Integration Rinse
Uptake
SAVANNAH RIVER NATIONAL LABORATORY Manual: L16.1 ANALYTICAL DEVELOPMENT Procedure: ADS - 2226 ANALYTICAL OPERATING PROCEDURES Revision: 9 Page: 1 of 8 TECHNICAL REFERENCE Effective Date: 10/22/2009 MAJOR REWRITE
1
Aqua Regia Dissolution of Sludge Approved by: for Elemental Analysis (U) APPROVAL ON FILE AD Manager _____________________________________________________________________________ 1.0 PURPOSE
This procedure describes the aqua regia dissolution method.
2.0 SCOPE Aqua regia (the common chemical name for a 3:1 by volume mixture of
concentrated HCl and HNO3) is an effective method for dissolving waste tank sludge samples. The resulting solution is analyzed for elemental and radionuclide composition. Sludge dissolution is the sample preparation step required before elemental analysis by Inductively Coupled Plasma-Atomic Emission Spectroscopy (ICP-AES), Atomic Absorption Spectroscopy (AAS), and Inductively Coupled Plasma Mass Spectroscopy (ICP-MS). Radiochemistry and nuclear counting techniques are also performed on the dissolutions. This procedure is applicable to both actual radioactive sludge from the waste tanks and non-radioactive synthetic sludge that simulates waste tank sludge compositions; both materials have been successfully dissolved using this process.
The aqua regia method is broadly applicable to many sample types and can
be applied to different type samples per the technical judgment of the Task Supervisor.
The aqua regia dissolution is commonly used concurrently with a sodium
peroxide/sodium hydroxide fusion dissolution (for brevity, it will be referred to as the sodium peroxide fusion method in this document) to dissolve sludge for subsequent analysis. The sodium peroxide fusion dissolution is discussed in a separate procedure.
3.0 PRECAUTIONS/LIMITATIONS
3.1 Safety Precautions
3.1.1 HCl and HNO3 are strong, corrosive acids that cause serious chemical burns. Perform the entire procedure in a fume hood,
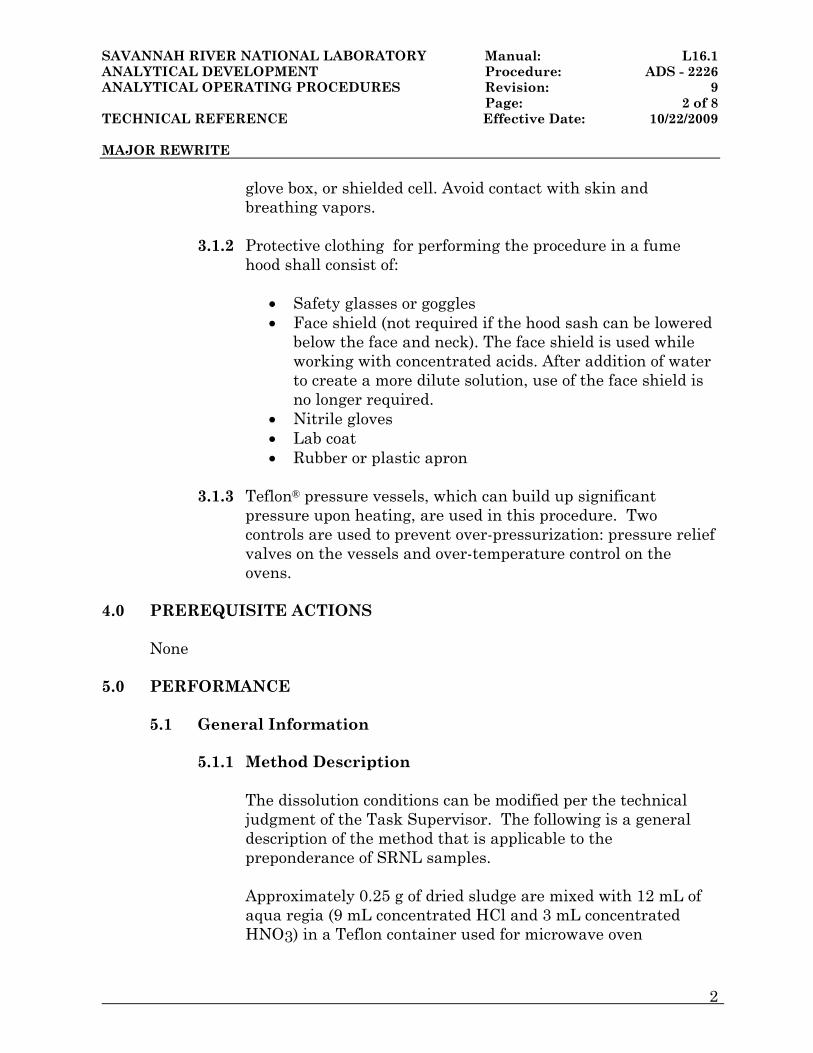
SAVANNAH RIVER NATIONAL LABORATORY Manual: L16.1 ANALYTICAL DEVELOPMENT Procedure: ADS - 2226 ANALYTICAL OPERATING PROCEDURES Revision: 9 Page: 2 of 8 TECHNICAL REFERENCE Effective Date: 10/22/2009 MAJOR REWRITE
2
glove box, or shielded cell. Avoid contact with skin and breathing vapors.
3.1.2 Protective clothing for performing the procedure in a fume
hood shall consist of:
• Safety glasses or goggles • Face shield (not required if the hood sash can be lowered
below the face and neck). The face shield is used while working with concentrated acids. After addition of water to create a more dilute solution, use of the face shield is no longer required.
• Nitrile gloves • Lab coat • Rubber or plastic apron
3.1.3 Teflon® pressure vessels, which can build up significant
pressure upon heating, are used in this procedure. Two controls are used to prevent over-pressurization: pressure relief valves on the vessels and over-temperature control on the ovens.
4.0 PREREQUISITE ACTIONS
None
5.0 PERFORMANCE 5.1 General Information
5.1.1 Method Description
The dissolution conditions can be modified per the technical judgment of the Task Supervisor. The following is a general description of the method that is applicable to the preponderance of SRNL samples.
Approximately 0.25 g of dried sludge are mixed with 12 mL of aqua regia (9 mL concentrated HCl and 3 mL concentrated HNO3) in a Teflon container used for microwave oven
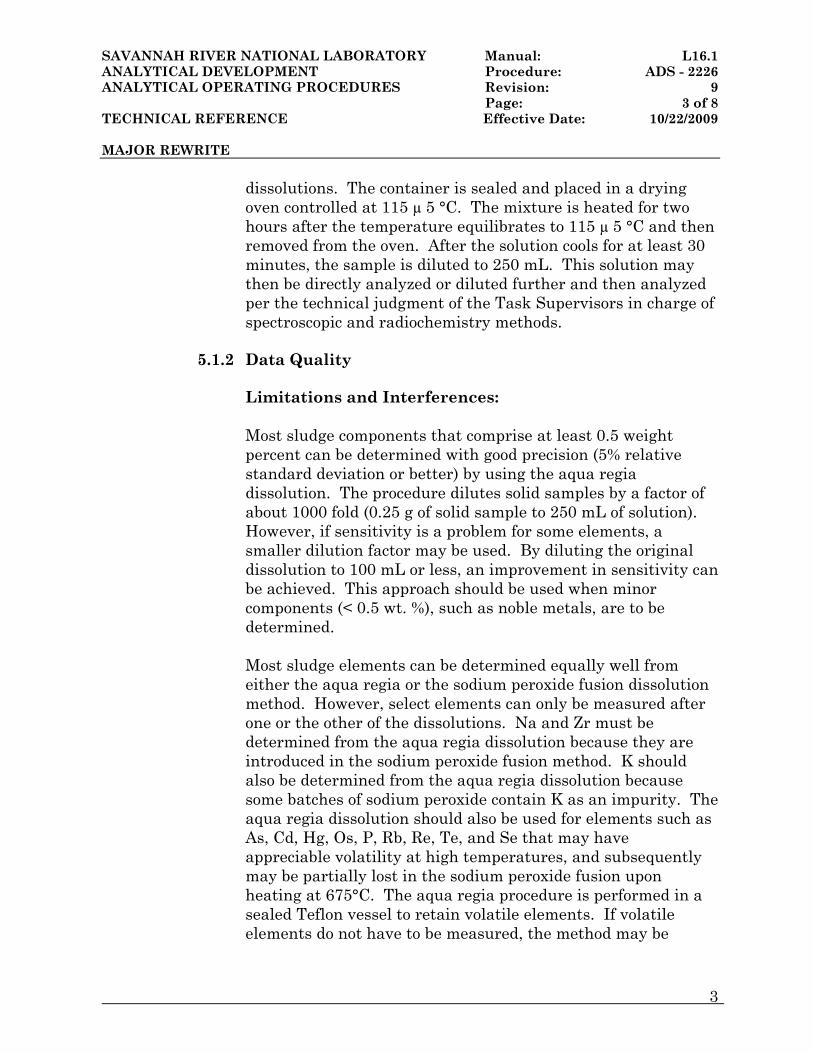
SAVANNAH RIVER NATIONAL LABORATORY Manual: L16.1 ANALYTICAL DEVELOPMENT Procedure: ADS - 2226 ANALYTICAL OPERATING PROCEDURES Revision: 9 Page: 3 of 8 TECHNICAL REFERENCE Effective Date: 10/22/2009 MAJOR REWRITE
3
dissolutions. The container is sealed and placed in a drying oven controlled at 115 ± 5 °C. The mixture is heated for two hours after the temperature equilibrates to 115 ± 5 °C and then removed from the oven. After the solution cools for at least 30 minutes, the sample is diluted to 250 mL. This solution may then be directly analyzed or diluted further and then analyzed per the technical judgment of the Task Supervisors in charge of spectroscopic and radiochemistry methods.
5.1.2 Data Quality
Limitations and Interferences:
Most sludge components that comprise at least 0.5 weight percent can be determined with good precision (5% relative standard deviation or better) by using the aqua regia dissolution. The procedure dilutes solid samples by a factor of about 1000 fold (0.25 g of solid sample to 250 mL of solution). However, if sensitivity is a problem for some elements, a smaller dilution factor may be used. By diluting the original dissolution to 100 mL or less, an improvement in sensitivity can be achieved. This approach should be used when minor components (< 0.5 wt. %), such as noble metals, are to be determined.
Most sludge elements can be determined equally well from either the aqua regia or the sodium peroxide fusion dissolution method. However, select elements can only be measured after one or the other of the dissolutions. Na and Zr must be determined from the aqua regia dissolution because they are introduced in the sodium peroxide fusion method. K should also be determined from the aqua regia dissolution because some batches of sodium peroxide contain K as an impurity. The aqua regia dissolution should also be used for elements such as As, Cd, Hg, Os, P, Rb, Re, Te, and Se that may have appreciable volatility at high temperatures, and subsequently may be partially lost in the sodium peroxide fusion upon heating at 675°C. The aqua regia procedure is performed in a sealed Teflon vessel to retain volatile elements. If volatile elements do not have to be measured, the method may be
SAVANNAH RIVER NATIONAL LABORATORY Manual: L16.1 ANALYTICAL DEVELOPMENT Procedure: ADS - 2226 ANALYTICAL OPERATING PROCEDURES Revision: 9 Page: 4 of 8 TECHNICAL REFERENCE Effective Date: 10/22/2009 MAJOR REWRITE
4
carried out in a non-pressurized vessel. However, this practice is discouraged since the corrosive acid fumes can escape and attack the metal surfaces of hoods, glove boxes and shielded cells. Si determinations obtained from aqua regia solutions are usually biased low relative to those obtained from the sodium peroxide method. Therefore, the sodium peroxide fusion method is used to determine Si.
5.1.3 Equipment
Teflon® pressure vessels: These vessels are also used for the microwave oven dissolution method. They contain a pressure relief valve that prevents the internal pressure from exceeding 120 ± 10 psig. The manufacturer of the vessels is CEM. The vessels are marketed by:
CEM P. O. Box 200 Matthews, NC 28106
Capping station: Also marketed by CEM or manual capping tools (fabricated by SRNL) Certified, calibrated analytical balance: Certified laboratory analytical balance should be able to weigh to at least the nearest 0.0001 g. For shielded cell dissolutions, the remote balances currently used are capable of weighing to the nearest 0.001 g. These balances are acceptable for shielded cell dissolutions. Drying oven Calibrated temperature controller for oven 250 mL plastic volumetric flasks or as directed by task supervisor
250 mL plastic bottles or as directed by task supervisor
SAVANNAH RIVER NATIONAL LABORATORY Manual: L16.1 ANALYTICAL DEVELOPMENT Procedure: ADS - 2226 ANALYTICAL OPERATING PROCEDURES Revision: 9 Page: 5 of 8 TECHNICAL REFERENCE Effective Date: 10/22/2009 MAJOR REWRITE
5
5.1.4 Reagents
Hydrochloric acid - (HCl)-Concentrated, 37%, ACS reagent grade Nitric acid - (HNO3)-Concentrated, 65%, ACS reagent grade
5.2 Sample Preparation
5.2.1 Verify that the oven controller is within calibration. Record balance M&TE information in Attachment 8.1.
5.2.2 Preheat a drying oven to 115 ± 5 °C. 5.2.3 Tare the Teflon pressure vessel bottom on an analytical
balance.
5.2.4 Transfer about 0.25 g of sample to the pressure vessel. Record the weight to the nearest 0.001 g or 0.0001 g (depending on the sensitivity of the balance) in the Data Sheet (see Attachment 8.1) or R&D direction for pasting in a laboratory notebook.
5.2.5 Add 9 mL of concentrated HCl and 3 mL concentrated HNO3
to the sample. 5.2.6 Cap the vessel using the CEM capping station or manual
capping tools. 5.2.7 Place the vessel in the drying oven and heat for 2 hours ± 10
minutes after the temperature equilibrates to 115 ± 5 °C. 5.2.8 Remove the vessel from the drying oven and let it cool for at
least 30 minutes.
Caution: Opening the vessels while still hot can result in the top popping off dangerously.
SAVANNAH RIVER NATIONAL LABORATORY Manual: L16.1 ANALYTICAL DEVELOPMENT Procedure: ADS - 2226 ANALYTICAL OPERATING PROCEDURES Revision: 9 Page: 6 of 8 TECHNICAL REFERENCE Effective Date: 10/22/2009 MAJOR REWRITE
6
5.2.9 Use the CEM Capping Station or manual capping tools to loosen the vessel caps.
5.2.10 Place a plastic funnel in the mouth of a plastic 250 mL plastic
volumetric flask. If smaller dilutions are required, i.e., 50 or 100 mL, substitute the required volumetric flask to obtain the desired dilution factor.
5.2.11 Pour the dissolved sample into the volumetric flask. 5.2.12 Add about 20 mL of distilled, deionized water to the digestion
vessel. 5.2.13 Pour the solution from the digestion vessel into the volumetric
flask. 5.2.14 Repeat Steps 5.2.12 through 5.2.14 to quantitatively transfer
the sample to the volumetric flask. 5.2.15 Add de-ionized water to the mark on the flask. 5.2.16 Cap the flask and shake vigorously to mix. 5.2.17 Pour the solution from the flask into a labeled plastic bottle
and transfer this bottle to AD sample receiving. Supply AD sample receiving with the sample weights and volumes.
5.2.18 Ensure data table is completed and pasted in a notebook.
Record additional information on data sheet, if necessary.
6.0 RECORDS
Lab notebook 7.0 REFERENCE
C. J. Coleman, ADS 2502, "Alkali Fusion Dissolutions Of Sludge And Glass For Elemental And Anion Analysis," March 5, 1990.
SAVANNAH RIVER NATIONAL LABORATORY Manual: L16.1 ANALYTICAL DEVELOPMENT Procedure: ADS - 2226 ANALYTICAL OPERATING PROCEDURES Revision: 9 Page: 7 of 8 TECHNICAL REFERENCE Effective Date: 10/22/2009 MAJOR REWRITE
7
8.0 ATTACHMENT Attachment 8:1: Data Table
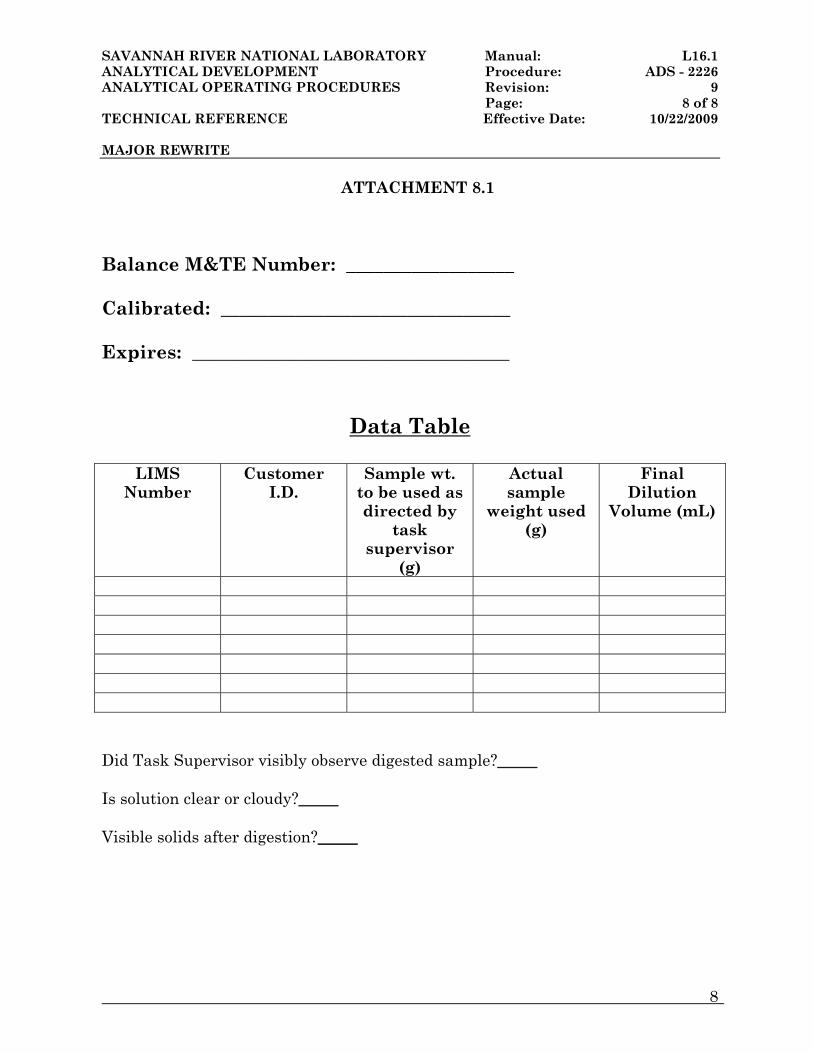
SAVANNAH RIVER NATIONAL LABORATORY Manual: L16.1 ANALYTICAL DEVELOPMENT Procedure: ADS - 2226 ANALYTICAL OPERATING PROCEDURES Revision: 9 Page: 8 of 8 TECHNICAL REFERENCE Effective Date: 10/22/2009 MAJOR REWRITE
8
ATTACHMENT 8.1 Balance M&TE Number: __________________ Calibrated: _______________________________ Expires: __________________________________
Data Table
LIMS Number
Customer I.D.
Sample wt. to be used as directed by
task supervisor
(g)
Actual sample
weight used (g)
Final Dilution
Volume (mL)
Did Task Supervisor visibly observe digested sample?_____ Is solution clear or cloudy?_____ Visible solids after digestion?_____
SAVANNAH RIVER NATIONAL LABORATORY Manual: L16.1 ANALYTICAL DEVELOPMENT Procedure: ADS-2310 ANALYTICAL OPERATING PROCEDURES Revision: 0 Page: 1 of 17 TECHNICAL REFERENCE Effective Date: 05/15/09
Analysis of Ions in Solutions Using Approved by: a Dionex ICS3000 Ion Chromatography System (U) Approval on File AD Manager _____________________________________________________________________________________________ 1. 1. PURPOSE
This procedure provides requirements by Analytical Development for using a Dionex ICS3000 Reagent-Free (RFIC) Ion Chromatography System for Anion and Cation analysis.
2. SCOPE
This procedure describes the requirements for the use of the Dionex ICS3000 Ion Chromatography System to separate and quantitate ions in solution. Anions such as F-, Cl-, NO2-, NO3-, Br-, SO42-, PO43-, C2O42-, CHO2- , and NH4+ are routinely determined by this method. System settings, method protocol, sample preparation instructions, procedures for data acquisition and report generation using the Chromeleon ® Chromatography Management Software for Windows, and quality assurance procedures are included. Use of the Dionex ICS3000 outside of the processes outlined in this document must be performed under direct supervision of the Task Supervisor.
2.1 Responsibilities
2.1.1 Technical Analyst is responsible for:
2.1.1.1 Preparing sample(s)/standard(s) as instructed by the Task supervisor.
2.1.1.2 Running the sample(s)/standard(s).
2.1.1.3 Obtaining results.
2.1.1.4 Maintaining the maintenance logbook, and all other general documentation required for laboratory operations.
2.1.1.1 Maintaining lab RBA & Radiological Containment Unit (RCU) cleanliness and order.
2.1.1.2 Maintaining adequate supplies for routine analysis.
2.1.2 Task Supervisor is responsible for:
2.1.2.1 Configuring the sample/standard parameters.
SAVANNAH RIVER NATIONAL LABORATORY Manual: L16.1 ANALYTICAL DEVELOPMENT Procedure: ADS-2310 ANALYTICAL OPERATING PROCEDURES Revision: 0 Page: 2 of 17 TECHNICAL REFERENCE Effective Date: 05/15/09
2.1.2.2 Reviewing the results generated by the Analyst.
2.1.2.3 Entering the results into the AD Laboratory Information Management System.
2.1.2.4 System troubleshooting.
3 PRECAUTIONS/LIMITATIONS
3.0 Safety
3.0.1 See Hazard Assessment Package # SRNL-ADD-2008-00163 for detailed hazard identification and mitigation.
Table 1: HAP reference table
Hazard Hazard Control
Samples - Mixed radioactive/toxic/corrosive materials
Handle materials in the appropriate containment unit with two pair gloves, protective eyewear with side shields and laboratory coat (PPE). Use care to avoid splashing, use limited quantities.
Glass Breaking Eyes on task
Lifting Use correct lifting technique
Flammable cleaning material Handle limited quantities with no local ignition source. Store material in a flammable cabinet, amount typically ≤ 20 mL
Sample injection Sample injection is performed in an auto-sampler, auto-sampler is self contained in a housing with cover preventing contact during injection
Pressure (IC systems) Use proper pressure relief systems
Pressure (purge and trap system) Use small volumes and gentle streams for purge
Heat (hot plate) Use UL listed hot plate, use hot signs, do not use flammable substances near hot surface
3.0.2 Additional Safety Considerations
3.0.2.1 Follow all ADS Laboratory radiation (L1, 2.32) and chemical handling guidelines (L1, 3.14, 3.15).
4 PREREQUISITE ACTIONS
4.0 To perform Ion Chromatography analysis it is required to be qualified on the Ion Chromatography Methods.
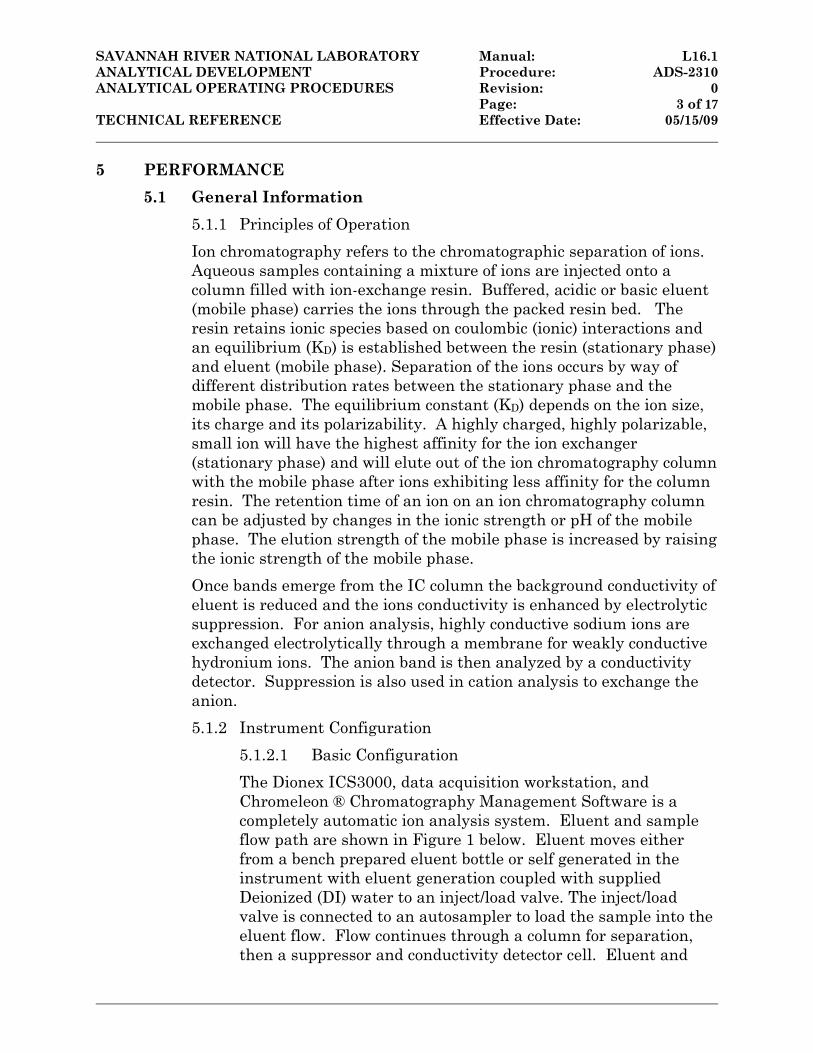
SAVANNAH RIVER NATIONAL LABORATORY Manual: L16.1 ANALYTICAL DEVELOPMENT Procedure: ADS-2310 ANALYTICAL OPERATING PROCEDURES Revision: 0 Page: 3 of 17 TECHNICAL REFERENCE Effective Date: 05/15/09
5 PERFORMANCE
5.1 General Information
5.1.1 Principles of Operation
Ion chromatography refers to the chromatographic separation of ions. Aqueous samples containing a mixture of ions are injected onto a column filled with ion-exchange resin. Buffered, acidic or basic eluent (mobile phase) carries the ions through the packed resin bed. The resin retains ionic species based on coulombic (ionic) interactions and an equilibrium (KD) is established between the resin (stationary phase) and eluent (mobile phase). Separation of the ions occurs by way of different distribution rates between the stationary phase and the mobile phase. The equilibrium constant (KD) depends on the ion size, its charge and its polarizability. A highly charged, highly polarizable, small ion will have the highest affinity for the ion exchanger (stationary phase) and will elute out of the ion chromatography column with the mobile phase after ions exhibiting less affinity for the column resin. The retention time of an ion on an ion chromatography column can be adjusted by changes in the ionic strength or pH of the mobile phase. The elution strength of the mobile phase is increased by raising the ionic strength of the mobile phase.
Once bands emerge from the IC column the background conductivity of eluent is reduced and the ions conductivity is enhanced by electrolytic suppression. For anion analysis, highly conductive sodium ions are exchanged electrolytically through a membrane for weakly conductive hydronium ions. The anion band is then analyzed by a conductivity detector. Suppression is also used in cation analysis to exchange the anion.
5.1.2 Instrument Configuration
5.1.2.1 Basic Configuration
The Dionex ICS3000, data acquisition workstation, and Chromeleon ® Chromatography Management Software is a completely automatic ion analysis system. Eluent and sample flow path are shown in Figure 1 below. Eluent moves either from a bench prepared eluent bottle or self generated in the instrument with eluent generation coupled with supplied Deionized (DI) water to an inject/load valve. The inject/load valve is connected to an autosampler to load the sample into the eluent flow. Flow continues through a column for separation, then a suppressor and conductivity detector cell. Eluent and
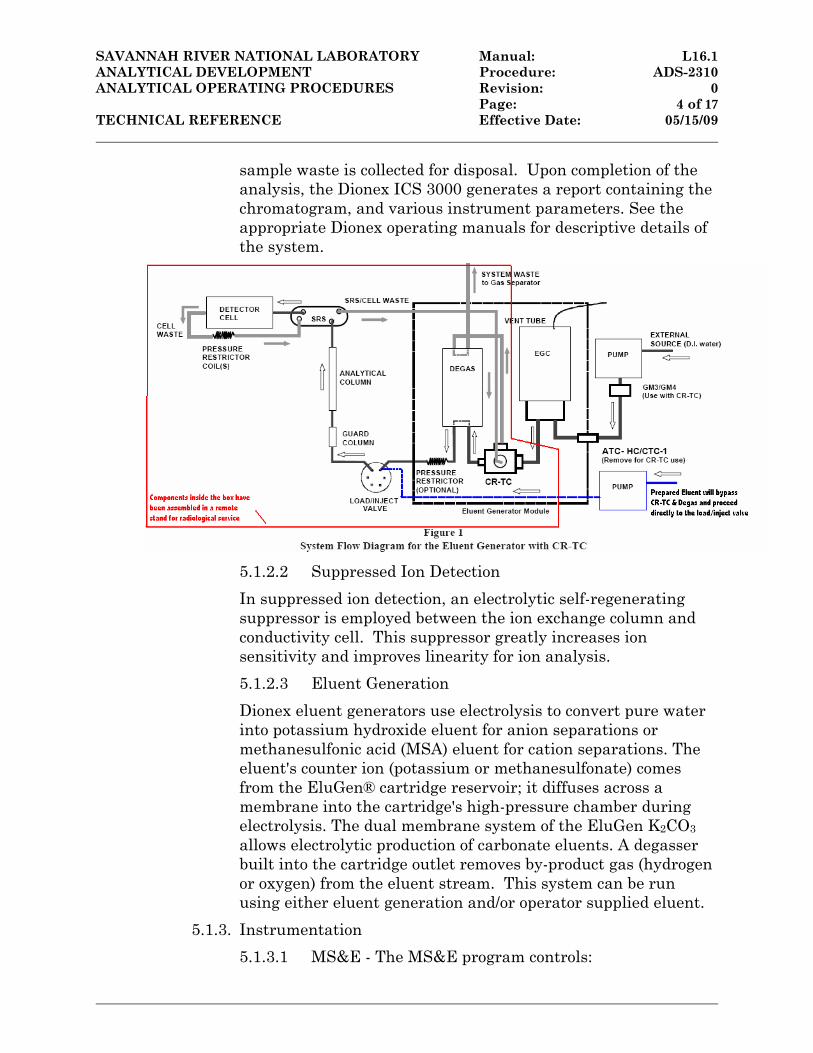
SAVANNAH RIVER NATIONAL LABORATORY Manual: L16.1 ANALYTICAL DEVELOPMENT Procedure: ADS-2310 ANALYTICAL OPERATING PROCEDURES Revision: 0 Page: 4 of 17 TECHNICAL REFERENCE Effective Date: 05/15/09
sample waste is collected for disposal. Upon completion of the analysis, the Dionex ICS 3000 generates a report containing the chromatogram, and various instrument parameters. See the appropriate Dionex operating manuals for descriptive details of the system.
5.1.2.2 Suppressed Ion Detection
In suppressed ion detection, an electrolytic self-regenerating suppressor is employed between the ion exchange column and conductivity cell. This suppressor greatly increases ion sensitivity and improves linearity for ion analysis.
5.1.2.3 Eluent Generation
Dionex eluent generators use electrolysis to convert pure water into potassium hydroxide eluent for anion separations or methanesulfonic acid (MSA) eluent for cation separations. The eluent's counter ion (potassium or methanesulfonate) comes from the EluGen® cartridge reservoir; it diffuses across a membrane into the cartridge's high-pressure chamber during electrolysis. The dual membrane system of the EluGen K2CO3 allows electrolytic production of carbonate eluents. A degasser built into the cartridge outlet removes by-product gas (hydrogen or oxygen) from the eluent stream. This system can be run using either eluent generation and/or operator supplied eluent.
5.1.3. Instrumentation
5.1.3.1 MS&E - The MS&E program controls:
SAVANNAH RIVER NATIONAL LABORATORY Manual: L16.1 ANALYTICAL DEVELOPMENT Procedure: ADS-2310 ANALYTICAL OPERATING PROCEDURES Revision: 0 Page: 5 of 17 TECHNICAL REFERENCE Effective Date: 05/15/09
5.1.3.1.1 ICS SYSTEM 1
Model Number: Dionex ICS3000 (dual channel RFIC)
Serial Number: 08100105
ELI Number: 0000414957
5.1.3.1.2 Auxiliary Pipettes (non-M&TE)
5.1.3.2. M&TE - The M&TE program controls:
5.1.3.2.1. Analytical balance(s)
5.1.3.2.2. Pipette(s)
5.1.4. Manufacturer
North American Headquarters
3000 Lakeside Drive, Suite 116N
Bannockburn, IL 60015
Phone: (847) 295-7500 / Fax: (847) 283-0722
5.2 Calibration and Measurement Control Program
5.2.1 ICS3000 Systems Calibration and Quality Checks
5.2.1.1 Calibrations shall be performed prior to running samples.
5.2.1.2 Calibrations can be performed weekly; however, a daily calibration is preferred.
5.2.1.3 Calibrations shall have a minimum of 3 points and generally covers a concentration range of 10 mg/L to 100 mg/L.
5.2.1.4 Calibrations shall fit a linear or polynomial curve fit to 99.5% or better (r2 = 0.995).
5.2.1.5 Quality Control (QC) checks will be performed after calibration, periodically throughout a sample batch, and at closing of a batch. (for example: every 12-18 injections). Quality control checks shall be in amounts within the range of the calibration curve. Additional quality control checks can be made for amounts less than the calibration curve to observe performance below the calibration curve.
SAVANNAH RIVER NATIONAL LABORATORY Manual: L16.1 ANALYTICAL DEVELOPMENT Procedure: ADS-2310 ANALYTICAL OPERATING PROCEDURES Revision: 0 Page: 6 of 17 TECHNICAL REFERENCE Effective Date: 05/15/09
5.2.2 Auxiliary Pipettes (non-M&TE)
5.2.2.1 If auxiliary pipettes are to be used, a weight check shall be performed prior to use on samples or standards. Perform weight check on the volumes intended for use by measuring a known amount of DI water. Amount should be within +/- 1% of target weight. For example see figure 2:
Figure 2: Pipette acceptance table for weight checks
Low (g)
Target (ml)
High (g)
0.0495 0.05 0.05050.099 0.1 0.1010.99 1 1.014.95 5 5.059.9 10 10.1
5.2.3 Standards and Chemicals
5.2.3.1 Reference Standards: Quality control checks and calibration standards shall be dilutions of NIST traceable standards that are within the expiration date and from independent lot #s.
5.2.3.2 American Chemical Society (ACS) reagent grade chemicals should be used unless otherwise specifies.
5.2.3.3 Deionized (DI) water shall be 18.0 ΜΩ or better resistivity.
5.2.3.4 Bench prepared eluent or instrument Eluent Generation can be used. Methane Sulfonic Acid (MSA) when used should be diluted from a filtered concentrated solution.
5.3 Non-Routine
5.3.1 Non Conforming Conditions
5.3.1.1 If the standard is out of specifications, see the Task Supervisor. It maybe necessary to generate a Non-Conformance (NCR) for any data generated since the last acceptable calibration check.
5.3.2 Non-Routine Samples
5.3.2.1 Non-routine ions are determined if the customer makes a formal request of the Task Supervisor. The
SAVANNAH RIVER NATIONAL LABORATORY Manual: L16.1 ANALYTICAL DEVELOPMENT Procedure: ADS-2310 ANALYTICAL OPERATING PROCEDURES Revision: 0 Page: 7 of 17 TECHNICAL REFERENCE Effective Date: 05/15/09
Task Supervisor determines if the analysis is feasible. It is the Task Supervisor's responsibility to determine any changes to the instrument configuration, eluent and regenerate solutions. These changes are to be recorded in the appropriate lab notebook and carried out through written laboratory R&D directions.
5.3.2.2 The customer and Task Supervisor are to agree on the source of the stock standard solutions. The source of the stock standard solution is to be recorded in the appropriate lab notebook.
5.4 Operating procedure
5.4.1 Ensure the computer, IC instrument and printer are powered on.
5.4.2 Load Chromeleon ® Chromatography Management Software by selecting the desktop icon on the computer.
5.4.3 Prepare Eluent
5.4.3.1 For Reagent-Free (RFIC) Ion Chromatography the eluent is generated by the instrument. Ensure the eluent concentrate cartridge has adequate supply, and the DI Water supply bottle is full. (An eluent concentrate cartridge has an estimated 6 month supply at typical rate of consumption).
5.4.3.2 Eluent can be prepared from American Chemical Society (ACS) reagent grade chemicals.
5.4.3.2.1 For anion analysis, eluent is prepared as a mixture 1.0 mM NaHCO3 in DI water / 3.5 mM Na2CO3 in DI water.
5.4.3.2.2 For cation analysis, eluent is prepared as 20.0 mM Methane Sulfonic Acid in DI Water.
5.4.3.2.3 Other eluent solutions may be specified by the task supervisor.
5.4.4 Prime pump
5.4.4.1 Open bypass valve for the pump you are attempting to prime.
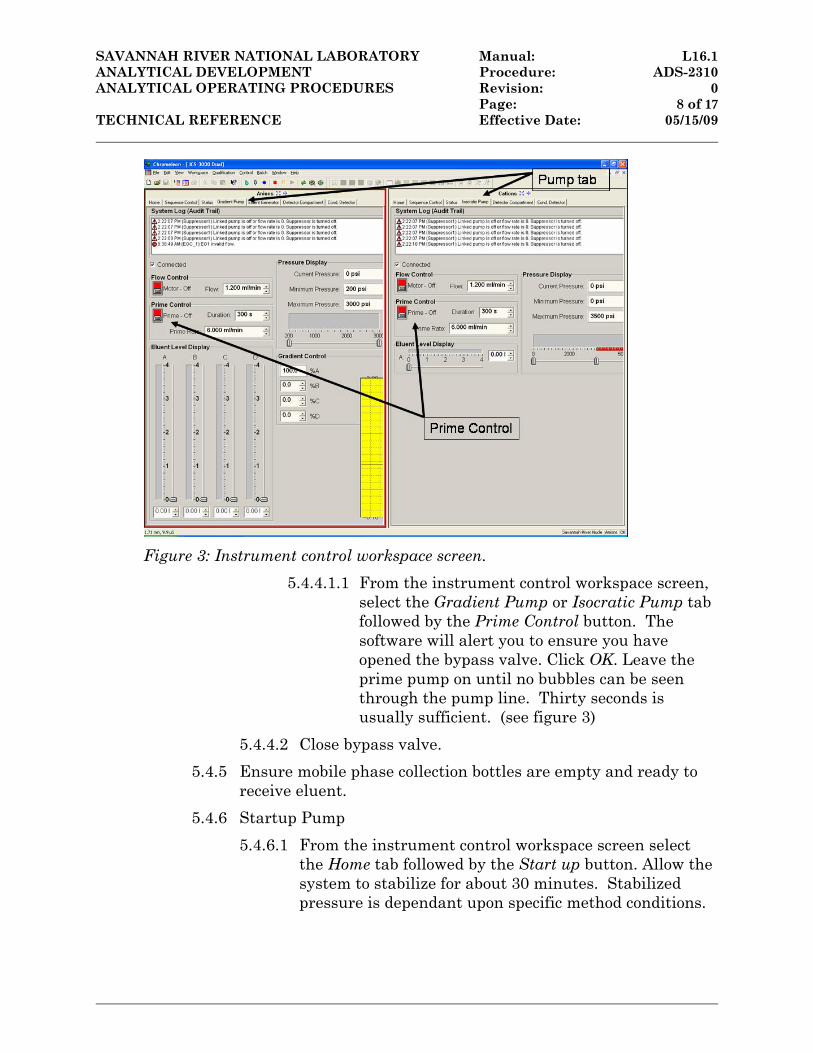
SAVANNAH RIVER NATIONAL LABORATORY Manual: L16.1 ANALYTICAL DEVELOPMENT Procedure: ADS-2310 ANALYTICAL OPERATING PROCEDURES Revision: 0 Page: 8 of 17 TECHNICAL REFERENCE Effective Date: 05/15/09
Figure 3: Instrument control workspace screen.
5.4.4.1.1 From the instrument control workspace screen, select the Gradient Pump or Isocratic Pump tab followed by the Prime Control button. The software will alert you to ensure you have opened the bypass valve. Click OK. Leave the prime pump on until no bubbles can be seen through the pump line. Thirty seconds is usually sufficient. (see figure 3)
5.4.4.2 Close bypass valve.
5.4.5 Ensure mobile phase collection bottles are empty and ready to receive eluent.
5.4.6 Startup Pump
5.4.6.1 From the instrument control workspace screen select the Home tab followed by the Start up button. Allow the system to stabilize for about 30 minutes. Stabilized pressure is dependant upon specific method conditions.
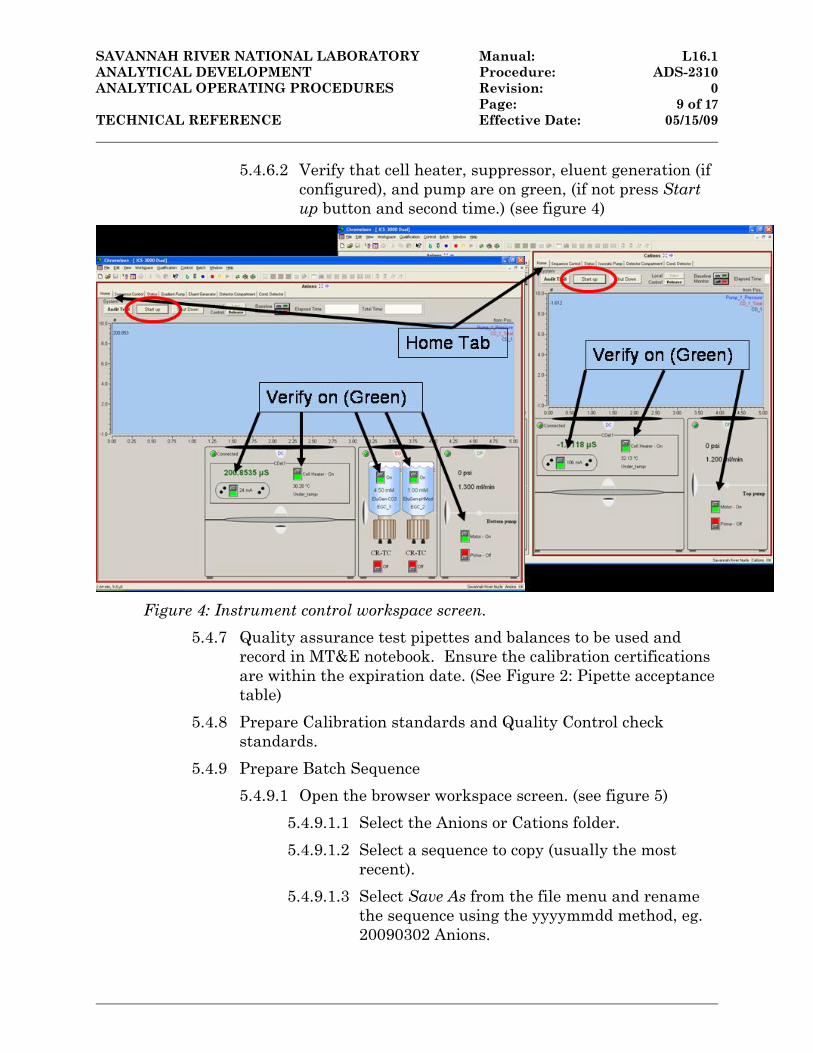
SAVANNAH RIVER NATIONAL LABORATORY Manual: L16.1 ANALYTICAL DEVELOPMENT Procedure: ADS-2310 ANALYTICAL OPERATING PROCEDURES Revision: 0 Page: 9 of 17 TECHNICAL REFERENCE Effective Date: 05/15/09
5.4.6.2 Verify that cell heater, suppressor, eluent generation (if configured), and pump are on green, (if not press Start up button and second time.) (see figure 4)
Figure 4: Instrument control workspace screen.
5.4.7 Quality assurance test pipettes and balances to be used and record in MT&E notebook. Ensure the calibration certifications are within the expiration date. (See Figure 2: Pipette acceptance table)
5.4.8 Prepare Calibration standards and Quality Control check standards.
5.4.9 Prepare Batch Sequence
5.4.9.1 Open the browser workspace screen. (see figure 5)
5.4.9.1.1 Select the Anions or Cations folder.
5.4.9.1.2 Select a sequence to copy (usually the most recent).
5.4.9.1.3 Select Save As from the file menu and rename the sequence using the yyyymmdd method, eg. 20090302 Anions.
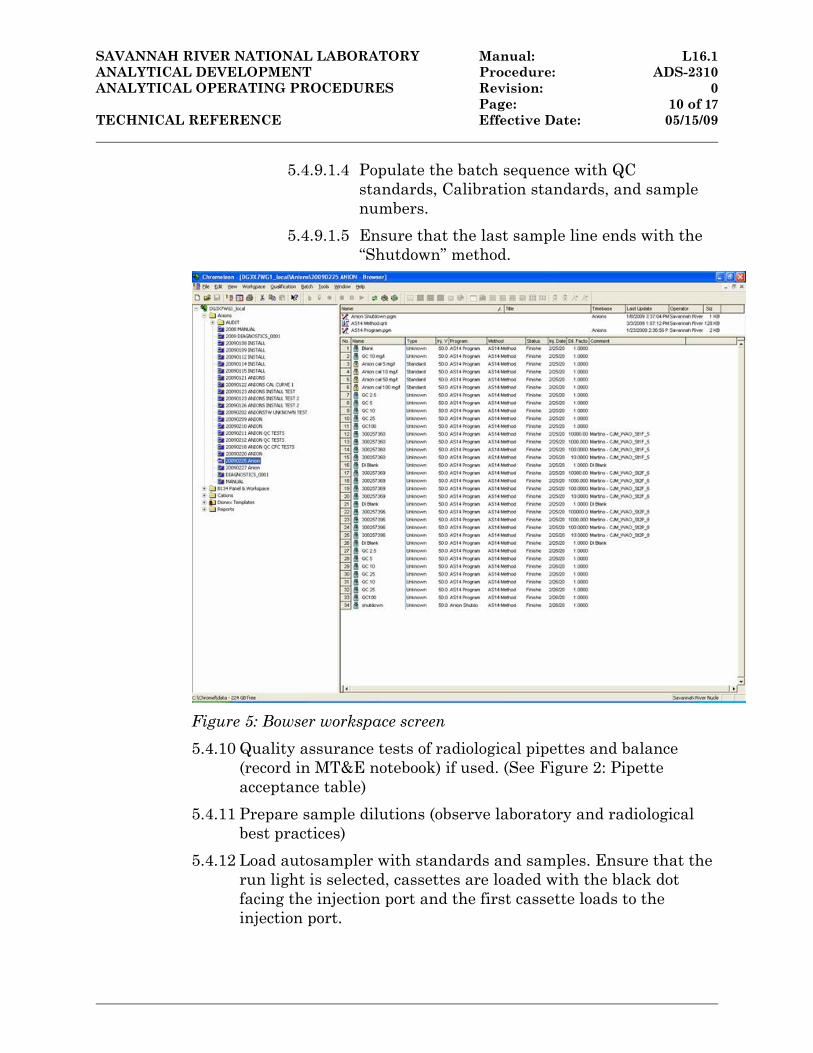
SAVANNAH RIVER NATIONAL LABORATORY Manual: L16.1 ANALYTICAL DEVELOPMENT Procedure: ADS-2310 ANALYTICAL OPERATING PROCEDURES Revision: 0 Page: 10 of 17 TECHNICAL REFERENCE Effective Date: 05/15/09
5.4.9.1.4 Populate the batch sequence with QC standards, Calibration standards, and sample numbers.
5.4.9.1.5 Ensure that the last sample line ends with the “Shutdown” method.
Figure 5: Bowser workspace screen
5.4.10 Quality assurance tests of radiological pipettes and balance (record in MT&E notebook) if used. (See Figure 2: Pipette acceptance table)
5.4.11 Prepare sample dilutions (observe laboratory and radiological best practices)
5.4.12 Load autosampler with standards and samples. Ensure that the run light is selected, cassettes are loaded with the black dot facing the injection port and the first cassette loads to the injection port.
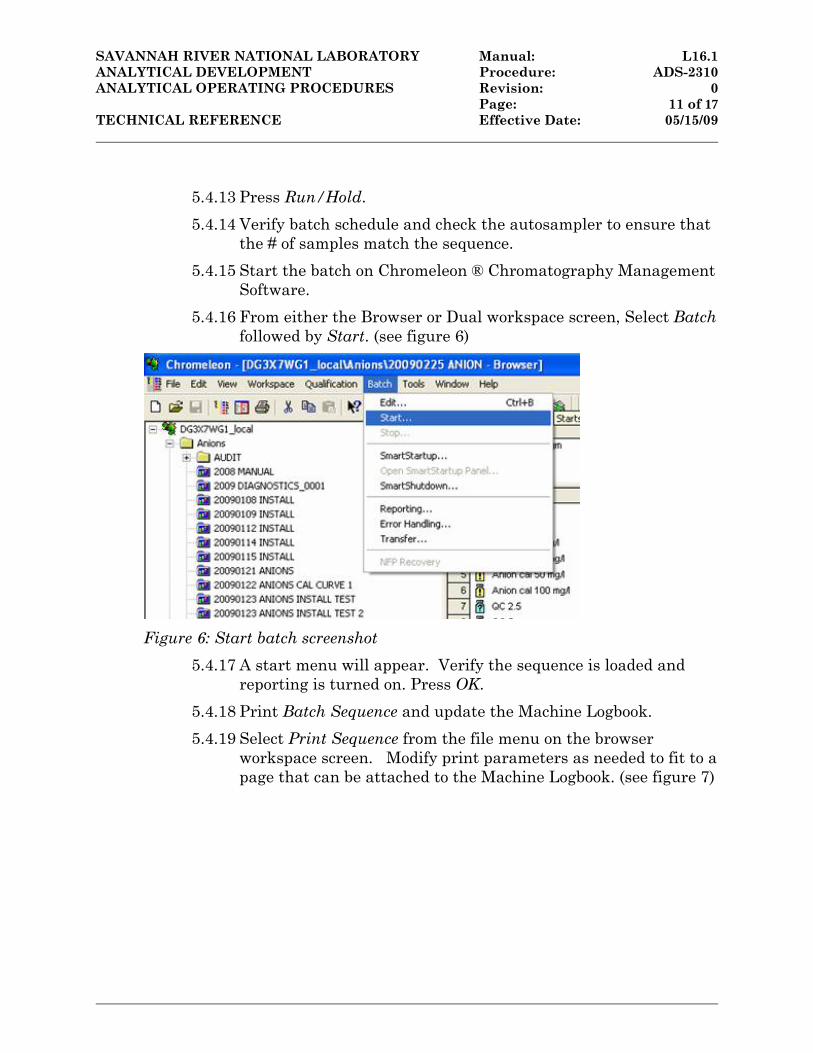
SAVANNAH RIVER NATIONAL LABORATORY Manual: L16.1 ANALYTICAL DEVELOPMENT Procedure: ADS-2310 ANALYTICAL OPERATING PROCEDURES Revision: 0 Page: 11 of 17 TECHNICAL REFERENCE Effective Date: 05/15/09
5.4.13 Press Run/Hold.
5.4.14 Verify batch schedule and check the autosampler to ensure that the # of samples match the sequence.
5.4.15 Start the batch on Chromeleon ® Chromatography Management Software.
5.4.16 From either the Browser or Dual workspace screen, Select Batch followed by Start. (see figure 6)
Figure 6: Start batch screenshot
5.4.17 A start menu will appear. Verify the sequence is loaded and reporting is turned on. Press OK.
5.4.18 Print Batch Sequence and update the Machine Logbook.
5.4.19 Select Print Sequence from the file menu on the browser workspace screen. Modify print parameters as needed to fit to a page that can be attached to the Machine Logbook. (see figure 7)
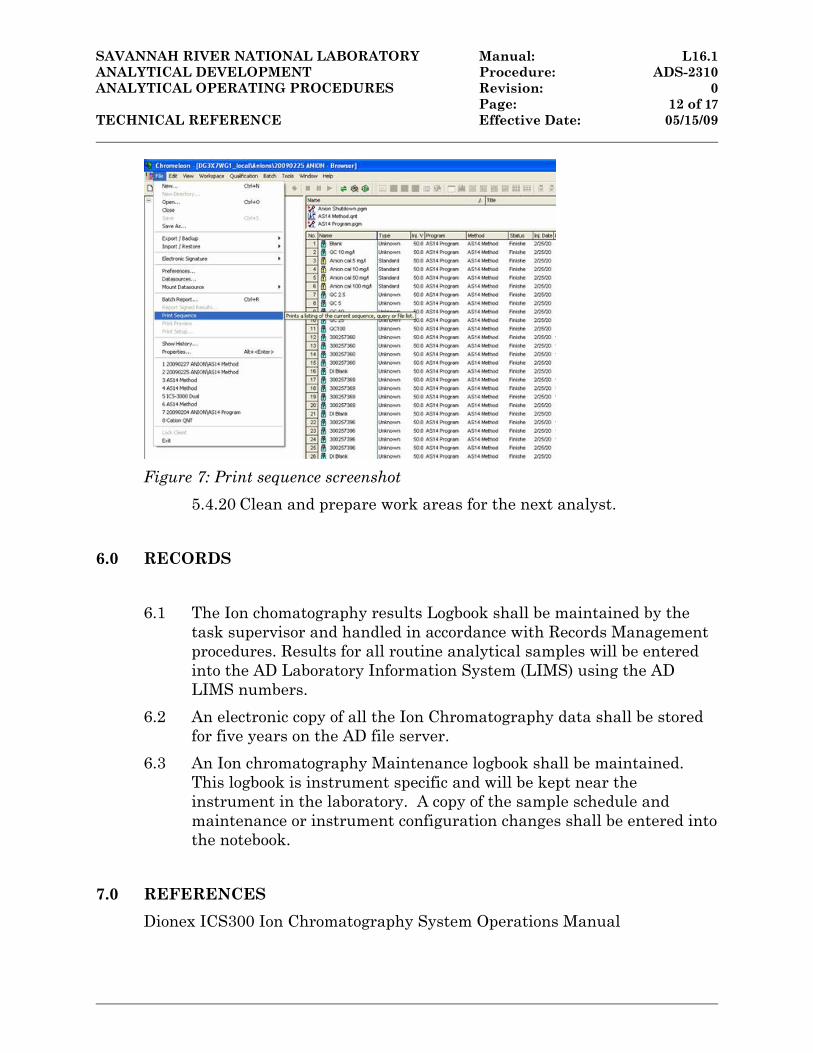
SAVANNAH RIVER NATIONAL LABORATORY Manual: L16.1 ANALYTICAL DEVELOPMENT Procedure: ADS-2310 ANALYTICAL OPERATING PROCEDURES Revision: 0 Page: 12 of 17 TECHNICAL REFERENCE Effective Date: 05/15/09
Figure 7: Print sequence screenshot
5.4.20 Clean and prepare work areas for the next analyst.
6.0 RECORDS
6.1 The Ion chomatography results Logbook shall be maintained by the task supervisor and handled in accordance with Records Management procedures. Results for all routine analytical samples will be entered into the AD Laboratory Information System (LIMS) using the AD LIMS numbers.
6.2 An electronic copy of all the Ion Chromatography data shall be stored for five years on the AD file server.
6.3 An Ion chromatography Maintenance logbook shall be maintained. This logbook is instrument specific and will be kept near the instrument in the laboratory. A copy of the sample schedule and maintenance or instrument configuration changes shall be entered into the notebook.
7.0 REFERENCES
Dionex ICS300 Ion Chromatography System Operations Manual
SAVANNAH RIVER NATIONAL LABORATORY Manual: L16.1 ANALYTICAL DEVELOPMENT Procedure: ADS-2310 ANALYTICAL OPERATING PROCEDURES Revision: 0 Page: 13 of 17 TECHNICAL REFERENCE Effective Date: 05/15/09
8.0 ATTACHMENTS
Attachment 1 Quick Guide for start up of ISC3000 sample batch
Attachment 2 Standard and Dilution Table
Attachment 3 Method Parameters for Anions
Attachment 4 Method Parameters for Cations
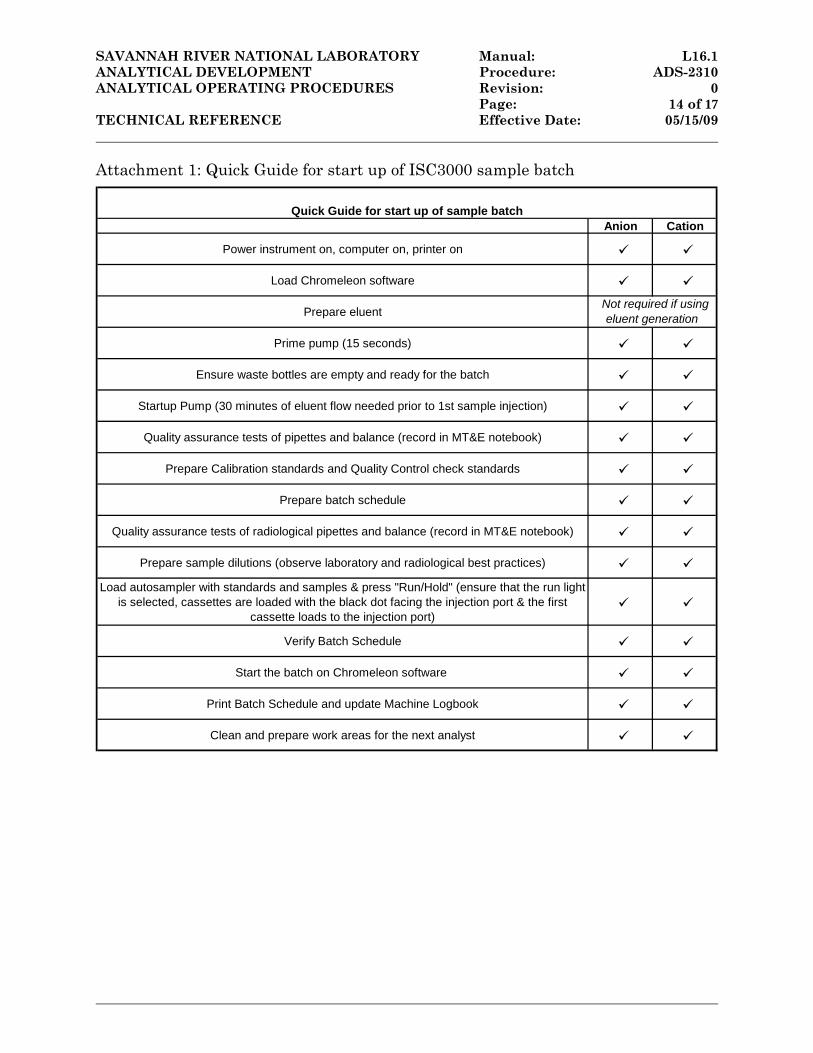
SAVANNAH RIVER NATIONAL LABORATORY Manual: L16.1 ANALYTICAL DEVELOPMENT Procedure: ADS-2310 ANALYTICAL OPERATING PROCEDURES Revision: 0 Page: 14 of 17 TECHNICAL REFERENCE Effective Date: 05/15/09
Attachment 1: Quick Guide for start up of ISC3000 sample batch
Anion Cation
Power instrument on, computer on, printer on
Load Chromeleon software
Prepare eluent
Prime pump (15 seconds)
Ensure waste bottles are empty and ready for the batch
Startup Pump (30 minutes of eluent flow needed prior to 1st sample injection)
Quality assurance tests of pipettes and balance (record in MT&E notebook)
Prepare Calibration standards and Quality Control check standards
Prepare batch schedule
Quality assurance tests of radiological pipettes and balance (record in MT&E notebook)
Prepare sample dilutions (observe laboratory and radiological best practices)
Load autosampler with standards and samples & press "Run/Hold" (ensure that the run light is selected, cassettes are loaded with the black dot facing the injection port & the first
cassette loads to the injection port)
Verify Batch Schedule
Start the batch on Chromeleon software
Print Batch Schedule and update Machine Logbook
Clean and prepare work areas for the next analyst
Quick Guide for start up of sample batch
Not required if using eluent generation
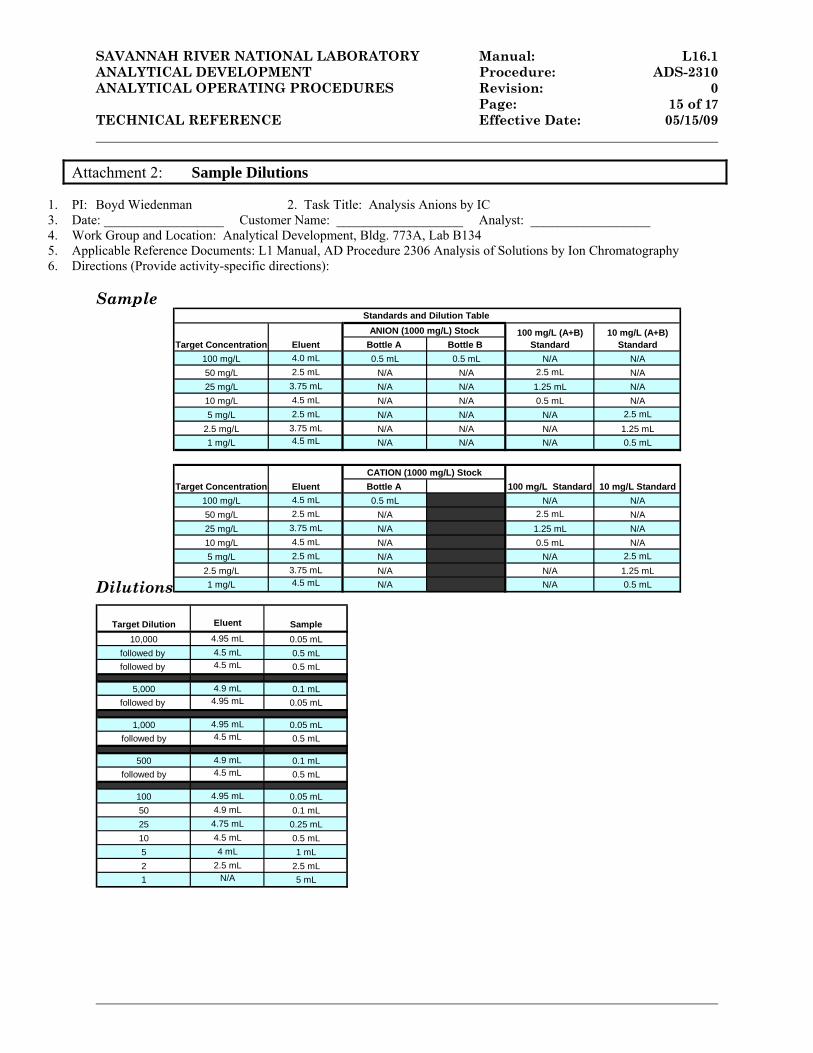
SAVANNAH RIVER NATIONAL LABORATORY Manual: L16.1 ANALYTICAL DEVELOPMENT Procedure: ADS-2310 ANALYTICAL OPERATING PROCEDURES Revision: 0 Page: 15 of 17 TECHNICAL REFERENCE Effective Date: 05/15/09
Attachment 2: Sample Dilutions
1. PI: Boyd Wiedenman 2. Task Title: Analysis Anions by IC 3. Date: __________________ Customer Name: ___________________ Analyst: __________________ 4. Work Group and Location: Analytical Development, Bldg. 773A, Lab B134 5. Applicable Reference Documents: L1 Manual, AD Procedure 2306 Analysis of Solutions by Ion Chromatography 6. Directions (Provide activity-specific directions):
Sample
Dilutions
Bottle A Bottle B
100 mg/L 4.0 mL 0.5 mL 0.5 mL N/A N/A
50 mg/L 2.5 mL N/A N/A 2.5 mL N/A
25 mg/L 3.75 mL N/A N/A 1.25 mL N/A
10 mg/L 4.5 mL N/A N/A 0.5 mL N/A
5 mg/L 2.5 mL N/A N/A N/A 2.5 mL
2.5 mg/L 3.75 mL N/A N/A N/A 1.25 mL
1 mg/L 4.5 mL N/A N/A N/A 0.5 mL
Bottle A
100 mg/L 4.5 mL 0.5 mL N/A N/A
50 mg/L 2.5 mL N/A 2.5 mL N/A
25 mg/L 3.75 mL N/A 1.25 mL N/A
10 mg/L 4.5 mL N/A 0.5 mL N/A
5 mg/L 2.5 mL N/A N/A 2.5 mL
2.5 mg/L 3.75 mL N/A N/A 1.25 mL
1 mg/L 4.5 mL N/A N/A 0.5 mL
100 mg/L Standard 10 mg/L Standard
ANION (1000 mg/L) Stock
Standards and Dilution Table
CATION (1000 mg/L) Stock
Target Concentration Eluent100 mg/L (A+B)
Standard10 mg/L (A+B)
Standard
Target Concentration Eluent
Target Dilution Eluent Sample
10,000 4.95 mL 0.05 mL
followed by 4.5 mL 0.5 mL
followed by 4.5 mL 0.5 mL
5,000 4.9 mL 0.1 mL
followed by 4.95 mL 0.05 mL
1,000 4.95 mL 0.05 mL
followed by 4.5 mL 0.5 mL
500 4.9 mL 0.1 mL
followed by 4.5 mL 0.5 mL
100 4.95 mL 0.05 mL
50 4.9 mL 0.1 mL
25 4.75 mL 0.25 mL
10 4.5 mL 0.5 mL
5 4 mL 1 mL
2 2.5 mL 2.5 mL
1 N/A 5 mL
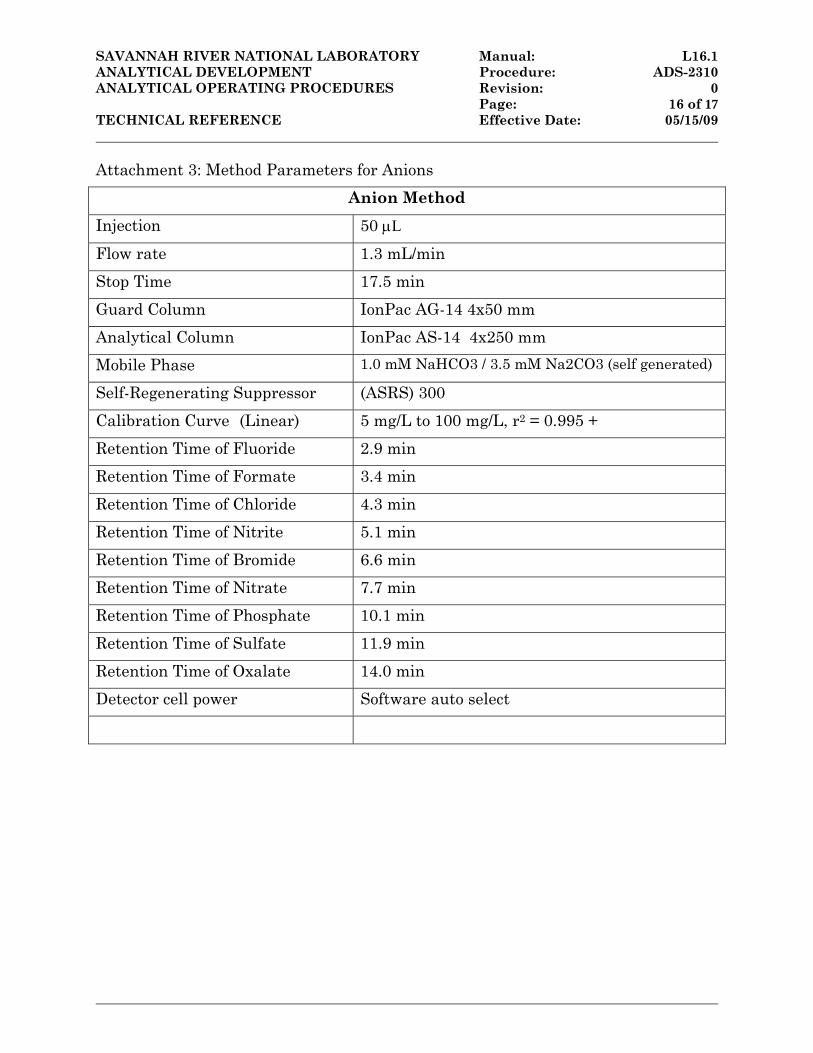
SAVANNAH RIVER NATIONAL LABORATORY Manual: L16.1 ANALYTICAL DEVELOPMENT Procedure: ADS-2310 ANALYTICAL OPERATING PROCEDURES Revision: 0 Page: 16 of 17 TECHNICAL REFERENCE Effective Date: 05/15/09
Attachment 3: Method Parameters for Anions
Anion Method
Injection 50 µL
Flow rate 1.3 mL/min
Stop Time 17.5 min
Guard Column IonPac AG-14 4x50 mm
Analytical Column IonPac AS-14 4x250 mm
Mobile Phase 1.0 mM NaHCO3 / 3.5 mM Na2CO3 (self generated)
Self-Regenerating Suppressor (ASRS) 300
Calibration Curve (Linear) 5 mg/L to 100 mg/L, r2 = 0.995 +
Retention Time of Fluoride 2.9 min
Retention Time of Formate 3.4 min
Retention Time of Chloride 4.3 min
Retention Time of Nitrite 5.1 min
Retention Time of Bromide 6.6 min
Retention Time of Nitrate 7.7 min
Retention Time of Phosphate 10.1 min
Retention Time of Sulfate 11.9 min
Retention Time of Oxalate 14.0 min
Detector cell power Software auto select
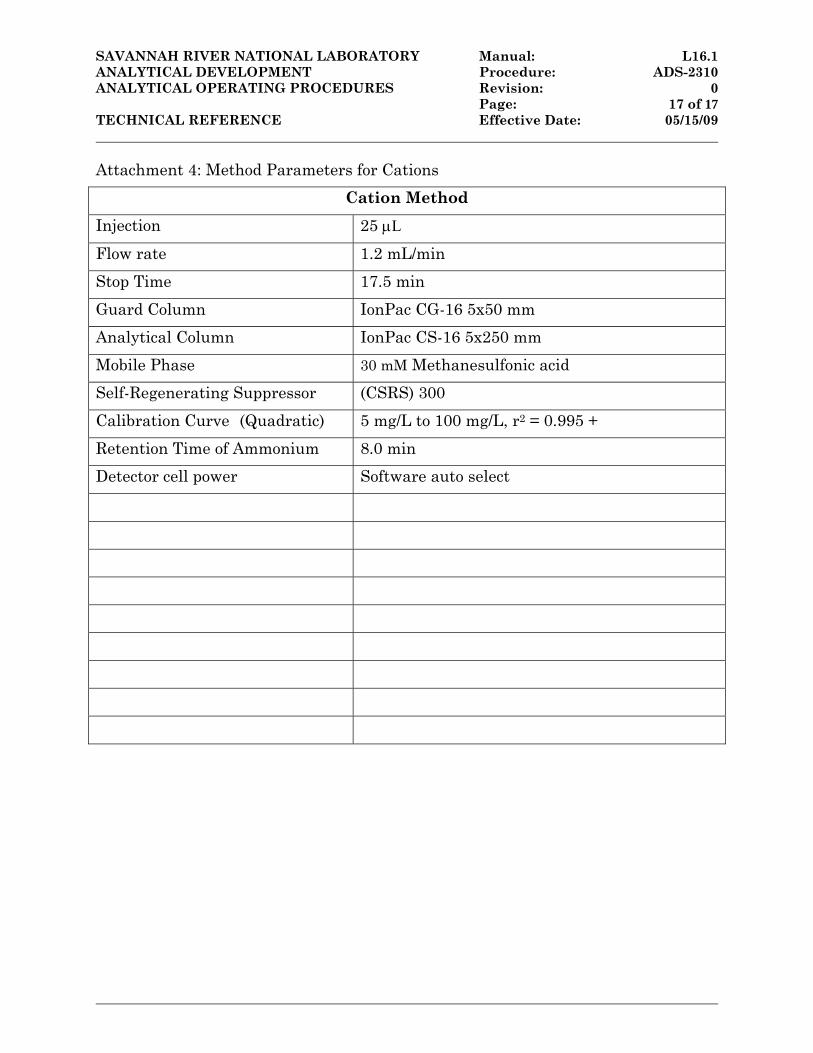
SAVANNAH RIVER NATIONAL LABORATORY Manual: L16.1 ANALYTICAL DEVELOPMENT Procedure: ADS-2310 ANALYTICAL OPERATING PROCEDURES Revision: 0 Page: 17 of 17 TECHNICAL REFERENCE Effective Date: 05/15/09
Attachment 4: Method Parameters for Cations
Cation Method
Injection 25 µL
Flow rate 1.2 mL/min
Stop Time 17.5 min
Guard Column IonPac CG-16 5x50 mm
Analytical Column IonPac CS-16 5x250 mm
Mobile Phase 30 mM Methanesulfonic acid
Self-Regenerating Suppressor (CSRS) 300
Calibration Curve (Quadratic) 5 mg/L to 100 mg/L, r2 = 0.995 +
Retention Time of Ammonium 8.0 min
Detector cell power Software auto select
Analytical Development Section Analytical Operating Procedures Volume 2
Manual: L16.1 Procedure: ADS-2402
Revision: 5 Alpha Pulse Height Analysis Major Revision
Effective Date: 06/29/11 Type-Category: Technical Page: 1 of 8
Electronic Approval on File: Author ________________________________ C. C. DiPrete Peer Reviewer ________________________________ D. P. DiPrete AD Materials Characterization & Nuclear Measurements Group Manager ________________________________ R. H. Young AD Procedure Coordinator ________________________________ M. S. Hanks
Procedure: ADS-2402 Alpha Pulse Height Analysis
Revision: 5 Page: 2 of 8
1.0 INTRODUCTION
1.1 Purpose This procedure describes a method for analyzing material prepared for analysis of alpha-emitting nuclides. A wide variety of sample matrices can be measured using this technique. This procedure will outline the requirements for routine use of alpha detectors for sample analysis.
1.2 Scope This procedure applies to alpha pulse height analysis (PHA) using a solid state detector system coupled with a Multichannel Analyzer (MCA), using Genie 2000 Alpha Analyst software for data processing. Samples can be chemically separated prior to analysis to isolate the analyte of interest. In order to account for inevitable sample loss during separation, a tracer, an isotope of the element of interest (i.e., 236Pu for plutonium analysis), is often added to the sample prior to separation. Assuming that homogeneity and chemical equilibrium have been achieved, the percent of tracer lost during separation is equal to the percent of sample analyte lost. The batch preparation and associated quality control samples are addressed in the applicable preparation procedures. Alpha PHA is also used as needed for absolute measurements of unknowns for quantification purposes (i.e., contamination samples).
2.0 GENERAL INFORMATION
2.1 Responsibilities
1. Analysts are responsible for: • Reading, understanding, and following this procedure. • Calling to the attention of the Task Supervisor any part of the
procedure that requires revision or that they believe to be unsafe.
2. Task Supervisor is responsible for: • Maintaining this procedure. • Providing technical guidance.
Procedure: ADS-2402 Alpha Pulse Height Analysis
Revision: 5 Page: 3 of 8
3.0 PRECAUTIONS AND LIMITATIONS
1. Alpha particles readily interact with other atoms because of their high positive charge. Hence, an alpha particle can easily be stopped or significantly slowed by even the thinnest layer of any material present. It is therefore vitally important that alpha samples be as thin as possible. Alpha spectra of samples that are not “massless” display broad peaks and decreased count rates. Correction for self-absorption can be accomplished by the preparation of spiked matrix samples at the discretion of the Task Supervisor.
2. Alpha-emitting nuclides decay with characteristic energies and half-lives. If a sample contains nuclides which decay with similar energies, unambiguous nuclide identification might not be possible. In many instances, however, interfering nuclides can be removed by simple radiochemical procedures.
3. Variations in sample geometry and the low detection efficiencies of solid state detectors make the determination of absolute count rates difficult. To overcome this problem, the gross alpha decay rate may be determined by gas-flow proportional counters with relatively high efficiencies. Once the absolute count rate has been determined, alpha PHA is used to determine the relative count rates of the nuclides present. From these two pieces of information, the absolute quantities of the various nuclides present can be determined.
3.1 Safety
1. Follow L1 2.32 Radiological Work Practices and 8Q Laboratory Safety Guidelines.
2. Yellow (RAD) gloves shall be worn to handle the plastic plate holders in the count room.
3. Read, understand and follow applicable Job Hazard Analyses (JHAs) in the Conduct of R&D packet.
4.0 PREREQUISITES Read, understand and comply with details in applicable JHA packets.
5.0 PROCEDURE
5.1 Description of Method This procedure is utilized to determine the energies of alpha particles contained in analyte material. This is done using any of the alpha pulse height analysis
Procedure: ADS-2402 Alpha Pulse Height Analysis
Revision: 5 Page: 4 of 8
(PHA) systems. The systems consist of vacuum chambers, alpha particle detectors, analog-to-digital converters, mixer-routers, and multi-channel analyzers (MCAs). Several sets of vacuum chamber/detector combinations are available, to be used at the discretion of the Task Supervisor. Results from the alpha analysis provide peak energy and peak area, which can be used to quantify numerous alpha-emitting isotopes in a variety of approaches. Each alpha PHA detector is calibrated for energy and efficiency using NIST-traceable alpha sources. It should be noted that energy calibrations are required for system use, while efficiency calibrations are not always necessary. Often, alpha samples are mounted and assayed for gross alpha activity prior to alpha pulse height analysis. Sample preparation and analysis using gas-flow proportional counters are addressed in L16.1, ADS-2405.
5.2 Data Quality The detector data quality indicators are addressed in the Quality Control section. The quality assurance and quality control protocols applicable to alpha PHA are dependent upon the Data Quality Objectives (DQOs), when supplied. In the absence of specific DQOs, preparation QC is addressed in the R&D Directions: blanks, laboratory duplicates, blank spikes, and matrix spikes are several examples of quality indicators which can be utilized for this procedure. The blank contribution should be less than 10% of the sample result, and the measured activities for duplicates should overlap within 3 sigma. If QC indicators fall outside of these ranges, the Task Supervisor must determine whether the data is fit for release with additional scrutiny and/or qualifiers. If a tracer with known alpha activity is utilized during sample preparation, detector efficiency does not need to be known. Quantification depends upon accurately knowing the activity of the tracer, coupled with acceptable peak shape and area. All of the detectors are Measurement Systems and Equipment (MS&E) and, as such, comply with the requirements set forth by Manual 1Q, 2-7.
Procedure: ADS-2402 Alpha Pulse Height Analysis
Revision: 5 Page: 5 of 8
5.3 Quality Control
1. Background
A. An instrument background shall be obtained at least monthly for each spectrometer in use. At the direction of the Task Supervisor, detector backgrounds may be required more frequently.
B. Background spectra are used for background subtraction of analyte spectra.
C. There are no pass/fail limits for background peak areas. However; as the area of a background peak for a given region of interest increases due to contamination, the minimum detectable activity (MDA) increases and the measurement uncertainty increases. If the background area negatively impacts the data quality and the ability to meet DQOs, the detectors and chambers are cleaned.
2. Calibration
A. Energy Calibration An energy calibration over the energy range of interest must be performed upon detector set up. The energy calibration is performed with NIST-traceable sources, or equivalent. The measured alpha peak energies at the high-energy edge of the peaks must differ by 0.1 MeV or less from the known peak energies for each alpha peak in the calibration spectrum.
B. Efficiency Calibration
An efficiency calibration may be performed on the alpha spectrometers system(s) at the direction of the Task Supervisor. Note that the efficiency calibration is not always necessary; for example, if the analysis is being performed with spikes of known alpha activity. The efficiency calibration must be performed with NIST-traceable sources, or equivalent. The calculated activities from the calibration must agree within three standard deviations (3 sigma) of the accepted average decay-corrected values for the standards used. Any values outside of two standard deviation limits may be investigated to determine the cause. Corrective action shall be taken for any values outside of three standard deviation limits. The investigation and/or action shall be documented in the instrument logbook.
Procedure: ADS-2402 Alpha Pulse Height Analysis
Revision: 5 Page: 6 of 8
3. Calibration Verification
The energy calibration and efficiency of the alpha spectrometer system(s) are checked weekly using standard sources independent from the sources used to establish the energy calibration and efficiency. The energy calibration check peaks must be within 0.1 MeV of the accepted peak energy. The efficiency must be within 3 sigma of the average established for the detector. The peak energy and efficiency will be recorded on the instrument control charts or in the instrument logbook. The analyst’s initials and corrective action taken (if any) will also be noted in the logbook. Deviations exceeding the tolerances specified in this procedure shall result in a recalibration of the system, unless specifically allowed by the Task Supervisor.
4. Documentation
A logbook is utilized to record spectra obtained on the alpha PHA systems. Every spectrum that is obtained is documented in the logbook with the analyst’s identity, date of analysis, detector identity, file name, and any other pertinent information (customer identity, purpose for count, etc.).
5.4 Equipment
The following list is indicative of the type of detectors and software used. Additional equipment may be used at the direction of the Task Supervisor.
1. Canberra Quad Alpha Spectrometer
2. Passivated Ion-Implanted Planar Silicon detectors
3. Canberra Model 8224 Mixer/Router
4. Canberra Alpha Analyst
5. Canberra Model 8701 ADC
6. Canberra Genie 2K Alpha Software
7. PC
8. Vacuum pumps
9. Acquisition Interface Module (AIM 556)
Procedure: ADS-2402 Alpha Pulse Height Analysis
Revision: 5 Page: 7 of 8
5.5 Reagents
The only reagents needed are those required for the preparation of alpha counting plates as described in ADS-2405 or other applicable separation and alpha analysis procedures.
5.6 Analysis
1. Gross Alpha Determination
Follow the methods described in Procedure L16.1, ADS-2405.
2. Alpha PHA Counting
A. Select the alpha spectrometer(s) to be used: either the Canberra Quad Alpha Spectrometer or the Alpha Analyst.
B. Prior to loading each planchet, monitor it using the beta/gamma count rate meter. The counts should not exceed 10,000 cpm. If a planchet exceeds this limit, do not proceed with counting and consult the Task Supervisor.
C. Load planchet into the appropriate detector chamber. The samples should be handled at the edge using tweezers. Care should be taken to only touch the planchet at the edge, since the alpha-containing material is mounted at the center of the planchet.
D. Using count rate meters, ensure tweezers are free of contamination after utilizing them to handle alpha planchets.
E. Acquire spectrum and save data as directed by Task Supervisor or designee. Record initials, date, spectrum name, customer, count time and additional comments in the laboratory logbook.
F. Remove sample from detector chamber.
5.7 Calculations
Data Control:
Sample preparation data are recorded on the preparation data sheet and recorded in the Radiochemistry Laboratory logbook. The final data packet, containing the prep sheet, computer printouts, and calculations are stored in the counting room data notebook and associated binders. The Laboratory Information Management System (LIMS) contains a pointer to the raw data packet.
Procedure: ADS-2402 Alpha Pulse Height Analysis
Revision: 5 Page: 8 of 8
All calculations are completed by the task supervisor or a trained designee.
6.0 REFERENCES
1. Canberra Nuclear Products Group Catalog, Eighth Edition, 1990. Chart of the Nuclides, Thirteenth Edition, General Electric Company,
1984.
2. Table of Isotopes, Seventh Edition, John Wiley and Sons, 1978.
3. Canberra Genie-2000 Spectroscopy System, Canberra Industries, Inc., 1997.
4. Manual L16.1, ADS-2405, “Alpha and Beta Plate Making, Direct Mount and Count .”
5. Canberra Model S570 Genie-2000 Alpha Analyst Users Manual, 2000.
7.0 RECORDS Data are recorded and maintained as described in Data Control above. The ADS LIMS is used as the primary data storage location.
8.0 ATTACHMENTS None
Manual: L16.1Analytical Development Section Analytical Operating Procedures Procedure: ADS-2405Volume 2 Revision: 6
Effective Date: 03/10/10Type-Category: Technical
Alpha and Beta Plate Making Direct Mount and Count (U) Page: 1 of 9 Author/Analytical Task Supervisor: SIGNED COPY ON FILE C.C. DiPrete Peer Reviewer: SIGNED COPY ON FILE
D.P. DiPrete AD Materials Characterization and Nuclear Measurements SIGNED COPY ON FILE Group Manager R. Young
AD Procedures Coordinator SIGNED COPY ON FILE Mary Sue Hanks
Procedure: ADS-2405Revision: 6Alpha and Beta Plate Making
Direct Mount and Count (U) Page: 2 of 9 1.0 INTRODUCTION 1.1 Purpose
This procedure describes the preparation of “direct mount” plates for gross alpha and gross beta determination. In addition, alpha pulse height analysis (PHA) can be performed on these same plates. Alpha PHA is performed using ADS Procedure ADS-2402.
1.2 Scope
This procedure applies to the direct mount preparation and the gross alpha and/or gross beta counting of liquid samples. Solid samples may be analyzed by first leaching or dissolving to generate a liquid. In addition, particulates or other solids may be directly mounted to a sample plate. The plates may also be analyzed according to the alpha PHA procedure (ADS-2402).
2.0 GENERAL INFORMATION 2.1 Responsibilities
Analysts are responsible for reading, understanding and following this procedure, and calling to the attention of the Analytical Task Supervisor any part of the procedure that requires revision or that they believe to be unsafe.
The Analytical Task Supervisor is responsible for maintaining this procedure, providing analysts with otherwise difficult-to-obtain spikes and reagents, and providing technical guidance.
3.0 PRECAUTIONS/LIMITATIONS 3.1 Safety 1. Follow L1, 2.32, Radiological Work Practices, and 8Q laboratory safety guidelines. 2 Make sure that collodion completely covers the plate or dish. 3. Yellow (Rad) gloves shall be worn to handle the plastic plate holders in the
Counting Room.
4. Always: • Add acid to water • Wear plastic gloves when handling chemicals. • Avoid contact with skin and breathing of vapors. • Do not exceed hood and radiobench activity limits (SRNL L1, 2.32,
Radiological Work Practices)
Procedure: ADS-2405Revision: 6Alpha and Beta Plate Making
Direct Mount and Count (U) Page: 3 of 9
5. Ensure there are no open flames or spark sources when using collodion. 4.0 PREREQUISITES
Read, understand and comply with details in JHA. 5.0 PROCEDURE 5.1 Description of Method
1. Alpha and beta plates are prepared by pipetting a small sample aliquot (typically 25-200 uL) directly onto a stainless steel plate. The liquid is evaporated (typically under a heat lamp). The plate is then heated to red heat to further evaporate residual material. A solution containing collodion in ethanol is then evaporated onto the plate to hold the dried material on the plate. The gross alpha activity on the plate is measured with a gas flow proportional counter. The gross beta activity may be measured with a gas flow proportional counter adjusted to provide beta sensitivity. These same plates may be analyzed directly by alpha PHA with no additional preparation (per Procedure ADS-2402).
2. Dishes are used to mount larger sample aliquots of low activity samples. 5.2 Data Quality 1. General Limitations:
Solid material on a plate can absorb some of the alpha particles emitted, thus preventing their detection and causing results to be biased low. If solids are visible, their presence must be recorded at all levels as part of the analytical data. Solids resulting from the corrosive effects of HCl, HF, or other chemicals on stainless steel can usually be avoided by use of Hastelloy or platinum plates. Solids from the sample itself can be minimized somewhat by dilution and mounting a smaller aliquot of the sample.
2. Interferences:
The gas flow proportional counters show approximately equal response for all alpha particle energies. Thus, the count yields total alpha content on the plate with no isotopic information determinable. The gas flow proportional counters’ alpha channels exhibit some sensitivity to beta particles as well as alpha. Typical beta response is less than about 0.5% (compared to about 50% for alpha particles). Alpha samples with high levels of beta activity and low levels of alpha may require chemical separation. Contact the Task Supervisor.
Procedure: ADS-2405Revision: 6Alpha and Beta Plate Making
Direct Mount and Count (U) Page: 4 of 9 3. Detection Range Limits:
The low limit of activity determinable is the minimum detectable activity (MDA). The MDA is dependent on sample size, count time, counting statistics and the background levels associated with the counters. The maximum activity determinable is constrained only by making dilutions so that the activity on a plate is on the order of 105 dpm or less. Solutions with high levels of activity may be determined by making an appropriate dilution. Contact the Task Supervisor. The precision of the method is primarily dependent on counting statistics. For example, a precision of about 1% is obtained on duplicate plates containing ~104 cpm counted for 1 minute using the gas flow proportional counter. Samples with solids or volatile components may exhibit degraded counting efficiency and reduced precision. For samples where solid deposits are unavoidable, an approximate correction factor may be applied by the use of an internal standard. A known alpha spike is added to one of the samples and the samples are then processed in the usual manner. The correction factor (Cf) is calculated and used to adjust final results.
5.3 Quality Control 1. Method Validation:
The calibration and background data for the counters in use are verified daily or, at a minimum for each day used, per this procedure. If the data are not within the limits as given by the Task Supervisor, the Task Supervisor is contacted. The data is plotted on a QC chart. When necessary, a spiked plate shall be prepared to correct for sample self absorption.
2. Calibration Frequency:
• Instrument background for the detectors in use is determined daily, or at a minimum on days used for sample analysis.
• Instrument efficiency for detectors in use is verified daily using National Institute of
Standards and Technology (NIST)-traceable sources kept by the technician in the Counting Room, or at a minimum on days used for sample analysis.
• All calibration results are recorded in the appropriate logbook or radiometric
laboratory notebook.
Procedure: ADS-2405Revision: 6Alpha and Beta Plate Making
Direct Mount and Count (U) Page: 5 of 9
3. Calibration and Standardization
Known standards are counted. This establishes an efficiency factor for the counters as follows:
Efficiency = cpm/dpm. Where: cpm = counts per minute dpm = disintegrations per minute
For the standard, the dpm is known and the cpm is determined by the counting. This efficiency factor determines only the counter efficiency. It does not correct for self shielding and sample ablation.
5.4 Equipment See APPENDIX A 5.5 Reagents
• Purity of reagents - Unless otherwise stated, American Chemical Society (ACS) reagent grade chemicals shall be used.
• Purity of water - Unless otherwise indicated, reference to water shall be understood to
mean distilled or demineralized (deionized) water, [which meets the ACS requirements for Reagent water] as delivered through building systems.
• Collodion solution – (Prior to opening bottle, ensure peroxide testing has been
performed within the past 6 months and ensure no open flames or spark sources are present). To prepare collodion solution, add 1 mL of collodion to 100 mL of isopropanol. Mix well. Apply a “Flammable” label. Properly label, date and initial the bottle. Remove small quantities as needed.
• Nitric acid solution - (HNO3) 1M - Prepare by carefully pouring 63 mL of concentrated
HNO3 into 700 mL of water contained in a one liter volumetric flask. Dilute to one liter with water. Mix, then transfer to a one liter polyethylene bottle. Label, initial, and date the bottle.
5.6 Aqueous Sample Analysis
1. Accurately prepare the necessary sample dilution in dilution bottles containing 1 M HNO3 unless directed otherwise. Final dilution should contain less than 610 dpm.
2. Add a sample aliquot as directed by task supervisor to the center portions of a plate
on a fiberboard. Place the board under a heat lamp. Make duplicate mounts on each sample. If the sample shows a large amount of solids, contact the Task Supervisor.
Procedure: ADS-2405Revision: 6Alpha and Beta Plate Making
Direct Mount and Count (U) Page: 6 of 9
NOTE: Add sample aliquot to center of plate. The objective is to make a plate with the sample centered like the standard plates used to calibrate the counting instruments.
3. Turn on lamp and allow the sample to dry completely. 4. Using forceps, grasp edge of plate and hold over the flame of meeker burner until
plate reaches a dull red color. Place plate on a clean fiberboard to cool (5 min.). NOTE: Plate should reach a dull red color all over, except near the forceps. 5. Ensure no open flames or spark sources prior to opening collodion.
6. Once burner has been turned off, add 2 drops of collodion solution to the plate and tilt, if necessary, to spread over entire surface. Let dry.
7. Record sample number on a plastic planchet holder. Place sample plate in the
planchet holder. Put the planchet holder in a plastic carrier. Plastic carrier is placed in CA for RCO to clear. Once carrier is cleared by RCO, ensure RCO dose rates are acceptable for transport, and place the carrier in a 5-gallon DOT-approved bucket for delivery to the AD Counting Room for assay.
8. Use radiological gloves to hold the gray sample holder. Use the 110 probe to
determine the activity on each plate. If the response is >104 cpm for flamed plates or >102 cpm for non-flamed plates, do not proceed without further evaluation of the safety of transferring the plate to the counter. If the response is <104 dpm for flamed plates or <102 cpm for non-flamed plates, load plate into appropriate counter as directed by the task supervisor.
9. Should results on duplicate mounts differ by more than 10% or 3 sigma counting
uncertainty on proportional counters, consult the Analytical Task Supervisor. 5.7 Calculations All calculations are completed by the Task Supervisor or a trained designee. 5.8 Data Control
Plate preparation data are recorded on the preparation data sheet and recorded in the Radiometric Laboratory notebook.
The final data packet, containing the prep sheet, computer printouts, and calculations are stored in the counting room data notebook and associated binders.
Procedure: ADS-2405Revision: 6Alpha and Beta Plate Making
Direct Mount and Count (U) Page: 7 of 9
6.0 REFERENCES
1. Rider, B.F., Radiochemical Analysis, AECU-1046, 1952. 2. Prohaska, C. A., The SRP Standard Windowless Flow Counter, DP - 451, 1954. 3. Conner, J. E., ADS Procedure, Gross Alpha Activity (Direct Mount), May 1984. 4. Manual L16.1, Procedure ADS-2402.
7.0 RECORDS
Data are recorded and maintained as described in Data Control above. The ADS LIMS is used as the primary data storage location.
8.0 ATTACHMENTS
Appendix A Radiometric Laboratory Equipment Description. Appendix B Detailed Calculations
Procedure: ADS-2405Revision: 6Alpha and Beta Plate Making
Direct Mount and Count (U) Page: 8 of 9
APPENDIX A Page 1 of 1
Radiometric Laboratory Equipment Description (example) Stainless Steel Plate (1 7/16"dia. x 0.020" thick) Meeker or Fisher-type Burner Micropipets Dilution bottles Plastic planchet holders Forceps, 6" or 8" size Cold spot heater and heat lamp Fiberboards COUNTING SYSTEMS: (not necessarily inclusive of all instruments) Component Model Information Gross Alpha Detector (P-10 gas flow proportional counter)
Gamma Products, G542M QUAD
Gross Alpha Detector (ZnS counter) Gamma Products, Mini-T, G6020/30 Gross Alpha/Beta Detector (P-10 gas flow proportional counter)
Gamma Products, Traveler, G5020
Procedure: ADS-2405Revision: 6Alpha and Beta Plate Making
Direct Mount and Count (U) Page: 9 of 9
APPENDIX B Page 1 of 1
Detailed Calculations
All alpha calculations are performed by the Task Supervisor or a trained designee.
Analytical Development Section Analytical Operating Procedures
Manual: L16.1Procedure: ADS-2407
Volume 2 Revision: 8 Californium Neutron Activation Analysis Major Revision
Effective Date: 04/26/11Type-Category: Technical Page: 1 of 10
Electronic Approval on File Author/Task Supervisor: ______________________ C. C. DiPrete Peer Reviewer ______________________ D. P. DiPrete AD Materials Characterization and Nuclear Measurements Group Manager: ______________________ R. H. Young AD Procedure Coordinator: ______________________ M. S. Hanks
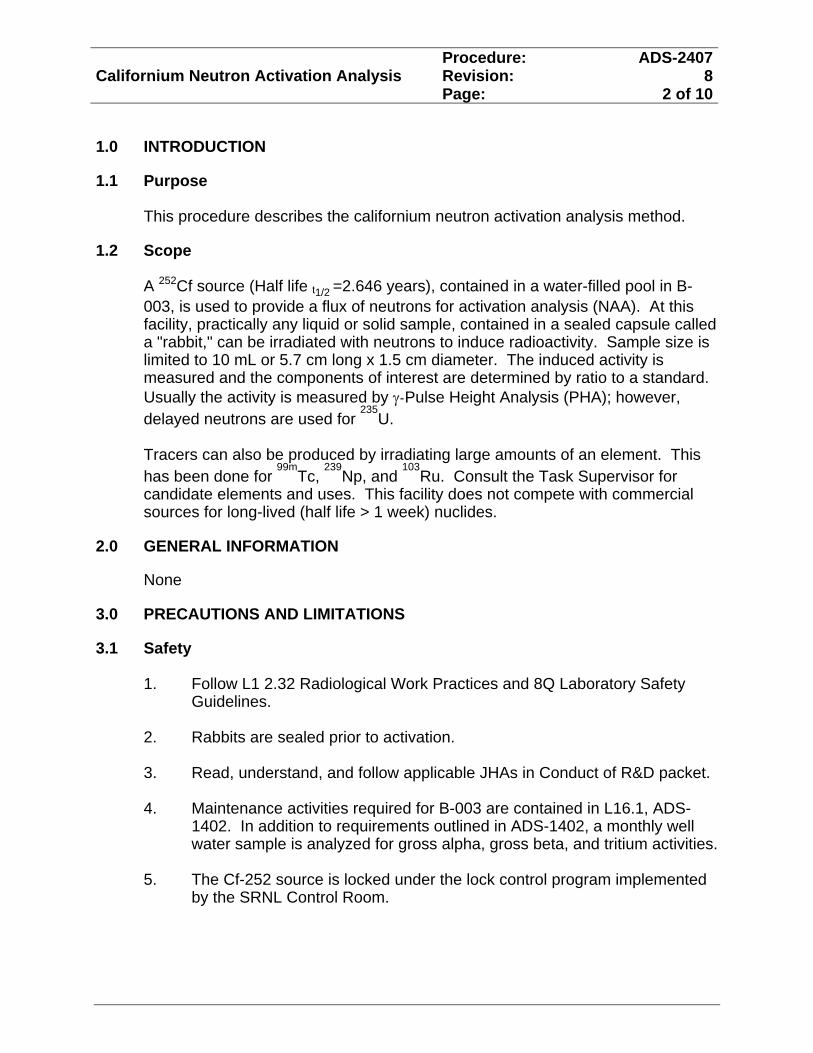
Procedure: ADS-2407Californium Neutron Activation Analysis Revision: 8
Page: 2 of 10
1.0 INTRODUCTION
1.1 Purpose This procedure describes the californium neutron activation analysis method.
1.2 Scope A 252Cf source (Half life t1/2 =2.646 years), contained in a water-filled pool in B-
003, is used to provide a flux of neutrons for activation analysis (NAA). At this facility, practically any liquid or solid sample, contained in a sealed capsule called a "rabbit," can be irradiated with neutrons to induce radioactivity. Sample size is limited to 10 mL or 5.7 cm long x 1.5 cm diameter. The induced activity is measured and the components of interest are determined by ratio to a standard. Usually the activity is measured by -Pulse Height Analysis (PHA); however, delayed neutrons are used for
235U.
Tracers can also be produced by irradiating large amounts of an element. This
has been done for 99m
Tc, 239
Np, and 103
Ru. Consult the Task Supervisor for candidate elements and uses. This facility does not compete with commercial sources for long-lived (half life > 1 week) nuclides.
2.0 GENERAL INFORMATION
None
3.0 PRECAUTIONS AND LIMITATIONS
3.1 Safety
1. Follow L1 2.32 Radiological Work Practices and 8Q Laboratory Safety Guidelines.
2. Rabbits are sealed prior to activation.
3. Read, understand, and follow applicable JHAs in Conduct of R&D packet.
4. Maintenance activities required for B-003 are contained in L16.1, ADS-1402. In addition to requirements outlined in ADS-1402, a monthly well water sample is analyzed for gross alpha, gross beta, and tritium activities.
5. The Cf-252 source is locked under the lock control program implemented by the SRNL Control Room.
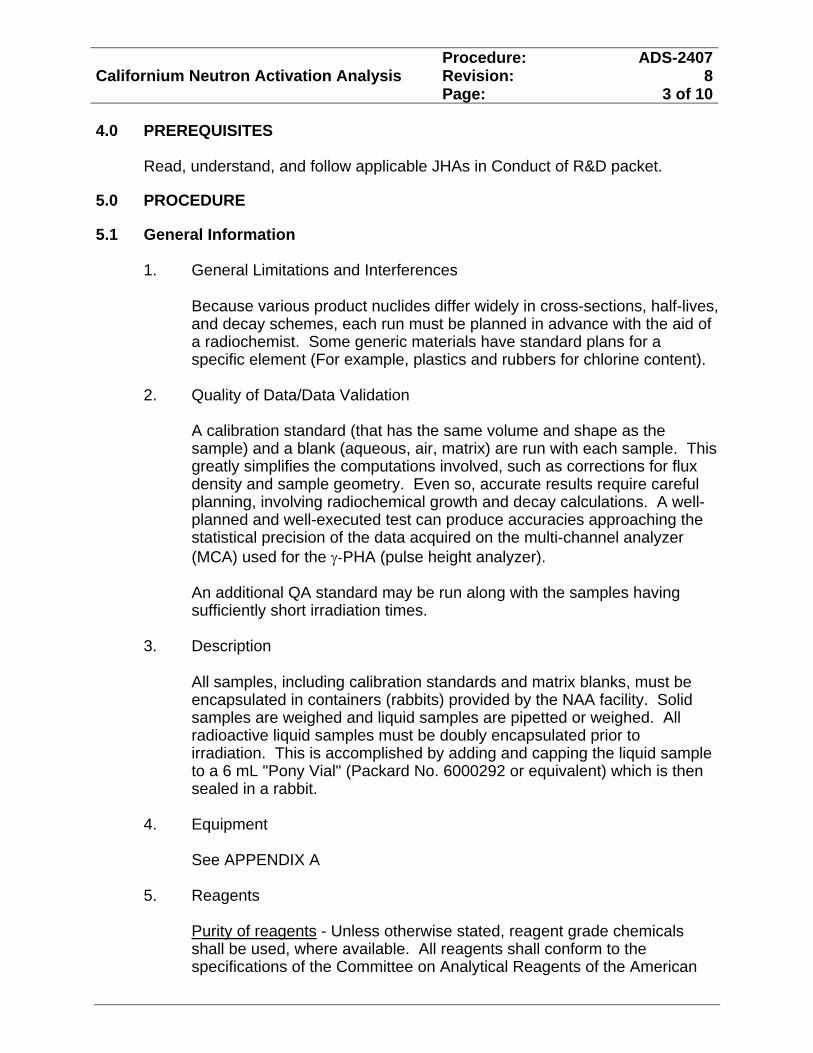
Procedure: ADS-2407Californium Neutron Activation Analysis Revision: 8
Page: 3 of 10
4.0 PREREQUISITES
Read, understand, and follow applicable JHAs in Conduct of R&D packet.
5.0 PROCEDURE
5.1 General Information 1. General Limitations and Interferences
Because various product nuclides differ widely in cross-sections, half-lives, and decay schemes, each run must be planned in advance with the aid of a radiochemist. Some generic materials have standard plans for a specific element (For example, plastics and rubbers for chlorine content).
2. Quality of Data/Data Validation
A calibration standard (that has the same volume and shape as the sample) and a blank (aqueous, air, matrix) are run with each sample. This greatly simplifies the computations involved, such as corrections for flux density and sample geometry. Even so, accurate results require careful planning, involving radiochemical growth and decay calculations. A well-planned and well-executed test can produce accuracies approaching the statistical precision of the data acquired on the multi-channel analyzer (MCA) used for the -PHA (pulse height analyzer). An additional QA standard may be run along with the samples having sufficiently short irradiation times.
3. Description
All samples, including calibration standards and matrix blanks, must be encapsulated in containers (rabbits) provided by the NAA facility. Solid samples are weighed and liquid samples are pipetted or weighed. All radioactive liquid samples must be doubly encapsulated prior to irradiation. This is accomplished by adding and capping the liquid sample to a 6 mL "Pony Vial" (Packard No. 6000292 or equivalent) which is then sealed in a rabbit.
4. Equipment
See APPENDIX A
5. Reagents
Purity of reagents - Unless otherwise stated, reagent grade chemicals shall be used, where available. All reagents shall conform to the specifications of the Committee on Analytical Reagents of the American
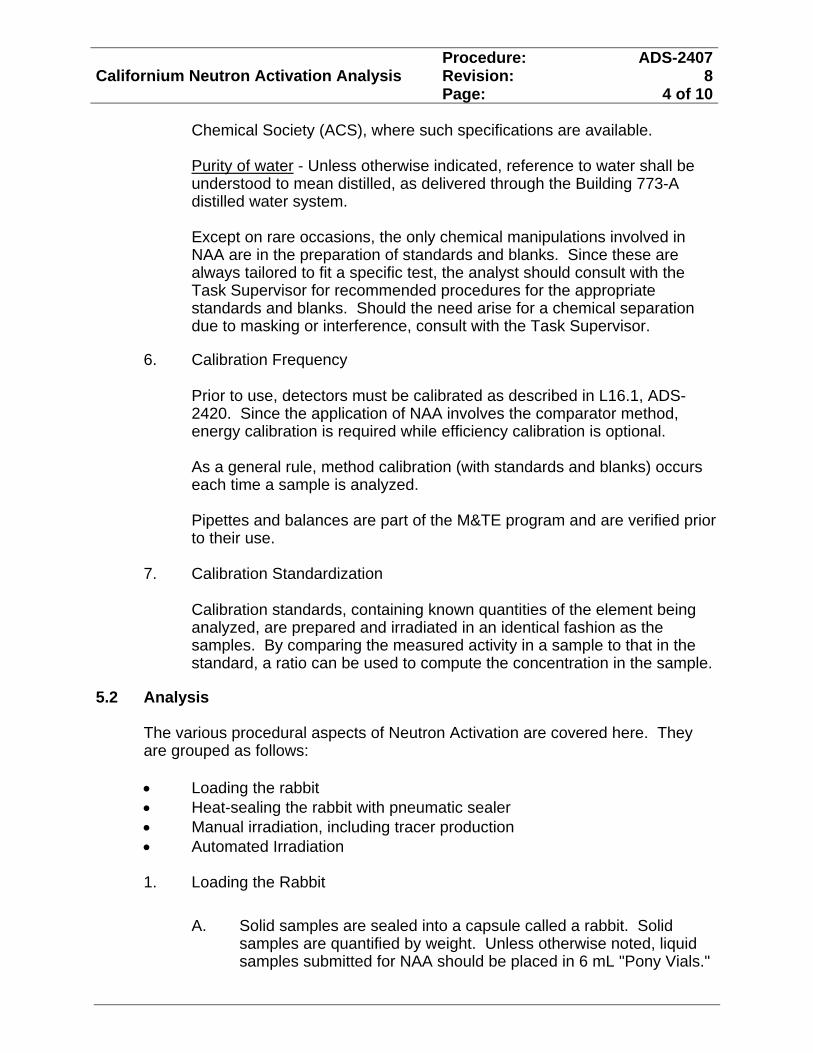
Procedure: ADS-2407Californium Neutron Activation Analysis Revision: 8
Page: 4 of 10
Chemical Society (ACS), where such specifications are available. Purity of water - Unless otherwise indicated, reference to water shall be understood to mean distilled, as delivered through the Building 773-A distilled water system. Except on rare occasions, the only chemical manipulations involved in NAA are in the preparation of standards and blanks. Since these are always tailored to fit a specific test, the analyst should consult with the Task Supervisor for recommended procedures for the appropriate standards and blanks. Should the need arise for a chemical separation due to masking or interference, consult with the Task Supervisor.
6. Calibration Frequency
Prior to use, detectors must be calibrated as described in L16.1, ADS-2420. Since the application of NAA involves the comparator method, energy calibration is required while efficiency calibration is optional.
As a general rule, method calibration (with standards and blanks) occurs each time a sample is analyzed. Pipettes and balances are part of the M&TE program and are verified prior to their use.
7. Calibration Standardization
Calibration standards, containing known quantities of the element being analyzed, are prepared and irradiated in an identical fashion as the samples. By comparing the measured activity in a sample to that in the standard, a ratio can be used to compute the concentration in the sample.
5.2 Analysis The various procedural aspects of Neutron Activation are covered here. They are grouped as follows: Loading the rabbit Heat-sealing the rabbit with pneumatic sealer Manual irradiation, including tracer production Automated Irradiation
1. Loading the Rabbit
A. Solid samples are sealed into a capsule called a rabbit. Solid samples are quantified by weight. Unless otherwise noted, liquid samples submitted for NAA should be placed in 6 mL "Pony Vials."
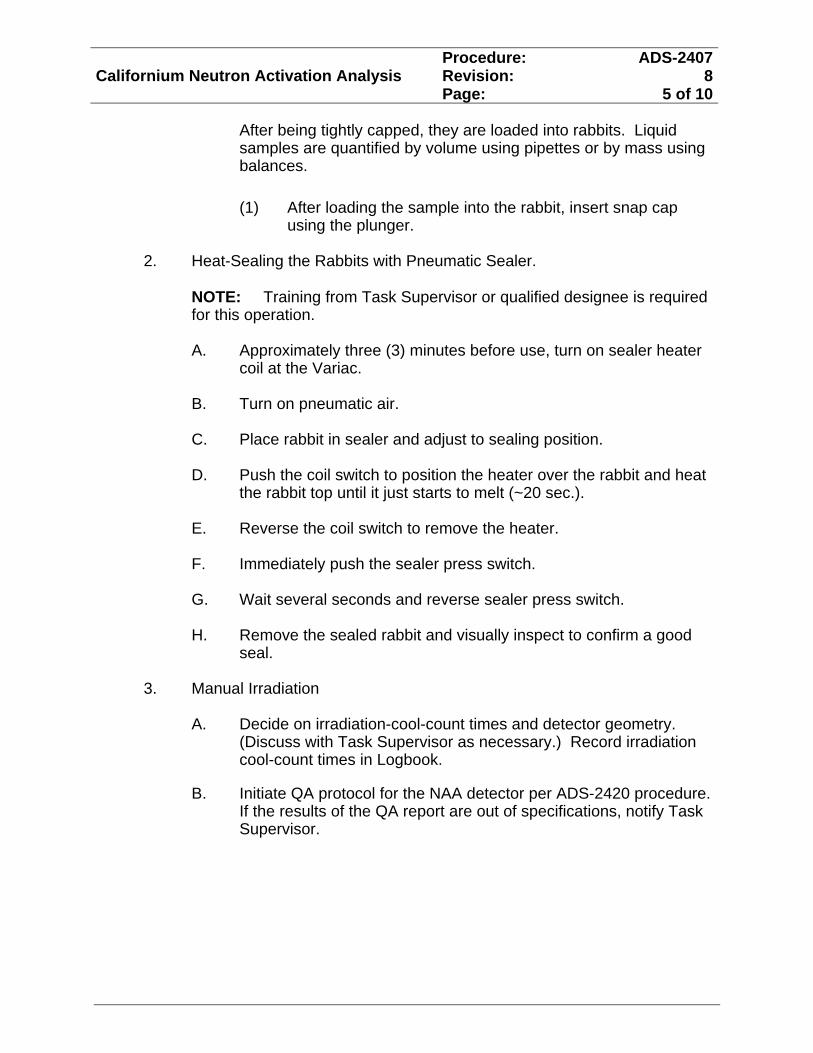
Procedure: ADS-2407Californium Neutron Activation Analysis Revision: 8
Page: 5 of 10
After being tightly capped, they are loaded into rabbits. Liquid samples are quantified by volume using pipettes or by mass using balances.
(1) After loading the sample into the rabbit, insert snap cap using the plunger.
2. Heat-Sealing the Rabbits with Pneumatic Sealer.
NOTE: Training from Task Supervisor or qualified designee is required for this operation.
A. Approximately three (3) minutes before use, turn on sealer heater
coil at the Variac. B. Turn on pneumatic air. C. Place rabbit in sealer and adjust to sealing position. D. Push the coil switch to position the heater over the rabbit and heat
the rabbit top until it just starts to melt (~20 sec.). E. Reverse the coil switch to remove the heater. F. Immediately push the sealer press switch. G. Wait several seconds and reverse sealer press switch. H. Remove the sealed rabbit and visually inspect to confirm a good seal.
3. Manual Irradiation
A. Decide on irradiation-cool-count times and detector geometry. (Discuss with Task Supervisor as necessary.) Record irradiation cool-count times in Logbook.
B. Initiate QA protocol for the NAA detector per ADS-2420 procedure. If the results of the QA report are out of specifications, notify Task Supervisor.
Procedure: ADS-2407Californium Neutron Activation Analysis Revision: 8
Page: 6 of 10
C. Begin sample irradiation.
(1) Have stopwatch on hand.
(2) Turn survey instrument on and set to x1000 scale.
(3) Rapidly lower capsule to bottom of tube and start stopwatch.
(4) For a given set of samples, all samples and standards must be irradiated in the same tube using the same irradiation duration.
D. End of irradiation.
(1) Rapidly remove sample from irradiation tube exactly at the end of the irradiation duration. Start stopwatch to monitor cool time as soon as rabbit is removed from neutron flux.
(2) Place the sample two (2) or three (3) inches from the survey instrument.
If count-rate is greater than 300,000 CPM, the sample
will be too hot to count. Lower the sample to just below the water level in an irradiation tube to further cool. Periodically check the count rate, and if additional cooling time is necessary, document the change in the cooling time on the log sheet that accompanies the samples.
If the sample has <300,000 CPM, it can be counted at
the end of the cool time.
E. Begin preparation for sample counting near the end of the cooling time. For a given batch, all samples and standards must be counted on the same detector. ADS-2420 and ADS-1401 cover necessary information on gamma analysis and liquid nitrogen dispensing.
(1) Place sample in rabbit holder designed for the detector.
(2) Initiate data collection for the pre-defined count time at the end of the pre-defined cool time.
Procedure: ADS-2407Californium Neutron Activation Analysis Revision: 8
Page: 7 of 10
(3) Record the following in logbook and/or in software:
sample file name, time and date of count, detector’s ID any deviations to the predefined irradiation, cool, and
counting time, dead time (if >10%, notify Task Supervisor for
additional instructions and clearly document in the notebook)
irradiation tube.
(4) Continue steps 3C-3E in this section, for all samples.
NOTE: Samples can be irradiated while other samples are being counted.
4. Automated Irradiation
A. The Neutron Activation System (ANAS-34) automatically processes multiple rabbits by sequentially moving the rabbits to the neutron activation wells, then to a gamma detector for counting with cooling time in between, and back again as needed for a series of predetermined cycles. This is done via a pneumatic system of plastic tubes that carry the rabbits with air pushing them through. The system can process 12 rabbits per hopper, and there are 2 hoppers. All aspects of the automated neutron activation system are controlled and monitored via a computer control system. Detailed operating instructions are contained in the vendor’s supplied manual (Section 6, Reference 6). Consult with the Task Supervisor if you have any questions.
B. As with manual irradiation, record all necessary information in
logbook and/or in software, as described in section 5.2, 3E (3).
5.3 Directions for Use of Electric Rabbit Cutter 1. Turn on unit by pressing orange switch; the orange light will turn on
when the unit is powered up.
Procedure: ADS-2407Californium Neutron Activation Analysis Revision: 8
Page: 8 of 10
2. Place the rabbit in the rabbit hole. It is critical the rabbit is placed in the hole upright. The top surface should have a circular depression in it, the bottom surface is flat. Contact the Task Supervisor if you are unsure.
3. Close the cover on the unit to protect from possible projectiles.
4. Press white switch and hold down, extending cutter until rabbit is cut clean through and the cutting arm is fully extended.
5. Release the white switch. 6. Remove the top of the rabbit; discard into the appropriate waste stream.
7. Press the white button again and hold down, retracting the cutting
arm back into its protective assembly.
8. Remove rabbit; discard the rabbit and its solid contents into the appropriate waste stream. If the rabbit contains a pony vial, decant the contents of the pony vial into the appropriate waste stream.
9. For additional rabbits return to step 2 in this section.
10. Once all rabbits have been opened, turn off the unit by pressing the orange button.
5.4 Calculations Calculations are based on a comparison of the activity of the element of interest in a standard to the activity of the element of interest in a sample. The results are background subtracted. Calculations for neutron activation are carried out under the Task Supervisor’s directions. They require a blank or background, a standard, and a sample.
5.5 Data Control
Sample preparation data are recorded on the preparation data sheet and recorded in the Radiochemistry Laboratory notebook. The final data packet, containing the prep sheet, computer printouts, and calculations are stored in the counting room data notebook and associated binders.
Procedure: ADS-2407Californium Neutron Activation Analysis Revision: 8
Page: 9 of 10
6.0 REFERENCES 1. Instrument Manual for Canberra Genie-PC. 2. William S. Lyon, Jr., Guide to Activation Analysis, Van Nostrand (1964). 3. L16.1, ADS-1401
4. L16.1, ADS-2420
5. L16.1, ADS-1402
6. System Manual for the Model ANAS-34 Automated Neutron Activation
System.
7.0 RECORDS Data are recorded and maintained as described in Data Control above. The ADS LIMS (Laboratory Information Management System) is used as the primary data storage location.
8.0 ATTACHMENTS
Appendix A Title: “Equipment”
Procedure: ADS-2407Californium Neutron Activation Analysis Revision: 8
Page: 10 of 10
APPENDIX A
EQUIPMENT
Containers (rabbits, vials) are provided by the NAA facility
Pipettes (various sizes)
Tips (various sizes)
Analytical Balance
Heat Sealer
Stopwatch
Gloves
Various Gamma Detectors
Electric Rabbit Cutter
Neutron Activation System (ANAS-34)
Analytical Development Section Analytical Operating Procedures
Manual: L16.1 Procedure: ADS-2420
Volume 2 Revision: 7 High-Purity Germanium Detector Gamma Pulse Height Analysis Major Rewrite
Effective Date: 10/19/12 Type-Category: Technical Ref. Page: 1 of 11
1.0 INTRODUCTION
1.1 Purpose This procedure covers the application of high-purity, high resolution germanium detectors to the detection, identification and quantification of gamma rays from a variety of low- to moderate-density sample matrices. This procedure will outline the requirements for routine use of high-purity germanium detectors for sample analysis. Portions of this procedure are applicable to the use of gamma pulse height analysis for accountability measurements.
1.2 Scope This procedure applies to gamma pulse height analysis (PHA) using high-purity germanium detectors of different types (coaxial, semi-planar, well, and planar) coupled with Genie 2000 Acquisition and Analysis Software (or similar industry software). The analysis software applies known gamma ray energies and calibrated detection efficiencies to spectral data to determine nuclide content of samples. Gamma pulse height analysis is used by Analytical Development in a variety of different ways to quantify material: It is used for the measurement of relative amounts of known nuclides for comparative purposes (i.e., tracing or trending), for absolute measurements of samples containing unknown concentrations of unknown nuclides for the purpose of quantification, and for Material Control and Accountability (MC&A) measurements. The quality assurance and quality control process varies with each different application. For example, comparative measurements require only that the detector can be used to accurately determine the relative peak areas of a given peak of known energy. Therefore, only energy calibration and verification is needed to provide data of sufficient quality. In comparison, MC&A measurements require very detailed studies of the detector behavior over time, control charts of the energies and inferred efficiencies of defined peaks within the expected energy range, verification of the quality assurance parameters each day the detector is used, and extensive evaluation if the quality assurance parameters fail defined acceptance criteria. It is the approach of this laboratory to maintain MC&A quality assurance (QA) on several characterized detectors, while maintaining less stringent QA on detectors that are not utilized for MC&A. The required QA for each type of application will be addressed.
Procedure: ADS-2420 High-Purity Germanium Detector Gamma Pulse Height Analysis
Revision: 7 Page: 2 of 11
2.0 GENERAL INFORMATION
2.1 Background Information Liquid and low- to moderate-density solid samples can be analyzed by gamma-PHA. The detector systems quantify gamma-emitting nuclides using pre-defined, calibrated, and validated counting geometries. Determinations of sample activity and supporting calculations are performed by vendor-qualified software (Section 6.0 References 3 and 4). Although gamma pulse height analysis is relatively simple, specific, and rapid, there are limitations that must be taken into account.
1. Detectors must be energy calibrated with known standards.
2. Detection efficiencies for gamma-rays vary with energy and must be obtained during the calibration process if the detector is being used for absolute quantification of unknown material.
3. The counting geometry (configuration of prepared sample and position of prepared sample relative to the detector) is established during calibration and must be carefully duplicated for accurate work.
4. The amount of activity in the counting vessel must be within an optimum range for accurate work. The Multichannel Analyzer (MCA) displays a "dead time” on the screen as the sample counts. During this "dead time", the MCA does not accept additional events. If the "dead time" is >10%, the sample should be analyzed in a different manner (diluted, moved away from the detector, etc.) for accurate measurements.
5. The relative abundance of the various gamma nuclides in the samples has an effect on the method sensitivity. Higher energy gammas can interfere with, or even mask, lower energy gamma rays.
The quality assurance and quality control protocols applicable to gamma PHA are dependent upon the Data Quality Objectives. If the data will be used for MC&A determinations, a higher level of QC must be maintained than if the data will be used for a trending study using a known standard. These different QC approaches are described in more detail throughout this procedure. All of the detectors are measurement systems and equipment (MS&E) and, as such, comply with the requirements set forth by Manual 1Q, 2-7. Only a subset of the detectors is maintained for MC&A analyses.
Procedure: ADS-2420 High-Purity Germanium Detector Gamma Pulse Height Analysis
Revision: 7 Page: 3 of 11
2.2 Responsibilities
1. Analysts are responsible for:
Reading, understanding and following this procedure.
Calling to the attention of the Task Supervisor any part of the procedure that requires revision or that they believe to be unsafe.
2. Task Supervisor is responsible for:
Maintaining this procedure.
Providing technical guidance.
3.0 PRECAUTIONS AND LIMITATIONS
3.1 Safety
1. Follow L1 2.32 Radiological Work Practices and 8Q Laboratory Safety guidelines.
2. Read, understand, and follow applicable Job Hazard Analyses (JHAs) in the Conduct of R&D packet.
3. Per JHA, be cautious of moving parts, lead, and pinch points.
4. Carefully examine all packaging for evidence of leaks prior to handling radioactive samples.
4.0 PREREQUISITES
None
5.0 PROCEDURE
5.1 Equipment
High-purity germanium detectors, and associated gamma spectroscopy electronics
Canberra Genie 2K gamma spectroscopy software (or similar industry product)
Changer Labs sample changers
Calibrated M&TE pipettes
Calibrated M&TE analytical balances
If necessary, additional items are maintained in the MS&E file for the method.
Procedure: ADS-2420 High-Purity Germanium Detector Gamma Pulse Height Analysis
Revision: 7 Page: 4 of 11
5.2 Reagents
Purity of reagents - Unless otherwise stated, ACS reagent grade chemicals shall be used.
5.3 Standards Standards utilized for establishing and validating energy and efficiency calibrations are NIST-traceable mixed gamma-ray standards. The mixed gamma-ray standards typically contain the following radionuclides: Am-241 (59.5 keV), Cd-109 (88.0 keV), Co-57 (122.1 keV), Ce-139 (165.9 keV), Hg-203 (279.2 keV), Sn-113 (391.7 keV), Sr-85 (514.0 keV), Cs-137 (661.6 keV), Mn-54 (834.8 keV), Y-88 (898.0 keV and 1836 keV), Zn-65 (1116 keV), and Co-60 (1173 keV and 1333 keV). Single-nuclide NIST-traceable standards can also be used, if necessary, to augment the energy range for example. Standards are diluted gravimetrically utilizing standard industry practice. Balances utilized for the preparation are M&TE (measuring and test equipment) and, as such, comply with the requirements set forth by Manual 1Q, 12-1. Documentation of standard preparation, including M&TE identification, is maintained in a logbook and is referenced in the dilution calculation spreadsheet.
Quality control standards are often prepared from the same source as the calibration standards. These standards are validated using previously validated standards from an independent lot.
5.4 Energy Calibration Energy calibrations are performed during detector set-up using a known, validated standard in conjunction with the Genie 2000 data acquisition system. Algorithms for the peak search, peak fitting and energy calibration are described in Section 6.0 Reference 4. The calibration peaks should span the entire range of energies to be reported.
5.5 Efficiency Calibration Detection efficiencies for gamma-rays vary with energy and must be determined if the detector is being used for absolute quantification of unknown material. Efficiency calibrations are performed during detector set-up, and on an as-needed basis, utilizing a mixed gamma-ray standard.
The standard for a given geometry, prepared and validated as previously described in Section 5.3, is analyzed using the Genie 2000 data acquisition procedure to determine detection efficiencies throughout the energy range of interest. After the detection efficiency has been determined for each calibration peak in the standard, a weighted, least-mean-squares fit is applied to a polynomial. The resultant polynomial is used to determine detector efficiencies for gamma rays within the span of the peak energies in the mixed gamma-ray
Procedure: ADS-2420 High-Purity Germanium Detector Gamma Pulse Height Analysis
Revision: 7 Page: 5 of 11
standard (typically, 59.5 keV from Am-241 through 1836 keV from Y-88). Periodically, the energy range of the calibration is extended using lower- or higher-energy emissions from additional NIST-traceable gamma standards. Newly established efficiencies are validated using a previously validated independent standard, when possible. Algorithms for the efficiency calibration are described in Section 6.0 References 3 and 4. Efficiency calibrations are evaluated at least annually. Radionuclide activities determined during the efficiency calibration should overlap the expected radionuclide activities for the standard within 3-sigma or have a deviation of less than 10%. The efficiency calibrations are documented in the systems’ measurement systems and equipment (MS&E) history files.
5.6 Quality Control Check Standard
1. Energy A check-source, prepared using a NIST-traceable standard, is counted as directed in Section 5.8. Three peaks with well-established energies (typically; 59.5 keV from Am-241, 661.6 keV from Cs-137, and 1333 keV from Co-60) are used to validate detector performance. The low-energy gamma detectors use different peaks to allow evaluation of the lower range of the energy spectrum (typically; 59.5 keV from Am-241, 88.0 keV from Cd-109, and 122.1 keV from Co-57). Results from each analysis of the check-source are evaluated to verify proper energy calibration. Gamma energies for the check standard should be within ± 0.5 keV of the true emission energy (investigate warning), and are required to be within ±1.0 keV of the true emission energy (action warning). Detectors are monitored with respect to the investigate warning, and controlled to the action warning. Any action warning requires immediate attention; no further analytical analyses can be performed until the event causing the action warning has been remedied. Any investigate warning requires attention; however, analytical analyses can be performed with an investigate warning.
Procedure: ADS-2420 High-Purity Germanium Detector Gamma Pulse Height Analysis
Revision: 7 Page: 6 of 11
A. Additional MC&A protocol:
(1) Any investigate warning shall be thoroughly evaluated to ensure there has not been an additional investigate warning within the past 2 evaluations. Violation of the 2-out-of-3 rule requires immediate action; no further analytical analyses can be performed until the event causing the 2-out-of-3 rule violation has been remedied. The system is validated following any corrective actions with three subsequent QA measurements which fall within the warning limits.
(2) If the detector has been deemed “out of control”, and the MC&A capability within AD is unavailable (i.e., no other detectors are working that can be used for MC&A determinations), the MBA custodian will be notified.
(3) Results from the energy calibration check standard are entered into control charts which are reviewed weekly.
(4) The result of the evaluations initiated by the QA protocol, and the subsequent corrective actions, will be documented in the logbook and in the MS&E history file.
2. Efficiency
A check-source, prepared using a NIST-traceable standard, is counted as directed in Section 5.8. Three peaks with acceptable counting statistics and statistical uncertainties (typically; Am-241, Cs-137, and Co-60) are used to validate detector performance. The low-energy gamma detectors use different peaks to allow evaluation of the working range of the detector (typically; Am-241, Cd-109, and Co-57). Historically, the activity/efficiency control limits have been set by a combination of the gamma-ray standard uncertainties from the NIST certificate, the uncertainties from the polynomial fit for a gamma ray of the energy in question, the uncertainties of the gamma branching ratio for the isotope generating the tracked gamma ray, as well as the counting statistics for the gamma ray in the ~15 minute count of the check standard. This approach is still applicable for detectors not carrying an MC&A pedigree. As a result of an effort to update the MC&A qualifications of the SRNL Analytical Development gamma method, SRNL’s Statistical Consulting Section was contracted to analyze the performance of 6 of SRNL AD gamma spectrometers’ historical check standard results. The results of this analysis are available in Reference 8. Results from a similar study on two additional detectors are available in Reference 10. Control limits for
Procedure: ADS-2420 High-Purity Germanium Detector Gamma Pulse Height Analysis
Revision: 7 Page: 7 of 11
MC&A-approved detectors are established using the total uncertainties as determined by the statistical analysis. The control limits are centered on the values of the check standards adjusted for any measured deviations in the efficiency calibration polynomial fit’s calculated efficiency versus its measured efficiency. Results from each analysis of the check-source standard are evaluated to verify efficiency calibration. Detectors are monitored with respect to the investigate warning, and controlled to the action warning. Any action warning requires immediate attention; no further analytical analyses can be performed until the event causing the action warning has been remedied. Any investigate warning requires attention; however, analytical analyses can be performed with an investigate warning.
A. Additional MC&A protocol:
(1) Any investigate warning shall be thoroughly evaluated to ensure there has not been an additional investigate warning within the past 2 evaluations. Violation of the 2-out-of-3 rule requires immediate action; no further analytical analyses can be performed until the event causing the 2-out-of-3 rule violation has been remedied. The system is validated following any corrective actions with three subsequent QA measurements which fall within the warning limits.
(2) If the detector has been deemed “out of control”, and the MC&A capability within AD is unavailable (i.e., no other detectors are working that can be used for MC&A determinations), the MBA custodian will be notified.
(3) Results from the check standard are entered into control charts which are reviewed weekly.
(4) The result of the evaluations initiated by the QA protocol, and the subsequent corrective actions, will be documented in the logbook or in the MS&E history file.
3. Full Width at Half-Maximum As a further control of detector stability, the resolution of the detector is also monitored for any sudden changes. The full-width at half maximum (FWHM) of one of the peaks utilized in the system verification is measured with each check standard count. The FWHM shall be within 0.3 keV of the average value for that peak. Results from each analysis of the check-source standard are evaluated to verify the FWHM. Detectors are monitored with respect to the investigate warning, and controlled to the action warning. Any action warning
Procedure: ADS-2420 High-Purity Germanium Detector Gamma Pulse Height Analysis
Revision: 7 Page: 8 of 11
requires immediate attention; no further analytical analyses can be performed until the event causing the action warning has been remedied. Any investigate warning requires attention; however, analytical analyses can be performed with an investigate warning. The result of the evaluations initiated by the QA protocol, and the subsequent corrective actions, will be documented in the logbook or in the MS&E history file.
5.7 Quality Control Background A background spectrum will be collected for each detector as determined by the Analytical Task Supervisor, but at least monthly. In the absence of any material, the spectrum should be accumulated over a period of time sufficient to properly determine a true background spectrum for the energy region normally used for sample analyses. Preferably the spectrum will be acquired for 200,000 seconds. The minimum acquisition time is 50,000 seconds, unless otherwise directed by the Analytical Task Supervisor.
5.8 Analysis
1. QA Check with Standard
A. The QA check-source standard shall be analyzed each day samples are analyzed, except when the detector is located in a functioning robotic sample changer or when a sample must be counted for durations which preclude daily QC counts. The QC standard results must be evaluated for acceptability (see Section 5.6) prior to sample analysis.
B. If the robotic sample changer is used for loading and counting samples during unmanned shifts (i.e. weekend), the QC check-source measurement from the date the samples are started and the next QC check-source measurement after the sample counting is completed are evaluated for acceptability (see Section 5.6).
C. If sample counting durations preclude the ability to perform a daily QC check (i.e. 48-hour counts), the QC check-source measurement from the date the sample count is started and the next QC check-source measurement after the sample count is completed are evaluated for acceptability (see Section 5.6).
D. If the evaluation of a QC check-source result indicates that a measurement is outside acceptable limits, corrective actions must be implemented (see Section 5.6), and all sample results reported since the last verification shall be evaluated by the Analytical Task Supervisor. Based on the outcome of the evaluation, the acceptability and/or validity of the sample results shall be determined by the Analytical Task Supervisor. Any corrective
Procedure: ADS-2420 High-Purity Germanium Detector Gamma Pulse Height Analysis
Revision: 7 Page: 9 of 11
actions and the reporting decision on suspect sample results shall be documented in notebooks.
2. Liquid Samples
A. Prepare sample in geometry and dilution as directed by Analytical Task Supervisor. Samples requiring extensive manipulation in a radiological containment unit will have batch blanks prepared along with the sample. However, samples undergoing simple dilution or transfer may not require batch blanks.
B. Record preparation information.
C. Have samples cleared to be transported to final counting facility.
D. Count sample on detector as directed by Analytical Task Supervisor. Ensure detector has had QA successfully completed prior to counting the sample.
E. Record file ID, date, time, detector, geometry, and initials in log book.
F. After data has been reviewed, enter results into LIMS as directed by Analytical Task Supervisor
3. Solid Samples
A. Prepare sample in geometry as directed by Analytical Task Supervisor. Samples requiring extensive manipulation in a radiological containment unit will have batch blanks prepared along with the sample. However, samples undergoing simple transfer may not require batch blanks.
B. Record preparation information.
C. Have samples cleared to be transported to final counting facility.
D. Count sample on detector as directed by Analytical Task Supervisor. Ensure detector has had QA successfully completed prior to counting the sample.
E. Record file ID, date, time, detector, geometry, and initials in log book.
F. After data has been reviewed, enter results into LIMS as directed by Analytical Task Supervisor.
Procedure: ADS-2420 High-Purity Germanium Detector Gamma Pulse Height Analysis
Revision: 7 Page: 10 of 11
4. Data Control
Preparation data are recorded on the preparation data sheet and recorded in the Radiochemistry Laboratory notebook. The final data packet, containing the preparation sheet, computer printouts, and calculations, are stored in the counting room data notebook and associated binders.
6.0 REFERENCES
1. Nuclear and Radiochemistry, G. Friedlander, J.W. Kennedy, E.S. Macias, J.M. Miller, 3rd Ed., pp. 243-286.
2. ANSI N42.14-1999. American National Standard Calibration and Use of Germanium Spectrometers for Measurement of Gamma-Ray Emission Rates of Radionuclides.
3. Genie 2000 Operations Manual, Canberra Industries, Inc., 2002.
4. Genie 2000 Customization Tools Manual, Canberra Industries, Inc., 2002.
5. Changer Labs Operations and Set-up manual, Westinghouse Savannah River Technical Center, Changer Labs 1996.
6. Manual 1Q, 12-1, Control of Measuring and Testing Equipment.
7. Manual 1Q, 2-7, QA Program Requirements for Analytical Measurement Systems.
8. SRNL-ACS-2007-00002, Statistical Uncertainty of SRNL’s Gamma Detectors.
9. SRNL-ADD-2007-00216, Recommendation for Update of SRNL’s Analytical Development Gamma Pulse Height Analysis 14Q302 Qualification
10. SRNL-STI-2012-00211, Statistical Uncertainty Limits for SRNL’s SPC1 and SPC2 Gamma Detectors.
7.0 RECORDS Data are recorded and maintained as described in Data Control section above.
The AD LIMS is used as the primary data storage location.
Procedure: ADS-2420 High-Purity Germanium Detector Gamma Pulse Height Analysis
Revision: 7 Page: 11 of 11
8.0 ATTACHMENTS
None
SAVANNAH RIVER NATIONAL LABORATORY Manual: L16.1 ANALYTICAL DEVELOPMENT Procedure: ADS-2424 ANALYTICAL OPERATING PROCEDURES Revision: 7 Page: 1 of 10 TECHNICAL REFERENCE Effective Date: 8/20/2008 Gross Alpha/Beta Determination Approved by: by Liquid Scintillation Counting (U) Approval on File ADS Manager MAJOR REWRITE 1.0 PURPOSE
This method is used to screen a variety of sample matrices for both alpha and beta activities by liquid scintillation counting. This procedure is an approved method for determining Measurement Control and Accountability (MC&A) values for SRNL. All required QA/QC are performed whether the sample is used for accountability purposes or not.
2.0 SCOPE
2.1 Applications of this method may include initial screening of:
• Environmental samples (soils, etc.). • “Clean” samples which have never been in a Radiological
Controlled Area (RCA).
• Samples which have been in RCAs, but which are not expected to be contaminated.
• Samples which may contain small quantities of radionuclides,
such as the Low Level Residue Tanks at 773-A.
• High activity samples which may or may not contain fission products.
2.2 The data produced by the method may be used for a variety of
applications such as:
• Providing adequate information concerning the activity within samples, and thus determine if further, more detailed analyses are required.
SAVANNAH RIVER NATIONAL LABORATORY Manual: L16.1 ANALYTICAL DEVELOPMENT Procedure: ADS-2424 ANALYTICAL OPERATING PROCEDURES Revision: 7 Page: 2 of 10 TECHNICAL REFERENCE Effective Date: 8/20/2008
• Ensuring that the Department of Transportation regulations concerning the transport of radioactive materials are not exceeded.
• Accountability measurements for gross alpha activity
2.3 Gross screening analyses are not expected to be as accurate nor as
precise as more detailed radiochemical separations. Rather, they are intended to provide rapid information associated with a particular action level with minimal chemical preparation. Additionally, these types of analyses are intended to give estimates rather than absolute activity measurements unless they are implemented with the use of NIST-traceable standards.
2.4 If a sample is analyzed by this method and is found to contain
significant quantities of alpha and/or beta-gamma activity, then the sample may be analyzed by additional ADS procedures. “Significant” will usually be determined by the customer, depending on how the data are to be used.
2.5 Responsibilities
2.5.1 Analysts are responsible for: • Reading, understanding and following this procedure. • Calling to the attention of the Task Supervisor any part of
the procedure that requires revision or that they believe to be unsafe.
2.5.2 Task Supervisor/Cognizant Technical Function is responsible
for: • Maintaining this procedure. • Providing technical guidance. • Providing additional directions, when needed, through the
use of R&D directions.
SAVANNAH RIVER NATIONAL LABORATORY Manual: L16.1 ANALYTICAL DEVELOPMENT Procedure: ADS-2424 ANALYTICAL OPERATING PROCEDURES Revision: 7 Page: 3 of 10 TECHNICAL REFERENCE Effective Date: 8/20/2008 3.0 PRECAUTIONS/LIMITATIONS
3.1 Safety
3.1.1 Follow L1, 2.32 Radiological Work Practices and 8Q Laboratory Safety guidelines
3.1.2 Read understand, and follow applicable Job Hazard Analyses
(JHAs) in Conduct of R&D packet. 3.1.3 The instrument contains a small sealed Ba-133 source
3.2 General Limitations
3.2.1 Chemical quenching and/or color quenching of the light output
can reduce detection efficiency. This can be prevented with the sample preparation or accounted for using a quench curve.
3.2.2 The presence of static electricity within the system can cause
erroneous results. This is monitored via duplicate counts. 3.2.3 High-energy beta emissions can be misidentified as alpha
emissions, biasing alpha results high and beta results low. An added standard is used to determine the degree of spill-over when quantification is needed.
3.2.4 High activity samples can cause pulse pile-up and high dead
time on the instrument, which would bias reported results low.
3.2.5 A large beta/alpha activity ratio can lead to erroneously high alpha results (due to spillover). Results are reported as upper limits in this case.
4.0 PREREQUSITE ACTIONS
N/A
5.0 PERFORMANCE
SAVANNAH RIVER NATIONAL LABORATORY Manual: L16.1 ANALYTICAL DEVELOPMENT Procedure: ADS-2424 ANALYTICAL OPERATING PROCEDURES Revision: 7 Page: 4 of 10 TECHNICAL REFERENCE Effective Date: 8/20/2008
5.1 Description
The method may be used for nearly all aqueous and organic solutions, provided they do not react with and are miscible with the cocktail used for analysis. Generally, Ultima Gold AB is used since it is specifically formulated for alpha/beta discrimination, and it is the best choice for samples dissolved in mineral acids. Other cocktails may be used at the discretion of the Task Supervisor/CTF. Packard instruments automatically correct for quenching and many other interference problems commonly associated with liquid scintillation counting. The Gross Alpha/Beta counting protocol, as utilized in this laboratory, is designed to provide a conservative screening for gross beta (including tritium) and gross alpha activities.
5.2 Equipment
5.2.1 Packard Instruments 2550AB, 2750AB and 3150AB TriCarb Liquid Scintillation Counters are presently being used. These instruments electronically separate alpha and beta counts into two separate energy spectra based on differences in pulse shapes.
5.2.2 Calibrated pipets and balances 5.2.3 20 mL polyethylene liquid scintillation vials, Packard No.
6008117 or equivalent. 5.2.4 6 mL polyethylene liquid scintillation (“pony”) vials, Packard
No. 6000292 or equivalent.
5.3 Reagents
5.3.1 Ultima Gold AB - used as delivered from the manufacturer. 5.3.2 Distilled Water - as delivered through the Building 773-A
distilled water system. 5.3.3 Nitric Acid
5.4 Standards
SAVANNAH RIVER NATIONAL LABORATORY Manual: L16.1 ANALYTICAL DEVELOPMENT Procedure: ADS-2424 ANALYTICAL OPERATING PROCEDURES Revision: 7 Page: 5 of 10 TECHNICAL REFERENCE Effective Date: 8/20/2008
5.4.1 Standards utilized for establishing and validating efficiency
calibrations, for determining the optimum discriminator setting, and for generating quench curves, are NIST-traceable.
5.4.2 The Packard Tri-Carb Liquid Scintillation Counters use three
vendor-supplied sealed sources in glass counting vials for routine calibrations and diagnostics. These include 3H, 14C, and a background standard, which are counted every day that samples are analyzed.
5.4.3 Standards are diluted gravimetrically utilizing standard
industry practice. Balances utilized for the preparation are M&TE (measuring and test equipment) and, as such, comply with the requirements set forth by Manual 1Q, 12-1.
5.4.4 Documentation of standard preparation, including M&TE
identification, is maintained in a logbook and is referenced in the calibration spreadsheet.
5.5 Efficiency Calibrations
5.5.1 The alpha detection efficiencies for the liquid scintillation counters were determined using NIST (National Institute of Standards and Technology) -traceable Pu-238 standard and later validated using an independent source of Pu.
5.5.2 A 70% beta detection efficiency is utilized for beta activity
outside the tritium region for gross screening analyses. This is an average of the experimental efficiencies typically observed for medium- to high-energy beta emissions.
5.5.3 A quench curve is utilized for tritium detection efficiency due to
its low energy, and thus, susceptibility to quench. This quench curve is validated yearly.
5.6 Routine System Verification
SAVANNAH RIVER NATIONAL LABORATORY Manual: L16.1 ANALYTICAL DEVELOPMENT Procedure: ADS-2424 ANALYTICAL OPERATING PROCEDURES Revision: 7 Page: 6 of 10 TECHNICAL REFERENCE Effective Date: 8/20/2008
5.6.1 As previously mentioned, the Packard Tri-Carb Liquid
Scintillation Counters use three sealed sources in glass counting vials for routine calibrations and diagnostics. These are counted every day that samples are analyzed.
5.6.2 For the 3H and 14C efficiency protocols, the instrument
establishes baseline efficiencies from the mean of the first 5 measurements stored for that parameter. If a change in the efficiency for that parameter is greater than 3% of the mean observed, the software will generate a warning flag.
5.6.3 Background baselines for 3H and 14C are also established from
the first 5 measurements. If the background increases to a value greater than 4 standard deviations above the baseline, a warning flag is generated.
5.6.4 Any flags that arise from these routine verifications are
investigated prior to further sample analysis.
5.7 Alpha Efficiency Validation and Control Charting
5.7.1 Due to site Material Control and Accountability (MC&A) requirements, additional Quality Control measures are performed daily.
5.7.2 A NIST-traceable 238Pu standard is counted daily as a check
source to validate the efficiency calibration. The results of this daily check standard are control charted weekly.
5.7.3 The counters are monitored with respect to the warning limit
(2σ) and controlled to the action limit (3σ). The uncertainties were determined by the Statistical Consulting Section as described in Reference 7.8.
5.7.4 Any action limit requires immediate attention; no further
analyses can be performed until the event causing the action limit has been remedied.
SAVANNAH RIVER NATIONAL LABORATORY Manual: L16.1 ANALYTICAL DEVELOPMENT Procedure: ADS-2424 ANALYTICAL OPERATING PROCEDURES Revision: 7 Page: 7 of 10 TECHNICAL REFERENCE Effective Date: 8/20/2008
5.7.5 Any warning limit requires attention; however, analyses can be performed with a single warning limit. It should be noted that any warning limit shall be thoroughly evaluated to ensure there has not been an additional warning limit within the past 3 evaluations. Violation of the 2-out-of-3 rule requires immediate action; no further analytical analyses can be performed until the event causing the 2-out-of-3 rule has been remedied.
5.7.6 The system is validated following any corrective actions with
three subsequent QC measurements which fall within the warning limits using the daily check-source standard. The counter is considered back in control if one of the three responses falls on the opposite side of the centerline from the other two or at least equals the target centerline value. The counter will be recalibrated if the results of the three measurements do not indicate the counter is back in control. The result of the evaluation and the recalibration (if necessary) will be documented in the logbook and in the MS&E history file.
5.7.7 The system is reviewed for any non-random pattern in the data.
Specifically, it is controlled to the eight runs rule using the 238Pu standard results. The counter is considered to be in an adverse condition if a pattern of eight consecutive points for the 238Pu standard lie on the same side of the control chart center line.
5.8 Accuracy
In order to evaluate the accuracy of the liquid scintillation counters, a dilution of the Analytical Laboratory Department (ALD)’s Coulometry Lab plutonium standard solution was analyzed 15 times on each counter. Results for both counters overlapped the value of the ALD standard within the 95% confidence interval.
5.9 Sample Preparation
Due to the variety of sample types (soil leachates, filters, and residue tank solutions) that may be analyzed using gross alpha-beta, sample preparation details will vary with sample type at the discretion of the Task Supervisor.
SAVANNAH RIVER NATIONAL LABORATORY Manual: L16.1 ANALYTICAL DEVELOPMENT Procedure: ADS-2424 ANALYTICAL OPERATING PROCEDURES Revision: 7 Page: 8 of 10 TECHNICAL REFERENCE Effective Date: 8/20/2008
5.9.1 Using the recommendations of the CTF, add cocktail to the appropriate LS vial.
5.9.2 Place vial(s) on a clean surface in the hood or radiobench to
avoid contamination on the outside of the vial. 5.9.3 Pipette the volume of sample recommended by the CTF into the
LS vial. If the sample is too dark, reduce the aliquot size to one-half of the initially recommended volume. Cap the vial tightly.
5.9.4 If a pony vial is used, insert the sealed pony vial inside the large
scintillation vial. Keep the outer vial clean. Cap the outer vial tightly.
5.9.5 Label the outer lid with sample ID. Do not write on the sides of
the vials. Shake the sealed vials thoroughly to ensure that the sample and cocktail are mixed well.
NOTE: Change plastic gloves to avoid contaminating the outside of vial(s) when capping.
5.9.6 Submit the vial(s) to the ADS Counting Room (773-A, B-145
after having them cleared by RCO) for analysis on the Packard instruments.
5.10 Counting
5.10.1 Load the samples into a sample cassette, with the appropriate
blank in the first position. The counting protocol to be selected depends on which counter is to be used, and on how the sample was prepared. Select the protocol number as instructed by the CTF.
5.10.2 The counting protocols may be edited to change the counting
parameters (i.e. counting time) only under direct supervision of the CTF. See the operation manuals for details.
5.10.3 Push the slide tab (on the left side of the cassette) to the left and
place the cassette(s) in the sample changer magazine. Start the instrument.
SAVANNAH RIVER NATIONAL LABORATORY Manual: L16.1 ANALYTICAL DEVELOPMENT Procedure: ADS-2424 ANALYTICAL OPERATING PROCEDURES Revision: 7 Page: 9 of 10 TECHNICAL REFERENCE Effective Date: 8/20/2008
5.10.4 After the samples have been analyzed and the results approved, all vials except those marked with special hazard dots should be emptied down the high activity drain. The vials themselves should be put in the solid radioactive waste. Vials marked with special hazard dots are treated according to specified guidelines.
5.11 Background
Check the count rate of the batch blank and ensure that levels are acceptable to the CTF. Large changes in blank counts could be a sign that further investigation or additional counting is required.
5.12 DPM Calculations The gross alpha and gross beta dpm values are listed on the printout. Multiply the dpm value by the appropriate dilution factor to obtain the dpm/unit of interest (ml, g, smear, etc.) value for the sample.
DPM/Unit of Interest = (DPM) (DF)
5.13 LLD Calculation
If net activity is not detected, then Lower Limits of Detection (LLD’s) must be calculated for the gross alpha and/or gross beta activities. The total background counts for any given region of interest are used in the following equation to calculate an LLD value:
.
LLD (DPM) = )count time)(efficiency(
regionin counts background total65.471.2 +
The LLD value is then adjusted for the dilution factor per the equation in 5.12
SAVANNAH RIVER NATIONAL LABORATORY Manual: L16.1 ANALYTICAL DEVELOPMENT Procedure: ADS-2424 ANALYTICAL OPERATING PROCEDURES Revision: 7 Page: 10 of 10 TECHNICAL REFERENCE Effective Date: 8/20/2008 6.0 RECORDS
All prep and analysis data is recorded and maintained in the laboratory notebooks. The final data packet, containing the prep sheet, computer printouts, and calculations are stored in the counting room data notebook and associated binders. The ADS LIM’s is used as the primary data storage location.
7.0 REFERENCES
7.1 "Liquid Scintillation Analysis -Science and Technology," Publication No. 169-3052, Packard Instrument Co., Inc. 1987.
7.2 Tri-Carb Series Liquid Scintillation Analyzers, Model 2250CA Operation Manual, Publication No. 169-3094, Packard Instrument Co., Inc. 1987.
7.3 Tri-Carb Series Liquid Scintillation Analyzers, Model 2550TR Operation Manual, Publication No. 169-4044, Packard Instrument Co., Inc. 1990
7.4 SRNLProcedure Manual L1, 2.32 “Radiological Work Practices.” 7.5 SRNL-ADD-2007-00584, Recommendation for Update of SRNL’s
Analytical Developments Liquid Scintillation Analysis 14Q302 Qualification, December 20, 2007.
7.6 Manual 1Q, 2-7, Revision 6, QA Program Requirements for Analytical Measurement Systems.
7.7 Manual 1Q, 12-1, Revision 11, Control of Measuring and Test Equipment.
7.8 SRNL-SCS-2008-00004, Statistical Uncertainty of SRNL’s LSC Counters, January 14, 2008.
8.0 ATTACHMENTS None
Analytical Development Section Analytical Operating Procedures Volume 2
Manual: L16.1Procedure: ADS-2444
Revision: 6Tritium in Environmental Samples – A Distillation Procedure
Effective Date: 08/09/11Type-Category: Technical Page: 1 of 8
Electronic Approval on File Author/ Task Supervisor C. C. DiPrete Peer Reviewer D. P. DiPrete Analytical and Radiochemistry Research Group Manager R. H. Young ADS Procedures Coordinator M. S. Hanks
Procedure: ADS-2444Tritium in Environmental Samples – A Distillation Procedure
Revision: 6Page: 2 of 8
1.0 INTRODUCTION
1.1 Purpose This procedure provides a description of the distillation method utilized for the
separation of tritium from a wide variety of matrices. The separated material contains the tritium originally present in the matrix without many of the interfering radionuclides. The separated material is quantified utilizing liquid scintillation analysis in accordance with L16.1, ADS-2424.
1.2 Scope This procedure is designed to be generic due to the wide variety of matrices for which it is used. Sample matrix materials vary widely and include, but are not limited to, high-and low-activity tank liquids, high- and low-activity tank solids, environmental solids, environmental liquids, and process material.
This procedure, along with R&D directions written for each batch of samples, describes the steps of the analysis. The counting and quantification steps are described in procedures L16.1, ADS-2424.
2.0 GENERAL INFORMATION
2.1 Background Tritium is a radioactive isotope of hydrogen. It decays via emission of a beta particle with a maximum energy of 18 keV, an average energy of 5.7 keV, and a half-life of 12.33 years. Tritium in liquid or solid samples can not be easily determined quantitatively by any kind of nondestructive analysis due to its weak beta energy. Therefore, it must be prepared for analysis by separation from the matrix. Following separation, it can be measured successfully using liquid scintillation analysis. Distillation is a common method for isolating tritium from matrix and interfering nuclides. The tritium-containing material must be in liquid form prior to the distillation. Solid samples undergo a dissolution/leach procedure to incorporate the tritium in a liquid phase prior to distillation. The tritium distillation procedure utilizes the volatile nature of tritium to separate it from the matrix which may contain interfering radionuclides and chemicals. The tritium-containing fraction is captured as distillate, which is then prepared for quantification by liquid scintillation analysis. The tritium distillation method may be applied to a variety of matrices, including but not limited to water, high-and low-activity tank liquids, high- and low-activity tank solids, environmental solids, environmental liquids, and process material.
Procedure: ADS-2444Tritium in Environmental Samples – A Distillation Procedure
Revision: 6Page: 3 of 8
Since distillation separates water from the matrix and does not oxidize the sample, the method does not yield results for organically-bound tritium unless a separate oxidation procedure, such as wet ashing, is also applied.
2.2 Responsibilities 1. Analysts are responsible for:
Reading, understanding and following this procedure. Calling to the attention of the Task Supervisor any part of the procedure that requires revision or that they believe to be unsafe.
2. Task Supervisor is responsible for:
Maintaining this procedure. Providing technical guidance.
3.0 PRECAUTIONS AND LIMITATIONS
3.1 Safety
1. Follow L1, 2.32 Radiological Work Practices and 8Q Laboratory Safety Guidelines.
2. Read, understand and follow applicable Job Hazard Analyses (JHAs) in the Conduct of R&D packet.
4.0 PREREQUISITES
None
5.0 PROCEDURE
5.1 Description of Method
Tritium is separated from interfering radionuclides using a distillation procedure. This procedure is designed to be generic due to the wide variety of matrices for which it is used. This procedure, along with R&D Directions written for each batch of samples, describes distillation portion of the analysis. The counting steps are described in procedures L16.1, ADS-2424.
5.2 Data Quality
1. Interferences Volatile organic compounds may co-distill during this distillation procedure. While such compounds may cause chemical quenching, the Packard
Procedure: ADS-2444Tritium in Environmental Samples – A Distillation Procedure
Revision: 6Page: 4 of 8
Liquid Scintillation Counting (LSC) instruments automatically determine quenching and its impact on counting efficiency for every sample.
If volatile radionuclides other than tritium are present, they may interfere and result in a high bias. The presence of such radionuclides may be determined from the beta spectra collected by the Packard LSC instruments. If significant interferences are present, the Task Supervisor may suggest additional sample purification steps.
Luminescence effects can increase count rates in the tritium window. The LSC instruments automatically correct for luminescence effects; however, if luminescence corrections are large, uncertainty in low-level tritium values can be significant. Recounting of the sample often alleviates luminescence problems.
2. Detection Limit Ranges
Minimum Detectable Activities (MDAs, Ref. 2) depend on the length of count, counter background, detector efficiencies and the dilution/concentration factor. Analyses are customized to meet the target MDAs prescribed by the customer’s data quality objectives. Some factors, such as limited sample size, sample dose rate, activity levels of the sample, and decontamination factors required to isolate the isotope of interest can impact the ability of the laboratory to meet requested detection limits.
3. Quality Control The quality assurance and quality control samples (blanks, lab control spikes, duplicates, etc.) that are utilized vary depending upon the customer’s data quality objectives. Blanks are generally part of each batch. The blank activity should be less than 10% of the sample activity. The recovery of a blank spike, if utilized, should be between 75-125% - Duplicates, if analyzed, should overlap within 3. If QC indicators fall outside of these ranges, the Task Supervisor must determine whether the data is fit for release with additional scrutiny, qualifiers, or alternate calculations.
5.3 Equipment
NOTE: This is a list of many types of equipment used. It will not be exhaustive since the analysis is fined-tuned for each batch of samples analyzed.
Distillation Apparatus (s-tube, erlenmeyer flask, etc) Calibrated M&TE pipettes Calibrated M&TE balances Hot plates
Procedure: ADS-2444Tritium in Environmental Samples – A Distillation Procedure
Revision: 6Page: 5 of 8
Scintillation counting vials: 20-mL (nominal) polyethylene with plastic caps
Liquid scintillation counter. Packard Model 2550 AB or Packard Model 2250, or equivalent. All of the detectors are measurement systems and equipment (MS&E) and, as such, comply with the requirements set forth by Manual 1Q, 2-7.
5.4 Reagents
NOTE: This a list of many of the reagents used. It will not be exhaustive since the separation is fined-tuned for each batch of samples analyzed.
Liquid scintillation cocktail: Packard Instrument Co. Ultima Gold AB Distilled Water – as delivered through the Building 773-A distilled
water system Nitric Acid - various
5.5 Standards
Standards utilized for recovery determination, establishing and validating efficiency calibrations, and generating quench curves, are NIST-traceable. Standards are decay corrected, as needed. Standards which are not assigned expiration dates from the vendor are not given expiration dates, since they can be decay corrected. Standards are diluted gravimetrically utilizing standard industry practice. Balances utilized for the preparation are M&TE (measuring and test equipment) and, as such, comply with the requirements set forth by Manual 1Q, 12-1. Documentation of standard preparation, including M&TE identification, is maintained in a logbook and is referenced in the calibration spreadsheet.
5.6 Analyses
Samples are prepared as instructed by the Task Supervisor in the R&D directions. The R&D directions must be used along with the procedure to understand the full analysis. A very generic procedure, indicating the types of activities performed during the distillation process, follows.
Procedure: ADS-2444Tritium in Environmental Samples – A Distillation Procedure
Revision: 6Page: 6 of 8
1. Solid Samples
A. Fill an appropriate vessel with the sample to be distilled. Weigh and record the sample weight (vessel may be weighed or tared prior to obtaining sample weight). Add a sufficient volume of appropriate solvent (water, dilute nitric acid, etc.) and allow to set while closed at least 4 hours. Task Supervisor will provide specific guidance.
Leachate solutions from solid samples can also be analyzed for tritium following the procedure for solutions provided below. If a sample is to be spiked, follow Task Supervisor’s guidance.
B. Set up the distillation apparatus in accordance with the Task Supervisor’s instructions. Place S-shaped tube into Erlenmeyer flask using a rubber
adapter.
Place apparatus on a hot plate.
C. Gradually raise the temperature on the hot plate, until the solution begins to boil.
D. Once a sufficient quantity of distillate has been collected, turn off heat and allow system to cool. Collect at least 2 mL of distillate, if possible.
E. Pipette an aliquot of distillate into an LSC counting vial. A volume of 2 mL is preferable but less may be used. Add enough LSC cocktail to the vial to bring the total volume to 19-20 mL. Record the volume of distillate added to the scintillation vial. Cap the vial tightly and shake.
F. Label the cap of the scintillation vial and submit to the counting facility for liquid scintillation counting.
2. Liquid Samples:
A. Add an appropriate amount of liquid (approximately 10 mL) to the distillation apparatus. Record the volume of sample added. Volumes used may be altered at discretion of Task Supervisor. If a sample is to be spiked, follow Task Supervisor’s guidance.
Procedure: ADS-2444Tritium in Environmental Samples – A Distillation Procedure
Revision: 6Page: 7 of 8
B. Set up the distillation apparatus in accordance with the Task Supervisor’s instructions.
Place S-shaped tube into Erlenmeyer flask using a rubber
adapter.
Place apparatus on a hot plate.
C. Gradually raise the temperature on the hot plate, until the solution begins to boil.
D. Once a sufficient quantity of distillate has been collected, turn off heat and allow system to cool. Collect at least 2 mL of distillate, if possible.
E. Pipette an aliquot of distillate into an LSC counting vial. A volume of 2 mL is preferable but less may be used. Add enough LSC cocktail to the vial to bring the total volume to 19-20 mL. Record the volume of distillate added to the scintillation vial. Cap the vial tightly and shake.
F. Label the cap of the scintillation vial and submit to the counting facility for liquid scintillation counting.
5.7 Calculations
Manual L16.1, Procedure ADS-2424 describes calculations for LSC counting.
Sample preparation data are recorded on the preparation data sheet and recorded in the Radiochemisry Laboratory notebook.
All calculations are completed by the Task Supervisor or a trained designee using spreadsheets which have been validated.
5.8 Data Control
Preparation data are recorded on the preparation data sheet and recorded in the Radiochemistry Laboratory notebook.
The final data packet, containing the prep sheet, computer printouts, and calculations are stored in the counting room data notebook and associated binders.
6.0 REFERENCES 1. ADS Manual L16.1, Procedure ADS-2424, ”Gross Alpha/Beta Determination
by Liquid Scintillation Counting.”
Procedure: ADS-2444Tritium in Environmental Samples – A Distillation Procedure
Revision: 6Page: 8 of 8
2. Currie, L. A., Limits for Qualitative Detection and Quantitative Determination, Analytical Chemistry 40, 586 (1968).
3. Peters, R.J. and G.H. Brooks, Tritium in Environmental Matrices - Distillation
Procedure, LANL Method # ER210. 4. EG&G Mound, Sample Preparation for Analysis of Tritium by Liquid
Scintillation Counting, Method # 1162. 5. Procedure Manual L1, 2.32, Radiological Work Practices.
7.0 RECORDS Data are recorded and maintained as described in Data Control section above. The ADS LIMS is used as the primary data storage location.
8.0 ATTACHMENTS
None
SAVANNAH RIVER NATIONAL LABORATORY Manual: L16.1 ANALYTICAL DEVELOPMENT Procedure: ADS-2445 ANALYTICAL OPERATING PROCEDURES Revision: 4 Page: 1 of 6 TECHNICAL REFERENCE Effective Date: 3/18/09
Technetium-99 by Extraction Approved by: Chromatography
APPROVAL ON FILE AD Manager
MAJOR REVISION 1.0 PURPOSE This procedure describes a method to separate technetium-99 (Tc-99) by
extraction chromatography and subsequent activity measurements by gamma-ray spectrometry and liquid scintillation counting.
2.0 SCOPE
The procedure describes the general method for separating Tc-99 from interfering nuclides, and analyzing the separated sample for Tc-99 content. Tc-99m is added to each sample as a tracer. Samples spiked with National Institute of Standards and Technology (NIST) traceable Tc-99 are also processed and counted. Gamma-PHA (Pulse Height Analysis) is used for tracer yield determination and liquid scintillation counting (LSC) is used for Tc-99 determinations. 2.1 Definitions and Abbreviations
JHA Job Hazards Analysis HAP Hazards Assessment Package LSC Liquid Scintillation Counting RWP Radiological Work Permit
2.2 Responsibilities
Analysts are responsible for: • Reading, understanding and following this procedure, • Calling to the attention of the Task Supervisor any part of the
procedure that requires revision or that they believe to be unsafe, • Reading, understanding, and signing applicable RWPs, JHAs, and
HAPs (or equivalent) prior to independent work.
SAVANNAH RIVER NATIONAL LABORATORY Manual: L16.1 ANALYTICAL DEVELOPMENT Procedure: ADS-2445 ANALYTICAL OPERATING PROCEDURES Revision: 4 Page: 2 of 6 TECHNICAL REFERENCE Effective Date: 3/18/09
Task Supervisor is responsible for: • Maintaining this procedure, • Providing technical guidance as needed, • Providing additional directions, when needed, through the use of
R&D directions. 3.0 PRECAUTIONS/LIMITATIONS
3.1 Safety
3.1.1 Follow L1, 2.32 Radiological Work Practices and 8Q Laboratory Safety Guidelines
3.1.2 Read, understand, and follow applicable Job Hazard Analyses
(JHAs) in Conduct of R&D packet. Specifically, be aware for the additional precautions when working with flammable solvents.
4.0 PREREQUISITE ACTIONS
None 5.0 PERFORMANCE
5.1 General Information
5.1.1 Description
Tc-99 is separated from samples using a variety of different approaches dependent upon the sample type and customer needs. Ultimately, the sample is separated using Eichrom TEVA resin and or TEVA disks (or equivalent) prior to liquid scintillation counting. After removal of the pertechnetate ion (TcO4
-), Tc-99 is measured by liquid scintillation counting after adding the resin or filter disk directly to liquid scintillation cocktail. Each sample is analyzed with the short-lived gamma emitter, Tc-99m, as a tracer.
This method is a rapid, reliable method for measurement of Tc-
99 in a variety of samples that is more cost-effective and efficient than traditional anion exchange, solvent extraction or precipitation techniques.
SAVANNAH RIVER NATIONAL LABORATORY Manual: L16.1 ANALYTICAL DEVELOPMENT Procedure: ADS-2445 ANALYTICAL OPERATING PROCEDURES Revision: 4 Page: 3 of 6 TECHNICAL REFERENCE Effective Date: 3/18/09
5.1.2 General Limitations
Due to the relatively short half-life of Tc-99m (6.01 hr), the method requires closer attention to measurement times than most other samples measured at ADS. Also due to the relatively short Tc-99m half-life, good communication and close coordination are needed between analysts performing the separations and Counting Room personnel. The method used separates Tc in the pertechnetate form (TcO4-). If total Tc-99 measurement is desired, steps must be taken to ensure all available Tc-99 is converted to TcO4-.
5.1.3 Interferences
Organic matter present in the sample can interfere by
quenching during liquid scintillation counting. While the Packard liquid scintillation counters automatically correct for most quenching, it may be desirable to minimize quenching by using a prefilter column (such as Eichrom Prefilter or XAD-7 resin) to remove organics from the sample.
Some samples having high initial actinide concentrations have
shown retention of some alpha activity on the TEVA columns. Therefore, care must be used when evaluating the analysis protocol and associated data.
Most radionuclides that undergo beta emission (including C-14,
P-32, S-35, and Sr-90) and materials that quench scintillation counting are effectively removed using Eichrom TEVA resin. Tritium may sometimes follow the technetium due to exchange of tritium with the resin or due to extraction of tritiated compounds. Possible interference by tritium is eliminated by setting the Tc-99 counting window above the maximum energy for tritium beta particles.
5.1.4 Detection Limit/Ranges
Minimum Detectable Activities (MDAs, Ref. 1) depend on the length of count, counter background, detector efficiencies, separation efficiencies, and the volume of sample added to the cocktail. As an example, for an LSC instrument having nominal
SAVANNAH RIVER NATIONAL LABORATORY Manual: L16.1 ANALYTICAL DEVELOPMENT Procedure: ADS-2445 ANALYTICAL OPERATING PROCEDURES Revision: 4 Page: 4 of 6 TECHNICAL REFERENCE Effective Date: 3/18/09
background and counting efficiency of 30 CPM and 85%, respectively, in the Tc-99 25 keV to 290 keV window, MDAs are
30 minute count: 2.5 pCi/sample 60 min count: 1.8 pCi/sample
2 Sigma counting uncertainties are provided by the LSC instruments.
5.1.5 Method Validation
For tracer determination (yield) the method requires direct comparison of samples spiked with Tc-99m tracer and Tc-99 standard to samples spiked with Tc-99m tracer only. Gamma-ray spectrometer calibration is not required for this application since only ratio data are required for yield determination.
5.1.6 Equipment
Equipment will vary dependent upon preparation method provided by the Task supervisor. Some general equipment needs are: • Glass beakers and vials • Liquid scintillation counters, with beta spectrometer
capabilities (such as Packard Models 2750 Series instruments).
• Liquid scintillation vials, 20 mL polyethylene • Calibrated pipets • Calibrated balances • Heat lamp or hot plate • Vacuum manifold • Gamma detector for Tc-99m determination
5.1.7 Reagents
Reagents are subject to change based on specific preparation methods provided by the Task Supervisor. • Tc-99m tracer • Tc-99 Spike • Deionized distilled water (DI water)
SAVANNAH RIVER NATIONAL LABORATORY Manual: L16.1 ANALYTICAL DEVELOPMENT Procedure: ADS-2445 ANALYTICAL OPERATING PROCEDURES Revision: 4 Page: 5 of 6 TECHNICAL REFERENCE Effective Date: 3/18/09
• Ammonium hydroxide 4M - Add 135 mL of concentrated NH4OH (14.8M) to 200 mL of water and dilute to 500 mL with water.
• Methyl Isobutyl Ketone (MIK) • Methyl Alcohol • Hydrogen peroxide (30 wt %) • Liquid scintillation cocktail - Packard Ultima Gold-AB • Nitric acid solution (0.1M) - Add 6.4 mL of concentrated
nitric acid (sp gr 1.42) to 950 mL of water and dilute to 1 liter with water.
• Nitric acid solution (1M) - Add 64 mL of concentrated nitric acid (sp gr 1.42) to 900 mL of water and dilute to 1 liter with water.
• Nitric acid solution (12M) - Add 764 mL of concentrated nitric acid (sp gr 1.42) to 150 mL of water and dilute to 1 liter with water.
• Prefilter column (Eichrom sodium vanadate (20 g/L) - Dissolve 1 g NaVO3 in 50 mL of water, warming as necessary.
• Eichrom TEVA resin- prepacked columns • Eichrom TEVA filter disks
5.1.8 Calibration Frequency
Liquid scintillation counters (LSC) must be checked, using the self-normalization and calibration (SNC) protocol, each day that samples are run. LSC efficiencies shall be determined using NIST-traceable Tc-99 solutions. Since the Tc-99m recovery is determined by comparison, no routine QA is necessary for the detector used, as long as the Tc-99m peak is observed.
5.2 Procedure Details
5.2.1 Separation and Analysis
Follow written instructions (R&D Directions) provided by the Task Supervisor.
SAVANNAH RIVER NATIONAL LABORATORY Manual: L16.1 ANALYTICAL DEVELOPMENT Procedure: ADS-2445 ANALYTICAL OPERATING PROCEDURES Revision: 4 Page: 6 of 6 TECHNICAL REFERENCE Effective Date: 3/18/09
The final LSC vials are counted by gamma analysis first and then by liquid scintillation analysis to quantify Tc-99m and Tc-99, respectively.
5.3 Calculations
All calculations are done by the Task Supervisor or trained designee.
6.0 RECORDS
All prep and analysis data is recorded and maintained in the laboratory notebooks. The final data packet, containing the prep sheet, computer printouts, and calculations are stored in the counting room data notebook and associated binders. The ADS LIMS (Laboratory Information Management System) is used as the primary data storage location.
7.0 REFERENCES
7.1 Currie, L.A., Limits for Qualitative Detection and Quantitative Determination, Analytical Chemistry 40, 586 (1968).
7.2 Manual L16.1, Procedure ADS-2420, Gamma-Sample Preparation and Analysis (Gamma-PHA). 7.3 Manual L16.1, Procedure ADS-2401, Liquid Scintillation Counting. 7.4 Eichrom Industries, Inc., Procedure TCS01, Technetium-99 in Soil. 7.5 Sullivan, T., Nelson, D., and Thompson, E., "Determination of
Technetium-99 in Borehole Waters using an Extraction Chromatographic Resin," presented at the 37th Annual Conference on Bioassay, Analytical and Environmental Radiochemistry, Ottawa, Canada, 1991.
7.6 RP550, "Technetium-99 Analysis Using Extraction Chromatography," DOE
Methods Compendium. 7.7 Manual L1, Procedure 2.32, Radiological Work Practices.
8.0 ATTACHMENTS None
SAVANNAH RIVER NATIONAL LABORATORY Manual: L16.1 ANALYTICAL DEVEOPMENT SECTION Procedure: ADS-2447 AD ANALYTICAL OPERATING PROCEDURES Revision: 4 Page: 1 of 8 TECHNICAL REFERENCE Effective Date: 3/18/09
Strontium-90 In Environmental Approved by: Samples APPROVAL ON FILE AD Manager MAJOR REWRITE 1.0 PURPOSE This procedure describes a method for separation of Strontium-90 in
samples using Eichrom Sr Resin, followed by the measurement of the purified Sr-90 using liquid scintillation counting.
2.0 SCOPE
This method is intended to permit measurement of Sr-90 in a variety of matrices. Radioactive strontium is separated from the remainder of the sample matrix using Eichrom Sr resin. Following the radiochemical separation, the Sr-90 content is determined by liquid scintillation counting (LSC) utilizing a Packard LSC System.
Samples are separated using a strontium-selective resin that removes Sr from other nuclides. Sample pretreatment should place the sample in a nitric acid medium for the subsequent loading into the strontium-selective resin. The purified Sr is then eluted from the resin and analyzed by liquid scintillation counting. The high energy β-emission from Y-90 is generally used for quantification since it is relatively free of interferences. Strontium carrier is utilized to monitor method yields and trace separation recovery. Carrier yields can be measured using Neutron Activation Analysis (NAA), Inductively-Coupled Plasma Emission Spectroscopy (ICPES), or other methods as determined by the Task Supervisor.
2.1 Definitions and Abbreviations
JHA-Job Hazards Analysis HAP-Hazards Assessment Package LSC-Liquid Scintillation Counting
SAVANNAH RIVER NATIONAL LABORATORY Manual: L16.1 ANALYTICAL DEVEOPMENT SECTION Procedure: ADS-2447 AD ANALYTICAL OPERATING PROCEDURES Revision: 4 Page: 2 of 8 TECHNICAL REFERENCE Effective Date: 3/18/09
NAA-Neutron Activation Analysis ICPES-Inductively Coupled Plasma Emission Spectroscopy
2.2 Responsibilities
Analysts are responsible for • Reading, understanding and following this procedure. • Calling to the attention of the Task Supervisor any part of
the procedure that requires revision or that they believe to be unsafe.
• Reading, understanding, and signing applicable RWPs, JHAs and HAPs (or equivalent) prior to independent work.
Analytical Task Supervisor is responsible for • Maintaining this procedure. • Providing technical guidance as needed. • Providing additional directions, when needed, through the
use of R&D directions.
3.0 PRECAUTIONS/LIMITATIONS
3.1 Safety
3.1.1 Follow L1, 2.32 Radiological Work Practices and 8Q Laboratory Safety guidelines
3.1.2 Read, understand, and follow applicable Job Hazards
Analyses (JHAs) in Conduct of R&D packet. Specifically, be aware of the need for splash protection. Since the configuration of the sample changes throughout this method, pay careful attention to dose rates.
3.1.3 Before beginning this procedure, read all of the Material
Safety Data Sheets (MSDS) for the chemicals listed in Reagents.
4.0 PREREQUISITE ACTIONS
None
SAVANNAH RIVER NATIONAL LABORATORY Manual: L16.1 ANALYTICAL DEVEOPMENT SECTION Procedure: ADS-2447 AD ANALYTICAL OPERATING PROCEDURES Revision: 4 Page: 3 of 8 TECHNICAL REFERENCE Effective Date: 3/18/09 5.0 PERFORMANCE
5.1 Description
This procedure uses Eichrom Sr Resin (Ref. 1 to 5) to separate strontium from a variety of sample matrices. Aliquots of the separated fraction are analyzed by liquid scintillation counting to quantify Sr-90, typically from the Y-90 tail. Yields are generally determined by NAA or ICPES analyses. The Task Supervisor may specify other methods to determine yields. This method provides a rapid, reliable method for measurement of Sr-90 in a variety of samples that is more cost-effective and efficient than traditional anion exchange or precipitation techniques.
5.2 Equipment
• Liquid Scintillation Counter - Packard Model 2550 TR/AB or equivalent for Sr-90/Y-90 beta radiation
• Liquid Scintillation Vials - 20 mL polyethylene
• Fume Hood, Hot Plate
• Gamma Pulse Height Detector - For Sr carrier determined by NAA
• Calibrated pipets and balances
5.3 Reagents
• Liquid Scintillation Cocktail - Ultima Gold AB
• Nitric acid (15.7 M) - concentrated nitric acid. • Nitric acid (3 M) - Add 191 mL of concentrated HNO3 to
800 mL of water and dilute to 1 liter with water.
SAVANNAH RIVER NATIONAL LABORATORY Manual: L16.1 ANALYTICAL DEVEOPMENT SECTION Procedure: ADS-2447 AD ANALYTICAL OPERATING PROCEDURES Revision: 4 Page: 4 of 8 TECHNICAL REFERENCE Effective Date: 3/18/09
• Nitric acid (3 M) - oxalic acid solution (0.05 M) - Add 191 mL of concentrated HNO3 and add 6.3 grams of oxalic acid dihydrate to 800 mL of water and dilute to 1 liter with water.
• Nitric acid Solution (0.05 M) - Add 3.2 mL of concentrated
nitric acid to 900 mL of water and dilute to 1 liter with water.
• Nitric acid solution (0.1 M) - Add 6.4 mL of concentrated
nitric acid to 900 mL of water and dilute to 1 liter with water.
• Nitric acid solution (8 M) - Add 510 mL of concentrated
nitric acid to 400 mL of water and dilute to 1 liter with water.
• Nitric acid solution (0.0001 M) - Add 2 mL of 0.05 M nitric
acid solution to 800 mL H2O and dilute to 1L with H2O. • Eichrom Sr Resin – pre-packed columns, 0.7 grams resin
of small particle size (50 to 100 um) in appropriate size column or alternate as specified by Task Supervisor.
• Sr Carrier - (about 5000 ppm)-as designated by the task
supervisor. The mass of Sr added to each sample should be less than 5 mg to prevent overloading the Sr Resin column.
• Sr-90 spike - as designated by the Task Supervisor. • Ce carrier - as designated by the Task Supervisor.
5.4 Data Quality
5.4.1 Method Validation 5.4.1.1 Yield determination
A small amount of non-radioactive Sr is added to the sample before the radiochemical separation begins. Yields are determined by measuring the amount of carrier that is recovered relative to the amount added.
SAVANNAH RIVER NATIONAL LABORATORY Manual: L16.1 ANALYTICAL DEVEOPMENT SECTION Procedure: ADS-2447 AD ANALYTICAL OPERATING PROCEDURES Revision: 4 Page: 5 of 8 TECHNICAL REFERENCE Effective Date: 3/18/09
Normally the carrier is determined by neutron activation analysis (NAA, Ref. 9), but other methods such as ICPES can be used as well.
NIST-traceable (National Institute of Standards and Technology) Sr-90 solution is used for spiked sample preparation and for preparing and testing the liquid scintillation counting efficiency (Ref. 5).
Alternatively, an LSC counter that does not have a Sr-90 quench efficiency curve may be used by first counting un-spiked samples, and recounting after adding NIST-traceable Sr-90 (with Y-90 at equilibrium) solution to each sample (standard addition method).
5.4.1.2 Precision and Bias
Relative standard deviations of 8% at the 500 DPM level (Sr-90) and mean tracer recoveries, corrected for chemical yield, of 104% ± 8% (Sr-90), have been reported (Ref. 1-5).
5.4.1.3 Interferences
Since the Sr carrier is non-radioactive, it will not interfere with LSC counting of Sr-90/Y-90. The determination of yield by carrier additions will be uncertain if the sample contains relatively large amounts of stable Sr in addition to the Sr added as carrier.
If present, Sr-89 will interfere with LSC results. Strontium is separated from interfering radio elements by Eichrom Sr Resin to enable measurement by liquid scintillation counting.
Eluting Eichrom Sr Resin with 8 M HNO3 effectively removes barium and potassium isotopes as well as other matrix interferences. Tetravalent plutonium, neptunium, cerium and ruthenium, however, are not removed using
SAVANNAH RIVER NATIONAL LABORATORY Manual: L16.1 ANALYTICAL DEVEOPMENT SECTION Procedure: ADS-2447 AD ANALYTICAL OPERATING PROCEDURES Revision: 4 Page: 6 of 8 TECHNICAL REFERENCE Effective Date: 3/18/09
nitric acid. If necessary, these isotopes can be effectively removed by including an additional rinse of approximately four free column volumes of 3 M HNO3-0.05 M oxalic acid. If necessary, actinides can be removed in Diphonex resin or Actinide Resin clean-up steps.
5.5 Quality Control
5.5.1 Calibration Frequency
Calibration of the gamma-ray spectrometer is validated per Procedure ADS-2420 (Ref. 7).
Calibration of the liquid scintillation counters are validated per Procedure ADS-2424 (Ref. 8).
5.5.2 Calibration and Standardization
If yields are determined by NAA, no efficiency determination is required for the gamma instrumentation since yields are determined by a simple ratio of the counts obtained in the activated unknown and the counts obtained in the stable Sr carrier samples.
LSC efficiencies shall be determined using NIST-traceable Sr-90/Y-90 solutions.
5.6 Analysis
5.6.1 Samples are to be analyzed as directed by the Task
Supervisor in R&D directions.
5.6.2 In general, samples are spiked with Ce carrier (to help flush residual Y) and Sr carrier (for yielding purposes).
5.6.3 The spiked samples are acidified using 8 M HNO3 to
convert all available Sr to the nitrate form.
5.6.4 The Eichrom Sr columns are conditioned using 8 M HNO3 and the samples are loaded.
SAVANNAH RIVER NATIONAL LABORATORY Manual: L16.1 ANALYTICAL DEVEOPMENT SECTION Procedure: ADS-2447 AD ANALYTICAL OPERATING PROCEDURES Revision: 4 Page: 7 of 8 TECHNICAL REFERENCE Effective Date: 3/18/09
5.6.5 The interferences are then eluted from the columns using 8 M HNO3 (and possibly other reagents).
5.6.6 The purified Sr is then eluted from the columns using
0.0001 M HNO3.
5.6.7 Aliquots of the purified Sr elute are analyzed for Sr 90 content (by liquid scintillation analysis) and stable Sr (by NAA, ICPES or alternate method per Task Supervisor).
5.7 Calculations
Calculations and data review are done by the Task supervisor or trained designee.
6.0 RECORDS
All prep and analysis data is recorded and maintained in the laboratory notebooks. The final data packet, containing the prep sheet, computer printouts, and calculations are stored in the counting room data notebook and associated binders. The ADS LIMS (Laboratory Information Management System) is used as the primary data storage location.
7.0 REFERENCES
7.1 Eichrom Industries, Inc., Procedure SRW01, Strontium 89/90 in Water.
7.2 Horwitz, E.P., Dietz, M.L., Chiarizia, R., 1992. "A Novel
Strontium Selective Extraction Selective Chromatographic Resin," Solvent Extraction and Ion Exchange, 10(2) 1, pp 313-336.
7.3 Nelson, D.M., "Purification of Strontium in Water before
Strontium-89/Strontium-90 Measurement," DOE Methods Compendium, RP500.
7.4 Maxwell, III S.L., Nelson, M.R., and Mahannah, R.N. "High
Speed Separations to Measure Impurities in Plutonium-238 Oxide and Trace Radionuclides in Waste," presented at 34th
SAVANNAH RIVER NATIONAL LABORATORY Manual: L16.1 ANALYTICAL DEVEOPMENT SECTION Procedure: ADS-2447 AD ANALYTICAL OPERATING PROCEDURES Revision: 4 Page: 8 of 8 TECHNICAL REFERENCE Effective Date: 3/18/09
ORNL-DOE Conference on Analytical Chemistry in Energy Technology, Gatlinburg, TN, October 5-7, 1993.
7.5 Banavali A.D., Moreno, E.M., and McCurdy, D.E., "Strontium-
89/90 Analysis by Eichrom Column Chemistry and Cerenkov Counting," presented at the 38th Annual Conference on Bioassay, Analytical and Environmental Radiochemistry, Santa Fe, NM, November 2-6, 1992.
7.6 Currie, L.A., Limits for Qualitative and Quantitative
Determination, Analytical Chemistry 40, 586 (1968). 7.7 Manual L16.1, Procedure ADS-2420, Gamma Sample
Preparation and Analysis. 7.8 Manual L16.1, Procedure ADS-2424, Gross Alpha/Beta
Determination by Liquid Scintillation Counting. 7.9 Manual L16.1, Procedure ADS-2407, Californium Neutron
Activation Analysis. 7.10 Manual L1, 2.32, Radiological Work Practices.
7.11. Manual L1, 2.39, Use of ARW Instruments.
8.0 ATTACHMENTS
None
Analytical Development Section Analytical Operating Procedures
Manual: L16.1 Procedure: ADS-2449
Volume 2 Revision: 4 Actinides in Environmental Samples Major Revision
Effective Date: 06/29/11 Type-Category: Technical Page: 1 of 15
Electronic Approval on File: Author/ Task Supervisor: C. C. DiPrete Peer Reviewer: D. P. DiPrete AD Materials Characterization and Nuclear Measurement Research Group Manager: R. H. Young AD Procedures Coordinator: M. S. Hanks
Procedure: ADS-2449 Actinides in Environmental Samples
Revision: 4 Page: 2 of 15
1.0 INTRODUCTION
1.1 Purpose This procedure provides a generic description of methods utilizing resins for the
separation of actinides from a wide variety of matrices. The separated material contains the actinides originally present in the matrix without many of the interfering radionuclides. The separated material is quantified utilizing alpha pulse height analysis, gamma spectrometry, mass spectrometry, or a combination of these.
1.2 Scope The material in this procedure provides separation techniques to efficiently separate individual actinides from a variety of matrices for eventual quantification. Actinides are separated using Eichrom TEVA, UTEVA, RE and/or TRU resins prior to measurement by alpha, gamma, and/or mass spectrometry. This procedure is designed to be generic due to the wide variety of matrices and analytes for which it is used. Sample matrix materials vary widely and include, but are not limited to, high-and low-activity tank liquids, high- and low-activity tank solids, environmental solids, environmental liquids, and process material. This procedure, along with R&D Directions written for each batch of samples, describes the separation and preparation steps of the analysis. The counting and quantification steps are described in procedures L16.1 ADS-2405, ADS-2402, ADS-2420, and ADS-1543.
2.0 GENERAL INFORMATION
2.1 Background This procedure is based on methods discussed in references 1 to 5; however, research and experimentation are routinely utilized to provide additional robustness, sensitivity, or capability to the procedure. The R&D directions in addition to this procedure provide the level of detail needed for an experienced analyst to reproduce analyses.
Appropriate tracers and standards are used, when possible and practical, to monitor chemical recoveries and yields. There are no lower limits applicable for the tracer recovery; many of the separations require aggressive decontamination of interfering nuclides which, in turn, reduces tracer recovery. Provided the tracer recovery is high enough to allow quantification of the isotope of interest with the criteria set forth by the customer’s data quality objectives, the recovery is considered acceptable. The quality assurance and quality control samples (blanks, lab control spikes, etc.) utilized vary depending upon the customer’s data quality objectives. Blanks and laboratory spiked blanks are generally part of each batch. The recovery of
Procedure: ADS-2449 Actinides in Environmental Samples
Revision: 4 Page: 3 of 15
the blank spike should be between 75-125% and the blank should be less than 10% of the sample result. If QC indicators fall outside of these ranges, the Task Supervisor must determine whether the data is fit for release with additional scrutiny, qualifiers, or alternate calculations.
2.2 Responsibilities
1. Analysts are responsible for:
A. Reading, understanding and following this procedure, and
B. Calling to the attention of the Task Supervisor any part of the procedure that requires revision or that they believe to be unsafe.
2. The Analytical Task Supervisor is responsible for:
A. Maintaining this procedure, and
B. Providing technical guidance.
3.0 PRECAUTIONS AND LIMITATIONS
3.1 Safety 1. Follow:
A. L1 2.32; Radiological Work Practices
B. 8Q; Laboratory Safety guidelines
C. L1 3.20; Handling HF Acid Solutions
D. ADS-WI-00021; Analytical Development Safety Practices
2. Read, understand, and follow applicable Job Hazard Analyses (JHAs) in the Conduct of R&D packet.
4.0 PREREQUISITES
None
5.0 PROCEDURE
5.1 Description of Method
1. Actinides are separated from interfering radionuclides using Eichrom TEVA, UTEVA, RE and/or TRU resins prior to measurement by alpha, gamma, and/or mass spectrometry. This procedure is designed to be generic due to the wide variety of matrices and analytes for which it is used. This procedure, along with R&D Directions written for each batch of samples, describes the separation and preparation steps of the analysis.
Procedure: ADS-2449 Actinides in Environmental Samples
Revision: 4 Page: 4 of 15
The counting steps are described in procedures L16.1 ADS-2405, ADS-2402, ADS-2420, and ADS-1543.
5.2 Data Quality
1. Interferences
Actinides with non-resolvable alpha energies such as 241Am and 238Pu, or 237Np and 234U, must be chemically separated prior to measurement. The methods described in this procedure, or derivations of these methods, are utilized to strategically separate radionuclides prior to analysis. Complementary methods (gamma pulse height analysis or ICP-MS, for example) are often utilized to further decouple interferences, or check for unexpected interferences. Incomplete removal of interfering radionuclides can impact the data quality in numerous ways, including increasing the minimum detectable activity (MDA) of the isotope of interest, or effecting a high bias in the measured radionuclide.
2. Detection Limit Ranges Minimum detectable activities (Ref. 7) depend on the aliquot size, separation yield, count duration, counter background, and detector efficiencies. Analyses are customized to meet the target MDAs prescribed by the customer’s data quality objectives. Some factors, such as limited sample size, sample dose rate, activity levels of the sample, and decontamination factors required to isolate the isotope of interest can impact the ability of the laboratory to meet requested detection limits.
3. Energy Calibration
Energy calibration of the alpha pulse height analysis detector, as described in L16.1, ADS-2402, is necessary for alpha isotope identification.
4. Efficiency Calibration
Efficiency calibration of the alpha pulse height analysis detector, as described in L16.1, ADS-2402, is not always a necessary part of this procedure.
A. Yield determination of the tracer is often calculated using a direct comparison of the peak areas of the tracer isotope to the sample isotopes from a single alpha count. This application of alpha spectroscopy, when applied with a quantified standard or known
Procedure: ADS-2449 Actinides in Environmental Samples
Revision: 4 Page: 5 of 15
amount of one of the isotopes, does not require knowledge of detector efficiencies.
B. Quantification can be performed using complementary methods such as gamma pulse height analysis of as-received (non-separated) sample, ICP-MS of as received (non-separated) sample, and numerous other methodologies deemed necessary on a sample-by-sample basis. Quantification via these methods does not require knowledge of alpha detector efficiencies.
5. Yield Determination
When possible, NIST-traceable solutions are used for spiked sample preparation. There are numerous approaches to monitor separation yield and provide quantitative, yield-corrected actinide results. The R&D directions and the raw data packet, as well as the calculation spreadsheets, provide the information needed for an experienced analyst to re-create the yield determination.
6. Various quality control (QC) plates are prepared with sample batches, dependent upon the customer’s data quality objectives.
A. Possible QC plates are:
(1) A batch blank
(a) The activity of the blank relative to the sample should be less than 10% for un-qualified release. In some instances, dependent upon DQOs, sample availability, or other factors, data can be released as upper limits if the blank exceeds 10%.
(2) Spiked blanks
(a) Results should indicate recovery of 75-125% for unqualified data release.
Procedure: ADS-2449 Actinides in Environmental Samples
Revision: 4 Page: 6 of 15
5.3 Equipment
NOTE: This is a list of many types of equipment used. It will not be exhaustive since the separation is fined-tuned for each batch of samples analyzed.
1. Calibrated M&TE pipettes
2. Calibrated M&TE balances
3. Column racks
4. Drying oven - capable of 120°C
5. Filter apparatus
6. Hot plate - capable of 100°C
7. Various Eichrom columns, cartridges, and associated hardware
8. Teflon Beakers - small
9. Filter Apparatus - 25 mm diameter.
10. Filters - 25 mm diameter polypropylene, 0.1 micron.
11. Filters – 50 mm diameter cellulose nitrate, 0.45 micron, contained in disposable filter apparatus
12. Vacuum Filter Flasks
13. Vacuum Filter Manifold
14. Stainless steel planchets-1 inch diameter
15. Alpha detectors-see L16.1, Procedure ADS-2402
16. Low energy gamma detectors-see L16.1, Procedure ADS-2420
5.4 Reagents
NOTE: This a list of many of the reagents used. It will not be exhaustive since the separation is fined-tuned for each batch of samples analyzed.
NOTE: All references to water refer to de-ionized or distilled water.
Procedure: ADS-2449 Actinides in Environmental Samples
Revision: 4 Page: 7 of 15
1. Sodium Nitrite solution (NaNO2) 4M - Dissolve 6.9g of NaNO2 in 15mL
of water. Dilute to 25mL with water. Make fresh daily.
2. Nitric Acid 2.5M – sodium nitrite (0.1M) solution - Add 32mL of concentrated HNO3 to 100mL of water, dissolve 1.38 grams of sodium nitrite in the solution and dilute to 200mL with water. Make fresh daily
3. Oxalic Acid 0.1M - Dissolve 12.6 g of oxalic acid dihydrate in 800mL of water. Dilute to 1000mL with water.
4. Aluminum Nitrate (1M) - Add 106 grams of anhydrous nitrate to 400mL of water. Dissolve and then dilute to 500mL with water.
5. Ammonium bioxalate (0.1M) - Dissolve 6.31 grams of oxalic acid dihydrate (H2C2O4•2H2O) and 7.11 grams of ammonium oxalate monohydrate (NH4) 2C2O4•H2O in 900mL of water, filter and dilute to 1 liter with water.
6. Ammonium hydroxide - concentrated (sp gr 0.9).
7. Ammonium Hydrogen Phosphate (3.2M) - Dissolve 106 grams of (NH4) 2 HPO4 in 200mL of water. Heat gently to dissolve, and dilute to 250mL with water.
8. Ammonium Hydrogen Phosphate [(NH4)2 HPO4] (3.2M) - Alternate preparation steps:
A. Slowly add 108mL of concentrated ammonium hydroxide to 40mL DI water.
B. Slowly add 54mL of concentrated phosphoric acid to 20mL of DI water.
C. Slowly add the ammonium hydroxide from step “A” to the phosphoric acid from step “B”.
D. Dilute to 250mL with DI water.
9. Ascorbic acid - solid
10. Calcium nitrate (1.25M) - Dissolve 51 grams of Ca (NO3)2 in 100mL of water and dilute to 250mL with water.
11. Hydrochloric acid (3M) - Add 250mL of concentrated HCl (sp gr 1.19) to 600mL of water and dilute to 1 liter with water.
12. Hydrochloric acid (4M) - Add 334mL of concentrated HCl (sp gr 1.19) to 600mL of water and dilute to 1 liter with water.
Procedure: ADS-2449 Actinides in Environmental Samples
Revision: 4 Page: 8 of 15
13. Hydrochloric acid (9M) - Add 750mL of concentrated HCl (sp gr 1.19) to
200mL of water and dilute to 1 liter with water.
14. Hydrogen peroxide (30 wt %)
15. Nitric acid (15.8M) - concentrated HNO3 (sp gr 1.42)
16. Nitric acid solution (3.0M) - Add 192mL of concentrated nitric acid (sp gr 1.42) to 600mL of water and dilute to 1 liter with water.
17. Nitric acid solution (2.5M) - Add 159mL of concentrated HNO3 (sp gr 1.42) to 800mL of water and dilute to 1 liter with water.
18. Nitric acid (2.5M) - oxalic acid solution (0.05M) - Add 159mL of concentrated HNO3 (sp gr 1.42) and add 6.3 grams oxalic acid dihydrate to 700mL of water and dilute to 1 liter with water.
19. Nitric acid solution (1.0M) - Add 64mL of concentrated nitric acid (sp gr 1.42) to 800mL of water and dilute to 1 liter with water.
20. Nitric acid solution (0.5M) - Add 32mL of concentrated nitric acid (sp gr 1.42) to 800mL of water and dilute to 1 liter with water.
21. Nitric acid solution (0.01M) - Add 10mL of 1N nitric acid to 800mL of water and dilute to 1 liter with water.
22. Ferrous Sulfamate - laboratory stock
23. EichromTEVA Resin
24. Eichrom TRU or RE Resin
25. Eichrom UTEVA Resin
26. Eichrom LN Resin
27. Cerium Carrier - Dissolve 0.155 g cerium (III) nitrate hexahydrate in 50mL water and dilute to 100mL in water
28. Titanium (III) Chloride - >10 wt % Titanium (III) chloride in 20 to 30 % hydrochloric acid. Used for uranium sample preparation only.
29. Hydrofluoric Acid - Concentrated
NOTE: In the event that high chloride residue is generated, the R&D directions provide guidance to neutralize the residue with NaOH, reduce the volume to dryness, and discard the resulting solid material in solid waste.
Procedure: ADS-2449 Actinides in Environmental Samples
Revision: 4 Page: 9 of 15
5.5 Analyses Samples are prepared as instructed by the task supervisor in the R&D directions. The R&D directions must be used along with the procedure to understand the full analysis. A very generic procedure, indicating the types of activities performed during the actinide separation process, follows.
1. Actinide Separations
A. Np, Th Separation from Am, Pu, and U using TEVA Resin Columns
(1) For each sample (typically prepared in a 2.5M HNO3 load solution as directed by the Task Supervisor), place a TEVA column in the column rack.
(2) Place a centrifuge tube or other appropriate catch vessel below each column, remove the bottom plug from each column and allow it to drain.
(3) Pipet 5mL of 2.5M HNO3-0.05M ferrous sulfamate (made fresh weekly) into each column (to condition the resin) and allow it to drain. Discard the eluate.
(4) Place a clean, labeled centrifuge tube or other appropriate catch vessel below each column.
(5) Add 2.5mL of ferrous sulfamate to each sample as directed by the Task Supervisor. Swirl to mix.
(a) Transfer the solution to the appropriate labeled TEVA resin column and collect the eluate in labeled catch vessel.
(6) Add 5mL of 2.5M HNO3•0.05M ferrous sulfamate to rinse the original vessel and transfer each solution to the appropriate TEVA resin column. Collect eluate in the same catch vessel used for collection in step 5.5.1.A.5.a. NOTE: Pu, U, and Am are removed with the load solution
and 2.5M HNO3 - 0.05M ferrous sulfamate rinses.
Procedure: ADS-2449 Actinides in Environmental Samples
Revision: 4 Page: 10 of 15
(7) Add 5mL of 2.5M HNO3 - 0.05M ferrous sulfamate to each
column and collect eluate in same catch vessel.
(8) Save this vessel for U, Pu, Am separation step 5.5.2.E. The TEVA column contains Th and Np. If these analyses are required, consult the Task Supervisor.
2. U Separation from Pu, Am Using UTEVA Resin
A. For each sample solution, place a UTEVA resin column in the column rack.
B. Place a centrifuge tube or other appropriate catch vessel below each column, remove the bottom plug from each column and allow the column to drain. Discard the eluate.
C. Add 5mL of 2.5M HNO3 - 0.05M ferrous sulfamate (prepared fresh each week) into each column to condition the resin and allow the column to drain. Discard the eluate.
D. Place a clean, labeled centrifuge tube or other appropriate catch vessel below each column.
E. Transfer each solution from step 5.5.1.A.8 or as generated per Task Supervisor direction into the appropriate UTEVA resin column by pouring or by using a plastic transfer pipet. Collect eluate in catch vessel.
F. Add 5mL of 2.5M HNO3 - 0.05M ferrous sulfamate to rinse the vessel from step 5.5.1.A.8 and transfer each solution into the appropriate UTEVA resin column. Collect the eluate in same vessel as used in steps 5.5.2.E.
G. Add 5mL of 2.5M HNO3 - 0.05M ferrous sulfamate into each column. Collect eluate in same vessel.
H. Set aside the labeled vessels with solutions collected in this section for Pu, Am separation described in the following section.
I. Place a clean, labeled centrifuge or other appropriate catch vessel below each column. Add 5mL of 2.5M HNO3 - 0.05M oxalic acid into each column and allow to drain. Discard this rinse.
NOTE: This rinse removes any trace amounts of neptunium that may have passed through the TEVA Resin and any residual ferrous ion.
Procedure: ADS-2449 Actinides in Environmental Samples
Revision: 4 Page: 11 of 15
J. Place a clean, labeled centrifuge tube or other appropriate catch
vessel below each column.
K. Add 10mL of 0.1M ammonium bioxalate to each column to strip the uranium. Collect eluate.
L. Add 2mL of concentrated nitric acid to the eluate. Set aside for cerium fluoride precipitation of the uranium sample. (5.5.4 of this procedure)
3. Pu, Am Separation Using TRU Resin Columns:
A. For each sample, place a TRU resin column in the column rack.
B. Place a centrifuge tube or other appropriate catch vessel below each column.
C. Remove the bottom plug from each column and allow each column to drain. Discard eluate solution.
D. Just prior to sample loading, pipet 5mL of 2.5M HNO3 into each column to condition resin and allow to drain. Discard eluate solution.
E. Add solid ascorbic acid to each solution from step 5.5.2.H as instructed by the Task Supervisor.
F. Immediately
G. Allow the load solution to drain through column into a labeled centrifuge tube or other appropriate catch vessel.
transfer each solution from the previous step into the appropriate TRU Resin column by pouring or using a plastic transfer pipet.
H. Add 5mL of 2.5 M HNO3 into the sample vessel from step 5.5.3.E and transfer this rinse to the appropriate column using the same plastic transfer pipet.
I. Allow the initial rinse solution to drain through each column.
J. Add 5mL of 2.5 M nitric acid - 0.1 M sodium nitrite (prepare fresh each week) directly into each column.
NOTE: Sodium nitrite is used to oxidize Pu+3 to Pu+4 and enhance the Pu/Am separation.
K. Allow the rinse solution to drain through each column.
L. Add 1mL of 0.5M HNO3 to each column and allow to drain.
Procedure: ADS-2449 Actinides in Environmental Samples
Revision: 4 Page: 12 of 15
NOTE: 0.5M HNO3 is used to lower the nitrate concentration prior to conversion to the chloride system.
M. Place clean, labeled vessels below each column.
N. Add 3mL of 9M HCl to each column to convert to chloride system.
O. Add 12mL of 4M HCl to the column to elute americium.
P. Add 2 drops of 30 wt% H2O2, and 1mL of concentrated nitric acid to the americium solution from the previous step. Set aside for cerium fluoride precipitation of the americium sample (Section 5.5.4).
NOTE: This step destroys any extractant that may have been stripped from the column that may interfere with the counting technique. If a prefilter is used on each column tip to prevent stripping of small amounts of extractant, addition of the H2O2 and concentrated nitric acid is not necessary.
Q. Ensure that clean, labeled vessels are below each column.
R. Add 10mL of 0.1M ammonium bioxalate to elute plutonium from each column.
S. Add 2mL of concentrated nitric acid to each vessel from the previous step and set aside for counting preparation (Section 5.5.4).
4. Cerium Fluoride Preparation Method for Alpha Spectrometry
A. Evaporate the samples prepared in the previous sections, as directed by the Task Supervisor, to dryness.
B. Dissolve the residue in 2 to 10 mL of 9M HCl and transfer the solution to a plastic or Teflon container. Rinse the beaker with 2mL of 9M HCl and transfer this rinse solution to the plastic or Teflon container.
C. Add 0.2 ml of cerium carrier to each sample.
Procedure: ADS-2449 Actinides in Environmental Samples
Revision: 4 Page: 13 of 15
D. To uranium
E. Add 1.0 mL of concentrated HF to each beaker. Swirl to mix. Let the beakers sit for at least 30 minutes before filtering.
samples only, add 0.5mL of titanium chloride solution.
Caution: Concentrated HF requires additional care. Review L1, 3.20 Handling HF Solutions when using HF.
F. Label each stainless steel planchet as directed by the Task Supervisor.
G. Set up a 0.1 micron 25 mm filter, with glassy side down on a Gelman filter apparatus or a vacuum filtering manifold.
H. Before adding the sample, add 2 to 3 mL water to each filter, apply vacuum and assure there are no leaks around the sides of the filter.
I. Filter the sample and rinse the beaker with ~ 2mL water, transferring the rinse to the filter apparatus.
J. Draw air through the filter until dry.
K. Mount filters on stainless planchets using a glue stick or double- sided tape.
L. Count each according to the ADS Alpha Spectrometry Procedure (Ref. 6)
5.6 Calculations Sample preparation data are recorded on the preparation data sheet and recorded in the Radiochemistry Laboratory notebook. The final data packet, containing the prep sheet, computer printouts, and calculations are stored in the counting room data notebook and associated binders. All calculations are completed by the Task Supervisor or a trained designee.
5.7 Data Control Preparation data are recorded on the preparation data sheet and recorded in the Radiochemistry Laboratory notebook. The final data packet, containing the preparation sheet, computer printouts, and calculations are stored in the counting room data notebook and associated binders.
Procedure: ADS-2449 Actinides in Environmental Samples
Revision: 4 Page: 14 of 15
6.0 REFERENCES
1. Maxwell, III S.L., Nelson, M. R., and Mahannah, R.N. "High Speed
Separations to Measure Impurities in Plutonium-238 Oxide and Trace Radionuclides in Waste at SRS," presented at 34th ORNL-DOE Conference on Analytical Chemistry in Energy Technology, Gatlinburg, TN, October 5-7, 1993.
2. Nelson, D. "Improved Methods for the Analysis of Radioactive Elements in
Bioassay and Environmental Samples," presented at the 38th Annual Conference on Bioassay, Analytical and Environmental Radiochemistry, Santa Fe, NM, November, 1992.
3. Horwitz, E.P., Chiarizia, R., Dietz, M. L., Diamond, H., Essling, A.M., and
Gracyk, D.W. "Separation and Preconcentration of Uranium form Acidic Media by Extraction Chromatography,” Analytical Chimica Acta, 266 (1992) 25-37.
4. Horwitz, E.P., Chimica, R., Dietz, M.L., Diamond, H., and Nelson, D.,
"Separation and Preconcentration of Actinides from Acidic Media by Extraction Chromatography," Analytical Chimica Acta, 281 (1993) 361-372.
5. Eichrom Industries, Inc., “Americium, Curium, Plutonium and Uranium
Determination in Water-Method Validation Report,” August 8, 1994. 6. Manual L16.1, V2, ADS-2402, “Alpha Pulse Height Analysis.” 7. Currie, L. A., “Limits for Qualitative and Quantitative Determination,”
Analytical Chemistry 40, (1968) 586.
8. Manual L16.1, V2, ADS-2405 “Alpha & Beta Plate Making Direct Mount and Count.”
9. Manual L16.1, V2, ADS-2420 “High Purity Germanium Detector Gamma Pulse Height Analysis.”
10. Manual L16.1, V2, ADS-1543 “Inductively Coupled Plasma-Mass Spectrometer Elemental and Isotopic Analysis for Aqueous Liquid Samples Plasmaquad II.”
7.0 RECORDS Data are recorded and maintained as described in the Data Control section
. The ADS LIMS (Laboratory Information Management System) is used as the primary data storage location.

Procedure: ADS-2449 Actinides in Environmental Samples
Revision: 4 Page: 15 of 15
8.0 ATTACHMENTS
None
SAVANNAH RIVER NATIONAL LABORATORY Manual: L16.1 ANALYTICAL DEVEOPMENT Procedure: ADS-2452 ANALYTICAL OPERATING PROCEDURES Revision: 2 Page: 1 of 10 TECHNICAL REFERENCE Effective Date: 11/12/2007
Ni-59,63 In Environmental and High Approved by: Activity Samples APPROVAL ON FILE AD Manager 1.0 PURPOSE This procedure describes a method for separation and measurement of
Ni-59 and Ni-63 in solid and aqueous samples. The separation method is based on the DOE Methods Nickel-59 and Nickel-63 Determination in Aqueous Samples, Method #RP300 (Ref. 1).
2.0 SCOPE The method is intended to permit measurement of Ni-59 by X-ray
spectrometry and Ni-63 by liquid scintillation counting (LSC).
2.1 The method is acceptable for:
• Solid samples prepared by a non-volatile digestion method, with nickel and cobalt carriers added prior to the digestion, or aqueous samples with nickel and cobalt carriers added.
• ICP-ES results for nickel carrier levels to monitor method yields and to correct results.
2.2 The samples are analyzed for:
• Ni-59 using a high purity germanium planar or semi-planar spectrometer (LEPS, LOAX) detector, with a Canberra Genie-2000 MCA interface, and
• Ni-63 using a liquid scintillation counter and a quench curve.
2.3 Responsibilities
2.3.1 Analysts are responsible for
• reading, understanding and following this procedure,
SAVANNAH RIVER NATIONAL LABORATORY Manual: L16.1 ANALYTICAL DEVEOPMENT Procedure: ADS-2452 ANALYTICAL OPERATING PROCEDURES Revision: 2 Page: 2 of 10 TECHNICAL REFERENCE Effective Date: 11/12/2007
• calling to the attention of the Analytical Task Supervisor any part of the procedure that requires revision or that they believe to be unsafe.
2.3.2 Analytical Task Supervisor is responsible for
• maintaining this procedure
• providing technical guidance as needed. 3.0 PRECAUTIONS/LIMITATIONS
3.1 Safety
3.1.1 Follow L1 2.32 Radiological Work Practices and 8Q Laboratory Safety Guidelines.
3.1.2 Read, understand, and follow applicable JHAs in Conduct
of R&D packet.
3.1.3 Per JHA for oven use, be cautious of heat and electrical hazards. Ensure nothing flammable/combustible is within 6 inches of the oven when it is operating, ensure it is not on top of paper.
3.1.4 Per JHA for NI-59/63 analyses, be cautious when
handling plates which are taped.
3.1.5 Stop and contact Task Supervisor of loose material, if noticed.
4.0 PREREQUISITE ACTIONS
Read, understand, and follow applicable JHAs in Conduct of R&D packet.
5.0 PERFORMANCE
5.1 Description
SAVANNAH RIVER NATIONAL LABORATORY Manual: L16.1 ANALYTICAL DEVEOPMENT Procedure: ADS-2452 ANALYTICAL OPERATING PROCEDURES Revision: 2 Page: 3 of 10 TECHNICAL REFERENCE Effective Date: 11/12/2007
This procedure uses dimethyl glyoxime (DMG) extractant on a solid substrate (Eichrom Ni columns). The method is a variation on classic DMG precipitations for separating radioactive nickel from other radioactive interferences. It provides a rapid, reliable separation of Ni-59 and Ni-63 from interferences in sample matrices ranging from high activity solids to aqueous environmental samples.
• Solid samples which have been previously dissolved using a
digestion procedure in which the samples have been spiked with nickel and cobalt carriers prior to the digestion.
• Aqueous samples having nickel and cobalt carriers added. High-activity samples may be determined without preconcentration. Aqueous environmental samples generally require evaporation to dryness and redissolution prior to separation.
• Yields are ideally determined by ICP-ES.
5.2 General Limitations Some prior knowledge of sample activity is recommended to
determine to appropriate path forward for the sample preparation.
5.3 Detection Limit Ranges Minimum Detectable Activities (MDAs, Ref. 2) depend on the
length of count, counter background, and detector efficiencies. Ni-59 detection limits of 70 pCi/g (or per mL) are readily obtainable from 1 gram or 1 milliliter samples, and an overnight gamma analysis using current equipment (counting efficiency for cobalt x-rays ~ 5%). Ni-63 detection limits of ~2 pCi/g (or per mL) are readily obtainable from 1 gram or 1 milliliter samples, and a 1 hour LSC analysis using current equipment. Using larger amounts of sample or longer counting times, the detection limits can be scaled accordingly.
SAVANNAH RIVER NATIONAL LABORATORY Manual: L16.1 ANALYTICAL DEVEOPMENT Procedure: ADS-2452 ANALYTICAL OPERATING PROCEDURES Revision: 2 Page: 4 of 10 TECHNICAL REFERENCE Effective Date: 11/12/2007
5.4 Method Validation
Yield determination: Several methods may be specified by the task supervisor.
• Nickel Carrier: A small amount (~2.5 mg) of non-radioactive
nickel may be added to the sample before the radiochemical separation sample preparation begins. Normally the carrier recovery is determined by ICP-ES. (Ref. 4). Yields are determined by ratioing carrier results for the separated sample to an unseparated aliquot of carrier.
• Radioactive nickel tracer: For analyses requiring only Ni-63 or Ni-59, the isotope not analyzed for may be used as a tracer. Yields are determined by ratioing tracer results for the separated sample to as unseparated aliquot of tracer.
• Standard addition: If necessary the recovery of the spiked
blank is used to correct batch data for yield. NIST traceable Ni-59 solution is used for the determination of
the LEPS gamma spectrometry counting efficiency and NIST traceable Ni-63 is used for determination of the Ni-63 quench curve for the LSC counters which is then used to determine Ni-63 counting efficiencies.
5.5 Precision and Bias
The overall uncertainty is determined from uncertainties in: Counting: Counting statistics and quench correction uncertainties. Generally, the counting statistic will dominate. Yielding: Yields determined by ICP-ES include uncertainties determined from repeated scans, and uncertainties that may be due to interfering elements. The latter may be minimized by measuring solutions that are at least one order of magnitude above the detection limit. If large dilutions are needed to compare standards to samples, dilution errors may also be important.
SAVANNAH RIVER NATIONAL LABORATORY Manual: L16.1 ANALYTICAL DEVEOPMENT Procedure: ADS-2452 ANALYTICAL OPERATING PROCEDURES Revision: 2 Page: 5 of 10 TECHNICAL REFERENCE Effective Date: 11/12/2007
5.6 Interferences
Since the nickel carrier is non-radioactive, it will not interfere with the counting of either Ni-63 or Ni-59. The determination of yield by carrier additions will be uncertain if the sample contains stable nickel in addition to the nickel added as carrier. Co-60 can interfere with this method; in samples high in Co-60 activity, addition of a small amount (< 1 mg) of cobalt carrier is a generally effective pretreatment in minimizing cobalt interference.
5.7 Equipment
Vacuum Filtration Apparatus Fume Hood General Laboratory Glassware Note: For accurate yielding, the use of metal containers or crucibles must be avoided in this procedure. Muffle Furnace Ceramic Crucibles Drying Oven Liquid Scintillation Counter Liquid Scintillation Cocktail (Ultima Gold AB)
High Purity Germanium Planar or Semi-Planar Detector and Associated Electronics. These include NIM bin power supply, high voltage power supply, spectroscopy-grade amplifier, and multichannel analyzer (MCA). The MCA may either be PC-based or external to the computer with a suitable interface.
5.8 Reagents
Eichrom Ni Columns or Cartridges - pre-packed.
SAVANNAH RIVER NATIONAL LABORATORY Manual: L16.1 ANALYTICAL DEVEOPMENT Procedure: ADS-2452 ANALYTICAL OPERATING PROCEDURES Revision: 2 Page: 6 of 10 TECHNICAL REFERENCE Effective Date: 11/12/2007
Nickel Carrier ~ 25,000 ppm Ni. Add ~ 3.33g of NiSO4•6H20 to 25 mL DI water. Cobalt Carrier ( Add ~ 0.37g Co(NO3)2•6H2O to 10mL DI water. Add more DI water so that the total solution weight is ~15 grams) 1M Sodium Citrate (add 25.8 g of sodium citrate to 80 mL of DI water, adjust volume to 100 mL with addition of DI water) Sodium Citrate Wash Solution - 15mL 1M sodium citrate diluted to 100 mL, add 1 drop of NH4OH. Test pH with some pH paper to confirm pH is between 8-10, if the pH goes beyond 10, use drops of HNO3 nitric to lower it. Nitric acid solution (3M) - 19.1 mL of concentrated nitric acid to 80 mL of DI water, dilute up to 100mL Nitric acid solution (1M) Add 64 mL of concentrated nitric acid to 900 mL of water and dilute to 1 liter with water.
5.9 Calibration Frequency The gamma-ray spectrometer must be maintained in accordance
with Ref. 3. The efficiency calibrations may be determined by • use of an efficiency curve using standards having gamma
rays with energies covering the Ni-59 regions of interest, or • direct comparison to a traceable Ni-59 standard. The liquid scintillation counter must be calibrated with standard solutions over a range of quench levels in order to determine a quench correction curve.
5.10 Calibration and Standardization The gamma detector energy calibration and QA records must be
maintained in accordance with Ref. 3. The LSC counter and its QA records must be maintained in accordance with Ref. 7.
Yields are determined by a ratio of the concentrations obtained
in the sample and carrier (or tracer if specified by the Analytical Task Supervisor) samples.
SAVANNAH RIVER NATIONAL LABORATORY Manual: L16.1 ANALYTICAL DEVEOPMENT Procedure: ADS-2452 ANALYTICAL OPERATING PROCEDURES Revision: 2 Page: 7 of 10 TECHNICAL REFERENCE Effective Date: 11/12/2007
5.11 Procedure Details Analyze a blank with each set of samples analyzed. The blank
shall contain the same aliquot size of carrier or tracer as the samples. General steps are provided below. In select cases as determined by the Task Supervisor, R&D directions will be provided for particular matrices. The customized directions shall be maintained in a Laboratory Notebook.
Solid Sample Preparation:
A1. Solid samples are spiked with 0.1 mL of nickel carrier prior to any sample digestion . A surrogate sample may be spiked with a nickel carrier instead of the actual samples to measure digestion recoveries if necessary.
A2. Using a small (about 50-mL) beaker, evaporate the sample dissolution (or the aliquot to be analyzed) to dryness in a drying oven at 100° C (Note: Do not exceed 105° C. The nickel nitrate complex will volatize at 130°C).
A3. Redissolve the sample in 5 mL of sodium citrate wash
solution. A4. Add 0.1 mL of cobalt carrier to the solution from step A3. A5. Continue at step D1.
Aqueous High Activity Sample Preparation:
B1. Add 0.1 mL of nickel carrier to 1 mL of sample in a small
glass beaker. Use a calibrated pipette for the sample measurements.
B2. Evaporate the samples to dryness in a drying oven at
100°C. B3. Add 0.1 mL of cobalt carrier to the sample from step B2.
SAVANNAH RIVER NATIONAL LABORATORY Manual: L16.1 ANALYTICAL DEVEOPMENT Procedure: ADS-2452 ANALYTICAL OPERATING PROCEDURES Revision: 2 Page: 8 of 10 TECHNICAL REFERENCE Effective Date: 11/12/2007
B4. Redissolve the sample in 5 mL of the sodium citrate wash solution.
B5. Continue at step D1. Environmental Water Sample Preparation
C1. Add 0.1 mL nickel carrier to 1000 mL of sample in a 2-L
glass beaker. C2. Evaporate the sample down to dryness in a drying oven. C3. Add 0.1mL of cobalt carrier to the sample from step C2. C4. Redissolve the sample in 20 mL of the sodium citrate
wash solution. C5. Continue on with step D1.
Nickel Separation
D1. Check the pH of the solution with pH paper, the pH
should be between 8- 10, if not contact the task supervisor.
D2. Check the necessary number of Eichrom Ni columns to
assure that they are full of resin, and that they have no visible void spaces. Label the columns with the sample ID’s, and pre-condition with 5 mL sodium citrate wash solution.
D3. Add the samples to the columns using transfer pipettes. D4. Replace the vials beneath the columns. D5. Add 5 mL of sodium citrate wash solution to the sample
beakers. Add that rinse solution to the columns. D6. Add 5 mL of sodium citrate wash solution to the columns
for a rinse.
SAVANNAH RIVER NATIONAL LABORATORY Manual: L16.1 ANALYTICAL DEVEOPMENT Procedure: ADS-2452 ANALYTICAL OPERATING PROCEDURES Revision: 2 Page: 9 of 10 TECHNICAL REFERENCE Effective Date: 11/12/2007
D7. Add 10 mL of sodium citrate wash solution to the columns for a rinse.
D8. Replace the vials beneath the columns with 50 mL
beakers labeled with the sample ID’s. D9. Elute the nickel from each column with 15 mL of 3M
HNO3. D10. Evaporate the samples to dryness at 100°C in a drying
oven. D11. Redissolve each sample in 3 mL of HNO3 nitric acid. D12. The Analytical Task Supervisor may specify other aliquot
sizes for sample preparation in steps D13 to D16. This is likely to happen if only one of the nickel isotopes is to be reported. Record the aliquot sizes in the laboratory notebook.
D13. Pipette 1.0 mL of the 3 mL sample from D11 into 19 mL
Ultima Gold AB in a 20-mL LSC vial for liquid scintillation analysis of Ni-63.
D14. Evaporate 1.0 mL of sample solution onto a stainless steel
planchet by successive additions of 0.1 mL. Secure the activity onto the plate with one layer of tape. Submit to the ADS Counting Room for LEPS analysis of Ni-59.
D15. Pipette 0.1 mL into 10 mL 1.0N nitric acid, submit this
solution to ICP-ES for yielding information. The result will be the "Sample Nickel Concentration."
D16. Pipette 0.1 mL of the nickel carrier into 10 mL 1.0N nitric
acid, submit this solution to ICP-ES for yielding information. The result will be the "Carrier Nickel Concentration."
5.12 Calculations
All calculations are completed by the Task Supervisor or a designee.
SAVANNAH RIVER NATIONAL LABORATORY Manual: L16.1 ANALYTICAL DEVEOPMENT Procedure: ADS-2452 ANALYTICAL OPERATING PROCEDURES Revision: 2 Page: 10 of 10 TECHNICAL REFERENCE Effective Date: 11/12/2007
5.12.1 Data Control
Preparation data are recorded on the preparation data sheet and recorded in the Radiochemistry Laboratory notebook. The final data packet, containing the prep sheet, computer printouts, and calculations are stored in the counting room data notebook and associated binders.
6.0 RECORDS
Data are recorded and maintained as described in Data Control section above. The AD LIMS is used as the primary data storage location.
7.0 REFERENCES
1. DOE Methods for Evaluating Environmental and Waste Management Samples, Nickel-59 and Nickel-63 Determination in Aqueous Samples, Method RP300 (October 1994).
2. Currie, L.A., Limits for Qualitative and Quantitative Determination, Analytical Chemistry 40, 586 (1968).
3. Manual L16.1, Procedure ADS-2420, Gamma Sample Preparation and Analysis.
4. Manual L16.1, Procedure ADS-1573, Radioactive and Non-Radioactive Sample Analysis on The Leeman Prodigy Inductively Coupled Plasma Emission Spectrometer.
5. Manual L16.1, Procedure ADS-2402, Gross Alpha and Beta Determinations by Liquid Scintillation Analyses.
6. Manual L16.1, Procedure ADS-2251, Dissolution of Radioactive and Non-radioactive Sludge, Soil and Biological Materials for Elemental Analysis by Microwave Acid Digestion.
8.0 ATTACHMENTS
None
Analytical Development Section Analytical Operating Procedures Volume 2
Manual: L16.1Procedure: ADS-2453
Revision: 3Plutonium TTA Extraction and Alpha Analysis Major Revision
Effective Date: 08/09/11Type-Category: Technical Page: 1 of 8
Electronic Approval on File:
Author/Analytical Task Supervisor: _________________________ C. C. DiPrete Peer Reviewer: __________________________ D. P. DiPrete AD Materials Characterization and Nuclear Measurements Group Manager ______________________ R. H. Young AD Procedure Coordinator: __________________________ M. S. Hanks
Procedure: ADS-2453Plutonium TTA Extraction and Alpha Analysis
Revision: 3Page: 2 of 8
1.0 INTRODUCTION
1.1 Purpose
This procedure is designed for analysis of a variety of sample types for the quantification of isotopic plutonium. This method utilizes traced radiochemical separations followed by α-pulse height analysis (for 238Pu and 239+240Pu) and/or liquid scintillation counting (for 241Pu).
1.2 Scope This analysis can be applied to a variety of different sample types to determine 238Pu, 239+240Pu, and 241Pu content. This procedure couples an extractive separation with alpha pulse height analysis to quantify 238Pu and 239+240Pu. The procedure is coupled to liquid scintillation analysis for the determination of 241Pu.
2.0 GENERAL INFORMATION
2.1 Responsibilities
1. Analysts are responsible for:
Reading, understanding, and following this procedure. Calling to the attention of the Task Supervisor any part of the
procedure that requires revision or that they believe to be unsafe.
2. Task Supervisor is responsible for:
Maintaining this procedure. Providing technical guidance.
3.0 PRECAUTIONS AND LIMITATIONS
3.1 Safety
1. Follow L1 2.32 Radiological Work Practices and 8Q Laboratory Safety Guidelines.
2. Make sure that collodion completely covers the plate or dish.
Procedure: ADS-2453Plutonium TTA Extraction and Alpha Analysis
Revision: 3Page: 3 of 8
3. The collodion solution contains anhydrous ethyl ether. Ethyl ether is flammable and may form peroxides. Ether solutions are tested for peroxide formation on a regularly scheduled basis (every 6 months). Ensure last test was within 6 months prior to using solution.
4. Ensure no open flames or spark sources are present when using collodion.
5. Read, understand, and follow applicable JHAs in Conduct of R&D packet.
4.0 PREREQUISITES
None
5.0 PROCEDURE
5.1 Description of Method
238Pu and 239+240Pu are quantified by alpha pulse height analysis of sample aliquots that have undergone a liquid-liquid extractive separation process using yield monitor (generally, 236Pu). The yield monitor is added to the samples at the beginning of the Pu separation. This is the first practical opportunity to begin the tracing process. Plutonium is reduced to Pu
+3; then oxidized to the extractable Pu
+4. The Pu
+4 is
extracted using thenoyltrifluoroacetone (TTA). The organic extract is analyzed for alpha-emitting isotopes (Pu isotopes) by alpha pulse height analysis (α-PHA) in accordance with procedure L16.1, ADS-2402. The 238Pu is quantified by applying the ratio of the 238Pu and 236Pu alpha peaks to the known activity of the 236Pu which was initially added to the sample. The same logic is used for the 239+240Pu quantification. This approach allows for the correction of each individual sample based on its own separation yield. Americium, curium, lanthanides, uranium, cesium, and strontium are not TTA-extractable under the acidic conditions of the plutonium extraction. Neptunium is oxidized to the non-extractable Np
+5. Thorium is partially extracted, but is
effectively removed with a 2 M acid scrub. 241Pu is quantified by liquid scintillation counting (LSC) of additional sample aliquots which have not been spiked with tracer, but which have undergone column separations to provide Pu-containing aliquots of the samples. The LSC of the Pu-containing aliquots are expected to have activity in the low energy (a.k.a., tritium) region of the spectrum from 241Pu, and activity identified as alpha activity (from LSC alpha/beta discrimination software) from the 238,239,240Pu. Provided the column-separated aliquots contain only Pu, the ratio of the 241Pu to alpha-Pu from LSC can be applied to the sum of the 238,239,240Pu from the alpha PHA to calculate the 241Pu content of each sample. This approach provides traced 241Pu analyses via the tracing of the alpha plates.
Procedure: ADS-2453Plutonium TTA Extraction and Alpha Analysis
Revision: 3Page: 4 of 8
In some cases, the 241Pu can not be calculated as described in the previous paragraph; rather, it must be determined using the recovery of the LSC analysis of the blank spike.
5.2 Data Quality The quality assurance and quality control protocols applicable to samples prepared and analyzed using this procedure are dependent upon the Data Quality Objectives (DQOs), when supplied. In the absence of specific DQOs, preparation QC is addressed in the R&D Directions: batch blanks to monitor for potential contamination from the preparation process, serial dilutions to monitor for matrix interference effects, and blank spikes are several examples of quality indicators which can be utilized for this procedure. Since a tracer with known activity is utilized during sample preparation, alpha detector efficiency does not need to be known. Quantification depends upon accurately knowing the activity of the tracer, acceptable peak shape and acceptable peak area. All of the detectors are measurement systems and equipment (MS&E) and, as such, comply with the requirements set forth by Manual 1Q, 2-7.
5.3 Quality Control As mentioned in the previous section, the quality control samples are often customized to meet the customer’s DQOs. In the absence of DQOs, the following quality control samples are usually prepared with each batch of samples: batch blanks to monitor for potential contamination from the preparation process, serial dilutions to monitor for matrix interference effects, blank spikes of a Pu isotope different from the tracer isotope, and aliquots of the tracer to ensure it is not contaminated with additional Pu isotopes. It should be noted that the recovery of the tracer is not required to be within specified limits. Due to the nature of the analyses, aggressive decontamination steps may be required to sufficiently remove interfering isotopes from the Pu-containing material. Tracer recovery must only be high enough to provide sufficient counting statistics in the final analysis.
1. Alpha PHA Quality Control
For unqualified release of data from the alpha PHA measurement quantifying 238Pu and 239+240Pu:
Procedure: ADS-2453Plutonium TTA Extraction and Alpha Analysis
Revision: 3Page: 5 of 8
A. The blank contribution should be less than 10% of the sample result for the lowest activity sample in the batch,
B. The serial dilution sample result for the major Pu isotope must agree with the sample result within 3 sigma.
C. The blank spike recovery should be 80-120%.
D. The aliquot of the tracer should contain no contamination greater than 10% of the activity in the samples being analyzed.
If QC indicators fall outside of these ranges, the Task Supervisor must determine whether the data is fit for release with additional scrutiny and/or qualifiers. The alpha PHA instrumentation is calibrated weekly in accordance with procedure L16.1, ADS-2405.
2. Liquid Scintillation Counting Quality Control
For unqualified release of data from the LSC measurement quantifying 241Pu:
A. The blank contribution should be less than 10% of the sample result for the lowest activity sample in the batch
B. The blank spike recovery (which might be used to determine batch recovery) should be sufficient to provide adequate counting statistics.
If QC indicators fall outside of these ranges, the Task Supervisor must determine whether the data is fit for release with additional scrutiny and/or qualifiers. The liquid scintillation counters are calibrated daily as described in Manual L16.1, ADS-2424.
5.4 Equipment
See Attachment 1.
5.5 Reagents NOTE: This is a list of many of the reagents used. It will not be exhaustive since the separation is fined-tuned for each batch of samples analyzed. NOTE: Unless otherwise stated, American Chemical Society (ACS) reagent grade chemicals shall be used.
Procedure: ADS-2453Plutonium TTA Extraction and Alpha Analysis
Revision: 3Page: 6 of 8
Aluminum nitrate solution – (Al (NO
3)3) 2 M – Prepared by placing 190 g of Al
(NO3)3•9H
2O in a 250-mL volumetric flask and adding 150 mL of water. Stir and
heat until dissolved, then cool, dilute to 250 mL with water, and transfer to a 250-mL polyethylene bottle. Label, initial, and date the bottle. Collodion solution (ensure peroxide testing has been performed within the past 6 months prior to opening bottle, and ensure no open flames or spark sources are present prior to opening the bottle) - To prepare, add 0.5 mL of collodion to 50 mL of isopropyl alcohol. Mix, then transfer to an amber glass bottle with a ground glass stopper. Apply a “Flammable” label. Properly label, date and initial the bottle. Remove small quantities as needed. Ferric nitrate solution – (Fe (NO
3)3) 0.025 M – To prepare, dissolve 1.0 g of Fe
(NO3)3 •9 H
2O in 100 mL of water. Mix well, and then transfer to a 125-mL
polyethylene bottle. Label, initial, and date the bottle. MAKE FRESH WEEKLY! Hydroxylamine hydrochloride solution – (NH
2OH•HCl) 5 M – To prepare, dissolve
17.4 g of NH2OH•HCl in 35 mL of water contained in a 50-mL volumetric flask.
Dilute to 50 mL with water, mix well then transfer to a 125-mL polyethylene bottle. Label, initial, and date the bottle. MAKE FRESH WEEKLY! Nitric Acid Solution – (HNO
3) 1 M – To prepare, carefully pour 63 mL of
concentrated nitric acid into 800 mL of water contained in a one-liter volumetric flask. Mix well. Dilute to one liter with water, and mix again. Transfer to a one-liter polyethylene bottle. Label, initial, and date the bottle. Sodium nitrite solution – (NaNO
2) 4 M – To prepare, dissolve 6.9 g of NaNO
2 in
15 mL of water. Dilute to 25 mL with water, and then transfer to a 1-oz. polyethylene bottle. Label, initial, and date the bottle. MAKE FRESH DAILY! Thenoyltrifluoroacetone solution – (TTA, 0.5M) (ensure there are no open flames or spark sources prior to opening the petroleum ether bottle). To prepare, dissolve 28 g of TTA in 200 mL of petroleum ether. Dilute to 250 mL with petroleum ether, mix well, then transfer to a 500-mL amber glass bottle with a ground glass stopper. Apply a “Flammable” label. Properly label, date and initial the bottle.
5.6 Analysis
Prepare samples as instructed by the Task Supervisor in the R&D Directions. The final plates should be prepared as described in Manual L16.1, ADS-2405. NOTE: The alpha plates are to be analyzed using alpha pulse height analysis instrumentation. Peaks corresponding to Pu isotopes are integrated and used for
Procedure: ADS-2453Plutonium TTA Extraction and Alpha Analysis
Revision: 3Page: 7 of 8
calculations. Pu-241, if needed, is determined via liquid scintillation counting of an additional aliquot of the separated samples.
5.7 Calculations
All calculations are completed by the Task Supervisor or a trained designee using spreadsheets which have been validated.
5.8 Data Control Sample preparation data are recorded on the preparation data sheet and recorded in the Radiochemistry Laboratory notebook. The final data packet, containing the prep sheet, computer printouts, and calculations are stored in the counting room data notebook and associated binders.
6.0 REFERENCES
1. Selected Measurement Methods for Plutonium and Uranium in the Nuclear Fuel Cycle, edited by C. J. Rodden, UACEC, p.392-398, 1972.
2. Solvent Extraction of Metals, A. K. De, S. M. Khopkar, R. A. Chalmers, Van Nostrand Reinhold Co., London, p. 57-65, 1970.
3. The Chemistry of the Transuranium Elements, C. Keller, Verlag Chemie, p.454, 1971.
4. Manual L16.1, Procedure ADS-2402, “Alpha Pulse Height Analysis.”
5. Manual L16.1, Procedure ADS-2405, “Alpha and Beta Plate Making Direct Mount and Count.”
6. Manual L16.1, Procedure ADS-2424, “Gross Alpha/Beta Determination by Liquid Scintillation Counting.”
7.0 RECORDS Data are recorded and maintained as described in Section 5.8. The ADS LIMS (Laboratory Information Management System) is used as the primary data storage location.
8.0 ATTACHMENTS
Attachment 1 - Equipment
Procedure: ADS-2453Plutonium TTA Extraction and Alpha Analysis
Revision: 3Page: 8 of 8
Attachment 1
Equipment
Equipment (SRS stocked)
1. Assorted Pyrex beakers
2. Assorted polyethylene bottles
3. Assorted automatic pipets, 1mL 10 mL
4. Equipment associated with alpha mounting (ADS-2405)
5. Disposable plastic droppers
6. 4-dram vials with polyseal caps
7. 500 mL amber glass bottles with ground glass stoppers
8. Vortex mixer
9. Hot plate NOTE: This is not an exhaustive list; equipment will change with each batch of samples.
Analytical Development Section Analytical Operating Procedures Volume 2
Manual: L16.1Procedure: ADS-2462
Revision: 0Gamma Sample and Tc-99m Analysis on Nal Well Detector
Effective Date: 01/19/11Type-Category: Technical Page: 1 of 5
1.0 INTRODUCTION
1.1 Purpose
This procedure covers the application of the NaI (TI) gamma well detector to the detection, identification and quantification of gamma rays from a variety of low- to moderate-density sample matrices. The detector described in this procedure is typically used to quantify Tc-99m for yield determination after traced radiochemical separations.
1.2 Scope
This procedure applies to gamma pulse height analysis (PHA) using a NaI (Tl) detector. Typically, this type of detector is used in the AD radiochemical laboratory for gamma-PHA associated with tracer yield determination. This detector is most often used for Tc-99m traced separations.
Although gamma PHA is relatively simple, specific and rapid, there are limitations that must be taken into account. The detector must be carefully energy calibrated with known standards. Detection efficiencies for gamma-rays vary with energy and must be obtained during the calibration process. The relative amount of activity in the counting vial must be within an optimum range for accurate work. Also, the relative abundance of the various gamma nuclides in the samples has an effect on the quality of the data. Higher energy gammas can interfere with, or even mask, low energy gamma rays.
2.0 GENERAL INFORMATION
2.1 Responsibilities
1. Analysts are responsible for:
Reading, understanding and following this procedure.
Calling to the attention of the Task Supervisor any part of the procedure that requires revision or that they believe to be unsafe.
Reading, understanding and following applicable Job Hazards Analyses (JHAs) in Conduct of R&D packet.
2. Task Supervisor is responsible for:
Maintaining this procedure.
Procedure: ADS-2462Gamma Sample and Tc-99m Analysis on Nal Well Detector
Revision: 0Page: 2 of 5
Providing technical guidance.
2.2 Definitions and Abbreviations
CTF - Cognizant Technical Function
JHA - Job Hazards Analysis
R&D - Research and Development
FWHM - Full Width Half Maximum
PHA - Pulse Height Analysis
M&TE – Measuring and Test Equipment
MCP – Measurement Control Program
MS&E – Measurement Systems and Equipment
3.0 PRECAUTIONS AND LIMITATIONS
3.1 Safety
1. Follow L1, 2.32 Radiological Work Practices and 8Q Laboratory Safety Guidelines.
2. Read, understand, and follow applicable Job Hazards Analyses (JHAs) in Conduct of R&D packet.
3. Per JHA, be cautious of moving parts, lead, and pinch points.
4. Carefully examine all packaging prior to handling radioactive samples for evidence of leaks.
4.0 PREREQUISITES
None
5.0 PROCEDURE
5.1 Equipment
1. NaI (Tl) gamma detector, and associated gamma spectroscopy electronics
A. History file and MCP for individual detectors will contain manufacturer, model number, and serial number.
2. Canberra Genie 2K gamma spectroscopy software or equivalent gamma spectroscopy software.
Procedure: ADS-2462Gamma Sample and Tc-99m Analysis on Nal Well Detector
Revision: 0Page: 3 of 5
5.2 Standards
1. The standard utilized for establishing and validating energy calibration is a NIST-traceable gamma ray standard.
2. If necessary, standards are diluted gravimetrically utilizing standard industry practice prior to use. Balances utilized for the preparation are M&TE (measuring and test equipment) and, as such, comply with the requirements set forth by Manual 1Q, 12-1.
3. Quality control standards are often prepared from the same source as the calibration standards. These standards are validated using previously validated standards from an independent lot. Documentation of standard preparation, including M&TE identification, is maintained in a logbook and is referenced in the calibration spreadsheet.
5.3 Energy Calibration
Energy calibration is performed using a NIST-traceable standard in conjunction with the Genie 2000 data acquisition system. The energies of Am-241 (59.5keV) and Cs-137 (661.6keV) are typically used to calibrate the energy of the detector.
5.4 Efficiency Calibration
Since the detector is being used for intra-batch comparison, the efficiency of the detector does not need to be determined. Only the relative area of the Tc-99m (or other tracer) peak in the separated samples to the area of the Tc-99m (or other tracer) peak in the standard is being determined.
5.5 Routine System Verification/QA Check
1. Energy
A check-source, prepared using the NIST-traceable standard, is counted each day that samples are analyzed. The Cs-137 peak energy at 661.6 keV will be controlled to 1.5 keV for warning limits and 2 keV for control limits. Should the energy validation of the Cs-137 peak fail the acceptance criteria, the system will be evaluated by the CTF. The result of the evaluations and the recalibration (if necessary) will be documented in the logbook and/or in the MS&E history file.
2. Full Width at Half-Maximum
As a further control of detector stability, the resolution of the detector is also monitored for any sudden changes. The full-width at half maximum (FWHM) of the Cs-137 peak in the check standard is measured with each check standard count. The FWHM will be controlled to 2.0 keV for warning limits and 3.0 keV for control limits of the average value for that peak. This is based on data, as well as logic. When the resolution of the HPGe
Procedure: ADS-2462Gamma Sample and Tc-99m Analysis on Nal Well Detector
Revision: 0Page: 4 of 5
detectors are compared to the NaI detector, a multiple of 10 is logical for the QA parameters.
3. Response to Non-Conforming Conditions
The results from the Routine System Verification/QA Check are evaluated daily prior to detector use. Any checks outside of the control limits require immediate attention; no further analytical analyses can be performed until the event causing the failure has been resolved.
5.6 Sample Analysis
1. Ensure the detector has had QA successfully completed prior to counting the sample.
2. Count each sample vial for one minute twice. The first count is performed with a given orientation, and the second count is performed with the vial rotated 180 degrees from the first-count orientation.
3. For each count, record the file ID, start time, area, % uncertainty, date, and detector on the prep sheet.
4. Once all vials in the batch have been counted, photocopy the hand-written gamma data from the previous step, record the logbook ID on the photocopy, and insert the photocopied entry into the logbook.
5. Data and samples are given to Counting Room personnel. Samples are then measured by liquid scintillation counting.
6. Gamma analysis and liquid scintillation data are used to quantify Tc-99 in the samples being analyzed.
5.7 Data Control
1. Sample preparation data are recorded on the preparation data sheet and recorded in the Radiochemistry Laboratory notebook.
2. The final data packet, containing the prep sheet, computer printouts, data from gamma counting, and calculations are stored in the counting room data notebook and associated binders.
6.0 REFERENCES
1. Nuclear and Radiochemistry, G. Friedlander, J.W. Kennedy, E.S. Macias, J.M. Miller, 3rd Ed., pp. 243-286
2. Genie 2000 Operations Manual, Canberra Industries, Inc., 2002.
3. Genie 2000 Customization Tools Manual, Canberra Industries, Inc., 2002.
Procedure: ADS-2462Gamma Sample and Tc-99m Analysis on Nal Well Detector
Revision: 0Page: 5 of 5
4. Manual 1Q, 12-1 (current revision), Control of Measuring and Test Equipment
5. Manual 1Q, 2-7 (current revision), QA Program Requirements for Analytical Measurement Systems
7.0 RECORDS
Data are recorded and maintained as described in the Data Control section above.
8.0 ATTACHMENTS
None
SAVANNAH RIVER NATIONAL LABORATORY Manual: L16.1 ANALYTICAL DEVELOPMENT Procedure: ADS - 2502 AD ANALYTICAL OPERATING PROCEDURES Revision: 6 Page: 1 of 11 TECHNICAL REFERENCE Effective Date: 03/20/08
Alkali Fusion Dissolutions of Sludge Approved by: and Glass for Elemental and Anion APPROVAL ON FILE Analysis (U) AD Manager ______________________________________________________________________________________________ 1.0 PURPOSE: This procedure describes fusion dissolution methods to prepare sludge and
glass for elemental and ion analyses. 2.0 SCOPE: This procedure describes a Na2,O2/NaOH fusion method for dissolving samples.
Other alkali hydroxides (NaOH, KOH, CsOH) and alkali carbonates (Li2CO3,Na2CO3, K2CO3, Cs2CO3) can be used with minimal changes to this procedure.
These dissolution methods are used to prepare sludge and glass, for elemental
and anion analysis. The dissolution method produces solutions for analysis by Inductively Coupled Plasma - Atomic Emission Spectroscopy (ICP-AES) and Ion Chromatography (IC). Except for the alkali metals and crucible material, all elements that are of interest in SRS waste and residue can be measured in the solution. However, elemental analysis can be optimized by using tandem dissolutions consisting of the fusion procedure described here and a sealed-vessel acid dissolution.
3.0 PRECAUTIONS AND LIMITATIONS
3.1 Safety
3.1.1 Sodium peroxide is a powerful oxidizing agent and can cause explosions when mixed with certain organic chemicals and materials. This material is an extremely corrosive chemical that must be handled with great care. CONTACT SUPERVISION. Keep the Na2O2 container tightly closed and in a dry place.
3.1.2 Alkali peroxides, hydroxides, and carbonates are extremely
corrosive chemicals that must be handled with great care. Always wear laboratory gloves, lab coat, and safety glass or goggles when weighing these materials or using them in the fusion dissolution procedure.
SAVANNAH RIVER NATIONAL LABORATORY Manual: L16.1 ANALYTICAL DEVELOPMENT Procedure: ADS - 2502 AD ANALYTICAL OPERATING PROCEDURES Revision: 6 Page: 2 of 11 TECHNICAL REFERENCE Effective Date: 03/20/08
3.1.3 Concentrated hydrochloric acid and nitric acid are extremely corrosive and toxic chemicals. The acids will produce burns, ulcerations, scarring on the skin, and mucous membranes (mouth and respiratory tract).
3.1.4 Always wear protective gloves, safety glasses, and a laboratory
coat during all fusion and uptake operations. 3.1.5 Perform all fusion and uptake steps in a shielded cell or a fume
hood.
3.1.6 The temperature of the alkali fusion will result in air combustion of organic materials, which can be manifested by a brief flame in the crucible. If it is known that organic materials are in the sample. Sample sizes are limited to 0.1g unless approved by Task Supervisor. This reduces the amount of combustible material. A face shield and heavy leather or Kevlar gloves must be worn when either placing the crucible in the muffle furnace or when removing it from the furnace. A pair of tongs must be used when placing crucibles into a hot furnace or when removing the crucibles.
3.1.7 Make up all solutions in a fume hood, and always wear protective gloves when handling any chemicals to avoid skin contact.
3.1.8 Inspect all glassware before and after each use for cracks, chips,
or jagged edges. Remove from service and dispose of faulty glassware in waste glass containers.
4.0 PREREQUISITE ACTIONS
4.1 Description of Method
A dried, powdered sample is fused with a mixture of sodium peroxide and sodium hydroxide at 675°C ± 10°C for 10 minutes in a zirconium (Zr) crucible. A nickel (Ni) crucible can be used when directed by the Task Supervisor. After brief cooling, deionized water is added and the mixture is swirled until the melt is decomposed. This alkaline slurry of metal hydroxides is then acidified with concentrated hydrochloric acid or nitric acid. This solution is transferred to a 250-mL volumetric flask and diluted with deionized water to the mark. A ten-fold volumetric dilution of this solution is made for elemental analysis.
SAVANNAH RIVER NATIONAL LABORATORY Manual: L16.1 ANALYTICAL DEVELOPMENT Procedure: ADS - 2502 AD ANALYTICAL OPERATING PROCEDURES Revision: 6 Page: 3 of 11 TECHNICAL REFERENCE Effective Date: 03/20/08
The carbonate fusions must be performed using Pt or Pt-Au crucibles. The carbonate fusions require temperatures of 875˚- 1100˚ C. The fusion decomposes the sample and converts the elements to metallic hydroxides or water-soluble sodium compounds. Addition of concentrated HCI or HNO3 dissolves the metal hydroxides. A similar method is used to dissolve samples for anion analysis, except that no acid is needed to keep the water-soluble anions in solution.
4.2 Data Quality
4.2.1 The quality of sludge and glass elemental analyses depends on both the qualities of the dissolution and the instrumental analysis. It is easy to assess the quality of glass analyses because glass standards are available for analysis. Sludge standards are not available, and the dissolution method is usually verified by analyzing a glass standard.
4.2.2 All reagents shall conform to specifications of the Committee on
Analytical Reagents of the American Chemical Society (ACS), where such specifications are available.
4.2.3 Analytical balances shall have a current QC calibration for the
balance/balance weight combination. 4.2.4 The Alkali fusion dissolution for elemental and anion analysis is
highly effective. It is one of the most rigorous dissolution techniques commonly used for sludge and glass matrices. Excellent results can be obtained when careful technique is used.
4.2.5 Most elements except the alkali used in the fusion and the
crucible material (Zr or Ni) can be analyzed with a sensitivity of about 0.25 wt. % in the original solid. Because of their volatility at 675°C, As, Cd, Cs, Hg, Os, P, Rb, Re, Ru, Te, and Se oxides are partially or completely lost during the fusion. Most of these oxides can be most reliably determined by using the sealed-vessel acid dissolution. However, the fusion dissolution should be used for Ru determination since the acid dissolution appears to result in incomplete dissolution of Ru.
SAVANNAH RIVER NATIONAL LABORATORY Manual: L16.1 ANALYTICAL DEVELOPMENT Procedure: ADS - 2502 AD ANALYTICAL OPERATING PROCEDURES Revision: 6 Page: 4 of 11 TECHNICAL REFERENCE Effective Date: 03/20/08
4.3 Equipment
55 mL Zirconium or Nickel Crucibles (used for perioxide alkali hydroxide fusions)
Platinum or Platinum Gold crucibles (used for carbonate fusions) Muffle Furnace Tongs – stainless steel Heat Protective Gloves 250 mL Plastic Volumetric Flasks 250 mL Plastic Bottles 100 mL Plastic Bottles Plastic Funnel Analytical Balance-Capable of reading to at least 1 mg and preferably
0.1 mg Timer
4.4 Reagents
Concentrated Hydrochloric Acid (HCl) – reagent grade Concentrated Nitric Acid (HNO3) – reagent grade
Sodium Peroxide (Na2O2) - Lot analysis on container must be less than
0.001 wt. % in any cation to analyzed. Usually, reagent grade is sufficiently pure.
Cesium Hydroxide-CsOH – Aldrich product is recommended because of
its high purity.
Potassium Hydroxide – KOH – Aldrich product is recommended Sodium Hydroxide (NaOH) - Ultrapure. Lithium Carbonate, Sodium Carbonate, Potassium Carbonate, Cesium
Carbonate – Aldrich or Alfa product is recommended.
SAVANNAH RIVER NATIONAL LABORATORY Manual: L16.1 ANALYTICAL DEVELOPMENT Procedure: ADS - 2502 AD ANALYTICAL OPERATING PROCEDURES Revision: 6 Page: 5 of 11 TECHNICAL REFERENCE Effective Date: 03/20/08 5.0 PERFORMANCE
5.1 Preparation of Alkali Fusion Blank
5.1.1 At least 1 hour before starting the fusion, pre-heat the muffle furnace to 675oC + 10oC. For carbonate fusions, see Task Supervisor.
5.1.2 Tare a clean, dry crucible. For the type of crucible, see Task
Supervisor.
5.1.3 Add the appropriate fusion material. a) Carefully add 1.5 g Na2O2 (± 0.1g) and 1.0 g of NaOH (± 0.1 g)
to the crucible. OR
b) Carefully add 2.5 g alkali hydroxide (CsOH or KOH or NaOH)
(± 0.1g) to the crucible. OR c) 2.5 g alkali carbonate (Li2CO3, Na2, CO3, K2CO3, CS2CO3.) 5.1.4 If instructed by the Task Supervisor, place the lid on the
crucible. Use of crucible lids are required only if specified by the Task Supervisor.
5.1.5 Open the furnace door and quickly place the crucible in the
furnace. Be sure to have heat-resistant gloves on and use the tongs to grasp the crucible. Immediately close the furnace door to minimize heat loss.
5.1.6 After heating the furnace temperature increases to 675 °C
again, note the time and heat the crucible for 10 minutes, then remove it from the furnace and set it on a clean, dry surface.
5.1.7 Place a plastic funnel in the mouth of a plastic 250-mL
volumetric flask. Plastic funnels and flasks are used to avoid dissolving any glass, which could affect the results.
SAVANNAH RIVER NATIONAL LABORATORY Manual: L16.1 ANALYTICAL DEVELOPMENT Procedure: ADS - 2502 AD ANALYTICAL OPERATING PROCEDURES Revision: 6 Page: 6 of 11 TECHNICAL REFERENCE Effective Date: 03/20/08
5.1.8 Let the crucible cool for 3 or 4 minutes, then squirt about 5 mL of deionized water into the crucible. The water will react with the residue and begin to dissolve some of the salts. It is important to add the water while the crucible is warm (but not extremely hot) so that the melt residue will break up readily. If the crucible gets too cool before the water is added, it requires more effort to break up the melt residue. If the water is added when the crucible is too hot, then splattering will cause loss of sample and low ICP-AES results.
5.1.9 Pour the contents in the crucible into the volumetric flask. 5.1.10 Rinse the crucible with several 15-20 mL portions of deionized
water. After the water is added, carefully swirl the crucible and then transfer the contents to the volumetric flask. After several rinses, there should be no solid residue in the crucible.
5.1.11 Add 25.0 mL of concentrated HCl or HNO3 to the crucible.
Swirl the crucible and pour the contents into the volumetric flask.
5.1.12 Add about 10 mL of deionized water to the crucible. Swirl the
crucible and pour the contents into the volumetric flask. 5.1.13 The volumetric flask should now contain about 200 mL of
solution from all the rinses. Cap the flask and shake it to mix the contents. The solids in the flask should now dissolve in the acid solution. If solids remain in the flask, notify the Task Supervisor.
5.1.14 Uncap the flask and add deionized water to the mark on the
flask. 5.1.15 Cap the flask and shake it to mix the contents. 5.1.16 Pour the solution into a 250-mL plastic bottle. Label the bottle
as Alkali Fusion Blank.
SAVANNAH RIVER NATIONAL LABORATORY Manual: L16.1 ANALYTICAL DEVELOPMENT Procedure: ADS - 2502 AD ANALYTICAL OPERATING PROCEDURES Revision: 6 Page: 7 of 11 TECHNICAL REFERENCE Effective Date: 03/20/08
5.2 Fusion Dissolutions of Samples
NOTE: If glass is to be dissolved, it must be finely crushed glass the consistency of fine talcum powder. If the glass is not already finely crushed, either return the glass to the customer for crushing or use glass crushers (or grinders) in the laboratory to crush the glass. If there is any doubt as to whether the glass is fine enough for dissolution ask the Task Supervisor or use sieve pans to obtain -200 mesh powder.
NOTE: Radioactive samples must be dissolved in a radioactive hood or
shielded cells depending on the activity of the sample. Consult with the Task Supervisor on where radioactive samples should be dissolved.
NOTE: Non-radioactive samples can be dissolved in a non-radioactive
hood. 5.2.1 Pre-heat the muffle furnace to 675°C ± 10°C. For carbonate
fusions see the Task Supervisor. 5.2.2 Tare a clean, dry Zr or Ni crucible on the analytical balance.
For carbonate fusions, see Task Supervisor. 5.2.3 Carefully add 0.25g (to either 3 or 4 places, depending on the
balance of finely crushed sample to the crucible. The sample weight can be modified as directed by the Task Supervisor.
NOTE: Slurry samples must be dried prior to dissolution. The sample
weight will then be either the original slurry weight for the dry weight which can be obtained by measuring the total solids. Reference: ADS Procedure ADS-2284 “Procedure for Measuring Weight % Total Solids, Soluble Solids, and Insoluble Solids, Rev. 0 5/15/2003.”
5.2.4 Record the sample weight in the dissolution lab notebook and
the Data Sheet.
5.2.5 Add the appropriate fusion material.
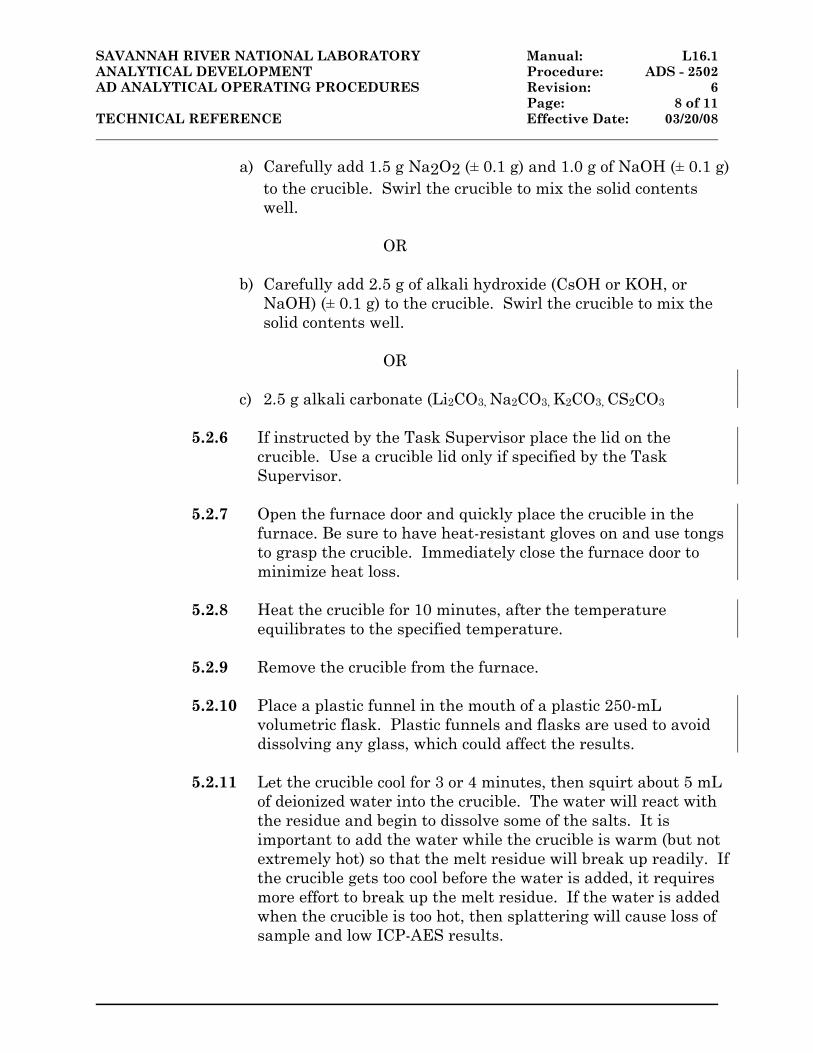
SAVANNAH RIVER NATIONAL LABORATORY Manual: L16.1 ANALYTICAL DEVELOPMENT Procedure: ADS - 2502 AD ANALYTICAL OPERATING PROCEDURES Revision: 6 Page: 8 of 11 TECHNICAL REFERENCE Effective Date: 03/20/08
a) Carefully add 1.5 g Na2O2 (± 0.1 g) and 1.0 g of NaOH (± 0.1 g) to the crucible. Swirl the crucible to mix the solid contents well.
OR
b) Carefully add 2.5 g of alkali hydroxide (CsOH or KOH, or
NaOH) (± 0.1 g) to the crucible. Swirl the crucible to mix the solid contents well.
OR
c) 2.5 g alkali carbonate (Li2CO3, Na2CO3, K2CO3, CS2CO3
5.2.6 If instructed by the Task Supervisor place the lid on the crucible. Use a crucible lid only if specified by the Task Supervisor.
5.2.7 Open the furnace door and quickly place the crucible in the
furnace. Be sure to have heat-resistant gloves on and use tongs to grasp the crucible. Immediately close the furnace door to minimize heat loss.
5.2.8 Heat the crucible for 10 minutes, after the temperature
equilibrates to the specified temperature. 5.2.9 Remove the crucible from the furnace.
5.2.10 Place a plastic funnel in the mouth of a plastic 250-mL
volumetric flask. Plastic funnels and flasks are used to avoid dissolving any glass, which could affect the results.
5.2.11 Let the crucible cool for 3 or 4 minutes, then squirt about 5 mL
of deionized water into the crucible. The water will react with the residue and begin to dissolve some of the salts. It is important to add the water while the crucible is warm (but not extremely hot) so that the melt residue will break up readily. If the crucible gets too cool before the water is added, it requires more effort to break up the melt residue. If the water is added when the crucible is too hot, then splattering will cause loss of sample and low ICP-AES results.
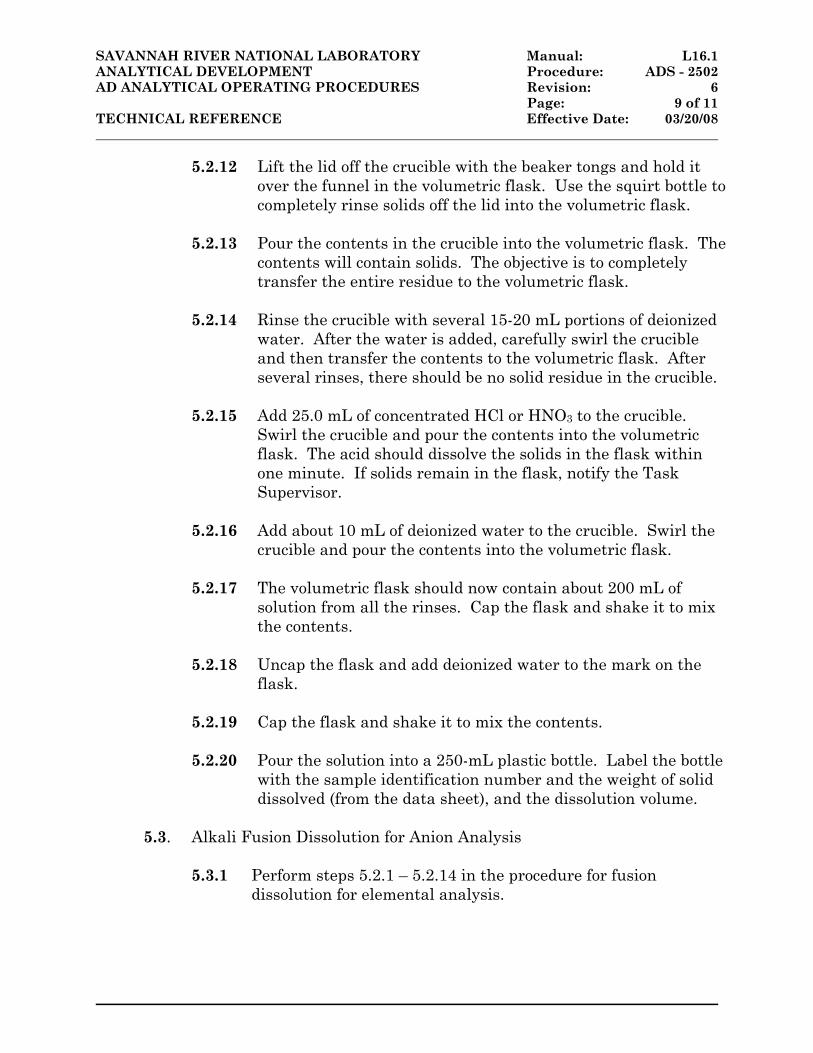
SAVANNAH RIVER NATIONAL LABORATORY Manual: L16.1 ANALYTICAL DEVELOPMENT Procedure: ADS - 2502 AD ANALYTICAL OPERATING PROCEDURES Revision: 6 Page: 9 of 11 TECHNICAL REFERENCE Effective Date: 03/20/08
5.2.12 Lift the lid off the crucible with the beaker tongs and hold it over the funnel in the volumetric flask. Use the squirt bottle to completely rinse solids off the lid into the volumetric flask.
5.2.13 Pour the contents in the crucible into the volumetric flask. The
contents will contain solids. The objective is to completely transfer the entire residue to the volumetric flask.
5.2.14 Rinse the crucible with several 15-20 mL portions of deionized
water. After the water is added, carefully swirl the crucible and then transfer the contents to the volumetric flask. After several rinses, there should be no solid residue in the crucible.
5.2.15 Add 25.0 mL of concentrated HCl or HNO3 to the crucible.
Swirl the crucible and pour the contents into the volumetric flask. The acid should dissolve the solids in the flask within one minute. If solids remain in the flask, notify the Task Supervisor.
5.2.16 Add about 10 mL of deionized water to the crucible. Swirl the
crucible and pour the contents into the volumetric flask. 5.2.17 The volumetric flask should now contain about 200 mL of
solution from all the rinses. Cap the flask and shake it to mix the contents.
5.2.18 Uncap the flask and add deionized water to the mark on the
flask.
5.2.19 Cap the flask and shake it to mix the contents. 5.2.20 Pour the solution into a 250-mL plastic bottle. Label the bottle
with the sample identification number and the weight of solid dissolved (from the data sheet), and the dissolution volume.
5.3. Alkali Fusion Dissolution for Anion Analysis
5.3.1 Perform steps 5.2.1 – 5.2.14 in the procedure for fusion
dissolution for elemental analysis.
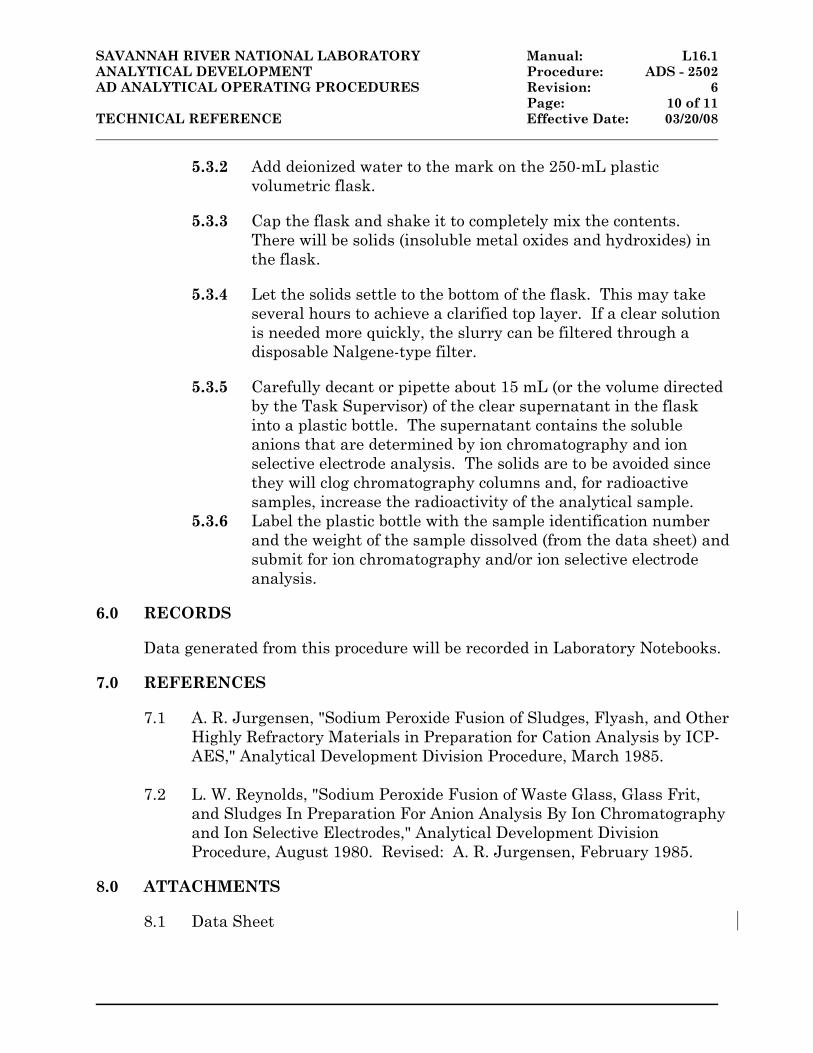
SAVANNAH RIVER NATIONAL LABORATORY Manual: L16.1 ANALYTICAL DEVELOPMENT Procedure: ADS - 2502 AD ANALYTICAL OPERATING PROCEDURES Revision: 6 Page: 10 of 11 TECHNICAL REFERENCE Effective Date: 03/20/08
5.3.2 Add deionized water to the mark on the 250-mL plastic volumetric flask.
5.3.3 Cap the flask and shake it to completely mix the contents.
There will be solids (insoluble metal oxides and hydroxides) in the flask.
5.3.4 Let the solids settle to the bottom of the flask. This may take
several hours to achieve a clarified top layer. If a clear solution is needed more quickly, the slurry can be filtered through a disposable Nalgene-type filter.
5.3.5 Carefully decant or pipette about 15 mL (or the volume directed
by the Task Supervisor) of the clear supernatant in the flask into a plastic bottle. The supernatant contains the soluble anions that are determined by ion chromatography and ion selective electrode analysis. The solids are to be avoided since they will clog chromatography columns and, for radioactive samples, increase the radioactivity of the analytical sample.
5.3.6 Label the plastic bottle with the sample identification number and the weight of the sample dissolved (from the data sheet) and submit for ion chromatography and/or ion selective electrode analysis.
6.0 RECORDS Data generated from this procedure will be recorded in Laboratory Notebooks. 7.0 REFERENCES
7.1 A. R. Jurgensen, "Sodium Peroxide Fusion of Sludges, Flyash, and Other Highly Refractory Materials in Preparation for Cation Analysis by ICP-AES," Analytical Development Division Procedure, March 1985.
7.2 L. W. Reynolds, "Sodium Peroxide Fusion of Waste Glass, Glass Frit,
and Sludges In Preparation For Anion Analysis By Ion Chromatography and Ion Selective Electrodes," Analytical Development Division Procedure, August 1980. Revised: A. R. Jurgensen, February 1985.
8.0 ATTACHMENTS
8.1 Data Sheet
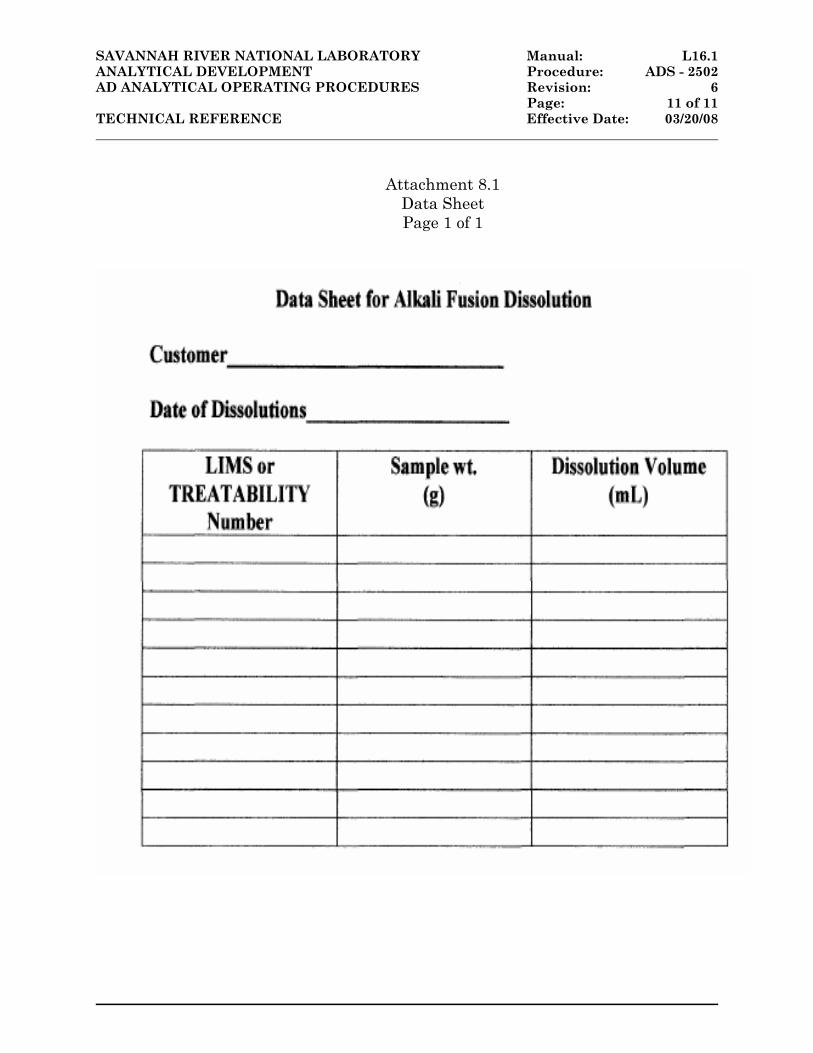
SAVANNAH RIVER NATIONAL LABORATORY Manual: L16.1 ANALYTICAL DEVELOPMENT Procedure: ADS - 2502 AD ANALYTICAL OPERATING PROCEDURES Revision: 6 Page: 11 of 11 TECHNICAL REFERENCE Effective Date: 03/20/08
Attachment 8.1 Data Sheet Page 1 of 1
Liquid Waste Tank Residuals Sampling- SRR-CWDA-2011-00117 Quality Assurance Program Plan Revision 1 July 2013
Page A.3-1 of A.3-79
ATTACHMENT 3
ANALYTICAL DATA VERIFICATION CHECKLISTS
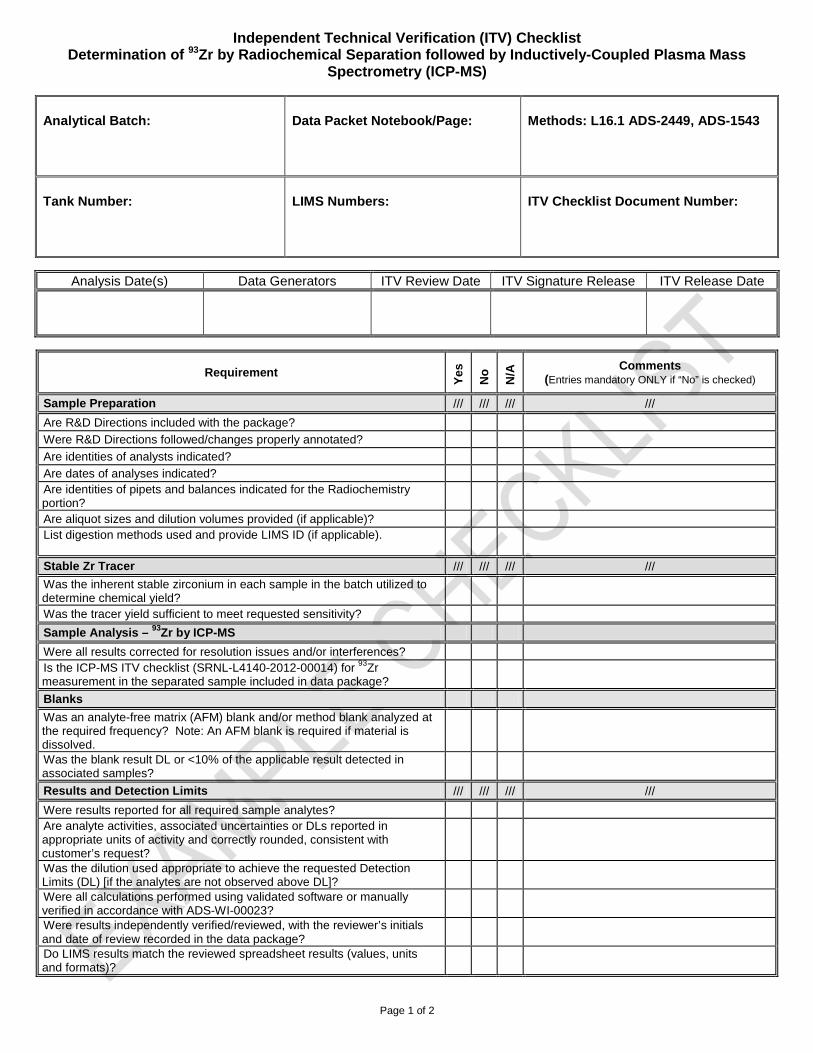
Independent Technical Verification (ITV) Checklist Determination of 93Zr by Radiochemical Separation followed by Inductively-Coupled Plasma Mass
Spectrometry (ICP-MS)
Analytical Batch: Data Packet Notebook/Page:
Methods: L16.1 ADS-2449, ADS-1543
Tank Number: LIMS Numbers: ITV Checklist Document Number:
Page 1 of 2
Analysis Date(s) Data Generators ITV Review Date ITV Signature Release ITV Release Date
Requirement
Ye
s
No
N/A
Comments (Entries mandatory ONLY if “No” is checked)
Sample Preparation /// /// /// ///
Are R&D Directions included with the package?
Were R&D Directions followed/changes properly annotated?
Are identities of analysts indicated?
Are dates of analyses indicated? Are identities of pipets and balances indicated for the Radiochemistry portion?
Are aliquot sizes and dilution volumes provided (if applicable)? List digestion methods used and provide LIMS ID (if applicable).
Stable Zr Tracer /// /// /// ///
Was the inherent stable zirconium in each sample in the batch utilized to determine chemical yield?
Was the tracer yield sufficient to meet requested sensitivity?
Sample Analysis – 93Zr by ICP-MS
Were all results corrected for resolution issues and/or interferences? Is the ICP-MS ITV checklist (SRNL-L4140-2012-00014) for 93Zr measurement in the separated sample included in data package?
Blanks
Was an analyte-free matrix (AFM) blank and/or method blank analyzed at the required frequency? Note: An AFM blank is required if material is dissolved.
Was the blank result DL or <10% of the applicable result detected in associated samples?
Results and Detection Limits /// /// /// ///
Were results reported for all required sample analytes? Are analyte activities, associated uncertainties or DLs reported in appropriate units of activity and correctly rounded, consistent with customer’s request?
Was the dilution used appropriate to achieve the requested Detection Limits (DL) [if the analytes are not observed above DL]?
Were all calculations performed using validated software or manually verified in accordance with ADS-WI-00023?
Were results independently verified/reviewed, with the reviewer’s initials and date of review recorded in the data package?
Do LIMS results match the reviewed spreadsheet results (values, units and formats)?
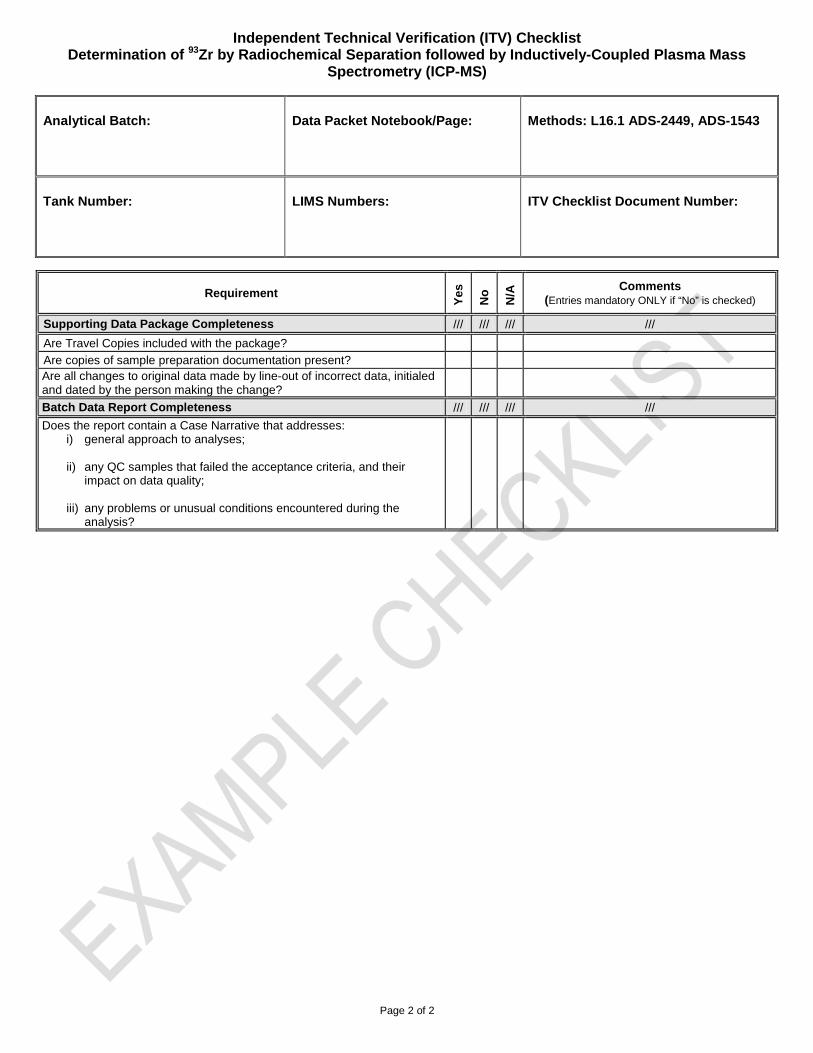
Independent Technical Verification (ITV) Checklist Determination of 93Zr by Radiochemical Separation followed by Inductively-Coupled Plasma Mass
Spectrometry (ICP-MS)
Analytical Batch: Data Packet Notebook/Page:
Methods: L16.1 ADS-2449, ADS-1543
Tank Number: LIMS Numbers: ITV Checklist Document Number:
Page 2 of 2
Requirement
Ye
s
No
N/A
Comments (Entries mandatory ONLY if “No” is checked)
Supporting Data Package Completeness /// /// /// ///
Are Travel Copies included with the package?
Are copies of sample preparation documentation present? Are all changes to original data made by line-out of incorrect data, initialed and dated by the person making the change?
Batch Data Report Completeness /// /// /// ///
Does the report contain a Case Narrative that addresses: i) general approach to analyses; ii) any QC samples that failed the acceptance criteria, and their
impact on data quality; iii) any problems or unusual conditions encountered during the
analysis?
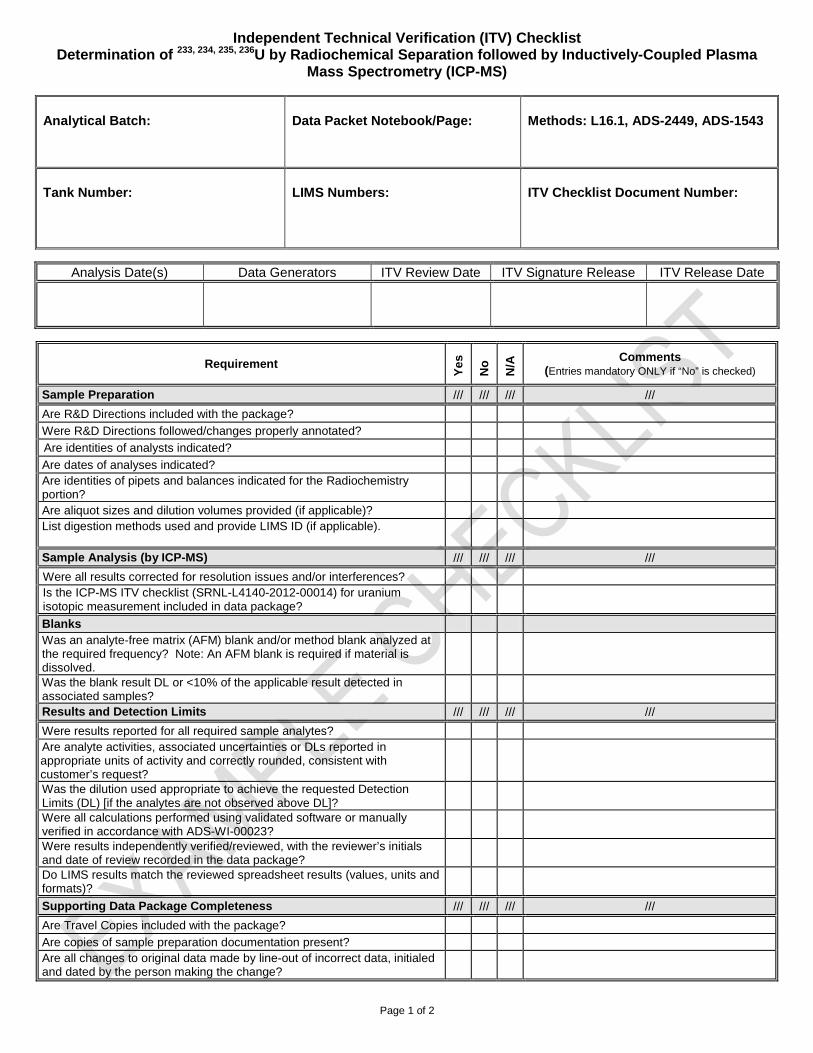
Independent Technical Verification (ITV) Checklist Determination of 233, 234, 235, 236U by Radiochemical Separation followed by Inductively-Coupled Plasma
Mass Spectrometry (ICP-MS)
Analytical Batch: Data Packet Notebook/Page: Methods: L16.1, ADS-2449, ADS-1543
Tank Number: LIMS Numbers: ITV Checklist Document Number:
Page 1 of 2
Analysis Date(s) Data Generators ITV Review Date ITV Signature Release ITV Release Date
Requirement
Ye
s
No
N/A
Comments (Entries mandatory ONLY if “No” is checked)
Sample Preparation /// /// /// ///
Are R&D Directions included with the package?
Were R&D Directions followed/changes properly annotated?
Are identities of analysts indicated?
Are dates of analyses indicated? Are identities of pipets and balances indicated for the Radiochemistry portion?
Are aliquot sizes and dilution volumes provided (if applicable)? List digestion methods used and provide LIMS ID (if applicable).
Sample Analysis (by ICP-MS) /// /// /// ///
Were all results corrected for resolution issues and/or interferences? Is the ICP-MS ITV checklist (SRNL-L4140-2012-00014) for uranium isotopic measurement included in data package?
Blanks Was an analyte-free matrix (AFM) blank and/or method blank analyzed at the required frequency? Note: An AFM blank is required if material is dissolved.
Was the blank result DL or <10% of the applicable result detected in associated samples?
Results and Detection Limits /// /// /// ///
Were results reported for all required sample analytes? Are analyte activities, associated uncertainties or DLs reported in appropriate units of activity and correctly rounded, consistent with customer’s request?
Was the dilution used appropriate to achieve the requested Detection Limits (DL) [if the analytes are not observed above DL]?
Were all calculations performed using validated software or manually verified in accordance with ADS-WI-00023?
Were results independently verified/reviewed, with the reviewer’s initials and date of review recorded in the data package?
Do LIMS results match the reviewed spreadsheet results (values, units and formats)?
Supporting Data Package Completeness /// /// /// ///
Are Travel Copies included with the package?
Are copies of sample preparation documentation present? Are all changes to original data made by line-out of incorrect data, initialed and dated by the person making the change?
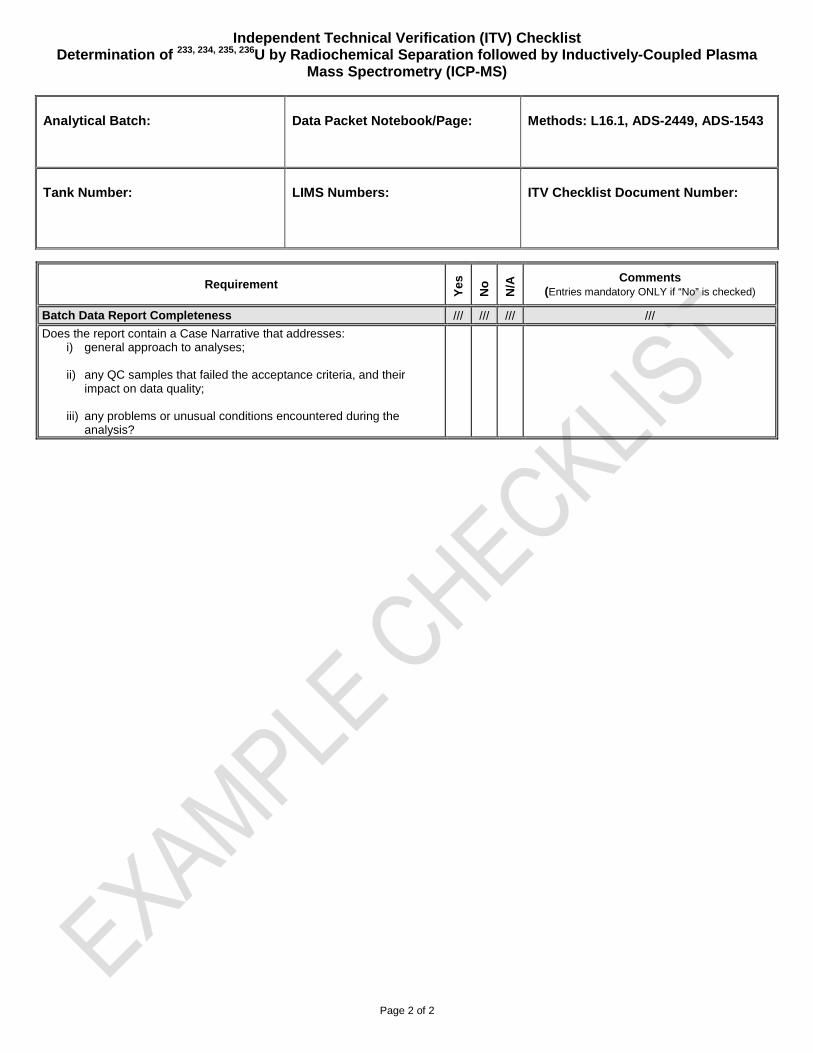
Independent Technical Verification (ITV) Checklist Determination of 233, 234, 235, 236U by Radiochemical Separation followed by Inductively-Coupled Plasma
Mass Spectrometry (ICP-MS)
Analytical Batch: Data Packet Notebook/Page: Methods: L16.1, ADS-2449, ADS-1543
Tank Number: LIMS Numbers: ITV Checklist Document Number:
Page 2 of 2
Requirement
Ye
s
No
N/A
Comments (Entries mandatory ONLY if “No” is checked)
Batch Data Report Completeness /// /// /// ///
Does the report contain a Case Narrative that addresses: i) general approach to analyses; ii) any QC samples that failed the acceptance criteria, and their
impact on data quality; iii) any problems or unusual conditions encountered during the
analysis?
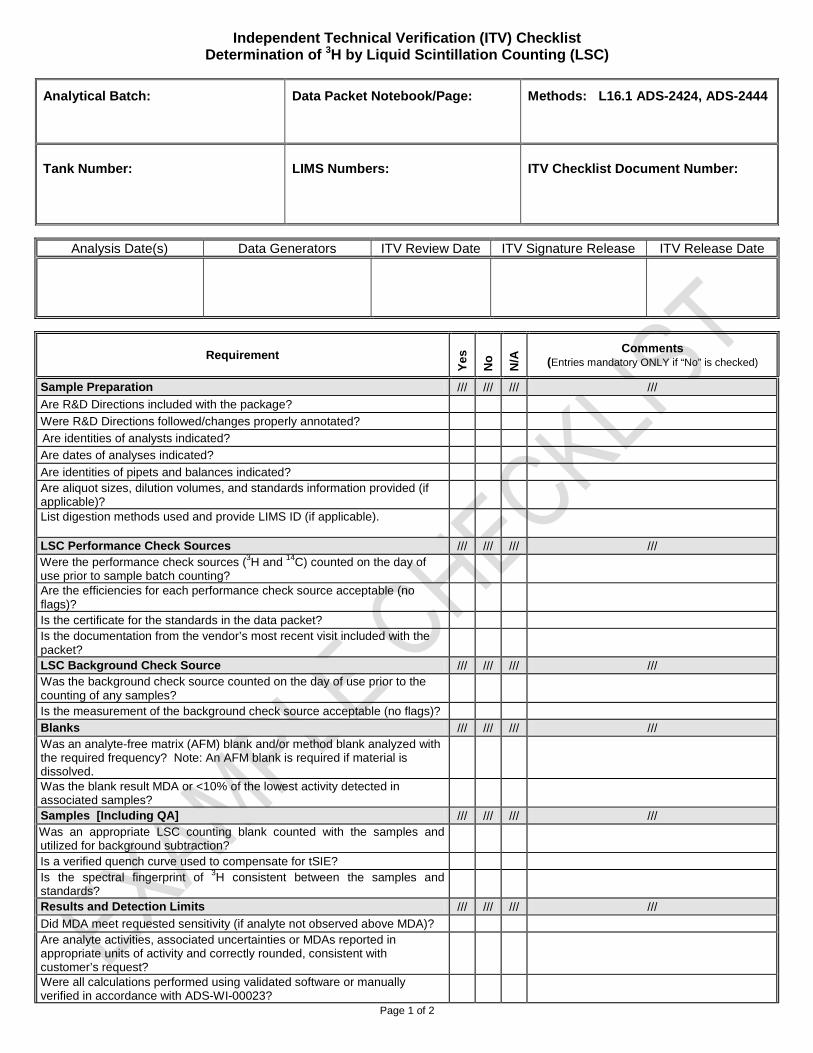
Independent Technical Verification (ITV) Checklist Determination of 3H by Liquid Scintillation Counting (LSC)
Analytical Batch: Data Packet Notebook/Page: Methods: L16.1 ADS-2424, ADS-2444
Tank Number: LIMS Numbers: ITV Checklist Document Number:
Page 1 of 2
Analysis Date(s) Data Generators ITV Review Date ITV Signature Release ITV Release Date
Requirement
Ye
s
No
N/A
Comments (Entries mandatory ONLY if “No” is checked)
Sample Preparation /// /// /// ///
Are R&D Directions included with the package?
Were R&D Directions followed/changes properly annotated?
Are identities of analysts indicated?
Are dates of analyses indicated?
Are identities of pipets and balances indicated? Are aliquot sizes, dilution volumes, and standards information provided (if applicable)?
List digestion methods used and provide LIMS ID (if applicable).
LSC Performance Check Sources /// /// /// /// Were the performance check sources (3H and 14C) counted on the day of use prior to sample batch counting?
Are the efficiencies for each performance check source acceptable (no flags)?
Is the certificate for the standards in the data packet? Is the documentation from the vendor’s most recent visit included with the packet?
LSC Background Check Source /// /// /// /// Was the background check source counted on the day of use prior to the counting of any samples?
Is the measurement of the background check source acceptable (no flags)? Blanks /// /// /// /// Was an analyte-free matrix (AFM) blank and/or method blank analyzed with the required frequency? Note: An AFM blank is required if material is dissolved.
Was the blank result MDA or <10% of the lowest activity detected in associated samples?
Samples [Including QA] /// /// /// /// Was an appropriate LSC counting blank counted with the samples and utilized for background subtraction?
Is a verified quench curve used to compensate for tSIE? Is the spectral fingerprint of 3H consistent between the samples and standards?
Results and Detection Limits /// /// /// ///
Did MDA meet requested sensitivity (if analyte not observed above MDA)? Are analyte activities, associated uncertainties or MDAs reported in appropriate units of activity and correctly rounded, consistent with customer’s request?
Were all calculations performed using validated software or manually verified in accordance with ADS-WI-00023?
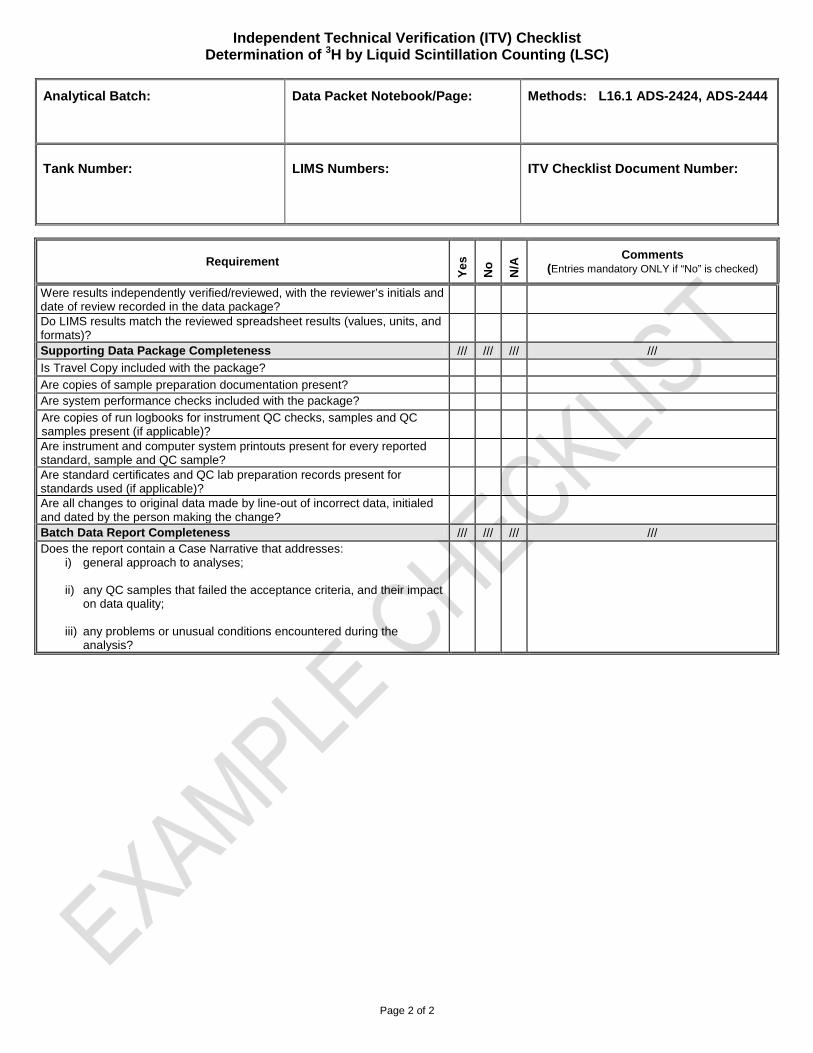
Independent Technical Verification (ITV) Checklist Determination of 3H by Liquid Scintillation Counting (LSC)
Analytical Batch: Data Packet Notebook/Page: Methods: L16.1 ADS-2424, ADS-2444
Tank Number: LIMS Numbers: ITV Checklist Document Number:
Page 2 of 2
Requirement
Ye
s
No
N/A
Comments (Entries mandatory ONLY if “No” is checked)
Were results independently verified/reviewed, with the reviewer’s initials and date of review recorded in the data package?
Do LIMS results match the reviewed spreadsheet results (values, units, and formats)?
Supporting Data Package Completeness /// /// /// ///
Is Travel Copy included with the package?
Are copies of sample preparation documentation present? Are system performance checks included with the package? Are copies of run logbooks for instrument QC checks, samples and QC samples present (if applicable)?
Are instrument and computer system printouts present for every reported standard, sample and QC sample?
Are standard certificates and QC lab preparation records present for standards used (if applicable)?
Are all changes to original data made by line-out of incorrect data, initialed and dated by the person making the change?
Batch Data Report Completeness /// /// /// /// Does the report contain a Case Narrative that addresses:
i) general approach to analyses; ii) any QC samples that failed the acceptance criteria, and their impact
on data quality; iii) any problems or unusual conditions encountered during the
analysis?
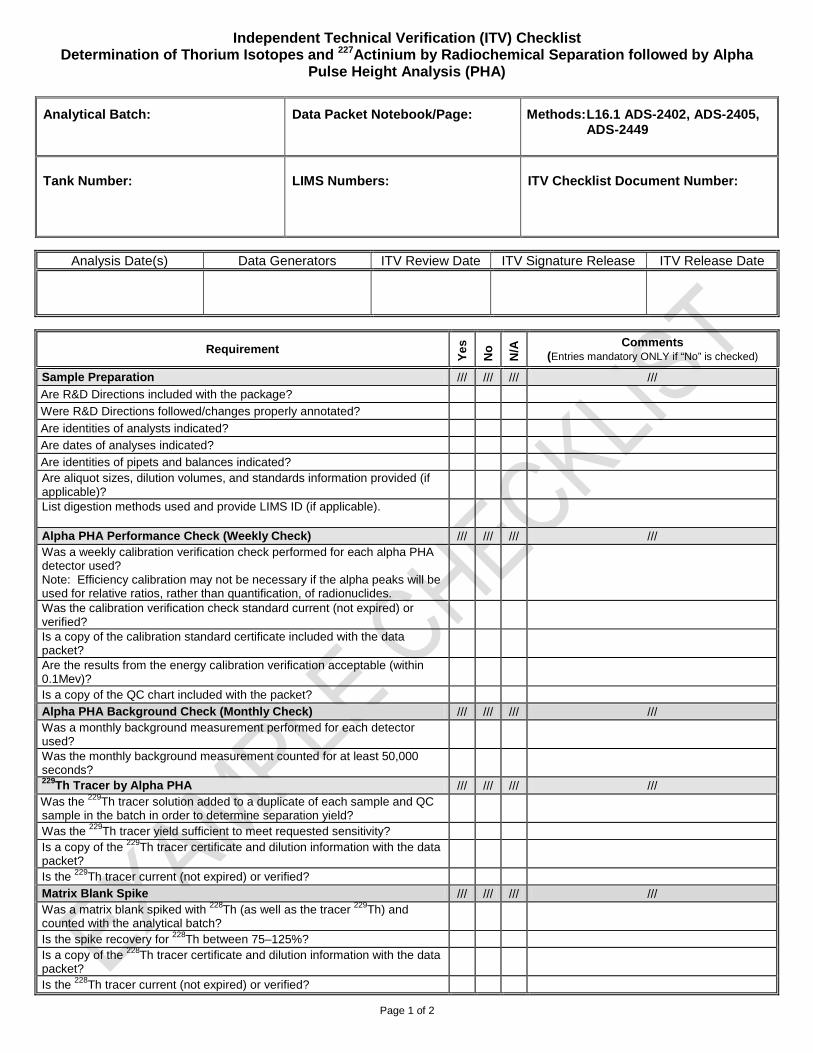
Independent Technical Verification (ITV) Checklist Determination of Thorium Isotopes and 227Actinium by Radiochemical Separation followed by Alpha
Pulse Height Analysis (PHA)
Analytical Batch: Data Packet Notebook/Page: Methods: L16.1 ADS-2402, ADS-2405, ADS-2449
Tank Number: LIMS Numbers: ITV Checklist Document Number:
Page 1 of 2
Analysis Date(s) Data Generators ITV Review Date ITV Signature Release ITV Release Date
Requirement
Ye
s
No
N/A
Comments (Entries mandatory ONLY if “No” is checked)
Sample Preparation /// /// /// ///
Are R&D Directions included with the package?
Were R&D Directions followed/changes properly annotated?
Are identities of analysts indicated?
Are dates of analyses indicated?
Are identities of pipets and balances indicated? Are aliquot sizes, dilution volumes, and standards information provided (if applicable)?
List digestion methods used and provide LIMS ID (if applicable).
Alpha PHA Performance Check (Weekly Check) /// /// /// /// Was a weekly calibration verification check performed for each alpha PHA detector used? Note: Efficiency calibration may not be necessary if the alpha peaks will be used for relative ratios, rather than quantification, of radionuclides.
Was the calibration verification check standard current (not expired) or verified?
Is a copy of the calibration standard certificate included with the data packet?
Are the results from the energy calibration verification acceptable (within 0.1Mev)?
Is a copy of the QC chart included with the packet?
Alpha PHA Background Check (Monthly Check) /// /// /// /// Was a monthly background measurement performed for each detector used?
Was the monthly background measurement counted for at least 50,000 seconds?
229Th Tracer by Alpha PHA /// /// /// /// Was the 229Th tracer solution added to a duplicate of each sample and QC sample in the batch in order to determine separation yield?
Was the 229Th tracer yield sufficient to meet requested sensitivity? Is a copy of the 229Th tracer certificate and dilution information with the data packet?
Is the 229Th tracer current (not expired) or verified?
Matrix Blank Spike /// /// /// /// Was a matrix blank spiked with 228Th (as well as the tracer 229Th) and counted with the analytical batch?
Is the spike recovery for 228Th between 75–125%? Is a copy of the 228Th tracer certificate and dilution information with the data packet?
Is the 228Th tracer current (not expired) or verified?
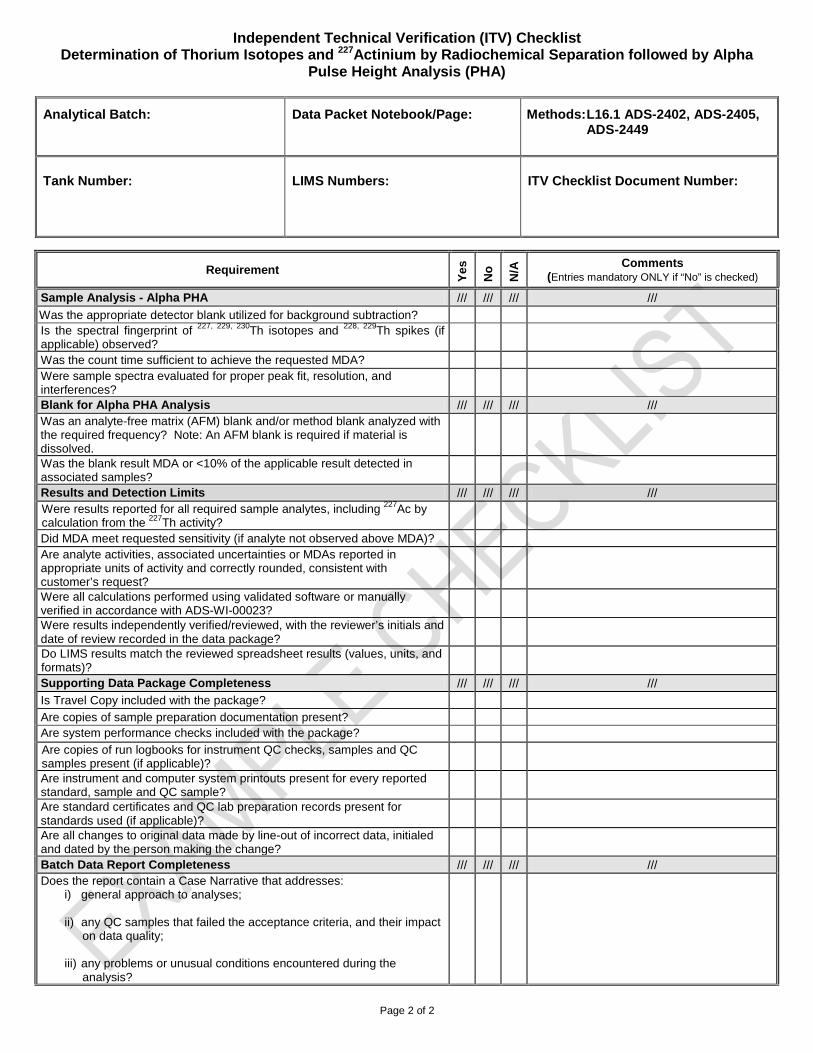
Independent Technical Verification (ITV) Checklist Determination of Thorium Isotopes and 227Actinium by Radiochemical Separation followed by Alpha
Pulse Height Analysis (PHA)
Analytical Batch: Data Packet Notebook/Page: Methods: L16.1 ADS-2402, ADS-2405, ADS-2449
Tank Number: LIMS Numbers: ITV Checklist Document Number:
Page 2 of 2
Requirement
Ye
s
No
N/A
Comments (Entries mandatory ONLY if “No” is checked)
Sample Analysis - Alpha PHA /// /// /// ///
Was the appropriate detector blank utilized for background subtraction? Is the spectral fingerprint of 227, 229, 230Th isotopes and 228, 229Th spikes (if applicable) observed?
Was the count time sufficient to achieve the requested MDA? Were sample spectra evaluated for proper peak fit, resolution, and interferences?
Blank for Alpha PHA Analysis /// /// /// /// Was an analyte-free matrix (AFM) blank and/or method blank analyzed with the required frequency? Note: An AFM blank is required if material is dissolved.
Was the blank result MDA or <10% of the applicable result detected in associated samples?
Results and Detection Limits /// /// /// /// Were results reported for all required sample analytes, including 227Ac by calculation from the 227Th activity?
Did MDA meet requested sensitivity (if analyte not observed above MDA)? Are analyte activities, associated uncertainties or MDAs reported in appropriate units of activity and correctly rounded, consistent with customer’s request?
Were all calculations performed using validated software or manually verified in accordance with ADS-WI-00023?
Were results independently verified/reviewed, with the reviewer’s initials and date of review recorded in the data package?
Do LIMS results match the reviewed spreadsheet results (values, units, and formats)?
Supporting Data Package Completeness /// /// /// ///
Is Travel Copy included with the package?
Are copies of sample preparation documentation present? Are system performance checks included with the package? Are copies of run logbooks for instrument QC checks, samples and QC samples present (if applicable)?
Are instrument and computer system printouts present for every reported standard, sample and QC sample?
Are standard certificates and QC lab preparation records present for standards used (if applicable)?
Are all changes to original data made by line-out of incorrect data, initialed and dated by the person making the change?
Batch Data Report Completeness /// /// /// /// Does the report contain a Case Narrative that addresses:
i) general approach to analyses; ii) any QC samples that failed the acceptance criteria, and their impact
on data quality; iii) any problems or unusual conditions encountered during the
analysis?
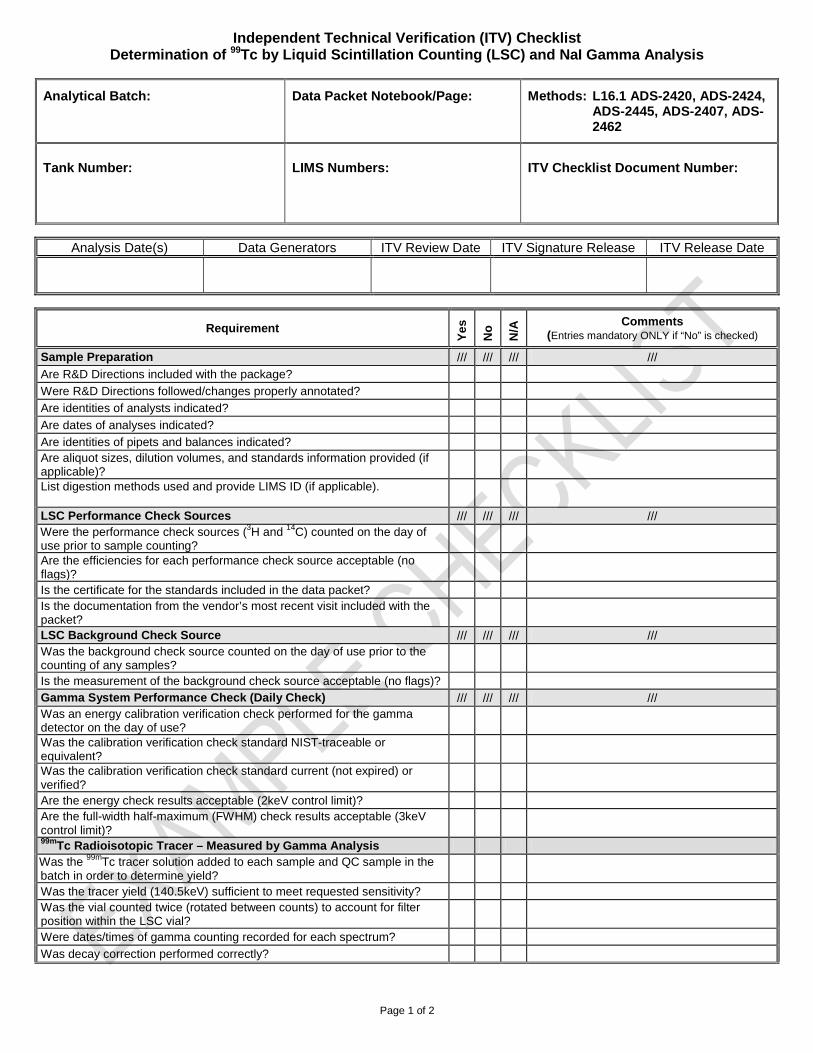
Independent Technical Verification (ITV) Checklist Determination of 99Tc by Liquid Scintillation Counting (LSC) and NaI Gamma Analysis
Analytical Batch: Data Packet Notebook/Page: Methods: L16.1 ADS-2420, ADS-2424, ADS-2445, ADS-2407, ADS-2462
Tank Number: LIMS Numbers: ITV Checklist Document Number:
Page 1 of 2
Analysis Date(s) Data Generators ITV Review Date ITV Signature Release ITV Release Date
Requirement
Ye
s
No
N/A
Comments (Entries mandatory ONLY if “No” is checked)
Sample Preparation /// /// /// ///
Are R&D Directions included with the package?
Were R&D Directions followed/changes properly annotated?
Are identities of analysts indicated?
Are dates of analyses indicated?
Are identities of pipets and balances indicated? Are aliquot sizes, dilution volumes, and standards information provided (if applicable)?
List digestion methods used and provide LIMS ID (if applicable).
LSC Performance Check Sources /// /// /// /// Were the performance check sources (3H and 14C) counted on the day of use prior to sample counting?
Are the efficiencies for each performance check source acceptable (no flags)?
Is the certificate for the standards included in the data packet? Is the documentation from the vendor’s most recent visit included with the packet?
LSC Background Check Source /// /// /// /// Was the background check source counted on the day of use prior to the counting of any samples?
Is the measurement of the background check source acceptable (no flags)? Gamma System Performance Check (Daily Check) /// /// /// /// Was an energy calibration verification check performed for the gamma detector on the day of use?
Was the calibration verification check standard NIST-traceable or equivalent?
Was the calibration verification check standard current (not expired) or verified?
Are the energy check results acceptable (2keV control limit)? Are the full-width half-maximum (FWHM) check results acceptable (3keV control limit)?
99mTc Radioisotopic Tracer – Measured by Gamma Analysis Was the 99mTc tracer solution added to each sample and QC sample in the batch in order to determine yield?
Was the tracer yield (140.5keV) sufficient to meet requested sensitivity? Was the vial counted twice (rotated between counts) to account for filter position within the LSC vial?
Were dates/times of gamma counting recorded for each spectrum?
Was decay correction performed correctly?
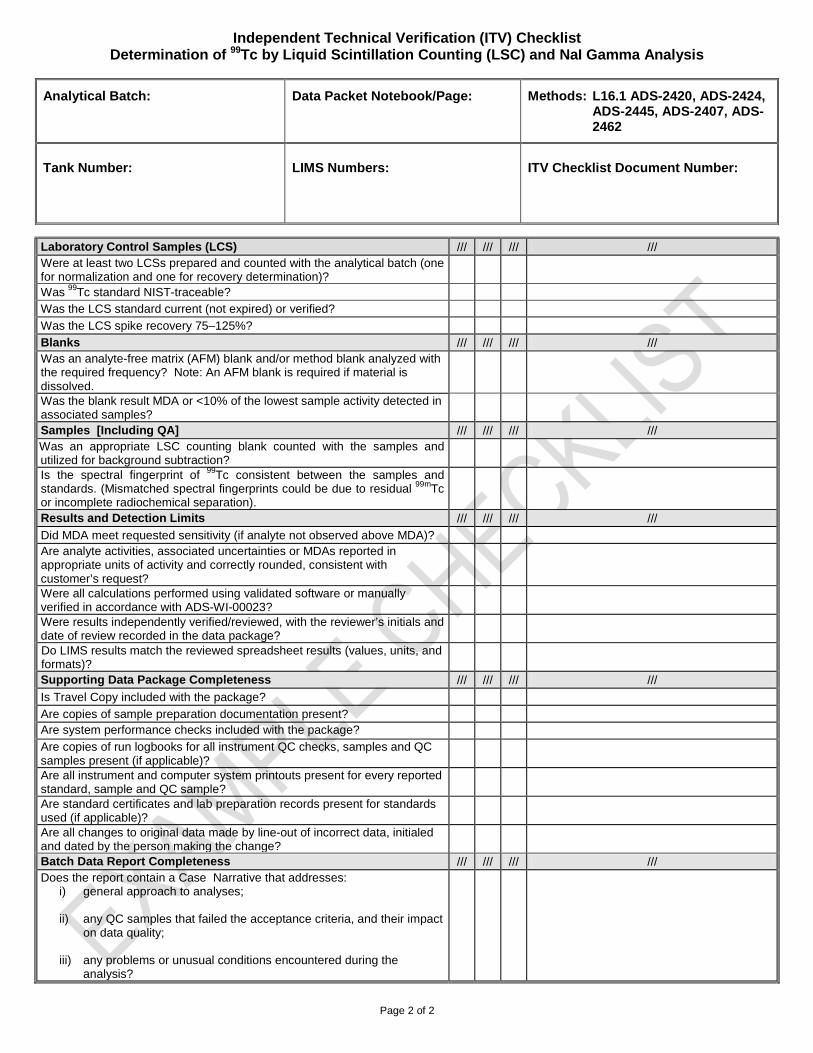
Independent Technical Verification (ITV) Checklist Determination of 99Tc by Liquid Scintillation Counting (LSC) and NaI Gamma Analysis
Analytical Batch: Data Packet Notebook/Page: Methods: L16.1 ADS-2420, ADS-2424, ADS-2445, ADS-2407, ADS-2462
Tank Number: LIMS Numbers: ITV Checklist Document Number:
Page 2 of 2
Laboratory Control Samples (LCS) /// /// /// /// Were at least two LCSs prepared and counted with the analytical batch (one for normalization and one for recovery determination)?
Was 99Tc standard NIST-traceable? Was the LCS standard current (not expired) or verified?
Was the LCS spike recovery 75–125%?
Blanks /// /// /// /// Was an analyte-free matrix (AFM) blank and/or method blank analyzed with the required frequency? Note: An AFM blank is required if material is dissolved.
Was the blank result MDA or <10% of the lowest sample activity detected in associated samples?
Samples [Including QA] /// /// /// /// Was an appropriate LSC counting blank counted with the samples and utilized for background subtraction?
Is the spectral fingerprint of 99Tc consistent between the samples and standards. (Mismatched spectral fingerprints could be due to residual 99mTc or incomplete radiochemical separation).
Results and Detection Limits /// /// /// ///
Did MDA meet requested sensitivity (if analyte not observed above MDA)? Are analyte activities, associated uncertainties or MDAs reported in appropriate units of activity and correctly rounded, consistent with customer’s request?
Were all calculations performed using validated software or manually verified in accordance with ADS-WI-00023?
Were results independently verified/reviewed, with the reviewer’s initials and date of review recorded in the data package?
Do LIMS results match the reviewed spreadsheet results (values, units, and formats)?
Supporting Data Package Completeness /// /// /// ///
Is Travel Copy included with the package?
Are copies of sample preparation documentation present? Are system performance checks included with the package? Are copies of run logbooks for all instrument QC checks, samples and QC samples present (if applicable)?
Are all instrument and computer system printouts present for every reported standard, sample and QC sample?
Are standard certificates and lab preparation records present for standards used (if applicable)?
Are all changes to original data made by line-out of incorrect data, initialed and dated by the person making the change?
Batch Data Report Completeness /// /// /// /// Does the report contain a Case Narrative that addresses:
i) general approach to analyses; ii) any QC samples that failed the acceptance criteria, and their impact
on data quality; iii) any problems or unusual conditions encountered during the
analysis?
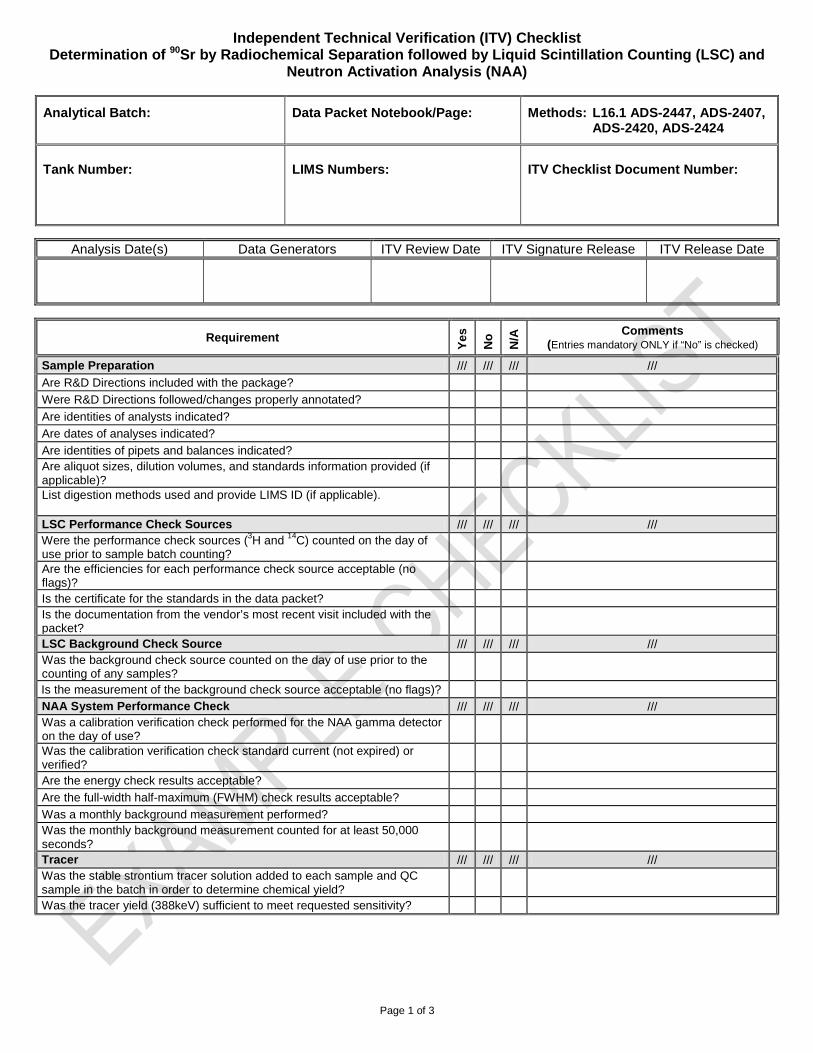
Independent Technical Verification (ITV) Checklist Determination of 90Sr by Radiochemical Separation followed by Liquid Scintillation Counting (LSC) and
Neutron Activation Analysis (NAA)
Analytical Batch: Data Packet Notebook/Page: Methods: L16.1 ADS-2447, ADS-2407, ADS-2420, ADS-2424
Tank Number: LIMS Numbers: ITV Checklist Document Number:
Page 1 of 3
Analysis Date(s) Data Generators ITV Review Date ITV Signature Release ITV Release Date
Requirement
Ye
s
No
N/A
Comments (Entries mandatory ONLY if “No” is checked)
Sample Preparation /// /// /// ///
Are R&D Directions included with the package?
Were R&D Directions followed/changes properly annotated?
Are identities of analysts indicated?
Are dates of analyses indicated?
Are identities of pipets and balances indicated? Are aliquot sizes, dilution volumes, and standards information provided (if applicable)?
List digestion methods used and provide LIMS ID (if applicable).
LSC Performance Check Sources /// /// /// /// Were the performance check sources (3H and 14C) counted on the day of use prior to sample batch counting?
Are the efficiencies for each performance check source acceptable (no flags)?
Is the certificate for the standards in the data packet? Is the documentation from the vendor’s most recent visit included with the packet?
LSC Background Check Source /// /// /// /// Was the background check source counted on the day of use prior to the counting of any samples?
Is the measurement of the background check source acceptable (no flags)? NAA System Performance Check /// /// /// /// Was a calibration verification check performed for the NAA gamma detector on the day of use?
Was the calibration verification check standard current (not expired) or verified?
Are the energy check results acceptable?
Are the full-width half-maximum (FWHM) check results acceptable?
Was a monthly background measurement performed? Was the monthly background measurement counted for at least 50,000 seconds?
Tracer /// /// /// /// Was the stable strontium tracer solution added to each sample and QC sample in the batch in order to determine chemical yield?
Was the tracer yield (388keV) sufficient to meet requested sensitivity?
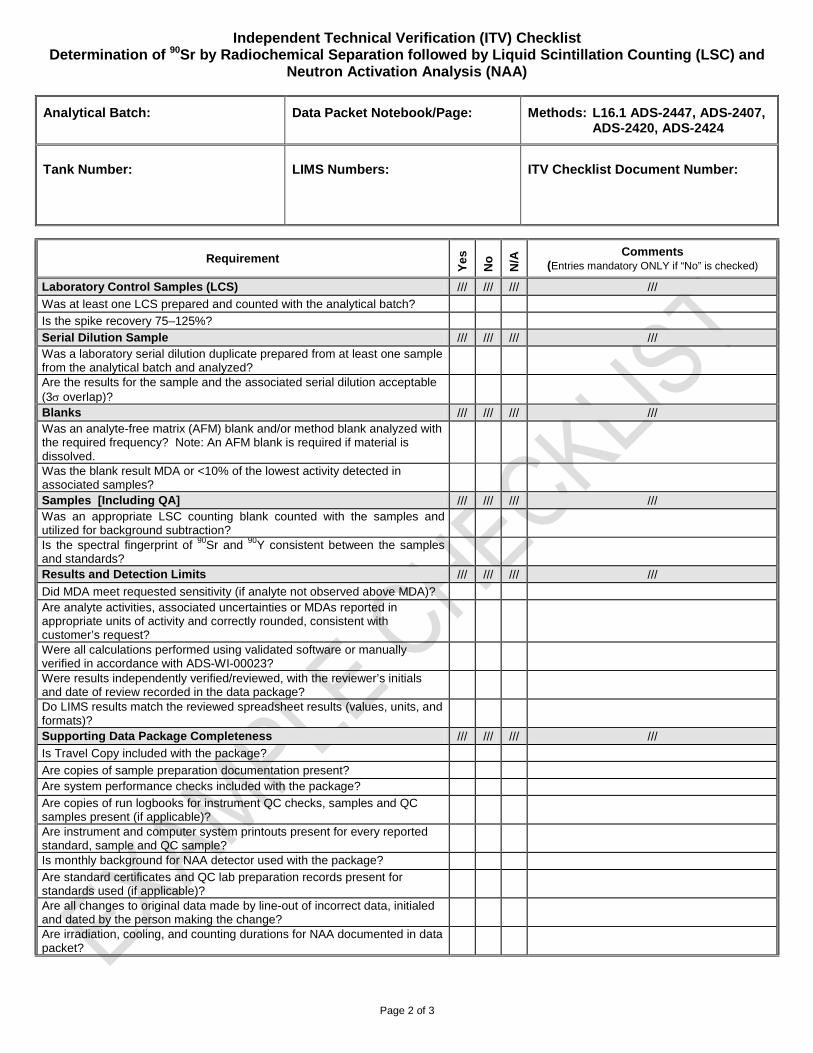
Independent Technical Verification (ITV) Checklist Determination of 90Sr by Radiochemical Separation followed by Liquid Scintillation Counting (LSC) and
Neutron Activation Analysis (NAA)
Analytical Batch: Data Packet Notebook/Page: Methods: L16.1 ADS-2447, ADS-2407, ADS-2420, ADS-2424
Tank Number: LIMS Numbers: ITV Checklist Document Number:
Page 2 of 3
Requirement
Ye
s
No
N/A
Comments (Entries mandatory ONLY if “No” is checked)
Laboratory Control Samples (LCS) /// /// /// ///
Was at least one LCS prepared and counted with the analytical batch?
Is the spike recovery 75–125%? Serial Dilution Sample /// /// /// /// Was a laboratory serial dilution duplicate prepared from at least one sample from the analytical batch and analyzed?
Are the results for the sample and the associated serial dilution acceptable (3σ overlap)?
Blanks /// /// /// /// Was an analyte-free matrix (AFM) blank and/or method blank analyzed with the required frequency? Note: An AFM blank is required if material is dissolved.
Was the blank result MDA or <10% of the lowest activity detected in associated samples?
Samples [Including QA] /// /// /// /// Was an appropriate LSC counting blank counted with the samples and utilized for background subtraction?
Is the spectral fingerprint of 90Sr and 90Y consistent between the samples and standards?
Results and Detection Limits /// /// /// ///
Did MDA meet requested sensitivity (if analyte not observed above MDA)? Are analyte activities, associated uncertainties or MDAs reported in appropriate units of activity and correctly rounded, consistent with customer’s request?
Were all calculations performed using validated software or manually verified in accordance with ADS-WI-00023?
Were results independently verified/reviewed, with the reviewer’s initials and date of review recorded in the data package?
Do LIMS results match the reviewed spreadsheet results (values, units, and formats)?
Supporting Data Package Completeness /// /// /// ///
Is Travel Copy included with the package?
Are copies of sample preparation documentation present? Are system performance checks included with the package? Are copies of run logbooks for instrument QC checks, samples and QC samples present (if applicable)?
Are instrument and computer system printouts present for every reported standard, sample and QC sample?
Is monthly background for NAA detector used with the package? Are standard certificates and QC lab preparation records present for standards used (if applicable)?
Are all changes to original data made by line-out of incorrect data, initialed and dated by the person making the change?
Are irradiation, cooling, and counting durations for NAA documented in data packet?
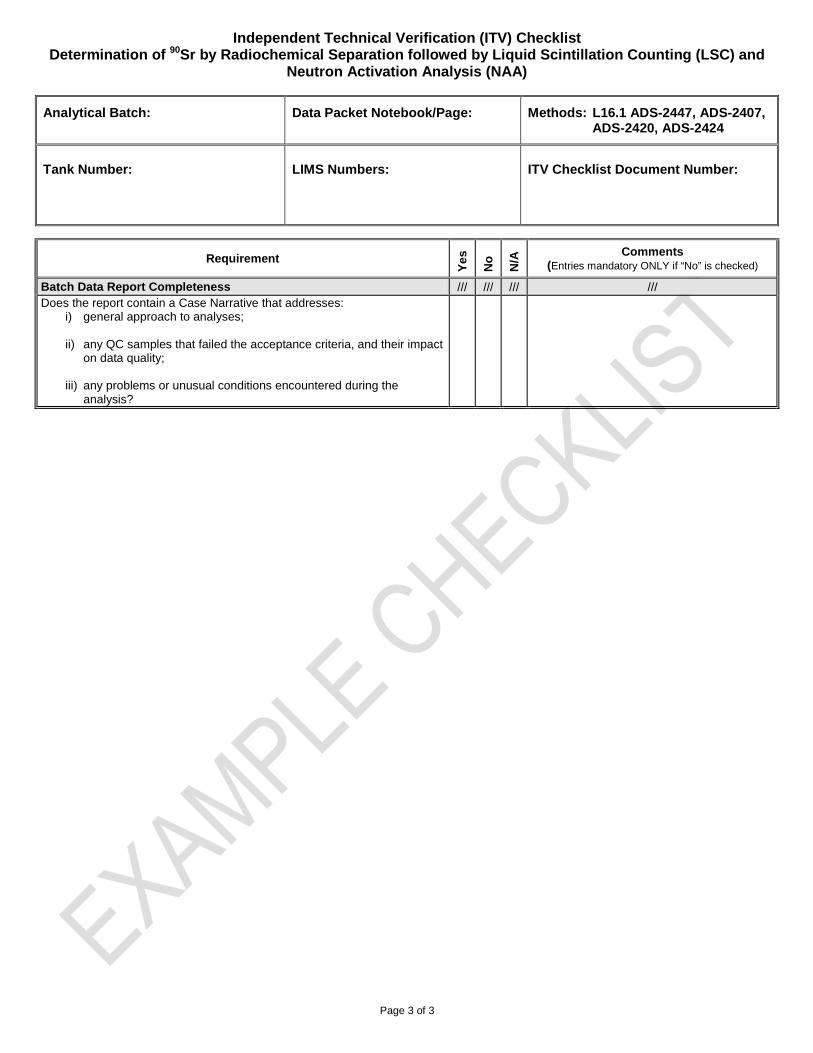
Independent Technical Verification (ITV) Checklist Determination of 90Sr by Radiochemical Separation followed by Liquid Scintillation Counting (LSC) and
Neutron Activation Analysis (NAA)
Analytical Batch: Data Packet Notebook/Page: Methods: L16.1 ADS-2447, ADS-2407, ADS-2420, ADS-2424
Tank Number: LIMS Numbers: ITV Checklist Document Number:
Page 3 of 3
Requirement
Ye
s
No
N/A
Comments (Entries mandatory ONLY if “No” is checked)
Batch Data Report Completeness /// /// /// /// Does the report contain a Case Narrative that addresses:
i) general approach to analyses; ii) any QC samples that failed the acceptance criteria, and their impact
on data quality; iii) any problems or unusual conditions encountered during the
analysis?
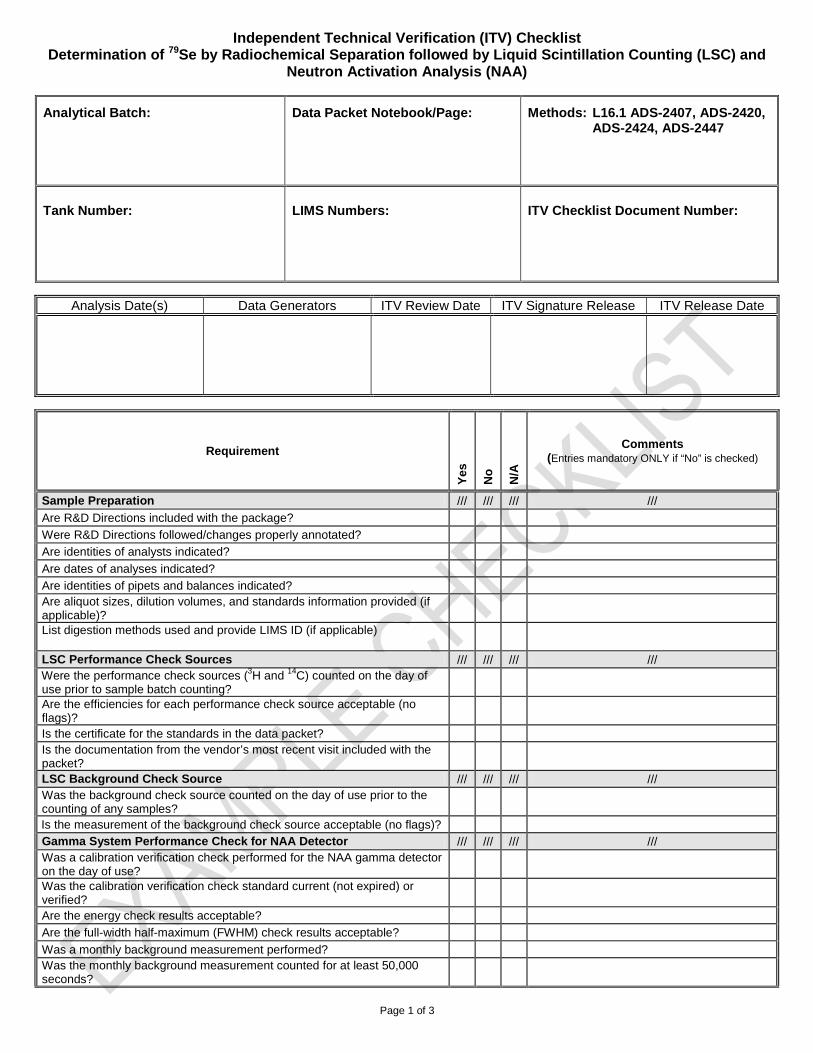
Independent Technical Verification (ITV) Checklist Determination of 79Se by Radiochemical Separation followed by Liquid Scintillation Counting (LSC) and
Neutron Activation Analysis (NAA)
Analytical Batch: Data Packet Notebook/Page: Methods: L16.1 ADS-2407, ADS-2420, ADS-2424, ADS-2447
Tank Number: LIMS Numbers: ITV Checklist Document Number:
Page 1 of 3
Analysis Date(s) Data Generators ITV Review Date ITV Signature Release ITV Release Date
Requirement Y
es
No
N/A
Comments (Entries mandatory ONLY if “No” is checked)
Sample Preparation /// /// /// ///
Are R&D Directions included with the package?
Were R&D Directions followed/changes properly annotated?
Are identities of analysts indicated?
Are dates of analyses indicated?
Are identities of pipets and balances indicated? Are aliquot sizes, dilution volumes, and standards information provided (if applicable)?
List digestion methods used and provide LIMS ID (if applicable)
LSC Performance Check Sources /// /// /// /// Were the performance check sources (3H and 14C) counted on the day of use prior to sample batch counting?
Are the efficiencies for each performance check source acceptable (no flags)?
Is the certificate for the standards in the data packet? Is the documentation from the vendor’s most recent visit included with the packet?
LSC Background Check Source /// /// /// /// Was the background check source counted on the day of use prior to the counting of any samples?
Is the measurement of the background check source acceptable (no flags)? Gamma System Performance Check for NAA Detector /// /// /// /// Was a calibration verification check performed for the NAA gamma detector on the day of use?
Was the calibration verification check standard current (not expired) or verified?
Are the energy check results acceptable?
Are the full-width half-maximum (FWHM) check results acceptable?
Was a monthly background measurement performed? Was the monthly background measurement counted for at least 50,000 seconds?
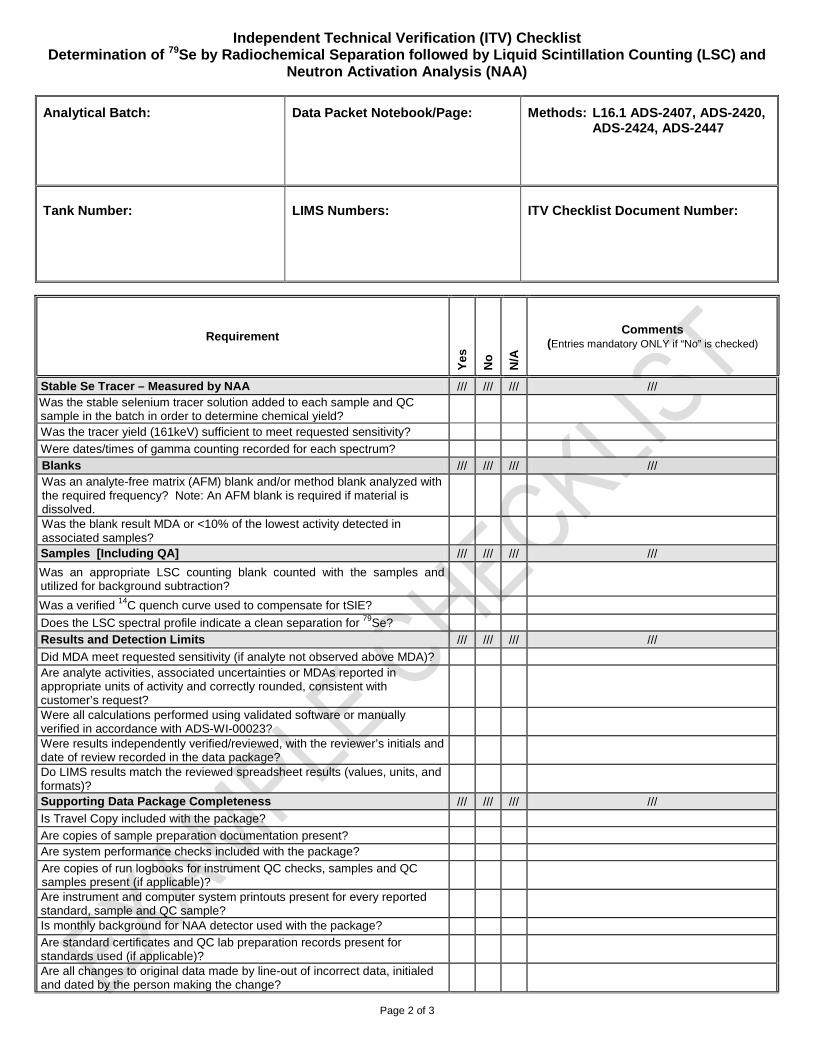
Independent Technical Verification (ITV) Checklist Determination of 79Se by Radiochemical Separation followed by Liquid Scintillation Counting (LSC) and
Neutron Activation Analysis (NAA)
Analytical Batch: Data Packet Notebook/Page: Methods: L16.1 ADS-2407, ADS-2420, ADS-2424, ADS-2447
Tank Number: LIMS Numbers: ITV Checklist Document Number:
Page 2 of 3
Requirement
Ye
s
No
N/A
Comments (Entries mandatory ONLY if “No” is checked)
Stable Se Tracer – Measured by NAA /// /// /// /// Was the stable selenium tracer solution added to each sample and QC sample in the batch in order to determine chemical yield?
Was the tracer yield (161keV) sufficient to meet requested sensitivity?
Were dates/times of gamma counting recorded for each spectrum? Blanks /// /// /// /// Was an analyte-free matrix (AFM) blank and/or method blank analyzed with the required frequency? Note: An AFM blank is required if material is dissolved.
Was the blank result MDA or <10% of the lowest activity detected in associated samples?
Samples [Including QA] /// /// /// ///
Was an appropriate LSC counting blank counted with the samples and utilized for background subtraction?
Was a verified 14C quench curve used to compensate for tSIE?
Does the LSC spectral profile indicate a clean separation for 79Se? Results and Detection Limits /// /// /// ///
Did MDA meet requested sensitivity (if analyte not observed above MDA)? Are analyte activities, associated uncertainties or MDAs reported in appropriate units of activity and correctly rounded, consistent with customer’s request?
Were all calculations performed using validated software or manually verified in accordance with ADS-WI-00023?
Were results independently verified/reviewed, with the reviewer’s initials and date of review recorded in the data package?
Do LIMS results match the reviewed spreadsheet results (values, units, and formats)?
Supporting Data Package Completeness /// /// /// ///
Is Travel Copy included with the package?
Are copies of sample preparation documentation present? Are system performance checks included with the package? Are copies of run logbooks for instrument QC checks, samples and QC samples present (if applicable)?
Are instrument and computer system printouts present for every reported standard, sample and QC sample?
Is monthly background for NAA detector used with the package? Are standard certificates and QC lab preparation records present for standards used (if applicable)?
Are all changes to original data made by line-out of incorrect data, initialed and dated by the person making the change?
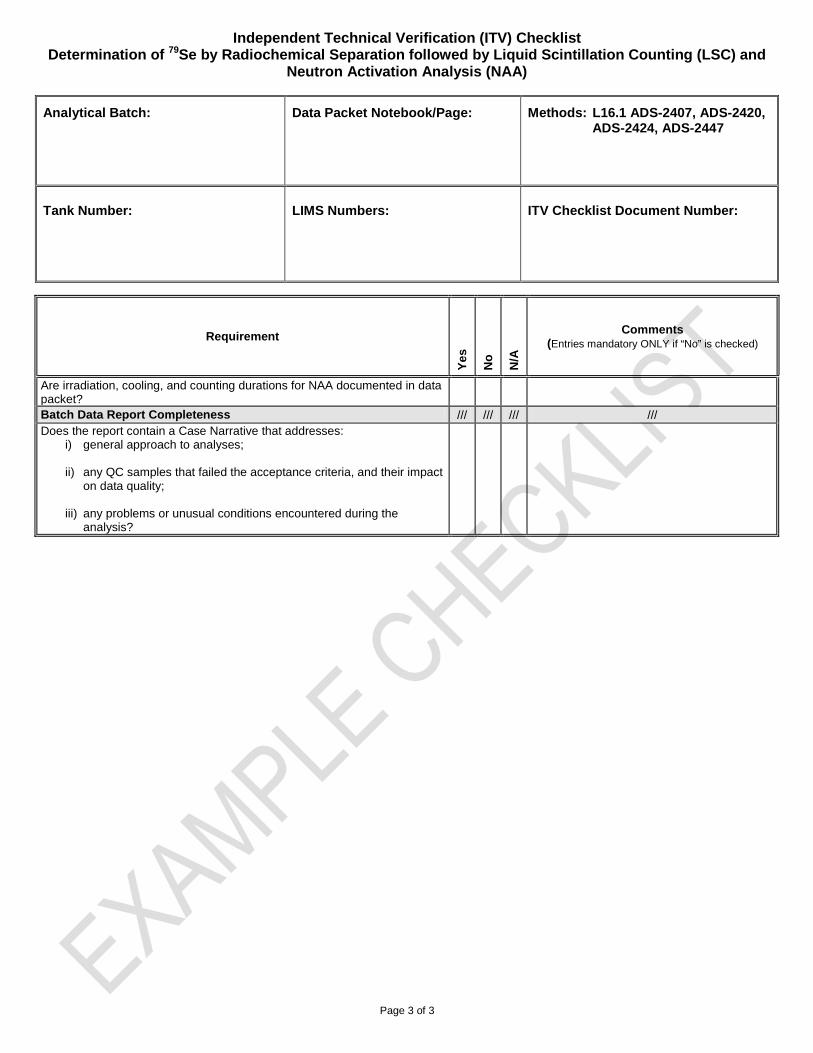
Independent Technical Verification (ITV) Checklist Determination of 79Se by Radiochemical Separation followed by Liquid Scintillation Counting (LSC) and
Neutron Activation Analysis (NAA)
Analytical Batch: Data Packet Notebook/Page: Methods: L16.1 ADS-2407, ADS-2420, ADS-2424, ADS-2447
Tank Number: LIMS Numbers: ITV Checklist Document Number:
Page 3 of 3
Requirement
Ye
s
No
N/A
Comments (Entries mandatory ONLY if “No” is checked)
Are irradiation, cooling, and counting durations for NAA documented in data packet?
Batch Data Report Completeness /// /// /// /// Does the report contain a Case Narrative that addresses:
i) general approach to analyses; ii) any QC samples that failed the acceptance criteria, and their impact
on data quality; iii) any problems or unusual conditions encountered during the
analysis?

Independent Technical Verification (ITV) Checklist Determination of 226Ra by Radiochemical Separation followed by
Gamma Pulse Height Analysis
Analytical Batch: Data Packet Notebook/Page: Methods: L16.1 ADS-2449, ADS-2420
Tank Number: LIMS Numbers: ITV Checklist Document Number:
Page 1 of 3
Analysis Date(s) Data Generators ITV Review Date ITV Signature Release ITV Release Date
Requirement
Ye
s
No
N/A
Comments (Entries mandatory ONLY if “No” is checked)
Sample Preparation /// /// /// ///
Are R&D Directions included with the package?
Were R&D Directions followed/changes properly annotated?
Are identities of analysts indicated?
Are dates of analyses indicated?
Are identities of pipets and balances indicated? Are aliquot sizes, dilution volumes, and standards information provided (if applicable)?
List digestion methods used and provide LIMS ID (if applicable).
Gamma PHA Initial Calibrations /// /// /// /// Was an energy and peak shape calibration performed initially for each detector used?
Does the calibration standard used for all calibrations contain photopeaks spanning the energy range of interest?
Was the standard used for calibration NIST-Traceable?
Was the standard used for calibration current (not expired)? Were efficiency calibrations performed initially (following energy calibration) for chosen sample geometry for each detector used? Note: Efficiency calibration may not be required if appropriate 224Ra and 226Ra standards are used to convert from peak area to peak activity on a peak-by-peak basis.
Are the efficiency calibrations satisfactory (validated) for each detector used?
Gamma PHA Background Determinations /// /// /// ///
Was a monthly background measurement performed for each detector? Were the background measurements counted for a minimum of 50,000 seconds?
Gamma System Performance Check #1 – Rapid Count for 224Ra /// /// /// /// Was a verification check performed for each detector (daily, or bracketed if daily verification not possible due to long count times or unattended counting with sample changer)? Review verification results before samples are counted and review next verification results following counts.
Was the verification check standard traceable and current (not expired) or verified?
Are the efficiency check results acceptable for each detector, if applicable? Are the full-width half-maximum (FWHM) check results acceptable for each detector?
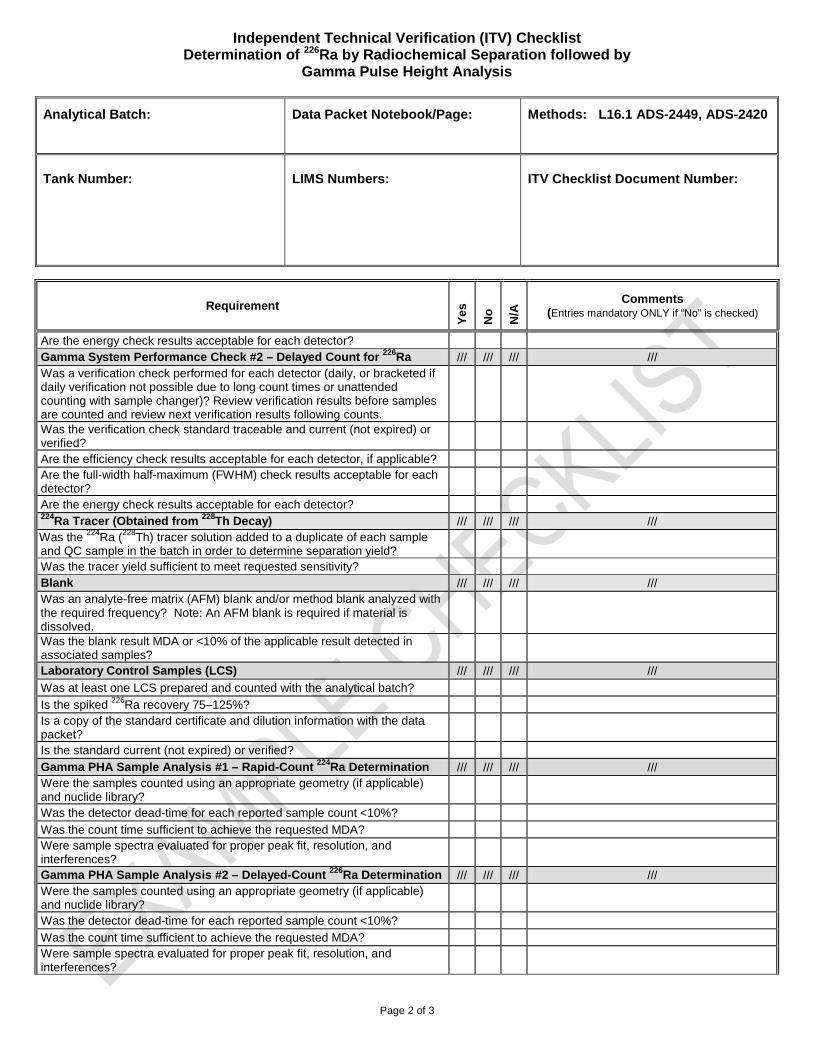
Independent Technical Verification (ITV) Checklist Determination of 226Ra by Radiochemical Separation followed by
Gamma Pulse Height Analysis
Analytical Batch: Data Packet Notebook/Page: Methods: L16.1 ADS-2449, ADS-2420
Tank Number: LIMS Numbers: ITV Checklist Document Number:
Page 2 of 3
Requirement
Ye
s
No
N/A
Comments (Entries mandatory ONLY if “No” is checked)
Are the energy check results acceptable for each detector? Gamma System Performance Check #2 – Delayed Count for 226Ra /// /// /// /// Was a verification check performed for each detector (daily, or bracketed if daily verification not possible due to long count times or unattended counting with sample changer)? Review verification results before samples are counted and review next verification results following counts.
Was the verification check standard traceable and current (not expired) or verified?
Are the efficiency check results acceptable for each detector, if applicable? Are the full-width half-maximum (FWHM) check results acceptable for each detector?
Are the energy check results acceptable for each detector? 224Ra Tracer (Obtained from 228Th Decay) /// /// /// /// Was the 224Ra (228Th) tracer solution added to a duplicate of each sample and QC sample in the batch in order to determine separation yield?
Was the tracer yield sufficient to meet requested sensitivity? Blank /// /// /// /// Was an analyte-free matrix (AFM) blank and/or method blank analyzed with the required frequency? Note: An AFM blank is required if material is dissolved.
Was the blank result MDA or <10% of the applicable result detected in associated samples?
Laboratory Control Samples (LCS) /// /// /// ///
Was at least one LCS prepared and counted with the analytical batch?
Is the spiked 226Ra recovery 75–125%? Is a copy of the standard certificate and dilution information with the data packet?
Is the standard current (not expired) or verified?
Gamma PHA Sample Analysis #1 – Rapid-Count 224Ra Determination /// /// /// /// Were the samples counted using an appropriate geometry (if applicable) and nuclide library?
Was the detector dead-time for each reported sample count <10%?
Was the count time sufficient to achieve the requested MDA? Were sample spectra evaluated for proper peak fit, resolution, and interferences?
Gamma PHA Sample Analysis #2 – Delayed-Count 226Ra Determination /// /// /// /// Were the samples counted using an appropriate geometry (if applicable) and nuclide library?
Was the detector dead-time for each reported sample count <10%?
Was the count time sufficient to achieve the requested MDA? Were sample spectra evaluated for proper peak fit, resolution, and interferences?
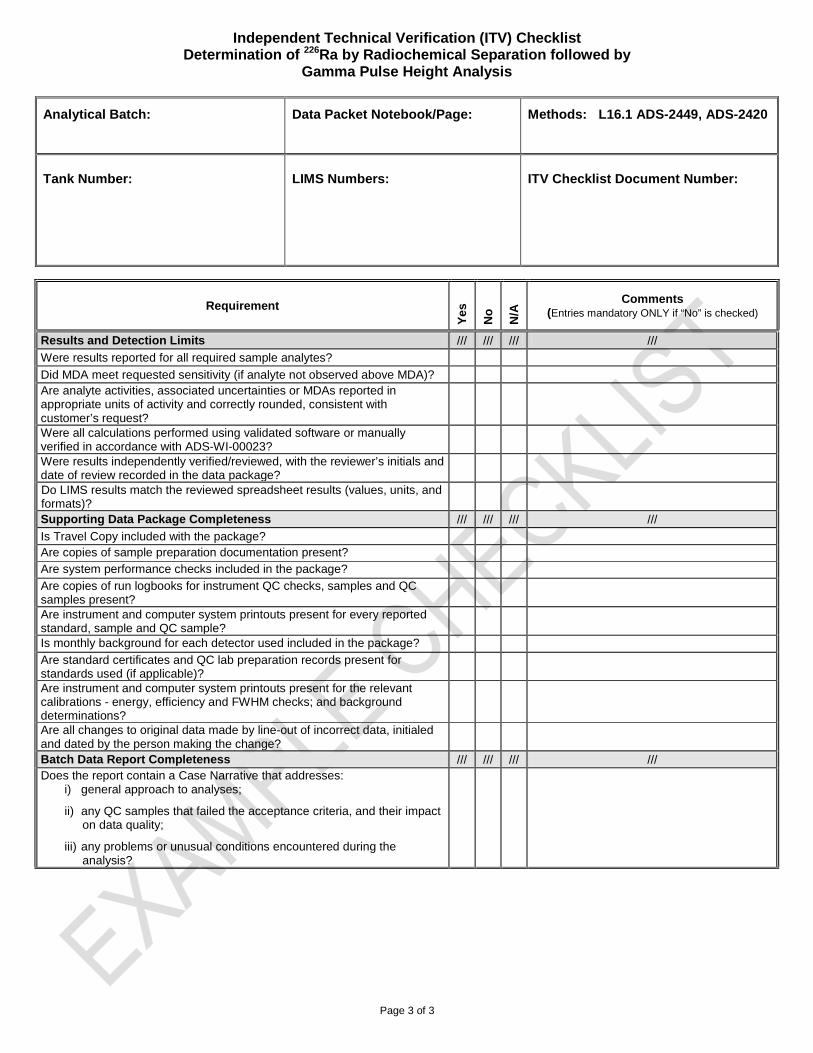
Independent Technical Verification (ITV) Checklist Determination of 226Ra by Radiochemical Separation followed by
Gamma Pulse Height Analysis
Analytical Batch: Data Packet Notebook/Page: Methods: L16.1 ADS-2449, ADS-2420
Tank Number: LIMS Numbers: ITV Checklist Document Number:
Page 3 of 3
Requirement
Ye
s
No
N/A
Comments (Entries mandatory ONLY if “No” is checked)
Results and Detection Limits /// /// /// ///
Were results reported for all required sample analytes?
Did MDA meet requested sensitivity (if analyte not observed above MDA)? Are analyte activities, associated uncertainties or MDAs reported in appropriate units of activity and correctly rounded, consistent with customer’s request?
Were all calculations performed using validated software or manually verified in accordance with ADS-WI-00023?
Were results independently verified/reviewed, with the reviewer’s initials and date of review recorded in the data package?
Do LIMS results match the reviewed spreadsheet results (values, units, and formats)?
Supporting Data Package Completeness /// /// /// ///
Is Travel Copy included with the package? Are copies of sample preparation documentation present? Are system performance checks included in the package? Are copies of run logbooks for instrument QC checks, samples and QC samples present?
Are instrument and computer system printouts present for every reported standard, sample and QC sample?
Is monthly background for each detector used included in the package? Are standard certificates and QC lab preparation records present for standards used (if applicable)?
Are instrument and computer system printouts present for the relevant calibrations - energy, efficiency and FWHM checks; and background determinations?
Are all changes to original data made by line-out of incorrect data, initialed and dated by the person making the change?
Batch Data Report Completeness /// /// /// /// Does the report contain a Case Narrative that addresses:
i) general approach to analyses; ii) any QC samples that failed the acceptance criteria, and their impact
on data quality; iii) any problems or unusual conditions encountered during the
analysis?
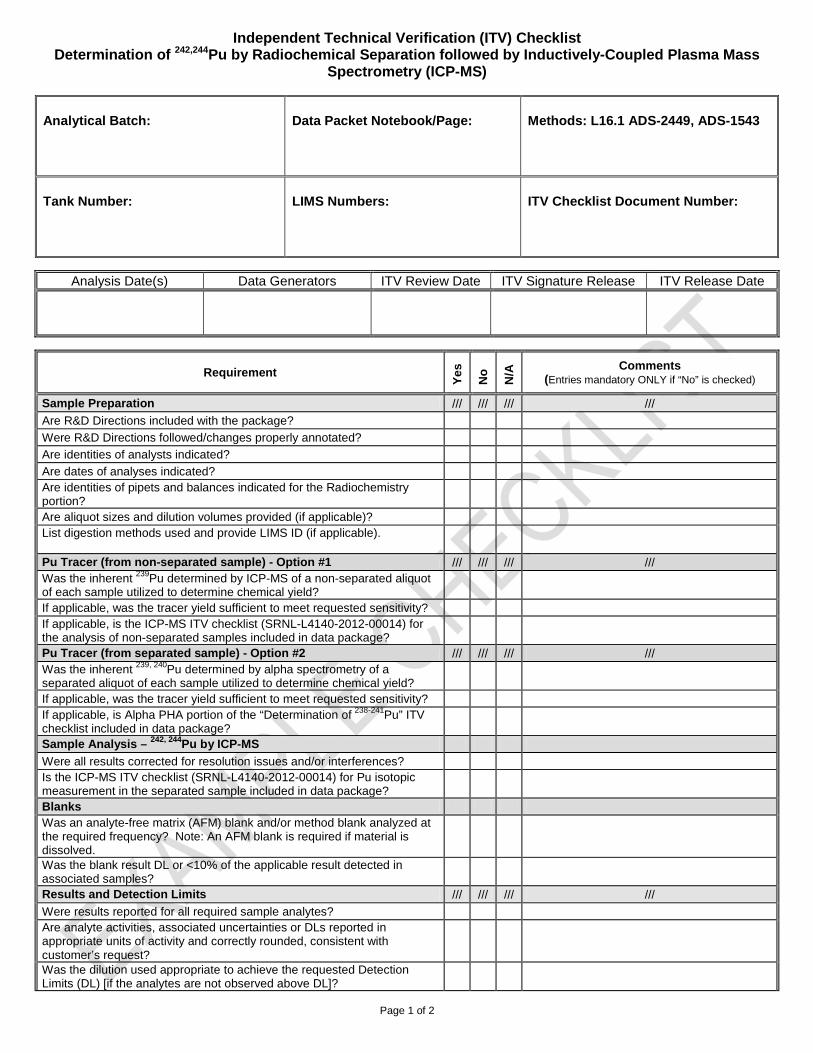
Independent Technical Verification (ITV) Checklist Determination of 242,244Pu by Radiochemical Separation followed by Inductively-Coupled Plasma Mass
Spectrometry (ICP-MS)
Analytical Batch: Data Packet Notebook/Page:
Methods: L16.1 ADS-2449, ADS-1543
Tank Number: LIMS Numbers: ITV Checklist Document Number:
Page 1 of 2
Analysis Date(s) Data Generators ITV Review Date ITV Signature Release ITV Release Date
Requirement
Ye
s
No
N/A
Comments (Entries mandatory ONLY if “No” is checked)
Sample Preparation /// /// /// ///
Are R&D Directions included with the package?
Were R&D Directions followed/changes properly annotated?
Are identities of analysts indicated?
Are dates of analyses indicated? Are identities of pipets and balances indicated for the Radiochemistry portion?
Are aliquot sizes and dilution volumes provided (if applicable)? List digestion methods used and provide LIMS ID (if applicable).
Pu Tracer (from non-separated sample) - Option #1 /// /// /// /// Was the inherent 239Pu determined by ICP-MS of a non-separated aliquot of each sample utilized to determine chemical yield?
If applicable, was the tracer yield sufficient to meet requested sensitivity? If applicable, is the ICP-MS ITV checklist (SRNL-L4140-2012-00014) for the analysis of non-separated samples included in data package?
Pu Tracer (from separated sample) - Option #2 /// /// /// /// Was the inherent 239, 240Pu determined by alpha spectrometry of a separated aliquot of each sample utilized to determine chemical yield?
If applicable, was the tracer yield sufficient to meet requested sensitivity? If applicable, is Alpha PHA portion of the “Determination of 238-241Pu” ITV checklist included in data package?
Sample Analysis – 242, 244Pu by ICP-MS
Were all results corrected for resolution issues and/or interferences? Is the ICP-MS ITV checklist (SRNL-L4140-2012-00014) for Pu isotopic measurement in the separated sample included in data package?
Blanks Was an analyte-free matrix (AFM) blank and/or method blank analyzed at the required frequency? Note: An AFM blank is required if material is dissolved.
Was the blank result DL or <10% of the applicable result detected in associated samples?
Results and Detection Limits /// /// /// ///
Were results reported for all required sample analytes? Are analyte activities, associated uncertainties or DLs reported in appropriate units of activity and correctly rounded, consistent with customer’s request?
Was the dilution used appropriate to achieve the requested Detection Limits (DL) [if the analytes are not observed above DL]?
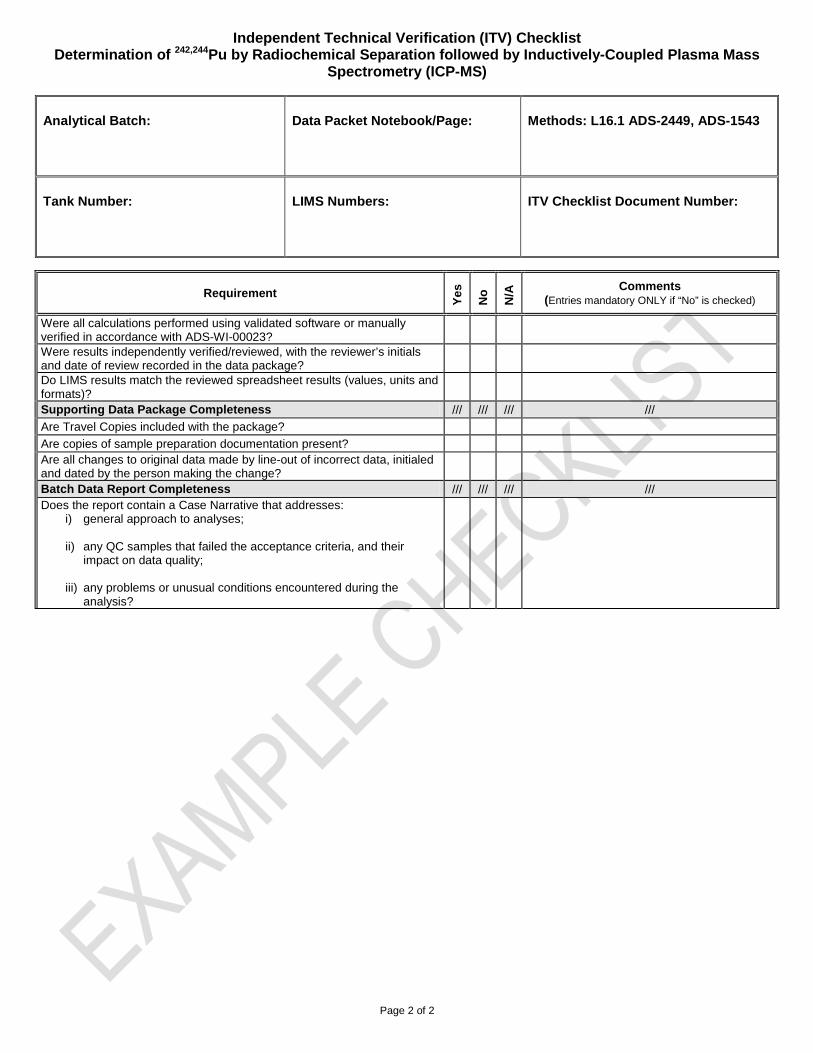
Independent Technical Verification (ITV) Checklist Determination of 242,244Pu by Radiochemical Separation followed by Inductively-Coupled Plasma Mass
Spectrometry (ICP-MS)
Analytical Batch: Data Packet Notebook/Page:
Methods: L16.1 ADS-2449, ADS-1543
Tank Number: LIMS Numbers: ITV Checklist Document Number:
Page 2 of 2
Requirement
Ye
s
No
N/A
Comments (Entries mandatory ONLY if “No” is checked)
Were all calculations performed using validated software or manually verified in accordance with ADS-WI-00023?
Were results independently verified/reviewed, with the reviewer’s initials and date of review recorded in the data package?
Do LIMS results match the reviewed spreadsheet results (values, units and formats)?
Supporting Data Package Completeness /// /// /// ///
Are Travel Copies included with the package?
Are copies of sample preparation documentation present? Are all changes to original data made by line-out of incorrect data, initialed and dated by the person making the change?
Batch Data Report Completeness /// /// /// /// Does the report contain a Case Narrative that addresses:
i) general approach to analyses; ii) any QC samples that failed the acceptance criteria, and their
impact on data quality; iii) any problems or unusual conditions encountered during the
analysis?
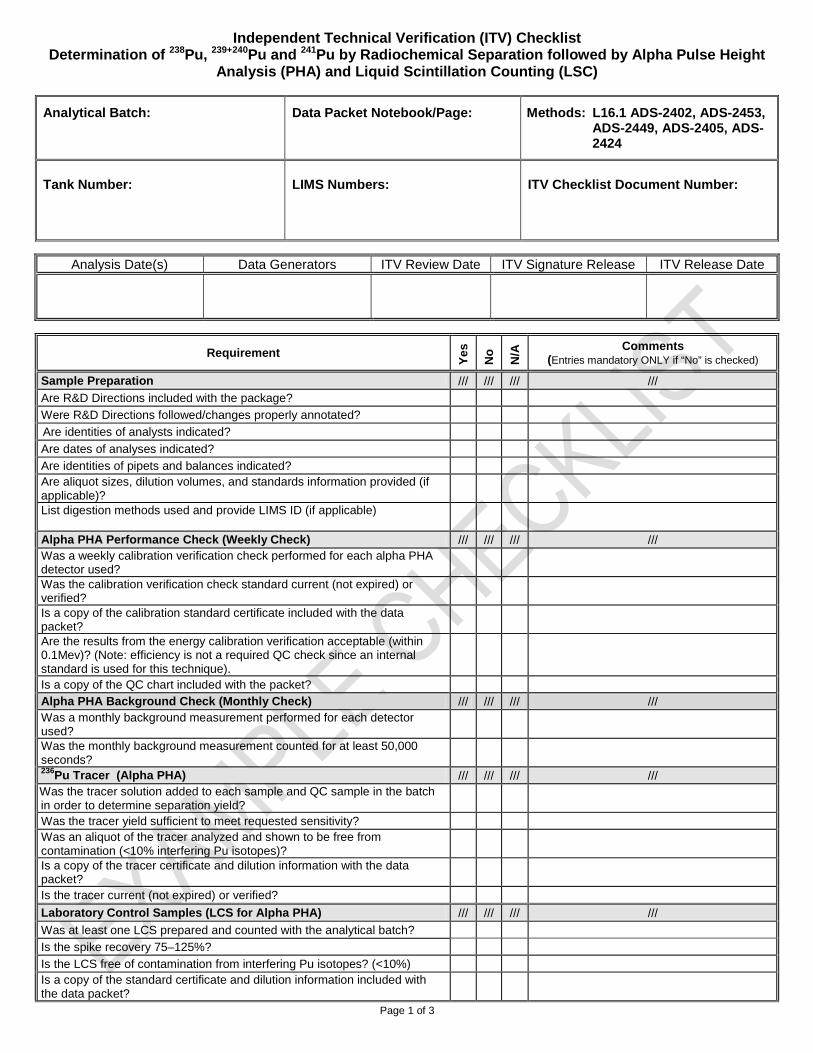
Independent Technical Verification (ITV) Checklist Determination of 238Pu, 239+240Pu and 241Pu by Radiochemical Separation followed by Alpha Pulse Height
Analysis (PHA) and Liquid Scintillation Counting (LSC)
Analytical Batch: Data Packet Notebook/Page: Methods: L16.1 ADS-2402, ADS-2453, ADS-2449, ADS-2405, ADS-2424
Tank Number: LIMS Numbers: ITV Checklist Document Number:
Page 1 of 3
Analysis Date(s) Data Generators ITV Review Date ITV Signature Release ITV Release Date
Requirement
Ye
s
No
N/A
Comments (Entries mandatory ONLY if “No” is checked)
Sample Preparation /// /// /// ///
Are R&D Directions included with the package?
Were R&D Directions followed/changes properly annotated?
Are identities of analysts indicated?
Are dates of analyses indicated?
Are identities of pipets and balances indicated? Are aliquot sizes, dilution volumes, and standards information provided (if applicable)?
List digestion methods used and provide LIMS ID (if applicable)
Alpha PHA Performance Check (Weekly Check) /// /// /// /// Was a weekly calibration verification check performed for each alpha PHA detector used?
Was the calibration verification check standard current (not expired) or verified?
Is a copy of the calibration standard certificate included with the data packet?
Are the results from the energy calibration verification acceptable (within 0.1Mev)? (Note: efficiency is not a required QC check since an internal standard is used for this technique).
Is a copy of the QC chart included with the packet? Alpha PHA Background Check (Monthly Check) /// /// /// /// Was a monthly background measurement performed for each detector used?
Was the monthly background measurement counted for at least 50,000 seconds?
236Pu Tracer (Alpha PHA) /// /// /// /// Was the tracer solution added to each sample and QC sample in the batch in order to determine separation yield?
Was the tracer yield sufficient to meet requested sensitivity? Was an aliquot of the tracer analyzed and shown to be free from contamination (<10% interfering Pu isotopes)?
Is a copy of the tracer certificate and dilution information with the data packet?
Is the tracer current (not expired) or verified?
Laboratory Control Samples (LCS for Alpha PHA) /// /// /// ///
Was at least one LCS prepared and counted with the analytical batch?
Is the spike recovery 75–125%?
Is the LCS free of contamination from interfering Pu isotopes? (<10%) Is a copy of the standard certificate and dilution information included with the data packet?
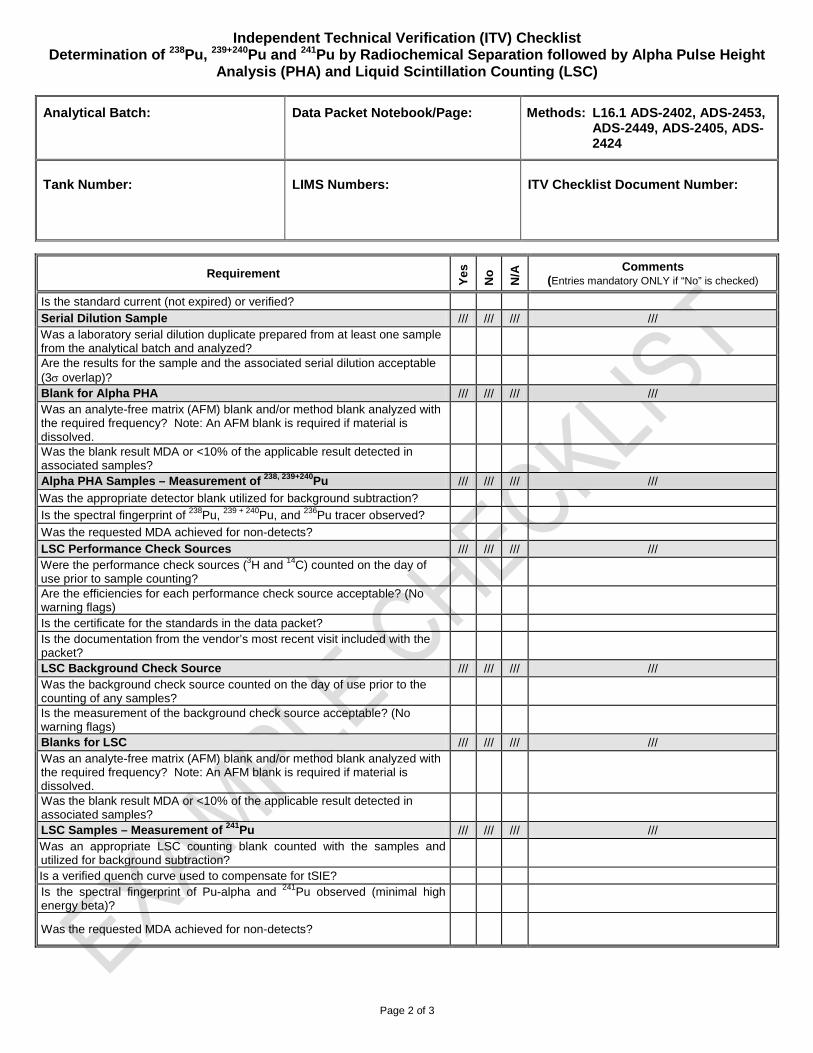
Independent Technical Verification (ITV) Checklist Determination of 238Pu, 239+240Pu and 241Pu by Radiochemical Separation followed by Alpha Pulse Height
Analysis (PHA) and Liquid Scintillation Counting (LSC)
Analytical Batch: Data Packet Notebook/Page: Methods: L16.1 ADS-2402, ADS-2453, ADS-2449, ADS-2405, ADS-2424
Tank Number: LIMS Numbers: ITV Checklist Document Number:
Page 2 of 3
Requirement
Ye
s
No
N/A
Comments (Entries mandatory ONLY if “No” is checked)
Is the standard current (not expired) or verified? Serial Dilution Sample /// /// /// /// Was a laboratory serial dilution duplicate prepared from at least one sample from the analytical batch and analyzed?
Are the results for the sample and the associated serial dilution acceptable (3σ overlap)?
Blank for Alpha PHA /// /// /// /// Was an analyte-free matrix (AFM) blank and/or method blank analyzed with the required frequency? Note: An AFM blank is required if material is dissolved.
Was the blank result MDA or <10% of the applicable result detected in associated samples?
Alpha PHA Samples – Measurement of 238, 239+240Pu /// /// /// ///
Was the appropriate detector blank utilized for background subtraction?
Is the spectral fingerprint of 238Pu, 239 + 240Pu, and 236Pu tracer observed?
Was the requested MDA achieved for non-detects? LSC Performance Check Sources /// /// /// /// Were the performance check sources (3H and 14C) counted on the day of use prior to sample counting?
Are the efficiencies for each performance check source acceptable? (No warning flags)
Is the certificate for the standards in the data packet? Is the documentation from the vendor’s most recent visit included with the packet?
LSC Background Check Source /// /// /// /// Was the background check source counted on the day of use prior to the counting of any samples?
Is the measurement of the background check source acceptable? (No warning flags)
Blanks for LSC /// /// /// /// Was an analyte-free matrix (AFM) blank and/or method blank analyzed with the required frequency? Note: An AFM blank is required if material is dissolved.
Was the blank result MDA or <10% of the applicable result detected in associated samples?
LSC Samples – Measurement of 241Pu /// /// /// /// Was an appropriate LSC counting blank counted with the samples and utilized for background subtraction?
Is a verified quench curve used to compensate for tSIE? Is the spectral fingerprint of Pu-alpha and 241Pu observed (minimal high energy beta)?
Was the requested MDA achieved for non-detects?
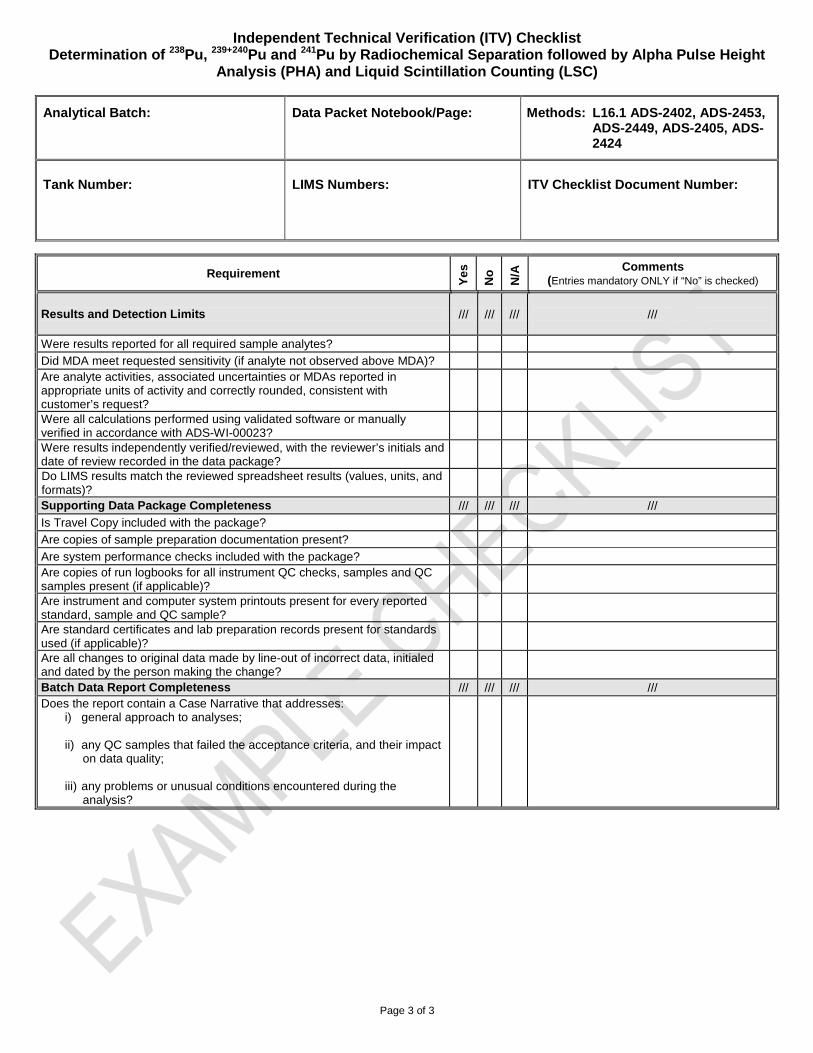
Independent Technical Verification (ITV) Checklist Determination of 238Pu, 239+240Pu and 241Pu by Radiochemical Separation followed by Alpha Pulse Height
Analysis (PHA) and Liquid Scintillation Counting (LSC)
Analytical Batch: Data Packet Notebook/Page: Methods: L16.1 ADS-2402, ADS-2453, ADS-2449, ADS-2405, ADS-2424
Tank Number: LIMS Numbers: ITV Checklist Document Number:
Page 3 of 3
Requirement
Ye
s
No
N/A
Comments (Entries mandatory ONLY if “No” is checked)
Results and Detection Limits /// /// ///
///
Were results reported for all required sample analytes?
Did MDA meet requested sensitivity (if analyte not observed above MDA)? Are analyte activities, associated uncertainties or MDAs reported in appropriate units of activity and correctly rounded, consistent with customer’s request?
Were all calculations performed using validated software or manually verified in accordance with ADS-WI-00023?
Were results independently verified/reviewed, with the reviewer’s initials and date of review recorded in the data package?
Do LIMS results match the reviewed spreadsheet results (values, units, and formats)?
Supporting Data Package Completeness /// /// /// ///
Is Travel Copy included with the package?
Are copies of sample preparation documentation present?
Are system performance checks included with the package? Are copies of run logbooks for all instrument QC checks, samples and QC samples present (if applicable)?
Are instrument and computer system printouts present for every reported standard, sample and QC sample?
Are standard certificates and lab preparation records present for standards used (if applicable)?
Are all changes to original data made by line-out of incorrect data, initialed and dated by the person making the change?
Batch Data Report Completeness /// /// /// /// Does the report contain a Case Narrative that addresses:
i) general approach to analyses; ii) any QC samples that failed the acceptance criteria, and their impact
on data quality; iii) any problems or unusual conditions encountered during the
analysis?
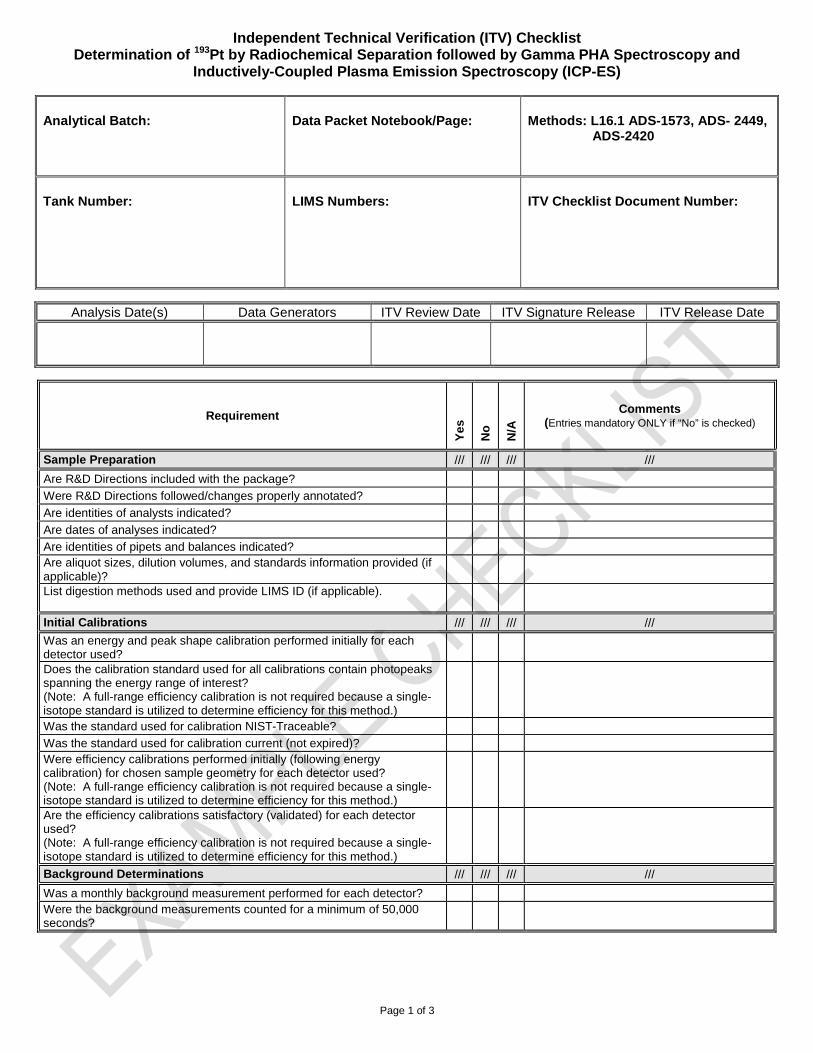
Independent Technical Verification (ITV) Checklist Determination of 193Pt by Radiochemical Separation followed by Gamma PHA Spectroscopy and
Inductively-Coupled Plasma Emission Spectroscopy (ICP-ES)
Analytical Batch: Data Packet Notebook/Page:
Methods: L16.1 ADS-1573, ADS- 2449, ADS-2420
Tank Number: LIMS Numbers:
ITV Checklist Document Number:
Page 1 of 3
Analysis Date(s) Data Generators ITV Review Date ITV Signature Release ITV Release Date
Requirement
Ye
s
No
N/A
Comments (Entries mandatory ONLY if “No” is checked)
Sample Preparation /// /// /// ///
Are R&D Directions included with the package?
Were R&D Directions followed/changes properly annotated?
Are identities of analysts indicated?
Are dates of analyses indicated?
Are identities of pipets and balances indicated? Are aliquot sizes, dilution volumes, and standards information provided (if applicable)?
List digestion methods used and provide LIMS ID (if applicable).
Initial Calibrations /// /// /// ///
Was an energy and peak shape calibration performed initially for each detector used?
Does the calibration standard used for all calibrations contain photopeaks spanning the energy range of interest? (Note: A full-range efficiency calibration is not required because a single-isotope standard is utilized to determine efficiency for this method.)
Was the standard used for calibration NIST-Traceable?
Was the standard used for calibration current (not expired)? Were efficiency calibrations performed initially (following energy calibration) for chosen sample geometry for each detector used? (Note: A full-range efficiency calibration is not required because a single-isotope standard is utilized to determine efficiency for this method.)
Are the efficiency calibrations satisfactory (validated) for each detector used? (Note: A full-range efficiency calibration is not required because a single-isotope standard is utilized to determine efficiency for this method.)
Background Determinations /// /// /// ///
Was a monthly background measurement performed for each detector? Were the background measurements counted for a minimum of 50,000 seconds?
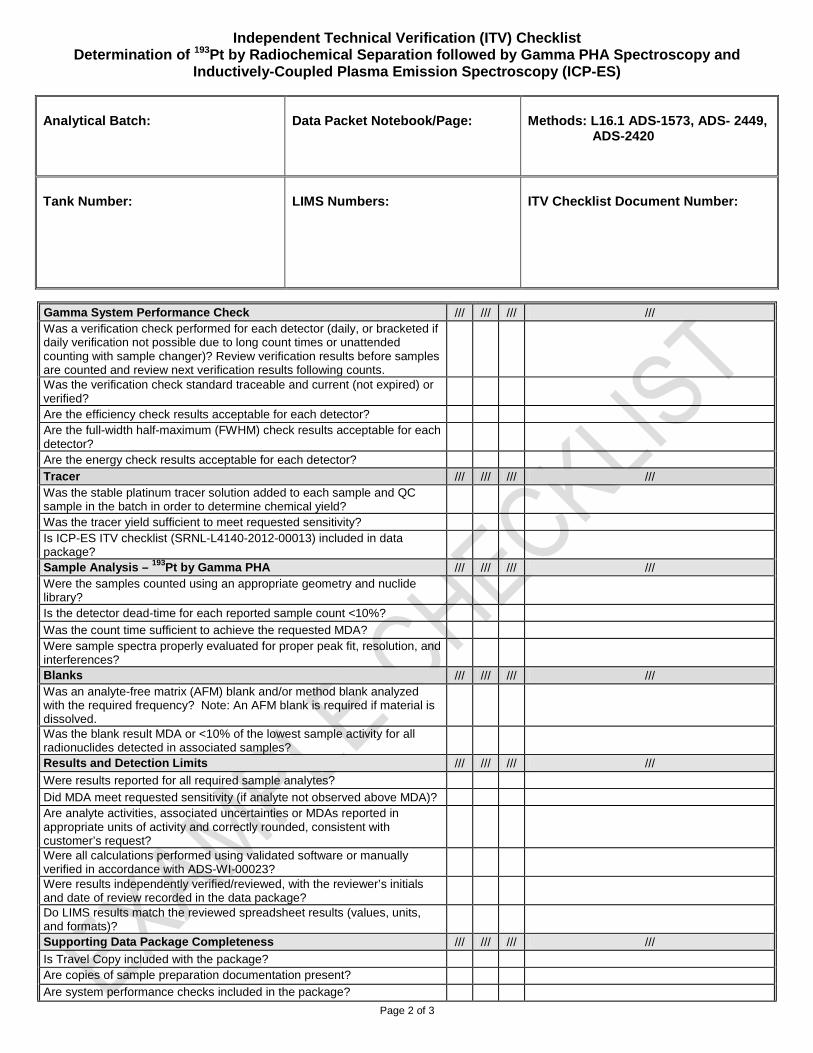
Independent Technical Verification (ITV) Checklist Determination of 193Pt by Radiochemical Separation followed by Gamma PHA Spectroscopy and
Inductively-Coupled Plasma Emission Spectroscopy (ICP-ES)
Analytical Batch: Data Packet Notebook/Page:
Methods: L16.1 ADS-1573, ADS- 2449, ADS-2420
Tank Number: LIMS Numbers:
ITV Checklist Document Number:
Page 2 of 3
Gamma System Performance Check /// /// /// /// Was a verification check performed for each detector (daily, or bracketed if daily verification not possible due to long count times or unattended counting with sample changer)? Review verification results before samples are counted and review next verification results following counts.
Was the verification check standard traceable and current (not expired) or verified?
Are the efficiency check results acceptable for each detector? Are the full-width half-maximum (FWHM) check results acceptable for each detector?
Are the energy check results acceptable for each detector? Tracer /// /// /// /// Was the stable platinum tracer solution added to each sample and QC sample in the batch in order to determine chemical yield?
Was the tracer yield sufficient to meet requested sensitivity? Is ICP-ES ITV checklist (SRNL-L4140-2012-00013) included in data package?
Sample Analysis – 193Pt by Gamma PHA /// /// /// /// Were the samples counted using an appropriate geometry and nuclide library?
Is the detector dead-time for each reported sample count <10%?
Was the count time sufficient to achieve the requested MDA? Were sample spectra properly evaluated for proper peak fit, resolution, and interferences?
Blanks /// /// /// /// Was an analyte-free matrix (AFM) blank and/or method blank analyzed with the required frequency? Note: An AFM blank is required if material is dissolved.
Was the blank result MDA or <10% of the lowest sample activity for all radionuclides detected in associated samples?
Results and Detection Limits /// /// /// ///
Were results reported for all required sample analytes?
Did MDA meet requested sensitivity (if analyte not observed above MDA)? Are analyte activities, associated uncertainties or MDAs reported in appropriate units of activity and correctly rounded, consistent with customer’s request?
Were all calculations performed using validated software or manually verified in accordance with ADS-WI-00023?
Were results independently verified/reviewed, with the reviewer’s initials and date of review recorded in the data package?
Do LIMS results match the reviewed spreadsheet results (values, units, and formats)?
Supporting Data Package Completeness /// /// /// ///
Is Travel Copy included with the package? Are copies of sample preparation documentation present? Are system performance checks included in the package?
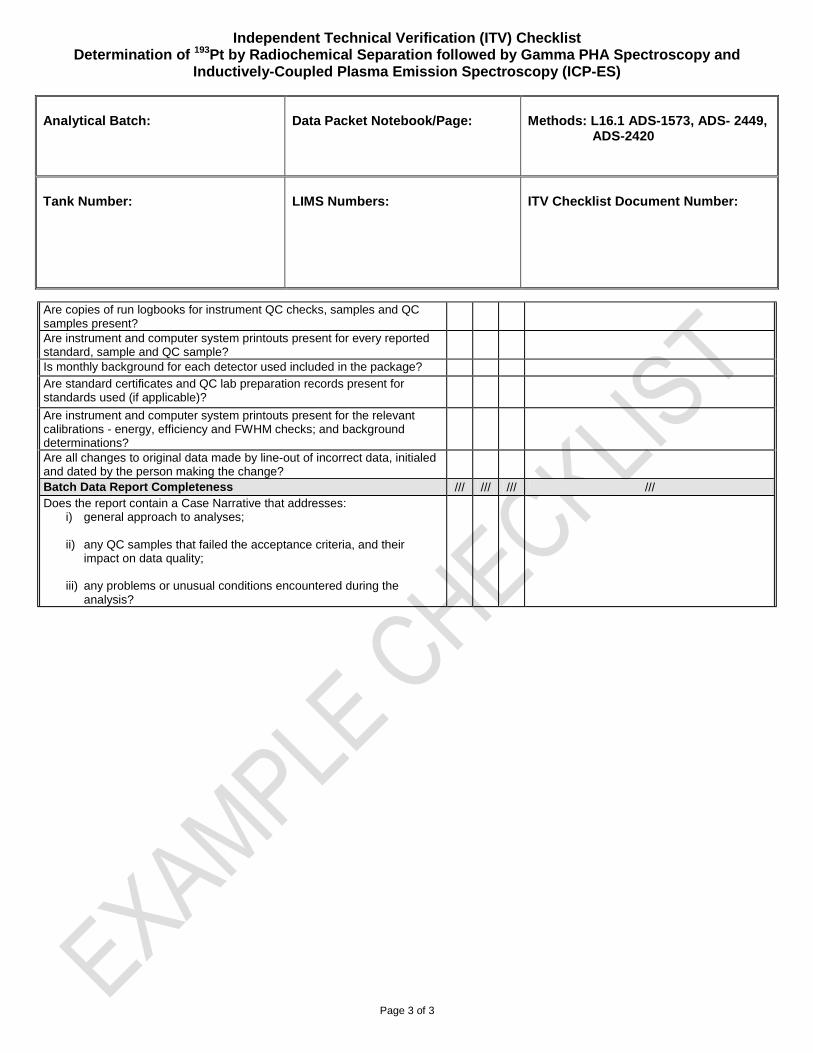
Independent Technical Verification (ITV) Checklist Determination of 193Pt by Radiochemical Separation followed by Gamma PHA Spectroscopy and
Inductively-Coupled Plasma Emission Spectroscopy (ICP-ES)
Analytical Batch: Data Packet Notebook/Page:
Methods: L16.1 ADS-1573, ADS- 2449, ADS-2420
Tank Number: LIMS Numbers:
ITV Checklist Document Number:
Page 3 of 3
Are copies of run logbooks for instrument QC checks, samples and QC samples present?
Are instrument and computer system printouts present for every reported standard, sample and QC sample?
Is monthly background for each detector used included in the package? Are standard certificates and QC lab preparation records present for standards used (if applicable)?
Are instrument and computer system printouts present for the relevant calibrations - energy, efficiency and FWHM checks; and background determinations?
Are all changes to original data made by line-out of incorrect data, initialed and dated by the person making the change?
Batch Data Report Completeness /// /// /// /// Does the report contain a Case Narrative that addresses:
i) general approach to analyses; ii) any QC samples that failed the acceptance criteria, and their
impact on data quality;
iii) any problems or unusual conditions encountered during the analysis?
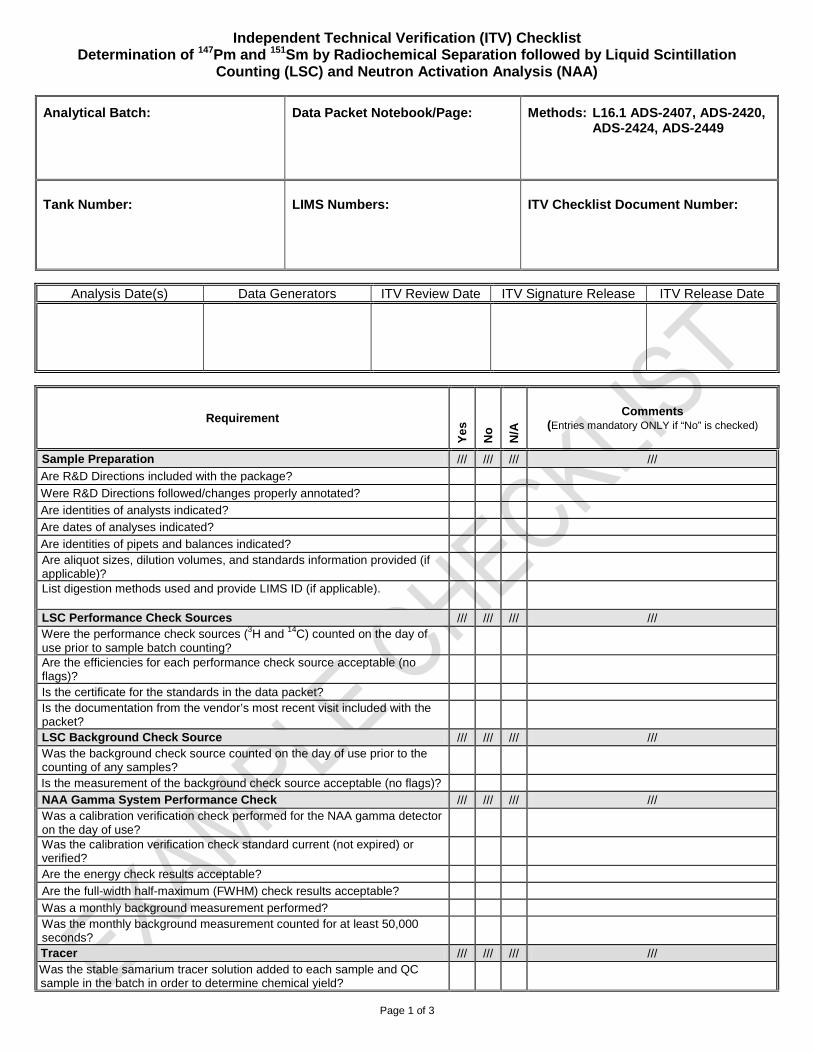
Independent Technical Verification (ITV) Checklist Determination of 147Pm and 151Sm by Radiochemical Separation followed by Liquid Scintillation
Counting (LSC) and Neutron Activation Analysis (NAA)
Analytical Batch: Data Packet Notebook/Page: Methods: L16.1 ADS-2407, ADS-2420, ADS-2424, ADS-2449
Tank Number: LIMS Numbers: ITV Checklist Document Number:
Page 1 of 3
Analysis Date(s) Data Generators ITV Review Date ITV Signature Release ITV Release Date
Requirement
Ye
s
No
N/A
Comments (Entries mandatory ONLY if “No” is checked)
Sample Preparation /// /// /// ///
Are R&D Directions included with the package?
Were R&D Directions followed/changes properly annotated?
Are identities of analysts indicated?
Are dates of analyses indicated?
Are identities of pipets and balances indicated? Are aliquot sizes, dilution volumes, and standards information provided (if applicable)?
List digestion methods used and provide LIMS ID (if applicable).
LSC Performance Check Sources /// /// /// /// Were the performance check sources (3H and 14C) counted on the day of use prior to sample batch counting?
Are the efficiencies for each performance check source acceptable (no flags)?
Is the certificate for the standards in the data packet? Is the documentation from the vendor’s most recent visit included with the packet?
LSC Background Check Source /// /// /// /// Was the background check source counted on the day of use prior to the counting of any samples?
Is the measurement of the background check source acceptable (no flags)? NAA Gamma System Performance Check /// /// /// /// Was a calibration verification check performed for the NAA gamma detector on the day of use?
Was the calibration verification check standard current (not expired) or verified?
Are the energy check results acceptable?
Are the full-width half-maximum (FWHM) check results acceptable?
Was a monthly background measurement performed? Was the monthly background measurement counted for at least 50,000 seconds?
Tracer /// /// /// /// Was the stable samarium tracer solution added to each sample and QC sample in the batch in order to determine chemical yield?
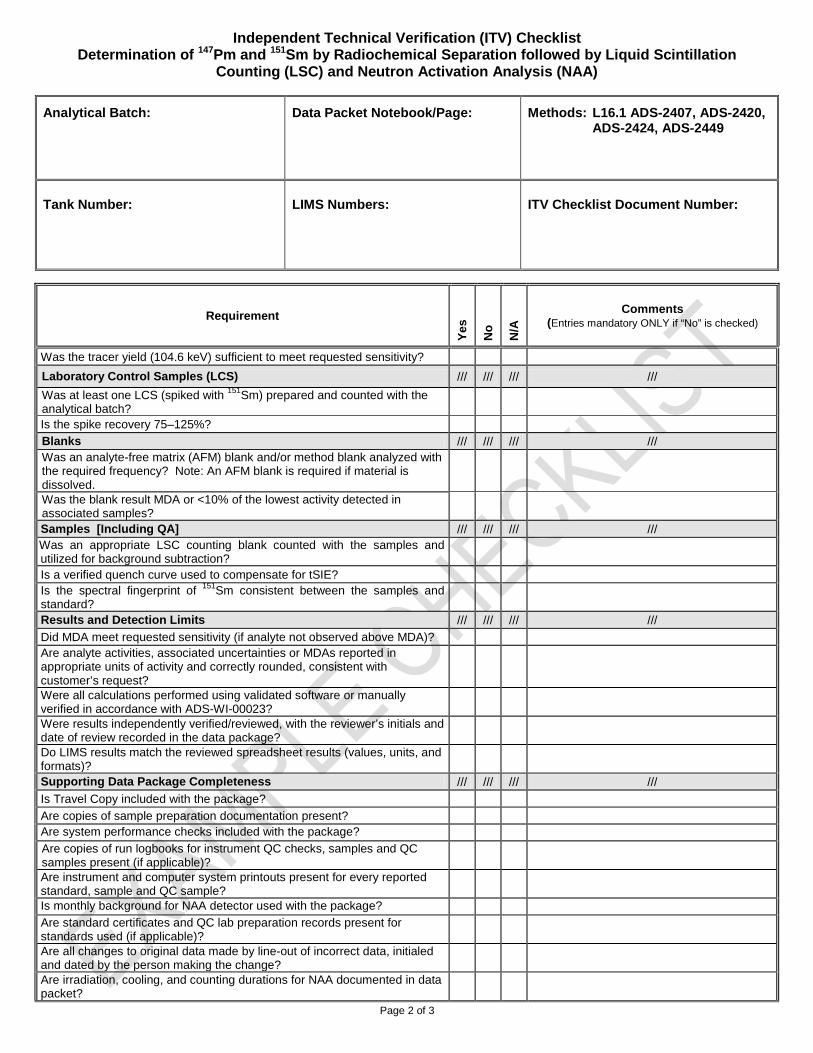
Independent Technical Verification (ITV) Checklist Determination of 147Pm and 151Sm by Radiochemical Separation followed by Liquid Scintillation
Counting (LSC) and Neutron Activation Analysis (NAA)
Analytical Batch: Data Packet Notebook/Page: Methods: L16.1 ADS-2407, ADS-2420, ADS-2424, ADS-2449
Tank Number: LIMS Numbers: ITV Checklist Document Number:
Page 2 of 3
Requirement
Ye
s
No
N/A
Comments (Entries mandatory ONLY if “No” is checked)
Was the tracer yield (104.6 keV) sufficient to meet requested sensitivity?
Laboratory Control Samples (LCS) /// /// /// ///
Was at least one LCS (spiked with 151Sm) prepared and counted with the analytical batch?
Is the spike recovery 75–125%?
Blanks /// /// /// /// Was an analyte-free matrix (AFM) blank and/or method blank analyzed with the required frequency? Note: An AFM blank is required if material is dissolved.
Was the blank result MDA or <10% of the lowest activity detected in associated samples?
Samples [Including QA] /// /// /// /// Was an appropriate LSC counting blank counted with the samples and utilized for background subtraction?
Is a verified quench curve used to compensate for tSIE? Is the spectral fingerprint of 151Sm consistent between the samples and standard?
Results and Detection Limits /// /// /// ///
Did MDA meet requested sensitivity (if analyte not observed above MDA)? Are analyte activities, associated uncertainties or MDAs reported in appropriate units of activity and correctly rounded, consistent with customer’s request?
Were all calculations performed using validated software or manually verified in accordance with ADS-WI-00023?
Were results independently verified/reviewed, with the reviewer’s initials and date of review recorded in the data package?
Do LIMS results match the reviewed spreadsheet results (values, units, and formats)?
Supporting Data Package Completeness /// /// /// ///
Is Travel Copy included with the package?
Are copies of sample preparation documentation present? Are system performance checks included with the package? Are copies of run logbooks for instrument QC checks, samples and QC samples present (if applicable)?
Are instrument and computer system printouts present for every reported standard, sample and QC sample?
Is monthly background for NAA detector used with the package? Are standard certificates and QC lab preparation records present for standards used (if applicable)?
Are all changes to original data made by line-out of incorrect data, initialed and dated by the person making the change?
Are irradiation, cooling, and counting durations for NAA documented in data packet?
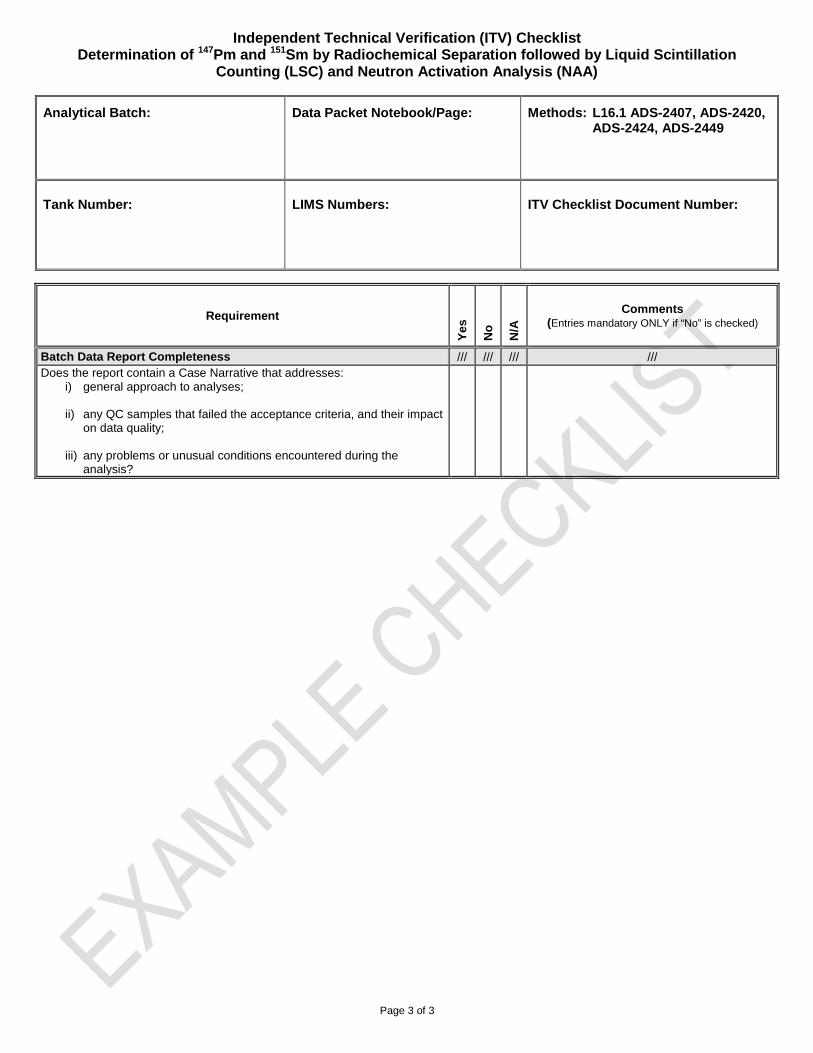
Independent Technical Verification (ITV) Checklist Determination of 147Pm and 151Sm by Radiochemical Separation followed by Liquid Scintillation
Counting (LSC) and Neutron Activation Analysis (NAA)
Analytical Batch: Data Packet Notebook/Page: Methods: L16.1 ADS-2407, ADS-2420, ADS-2424, ADS-2449
Tank Number: LIMS Numbers: ITV Checklist Document Number:
Page 3 of 3
Requirement
Ye
s
No
N/A
Comments (Entries mandatory ONLY if “No” is checked)
Batch Data Report Completeness /// /// /// /// Does the report contain a Case Narrative that addresses:
i) general approach to analyses; ii) any QC samples that failed the acceptance criteria, and their impact
on data quality; iii) any problems or unusual conditions encountered during the
analysis?

Independent Technical Verification (ITV) Checklist Determination of 107Pd by Radiochemical Separation followed by Inductively-Coupled Plasma Mass
Spectrometry (ICP-MS)
Analytical Batch: Data Packet Notebook/Page:
Methods: L16.1 ADS-2449, ADS-1543
Tank Number: LIMS Numbers: ITV Checklist Document Number:
Page 1 of 2
Analysis Date(s) Data Generators ITV Review Date ITV Signature Release ITV Release Date
Requirement
Ye
s
No
N/A
Comments (Entries mandatory ONLY if “No” is checked)
Sample Preparation /// /// /// ///
Are R&D Directions included with the package?
Were R&D Directions followed/changes properly annotated?
Are identities of analysts indicated?
Are dates of analyses indicated? Are identities of pipets and balances indicated for the Radiochemistry portion?
Are aliquot sizes and dilution volumes provided (if applicable)? List digestion methods used and provide LIMS ID (if applicable).
Tracer /// /// /// /// Was stable palladium added into each sample and QC sample in the batch in order to determine chemical yield?
Was the tracer yield sufficient to meet requested sensitivity?
Sample Analysis – 107Pd by ICP-MS /// /// /// ///
Were all results corrected for resolution issues and/or interferences? Is the ICP-MS ITV checklist (SRNL-L4140-2012-00014) for 107Pd measurement in the separated sample aliquot included in data package?
Blanks Was an analyte-free matrix (AFM) blank and/or method blank analyzed at the required frequency? Note: An AFM blank is required if material is dissolved.
Was the blank result DL or <10% of the applicable result detected in associated samples?
Results and Detection Limits /// /// /// ///
Were results reported for all required sample analytes? Are analyte activities, associated uncertainties or DLs reported in appropriate units of activity and correctly rounded, consistent with customer’s request?
Was the dilution used appropriate to achieve the requested Detection Limits (DL) [if the analytes are not observed above DL]?
Were all calculations performed using validated software or manually verified in accordance with ADS-WI-00023?
Were results independently verified/reviewed, with the reviewer’s initials and date of review recorded in the data package?
Do LIMS results match the reviewed spreadsheet results (values, units and formats)?
Supporting Data Package Completeness /// /// /// ///
Are Travel Copies included with the package?
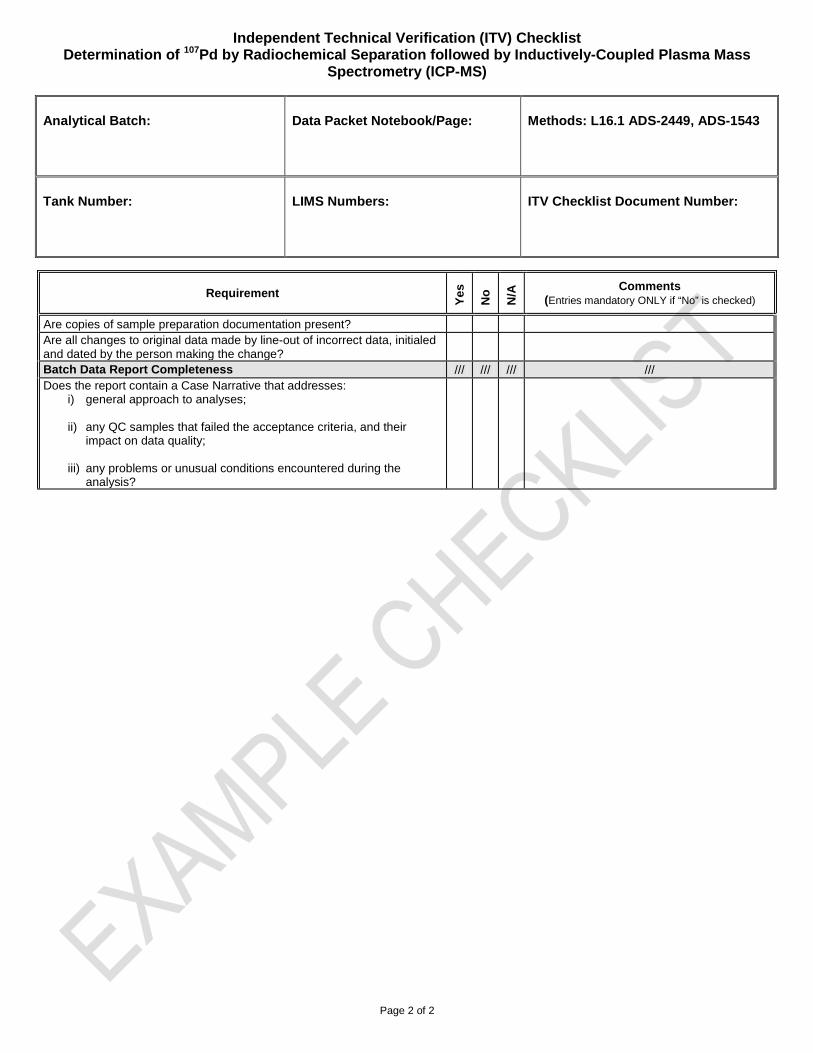
Independent Technical Verification (ITV) Checklist Determination of 107Pd by Radiochemical Separation followed by Inductively-Coupled Plasma Mass
Spectrometry (ICP-MS)
Analytical Batch: Data Packet Notebook/Page:
Methods: L16.1 ADS-2449, ADS-1543
Tank Number: LIMS Numbers: ITV Checklist Document Number:
Page 2 of 2
Requirement
Ye
s
No
N/A
Comments (Entries mandatory ONLY if “No” is checked)
Are copies of sample preparation documentation present? Are all changes to original data made by line-out of incorrect data, initialed and dated by the person making the change?
Batch Data Report Completeness /// /// /// /// Does the report contain a Case Narrative that addresses:
i) general approach to analyses; ii) any QC samples that failed the acceptance criteria, and their
impact on data quality; iii) any problems or unusual conditions encountered during the
analysis?
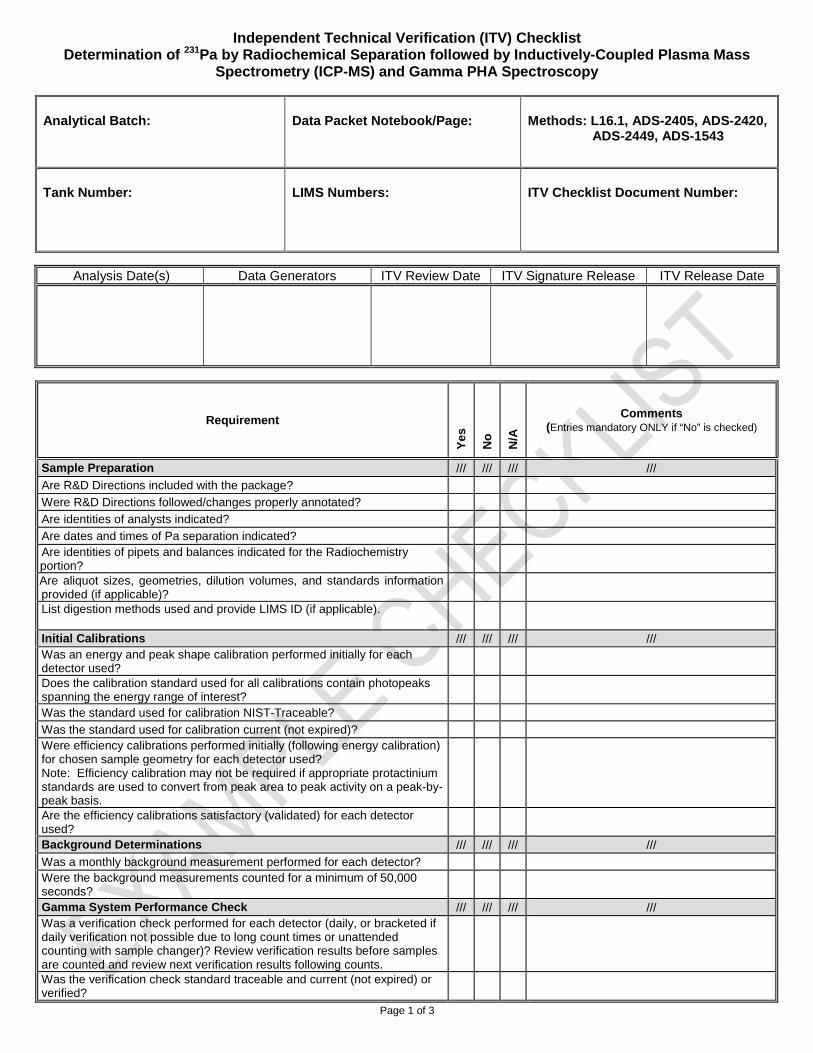
Independent Technical Verification (ITV) Checklist Determination of 231Pa by Radiochemical Separation followed by Inductively-Coupled Plasma Mass
Spectrometry (ICP-MS) and Gamma PHA Spectroscopy
Analytical Batch: Data Packet Notebook/Page: Methods: L16.1, ADS-2405, ADS-2420, ADS-2449, ADS-1543
Tank Number: LIMS Numbers: ITV Checklist Document Number:
Page 1 of 3
Analysis Date(s) Data Generators ITV Review Date ITV Signature Release ITV Release Date
Requirement
Ye
s
No
N/A
Comments (Entries mandatory ONLY if “No” is checked)
Sample Preparation /// /// /// ///
Are R&D Directions included with the package?
Were R&D Directions followed/changes properly annotated?
Are identities of analysts indicated?
Are dates and times of Pa separation indicated? Are identities of pipets and balances indicated for the Radiochemistry portion?
Are aliquot sizes, geometries, dilution volumes, and standards information provided (if applicable)?
List digestion methods used and provide LIMS ID (if applicable).
Initial Calibrations /// /// /// /// Was an energy and peak shape calibration performed initially for each detector used?
Does the calibration standard used for all calibrations contain photopeaks spanning the energy range of interest?
Was the standard used for calibration NIST-Traceable?
Was the standard used for calibration current (not expired)? Were efficiency calibrations performed initially (following energy calibration) for chosen sample geometry for each detector used? Note: Efficiency calibration may not be required if appropriate protactinium standards are used to convert from peak area to peak activity on a peak-by-peak basis.
Are the efficiency calibrations satisfactory (validated) for each detector used?
Background Determinations /// /// /// ///
Was a monthly background measurement performed for each detector? Were the background measurements counted for a minimum of 50,000 seconds?
Gamma System Performance Check /// /// /// /// Was a verification check performed for each detector (daily, or bracketed if daily verification not possible due to long count times or unattended counting with sample changer)? Review verification results before samples are counted and review next verification results following counts.
Was the verification check standard traceable and current (not expired) or verified?
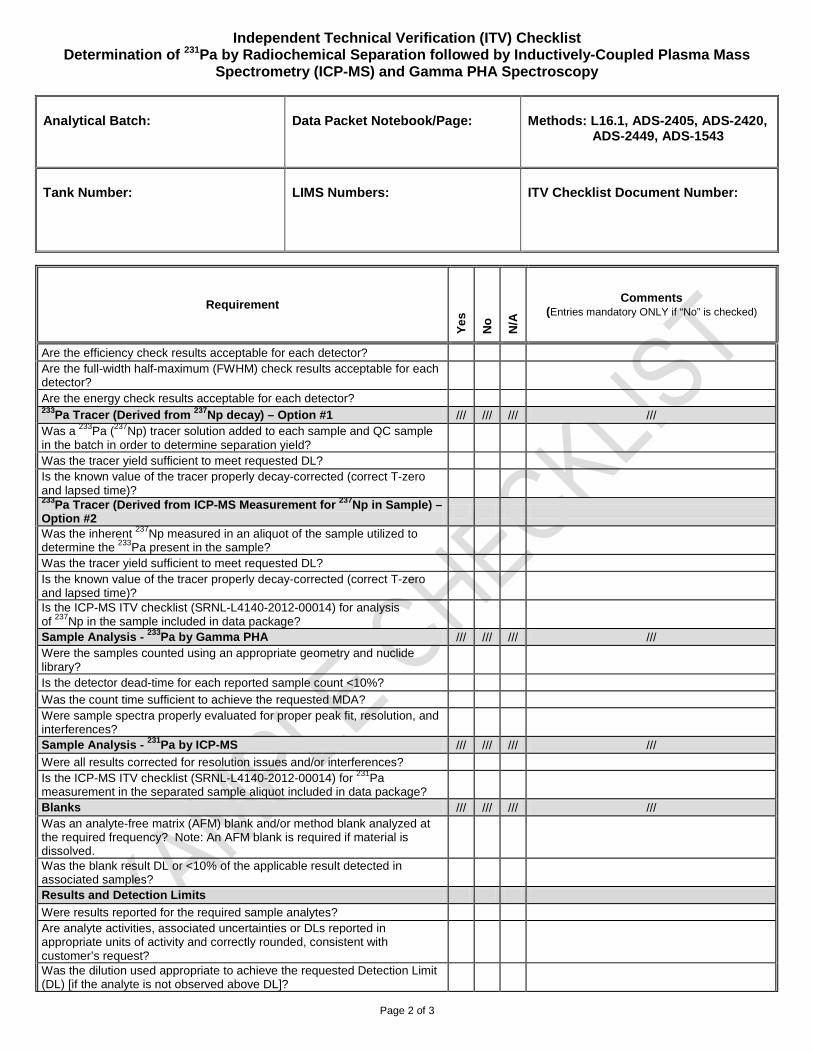
Independent Technical Verification (ITV) Checklist Determination of 231Pa by Radiochemical Separation followed by Inductively-Coupled Plasma Mass
Spectrometry (ICP-MS) and Gamma PHA Spectroscopy
Analytical Batch: Data Packet Notebook/Page: Methods: L16.1, ADS-2405, ADS-2420, ADS-2449, ADS-1543
Tank Number: LIMS Numbers: ITV Checklist Document Number:
Page 2 of 3
Requirement
Ye
s
No
N/A
Comments (Entries mandatory ONLY if “No” is checked)
Are the efficiency check results acceptable for each detector? Are the full-width half-maximum (FWHM) check results acceptable for each detector?
Are the energy check results acceptable for each detector? 233Pa Tracer (Derived from 237Np decay) – Option #1 /// /// /// /// Was a 233Pa (237Np) tracer solution added to each sample and QC sample in the batch in order to determine separation yield?
Was the tracer yield sufficient to meet requested DL? Is the known value of the tracer properly decay-corrected (correct T-zero and lapsed time)?
233Pa Tracer (Derived from ICP-MS Measurement for 237Np in Sample) – Option #2
Was the inherent 237Np measured in an aliquot of the sample utilized to determine the 233Pa present in the sample?
Was the tracer yield sufficient to meet requested DL? Is the known value of the tracer properly decay-corrected (correct T-zero and lapsed time)?
Is the ICP-MS ITV checklist (SRNL-L4140-2012-00014) for analysis of 237Np in the sample included in data package?
Sample Analysis - 233Pa by Gamma PHA /// /// /// /// Were the samples counted using an appropriate geometry and nuclide library?
Is the detector dead-time for each reported sample count <10%?
Was the count time sufficient to achieve the requested MDA? Were sample spectra properly evaluated for proper peak fit, resolution, and interferences?
Sample Analysis - 231Pa by ICP-MS /// /// /// ///
Were all results corrected for resolution issues and/or interferences? Is the ICP-MS ITV checklist (SRNL-L4140-2012-00014) for 231Pa measurement in the separated sample aliquot included in data package?
Blanks /// /// /// /// Was an analyte-free matrix (AFM) blank and/or method blank analyzed at the required frequency? Note: An AFM blank is required if material is dissolved.
Was the blank result DL or <10% of the applicable result detected in associated samples?
Results and Detection Limits
Were results reported for the required sample analytes? Are analyte activities, associated uncertainties or DLs reported in appropriate units of activity and correctly rounded, consistent with customer’s request?
Was the dilution used appropriate to achieve the requested Detection Limit (DL) [if the analyte is not observed above DL]?
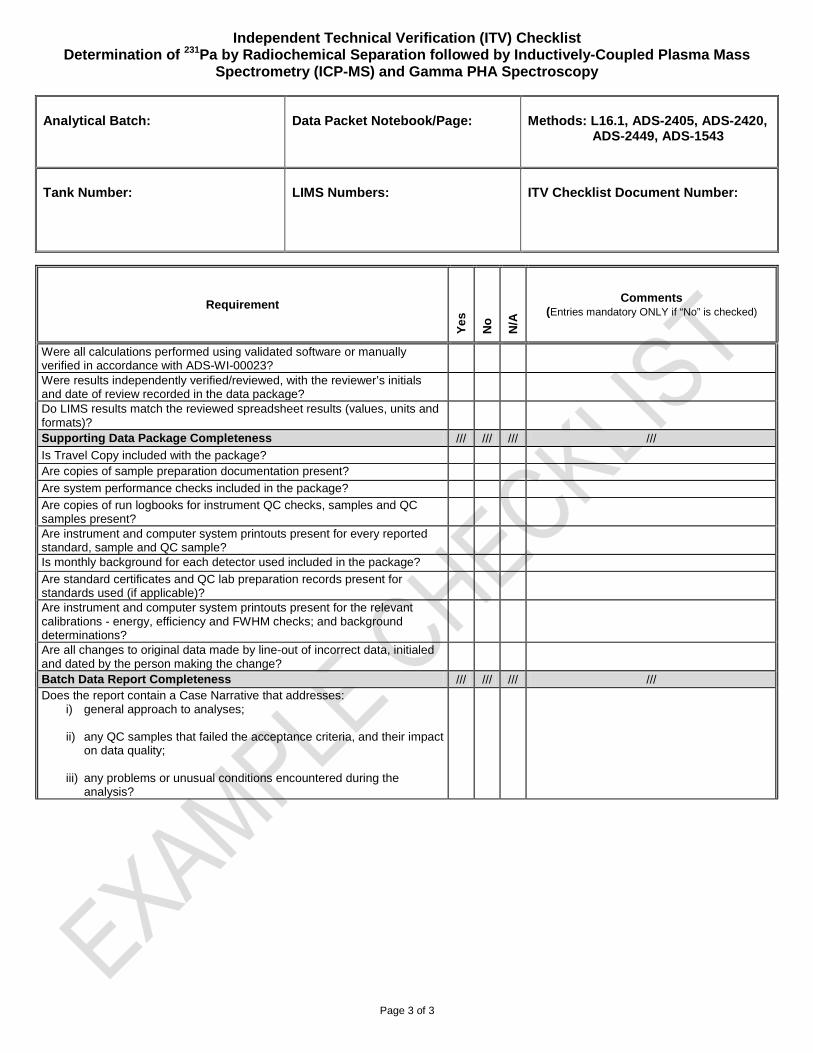
Independent Technical Verification (ITV) Checklist Determination of 231Pa by Radiochemical Separation followed by Inductively-Coupled Plasma Mass
Spectrometry (ICP-MS) and Gamma PHA Spectroscopy
Analytical Batch: Data Packet Notebook/Page: Methods: L16.1, ADS-2405, ADS-2420, ADS-2449, ADS-1543
Tank Number: LIMS Numbers: ITV Checklist Document Number:
Page 3 of 3
Requirement
Ye
s
No
N/A
Comments (Entries mandatory ONLY if “No” is checked)
Were all calculations performed using validated software or manually verified in accordance with ADS-WI-00023?
Were results independently verified/reviewed, with the reviewer’s initials and date of review recorded in the data package?
Do LIMS results match the reviewed spreadsheet results (values, units and formats)?
Supporting Data Package Completeness /// /// /// ///
Is Travel Copy included with the package? Are copies of sample preparation documentation present? Are system performance checks included in the package? Are copies of run logbooks for instrument QC checks, samples and QC samples present?
Are instrument and computer system printouts present for every reported standard, sample and QC sample?
Is monthly background for each detector used included in the package? Are standard certificates and QC lab preparation records present for standards used (if applicable)?
Are instrument and computer system printouts present for the relevant calibrations - energy, efficiency and FWHM checks; and background determinations?
Are all changes to original data made by line-out of incorrect data, initialed and dated by the person making the change?
Batch Data Report Completeness /// /// /// /// Does the report contain a Case Narrative that addresses:
i) general approach to analyses; ii) any QC samples that failed the acceptance criteria, and their impact
on data quality; iii) any problems or unusual conditions encountered during the
analysis?
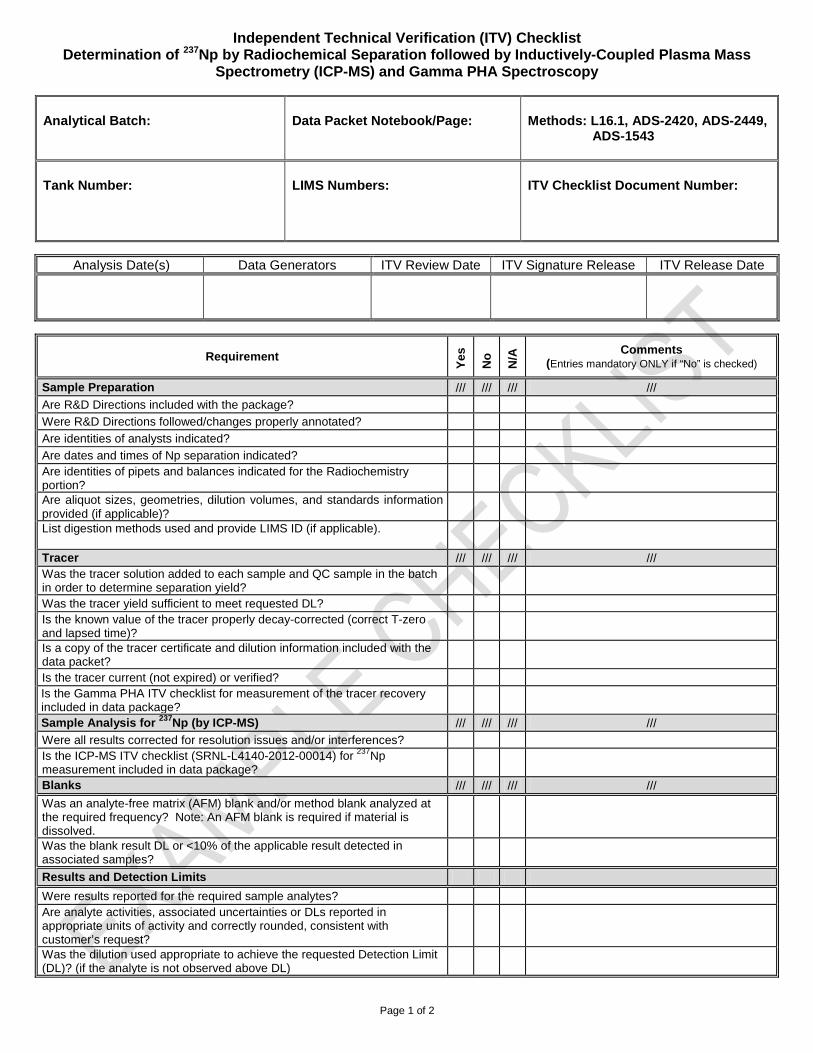
Independent Technical Verification (ITV) Checklist Determination of 237Np by Radiochemical Separation followed by Inductively-Coupled Plasma Mass
Spectrometry (ICP-MS) and Gamma PHA Spectroscopy
Analytical Batch: Data Packet Notebook/Page: Methods: L16.1, ADS-2420, ADS-2449, ADS-1543
Tank Number: LIMS Numbers: ITV Checklist Document Number:
Page 1 of 2
Analysis Date(s) Data Generators ITV Review Date ITV Signature Release ITV Release Date
Requirement
Ye
s
No
N/A
Comments (Entries mandatory ONLY if “No” is checked)
Sample Preparation /// /// /// ///
Are R&D Directions included with the package?
Were R&D Directions followed/changes properly annotated?
Are identities of analysts indicated?
Are dates and times of Np separation indicated? Are identities of pipets and balances indicated for the Radiochemistry portion?
Are aliquot sizes, geometries, dilution volumes, and standards information provided (if applicable)?
List digestion methods used and provide LIMS ID (if applicable).
Tracer /// /// /// /// Was the tracer solution added to each sample and QC sample in the batch in order to determine separation yield?
Was the tracer yield sufficient to meet requested DL? Is the known value of the tracer properly decay-corrected (correct T-zero and lapsed time)?
Is a copy of the tracer certificate and dilution information included with the data packet?
Is the tracer current (not expired) or verified? Is the Gamma PHA ITV checklist for measurement of the tracer recovery included in data package?
Sample Analysis for 237Np (by ICP-MS) /// /// /// ///
Were all results corrected for resolution issues and/or interferences? Is the ICP-MS ITV checklist (SRNL-L4140-2012-00014) for 237Np measurement included in data package?
Blanks /// /// /// ///
Was an analyte-free matrix (AFM) blank and/or method blank analyzed at the required frequency? Note: An AFM blank is required if material is dissolved.
Was the blank result DL or <10% of the applicable result detected in associated samples?
Results and Detection Limits
Were results reported for the required sample analytes? Are analyte activities, associated uncertainties or DLs reported in appropriate units of activity and correctly rounded, consistent with customer’s request?
Was the dilution used appropriate to achieve the requested Detection Limit (DL)? (if the analyte is not observed above DL)
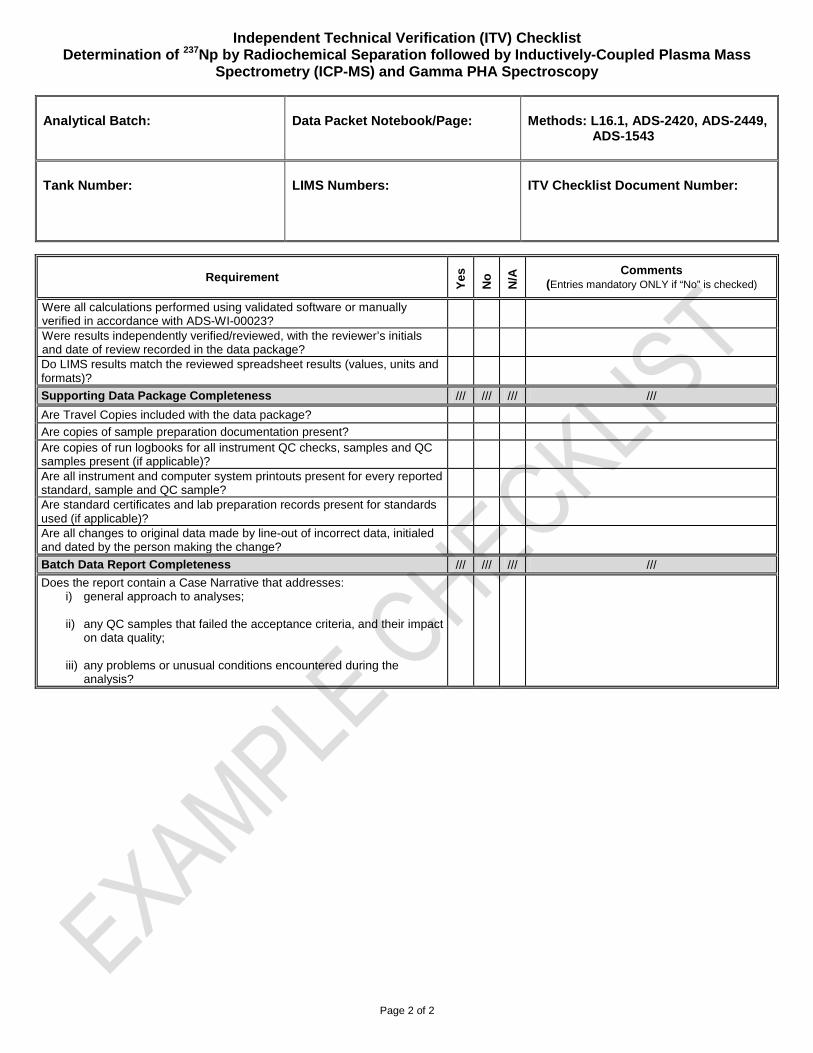
Independent Technical Verification (ITV) Checklist Determination of 237Np by Radiochemical Separation followed by Inductively-Coupled Plasma Mass
Spectrometry (ICP-MS) and Gamma PHA Spectroscopy
Analytical Batch: Data Packet Notebook/Page: Methods: L16.1, ADS-2420, ADS-2449, ADS-1543
Tank Number: LIMS Numbers: ITV Checklist Document Number:
Page 2 of 2
Requirement
Ye
s
No
N/A
Comments (Entries mandatory ONLY if “No” is checked)
Were all calculations performed using validated software or manually verified in accordance with ADS-WI-00023?
Were results independently verified/reviewed, with the reviewer’s initials and date of review recorded in the data package?
Do LIMS results match the reviewed spreadsheet results (values, units and formats)?
Supporting Data Package Completeness /// /// /// ///
Are Travel Copies included with the data package?
Are copies of sample preparation documentation present? Are copies of run logbooks for all instrument QC checks, samples and QC samples present (if applicable)?
Are all instrument and computer system printouts present for every reported standard, sample and QC sample?
Are standard certificates and lab preparation records present for standards used (if applicable)?
Are all changes to original data made by line-out of incorrect data, initialed and dated by the person making the change?
Batch Data Report Completeness /// /// /// ///
Does the report contain a Case Narrative that addresses: i) general approach to analyses; ii) any QC samples that failed the acceptance criteria, and their impact
on data quality; iii) any problems or unusual conditions encountered during the
analysis?
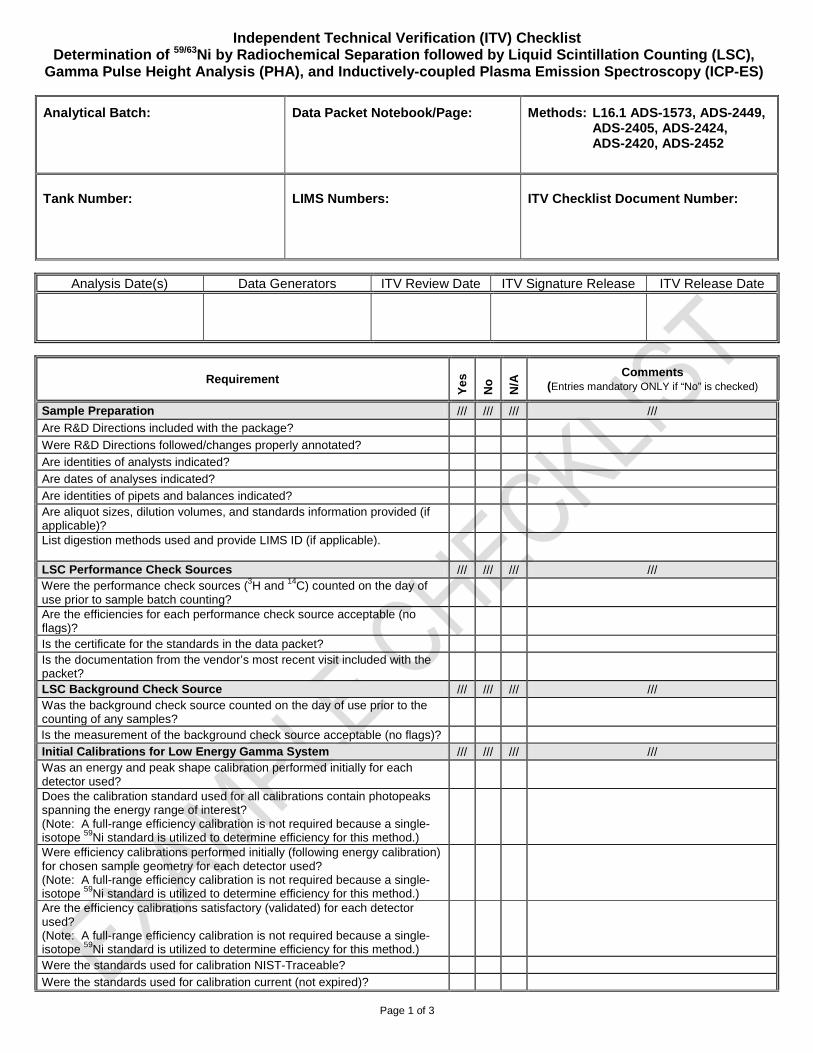
Independent Technical Verification (ITV) Checklist Determination of 59/63Ni by Radiochemical Separation followed by Liquid Scintillation Counting (LSC),
Gamma Pulse Height Analysis (PHA), and Inductively-coupled Plasma Emission Spectroscopy (ICP-ES)
Analytical Batch: Data Packet Notebook/Page: Methods: L16.1 ADS-1573, ADS-2449, ADS-2405, ADS-2424, ADS-2420, ADS-2452
Tank Number: LIMS Numbers: ITV Checklist Document Number:
Page 1 of 3
Analysis Date(s) Data Generators ITV Review Date ITV Signature Release ITV Release Date
Requirement
Ye
s
No
N/A
Comments (Entries mandatory ONLY if “No” is checked)
Sample Preparation /// /// /// ///
Are R&D Directions included with the package?
Were R&D Directions followed/changes properly annotated?
Are identities of analysts indicated?
Are dates of analyses indicated?
Are identities of pipets and balances indicated? Are aliquot sizes, dilution volumes, and standards information provided (if applicable)?
List digestion methods used and provide LIMS ID (if applicable).
LSC Performance Check Sources /// /// /// /// Were the performance check sources (3H and 14C) counted on the day of use prior to sample batch counting?
Are the efficiencies for each performance check source acceptable (no flags)?
Is the certificate for the standards in the data packet? Is the documentation from the vendor’s most recent visit included with the packet?
LSC Background Check Source /// /// /// /// Was the background check source counted on the day of use prior to the counting of any samples?
Is the measurement of the background check source acceptable (no flags)? Initial Calibrations for Low Energy Gamma System /// /// /// /// Was an energy and peak shape calibration performed initially for each detector used?
Does the calibration standard used for all calibrations contain photopeaks spanning the energy range of interest? (Note: A full-range efficiency calibration is not required because a single-isotope 59Ni standard is utilized to determine efficiency for this method.)
Were efficiency calibrations performed initially (following energy calibration) for chosen sample geometry for each detector used? (Note: A full-range efficiency calibration is not required because a single-isotope 59Ni standard is utilized to determine efficiency for this method.)
Are the efficiency calibrations satisfactory (validated) for each detector used? (Note: A full-range efficiency calibration is not required because a single-isotope 59Ni standard is utilized to determine efficiency for this method.)
Were the standards used for calibration NIST-Traceable?
Were the standards used for calibration current (not expired)?
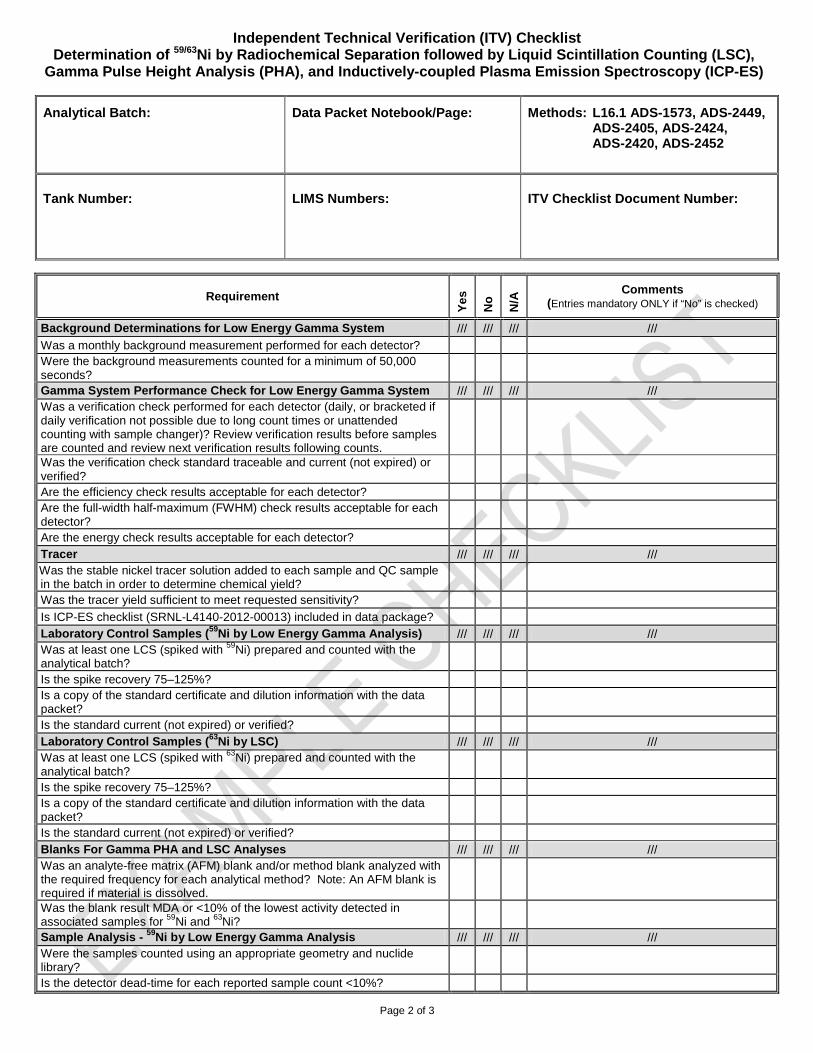
Independent Technical Verification (ITV) Checklist Determination of 59/63Ni by Radiochemical Separation followed by Liquid Scintillation Counting (LSC),
Gamma Pulse Height Analysis (PHA), and Inductively-coupled Plasma Emission Spectroscopy (ICP-ES)
Analytical Batch: Data Packet Notebook/Page: Methods: L16.1 ADS-1573, ADS-2449, ADS-2405, ADS-2424, ADS-2420, ADS-2452
Tank Number: LIMS Numbers: ITV Checklist Document Number:
Page 2 of 3
Requirement
Ye
s
No
N/A
Comments (Entries mandatory ONLY if “No” is checked)
Background Determinations for Low Energy Gamma System /// /// /// ///
Was a monthly background measurement performed for each detector? Were the background measurements counted for a minimum of 50,000 seconds?
Gamma System Performance Check for Low Energy Gamma System /// /// /// /// Was a verification check performed for each detector (daily, or bracketed if daily verification not possible due to long count times or unattended counting with sample changer)? Review verification results before samples are counted and review next verification results following counts.
Was the verification check standard traceable and current (not expired) or verified?
Are the efficiency check results acceptable for each detector? Are the full-width half-maximum (FWHM) check results acceptable for each detector?
Are the energy check results acceptable for each detector? Tracer /// /// /// /// Was the stable nickel tracer solution added to each sample and QC sample in the batch in order to determine chemical yield?
Was the tracer yield sufficient to meet requested sensitivity?
Is ICP-ES checklist (SRNL-L4140-2012-00013) included in data package? Laboratory Control Samples (59Ni by Low Energy Gamma Analysis) /// /// /// /// Was at least one LCS (spiked with 59Ni) prepared and counted with the analytical batch?
Is the spike recovery 75–125%? Is a copy of the standard certificate and dilution information with the data packet?
Is the standard current (not expired) or verified? Laboratory Control Samples (63Ni by LSC) /// /// /// /// Was at least one LCS (spiked with 63Ni) prepared and counted with the analytical batch?
Is the spike recovery 75–125%? Is a copy of the standard certificate and dilution information with the data packet?
Is the standard current (not expired) or verified? Blanks For Gamma PHA and LSC Analyses /// /// /// /// Was an analyte-free matrix (AFM) blank and/or method blank analyzed with the required frequency for each analytical method? Note: An AFM blank is required if material is dissolved.
Was the blank result MDA or <10% of the lowest activity detected in associated samples for 59Ni and 63Ni?
Sample Analysis - 59Ni by Low Energy Gamma Analysis /// /// /// /// Were the samples counted using an appropriate geometry and nuclide library?
Is the detector dead-time for each reported sample count <10%?
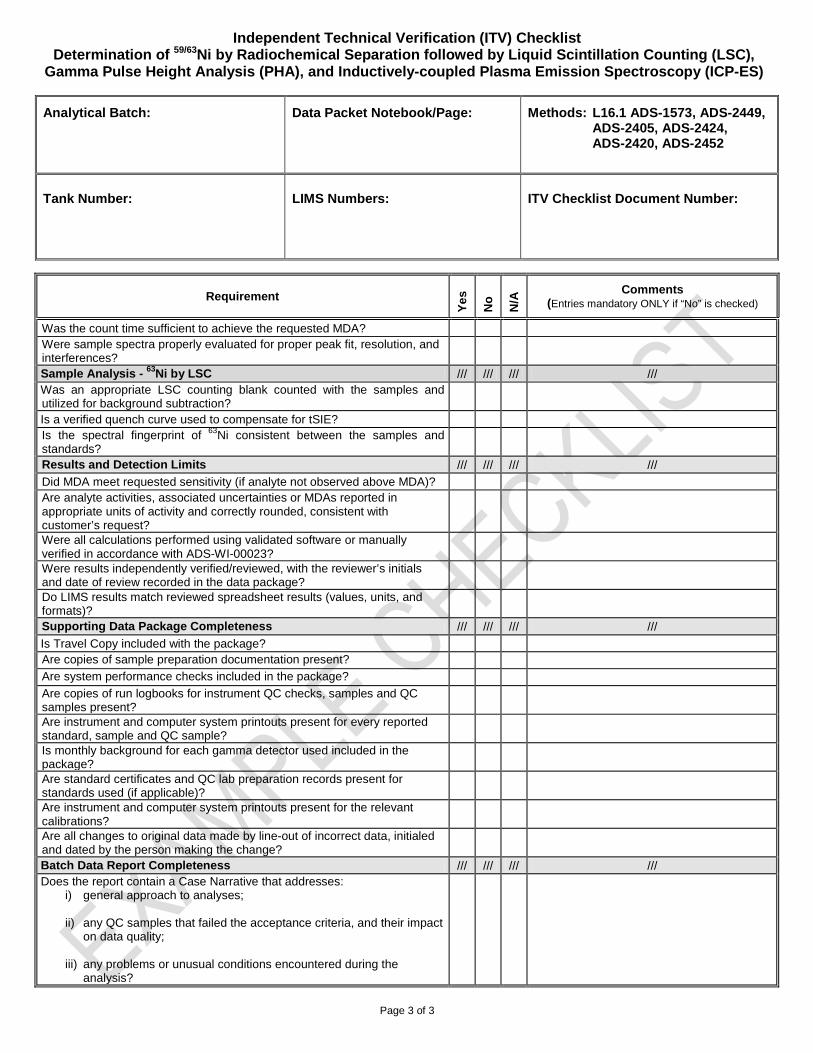
Independent Technical Verification (ITV) Checklist Determination of 59/63Ni by Radiochemical Separation followed by Liquid Scintillation Counting (LSC),
Gamma Pulse Height Analysis (PHA), and Inductively-coupled Plasma Emission Spectroscopy (ICP-ES)
Analytical Batch: Data Packet Notebook/Page: Methods: L16.1 ADS-1573, ADS-2449, ADS-2405, ADS-2424, ADS-2420, ADS-2452
Tank Number: LIMS Numbers: ITV Checklist Document Number:
Page 3 of 3
Requirement
Ye
s
No
N/A
Comments (Entries mandatory ONLY if “No” is checked)
Was the count time sufficient to achieve the requested MDA? Were sample spectra properly evaluated for proper peak fit, resolution, and interferences?
Sample Analysis - 63Ni by LSC /// /// /// /// Was an appropriate LSC counting blank counted with the samples and utilized for background subtraction?
Is a verified quench curve used to compensate for tSIE? Is the spectral fingerprint of 63Ni consistent between the samples and standards?
Results and Detection Limits /// /// /// ///
Did MDA meet requested sensitivity (if analyte not observed above MDA)? Are analyte activities, associated uncertainties or MDAs reported in appropriate units of activity and correctly rounded, consistent with customer’s request?
Were all calculations performed using validated software or manually verified in accordance with ADS-WI-00023?
Were results independently verified/reviewed, with the reviewer’s initials and date of review recorded in the data package?
Do LIMS results match reviewed spreadsheet results (values, units, and formats)?
Supporting Data Package Completeness /// /// /// ///
Is Travel Copy included with the package? Are copies of sample preparation documentation present? Are system performance checks included in the package? Are copies of run logbooks for instrument QC checks, samples and QC samples present?
Are instrument and computer system printouts present for every reported standard, sample and QC sample?
Is monthly background for each gamma detector used included in the package?
Are standard certificates and QC lab preparation records present for standards used (if applicable)?
Are instrument and computer system printouts present for the relevant calibrations?
Are all changes to original data made by line-out of incorrect data, initialed and dated by the person making the change?
Batch Data Report Completeness /// /// /// /// Does the report contain a Case Narrative that addresses:
i) general approach to analyses; ii) any QC samples that failed the acceptance criteria, and their impact
on data quality; iii) any problems or unusual conditions encountered during the
analysis?
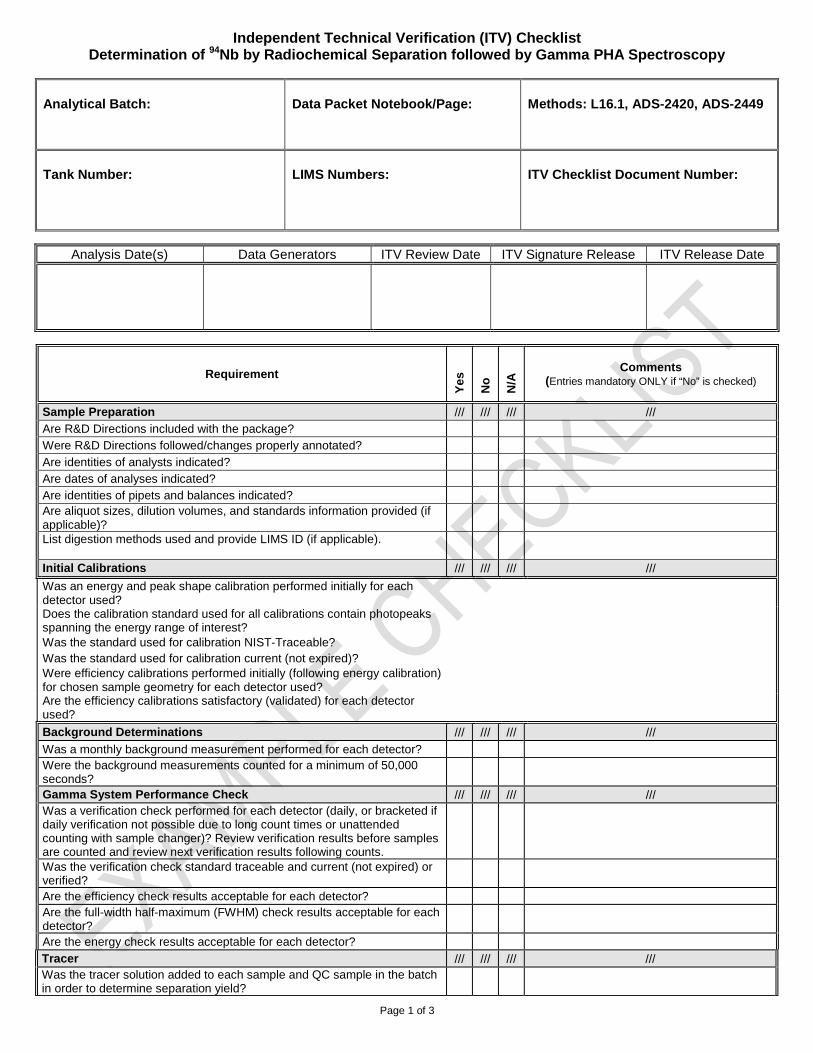
Independent Technical Verification (ITV) Checklist Determination of 94Nb by Radiochemical Separation followed by Gamma PHA Spectroscopy
Analytical Batch: Data Packet Notebook/Page: Methods: L16.1, ADS-2420, ADS-2449
Tank Number: LIMS Numbers: ITV Checklist Document Number:
Page 1 of 3
Analysis Date(s) Data Generators ITV Review Date ITV Signature Release ITV Release Date
Requirement
Ye
s
No
N/A
Comments (Entries mandatory ONLY if “No” is checked)
Sample Preparation /// /// /// /// Are R&D Directions included with the package? Were R&D Directions followed/changes properly annotated?
Are identities of analysts indicated? Are dates of analyses indicated? Are identities of pipets and balances indicated? Are aliquot sizes, dilution volumes, and standards information provided (if applicable)?
List digestion methods used and provide LIMS ID (if applicable).
Initial Calibrations /// /// /// ///
Was an energy and peak shape calibration performed initially for each detector used?
Does the calibration standard used for all calibrations contain photopeaks spanning the energy range of interest?
Was the standard used for calibration NIST-Traceable? Was the standard used for calibration current (not expired)? Were efficiency calibrations performed initially (following energy calibration) for chosen sample geometry for each detector used?
Are the efficiency calibrations satisfactory (validated) for each detector used?
Background Determinations /// /// /// ///
Was a monthly background measurement performed for each detector? Were the background measurements counted for a minimum of 50,000 seconds?
Gamma System Performance Check /// /// /// /// Was a verification check performed for each detector (daily, or bracketed if daily verification not possible due to long count times or unattended counting with sample changer)? Review verification results before samples are counted and review next verification results following counts.
Was the verification check standard traceable and current (not expired) or verified?
Are the efficiency check results acceptable for each detector? Are the full-width half-maximum (FWHM) check results acceptable for each detector?
Are the energy check results acceptable for each detector?
Tracer /// /// /// /// Was the tracer solution added to each sample and QC sample in the batch in order to determine separation yield?
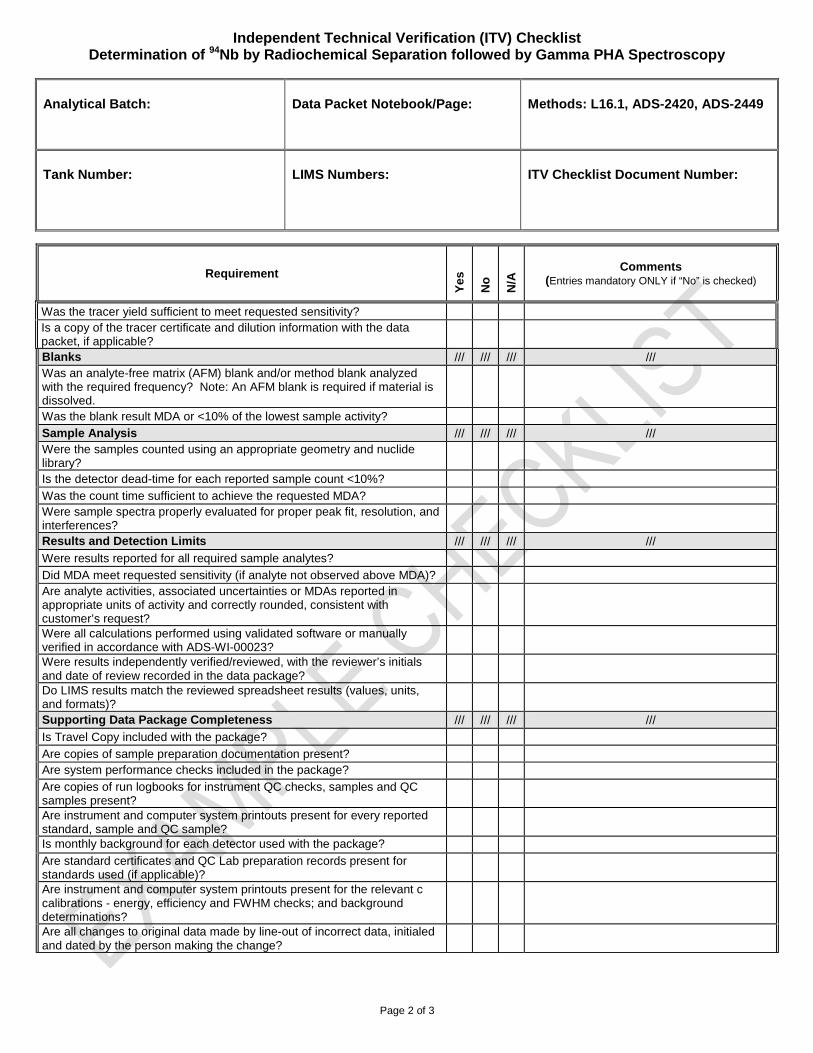
Independent Technical Verification (ITV) Checklist Determination of 94Nb by Radiochemical Separation followed by Gamma PHA Spectroscopy
Analytical Batch: Data Packet Notebook/Page: Methods: L16.1, ADS-2420, ADS-2449
Tank Number: LIMS Numbers: ITV Checklist Document Number:
Page 2 of 3
Requirement
Ye
s
No
N/A
Comments (Entries mandatory ONLY if “No” is checked)
Was the tracer yield sufficient to meet requested sensitivity? Is a copy of the tracer certificate and dilution information with the data packet, if applicable?
Blanks /// /// /// /// Was an analyte-free matrix (AFM) blank and/or method blank analyzed with the required frequency? Note: An AFM blank is required if material is dissolved.
Was the blank result MDA or <10% of the lowest sample activity?
Sample Analysis /// /// /// /// Were the samples counted using an appropriate geometry and nuclide library?
Is the detector dead-time for each reported sample count <10%?
Was the count time sufficient to achieve the requested MDA? Were sample spectra properly evaluated for proper peak fit, resolution, and interferences?
Results and Detection Limits /// /// /// ///
Were results reported for all required sample analytes?
Did MDA meet requested sensitivity (if analyte not observed above MDA)? Are analyte activities, associated uncertainties or MDAs reported in appropriate units of activity and correctly rounded, consistent with customer’s request?
Were all calculations performed using validated software or manually verified in accordance with ADS-WI-00023?
Were results independently verified/reviewed, with the reviewer’s initials and date of review recorded in the data package?
Do LIMS results match the reviewed spreadsheet results (values, units, and formats)?
Supporting Data Package Completeness /// /// /// ///
Is Travel Copy included with the package?
Are copies of sample preparation documentation present? Are system performance checks included in the package? Are copies of run logbooks for instrument QC checks, samples and QC samples present?
Are instrument and computer system printouts present for every reported standard, sample and QC sample?
Is monthly background for each detector used with the package? Are standard certificates and QC Lab preparation records present for standards used (if applicable)?
Are instrument and computer system printouts present for the relevant c calibrations - energy, efficiency and FWHM checks; and background determinations?
Are all changes to original data made by line-out of incorrect data, initialed and dated by the person making the change?
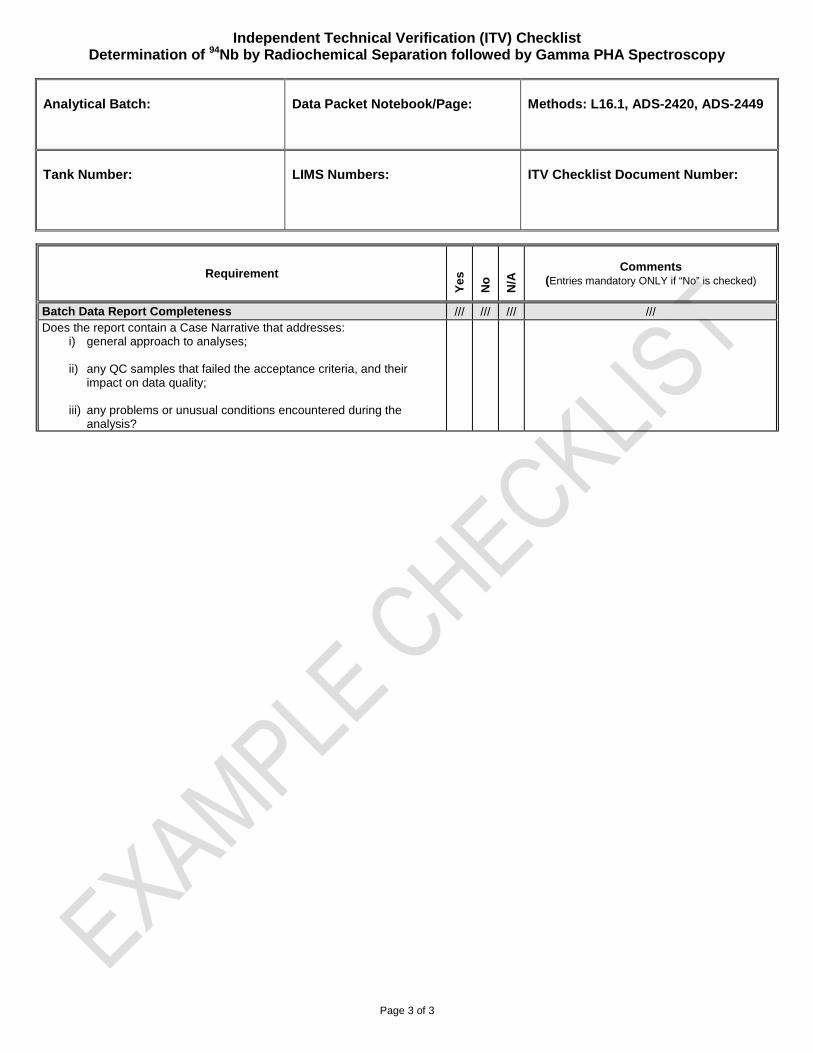
Independent Technical Verification (ITV) Checklist Determination of 94Nb by Radiochemical Separation followed by Gamma PHA Spectroscopy
Analytical Batch: Data Packet Notebook/Page: Methods: L16.1, ADS-2420, ADS-2449
Tank Number: LIMS Numbers: ITV Checklist Document Number:
Page 3 of 3
Requirement
Ye
s
No
N/A
Comments (Entries mandatory ONLY if “No” is checked)
Batch Data Report Completeness /// /// /// /// Does the report contain a Case Narrative that addresses:
i) general approach to analyses; ii) any QC samples that failed the acceptance criteria, and their
impact on data quality; iii) any problems or unusual conditions encountered during the
analysis?
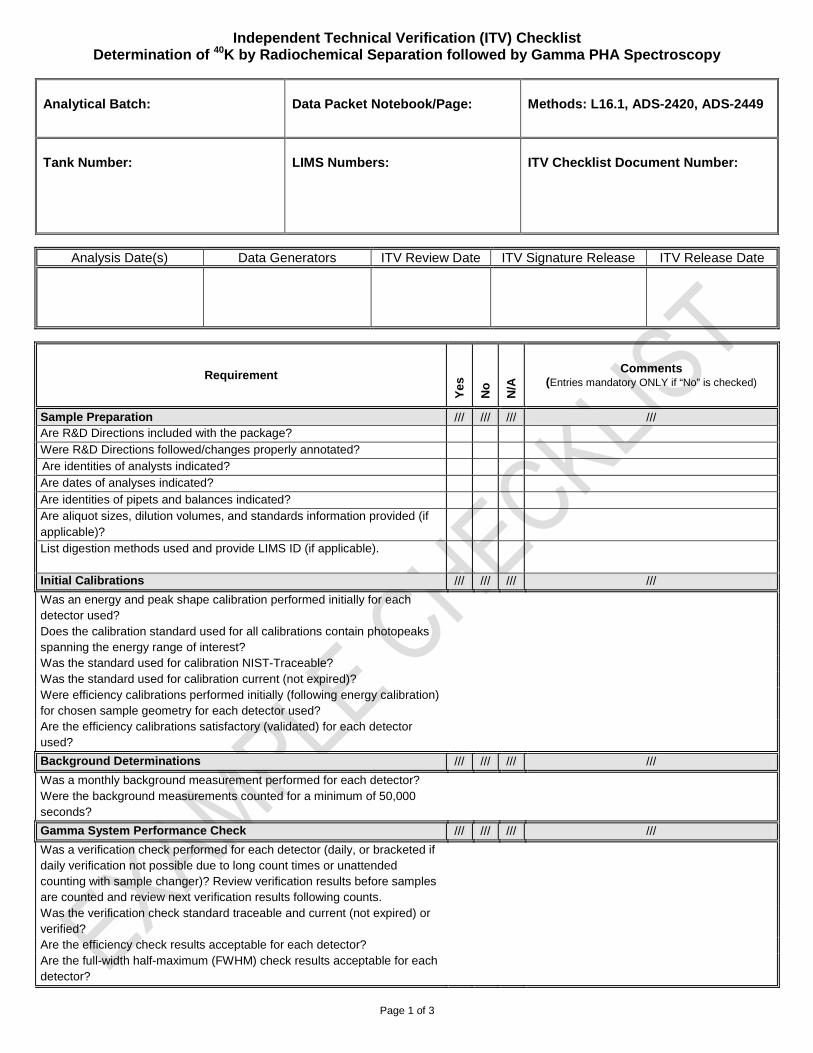
Independent Technical Verification (ITV) Checklist Determination of 40K by Radiochemical Separation followed by Gamma PHA Spectroscopy
Analytical Batch: Data Packet Notebook/Page: Methods: L16.1, ADS-2420, ADS-2449
Tank Number: LIMS Numbers: ITV Checklist Document Number:
Page 1 of 3
Analysis Date(s) Data Generators ITV Review Date ITV Signature Release ITV Release Date
Requirement
Ye
s
No
N/A
Comments (Entries mandatory ONLY if “No” is checked)
Sample Preparation /// /// /// /// Are R&D Directions included with the package? Were R&D Directions followed/changes properly annotated? Are identities of analysts indicated? Are dates of analyses indicated?
Are identities of pipets and balances indicated? Are aliquot sizes, dilution volumes, and standards information provided (if applicable)?
List digestion methods used and provide LIMS ID (if applicable).
Initial Calibrations /// /// /// ///
Was an energy and peak shape calibration performed initially for each detector used?
Does the calibration standard used for all calibrations contain photopeaks spanning the energy range of interest?
Was the standard used for calibration NIST-Traceable? Was the standard used for calibration current (not expired)? Were efficiency calibrations performed initially (following energy calibration) for chosen sample geometry for each detector used?
Are the efficiency calibrations satisfactory (validated) for each detector used?
Background Determinations /// /// /// ///
Was a monthly background measurement performed for each detector? Were the background measurements counted for a minimum of 50,000 seconds?
Gamma System Performance Check /// /// /// ///
Was a verification check performed for each detector (daily, or bracketed if daily verification not possible due to long count times or unattended counting with sample changer)? Review verification results before samples are counted and review next verification results following counts.
Was the verification check standard traceable and current (not expired) or verified?
Are the efficiency check results acceptable for each detector? Are the full-width half-maximum (FWHM) check results acceptable for each detector?
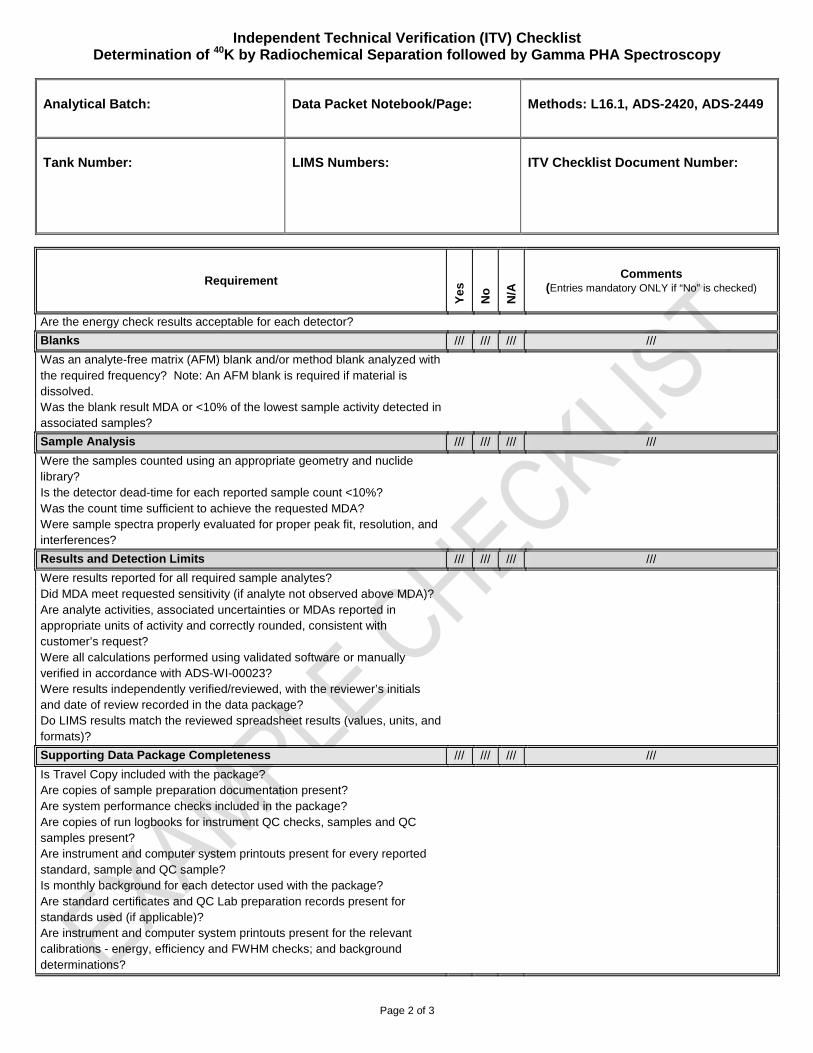
Independent Technical Verification (ITV) Checklist Determination of 40K by Radiochemical Separation followed by Gamma PHA Spectroscopy
Analytical Batch: Data Packet Notebook/Page: Methods: L16.1, ADS-2420, ADS-2449
Tank Number: LIMS Numbers: ITV Checklist Document Number:
Page 2 of 3
Requirement
Ye
s
No
N/A
Comments (Entries mandatory ONLY if “No” is checked)
Are the energy check results acceptable for each detector?
Blanks /// /// /// ///
Was an analyte-free matrix (AFM) blank and/or method blank analyzed with the required frequency? Note: An AFM blank is required if material is dissolved.
Was the blank result MDA or <10% of the lowest sample activity detected in associated samples?
Sample Analysis /// /// /// ///
Were the samples counted using an appropriate geometry and nuclide library?
Is the detector dead-time for each reported sample count <10%? Was the count time sufficient to achieve the requested MDA? Were sample spectra properly evaluated for proper peak fit, resolution, and interferences?
Results and Detection Limits /// /// /// ///
Were results reported for all required sample analytes? Did MDA meet requested sensitivity (if analyte not observed above MDA)? Are analyte activities, associated uncertainties or MDAs reported in appropriate units of activity and correctly rounded, consistent with customer’s request?
Were all calculations performed using validated software or manually verified in accordance with ADS-WI-00023?
Were results independently verified/reviewed, with the reviewer’s initials and date of review recorded in the data package?
Do LIMS results match the reviewed spreadsheet results (values, units, and formats)?
Supporting Data Package Completeness /// /// /// ///
Is Travel Copy included with the package? Are copies of sample preparation documentation present? Are system performance checks included in the package? Are copies of run logbooks for instrument QC checks, samples and QC samples present?
Are instrument and computer system printouts present for every reported standard, sample and QC sample?
Is monthly background for each detector used with the package? Are standard certificates and QC Lab preparation records present for standards used (if applicable)?
Are instrument and computer system printouts present for the relevant calibrations - energy, efficiency and FWHM checks; and background determinations?
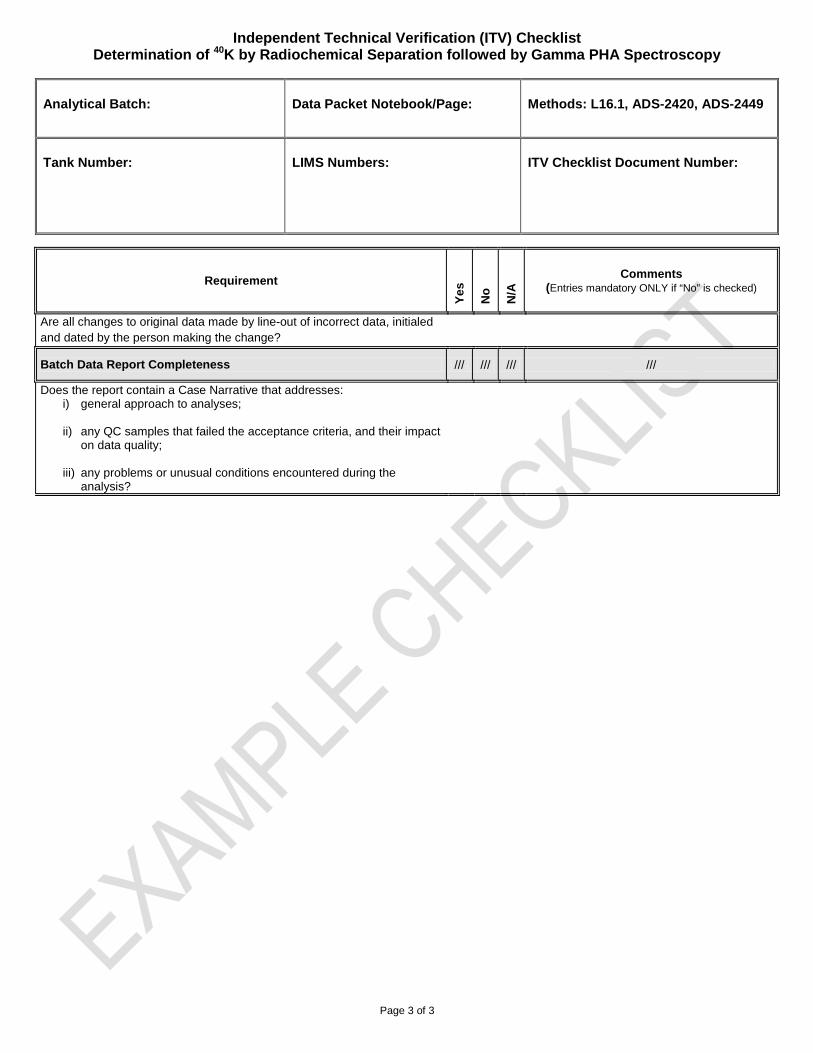
Independent Technical Verification (ITV) Checklist Determination of 40K by Radiochemical Separation followed by Gamma PHA Spectroscopy
Analytical Batch: Data Packet Notebook/Page: Methods: L16.1, ADS-2420, ADS-2449
Tank Number: LIMS Numbers: ITV Checklist Document Number:
Page 3 of 3
Requirement
Ye
s
No
N/A
Comments (Entries mandatory ONLY if “No” is checked)
Are all changes to original data made by line-out of incorrect data, initialed and dated by the person making the change?
Batch Data Report Completeness /// /// /// ///
Does the report contain a Case Narrative that addresses: i) general approach to analyses; ii) any QC samples that failed the acceptance criteria, and their impact
on data quality; iii) any problems or unusual conditions encountered during the
analysis?
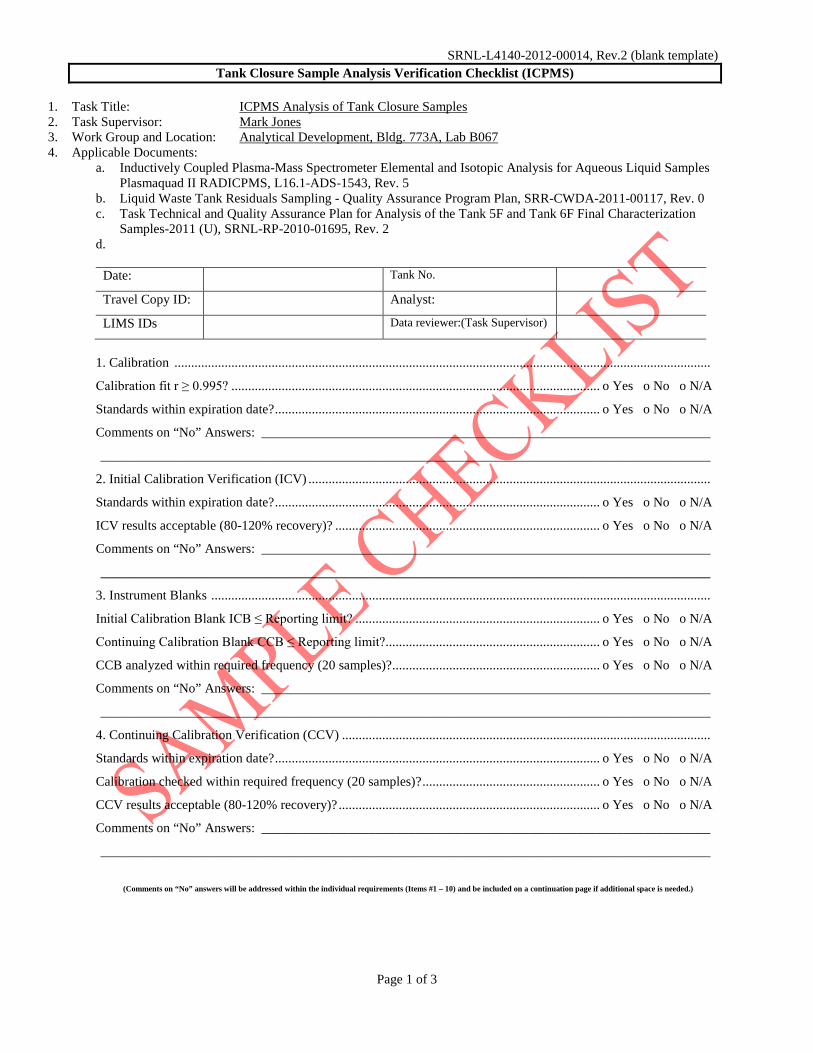
SRNL-L4140-2012-00014, Rev.2 (blank template) Tank Closure Sample Analysis Verification Checklist (ICPMS)
Page 1 of 3
1. Task Title: ICPMS Analysis of Tank Closure Samples 2. Task Supervisor: Mark Jones 3. Work Group and Location: Analytical Development, Bldg. 773A, Lab B067 4. Applicable Documents:
a. Inductively Coupled Plasma-Mass Spectrometer Elemental and Isotopic Analysis for Aqueous Liquid Samples Plasmaquad II RADICPMS, L16.1-ADS-1543, Rev. 5
b. Liquid Waste Tank Residuals Sampling - Quality Assurance Program Plan, SRR-CWDA-2011-00117, Rev. 0 c. Task Technical and Quality Assurance Plan for Analysis of the Tank 5F and Tank 6F Final Characterization
Samples-2011 (U), SRNL-RP-2010-01695, Rev. 2 d.
Date: Tank No.
Travel Copy ID: Analyst:
LIMS IDs Data reviewer:(Task Supervisor)
1. Calibration ................................................................................................................................................................
Calibration fit r ≥ 0.995? .............................................................................................................. o Yes o No o N/A
Standards within expiration date? ................................................................................................. o Yes o No o N/A
Comments on “No” Answers: ___________________________________________________________________
___________________________________________________________________________________________
2. Initial Calibration Verification (ICV) ........................................................................................................................
Standards within expiration date? ................................................................................................. o Yes o No o N/A
ICV results acceptable (80-120% recovery)? ............................................................................... o Yes o No o N/A
Comments on “No” Answers: ___________________________________________________________________
___________________________________________________________________________________________
3. Instrument Blanks .....................................................................................................................................................
Initial Calibration Blank ICB ≤ Reporting limit? ......................................................................... o Yes o No o N/A
Continuing Calibration Blank CCB ≤ Reporting limit?................................................................ o Yes o No o N/A
CCB analyzed within required frequency (20 samples)? .............................................................. o Yes o No o N/A
Comments on “No” Answers: ___________________________________________________________________
___________________________________________________________________________________________
4. Continuing Calibration Verification (CCV) ..............................................................................................................
Standards within expiration date? ................................................................................................. o Yes o No o N/A
Calibration checked within required frequency (20 samples)? ..................................................... o Yes o No o N/A
CCV results acceptable (80-120% recovery)? .............................................................................. o Yes o No o N/A
Comments on “No” Answers: ___________________________________________________________________
___________________________________________________________________________________________
(Comments on “No” answers will be addressed within the individual requirements (Items #1 – 10) and be included on a continuation page if additional space is needed.)
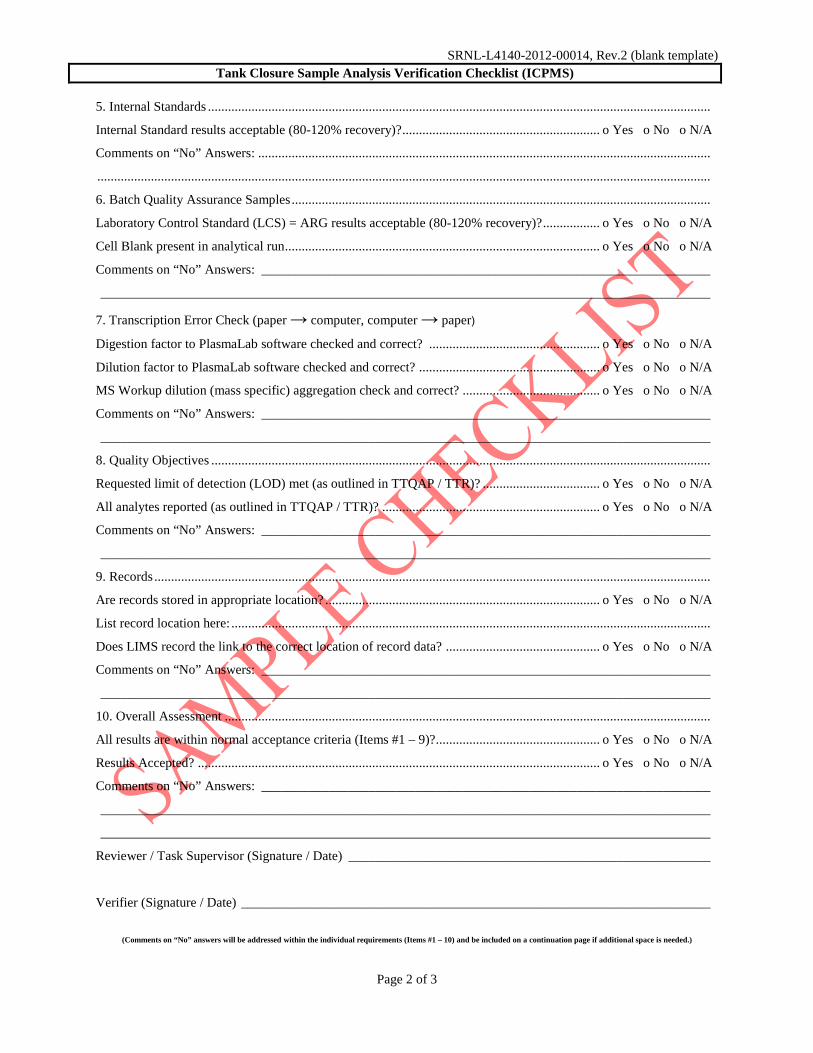
SRNL-L4140-2012-00014, Rev.2 (blank template) Tank Closure Sample Analysis Verification Checklist (ICPMS)
Page 2 of 3
5. Internal Standards ......................................................................................................................................................
Internal Standard results acceptable (80-120% recovery)? ........................................................... o Yes o No o N/A
Comments on “No” Answers: .......................................................................................................................................
.......................................................................................................................................................................................
6. Batch Quality Assurance Samples .............................................................................................................................
Laboratory Control Standard (LCS) = ARG results acceptable (80-120% recovery)? ................. o Yes o No o N/A
Cell Blank present in analytical run .............................................................................................. o Yes o No o N/A
Comments on “No” Answers: ___________________________________________________________________
___________________________________________________________________________________________
7. Transcription Error Check (paper → computer, computer → paper)
Digestion factor to PlasmaLab software checked and correct? ................................................... o Yes o No o N/A
Dilution factor to PlasmaLab software checked and correct? ...................................................... o Yes o No o N/A
MS Workup dilution (mass specific) aggregation check and correct? ......................................... o Yes o No o N/A
Comments on “No” Answers: ___________________________________________________________________
___________________________________________________________________________________________
8. Quality Objectives .....................................................................................................................................................
Requested limit of detection (LOD) met (as outlined in TTQAP / TTR)? ................................... o Yes o No o N/A
All analytes reported (as outlined in TTQAP / TTR)? ................................................................. o Yes o No o N/A
Comments on “No” Answers: ___________________________________________________________________
___________________________________________________________________________________________
9. Records ......................................................................................................................................................................
Are records stored in appropriate location? .................................................................................. o Yes o No o N/A
List record location here: ...............................................................................................................................................
Does LIMS record the link to the correct location of record data? .............................................. o Yes o No o N/A
Comments on “No” Answers: ___________________________________________________________________
___________________________________________________________________________________________
10. Overall Assessment .................................................................................................................................................
All results are within normal acceptance criteria (Items #1 – 9)? ................................................. o Yes o No o N/A
Results Accepted? ........................................................................................................................ o Yes o No o N/A
Comments on “No” Answers: ___________________________________________________________________
___________________________________________________________________________________________
___________________________________________________________________________________________
Reviewer / Task Supervisor (Signature / Date) ______________________________________________________
Verifier (Signature / Date) ______________________________________________________________________
(Comments on “No” answers will be addressed within the individual requirements (Items #1 – 10) and be included on a continuation page if additional space is needed.)
SRNL-L4140-2012-00014, Rev.2 (blank template) Tank Closure Sample Analysis Verification Checklist (ICPMS)
Page 3 of 3
Continuation Page:
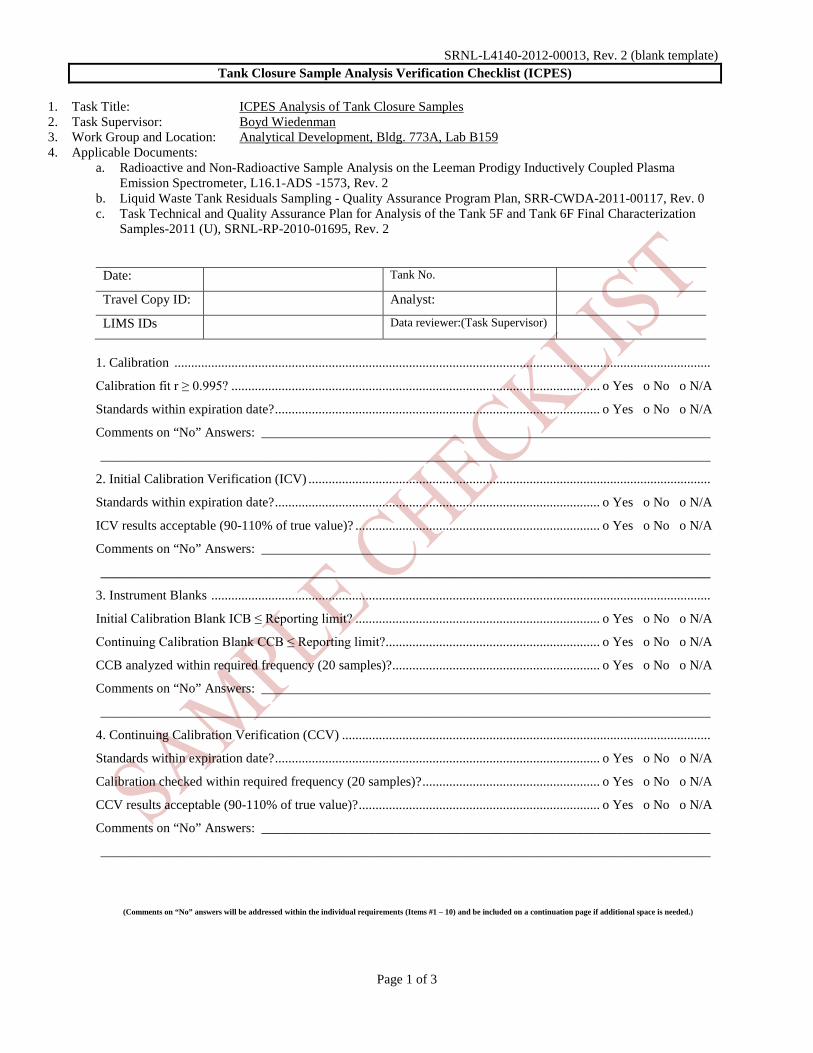
SRNL-L4140-2012-00013, Rev. 2 (blank template) Tank Closure Sample Analysis Verification Checklist (ICPES)
Page 1 of 3
1. Task Title: ICPES Analysis of Tank Closure Samples 2. Task Supervisor: Boyd Wiedenman 3. Work Group and Location: Analytical Development, Bldg. 773A, Lab B159 4. Applicable Documents:
a. Radioactive and Non-Radioactive Sample Analysis on the Leeman Prodigy Inductively Coupled Plasma Emission Spectrometer, L16.1-ADS -1573, Rev. 2
b. Liquid Waste Tank Residuals Sampling - Quality Assurance Program Plan, SRR-CWDA-2011-00117, Rev. 0 c. Task Technical and Quality Assurance Plan for Analysis of the Tank 5F and Tank 6F Final Characterization
Samples-2011 (U), SRNL-RP-2010-01695, Rev. 2
Date: Tank No.
Travel Copy ID: Analyst:
LIMS IDs Data reviewer:(Task Supervisor)
1. Calibration ................................................................................................................................................................
Calibration fit r ≥ 0.995? .............................................................................................................. o Yes o No o N/A
Standards within expiration date? ................................................................................................. o Yes o No o N/A
Comments on “No” Answers: ___________________________________________________________________
___________________________________________________________________________________________
2. Initial Calibration Verification (ICV) ........................................................................................................................
Standards within expiration date? ................................................................................................. o Yes o No o N/A
ICV results acceptable (90-110% of true value)? ......................................................................... o Yes o No o N/A
Comments on “No” Answers: ___________________________________________________________________
___________________________________________________________________________________________
3. Instrument Blanks .....................................................................................................................................................
Initial Calibration Blank ICB ≤ Reporting limit? ......................................................................... o Yes o No o N/A
Continuing Calibration Blank CCB ≤ Reporting limit?................................................................ o Yes o No o N/A
CCB analyzed within required frequency (20 samples)? .............................................................. o Yes o No o N/A
Comments on “No” Answers: ___________________________________________________________________
___________________________________________________________________________________________
4. Continuing Calibration Verification (CCV) ..............................................................................................................
Standards within expiration date? ................................................................................................. o Yes o No o N/A
Calibration checked within required frequency (20 samples)? ..................................................... o Yes o No o N/A
CCV results acceptable (90-110% of true value)? ........................................................................ o Yes o No o N/A
Comments on “No” Answers: ___________________________________________________________________
___________________________________________________________________________________________
(Comments on “No” answers will be addressed within the individual requirements (Items #1 – 10) and be included on a continuation page if additional space is needed.)
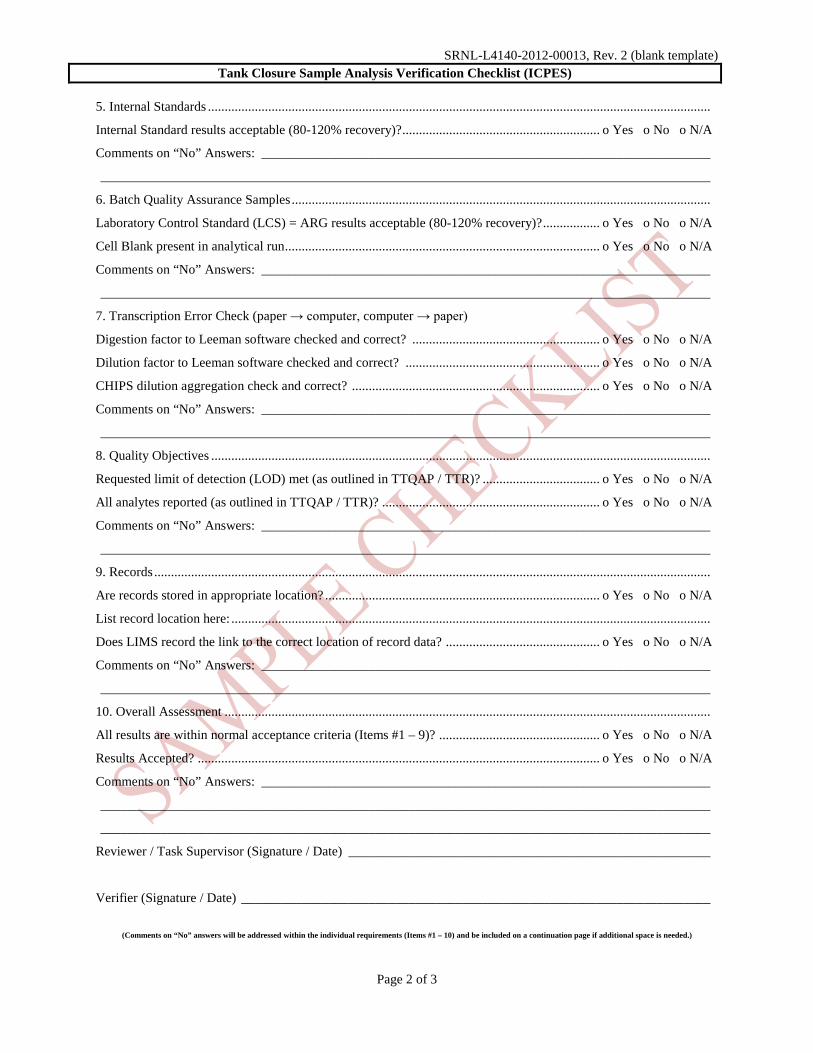
SRNL-L4140-2012-00013, Rev. 2 (blank template) Tank Closure Sample Analysis Verification Checklist (ICPES)
Page 2 of 3
5. Internal Standards ......................................................................................................................................................
Internal Standard results acceptable (80-120% recovery)? ........................................................... o Yes o No o N/A
Comments on “No” Answers: ___________________________________________________________________
___________________________________________________________________________________________
6. Batch Quality Assurance Samples .............................................................................................................................
Laboratory Control Standard (LCS) = ARG results acceptable (80-120% recovery)? ................. o Yes o No o N/A
Cell Blank present in analytical run .............................................................................................. o Yes o No o N/A
Comments on “No” Answers: ___________________________________________________________________
___________________________________________________________________________________________
7. Transcription Error Check (paper → computer, computer → paper)
Digestion factor to Leeman software checked and correct? ........................................................ o Yes o No o N/A
Dilution factor to Leeman software checked and correct? .......................................................... o Yes o No o N/A
CHIPS dilution aggregation check and correct? .......................................................................... o Yes o No o N/A
Comments on “No” Answers: ___________________________________________________________________
___________________________________________________________________________________________
8. Quality Objectives .....................................................................................................................................................
Requested limit of detection (LOD) met (as outlined in TTQAP / TTR)? ................................... o Yes o No o N/A
All analytes reported (as outlined in TTQAP / TTR)? ................................................................. o Yes o No o N/A
Comments on “No” Answers: ___________________________________________________________________
___________________________________________________________________________________________
9. Records ......................................................................................................................................................................
Are records stored in appropriate location? .................................................................................. o Yes o No o N/A
List record location here: ...............................................................................................................................................
Does LIMS record the link to the correct location of record data? .............................................. o Yes o No o N/A
Comments on “No” Answers: ___________________________________________________________________
___________________________________________________________________________________________
10. Overall Assessment .................................................................................................................................................
All results are within normal acceptance criteria (Items #1 – 9)? ................................................ o Yes o No o N/A
Results Accepted? ........................................................................................................................ o Yes o No o N/A
Comments on “No” Answers: ___________________________________________________________________
___________________________________________________________________________________________
___________________________________________________________________________________________
Reviewer / Task Supervisor (Signature / Date) ______________________________________________________
Verifier (Signature / Date) ______________________________________________________________________
(Comments on “No” answers will be addressed within the individual requirements (Items #1 – 10) and be included on a continuation page if additional space is needed.)
SRNL-L4140-2012-00013, Rev. 2 (blank template) Tank Closure Sample Analysis Verification Checklist (ICPES)
Page 3 of 3
Continuation Page:
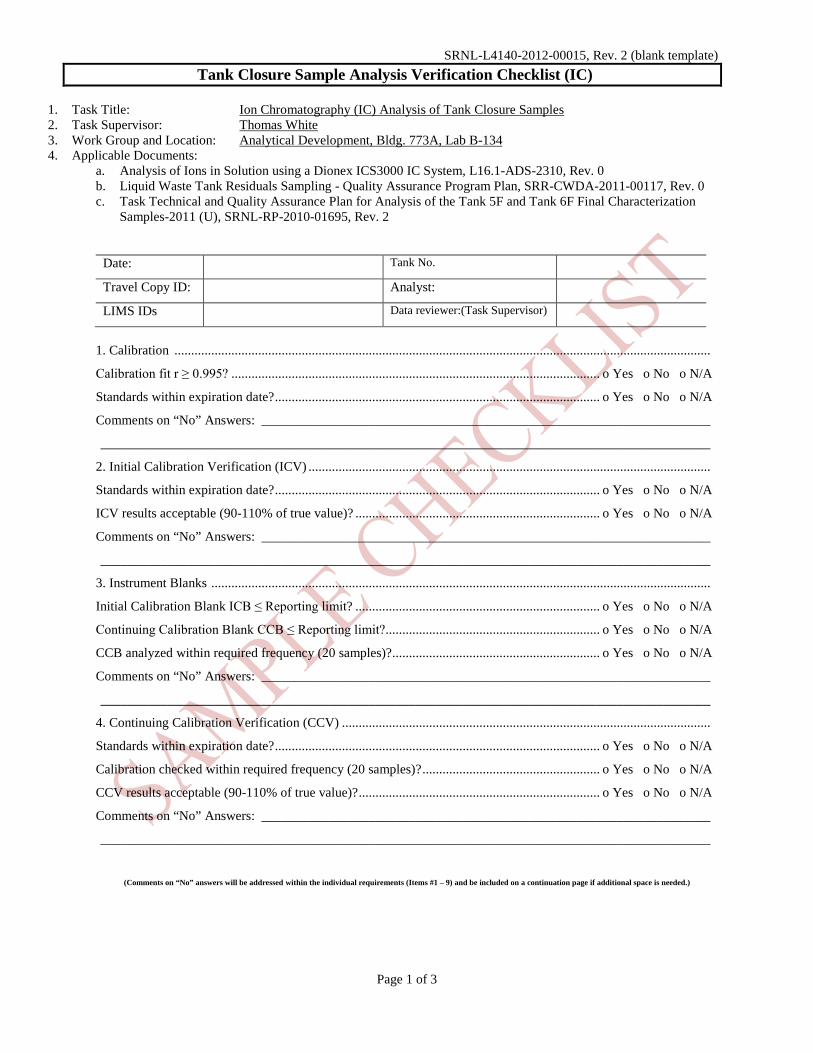
SRNL-L4140-2012-00015, Rev. 2 (blank template)
Tank Closure Sample Analysis Verification Checklist (IC)
Page 1 of 3
1. Task Title: Ion Chromatography (IC) Analysis of Tank Closure Samples 2. Task Supervisor: Thomas White 3. Work Group and Location: Analytical Development, Bldg. 773A, Lab B-134 4. Applicable Documents:
a. Analysis of Ions in Solution using a Dionex ICS3000 IC System, L16.1-ADS-2310, Rev. 0 b. Liquid Waste Tank Residuals Sampling - Quality Assurance Program Plan, SRR-CWDA-2011-00117, Rev. 0 c. Task Technical and Quality Assurance Plan for Analysis of the Tank 5F and Tank 6F Final Characterization
Samples-2011 (U), SRNL-RP-2010-01695, Rev. 2
Date: Tank No.
Travel Copy ID: Analyst:
LIMS IDs Data reviewer:(Task Supervisor)
1. Calibration ................................................................................................................................................................
Calibration fit r ≥ 0.995? .............................................................................................................. o Yes o No o N/A
Standards within expiration date? ................................................................................................. o Yes o No o N/A
Comments on “No” Answers: ___________________________________________________________________
___________________________________________________________________________________________
2. Initial Calibration Verification (ICV) ........................................................................................................................
Standards within expiration date? ................................................................................................. o Yes o No o N/A
ICV results acceptable (90-110% of true value)? ......................................................................... o Yes o No o N/A
Comments on “No” Answers: ___________________________________________________________________
___________________________________________________________________________________________
3. Instrument Blanks .....................................................................................................................................................
Initial Calibration Blank ICB ≤ Reporting limit? ......................................................................... o Yes o No o N/A
Continuing Calibration Blank CCB ≤ Reporting limit?................................................................ o Yes o No o N/A
CCB analyzed within required frequency (20 samples)? .............................................................. o Yes o No o N/A
Comments on “No” Answers: ___________________________________________________________________
___________________________________________________________________________________________
4. Continuing Calibration Verification (CCV) ..............................................................................................................
Standards within expiration date? ................................................................................................. o Yes o No o N/A
Calibration checked within required frequency (20 samples)? ..................................................... o Yes o No o N/A
CCV results acceptable (90-110% of true value)? ........................................................................ o Yes o No o N/A
Comments on “No” Answers: ___________________________________________________________________
___________________________________________________________________________________________
(Comments on “No” answers will be addressed within the individual requirements (Items #1 – 9) and be included on a continuation page if additional space is needed.)
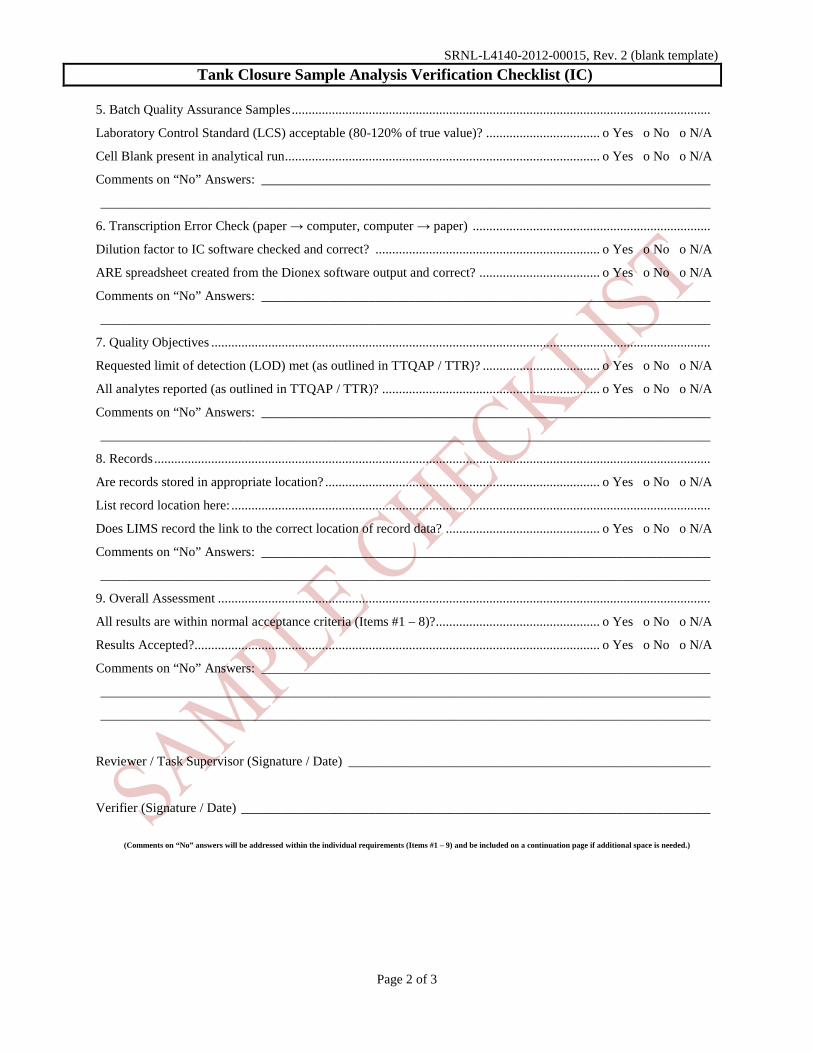
SRNL-L4140-2012-00015, Rev. 2 (blank template)
Tank Closure Sample Analysis Verification Checklist (IC)
Page 2 of 3
5. Batch Quality Assurance Samples .............................................................................................................................
Laboratory Control Standard (LCS) acceptable (80-120% of true value)? .................................. o Yes o No o N/A
Cell Blank present in analytical run .............................................................................................. o Yes o No o N/A
Comments on “No” Answers: ___________________________________________________________________
___________________________________________________________________________________________
6. Transcription Error Check (paper → computer, computer → paper) .......................................................................
Dilution factor to IC software checked and correct? ................................................................... o Yes o No o N/A
ARE spreadsheet created from the Dionex software output and correct? .................................... o Yes o No o N/A
Comments on “No” Answers: ___________________________________________________________________
___________________________________________________________________________________________
7. Quality Objectives .....................................................................................................................................................
Requested limit of detection (LOD) met (as outlined in TTQAP / TTR)? ................................... o Yes o No o N/A
All analytes reported (as outlined in TTQAP / TTR)? ................................................................. o Yes o No o N/A
Comments on “No” Answers: ___________________________________________________________________
___________________________________________________________________________________________
8. Records ......................................................................................................................................................................
Are records stored in appropriate location? .................................................................................. o Yes o No o N/A
List record location here: ...............................................................................................................................................
Does LIMS record the link to the correct location of record data? .............................................. o Yes o No o N/A
Comments on “No” Answers: ___________________________________________________________________
___________________________________________________________________________________________
9. Overall Assessment ...................................................................................................................................................
All results are within normal acceptance criteria (Items #1 – 8)? ................................................. o Yes o No o N/A
Results Accepted?......................................................................................................................... o Yes o No o N/A
Comments on “No” Answers: ___________________________________________________________________
___________________________________________________________________________________________
___________________________________________________________________________________________
Reviewer / Task Supervisor (Signature / Date) ______________________________________________________
Verifier (Signature / Date) ______________________________________________________________________
(Comments on “No” answers will be addressed within the individual requirements (Items #1 – 9) and be included on a continuation page if additional space is needed.)
SRNL-L4140-2012-00015, Rev. 2 (blank template)
Tank Closure Sample Analysis Verification Checklist (IC)
Page 3 of 3
Continuation Page:
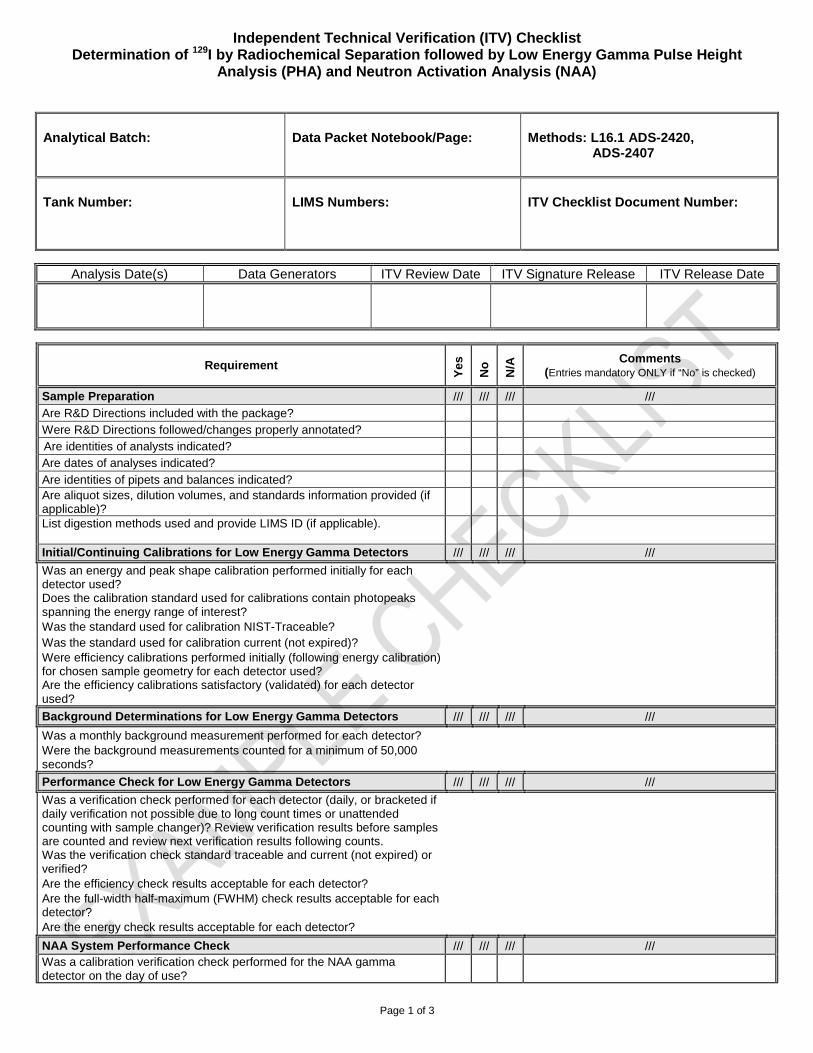
Independent Technical Verification (ITV) Checklist Determination of 129I by Radiochemical Separation followed by Low Energy Gamma Pulse Height
Analysis (PHA) and Neutron Activation Analysis (NAA)
Analytical Batch: Data Packet Notebook/Page: Methods: L16.1 ADS-2420, ADS-2407
Tank Number: LIMS Numbers: ITV Checklist Document Number:
Page 1 of 3
Analysis Date(s) Data Generators ITV Review Date ITV Signature Release ITV Release Date
Requirement
Ye
s
No
N/A
Comments (Entries mandatory ONLY if “No” is checked)
Sample Preparation /// /// /// /// Are R&D Directions included with the package? Were R&D Directions followed/changes properly annotated? Are identities of analysts indicated? Are dates of analyses indicated?
Are identities of pipets and balances indicated? Are aliquot sizes, dilution volumes, and standards information provided (if applicable)?
List digestion methods used and provide LIMS ID (if applicable).
Initial/Continuing Calibrations for Low Energy Gamma Detectors /// /// /// ///
Was an energy and peak shape calibration performed initially for each detector used?
Does the calibration standard used for calibrations contain photopeaks spanning the energy range of interest?
Was the standard used for calibration NIST-Traceable? Was the standard used for calibration current (not expired)? Were efficiency calibrations performed initially (following energy calibration) for chosen sample geometry for each detector used?
Are the efficiency calibrations satisfactory (validated) for each detector used?
Background Determinations for Low Energy Gamma Detectors /// /// /// ///
Was a monthly background measurement performed for each detector? Were the background measurements counted for a minimum of 50,000 seconds?
Performance Check for Low Energy Gamma Detectors /// /// /// ///
Was a verification check performed for each detector (daily, or bracketed if daily verification not possible due to long count times or unattended counting with sample changer)? Review verification results before samples are counted and review next verification results following counts.
Was the verification check standard traceable and current (not expired) or verified?
Are the efficiency check results acceptable for each detector? Are the full-width half-maximum (FWHM) check results acceptable for each detector?
Are the energy check results acceptable for each detector?
NAA System Performance Check /// /// /// /// Was a calibration verification check performed for the NAA gamma detector on the day of use?
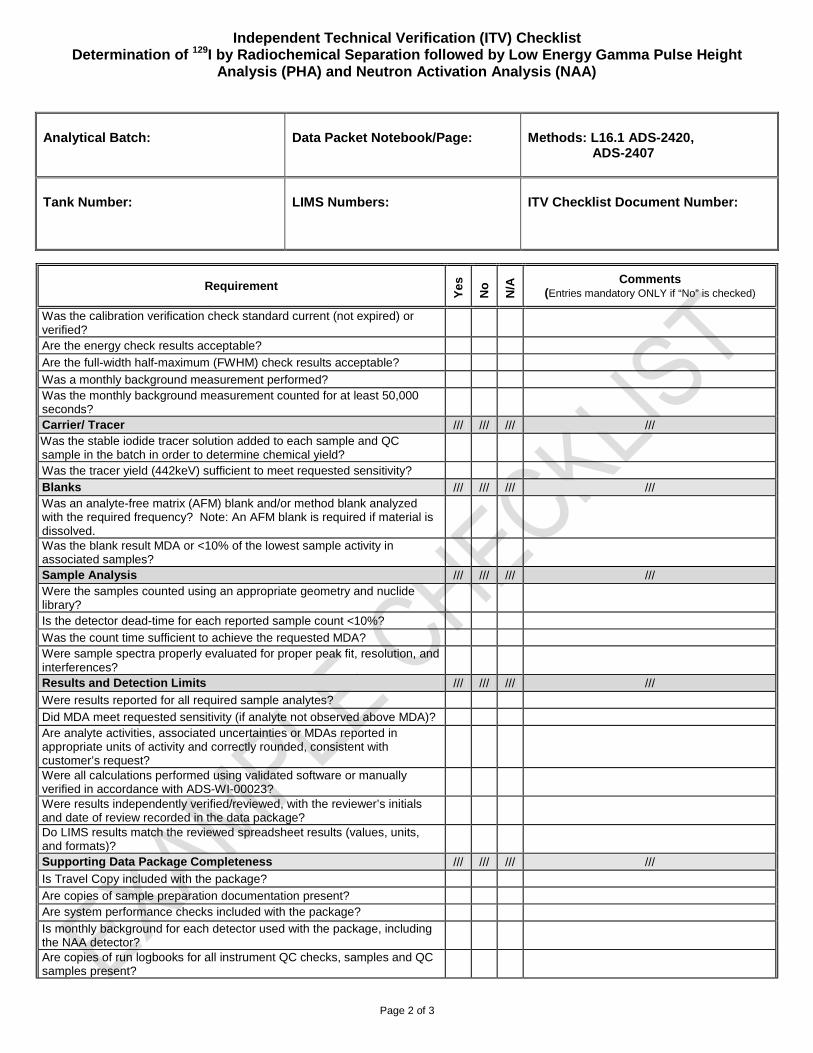
Independent Technical Verification (ITV) Checklist Determination of 129I by Radiochemical Separation followed by Low Energy Gamma Pulse Height
Analysis (PHA) and Neutron Activation Analysis (NAA)
Analytical Batch: Data Packet Notebook/Page: Methods: L16.1 ADS-2420, ADS-2407
Tank Number: LIMS Numbers: ITV Checklist Document Number:
Page 2 of 3
Requirement
Ye
s
No
N/A
Comments (Entries mandatory ONLY if “No” is checked)
Was the calibration verification check standard current (not expired) or verified?
Are the energy check results acceptable?
Are the full-width half-maximum (FWHM) check results acceptable?
Was a monthly background measurement performed? Was the monthly background measurement counted for at least 50,000 seconds?
Carrier/ Tracer /// /// /// /// Was the stable iodide tracer solution added to each sample and QC sample in the batch in order to determine chemical yield?
Was the tracer yield (442keV) sufficient to meet requested sensitivity? Blanks /// /// /// /// Was an analyte-free matrix (AFM) blank and/or method blank analyzed with the required frequency? Note: An AFM blank is required if material is dissolved.
Was the blank result MDA or <10% of the lowest sample activity in associated samples?
Sample Analysis /// /// /// /// Were the samples counted using an appropriate geometry and nuclide library?
Is the detector dead-time for each reported sample count <10%?
Was the count time sufficient to achieve the requested MDA? Were sample spectra properly evaluated for proper peak fit, resolution, and interferences?
Results and Detection Limits /// /// /// ///
Were results reported for all required sample analytes?
Did MDA meet requested sensitivity (if analyte not observed above MDA)? Are analyte activities, associated uncertainties or MDAs reported in appropriate units of activity and correctly rounded, consistent with customer’s request?
Were all calculations performed using validated software or manually verified in accordance with ADS-WI-00023?
Were results independently verified/reviewed, with the reviewer’s initials and date of review recorded in the data package?
Do LIMS results match the reviewed spreadsheet results (values, units, and formats)?
Supporting Data Package Completeness /// /// /// ///
Is Travel Copy included with the package?
Are copies of sample preparation documentation present? Are system performance checks included with the package? Is monthly background for each detector used with the package, including the NAA detector?
Are copies of run logbooks for all instrument QC checks, samples and QC samples present?
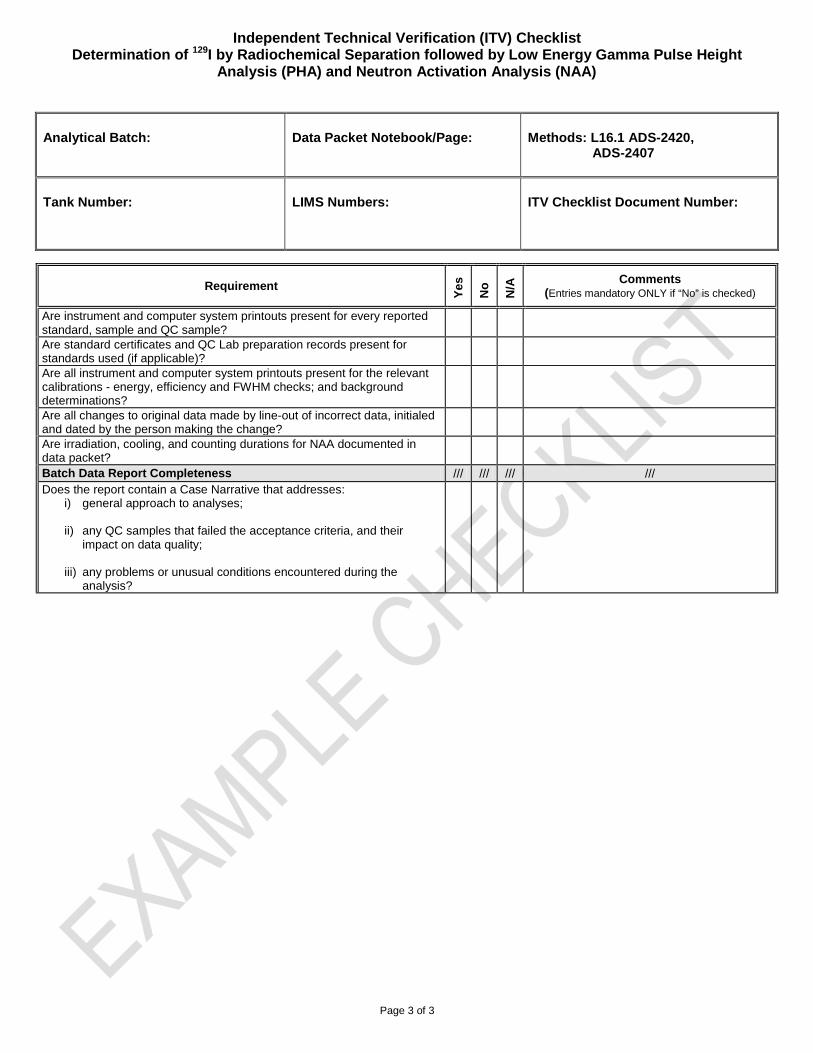
Independent Technical Verification (ITV) Checklist Determination of 129I by Radiochemical Separation followed by Low Energy Gamma Pulse Height
Analysis (PHA) and Neutron Activation Analysis (NAA)
Analytical Batch: Data Packet Notebook/Page: Methods: L16.1 ADS-2420, ADS-2407
Tank Number: LIMS Numbers: ITV Checklist Document Number:
Page 3 of 3
Requirement
Ye
s
No
N/A
Comments (Entries mandatory ONLY if “No” is checked)
Are instrument and computer system printouts present for every reported standard, sample and QC sample?
Are standard certificates and QC Lab preparation records present for standards used (if applicable)?
Are all instrument and computer system printouts present for the relevant calibrations - energy, efficiency and FWHM checks; and background determinations?
Are all changes to original data made by line-out of incorrect data, initialed and dated by the person making the change?
Are irradiation, cooling, and counting durations for NAA documented in data packet?
Batch Data Report Completeness /// /// /// /// Does the report contain a Case Narrative that addresses:
i) general approach to analyses; ii) any QC samples that failed the acceptance criteria, and their
impact on data quality; iii) any problems or unusual conditions encountered during the
analysis?
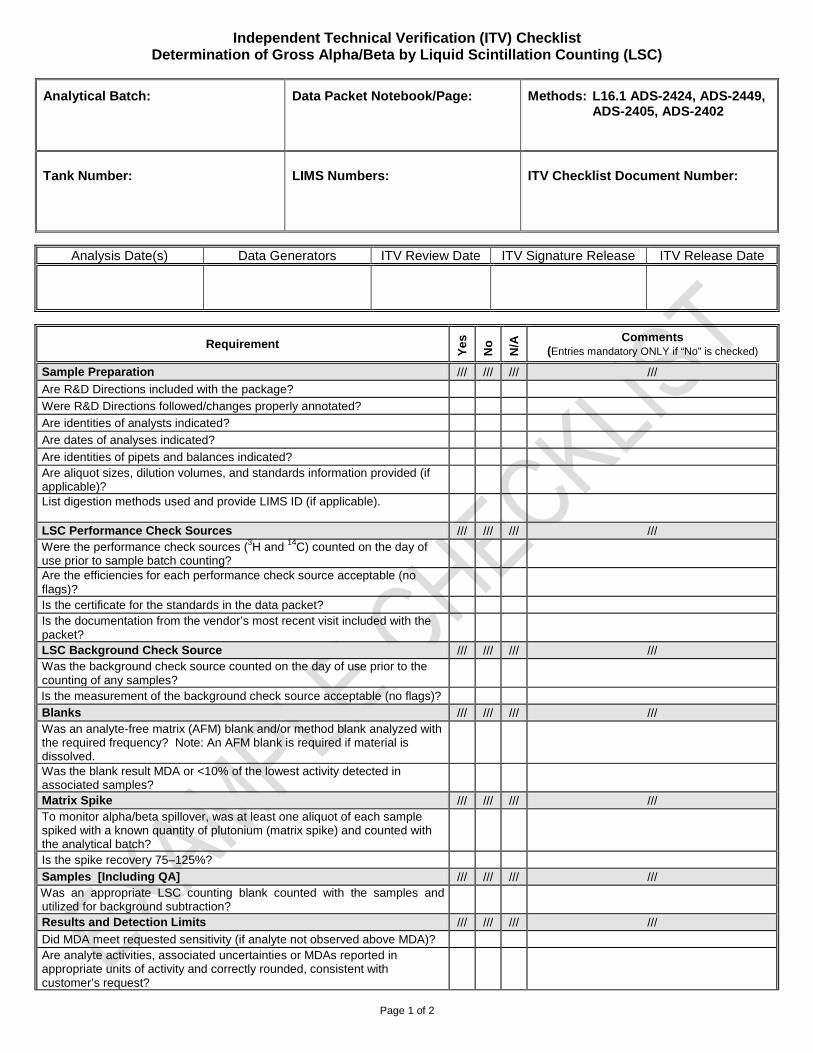
Independent Technical Verification (ITV) Checklist Determination of Gross Alpha/Beta by Liquid Scintillation Counting (LSC)
Analytical Batch:
Data Packet Notebook/Page:
Methods: L16.1 ADS-2424, ADS-2449, ADS-2405, ADS-2402
Tank Number: LIMS Numbers: ITV Checklist Document Number:
Page 1 of 2
Analysis Date(s) Data Generators ITV Review Date ITV Signature Release ITV Release Date
Requirement
Ye
s
No
N/A
Comments (Entries mandatory ONLY if “No” is checked)
Sample Preparation /// /// /// ///
Are R&D Directions included with the package?
Were R&D Directions followed/changes properly annotated?
Are identities of analysts indicated?
Are dates of analyses indicated?
Are identities of pipets and balances indicated? Are aliquot sizes, dilution volumes, and standards information provided (if applicable)?
List digestion methods used and provide LIMS ID (if applicable).
LSC Performance Check Sources /// /// /// /// Were the performance check sources (3H and 14C) counted on the day of use prior to sample batch counting?
Are the efficiencies for each performance check source acceptable (no flags)?
Is the certificate for the standards in the data packet? Is the documentation from the vendor’s most recent visit included with the packet?
LSC Background Check Source /// /// /// /// Was the background check source counted on the day of use prior to the counting of any samples?
Is the measurement of the background check source acceptable (no flags)? Blanks /// /// /// /// Was an analyte-free matrix (AFM) blank and/or method blank analyzed with the required frequency? Note: An AFM blank is required if material is dissolved.
Was the blank result MDA or <10% of the lowest activity detected in associated samples?
Matrix Spike /// /// /// /// To monitor alpha/beta spillover, was at least one aliquot of each sample spiked with a known quantity of plutonium (matrix spike) and counted with the analytical batch?
Is the spike recovery 75–125%?
Samples [Including QA] /// /// /// /// Was an appropriate LSC counting blank counted with the samples and utilized for background subtraction?
Results and Detection Limits /// /// /// ///
Did MDA meet requested sensitivity (if analyte not observed above MDA)? Are analyte activities, associated uncertainties or MDAs reported in appropriate units of activity and correctly rounded, consistent with customer’s request?
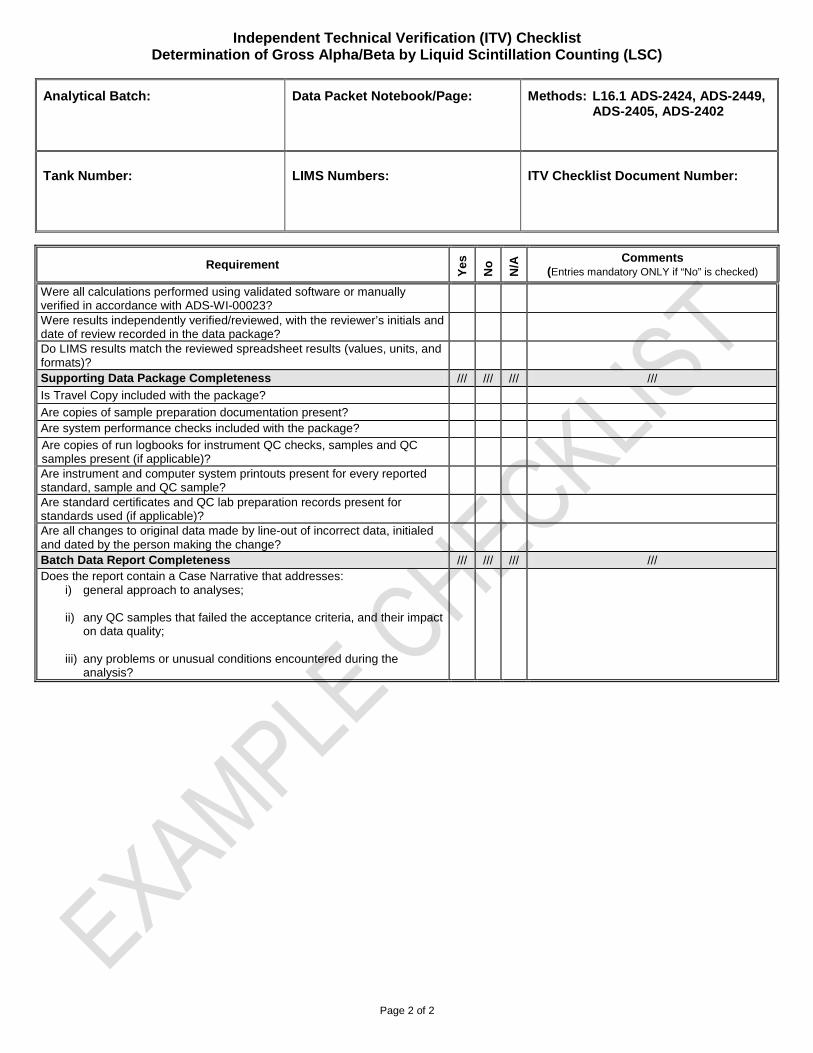
Independent Technical Verification (ITV) Checklist Determination of Gross Alpha/Beta by Liquid Scintillation Counting (LSC)
Analytical Batch:
Data Packet Notebook/Page:
Methods: L16.1 ADS-2424, ADS-2449, ADS-2405, ADS-2402
Tank Number: LIMS Numbers: ITV Checklist Document Number:
Page 2 of 2
Requirement
Ye
s
No
N/A
Comments (Entries mandatory ONLY if “No” is checked)
Were all calculations performed using validated software or manually verified in accordance with ADS-WI-00023?
Were results independently verified/reviewed, with the reviewer’s initials and date of review recorded in the data package?
Do LIMS results match the reviewed spreadsheet results (values, units, and formats)?
Supporting Data Package Completeness /// /// /// ///
Is Travel Copy included with the package?
Are copies of sample preparation documentation present? Are system performance checks included with the package? Are copies of run logbooks for instrument QC checks, samples and QC samples present (if applicable)?
Are instrument and computer system printouts present for every reported standard, sample and QC sample?
Are standard certificates and QC lab preparation records present for standards used (if applicable)?
Are all changes to original data made by line-out of incorrect data, initialed and dated by the person making the change?
Batch Data Report Completeness /// /// /// /// Does the report contain a Case Narrative that addresses:
i) general approach to analyses; ii) any QC samples that failed the acceptance criteria, and their impact
on data quality; iii) any problems or unusual conditions encountered during the
analysis?
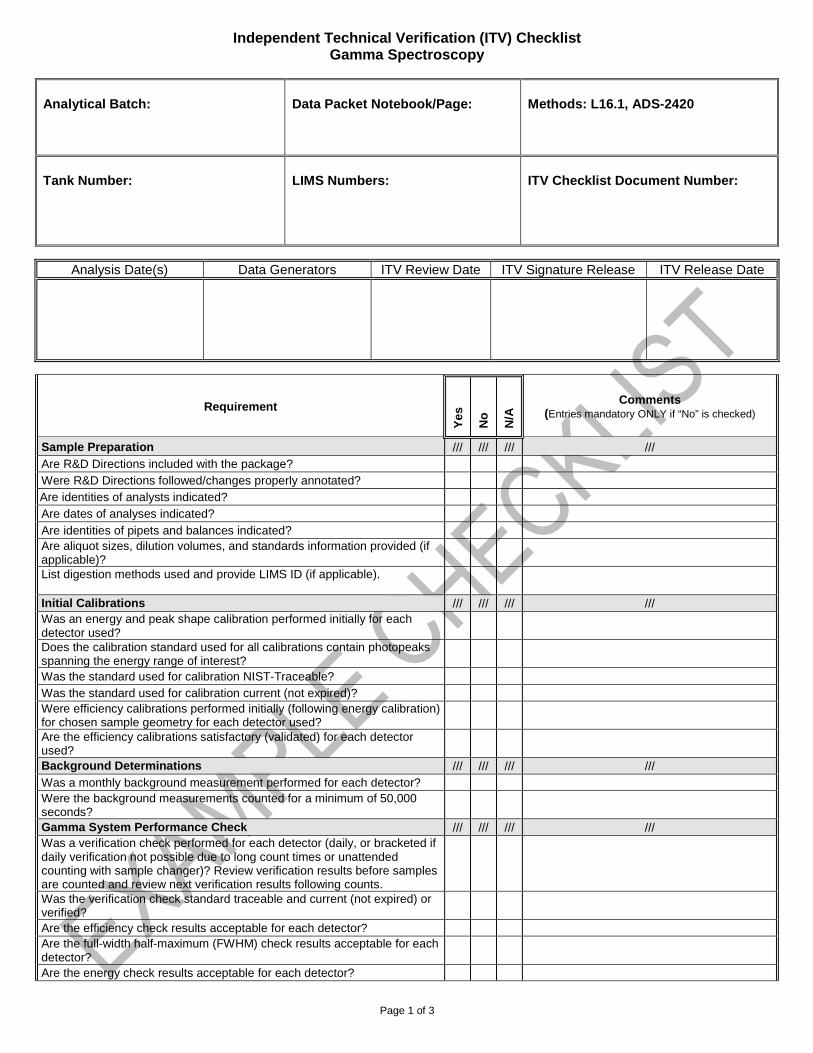
Independent Technical Verification (ITV) Checklist Gamma Spectroscopy
Analytical Batch: Data Packet Notebook/Page: Methods: L16.1, ADS-2420
Tank Number: LIMS Numbers: ITV Checklist Document Number:
Page 1 of 3
Analysis Date(s) Data Generators ITV Review Date ITV Signature Release ITV Release Date
Requirement
Ye
s
No
N/A
Comments (Entries mandatory ONLY if “No” is checked)
Sample Preparation /// /// /// /// Are R&D Directions included with the package? Were R&D Directions followed/changes properly annotated? Are identities of analysts indicated? Are dates of analyses indicated?
Are identities of pipets and balances indicated? Are aliquot sizes, dilution volumes, and standards information provided (if applicable)?
List digestion methods used and provide LIMS ID (if applicable).
Initial Calibrations /// /// /// /// Was an energy and peak shape calibration performed initially for each detector used?
Does the calibration standard used for all calibrations contain photopeaks spanning the energy range of interest?
Was the standard used for calibration NIST-Traceable? Was the standard used for calibration current (not expired)? Were efficiency calibrations performed initially (following energy calibration) for chosen sample geometry for each detector used?
Are the efficiency calibrations satisfactory (validated) for each detector used?
Background Determinations /// /// /// /// Was a monthly background measurement performed for each detector? Were the background measurements counted for a minimum of 50,000 seconds?
Gamma System Performance Check /// /// /// /// Was a verification check performed for each detector (daily, or bracketed if daily verification not possible due to long count times or unattended counting with sample changer)? Review verification results before samples are counted and review next verification results following counts.
Was the verification check standard traceable and current (not expired) or verified?
Are the efficiency check results acceptable for each detector? Are the full-width half-maximum (FWHM) check results acceptable for each detector?
Are the energy check results acceptable for each detector?
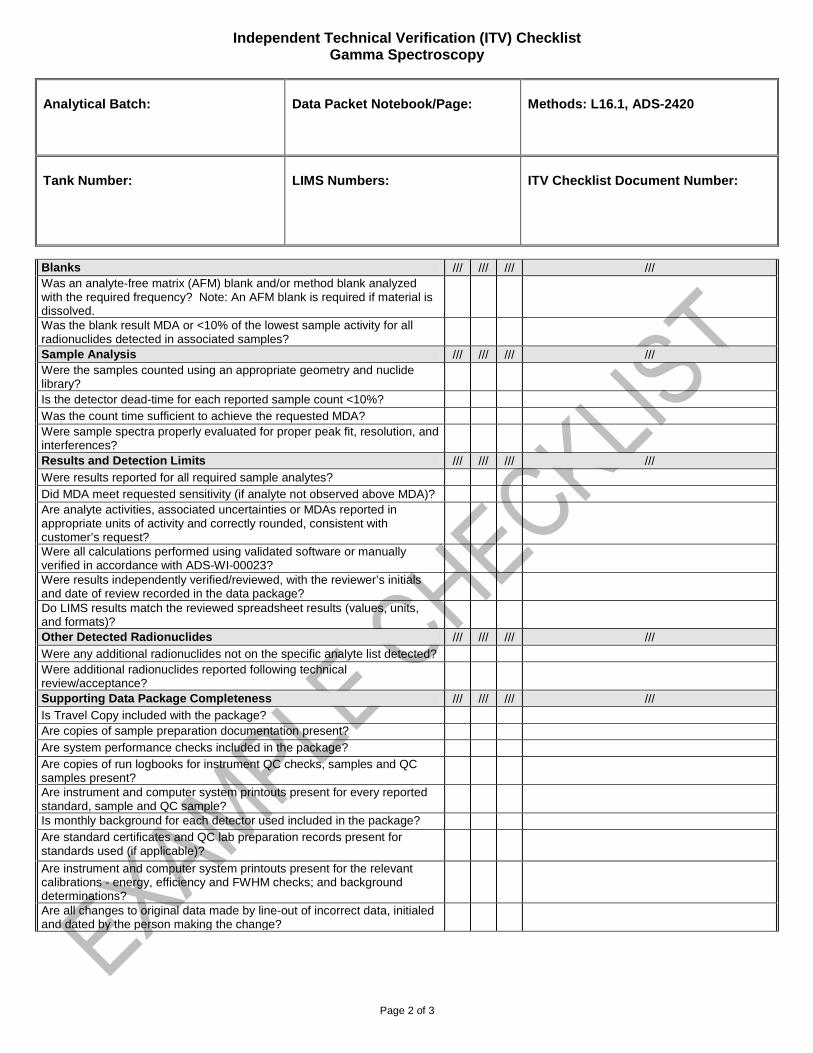
Independent Technical Verification (ITV) Checklist Gamma Spectroscopy
Analytical Batch: Data Packet Notebook/Page: Methods: L16.1, ADS-2420
Tank Number: LIMS Numbers: ITV Checklist Document Number:
Page 2 of 3
Blanks /// /// /// /// Was an analyte-free matrix (AFM) blank and/or method blank analyzed with the required frequency? Note: An AFM blank is required if material is dissolved.
Was the blank result MDA or <10% of the lowest sample activity for all radionuclides detected in associated samples?
Sample Analysis /// /// /// /// Were the samples counted using an appropriate geometry and nuclide library?
Is the detector dead-time for each reported sample count <10%? Was the count time sufficient to achieve the requested MDA? Were sample spectra properly evaluated for proper peak fit, resolution, and interferences?
Results and Detection Limits /// /// /// /// Were results reported for all required sample analytes? Did MDA meet requested sensitivity (if analyte not observed above MDA)? Are analyte activities, associated uncertainties or MDAs reported in appropriate units of activity and correctly rounded, consistent with customer’s request?
Were all calculations performed using validated software or manually verified in accordance with ADS-WI-00023?
Were results independently verified/reviewed, with the reviewer’s initials and date of review recorded in the data package?
Do LIMS results match the reviewed spreadsheet results (values, units, and formats)?
Other Detected Radionuclides /// /// /// /// Were any additional radionuclides not on the specific analyte list detected? Were additional radionuclides reported following technical review/acceptance?
Supporting Data Package Completeness /// /// /// /// Is Travel Copy included with the package? Are copies of sample preparation documentation present? Are system performance checks included in the package? Are copies of run logbooks for instrument QC checks, samples and QC samples present?
Are instrument and computer system printouts present for every reported standard, sample and QC sample?
Is monthly background for each detector used included in the package? Are standard certificates and QC lab preparation records present for standards used (if applicable)?
Are instrument and computer system printouts present for the relevant calibrations - energy, efficiency and FWHM checks; and background determinations?
Are all changes to original data made by line-out of incorrect data, initialed and dated by the person making the change?
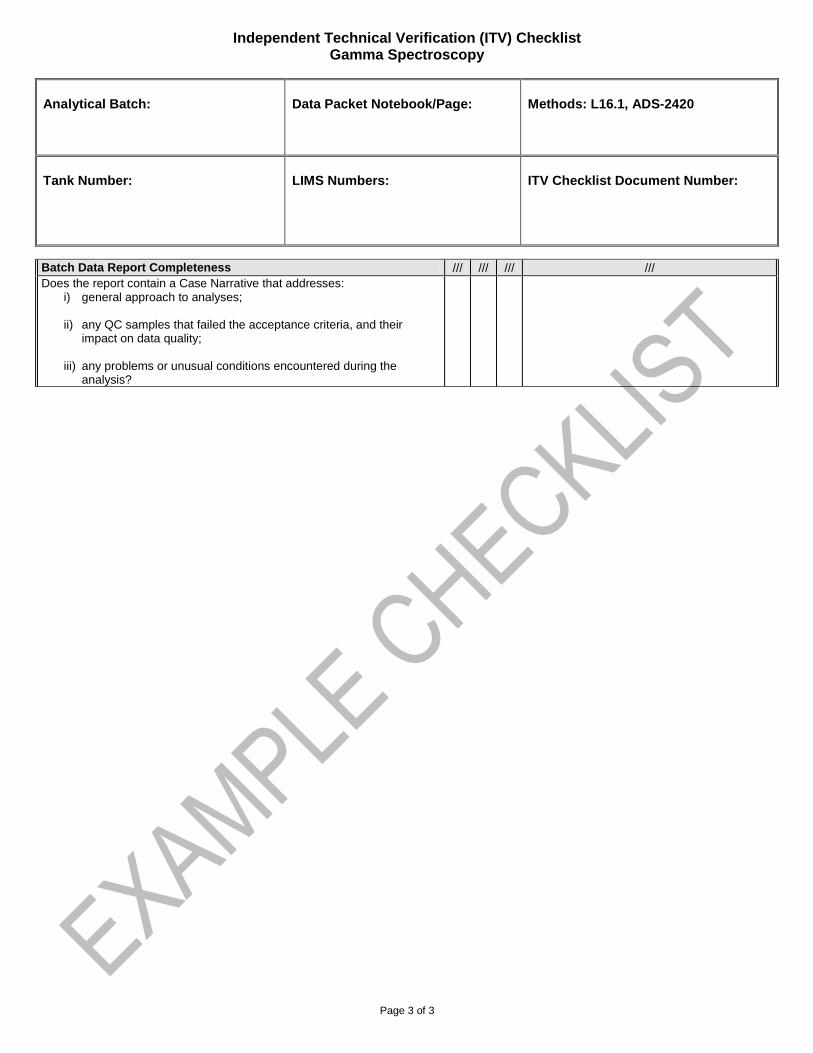
Independent Technical Verification (ITV) Checklist Gamma Spectroscopy
Analytical Batch: Data Packet Notebook/Page: Methods: L16.1, ADS-2420
Tank Number: LIMS Numbers: ITV Checklist Document Number:
Page 3 of 3
Batch Data Report Completeness /// /// /// /// Does the report contain a Case Narrative that addresses:
i) general approach to analyses; ii) any QC samples that failed the acceptance criteria, and their
impact on data quality;
iii) any problems or unusual conditions encountered during the analysis?
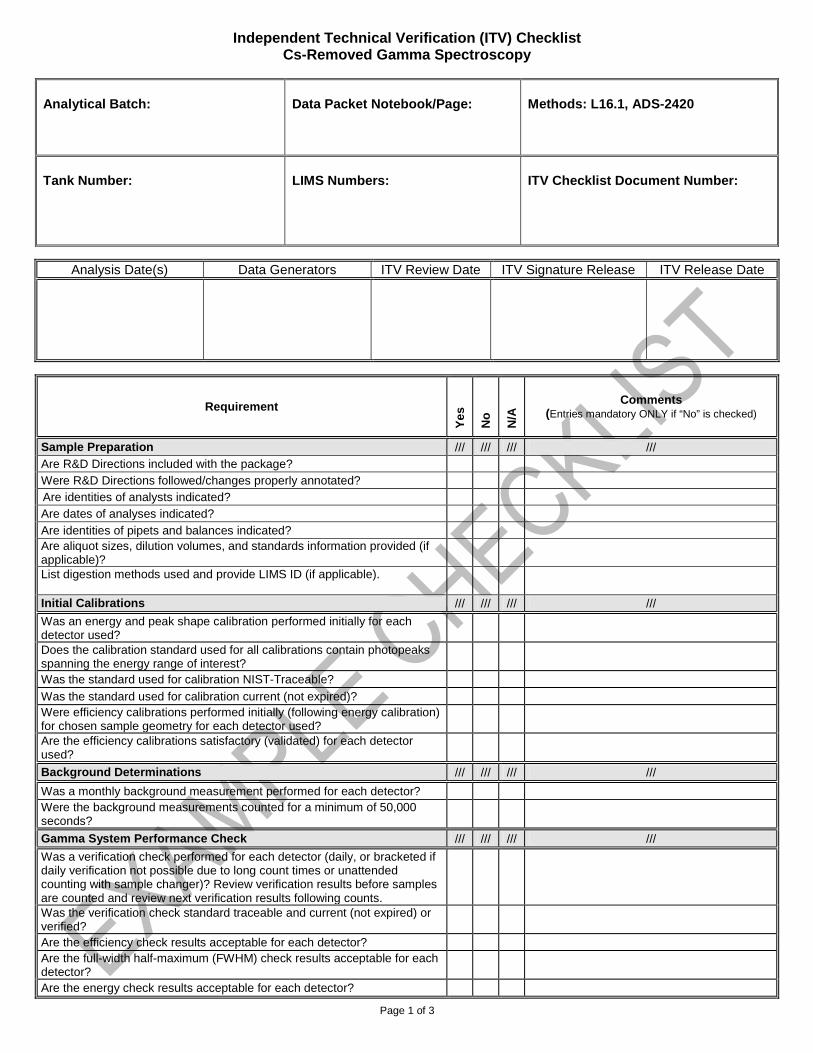
Independent Technical Verification (ITV) Checklist Cs-Removed Gamma Spectroscopy
Analytical Batch: Data Packet Notebook/Page: Methods: L16.1, ADS-2420
Tank Number: LIMS Numbers: ITV Checklist Document Number:
Page 1 of 3
Analysis Date(s) Data Generators ITV Review Date ITV Signature Release ITV Release Date
Requirement
Ye
s
No
N/A
Comments (Entries mandatory ONLY if “No” is checked)
Sample Preparation /// /// /// /// Are R&D Directions included with the package? Were R&D Directions followed/changes properly annotated? Are identities of analysts indicated? Are dates of analyses indicated?
Are identities of pipets and balances indicated? Are aliquot sizes, dilution volumes, and standards information provided (if applicable)?
List digestion methods used and provide LIMS ID (if applicable).
Initial Calibrations /// /// /// ///
Was an energy and peak shape calibration performed initially for each detector used?
Does the calibration standard used for all calibrations contain photopeaks spanning the energy range of interest?
Was the standard used for calibration NIST-Traceable?
Was the standard used for calibration current (not expired)? Were efficiency calibrations performed initially (following energy calibration) for chosen sample geometry for each detector used?
Are the efficiency calibrations satisfactory (validated) for each detector used?
Background Determinations /// /// /// ///
Was a monthly background measurement performed for each detector? Were the background measurements counted for a minimum of 50,000 seconds?
Gamma System Performance Check /// /// /// ///
Was a verification check performed for each detector (daily, or bracketed if daily verification not possible due to long count times or unattended counting with sample changer)? Review verification results before samples are counted and review next verification results following counts.
Was the verification check standard traceable and current (not expired) or verified?
Are the efficiency check results acceptable for each detector? Are the full-width half-maximum (FWHM) check results acceptable for each detector?
Are the energy check results acceptable for each detector?
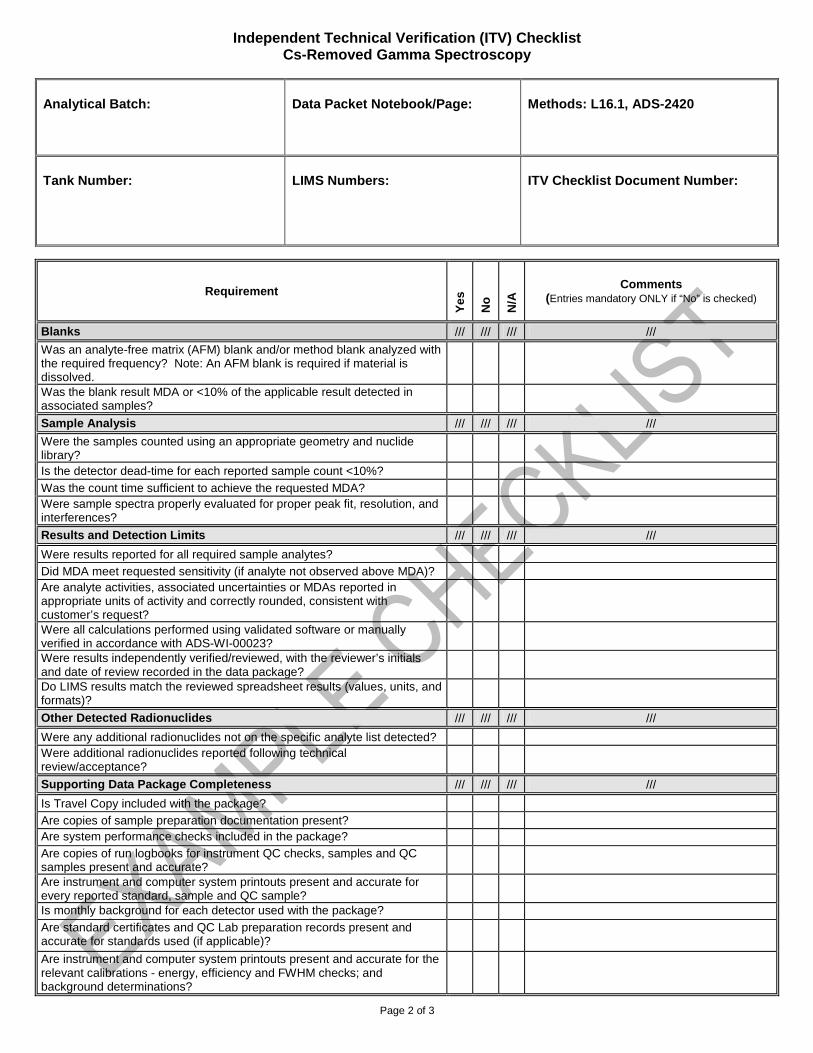
Independent Technical Verification (ITV) Checklist Cs-Removed Gamma Spectroscopy
Analytical Batch: Data Packet Notebook/Page: Methods: L16.1, ADS-2420
Tank Number: LIMS Numbers: ITV Checklist Document Number:
Page 2 of 3
Requirement
Ye
s
No
N/A
Comments (Entries mandatory ONLY if “No” is checked)
Blanks /// /// /// ///
Was an analyte-free matrix (AFM) blank and/or method blank analyzed with the required frequency? Note: An AFM blank is required if material is dissolved.
Was the blank result MDA or <10% of the applicable result detected in associated samples?
Sample Analysis /// /// /// ///
Were the samples counted using an appropriate geometry and nuclide library?
Is the detector dead-time for each reported sample count <10%?
Was the count time sufficient to achieve the requested MDA? Were sample spectra properly evaluated for proper peak fit, resolution, and interferences?
Results and Detection Limits /// /// /// ///
Were results reported for all required sample analytes?
Did MDA meet requested sensitivity (if analyte not observed above MDA)? Are analyte activities, associated uncertainties or MDAs reported in appropriate units of activity and correctly rounded, consistent with customer’s request?
Were all calculations performed using validated software or manually verified in accordance with ADS-WI-00023?
Were results independently verified/reviewed, with the reviewer’s initials and date of review recorded in the data package?
Do LIMS results match the reviewed spreadsheet results (values, units, and formats)?
Other Detected Radionuclides /// /// /// ///
Were any additional radionuclides not on the specific analyte list detected? Were additional radionuclides reported following technical review/acceptance?
Supporting Data Package Completeness /// /// /// ///
Is Travel Copy included with the package?
Are copies of sample preparation documentation present? Are system performance checks included in the package? Are copies of run logbooks for instrument QC checks, samples and QC samples present and accurate?
Are instrument and computer system printouts present and accurate for every reported standard, sample and QC sample?
Is monthly background for each detector used with the package? Are standard certificates and QC Lab preparation records present and accurate for standards used (if applicable)?
Are instrument and computer system printouts present and accurate for the relevant calibrations - energy, efficiency and FWHM checks; and background determinations?
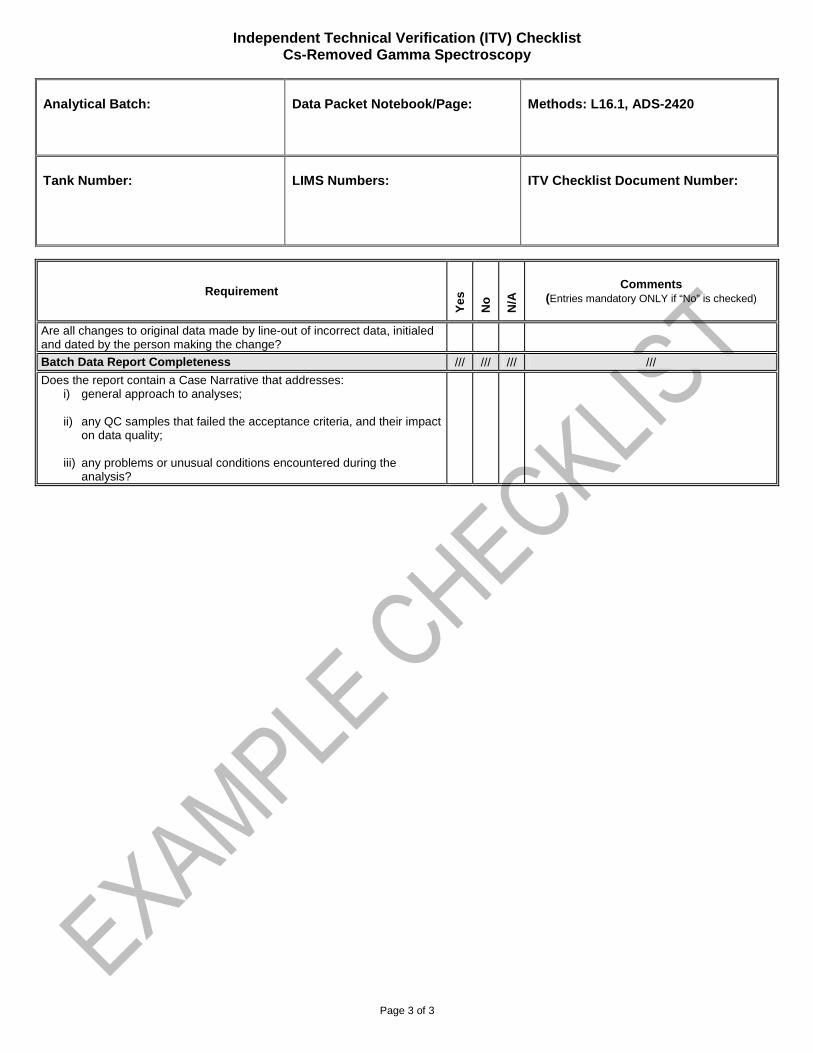
Independent Technical Verification (ITV) Checklist Cs-Removed Gamma Spectroscopy
Analytical Batch: Data Packet Notebook/Page: Methods: L16.1, ADS-2420
Tank Number: LIMS Numbers: ITV Checklist Document Number:
Page 3 of 3
Requirement
Ye
s
No
N/A
Comments (Entries mandatory ONLY if “No” is checked)
Are all changes to original data made by line-out of incorrect data, initialed and dated by the person making the change?
Batch Data Report Completeness /// /// /// ///
Does the report contain a Case Narrative that addresses: i) general approach to analyses; ii) any QC samples that failed the acceptance criteria, and their impact
on data quality; iii) any problems or unusual conditions encountered during the
analysis?
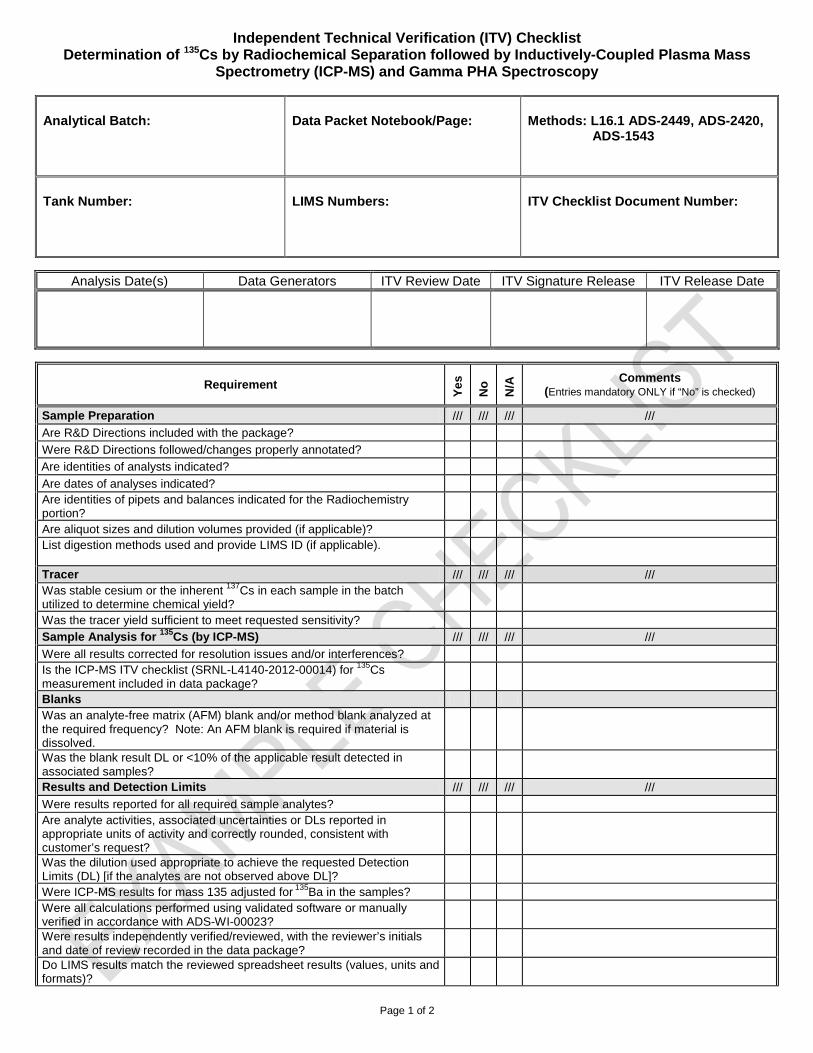
Independent Technical Verification (ITV) Checklist Determination of 135Cs by Radiochemical Separation followed by Inductively-Coupled Plasma Mass
Spectrometry (ICP-MS) and Gamma PHA Spectroscopy
Analytical Batch: Data Packet Notebook/Page:
Methods: L16.1 ADS-2449, ADS-2420, ADS-1543
Tank Number: LIMS Numbers: ITV Checklist Document Number:
Page 1 of 2
Analysis Date(s) Data Generators ITV Review Date ITV Signature Release ITV Release Date
Requirement
Ye
s
No
N/A
Comments (Entries mandatory ONLY if “No” is checked)
Sample Preparation /// /// /// ///
Are R&D Directions included with the package?
Were R&D Directions followed/changes properly annotated?
Are identities of analysts indicated?
Are dates of analyses indicated? Are identities of pipets and balances indicated for the Radiochemistry portion?
Are aliquot sizes and dilution volumes provided (if applicable)? List digestion methods used and provide LIMS ID (if applicable).
Tracer /// /// /// /// Was stable cesium or the inherent 137Cs in each sample in the batch utilized to determine chemical yield?
Was the tracer yield sufficient to meet requested sensitivity? Sample Analysis for 135Cs (by ICP-MS) /// /// /// ///
Were all results corrected for resolution issues and/or interferences? Is the ICP-MS ITV checklist (SRNL-L4140-2012-00014) for 135Cs measurement included in data package?
Blanks Was an analyte-free matrix (AFM) blank and/or method blank analyzed at the required frequency? Note: An AFM blank is required if material is dissolved.
Was the blank result DL or <10% of the applicable result detected in associated samples?
Results and Detection Limits /// /// /// ///
Were results reported for all required sample analytes? Are analyte activities, associated uncertainties or DLs reported in appropriate units of activity and correctly rounded, consistent with customer’s request?
Was the dilution used appropriate to achieve the requested Detection Limits (DL) [if the analytes are not observed above DL]?
Were ICP-MS results for mass 135 adjusted for 135Ba in the samples? Were all calculations performed using validated software or manually verified in accordance with ADS-WI-00023?
Were results independently verified/reviewed, with the reviewer’s initials and date of review recorded in the data package?
Do LIMS results match the reviewed spreadsheet results (values, units and formats)?
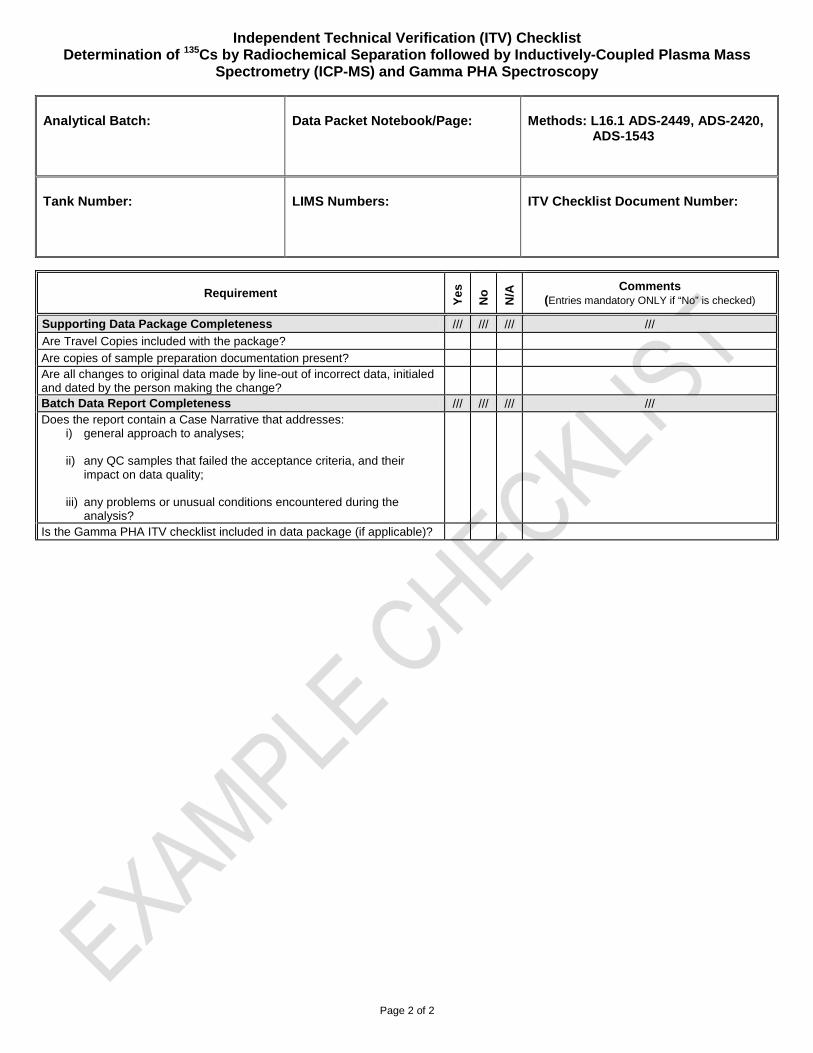
Independent Technical Verification (ITV) Checklist Determination of 135Cs by Radiochemical Separation followed by Inductively-Coupled Plasma Mass
Spectrometry (ICP-MS) and Gamma PHA Spectroscopy
Analytical Batch: Data Packet Notebook/Page:
Methods: L16.1 ADS-2449, ADS-2420, ADS-1543
Tank Number: LIMS Numbers: ITV Checklist Document Number:
Page 2 of 2
Requirement
Ye
s
No
N/A
Comments (Entries mandatory ONLY if “No” is checked)
Supporting Data Package Completeness /// /// /// ///
Are Travel Copies included with the package?
Are copies of sample preparation documentation present? Are all changes to original data made by line-out of incorrect data, initialed and dated by the person making the change?
Batch Data Report Completeness /// /// /// /// Does the report contain a Case Narrative that addresses:
i) general approach to analyses; ii) any QC samples that failed the acceptance criteria, and their
impact on data quality; iii) any problems or unusual conditions encountered during the
analysis?
Is the Gamma PHA ITV checklist included in data package (if applicable)?
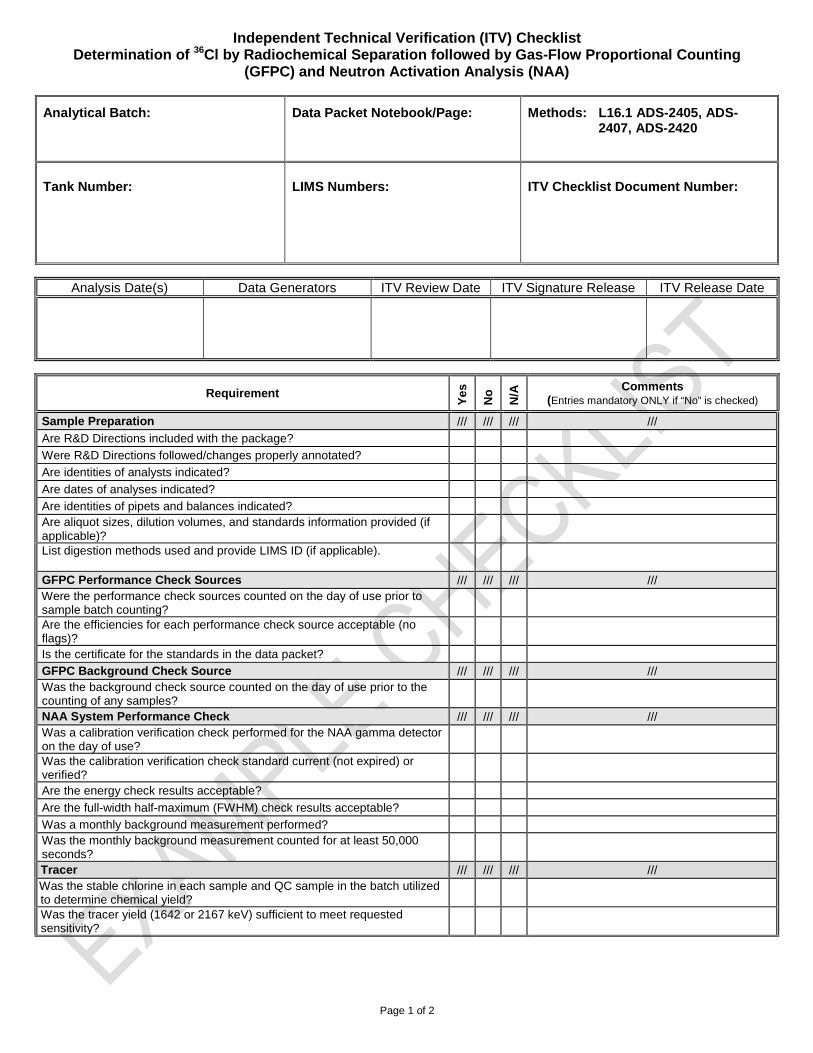
Independent Technical Verification (ITV) Checklist Determination of 36Cl by Radiochemical Separation followed by Gas-Flow Proportional Counting
(GFPC) and Neutron Activation Analysis (NAA)
Analytical Batch: Data Packet Notebook/Page:
Methods: L16.1 ADS-2405, ADS-2407, ADS-2420
Tank Number: LIMS Numbers: ITV Checklist Document Number:
Page 1 of 2
Analysis Date(s) Data Generators ITV Review Date ITV Signature Release ITV Release Date
Requirement
Ye
s
No
N/A
Comments (Entries mandatory ONLY if “No” is checked)
Sample Preparation /// /// /// ///
Are R&D Directions included with the package?
Were R&D Directions followed/changes properly annotated?
Are identities of analysts indicated?
Are dates of analyses indicated?
Are identities of pipets and balances indicated? Are aliquot sizes, dilution volumes, and standards information provided (if applicable)?
List digestion methods used and provide LIMS ID (if applicable).
GFPC Performance Check Sources /// /// /// /// Were the performance check sources counted on the day of use prior to sample batch counting?
Are the efficiencies for each performance check source acceptable (no flags)?
Is the certificate for the standards in the data packet?
GFPC Background Check Source /// /// /// /// Was the background check source counted on the day of use prior to the counting of any samples?
NAA System Performance Check /// /// /// /// Was a calibration verification check performed for the NAA gamma detector on the day of use?
Was the calibration verification check standard current (not expired) or verified?
Are the energy check results acceptable?
Are the full-width half-maximum (FWHM) check results acceptable?
Was a monthly background measurement performed? Was the monthly background measurement counted for at least 50,000 seconds?
Tracer /// /// /// /// Was the stable chlorine in each sample and QC sample in the batch utilized to determine chemical yield?
Was the tracer yield (1642 or 2167 keV) sufficient to meet requested sensitivity?
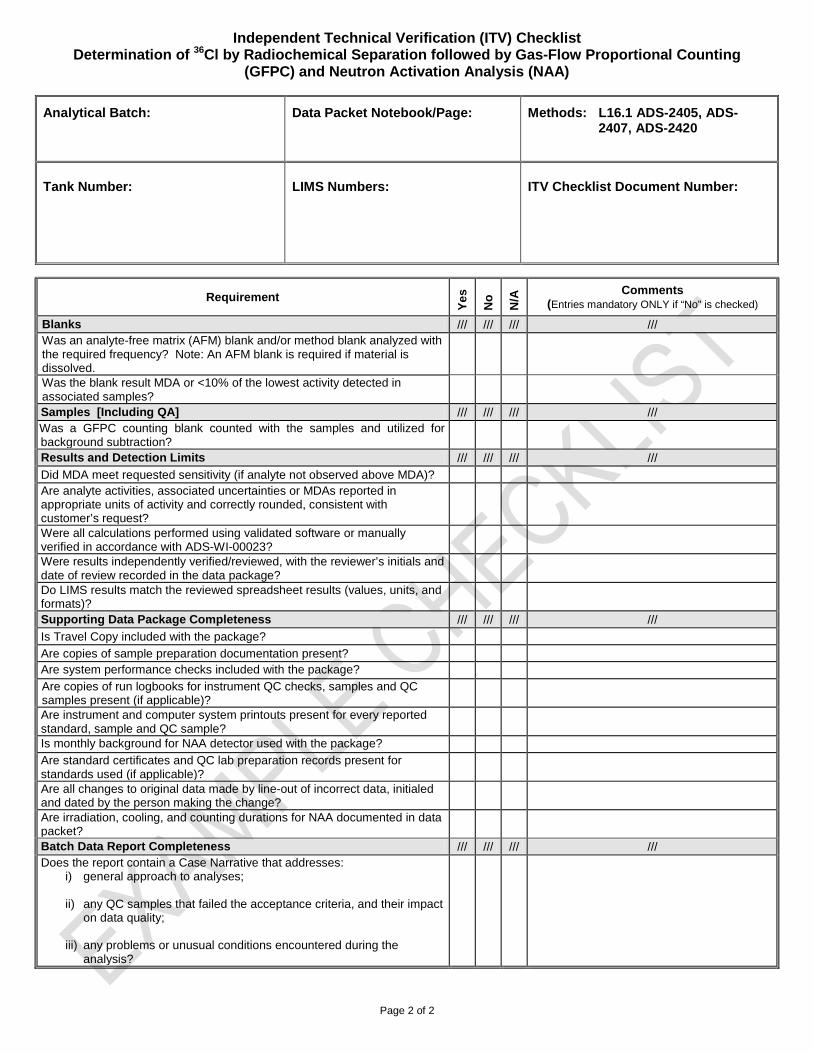
Independent Technical Verification (ITV) Checklist Determination of 36Cl by Radiochemical Separation followed by Gas-Flow Proportional Counting
(GFPC) and Neutron Activation Analysis (NAA)
Analytical Batch: Data Packet Notebook/Page:
Methods: L16.1 ADS-2405, ADS-2407, ADS-2420
Tank Number: LIMS Numbers: ITV Checklist Document Number:
Page 2 of 2
Requirement
Ye
s
No
N/A
Comments (Entries mandatory ONLY if “No” is checked)
Blanks /// /// /// /// Was an analyte-free matrix (AFM) blank and/or method blank analyzed with the required frequency? Note: An AFM blank is required if material is dissolved.
Was the blank result MDA or <10% of the lowest activity detected in associated samples?
Samples [Including QA] /// /// /// /// Was a GFPC counting blank counted with the samples and utilized for background subtraction?
Results and Detection Limits /// /// /// ///
Did MDA meet requested sensitivity (if analyte not observed above MDA)? Are analyte activities, associated uncertainties or MDAs reported in appropriate units of activity and correctly rounded, consistent with customer’s request?
Were all calculations performed using validated software or manually verified in accordance with ADS-WI-00023?
Were results independently verified/reviewed, with the reviewer’s initials and date of review recorded in the data package?
Do LIMS results match the reviewed spreadsheet results (values, units, and formats)?
Supporting Data Package Completeness /// /// /// ///
Is Travel Copy included with the package?
Are copies of sample preparation documentation present? Are system performance checks included with the package? Are copies of run logbooks for instrument QC checks, samples and QC samples present (if applicable)?
Are instrument and computer system printouts present for every reported standard, sample and QC sample?
Is monthly background for NAA detector used with the package? Are standard certificates and QC lab preparation records present for standards used (if applicable)?
Are all changes to original data made by line-out of incorrect data, initialed and dated by the person making the change?
Are irradiation, cooling, and counting durations for NAA documented in data packet?
Batch Data Report Completeness /// /// /// /// Does the report contain a Case Narrative that addresses:
i) general approach to analyses; ii) any QC samples that failed the acceptance criteria, and their impact
on data quality; iii) any problems or unusual conditions encountered during the
analysis?
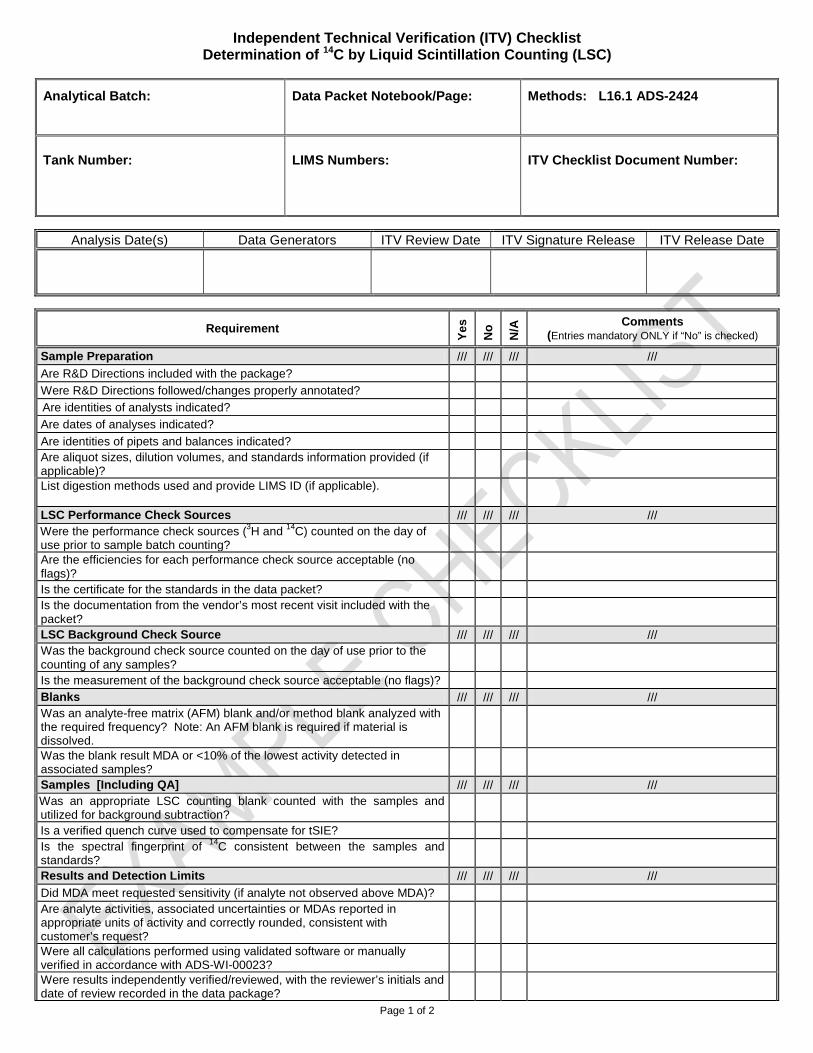
Independent Technical Verification (ITV) Checklist Determination of 14C by Liquid Scintillation Counting (LSC)
Analytical Batch: Data Packet Notebook/Page: Methods: L16.1 ADS-2424
Tank Number: LIMS Numbers: ITV Checklist Document Number:
Page 1 of 2
Analysis Date(s) Data Generators ITV Review Date ITV Signature Release ITV Release Date
Requirement
Ye
s
No
N/A
Comments (Entries mandatory ONLY if “No” is checked)
Sample Preparation /// /// /// ///
Are R&D Directions included with the package?
Were R&D Directions followed/changes properly annotated?
Are identities of analysts indicated?
Are dates of analyses indicated?
Are identities of pipets and balances indicated? Are aliquot sizes, dilution volumes, and standards information provided (if applicable)?
List digestion methods used and provide LIMS ID (if applicable).
LSC Performance Check Sources /// /// /// /// Were the performance check sources (3H and 14C) counted on the day of use prior to sample batch counting?
Are the efficiencies for each performance check source acceptable (no flags)?
Is the certificate for the standards in the data packet? Is the documentation from the vendor’s most recent visit included with the packet?
LSC Background Check Source /// /// /// /// Was the background check source counted on the day of use prior to the counting of any samples?
Is the measurement of the background check source acceptable (no flags)? Blanks /// /// /// /// Was an analyte-free matrix (AFM) blank and/or method blank analyzed with the required frequency? Note: An AFM blank is required if material is dissolved.
Was the blank result MDA or <10% of the lowest activity detected in associated samples?
Samples [Including QA] /// /// /// /// Was an appropriate LSC counting blank counted with the samples and utilized for background subtraction?
Is a verified quench curve used to compensate for tSIE? Is the spectral fingerprint of 14C consistent between the samples and standards?
Results and Detection Limits /// /// /// ///
Did MDA meet requested sensitivity (if analyte not observed above MDA)? Are analyte activities, associated uncertainties or MDAs reported in appropriate units of activity and correctly rounded, consistent with customer’s request?
Were all calculations performed using validated software or manually verified in accordance with ADS-WI-00023?
Were results independently verified/reviewed, with the reviewer’s initials and date of review recorded in the data package?
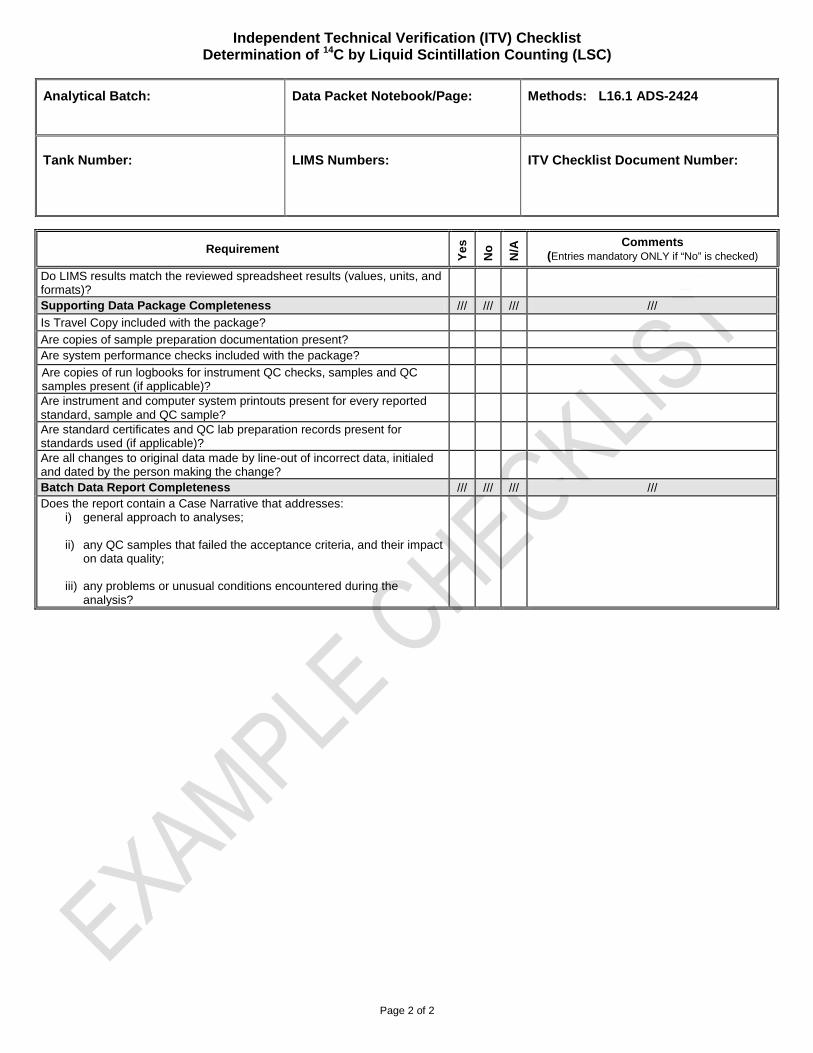
Independent Technical Verification (ITV) Checklist Determination of 14C by Liquid Scintillation Counting (LSC)
Analytical Batch: Data Packet Notebook/Page: Methods: L16.1 ADS-2424
Tank Number: LIMS Numbers: ITV Checklist Document Number:
Page 2 of 2
Requirement
Ye
s
No
N/A
Comments (Entries mandatory ONLY if “No” is checked)
Do LIMS results match the reviewed spreadsheet results (values, units, and formats)?
Supporting Data Package Completeness /// /// /// ///
Is Travel Copy included with the package?
Are copies of sample preparation documentation present? Are system performance checks included with the package? Are copies of run logbooks for instrument QC checks, samples and QC samples present (if applicable)?
Are instrument and computer system printouts present for every reported standard, sample and QC sample?
Are standard certificates and QC lab preparation records present for standards used (if applicable)?
Are all changes to original data made by line-out of incorrect data, initialed and dated by the person making the change?
Batch Data Report Completeness /// /// /// /// Does the report contain a Case Narrative that addresses:
i) general approach to analyses; ii) any QC samples that failed the acceptance criteria, and their impact
on data quality; iii) any problems or unusual conditions encountered during the
analysis?
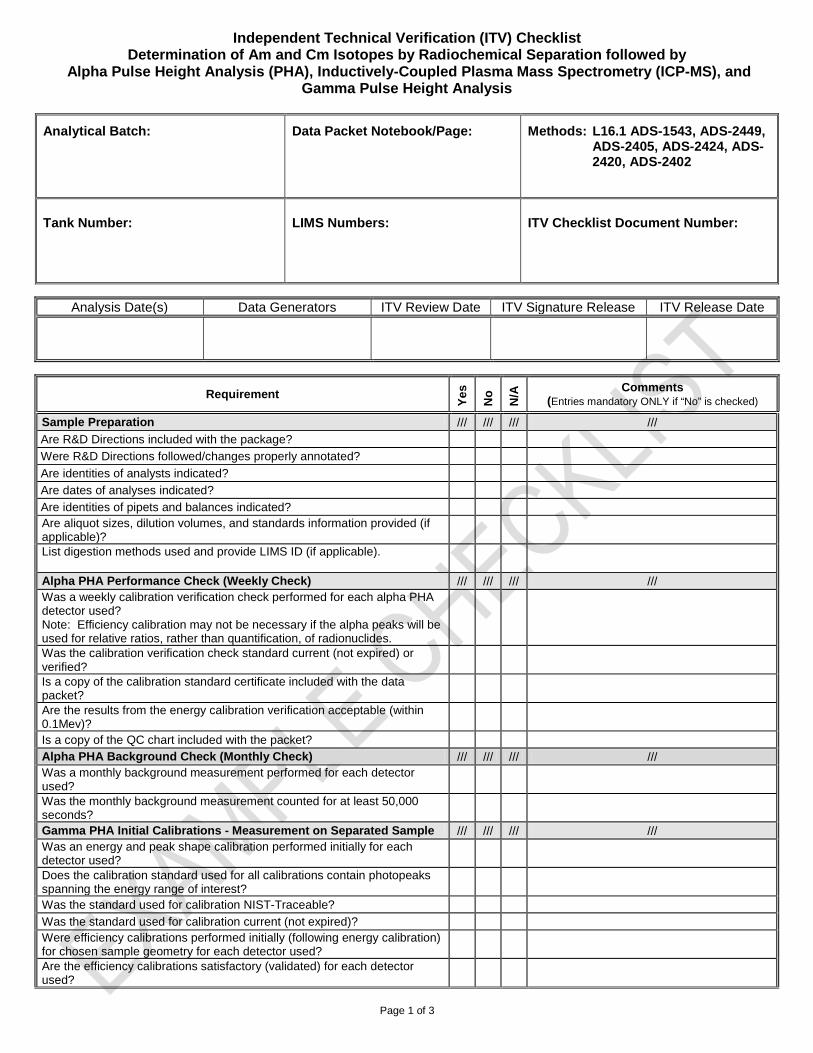
Independent Technical Verification (ITV) Checklist Determination of Am and Cm Isotopes by Radiochemical Separation followed by
Alpha Pulse Height Analysis (PHA), Inductively-Coupled Plasma Mass Spectrometry (ICP-MS), and Gamma Pulse Height Analysis
Analytical Batch: Data Packet Notebook/Page: Methods: L16.1 ADS-1543, ADS-2449, ADS-2405, ADS-2424, ADS-2420, ADS-2402
Tank Number: LIMS Numbers: ITV Checklist Document Number:
Page 1 of 3
Analysis Date(s) Data Generators ITV Review Date ITV Signature Release ITV Release Date
Requirement
Ye
s
No
N/A
Comments (Entries mandatory ONLY if “No” is checked)
Sample Preparation /// /// /// ///
Are R&D Directions included with the package?
Were R&D Directions followed/changes properly annotated?
Are identities of analysts indicated?
Are dates of analyses indicated?
Are identities of pipets and balances indicated? Are aliquot sizes, dilution volumes, and standards information provided (if applicable)?
List digestion methods used and provide LIMS ID (if applicable).
Alpha PHA Performance Check (Weekly Check) /// /// /// /// Was a weekly calibration verification check performed for each alpha PHA detector used? Note: Efficiency calibration may not be necessary if the alpha peaks will be used for relative ratios, rather than quantification, of radionuclides.
Was the calibration verification check standard current (not expired) or verified?
Is a copy of the calibration standard certificate included with the data packet?
Are the results from the energy calibration verification acceptable (within 0.1Mev)?
Is a copy of the QC chart included with the packet? Alpha PHA Background Check (Monthly Check) /// /// /// /// Was a monthly background measurement performed for each detector used?
Was the monthly background measurement counted for at least 50,000 seconds?
Gamma PHA Initial Calibrations - Measurement on Separated Sample /// /// /// /// Was an energy and peak shape calibration performed initially for each detector used?
Does the calibration standard used for all calibrations contain photopeaks spanning the energy range of interest?
Was the standard used for calibration NIST-Traceable?
Was the standard used for calibration current (not expired)? Were efficiency calibrations performed initially (following energy calibration) for chosen sample geometry for each detector used?
Are the efficiency calibrations satisfactory (validated) for each detector used?
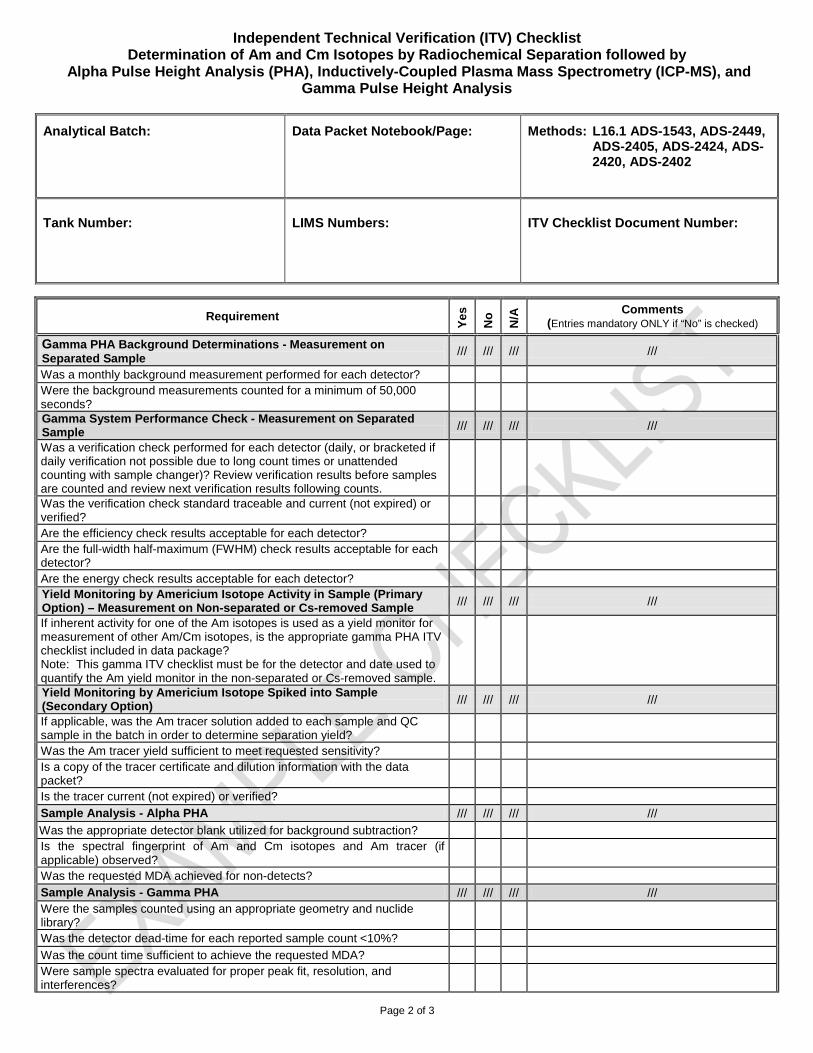
Independent Technical Verification (ITV) Checklist Determination of Am and Cm Isotopes by Radiochemical Separation followed by
Alpha Pulse Height Analysis (PHA), Inductively-Coupled Plasma Mass Spectrometry (ICP-MS), and Gamma Pulse Height Analysis
Analytical Batch: Data Packet Notebook/Page: Methods: L16.1 ADS-1543, ADS-2449, ADS-2405, ADS-2424, ADS-2420, ADS-2402
Tank Number: LIMS Numbers: ITV Checklist Document Number:
Page 2 of 3
Requirement
Ye
s
No
N/A
Comments (Entries mandatory ONLY if “No” is checked)
Gamma PHA Background Determinations - Measurement on Separated Sample
/// /// /// ///
Was a monthly background measurement performed for each detector? Were the background measurements counted for a minimum of 50,000 seconds?
Gamma System Performance Check - Measurement on Separated Sample /// /// /// ///
Was a verification check performed for each detector (daily, or bracketed if daily verification not possible due to long count times or unattended counting with sample changer)? Review verification results before samples are counted and review next verification results following counts.
Was the verification check standard traceable and current (not expired) or verified?
Are the efficiency check results acceptable for each detector? Are the full-width half-maximum (FWHM) check results acceptable for each detector?
Are the energy check results acceptable for each detector? Yield Monitoring by Americium Isotope Activity in Sample (Primary Option) – Measurement on Non-separated or Cs-removed Sample /// /// /// ///
If inherent activity for one of the Am isotopes is used as a yield monitor for measurement of other Am/Cm isotopes, is the appropriate gamma PHA ITV checklist included in data package? Note: This gamma ITV checklist must be for the detector and date used to quantify the Am yield monitor in the non-separated or Cs-removed sample.
Yield Monitoring by Americium Isotope Spiked into Sample (Secondary Option) /// /// /// ///
If applicable, was the Am tracer solution added to each sample and QC sample in the batch in order to determine separation yield?
Was the Am tracer yield sufficient to meet requested sensitivity? Is a copy of the tracer certificate and dilution information with the data packet?
Is the tracer current (not expired) or verified?
Sample Analysis - Alpha PHA /// /// /// ///
Was the appropriate detector blank utilized for background subtraction? Is the spectral fingerprint of Am and Cm isotopes and Am tracer (if applicable) observed?
Was the requested MDA achieved for non-detects? Sample Analysis - Gamma PHA /// /// /// /// Were the samples counted using an appropriate geometry and nuclide library?
Was the detector dead-time for each reported sample count <10%?
Was the count time sufficient to achieve the requested MDA? Were sample spectra evaluated for proper peak fit, resolution, and interferences?
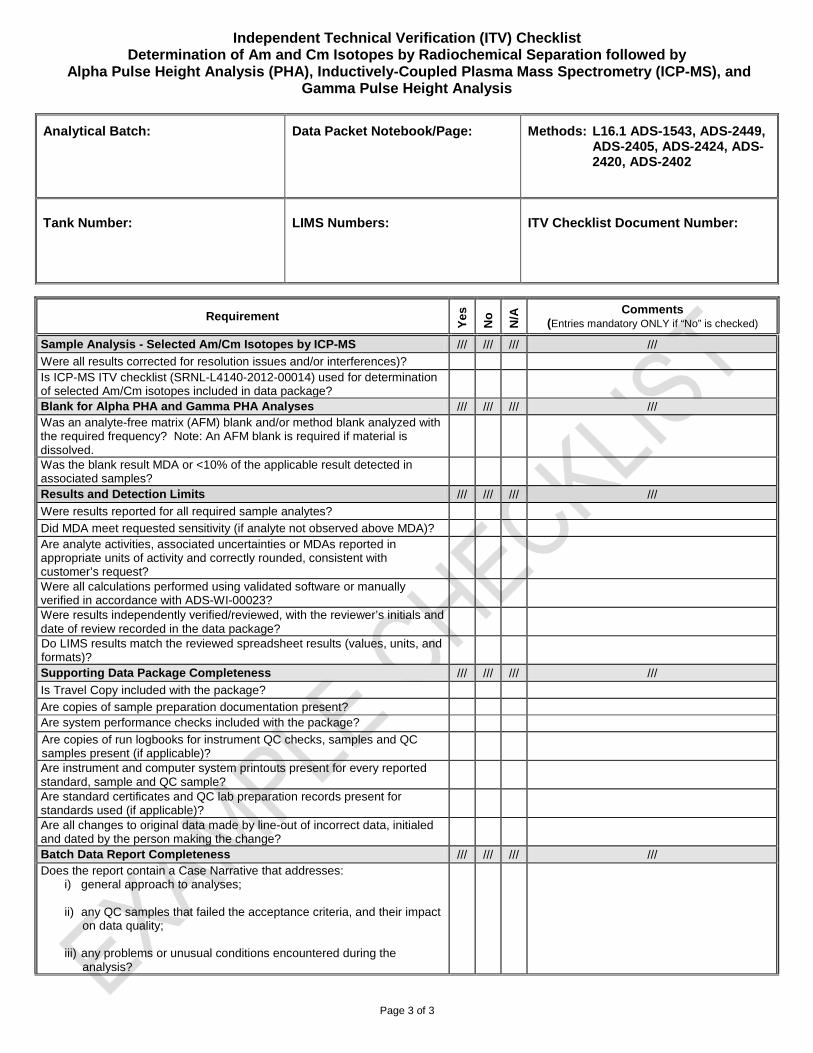
Independent Technical Verification (ITV) Checklist Determination of Am and Cm Isotopes by Radiochemical Separation followed by
Alpha Pulse Height Analysis (PHA), Inductively-Coupled Plasma Mass Spectrometry (ICP-MS), and Gamma Pulse Height Analysis
Analytical Batch: Data Packet Notebook/Page: Methods: L16.1 ADS-1543, ADS-2449, ADS-2405, ADS-2424, ADS-2420, ADS-2402
Tank Number: LIMS Numbers: ITV Checklist Document Number:
Page 3 of 3
Requirement
Ye
s
No
N/A
Comments (Entries mandatory ONLY if “No” is checked)
Sample Analysis - Selected Am/Cm Isotopes by ICP-MS /// /// /// ///
Were all results corrected for resolution issues and/or interferences)? Is ICP-MS ITV checklist (SRNL-L4140-2012-00014) used for determination of selected Am/Cm isotopes included in data package?
Blank for Alpha PHA and Gamma PHA Analyses /// /// /// /// Was an analyte-free matrix (AFM) blank and/or method blank analyzed with the required frequency? Note: An AFM blank is required if material is dissolved.
Was the blank result MDA or <10% of the applicable result detected in associated samples?
Results and Detection Limits /// /// /// ///
Were results reported for all required sample analytes?
Did MDA meet requested sensitivity (if analyte not observed above MDA)? Are analyte activities, associated uncertainties or MDAs reported in appropriate units of activity and correctly rounded, consistent with customer’s request?
Were all calculations performed using validated software or manually verified in accordance with ADS-WI-00023?
Were results independently verified/reviewed, with the reviewer’s initials and date of review recorded in the data package?
Do LIMS results match the reviewed spreadsheet results (values, units, and formats)?
Supporting Data Package Completeness /// /// /// ///
Is Travel Copy included with the package?
Are copies of sample preparation documentation present? Are system performance checks included with the package? Are copies of run logbooks for instrument QC checks, samples and QC samples present (if applicable)?
Are instrument and computer system printouts present for every reported standard, sample and QC sample?
Are standard certificates and QC lab preparation records present for standards used (if applicable)?
Are all changes to original data made by line-out of incorrect data, initialed and dated by the person making the change?
Batch Data Report Completeness /// /// /// /// Does the report contain a Case Narrative that addresses:
i) general approach to analyses; ii) any QC samples that failed the acceptance criteria, and their impact
on data quality; iii) any problems or unusual conditions encountered during the
analysis?
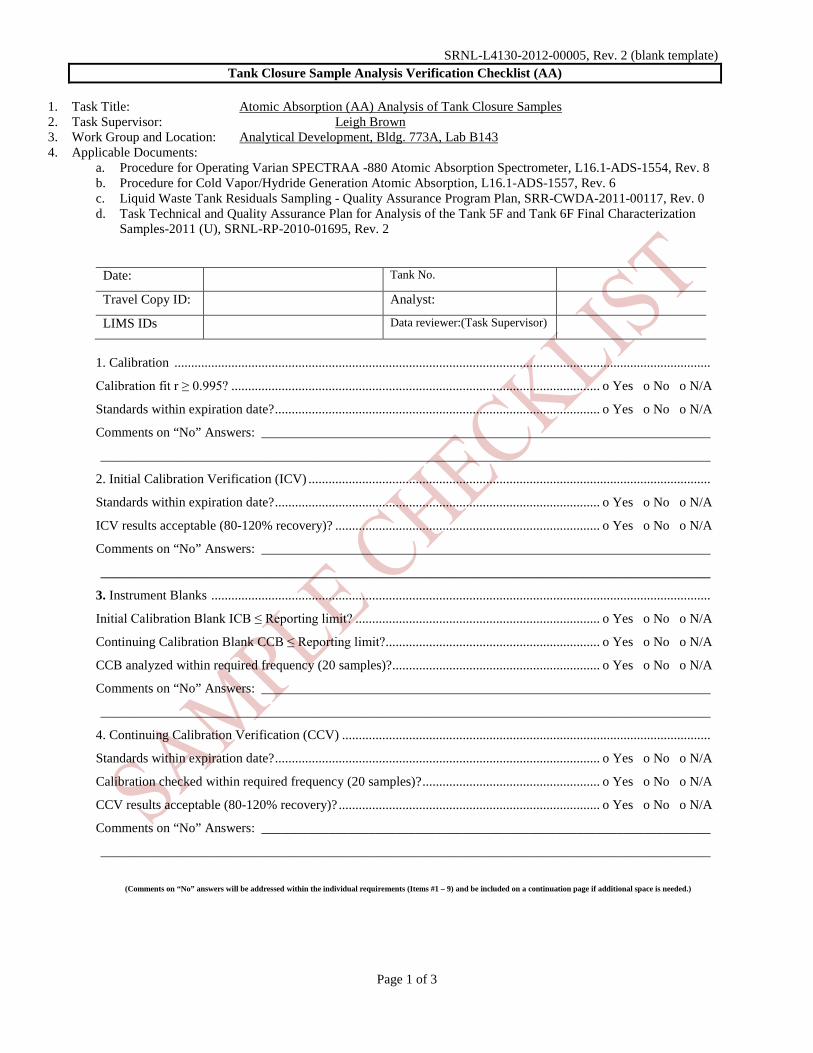
SRNL-L4130-2012-00005, Rev. 2 (blank template) Tank Closure Sample Analysis Verification Checklist (AA)
Page 1 of 3
1. Task Title: Atomic Absorption (AA) Analysis of Tank Closure Samples 2. Task Supervisor: Leigh Brown 3. Work Group and Location: Analytical Development, Bldg. 773A, Lab B143 4. Applicable Documents:
a. Procedure for Operating Varian SPECTRAA -880 Atomic Absorption Spectrometer, L16.1-ADS-1554, Rev. 8 b. Procedure for Cold Vapor/Hydride Generation Atomic Absorption, L16.1-ADS-1557, Rev. 6 c. Liquid Waste Tank Residuals Sampling - Quality Assurance Program Plan, SRR-CWDA-2011-00117, Rev. 0 d. Task Technical and Quality Assurance Plan for Analysis of the Tank 5F and Tank 6F Final Characterization
Samples-2011 (U), SRNL-RP-2010-01695, Rev. 2
Date: Tank No.
Travel Copy ID: Analyst:
LIMS IDs Data reviewer:(Task Supervisor)
1. Calibration ................................................................................................................................................................
Calibration fit r ≥ 0.995? .............................................................................................................. o Yes o No o N/A
Standards within expiration date? ................................................................................................. o Yes o No o N/A
Comments on “No” Answers: ___________________________________________________________________
___________________________________________________________________________________________
2. Initial Calibration Verification (ICV) ........................................................................................................................
Standards within expiration date? ................................................................................................. o Yes o No o N/A
ICV results acceptable (80-120% recovery)? ............................................................................... o Yes o No o N/A
Comments on “No” Answers: ___________________________________________________________________
___________________________________________________________________________________________
3. Instrument Blanks .....................................................................................................................................................
Initial Calibration Blank ICB ≤ Reporting limit? ......................................................................... o Yes o No o N/A
Continuing Calibration Blank CCB ≤ Reporting limit?................................................................ o Yes o No o N/A
CCB analyzed within required frequency (20 samples)? .............................................................. o Yes o No o N/A
Comments on “No” Answers: ___________________________________________________________________
___________________________________________________________________________________________
4. Continuing Calibration Verification (CCV) ..............................................................................................................
Standards within expiration date? ................................................................................................. o Yes o No o N/A
Calibration checked within required frequency (20 samples)? ..................................................... o Yes o No o N/A
CCV results acceptable (80-120% recovery)? .............................................................................. o Yes o No o N/A
Comments on “No” Answers: ___________________________________________________________________
___________________________________________________________________________________________
(Comments on “No” answers will be addressed within the individual requirements (Items #1 – 9) and be included on a continuation page if additional space is needed.)
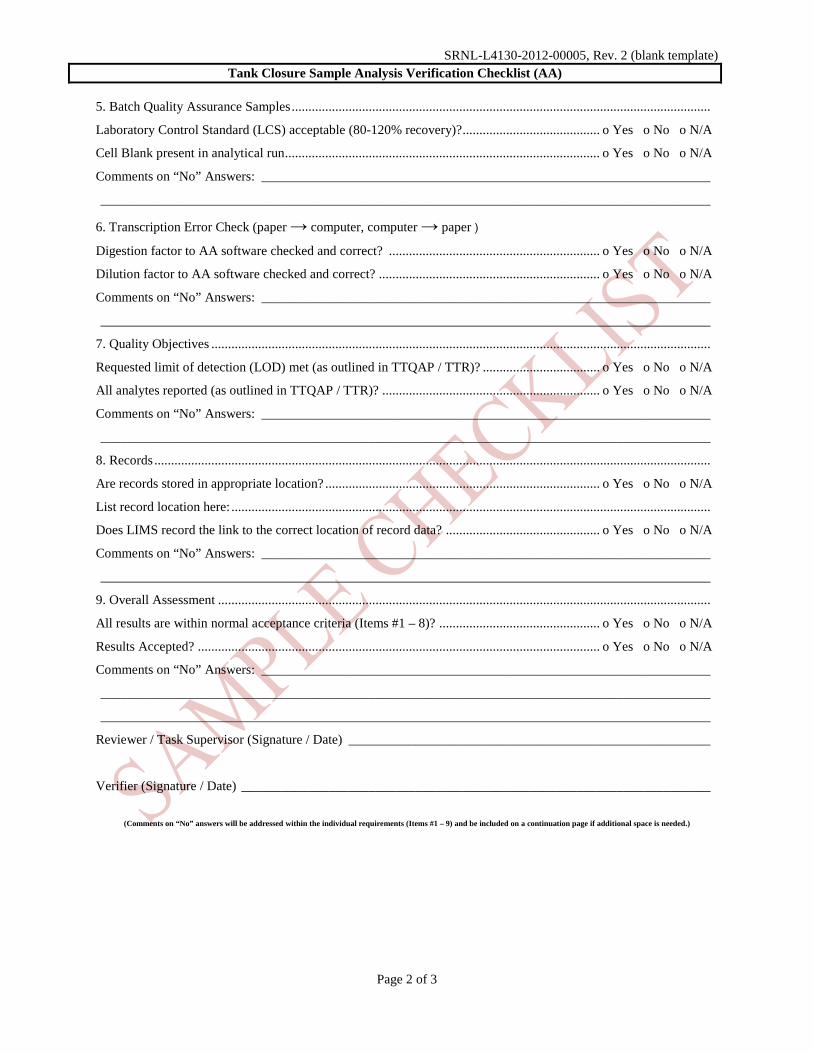
SRNL-L4130-2012-00005, Rev. 2 (blank template) Tank Closure Sample Analysis Verification Checklist (AA)
Page 2 of 3
5. Batch Quality Assurance Samples .............................................................................................................................
Laboratory Control Standard (LCS) acceptable (80-120% recovery)? ......................................... o Yes o No o N/A
Cell Blank present in analytical run .............................................................................................. o Yes o No o N/A
Comments on “No” Answers: ___________________________________________________________________
___________________________________________________________________________________________
6. Transcription Error Check (paper → computer, computer → paper )
Digestion factor to AA software checked and correct? ............................................................... o Yes o No o N/A
Dilution factor to AA software checked and correct? .................................................................. o Yes o No o N/A
Comments on “No” Answers: ___________________________________________________________________
___________________________________________________________________________________________
7. Quality Objectives .....................................................................................................................................................
Requested limit of detection (LOD) met (as outlined in TTQAP / TTR)? ................................... o Yes o No o N/A
All analytes reported (as outlined in TTQAP / TTR)? ................................................................. o Yes o No o N/A
Comments on “No” Answers: ___________________________________________________________________
___________________________________________________________________________________________
8. Records ......................................................................................................................................................................
Are records stored in appropriate location? .................................................................................. o Yes o No o N/A
List record location here: ...............................................................................................................................................
Does LIMS record the link to the correct location of record data? .............................................. o Yes o No o N/A
Comments on “No” Answers: ___________________________________________________________________
___________________________________________________________________________________________
9. Overall Assessment ...................................................................................................................................................
All results are within normal acceptance criteria (Items #1 – 8)? ................................................ o Yes o No o N/A
Results Accepted? ........................................................................................................................ o Yes o No o N/A
Comments on “No” Answers: ___________________________________________________________________
___________________________________________________________________________________________
___________________________________________________________________________________________
Reviewer / Task Supervisor (Signature / Date) ______________________________________________________
Verifier (Signature / Date) ______________________________________________________________________
(Comments on “No” answers will be addressed within the individual requirements (Items #1 – 9) and be included on a continuation page if additional space is needed.)
SRNL-L4130-2012-00005, Rev. 2 (blank template) Tank Closure Sample Analysis Verification Checklist (AA)
Page 3 of 3
Continuation Page:

Liquid Waste Tank Residuals Sampling- SRR-CWDA-2011-00117 Quality Assurance Program Plan Revision 1 July 2013
Page A.4-1 of A.4-9
ATTACHMENT 4
RECORDS COMPLETENESS CHECKLISTS
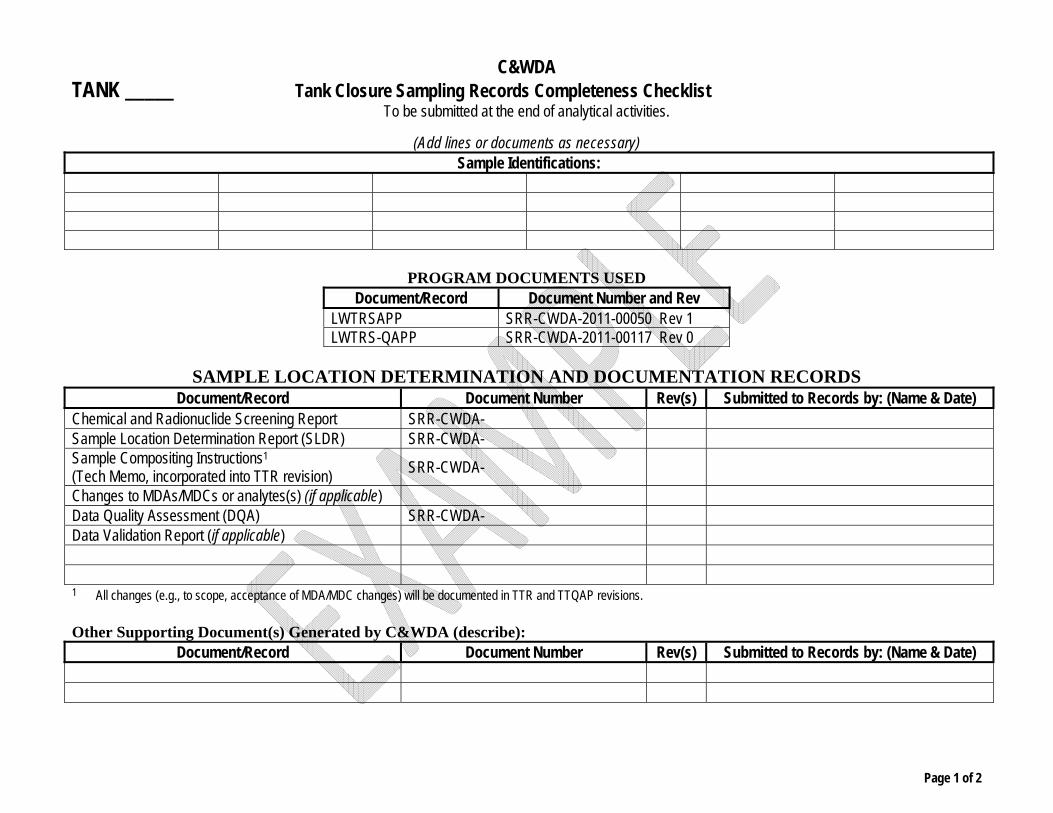
C&WDA
TANK _____ Tank Closure Sampling Records Completeness Checklist To be submitted at the end of analytical activities.
Page 1 of 2
(Add lines or documents as necessary) Sample Identifications:
PROGRAM DOCUMENTS USED Document/Record Document Number and Rev
LWTRSAPP SRR-CWDA-2011-00050 Rev 1 LWTRS-QAPP SRR-CWDA-2011-00117 Rev 0
SAMPLE LOCATION DETERMINATION AND DOCUMENTATION RECORDS
Document/Record Document Number Rev(s) Submitted to Records by: (Name & Date) Chemical and Radionuclide Screening Report SRR-CWDA- Sample Location Determination Report (SLDR) SRR-CWDA- Sample Compositing Instructions1
(Tech Memo, incorporated into TTR revision) SRR-CWDA-
Changes to MDAs/MDCs or analytes(s) (if applicable) Data Quality Assessment (DQA) SRR-CWDA- Data Validation Report (if applicable) 1 All changes (e.g., to scope, acceptance of MDA/MDC changes) will be documented in TTR and TTQAP revisions. Other Supporting Document(s) Generated by C&WDA (describe):
Document/Record Document Number Rev(s) Submitted to Records by: (Name & Date)
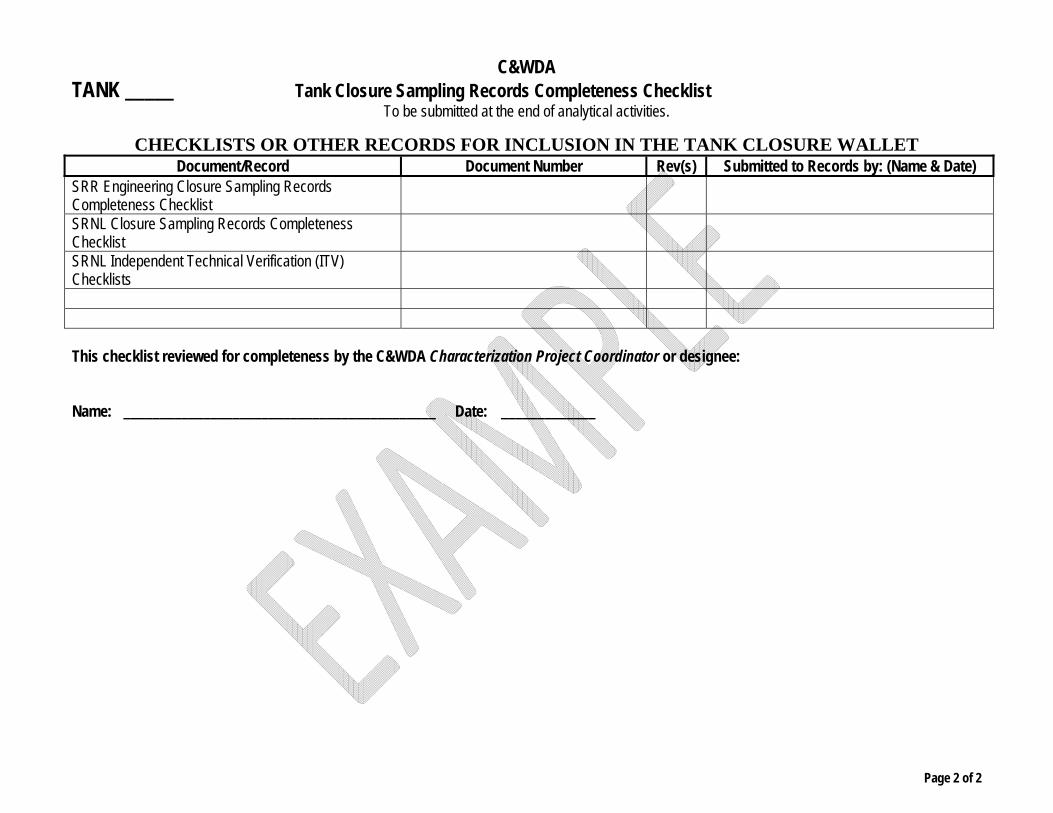
C&WDA
TANK _____ Tank Closure Sampling Records Completeness Checklist To be submitted at the end of analytical activities.
Page 2 of 2
CHECKLISTS OR OTHER RECORDS FOR INCLUSION IN THE TANK CLOSURE WALLET Document/Record Document Number Rev(s) Submitted to Records by: (Name & Date)
SRR Engineering Closure Sampling Records Completeness Checklist
SRNL Closure Sampling Records Completeness Checklist
SRNL Independent Technical Verification (ITV) Checklists
This checklist reviewed for completeness by the C&WDA Characterization Project Coordinator or designee: Name: ___________________________________________ Date: _____________
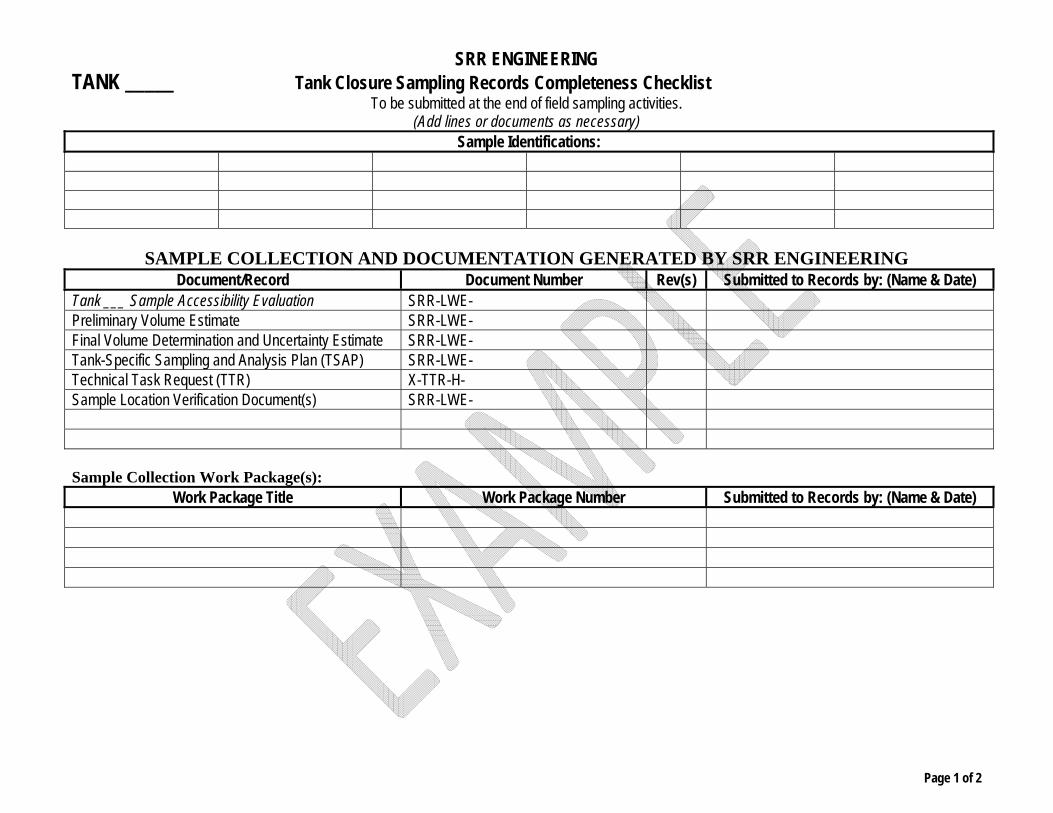
SRR ENGINEERING TANK _____ Tank Closure Sampling Records Completeness Checklist
To be submitted at the end of field sampling activities.
Page 1 of 2
(Add lines or documents as necessary) Sample Identifications:
SAMPLE COLLECTION AND DOCUMENTATION GENERATED BY SRR ENGINEERING
Document/Record Document Number Rev(s) Submitted to Records by: (Name & Date) Tank ___ Sample Accessibility Evaluation SRR-LWE- Preliminary Volume Estimate SRR-LWE- Final Volume Determination and Uncertainty Estimate SRR-LWE- Tank-Specific Sampling and Analysis Plan (TSAP) SRR-LWE- Technical Task Request (TTR) X-TTR-H- Sample Location Verification Document(s) SRR-LWE-
Sample Collection Work Package(s):
Work Package Title Work Package Number Submitted to Records by: (Name & Date)
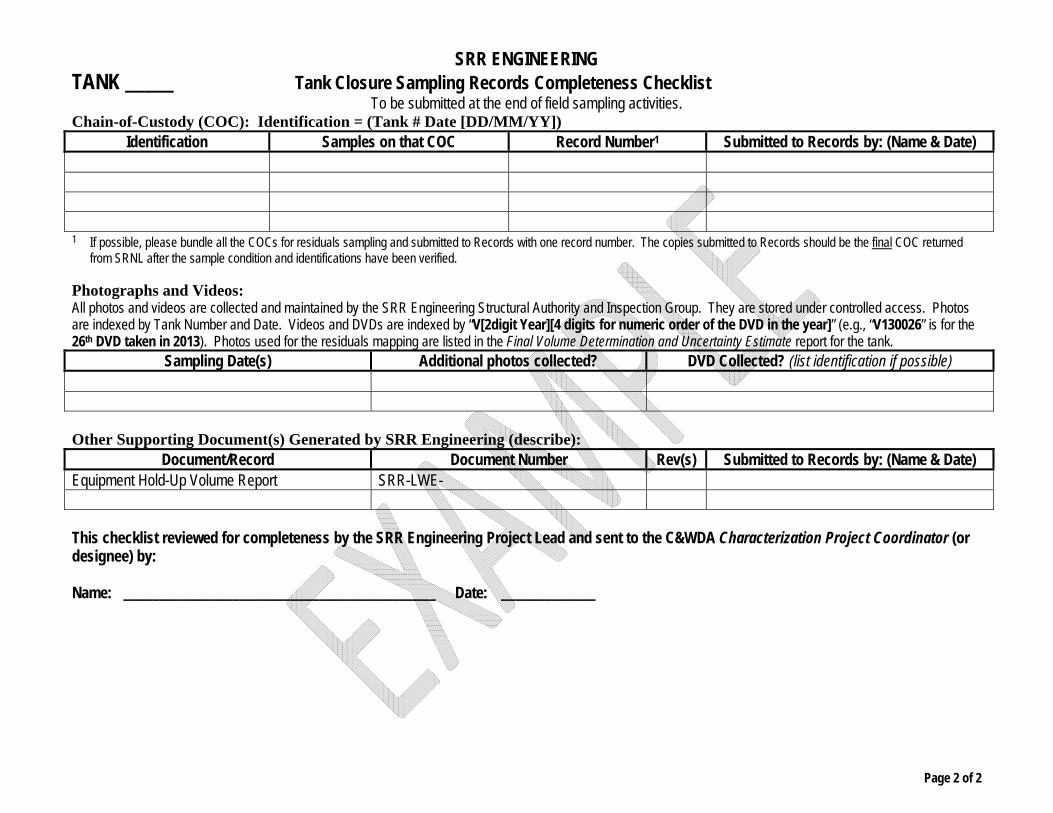
SRR ENGINEERING TANK _____ Tank Closure Sampling Records Completeness Checklist
To be submitted at the end of field sampling activities.
Page 2 of 2
Chain-of-Custody (COC): Identification = (Tank # Date [DD/MM/YY]) Identification Samples on that COC Record Number1 Submitted to Records by: (Name & Date)
1 If possible, please bundle all the COCs for residuals sampling and submitted to Records with one record number. The copies submitted to Records should be the final COC returned
from SRNL after the sample condition and identifications have been verified. Photographs and Videos: All photos and videos are collected and maintained by the SRR Engineering Structural Authority and Inspection Group. They are stored under controlled access. Photos are indexed by Tank Number and Date. Videos and DVDs are indexed by “V[2digit Year][4 digits for numeric order of the DVD in the year]” (e.g., “V130026” is for the 26th DVD taken in 2013). Photos used for the residuals mapping are listed in the Final Volume Determination and Uncertainty Estimate report for the tank.
Sampling Date(s) Additional photos collected? DVD Collected? (list identification if possible) Other Supporting Document(s) Generated by SRR Engineering (describe):
Document/Record Document Number Rev(s) Submitted to Records by: (Name & Date) Equipment Hold-Up Volume Report SRR-LWE- This checklist reviewed for completeness by the SRR Engineering Project Lead and sent to the C&WDA Characterization Project Coordinator (or designee) by: Name: ___________________________________________ Date: _____________
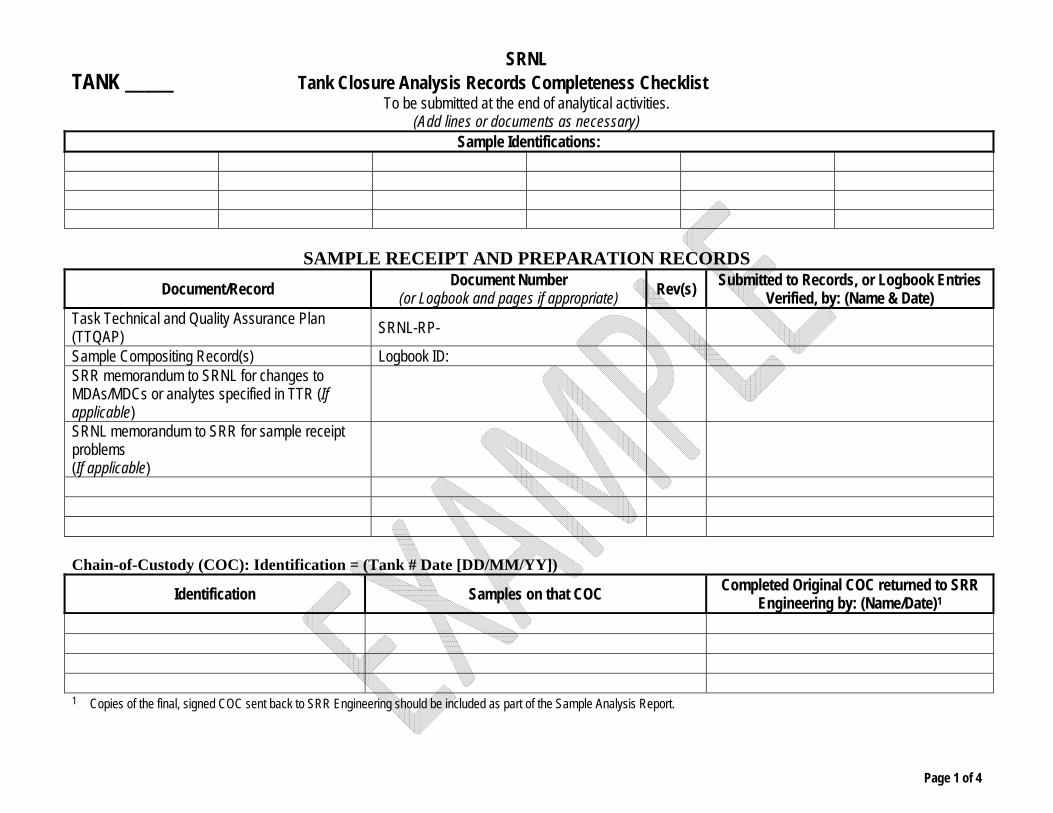
SRNL TANK _____ Tank Closure Analysis Records Completeness Checklist
To be submitted at the end of analytical activities.
Page 1 of 4
(Add lines or documents as necessary) Sample Identifications:
SAMPLE RECEIPT AND PREPARATION RECORDS
Document/Record Document Number (or Logbook and pages if appropriate) Rev(s) Submitted to Records, or Logbook Entries
Verified, by: (Name & Date) Task Technical and Quality Assurance Plan (TTQAP) SRNL-RP-
Sample Compositing Record(s) Logbook ID: SRR memorandum to SRNL for changes to MDAs/MDCs or analytes specified in TTR (If applicable)
SRNL memorandum to SRR for sample receipt problems (If applicable)
Chain-of-Custody (COC): Identification = (Tank # Date [DD/MM/YY])
Identification Samples on that COC Completed Original COC returned to SRR Engineering by: (Name/Date)1
1 Copies of the final, signed COC sent back to SRR Engineering should be included as part of the Sample Analysis Report.
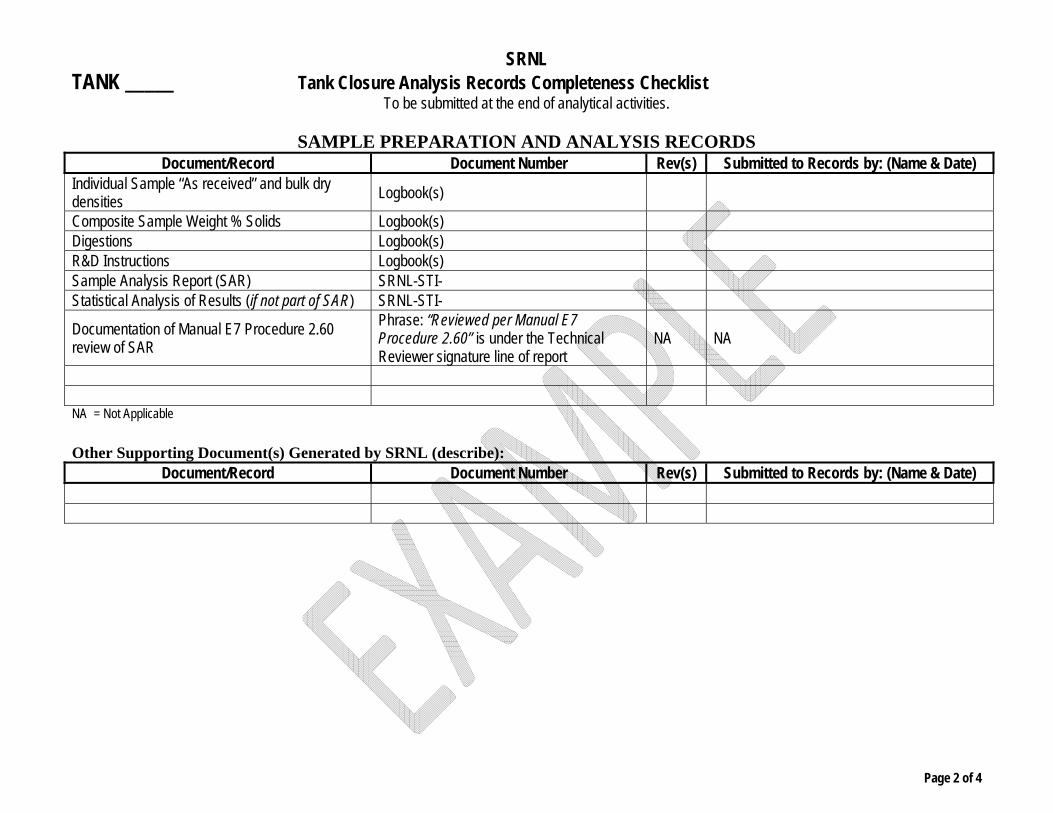
SRNL TANK _____ Tank Closure Analysis Records Completeness Checklist
To be submitted at the end of analytical activities.
Page 2 of 4
SAMPLE PREPARATION AND ANALYSIS RECORDS
Document/Record Document Number Rev(s) Submitted to Records by: (Name & Date) Individual Sample “As received” and bulk dry densities Logbook(s)
Composite Sample Weight % Solids Logbook(s) Digestions Logbook(s) R&D Instructions Logbook(s) Sample Analysis Report (SAR) SRNL-STI- Statistical Analysis of Results (if not part of SAR) SRNL-STI-
Documentation of Manual E7 Procedure 2.60 review of SAR
Phrase: “Reviewed per Manual E7 Procedure 2.60” is under the Technical Reviewer signature line of report
NA NA
NA = Not Applicable Other Supporting Document(s) Generated by SRNL (describe):
Document/Record Document Number Rev(s) Submitted to Records by: (Name & Date)
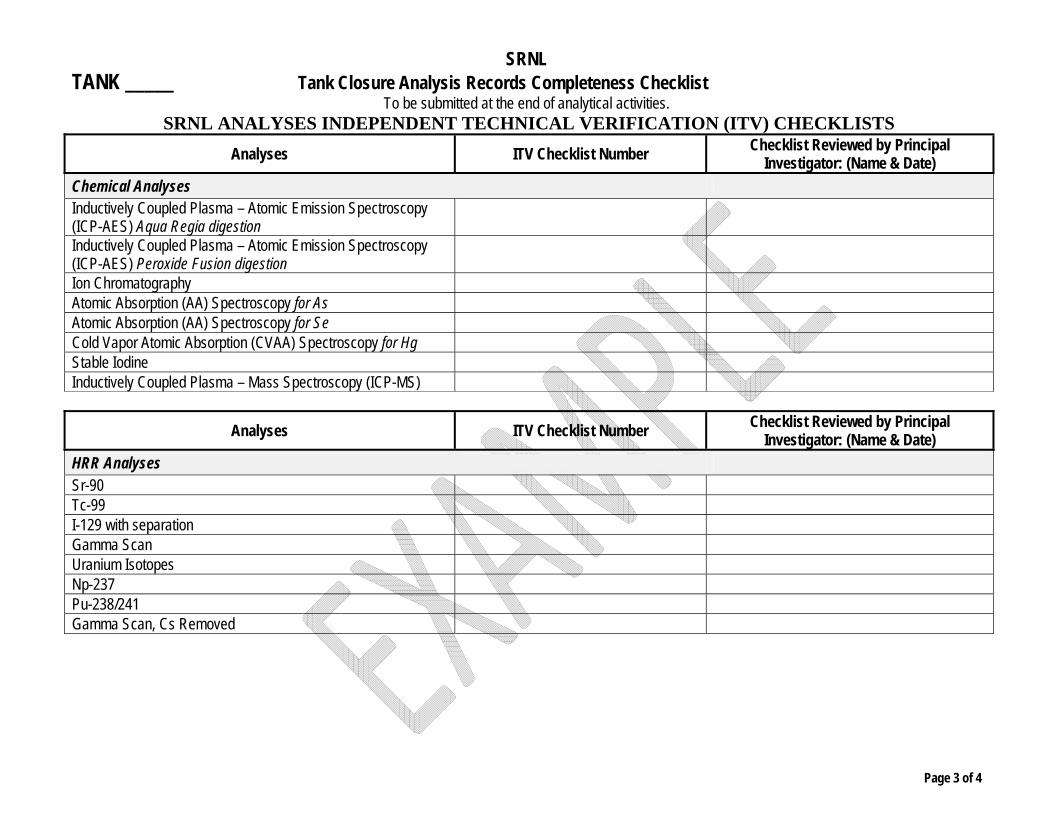
SRNL TANK _____ Tank Closure Analysis Records Completeness Checklist
To be submitted at the end of analytical activities.
Page 3 of 4
SRNL ANALYSES INDEPENDENT TECHNICAL VERIFICATION (ITV) CHECKLISTS
Analyses ITV Checklist Number Checklist Reviewed by Principal Investigator: (Name & Date)
Chemical Analyses Inductively Coupled Plasma – Atomic Emission Spectroscopy (ICP-AES) Aqua Regia digestion
Inductively Coupled Plasma – Atomic Emission Spectroscopy (ICP-AES) Peroxide Fusion digestion
Ion Chromatography Atomic Absorption (AA) Spectroscopy for As Atomic Absorption (AA) Spectroscopy for Se Cold Vapor Atomic Absorption (CVAA) Spectroscopy for Hg Stable Iodine Inductively Coupled Plasma – Mass Spectroscopy (ICP-MS)
Analyses ITV Checklist Number Checklist Reviewed by Principal Investigator: (Name & Date)
HRR Analyses Sr-90 Tc-99 I-129 with separation Gamma Scan Uranium Isotopes Np-237 Pu-238/241 Gamma Scan, Cs Removed
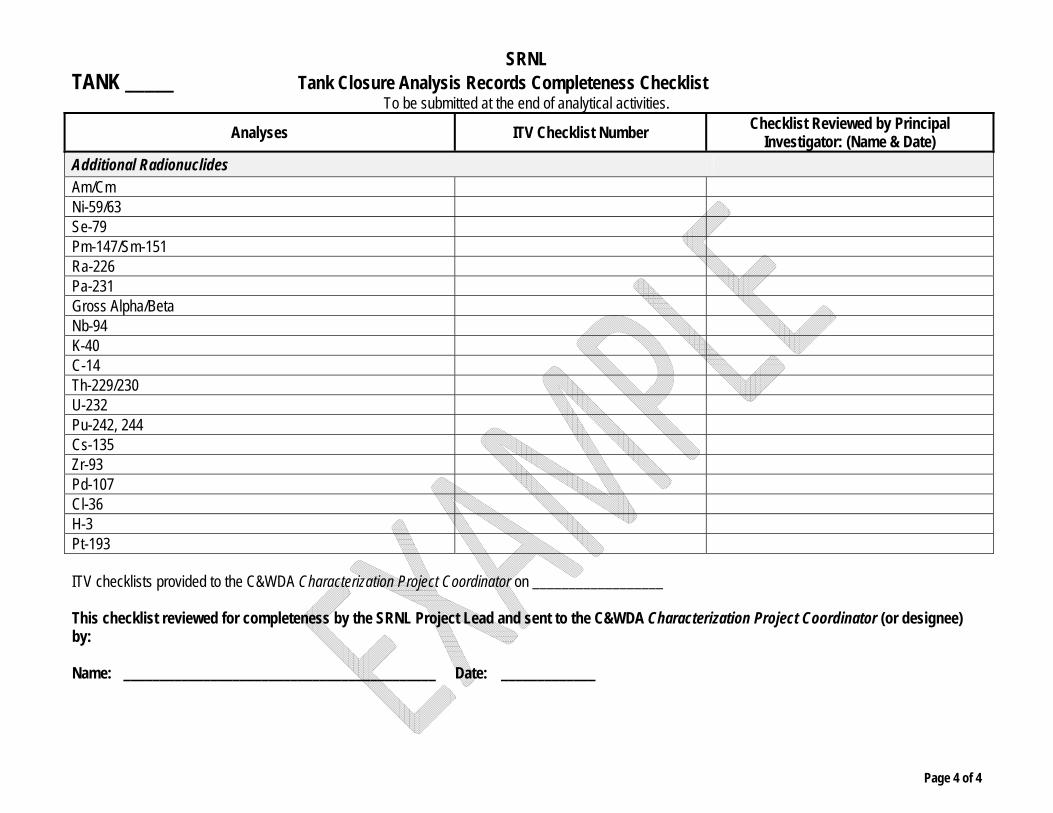
SRNL TANK _____ Tank Closure Analysis Records Completeness Checklist
To be submitted at the end of analytical activities.
Page 4 of 4
Analyses ITV Checklist Number Checklist Reviewed by Principal Investigator: (Name & Date)
Additional Radionuclides Am/Cm Ni-59/63 Se-79 Pm-147/Sm-151 Ra-226 Pa-231 Gross Alpha/Beta Nb-94 K-40 C-14 Th-229/230 U-232 Pu-242, 244 Cs-135 Zr-93 Pd-107 Cl-36 H-3 Pt-193 ITV checklists provided to the C&WDA Characterization Project Coordinator on __________________ This checklist reviewed for completeness by the SRNL Project Lead and sent to the C&WDA Characterization Project Coordinator (or designee) by: Name: ___________________________________________ Date: _____________
Liquid Waste Tank Residuals Sampling- SRR-CWDA-2011-00117 Quality Assurance Program Plan Revision 1 July 2013
Page A.5-1 of A.5-1
ATTACHMENT 5
DATA VALIDATION PROTOCOLS AND CHECKLISTS
To Be Determined