Embed Size (px)
Citation preview
RURAL DEVELOPMENT INSTITUTE
LIST OF DATABASES
LIST OF DATABASES
Rural Development Institute, Brandon University
Brandon University established the Rural Development Institute in 1989 as an academic research centre and a leading source of information on issues affecting rural communities in Western Canada and elsewhere.
RDI functions as a not-for-profit research and development organization designed to promote, facilitate, coordinate, initiate and conduct multi-disciplinary academic and applied research on rural issues. The Institute provides an interface between academic research efforts and the community by acting as a conduit of rural research information and by facilitating community involvement in rural development. RDI projects are characterized by cooperative and collaborative efforts of multi-stakeholders.
The Institute has diverse research affiliations, and multiple community and government linkages related to its rural development mandate. RDI disseminates information to a variety of constituents and stakeholders and makes research information and results widely available to the public either in printed form or by means of public lectures, seminars, workshops and conferences.
For more information, please visit www.brandonu.ca/rdi.
Copyright © May 2017
Prepared by:
Michael Adiyia, MRDWilliam Ashton, PhD, DirectorRural Development Institute Brandon University
III
Table of ContentsIntroduction 1
Health Databases 2
• OECDHealthStatistics2016
• HealthStatusofFirstNationsOn-ReserveinAtlanticCanada2015
Quality of Life Databases 2
• QualityofLifeIndexforCountry2017
• HLI:OECD’sHow’sLife?Index
• ChildWell-BeinginRichCountries:AComparativeOverview
• SocialProgressIndex2016
• CanadianIndexofWellbeing
• TheCommunityWell-Being(CWB)Index
• The2016DistressedCommunitiesIndex
AnAnalysisofCommunityWell-BeingAcrosstheUnitedStates
•WorldWealthandIncomeDatabase(TheWorldInequityLab)
• EuropeanQualityofLifeandOtherDatasetsfromEurofound
Resilience Database 5
• 2016FMGlobalResilienceIndex
Economic Databases 6
•MainEconomicIndicators,Volume2016Issue11
TheGlobalCompetitivenessReport2015–2016
• EuropeanEconomicSustainabilityIndex(EESI)
• ConsumerPriceIndex(CPI)
Climate Change Databases 7
• NationalClimatePoliciesinInternationalComparison
• ClimatePoliciesintheEUandUSA
• ClimateChangePerformanceIndex
IV
LIST OF DATABASES
Environment Databases 7
• OECDKeyEnvironmentalIndicators2008
• TheEnvironmentalSustainabilityIndex(ESI)
Infrastructure Databases 9
• ThirdGlobalInfrastructureInvestmentIndex2016
• SurveyofMiningCompanies
Migration Database 10
•MIPEX:MigrantIntegrationPolicyIndex
• KeyStatisticsonMigrationinOECDCountries
Other Databases 10
• RuralDevelopmentReport2016
• TheEuropeanSocialSurvey(ESS)
• EurostatDatabases
References 10
1
Too often the challenge is finding quality data to analyze. Data is especially important for the Rural Policy Learning Commons which is encouraging comparisons to inform and improve rural and remote communities and economies. This report is a directory of data bases assembled to help researchers, policy analysts, practitioners, businesses, and community members to make comparisons. Comparisons of one situation with another can help bench mark a situation and enhance knowledge and inform public policies. In some situations the comparison is based on a particular geographic unit with another, be it towns, regions, countries, or continents (Pennings et al., 1999). Comparisons can address many subjects, such as health, education and the economy. Comparative research is a broad term encompassing quantitative and qualitative analyses and helps discover similarities and contrasts that sharpen our powers of description and understanding (Mills, Van de Bunt and Bruijn, 2006; Collier, 1993). Comparisons are conducted across political, social, cultural, historical, and environmental regimes, and it is here where the differences in the data and results are nuanced and insights gained.
This report connects you to databases on such topics as health, environment, quality of life, economics, resilience and others which can be used in comparative analysis. The databases listed mainly covers comparisons in countries in North America and Europe, OECD countries and other parts of the world.
As students, this directory to databases is a quick resource to bring focus to your research and provide some assurance data exists. However, it is neither a comprehensive collection nor an exhaustive one; rather this director severs to illustrate the range of topics and data for comparisons while being accessible at no charge, (at the time of this printing). We hope others will be added to this directory over time and will be posted.
Introduction
If you have other databased to add to this directory, send them along with a short description and let us know how you used the database.
Dr. Bill Ashton, MCIP, Director, Rural Development Institute, Brandon University, Brandon, MB [email protected]
NOTE: ADDITIONAL DATABASES
2
LIST OF DATABASES
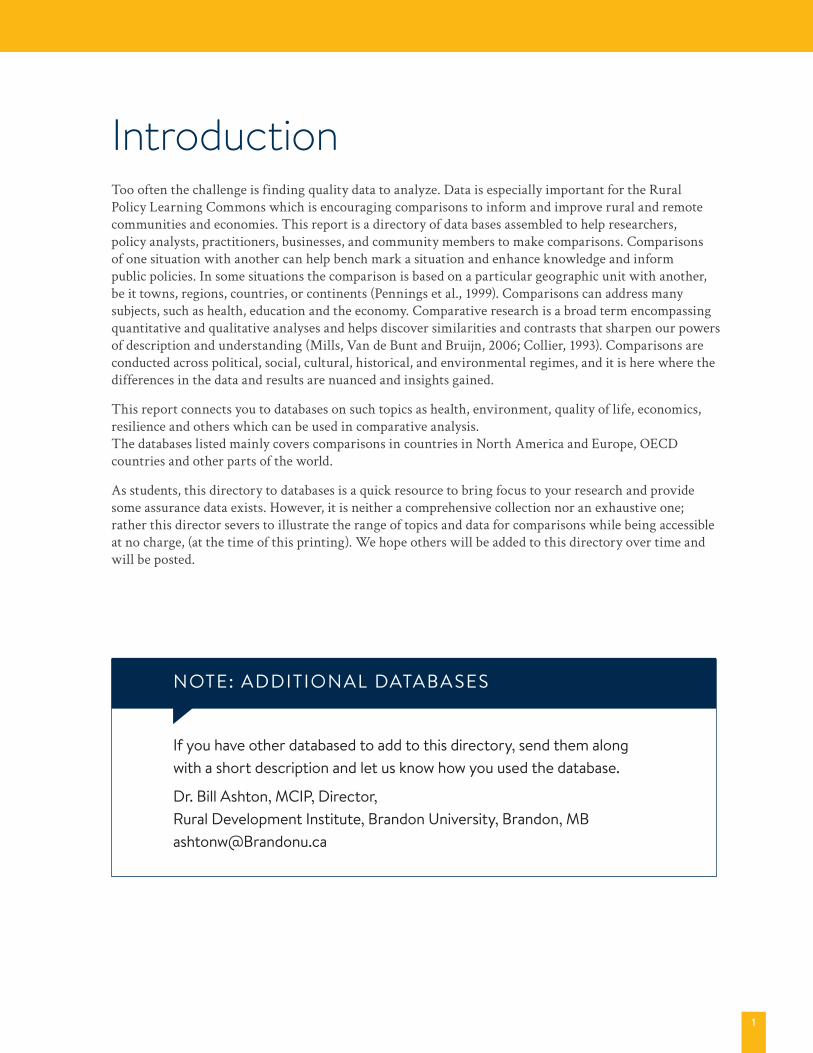
Health Databases OECD Health Statistics 2016The OECD Health Database provides the most comprehensive source of comparable statistics on health and health systems across OECD countries. It is an essential tool to carry out comparative analyses and draw lessons from international comparisons of diverse health systems. The variables of health provided include health expenditure and financing, health status, health care resources, social protection and others. The time period for the comparison starts from 2000 to 2014 for all OECD countries.
E.g.Intheyear2009,Canadahadabout313,431nurses-anincreasefrom304,424in2008whileAustraliahadabout
220,814in2009–anincreasefrom218,928in2008
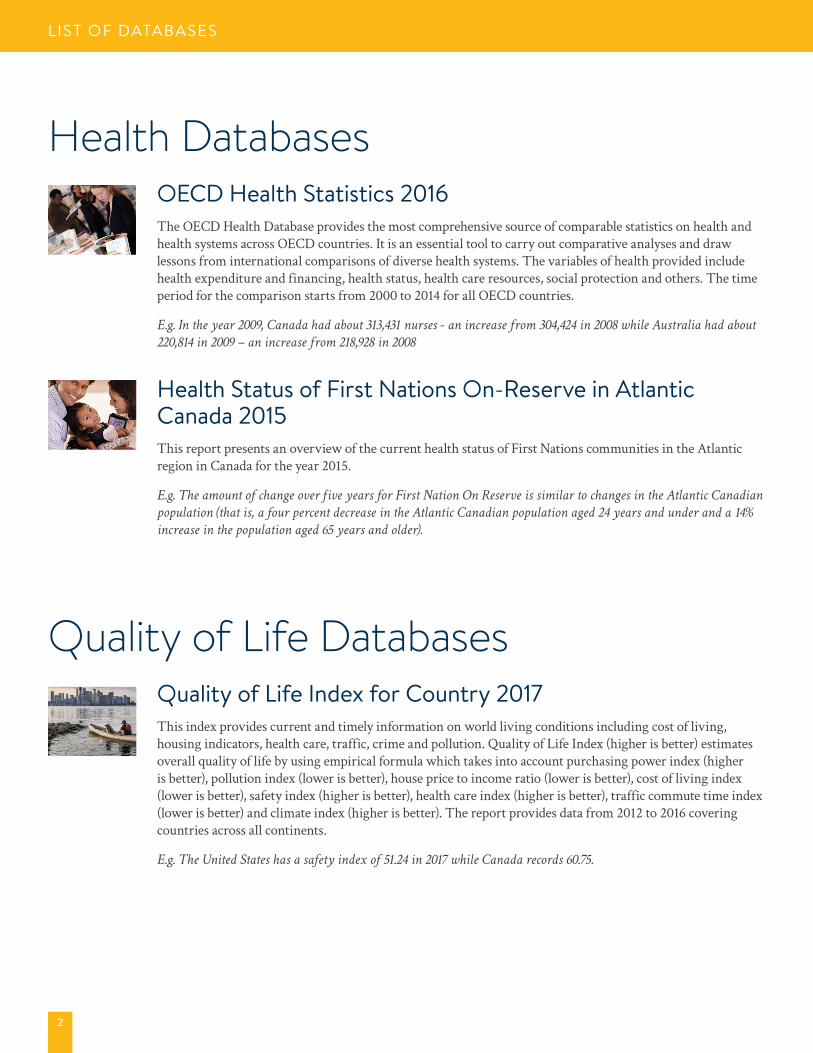
Health Status of First Nations On-Reserve in Atlantic Canada 2015This report presents an overview of the current health status of First Nations communities in the Atlantic region in Canada for the year 2015.
E.g.TheamountofchangeoverfiveyearsforFirstNationOnReserveissimilartochangesintheAtlanticCanadian
population(thatis,afourpercentdecreaseintheAtlanticCanadianpopulationaged24yearsandunderanda14%
increaseinthepopulationaged65yearsandolder).
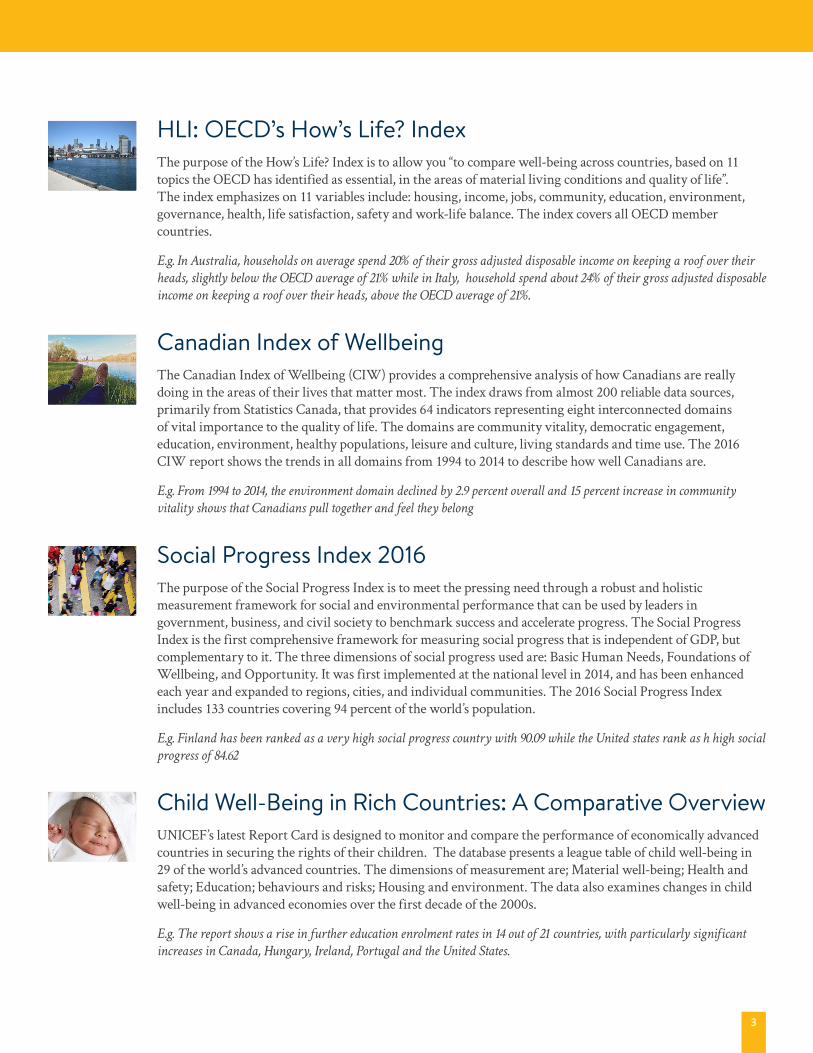
Quality of Life DatabasesQuality of Life Index for Country 2017This index provides current and timely information on world living conditions including cost of living, housing indicators, health care, traffic, crime and pollution. Quality of Life Index (higher is better) estimates overall quality of life by using empirical formula which takes into account purchasing power index (higher is better), pollution index (lower is better), house price to income ratio (lower is better), cost of living index (lower is better), safety index (higher is better), health care index (higher is better), traffic commute time index (lower is better) and climate index (higher is better). The report provides data from 2012 to 2016 covering countries across all continents.
E.g.TheUnitedStateshasasafetyindexof51.24in2017whileCanadarecords60.75.
3
HLI: OECD’s How’s Life? IndexThe purpose of the How’s Life? Index is to allow you “to compare well-being across countries, based on 11 topics the OECD has identified as essential, in the areas of material living conditions and quality of life”. The index emphasizes on 11 variables include: housing, income, jobs, community, education, environment, governance, health, life satisfaction, safety and work-life balance. The index covers all OECD member countries.
E.g.InAustralia,householdsonaveragespend20%oftheirgrossadjusteddisposableincomeonkeepingaroofovertheir
heads,slightlybelowtheOECDaverageof21%whileinItaly,householdspendabout24%oftheirgrossadjusteddisposable
incomeonkeepingaroofovertheirheads,abovetheOECDaverageof21%.
Canadian Index of Wellbeing The Canadian Index of Wellbeing (CIW) provides a comprehensive analysis of how Canadians are really doing in the areas of their lives that matter most. The index draws from almost 200 reliable data sources, primarily from Statistics Canada, that provides 64 indicators representing eight interconnected domains of vital importance to the quality of life. The domains are community vitality, democratic engagement, education, environment, healthy populations, leisure and culture, living standards and time use. The 2016 CIW report shows the trends in all domains from 1994 to 2014 to describe how well Canadians are.
E.g.From1994to2014,theenvironmentdomaindeclinedby2.9percentoveralland15percentincreaseincommunity
vitalityshowsthatCanadianspulltogetherandfeeltheybelong
Social Progress Index 2016The purpose of the Social Progress Index is to meet the pressing need through a robust and holistic measurement framework for social and environmental performance that can be used by leaders in government, business, and civil society to benchmark success and accelerate progress. The Social Progress Index is the first comprehensive framework for measuring social progress that is independent of GDP, but complementary to it. The three dimensions of social progress used are: Basic Human Needs, Foundations of Wellbeing, and Opportunity. It was first implemented at the national level in 2014, and has been enhanced each year and expanded to regions, cities, and individual communities. The 2016 Social Progress Index includes 133 countries covering 94 percent of the world’s population.
E.g.Finlandhasbeenrankedasaveryhighsocialprogresscountrywith90.09whiletheUnitedstatesrankashhighsocial
progressof84.62
Child Well-Being in Rich Countries: A Comparative OverviewUNICEF’s latest Report Card is designed to monitor and compare the performance of economically advanced countries in securing the rights of their children. The database presents a league table of child well-being in 29 of the world’s advanced countries. The dimensions of measurement are; Material well-being; Health and safety; Education; behaviours and risks; Housing and environment. The data also examines changes in child well-being in advanced economies over the first decade of the 2000s.
E.g.Thereportshowsariseinfurthereducationenrolmentratesin14outof21countries,withparticularlysignificant
increasesinCanada,Hungary,Ireland,PortugalandtheUnitedStates.
4
LIST OF DATABASES
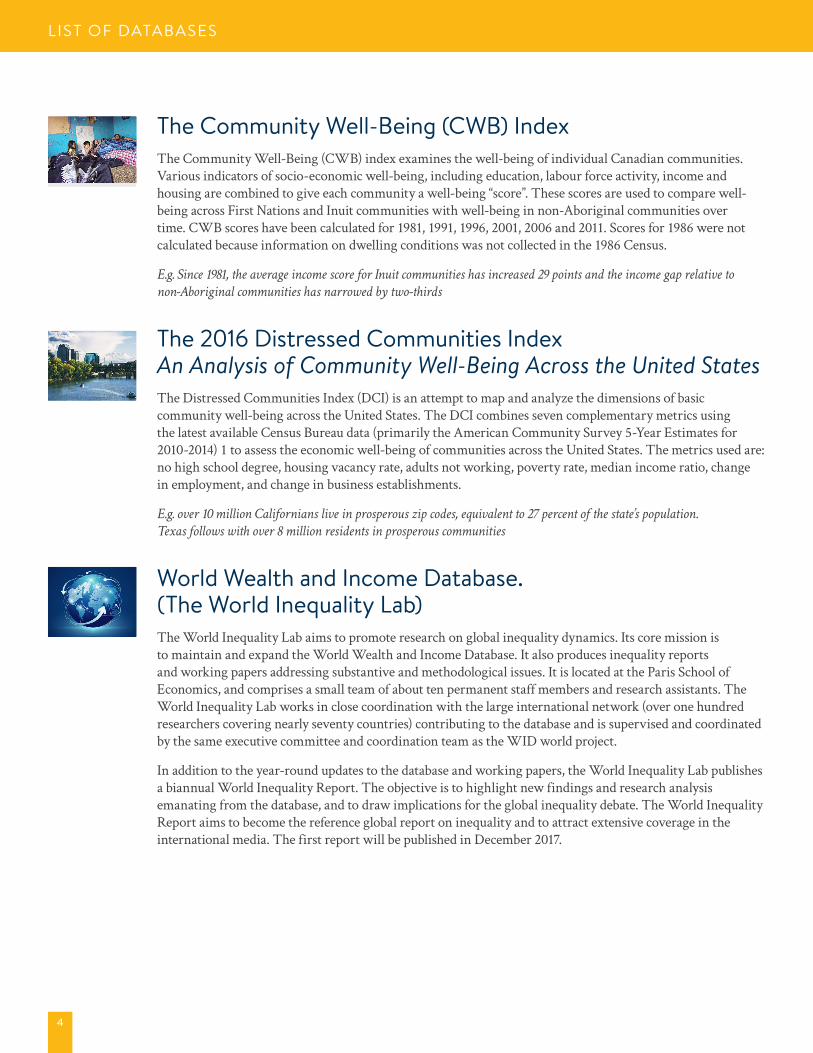
The Community Well-Being (CWB) IndexThe Community Well-Being (CWB) index examines the well-being of individual Canadian communities. Various indicators of socio-economic well-being, including education, labour force activity, income and housing are combined to give each community a well-being “score”. These scores are used to compare well-being across First Nations and Inuit communities with well-being in non-Aboriginal communities over time. CWB scores have been calculated for 1981, 1991, 1996, 2001, 2006 and 2011. Scores for 1986 were not calculated because information on dwelling conditions was not collected in the 1986 Census.
E.g.Since1981,theaverageincomescoreforInuitcommunitieshasincreased29pointsandtheincomegaprelativeto
non-Aboriginalcommunitieshasnarrowedbytwo-thirds
The 2016 Distressed Communities Index An Analysis of Community Well-Being Across the United StatesThe Distressed Communities Index (DCI) is an attempt to map and analyze the dimensions of basic community well-being across the United States. The DCI combines seven complementary metrics using the latest available Census Bureau data (primarily the American Community Survey 5-Year Estimates for 2010-2014) 1 to assess the economic well-being of communities across the United States. The metrics used are: no high school degree, housing vacancy rate, adults not working, poverty rate, median income ratio, change in employment, and change in business establishments.
E.g.over10millionCaliforniansliveinprosperouszipcodes,equivalentto27percentofthestate’spopulation.
Texasfollowswithover8millionresidentsinprosperouscommunities
World Wealth and Income Database. (The World Inequality Lab)The World Inequality Lab aims to promote research on global inequality dynamics. Its core mission is to maintain and expand the World Wealth and Income Database. It also produces inequality reports and working papers addressing substantive and methodological issues. It is located at the Paris School of Economics, and comprises a small team of about ten permanent staff members and research assistants. The World Inequality Lab works in close coordination with the large international network (over one hundred researchers covering nearly seventy countries) contributing to the database and is supervised and coordinated by the same executive committee and coordination team as the WID world project.
In addition to the year-round updates to the database and working papers, the World Inequality Lab publishes a biannual World Inequality Report. The objective is to highlight new findings and research analysis emanating from the database, and to draw implications for the global inequality debate. The World Inequality Report aims to become the reference global report on inequality and to attract extensive coverage in the international media. The first report will be published in December 2017.
5
European Quality of Life and other Datasets from EurofoundThe Eurofound datasets and accompanying materials are stored with the UK Data Service in Essex, UK and promoted online via their website. For access please see http://discover.ukdataservice.ac.uk/. The data is available free of charge to all those who intend to use it for non-commercial purposes. Requests for use for commercial purposes will be forwarded to Eurofound for authorisation.
In order to download the data, you must register with the UK Data Service via their website. If you are not from a UK university or college please request a UKDS user name at http://www.data-archive.ac.uk/sign-up/credentials-application or consult the page on how to access data. Once you are registered with the system the quickest way to find Eurofound data is to type in the words ‘European Foundation’ as the ‘Data Creator/Funder’ in the Catalogue search page. Once Eurofound’s surveys are listed then you can click on the name of the relevant survey for more information and download using your user name and password.
The latest datasets available are:
• new European Working Conditions Survey Integrated Data File, 1991-2015
• European Working Conditions Survey 2015
• European Company Survey 2013
• European Quality of Life Survey 2011/2012
• European Working Conditions Survey 2010
• European Company Survey 2009
Resilience Database2016 FM Global Resilience IndexResilience is the ability to withstand disruption and rebound quickly when necessary. It is especially vital for global companies doing business in a fluid, borderless manner, facing unknown risks in developing markets. The 2016 FM Global Resilience Index is designed to help you make better business decisions around the world. It employs fresh, newly updated data from authoritative sources to rank 130 countries and territories according to nine drivers that can make a business in those regions vulnerable. The indicators of resilience used include: Economic (GDP per capita, political risk, oil intensity), Risk quality (exposure to natural hazard, quality of natural hazard risk management, quality of fire management), Supply Chain (control of corruption, infrastructure, and local supplier quality).
E.g.BothFrance(ranked19)andtheUnitedKingdom(ranked20)retaintheirpositionsfromlastyear,whileGermany
(ranked4)improvesveryslightlybyrisingtwoplaces.
6
LIST OF DATABASES
Economic DatabasesMain Economic Indicators, Volume 2016 Issue 11 The monthly Main Economic Indicators (MEI) presents comparative statistics that provide an overview of recent international economic developments for the 35 OECD countries, the euro area and a number of non-member economies. The indicators cover a wide range of economic variables such as unemployment rate, GDP, international finance, business and consumer opinions among others over the period from 2014 to 2016.
E.g.UnemploymentrateintheUnitedStatesin2015was5.3%adecreasefrom6.2%in2014whilethatofGermanyis4.6%
in2015,adecreasefrom5%in2014
The Global Competitiveness Report 2015–2016The Global Competitiveness Report 2015-2016 assesses the competitiveness landscape of 140 economies, providing insight into the drivers of their productivity and prosperity. The Index presents a framework and a corresponding set of indicators in three principal policy domains (Basic requirements, Efficiency enhancers, and Innovation and sophistication factors) and twelve sub-domains (sub-pillars). The sub-domains include institutions, infrastructure, Macroeconomic environment, Health and primary education, Higher education and training, Goods market efficiency, Labor market efficiency, Financial market development, Technological readiness, Market size, Business sophistication and Innovation. The report provides a comparison of 140 countries in the year 2014.
E.g.Canadascores5.8(outof7)onbasicrequirementswhiletheUnitedStatesscores5.3(outof7).
European Economic Sustainability Index (EESI)The European Policy Centre has developed an index to assess simultaneously the short-, medium- and long-term economic sustainability of EU countries relative to each other. This index is constructed using six domains: deficits, national debt, growth, competitiveness, governance/corruption and cost of ageing. The index covers comparison in year 2007 and 2010 to assess the economic sustainability of Europe’s economies.
E.g.Costofageing:Luxembourgistheworstperformer,withGreeceonlyverymarginallybetter.
Sloveniaalsoperformsbadly.AtthetopareLatvia,EstoniaandPoland.
Consumer Price Index (CPI)The Consumer Price Index (CPI) measures the rate of price change for goods and services bought by Canadian consumers. It is obtained by comparing, over time, the cost of a fixed basket of goods and services purchased by consumers. Since the basket contains goods and services of unchanging or equivalent quantity and quality, the index reflects only pure price change. The target population of the CPI consists of families and individuals living in urban and rural private households in Canada. The eight components or variables in the CPI include: food; shelter; Household operations and furnishings; clothing and footwear; transportation; health and personal care; recreation, education and reading; alcoholic beverages and tobacco products. The data is presented monthly from year 2000 to 2016.
E.g.TheConsumerPriceIndex(CPI)rose2.1%onayear-over-yearbasisinJanuary,followinga1.5%gaininDecember.
Also,excludinggasoline,theCPIwasup1.5%yearoveryearinJanuary,afterpostinga1.4%increaseinDecember.
7
Climate Change DatabasesNational Climate Policies in International Comparison: The Climate Change Cooperation IndexThis index measures countries’ climate policy performance for policy-making and analytical purposes. The Climate Change Cooperation Index (C3-I) captures overall performance as well as performance in terms of political behavior (output) and emissions (outcome). The C3-I, thus, allows for a systematic global comparison of countries’ climate policies. The paper also compares the C3-I with its most relevant alternative, the Climate Change Performance Index (CCPI) by Germanwatch. The authors contribute to this end by introducing a new dataset that offers such information for up to 172 countries for the time period 1996–2008.
Climate Policies in the EU and USAThis briefing surveys the climate policies of the European Union and the United States and identifies both similarities and differences in their respective positions. Comparisons include policies and targets from 1990 to 2015.
E.g.EUMemberStateshavepledgedmorethanUS$4.7billionfortheGreenClimateFund.
TheUSAhaspledgedUS$3billion,butCongresshasnotyetapprovedpayment.
Climate Change Performance IndexThe Climate Change Performance Index (CCPI) evaluates climate protection performance of 58 countries, responsible for over 90% of global energy-related CO2 emissions and enhances transparency in international climate politics. Its aim is to put political and social pressure on those countries which have, up until now, failed to take ambitious action on climate protection. It also aims to highlight those countries with best practice climate policies. The evaluations are based on indicators of emissions, efficiency, renewable energy and national and international climate policy assessments. This report provides the results for the year 2017.
E.g.TheUnitedStatesbeingtheworld’ssecondlargestemitter;CO2percapitaemissionshavebeenfallingsincethe
economicrecessionin2007buthaveexperiencedaslightupturnin2014
Environment DatabasesOECD Key Environmental Indicators 2008The purpose of this indicator is to provide a cost-effective and powerful tool for tracking and charting environmental progress and measuring environmental performance through the use of a selection of agreed environmental indicators. The indicators used are: climate change, ozone layer, air quality, waste generation, biodiversity, energy resources, fish resources, freshwater resources, fresh water quality and forest resources. The report was produced in 2008 and provides trend analysis from 1980/1980 to 2005 for all OECD countries.
E.g.Duringthe1990s,energyintensityperunitofGDPhasgenerallydecreasedintheOECD,butataslowerpace
thanduringthe1980s.Whileinthefirsthalfofthe1990s,energyintensitydidnotimproveinmostcountries,dueto
decreasingpricesforenergyresources(oil,gas,etc.)
8
LIST OF DATABASES
The Environmental Sustainability Index (ESI) The Environmental Sustainability Index (ESI) seeks to create a comparative index of national-level environmental sustainability and to provide a mechanism for making environmental management more quantitative, empirically grounded and systematic. The index provides a composite profile of national environmental stewardship based on a compilation of 21 indicators derived from five underlying datasets. The broad indicators include; environmental systems, global stewardship, social and institutional capacity, reducing human vulnerability, reducing environmental stresses. The comparatives range from the years 1980 to 2000 developed for 146 countries.
*This index requires users to register free of charge to access data.
E.g.NorwayhasanESIscoreof73.4andrankssecondwhileCanadascores64.4rankingfifth.
Environmental Vulnerability IndexThe Environmental Vulnerability Index report provides a summary of list of databases on main environmental, vulnerability and sustainability indices and indicators currently under development worldwide. These indicators report observed values for a country in relation to the worldwide range or are based on policy. Few of the indicators developed are expressed in relation to area, with most being expressed as changes through time or on a per capita basis. The databases provided are listed as follows:
• Environmental Indicators – National State of the Environment Reporting – Australia
• ANZECC - Core Environmental Indicators for Reporting State of the Environment
• South Africa - State of Environment Indicators
• United Kingdom - State of Environment Indicators
• Treaties (Stratospheric Ozone Depletion, Biological Diversity, Global Climate Change and Trade and Environment), Environmental Indicators and National Responses
• Index of Leading Environmental Indicators
• Water Poverty Index (WPI)
• Pesticide Impact Ranking Index – PIRI
• Index of Watershed Indicators – IWI
• Reefs at Risk – Map-based Indicator of Threats to the World’s Coral Reefs
• Living Planet Report
• Ecological Footprint – Revisiting Carrying Capacity: Area-Based Indicators of Sustainability
• OECD State of Environment Indicators
• Well-being of Nations / Barometer of Sustainability
• World Bank – Measuring the Wealth of Nations
• CSD – Indicators of Sustainable Development
• Environmental Sustainability Index
• Sustainable Development Index (SDI)
• Sustainable Development Index (SDI)
• Compass Index of Sustainability
• Redefining Progress – Genuine Progress Indicator
9
• Human Development Index (HDI)
• Index of Environmental Friendliness
• Economic Vulnerability Index
• Coral Reef “Vulnerability Index” of Exposure to Climate Change
• Vulnerability assessment to climate change and sea-level rise
• Key Indicators for Global Vulnerability Mapping
• Composite human vulnerability index
• Island Indicators
Infrastructure DatabasesThird Global Infrastructure Investment Index 2016The Third Arcadis Global Infrastructure Investment Index (GIII) shows which markets are most attractive to both public and private investors, and the analysis highlights why this is the case, revealing where core opportunities lie. It also explores the issues affecting each region and the conclusions support investors, contractors and project sponsors alike in ensuring that the investment gap is bridged successfully. The index covers countries in America, Asia, Australia, Europe and the Middle East for the year 2016.
E.g.GermanyandtheNetherlandsbothroseoneplaceintheindexsince2014confirmingtheirstatusasstable,
legallysoundmarketswithgooddealflows.
Survey of Mining Companies 2015This report presents the results of the Fraser Institute’s 2015 annual survey of mining and exploration companies. An overall Investment Attractiveness Index is constructed by combining the Best Practices Mineral Potential index, which rates regions based on their geologic attractiveness, and the Policy Perception Index, a composite index that measures the effects of government policy on attitudes toward exploration investment. The survey includes 109 jurisdictions from all continents except Antarctica is designed to identify the provinces, states, and countries that have the most attractive policies for encouraging investment.
E.g.Canada’smedianPolicyPerceptionIndexscoreremainedaboutthesamein2015asin2014andthreeCanadian
jurisdictions—Saskatchewan(4th),Alberta(7th),andNewBrunswick(9th)—wererankedinthetop10.Onthe
InvestmentAttractivenessIndex,Canadianjurisdictionscontinuetoperformwell,althoughAustraliasurpassedCanada
in2015tobecomethemostattractiveregionintheworldforinvestment.TwoCanadianjurisdictions(Saskatchewanat
2ndandQuebecat8th)areinthetoptenonthatindex.
10
LIST OF DATABASES
Migration DatabasesMIPEX: Migrant Integration Policy IndexThe Migrant Integration Policy Index (MIPEX) is a unique tool which measures policies to integrate migrants. Some 167 policy indicators have been developed to create a rich, multi-dimensional picture of migrants’ opportunities to participate in society. The index is a useful tool to evaluate and compare what governments are doing to promote the integration of migrants in all the countries analysed. MIPEX covers eight policy areas which shape a migrant’s journey to full citizenship: labour market access, health, family reunification, long-term residence, and political participation, access to nationality, anti-discrimination and education. The data covers all EU Member States and Australia, Canada, Iceland, Japan, South Korea, New Zealand, Norway, Switzerland, Turkey and the USA.
E.g.Since2008andcrisis/austerity,non-EUcitizens’employmentrates(aged20-64)dropped6pointson
averageintheEUto56.5%in2014,whiletheirriskofpovertyorsocialexclusionincreased4pointsto49%,
twicethelevelforEUcitizens.
Key Statistics on Migration in OECD CountriesThe purpose of this annex is to describe the “immigrant” population (generally the foreign-born population). The information gathered concerns the f lows and stocks of the total immigrant population as well as the acquisition of nationality. The tables provide annual series covering the period 2004-14. Each series in the annex is preceded by an explanatory note concerning the data presented.
Other DatabasesRural Development Report 2016This purpose of this report is to examine rural development in the context of the transformation of rural areas and the wider economy – i.e. rural transformation and structural transformation. The report also talks about choices, starting with the programmatic and policy choices of governments and local, regional and global development practitioners. The variables used in the comparatives are structural transformation, rural transformation and social inclusion in rural areas with data from 1990 to 2014 across all continents.
E.g.Accordingtothereport,inruralpoverty,thesteepestfallsintheUS$1.25orUS$2-a-daymetricoverthepast
twodecadeshavebeeninChinaandVietNam.
11
The European Social Survey (ESS)The European Social Survey (ESS) is an academically-driven multi-country survey, which aims are to monitor and interpret changing public attitudes and values within Europe and to investigate how they interact with Europe’s changing institutions, secondly - to advance and consolidate improved methods of cross-national survey measurement in Europe and beyond, and thirdly - to develop a series of European social indicators, including attitudinal indicators. The variables described include social trust, political interest and participation, socio-political orientations, social exclusion, national ethnic and religious allegiances, health and social determinants, immigration, human values demographics and socioeconomics. The data which has been administered in over covers 22 European countries to from 2002 to 2014.
Eurostat DatabasesThis database covers many areas of statistical data for the countries and regions of the European Union. Providing the European Union with statistics at European level that enable comparisons between countries and regions is a key task. Democratic societies do not function properly without a solid basis of reliable and objective statistics. On one hand, decision-makers at EU level, in Member States, in local government and in business need statistics to make those decisions. On the other hand, the public and media need statistics for an accurate picture of contemporary society and to evaluate the performance of politicians and others. Of course, national statistics are still important for national purposes in Member States whereas EU statistics are essential for decisions and evaluation at European level.
12
LIST OF DATABASES
ReferencesCollier, D. (1993). The comparative method. InPoliticalscience:thestateofthedisciplineII. Washington, D.C.: American Political Science Association.
Mills, M., Van de Bunt, G. G., & De Bruijn, J. (2006). Comparative research: Persistent problems and promising solutions. InternationalSociology, 21(5), 619-631.
Pennings, P., Keman, H., & Kleinnijenhuis, J. (2006). Doingresearchinpoliticalscience:Anintroductiontocomparativemethodsandstatistics. London: Sage.
Contact UsRural Development Institute, Brandon University
270-18th Street, McMaster Hall, Lower Level Brandon, Manitoba R7A 6A9
Phone: 204-571-8515 Email: [email protected]/RDI