Embed Size (px)
Citation preview

List of principal investigators and coordinators in the ENIGMA-II trial Australia (ANZCA Clinical Trials Network):
Alfred: P Myles, S Wallace, W Galagher, C Farrington, A Ditoro; Austin: P Peyton, S Baulch, S Sidiropoulos; Dandenong: R Bulach, D Bryant; Fremantle: E O’Loughlin. V Mitteregger; Geelong Hospital: S Bolsin, C Osborne; Monash Medical Centre: R McRae, M Backstrom; Royal Melbourne Hospital: K Leslie, R Cotter; Royal Perth Hospital: M Paech, S March; St Vincent’s Hospital: B Silbert, S Said; Westmead Hospital: R Halliwell, J Cope. Calvary Wakefield: D Fahlbusch, D Crump; Peter MacCallum Cancer Centre: G Thompson; Western Hospital: A Jefferies; Royal Prince Alfred: T McCulloch; North west Regional Hosptial: M Reeves.
Canada McMaster University: N Buckley, T Tidy; Royal Victoria Hospital: T Schricker, R Lattermann, D Iannuzzi; Toronto General Hospital: S Beattie, J Carroll; University of Alberta Hospital: M Jacka, C Bryden. London Health Sciences: N Badner.
Hong Kong Prince of Wales: MTV Chan (ANZCA Trials Group member), MWY Tsang; Tuen Mun Hospital: BCP Cheng, ACM Fong; Pamela Youde Nethersole Eastern Hospital: LCY Chu, EGY Koo.
Malaysia Hospital Kuala Lumpur: N Mohd, L E Ming. Malaya Medical Centre: C Yin Wang.
New Zealand (ANZCA Trials Group members) Auckland Hospital: D Campbell, D McAllister; Middlemore Hospital: S Walker, S Olliff. Christchurch Hospital: R Kennedy.
Saudi Arabia King Saud University Hospital; A Eldawlatly, T Alzahrani.
Singapore
Tan Tock Seng Hospital: N Chua. Switzerland

Geneva University Hospital: G Haller, I Pichon. United Kingdom
Plymouth NHS Trust: R Sneyd, H McMillan. Royal Lancaster Infirmary: I Parkinson; North Devon District Hospital: G Rousseau; Bradford Teaching Hospital: A Brennan; Hull Royal Infirmary: P Balaji; Blackpool Victoria Hospital: J Cupitt; Portsmouth Hospital: J Nightingale; King’s College Hospital: G Kunst; Royal Surrey County Hospital: M Dickinson; University Hospitals, Coventry and Warwickshire: T Saran.
United States of America Beth Israel Deaconess Medical Center: B Subramaniam, V Banner-Godspeed; Cleveland Clinic: DI Sessler, J Liu, A Kurz, B Hesler, AY Fu, C Egan, AN Fiffick, MT Hutcherson, A Turan, A Naylor; Louisville Medical Centre: D Obal, E Cooke.

Appendix Table 1. Risk factors for severe postoperative nausea and vomiting-adjusted for all listed covariables. Interaction terms between nitrous oxide and Asian patients
included in both models. P value for interaction in the PONV prophylaxis group was 0.38, for the No PONV prophylaxis group 0.16.
PONV Prophylaxis (n=3,970) No PONV Prophylaxis (n=3,041)
Severe PONV
n
%
OR (95% CI)
P value
Severe PONV
n
%
OR (95% CI)
P value
Nitrous oxide 270 13.1 1.07 (0.87-1.32) 0.51 234 16.7 1.74 (1.27-2.37) <0.001
If no nitrous oxide
Non-Asian 203 11.4 1.00 (ref)
83 8.3 1.00 (ref)
Asian 22 18.2 0.76 (0.44-1.31) 0.32 70 12.1 1.03 (0.67-1.58) 0.90
If nitrous oxide
Non-Asia 229 12.1 1.07 (0.87-1.32) 0.51 109 12.4 1.74 (1.27-2.37) <0.001
Asia 41 24.8 1.08 (0.69-1.69) 0.74 125 23.7 2.47 (1.64-3.72) <0.001
PONV = postoperative nausea and vomiting.

Appendix Table 2: Univariate risk factors for severe PONV.
PONV Prophylaxis (n=3,970) No PONV Prophylaxis (n=3,041)
n % OR (95% CI) P value n % OR (95% CI) P value
Age categories (years)
<60 106 14.0 1.00 (ref) 44 9.5 1.00 (ref)
60-69 126 11.2 0.77 (0.58, 1.01) 0.062 111 13.7 1.51 (1.04, 2.18) 0.029
70-79 200 12.9 0.91 (0.71, 1.17) 0.47 166 13.2 1.45 (1.02, 2.06) 0.037
≥80 63 11.8 0.82 (0.59, 1.14) 0.24 68 13.8 1.53 (1.02, 2.29) 0.038
Female 287 17.8 2.24 (1.85, 2.71) <0.001 177 19.1 2.09 (1.69, 2.60) <0.001
Asian 63 22.0 2.12 (1.58, 2.85) <0.001 196 17.7 1.90 (1.53, 2.35) <0.001
ASA Physical status
1 or 2 163 15.8 1.00 (ref) 166 14.2 1.00 (ref)
3 302 11.5 0.69 (0.56, 0.85) <0.001 199 11.9 0.82 (0.65, 1.02) 0.072
4 or 5 30 9.8 0.58 (0.38, 0.88) 0.010 24 13.0 0.90 (0.57, 1.43) 0.67
BMI categories (kg/m2)
< 18.5 12 17.6 1.00 (ref) 22 19.0 1.00 (ref)
18.5-24.9 155 14.3 0.78 (0.41, 1.48) 0.44 164 13.9 0.69 (0.42, 1.13) 0.14
25-29.9 172 12.2 0.65 (0.34, 1.24) 0.19 131 12.7 0.62 (0.38, 1.03) 0.064
≥30 156 11.1 0.58 (0.31, 1.11) 0.10 72 10.4 0.50 (0.29, 0.84) 0.009
Folate/multivitamin 104 12.9 1.05 (0.83, 1.32) 0.71 63 13.6 1.07 (0.80, 1.44) 0.63
Vitamin B12 injections 13 11.0 0.86 (0.48, 1.55) 0.63 6 7.1 0.51 (0.22, 1.18) 0.12
Non-smoker 440 13.5 1.87 (1.39, 2.50) <0.001 346 14.2 2.10 (1.51, 2.92) <0.001
Diabetes 189 13.9 1.21 (0.99, 1.47) 0.059 156 13.0 1.01 (0.81, 1.26) 0.92
Coronary artery disease 174 11.3 0.83 (0.68, 1.01) 0.067 113 11.2 0.79 (0.62, 1.00) 0.046

Nitrous oxide 270 13.1 1.13 (0.93, 1.36) 0.21 236 16.6 1.89 (1.52, 2.34) <0.001
Propofol maintenance 22 17.6 1.52 (0.95, 2.43) 0.081 9 9.4 0.69 (0.35, 1.39) 0.30
Regional LA block 173 15.8 1.48 (1.22, 1.81) <0.001 110 13.6 1.10 (0.86, 1.39) 0.45
BIS monitoring 183 10.6 0.73 (0.60, 0.89) 0.002 106 9.9 0.65 (0.52, 0.83) <0.001
Morphine 210 12.4 0.98 (0.81, 1.19) 0.83 221 14.2 1.28 (1.03, 1.58) 0.026
Surgery type
Gastrointestinal* 160 24.7 1.00 (ref) 164 22.1 1.00 (ref)
Renal/bladder 39 11.2 0.38 (0.26, 0.56) <0.001 42 16.7 0.71 (0.49, 1.03) 0.068
Neurology/spine 28 6.7 0.22 (0.14, 0.34) <0.001 16 11.4 0.46 (0.26, 0.79) 0.005
Ear, nose, throat 14 10.4 0.35 (0.20, 0.63) <0.001 7 10.3 0.41 (0.18, 0.90) 0.027
Orthopedic 56 10.4 0.35 (0.25, 0.49) <0.001 37 8.8 0.34 (0.23, 0.50) <0.001
Plastics 10 14.9 0.53 (0.27, 1.07) 0.077 1 3.6 0.13 (0.02, 0.97) 0.047
Gynecology 52 24.3 0.98 (0.68, 1.40) 0.90 23 22.5 1.03 (0.63, 1.69) 0.91
Vascular 121 8.1 0.27 (0.21, 0.35) <0.001 94 7.7 0.30 (0.23, 0.39) <0.001
Other 15 15.2 0.54 (0.31, 0.97) 0.039 5 10.0 0.39 (0.15, 1.00) 0.051
Anesthesia duration
< 2 hours 44 8.5 1.0 (ref) 24 7.7 1.00 (ref)
2-3 hours 142 10.8 1.31 (0.92, 1.87) 0.14 113 13.4 1.86 (1.17, 2.95) 0.008
3-4 hours 131 12.9 1.60 (1.12, 2.29) 0.010 93 12.4 1.69 (1.06, 2.70) 0.028
4-5 hours 79 14.5 1.83 (1.24, 2.70) 0.002 75 14.4 2.02 (1.25, 3.28) 0.004
≥ 5 hours 99 17.0 2.21 (1.51, 3.22) <0.001 84 14.3 2.00 (1.24, 3.21) 0.004
*includes hepatobiliary, pancreatic, and colorectal surgery
PONV=postoperative nausea and vomiting; ASA=American Society of Anesthesiologists; LA=local anesthetic, BIS=bispectral index.
p = 0.89

Appendix Table 3: Univariate models for severe PONV, pooled over patients receiving and not receiving PONV prophylaxis containing interactions between each variable
and PONV prophylaxis.
Variable PONV Prophylaxis (n=3,970) No PONV Prophylaxis (n=3,041)
P value for interaction
Severe PONV n/N % OR (95% CI) P value
Severe PONV n/N % OR (95% CI) P value
Age categories (years)
0.030
<60 106/755 14.0 1.56 (1.07-2.26) 0.020 44/463 9.5 1.00 (ref) 60-69 126/1130 11.2 1.20 (0.83-1.72) 0.33 111/812 13.7 1.51 (1.04-2.18) 0.029
70-79 200/1545 12.9 1.42 (1.00-2.00) 0.048 166/1254 13.2 1.45 (1.02-2.06) 0.037 ≥80 63/535 11.8 1.27 (0.85-1.91) 0.25 68/491 13.8 1.53 (1.02-2.29) 0.038 Sex
0.66
Male 208/2354 8.8 0.86 (0.70-1.05) 0.14 212/2093 10.1 1.00 (ref) Female 287/1611 17.8 1.92 (1.59-2.33) <0.001 177/927 19.1 2.09 (1.69-2.60) <0.001
ASA Physical status
0.30
1 or 2 163/1033 15.8 1.13 (0.89-1.43) 0.31 166/1167 14.2 1.00 (ref) 3 302/2626 11.5 0.78 (0.64-0.96) 0.019 199/1669 11.9 0.82 (0.65-1.02) 0.072
4 or 5 30/306 9.8 0.66 (0.43-0.99) 0.044 24/184 13.0 0.90 (0.57-1.43) 0.67 Region
0.55
Non-Asia 432/3675 11.8 1.18 (0.98-1.41) 0.077 192/1887 10.2 1.00 (ref) Asia 63/286 22.0 2.49 (1.82-3.42) <0.001 196/1109 17.7 1.90 (1.53-2.35) <0.001
BMI categories (kg/m2)
0.92
<18.5 12/68 17.6 0.92 (0.42-1.99) 0.82 22/116 19.0 1.00 (ref) 18.5-24.9 155/1086 14.3 0.71 (0.43-1.17) 0.18 164/1183 13.9 0.69 (0.42-1.13) 0.136
25-29.9 172/1405 12.2 0.60 (0.36-0.97) 0.039 131/1028 12.7 0.62 (0.38-1.03) 0.064 ≥30 156/1405 11.1 0.53 (0.33-0.87) 0.013 72/693 10.4 0.50 (0.29-0.84) 0.009 Folate/multivitamin
0.88
No 391/3157 12.4 0.97 (0.83-1.13) 0.67 326/2556 12.8 1.00 (ref) Yes 104/808 12.9 1.01 (0.80-1.28) 0.93 63/464 13.6 1.07 (0.80-1.44) 0.63
Vitamin B12 injections
0.32
No 482/3847 12.5 0.95 (0.83-1.10) 0.53 383/2936 13.0 1.00 (ref) Yes 13/118 11.0 0.83 (0.46-1.48) 0.52 6/84 7.1 0.51 (0.22-1.18) 0.118
Smoker
0.61

Yes 55/712 7.7 1.06 (0.70-1.60) 0.79 43/587 7.3 1.00 (ref) No 440/3253 13.5 1.98 (1.43-2.74) <0.001 346/2433 14.2 2.10 (1.51-2.92) <0.001
Diabetes
0.24
No 306/2601 11.8 0.91 (0.76-1.09) 0.29 233/1816 12.8 1.00 (ref) Yes 189/1364 13.9 1.09 (0.89-1.34) 0.40 156/1204 13.0 1.01 (0.81-1.26) 0.92
Coronary artery disease
0.73
No 321/2422 13.3 0.96 (0.81-1.14) 0.63 276/2008 13.7 1.00 (ref) Yes 174/1543 11.3 0.80 (0.65-0.98) 0.029 113/1012 11.2 0.79 (0.62-1.00) 0.046
Propofol maintenance
0.066
No 473/3840 12.3 0.94 (0.81-1.09) 0.41 380/2924 13.0 1.00 (ref) Yes 22/125 17.6 1.43 (0.89-2.29) 0.14 9/96 9.4 0.69 (0.35-1.39) 0.300
Regional LA block
0.055
No 322/2869 11.2 0.88 (0.74-1.04) 0.13 279/2214 12.6 1.00 (ref) Yes 173/1095 15.8 1.30 (1.06-1.60) 0.012 110/806 13.6 1.10 (0.86-1.39) 0.45
BIS monitoring
0.47
No 312/2238 13.9 0.96 (0.81-1.14) 0.64 282/1951 14.5 1.00 (ref) Yes 183/1727 10.6 0.70 (0.58-0.86) <0.001 106/1066 9.9 0.65 (0.52-0.83) <0.001
Morphine
0.070
No 285/2265 12.6 1.11 (0.91-1.36) 0.31 168/1464 11.5 1.00 (ref) Yes 210/1699 12.4 1.09 (0.88-1.35) 0.44 221/1556 14.2 1.28 (1.03-1.58) 0.026
Surgery type
0.16
Gastrointestinal* 160/647 24.7 1.16 (0.90-1.49) 0.24 164/743 22.1 1.00 (ref) Renal/bladder 39/348 11.2 0.45 (0.31-0.65) <0.001 42/252 16.7 0.71 (0.49-1.03) 0.068
Neurology/spine 28/416 6.7 0.25 (0.17-0.39) <0.001 16/140 11.4 0.46 (0.26-0.79) 0.005 Ear-nose-throat 14/135 10.4 0.41 (0.23-0.73) 0.002 7/68 10.3 0.41 (0.18-0.90) 0.027 Orthopedic 56/540 10.4 0.41 (0.29-0.57) <0.001 37/422 8.8 0.34 (0.23-0.50) <0.001 Plastics 10/67 14.9 0.62 (0.31-1.24) 0.18 1/28 3.6 0.13 (0.02-0.97) 0.047 Gynecology 52/214 24.3 1.13 (0.79-1.62) 0.49 23/102 22.5 1.03 (0.63-1.69) 0.91 Vascular 121/1499 8.1 0.31 (0.24-0.40) <0.001 94/1215 7.7 0.30 (0.23-0.39) <0.001 Other 15/99 15.2 0.63 (0.35-1.12) 0.12 5/50 10.0 0.39 (0.15-1.00) 0.051
Anaesthesia duration
0.27
< 2 hours 44/518 8.5 1.11 (0.66-1.87) 0.68 24/312 7.7 1.00 (ref)
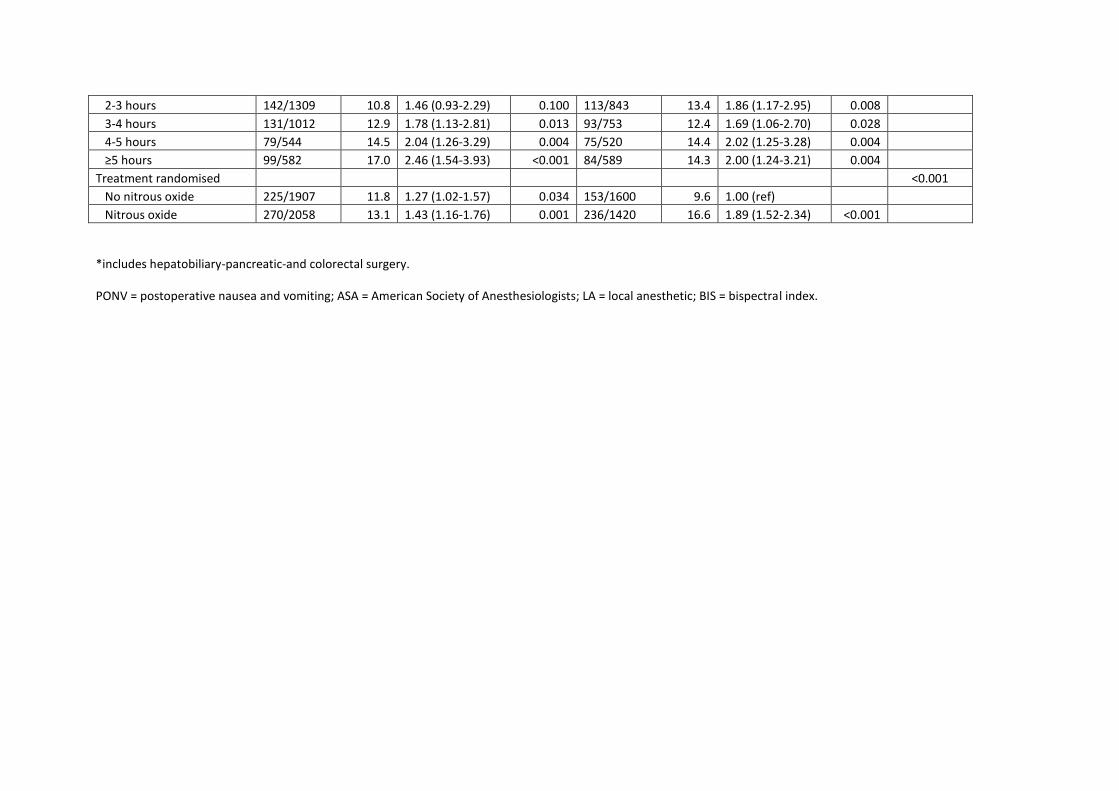
2-3 hours 142/1309 10.8 1.46 (0.93-2.29) 0.100 113/843 13.4 1.86 (1.17-2.95) 0.008 3-4 hours 131/1012 12.9 1.78 (1.13-2.81) 0.013 93/753 12.4 1.69 (1.06-2.70) 0.028 4-5 hours 79/544 14.5 2.04 (1.26-3.29) 0.004 75/520 14.4 2.02 (1.25-3.28) 0.004 ≥5 hours 99/582 17.0 2.46 (1.54-3.93) <0.001 84/589 14.3 2.00 (1.24-3.21) 0.004 Treatment randomised
<0.001
No nitrous oxide 225/1907 11.8 1.27 (1.02-1.57) 0.034 153/1600 9.6 1.00 (ref) Nitrous oxide 270/2058 13.1 1.43 (1.16-1.76) 0.001 236/1420 16.6 1.89 (1.52-2.34) <0.001
*includes hepatobiliary-pancreatic-and colorectal surgery.
PONV = postoperative nausea and vomiting; ASA = American Society of Anesthesiologists; LA = local anesthetic; BIS = bispectral index.

Appendix Table 4: Incidence rates of postoperative nausea and vomiting (PONV) up to Day 3, and rates of antiemetic prophylaxis, for Asian sites.
(a) Number (%) of patients in each Asian country with severe PONV.
Country
No PONV no. (%)
PONV no. (%)
Total
Malaysia 268 (97) 7 (3) 275
Singapore 18 (78) 5 (21) 23
Hong Kong 850 (77) 247 (23) 1097
Saudi Arabia 30 (97) 1 (3) 31
(b) Number (%) of patients in each Asian country receiving any antiemetic prophylaxis.
Country
No antiemetic no. (%)
Any antiemetic no. (%)
Total
Malaysia 223 (81) 54 (19) 277
Singapore 1 (4) 22 (96) 23
Hong Kong 888 (81) 210 (19) 1098
Saudi Arabia 24 (86) 4 (14) 28

Appendix Table 5: Antiemetic count baseline characteristics (n=4,754). *Except for age, weight, body mass index, preinduction heart rate, systolic blood pressure, surgery
duration, hemoglobin and creatinine which are presented as mean (SD).
Unweighted Propensity score weighted
Characteristic
No anti-emetic
(n=1480) % (n)*
1 anti-emetic
(n=2135) % (n)*
≥2 anti-emetics
(n=1139) % (n)*
Std. diff. (1 anti-emetic
vs. none)
Std. diff. (≥2 anti-emetics
vs. none) P value
No anti-emetic
(n=1480) %*
1 anti-emetic
(n=2135) %*
≥2 anti-emetics
(n=1139) %*
Std. diff. (1 anti-emetic
vs. none)
Std. diff. (≥2 anti-emetics
vs. none) P value
Male 75.0 (1110) 63.6 (1357) 51.9 (591) 25.0 49.4 <0.001 63.7 64.3 64.3 -1.2 -1.2 0.95
Age (years) 70.7 (9.4) 69.1 (9.9) 68.3 (9.6) 15.9 24.5 <0.001 69.7 (9.4)
69.4 (11.0)
69.0 (8.3) 2.5 7.1 0.24
Weight (kg) 81.2 (18.0) 82.2 (19.0) 82.7 (20.3) -5.6 -7.9 0.037
82.0 (18.0)
82.0 (20.9)
82.6 (17.5) -0.2 -3.4 0.67
Body mass index (kg/m2)
28.2 (5.9) 28.9 (6.2) 29.5 (6.8) -12.5 -21.5 <0.001 28.6 (5.8) 28.8 (6.9)
29.2 (5.7) -3.8 -8.8 0.10
Preinduction heart rate 71.0 (13.9) 72.7 (13.9) 72.8 (14.0) -11.9 -12.7 0.001
71.7 (13.5)
72.2 (15.2)
72.2 (12.4) -3.5 -3.3 0.60
Preinduction systolic blood pressure
148.1 (25.6) 148.8 (26.6) 152.8 (26.9)
-2.9 -17.8 <0.001 149.0 (24.4)
149.4 (29.9)
151.5 (23.9)
-1.5 -9.7 0.057
Hemoglobin 13.2 (1.9) 13.3 (1.8) 13.4 (1.6) -5.0 -14.8 <0.001 13.3 (1.8)
13.3 (2.1)
13.4 (1.4) -0.8 -8.6 0.071
Creatinine 111.0
(107.0) 103.3 (95.7) 96.2 (94.1) 7.6 14.7 <0.001
107.6 (102.7)
104.4 (111.3)
99.0 (88.7) 3.2 8.5 0.18
Hypertension 85.4 (1264) 82.8 (1768) 85.6 (975) 7.1 -0.6 0.041 83.9 84.2 84.5 -0.6 -1.5 0.93
Coronary artery disease 45.5 (674) 41.4 (884) 37.9 (432) 8.3 15.5 <0.001 42.3 42.0 41.7 0.6 1.2 0.95
Heart failure 9.7 (143) 6.2 (132) 7.4 (84) 12.9 8.2 <0.001 7.7 7.7 7.5 -0.2 0.4 0.99
Previous myocardial infarction
28.4 (421) 25.7 (548) 21.2 (242) 6.3 16.7 <0.001 25.4 25.3 26.1 0.3 -1.5 0.88
Previous CABG/PCI 28.8 (426) 25.9 (553) 25.9 (295) 6.5 6.5 0.12 27.1 26.7 27.4 1.0 -0.5 0.93
Peripheral vascular disease 45.7 (677) 36.7 (784) 27.2 (310) 18.4 39.2 <0.001 37.4 37.7 38.1 -0.6 -1.5 0.93
Previous stroke/TIA 20.5 (304) 17.9 (383) 18.6 (212) 6.6 4.9 0.14 19.2 19.2 19.7 -0.1 -1.3 0.93
High cholesterol 59.6 (882) 59.7 (1275) 60.7 (691) -0.3 -2.2 0.83 59.2 60.1 60.7 -1.9 -3.0 0.76
Current smoker 24.9 (368) 19.3 (411) 16.3 (186) 13.6 21.2 <0.001 20.9 20.4 20.1 1.1 2.0 0.89
Asthma/COPD 22.2 (328) 19.4 (415) 20.8 (237) 6.7 3.3 0.14 21.8 20.9 20.6 2.1 2.9 0.77

Diabetes 34.9 (516) 33.7 (720) 30.5 (347) 2.4 9.4 0.052 32.6 33.6 34.0 -2.1 -3.0 0.76
Infection/fever 6.6 (98) 3.6 (77) 1.8 (21) 13.7 23.9 <0.001 4.2 4.3 5.6 -0.3 -7.0 0.40
Other medical condition 37.5 (555) 42.5 (907) 39.8 (453) -10.2 -4.7 0.010 42.5 41.2 42.2 2.7 0.6 0.80
Vegan/vegetarian 1.7 (25) 1.9 (40) 1.8 (21) -1.4 -1.2 0.92 1.6 1.9 1.7 -2.5 -0.7 0.80
Folate/multivitamin 18.0 (266) 22.5 (480) 20.0 (228) -11.2 -5.2 0.004 20.2 20.4 20.2 -0.6 0.0 0.98
Vitamin B12 injections 3.6 (53) 3.0 (65) 3.2 (37) 3.0 1.8 0.67 3.8 3.5 3.4 1.5 2.2 0.87
Aspirin last 5 days 49.7 (736) 43.7 (934) 44.8 (510) 12.0 9.9 0.001 46.0 46.0 45.6 0.1 1.0 0.97
Other NSAID last 2 days 4.2 (62) 4.7 (100) 4.0 (45) -2.4 1.2 0.58 4.6 4.4 6.0 1.1 -7.1 0.35
Clopidogrel last 7 days 6.6 (98) 6.2 (133) 5.5 (63) 1.6 4.6 0.51 6.0 6.3 5.9 -1.4 0.3 0.89
Warfarin last 7 days 5.7 (85) 5.9 (125) 4.7 (54) -0.5 4.5 0.39 5.6 5.6 5.9 -0.2 -1.6 0.91
Cyclo-oxygenase2 inhibitor 2.8 (42) 3.1 (67) 4.2 (48) -1.8 -7.5 0.13 3.2 3.2 3.2 0.2 0.3 1.00
Nitrates 10.4 (154) 9.6 (206) 8.3 (95) 2.5 7.1 0.20 9.8 10.1 10.6 -1.0 -2.8 0.82
Statins 68.8 (1018) 70.6 (1507) 74.0 (843) -3.9 -11.6 0.013 71.0 71.2 71.6 -0.5 -1.4 0.93
ACEI/ARB 60.6 (897) 60.9 (1300) 61.0 (695) -0.6 -0.8 0.98 60.8 61.1 61.0 -0.5 -0.5 0.99
Amiodarone 1.9 (28) 1.3 (27) 1.6 (18) 5.0 2.4 0.32 1.3 1.4 1.3 -0.8 0.3 0.93
Beta blockers 44.0 (651) 36.0 (769) 36.2 (412) 16.3 16.0 <0.001 39.0 38.9 40.4 0.2 -3.0 0.69
Heparin 9.5 (141) 7.7 (164) 7.1 (81) 6.6 8.8 0.049 8.6 8.4 8.7 0.8 -0.3 0.96
Diuretics 25.9 (383) 26.6 (567) 24.1 (275) -1.5 4.0 0.32 26.0 25.5 25.0 1.0 2.3 0.85
Calcium channel blockers 30.2 (447) 30.0 (641) 29.9 (340) 0.4 0.8 0.98 30.8 30.3 31.2 1.1 -0.8 0.89
Digoxin 4.7 (69) 3.5 (75) 1.9 (22) 5.8 15.3 0.001 3.6 3.5 3.4 0.4 0.9 0.97
Insulin 10.2 (151) 9.6 (205) 7.0 (80) 2.0 11.3 0.013 9.7 9.3 9.2 1.3 1.8 0.91
Oral hypoglycemic 23.0 (341) 24.9 (532) 21.5 (245) -4.4 3.7 0.079 22.6 23.8 22.6 -2.7 0.0 0.74
Cardiac perfusion scan 16.0 (237) 14.4 (307) 10.9 (124) 4.6 15.1 0.001 13.5 13.7 14.0 -0.6 -1.7 0.91
Clean surgery 92.3 (1366) 90.8 (1938)
91.4 (1041)
5.5 3.3 0.28 89.9 91.0 89.4 -4.0 1.7 0.57
Nitrous oxide 53.9 (798) 50.6 (1081) 43.5 (495) 6.6 21.0 <0.001 50.0 50.2 49.9 -0.4 0.2 0.99
Country
<0.001
0.75
1 26.8 (397) 43.4 (927) 29.1 (331) -35.3 -5.0 34.3 35.1 36.5 -1.8 -5.0
61 62.3 (922) 46.5 (993) 51.0 (581) 32.1 22.9
52.4 52.3 51.6 0.2 1.6
64 10.9 (161) 10.1 (215) 19.9 (227) 2.6 -25.3
13.3 12.6 11.9 2.3 4.0
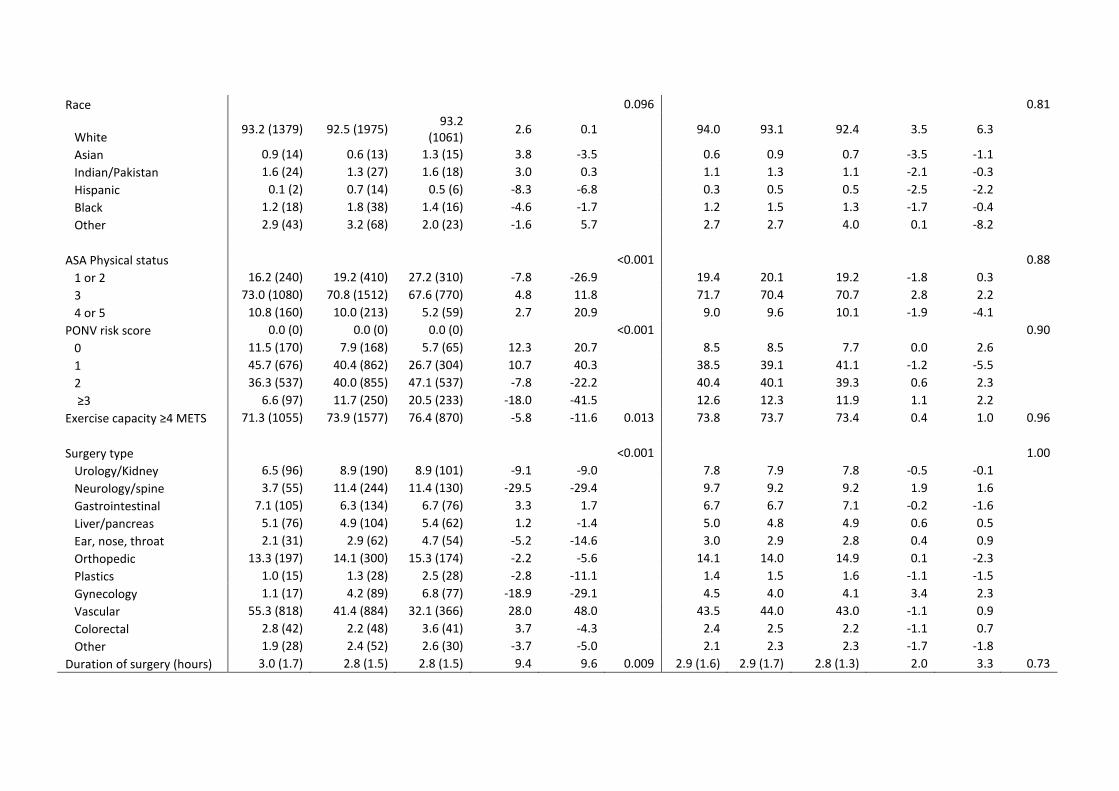
Race
0.096
0.81
White 93.2 (1379) 92.5 (1975)
93.2 (1061)
2.6 0.1
94.0 93.1 92.4 3.5 6.3
Asian 0.9 (14) 0.6 (13) 1.3 (15) 3.8 -3.5
0.6 0.9 0.7 -3.5 -1.1
Indian/Pakistan 1.6 (24) 1.3 (27) 1.6 (18) 3.0 0.3
1.1 1.3 1.1 -2.1 -0.3
Hispanic 0.1 (2) 0.7 (14) 0.5 (6) -8.3 -6.8
0.3 0.5 0.5 -2.5 -2.2
Black 1.2 (18) 1.8 (38) 1.4 (16) -4.6 -1.7
1.2 1.5 1.3 -1.7 -0.4
Other 2.9 (43) 3.2 (68) 2.0 (23) -1.6 5.7
2.7 2.7 4.0 0.1 -8.2
ASA Physical status
<0.001
0.88
1 or 2 16.2 (240) 19.2 (410) 27.2 (310) -7.8 -26.9 19.4 20.1 19.2 -1.8 0.3
3 73.0 (1080) 70.8 (1512) 67.6 (770) 4.8 11.8
71.7 70.4 70.7 2.8 2.2
4 or 5 10.8 (160) 10.0 (213) 5.2 (59) 2.7 20.9
9.0 9.6 10.1 -1.9 -4.1
PONV risk score 0.0 (0) 0.0 (0) 0.0 (0)
<0.001
0.90
0 11.5 (170) 7.9 (168) 5.7 (65) 12.3 20.7
8.5 8.5 7.7 0.0 2.6
1 45.7 (676) 40.4 (862) 26.7 (304) 10.7 40.3
38.5 39.1 41.1 -1.2 -5.5
2 36.3 (537) 40.0 (855) 47.1 (537) -7.8 -22.2
40.4 40.1 39.3 0.6 2.3
≥3 6.6 (97) 11.7 (250) 20.5 (233) -18.0 -41.5
12.6 12.3 11.9 1.1 2.2
Exercise capacity ≥4 METS 71.3 (1055) 73.9 (1577) 76.4 (870) -5.8 -11.6 0.013 73.8 73.7 73.4 0.4 1.0 0.96
Surgery type <0.001 1.00
Urology/Kidney 6.5 (96) 8.9 (190) 8.9 (101) -9.1 -9.0 7.8 7.9 7.8 -0.5 -0.1
Neurology/spine 3.7 (55) 11.4 (244) 11.4 (130) -29.5 -29.4
9.7 9.2 9.2 1.9 1.6
Gastrointestinal 7.1 (105) 6.3 (134) 6.7 (76) 3.3 1.7
6.7 6.7 7.1 -0.2 -1.6
Liver/pancreas 5.1 (76) 4.9 (104) 5.4 (62) 1.2 -1.4
5.0 4.8 4.9 0.6 0.5
Ear, nose, throat 2.1 (31) 2.9 (62) 4.7 (54) -5.2 -14.6
3.0 2.9 2.8 0.4 0.9
Orthopedic 13.3 (197) 14.1 (300) 15.3 (174) -2.2 -5.6
14.1 14.0 14.9 0.1 -2.3
Plastics 1.0 (15) 1.3 (28) 2.5 (28) -2.8 -11.1
1.4 1.5 1.6 -1.1 -1.5
Gynecology 1.1 (17) 4.2 (89) 6.8 (77) -18.9 -29.1
4.5 4.0 4.1 3.4 2.3
Vascular 55.3 (818) 41.4 (884) 32.1 (366) 28.0 48.0
43.5 44.0 43.0 -1.1 0.9
Colorectal 2.8 (42) 2.2 (48) 3.6 (41) 3.7 -4.3
2.4 2.5 2.2 -1.1 0.7
Other 1.9 (28) 2.4 (52) 2.6 (30) -3.7 -5.0
2.1 2.3 2.3 -1.7 -1.8
Duration of surgery (hours) 3.0 (1.7) 2.8 (1.5) 2.8 (1.5) 9.4 9.6 0.009 2.9 (1.6) 2.9 (1.7) 2.8 (1.3) 2.0 3.3 0.73

ASA=American Society of Anesthesiologists; BMI, body mass index; CABG/PCI, coronary artery bypass graft/percutaneous coronary intervention; COPD, chronic obstructive
pulmonary disease; METS, metabolic equivalents; NSAID, non-steroidal anti-inflammatory drug; PONV=postoperative nausea and vomiting; Std diff, standardised difference;
TIA, transient ischemic attack.

Appendix Table 6: Antiemetic count baseline characteristics, where at least one anti-emetic has been administered (n=3272). *Except for age, weight, body mass index,
preinduction heart rate, systolic blood pressure, surgery duration, hemoglobin and creatinine which are presented as mean (SD).
Unweighted Propensity score weighted
Characteristic
1 anti-emetic (n=2113)
% (n)*
≥2 anti-emetics (n=1159)
% (n)* Std. diff P value
1 anti-emetic (n=2113)
%*
≥2 anti-emetics (n=1159)
%* Std. diff P value
Male 63.4 (1340) 52.6 (610) 22.0 <0.001 59.9 57.4 5.2 0.18
Age (years) 69.1 (9.9) 68.5 (9.6) 6.9 0.061 68.9 (11.1) 68.7 (8.2) 2.4 0.52
Weight (kg) 82.3 (19.0) 82.5 (20.2) -1.0 0.77 82.4 (21.2) 82.4 (17.3) 0.0 1.00
Body mass index (kg/m2) 28.9 (6.2) 29.4 (6.8) -7.9 0.030 29.1 (7.0) 29.2 (5.8) -1.9 0.62
Preinduction heart rate 72.7 (13.9) 72.7 (14.0) 0.3 0.94 72.7 (15.4) 72.4 (12.1) 2.3 0.56 Preinduction systolic blood pressure 149.0 (26.5) 152.2 (27.0) -12.3 0.001 150.0 (29.8) 150.7 (23.3) -2.6 0.51
Hemoglobin 13.3 (1.8) 13.4 (1.6) -7.4 0.047 13.3 (2.0) 13.4 (1.4) -3.5 0.36
Creatinine 102.7 (94.9) 96.0 (90.9) 7.2 0.049 102.4 (109.5) 98.2 (85.3) 4.5 0.32
Hypertension 82.8 (1749) 85.6 (992) -7.7 0.037 83.8 84.9 -3.2 0.40
Coronary artery disease 41.2 (870) 38.1 (442) 6.2 0.090 39.9 38.9 2.0 0.60
Heart failure 6.2 (130) 7.3 (85) -4.7 0.19 6.7 6.7 0.1 0.98 Previous myocardial infarction 25.5 (538) 22.0 (255) 8.1 0.027 24.1 23.3 1.8 0.64
Previous CABG/PCI 26.0 (549) 26.1 (303) -0.4 0.92 25.9 26.0 -0.2 0.97
Peripheral vascular disease 36.4 (770) 27.8 (322) 18.6 <0.001 33.7 30.7 6.6 0.093
Previous stroke/TIA 18.1 (383) 18.5 (214) -0.9 0.81 18.6 18.3 0.6 0.87
High cholesterol 59.7 (1262) 60.5 (701) -1.5 0.67 60.3 60.7 -0.9 0.81
Current smoker 19.3 (407) 16.7 (193) 6.8 0.065 18.3 17.7 1.5 0.70
Asthma/COPD 19.5 (413) 20.8 (241) -3.1 0.39 20.1 20.1 -0.1 0.99
Diabetes 33.6 (709) 30.4 (352) 6.8 0.063 32.7 31.4 2.8 0.47
Infection/fever 3.5 (74) 2.2 (26) 7.5 0.045 3.2 2.7 2.8 0.50
Other medical condition 42.4 (895) 39.9 (462) 5.1 0.17 42.1 41.1 2.1 0.59
Vegan/vegetarian 1.9 (40) 1.8 (21) 0.6 0.87 1.9 1.8 0.2 0.96
Folate/multivitamin 22.3 (472) 19.5 (226) 7.0 0.058 21.4 20.1 3.2 0.41

Vitamin B12 injections 3.0 (63) 3.5 (40) -2.7 0.46 3.1 3.3 -0.7 0.84
Aspirin last 5 days 43.7 (923) 45.0 (521) -2.6 0.48 44.3 44.8 -1.1 0.78
Other NSAID last 2 days 4.7 (100) 4.0 (46) 3.7 0.31 4.6 4.2 1.6 0.69
Clopidogrel last 7 days 6.2 (132) 5.7 (66) 2.3 0.53 6.1 6.2 -0.6 0.89
Warfarin last 7 days 5.9 (124) 4.7 (55) 5.0 0.18 5.7 5.0 3.3 0.40
Cyclo-oxygenase2 inhibitor 3.2 (67) 4.1 (48) -5.2 0.15 3.4 3.6 -0.8 0.82
Nitrates 9.6 (203) 8.2 (95) 5.0 0.18 9.6 8.4 4.2 0.28
Statins 70.7 (1493) 73.8 (855) -7.0 0.059 71.7 73.0 -2.7 0.47
ACEI/ARB 60.6 (1281) 60.4 (700) 0.5 0.90 60.7 60.7 0.0 0.99
Amiodarone 1.3 (27) 1.6 (18) -2.3 0.52 1.3 1.5 -1.3 0.73
Beta blockers 36.0 (761) 36.8 (427) -1.7 0.64 36.6 36.5 0.2 0.96
Heparin 7.7 (163) 7.5 (87) 0.8 0.83 7.8 7.9 -0.3 0.95
Diuretics 26.3 (555) 23.9 (277) 5.5 0.14 25.4 24.7 1.7 0.65
Calcium channel blockers 29.9 (631) 29.7 (344) 0.4 0.91 30.0 29.3 1.4 0.71
Digoxin 3.4 (72) 2.2 (25) 7.6 0.044 3.1 2.5 3.3 0.41
Insulin 9.3 (196) 7.3 (85) 7.0 0.058 8.7 8.3 1.6 0.69
Oral hypoglycemic 24.7 (521) 21.2 (246) 8.2 0.027 23.6 22.3 2.9 0.45
Cardiac perfusion scan 14.2 (301) 11.1 (129) 9.4 0.012 13.3 12.7 1.7 0.67
Surgery cleanliness 90.9 (1920) 91.3 (1058) -1.5 0.69 90.8 91.0 -0.8 0.83
Nitrous oxide 50.4 (1065) 43.6 (505) 13.7 <0.001 48.4 46.0 4.8 0.21
Country
<0.001
0.065
1 42.9 (906) 28.4 (329) 30.6
38.3 34.0 9.1 61 46.9 (992) 52.1 (604) -10.3
48.5 51.8 -6.5
64 10.2 (215) 19.5 (226) -26.5
13.2 14.2 -3.0 Race
0.101
0.85
White 92.8 (1960) 93.6 (1085) -3.4
92.8 93.6 -3.0 Asian 0.6 (13) 1.3 (15) -7.0
0.9 1.0 -0.6
Indian/Pakistan 1.3 (27) 1.5 (17) -1.6
1.4 1.3 1.2 Hispanic 0.7 (14) 0.4 (5) 3.1
0.6 0.6 0.0
Black 1.8 (38) 1.4 (16) 3.3
1.6 1.7 -1.0 Other 2.9 (61) 1.8 (21) 7.1
2.6 1.8 5.3

ASA physical status <0.001 0.059
1 or 2 19.4 (409) 26.5 (307) -17.0
21.8 22.7 -2.2 3 71.0 (1500) 68.3 (792) 5.8
69.8 71.3 -3.2
4 or 5 9.7 (204) 5.2 (60) 17.2
8.4 6.0 9.2 PONV risk score <0.001 0.33
0 7.8 (165) 5.7 (66) 8.4
7.1 6.4 2.9 1 40.2 (850) 27.8 (322) 26.5
36.4 33.6 5.8
2 40.1 (848) 46.4 (538) -12.7
41.8 43.9 -4.3 ≥3 11.8 (250) 20.1 (233) -22.7
14.7 16.1 -3.7
Exercise capacity >=4 METS 73.9 (1561) 76.7 (889) -6.6 0.074 74.6 75.5 -2.0 0.60
Surgery type <0.001 0.99
Urology/Kidney 8.8 (187) 8.8 (102) 0.2
8.8 8.7 0.1 Neurology/spine 11.5 (243) 10.7 (124) 2.6
11.3 10.9 1.2
Gastrointestinal 6.2 (132) 6.9 (80) -2.6
6.5 6.5 0.1 Liver/pancreas 4.9 (103) 5.4 (63) -2.5
4.9 5.4 -2.1
Ear, nose, throat 2.9 (62) 4.7 (54) -9.0
3.4 3.7 -1.4 Orthopedic 14.1 (298) 15.2 (176) -3.1
14.4 14.9 -1.4
Plastics 1.3 (28) 2.4 (28) -8.1
1.8 2.0 -1.5 Gynecology 4.2 (89) 6.6 (77) -10.7
5.0 5.6 -2.7
Vascular 41.3 (872) 33.0 (382) 17.3
38.9 36.8 4.3 Colorectal 2.2 (47) 3.5 (41) -7.9
2.4 2.7 -1.6
Other 2.5 (52) 2.8 (32) -1.9 2.6 2.8 -1.3
Duration of surgery (hours) 2.8 (1.5) 2.8 (1.5) -0.5 0.89 2.8 (1.7) 2.8 (1.3) -1.1 0.78
ASA=American Society of Anesthesiologists; BMI, body mass index; CABG/PCI, coronary artery bypass graft/percutaneous coronary intervention; COPD, chronic obstructive
pulmonary disease; METS, metabolic equivalents; NSAID, non-steriodal anti-inflammatory drug; PONV=postoperative nausea and vomiting; Std diff, standardised difference;
TIA, transient ischemic attack.

Appendix Table 7: Antiemetic combinations (n= 4,497)
Unweighted Propensity score weighted
No anti-emetic
(n=1511)% (n)*
5-HT3 only
(n=1149) % (n)*
Dex only
(n=890)% (n)*
Dex and 5-
HT3 (n=947)%(n)*
Std. diff
(5-HT3 vs.
none)
Std diff
(Dex vs.
none)
Std diff
(5-HT3
+Dex vs. None) P value
No anti-emetic
(n=1511) %*
5-HT3
(n=1149) only %*
Dex only (n=890)
%*
Dex and 5-HT3
(n=947) %*
Std. diff (5-HT3 vs. none)
Std diff
(Dex vs
none)
Std diff (5-HT3
+Dex vs None) P value
Male 73.5 (1111)
62.4 (717)
64.7 (576)
53.6 (508) 24.0 19.2 42.2 <0.001 64.3 65.6 63.1 64.7 -2.8 2.7 -0.9 0.78
Age (years) 70.6 (9.5)
68.8 (10.2)
69.6 (9.5)
68.4 (9.8) 18.2 10.0 22.4 <0.001
69.5 (11.3)
69.7 (10.4) 69.2 (8.4) 69.6 (8.7) -2.1 3.1 -1.3 0.81
Weight (kg) 81.3 (18.2)
82.6 (19.9)
81.3 (17.9)
82.5 (20.8) -7.2 -0.1 -6.1 0.30
82.1 (22.2)
81.8 (19.0)
81.8 (16.9)
81.8 (18.0) 1.5 1.6 1.4 0.99
Body mass index (kg/m
2) 28.3 (6.0)
29.0 (6.5)
28.6 (5.9)
29.5 (7.1) -12.2 -6.5 -18.6 <0.001
28.9 (7.3) 28.8 (6.3) 28.9 (5.8) 28.8 (6.0) 2.1 0.1 1.0 0.98
Preinduction heart rate
71.2 (14.0)
73.1 (13.8)
72.2 (13.9)
72.7 (14.2) -13.5 -7.2 -10.9 0.017
72.1 (16.4)
72.1 (13.4)
72.5 (12.6)
72.5 (13.3) 0.0 -2.2 -2.2 0.95
Preinduction systolic blood pressure
148.2 (25.7)
147.7 (26.2)
150.3 (26.9)
151.8 (26.2) 1.7 -8.0 -13.9 <0.001
148.9 (29.6)
149.5 (27.7)
150.0 (24.2)
149.1 (23.1) -2.2 -3.9 -0.8 0.88
Hemoglobin 13.2 (1.9) 13.1 (1.9)
13.5 (1.8)
13.4 (1.7) 5.8 -17.3 -11.9 <0.001
13.3 (2.2) 13.2 (1.9) 13.3 (1.6) 13.2 (1.6) 4.1 0.5 4.1 0.77
Creatinine 110.3 (106.2)
107.7 (104.9)
97.5 (82.0)
96.4 (92.1) 2.5 13.6 14.0 <0.001
104.1 (112.5)
104.7 (97.5)
105.4 (90.5)
107 (110.9) -0.5 -1.4 -3.1 0.97
Hypertension 85.4 (1290)
83.6 (960)
81.6 (726)
84.8 (803) 5.0 10.2 1.6 0.084 83.7 83.0 83.0 84.2 1.9 1.9 -1.3 0.92
Coronary artery disease
45.3 (685)
41.6 (478)
40.2 (358)
36.3 (344) 7.5 10.3 18.4 <0.001 42.1 40.6 41.9 41.6 3.0 0.5 1.0 0.94
Heart failure 9.4 (142) 7.2 (83) 5.2 (46) 6.5 (62) 7.9 16.3 10.5 0.001 7.4 7.5 8.3 7.4 -0.3 -3.5 0.2 0.90 Previous myocardial infarction
28.2 (426)
25.0 (287)
25.7 (229)
21.6 (205) 7.3 5.6 15.2 0.004 25.5 24.2 26.6 25.2 3.1 -2.3 0.8 0.78
Previous CABG/PCI 28.7 25.5 26.1 25.1 7.3 6.0 8.1 0.15 27.4 24.8 26.5 28.3 6.0 2.2 -2.0 0.48

(434) (293) (232) (238)
Peripheral vascular disease
44.7 (675)
37.7 (433)
36.1 (321)
29.4 (278) 14.2 17.6 32.1 <0.001 38.0 38.2 39.7 38.1 -0.3 -3.5 -0.2 0.89
Previous stroke/TIA 20.4 (308)
16.6 (191)
19.9 (177)
18.9 (179) 9.7 1.2 3.7 0.087 18.8 21.0 18.0 18.7 -5.7 1.9 0.2 0.50
High cholesterol 59.8 (903)
61.6 (708)
58.9 (524)
60.4 (572) -3.8 1.8 -1.3 0.63 60.0 59.7 60.5 59.9 0.7 -1.0 0.2 0.99
Current smoker 24.6 (371)
19.0 (218)
19.2 (171)
17.0 (161) 13.6 12.9 18.7 <0.001 21.3 20.5 22.8 19.6 1.8 -3.7 4.1 0.52
Asthma/COPD 22.2 (335)
17.4 (200)
21.6 (192)
19.7 (187) 12.0 1.4 6.0 0.016 20.9 19.5 21.4 20.0 3.5 -1.3 2.2 0.80
Diabetes 34.5 (521)
40.6 (467)
23.1 (206)
29.5 (279) -12.8 25.2 10.8 <0.001 31.7 33.3 32.1 32.2 -3.2 -0.9 -1.0 0.92
Infection/fever 6.2 (94) 4.9 (56) 2.0 (18) 2.4 (23) 5.9 21.2 18.7 <0.001 4.2 5.1 4.6 4.6 -3.9 -2.1 -2.0 0.90 Other medical condition
38.4 (580)
46.4 (533)
38.0 (338)
41.2 (390) -16.2 0.8 -5.7 <0.001 42.8 41.1 39.9 42.6 3.4 5.9 0.3 0.65
Vegan/vegetarian 1.7 (26) 1.7 (20) 2.2 (20) 2.0 (19) -0.2 -3.8 -2.1 0.79 1.7 2.0 2.1 1.8 -2.0 -2.8 -0.4 0.94
Folate/multivitamin 18.1 (273)
28.3 (325)
14.9 (133)
19.3 (183) -24.4 8.4 -3.2 <0.001 19.4 20.2 19.0 20.0 -2.0 1.2 -1.6 0.92
Vitamin B12 injections 3.6 (55) 3.1 (36) 2.8 (25) 3.6 (34) 2.8 4.7 0.3 0.67 3.5 3.4 2.7 3.6 0.2 4.5 -0.7 0.73
Aspirin last 5 days 49.4 (746)
44.0 (506)
43.6 (388)
44.0 (417) 10.7 11.6 10.7 0.007 45.9 46.5 46.9 45.8 -1.3 -2.1 0.2 0.97
Other NSAID last 2 days 4.2 (63) 4.4 (51) 4.9 (44) 3.8 (36) -1.3 -3.7 1.9 0.66 4.8 4.3 4.6 4.2 2.2 1.0 2.9 0.96 Clopidogrel last 7 days 6.5 (98) 7.0 (81) 5.2 (46) 5.7 (54) -2.2 5.6 3.3 0.30 6.2 6.0 6.8 6.3 0.7 -2.6 -0.6 0.93
Warfarin last 7 days 5.8 (88) 5.6 (64) 6.3 (56) 4.6 (44) 1.1 -2.0 5.3 0.46 5.8 5.6 5.1 5.9 1.1 3.0 -0.4 0.91
COX2 2.8 (43) 2.8 (32) 3.8 (34) 3.8 (36) 0.4 -5.4 -5.3 0.33 3.3 2.8 3.5 3.1 3.0 -1.1 0.9 0.88
Nitrates 10.4 (157) 9.7 (112) 9.3 (83) 8.3 (79) 2.1 3.6 7.0 0.40 9.5 10.3 8.9 9.2 -2.7 2.0 1.2 0.82
Statins 69.1 (1044)
69.2 (795)
71.9 (640)
73.2 (693) -0.2 -6.2 -9.0 0.089 71.3 71.7 70.0 71.2 -0.8 3.0 0.2 0.89
ACEI/ARB 60.9 59.8 62.1 60.3 2.2 -2.6 1.2 0.74 60.8 59.7 59.6 60.2 2.4 2.5 1.2 0.96

(920) (687) (553) (571)
Amiodarone 1.9 (28) 1.3 (15) 1.2 (11) 1.4 (13) 4.4 5.0 3.8 0.55 1.3 1.5 1.2 1.4 -1.0 0.8 -0.7 0.98
Beta blockers 43.7 (661)
37.2 (427)
33.0 (294)
35.3 (334) 13.4 22.2 17.4 <0.001 39.0 38.6 38.5 38.7 0.9 1.1 0.6 1.00
Heparin 9.5 (144) 8.5 (98) 6.3 (56) 7.1 (67) 3.5 12.0 8.9 0.022 8.9 8.2 8.7 8.6 2.3 0.7 1.0 0.97
Diuretics 26.0 (393)
29.1 (334)
22.5 (200)
23.3 (221) -6.9 8.3 6.2 0.002 25.4 24.5 25.4 24.3 2.1 -0.1 2.6 0.94
Calcium channel blockers
30.4 (460)
30.1 (346)
29.8 (265)
29.1 (276) 0.7 1.5 2.8 0.92 30.2 30.9 29.4 29.9 -1.3 1.9 0.7 0.94
Digoxin 4.6 (69) 3.4 (39) 3.3 (29) 2.2 (21) 6.0 6.8 13.0 0.020 3.7 3.7 3.3 3.5 0.0 2.1 0.9 0.97
Insulin 10.1 (153)
12.4 (142) 5.3 (47) 6.5 (62) -7.1 18.2 13.0 <0.001 9.1 9.3 9.0 9.1 -0.8 0.3 -0.1 1.00
Oral hypoglycemic 23.0 (347)
30.0 (345)
17.3 (154)
21.3 (202) -16.1 14.2 3.9 <0.001 21.9 23.5 22.4 22.1 -3.6 -1.2 -0.5 0.87
Cardiac perfusion scan
15.8 (239)
14.4 (165)
14.4 (128)
10.5 (99) 4.1 4.0 15.9 0.003 13.7 12.4 13.1 14.2 3.8 1.8 -1.5 0.74
Clean surgery 91.9 (1388)
90.3 (1037)
91.0 (810)
90.1 (853) 5.6 3.0 6.2 0.38 90.0 89.9 90.2 90.5 0.2 -0.6 -1.7 0.99
Nitrous oxide 53.5 (808)
50.9 (585)
50.6 (450)
44.6 (422) 5.1 5.8 17.9 <0.001 50.4 51.6 49.9 50.0 -2.2 1.1 0.8 0.91
Country 0.0 (0) 0.0 (0) 0.0 (0) 0.0 (0)
<0.001
0.90
1 27.5 (416)
62.7 (720)
19.7 (175)
34.4 (326) -75.5 18.6 -14.9
35.4 35.9 34.1 37.6 -1.1 3.0 -4.9
61
61.4 (927)
29.6 (340)
67.8 (603)
49.4 (468) 67.3 -13.4 24.2
52.9 52.8 53.9 50.8 0.2 -2.1 4.2
64
11.1 (168) 7.7 (89)
12.6 (112)
16.2 (153) 11.6 -4.5 -14.7
11.8 11.3 12.1 11.6 1.5 -0.9 0.6
Non-white 6.8 (103) 9.4 (108) 4.8 (43) 6.2 (59) -9.5 8.5 2.4 0.001 94.1 93.1 93.0 92.5 3.8 4.7 6.4 0.68
ASA physical status <0.001 0.98
1 or 2 16.5 (249)
15.7 (180)
24.2 (215)
25.3 (240) 2.2 -19.2 -21.9
18.9 20.5 20.0 19.3 -4.3 -3.0 -1.1
3
72.9 (1102)
71.1 (817)
70.0 (623)
67.8 (642) 4.1 6.5 11.3
72.0 69.8 70.5 71.4 4.8 3.3 1.3

4 or 5 10.6 (160)
13.2 (152) 5.8 (52) 6.9 (65) -8.2 17.3 13.2
9.2 9.8 9.5 9.3 -1.8 -1.1 -0.5
PONV risk score <0.001 0.76
0 11.3 (170) 9.0 (103) 6.4 (57) 6.3 (60) 7.6 17.1 17.4
8.7 9.4 9.3 7.8 -2.3 -2.0 3.2
1
44.7 (676)
46.1 (530)
33.6 (299)
29.5 (279) -2.8 23.0 32.0
39.2 41.2 37.3 41.0 -4.1 3.8 -3.7
2
36.4 (550)
36.0 (414)
44.7 (398)
45.7 (433) 0.8 -17.0 -19.0
39.6 38.9 42.3 39.7 1.5 -5.4 -0.2
≥3 7.6 (115) 8.9 (102)
15.3 (136)
18.5 (175) -4.6 -24.3 -32.7
12.5 10.4 11.1 11.5 7.3 4.3 2.9
Exercise capacity ≥4 METS
71.6 (1082)
74.0 (850)
73.5 (654)
78.0 (739) -5.3 -4.2 -14.8 0.006 74.0 72.9 75.0 73.2 2.4 -2.1 1.9 0.81
Surgery type <0.001 1.000
Urology/Kidney 6.6 (99) 10.5 (121) 6.5 (58) 8.1 (77) -14.3 0.1 -6.1
7.5 7.9 6.8 7.8 -1.4 3.1 -1.1
Neurology/spine 4.6 (70) 8.4 (97)
15.6 (139)
10.6 (100) -15.5 -37.0 -22.5
9.9 8.4 8.4 9.3 6.1 4.8 2.1
Gastrointestinal 7.2 (109) 6.7 (77) 5.4 (48) 7.0 (66) 2.0 7.5 1.0
6.7 6.5 6.4 7.0 0.7 1.2 -1.4 Liver/pancreas 5.0 (76) 5.9 (68) 3.8 (34) 5.8 (55) -3.9 5.9 -3.4
5.2 5.6 5.6 5.7 -1.7 -2.0 -1.9
Ear, nose, throat 2.1 (32) 3.0 (35) 2.8 (25) 4.3 (41) -5.9 -4.5 -12.5
2.8 3.0 2.7 3.0 -1.4 0.5 -1.1
Orthopedic 13.2 (199)
12.8 (147)
14.2 (126)
13.8 (131) 1.1 -2.9 -1.9
13.2 13.7 14.1 13.1 -1.3 -2.5 0.3
Plastics 1.0 (15) 1.0 (11) 1.8 (16) 2.7 (26) 0.4 -6.9 -13.0
1.4 1.6 1.5 1.6 -1.7 -0.7 -1.7 Gynecology 1.8 (27) 5.0 (57) 3.6 (32) 7.7 (73) -17.6 -11.2 -28.1
4.5 4.0 4.1 4.3 2.8 2.3 0.7
Vascular
54.0 (816)
41.3 (475)
42.4 (377)
34.4 (326) 25.6 23.5 40.2
44.7 44.4 45.8 43.8 0.6 -2.3 1.8
Colorectal 2.7 (41) 2.5 (29) 2.0 (18) 2.7 (26) 1.2 4.5 -0.2
2.0 2.9 2.2 2.2 -5.8 -1.3 -1.0 Other 1.8 (27) 2.8 (32) 1.9 (17) 2.7 (26) -6.7 -0.9 -6.4 2.1 2.0 2.3 2.1 0.5 -1.8 0.1
Duration of surgery (hours) 2.9 (1.7) 2.8 (1.5)
2.8 (1.5)
2.8 (1.5) 7.3 7.0 7.3 0.064 2.9 (1.9) 2.9 (1.6) 2.9 (1.4) 2.9 (1.4) -2.6 0.1 -0.3 0.95
ASA=American Society of Anesthesiologists; CABG/PCI, coronary artery bypass graft/percutaneous coronary intervention; COPD, chronic obstructive pulmonary disease;
METS, metabolic equivalents; NSAID, non-steriodal anti-inflammatory drug; PONV=postoperative nausea and vomiting; Std diff, standardised difference; TIA, transient
ischemic attack.

Appendix Table 8: Antiemetic combinations, among those patients who received at least one of 5-HT3 antagonist or dexamethasone (n=2785).
Unweighted Propensity score weighted
5-HT3 only (n=953) %(n)
Dex only (n=889)
%(n)
5-HT3 + Dex
(n=943) %(n)
Std. diff (Dex vs. 5-HT3)
Std. diff (5-HT3
+ Dex vs. 5-HT3) P value
5-HT3 only
(n=953) %(n)
Dex only
(n=889) %(n)
5-HT3 + Dex
(n=94) %(n)
Std. diff (Dex vs. 5-HT3)
Std. diff (5-HT3
+ Dex vs 5-HT3) P value
Male 59.5 (567) 64.8 (576) 53.8 (507) -10.9 11.6 <0.001 60.5 59.6 60.4 1.9 0.2 0.93
Age (years) 68.6 (10.4) 69.6 (9.5) 68.4 (9.8) -10.1 2.3 0.61 68.7
(11.0) 68.7 (9.2)
69.0 (9.5) -0.5 -2.7 0.85
Weight (kg) 82.3 (19.7) 81.2 (17.8) 82.5 (20.9) 5.8 -0.9 0.84 82.4
(20.3) 81.4
(17.9) 82.3
(20.0) 5.1 0.7 0.63
Body mass index (kg/m2) 29.1 (6.5) 28.6 (5.8) 29.5 (7.1) 8.0 -5.4 0.22
29.2 (6.9)
28.8 (5.9)
29.1 (6.7) 5.5 1.5 0.62
Preinduction heart rate 73.1 (13.7) 72.3 (13.8) 72.7 (14.2) 6.4 2.9 0.53 72.8
(13.9) 73.4
(13.6) 72.7
(14.3) -4.5 0.7 0.63 Preinduction systolic blood pressure 148.9 (26.2)
150.3 (26.9)
151.8 (26.3) -5.1 -10.8 0.020
151.0 (28.2)
150.7 (25.8)
149.7 (25.5) 1.1 4.6 0.65
Hemoglobin 13.2 (1.9) 13.5 (1.8) 13.4 (1.7) -17.7 -12.8 0.005 13.3 (1.9)
13.3 (1.7)
13.3 (1.7) 2.5 0.3 0.88
Creatinine 102.6 (96.3) 97.5 (82.0) 95.9 (90.8) 5.7 7.2 0.11 99.4
(93.4) 104.1 (94.6)
100.7 (102.6) -5.2 -1.3 0.73
Hypertension 83.3 (794) 81.6 (725) 84.6 (798) 4.6 -3.6 0.21 81.8 82.5 83.2 -2.0 -3.8 0.81
Coronary artery disease 38.5 (367) 40.3 (358) 36.3 (342) -3.6 4.6 0.21 36.1 37.7 38.6 -3.3 -5.1 0.63
Heart failure 6.6 (63) 5.2 (46) 6.4 (60) 6.1 1.0 0.39 6.5 6.4 6.0 0.4 1.9 0.94 Previous myocardial infarction 23.4 (223) 25.8 (229) 21.6 (204) -5.5 4.2 0.11 22.4 23.6 23.5 -2.9 -2.7 0.84
Previous CABG/PCI 24.9 (237) 26.1 (232) 25.0 (236) -2.8 -0.4 0.81 24.2 24.1 25.4 0.3 -2.8 0.82
Peripheral vascular disease 35.7 (340) 36.1 (321) 29.1 (274) -0.9 14.2 0.001 34.5 35.1 33.3 -1.3 2.5 0.78
Previous stroke/TIA 17.2 (164) 19.9 (177) 18.9 (178) -7.0 -4.3 0.32 19.5 17.6 19.1 5.0 1.1 0.62
High cholesterol 60.4 (576) 58.9 (524) 60.4 (570) 3.1 0.0 0.75 59.1 59.5 60.9 -0.8 -3.6 0.78
Current smoker 19.8 (189) 19.1 (170) 17.0 (160) 1.8 7.4 0.25 19.2 18.7 17.8 1.4 3.7 0.79
Asthma/COPD 17.8 (170) 21.5 (191) 19.7 (186) -9.2 -4.8 0.14 20.0 19.2 19.8 2.0 0.5 0.93
Diabetes 36.1 (344) 23.1 (205) 29.4 (277) 28.9 14.4 <0.001 32.5 34.0 32.9 -3.2 -0.7 0.85
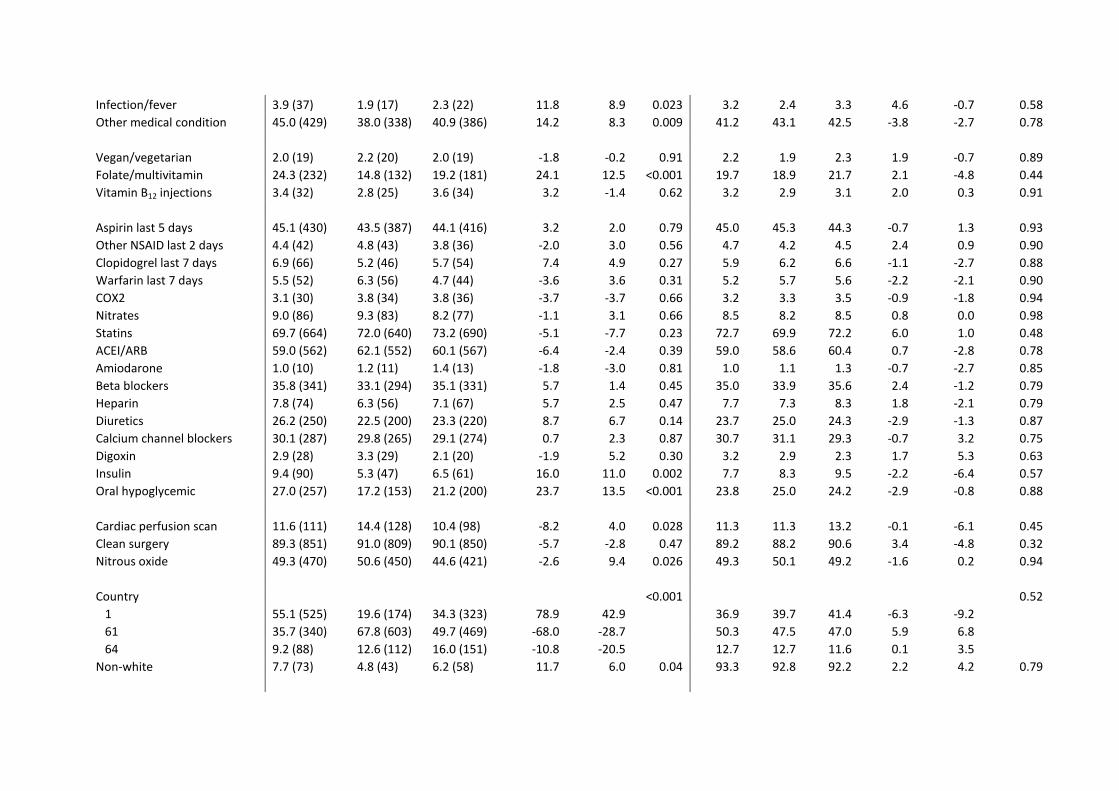
Infection/fever 3.9 (37) 1.9 (17) 2.3 (22) 11.8 8.9 0.023 3.2 2.4 3.3 4.6 -0.7 0.58
Other medical condition 45.0 (429) 38.0 (338) 40.9 (386) 14.2 8.3 0.009 41.2 43.1 42.5 -3.8 -2.7 0.78
Vegan/vegetarian 2.0 (19) 2.2 (20) 2.0 (19) -1.8 -0.2 0.91 2.2 1.9 2.3 1.9 -0.7 0.89
Folate/multivitamin 24.3 (232) 14.8 (132) 19.2 (181) 24.1 12.5 <0.001 19.7 18.9 21.7 2.1 -4.8 0.44
Vitamin B12 injections 3.4 (32) 2.8 (25) 3.6 (34) 3.2 -1.4 0.62 3.2 2.9 3.1 2.0 0.3 0.91
Aspirin last 5 days 45.1 (430) 43.5 (387) 44.1 (416) 3.2 2.0 0.79 45.0 45.3 44.3 -0.7 1.3 0.93
Other NSAID last 2 days 4.4 (42) 4.8 (43) 3.8 (36) -2.0 3.0 0.56 4.7 4.2 4.5 2.4 0.9 0.90
Clopidogrel last 7 days 6.9 (66) 5.2 (46) 5.7 (54) 7.4 4.9 0.27 5.9 6.2 6.6 -1.1 -2.7 0.88
Warfarin last 7 days 5.5 (52) 6.3 (56) 4.7 (44) -3.6 3.6 0.31 5.2 5.7 5.6 -2.2 -2.1 0.90
COX2 3.1 (30) 3.8 (34) 3.8 (36) -3.7 -3.7 0.66 3.2 3.3 3.5 -0.9 -1.8 0.94
Nitrates 9.0 (86) 9.3 (83) 8.2 (77) -1.1 3.1 0.66 8.5 8.2 8.5 0.8 0.0 0.98
Statins 69.7 (664) 72.0 (640) 73.2 (690) -5.1 -7.7 0.23 72.7 69.9 72.2 6.0 1.0 0.48
ACEI/ARB 59.0 (562) 62.1 (552) 60.1 (567) -6.4 -2.4 0.39 59.0 58.6 60.4 0.7 -2.8 0.78
Amiodarone 1.0 (10) 1.2 (11) 1.4 (13) -1.8 -3.0 0.81 1.0 1.1 1.3 -0.7 -2.7 0.85
Beta blockers 35.8 (341) 33.1 (294) 35.1 (331) 5.7 1.4 0.45 35.0 33.9 35.6 2.4 -1.2 0.79
Heparin 7.8 (74) 6.3 (56) 7.1 (67) 5.7 2.5 0.47 7.7 7.3 8.3 1.8 -2.1 0.79
Diuretics 26.2 (250) 22.5 (200) 23.3 (220) 8.7 6.7 0.14 23.7 25.0 24.3 -2.9 -1.3 0.87
Calcium channel blockers 30.1 (287) 29.8 (265) 29.1 (274) 0.7 2.3 0.87 30.7 31.1 29.3 -0.7 3.2 0.75
Digoxin 2.9 (28) 3.3 (29) 2.1 (20) -1.9 5.2 0.30 3.2 2.9 2.3 1.7 5.3 0.63
Insulin 9.4 (90) 5.3 (47) 6.5 (61) 16.0 11.0 0.002 7.7 8.3 9.5 -2.2 -6.4 0.57
Oral hypoglycemic 27.0 (257) 17.2 (153) 21.2 (200) 23.7 13.5 <0.001 23.8 25.0 24.2 -2.9 -0.8 0.88
Cardiac perfusion scan 11.6 (111) 14.4 (128) 10.4 (98) -8.2 4.0 0.028 11.3 11.3 13.2 -0.1 -6.1 0.45
Clean surgery 89.3 (851) 91.0 (809) 90.1 (850) -5.7 -2.8 0.47 89.2 88.2 90.6 3.4 -4.8 0.32
Nitrous oxide 49.3 (470) 50.6 (450) 44.6 (421) -2.6 9.4 0.026 49.3 50.1 49.2 -1.6 0.2 0.94
Country
<0.001
0.52
1 55.1 (525) 19.6 (174) 34.3 (323) 78.9 42.9
36.9 39.7 41.4 -6.3 -9.2 61 35.7 (340) 67.8 (603) 49.7 (469) -68.0 -28.7
50.3 47.5 47.0 5.9 6.8
64 9.2 (88) 12.6 (112) 16.0 (151) -10.8 -20.5
12.7 12.7 11.6 0.1 3.5 Non-white 7.7 (73) 4.8 (43) 6.2 (58) 11.7 6.0 0.04 93.3 92.8 92.2 2.2 4.2 0.79

ASA physical status <0.001 0.76
1 or 2 17.4 (166) 24.2 (215) 25.3 (239) -16.7 -19.4
23.2 22.3 21.0 2.1 5.4 3 72.7 (693) 70.0 (622) 67.9 (640) 6.1 10.6
69.6 69.4 70.1 0.4 -1.1
4 or 5 9.9 (94) 5.8 (52) 6.8 (64) 15.0 11.2
7.3 8.3 9.0 -3.8 -6.1 PONV score <0.001 0.99
0 9.3 (89) 6.4 (57) 6.4 (60) 10.9 11.1
7.8 7.4 7.0 1.4 2.9 1 41.0 (391) 33.5 (298) 29.4 (277) 15.6 24.6
37.2 36.4 37.9 1.7 -1.5
2 39.5 (376) 44.8 (398) 45.9 (433) -10.8 -13.1
41.7 42.9 41.4 -2.3 0.8 3 10.2 (97) 15.3 (136) 18.3 (173) -15.4 -23.5
13.2 13.3 13.7 -0.2 -1.3
Exercise capacity >=4 METS 74.5 (710) 73.5 (653) 78.2 (737) 2.4 -8.6 0.048 75.6 76.3 75.2 -1.5 1.1 0.88
Surgery type <0.001 1.00
Urology/Kidney 9.0 (86) 6.5 (58) 8.1 (76) 9.3 3.5
7.8 8.5 7.8 -2.4 0.0 Neurology/spine 9.0 (86) 15.6 (139) 10.6 (100) -20.2 -5.3
9.3 9.9 11.8 -1.7 -8.2
Gastrointestinal 7.1 (68) 5.3 (47) 7.0 (66) 7.7 0.5
7.0 6.5 6.7 2.0 1.2 Liver/pancreas 6.6 (63) 3.8 (34) 5.7 (54) 12.6 3.7
6.6 7.0 5.5 -1.7 4.5
Ear, nose, throat 3.4 (32) 2.8 (25) 4.3 (41) 3.2 -5.1
3.6 3.3 3.3 1.9 1.6 Orthopedic 12.5 (119) 14.2 (126) 13.8 (130) -5.0 -3.8
12.6 13.1 13.5 -1.3 -2.6
Plastics 1.0 (10) 1.8 (16) 2.7 (25) -6.3 -11.9
2.5 2.0 1.8 4.1 5.6 Gynecology 5.9 (56) 3.6 (32) 7.7 (73) 10.7 -7.4
5.7 5.0 5.6 3.2 0.2
Vascular 39.9 (380) 42.4 (377) 34.6 (326) -5.1 11.0
39.3 39.5 39.0 -0.4 0.8 Colorectal 2.6 (25) 2.0 (18) 2.8 (26) 4.0 -0.8
2.6 2.4 2.4 1.0 1.0
Other 2.9 (28) 1.9 (17) 2.8 (26) 6.7 1.1 2.9 2.8 2.6 0.5 1.7
Duration of surgery (hours) 2.9 (1.6) 2.8 (1.5) 2.8 (1.5) 2.2 2.3 0.62 2.9
(1.7) 2.9
(1.6) 2.8
(1.5) 2.4 5.9 0.53
ASA=American Society of Anesthesiologists; BMI, body mass index; CABG/PCI, coronary artery bypass graft/percutaneous coronary intervention; COPD, chronic obstructive
pulmonary disorder; METS, metabolic equivalents; NSAID, non-steroidal anti-inflammatory drug; PONV=postoperative nausea and vomiting; Std diff, standardised
difference; TIA, transient ischemic attack.

Appendix Table 9. Risk of severe postoperative nausea and vomiting (PONV) up to 24 hours after surgery according to anti-emetics prophylaxis.
Number of
patients
with PONV
prophylaxis
PONV n(%)
Unadjusted Propensity-score adjusted
RR (95% CI) P-value RR (95% CI) P-value
Number of anti-emetics used
0 1470 105 (7.1) 1.00 (ref)
1.00 (ref)
1 2132 181 (8.5) 1.19 (0.94, 1.50) 0.14 1.06 (0.83, 1.35) 0.66
2 or more 1130 110 (9.7) 1.36 (1.06, 1.76) 0.018 1.07 (0.81, 1.41) 0.64
Anti-emetic combinations
No prophylaxis 1508 110 (7.3) 1.00 (ref)
1.00 (ref)
Dexamethasone 1146 96 (8.4) 1.15 (0.88, 1.49) 0.30 1.02 (0.75, 1.40) 0.88
5-HT3 antagonist 889 75 (8.4) 1.16 (0.87, 1.53) 0.31 1.22 (0.89, 1.68) 0.22
Dexamethasone and 5-HT3 antagonist 947 85 (9.0) 1.23 (0.94, 1.61) 0.13 0.93 (0.69, 1.27) 0.66