Embed Size (px)
Citation preview
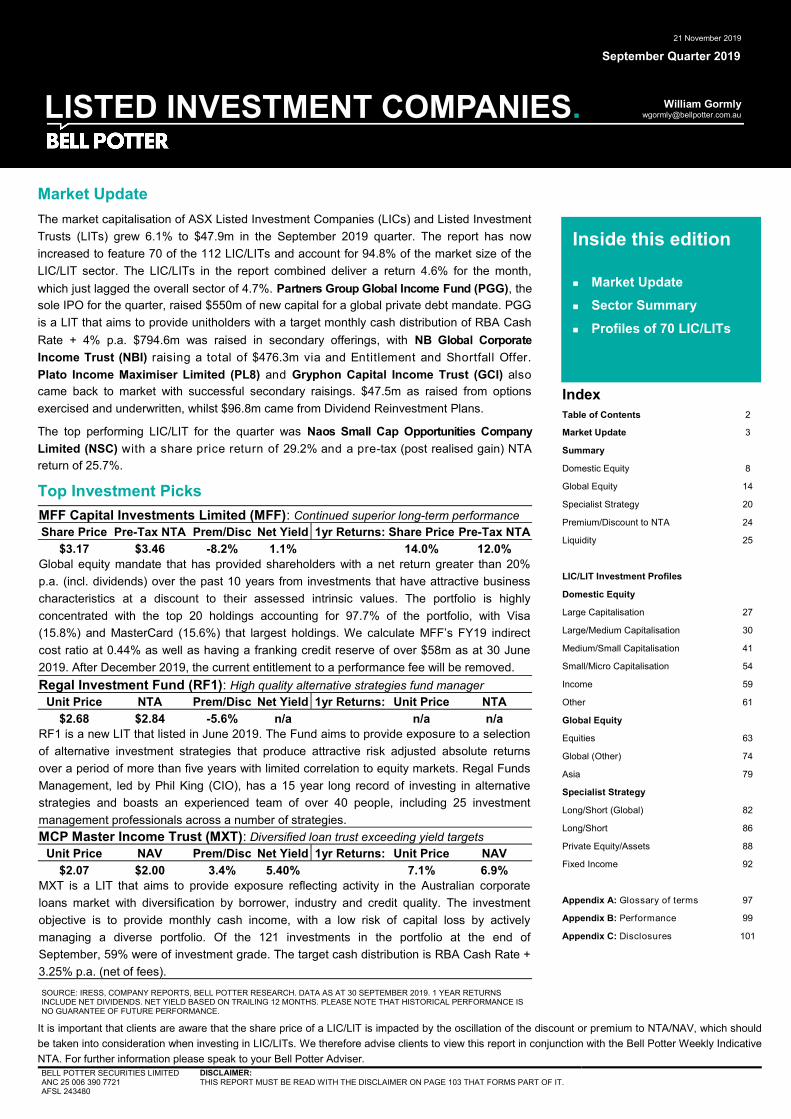
Market Update
The market capitalisation of ASX Listed Investment Companies (LICs) and Listed Investment
Trusts (LITs) grew 6.1% to $47.9m in the September 2019 quarter. The report has now
increased to feature 70 of the 112 LIC/LITs and account for 94.8% of the market size of the
LIC/LIT sector. The LIC/LITs in the report combined deliver a return 4.6% for the month,
which just lagged the overall sector of 4.7%. Partners Group Global Income Fund (PGG), the
sole IPO for the quarter, raised $550m of new capital for a global private debt mandate. PGG
is a LIT that aims to provide unitholders with a target monthly cash distribution of RBA Cash
Rate + 4% p.a. $794.6m was raised in secondary offerings, with NB Global Corporate
Income Trust (NBI) raising a total of $476.3m via and Entitlement and Shortfall Offer.
Plato Income Maximiser Limited (PL8) and Gryphon Capital Income Trust (GCI) also
came back to market with successful secondary raisings. $47.5m as raised from options
exercised and underwritten, whilst $96.8m came from Dividend Reinvestment Plans.
The top performing LIC/LIT for the quarter was Naos Small Cap Opportunities Company
Limited (NSC) with a share price return of 29.2% and a pre-tax (post realised gain) NTA
return of 25.7%.
Top Investment Picks
Inside this edition Market Update
Sector Summary
Profiles of 70 LIC/LITs
LISTED INVESTMENT COMPANIES.
21 November 2019
September Quarter 2019
William Gormly [email protected]
BELL POTTER SECURITIES LIMITED ANC 25 006 390 7721 AFSL 243480
DISCLAIMER:
THIS REPORT MUST BE READ WITH THE DISCLAIMER ON PAGE 103 THAT FORMS PART OF IT.
It is important that clients are aware that the share price of a LIC/LIT is impacted by the oscillation of the discount or premium to NTA/NAV, which should
be taken into consideration when investing in LIC/LITs. We therefore advise clients to view this report in conjunction with the Bell Potter Weekly Indicative
NTA. For further information please speak to your Bell Potter Adviser.
SOURCE: IRESS, COMPANY REPORTS, BELL POTTER RESEARCH. DATA AS AT 30 SEPTEMBER 2019. 1 YEAR RETURNS INCLUDE NET DIVIDENDS. NET YIELD BASED ON TRAILING 12 MONTHS. PLEASE NOTE THAT HISTORICAL PERFORMANCE IS NO GUARANTEE OF FUTURE PERFORMANCE.
MFF Capital Investments Limited (MFF): Continued superior long-term performance
Share Price Pre-Tax NTA Prem/Disc Net Yield 1yr Returns: Share Price Pre-Tax NTA
$3.17 $3.46 -8.2% 1.1% 14.0% 12.0%
Global equity mandate that has provided shareholders with a net return greater than 20%
p.a. (incl. dividends) over the past 10 years from investments that have attractive business
characteristics at a discount to their assessed intrinsic values. The portfolio is highly
concentrated with the top 20 holdings accounting for 97.7% of the portfolio, with Visa
(15.8%) and MasterCard (15.6%) that largest holdings. We calculate MFF’s FY19 indirect
cost ratio at 0.44% as well as having a franking credit reserve of over $58m as at 30 June
2019. After December 2019, the current entitlement to a performance fee will be removed.
Regal Investment Fund (RF1): High quality alternative strategies fund manager
Unit Price NTA Prem/Disc Net Yield 1yr Returns: Unit Price NTA
$2.68 $2.84 -5.6% n/a n/a n/a
RF1 is a new LIT that listed in June 2019. The Fund aims to provide exposure to a selection
of alternative investment strategies that produce attractive risk adjusted absolute returns
over a period of more than five years with limited correlation to equity markets. Regal Funds
Management, led by Phil King (CIO), has a 15 year long record of investing in alternative
strategies and boasts an experienced team of over 40 people, including 25 investment
management professionals across a number of strategies.
MCP Master Income Trust (MXT): Diversified loan trust exceeding yield targets
Unit Price NAV Prem/Disc Net Yield 1yr Returns: Unit Price NAV
$2.07 $2.00 3.4% 5.40% 7.1% 6.9%
MXT is a LIT that aims to provide exposure reflecting activity in the Australian corporate
loans market with diversification by borrower, industry and credit quality. The investment
objective is to provide monthly cash income, with a low risk of capital loss by actively
managing a diverse portfolio. Of the 121 investments in the portfolio at the end of
September, 59% were of investment grade. The target cash distribution is RBA Cash Rate +
3.25% p.a. (net of fees).
Index
Table of Contents 2
Market Update 3
Summary
Domestic Equity 8
Global Equity 14
Specialist Strategy 20
Premium/Discount to NTA 24
Liquidity 25
LIC/LIT Investment Profiles
Domestic Equity
Large Capitalisation 27
Large/Medium Capitalisation 30
Medium/Small Capitalisation 41
Small/Micro Capitalisation 54
Income 59
Other 61
Global Equity
Equities 63
Global (Other) 74
Asia 79
Specialist Strategy
Long/Short (Global) 82
Long/Short 86
Private Equity/Assets 88
Fixed Income 92
Appendix A: Glossary of terms 97
Appendix B: Performance 99
Appendix C: Disclosures 101
LISTED INVESTMENT COMPANIES & TRUSTS. 2
Table of Contents
Market Update 3
Summary
Domestic Equity 8
Global Equity 14
Specialist Strategy 20
Premium/Discount to NTA 24
Liquidity 25
LIC/LIT Investment Profiles
Domestic Equity
Large Capitalisation 27
AFI, ARG, AUI
Large/Medium Capitalisation 30
MLT, BKI, DUI, CIN, WLE, WHF, PIC, AMH, CAM, CLF, FSI
Medium/Small Capitalisation 41
WAM, OPH, MIR, QVE, WAX, CDM, WIC, TOP, RYD, NCC, TEK, WAA, NAC
Small/Micro Capitalisation 54
WMI, SEC, NSC, ACQ, OZG
Income 59
DJW, PL8
Other 61
SNC, FGX
Global Equity
Equities 63
MGG, MFF, WGB, PMC, PGF, PIA, TGG, EGD, EGF, WQG, EGI
Global (Other) 74
ALI, GVF, TGF, FGG, HM1
Asia 79
PAI, EAI, PAF
Specialist Strategy
Long/Short (Global) 82
LSF, VG1, APL, RF1
Long/Short 86
ALF, AEG
Private Equity/Assets 88
URB, BAF, PE1, BTI
Fixed Income 92
GCI, MXT, MOT, NBI, PCI
Appendix A: Glossary of terms 97
Appendix B: Legend to Performance Measures 99
Appendix C: Disclosures 101

LISTED INVESTMENT COMPANIES & TRUSTS. 3
Market Update
Partners Group Global Income Fund (PGG) was the sole IPO in the September 2019 quarter, raising $550m of new capital.
PGG is a Listed Investment Trust (LIT) that will be managed by Partners Group Private Markets (Australia) Pty Ltd, wholly owned
by the Swiss Partners Group Holding AG. The LIT aims to provide unitholders with exposure to a portfolio of global private debt
investments and seeking to provide unitholders with a target monthly cash distribution of RBA Cash Rate + 4% p.a. The
investments in the portfolio will be diversified outside of Australia, with the exposure predominately weighted towards the US, and
also Europe.
Figure 1 - 3Q19 IPOs
SOURCE: COMPANY DATA, IRESS & BELL POTTER
Figure 2 - LIC/LIT IPOs Figure 3 - LIC/LITs compared to the ASX
SOURCE: BLOOMBERG & BELL POTTER. *DATA AS AT 30 SEPTEMBER 2019 SOURCE: BLOOMBERG & BELL POTTER. *DATA AS AT 30 SEPTEMBER 2019
Figure 4 - Largest ASX IPOs since 2017
SOURCE: BLOOMBERG & BELL POTTER. DATA AS AT 30 SEPTEMBER 2019
Figure 5 - Cumulative IPO capital raised since 2017
SOURCE: BLOOMBERG & BELL POTTER. DATA AS AT 30 SEPTEMBER 2019
$0b
$10b
$20b
$30b
$40b
$50b
2014 2015 2016 2017 2018 2019*
$0b
$1b
$2b
$3b
$4b
$5b
LIC/LIT IPO Capital Raised (LHS) LIC/LIT Market Cap (RHS)
ASX Code Company Name Listing Date Shares Issued Issue Price Amount Raised
PGG Partners Group Global Income Fund 26-Sep-19 275,000,000 $2.00 $550,000,000
$550,000,000
$0bn
$2bn
$4bn
$6bn
$8bn
$10bn
$12bn
$14bn
$16bn
$18bn
2017 2018 2019
ASX Cumulative IPO Capital Raised LIC/LIT Cumulative IPO Capital Raised
MG
G
LS
F
VG
1
PG
G
MX
T
HM
1
WG
B
PC
I
NB
I
PL
8
MO
T
RF
1
PE
1
GC
I
TG
F
$0.0bn
$0.5bn
$1.0bn
$1.5bn
$2.0bn
$2.5bn
$3.0bn
0%
10%
20%
30%
40%
50%
60%
70%
80%
90%
100%
2014 2015 2016 2017 2018 2019*
LIC/LIT IPO Capital Raised Other ASX IPO Capital Raised

LISTED INVESTMENT COMPANIES & TRUSTS. 4
Market Update
The $794.6m in secondary raisings for the September quarter was an increase of approximately $120m from the June quarter. This
was predominately due to an Entitlement and Shortfall Offer in NB Global Corporate Income Trust (NBI) which raised a total of
$476.3m. The Offer closed on 27 June after achieving the maximum potential raise, with new units issued in July. NBI currently
targets a net distribution of 5.25% p.a. delivered as monthly income. The Trust aims to invest in a well-diversified portfolio of the
high yield bonds of global companies.
Plato Income Maximiser Limited (PL8) raised $144.4m via an Entitlement and Shortfall Offer, with the funds invest as of 12
September. Greater liquidity and lowering the management expense ratio due to economies of scale on the fixed costs were stated
as benefits of the raising.
Gryphon Capital Income Trust (GCI) also substantially grew its FUM via an Entitlement, Wholesale and Shortfall Offer. GCI
raised an additional $122.1m for a strategy that aims to provide unitholders with exposure to the Australian fixed income credit
market that includes residential mortgage-backed securities (RMBS) and asset backed securities (ABS).
Figure 6 - 3Q19 Share Purchase Plans, Placements & Entitlements
SOURCE: COMPANY DATA, IRESS & BELL POTTER
ASX Code Company Name Method Shares Issued Issue Price Amount Raised
AIQ Alternative Investment Trust Rights Issue 124,204,979 $0.10 $11,799,473
GCI Gryphon Capital Income Trust Wholesale Offer 7,017,075 $2.00 $14,034,150
GCI Gryphon Capital Income Trust Shortfall Offer 35,179,804 $2.00 $70,359,608
GCI Gryphon Capital Income Trust Entitlement Offer 18,837,196 $2.00 $37,674,392
NBI NB Global Corporate Income Trust Shortfall Offer 173,334,840 $2.00 $346,669,680
NBI NB Global Corporate Income Trust Entitlement Offer 64,793,062 $2.00 $129,586,124
PL8 Plato Income Maximiser Limited Entitlement Offer 45,228,433 $1.10 $49,751,276
PL8 Plato Income Maximiser Limited Shortfall Offer 86,023,470 $1.10 $94,625,817
QRI Qualitas Real Estate Income Fund Entitlement Offer 25,090,994 $1.60 $40,145,590
$794,646,111

LISTED INVESTMENT COMPANIES & TRUSTS. 5
Market Update
Dividend Reinvestment Plans (DRPs) added $96.8m in capital raised for the September quarter, an increase from the $19.1m
raised in the previous quarter. This was predominately due to the two largest LICs, Australian Foundation Investment Company
Limited (AFI) and Argo Investments Limited (ARG), paying dividends in August and September respectively.
Figure 7 - 3Q19 Dividend Reinvestment Plans
SOURCE: COMPANY DATA, IRESS & BELL POTTER
ASX Code Company Name Shares Issued DRP Price Amount Raised
ABW Aurora Absolute Return Fund 7,443 $0.28 $2,095
AFI Australian Foundation Investment Company Limited 5,540,584 $6.21 $34,407,027
AGM Australian Governance & Ethical Index Fund 166,559 $1.94 $323,124
AIB Aurora Global Income Trust 8,734 $0.15 $1,310
ALI Argo Global Listed Infrastructure Limited 412,146 $2.34 $964,422
AMH AMCIL Limited 3,937,545 $0.87 $3,425,664
ARG Argo Investments Limited 2,861,032 $8.05 $23,031,308
AUI Australian United Investment Company Limited 156,424 $9.13 $1,428,746
AUP Aurora Property Buy-Write Income Trust 1,556 $3.67 $5,714
BKI BKI Investment Company Limited 2,746,116 $1.61 $4,421,247
CAM Clime Capital Limited 180,586 $0.95 $172,147
CDM Cadence Capital Limited 2,331,352 $1.19 $2,781,909
DJW Djerriw arrh Investments Limited 815,113 $3.31 $2,698,024
DUI Diversif ied United Investment Limited 531,853 $4.46 $2,369,618
EAF Evans & Partners Asia Fund 764,658 $1.20 $917,590
EFF Evans & Partners Australian Flagship Fund 88,323 $1.59 $140,434
EGF Evans & Partners Global Flagship Fund 686,391 $1.57 $1,077,634
GC1 Glennon Small Companies Limited 219,811 $0.78 $170,397
MEC Morphic Ethical Equities Fund Limited 108,532 $0.87 $94,824
MGG Magellan Global Trust 3,115,819 $1.76 $5,492,566
MIR Mirrabooka Investments Limited 768,376 $2.50 $1,920,940
MLT Milton Corporation Limited 1,288,011 $4.64 $5,976,371
MOT MCP Income Opportunities Trust 101,340 $2.00 $202,842
MXT MCP Master Income Trust 483,995 $2.00 $969,707
NBI NB Global Corporate Income Trust 99,043 $2.03 $201,517
PAI Platinum Asia Investments Limited 638,517 $0.91 $583,349
PCI Perpetual Credit Income Trust 98,098 $1.10 $108,336
PGF PM Capital Global Opportunities Fund Limited 964,529 $1.06 $1,024,812
PMC Platinum Capital Limited 1,019,513 $1.45 $1,482,115
QRI Qualitas Real Estate Income Fund 46,369 $1.60 $74,204
QVE QV Equities Limited 380,059 $0.96 $365,123
$96,835,114
LISTED INVESTMENT COMPANIES & TRUSTS. 6
Market Update
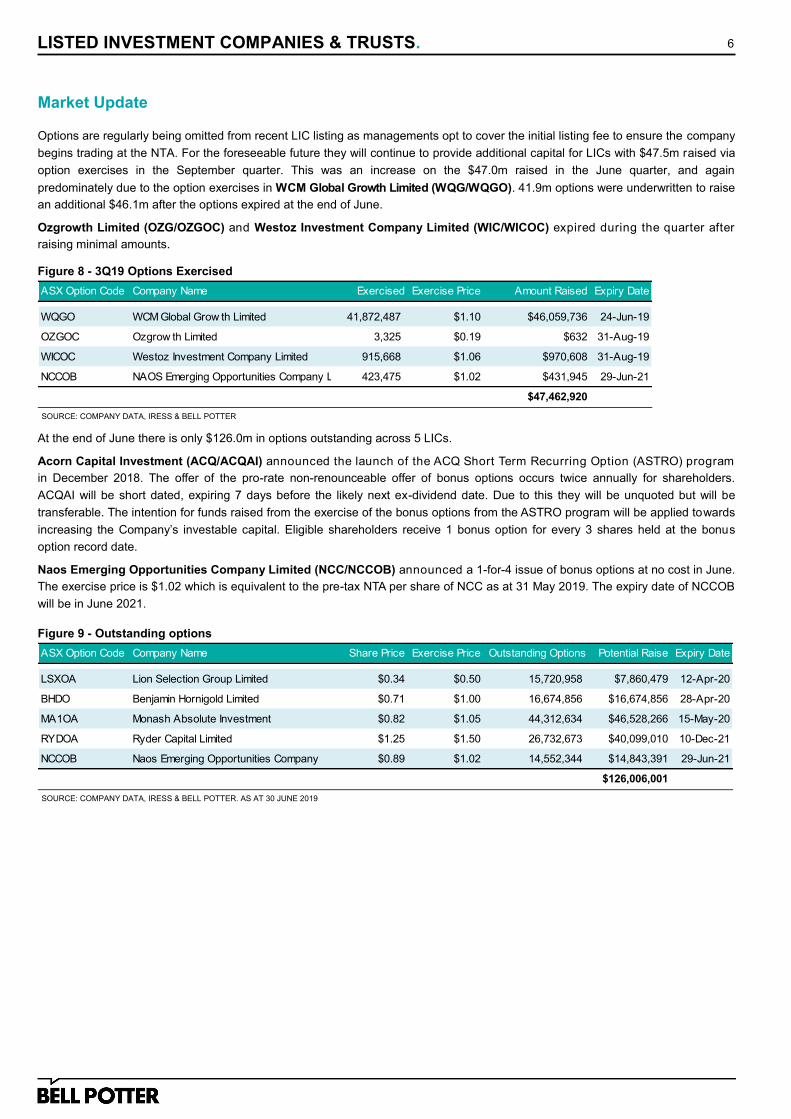
Options are regularly being omitted from recent LIC listing as managements opt to cover the initial listing fee to ensure the company
begins trading at the NTA. For the foreseeable future they will continue to provide additional capital for LICs with $47.5m raised via
option exercises in the September quarter. This was an increase on the $47.0m raised in the June quarter, and again
predominately due to the option exercises in WCM Global Growth Limited (WQG/WQGO). 41.9m options were underwritten to raise
an additional $46.1m after the options expired at the end of June.
Ozgrowth Limited (OZG/OZGOC) and Westoz Investment Company Limited (WIC/WICOC) expired during the quarter after
raising minimal amounts.
Figure 8 - 3Q19 Options Exercised
Figure 9 - Outstanding options
At the end of June there is only $126.0m in options outstanding across 5 LICs.
Acorn Capital Investment (ACQ/ACQAI) announced the launch of the ACQ Short Term Recurring Option (ASTRO) program
in December 2018. The offer of the pro-rate non-renounceable offer of bonus options occurs twice annually for shareholders.
ACQAI will be short dated, expiring 7 days before the likely next ex-dividend date. Due to this they will be unquoted but will be
transferable. The intention for funds raised from the exercise of the bonus options from the ASTRO program will be applied towards
increasing the Company’s investable capital. Eligible shareholders receive 1 bonus option for every 3 shares held at the bonus
option record date.
Naos Emerging Opportunities Company Limited (NCC/NCCOB) announced a 1-for-4 issue of bonus options at no cost in June.
The exercise price is $1.02 which is equivalent to the pre-tax NTA per share of NCC as at 31 May 2019. The expiry date of NCCOB
will be in June 2021.
SOURCE: COMPANY DATA, IRESS & BELL POTTER
SOURCE: COMPANY DATA, IRESS & BELL POTTER. AS AT 30 JUNE 2019
ASX Option Code Company Name Exercised Exercise Price Amount Raised Expiry Date
WQGO WCM Global Grow th Limited 41,872,487 $1.10 $46,059,736 24-Jun-19
OZGOC Ozgrow th Limited 3,325 $0.19 $632 31-Aug-19
WICOC Westoz Investment Company Limited 915,668 $1.06 $970,608 31-Aug-19
NCCOB NAOS Emerging Opportunities Company Limited 423,475 $1.02 $431,945 29-Jun-21
$47,462,920
ASX Option Code Company Name Share Price Exercise Price Outstanding Options Potential Raise Expiry Date
LSXOA Lion Selection Group Limited $0.34 $0.50 15,720,958 $7,860,479 12-Apr-20
BHDO Benjamin Hornigold Limited $0.71 $1.00 16,674,856 $16,674,856 28-Apr-20
MA1OA Monash Absolute Investment $0.82 $1.05 44,312,634 $46,528,266 15-May-20
RYDOA Ryder Capital Limited $1.25 $1.50 26,732,673 $40,099,010 10-Dec-21
NCCOB Naos Emerging Opportunities Company $0.89 $1.02 14,552,344 $14,843,391 29-Jun-21
$126,006,001

LISTED INVESTMENT COMPANIES & TRUSTS. 7
Investment Performance Measures
In the next section we have evaluated our LIC/LITs using the performance of both the pre-tax NTA and share price. The pre-tax
NTA data seeks to measure the performance of the underlying investments of the Fund. Whereas, the share price data measures
the performance of the security as it trades on the ASX. However, some of this terminology is a little misleading as the pre-tax NTA
actually reflects tax associated with realised capital gains (tax applicable on positions that have been exited) but not unrealised
capital gains (tax applicable on positions that have not been exited).
The measurement of a LIC/LIT’s performance is calculated after all operating expenses, provision and payment of both income and
realised capital gains tax and the reinvestment of dividends, but does not incorporate franking. LIC/LIT returns will consequently be
understated relative to the Index return given that the Benchmarks do not factor in operating costs or taxation. The performance of
Unlisted Unit Trusts are not measured on an after tax basis and are therefore, generally, not a valid comparison.
In order to assess a LIC/LIT’s performance, NTA and share price need to be evaluated with respect to the relative mandate and/or
benchmark, giving varying outcomes from different styles of investment. To cater for this we have separate the LIC/LITs under
coverage into 3 categories:
Domestic Equity
Global Equity
Specialist Strategy
Within each category the LIC/LITs are again group together with other like-mandated companies to assist in general comparison. In
general, the NTA has been benchmarked against the relative indices preferred by the Manager and these should be most reflective
of its mandate.
Our value-add columns seek to quantify the value generated by the Manager, being the difference between the performance of the
share price and pre-tax NTA against the relevant benchmark. A positive value indicates outperformance against the Benchmark
and a negative value indicates an underperformance.
Dividends are also an important aspect of any investment decision. The next section includes historical Net Dividend Yield and
Gross Dividend Yield for the LIC/LITs in our universe. Nonetheless, investors must realise that although historical yield is clearly a
key consideration when selecting a LIC/LIT, it is no guarantee of future yield. Please note several LIC/LITs have recently entered
the market and have not paid a dividend yet.
Dividend Reserves & Franking Credit Balance
In comparison to a trust structure, Listed Investment Companies (LICs) have an advantage in being able retain earnings through
periods to build up a dividend reserve. This assists LICs in maintaining a smooth and sustainable dividend over a long term that is
often fully franked as opposed to trusts that are required to distribute all earnings to the underlying unit holders. Given they are a
company structure, LICs are also required to pay company tax on corporate profits which adds an additional source of franking
credits than can be passed onto shareholders in addition to receiving franked dividends from the underlying holdings. Therefore,
when comparing dividend yields between LICs it can assist to look at the profit reserves and franking credit balances to analyse the
future sustainability of the current dividend.
LICs generally source income from either dividend income from the underlying holdings or from capital appreciation and realisation
of the holdings. Income that is heavy relied on from capital appreciation will tend to be more volatile and, as a result, having a stable
level of profit reserves dedicated to the future distribution of dividends can assist LICs in maintaining a dividend through periods of
poor market performance. The same methodology is applied with maintaining a franking credit balance. Many LICs will differentiate
their dividend reserves from their profit reserves which are likely to include unrealised gains and losses from investments which
may not be actually realised at the current values. We have therefore chosen to report only the specified dividend reserve when
provided to give a more accurate measure of the reverses being held for the future distribution of dividends.
The dividend reserve cover represents how many years the company could continue its last 12 month dividend with the dividend
reserves held. Both the dividend reserve and franking credit balances have been sourced from the LICs 2019 Annual Reports and
have been adjusted for the 2019 final dividend when the adjustment was made in the reports. Not that some reported dividend
reserves may not accurately represent the company’s ability to pay dividends in the future as it may include unrealised profits.
LISTED INVESTMENT COMPANIES & TRUSTS. 8
Domestic Equity LIC/LIT Summary
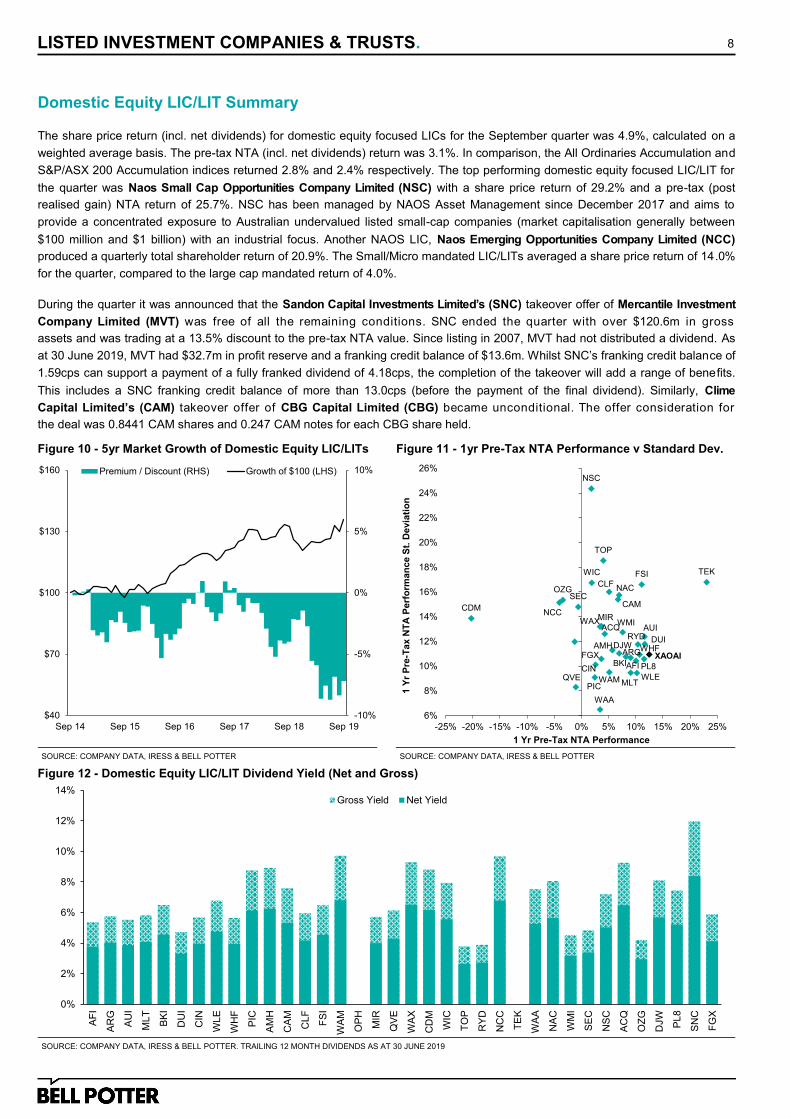
The share price return (incl. net dividends) for domestic equity focused LICs for the September quarter was 4.9%, calculated on a
weighted average basis. The pre-tax NTA (incl. net dividends) return was 3.1%. In comparison, the All Ordinaries Accumulation and
S&P/ASX 200 Accumulation indices returned 2.8% and 2.4% respectively. The top performing domestic equity focused LIC/LIT for
the quarter was Naos Small Cap Opportunities Company Limited (NSC) with a share price return of 29.2% and a pre-tax (post
realised gain) NTA return of 25.7%. NSC has been managed by NAOS Asset Management since December 2017 and aims to
provide a concentrated exposure to Australian undervalued listed small-cap companies (market capitalisation generally between
$100 million and $1 billion) with an industrial focus. Another NAOS LIC, Naos Emerging Opportunities Company Limited (NCC)
produced a quarterly total shareholder return of 20.9%. The Small/Micro mandated LIC/LITs averaged a share price return of 14.0%
for the quarter, compared to the large cap mandated return of 4.0%.
During the quarter it was announced that the Sandon Capital Investments Limited’s (SNC) takeover offer of Mercantile Investment
Company Limited (MVT) was free of all the remaining conditions. SNC ended the quarter with over $120.6m in gross
assets and was trading at a 13.5% discount to the pre-tax NTA value. Since listing in 2007, MVT had not distributed a dividend. As
at 30 June 2019, MVT had $32.7m in profit reserve and a franking credit balance of $13.6m. Whilst SNC’s franking credit balance of
1.59cps can support a payment of a fully franked dividend of 4.18cps, the completion of the takeover will add a range of benefits.
This includes a SNC franking credit balance of more than 13.0cps (before the payment of the final dividend). Similarly, Clime
Capital Limited’s (CAM) takeover offer of CBG Capital Limited (CBG) became unconditional. The offer consideration for
the deal was 0.8441 CAM shares and 0.247 CAM notes for each CBG share held.
Figure 10 - 5yr Market Growth of Domestic Equity LIC/LITs Figure 11 - 1yr Pre-Tax NTA Performance v Standard Dev.
Figure 12 - Domestic Equity LIC/LIT Dividend Yield (Net and Gross)
SOURCE: COMPANY DATA, IRESS & BELL POTTER SOURCE: COMPANY DATA, IRESS & BELL POTTER
SOURCE: COMPANY DATA, IRESS & BELL POTTER. TRAILING 12 MONTH DIVIDENDS AS AT 30 JUNE 2019
-10%
-5%
0%
5%
10%
$40
$70
$100
$130
$160
Sep 14 Sep 15 Sep 16 Sep 17 Sep 18 Sep 19
Premium / Discount (RHS) Growth of $100 (LHS)
AFI
ARG
AUI
MLT
BKI
DUI
CINWLE
WHF
PIC
AMH
CAM
CLFFSI
WAM
MIR
QVE
WAX
CDM
WIC
TOP
RYD
NCC
TEK
WAA
NAC
WMI
SEC
NSC
ACQ
OZG
DJW
PL8
FGX XAOAI
6%
8%
10%
12%
14%
16%
18%
20%
22%
24%
26%
-25% -20% -15% -10% -5% 0% 5% 10% 15% 20% 25%
1 Y
r P
re-T
ax N
TA
Perf
orm
an
ce S
t. D
evia
tio
n
1 Yr Pre-Tax NTA Performance
0%
2%
4%
6%
8%
10%
12%
14%
AF
I
AR
G
AU
I
ML
T
BK
I
DU
I
CIN
WL
E
WH
F
PIC
AM
H
CA
M
CLF
FS
I
WA
M
OP
H
MIR
QV
E
WA
X
CD
M
WIC
TO
P
RY
D
NC
C
TE
K
WA
A
NA
C
WM
I
SE
C
NS
C
AC
Q
OZ
G
DJW
PL
8
SN
C
FG
X
Gross Yield Net Yield

LISTED INVESTMENT COMPANIES & TRUSTS. 9
Domestic Equity - NTA Summary
Figure 13 - Domestic Equity LIC/LIT Share Price Premium/Discount to NTA
SOURCE: COMPANY DATA, IRESS & BELL POTTER
AFI AFIC Large $7,696.3 $6.38 $6.48 -1.5% $5.51 15.8%
ARG Argo Investments Large $5,878.0 $8.19 $8.44 -3.0% $7.38 11.0%
AUI Australian United Investment Large $1,157.7 $9.30 $9.92 -6.2% $8.41 10.6%
MLT Milton Corporation Large/Medium $3,197.1 $4.77 $4.97 -4.0% $4.32 10.4%
BKI BKI Investment Large/Medium $1,180.8 $1.61 $1.66 -3.0% $1.56 3.2%
DUI Diversified United Investment Large/Medium $989.8 $4.68 $4.85 -3.5% $4.07 15.0%
CIN Carlton Investments Large/Medium $834.0 $31.50 $37.98 -17.1% $31.51 0.0%
WLE WAM Leaders Large/Medium $932.8 $1.19 $1.27 -6.6% $1.25 -5.0%
WHF Whitefield Large/Medium $459.7 $4.99 $5.41 -7.8% $4.91 1.6%
PIC Perpetual Equity Investment Large/Medium $366.4 $1.06 $1.13 -6.2% $1.12 -5.6%
AMH AMCIL Large/Medium $245.1 $0.88 $0.97 -9.3% $0.89 -1.1%
CAM Clime Capital Large/Medium $106.1 $0.94 $0.99 -5.1% $0.96 -2.1%
CLF Concentrated Leaders Fund Large/Medium $74.9 $1.26 $1.33 -5.3% $1.29 -2.3%
FSI Flagship Investments Large/Medium $46.5 $1.82 $2.18 -16.4% $2.04 -11.0%
WAM WAM Capital Medium/Small $1,636.1 $2.28 $2.00 14.2% $1.96 16.6%
OPH Ophir High Conviction Fund Medium/Small $498.0 $2.49 $2.70 -7.8% $2.70 -7.8%
MIR Mirrabooka Investments Medium/Small $403.1 $2.50 $2.43 2.9% $2.18 14.7%
QVE QV Equities Medium/Small $283.6 $1.03 $1.13 -9.3% $1.11 -7.7%
WAX WAM Research Medium/Small $284.5 $1.49 $1.27 17.8% $1.22 21.8%
CDM Cadence Capital Medium/Small $256.4 $0.81 $0.90 -9.5% $1.05 -22.7%
WIC Westoz Investment Medium/Small $144.9 $1.08 $1.24 -13.2% $1.21 -10.8%
TOP Thorney Opportunities Medium/Small $138.5 $0.68 $0.85 -20.4% $0.79 -14.2%
RYD Ryder Capital Medium/Small $87.0 $1.47 $1.63 -10.1% $1.49 -1.2%
NCC Naos Emerging Opportunities Medium/Small $64.4 $1.07 $1.17 -8.5% $1.17 -8.5%
TEK Thorney Technologies Medium/Small $70.8 $0.28 $0.34 -19.6% $0.37 -25.1%
WAA WAM Active Medium/Small $51.8 $1.12 $1.08 3.7% $1.08 3.7%
NAC Naos Ex-50 Opportunities Medium/Small $47.9 $0.93 $1.15 -19.1% $1.11 -16.2%
WMI WAM Microcap Small/Micro $200.0 $1.42 $1.43 -0.7% $1.38 3.2%
SEC Spheria Emerging Companies Small/Micro $117.4 $1.77 $2.04 -13.1% $2.07 -14.4%
NSC Naos Small Cap Opportunities Small/Micro $119.1 $0.73 $0.90 -19.4% $0.88 -17.6%
ACQ Acorn Capital Investment Small/Micro $57.3 $1.08 $1.34 -19.2% $1.28 -15.6%
OZG Ozgrowth Small/Micro $60.5 $0.17 $0.21 -20.2% $0.21 -18.7%
DJW Djerriwarrh Investments Income $786.8 $3.52 $3.27 7.6% $3.24 8.6%
PL8 Plato Income Maximiser Income $488.4 $1.14 $1.10 3.4% $1.11 3.0%
SNC Sandon Capital Investments Activist $85.9 $0.84 $0.97 -13.5% $0.95 -11.9%
FGX Future Generation Investment Fund of Funds $452.9 $1.14 $1.27 -10.4% $1.24 -8.4%
Arithmetic Average (Domestic) -7.2% -2.5%
Arithmetic Average (Investment Mandate - Large) -3.6% 12.4%
Arithmetic Average (Investment Mandate - Large/Medium) -7.6% 0.3%
Arithmetic Average (Investment Mandate - Medium/Small) -6.1% -4.4%
Arithmetic Average (Investment Mandate - Small/Micro) -14.5% -12.6%
Arithmetic Average (Investment Mandate - Income) 5.5% 5.8%
Weighted Average (Domestic) -2.7% 8.9%
Post-tax
NTA/NAV
Prem/
Disc
Pre-tax
NTA/NAV
Prem/
Disc
ASX
CodeCompany/Trust Name Investment Mandate
Market
Cap (m)
Share/Unit
Price

LISTED INVESTMENT COMPANIES & TRUSTS. 10
Domestic Equity - Dividend Summary
Figure 14 - Domestic Equity LIC/LIT Historical Dividend Yield
SOURCE: COMPANY DATA, IRESS & BELL POTTER. *TRAILING 12 MONTH DIVIDENDS/DISTRIBUTIONS PAID, EXCLUDING SPECIAL DIVIDENDS/DISTRIBUTIONS.
AFI AFIC Large $7,696.3 $6.38 $0.240 3.8% 100% 5.4%
ARG Argo Investments Large $5,878.0 $8.19 $0.330 4.0% 100% 5.8%
AUI Australian United Investment Large $1,157.7 $9.30 $0.360 3.9% 100% 5.5%
MLT Milton Corporation Large/Medium $3,197.1 $4.77 $0.194 4.1% 100% 5.8%
BKI BKI Investment Large/Medium $1,180.8 $1.61 $0.073 4.5% 100% 6.5%
DUI Diversified United Investment Large/Medium $989.8 $4.68 $0.155 3.3% 100% 4.7%
CIN Carlton Investments Large/Medium $834.0 $31.50 $1.250 4.0% 100% 5.7%
WLE WAM Leaders Large/Medium $932.8 $1.19 $0.057 4.7% 100% 6.8%
WHF Whitefield Large/Medium $459.7 $4.99 $0.198 4.0% 100% 5.7%
PIC Perpetual Equity Investment Large/Medium $366.4 $1.06 $0.065 6.1% 100% 8.8%
AMH AMCIL Large/Medium $245.1 $0.88 $0.055 6.3% 100% 8.9%
CAM Clime Capital Large/Medium $106.1 $0.94 $0.050 5.3% 100% 7.6%
CLF Concentrated Leaders Fund Large/Medium $74.9 $1.26 $0.053 4.2% 100% 6.0%
FSI Flagship Investments Large/Medium $46.5 $1.82 $0.083 4.5% 100% 6.5%
WAM WAM Capital Medium/Small $1,636.1 $2.28 $0.155 6.8% 100% 9.7%
OPH Ophir High Conviction Fund Medium/Small $498.0 $2.49 $0.000 0.0% - 0.0%
MIR Mirrabooka Investments Medium/Small $403.1 $2.50 $0.100 4.0% 100% 5.7%
QVE QV Equities Medium/Small $283.6 $1.03 $0.044 4.3% 100% 6.1%
WAX WAM Research Medium/Small $284.5 $1.49 $0.097 6.5% 100% 9.3%
CDM Cadence Capital Medium/Small $256.4 $0.81 $0.050 6.2% 100% 8.8%
WIC Westoz Investment Medium/Small $144.9 $1.08 $0.060 5.6% 100% 7.9%
TOP Thorney Opportunities Medium/Small $138.5 $0.68 $0.018 2.6% 100% 3.8%
RYD Ryder Capital Medium/Small $87.0 $1.47 $0.040 2.7% 100% 3.9%
NCC Naos Emerging Opportunities Medium/Small $64.4 $1.07 $0.073 6.8% 100% 9.7%
TEK Thorney Technologies Medium/Small $70.8 $0.28 $0.000 0.0% - 0.0%
WAA WAM Active Medium/Small $51.8 $1.12 $0.059 5.3% 100% 7.5%
NAC Naos Ex-50 Opportunities Medium/Small $47.9 $0.93 $0.053 5.6% 100% 8.1%
WMI WAM Microcap Small/Micro $200.0 $1.42 $0.045 3.2% 100% 4.5%
SEC Spheria Emerging Companies Small/Micro $117.4 $1.77 $0.060 3.4% 100% 4.8%
NSC Naos Small Cap Opportunities Small/Micro $119.1 $0.73 $0.037 5.0% 100% 7.2%
ACQ Acorn Capital Investment Small/Micro $57.3 $1.08 $0.070 6.5% 100% 9.3%
OZG Ozgrowth Small/Micro $60.5 $0.17 $0.005 2.9% 100% 4.2%
DJW Djerriwarrh Investments Income $786.8 $3.52 $0.200 5.7% 100% 8.1%
PL8 Plato Income Maximiser Income $488.4 $1.14 $0.059 5.2% 100% 7.4%
SNC Sandon Capital Investments Activist $85.9 $0.84 $0.070 8.4% 100% 12.0%
FGX Future Generation Investment Fund of Funds $452.9 $1.14 $0.047 4.1% 100% 5.9%
Arithmetic Average (Domestic) 4.5% 6.5%
Arithmetic Average (Investment Mandate - Large) 3.9% 5.6%
Arithmetic Average (Investment Mandate - Large/Medium) 4.6% 6.6%
Arithmetic Average (Investment Mandate - Medium/Small) 4.3% 6.5%
Arithmetic Average (Investment Mandate - Small/Micro) 4.2% 5.2%
Arithmetic Average (Investment Mandate - Income) 5.8% 8.4%
Weighted Average (Domestic) 4.2% 6.0%
Dividend
TTM*
Net
YieldFranking
Gross
Yield
ASX
CodeCompany/Trust Name Investment Mandate
Market
Cap (m)
Share/Unit
Price

LISTED INVESTMENT COMPANIES & TRUSTS. 11
Domestic Equity - Pre-Tax NTA Performance Summary
Figure 15 - Domestic Equity LIC/LIT Pre-Tax NTA Performance
SOURCE: COMPANY DATA, IRESS & BELL POTTER
3m 6m 1y 3y 5y 3m 6m 1y 3y 5y
AFI AFIC Large 2.0 9.8 10.0 9.7 7.2 -0.4 -0.7 -2.5 -2.2 -2.3
ARG Argo Investments Large 2.3 8.6 9.0 9.2 7.4 -0.1 -1.9 -3.5 -2.7 -2.1
AUI Australian United Investment Large 2.6 10.7 11.6 12.3 8.2 0.2 0.2 -0.9 0.4 -1.3
MLT Milton Corporation Large/Medium 3.2 9.1 9.0 9.8 8.1 0.4 -1.8 -3.1 -1.9 -1.6
BKI BKI Investment Large/Medium 1.1 8.1 8.2 7.4 6.0 -1.5 -2.7 -4.4 -4.5 -3.5
DUI Diversified United Investment Large/Medium 2.4 10.4 11.6 14.2 10.1 0.0 -0.1 -0.9 2.3 0.6
CIN Carlton Investments Large/Medium 5.8 6.5 2.6 4.4 8.4 3.4 -4.0 -9.9 -7.5 -1.1
WLE WAM Leaders Large/Medium 2.3 8.6 10.2 7.4 - -0.1 -1.9 -2.3 -4.5 -
WHF Whitefield Large/Medium 3.4 12.1 10.7 8.3 8.4 -0.5 -0.9 -2.2 -2.0 -1.4
PIC Perpetual Equity Investment Large/Medium -0.4 6.1 2.5 7.0 - -3.0 -4.7 -10.1 -4.9 -
AMH AMCIL Large/Medium 2.6 9.3 5.7 6.4 7.2 0.2 -1.2 -6.8 -5.5 -2.3
CAM Clime Capital Large/Medium 3.4 10.4 6.7 9.1 4.8 0.6 -0.5 -5.4 -2.6 -4.9
CLF Concentrated Leaders Fund Large/Medium -0.4 3.8 5.1 - - -2.8 -6.7 -7.4 - -
FSI Flagship Investments Large/Medium 5.3 9.8 11.1 10.3 9.5 2.5 -1.1 -1.0 -1.4 -0.2
WAM WAM Capital Medium/Small 8.0 11.9 5.1 6.6 9.8 5.2 1.0 -7.0 -5.1 0.1
OPH Ophir High Conviction Fund Medium/Small 3.4 9.8 - - - 0.2 2.0 - - -
MIR Mirrabooka Investments Medium/Small 4.0 9.0 3.6 6.8 9.0 0.8 1.2 0.0 -3.1 -3.0
QVE QV Equities Medium/Small 0.2 2.0 -1.0 2.9 6.3 -2.4 -8.8 -13.6 -9.0 -3.2
WAX WAM Research Medium/Small 6.4 12.3 3.4 6.3 10.3 3.6 1.4 -8.7 -5.4 0.6
CDM Cadence Capital Medium/Small 0.1 -2.9 -20.3 -2.1 -1.6 -2.7 -13.8 -32.4 -13.8 -11.3
WIC Westoz Investment Medium/Small 10.5 10.5 1.9 10.0 6.2 7.4 3.5 -2.0 1.2 -3.4
TOP Thorney Opportunities Medium/Small 1.1 9.7 4.0 6.4 14.4 -2.0 2.7 0.1 -2.4 4.8
RYD Ryder Capital Medium/Small 10.8 18.2 10.4 15.2 - 9.5 15.5 4.8 9.5 -
NCC Naos Emerging Opportunities Medium/Small 17.0 10.4 -4.1 -0.8 4.3 13.9 3.4 -8.0 -9.6 -5.3
TEK Thorney Technologies Medium/Small 10.3 24.4 23.0 - - 7.5 13.5 10.9 - -
WAA WAM Active Medium/Small 3.4 6.1 3.4 5.6 7.1 0.6 -4.8 -8.7 -6.1 -2.6
NAC Naos Ex-50 Opportunities Medium/Small 13.9 14.3 6.9 2.4 - 9.8 0.9 -6.3 -8.0 -
WMI WAM Microcap Small/Micro 9.0 15.3 7.6 - - 5.9 8.3 3.7 - -
SEC Spheria Emerging Companies Small/Micro 1.7 2.5 -0.6 - - -1.4 -4.5 -4.5 - -
NSC Naos Small Cap Opportunities Small/Micro 25.7 20.7 1.8 -3.8 0.8 22.6 13.7 -2.1 -12.6 -8.8
ACQ Acorn Capital Investment Small/Micro 11.1 11.8 4.3 6.9 9.6 8.0 4.8 0.4 -1.9 0.0
OZG Ozgrowth Small/Micro 10.0 10.0 -3.4 4.0 2.8 6.9 3.0 -7.3 -4.8 -6.8
DJW Djerriwarrh Investments Income 1.9 7.7 6.9 8.1 5.2 -0.5 -2.8 -5.6 -3.8 -4.3
PL8 Plato Income Maximiser Income 2.5 10.3 11.5 - - -0.4 -1.1 -2.8 - -
SNC Sandon Capital Investments Activist 6.9 5.4 -1.3 5.7 6.0 6.6 4.8 -2.9 4.0 4.1
FGX Future Generation Investment Fund of Funds 3.8 8.2 3.7 6.6 6.7 1.0 -2.7 -8.4 -5.1 -3.0
Arithmetic Average (Domestic) 5.5 9.7 5.2 6.7 7.0 2.8 0.4 -4.6 -3.8 -2.4
Arithmetic Average (Investment Mandate - Large) 2.3 9.7 10.2 10.4 7.6 -0.1 -0.8 -2.3 -1.5 -1.9
Arithmetic Average (Investment Mandate - Large/Medium) 2.6 8.6 7.6 8.4 7.8 -0.1 -2.3 -4.9 -3.3 -1.8
Arithmetic Average (Investment Mandate - Medium/Small) 6.9 10.4 3.0 5.4 7.3 4.0 1.4 -5.9 -4.7 -2.6
Arithmetic Average (Investment Mandate - Small/Micro) 11.5 12.1 1.9 2.3 4.4 8.4 5.1 -2.0 -6.4 -5.2
Arithmetic Average (Investment Mandate - Income) 2.2 9.0 9.2 8.1 5.2 -0.5 -2.0 -4.2 -3.8 -4.3
Weighted Average (Domestic) 3.1 9.3 8.1 0.5 -1.1 -3.8
Company/Trust Name Investment Mandate Performance (%) Value-add+ (%)
Pre-tax NTA/NAVASX
Code
LISTED INVESTMENT COMPANIES & TRUSTS. 12
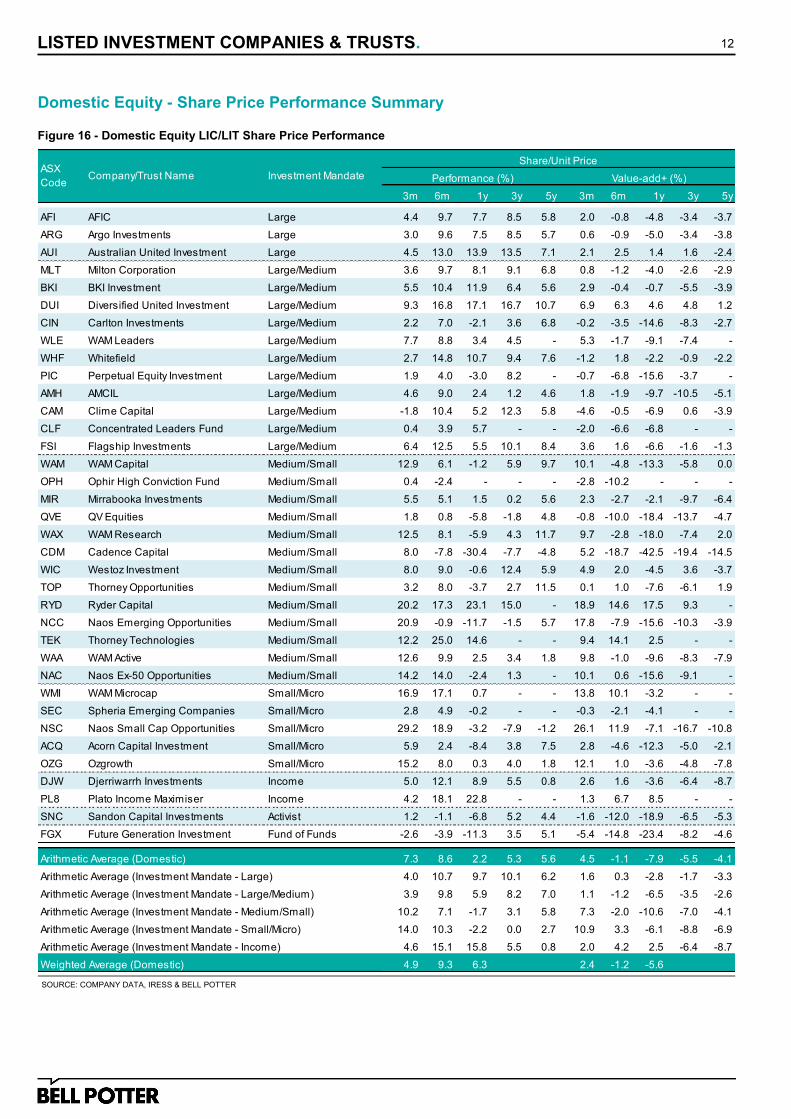
Domestic Equity - Share Price Performance Summary
Figure 16 - Domestic Equity LIC/LIT Share Price Performance
SOURCE: COMPANY DATA, IRESS & BELL POTTER
3m 6m 1y 3y 5y 3m 6m 1y 3y 5y
AFI AFIC Large 4.4 9.7 7.7 8.5 5.8 2.0 -0.8 -4.8 -3.4 -3.7
ARG Argo Investments Large 3.0 9.6 7.5 8.5 5.7 0.6 -0.9 -5.0 -3.4 -3.8
AUI Australian United Investment Large 4.5 13.0 13.9 13.5 7.1 2.1 2.5 1.4 1.6 -2.4
MLT Milton Corporation Large/Medium 3.6 9.7 8.1 9.1 6.8 0.8 -1.2 -4.0 -2.6 -2.9
BKI BKI Investment Large/Medium 5.5 10.4 11.9 6.4 5.6 2.9 -0.4 -0.7 -5.5 -3.9
DUI Diversified United Investment Large/Medium 9.3 16.8 17.1 16.7 10.7 6.9 6.3 4.6 4.8 1.2
CIN Carlton Investments Large/Medium 2.2 7.0 -2.1 3.6 6.8 -0.2 -3.5 -14.6 -8.3 -2.7
WLE WAM Leaders Large/Medium 7.7 8.8 3.4 4.5 - 5.3 -1.7 -9.1 -7.4 -
WHF Whitefield Large/Medium 2.7 14.8 10.7 9.4 7.6 -1.2 1.8 -2.2 -0.9 -2.2
PIC Perpetual Equity Investment Large/Medium 1.9 4.0 -3.0 8.2 - -0.7 -6.8 -15.6 -3.7 -
AMH AMCIL Large/Medium 4.6 9.0 2.4 1.2 4.6 1.8 -1.9 -9.7 -10.5 -5.1
CAM Clime Capital Large/Medium -1.8 10.4 5.2 12.3 5.8 -4.6 -0.5 -6.9 0.6 -3.9
CLF Concentrated Leaders Fund Large/Medium 0.4 3.9 5.7 - - -2.0 -6.6 -6.8 - -
FSI Flagship Investments Large/Medium 6.4 12.5 5.5 10.1 8.4 3.6 1.6 -6.6 -1.6 -1.3
WAM WAM Capital Medium/Small 12.9 6.1 -1.2 5.9 9.7 10.1 -4.8 -13.3 -5.8 0.0
OPH Ophir High Conviction Fund Medium/Small 0.4 -2.4 - - - -2.8 -10.2 - - -
MIR Mirrabooka Investments Medium/Small 5.5 5.1 1.5 0.2 5.6 2.3 -2.7 -2.1 -9.7 -6.4
QVE QV Equities Medium/Small 1.8 0.8 -5.8 -1.8 4.8 -0.8 -10.0 -18.4 -13.7 -4.7
WAX WAM Research Medium/Small 12.5 8.1 -5.9 4.3 11.7 9.7 -2.8 -18.0 -7.4 2.0
CDM Cadence Capital Medium/Small 8.0 -7.8 -30.4 -7.7 -4.8 5.2 -18.7 -42.5 -19.4 -14.5
WIC Westoz Investment Medium/Small 8.0 9.0 -0.6 12.4 5.9 4.9 2.0 -4.5 3.6 -3.7
TOP Thorney Opportunities Medium/Small 3.2 8.0 -3.7 2.7 11.5 0.1 1.0 -7.6 -6.1 1.9
RYD Ryder Capital Medium/Small 20.2 17.3 23.1 15.0 - 18.9 14.6 17.5 9.3 -
NCC Naos Emerging Opportunities Medium/Small 20.9 -0.9 -11.7 -1.5 5.7 17.8 -7.9 -15.6 -10.3 -3.9
TEK Thorney Technologies Medium/Small 12.2 25.0 14.6 - - 9.4 14.1 2.5 - -
WAA WAM Active Medium/Small 12.6 9.9 2.5 3.4 1.8 9.8 -1.0 -9.6 -8.3 -7.9
NAC Naos Ex-50 Opportunities Medium/Small 14.2 14.0 -2.4 1.3 - 10.1 0.6 -15.6 -9.1 -
WMI WAM Microcap Small/Micro 16.9 17.1 0.7 - - 13.8 10.1 -3.2 - -
SEC Spheria Emerging Companies Small/Micro 2.8 4.9 -0.2 - - -0.3 -2.1 -4.1 - -
NSC Naos Small Cap Opportunities Small/Micro 29.2 18.9 -3.2 -7.9 -1.2 26.1 11.9 -7.1 -16.7 -10.8
ACQ Acorn Capital Investment Small/Micro 5.9 2.4 -8.4 3.8 7.5 2.8 -4.6 -12.3 -5.0 -2.1
OZG Ozgrowth Small/Micro 15.2 8.0 0.3 4.0 1.8 12.1 1.0 -3.6 -4.8 -7.8
DJW Djerriwarrh Investments Income 5.0 12.1 8.9 5.5 0.8 2.6 1.6 -3.6 -6.4 -8.7
PL8 Plato Income Maximiser Income 4.2 18.1 22.8 - - 1.3 6.7 8.5 - -
SNC Sandon Capital Investments Activist 1.2 -1.1 -6.8 5.2 4.4 -1.6 -12.0 -18.9 -6.5 -5.3
FGX Future Generation Investment Fund of Funds -2.6 -3.9 -11.3 3.5 5.1 -5.4 -14.8 -23.4 -8.2 -4.6
Arithmetic Average (Domestic) 7.3 8.6 2.2 5.3 5.6 4.5 -1.1 -7.9 -5.5 -4.1
Arithmetic Average (Investment Mandate - Large) 4.0 10.7 9.7 10.1 6.2 1.6 0.3 -2.8 -1.7 -3.3
Arithmetic Average (Investment Mandate - Large/Medium) 3.9 9.8 5.9 8.2 7.0 1.1 -1.2 -6.5 -3.5 -2.6
Arithmetic Average (Investment Mandate - Medium/Small) 10.2 7.1 -1.7 3.1 5.8 7.3 -2.0 -10.6 -7.0 -4.1
Arithmetic Average (Investment Mandate - Small/Micro) 14.0 10.3 -2.2 0.0 2.7 10.9 3.3 -6.1 -8.8 -6.9
Arithmetic Average (Investment Mandate - Income) 4.6 15.1 15.8 5.5 0.8 2.0 4.2 2.5 -6.4 -8.7
Weighted Average (Domestic) 4.9 9.3 6.3 2.4 -1.2 -5.6
ASX
Code
Share/Unit Price
Performance (%) Value-add+ (%)Company/Trust Name Investment Mandate
LISTED INVESTMENT COMPANIES & TRUSTS. 13
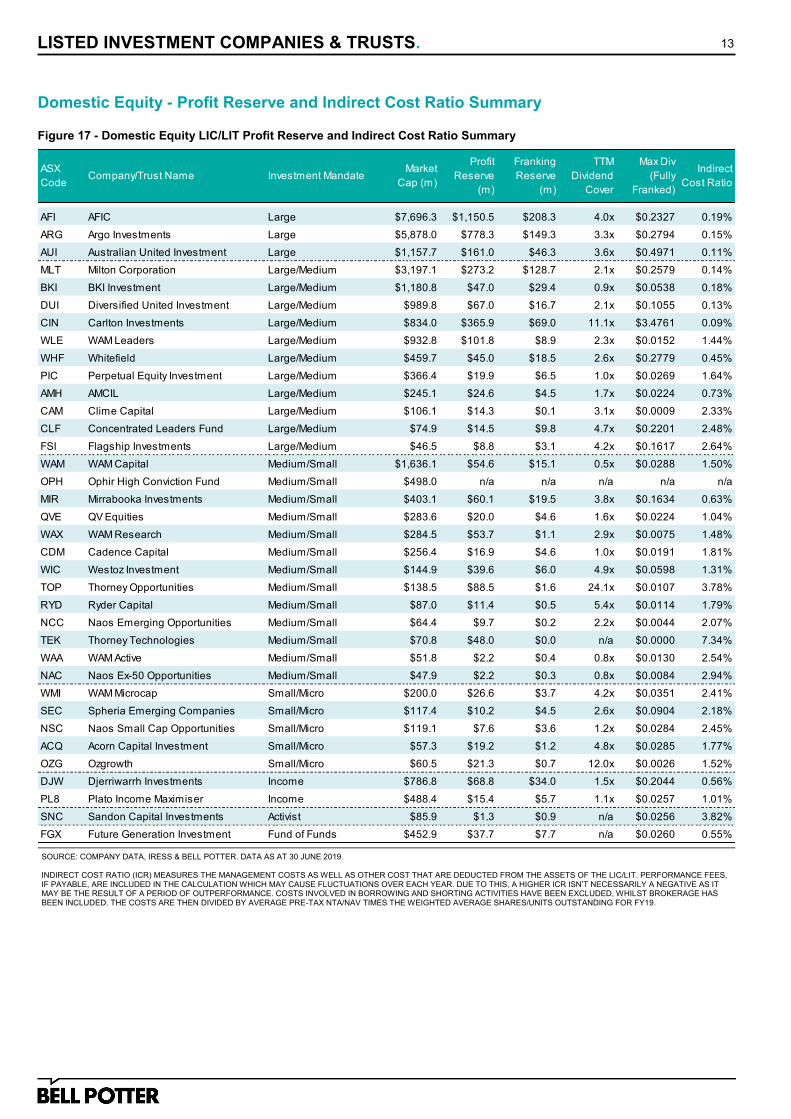
Domestic Equity - Profit Reserve and Indirect Cost Ratio Summary
Figure 17 - Domestic Equity LIC/LIT Profit Reserve and Indirect Cost Ratio Summary
SOURCE: COMPANY DATA, IRESS & BELL POTTER. DATA AS AT 30 JUNE 2019. INDIRECT COST RATIO (ICR) MEASURES THE MANAGEMENT COSTS AS WELL AS OTHER COST THAT ARE DEDUCTED FROM THE ASSETS OF THE LIC/LIT. PERFORMANCE FEES, IF PAYABLE, ARE INCLUDED IN THE CALCULATION WHICH MAY CAUSE FLUCTUATIONS OVER EACH YEAR. DUE TO THIS, A HIGHER ICR ISN’T NECESSARILY A NEGATIVE AS IT MAY BE THE RESULT OF A PERIOD OF OUTPERFORMANCE. COSTS INVOLVED IN BORROWING AND SHORTING ACTIVITIES HAVE BEEN EXCLUDED, WHILST BROKERAGE HAS BEEN INCLUDED. THE COSTS ARE THEN DIVIDED BY AVERAGE PRE-TAX NTA/NAV TIMES THE WEIGHTED AVERAGE SHARES/UNITS OUTSTANDING FOR FY19.
AFI AFIC Large $7,696.3 $1,150.5 $208.3 4.0x $0.2327 0.19%
ARG Argo Investments Large $5,878.0 $778.3 $149.3 3.3x $0.2794 0.15%
AUI Australian United Investment Large $1,157.7 $161.0 $46.3 3.6x $0.4971 0.11%
MLT Milton Corporation Large/Medium $3,197.1 $273.2 $128.7 2.1x $0.2579 0.14%
BKI BKI Investment Large/Medium $1,180.8 $47.0 $29.4 0.9x $0.0538 0.18%
DUI Diversified United Investment Large/Medium $989.8 $67.0 $16.7 2.1x $0.1055 0.13%
CIN Carlton Investments Large/Medium $834.0 $365.9 $69.0 11.1x $3.4761 0.09%
WLE WAM Leaders Large/Medium $932.8 $101.8 $8.9 2.3x $0.0152 1.44%
WHF Whitefield Large/Medium $459.7 $45.0 $18.5 2.6x $0.2779 0.45%
PIC Perpetual Equity Investment Large/Medium $366.4 $19.9 $6.5 1.0x $0.0269 1.64%
AMH AMCIL Large/Medium $245.1 $24.6 $4.5 1.7x $0.0224 0.73%
CAM Clime Capital Large/Medium $106.1 $14.3 $0.1 3.1x $0.0009 2.33%
CLF Concentrated Leaders Fund Large/Medium $74.9 $14.5 $9.8 4.7x $0.2201 2.48%
FSI Flagship Investments Large/Medium $46.5 $8.8 $3.1 4.2x $0.1617 2.64%
WAM WAM Capital Medium/Small $1,636.1 $54.6 $15.1 0.5x $0.0288 1.50%
OPH Ophir High Conviction Fund Medium/Small $498.0 n/a n/a n/a n/a n/a
MIR Mirrabooka Investments Medium/Small $403.1 $60.1 $19.5 3.8x $0.1634 0.63%
QVE QV Equities Medium/Small $283.6 $20.0 $4.6 1.6x $0.0224 1.04%
WAX WAM Research Medium/Small $284.5 $53.7 $1.1 2.9x $0.0075 1.48%
CDM Cadence Capital Medium/Small $256.4 $16.9 $4.6 1.0x $0.0191 1.81%
WIC Westoz Investment Medium/Small $144.9 $39.6 $6.0 4.9x $0.0598 1.31%
TOP Thorney Opportunities Medium/Small $138.5 $88.5 $1.6 24.1x $0.0107 3.78%
RYD Ryder Capital Medium/Small $87.0 $11.4 $0.5 5.4x $0.0114 1.79%
NCC Naos Emerging Opportunities Medium/Small $64.4 $9.7 $0.2 2.2x $0.0044 2.07%
TEK Thorney Technologies Medium/Small $70.8 $48.0 $0.0 n/a $0.0000 7.34%
WAA WAM Active Medium/Small $51.8 $2.2 $0.4 0.8x $0.0130 2.54%
NAC Naos Ex-50 Opportunities Medium/Small $47.9 $2.2 $0.3 0.8x $0.0084 2.94%
WMI WAM Microcap Small/Micro $200.0 $26.6 $3.7 4.2x $0.0351 2.41%
SEC Spheria Emerging Companies Small/Micro $117.4 $10.2 $4.5 2.6x $0.0904 2.18%
NSC Naos Small Cap Opportunities Small/Micro $119.1 $7.6 $3.6 1.2x $0.0284 2.45%
ACQ Acorn Capital Investment Small/Micro $57.3 $19.2 $1.2 4.8x $0.0285 1.77%
OZG Ozgrowth Small/Micro $60.5 $21.3 $0.7 12.0x $0.0026 1.52%
DJW Djerriwarrh Investments Income $786.8 $68.8 $34.0 1.5x $0.2044 0.56%
PL8 Plato Income Maximiser Income $488.4 $15.4 $5.7 1.1x $0.0257 1.01%
SNC Sandon Capital Investments Activist $85.9 $1.3 $0.9 n/a $0.0256 3.82%
FGX Future Generation Investment Fund of Funds $452.9 $37.7 $7.7 n/a $0.0260 0.55%
Franking
Reserve
(m)
ASX
CodeCompany/Trust Name Investment Mandate
Market
Cap (m)
Profit
Reserve
(m)
TTM
Dividend
Cover
Max Div
(Fully
Franked)
Indirect
Cost Ratio

LISTED INVESTMENT COMPANIES & TRUSTS. 14
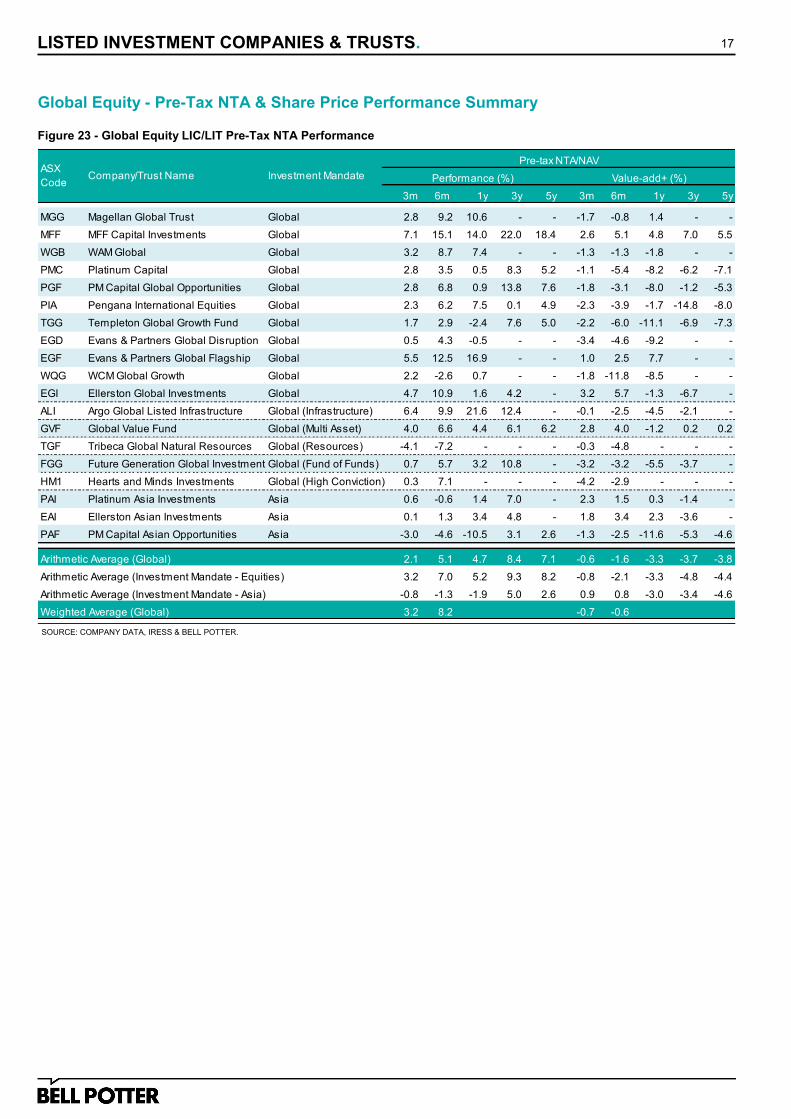
Global Equity LIC/LIT Summary
Global equity LIC/LITs collectively had a share price return (incl. net dividends) of 3.5% for the September quarter compared to the
pre-tax NTA return (incl. net dividends) of 3.2%. This compares to a 4.5% return in the MSCI World Net Total Return Index in AUD
and -1.7% in the MSCI All Country Asia ex-Japan Index in AUD. MFF Capital Investments Limited (MFF) was the top performing
global LIC/LIT based on pre-tax NTA (incl. net dividends), returning 7.1% in the quarter after returning 7.5% in the June quarter.
MFF remains a top pick amongst LIC/LITs. MFF’s share price (incl. net dividends) was 9.3% and followed by another top pick from
the June Quarterly Report, WAM Global Limited (WGB) which returned 9.1%.
There are 3 Asian equity focused LICs in the report which are trading at an average pre-tax NTA discount of 16.2% with an average
fully franked net yield of 3.8% and each over 3 times dividend cover on the trailing 12 month distribution. Despite PM Capital Asian
Opportunities Fund Limited (PAF) recording a quarterly pre-tax NTA negative return of 3.0%, compared to the benchmark -
1.7%, the share price was down 14.3%. In a similar manner, Platinum Asia Investments Limited’s (PAI) pre-tax NTA (incl. net
dividends) return for the 12 months ending September outperformed the benchmark 1.4% to 1.1%. Yet the share price return was
down 18.1% over this period, a differential of 19.6% which is the largest margin amongst all LIC/LITs in the report.
The extent of the discount to which some LIC/LITs have been trading at during 2019 has raised concern amongst many investors
and market commentators. Whilst the market since the Federal Election has seen domestic mandated LIC/LITs discounts tighten,
the discounts for many global LICs have lagged in the response. This is despite the relatively acceptable performance and, like
domestic LICs, global mandate LICs have the ability to retain profit reserves and franking credit balances to pay a smooth and
sustainable stream of fully franked dividends.
Figure 18- 5yr Market Growth of Global Equity LIC/LITs Figure 19 - 1yr Pre-Tax NTA Performance v Standard Dev.
Figure 20 - Global Equity LIC/LIT Dividend Yield (Net and Gross)
SOURCE: COMPANY DATA, IRESS & BELL POTTER
SOURCE: COMPANY DATA, IRESS & BELL POTTER. TRAILING 12 MONTH DIVIDENDS AS AT 30 JUNE 2019
SOURCE: COMPANY DATA, IRESS & BELL POTTER
-14%
-7%
0%
7%
14%
$60
$80
$100
$120
$140
Sep 14 Sep 15 Sep 16 Sep 17 Sep 18 Sep 19
Premium / Discount (RHS) Growth of $100 (LHS)
MGG
MFF
WGB
PMC
PGF
PIA
TGG
EGD
EGF
WQG
EGI
ALIGVF
FGG
PAI
EAI
PAF
MSCIAI
4%
6%
8%
10%
12%
14%
16%
18%
20%
-15% -10% -5% 0% 5% 10% 15% 20% 25%
1 Y
r P
re-T
ax N
TA
Pe
rfo
rma
nce
St.
De
via
tio
n
1 Yr Pre-Tax NTA Performance
0%
1%
2%
3%
4%
5%
6%
7%
8%
9%
10%
MGG MFF WGB PMC PGF PIA TGG EGD EGF WQG EGI ALI GVF TGF FGG HM1 PAI EAI PAF
Gross Yield Net Yield

LISTED INVESTMENT COMPANIES & TRUSTS. 15
Global Equity - NTA Summary
Figure 21 - Global Equity LIC/LIT Share Price Premium/Discount to NTA
SOURCE: COMPANY DATA, IRESS & BELL POTTER.
MGG Magellan Global Trust Global $2,243.7 $1.81 $1.85 -2.2% $1.85 -2.2%
MFF MFF Capital Investments Global $1,718.4 $3.17 $3.46 -8.2% $2.83 11.9%
WGB WAM Global Global $455.0 $2.15 $2.42 -11.2% $2.36 -8.7%
PMC Platinum Capital Global $447.4 $1.55 $1.57 -1.6% $1.52 1.7%
PGF PM Capital Global Opportunities Global $377.7 $1.07 $1.33 -19.8% $1.26 -15.3%
PIA Pengana International Equities Global $279.5 $1.10 $1.26 -12.9% $1.23 -10.6%
TGG Templeton Global Growth Fund Global $256.9 $1.22 $1.43 -14.8% $1.40 -13.3%
EGD Evans & Partners Global Disruption Global $259.9 $2.14 $2.17 -1.4% $2.17 -1.4%
EGF Evans & Partners Global Flagship Global $199.1 $1.67 $1.72 -2.9% $1.70 -1.8%
WQG WCM Global Growth Global $190.9 $1.09 $1.30 -15.8% $1.23 -11.5%
EGI Ellerston Global Investments Global $102.2 $0.96 $1.17 -18.5% $1.14 -16.1%
ALI Argo Global Listed Infrastructure Global (Infrastructure) $330.8 $2.33 $2.62 -11.1% $2.49 -6.4%
GVF Global Value Fund Global (Multi Asset) $149.9 $1.02 $1.08 -5.8% $1.06 -4.4%
TGF Tribeca Global Natural Resources Global (Resources) $121.6 $1.93 $2.29 -15.7% $2.33 -17.3%
FGG Future Generation Global Investment Global (Fund of Funds) $509.3 $1.30 $1.42 -8.4% $1.35 -4.0%
HM1 Hearts and Minds Investments Global (High Conviction) $600.0 $3.00 $3.00 0.0% $2.86 4.9%
PAI Platinum Asia Investments Asia $341.2 $0.94 $1.07 -12.1% $1.07 -12.1%
EAI Ellerston Asian Investments Asia $131.7 $0.93 $1.11 -16.0% $1.10 -15.2%
PAF PM Capital Asian Opportunities Asia $45.2 $0.80 $1.00 -20.5% $1.04 -23.5%
Arithmetic Average (Global) -10.5% -7.7%
Arithmetic Average (Investment Mandate - Equities) -9.9% -6.1%
Arithmetic Average (Investment Mandate - Asia) -16.2% -17.0%
Weighted Average (Global) -7.3% -1.8%
Prem/
Disc
Post-tax
NTA/NAV
Prem/
Disc
Pre-tax
NTA/NAV
ASX
CodeCompany/Trust Name Investment Mandate
Market
Cap (m)
Share/Unit
Price

LISTED INVESTMENT COMPANIES & TRUSTS. 16
Global Equity - Dividend Summary
Figure 22 - Global Equity LIC/LIT Historical Dividend Yield
SOURCE: COMPANY DATA, IRESS & BELL POTTER. *TRAILING 12 MONTH DIVIDENDS/DISTRIBUTIONS PAID, EXCLUDING SPECIAL DIVIDENDS/DISTRIBUTIONS.
MGG Magellan Global Trust Global $2,243.7 $1.81 $0.060 3.3% 0% 3.3%
MFF MFF Capital Investments Global $1,718.4 $3.17 $0.035 1.1% 100% 1.6%
WGB WAM Global Global $455.0 $2.15 $0.020 0.9% 100% 1.3%
PMC Platinum Capital Global $447.4 $1.55 $0.070 4.5% 100% 6.5%
PGF PM Capital Global Opportunities Global $377.7 $1.07 $0.038 3.6% 100% 5.1%
PIA Pengana International Equities Global $279.5 $1.10 $0.070 6.4% 84% 8.6%
TGG Templeton Global Growth Fund Global $256.9 $1.22 $0.070 5.8% 100% 8.2%
EGD Evans & Partners Global Disruption Global $259.9 $2.14 $0.000 0.0% - 0.0%
EGF Evans & Partners Global Flagship Global $199.1 $1.67 $0.116 7.0% 0% 7.0%
WQG WCM Global Growth Global $190.9 $1.09 $0.020 1.8% 0% 1.8%
EGI Ellerston Global Investments Global $102.2 $0.96 $0.030 3.1% 100% 4.5%
ALI Argo Global Listed Infrastructure Global (Infrastructure) $330.8 $2.33 $0.065 2.8% 100% 4.0%
GVF Global Value Fund Global (Multi Asset) $149.9 $1.02 $0.061 6.0% 84% 8.1%
TGF Tribeca Global Natural Resources Global (Resources) $121.6 $1.93 $0.000 0.0% - 0.0%
FGG Future Generation Global Investment Global (Fund of Funds) $509.3 $1.30 $0.015 1.2% 100% 1.6%
HM1 Hearts and Minds Investments Global (High Conviction) $600.0 $3.00 $0.000 0.0% - 0.0%
PAI Platinum Asia Investments Asia $341.2 $0.94 $0.040 4.3% 100% 6.1%
EAI Ellerston Asian Investments Asia $131.7 $0.93 $0.025 2.7% 100% 3.8%
PAF PM Capital Asian Opportunities Asia $45.2 $0.80 $0.035 4.4% 100% 6.3%
Arithmetic Average (Global) 3.1% 4.1%
Arithmetic Average (Investment Mandate - Equities) 3.4% 4.4%
Arithmetic Average (Investment Mandate - Asia) 3.8% 5.4%
Weighted Average (Global) 2.6% 3.3%
ASX
CodeCompany/Trust Name Investment Mandate
Market
Cap (m)
Share/Unit
Price
Dividend
TTM*
Net
YieldFranking
Gross
Yield
LISTED INVESTMENT COMPANIES & TRUSTS. 17
Global Equity - Pre-Tax NTA & Share Price Performance Summary
Figure 23 - Global Equity LIC/LIT Pre-Tax NTA Performance
SOURCE: COMPANY DATA, IRESS & BELL POTTER.
3m 6m 1y 3y 5y 3m 6m 1y 3y 5y
MGG Magellan Global Trust Global 2.8 9.2 10.6 - - -1.7 -0.8 1.4 - -
MFF MFF Capital Investments Global 7.1 15.1 14.0 22.0 18.4 2.6 5.1 4.8 7.0 5.5
WGB WAM Global Global 3.2 8.7 7.4 - - -1.3 -1.3 -1.8 - -
PMC Platinum Capital Global 2.8 3.5 0.5 8.3 5.2 -1.1 -5.4 -8.2 -6.2 -7.1
PGF PM Capital Global Opportunities Global 2.8 6.8 0.9 13.8 7.6 -1.8 -3.1 -8.0 -1.2 -5.3
PIA Pengana International Equities Global 2.3 6.2 7.5 0.1 4.9 -2.3 -3.9 -1.7 -14.8 -8.0
TGG Templeton Global Growth Fund Global 1.7 2.9 -2.4 7.6 5.0 -2.2 -6.0 -11.1 -6.9 -7.3
EGD Evans & Partners Global Disruption Global 0.5 4.3 -0.5 - - -3.4 -4.6 -9.2 - -
EGF Evans & Partners Global Flagship Global 5.5 12.5 16.9 - - 1.0 2.5 7.7 - -
WQG WCM Global Growth Global 2.2 -2.6 0.7 - - -1.8 -11.8 -8.5 - -
EGI Ellerston Global Investments Global 4.7 10.9 1.6 4.2 - 3.2 5.7 -1.3 -6.7 -
ALI Argo Global Listed Infrastructure Global (Infrastructure) 6.4 9.9 21.6 12.4 - -0.1 -2.5 -4.5 -2.1 -
GVF Global Value Fund Global (Multi Asset) 4.0 6.6 4.4 6.1 6.2 2.8 4.0 -1.2 0.2 0.2
TGF Tribeca Global Natural Resources Global (Resources) -4.1 -7.2 - - - -0.3 -4.8 - - -
FGG Future Generation Global Investment Global (Fund of Funds) 0.7 5.7 3.2 10.8 - -3.2 -3.2 -5.5 -3.7 -
HM1 Hearts and Minds Investments Global (High Conviction) 0.3 7.1 - - - -4.2 -2.9 - - -
PAI Platinum Asia Investments Asia 0.6 -0.6 1.4 7.0 - 2.3 1.5 0.3 -1.4 -
EAI Ellerston Asian Investments Asia 0.1 1.3 3.4 4.8 - 1.8 3.4 2.3 -3.6 -
PAF PM Capital Asian Opportunities Asia -3.0 -4.6 -10.5 3.1 2.6 -1.3 -2.5 -11.6 -5.3 -4.6
Arithmetic Average (Global) 2.1 5.1 4.7 8.4 7.1 -0.6 -1.6 -3.3 -3.7 -3.8
Arithmetic Average (Investment Mandate - Equities) 3.2 7.0 5.2 9.3 8.2 -0.8 -2.1 -3.3 -4.8 -4.4
Arithmetic Average (Investment Mandate - Asia) -0.8 -1.3 -1.9 5.0 2.6 0.9 0.8 -3.0 -3.4 -4.6
Weighted Average (Global) 3.2 8.2 -0.7 -0.6
Pre-tax NTA/NAV
Performance (%) Value-add+ (%)ASX
CodeCompany/Trust Name Investment Mandate
LISTED INVESTMENT COMPANIES & TRUSTS. 18
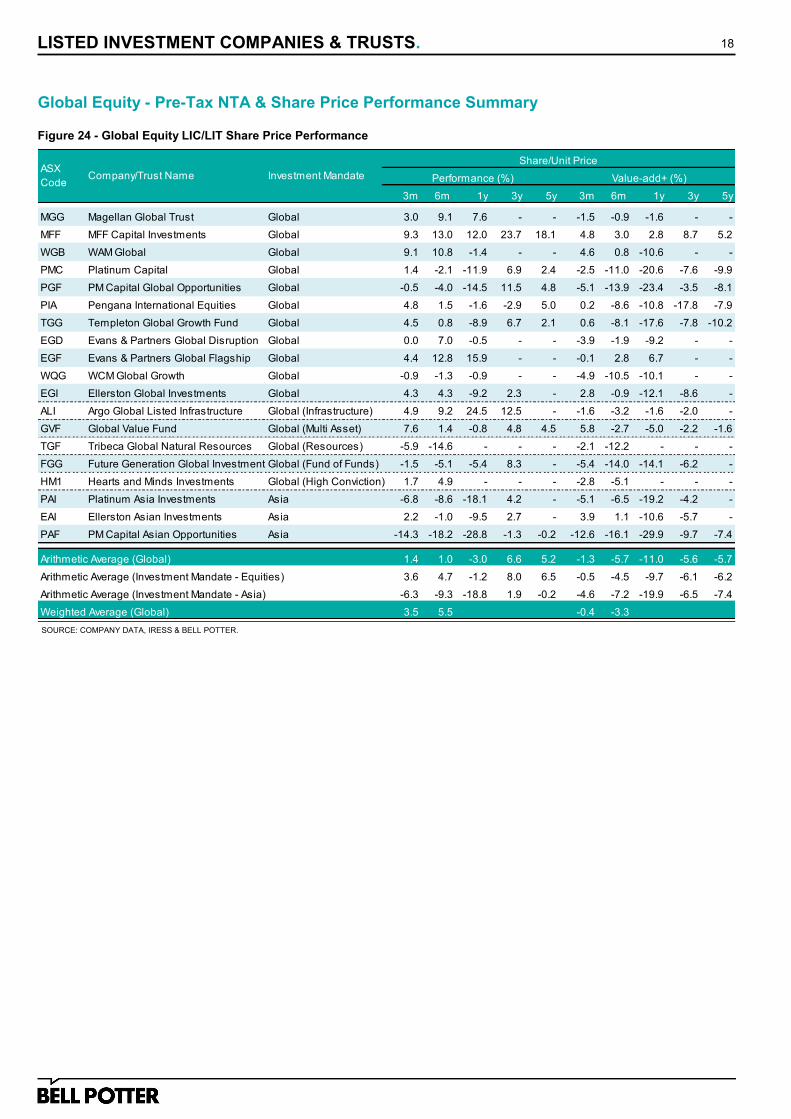
Global Equity - Pre-Tax NTA & Share Price Performance Summary
Figure 24 - Global Equity LIC/LIT Share Price Performance
SOURCE: COMPANY DATA, IRESS & BELL POTTER.
3m 6m 1y 3y 5y 3m 6m 1y 3y 5y
MGG Magellan Global Trust Global 3.0 9.1 7.6 - - -1.5 -0.9 -1.6 - -
MFF MFF Capital Investments Global 9.3 13.0 12.0 23.7 18.1 4.8 3.0 2.8 8.7 5.2
WGB WAM Global Global 9.1 10.8 -1.4 - - 4.6 0.8 -10.6 - -
PMC Platinum Capital Global 1.4 -2.1 -11.9 6.9 2.4 -2.5 -11.0 -20.6 -7.6 -9.9
PGF PM Capital Global Opportunities Global -0.5 -4.0 -14.5 11.5 4.8 -5.1 -13.9 -23.4 -3.5 -8.1
PIA Pengana International Equities Global 4.8 1.5 -1.6 -2.9 5.0 0.2 -8.6 -10.8 -17.8 -7.9
TGG Templeton Global Growth Fund Global 4.5 0.8 -8.9 6.7 2.1 0.6 -8.1 -17.6 -7.8 -10.2
EGD Evans & Partners Global Disruption Global 0.0 7.0 -0.5 - - -3.9 -1.9 -9.2 - -
EGF Evans & Partners Global Flagship Global 4.4 12.8 15.9 - - -0.1 2.8 6.7 - -
WQG WCM Global Growth Global -0.9 -1.3 -0.9 - - -4.9 -10.5 -10.1 - -
EGI Ellerston Global Investments Global 4.3 4.3 -9.2 2.3 - 2.8 -0.9 -12.1 -8.6 -
ALI Argo Global Listed Infrastructure Global (Infrastructure) 4.9 9.2 24.5 12.5 - -1.6 -3.2 -1.6 -2.0 -
GVF Global Value Fund Global (Multi Asset) 7.6 1.4 -0.8 4.8 4.5 5.8 -2.7 -5.0 -2.2 -1.6
TGF Tribeca Global Natural Resources Global (Resources) -5.9 -14.6 - - - -2.1 -12.2 - - -
FGG Future Generation Global Investment Global (Fund of Funds) -1.5 -5.1 -5.4 8.3 - -5.4 -14.0 -14.1 -6.2 -
HM1 Hearts and Minds Investments Global (High Conviction) 1.7 4.9 - - - -2.8 -5.1 - - -
PAI Platinum Asia Investments Asia -6.8 -8.6 -18.1 4.2 - -5.1 -6.5 -19.2 -4.2 -
EAI Ellerston Asian Investments Asia 2.2 -1.0 -9.5 2.7 - 3.9 1.1 -10.6 -5.7 -
PAF PM Capital Asian Opportunities Asia -14.3 -18.2 -28.8 -1.3 -0.2 -12.6 -16.1 -29.9 -9.7 -7.4
Arithmetic Average (Global) 1.4 1.0 -3.0 6.6 5.2 -1.3 -5.7 -11.0 -5.6 -5.7
Arithmetic Average (Investment Mandate - Equities) 3.6 4.7 -1.2 8.0 6.5 -0.5 -4.5 -9.7 -6.1 -6.2
Arithmetic Average (Investment Mandate - Asia) -6.3 -9.3 -18.8 1.9 -0.2 -4.6 -7.2 -19.9 -6.5 -7.4
Weighted Average (Global) 3.5 5.5 -0.4 -3.3
ASX
CodeCompany/Trust Name Investment Mandate
Share/Unit Price
Performance (%) Value-add+ (%)

LISTED INVESTMENT COMPANIES & TRUSTS. 19
Global Equity - Profit Reserve and Indirect Cost Ratio Summary
Figure 25 - Global Equity LIC/LIT Profit Reserve and Indirect Cost Ratio Summary
MGG Magellan Global Trust Global $2,243.7 n/a n/a n/a n/a 1.72%
MFF MFF Capital Investments Global $1,718.4 $838.1 $58.6 44.2x $0.1444 0.44%
WGB WAM Global Global $455.0 $17.5 $3.8 5.4x $0.0315 2.17%
PMC Platinum Capital Global $447.4 $75.0 $10.8 3.7x $0.0501 1.44%
PGF PM Capital Global Opportunities Global $377.7 $93.5 $16.3 7.0x $0.0619 1.27%
PIA Pengana International Equities Global $279.5 $105.5 $2.3 6.0x $0.0120 1.77%
TGG Templeton Global Growth Fund Global $256.9 $14.2 $8.8 0.9x $0.0537 1.25%
EGD Evans & Partners Global Disruption Global $259.9 n/a n/a n/a n/a 1.51%
EGF Evans & Partners Global Flagship Global $199.1 n/a n/a n/a n/a 1.79%
WQG WCM Global Growth Global $190.9 $25.2 $0.0 13.3x $0.0000 3.22%
EGI Ellerston Global Investments Global $102.2 $6.8 $2.6 2.1x $0.0315 1.67%
ALI Argo Global Listed Infrastructure Global (Infrastructure) $330.8 $59.6 $9.3 6.5x $0.0878 1.58%
GVF Global Value Fund Global (Multi Asset) $149.9 $9.0 $4.4 1.0x $0.0401 2.56%
TGF Tribeca Global Natural Resources Global (Resources) $121.6 -$2.6 $0.0 n/a $0.0000 2.99%
FGG Future Generation Global Investment Global (Fund of Funds) $509.3 $20.2 $2.3 1.3x $0.0079 0.54%
HM1 Hearts and Minds Investments Global (High Conviction) $600.0 $4.2 $0.6 1.0x $0.0052 n/a
PAI Platinum Asia Investments Asia $341.2 $43.8 $8.1 3.0x $0.0298 1.69%
EAI Ellerston Asian Investments Asia $131.7 $11.2 $4.2 3.7x $0.0466 2.13%
PAF PM Capital Asian Opportunities Asia $45.2 $5.9 $5.1 3.0x $0.1207 1.67%
Franking
Reserve
(m)
ASX
CodeCompany/Trust Name Investment Mandate
Market
Cap (m)
Profit
Reserve
(m)
TTM
Dividend
Cover
Max Div
(Fully
Franked)
Indirect
Cost Ratio
SOURCE: COMPANY DATA, IRESS & BELL POTTER. DATA AS AT 30 JUNE 2019. INDIRECT COST RATIO (ICR) MEASURES THE MANAGEMENT COSTS AS WELL AS OTHER COST THAT ARE DEDUCTED FROM THE ASSETS OF THE LIC/LIT. PERFORMANCE FEES, IF PAYABLE, ARE INCLUDED IN THE CALCULATION WHICH MAY CAUSE FLUCTUATIONS OVER EACH YEAR. DUE TO THIS, A HIGHER ICR ISN’T NECESSARILY A NEGATIVE AS IT MAY BE THE RESULT OF A PERIOD OF OUTPERFORMANCE. COSTS INVOLVED IN BORROWING AND SHORTING ACTIVITIES HAVE BEEN EXCLUDED, WHILST BROKERAGE HAS BEEN INCLUDED. THE COSTS ARE THEN DIVIDED BY AVERAGE PRE-TAX NTA/NAV TIMES THE WEIGHTED AVERAGE SHARES/UNITS OUTSTANDING FOR FY19.

LISTED INVESTMENT COMPANIES & TRUSTS. 20
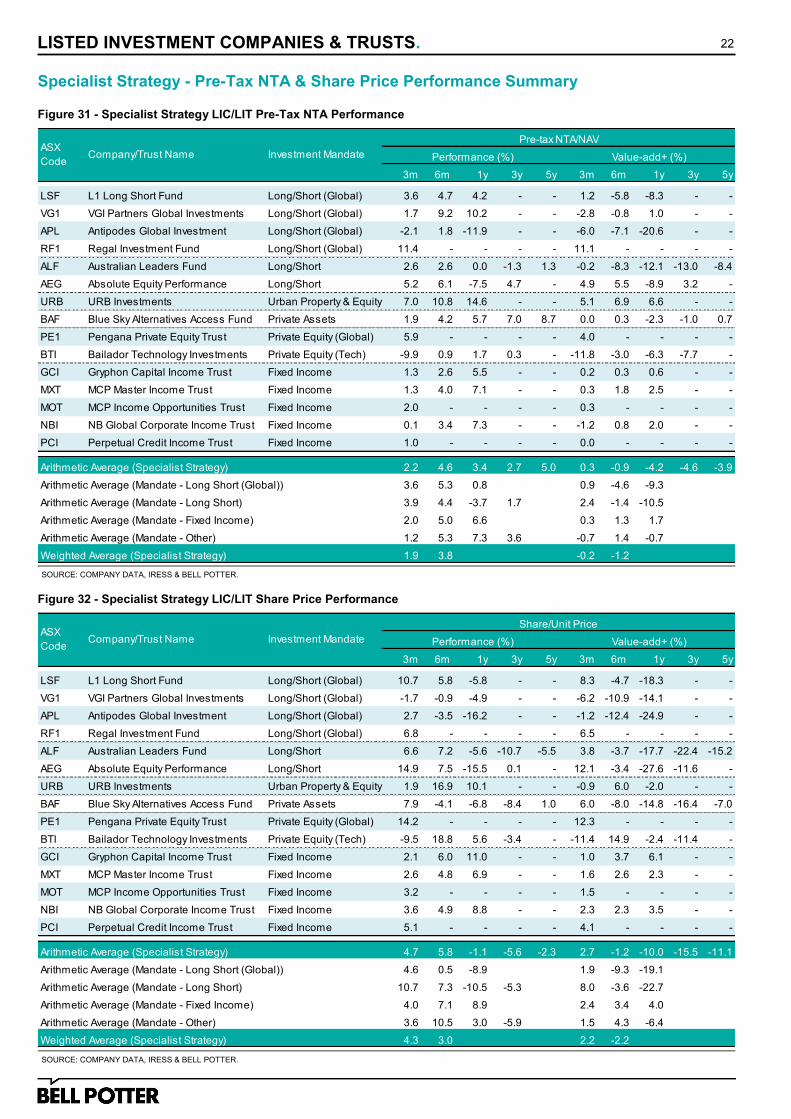
Specialist Strategy LIC/LIT Summary
The specialist strategy LICs are compromised from long/short mandated companies as well as LICs when its performance may not
be best compared to a broad domestic or global equity index.
These LIC/LITs collectively returned 4.3% (incl. net dividends) over the quarter, compared to the pre-tax NTA (incl. net dividends)
return of 1.9%. Regal Investment Fund (RF1), which listed in the middle of June 2019, was the top performing on a pre-tax NTA
measure with 11.4% compared to the share price return of 6.8%. RF1 provides exposure to a selection of alternative investment
strategies, with the aim of delivering attractive risk adjusted absolute returns with limited correlation to equity markets. The portfolio
is diversified across strategy, geography and sector.
Bailador Technology Investments Limited (BTI), which invests in private IT companies that are in the ‘expansion stage’ of
their business cycle, had the lowest return with the share price and pre-tax NTA producing negative 9.5% and 9.9% respectively.
During the quarter BTI conservatively decided to write-down two of its investments, Stackla and Viostream, to a value of zero.
Stackla, which was at the time BTI’s 3rd largest holding representing 7.7% of the NTA as at August 2019, had its access to the
Facebook platform suspended. Despite Stackla regaining access to Facebook on 14 October, BTI deemed the ongoing effect to be
unclear and proceeded with the most conservative valuation. Despite the write-down of the two companies in the portfolio, they may
still provide a future benefit. BTI has chosen to take a very conservative valuation method and has investments across a number of
other companies that have recently received positive revaluations. At the end of September 2019, BTI was trading at a 19.5%
discount to pre-tax NTA.
Figure 26 - 5yr Market Growth of Alt. Strategy LIC/LITs Figure 27 - 1yr Pre-Tax NTA Performance v Standard Dev
Figure 28 - Alternative Strategy LIC/LIT Dividend Yield (Net and Gross)
SOURCE: COMPANY DATA, IRESS & BELL POTTER SOURCE: COMPANY DATA, IRESS & BELL POTTER
SOURCE: COMPANY DATA, IRESS & BELL POTTER. TRAILING 12 MONTH DIVIDENDS AS AT 30 JUNE 2019
-14%
-7%
0%
7%
14%
$70
$85
$100
$115
$130
Sep 14 Sep 15 Sep 16 Sep 17 Sep 18 Sep 19
Premium / Discount (RHS) Growth of $100 (LHS)
LSF
VG1
APL
ALF
AEG
URB
BAF
BTI
GCI
MXT
NBI
XAOAI
0%
2%
4%
6%
8%
10%
12%
14%
16%
18%
-15% -10% -5% 0% 5% 10% 15% 20%
1 Y
r P
re-T
ax N
TA
Pe
rfo
rma
nce
St.
De
via
tio
n
1 Yr Pre-Tax NTA Performance
0%
1%
2%
3%
4%
5%
6%
7%
8%
9%
10%
LSF VG1 APL RF1 ALF AEG URB BAF PE1 BTI GCI MXT MOT NBI PCI
Gross Yield Net Yield

LISTED INVESTMENT COMPANIES & TRUSTS. 21
Specialist Strategy - NTA & Dividend Summary
Figure 29 - Specialist Strategy LIC/LIT Share Price Premium/Discount to NTA
Figure 30 - Specialist Strategy LIC/LIT Historic Dividend Yield
SOURCE: COMPANY DATA, IRESS & BELL POTTER.
SOURCE: COMPANY DATA, IRESS & BELL POTTER. *TRAILING 12 MONTH DIVIDENDS/DISTRIBUTIONS PAID, EXCLUDING SPECIAL DIVIDENDS/DISTRIBUTIONS.
LSF L1 Long Short Fund Long/Short (Global) $1,034 $1.56 $1.74 -10.5% $1.83 -14.8%
VG1 VGI Partners Global Investments Long/Short (Global) $948 $2.33 $2.44 -4.5% $2.44 -4.5%
APL Antipodes Global Investment Long/Short (Global) $527 $0.96 $1.12 -14.7% $1.12 -14.6%
RF1 Regal Investment Fund Long/Short (Global) $302 $2.68 $2.84 -5.6% $2.84 -5.6%
ALF Australian Leaders Fund Long/Short $233 $0.97 $1.18 -17.8% $1.17 -17.1%
AEG Absolute Equity Performance Long/Short $95 $0.97 $1.04 -6.8% $1.05 -7.7%
URB URB Investments Urban Property & Equity $76 $1.03 $1.19 -13.4% $1.18 -12.7%
BAF Blue Sky Alternatives Access Fund Private Assets $157 $0.78 $1.12 -30.1% $1.09 -28.5%
PE1 Pengana Private Equity Trust Private Equity (Global) $238 $1.45 $1.39 4.2% $1.39 4.2%
BTI Bailador Technology Investments Private Equity (Tech) $114 $0.95 $1.18 -19.5% $1.11 -14.4%
GCI Gryphon Capital Income Trust Fixed Income $322 $2.08 $2.01 3.7% $2.01 3.7%
MXT MCP Master Income Trust Fixed Income $1,319 $2.07 $2.00 3.4% $2.00 3.4%
MOT MCP Income Opportunities Trust Fixed Income $311 $2.07 $2.01 3.2% $2.01 3.2%
NBI NB Global Corporate Income Trust Fixed Income $926 $2.08 $2.03 2.5% $2.03 2.5%
PCI Perpetual Credit Income Trust Fixed Income $466 $1.17 $1.10 5.7% $1.10 5.7%
Arithmetic Average (Specialist Strategy) -6.7% -6.5%
Arithmetic Average (Mandate - Long Short (Global)) -8.8% -9.9%
Arithmetic Average (Mandate - Long Short) -12.3% -12.4%
Arithmetic Average (Mandate - Fixed Income) 3.7% 3.7%
Arithmetic Average (Mandate - Other) -14.7% -12.8%
Weighted Average (Specialist Strategy) -3.5% -4.0%
Prem/
Disc
Post-tax
NTA/NAV
Prem/
Disc
Pre-tax
NTA/NAV
ASX
CodeCompany/Trust Name Investment Mandate
Market
Cap (m)
Share/Unit
Price
LSF L1 Long Short Fund Long/Short (Global) $1,034 $1.56 $0.000 0.0% - 0.0%
VG1 VGI Partners Global Investments Long/Short (Global) $948 $2.33 $0.000 0.0% - 0.0%
APL Antipodes Global Investment Long/Short (Global) $527 $0.96 $0.045 4.7% 50% 5.7%
RF1 Regal Investment Fund Long/Short (Global) $302 $2.68 $0.000 0.0% - 0.0%
ALF Australian Leaders Fund Long/Short $233 $0.97 $0.045 4.6% 72% 6.1%
AEG Absolute Equity Performance Long/Short $95 $0.97 $0.045 4.7% 100% 6.7%
URB URB Investments Urban Property & Equity $76 $1.03 $0.023 2.2% 100% 3.1%
BAF Blue Sky Alternatives Access Fund Private Assets $157 $0.78 $0.050 6.4% 65% 8.2%
PE1 Pengana Private Equity Trust Private Equity (Global) $238 $1.45 $0.000 0.0% - 0.0%
BTI Bailador Technology Investments Private Equity (Tech) $114 $0.95 $0.000 0.0% - 0.0%
GCI Gryphon Capital Income Trust Fixed Income $322 $2.08 $0.100 4.8% 0% 4.8%
MXT MCP Master Income Trust Fixed Income $1,319 $2.07 $0.113 5.4% 0% 5.4%
MOT MCP Income Opportunities Trust Fixed Income $311 $2.07 $0.066 3.2% 0% 3.2%
NBI NB Global Corporate Income Trust Fixed Income $926 $2.08 $0.121 5.8% 0% 5.8%
PCI Perpetual Credit Income Trust Fixed Income $466 $1.17 $0.016 1.4% 0% 1.4%
Arithmetic Average (Specialist Strategy) 2.9% 3.4%
Arithmetic Average (Mandate - Long Short (Global)) 1.2% 1.4%
Arithmetic Average (Mandate - Long Short) 4.7% 6.4%
Arithmetic Average (Mandate - Fixed Income) 4.1% 4.1%
Arithmetic Average (Mandate - Other) 2.1% 2.8%
Weighted Average (Specialist Strategy) 3.0% 3.2%
ASX
CodeCompany/Trust Name Investment Mandate
Market
Cap (m)
Share/Unit
Price
Dividend
TTM*
Net
YieldFranking
Gross
Yield
LISTED INVESTMENT COMPANIES & TRUSTS. 22
Specialist Strategy - Pre-Tax NTA & Share Price Performance Summary
Figure 31 - Specialist Strategy LIC/LIT Pre-Tax NTA Performance
Figure 32 - Specialist Strategy LIC/LIT Share Price Performance
SOURCE: COMPANY DATA, IRESS & BELL POTTER.
SOURCE: COMPANY DATA, IRESS & BELL POTTER.
3m 6m 1y 3y 5y 3m 6m 1y 3y 5y
LSF L1 Long Short Fund Long/Short (Global) 3.6 4.7 4.2 - - 1.2 -5.8 -8.3 - -
VG1 VGI Partners Global Investments Long/Short (Global) 1.7 9.2 10.2 - - -2.8 -0.8 1.0 - -
APL Antipodes Global Investment Long/Short (Global) -2.1 1.8 -11.9 - - -6.0 -7.1 -20.6 - -
RF1 Regal Investment Fund Long/Short (Global) 11.4 - - - - 11.1 - - - -
ALF Australian Leaders Fund Long/Short 2.6 2.6 0.0 -1.3 1.3 -0.2 -8.3 -12.1 -13.0 -8.4
AEG Absolute Equity Performance Long/Short 5.2 6.1 -7.5 4.7 - 4.9 5.5 -8.9 3.2 -
URB URB Investments Urban Property & Equity 7.0 10.8 14.6 - - 5.1 6.9 6.6 - -
BAF Blue Sky Alternatives Access Fund Private Assets 1.9 4.2 5.7 7.0 8.7 0.0 0.3 -2.3 -1.0 0.7
PE1 Pengana Private Equity Trust Private Equity (Global) 5.9 - - - - 4.0 - - - -
BTI Bailador Technology Investments Private Equity (Tech) -9.9 0.9 1.7 0.3 - -11.8 -3.0 -6.3 -7.7 -
GCI Gryphon Capital Income Trust Fixed Income 1.3 2.6 5.5 - - 0.2 0.3 0.6 - -
MXT MCP Master Income Trust Fixed Income 1.3 4.0 7.1 - - 0.3 1.8 2.5 - -
MOT MCP Income Opportunities Trust Fixed Income 2.0 - - - - 0.3 - - - -
NBI NB Global Corporate Income Trust Fixed Income 0.1 3.4 7.3 - - -1.2 0.8 2.0 - -
PCI Perpetual Credit Income Trust Fixed Income 1.0 - - - - 0.0 - - - -
Arithmetic Average (Specialist Strategy) 2.2 4.6 3.4 2.7 5.0 0.3 -0.9 -4.2 -4.6 -3.9
Arithmetic Average (Mandate - Long Short (Global)) 3.6 5.3 0.8 0.9 -4.6 -9.3
Arithmetic Average (Mandate - Long Short) 3.9 4.4 -3.7 1.7 2.4 -1.4 -10.5
Arithmetic Average (Mandate - Fixed Income) 2.0 5.0 6.6 0.3 1.3 1.7
Arithmetic Average (Mandate - Other) 1.2 5.3 7.3 3.6 -0.7 1.4 -0.7
Weighted Average (Specialist Strategy) 1.9 3.8 -0.2 -1.2
Pre-tax NTA/NAV
Performance (%) Value-add+ (%)ASX
CodeCompany/Trust Name Investment Mandate
3m 6m 1y 3y 5y 3m 6m 1y 3y 5y
LSF L1 Long Short Fund Long/Short (Global) 10.7 5.8 -5.8 - - 8.3 -4.7 -18.3 - -
VG1 VGI Partners Global Investments Long/Short (Global) -1.7 -0.9 -4.9 - - -6.2 -10.9 -14.1 - -
APL Antipodes Global Investment Long/Short (Global) 2.7 -3.5 -16.2 - - -1.2 -12.4 -24.9 - -
RF1 Regal Investment Fund Long/Short (Global) 6.8 - - - - 6.5 - - - -
ALF Australian Leaders Fund Long/Short 6.6 7.2 -5.6 -10.7 -5.5 3.8 -3.7 -17.7 -22.4 -15.2
AEG Absolute Equity Performance Long/Short 14.9 7.5 -15.5 0.1 - 12.1 -3.4 -27.6 -11.6 -
URB URB Investments Urban Property & Equity 1.9 16.9 10.1 - - -0.9 6.0 -2.0 - -
BAF Blue Sky Alternatives Access Fund Private Assets 7.9 -4.1 -6.8 -8.4 1.0 6.0 -8.0 -14.8 -16.4 -7.0
PE1 Pengana Private Equity Trust Private Equity (Global) 14.2 - - - - 12.3 - - - -
BTI Bailador Technology Investments Private Equity (Tech) -9.5 18.8 5.6 -3.4 - -11.4 14.9 -2.4 -11.4 -
GCI Gryphon Capital Income Trust Fixed Income 2.1 6.0 11.0 - - 1.0 3.7 6.1 - -
MXT MCP Master Income Trust Fixed Income 2.6 4.8 6.9 - - 1.6 2.6 2.3 - -
MOT MCP Income Opportunities Trust Fixed Income 3.2 - - - - 1.5 - - - -
NBI NB Global Corporate Income Trust Fixed Income 3.6 4.9 8.8 - - 2.3 2.3 3.5 - -
PCI Perpetual Credit Income Trust Fixed Income 5.1 - - - - 4.1 - - - -
Arithmetic Average (Specialist Strategy) 4.7 5.8 -1.1 -5.6 -2.3 2.7 -1.2 -10.0 -15.5 -11.1
Arithmetic Average (Mandate - Long Short (Global)) 4.6 0.5 -8.9 1.9 -9.3 -19.1
Arithmetic Average (Mandate - Long Short) 10.7 7.3 -10.5 -5.3 8.0 -3.6 -22.7
Arithmetic Average (Mandate - Fixed Income) 4.0 7.1 8.9 2.4 3.4 4.0
Arithmetic Average (Mandate - Other) 3.6 10.5 3.0 -5.9 1.5 4.3 -6.4
Weighted Average (Specialist Strategy) 4.3 3.0 2.2 -2.2
ASX
CodeCompany/Trust Name Investment Mandate
Share/Unit Price
Performance (%) Value-add+ (%)

LISTED INVESTMENT COMPANIES & TRUSTS. 23
Specialist Strategy - Profit Reserve and Indirect Cost Ratio Summary
Figure 33 - Specialist Strategy LIC/LIT Profit Reserve and Indirect Cost Ratio Summary
LSF L1 Long Short Fund Long/Short (Global) $1,033.8 $0.0 $7.1 n/a $0.0142 2.72%
VG1 VGI Partners Global Investments Long/Short (Global) $948.1 $83.8 $1.1 n/a $0.0050 3.68%
APL Antipodes Global Investment Long/Short (Global) $526.7 $43.1 $13.4 1.9x $0.0353 1.52%
RF1 Regal Investment Fund Long/Short (Global) $302.1 n/a n/a n/a n/a n/a
ALF Australian Leaders Fund Long/Short $233.5 $0.3 $1.5 0.0x $0.0076 2.79%
AEG Absolute Equity Performance Long/Short $95.4 $8.6 $2.6 1.9x $0.0345 3.50%
URB URB Investments Urban Property & Equity $75.6 $6.3 $1.8 3.8x $0.0322 1.67%
BAF Blue Sky Alternatives Access Fund Private Assets $156.7 $11.1 $1.3 1.1x $0.0083 1.22%
PE1 Pengana Private Equity Trust Private Equity (Global) $237.8 n/a n/a n/a n/a n/a
BTI Bailador Technology Investments Private Equity (Tech) $114.2 $28.6 $0.0 n/a $0.0000 5.47%
GCI Gryphon Capital Income Trust Fixed Income $321.6 n/a n/a n/a n/a 0.99%
MXT MCP Master Income Trust Fixed Income $1,319.3 n/a n/a n/a n/a 0.46%
MOT MCP Income Opportunities Trust Fixed Income $310.7 n/a n/a n/a n/a n/a
NBI NB Global Corporate Income Trust Fixed Income $926.2 n/a n/a n/a n/a 0.65%
PCI Perpetual Credit Income Trust Fixed Income $466.1 n/a n/a n/a n/a n/a
Franking
Reserve
(m)
ASX
CodeCompany/Trust Name Investment Mandate
Market
Cap (m)
Profit
Reserve
(m)
TTM
Dividend
Cover
Max Div
(Fully
Franked)
Indirect
Cost Ratio
SOURCE: COMPANY DATA, IRESS & BELL POTTER. DATA AS AT 30 JUNE 2019. INDIRECT COST RATIO (ICR) MEASURES THE MANAGEMENT COSTS AS WELL AS OTHER COST THAT ARE DEDUCTED FROM THE ASSETS OF THE LIC/LIT. PERFORMANCE FEES, IF PAYABLE, ARE INCLUDED IN THE CALCULATION WHICH MAY CAUSE FLUCTUATIONS OVER EACH YEAR. DUE TO THIS, A HIGHER ICR ISN’T NECESSARILY A NEGATIVE AS IT MAY BE THE RESULT OF A PERIOD OF OUTPERFORMANCE. COSTS INVOLVED IN BORROWING AND SHORTING ACTIVITIES HAVE BEEN EXCLUDED, WHILST BROKERAGE HAS BEEN INCLUDED. THE COSTS ARE THEN DIVIDED BY AVERAGE PRE-TAX NTA/NAV TIMES THE WEIGHTED AVERAGE SHARES/UNITS OUTSTANDING FOR FY19.

LISTED INVESTMENT COMPANIES & TRUSTS. 24
Premium/Discount to NTA
We have categorised our universe of LICs according to the percentage premium or discount the share price trades at relative to the
pre-tax NTA as at the end of September 2019.
Figure 34 - Domestic Equity Pre-Tax NTA Prem/Disc
Figure 35 - Global Equity Pre-Tax NTA Prem/Disc Figure 36 - Specialist Strategy Pre-Tax NTA Prem/Disc
SOURCE: COMPANY DATA, IRESS & BELL POTTER.
SOURCE: COMPANY DATA, IRESS & BELL POTTER. SOURCE: COMPANY DATA, IRESS & BELL POTTER.
ASX Code Company/Trust name % ASX Code Company/Trust name %
WAX WAM Research 17.8% OPH Ophir High Conviction Fund -7.8%
WAM WAM Capital 14.2% NCC Naos Emerging Opportunities -8.5%
DJW Djerriwarrh Investments 7.6% AMH AMCIL -9.3%
WAA WAM Active 3.7% QVE QV Equities -9.3%
PL8 Plato Income Maximiser 3.4% CDM Cadence Capital -9.5%
MIR Mirrabooka Investments 2.9% RYD Ryder Capital -10.1%
WMI WAM Microcap -0.7% FGX Future Generation Investment -10.4%
AFI AFIC -1.5% SEC Spheria Emerging Companies -13.1%
ARG Argo Investments -3.0% WIC Westoz Investment -13.2%
BKI BKI Investment -3.0% SNC Sandon Capital Investments -13.5%
WLE WAM Leaders -3.5% FSI Flagship Investments -16.4%
MLT Milton Corporation -4.0% DUI Diversified United Investment -17.1%
CAM Clime Capital -5.1% NAC Naos Ex-50 Opportunities -19.1%
CLF Concentrated Leaders Fund -5.3% ACQ Acorn Capital Investment -19.2%
PIC Perpetual Equity Investment -6.2% NSC Naos Small Cap Opportunities -19.4%
AUI Australian United Investment -6.2% TEK Thorney Technologies -19.6%
CIN Carlton Investments -6.6% OZG Ozgrowth -20.2%
WHF Whitefield -7.8% TOP Thorney Opportunities -20.4%
ASX Code Company/Trust name % ASX Code Company/Trust name %
HM1 Hearts and Minds Investments 0.0% PCI Perpetual Credit Income Trust 5.7%
EGD Evans & Partners Global Disruption -1.4% PE1 Pengana Private Equity Trust 4.2%
PMC Platinum Capital -1.6% GCI Gryphon Capital Income Trust 3.7%
MGG Magellan Global Trust -2.2% MXT MCP Master Income Trust 3.4%
EGF Evans & Partners Global Flagship -2.9% MOT MCP Income Opportunities Trust 3.2%
GVF Global Value Fund -5.8% NBI NB Global Corporate Income Trust 2.5%
MFF MFF Capital Investments -8.2% VG1 VGI Partners Global Investments -4.5%
FGG Future Generation Global Investment -8.4% RF1 Regal Investment Fund -5.6%
ALI Argo Global Listed Infrastructure -11.1% AEG Absolute Equity Performance -6.8%
WGB WAM Global -11.2% LSF L1 Long Short Fund -10.5%
PAI Platinum Asia Investments -12.1% URB URB Investments -13.4%
PIA Pengana International Equities -12.9% APL Antipodes Global Investment -14.7%
TGG Templeton Global Growth Fund -14.8% ALF Australian Leaders Fund -17.8%
TGF Tribeca Global Natural Resources -15.7% BTI Bailador Technology Investments -19.5%
WQG WCM Global Growth -15.8% BAF Blue Sky Alternatives Access Fund -30.1%
EAI Ellerston Asian Investments -16.0%
EGI Ellerston Global Investments -18.5%
PGF PM Capital Global Opportunities -19.8%
PAF PM Capital Asian Opportunities -20.5%

LISTED INVESTMENT COMPANIES & TRUSTS. 25
Liquidity
Liquidity is the ability to buy or sell a particular security. The volume traded among some LICs can be quite thin at times and may be
difficult to trade larger lines. Therefore, liquidity needs to be taken into consideration when investing in this asset class.
Figure 37 - Domestic Equity Liquidity
SOURCE: COMPANY DATA, IRESS & BELL POTTER.
ASX
CodeCompany/Trust name
Shares/Units
on Issue
(19 Nov'19)
Jun'19
Quarter Vol.
Sep'19
Quarter Vol.
Quarterly
Change
Quarterly
Liquidity
3 Year
Average
Monthly Vol.
3 Year
Average
Monthly Val.
AFI AFIC 1,206m 31.06m 32.85m 5.8% 2.72% 9.80m $58.98m
ARG Argo Investments 718m 17.35m 17.99m 3.7% 2.51% 4.77m $37.42m
AUI Australian United Investment 124m 1.89m 0.84m -55.6% 0.67% 0.38m $3.13m
MLT Milton Corporation 670m 14.99m 15.48m 3.3% 2.31% 4.53m $20.48m
BKI BKI Investment 733m 25.11m 25.84m 2.9% 3.52% 6.63m $10.46m
DUI Diversified United Investment 211m 4.47m 3.49m -21.9% 1.65% 1.07m $4.26m
CIN Carlton Investments 26m 0.13m 0.18m 46.4% 0.69% 0.05m $1.64m
WLE WAM Leaders 785m 60.85m 75.37m 23.9% 9.60% 18.71m $21.28m
WHF Whitefield 92m 2.39m 1.36m -43.1% 1.47% 0.61m $2.79m
PIC Perpetual Equity Investment 347m 29.45m 24.33m -17.4% 7.02% 6.03m $6.39m
AMH AMCIL 279m 10.73m 9.60m -10.5% 3.45% 2.43m $2.17m
CAM Clime Capital 114m 6.51m 6.67m 2.5% 5.85% 1.58m $1.37m
CLF Concentrated Leaders Fund 59m 1.30m 1.50m 15.2% 2.53% 0.47m $0.58m
FSI Flagship Investments 26m 0.40m 0.59m 47.1% 2.32% 0.22m $0.36m
WAM WAM Capital 721m 64.32m 53.95m -16.1% 7.48% 16.77m $39.18m
OPH Ophir High Conviction Fund 200m 10.56m 9.67m -8.4% 4.83% 3.15m $7.79m
MIR Mirrabooka Investments 161m 6.87m 6.08m -11.4% 3.77% 1.52m $4.00m
QVE QV Equities 272m 18.20m 18.58m 2.0% 6.84% 4.95m $5.81m
WAX WAM Research 192m 13.78m 12.18m -11.6% 6.34% 3.87m $5.78m
CDM Cadence Capital 315m 36.92m 30.43m -17.6% 9.66% 6.32m $6.80m
WIC Westoz Investment 134m 2.11m 4.93m 133.8% 3.68% 1.25m $1.31m
TOP Thorney Opportunities 204m 5.51m 7.01m 27.2% 3.44% 2.33m $1.60m
RYD Ryder Capital 59m 1.48m 1.17m -21.0% 1.97% 0.42m $0.51m
NCC Naos Emerging Opportunities 61m 3.19m 2.92m -8.5% 4.78% 0.91m $1.16m
TEK Thorney Technologies 257m 17.94m 14.91m -16.9% 5.80% 4.96m $1.25m
WAA WAM Active 46m 2.90m 2.27m -21.5% 4.90% 0.71m $0.78m
NAC Naos Ex-50 Opportunities 51m 2.82m 3.14m 11.1% 6.19% 1.05m $1.06m
WMI WAM Microcap 141m 11.38m 11.76m 3.3% 8.32% 3.55m $6.34m
SEC Spheria Emerging Companies 66m 5.50m 6.53m 18.8% 9.84% 1.96m $3.14m
NSC Naos Small Cap Opportunities 163m 18.50m 15.80m -14.6% 9.71% 4.55m $3.84m
ACQ Acorn Capital Investment 53m 4.45m 3.15m -29.3% 5.93% 1.24m $1.34m
OZG Ozgrowth 355m 6.00m 9.07m 51.2% 2.55% 2.29m $0.38m
DJW Djerriwarrh Investments 224m 11.61m 9.78m -15.7% 4.38% 2.90m $10.03m
PL8 Plato Income Maximiser 428m 34.82m 38.98m 11.9% 9.10% 8.20m $8.39m
SNC Sandon Capital Investments 107m 3.89m 3.70m -4.9% 3.47% 0.83m $0.79m
FGX Future Generation Investment 398m 16.28m 25.04m 53.8% 6.29% 6.73m $7.86m

LISTED INVESTMENT COMPANIES & TRUSTS. 26
Liquidity
Liquidity is the ability to buy or sell a particular security. The volume traded among some LICs can be quite thin at times and may be
difficult to trade larger lines. Therefore, liquidity needs to be taken into consideration when investing in this asset class.
Figure 38 - Global Equity Liquidity
SOURCE: COMPANY DATA, IRESS & BELL POTTER.
ASX
CodeCompany/Trust name
Shares/Units
on Issue
(19 Nov'19)
Jun'19
Quarter Vol.
Sep'19
Quarter Vol.
Quarterly
Change
Quarterly
Liquidity
3 Year
Average
Monthly Vol.
3 Year
Average
Monthly Val.
MGG Magellan Global Trust 1,240m 60.35m 99.95m 65.6% 8.06% 21.88m $36.29m
MFF MFF Capital Investments 543m 17.01m 18.38m 8.1% 3.39% 7.26m $16.74m
WGB WAM Global 212m 15.90m 23.10m 45.3% 10.91% 3.18m $5.57m
PMC Platinum Capital 290m 15.23m 19.47m 27.9% 6.72% 5.40m $9.47m
PGF PM Capital Global Opportunities 353m 18.58m 25.19m 35.6% 7.14% 7.14m $7.94m
PIA Pengana International Equities 254m 13.44m 14.92m 11.0% 5.88% 5.72m $6.66m
TGG Templeton Global Growth Fund 211m 16.35m 11.40m -30.3% 5.41% 4.18m $5.51m
EGD Evans & Partners Global Disruption 121m 5.59m 10.01m 79.0% 8.24% 1.60m $2.51m
EGF Evans & Partners Global Flagship 119m 4.96m 9.72m 96.0% 8.15% 0.80m $1.36m
WQG WCM Global Growth 174m 9.78m 19.21m 96.4% 11.03% 2.61m $2.81m
EGI Ellerston Global Investments 105m 8.44m 9.51m 12.8% 9.04% 2.12m $2.16m
ALI Argo Global Listed Infrastructure 142m 6.61m 6.58m -0.4% 4.64% 2.22m $4.18m
GVF Global Value Fund 148m 9.26m 6.82m -26.4% 4.62% 1.91m $2.05m
TGF Tribeca Global Natural Resources 63m 4.87m 5.73m 17.7% 9.10% 5.54m $7.06m
FGG Future Generation Global Investment 392m 11.91m 13.02m 9.3% 3.32% 5.05m $6.11m
HM1 Hearts and Minds Investments 200m 9.08m 11.44m 26.0% 5.72% 4.61m $12.72m
PAI Platinum Asia Investments 363m 18.23m 31.95m 75.2% 8.80% 6.95m $7.69m
EAI Ellerston Asian Investments 139m 14.50m 13.14m -9.4% 9.43% 3.38m $3.31m
PAF PM Capital Asian Opportunities 57m 4.10m 6.53m 59.2% 11.41% 1.48m $1.57m
Figure 39 - Specialist Strategy Liquidity
SOURCE: COMPANY DATA, IRESS & BELL POTTER.
ASX
CodeCompany/Trust name
Shares/Units
on Issue
(19 Nov'19)
Jun'19
Quarter Vol.
Sep'19
Quarter Vol.
Quarterly
Change
Quarterly
Liquidity
3 Year
Average
Monthly Vol.
3 Year
Average
Monthly Val.
LSF L1 Long Short Fund 665m 87.14m 69.65m -20.1% 10.48% 17.41m $27.88m
VG1 VGI Partners Global Investments 407m 22.25m 33.81m 51.9% 8.31% 4.79m $10.33m
APL Antipodes Global Investment 552m 54.04m 51.59m -4.5% 9.35% 12.52m $13.95m
RF1 Regal Investment Fund 113m 4.74m 9.86m 108.1% 8.75% 1.07m $1.74m
ALF Australian Leaders Fund 239m 28.21m 20.78m -26.3% 8.71% 8.08m $8.73m
AEG Absolute Equity Performance 99m 8.36m 8.75m 4.6% 8.88% 2.68m $2.83m
URB URB Investments 74m 4.71m 5.49m 16.5% 7.43% 1.13m $1.12m
BAF Blue Sky Alternatives Access Fund 200m 19.83m 10.62m -46.4% 5.31% 5.24m $4.94m
PE1 Pengana Private Equity Trust 164m 4.87m 6.38m 31.0% 3.89% 1.87m $2.49m
BTI Bailador Technology Investments 120m 7.76m 7.67m -1.2% 6.38% 1.43m $1.32m
GCI Gryphon Capital Income Trust 155m 6.49m 9.39m 44.8% 6.08% 2.21m $4.41m
MXT MCP Master Income Trust 638m 64.14m 77.62m 21.0% 12.17% 13.13m $26.84m
MOT MCP Income Opportunities Trust 173m 11.66m 11.99m 2.8% 6.94% 3.94m $8.10m
NBI NB Global Corporate Income Trust 445m 25.24m 48.82m 93.5% 10.96% 9.07m $18.47m
PCI Perpetual Credit Income Trust 400m 32.06m 37.27m 16.3% 9.31% 13.86m $15.72m

LISTED INVESTMENT COMPANIES & TRUSTS. 27
AUSTRALIAN FOUNDATION INVESTMENT CO (AFI)Domestic Focused Share Price and NTA Summary
Mandate: Australian listed equities Benchmark: S&P/ASX 200 Accumulation as at 30-Sep-19
Manager: Internal Management Fee: 0.13% p.a Share price $6.38
Listed: 1936 Performance Fee: None Pre-tax NTA $6.48
Post-tax NTA $5.51
Investment Strategy
Pre-tax NTA -1.5%
Post-tax NTA 15.8%
Historic Dividend (prior 12-mths)¹
Personnel Dividends (net) $0.2400
Yield 3.8%
Franking 100%
Grossed up yield 5.4%
Key Information ¹Not including special dividends/distribut ions
Exposure: International/Domestic, Equities/Fixed Income/Derivatives, Cash Capital Structure
Style: Large/Medium/Small Cap, Balanced/Value/Growth, Passive/Active, Long/Short Ordinary shares 1200.1m
Derivatives: Options used to generate additional income in its short-term trading portfolio. Options/other 0.0m
Cash/Debt: $155m cash (30 Sep 2019) Fully diluted 1200.1m
Dividend reinvestment plan: Yes, VWAP 5 day average price post ex-date Market capitalisation 7656.9m
Other: Affiliated with AMCIL (AMH), Djerriwarrh (DJW) and Mirrabooka (MIR).
Performance 3-mth 6-mth 1 year 3 yr p.a. 5 yr p.a. 10 yr p.a. AFI Share Price v ASX All Ords
Share price*
Performance 4.4% 9.7% 7.7% 8.5% 5.8% 6.8%
Index 2.4% 10.5% 12.5% 11.9% 9.5% 8.1%
Active return 2.0% -0.8% -4.8% -3.4% -3.7% -1.3%
NTA+
Performance 2.0% 9.8% 10.0% 9.7% 7.2% 7.6%
Benchmark 2.4% 10.5% 12.5% 11.9% 9.5% 8.1%
Active return -0.4% -0.7% -2.5% -2.2% -2.3% -0.5%
Share Price and NTA Top 20 Holdings %
as at 30-Sep-19
Commonwealth Bank 8.3
BHP 6.4
CSL 6.4
Westpac Banking Corp. 6.0
National Australia Bank 4.9
Transurban Group 4.4
Macquarie Group 3.6
Wesfarmers 3.5
ANZ Banking Group 3.4
Risk/Return Indicators Sector Exposure (Portfolio) Woolworths Group 2.8
Sharpe Standard Rio Tinto 2.3
Share price* Ratio Ratio Deviation Amcor 2.3
Year 1 -0.49 0.62 9.5% Sydney Airport 2.0
Year 3 -0.37 0.82 7.4% James Hardie Industries 2.0
Year 5 -0.43 0.42 8.1% Telstra Corporation 1.8
NTA+ Woodside Petroleum 1.8
Year 1 -1.59 0.79 10.4% Brambles 1.8
Year 3 -1.78 0.88 8.3% Oil Search 1.7
Year 5 -1.81 0.45 10.7% Mainfreight 1.5
Sonic Healthcare 1.5
% of Total 68.6* The share price benchmark has been compared against the S&P/ASX All Ordinaries Accumulat ion Index. + The NTA has been compared against
the S&P/ASX 200 Accumulat ion.
*+ M easurement of a LIC’s performance is calculated after all operat ing expenses, provision and payment of both income and realised capital gains tax and the reinvestment of dividends, and do not incorporate franking.
Index returns however are ent irely before any operat ing expenses or taxat ion. LIC returns will consequent ly be understated relat ive to the Index return.
AFI takes a medium to longer term view of value which means that the aim is to buy and hold
individual stocks for the long term based on selection criteria which, in summary, include:
formulation and execution of the business strategy and its underlying business value; key
financial indicators, including cash flow, prospective price earnings relative to projected growth,
sustainability of earnings and dividend yield; and corporate governance practices.
Premium/(Discount) share price to:
Investment Personnel: Mark Freeman (CEO). Directors: John Paterson (Chairman), Ross
Barker, Rebecca Dee-Bradbury, Mark Freeman, David Peever, Catherine Walter, Peter Williams
and Graeme Liebelt.
Information
$5.00
$5.50
$6.00
$6.50
$7.00
Sep-18 Dec-18 Mar-19 Jun-19 Sep-19
All Ords Rebased AFI
-20%
-10%
0%
10%
20%
$3.00
$4.00
$5.00
$6.00
$7.00
2004 2005 2006 2007 2008 2009 2010 2011 2012 2013 2014 2015 2016 2017 2018 2019
Prem/Disc (RHS) Pre-Tax NTA (LHS) Share Price (LHS)
Financials
Industrials
Materials
Healthcare
Consumer Staples
Other

LISTED INVESTMENT COMPANIES & TRUSTS. 28
ARGO INVESTMENTS (ARG)Domestic Focused Share Price and NTA Summary
Mandate: Australian listed equities Benchmark: S&P/ASX 200 Accumulation as at 30-Sep-19
Manager: Internal Management Fee: 0.15% Share price $8.19
Listed: 1948 Performance Fee: None Pre-tax NTA $8.44
Post-tax NTA $7.38
Investment Strategy
Pre-tax NTA -3.0%
Post-tax NTA 11.0%
Historic Dividend (prior 12-mths)¹
Personnel Dividends (net) $0.3300
Yield 4.0%
Franking 100%
Grossed up yield 5.8%
Key Information ¹Not including special dividends/distribut ions
Exposure: International/Domestic, Equities/Fixed Income/Derivatives, Cash Capital Structure
Style: Large/Medium/Small Cap, Balanced/Value/Growth, Passive/Active, Long/Short Ordinary shares 717.7m
Derivatives: Options used to generate additional income in its short-term trading portfolio. Options/other 0.0m
Cash/Debt: $254m cash (30 Sep 2019) Fully diluted 717.7m
Dividend reinvestment plan: Yes Market capitalisation 5878.0m
Other: n/a
Performance 3-mth 6-mth 1 year 3 yr p.a. 5 yr p.a. 10 yr p.a. ARG Share Price v ASX All Ords
Share price*
Performance 3.0% 9.6% 7.5% 8.5% 5.7% 6.4%
Index 2.4% 10.5% 12.5% 11.9% 9.5% 8.1%
Active return 0.6% -0.9% -5.0% -3.4% -3.8% -1.7%
NTA+
Performance 2.3% 8.6% 9.0% 9.2% 7.4% 7.1%
Benchmark 2.4% 10.5% 12.5% 11.9% 9.5% 8.1%
Active return -0.1% -1.9% -3.5% -2.7% -2.1% -1.0%
Share Price and NTA Top 20 Holdings %
as at 30-Sep-19
Westpac 5.8
Macquarie 5.3
ANZ Bank 4.6
BHP Group 4.5
CSL 4.3
Commonwealth Bank 4.1
Wesfarmers 3.3
Rio Tinto 3.2
NAB 3.1
Risk/Return Indicators Sector Exposure (Top 20) Telstra 2.5
Sharpe Standard Aust. United Investment 2.2
Share price* Ratio Ratio Deviation APA 2.0
Year 1 -0.67 0.94 6.2% Transurban 2.0
Year 3 -0.44 1.06 5.8% Ramsay Health Care 2.0
Year 5 -0.44 0.46 7.1% Woolworths 2.0
NTA+ Sydney Airport 1.9
Year 1 -1.43 0.68 10.7% Sonic Healthcare 1.7
Year 3 -1.46 0.85 8.1% Aristocrat Leisure 1.6
Year 5 -1.18 0.50 10.1% QBE Insurance 1.5
Origin Energy 1.5
% of Total 59.1* The share price benchmark has been compared against the S&P/ASX 200 Accumulat ion. + The NTA has been compared against the S&P/ASX
200 Accumulat ion.
*+ M easurement of a LIC’s performance is calculated after all operat ing expenses, provision and payment of both income and realised capital gains tax and the reinvestment of dividends, and do not incorporate franking.
Index returns however are ent irely before any operat ing expenses or taxat ion. LIC returns will consequent ly be understated relat ive to the Index return.
ARG's objective is to maximise long-term returns to shareholders through a balance of capital
and dividend growth. The Company seeks to invest in quality companies that display sound
management and a capability to grow profitability to fund increasing dividend payments. ARG is
a value orientated, bottom-up stock picker whose objective is to buy on price weakness and
hold for the long-term. ARG characterises itself as moderately benchmark aware, value driven
and fundamentally based.
Premium/(Discount) share price to:
Investment Personnel: Jason Beddow (MD), Andy Forster (SIO), Brydie Lloyd-Roberts, Paul
Frost, Andrew Moller and Colin Whitehead. Directors: Russell Higgins AO (Chairman), Anne
Brennan, Jason Beddow, Chris Cuffe AO, Joycelyn Morton, Liz Lewin and Roger Davis.
Information
$7.00
$7.50
$8.00
$8.50
$9.00
Sep-18 Dec-18 Mar-19 Jun-19 Sep-19
All Ords Rebased ARG
Financials Health Care
Materials
Consumer Staples
IndustrialsOther
-20%
-10%
0%
10%
20%
$4.00
$5.50
$7.00
$8.50
$10.00
2004 2005 2006 2007 2008 2009 2010 2011 2012 2013 2014 2015 2016 2017 2018 2019
Prem/Disc (RHS) Pre-Tax NTA (LHS) Share Price (LHS)

LISTED INVESTMENT COMPANIES & TRUSTS. 29
AUSTRALIAN UNITED INVESTMENT CO (AUI)Domestic Focused Share Price and NTA Summary
Mandate: Australian listed equities Benchmark: S&P/ASX 200 Accumulation as at 30-Sep-19
Manager: Internal Management Fee: 0.09% Share price $9.30
Listed: 1953 Performance Fee: None Pre-tax NTA $9.92
Post-tax NTA $8.41
Investment Strategy
Pre-tax NTA -6.2%
Post-tax NTA 10.6%
Historic Dividend (prior 12-mths)¹
Personnel Dividends (net) $0.3600
Yield 3.9%
Franking 100%
Grossed up yield 5.5%
Key Information ¹Not including special dividends/distribut ions
Exposure: International/Domestic, Equities/Fixed Income/Derivatives, Cash Capital Structure
Style: Large/Medium/Small Cap, Balanced/Value/Growth, Passive/Active, Long/Short Ordinary shares 124.5m
Derivatives: n/a Options/other 0.0m
Cash/Debt: $69m Cash (30 Sep 2019), $90m Debt (30 Sep 2019) Fully diluted 124.5m
Dividend reinvestment plan: 5 day average price from ex-date. Market capitalisation 1157.7m
Other: Affiliated with DUI
Performance 3-mth 6-mth 1 year 3 yr p.a. 5 yr p.a. 10 yr p.a. AUI Share Price v ASX All Ords
Share price*
Performance 4.5% 13.0% 13.9% 13.5% 7.1% 7.6%
Index 2.4% 10.5% 12.5% 11.9% 9.5% 8.1%
Active return 2.1% 2.5% 1.4% 1.6% -2.4% -0.5%
NTA+
Performance 2.6% 10.7% 11.6% 12.3% 8.2% 7.5%
Benchmark 2.4% 10.5% 12.5% 11.9% 9.5% 8.1%
Active return 0.2% 0.2% -0.9% 0.4% -1.3% -0.6%
Share Price and NTA Top 20 Holdings %
as at 30-Sep-19
Commonwealth Bank 7.9
CSL Ltd 7.0
Westpac Banking Corp 6.7
ANZ Banking Group Ltd 6.5
Transurban Group 6.2
Rio Tinto Ltd 5.3
BHP Billiton Ltd 5.1
Div. United Investment Ltd 5.1
Woodside Petroleum Ltd 4.9
Risk/Return Indicators Sector Exposure (Top 20) National Australia Bank 4.5
Sharpe Standard Wesfarmers Ltd 4.2
Share price* Ratio Ratio Deviation Woolworths Ltd 2.8
Year 1 0.15 1.20 10.1% Sydney Airport 2.7
Year 3 0.19 1.22 9.1% Atlas Arteria Ltd 2.0
Year 5 -0.28 0.45 10.2% Ramsay Health Care Ltd 1.7
NTA+ Coles Group Ltd 1.6
Year 1 -0.23 0.79 12.4% Seek Ltd 1.6
Year 3 0.14 1.05 9.4% W H Soul Pattinson 1.6
Year 5 -0.40 0.47 12.2% Event Hospitality and Ent. 1.5
Brambles Ltd 1.4
% of Total 80.3* The share price benchmark has been compared against the S&P/ASX 200 Accumulat ion. + The NTA has been compared against the S&P/ASX
200 Accumulat ion.
*+ M easurement of a LIC’s performance is calculated after all operat ing expenses, provision and payment of both income and realised capital gains tax and the reinvestment of dividends, and do not incorporate franking.
Index returns however are ent irely before any operat ing expenses or taxat ion. LIC returns will consequent ly be understated relat ive to the Index return.
AUI is an investment company which seeks, through careful portfolio management, to reduce
risk and improve income from dividends and interest so as to maintain and grow dividend
distributions to shareholders over the long term. AUI was founded in 1953 by the late Sir Ian
Potter and The Ian Potter Foundation Ltd is today the Company's largest single shareholder.
Premium/(Discount) share price to:
Investment Personnel/Directors: Charles Goode AC (Chairman), Dion Hershan, Frederick
Grimwade and Jim Craig.
Information
$7.00
$7.75
$8.50
$9.25
$10.00
Sep-18 Dec-18 Mar-19 Jun-19 Sep-19
All Ords Rebased AUI
Financials
Industrials
Materials
Health CareConsumer Staples
Other
-20%
-10%
0%
10%
20%
$0.00
$3.00
$6.00
$9.00
$12.00
2004 2005 2006 2007 2008 2009 2010 2011 2012 2013 2014 2015 2016 2017 2018 2019
Prem/Disc (RHS) Pre-Tax NTA (LHS) Share Price (LHS)
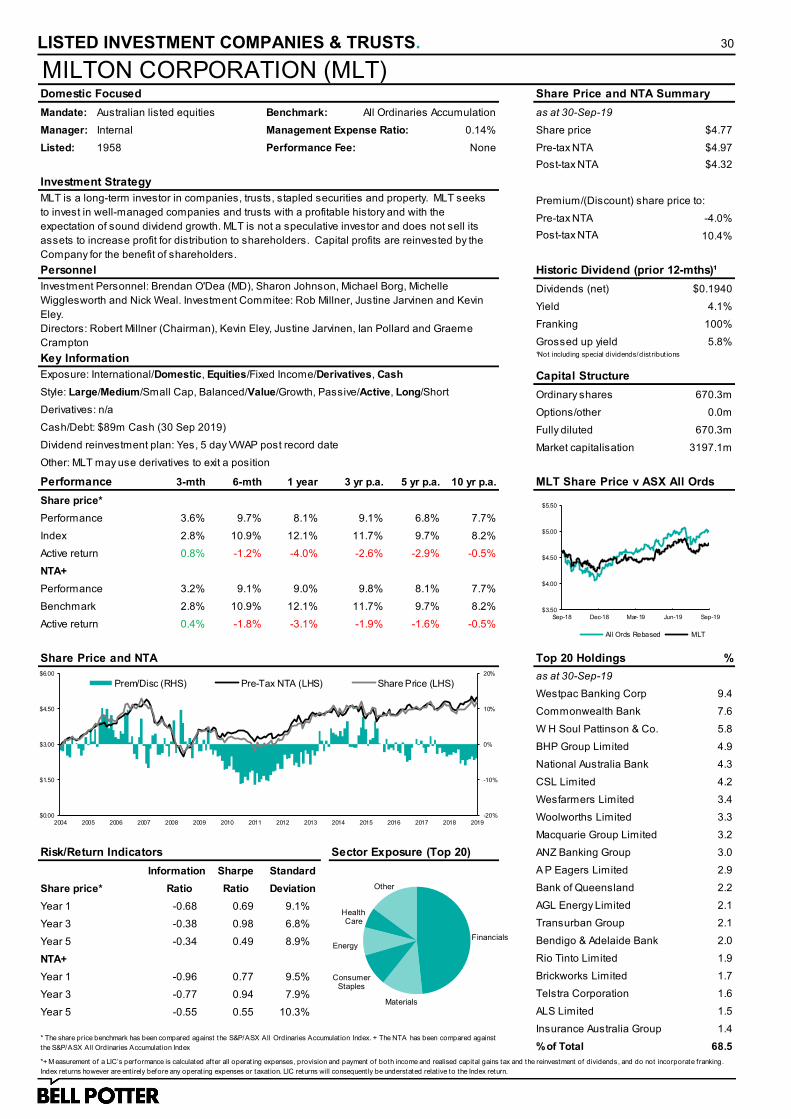
LISTED INVESTMENT COMPANIES & TRUSTS. 30
MILTON CORPORATION (MLT)Domestic Focused Share Price and NTA Summary
Mandate: Australian listed equities Benchmark: All Ordinaries Accumulation as at 30-Sep-19
Manager: Internal Management Expense Ratio: 0.14% Share price $4.77
Listed: 1958 Performance Fee: None Pre-tax NTA $4.97
Post-tax NTA $4.32
Investment Strategy
Pre-tax NTA -4.0%
Post-tax NTA 10.4%
Personnel Historic Dividend (prior 12-mths)¹
Dividends (net) $0.1940
Yield 4.1%
Franking 100%
Grossed up yield 5.8%
Key Information ¹Not including special dividends/distribut ions
Exposure: International/Domestic, Equities/Fixed Income/Derivatives, Cash Capital Structure
Style: Large/Medium/Small Cap, Balanced/Value/Growth, Passive/Active, Long/Short Ordinary shares 670.3m
Derivatives: n/a Options/other 0.0m
Cash/Debt: $89m Cash (30 Sep 2019) Fully diluted 670.3m
Dividend reinvestment plan: Yes, 5 day VWAP post record date Market capitalisation 3197.1m
Other: MLT may use derivatives to exit a position
Performance 3-mth 6-mth 1 year 3 yr p.a. 5 yr p.a. 10 yr p.a. MLT Share Price v ASX All Ords
Share price*
Performance 3.6% 9.7% 8.1% 9.1% 6.8% 7.7%
Index 2.8% 10.9% 12.1% 11.7% 9.7% 8.2%
Active return 0.8% -1.2% -4.0% -2.6% -2.9% -0.5%
NTA+
Performance 3.2% 9.1% 9.0% 9.8% 8.1% 7.7%
Benchmark 2.8% 10.9% 12.1% 11.7% 9.7% 8.2%
Active return 0.4% -1.8% -3.1% -1.9% -1.6% -0.5%
Share Price and NTA Top 20 Holdings %
as at 30-Sep-19
Westpac Banking Corp 9.4
Commonwealth Bank 7.6
W H Soul Pattinson & Co. 5.8
BHP Group Limited 4.9
National Australia Bank 4.3
CSL Limited 4.2
Wesfarmers Limited 3.4
Woolworths Limited 3.3
Macquarie Group Limited 3.2
Risk/Return Indicators Sector Exposure (Top 20) ANZ Banking Group 3.0
Sharpe Standard A P Eagers Limited 2.9
Share price* Ratio Ratio Deviation Bank of Queensland 2.2
Year 1 -0.68 0.69 9.1% AGL Energy Limited 2.1
Year 3 -0.38 0.98 6.8% Transurban Group 2.1
Year 5 -0.34 0.49 8.9% Bendigo & Adelaide Bank 2.0
NTA+ Rio Tinto Limited 1.9
Year 1 -0.96 0.77 9.5% Brickworks Limited 1.7
Year 3 -0.77 0.94 7.9% Telstra Corporation 1.6
Year 5 -0.55 0.55 10.3% ALS Limited 1.5
Insurance Australia Group 1.4
% of Total 68.5* The share price benchmark has been compared against the S&P/ASX All Ordinaries Accumulat ion Index. + The NTA has been compared against
the S&P/ASX All Ordinaries Accumulat ion Index
*+ M easurement of a LIC’s performance is calculated after all operat ing expenses, provision and payment of both income and realised capital gains tax and the reinvestment of dividends, and do not incorporate franking.
Index returns however are ent irely before any operat ing expenses or taxat ion. LIC returns will consequent ly be understated relat ive to the Index return.
Premium/(Discount) share price to:
Information
MLT is a long-term investor in companies, trusts, stapled securities and property. MLT seeks
to invest in well-managed companies and trusts with a profitable history and with the
expectation of sound dividend growth. MLT is not a speculative investor and does not sell its
assets to increase profit for distribution to shareholders. Capital profits are reinvested by the
Company for the benefit of shareholders.
Investment Personnel: Brendan O'Dea (MD), Sharon Johnson, Michael Borg, Michelle
Wigglesworth and Nick Weal. Investment Commitee: Rob Millner, Justine Jarvinen and Kevin
Eley.
Directors: Robert Millner (Chairman), Kevin Eley, Justine Jarvinen, Ian Pollard and Graeme
Crampton
$3.50
$4.00
$4.50
$5.00
$5.50
Sep-18 Dec-18 Mar-19 Jun-19 Sep-19
All Ords Rebased MLT
Financials
Materials
Consumer Staples
Energy
Health Care
Other
-20%
-10%
0%
10%
20%
$0.00
$1.50
$3.00
$4.50
$6.00
2004 2005 2006 2007 2008 2009 2010 2011 2012 2013 2014 2015 2016 2017 2018 2019
Prem/Disc (RHS) Pre-Tax NTA (LHS) Share Price (LHS)

LISTED INVESTMENT COMPANIES & TRUSTS. 31
BKI INVESTMENT CO (BKI)Domestic Focused Share Price and NTA Summary
Mandate: Australian listed equities Benchmark: S&P/ASX 300 Accumulation as at 30-Sep-19
Manager: External (Contact Asset Mgmt) Management Fee: 0.17% Share price $1.61
Listed: 2003 Performance Fee: None Pre-tax NTA $1.66
Post-tax NTA $1.56
Investment Strategy
Pre-tax NTA -3.0%
Post-tax NTA 3.2%
Historic Dividend (prior 12-mths)¹
Personnel Dividends (net) $0.0733
Yield 4.5%
Franking 100%
Grossed up yield 6.5%
Key Information ¹Not including special dividends/distribut ions
Exposure: International/Domestic, Equities/Fixed Income/Derivatives, Cash Capital Structure
Style: Large/Medium/Small Cap, Balanced/Value/Growth, Passive/Active, Long/Short Ordinary shares 733.4m
Derivatives: n/a Options/other 0.0m
Cash/Debt: $48m cash (30 Sep 2019) Fully diluted 733.4m
Dividend reinvestment plan: Yes, 5 day VWAP post record date Market capitalisation 1180.8m
Other: n/a
Performance 3-mth 6-mth 1 year 3 yr p.a. 5 yr p.a. 10 yr p.a. BKI Share Price v ASX All Ords
Share price*
Performance 5.5% 10.4% 11.9% 6.4% 5.6% 7.9%
Index 2.6% 10.8% 12.6% 11.9% 9.5% 8.0%
Active return 2.9% -0.4% -0.7% -5.5% -3.9% -0.1%
NTA+
Performance 1.1% 8.1% 8.2% 7.4% 6.0% 6.5%
Benchmark 2.6% 10.8% 12.6% 11.9% 9.5% 8.0%
Active return -1.5% -2.7% -4.4% -4.5% -3.5% -1.5%
Share Price and NTA Top 20 Holdings %
as at 30-Sep-19
Commonwealth Bank 6.8
National Australia Bank 6.1
Macquarie Group 5.3
Westpac Banking Corp. 5.0
APA Group 4.6
BHP Limited 4.5
Transurban Group 4.4
Woolworths Limited 4.4
Wesfarmers Limited 3.7
Risk/Return Indicators Sector Exposure (Top 20) ANZ Banking Group 3.6
Sharpe Standard Sydney Airport 3.0
Share price* Ratio Ratio Deviation Woodside Petroleum 2.9
Year 1 -0.05 0.80 12.6% TPG Telecom 2.7
Year 3 -0.45 0.37 11.0% Ramsay Healthcare 2.7
Year 5 -0.37 0.29 10.8% New Hope Corporation 2.7
NTA+ Telstra Corporation 2.7
Year 1 -1.74 0.59 10.8% ASX Limited 2.6
Year 3 -1.99 0.58 8.6% AGL Energy Limited 2.3
Year 5 -1.47 0.35 10.3% IAG Limited 2.2
Sonic Healthcare 2.2
% of Total 74.4* The share price benchmark has been compared against the S&P/ASX 300 Accumulat ion. + The NTA has been compared against the S&P/ASX
300 Accumulat ion.
*+ M easurement of a LIC’s performance is calculated after all operat ing expenses, provision and payment of both income and realised capital gains tax and the reinvestment of dividends, and do not incorporate franking.
Index returns however are ent irely before any operat ing expenses or taxat ion. LIC returns will consequent ly be understated relat ive to the Index return.
BKI invests with a long-term horizon in companies, trust and interest bearing securities, with a
focus on well-managed businesses with a profitable history and sound dividend or distribution
growth prospects. The portfolio had been built over 15 years, prior to being acquired by BKI and
listed in 2003.
Premium/(Discount) share price to:
Investment Personnel: Tom Millner, Will Culbert. Directors: Robert Millner (Chairman),
Alexander Payne, David Hall, Ian Huntley
Information
$1.30
$1.40
$1.50
$1.60
$1.70
Sep-18 Dec-18 Mar-19 Jun-19 Sep-19
All Ords Rebased BKI
Financials
Consumer Staples
Industrials
Utilities
Energy
Other
-20%
-10%
0%
10%
20%
$0.60
$0.95
$1.30
$1.65
$2.00
2004 2005 2006 2007 2008 2009 2010 2011 2012 2013 2014 2015 2016 2017 2018 2019
Prem/Disc (RHS) Pre-Tax NTA (LHS) Share Price (LHS)
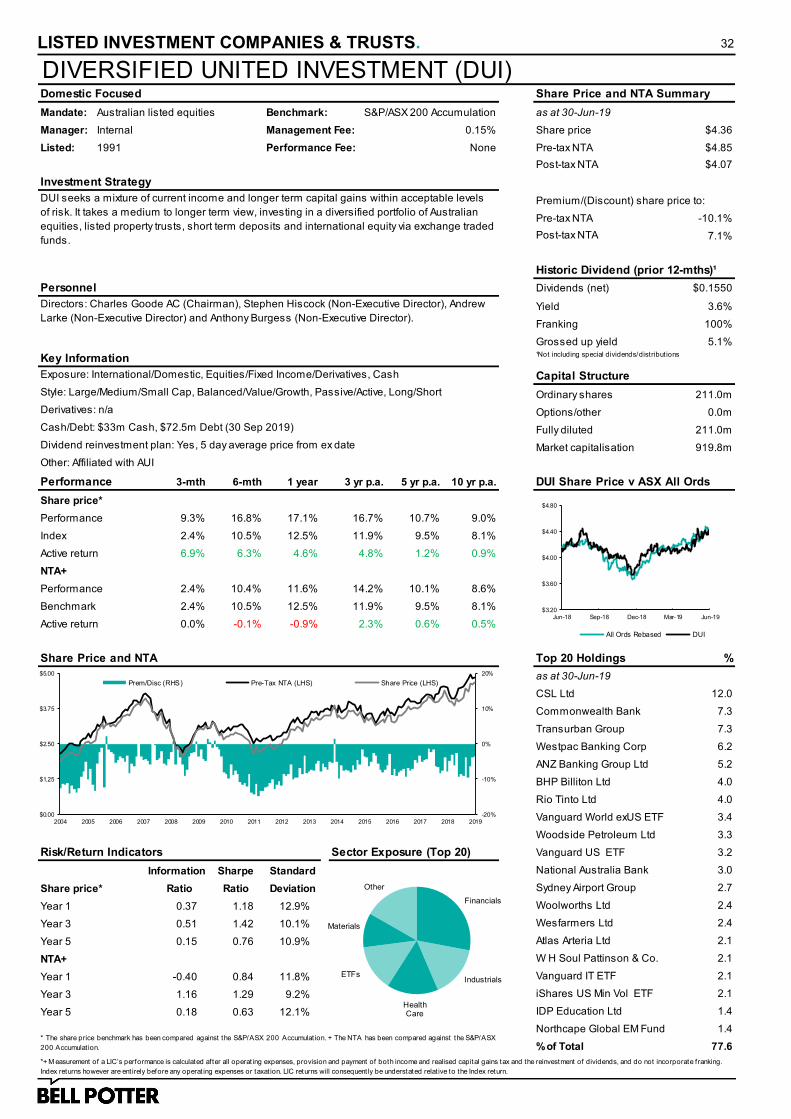
LISTED INVESTMENT COMPANIES & TRUSTS. 32
DIVERSIFIED UNITED INVESTMENT (DUI)Domestic Focused Share Price and NTA Summary
Mandate: Australian listed equities Benchmark: S&P/ASX 200 Accumulation as at 30-Jun-19
Manager: Internal Management Fee: 0.15% Share price $4.36
Listed: 1991 Performance Fee: None Pre-tax NTA $4.85
Post-tax NTA $4.07
Investment Strategy
Pre-tax NTA -10.1%
Post-tax NTA 7.1%
Historic Dividend (prior 12-mths)¹
Personnel Dividends (net) $0.1550
Yield 3.6%
Franking 100%
Grossed up yield 5.1%
Key Information ¹Not including special dividends/distribut ions
Exposure: International/Domestic, Equities/Fixed Income/Derivatives, Cash Capital Structure
Style: Large/Medium/Small Cap, Balanced/Value/Growth, Passive/Active, Long/Short Ordinary shares 211.0m
Derivatives: n/a Options/other 0.0m
Cash/Debt: $33m Cash, $72.5m Debt (30 Sep 2019) Fully diluted 211.0m
Dividend reinvestment plan: Yes, 5 day average price from ex date Market capitalisation 919.8m
Other: Affiliated with AUI
Performance 3-mth 6-mth 1 year 3 yr p.a. 5 yr p.a. 10 yr p.a. DUI Share Price v ASX All Ords
Share price*
Performance 9.3% 16.8% 17.1% 16.7% 10.7% 9.0%
Index 2.4% 10.5% 12.5% 11.9% 9.5% 8.1%
Active return 6.9% 6.3% 4.6% 4.8% 1.2% 0.9%
NTA+
Performance 2.4% 10.4% 11.6% 14.2% 10.1% 8.6%
Benchmark 2.4% 10.5% 12.5% 11.9% 9.5% 8.1%
Active return 0.0% -0.1% -0.9% 2.3% 0.6% 0.5%
Share Price and NTA Top 20 Holdings %
as at 30-Jun-19
CSL Ltd 12.0
Commonwealth Bank 7.3
Transurban Group 7.3
Westpac Banking Corp 6.2
ANZ Banking Group Ltd 5.2
BHP Billiton Ltd 4.0
Rio Tinto Ltd 4.0
Vanguard World exUS ETF 3.4
Woodside Petroleum Ltd 3.3
Risk/Return Indicators Sector Exposure (Top 20) Vanguard US ETF 3.2
Sharpe Standard National Australia Bank 3.0
Share price* Ratio Ratio Deviation Sydney Airport Group 2.7
Year 1 0.37 1.18 12.9% Woolworths Ltd 2.4
Year 3 0.51 1.42 10.1% Wesfarmers Ltd 2.4
Year 5 0.15 0.76 10.9% Atlas Arteria Ltd 2.1
NTA+ W H Soul Pattinson & Co. 2.1
Year 1 -0.40 0.84 11.8% Vanguard IT ETF 2.1
Year 3 1.16 1.29 9.2% iShares US Min Vol ETF 2.1
Year 5 0.18 0.63 12.1% IDP Education Ltd 1.4
Northcape Global EM Fund 1.4
% of Total 77.6* The share price benchmark has been compared against the S&P/ASX 200 Accumulat ion. + The NTA has been compared against the S&P/ASX
200 Accumulat ion.
*+ M easurement of a LIC’s performance is calculated after all operat ing expenses, provision and payment of both income and realised capital gains tax and the reinvestment of dividends, and do not incorporate franking.
Index returns however are ent irely before any operat ing expenses or taxat ion. LIC returns will consequent ly be understated relat ive to the Index return.
DUI seeks a mixture of current income and longer term capital gains within acceptable levels
of risk. It takes a medium to longer term view, investing in a diversified portfolio of Australian
equities, listed property trusts, short term deposits and international equity via exchange traded
funds.
Premium/(Discount) share price to:
Directors: Charles Goode AC (Chairman), Stephen Hiscock (Non-Executive Director), Andrew
Larke (Non-Executive Director) and Anthony Burgess (Non-Executive Director).
Information
$3.20
$3.60
$4.00
$4.40
$4.80
Jun-18 Sep-18 Dec-18 Mar-19 Jun-19
All Ords Rebased DUI
Financials
Industrials
Health Care
ETFs
Materials
Other
-20%
-10%
0%
10%
20%
$0.00
$1.25
$2.50
$3.75
$5.00
2004 2005 2006 2007 2008 2009 2010 2011 2012 2013 2014 2015 2016 2017 2018 2019
Prem/Disc (RHS) Pre-Tax NTA (LHS) Share Price (LHS)
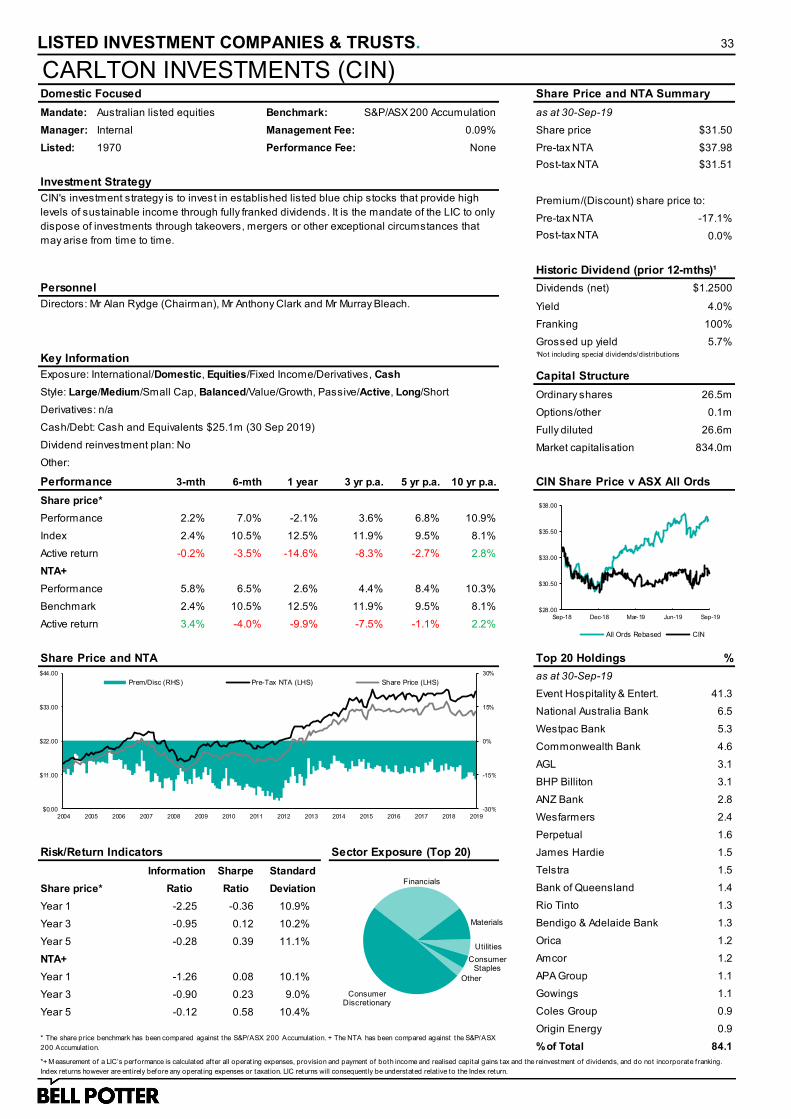
LISTED INVESTMENT COMPANIES & TRUSTS. 33
CARLTON INVESTMENTS (CIN)Domestic Focused Share Price and NTA Summary
Mandate: Australian listed equities Benchmark: S&P/ASX 200 Accumulation as at 30-Sep-19
Manager: Internal Management Fee: 0.09% Share price $31.50
Listed: 1970 Performance Fee: None Pre-tax NTA $37.98
Post-tax NTA $31.51
Investment Strategy
Pre-tax NTA -17.1%
Post-tax NTA 0.0%
Historic Dividend (prior 12-mths)¹
Personnel Dividends (net) $1.2500
Yield 4.0%
Franking 100%
Grossed up yield 5.7%
Key Information ¹Not including special dividends/distribut ions
Exposure: International/Domestic, Equities/Fixed Income/Derivatives, Cash Capital Structure
Style: Large/Medium/Small Cap, Balanced/Value/Growth, Passive/Active, Long/Short Ordinary shares 26.5m
Derivatives: n/a Options/other 0.1m
Cash/Debt: Cash and Equivalents $25.1m (30 Sep 2019) Fully diluted 26.6m
Dividend reinvestment plan: No Market capitalisation 834.0m
Other:
Performance 3-mth 6-mth 1 year 3 yr p.a. 5 yr p.a. 10 yr p.a. CIN Share Price v ASX All Ords
Share price*
Performance 2.2% 7.0% -2.1% 3.6% 6.8% 10.9%
Index 2.4% 10.5% 12.5% 11.9% 9.5% 8.1%
Active return -0.2% -3.5% -14.6% -8.3% -2.7% 2.8%
NTA+
Performance 5.8% 6.5% 2.6% 4.4% 8.4% 10.3%
Benchmark 2.4% 10.5% 12.5% 11.9% 9.5% 8.1%
Active return 3.4% -4.0% -9.9% -7.5% -1.1% 2.2%
Share Price and NTA Top 20 Holdings %
as at 30-Sep-19
Event Hospitality & Entert. 41.3
National Australia Bank 6.5
Westpac Bank 5.3
Commonwealth Bank 4.6
AGL 3.1
BHP Billiton 3.1
ANZ Bank 2.8
Wesfarmers 2.4
Perpetual 1.6
Risk/Return Indicators Sector Exposure (Top 20) James Hardie 1.5
Sharpe Standard Telstra 1.5
Share price* Ratio Ratio Deviation Bank of Queensland 1.4
Year 1 -2.25 -0.36 10.9% Rio Tinto 1.3
Year 3 -0.95 0.12 10.2% Bendigo & Adelaide Bank 1.3
Year 5 -0.28 0.39 11.1% Orica 1.2
NTA+ Amcor 1.2
Year 1 -1.26 0.08 10.1% APA Group 1.1
Year 3 -0.90 0.23 9.0% Gowings 1.1
Year 5 -0.12 0.58 10.4% Coles Group 0.9
Origin Energy 0.9
% of Total 84.1* The share price benchmark has been compared against the S&P/ASX 200 Accumulat ion. + The NTA has been compared against the S&P/ASX
200 Accumulat ion.
*+ M easurement of a LIC’s performance is calculated after all operat ing expenses, provision and payment of both income and realised capital gains tax and the reinvestment of dividends, and do not incorporate franking.
Index returns however are ent irely before any operat ing expenses or taxat ion. LIC returns will consequent ly be understated relat ive to the Index return.
CIN's investment strategy is to invest in established listed blue chip stocks that provide high
levels of sustainable income through fully franked dividends. It is the mandate of the LIC to only
dispose of investments through takeovers, mergers or other exceptional circumstances that
may arise from time to time.
Premium/(Discount) share price to:
Directors: Mr Alan Rydge (Chairman), Mr Anthony Clark and Mr Murray Bleach.
Information
$28.00
$30.50
$33.00
$35.50
$38.00
Sep-18 Dec-18 Mar-19 Jun-19 Sep-19
All Ords Rebased CIN
Consumer Discretionary
Financials
Materials
Utilities
Consumer Staples
Other
-30%
-15%
0%
15%
30%
$0.00
$11.00
$22.00
$33.00
$44.00
2004 2005 2006 2007 2008 2009 2010 2011 2012 2013 2014 2015 2016 2017 2018 2019
Prem/Disc (RHS) Pre-Tax NTA (LHS) Share Price (LHS)
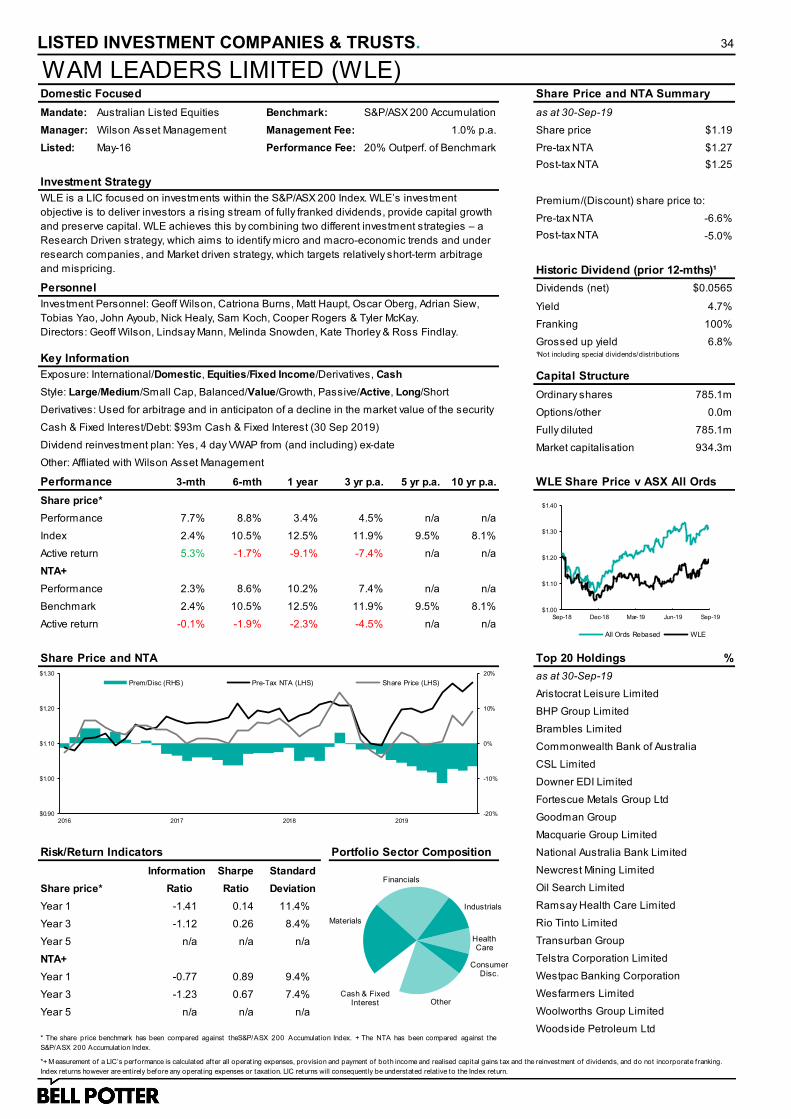
LISTED INVESTMENT COMPANIES & TRUSTS. 34
WAM LEADERS LIMITED (WLE)Domestic Focused Share Price and NTA Summary
Mandate: Australian Listed Equities Benchmark: S&P/ASX 200 Accumulation as at 30-Sep-19
Manager: Wilson Asset Management Management Fee: 1.0% p.a. Share price $1.19
Listed: May-16 Performance Fee: 20% Outperf. of Benchmark Pre-tax NTA $1.27
Post-tax NTA $1.25
Investment Strategy
Pre-tax NTA -6.6%
Post-tax NTA -5.0%
Historic Dividend (prior 12-mths)¹
Personnel Dividends (net) $0.0565
Yield 4.7%
Franking 100%
Grossed up yield 6.8%
Key Information ¹Not including special dividends/distribut ions
Exposure: International/Domestic, Equities/Fixed Income/Derivatives, Cash Capital Structure
Style: Large/Medium/Small Cap, Balanced/Value/Growth, Passive/Active, Long/Short Ordinary shares 785.1m
Derivatives: Used for arbitrage and in anticipaton of a decline in the market value of the security Options/other 0.0m
Cash & Fixed Interest/Debt: $93m Cash & Fixed Interest (30 Sep 2019) Fully diluted 785.1m
Dividend reinvestment plan: Yes, 4 day VWAP from (and including) ex-date Market capitalisation 934.3m
Other: Affliated with Wilson Asset Management
Performance 3-mth 6-mth 1 year 3 yr p.a. 5 yr p.a. 10 yr p.a. WLE Share Price v ASX All Ords
Share price*
Performance 7.7% 8.8% 3.4% 4.5% n/a n/a
Index 2.4% 10.5% 12.5% 11.9% 9.5% 8.1%
Active return 5.3% -1.7% -9.1% -7.4% n/a n/a
NTA+
Performance 2.3% 8.6% 10.2% 7.4% n/a n/a
Benchmark 2.4% 10.5% 12.5% 11.9% 9.5% 8.1%
Active return -0.1% -1.9% -2.3% -4.5% n/a n/a
Share Price and NTA Top 20 Holdings %
as at 30-Sep-19
Aristocrat Leisure Limited
BHP Group Limited
Brambles Limited
Commonwealth Bank of Australia
CSL Limited
Downer EDI Limited
Fortescue Metals Group Ltd
Goodman Group
Macquarie Group Limited
Risk/Return Indicators Portfolio Sector Composition National Australia Bank Limited
Sharpe Standard Newcrest Mining Limited
Share price* Ratio Ratio Deviation Oil Search Limited
Year 1 -1.41 0.14 11.4% Ramsay Health Care Limited
Year 3 -1.12 0.26 8.4% Rio Tinto Limited
Year 5 n/a n/a n/a Transurban Group
NTA+ Telstra Corporation Limited
Year 1 -0.77 0.89 9.4% Westpac Banking Corporation
Year 3 -1.23 0.67 7.4% Wesfarmers Limited
Year 5 n/a n/a n/a Woolworths Group Limited
Woodside Petroleum Ltd* The share price benchmark has been compared against theS&P/ASX 200 Accumulat ion Index. + The NTA has been compared against the
S&P/ASX 200 Accumulat ion Index.
*+ M easurement of a LIC’s performance is calculated after all operat ing expenses, provision and payment of both income and realised capital gains tax and the reinvestment of dividends, and do not incorporate franking.
Index returns however are ent irely before any operat ing expenses or taxat ion. LIC returns will consequent ly be understated relat ive to the Index return.
WLE is a LIC focused on investments within the S&P/ASX 200 Index. WLE’s investment
objective is to deliver investors a rising stream of fully franked dividends, provide capital growth
and preserve capital. WLE achieves this by combining two different investment strategies – a
Research Driven strategy, which aims to identify micro and macro-economic trends and under
research companies, and Market driven strategy, which targets relatively short-term arbitrage
and mispricing.
Premium/(Discount) share price to:
Investment Personnel: Geoff Wilson, Catriona Burns, Matt Haupt, Oscar Oberg, Adrian Siew,
Tobias Yao, John Ayoub, Nick Healy, Sam Koch, Cooper Rogers & Tyler McKay.
Directors: Geoff Wilson, Lindsay Mann, Melinda Snowden, Kate Thorley & Ross Findlay.
Information
$1.00
$1.10
$1.20
$1.30
$1.40
Sep-18 Dec-18 Mar-19 Jun-19 Sep-19
All Ords Rebased WLE
Materials
Financials
Industrials
Health Care
Consumer Disc.
OtherCash & Fixed
Interest
-20%
-10%
0%
10%
20%
$0.90
$1.00
$1.10
$1.20
$1.30
2016 2017 2018 2019
Prem/Disc (RHS) Pre-Tax NTA (LHS) Share Price (LHS)

LISTED INVESTMENT COMPANIES & TRUSTS. 35
WHITEFIELD (WHF)Domestic Focused Share Price and NTA Summary
Mandate: Australian listed equities Benchmark: S&P/ASX 200 Ind Accumulation as at 30-Sep-19
Manager: White Funds Management Pty Ltd Management Fee: 0.26% p.a Share price $4.99
Listed: 1923 Performance Fee: None Pre-tax NTA $5.41
Post-tax NTA $4.91
Investment Strategy
Pre-tax NTA -7.8%
Post-tax NTA 1.6%
Historic Dividend (prior 12-mths)¹
Personnel Dividends (net) $0.1975
Yield 4.0%
Franking 100%
Grossed up yield 5.7%
Key Information ¹Not including special dividends/distribut ions
Exposure: International/Domestic, Equities/Fixed Income/Derivatives, Cash Capital Structure
Style: Large/Medium/Small Cap, Balanced/Value/Growth, Passive/Active, Long/Short Ordinary shares 92.1m
Derivatives: n/a Options/other 0.3m
Cash/Debt: $0m Cash (30 Sep 2019), $32.1m Conv. Pref. Share (Face Value) (30 Sep 2019) Fully diluted 92.4m
Dividend reinvestment plan: Yes, 2.5% discount to a 5 day VWAP from (and including) ex-date Market capitalisation 459.7m
Other: N/A
Performance 3-mth 6-mth 1 year 3 yr p.a. 5 yr p.a. 10 yr p.a. WHF Share Price v ASX All Ords
Share price*
Performance 2.7% 14.8% 10.7% 9.4% 7.6% 8.9%
Index 3.9% 13.0% 12.9% 10.3% 9.8% 9.9%
Active return -1.2% 1.8% -2.2% -0.9% -2.2% -1.0%
NTA+
Performance 3.4% 12.1% 10.7% 8.3% 8.4% 8.4%
Benchmark 3.9% 13.0% 12.9% 10.3% 9.8% 9.9%
Active return -0.5% -0.9% -2.2% -2.0% -1.4% -1.5%
Share Price and NTA Top 20 Holdings %
as at 30-Sep-19
Commonwealth Bank 9.5
CSL Limited 7.0
Westpac Banking Corp. 6.7
ANZ Banking Group 5.6
National Australia Bank 5.3
Woolworths Group Limited 3.6
Telstra Corporation 3.4
Wesfarmers Limited 3.1
Macquarie Group Limited 2.7
Risk/Return Indicators Sector Exposure (Portfolio) Transurban Group 2.4
Sharpe Standard Aristocrat Leisure Limited 1.7
Share price* Ratio Ratio Deviation Goodman Group 1.5
Year 1 -0.33 0.93 9.6% Mirvac Group 1.3
Year 3 -0.14 0.94 7.5% Aurizon Holdings Limited 1.3
Year 5 -0.29 0.62 8.4% APA Group 1.3
NTA+ AGL Energy Limited 1.3
Year 1 -2.49 0.81 10.9% Insurance Australia Group 1.2
Year 3 -2.21 0.63 9.5% Sydney Airport 1.2
Year 5 -0.76 0.49 12.3% Sonic Healthcare Limited 1.2
Coles Group Limited 1.2
% of Total 62.2* The share price benchmark has been compared against the S&P/ASX 200 Industrial Accumulat ion Index. + The NTA has been compared against
the S&P/ASX 200 Industrial Accumulat ion.
*+ M easurement of a LIC’s performance is calculated after all operat ing expenses, provision and payment of both income and realised capital gains tax and the reinvestment of dividends, and do not incorporate franking.
Index returns however are ent irely before any operat ing expenses or taxat ion. LIC returns will consequent ly be understated relat ive to the Index return.
WHF seeks to own a portfolio of attactively priced businesses with a proven or strengthening
ability to deliver shareholder value. Its investment strategy utilises a disciplined quantitative
and qualitative process to identify and assess Quality, Intrinsic Value and Mispricing, and will
seek to invest where these elements favour their shareholders. It takes a style neutral
approach which is designed to provide a diversified return despite their focus on industrials.
Premium/(Discount) share price to:
Investment Personnel: Angus Gluskie, Peter Borkovec, Will Seddon.
Directors: Angus Gluskie (Interim Chairman), Martin Fowler, Mark Beardow, Lance Jenkins and
Will Seddon.
Information
$3.50
$4.00
$4.50
$5.00
$5.50
Sep-18 Dec-18 Mar-19 Jun-19 Sep-19
All Ords Rebased WHF
Commercial Banks
Health Care
Real EstateFinancials
(ex-Banks)
Industrials
Other
-30%
-15%
0%
15%
30%
$0.00
$1.75
$3.50
$5.25
$7.00
2004 2005 2006 2007 2008 2009 2010 2011 2012 2013 2014 2015 2016 2017 2018 2019
Prem/Disc (RHS) Pre-Tax NTA (LHS) Share Price (LHS)

LISTED INVESTMENT COMPANIES & TRUSTS. 36
PERPETUAL EQUITY INVESTMENT CO (PIC)Domestic Focused Share Price and NTA Summary
Mandate: Aust/Intl Listed Equities Benchmark: S&P/ASX 300 Accumulation as at 30-Sep-19
Manager: Perpetual Investment Mgmt Management Fee: 1.0% p.a. Share price $1.06
Listed: Dec-14 Performance Fee: None Pre-tax NTA $1.13
Post-tax NTA $1.12
Investment Strategy
Pre-tax NTA -6.2%
Post-tax NTA -5.6%
Historic Dividend (prior 12-mths)
Personnel Dividends (net) $0.0650
Yield 6.1%
Franking 100%
Grossed up yield 8.6%
Key Information
Exposure: International/Domestic, Equities/Fixed Income/Derivatives, Cash Capital Structure
Style: Large/Medium/Small Cap, Balanced/Value/Growth, Passive/Active, Long/Short Ordinary shares 345.7m
Derivatives: Can use derivatives to hedge currency & securities, and short term invest. Options/other 0.0m
Cash/Debt: $82m Cash/Fixed Income (30 Sep 2019) Fully diluted 345.7m
Dividend Reinvestment Plan: Yes Market capitalisation 366.4m
Other: n/a
Performance 3-mth 6-mth 1 year 3 yr p.a. 5 yr p.a. 10 yr p.a. PIC Share Price v ASX All Ords
Share price*
Performance 1.9% 4.0% -3.0% 8.2% n/a n/a
Index 2.6% 10.8% 12.6% 11.9% 9.5% 8.0%
Active return -0.7% -6.8% -15.6% -3.7% n/a n/a
NTA+
Performance -0.4% 6.1% 2.5% 7.0% n/a n/a
Benchmark 2.6% 10.8% 12.6% 11.9% 9.5% 8.0%
Active return -3.0% -4.7% -10.1% -4.9% n/a n/a
Share Price and NTA Top Holdings %
as at 30-Sep-19
Domestic Securites
Commonwealth Bank 7.1
Suncorp Group Limited 4.8
National Australia Bank 4.3
Crown Resorts 4.1
Amcor PLC 3.8
International Securities
Flutter Entertainment Plc 3.2
Ferguson Plc 2.8
Risk/Return Indicators Portfolio Sectors Takeda Pharmaceutical 0.9
Sharpe Standard % of Total 31.0
Share price* Ratio Ratio Deviation
Year 1 -2.07 -0.60 8.0% Allocation of Investments
Year 3 -0.42 0.67 8.6%
Year 5 n/a n/a n/a
NTA+
Year 1 -1.56 0.07 9.1%
Year 3 -0.71 0.57 8.2%
Year 5 n/a n/a n/a
* The share price benchmark has been compared against the S&P/ASX 300 Accumulat ion Index. + The NTA has been compared against the
S&P/ASX 300 Accumulat ion Index.
*+ M easurement of a LIC’s performance is calculated after all operat ing expenses, provision and payment of both income and realised capital gains tax and the reinvestment of dividends, and do not incorporate franking.
Index returns however are ent irely before any operat ing expenses or taxat ion. LIC returns will consequent ly be understated relat ive to the Index return.
PIC’s concentrated portfolio will primarily consist of mid cap Australian companies along with a
smaller portion of global listed securities in an attempt to generate outperformance relative to
the benchmark. The Manager will undertake a bottom up research approach to identify
companies with four key quality characteristics; sound management, conservative debt
(typically d/e ratio less than 50%), quality of business, and recurring earnings. The portfolio will
typically consist between 20-40 securities.
Premium/(Discount) share price to:
Investment Personnel: Vince Pezzullo, Paul Skamvougeras, Anthony Aboud, Anthony Cay, Jack
Collopy, Nathan Hughes, Garry Laurence. Directors: Nancy Fox (Chairman), Virginia Malley,
John Edstein, Christine Feldmanis, David Lane
Information
$0.90
$1.00
$1.10
$1.20
$1.30
Sep-18 Dec-18 Mar-19 Jun-19 Sep-19
All Ords Rebased PIC
Financials
Materials
Consumer Disc.
Consumer Staples
Energy
Other
Cash
-20%
-10%
0%
10%
20%
$0.50
$0.75
$1.00
$1.25
$1.50
2014 2015 2016 2017 2018 2019
Prem/Disc (RHS) Pre-Tax NTA (LHS) Share Price (LHS)
0% 25% 50% 75%
Cash
Global Securities
Australian Securi ties

LISTED INVESTMENT COMPANIES & TRUSTS. 37
AMCIL (AMH)Domestic Focused Share Price and NTA Summary
Mandate: Australian listed equities Benchmark: S&P/ASX 200 Accumulation as at 30-Sep-19
Manager: Internal Management Fee: 0.72% p.a. Share price $0.88
Listed: 2000 Performance Fee: None Pre-tax NTA $0.97
Post-tax NTA $0.89
Investment Strategy
Pre-tax NTA -9.3%
Post-tax NTA -1.1%
Historic Dividend (prior 12-mths)¹
Personnel Dividends (net) $0.0550
Yield 6.3%
Franking 100%
Grossed up yield 8.9%
Key Information ¹Not including special dividends/distribut ions
Exposure: International/Domestic, Equities/Fixed Income/Derivatives, Cash Capital Structure
Style: Large/Medium/Small Cap, Balanced/Value/Growth, Passive/Active, Long/Short Ordinary shares 278.5m
Derivatives: Options occasionally used to generate additional income. Options/other 0.0m
Cash/Debt: $7.3m cash (30 Sep 2019) Fully diluted 278.5m
Dividend reinvestment plan: Yes, 5 day average price post ex-date Market capitalisation 245.1m
Other: Affiliated with AFIC (AFI), Djerriwarrh (DJW) and Mirrabooka (MIR).
Performance 3-mth 6-mth 1 year 3 yr p.a. 5 yr p.a. 10 yr p.a. AMH Share Price v ASX All Ords
Share price*
Performance 4.6% 9.0% 2.4% 1.2% 4.6% 8.1%
Index 2.8% 10.9% 12.1% 11.7% 9.7% 8.2%
Active return 1.8% -1.9% -9.7% -10.5% -5.1% -0.1%
NTA+
Performance 2.6% 9.3% 5.7% 6.4% 7.2% 8.3%
Benchmark 2.4% 10.5% 12.5% 11.9% 9.5% 8.1%
Active return 0.2% -1.2% -6.8% -5.5% -2.3% 0.2%
Share Price and NTA Top 20 Holdings %
as at 30-Sep-19
CSL 7.6
National Australia Bank 5.7
Mainfreight 4.7
Macquarie Group 4.4
Transurban Group 4.3
BHP 4.2
Wesfarmers 4.0
James Hardie Industries 3.5
Sydney Airport 3.4
Risk/Return Indicators Sector Exposure (Top 20) Reliance Worldwide Corp 3.1
Sharpe Standard EQT Holdings 3.0
Share price* Ratio Ratio Deviation Carsales.com 3.0
Year 1 -0.93 0.06 12.0% Qube Holdings 2.9
Year 3 -1.13 -0.12 9.2% Wellcom Group 2.9
Year 5 -0.55 0.22 10.1% Commonwealth Bank 2.8
NTA+ Oil Search 2.7
Year 1 -2.21 0.35 11.3% Objective Corporation 2.6
Year 3 -1.32 0.46 8.8% Reece 2.6
Year 5 -0.49 0.47 10.0% Sonic Healthcare 2.6
Seek 2.5
% of Total 72.5* The share price benchmark has been compared against the S&P/ASX All Ordinaries Accumulat ion Index. + The NTA has been compared against
the S&P/ASX 200 Accumulat ion.
*+ M easurement of a LIC’s performance is calculated after all operat ing expenses, provision and payment of both income and realised capital gains tax and the reinvestment of dividends, and do not incorporate franking.
Index returns however are ent irely before any operat ing expenses or taxat ion. LIC returns will consequent ly be understated relat ive to the Index return.
AMCIL’s concentrated portfolio covers both large and small companies . The number of
companies in the portfolio will usually comprise 30 to 40 stocks depending on market
conditions and thematic investment opportunities. The selection of stocks in the portfolio is
based on attractive valuations as well as the outlook for growth and the competitive structure of
the industry.
Premium/(Discount) share price to:
Investment Personnel: Mark Freeman (Chief Executive Officer). Directors: Bruce Teele
(Chairman), Ross Barker, Michael Hirst, Siobhan McKenna, Rupert Myer, Roger Brown & Jon
Webster.
Information
$0.70
$0.80
$0.90
$1.00
$1.10
Sep-18 Dec-18 Mar-19 Jun-19 Sep-19
All Ords Rebased AMH
Industrials
Financials
Health Care Materials
IT
Other
-40%
-20%
0%
20%
40%
$0.00
$0.30
$0.60
$0.90
$1.20
2004 2005 2006 2007 2008 2009 2010 2011 2012 2013 2014 2015 2016 2017 2018 2019
Prem/Disc (RHS) Pre-Tax NTA (LHS) Share Price (LHS)

LISTED INVESTMENT COMPANIES & TRUSTS. 38
CLIME CAPITAL (CAM)Domestic Focused Share Price and NTA Summary
Mandate: Australian listed equities Benchmark: All Ordinaries Accumulation as at 30-Sep-19
Manager: Clime Asset Management Management Fee: 1.0% p.a. Share price $0.94
Listed: Apr-04 Performance Fee: 20% Outperf. Of Benchmark Pre-tax NTA $0.99
Post-tax NTA $0.96
Investment Strategy
Pre-tax NTA -5.1%
Post-tax NTA -2.1%
Historic Dividend (prior 12-mths)¹
Personnel Dividends (net) $0.0500
Yield 5.3%
Franking 100%
Grossed up yield 7.6%
Key Information ¹Not including special dividends/distribut ions
Exposure: International/Domestic, Equities/Fixed Income/Derivatives, Cash Capital Structure
Style: Large/Medium/Small Cap, Balanced/Value/Growth, Passive/Active, Long/Short Ordinary shares 114.0m
Derivatives: Ability to use derivatives to manage excessive risk concentrations. Options/other 22.3m
Cash (Fixed Income)/Debt: Cash $6.24m (30 Sep 2019), Conv. Notes $28.28m (30 Sep 2019) Fully diluted 136.3m
Dividend reinvestment plan: Yes, at 1% discount to 4-day VWAP from (and incl.) record date. Market capitalisation 107.2m
Other: n/a
Performance 3-mth 6-mth 1 year 3 yr p.a. 5 yr p.a. 10 yr p.a. CAM Share Price v ASX All Ords
Share price*
Performance -1.8% 10.4% 5.2% 12.3% 5.8% 7.8%
Index 2.8% 10.9% 12.1% 11.7% 9.7% 8.2%
Active return -4.6% -0.5% -6.9% 0.6% -3.9% -0.4%
NTA+
Performance 3.4% 10.4% 6.7% 9.1% 4.8% 4.3%
Benchmark 2.8% 10.9% 12.1% 11.7% 9.7% 8.2%
Active return 0.6% -0.5% -5.4% -2.6% -4.9% -3.9%
Share Price and NTA Top Holdings %
as at 30-Sep-19
Amcor Limited 5.0
BHP Billiton Limited 5.0
Westpac Banking Corp 5.0
National Australia Bank 4.8
ANZ Banking Group 3.8
AUD Cash 4.4
% of Gross Assets 28.1
Risk/Return Indicators Asset Exposure (Portfolio)
Sharpe Standard
Share price* Ratio Ratio Deviation
Year 1 -0.58 0.28 12.5%
Year 3 0.05 0.94 10.6%
Year 5 -0.38 0.33 10.2%
NTA+
Year 1 -0.66 0.32 15.4%
Year 3 -0.42 0.62 10.8%
Year 5 -0.78 0.23 10.6%
*+ M easurement of a LIC’s performance is calculated after all operat ing expenses, provision and payment of both income and realised capital gains tax and the reinvestment of dividends, and do not incorporate franking.
Index returns however are ent irely before any operat ing expenses or taxat ion. LIC returns will consequent ly be understated relat ive to the Index return.
CAM applies a four tier strategy: Acquire securities in attractive companies when the market
price on offer trades at a discount to their assessed value; reduce or close positions when the
market price is well above the assessment of value; ensure each investment meets a realistic
required return to ensure the risk and return of the portfolio is properly balanced to achieve
returns without risking capital; seek investments with an enhanced yield; and maintain a high
cash position when prices are expensive and value is not readily available in the market.
Premium/(Discount) share price to:
Information
Investment Personnel: John Abernethy (Chief Investment Officer). Directors: John Abernethy
(Chairman), Anthony Golowenko, Julian Gosse and Brett Spork
*+ The investment performance calculat ion has been impacted by the init ial uplif t associated with the 1 for 4 Renounceable Rights issue (CAM PA) issued in April 2007. However, this is of fset by the ongoing cost of the
issue which has an effect ive 7.5% fully f ranked coupon. CAM PA converts into ordinary equity in April 2017. The share price benchmark has been compared against the S&P/ASX All Ordinaries Accumulat ion Index. + The
NTA has been compared against the S&P/ASX All Ordinaries Accumulat ion Index.
$0.70
$0.80
$0.90
$1.00
$1.10
Sep-18 Dec-18 Mar-19 Jun-19 Sep-19
All Ords Rebased CAM
Aus Equity - Large Cap
Aus Equity -Mid Cap
Aus Equity -Small Cap
Aus Income Sleev e
AUD Cash & Equiv .
-40%
-20%
0%
20%
40%
$0.40
$0.65
$0.90
$1.15
$1.40
2004 2005 2006 2007 2008 2009 2010 2011 2012 2013 2014 2015 2016 2017 2018 2019
Prem/Disc (RHS) Pre-Tax NTA (LHS) Share Price (LHS)

LISTED INVESTMENT COMPANIES & TRUSTS. 39
CONCENTRATED LEADERS FUND LIMITED (CLF)Domestic Focused Share Price and NTA Summary
Mandate: Australian listed equities Benchmark: S&P/ASX 200 Accumulation as at 30-Sep-19
Manager: Internal (since Jan 18) Management Expense Ratio: n/a Share price $1.26
Listed: 1987 Performance Fee: 20% Outper. of Benchmark Pre-tax NTA $1.33
Post-tax NTA $1.29
Investment Strategy
Pre-tax NTA -5.3%
Post-tax NTA -2.3%
Historic Dividend (prior 12-mths)¹
Personnel Dividends (net) $0.0525
Yield 4.2%
Franking 100%
Grossed up yield 6.0%
Key Information ¹Not including special dividends/distribut ions
Exposure: International/Domestic, Equities/Fixed Income/Derivatives, Cash Capital Structure
Style: Large/Medium/Small Cap, Balanced/Value/Growth, Passive/Active, Long/Short Ordinary shares 59.4m
Derivatives: No Options/other 0.0m
Cash/Debt: $30.0m Loan Facility, with a current cash holding of $31.4m (30 Sep 2019) Fully diluted 59.4m
Dividend reinvestment plan: Yes Market capitalisation 74.8m
Other: Management was internalised on 1 Jan 18. Performance from this date is shown.
Performance 3-mth 6-mth 1 year 3 yr p.a. 5 yr p.a. 10 yr p.a. CLF Share Price v ASX All Ords
Share price*
Performance 0.4% 3.9% 5.7% n/a n/a n/a
Index 2.4% 10.5% 12.5% 11.9% 9.5% 8.1%
Active return -2.0% -6.6% -6.8% n/a n/a n/a
NTA+
Performance -0.4% 3.8% 5.1% n/a n/a n/a
Benchmark 2.4% 10.5% 12.5% 11.9% 9.5% 8.1%
Active return -2.8% -6.7% -7.4% n/a n/a n/a
Share Price and NTA Top 10 Holdings %
as at 30-Sep-19
Amcor Limited
APA Group
BHP Billiton Limited
Commonwealth Bank of Australia
CSL Limited
Macquarie Group Ltd
National Aust. Bank
NextDC Limited
Seven Group Holdings
Risk/Return Indicators Sector Exposure (Portfolio) Transurban Group
Sharpe Standard % of Total 39.5
Share price* Ratio Ratio Deviation
Year 1 -1.07 0.32 12.1%
Year 3 n/a n/a n/a
Year 5 n/a n/a n/a
NTA+
Year 1 -0.83 0.21 16.0%
Year 3 n/a n/a n/a
Year 5 n/a n/a n/a
* The share price benchmark has been compared against the S&P/ASX 200 Accumulat ion. + The NTA has been compared against the S&P/ASX
200 Accumulat ion.
*+ M easurement of a LIC’s performance is calculated after all operat ing expenses, provision and payment of both income and realised capital gains tax and the reinvestment of dividends, and do not incorporate franking.
Index returns however are ent irely before any operat ing expenses or taxat ion. LIC returns will consequent ly be understated relat ive to the Index return.
CLF (formerly Aberdeen Leaders Limited) is a geared listed investment company that uniquely
combines a macro thematic and bottom-up fundamental approach to manage its investment
portfolio with the aim of delivering investors a consistent quarterly dividend as well as a capital
gain over the investment cycle. The Company’s investment mandate is to invest in Australian
shares primarily within the S&P/ASX 200 Accumulation Index, to generate capital gains as well
as regular income for shareholders.
Premium/(Discount) share price to:
Directors: Brian Sherman (Chairman), Barry Sechos, John Martin & David Sokulsky.
Investment Personnel: David Sokulsky (CEO/CIO), Trevor Huynh & Gino Boscutti.
Information
$1.00
$1.15
$1.30
$1.45
$1.60
Sep-18 Dec-18 Mar-19 Jun-19 Sep-19
All Ords Rebased CLF
-20%
-10%
0%
10%
20%
$0.00
$0.50
$1.00
$1.50
$2.00
Dec 17 Mar 18 Jun 18 Sep 18 Dec 18 Mar 19 Jun 19 Sep 19
Prem/Disc (RHS) Pre-Tax NTA (LHS) Share Price (LHS)
FinancialsIndustrials
Materials
Consumer Discretionary
Health Care
Real Estate
Other
Cash

LISTED INVESTMENT COMPANIES & TRUSTS. 40
FLAGSHIP INVESTMENTS (FSI)Domestic Focused Share Price and NTA Summary
Mandate: Australian listed equities Benchmark: All Ordinaries Accumulation as at 30-Sep-19
Manager: EC Pohl & Co Pty Ltd Management Fee: Nil Share price $1.82
Listed: 2000 Performance Fee: 15% Outperf. BAUBIL Index Pre-tax NTA $2.18
Post-tax NTA $2.04
Investment Strategy
Pre-tax NTA -16.4%
Post-tax NTA -11.0%
Historic Dividend (prior 12-mths)¹
Personnel Dividends (net) $0.0825
Yield 4.5%
Franking 100%
Grossed up yield 6.5%
Key Information ¹Not including special dividends/distribut ions
Exposure: International/Domestic, Equities/Fixed Income/Derivatives, Cash Capital Structure
Style: Large/Medium/Small Cap, Balanced/Value/Growth, Passive/Active, Long/Short Ordinary shares 25.5m
Derivatives: n/a Options/other 0.0m
Cash/Debt: $1.1m Cash (30 Sep 2019) Fully diluted 25.5m
Dividend reinvestment plan: Yes Market capitalisation 46.4m
Other: n/a
Performance 3-mth 6-mth 1 year 3 yr p.a. 5 yr p.a. 10 yr p.a. FSI Share Price v ASX All Ords
Share price*
Performance 6.4% 12.5% 5.5% 10.1% 8.4% 8.1%
Index 2.8% 10.9% 12.1% 11.7% 9.7% 8.2%
Active return 3.6% 1.6% -6.6% -1.6% -1.3% -0.1%
NTA+
Performance 5.3% 9.8% 11.1% 10.3% 9.5% 8.4%
Benchmark 2.8% 10.9% 12.1% 11.7% 9.7% 8.2%
Active return 2.5% -1.1% -1.0% -1.4% -0.2% 0.2%
Share Price and NTA Top 20 Holdings %
as at 30-Sep-19
Westpac Banking Corp 6.9
Macquarie Group 6.6
Rio Tinto Limited 5.9
HUB24 Ltd 5.3
Commonwealth Bank 4.9
ResMed Inc 4.8
CSL Limited 4.8
REA Group 4.7
SEEK Limited 4.7
Risk/Return Indicators Sector Exposure (Portfolio) Carsales.com 4.5
Sharpe Standard % of Total 53.1
Share price* Ratio Ratio Deviation
Year 1 -0.50 0.26 14.0%
Year 3 -0.14 0.66 11.8%
Year 5 -0.11 0.48 12.5%
NTA+
Year 1 -0.11 0.56 16.6%
Year 3 -0.16 0.60 13.3%
Year 5 -0.03 0.54 13.0%
* The share price benchmark has been compared against the S&P/ASX All Ordinaries Accumulat ion Index. + The NTA has been compared against
the S&P/ASX All Ordinaries Accumulat ion Index.
*+ M easurement of a LIC’s performance is calculated after all operat ing expenses, provision and payment of both income and realised capital gains tax and the reinvestment of dividends, and do not incorporate franking.
Index returns however are ent irely before any operat ing expenses or taxat ion. LIC returns will consequent ly be understated relat ive to the Index return.
FSI provides investors with access to a diversified Australian investment portfolio. It aims to
maintain 90% of available funds in equity investments with the balance in cash and equivalent.
FSI is best suited to investors with a medium to long-term time horizon. FSI’s central
investment strategy is to invest in high quality business franchises that have the ability to grow
sales and earnings at rates above GDP, producing superior long term investment returns. The
active investment strategy comprises a broad spectrum of well managed companies.
Premium/(Discount) share price to:
Investment Personnel: Emmanuel Pohl (Managing Director). Directors: Emmanuel Pohl,
Dominic McGann (Chairman) and Sophie Mitchell
Information
$1.40
$1.60
$1.80
$2.00
$2.20
Sep-18 Dec-18 Mar-19 Jun-19 Sep-19
All Ords Rebased FSI
Financials
Health Care
IT
Consumer Disc.
Telecomm. Serv ices
Other
Cash
-40%
-20%
0%
20%
40%
$0.00
$0.75
$1.50
$2.25
$3.00
2004 2005 2006 2007 2008 2009 2010 2011 2012 2013 2014 2015 2016 2017 2018 2019
Prem/Disc (RHS) Pre-Tax NTA (LHS) Share Price (LHS)
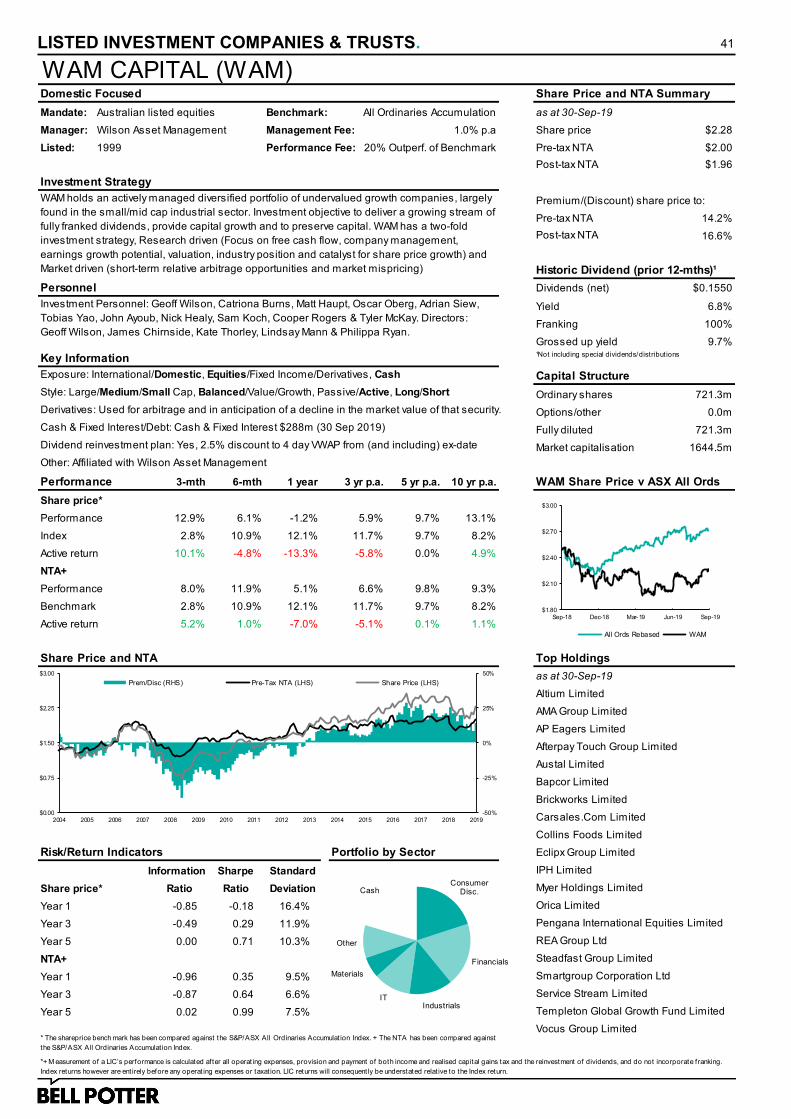
LISTED INVESTMENT COMPANIES & TRUSTS. 41
WAM CAPITAL (WAM)Domestic Focused Share Price and NTA Summary
Mandate: Australian listed equities Benchmark: All Ordinaries Accumulation as at 30-Sep-19
Manager: Wilson Asset Management Management Fee: 1.0% p.a Share price $2.28
Listed: 1999 Performance Fee: 20% Outperf. of Benchmark Pre-tax NTA $2.00
Post-tax NTA $1.96
Investment Strategy
Pre-tax NTA 14.2%
Post-tax NTA 16.6%
Historic Dividend (prior 12-mths)¹
Personnel Dividends (net) $0.1550
Yield 6.8%
Franking 100%
Grossed up yield 9.7%
Key Information ¹Not including special dividends/distribut ions
Exposure: International/Domestic, Equities/Fixed Income/Derivatives, Cash Capital Structure
Style: Large/Medium/Small Cap, Balanced/Value/Growth, Passive/Active, Long/Short Ordinary shares 721.3m
Derivatives: Used for arbitrage and in anticipation of a decline in the market value of that security. Options/other 0.0m
Cash & Fixed Interest/Debt: Cash & Fixed Interest $288m (30 Sep 2019) Fully diluted 721.3m
Dividend reinvestment plan: Yes, 2.5% discount to 4 day VWAP from (and including) ex-date Market capitalisation 1644.5m
Other: Affiliated with Wilson Asset Management
Performance 3-mth 6-mth 1 year 3 yr p.a. 5 yr p.a. 10 yr p.a. WAM Share Price v ASX All Ords
Share price*
Performance 12.9% 6.1% -1.2% 5.9% 9.7% 13.1%
Index 2.8% 10.9% 12.1% 11.7% 9.7% 8.2%
Active return 10.1% -4.8% -13.3% -5.8% 0.0% 4.9%
NTA+
Performance 8.0% 11.9% 5.1% 6.6% 9.8% 9.3%
Benchmark 2.8% 10.9% 12.1% 11.7% 9.7% 8.2%
Active return 5.2% 1.0% -7.0% -5.1% 0.1% 1.1%
Share Price and NTA Top Holdings
as at 30-Sep-19
Altium Limited
AMA Group Limited
AP Eagers Limited
Afterpay Touch Group Limited
Austal Limited
Bapcor Limited
Brickworks Limited
Carsales.Com Limited
Collins Foods Limited
Risk/Return Indicators Portfolio by Sector Eclipx Group Limited
Sharpe Standard IPH Limited
Share price* Ratio Ratio Deviation Myer Holdings Limited
Year 1 -0.85 -0.18 16.4% Orica Limited
Year 3 -0.49 0.29 11.9% Pengana International Equities Limited
Year 5 0.00 0.71 10.3% REA Group Ltd
NTA+ Steadfast Group Limited
Year 1 -0.96 0.35 9.5% Smartgroup Corporation Ltd
Year 3 -0.87 0.64 6.6% Service Stream Limited
Year 5 0.02 0.99 7.5% Templeton Global Growth Fund Limited
Vocus Group Limited* The shareprice bench mark has been compared against the S&P/ASX All Ordinaries Accumulat ion Index. + The NTA has been compared against
the S&P/ASX All Ordinaries Accumulat ion Index.
*+ M easurement of a LIC’s performance is calculated after all operat ing expenses, provision and payment of both income and realised capital gains tax and the reinvestment of dividends, and do not incorporate franking.
Index returns however are ent irely before any operat ing expenses or taxat ion. LIC returns will consequent ly be understated relat ive to the Index return.
WAM holds an actively managed diversified portfolio of undervalued growth companies, largely
found in the small/mid cap industrial sector. Investment objective to deliver a growing stream of
fully franked dividends, provide capital growth and to preserve capital. WAM has a two-fold
investment strategy, Research driven (Focus on free cash flow, company management,
earnings growth potential, valuation, industry position and catalyst for share price growth) and
Market driven (short-term relative arbitrage opportunities and market mispricing)
Premium/(Discount) share price to:
Investment Personnel: Geoff Wilson, Catriona Burns, Matt Haupt, Oscar Oberg, Adrian Siew,
Tobias Yao, John Ayoub, Nick Healy, Sam Koch, Cooper Rogers & Tyler McKay. Directors:
Geoff Wilson, James Chirnside, Kate Thorley, Lindsay Mann & Philippa Ryan.
Information
$1.80
$2.10
$2.40
$2.70
$3.00
Sep-18 Dec-18 Mar-19 Jun-19 Sep-19
All Ords Rebased WAM
Consumer Disc.
Financials
IndustrialsIT
Materials
Other
Cash
-50%
-25%
0%
25%
50%
$0.00
$0.75
$1.50
$2.25
$3.00
2004 2005 2006 2007 2008 2009 2010 2011 2012 2013 2014 2015 2016 2017 2018 2019
Prem/Disc (RHS) Pre-Tax NTA (LHS) Share Price (LHS)
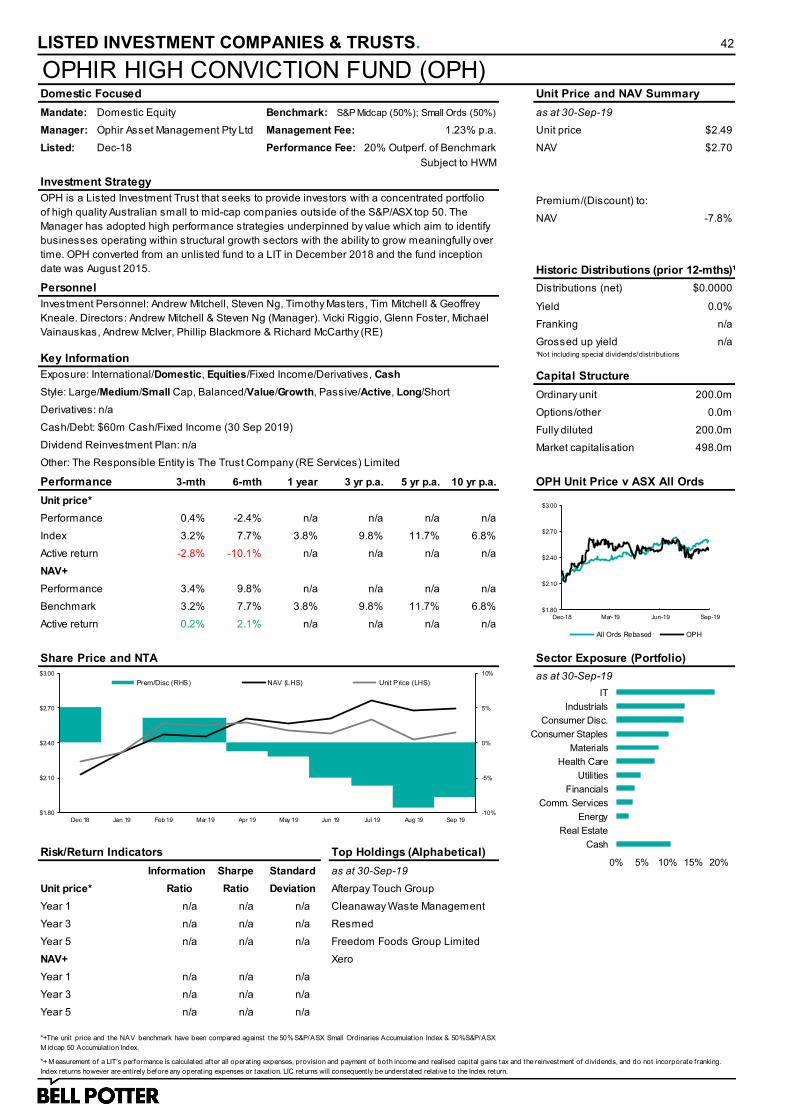
LISTED INVESTMENT COMPANIES & TRUSTS. 42
OPHIR HIGH CONVICTION FUND (OPH)Domestic Focused Unit Price and NAV Summary
Mandate: Domestic Equity Benchmark: S&P Midcap (50%); Small Ords (50%) as at 30-Sep-19
Manager: Ophir Asset Management Pty Ltd Management Fee: 1.23% p.a. Unit price $2.49
Listed: Dec-18 Performance Fee: 20% Outperf. of Benchmark NAV $2.70
Subject to HWM
Investment Strategy
NAV -7.8%
Historic Distributions (prior 12-mths)¹
Personnel Distributions (net) $0.0000
Yield 0.0%
Franking n/a
Grossed up yield n/a
Key Information ¹Not including special dividends/distribut ions
Exposure: International/Domestic, Equities/Fixed Income/Derivatives, Cash Capital Structure
Style: Large/Medium/Small Cap, Balanced/Value/Growth, Passive/Active, Long/Short Ordinary unit 200.0m
Derivatives: n/a Options/other 0.0m
Cash/Debt: $60m Cash/Fixed Income (30 Sep 2019) Fully diluted 200.0m
Dividend Reinvestment Plan: n/a Market capitalisation 498.0m
Other: The Responsible Entity is The Trust Company (RE Services) Limited
Performance 3-mth 6-mth 1 year 3 yr p.a. 5 yr p.a. 10 yr p.a. OPH Unit Price v ASX All Ords
Unit price*
Performance 0.4% -2.4% n/a n/a n/a n/a
Index 3.2% 7.7% 3.8% 9.8% 11.7% 6.8%
Active return -2.8% -10.1% n/a n/a n/a n/a
NAV+
Performance 3.4% 9.8% n/a n/a n/a n/a
Benchmark 3.2% 7.7% 3.8% 9.8% 11.7% 6.8%
Active return 0.2% 2.1% n/a n/a n/a n/a
Share Price and NTA Sector Exposure (Portfolio)
as at 30-Sep-19
Risk/Return Indicators Top Holdings (Alphabetical)
Sharpe Standard
Unit price* Ratio Ratio Deviation Afterpay Touch Group
Year 1 n/a n/a n/a Cleanaway Waste Management
Year 3 n/a n/a n/a Resmed
Year 5 n/a n/a n/a Freedom Foods Group Limited
NAV+ Xero
Year 1 n/a n/a n/a
Year 3 n/a n/a n/a
Year 5 n/a n/a n/a
*+The unit price and the NAV benchmark have been compared against the 50%S&P/ASX Small Ordinaries Accumulat ion Index & 50%S&P/ASX
M idcap 50 Accumulat ion Index.
*+ M easurement of a LIT’s performance is calculated after all operat ing expenses, provision and payment of both income and realised capital gains tax and the reinvestment of dividends, and do not incorporate franking.
Index returns however are ent irely before any operat ing expenses or taxat ion. LIC returns will consequent ly be understated relat ive to the Index return.
OPH is a Listed Investment Trust that seeks to provide investors with a concentrated portfolio
of high quality Australian small to mid-cap companies outside of the S&P/ASX top 50. The
Manager has adopted high performance strategies underpinned by value which aim to identify
businesses operating within structural growth sectors with the ability to grow meaningfully over
time. OPH converted from an unlisted fund to a LIT in December 2018 and the fund inception
date was August 2015.
Premium/(Discount) to:
Investment Personnel: Andrew Mitchell, Steven Ng, Timothy Masters, Tim Mitchell & Geoffrey
Kneale. Directors: Andrew Mitchell & Steven Ng (Manager). Vicki Riggio, Glenn Foster, Michael
Vainauskas, Andrew McIver, Phillip Blackmore & Richard McCarthy (RE)
Information as at 30-Sep-19
$1.80
$2.10
$2.40
$2.70
$3.00
Dec-18 Mar-19 Jun-19 Sep-19
All Ords Rebased OPH
-10%
-5%
0%
5%
10%
$1.80
$2.10
$2.40
$2.70
$3.00
Dec 18 Jan 19 Feb 19 Mar 19 Apr 19 May 19 Jun 19 Jul 19 Aug 19 Sep 19
Prem/Disc (RHS) NAV (LHS) Unit Price (LHS)
0% 5% 10% 15% 20%
Cash
Real Estate
Energy
Comm. Services
Financials
Utilities
Health Care
Materials
Consumer Staples
Consumer Disc.
Industrials
IT

LISTED INVESTMENT COMPANIES & TRUSTS. 43
MIRRABOOKA INVESTMENTS (MIR)Domestic Focused Share Price and NTA Summary
Mandate: Australian listed equities Benchmark: S&P Midcap (50%); Small Ords (50%) as at 30-Sep-19
Manager: Internal Management Fee: 0.61% p.a. Share price $2.50
Listed: 2001 Performance Fee: None Pre-tax NTA $2.43
Post-tax NTA $2.18
Investment Strategy
Pre-tax NTA 2.9%
Post-tax NTA 14.7%
Historic Dividend (prior 12-mths)¹
Personnel Dividends (net) $0.1000
Yield 4.0%
Franking 100%
Grossed up yield 5.7%
Key Information ¹Not including special dividends/distribut ions
Exposure: International/Domestic, Equities/Fixed Income/Derivatives, Cash Capital Structure
Style: Large/Medium/Small Cap, Balanced/Value/Growth, Passive/Active, Long/Short Ordinary shares 160.5m
Derivatives: Options occasionally used to generate additional income. Options/other 0.0m
Cash/Debt: $17.3m Cash (30 Sep 2019) Fully diluted 160.5m
Dividend reinvestment plan: Yes Market capitalisation 401.2m
Other: Affiliated with AMCIL (AMH), AFIC (AFI) and Djerriwarrh (DJW).
Performance 3-mth 6-mth 1 year 3 yr p.a. 5 yr p.a. 10 yr p.a. MIR Share Price v ASX All Ords
Share price*
Performance 5.5% 5.1% 1.5% 0.2% 5.6% 9.3%
Index 3.2% 7.8% 3.6% 9.9% 12.0% 6.9%
Active return 2.3% -2.7% -2.1% -9.7% -6.4% 2.4%
NTA+
Performance 4.0% 9.0% 3.6% 6.8% 9.0% 9.8%
Benchmark 3.2% 7.8% 3.6% 9.9% 12.0% 6.9%
Active return 0.8% 1.2% 0.0% -3.1% -3.0% 2.9%
Share Price and NTA Top 20 Holdings %
as at 30-Sep-19
Mainfreight 4.8
Qube Holdings 3.7
James Hardie Industries 3.6
Seek 3.2
EQT Holdings 2.9
ARB Corporation 2.8
Reece 2.8
Reliance Worldwide Corp. 2.7
Wellcom Group 2.6
Risk/Return Indicators Sector Exposure (Top 20) IRESS 2.6
Sharpe Standard Objective Corporation 2.5
Share price* Ratio Ratio Deviation Macquarie Telecom Group 2.5
Year 1 -0.16 -0.02 13.4% Carsales.com 2.5
Year 3 -0.72 -0.17 12.4% Alumina 2.4
Year 5 -0.47 0.26 12.2% Breville Group 2.4
NTA+ AP Eagers 1.9
Year 1 0.00 0.14 13.2% AUB Group 1.9
Year 3 -0.77 0.47 9.3% ALS 1.9
Year 5 -0.60 0.66 10.0% Cooper Energy 1.8
Invocare 1.8
% of Total 53.3* The share price benchmark has been compared against the S&P/M id-cap (50%) and S&P/Small-cap (50%). + The NTA has been compared against
the S&P/M id-cap (50%) and S&P/Small-cap (50%).
*+ M easurement of a LIC’s performance is calculated after all operat ing expenses, provision and payment of both income and realised capital gains tax and the reinvestment of dividends, and do not incorporate franking.
Index returns however are ent irely before any operat ing expenses or taxat ion. LIC returns will consequent ly be understated relat ive to the Index return.
MIR objectives are to provide attractive investment returns over the medium to long term
through holding core investments in selected small and medium sized companies and to
provide attractive dividend returns. MIR focuses on attractive valuations, prospects for strong
growth and the potential to benefit from takeover activity.
Premium/(Discount) share price to:
Investment Personnel: Mark Freeman (Chief Executive Officer). Directors: Terrence Campbell
(Chairman), Ian Campbell, David Meiklejohn, Ross Barker, Dr Jackie Fairley.
Information
$2.20
$2.40
$2.60
$2.80
$3.00
Sep-18 Dec-18 Mar-19 Jun-19 Sep-19
All Ords Rebased MIR
Industrials
Consumer Discretionary
IT
Materials
Financials
Other
-50%
-25%
0%
25%
50%
$0.00
$0.90
$1.80
$2.70
$3.60
2004 2005 2006 2007 2008 2009 2010 2011 2012 2013 2014 2015 2016 2017 2018 2019
Prem/Disc (RHS) Pre-Tax NTA (LHS) Share Price (LHS)

LISTED INVESTMENT COMPANIES & TRUSTS. 44
QV EQUITIES LIMITED (QVE)Domestic Focused Share Price and NTA Summary
Mandate: Australian Listed Equities Benchmark: S&P/ASX 300 Ex-20 Accumulation as at 30-Sep-19
Manager: Investors Mutual Management Fee: 0.9% p.a. (on NAV <$150m) Share price $1.03
Listed: Aug-14 0.75% p.a. (on NAV $150m>) Pre-tax NTA $1.13
Post-tax NTA $1.11
Investment Strategy
Pre-tax NTA -9.3%
Post-tax NTA -7.7%
Historic Dividend (prior 12-mths)¹
Personnel Dividends (net) $0.0440
Yield 4.3%
Franking 100%
Grossed up yield 6.1%
Key Information ¹Not including special dividends/distribut ions
Exposure: International/Domestic, Equities/Fixed Income/Derivatives, Cash Capital Structure
Style: Large/Medium/Small Cap, Balanced/Value/Growth, Passive/Active, Long/Short Ordinary shares 275.1m
Derivatives: Used for arbitrage or to replicate underlying positions Options/other 0.0m
Cash/Debt: $56m cash (30 Jun 2019) Fully diluted 275.1m
Dividend Reinvestment Plan: Yes Market capitalisation 282.0m
Other: n/a
Performance 3-mth 6-mth 1 year 3 yr p.a. 5 yr p.a. 10 yr p.a. QVE Share Price v ASX All Ords
Share price*
Performance 1.8% 0.8% -5.8% -1.8% 4.8% n/a
Index 2.6% 10.8% 12.6% 11.9% 9.5% 8.0%
Active return -0.8% -10.0% -18.4% -13.7% -4.7% n/a
NTA+
Performance 0.2% 2.0% -1.0% 2.9% 6.3% n/a
Benchmark 4.6% 11.5% 11.0% n/a n/a n/a
Active return -4.4% -9.5% -12.0% n/a n/a n/a
Share Price and NTA Top 10 Holdings %
as at 30-Sep-19
Amcor 4.6
Aurizon 4.5
Crown Resorts 4.4
Sonic Healthcare 4.0
Caltex 3.8
Steadfast 3.5
Tabcorp 3.4
GWA 3.0
Bank of Queensland 3.0
Risk/Return Indicators Sector Exposure (Portfolio) Orica 2.9
Sharpe Standard % of Total 37.1
Share price* Ratio Ratio Deviation
Year 1 -1.82 -0.69 11.1%
Year 3 -1.23 -0.39 10.8%
Year 5 -0.40 0.23 10.4%
NTA+
Year 1 -2.45 -0.34 8.3%
Year 3 -1.86 0.07 7.0%
Year 5 -0.51 0.53 7.3%
* The share price benchmark has been compared against the S&P/ASX 300 Accumulat ion Index. + The NTA has been compared against the
S&P/ASX 300 Ex-20 Accumulat ion Index. Benchmark f igures provided by company reports
*+ M easurement of a LIC’s performance is calculated after all operat ing expenses, provision and payment of both income and realised capital gains tax and the reinvestment of dividends, and do not incorporate franking.
Index returns however are ent irely before any operat ing expenses or taxat ion. LIC returns will consequent ly be understated relat ive to the Index return.
QVE’s primary objective is to achieve long term value through a combination of capital growth
and income. This will be established by holding a diversified portfolio outside the S&P/ASX 20
Index. QVE will hold 20-50 stock mainly from the S&P/ASX 300 –ex Top 20. The Company
seeks to invest in quality companies that display four key characteristics; an established
competitive advantage, recurring and predictable earnings, strong management, and ability to
grow over time. QVE characterises itself as value-driven investor, with a bottom-up approach.
Premium/(Discount) share price to:
Investment Personnel: Anton Tagliaferro, Simon Conn. Directors: Peter McKillop (Chairman),
John McBain, Jennifer Horrigan, Anton Tagliaferro, Simon Conn.
Information
$0.90
$1.00
$1.10
$1.20
$1.30
Sep-18 Dec-18 Mar-19 Jun-19 Sep-19
All Ords Rebased QVE
Materials
Consumer Disc
Industrials
Health Care
FinancialsEnergy
Utilities
Comm. Serv ices
Real Estate
IT
Cash
-30%
-15%
0%
15%
30%
$0.50
$0.75
$1.00
$1.25
$1.50
2014 2015 2016 2017 2018 2019
Prem/Disc (RHS) Pre-Tax NTA (LHS) Share Price (LHS)

LISTED INVESTMENT COMPANIES & TRUSTS. 45
WAM RESEARCH (WAX)Domestic Focused Share Price and NTA Summary
Mandate: Australian listed equities Benchmark: All Ordinaries Accumulation as at 30-Sep-19
Manager: Wilson Asset Management Management Fee: 1.0% p.a. Share price $1.49
Listed: 2003 Performance Fee: 20% Outperf. of Benchmark Pre-tax NTA $1.27
Post-tax NTA $1.22
Investment Strategy
Pre-tax NTA 17.8%
Post-tax NTA 21.8%
Historic Dividend (prior 12-mths)¹
Personnel Dividends (net) $0.0970
Yield 6.5%
Franking 100%
Grossed up yield 9.3%
Key Information ¹Not including special dividends/distribut ions
Exposure: International/Domestic, Equities/Fixed Income/Derivatives, Cash Capital Structure
Style: Large/Medium/Small Cap, Balanced/Value/Growth, Passive/Active, Long/Short Ordinary shares 192.1m
Derivatives: Used for arbitrage and in anticipation of a decline in the market value of that security. Options/other 0.0m
Cash & Fixed Interest/Debt: Cash & Fixed Interest $54.8m (30 Sep 2019) Fully diluted 192.1m
Dividend reinvestment plan: Yes, 2.5% discount to 4 day VWAP from (and including) ex-date Market capitalisation 286.3m
Other: Affiliated with Wilson Asset Management
Performance 3-mth 6-mth 1 year 3 yr p.a. 5 yr p.a. 10 yr p.a. WAX Share Price v ASX All Ords
Share price*
Performance 12.5% 8.1% -5.9% 4.3% 11.7% 14.6%
Index 2.8% 10.9% 12.1% 11.7% 9.7% 8.2%
Active return 9.7% -2.8% -18.0% -7.4% 2.0% 6.4%
NTA+
Performance 6.4% 12.3% 3.4% 6.3% 10.3% 10.2%
Benchmark 2.8% 10.9% 12.1% 11.7% 9.7% 8.2%
Active return 3.6% 1.4% -8.7% -5.4% 0.6% 2.0%
Share Price and NTA Top Holdings
as at 30-Sep-19
Australian Finance Group Ltd
AMA Group Limited
AP Eagers Limited
Austal Limited
Bapcor Limited
Brickworks Limited
City Chic Collective Limited
Codan Limited
Cleanaway Waste Management Limited
Risk/Return Indicators Portfolio Composition FlexiGroup Limited
Sharpe Standard Harvey Norman Holdings Limited
Share price* Ratio Ratio Deviation Infomedia Ltd
Year 1 -1.08 -0.42 18.2% Imdex Limited
Year 3 -0.54 0.13 14.5% Johns Lyng Group Limited
Year 5 0.14 0.73 12.8% Myer Holdings Limited
NTA+ Psc Insurance Group Limited
Year 1 -1.21 0.12 13.2% Smartgroup Corporation Ltd
Year 3 -0.86 0.45 8.6% Service Stream Limited
Year 5 0.07 0.99 7.9% Vocus Group Limited
Xero Limited* The shareprice bench mark has been compared against the S&P/ASX All Ordinaries Accumulat ion Index. + The NTA has been compared against
the S&P/ASX All Ordinaries Accumulat ion Index.
*+ M easurement of a LIC’s performance is calculated after all operat ing expenses, provision and payment of both income and realised capital gains tax and the reinvestment of dividends, and do not incorporate franking.
Index returns however are ent irely before any operat ing expenses or taxat ion. LIC returns will consequent ly be understated relat ive to the Index return.
WAX is an LIC primarily investing in small to medium industrial companies listed on the ASX.
The investment objectives are to provide a growing stream of fully franked dividends and to
achieve a high real rate of return, comprising both income and capital growth within risk
parameters acceptable to the Directors. WAX has a research driven investment strategy,
focussed on identifying free cash flow, then rating the company’s management, earnings
growth potential, valuation, industry position and catalyst for share price growth.
Premium/(Discount) share price to:
Investment Personnel: Geoff Wilson, Catriona Burns, Matt Haupt, Oscar Oberg, Adrian Siew,
Tobias Yao, John Ayoub, Nick Healy, Sam Koch, Cooper Rogers & Tyler McKay.
Directors: Geoff Wilson, John Abernethy, Julian Gosse & Kate Thorley.
Information
$1.20
$1.40
$1.60
$1.80
$2.00
Sep-18 Dec-18 Mar-19 Jun-19 Sep-19
All Ords Rebased WAX
Consumer Disc.
Industrials
ITFinancials
Materials
Other
Cash
-50%
-25%
0%
25%
50%
$0.00
$0.50
$1.00
$1.50
$2.00
2004 2005 2006 2007 2008 2009 2010 2011 2012 2013 2014 2015 2016 2017 2018 2019
Prem/Disc (RHS) Pre-Tax NTA (LHS) Share Price (LHS)

LISTED INVESTMENT COMPANIES & TRUSTS. 46
CADENCE CAPITAL (CDM)Domestic/International Focused Share Price and NTA Summary
Mandate: Long/Short Dom/Intl Listed Equity Benchmark: All Ordinaries Accumulation as at 30-Sep-19
Manager: Cadence Asset Management Management Fee: 1% p.a. Share price $0.81
Listed: Dec-06 Performance Fee: 20% Outperf. of Benchmark Pre-tax NTA $0.90
Post-tax NTA $1.05
Investment Strategy
Pre-tax NTA -9.5%
Post-tax NTA -22.7%
Historic Dividend (prior 12-mths)¹
Personnel Dividends (net) $0.0500
Yield 6.2%
Franking 100%
Grossed up yield 8.8%
Key Information ¹Not including special dividends/distribut ions
Exposure: International/Domestic, Equities/Fixed Income/Derivatives, Cash Capital Structure
Style: Large/Medium/Small Cap, Balanced/Value/Growth, Passive/Active, Long/Short Ordinary shares 315.7m
Derivatives: n/a Options/other 0.0m
Cash/Debt: Cash $92.1m (30 Sep 2019) Fully diluted 315.7m
Dividend reinvestment plan: No Market capitalisation 255.7m
Other: n/a
Performance 3-mth 6-mth 1 year 3 yr p.a. 5 yr p.a. 10 yr p.a. CDM Share Price v ASX All Ords
Share price*
Performance 8.0% -7.8% -30.4% -7.7% -4.8% 9.6%
Index 2.8% 10.9% 12.1% 11.7% 9.7% 8.2%
Active return 5.2% -18.7% -42.5% -19.4% -14.5% 1.4%
NTA+
Performance 0.1% -2.9% -20.3% -2.1% -1.6% 5.9%
Benchmark 2.8% 10.9% 12.1% 11.7% 9.7% 8.2%
Active return -2.7% -13.8% -32.4% -13.8% -11.3% -2.3%
Share Price and NTA Top Holdings %
as at 30-Sep-19
Eclipx Group Ltd 6.5
Macquarie Group Ltd 4.9
Money3 Corp Ltd 4.6
Resimac Group Ltd 4.1
Champion Iron Ltd 3.8
Strike Energy Ltd 3.3
Shine Corporate Ltd 3.1
Deepgreen Metals 3.1
ARQ Group Ltd 2.4
Risk/Return Indicators Net Sector Exposure (Portfolio) Qualcomm Inc 2.3
Sharpe Standard Bingo Industries Ltd 2.1
Share price* Ratio Ratio Deviation Alibaba Group Holding-SP 2.1
Year 1 -2.31 -1.44 22.3% Rio Tinto Ltd 1.9
Year 3 -1.32 -0.63 16.0% % of Total 44.2
Year 5 -1.02 -0.51 14.3% Gross Portfolio Structure
NTA+ as at 30-Sep-19
Year 1 -3.51 -1.59 13.9% Listed Securities (Long) 68.1
Year 3 -1.70 -0.42 10.6% Listed Securities (Short) 0.7
Year 5 -1.36 -0.35 11.7% Net Exposure 67.4
Cash 32.6
% of Total 100.0
*+ In May 2011CDM received $0.22 per CDM share of f ranking credit s when RHG ret urned t he major it y of it sasset s in t he f orm of a f ully f ranked dividend. At t he
t ime CDM shares were t rading at $1.25. These f ranking credit s were wort h 17.6%of t he CDM share price at t he t ime and are not ref lect ed in our perf ormance
calculat ionsast he calculat ionsare based on pre-t ax NTA and not post -t ax NTA. * The share price benchmark and NTA have been compared against t he S&P/ ASX
All Ordinaries Acc. Index.
*+ Measurement of a LIC’s perf ormance is calculat ed af t er all operat ing expenses, provision and payment of bot h income and realised capit al gains t ax and t he reinvest ment of dividends, and do not incorporat e f ranking. Index ret urns however are
ent irely bef ore any operat ing expenses or t axat ion. LIC ret urns will consequent ly be underst at ed relat ive t o t he Index ret urn.
CDM is a long-short Australian equities fund, with a long bias, that invests predominatly in
equities listed on the ASX. More recently, the manager has taken advatange of opportunities in
the international markets. The manager uses both fundamental and technical analysis in
making investing decisions, employing bottom up research and a disciplined 'Entry and Exit'
strategy. Both strategies seek to exploit the inefficient flow of information through the market,
individual equity momentum and the cyclical nature of markets.
Premium/(Discount) share price to:
Investment Personnel: Karl Siegling, Charlie Gray, Jackson Aldridge. Directors: Karl Siegling
(Chairman), Wayne Davies, James Chirnside, Jenelle Webster.
Information
$0.70
$0.95
$1.20
$1.45
$1.70
Sep-18 Dec-18 Mar-19 Jun-19 Sep-19
All Ords Rebased CDM
Financial
EnergyTechnology
Basic Materials
Consumer, Non-cy clical
Div ersif ied Financials
CashOther
-60%
-30%
0%
30%
60%
$0.00
$0.45
$0.90
$1.35
$1.80
2006 2007 2008 2009 2010 2011 2012 2013 2014 2015 2016 2017 2018
Prem/Disc (RHS) Pre-Tax NTA (LHS) Share Price (LHS)

LISTED INVESTMENT COMPANIES & TRUSTS. 47
WESTOZ INVESTMENT COMPANY LIMITED (WIC)Domestic Focused Share Price and NTA Summary
Mandate: Australian listed equities Benchmark: S&P/ASX Small Ords Accum as at 30-Sep-19
Manager: Westoz Funds Management Management Fee: 1.0% p.a. Share price $1.08
Listed: Sep-09 Performance Fee: 20% over 10% Hurdle Rate Pre-tax NTA $1.24
Post-tax NTA $1.21
Investment Strategy
Pre-tax NTA -13.2%
Post-tax NTA -10.8%
Historic Dividend (prior 12-mths)
Personnel Dividends (net) $0.0600
Yield 5.6%
Franking 100%
Grossed up yield 7.9%
Key Information
Exposure: International/Domestic, Equities/Fixed Income/Derivatives, Cash
Style: Large/Medium/Small Cap, Balanced/Value/Growth, Passive/Active, Long/Short Ordinary shares 134.2m
Derivatives: No (allowed but not used). Options/other 0.0m
Cash/Debt: $6.7m Cash (30 Sep 2019) Fully diluted 134.2m
Dividend reinvestment plan: Yes. Market capitalisation 144.9m
Other: Affiliated with Ozgrowth (ASX code: OZG).
Performance 3-mth 6-mth 1 year 3 yr p.a. 5 yr p.a. 10 yr p.a. WIC Share Price v ASX All Ords
Share price*
Performance 8.0% 9.0% -0.6% 12.4% 5.9% 7.0%
Index 3.1% 7.0% 3.9% 8.8% 9.6% 4.5%
Active return 4.9% 2.0% -4.5% 3.6% -3.7% 2.5%
NTA+
Performance 10.5% 10.5% 1.9% 10.0% 6.2% 3.6%
Benchmark 3.1% 7.0% 3.9% 8.8% 9.6% 4.5%
Active return 7.4% 3.5% -2.0% 1.2% -3.4% -0.9%
Share Price and NTA Top 10 Holdings %
as at 30-Sep-19
Cedar Woods Properties 10.0
Ausdrill Limited 8.0
BHP Group Limited 8.0
Macmahon Holdings 7.0
Finbar Group Limited 6.0
Orecorp Limited 5.0
Western Areas Limited 5.0
Australis Oil & Gas Limited 5.0
Cooper Energy Limited 5.0
Risk/Return Indicators Sector Exposure (Portfolio) West African Resources 5.0
Sharpe Standard % of Total 64.0
Share price* Ratio Ratio Deviation
Year 1 -0.43 -0.14 16.5%
Year 3 0.29 0.74 13.5%
Year 5 -0.30 0.23 14.8%
NTA+
Year 1 -0.18 0.01 16.7%
Year 3 0.11 0.61 12.5%
Year 5 -0.30 0.28 13.7%
* The share price benchmark has been compared against the S&P/ASX Small Ordinaries Accumulat ion Index. + The NTA has been compared
against the S&P/ASX Small Ordinaries Accumulat ion Index.
*+ M easurement of a LIC’s performance is calculated after all operat ing expenses, provision and payment of both income and realised capital gains tax and the reinvestment of dividends, and do not incorporate franking.
Index returns however are ent irely before any operat ing expenses or taxat ion. LIC returns will consequent ly be understated relat ive to the Index return.
WIC invests in small to medium sized companies, generally with some connection to Western
Australia. Its investment objective is to generate a positive return over the medium term from an
actively managed, concentrated portfolio (generally 10-25 stocks) and provide shareholders
with a consistent stream of dividends. If suitable equity investments are not available, large
cash positions maybe held from time to time.
Premium/(Discount) share price to:
Key Personnel: Philip Rees, Dermot Woods, Jay Hughes.
Directors: Jay Hughes (Chairman), Terry Budge, Simon Joyner.
Capital Structure
Information
$0.80
$0.95
$1.10
$1.25
$1.40
Sep-18 Dec-18 Mar-19 Jun-19 Sep-19
All Ords Rebased WIC
Industrials
MaterialsReal
Estate
Energy
Gold
Cash
-50%
-25%
0%
25%
50%
$0.00
$0.50
$1.00
$1.50
$2.00
2010 2011 2012 2013 2014 2015 2016 2017 2018 2019
Prem/Disc (RHS) Pre-Tax NTA (LHS) Share Price (LHS)

LISTED INVESTMENT COMPANIES & TRUSTS. 48
THORNEY OPPORTUNITIES LTD (TOP)Domestic Focused Share Price and NTA Summary
Mandate: Australian Equity Benchmark: S&P/ASX Small Ords Accum. as at 30-Sep-19
Manager: Thorney Management Services Management Fee: 0.75% per half-year Share price $0.68
Listed: Dec-13 Performance Fee: 20% Outperformance Pre-tax NTA $0.85
Post-tax NTA $0.79
Investment Strategy
Pre-tax NTA -20.4%
Post-tax NTA -14.2%
Historic Dividend (prior 12-mths)¹
Personnel Dividends (net) $0.0180
Yield 2.6%
Franking 100%
Grossed up yield 3.8%
Key Information ¹Not including special dividends/distribut ions
Exposure: International/Domestic, Equities/Fixed Income/Derivatives, Cash Capital Structure
Style: Large/Medium/Small Cap, Balanced/Value/Growth, Passive/Active, Long/Short Ordinary shares 203.6m
Derivatives: n/a Options/other 0.0m
Cash/Debt: n/a Fully diluted 203.6m
Dividend Reinvestment Plan: Suspended Market capitalisation 138.5m
Other:
Performance 3-mth 6-mth 1 year 3 yr p.a. 5 yr p.a. 10 yr p.a. TOP Share Price v ASX All Ords
Share price*
Performance 3.2% 8.0% -3.7% 2.7% 11.5% 6.8%
Index 3.1% 7.0% 3.9% 8.8% 9.6% 4.5%
Active return 0.1% 1.0% -7.6% -6.1% 1.9% 2.3%
NTA+
Performance 1.1% 9.7% 4.0% 6.4% 14.4% n/a
Benchmark 3.1% 7.0% 3.9% 8.8% 9.6% 4.5%
Active return -2.0% 2.7% 0.1% -2.4% 4.8% n/a
Share Price and NTA Total Holdings %
as at 30-Jun-19
AMA Group Ltd 19.5
Service Stream Ltd 18.6
Money3 Corporation Ltd 17.7
Austin Engineering Ltd 5.3
Palla Pharma Ltd 5.2
Aveo Group 4.6
Aus. Community Media UL 4.3
Southern Cross Elec. Eng. 3.6
MMA Offshore Ltd 3.5
Risk/Return Indicators OneVue Holdings Ltd 3.5
Sharpe Standard Decmil Group Ltd 3.3
Share price* Ratio Ratio Deviation Nine Entertainment Co 3.2
Year 1 -0.64 -0.33 16.4% Cooper Energy Ltd 1.8
Year 3 -0.46 0.03 13.0% Consolidated Op. Group 1.4
Year 5 0.14 0.61 14.9% Ardent Leisure Group 1.1
NTA+ Murray River Organics Ltd 1.1
Year 1 0.01 0.12 18.5% Mesoblast Ltd 0.6
Year 3 -0.25 0.33 12.1% Other listed investments 1.8
Year 5 0.41 0.92 13.0%
* The share price benchmark has been compared against the S&P/ASX Small Ordinaries Accumulat ion Index. + The NTA has been compared
against the S&P/ASX Small Ordinaries Accumulat ion Index.
*+ M easurement of a LIC’s performance is calculated after all operat ing expenses, provision and payment of both income and realised capital gains tax and the reinvestment of dividends, and do not incorporate franking.
Index returns however are ent irely before any operat ing expenses or taxat ion. LIC returns will consequent ly be understated relat ive to the Index return.
TOP concentrates on producing absolute returns for shareholders over the medium to long
term. Its primary focus is on the careful selection of investments which enable it to be a
constructive catalyst towards unlocking the value in the companies that it identifies.
Premium/(Discount) share price to:
Investment Personnel: Alex Waislitz, Peter Landos, Avee Waislitz, John Cathcart, Margaret
Ross, Jeremy Davis & Anthony Vogel.
Directors: Alex Waislitz, Henry Lanzer, Ashok Jacob & Gary Weiss
Information
$0.50
$0.60
$0.70
$0.80
$0.90
Sep-18 Dec-18 Mar-19 Jun-19 Sep-19
All Ords Rebased TOP
-30%
-15%
0%
15%
30%
$0.00
$0.25
$0.50
$0.75
$1.00
2013 2014 2015 2016 2017 2018 2019
Prem/Disc (RHS) Pre-Tax NTA (LHS) Share Price (LHS)
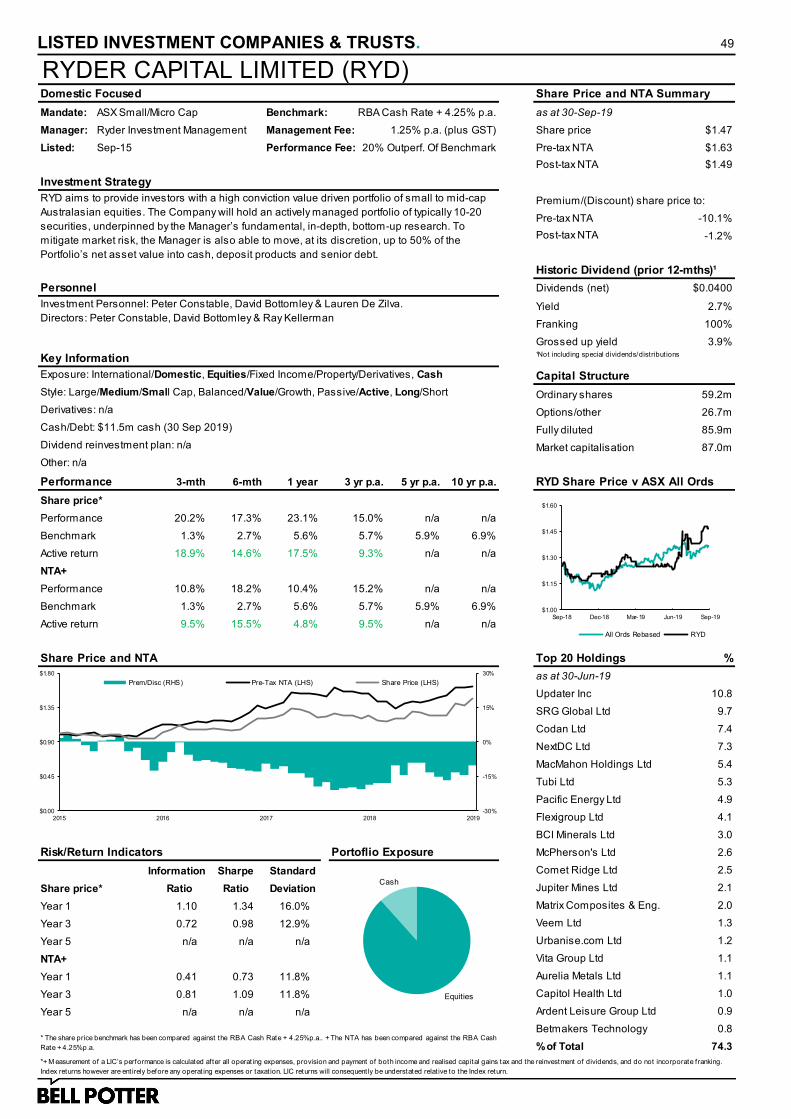
LISTED INVESTMENT COMPANIES & TRUSTS. 49
RYDER CAPITAL LIMITED (RYD)Domestic Focused Share Price and NTA Summary
Mandate: ASX Small/Micro Cap Benchmark: RBA Cash Rate + 4.25% p.a. as at 30-Sep-19
Manager: Ryder Investment Management Management Fee: 1.25% p.a. (plus GST) Share price $1.47
Listed: Sep-15 Performance Fee: 20% Outperf. Of Benchmark Pre-tax NTA $1.63
Post-tax NTA $1.49
Investment Strategy
Pre-tax NTA -10.1%
Post-tax NTA -1.2%
Historic Dividend (prior 12-mths)¹
Personnel Dividends (net) $0.0400
Yield 2.7%
Franking 100%
Grossed up yield 3.9%
Key Information ¹Not including special dividends/distribut ions
Exposure: International/Domestic, Equities/Fixed Income/Property/Derivatives, Cash Capital Structure
Style: Large/Medium/Small Cap, Balanced/Value/Growth, Passive/Active, Long/Short Ordinary shares 59.2m
Derivatives: n/a Options/other 26.7m
Cash/Debt: $11.5m cash (30 Sep 2019) Fully diluted 85.9m
Dividend reinvestment plan: n/a Market capitalisation 87.0m
Other: n/a
Performance 3-mth 6-mth 1 year 3 yr p.a. 5 yr p.a. 10 yr p.a. RYD Share Price v ASX All Ords
Share price*
Performance 20.2% 17.3% 23.1% 15.0% n/a n/a
Benchmark 1.3% 2.7% 5.6% 5.7% 5.9% 6.9%
Active return 18.9% 14.6% 17.5% 9.3% n/a n/a
NTA+
Performance 10.8% 18.2% 10.4% 15.2% n/a n/a
Benchmark 1.3% 2.7% 5.6% 5.7% 5.9% 6.9%
Active return 9.5% 15.5% 4.8% 9.5% n/a n/a
Share Price and NTA Top 20 Holdings %
as at 30-Jun-19
Updater Inc 10.8
SRG Global Ltd 9.7
Codan Ltd 7.4
NextDC Ltd 7.3
MacMahon Holdings Ltd 5.4
Tubi Ltd 5.3
Pacific Energy Ltd 4.9
Flexigroup Ltd 4.1
BCI Minerals Ltd 3.0
Risk/Return Indicators Portoflio Exposure McPherson's Ltd 2.6
Sharpe Standard Comet Ridge Ltd 2.5
Share price* Ratio Ratio Deviation Jupiter Mines Ltd 2.1
Year 1 1.10 1.34 16.0% Matrix Composites & Eng. 2.0
Year 3 0.72 0.98 12.9% Veem Ltd 1.3
Year 5 n/a n/a n/a Urbanise.com Ltd 1.2
NTA+ Vita Group Ltd 1.1
Year 1 0.41 0.73 11.8% Aurelia Metals Ltd 1.1
Year 3 0.81 1.09 11.8% Capitol Health Ltd 1.0
Year 5 n/a n/a n/a Ardent Leisure Group Ltd 0.9
Betmakers Technology 0.8
% of Total 74.3* The share price benchmark has been compared against the RBA Cash Rate + 4.25%p.a.. + The NTA has been compared against the RBA Cash
Rate + 4.25% p.a.
*+ M easurement of a LIC’s performance is calculated after all operat ing expenses, provision and payment of both income and realised capital gains tax and the reinvestment of dividends, and do not incorporate franking.
Index returns however are ent irely before any operat ing expenses or taxat ion. LIC returns will consequent ly be understated relat ive to the Index return.
RYD aims to provide investors with a high conviction value driven portfolio of small to mid-cap
Australasian equities. The Company will hold an actively managed portfolio of typically 10-20
securities, underpinned by the Manager’s fundamental, in-depth, bottom-up research. To
mitigate market risk, the Manager is also able to move, at its discretion, up to 50% of the
Portfolio’s net asset value into cash, deposit products and senior debt.
Premium/(Discount) share price to:
Investment Personnel: Peter Constable, David Bottomley & Lauren De Zilva.
Directors: Peter Constable, David Bottomley & Ray Kellerman
Information
$1.00
$1.15
$1.30
$1.45
$1.60
Sep-18 Dec-18 Mar-19 Jun-19 Sep-19
All Ords Rebased RYD
Equities
Cash
-30%
-15%
0%
15%
30%
$0.00
$0.45
$0.90
$1.35
$1.80
2015 2016 2017 2018 2019
Prem/Disc (RHS) Pre-Tax NTA (LHS) Share Price (LHS)
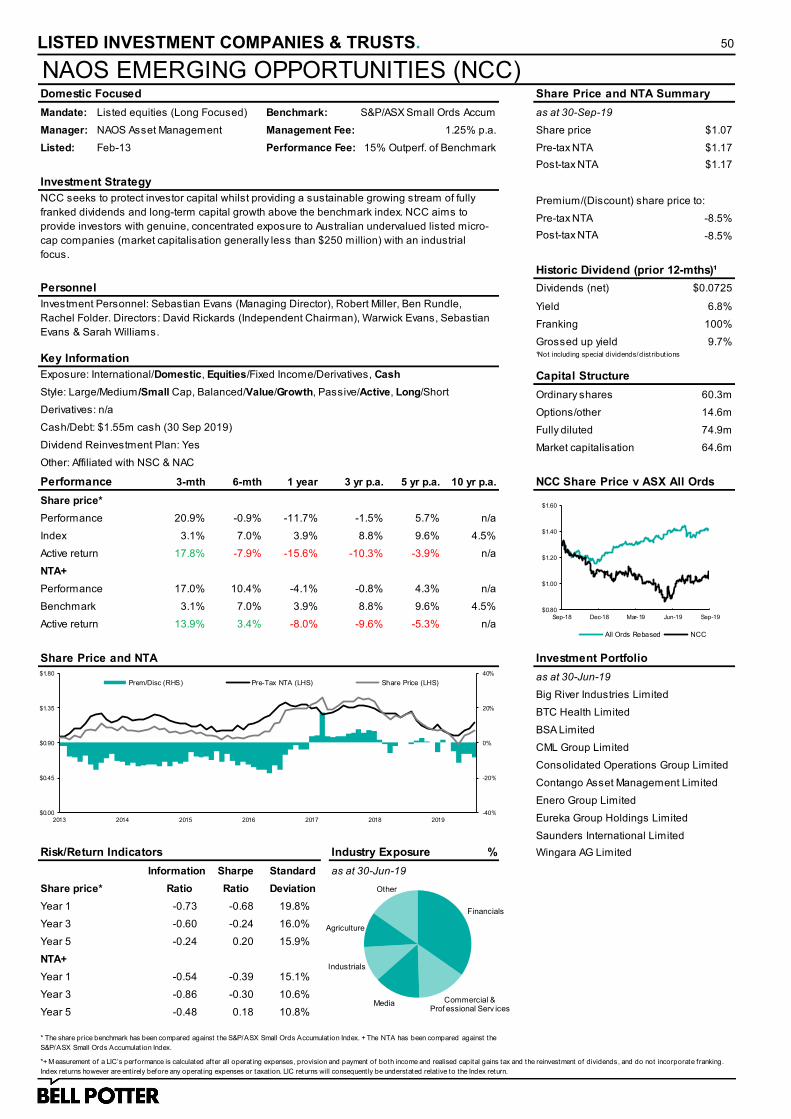
LISTED INVESTMENT COMPANIES & TRUSTS. 50
NAOS EMERGING OPPORTUNITIES (NCC)Domestic Focused Share Price and NTA Summary
Mandate: Listed equities (Long Focused) Benchmark: S&P/ASX Small Ords Accum as at 30-Sep-19
Manager: NAOS Asset Management Management Fee: 1.25% p.a. Share price $1.07
Listed: Feb-13 Performance Fee: 15% Outperf. of Benchmark Pre-tax NTA $1.17
Post-tax NTA $1.17
Investment Strategy
Pre-tax NTA -8.5%
Post-tax NTA -8.5%
Historic Dividend (prior 12-mths)¹
Personnel Dividends (net) $0.0725
Yield 6.8%
Franking 100%
Grossed up yield 9.7%
Key Information ¹Not including special dividends/distribut ions
Exposure: International/Domestic, Equities/Fixed Income/Derivatives, Cash Capital Structure
Style: Large/Medium /Small Cap, Balanced/Value/Growth, Passive/Active, Long/Short Ordinary shares 60.3m
Derivatives: n/a Options/other 14.6m
Cash/Debt: $1.55m cash (30 Sep 2019) Fully diluted 74.9m
Dividend Reinvestment Plan: Yes Market capitalisation 64.6m
Other: Affiliated with NSC & NAC
Performance 3-mth 6-mth 1 year 3 yr p.a. 5 yr p.a. 10 yr p.a. NCC Share Price v ASX All Ords
Share price*
Performance 20.9% -0.9% -11.7% -1.5% 5.7% n/a
Index 3.1% 7.0% 3.9% 8.8% 9.6% 4.5%
Active return 17.8% -7.9% -15.6% -10.3% -3.9% n/a
NTA+
Performance 17.0% 10.4% -4.1% -0.8% 4.3% n/a
Benchmark 3.1% 7.0% 3.9% 8.8% 9.6% 4.5%
Active return 13.9% 3.4% -8.0% -9.6% -5.3% n/a
Share Price and NTA Investment Portfolio
Big River Industries Limited
BTC Health Limited
BSA Limited
CML Group Limited
Consolidated Operations Group Limited
Contango Asset Management Limited
Enero Group Limited
Eureka Group Holdings Limited
Saunders International Limited
Risk/Return Indicators Industry Exposure % Wingara AG Limited
Sharpe Standard
Share price* Ratio Ratio Deviation
Year 1 -0.73 -0.68 19.8%
Year 3 -0.60 -0.24 16.0%
Year 5 -0.24 0.20 15.9%
NTA+
Year 1 -0.54 -0.39 15.1%
Year 3 -0.86 -0.30 10.6%
Year 5 -0.48 0.18 10.8%
* The share price benchmark has been compared against the S&P/ASX Small Ords Accumulat ion Index. + The NTA has been compared against the
S&P/ASX Small Ords Accumulat ion Index.
*+ M easurement of a LIC’s performance is calculated after all operat ing expenses, provision and payment of both income and realised capital gains tax and the reinvestment of dividends, and do not incorporate franking.
Index returns however are ent irely before any operat ing expenses or taxat ion. LIC returns will consequent ly be understated relat ive to the Index return.
NCC seeks to protect investor capital whilst providing a sustainable growing stream of fully
franked dividends and long-term capital growth above the benchmark index. NCC aims to
provide investors with genuine, concentrated exposure to Australian undervalued listed micro-
cap companies (market capitalisation generally less than $250 million) with an industrial
focus.
Premium/(Discount) share price to:
Investment Personnel: Sebastian Evans (Managing Director), Robert Miller, Ben Rundle,
Rachel Folder. Directors: David Rickards (Independent Chairman), Warwick Evans, Sebastian
Evans & Sarah Williams.
Information as at 30-Jun-19
as at 30-Jun-19
$0.80
$1.00
$1.20
$1.40
$1.60
Sep-18 Dec-18 Mar-19 Jun-19 Sep-19
All Ords Rebased NCC
-40%
-20%
0%
20%
40%
$0.00
$0.45
$0.90
$1.35
$1.80
2013 2014 2015 2016 2017 2018 2019
Prem/Disc (RHS) Pre-Tax NTA (LHS) Share Price (LHS)
Financials
Commercial & Prof essional Serv ices
Media
Industrials
Agriculture
Other

LISTED INVESTMENT COMPANIES & TRUSTS. 51
THORNEY TECHNOLOGIES LTD (TEK)Domestic Focused Share Price and NTA Summary
Mandate: Technology securities Benchmark: None as at 30-Sep-19
Manager: Thorney Management Services Management Fee: 1.5% p.a. Share price $0.28
Listed: Jan-17 Performance Fee: 20% Outperformance Pre-tax NTA $0.34
Post-tax NTA $0.37
Investment Strategy
Pre-tax NTA -19.6%
Post-tax NTA -25.1%
Historic Dividend (prior 12-mths)¹
Personnel Dividends (net) $0.0000
Yield 0.0%
Franking n/a
Grossed up yield n/a
Key Information ¹Not including special dividends/distribut ions
Exposure: International/Domestic, Equities/Fixed Income/Derivatives, Cash Capital Structure
Style: Large/Medium/Small Cap, Balanced/Value/Growth, Passive/Active, Long/Short Ordinary shares 257.3m
Derivatives: n/a Options/other 0.0m
Cash/Debt: n/a Fully diluted 257.3m
Dividend Reinvestment Plan: n/a Market capitalisation 70.8m
Other:
Performance 3-mth 6-mth 1 year 3 yr p.a. 5 yr p.a. 10 yr p.a. TEK Share Price v ASX All Ords
Share price*
Performance 12.2% 25.0% 14.6% n/a n/a n/a
Index 2.8% 10.9% 12.1% 11.7% 9.7% 8.2%
Active return 9.4% 14.1% 2.5% n/a n/a n/a
NTA+
Performance 10.3% 24.4% 23.0% n/a n/a n/a
Index 2.8% 10.9% 12.1% 11.7% 9.7% 8.2%
Active return 7.5% 13.5% 10.9% n/a n/a n/a
Share Price and NTA Total Holdings %
as at 30-Jun-19
Updater Inc. 11.7
Zip Co Ltd 9.8
Credible Labs Inc. 7.9
Afterpay Touch Group Ltd 7.9
iSelect Ltd 3.8
Next Science Ltd 3.2
Dubber Corporation Ltd 3.0
Yojee Ltd 2.7
SkyFii Ltd 2.7
Risk/Return Indicators Mesoblast Ltd 2.5
Sharpe Standard Sensera Ltd 2.1
Share price* Ratio Ratio Deviation ReadCloud Ltd 2.0
Year 1 0.15 0.60 21.3% OneVue Holdings Ltd 1.8
Year 3 n/a n/a n/a NJOY Holdings Inc. 1.6
Year 5 n/a n/a n/a Livehire Ltd 1.4
NTA+ NEXTDC Ltd 1.3
Year 1 0.93 1.27 16.8% Carbon Revolution Ltd 1.3
Year 3 n/a n/a n/a Oventus Medical Ltd 1.3
Year 5 n/a n/a n/a Aglive Group Ltd 1.3
Terragen Holdings Ltd 1.2
% of Total 70.6* The share price benchmark has been compared against the ASX All Ordinaries Accumulat ion Index. + The NTA has been compared against the
ASX All Ordinaries Accumulat ion Index.
*+ M easurement of a LIC’s performance is calculated after all operat ing expenses, provision and payment of both income and realised capital gains tax and the reinvestment of dividends, and do not incorporate franking.
Index returns however are ent irely before any operat ing expenses or taxat ion. LIC returns will consequent ly be understated relat ive to the Index return.
TEK invests in companies with a technology related business with a disruptive business
model. TEK has the flexibility to invest across listed and unlisted companies as well as
convertible notes and other instruments.
Premium/(Discount) share price to:
Investment Personnel: Alex Waislitz, Peter Landos, Avee Waislitz, John Cathcart, Margaret
Ross, Jeremy Davis & Anthony Vogel.
Directors: Alex Waislitz, Jeremy Leiber, Alan Fisher & Martin Casey
Information
$0.10
$0.15
$0.20
$0.25
$0.30
Sep-18 Dec-18 Mar-19 Jun-19 Sep-19
All Ords Rebased TEK
-50%
-25%
0%
25%
50%
$0.00
$0.10
$0.20
$0.30
$0.40
2017 2018 2019
Prem/Disc (RHS) Pre-Tax NTA (LHS) Share Price (LHS)

LISTED INVESTMENT COMPANIES & TRUSTS. 52
WAM ACTIVE (WAA)Domestic Focused Share Price and NTA Summary
Mandate: ASX Listed Equity Benchmark: All Ordinaries Accumulation as at 30-Sep-19
Manager: Wilson Asset Management Management Fee: 1.0% p.a. Share price $1.12
Listed: 2008 Performance Fee: 20% over High Watermark Pre-tax NTA $1.08
Post-tax NTA $1.08
Investment Strategy
Pre-tax NTA 3.7%
Post-tax NTA 3.7%
Historic Dividend (prior 12-mths)
Personnel Dividends (net) $0.0590
Yield 5.3%
Franking 100%
Grossed up yield 7.5%
Key Information
Exposure: International/Domestic, Equities/Fixed Income/Derivatives, Cash
Style: Large/Medium/Small Cap, Balanced/Value/Growth, Passive/Active, Long/Short Ordinary shares 46.4m
Derivatives: Used for arbitrage and in anticipation of a decline in the market value of that security. Options/other 0.0m
Cash & Fixed Interest/Debt: Cash & Fixed Interest $9.5m (30 Sep 2019) Fully diluted 46.4m
Dividend reinvestment plan: Yes, 2.5% discount to 4 day VWAP from (and including) ex-date Market capitalisation 52.0m
Other: Affiliated with Wilson Asset Management
Performance 3-mth 6-mth 1 year 3 yr p.a. 5 yr p.a. 10 yr p.a. WAA Share Price v ASX All Ords
Share price*
Performance 12.6% 9.9% 2.5% 3.4% 1.8% 7.6%
Index 2.8% 10.9% 12.1% 11.7% 9.7% 8.2%
Active return 9.8% -1.0% -9.6% -8.3% -7.9% -0.6%
NTA+
Performance 3.4% 6.1% 3.4% 5.6% 7.1% 5.6%
Benchmark 2.8% 10.9% 12.1% 11.7% 9.7% 8.2%
Active return 0.6% -4.8% -8.7% -6.1% -2.6% -2.6%
Share Price and NTA Top Holdings
as at 30-Sep-19
Altium Ltd
Afterpay Touch Group Ltd
Ausdrill Ltd
BWX Limited
Carsales.Com Limited
Collins Foods Ltd
Domino's Pizza Enterprises Limited
Eclipx Group Limited
EML Payments Limited
Risk/Return Indicators Portfolio by Sector EQT Holdings Limited
Sharpe Standard IPH Limited
Share price* Ratio Ratio Deviation Kogan.Com Ltd
Year 1 -0.81 0.06 11.4% Megaport Limited
Year 3 -0.85 0.12 8.2% Orica Limited
Year 5 -0.53 -0.05 13.0% Pengana International Equities Ltd
NTA+ REA Group Ltd
Year 1 -1.36 0.25 6.5% Steadfast Group Ltd
Year 3 -1.00 0.74 4.4% Super Retail Group Limited
Year 5 -0.31 1.01 4.6% Seven Group Holdings Ltd
Templeton Global Growth Fund Ltd* The shareprice bench mark has been compared against the S&P/ASX All Ordinaries Accumulat ion Index. + The NTA has been compared against
the S&P/ASX All Ordinaries Accumulat ion Index.
*+ M easurement of a LIC’s performance is calculated after all operat ing expenses, provision and payment of both income and realised capital gains tax and the reinvestment of dividends, and do not incorporate franking.
Index returns however are ent irely before any operat ing expenses or taxat ion. LIC returns will consequent ly be understated relat ive to the Index return.
WAA exhibits an active trading style, aiming to achieve a sound return with a low correlation to
traditional markets. The investment objectives are to deliver a growing income stream in the
form of fully franked dividends and to preserve capital in both the short and long term. WAA
uses a market driven approach to investing – aiming to take advantage of short-term relative
arbitrage and mispricing in the market. WAA participates in IPOs, rights issues, placements,
schemes of arrangement and looks for arbitrage opportunities and discount to asset plays.
Premium/(Discount) share price to:
Investment Personnel: Geoff Wilson, Catriona Burns, Matt Haupt, Oscar Oberg, Adrian Siew,
Tobias Yao, John Ayoub, Nick Healy, Sam Koch, Cooper Rogers & Tyler McKay.
Directors: Geoff Wilson, Kate Thorley, Emma Rugge-Price & Karina Kwan.
Capital Structure
Information
$0.80
$0.95
$1.10
$1.25
$1.40
Sep-18 Dec-18 Mar-19 Jun-19 Sep-19
All Ords Rebased WAA
Financials
Consumer Disc.
IT
Industrials
Materials
Other
Cash
-50%
-25%
0%
25%
50%
$0.00
$0.40
$0.80
$1.20
$1.60
2008 2009 2010 2011 2012 2013 2014 2015 2016 2017 2018 2019
Prem/Disc (RHS) Pre-Tax NTA (LHS) Share Price (LHS)

LISTED INVESTMENT COMPANIES & TRUSTS. 53
NAOS EX-50 OPPORTUNITIES (NAC)Domestic Focused Share Price and NTA Summary
Mandate: Listed Equity (Long Focused) Benchmark: S&P/ASX 300 Industrials Accum as at 30-Sep-19
Manager: NAOS Asset Management Management Fee: 1.75% p.a. Share price $0.93
Listed: Nov-14 Performance Fee: 20% Outperf. of Benchmark Pre-tax NTA $1.15
Post-tax NTA $1.11
Investment Strategy
Pre-tax NTA -19.1%
Post-tax NTA -16.2%
Historic Dividend (prior 12-mths)¹
Personnel Dividends (net) $0.0525
Yield 5.6%
Franking 100%
Grossed up yield 8.1%
Key Information ¹Not including special dividends/distribut ions
Exposure: International/Domestic, Equities/Fixed Income/Derivatives, Cash Capital Structure
Style: Large/Medium/Small Cap, Balanced/Value/Growth, Passive/Active, Long/Short Ordinary shares 51.1m
Derivatives: n/a Options/other 0.0m
Cash/Debt: $7.3m Cash (30 Sep 2019) Fully diluted 51.1m
Dividend Reinvestment Plan: Yes Market capitalisation 47.5m
Other: Affiliated with NCC & NSC
Performance 3-mth 6-mth 1 year 3 yr p.a. 5 yr p.a. 10 yr p.a. NAC Share Price v ASX All Ords
Share price*
Performance 14.2% 14.0% -2.4% 1.3% n/a n/a
Index 4.1% 13.4% 13.2% 10.4% 9.9% 9.8%
Active return 10.1% 0.6% -15.6% -9.1% n/a n/a
NTA+
Performance 13.9% 14.3% 6.9% 2.4% n/a n/a
Benchmark 4.1% 13.4% 13.2% 10.4% 9.9% 9.8%
Active return 9.8% 0.9% -6.3% -8.0% n/a n/a
Share Price and NTA Investment Portfolio
AP Eagers Limited
Automotive Holdings Limited
BTC Health Limited (UL options)
CML Group Limited
CYBG Plc Limited
Elders Limited
Gentrack Group Limited
Lifestyle Communities Limited
MNF Group Limited
Risk/Return Indicators Industry Exposure % Over the Wire Holdings Limited
Sharpe Standard People Infrastruture Limited
Share price* Ratio Ratio Deviation PSC Insurance Group Limited
Year 1 -1.16 -0.27 15.4% Ruralco Holdings Limited
Year 3 -0.70 -0.09 12.1% Smartgroup Corporation Limited
Year 5 n/a n/a n/a Village Roadshow Limited
NTA+
Year 1 -0.42 0.33 15.7%
Year 3 -0.68 0.00 10.9%
Year 5 n/a n/a n/a
* The share price benchmark has been compared against the S&P/ASX 300 Industrials Accumulat ion Index. + The NTA has been compared against
the S&P/ASX 300 Industrials Accumulat ion Index. Benchmark changed 1st July 2018 and will be used as a past performance indicated
*+ M easurement of a LIC’s performance is calculated after all operat ing expenses, provision and payment of both income and realised capital gains tax and the reinvestment of dividends, and do not incorporate franking.
Index returns however are ent irely before any operat ing expenses or taxat ion. LIC returns will consequent ly be understated relat ive to the Index return.
NAC seeks to protect investor capital whilst providing a sustainable growing stream of fully
franked dividends and long-term capital growth above the benchmark index. NAC aims to
provide investors with genuine, concentrated exposure to Australian undervalued listed mid-
cap companies (market capitalisation generally between$400 million and $1 billion+) with an
industrial focus.
Premium/(Discount) share price to:
Investment Personnel: Sebastian Evans (Managing Director), Robert Miller, Ben Rundle,
Rachel Folder. Directors: David Rickards (Independent Chairman), Warwick Evans, Sebastian
Evans & Sarah Williams.
Information as at 30-Jun-19
as at 30-Jun-19
$0.70
$0.85
$1.00
$1.15
$1.30
Sep-18 Dec-18 Mar-19 Jun-19 Sep-19
All Ords Rebased NAC
-30%
-15%
0%
15%
30%
$0.50
$0.75
$1.00
$1.25
$1.50
2014 2015 2016 2017 2018 2019
Prem/Disc (RHS) Pre-Tax NTA (LHS) Share Price (LHS)
IT
Commercial & Prof essional Serv ices
Financials
Agriculture
Consumer Disc.
Other

LISTED INVESTMENT COMPANIES & TRUSTS. 54
WAM MICROCAP (WMI)Domestic Focused Share Price and NTA Summary
Mandate: Australian listed equities Benchmark: S&P/ASX Small Ords Accum as at 30-Sep-19
Manager: Wilson Asset Management Management Fee: 1.0% p.a. Share price $1.42
Listed: Jun-17 Performance Fee: 20% Outperf. of Benchmark Pre-tax NTA $1.43
Post-tax NTA $1.38
Investment Strategy
Pre-tax NTA -0.7%
Post-tax NTA 3.2%
Historic Dividend (prior 12-mths)¹
Personnel Dividends (net) $0.0450
Yield 3.2%
Franking 100%
Grossed up yield 4.5%
Key Information ¹Not including special dividends/distribut ions
Exposure: International/Domestic, Equities/Fixed Income/Derivatives, Cash Capital Structure
Style: Large/Medium/Small Cap, Balanced/Value/Growth, Passive/Active, Long/Short Ordinary shares 141.4m
Derivatives: Used for arbitrage and in anticipaton of a decline in the market value of the security Options/other 0.0m
Cash & Fixed Interest/Debt: $43m cash (30 Sep 2019) Fully diluted 141.4m
Dividend reinvestment plan: n/a Market capitalisation 200.8m
Other: Affiliated with Wilson Asset Management
Performance 3-mth 6-mth 1 year 3 yr p.a. 5 yr p.a. 10 yr p.a. WMI Share Price v ASX All Ords
Share price*
Performance 16.9% 17.1% 0.7% n/a n/a n/a
Index 3.1% 7.0% 3.9% 8.8% 9.6% 4.5%
Active return 13.8% 10.1% -3.2% n/a n/a n/a
NTA+
Performance 9.0% 15.3% 7.6% n/a n/a n/a
Benchmark 3.1% 7.0% 3.9% 8.8% 9.6% 4.5%
Active return 5.9% 8.3% 3.7% n/a n/a n/a
Share Price and NTA Top Holdings
as at 30-Sep-19
Australian Finance Group Ltd
Alliance Aviation Services Limited
Beacon Lighting Group Limited
BSA Limited
City Chic Collective Limited
Cirrus Networks Holdings Limited
Countplus Limited
Data#3 Limited
Eclipx Group Limited
Risk/Return Indicators Sector Exposure (Portfolio) Enero Group Limited
Sharpe Standard Ecofibre Limited
Share price* Ratio Ratio Deviation Infomedia Ltd
Year 1 -0.18 -0.08 14.4% Johns Lyng Group Limited
Year 3 n/a n/a n/a Mader Group Limited
Year 5 n/a n/a n/a Myer Holdings Limited
NTA+ National Veterinary Care Ltd
Year 1 0.56 0.45 12.7% Prospa Group Limited
Year 3 n/a n/a n/a Psc Insurance Group Limited
Year 5 n/a n/a n/a Think Childcare Limited
Temple & Webster Group Ltd* The share price benchmark has been compared against the S&P/ASX Small Ords Accumulat ion Index. + The NTA has been compared against the
S&P/ASX Small Ords Accumulat ion Index.
*+ M easurement of a LIC’s performance is calculated after all operat ing expenses, provision and payment of both income and realised capital gains tax and the reinvestment of dividends, and do not incorporate franking.
Index returns however are ent irely before any operat ing expenses or taxat ion. LIC returns will consequent ly be understated relat ive to the Index return.
WMI targets listed companies with a market capitalisation of less than $300m at time of
acquisition. WMI will seek to deliver a steam of fully-franked dividends, provide capital growth
over the medium-to-long term and preserve capital. WMI employs a two tiered investment
process including a Research Driven strategy, which is fundamentally a bottom up approach,
and a Market Driven strategy, which targets relatively short-term arbitrage and mispricing.
Premium/(Discount) share price to:
Investment Personnel: Geoff Wilson, Catriona Burns, Matt Haupt, Oscar Oberg, Adrian Siew,
Tobias Yao, John Ayoub, Nick Healy, Sam Koch, Cooper Rogers & Tyler McKay.
Directors: Geoff Wilson, Jacqueline Sullivan & Kate Thorley.
Information
$1.00
$1.20
$1.40
$1.60
$1.80
Sep-18 Dec-18 Mar-19 Jun-19 Sep-19
All Ords Rebased WMI
Consumer Disc.
IT
FinancialsIndustrials
Health Care
Other
Cash
-30%
-15%
0%
15%
30%
$0.40
$0.75
$1.10
$1.45
$1.80
2017 2018 2019
Prem/Disc (RHS) Pre-Tax NTA (LHS) Share Price (LHS)
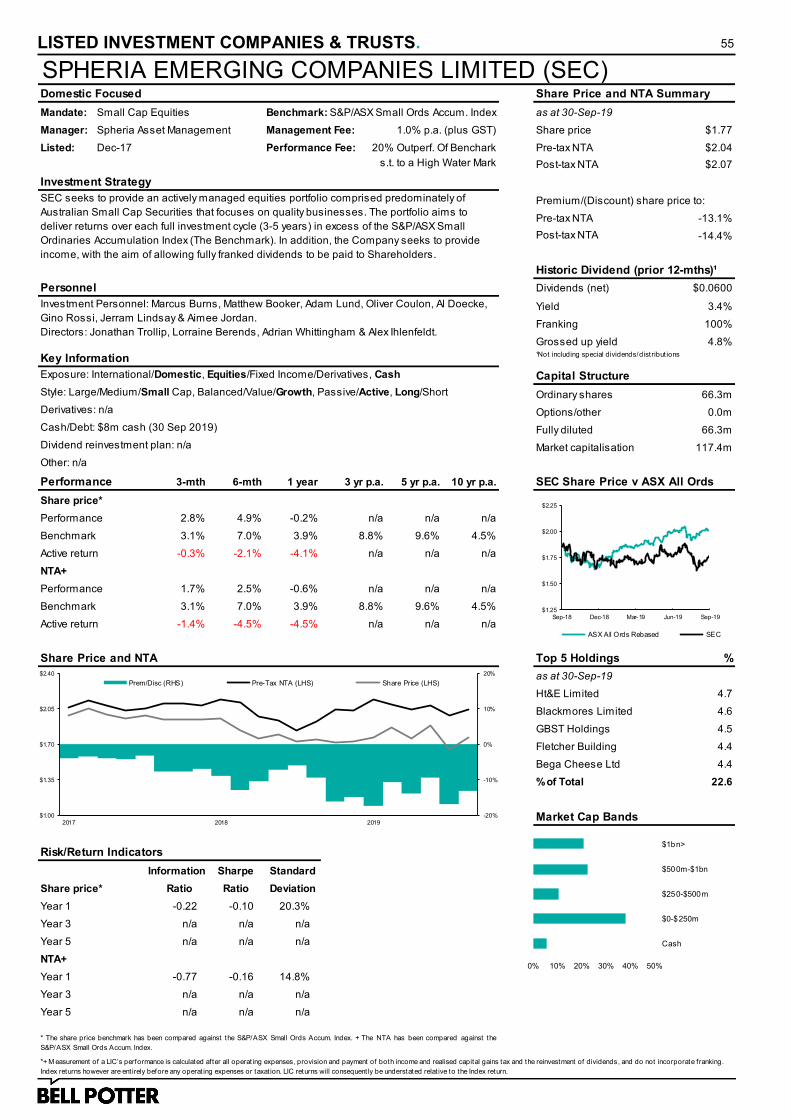
LISTED INVESTMENT COMPANIES & TRUSTS. 55
SPHERIA EMERGING COMPANIES LIMITED (SEC)Domestic Focused Share Price and NTA Summary
Mandate: Small Cap Equities Benchmark: S&P/ASX Small Ords Accum. Index as at 30-Sep-19
Manager: Spheria Asset Management Management Fee: 1.0% p.a. (plus GST) Share price $1.77
Listed: Dec-17 Performance Fee: 20% Outperf. Of Benchark Pre-tax NTA $2.04
s.t. to a High Water Mark Post-tax NTA $2.07
Investment Strategy
Pre-tax NTA -13.1%
Post-tax NTA -14.4%
Historic Dividend (prior 12-mths)¹
Personnel Dividends (net) $0.0600
Yield 3.4%
Franking 100%
Grossed up yield 4.8%
Key Information ¹Not including special dividends/distribut ions
Exposure: International/Domestic, Equities/Fixed Income/Derivatives, Cash Capital Structure
Style: Large/Medium/Small Cap, Balanced/Value/Growth, Passive/Active, Long/Short Ordinary shares 66.3m
Derivatives: n/a Options/other 0.0m
Cash/Debt: $8m cash (30 Sep 2019) Fully diluted 66.3m
Dividend reinvestment plan: n/a Market capitalisation 117.4m
Other: n/a
Performance 3-mth 6-mth 1 year 3 yr p.a. 5 yr p.a. 10 yr p.a. SEC Share Price v ASX All Ords
Share price*
Performance 2.8% 4.9% -0.2% n/a n/a n/a
Benchmark 3.1% 7.0% 3.9% 8.8% 9.6% 4.5%
Active return -0.3% -2.1% -4.1% n/a n/a n/a
NTA+
Performance 1.7% 2.5% -0.6% n/a n/a n/a
Benchmark 3.1% 7.0% 3.9% 8.8% 9.6% 4.5%
Active return -1.4% -4.5% -4.5% n/a n/a n/a
Share Price and NTA Top 5 Holdings %
as at 30-Sep-19
Ht&E Limited 4.7
Blackmores Limited 4.6
GBST Holdings 4.5
Fletcher Building 4.4
Bega Cheese Ltd 4.4
% of Total 22.6
Market Cap Bands
Risk/Return Indicators
Sharpe Standard
Share price* Ratio Ratio Deviation
Year 1 -0.22 -0.10 20.3%
Year 3 n/a n/a n/a
Year 5 n/a n/a n/a
NTA+
Year 1 -0.77 -0.16 14.8%
Year 3 n/a n/a n/a
Year 5 n/a n/a n/a
* The share price benchmark has been compared against the S&P/ASX Small Ords Accum. Index. + The NTA has been compared against the
S&P/ASX Small Ords Accum. Index.
*+ M easurement of a LIC’s performance is calculated after all operat ing expenses, provision and payment of both income and realised capital gains tax and the reinvestment of dividends, and do not incorporate franking.
Index returns however are ent irely before any operat ing expenses or taxat ion. LIC returns will consequent ly be understated relat ive to the Index return.
SEC seeks to provide an actively managed equities portfolio comprised predominately of
Australian Small Cap Securities that focuses on quality businesses. The portfolio aims to
deliver returns over each full investment cycle (3-5 years) in excess of the S&P/ASX Small
Ordinaries Accumulation Index (The Benchmark). In addition, the Company seeks to provide
income, with the aim of allowing fully franked dividends to be paid to Shareholders.
Premium/(Discount) share price to:
Investment Personnel: Marcus Burns, Matthew Booker, Adam Lund, Oliver Coulon, Al Doecke,
Gino Rossi, Jerram Lindsay & Aimee Jordan.
Directors: Jonathan Trollip, Lorraine Berends, Adrian Whittingham & Alex Ihlenfeldt.
Information
$1.25
$1.50
$1.75
$2.00
$2.25
Sep-18 Dec-18 Mar-19 Jun-19 Sep-19
ASX All Ords Rebased SEC
-20%
-10%
0%
10%
20%
$1.00
$1.35
$1.70
$2.05
$2.40
2017 2018 2019
Prem/Disc (RHS) Pre-Tax NTA (LHS) Share Price (LHS)
Cash
$0-$250m
$250-$500m
$500m-$1bn
$1bn>
0% 10% 20% 30% 40% 50%

LISTED INVESTMENT COMPANIES & TRUSTS. 56
NAOS SMALL CAP OPPORTUNITIES (NSC)Domestic Focused Share Price and NTA Summary
Mandate: Listed Equity (Long Focused) Benchmark: S&P/ASX Small Ords Accum as at 30-Sep-19
Manager: NAOS Asset Management Management Fee: 1.15% p.a. Share price $0.73
Listed: 2004 Performance Fee: 20% Outperf. of Benchmark Pre-tax NTA $0.90
Post-tax NTA $0.88
Investment Strategy
Pre-tax NTA -19.4%
Post-tax NTA -17.6%
Historic Dividend (prior 12-mths)¹
Personnel Dividends (net) $0.0400
Yield 5.5%
Franking 100%
Grossed up yield 7.9%
Key Information ¹Not including special dividends/distribut ions
Exposure: International/Domestic, Equities/Fixed Income/Derivatives, Cash Capital Structure
Style: Large/Medium/Small Cap, Balanced/Value/Growth, Passive/Active, Long/Short Ordinary shares 164.2m
Derivatives: n/a Options/other 0.3m
Cash: $7.2m (30 Sep 2019) Convertible Note Face Value: $26.5m (30 Sep 2019) Fully diluted 184.6m
Dividend reinvestment plan: Yes Market capitalisation 119.1m
Other: Convertible Note Maturity Mar 2020. Affiliated with NAC & NCC
Performance 3-mth 6-mth 1 year 3 yr p.a. 5 yr p.a. 10 yr p.a. NSC Share Price v ASX All Ords
Share price*
Performance 29.2% 18.9% -3.2% -7.9% -1.2% 3.2%
Index 3.1% 7.0% 3.9% 8.8% 9.6% 4.5%
Active return 26.1% 11.9% -7.1% -16.7% -10.8% -1.3%
NTA+
Performance 25.7% 20.7% 1.8% -3.8% 0.8% 1.0%
Benchmark 3.1% 7.0% 3.9% 8.8% 9.6% 4.5%
Active return 22.6% 13.7% -2.1% -12.6% -8.8% -3.5%
Share Price and NTA Investment Portfolio
Big River Industries Limited
BSA Limited
CML Group Limited
Consolidated Operations Group Limited
Countplus Limited
Enero Group Limited
Experience Co Limited
Motorcycle Holdings Limited
MNF Group Limited
Risk/Return Indicators Industry Exposure % Objective Corporation Limited
Sharpe Standard Over The Wire Holdings Limited
Share price* Ratio Ratio Deviation Village Roadshow Limited
Year 1 -0.29 -0.20 25.1% 360 Capital Total Return Fund
Year 3 -0.87 -0.53 19.3%
Year 5 -0.64 -0.21 17.2%
NTA+
Year 1 -0.08 0.00 24.4%
Year 3 -0.70 -0.38 16.1%
Year 5 -0.59 -0.11 15.1%
* The share price benchmark has been compared against the S&P/ASX All Ordinaries Accumulat ion Index. + The NTA has been compared against
the S&P/ASX Small Ords Accumulat ion Index.
*+ M easurement of a LIC’s performance is calculated after all operat ing expenses, provision and payment of both income and realised capital gains tax and the reinvestment of dividends, and do not incorporate franking.
Index returns however are ent irely before any operat ing expenses or taxat ion. LIC returns will consequent ly be understated relat ive to the Index return.
NSC seeks to protect investor capital whilst providing a sustainable growing stream of fully
franked dividends and long-term capital growth above the benchmark index. NSC aims to
provide investors with genuine, concentrated exposure to Australian undervalued listed small-
cap companies (market capitalisation generally between $100 million and $1 billion) with an
industrial focus.
NAOS Asset Management became the Manager on 1 December 2017
Premium/(Discount) share price to:
Investment Personnel: Sebastian Evans (Managing Director), Robert Miller, Ben Rundle,
Rachel Folder. Directors: Trevor Carroll (Independent Chairman), David Rickards, Warwick
Evans, Sebastian Evans.
Information as at 30-Jun-19
as at 30-Jun-19
$0.40
$0.55
$0.70
$0.85
$1.00
Sep-18 Dec-18 Mar-19 Jun-19 Sep-19
All Ords Rebased NSC
-30%
-15%
0%
15%
30%
$0.00
$0.30
$0.60
$0.90
$1.20
Dec 17 Mar 18 Jun 18 Sep 18 Dec 18 Mar 19 Jun 19 Sep 19
Prem/Disc (RHS) Pre-Tax NTA (LHS) Share Price (LHS)
IT
Financials
Commercial & Prof essional
Serv ices
Real Estate
Media
Other

LISTED INVESTMENT COMPANIES & TRUSTS. 57
ACORN CAPITAL INVESTMENT FUND (ACQ)Domestic Focused Share Price and NTA Summary
Mandate: Australian listed/unlisted equities Benchmark: S&P/ASX Small Ords Accum as at 30-Sep-19
Manager: Acorn Capital Management Fee: 0.95% p.a Share price $1.08
Listed: May-14 Performance Fee: 20% Outperf. of Benchmark Pre-tax NTA $1.34
Post-tax NTA $1.28
Investment Strategy
Pre-tax NTA -19.2%
Post-tax NTA -15.6%
Historic Dividend (prior 12-mths)
Personnel Dividends (net) $0.0700
Yield 6.5%
Franking 100%
Grossed up yield 9.3%
Key Information
Exposure: International/Domestic, Equities/Fixed Income/Derivatives, Cash
Style: Large/Medium /Small Cap, Balanced/Value/Growth, Passive/Active, Long/Short Ordinary shares 53.0m
Derivatives: n/a. Options/other 0.0m
Cash/Debt: $3.6m cash (30 Sep 2019) Fully diluted 53.0m
Dividend Reinvestment Plan: Yes Market capitalisation 57.3m
Other:
Performance 3-mth 6-mth 1 year 3 yr p.a. 5 yr p.a. 10 yr p.a. ACQ Share Price v ASX All Ords
Share price*
Performance 5.9% 2.4% -8.4% 3.8% 7.5% n/a
Index 3.1% 7.0% 3.9% 8.8% 9.6% 4.5%
Active return 2.8% -4.6% -12.3% -5.0% -2.1% n/a
NTA+
Performance 11.1% 11.8% 4.3% 6.9% 9.6% n/a
Benchmark 3.1% 7.0% 3.9% 8.8% 9.6% 4.5%
Active return 8.0% 4.8% 0.4% -1.9% 0.0% n/a
Share Price and NTA Top 10 Holdings %
as at 30-Sep-19
Telix Pharmaceuticals 9.1
Moula Money Pty Ltd (UL) 6.3
Calix Limited 4.8
Shine Corporate Ltd 3.7
Redbubble Limited 3.4
Zip Co Limited 3.2
Carbon Revolution (UL) 3.2
Innovative Asset Sol. (UL) 2.7
Lifestylepanel (UL) 2.6
Risk/Return Indicators Portfolio Profile Redhill Education Limited 2.2
Sharpe Standard % of Total 41.2
Share price* Ratio Ratio Deviation
Year 1 -1.03 -0.97 10.4%
Year 3 -0.41 0.11 13.5%
Year 5 -0.16 0.33 15.5%
NTA+
Year 1 0.04 0.20 12.6%
Year 3 -0.22 0.40 11.3%
Year 5 0.00 0.52 13.9%
* The share price benchmark has been compared against the S&P/ASX Small Ords Accumulat ion Index. + The NTA has been compared against the
S&P/ASX Small Ords Accumulat ion Index. Pre-tax NTA is NTA after tax excluding tax liability on unrealised gains
*+ M easurement of a LIC’s performance is calculated after all operat ing expenses, provision and payment of both income and realised capital gains tax and the reinvestment of dividends, and do not incorporate franking.
Index returns however are ent irely before any operat ing expenses or taxat ion. LIC returns will consequent ly be understated relat ive to the Index return.
ACQ invests in listed and unlisted microcaps. The Manager believes that through an in-house
research driven investment process, the pricing inefficiencies that exist in both listed and
unlisted microcaps can be exploited to earn returns superior to those available in the broader
market.
Premium/(Discount) share price to:
Investment Personnel: Robert Routley, James Douglas, Matthew Sheehan, Ben Dalling, Rick
Squire, Karina Bader, Robert Bruce, Paul Palumbo & Brian Gan. Directors: Robert Officer
(Chairman), David Bryant, Geraldine Barlow, Barry Fairley & Robert Brown.
Capital Structure
Information
$0.80
$1.00
$1.20
$1.40
$1.60
Sep-18 Dec-18 Mar-19 Jun-19 Sep-19
All Ords Rebased ACQ
Listed Inv estments
Unlisted Inv estments
Cash
-40%
-20%
0%
20%
40%
$0.00
$0.50
$1.00
$1.50
$2.00
2014 2015 2016 2017 2018 2019
Prem/Disc (RHS) Pre-Tax NTA (LHS) Share Price (LHS)

LISTED INVESTMENT COMPANIES & TRUSTS. 58
OZGROWTH (OZG)Domestic Focused Share Price and NTA Summary
Mandate: Australian listed Benchmark: S&P/ASX Small Ords Accum as at 30-Sep-19
Manager: Westoz Funds Management Management Fee: 1.0% p.a. Share price $0.17
Listed: Jan-08 Performance Fee: 20% over 7% Hurdle Rate Pre-tax NTA $0.21
Post-tax NTA $0.21
Investment Strategy
Pre-tax NTA -20.2%
Post-tax NTA -18.7%
Historic Dividend (prior 12-mths)¹
Personnel Dividends (net) $0.0050
Yield 2.9%
Franking 100%
Grossed up yield 4.2%
Key Information ¹Not including special dividends/distribut ions
Exposure: International/Domestic, Equities/Fixed Income/Derivatives, Cash Capital Structure
Style: Large/Medium/Small Cap, Balanced/Value/Growth, Passive/Active, Long/Short Ordinary shares 355.4m
Derivatives: No (allowed but not used). Options/other 0.0m
Cash/Debt: $7.6m cash (30 Sep 2019) Fully diluted 355.4m
Dividend Reinvestment Plan: Yes Market capitalisation 60.4m
Other: Affiliated with Westoz Investment Company (ASX code: WIC).
Performance 3-mth 6-mth 1 year 3 yr p.a. 5 yr p.a. 10 yr p.a. OZG Share Price v ASX All Ords
Share price*
Performance 15.2% 8.0% 0.3% 4.0% 1.8% 6.9%
Index 3.1% 7.0% 3.9% 8.8% 9.6% 4.5%
Active return 12.1% 1.0% -3.6% -4.8% -7.8% 2.4%
NTA+
Performance 10.0% 10.0% -3.4% 4.0% 2.8% 4.1%
Benchmark 3.1% 7.0% 3.9% 8.8% 9.6% 4.5%
Active return 6.9% 3.0% -7.3% -4.8% -6.8% -0.4%
Share Price and NTA Top 10 Holdings %
as at 30-Sep-19
Zenith Energy Limited 7.0
Cedar Woods Properties 7.0
Emerald Resources NL 6.0
Kingsgate Consolidated 6.0
Orecorp Ltd 6.0
SRG Global Ltd 6.0
Macmahon Holdings Ltd 5.0
Finbar Group Ltd 4.0
Carnarvon Petroleum Ltd 4.0
Risk/Return Indicators Sector Exposure (Portfolio) Decmil Group Ltd 4.0
Sharpe Standard % of Total 55.0
Share price* Ratio Ratio Deviation
Year 1 -0.20 -0.08 19.7%
Year 3 -0.30 0.11 15.8%
Year 5 -0.44 -0.03 18.7%
NTA+
Year 1 -0.69 -0.34 15.4%
Year 3 -0.42 0.13 12.7%
Year 5 -0.54 0.02 15.7%
* The share price benchmark has been compared against the S&P/ASX Small Ordinaries Accumulat ion Index. + The NTA has been compared
against the S&P/ASX Small Ordinaries Accumulat ion Index.
*+ M easurement of a LIC’s performance is calculated after all operat ing expenses, provision and payment of both income and realised capital gains tax and the reinvestment of dividends, and do not incorporate franking.
Index returns however are ent irely before any operat ing expenses or taxat ion. LIC returns will consequent ly be understated relat ive to the Index return.
OZG invests in small to medium sized companies, generally with some connection to Western
Australia. The Company’s investment objective is to generate a positive return over the
medium to long-term from an actively managed portfolio and provide shareholders with a
consistent stream of dividends. OZG will hold a concentrated portfolio of securities and a
variable amount of cash. It will also invest in smaller situations (sub $100m market cap) and
consider unlisted opportunities.
Premium/(Discount) share price to:
Key Personnel: Philip Rees, Dermot Woods, Jay Hughes. Directors: Jay Hughes (Chairman),
Simon Joyner, Michael Jefferies.
Information
$0.14
$0.16
$0.18
$0.20
$0.22
Sep-18 Dec-18 Mar-19 Jun-19 Sep-19
All Ords Rebased OZG
Industrials
GoldEnergy
Real Estate
Materials
Cash
-60%
-30%
0%
30%
60%
$0.00
$0.10
$0.20
$0.30
$0.40
2008 2009 2010 2011 2012 2013 2014 2015 2016 2017 2018 2019
Prem/Disc (RHS) Pre-Tax NTA (LHS) Share Price (LHS)

LISTED INVESTMENT COMPANIES & TRUSTS. 59
DJERRIWARRH INVESTMENTS (DJW)Domestic Focused Share Price and NTA Summary
Mandate: Australian listed equities Benchmark: S&P/ASX 200 Accumulation as at 30-Sep-19
Manager: Internal Management Fee: 0.43% Share price $3.52
Listed: 1995 Performance Fee: None Pre-tax NTA $3.27
Investment Strategy Post-tax NTA $3.24
Pre-tax NTA 7.6%
Post-tax NTA 8.6%
Historic Dividend (prior 12-mths)¹
Dividends (net) $0.2000
Personnel Yield 5.7%
Franking 100%
Grossed up yield 8.1%
Key Information ¹Not including special dividends/distribut ions
Exposure: International/Domestic, Equities/Fixed Income/Derivatives, Cash Capital Structure
Style: Large/Medium/Small Cap, Balanced/Value/Growth, Passive/Active, Long/Short Ordinary shares 223.5m
Derivatives: Options typically written on between 20-50% of the Portfolio. Options/other 0.0m
Cash/Debt: $14.6m cash (30 Sep 2019), $110.5m debt (30 Jun 2019) Fully diluted 223.5m
Dividend reinvestment plan: Yes, 2.5% discount to 5 day VWAP post ex-date Market capitalisation 786.8m
Other: Affiliated with AMCIL (AMH), AFIC (AFI) and Mirrabooka (MIR).
Performance 3-mth 6-mth 1 year 3 yr p.a. 5 yr p.a. 10 yr p.a. DJW Share Price v ASX All Ords
Share price*
Performance 5.0% 12.1% 8.9% 5.5% 0.8% 4.4%
Index 2.4% 10.5% 12.5% 11.9% 9.5% 8.1%
Active return 2.6% 1.6% -3.6% -6.4% -8.7% -3.7%
NTA+
Performance 1.9% 7.7% 6.9% 8.1% 5.2% 5.5%
Benchmark 2.4% 10.5% 12.5% 11.9% 9.5% 8.1%
Active return -0.5% -2.8% -5.6% -3.8% -4.3% -2.6%
Share Price and NTA Top 20 Holdings %
as at 30-Sep-19
Commonwealth Bank 8.6
Westpac Banking Corp 7.5
National Australia Bank 6.8
BHP Group 6.3
ANZ Banking Group 5.4
CSL 4.9
Macquarie Group 4.0
Transurban Group 3.7
Wesfarmers 3.0
Risk/Return Indicators Sector Exposure (Top 20) Sydney Airport 2.9
Sharpe Standard Woodside Petroleum 2.6
Share price* Ratio Ratio Deviation Telstra Corporation 2.2
Year 1 -0.34 0.53 13.5% Brambles 2.2
Year 3 -0.56 0.27 11.6% Oil Search 2.0
Year 5 -0.71 -0.13 11.9% Amcor 1.9
NTA+ Woolworths Group 1.9
Year 1 -3.50 0.47 11.0% Ramsay Health Care 1.8
Year 3 -2.27 0.67 8.6% Atlas Arteria 1.6
Year 5 -1.98 0.25 11.0% Rio Tinto 1.5
Scentre Group 1.5
% of Total 72.3
*+ M easurement of a LIC’s performance is calculated after all operat ing expenses, provision and payment of both income and realised capital
gains tax and the reinvestment of dividends, and do not incorporate franking. Index returns however are ent irely before any operat ing expenses or
taxat ion. LIC returns will consequent ly be understated relat ive to the Index return.
* The share price benchmark has been compared against the S&P/ASX 200 Accumulat ion. + The NTA has been compared against the S&P/ASX 200 Accumulat ion.
Premium/(Discount) share price to:
Information
Investment personnel: Mark Freeman (CEO). Directors: John Paterson (Chariman), Alice
Williams, Graham Goldsmith, Kathryn Fagg, Karen Wood, and Robert Edgar.
DJW invests in Australian equities with a focus on stocks where there is an active options
market and/or sustainable dividend yield. The company aims to provide shareholders with
attractive investment returns through an enhanced level of dividends and attractive total returns
over the medium to long term. It takes a medium to longer term view of value which means that
the aim is to buy and hold individual stocks for the long term based on selection criteria which,
in summary, include: formulation and execution of the business strategy and its underlying
business value; and key financial indicators, including prospective price earnings relative to
projected growth, sustainability of earnings and dividend yield (including franking) and balance
sheet position including gearing, interest cover and cash flow.
$2.80
$3.05
$3.30
$3.55
$3.80
Sep-18 Dec-18 Mar-19 Jun-19 Sep-19
All Ords Rebased DJW
Financials
Industrials
Materials
Health Care
Consumer Staples
Other
-60%
-30%
0%
30%
60%
$0.00
$1.50
$3.00
$4.50
$6.00
2004 2005 2006 2007 2008 2009 2010 2011 2012 2013 2014 2015 2016 2017 2018 2019
Prem/Disc (RHS) Pre-Tax NTA (LHS) Share Price (LHS)
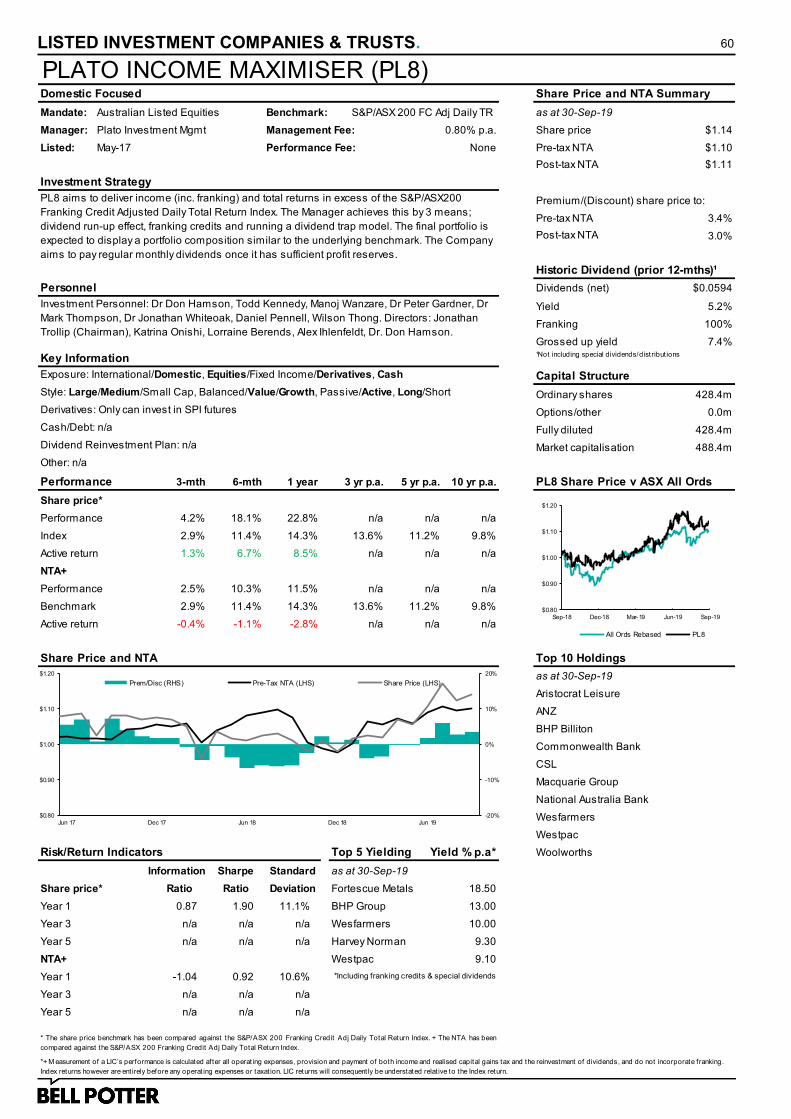
LISTED INVESTMENT COMPANIES & TRUSTS. 60
PLATO INCOME MAXIMISER (PL8)Domestic Focused Share Price and NTA Summary
Mandate: Australian Listed Equities Benchmark: S&P/ASX 200 FC Adj Daily TR as at 30-Sep-19
Manager: Plato Investment Mgmt Management Fee: 0.80% p.a. Share price $1.14
Listed: May-17 Performance Fee: None Pre-tax NTA $1.10
Post-tax NTA $1.11
Investment Strategy
Pre-tax NTA 3.4%
Post-tax NTA 3.0%
Historic Dividend (prior 12-mths)¹
Personnel Dividends (net) $0.0594
Yield 5.2%
Franking 100%
Grossed up yield 7.4%
Key Information ¹Not including special dividends/distribut ions
Exposure: International/Domestic, Equities/Fixed Income/Derivatives, Cash Capital Structure
Style: Large/Medium/Small Cap, Balanced/Value/Growth, Passive/Active, Long/Short Ordinary shares 428.4m
Derivatives: Only can invest in SPI futures Options/other 0.0m
Cash/Debt: n/a Fully diluted 428.4m
Dividend Reinvestment Plan: n/a Market capitalisation 488.4m
Other: n/a
Performance 3-mth 6-mth 1 year 3 yr p.a. 5 yr p.a. 10 yr p.a. PL8 Share Price v ASX All Ords
Share price*
Performance 4.2% 18.1% 22.8% n/a n/a n/a
Index 2.9% 11.4% 14.3% 13.6% 11.2% 9.8%
Active return 1.3% 6.7% 8.5% n/a n/a n/a
NTA+
Performance 2.5% 10.3% 11.5% n/a n/a n/a
Benchmark 2.9% 11.4% 14.3% 13.6% 11.2% 9.8%
Active return -0.4% -1.1% -2.8% n/a n/a n/a
Share Price and NTA Top 10 Holdings
as at 30-Sep-19
Aristocrat Leisure
ANZ
BHP Billiton
Commonwealth Bank
CSL
Macquarie Group
National Australia Bank
Wesfarmers
Westpac
Risk/Return Indicators Top 5 Yielding Yield % p.a* Woolworths
Sharpe Standard
Share price* Ratio Ratio Deviation Fortescue Metals 18.50
Year 1 0.87 1.90 11.1% BHP Group 13.00
Year 3 n/a n/a n/a Wesfarmers 10.00
Year 5 n/a n/a n/a Harvey Norman 9.30
NTA+ Westpac 9.10
Year 1 -1.04 0.92 10.6% *Including franking credits & special dividends
Year 3 n/a n/a n/a
Year 5 n/a n/a n/a
* The share price benchmark has been compared against the S&P/ASX 200 Franking Credit Adj Daily Total Return Index. + The NTA has been
compared against the S&P/ASX 200 Franking Credit Adj Daily Total Return Index.
*+ M easurement of a LIC’s performance is calculated after all operat ing expenses, provision and payment of both income and realised capital gains tax and the reinvestment of dividends, and do not incorporate franking.
Index returns however are ent irely before any operat ing expenses or taxat ion. LIC returns will consequent ly be understated relat ive to the Index return.
PL8 aims to deliver income (inc. franking) and total returns in excess of the S&P/ASX200
Franking Credit Adjusted Daily Total Return Index. The Manager achieves this by 3 means;
dividend run-up effect, franking credits and running a dividend trap model. The final portfolio is
expected to display a portfolio composition similar to the underlying benchmark. The Company
aims to pay regular monthly dividends once it has sufficient profit reserves.
Premium/(Discount) share price to:
Investment Personnel: Dr Don Hamson, Todd Kennedy, Manoj Wanzare, Dr Peter Gardner, Dr
Mark Thompson, Dr Jonathan Whiteoak, Daniel Pennell, Wilson Thong. Directors: Jonathan
Trollip (Chairman), Katrina Onishi, Lorraine Berends, Alex Ihlenfeldt, Dr. Don Hamson.
Information as at 30-Sep-19
$0.80
$0.90
$1.00
$1.10
$1.20
Sep-18 Dec-18 Mar-19 Jun-19 Sep-19
All Ords Rebased PL8
-20%
-10%
0%
10%
20%
$0.80
$0.90
$1.00
$1.10
$1.20
Jun 17 Dec 17 Jun 18 Dec 18 Jun 19
Prem/Disc (RHS) Pre-Tax NTA (LHS) Share Price (LHS)

LISTED INVESTMENT COMPANIES & TRUSTS. 61
SANDON CAPITAL INVESTMENTS (SNC)Domestic Focused Share Price and NTA Summary
Mandate: Australian listed Benchmark: BBSW 1 Month Rate as at 30-Sep-19
Manager: Sandon Capital Management Fee: 1.25% p.a. Share price $0.84
Listed: Dec-13 Performance Fee: 20% Outperf. of Benchmark Pre-tax NTA $0.97
s.t. High Water Mark Post-tax NTA $0.95
Investment Strategy
Pre-tax NTA -13.5%
Post-tax NTA -11.9%
Historic Dividend (prior 12-mths)¹
Personnel Dividends (net) $0.0700
Yield 8.4%
Franking 100%
Grossed up yield 11.6%
Key Information ¹Not including special dividends/distribut ions
Exposure: International/Domestic, Equities/Fixed Income/Derivatives, Cash Capital Structure
Style: Large/Medium/Small Cap, Balanced/Value/Growth, Passive/Active, Long/Short Ordinary shares 106.8m
Derivatives: No derivatives currently employed Options/other 0.0m
Cash/Debt: $6m (30 Sep 2019) Cash and Cash Equivalents Fully diluted 106.8m
Dividend reinvestment plan: No Market capitalisation 89.2m
Other: na
Performance 3-mth 6-mth 1 year 3 yr p.a. 5 yr p.a. 10 yr p.a. SNC Share Price v ASX All Ords
Share price*
Performance 1.2% -1.1% -6.8% 5.2% 4.4% n/a
Index 2.8% 10.9% 12.1% 11.7% 9.7% 8.2%
Active return -1.6% -12.0% -18.9% -6.5% -5.3% n/a
NTA+
Performance 6.9% 5.4% -1.3% 5.7% 6.0% n/a
Benchmark 0.3% 0.6% 1.6% 1.7% 1.9% 2.8%
Active return 6.6% 4.8% -2.9% 4.0% 4.1% n/a
Share Price and NTA Top 15 Holdings %
as at 30-Sep-19
Fleetwood Corporation Ltd 8.9
Ingenia Communities 8.7
Spectra Systems plc 7.5
Consolidated Operations 5.5
Coventry Group Ltd 4.3
% of Total 34.9
Risk/Return Indicators Investment Portfolio
Sharpe Standard
Share price* Ratio Ratio Deviation
Year 1 -2.04 -0.76 11.3%
Year 3 -0.55 0.23 12.3%
Year 5 -0.40 0.16 12.2%
NTA+
Year 1 -0.24 -0.25 12.0%
Year 3 0.42 0.35 9.6%
Year 5 0.46 0.39 9.1%
* The share price benchmark has been compared against the S&P/ASX All Ordinaries Accumulat ion Index. + The NTA has been compared against
the BBSW 1 M onth Rate.
*+ M easurement of a LIC’s performance is calculated after all operat ing expenses, provision and payment of both income and realised capital gains tax and the reinvestment of dividends, and do not incorporate franking.
Index returns however are ent irely before any operat ing expenses or taxat ion. LIC returns will consequent ly be understated relat ive to the Index return.
The company’s investment philosophy is to build a concentrated portfolio of undervalued
securities where the manager believes that there are opportunities to encourage change to
unlock the securities’ intrinsic value. SNC will aim to deliver an absolute positive return over the
medium to long term while preserving capital and providing growth.
Premium/(Discount) share price to:
Investment Personnel: Gabriel Radzyminski (Managing Director), Campbell Morgan.
Directors: Gabriel Radzyminski (Chairman), Peter Velez, Melinda Snowden & Sir Ron Brierley.
Information
$0.75
$0.85
$0.95
$1.05
$1.15
Sep-18 Dec-18 Mar-19 Jun-19 Sep-19
All Ords Rebased SNC
Listed Australian
Equity
Listed International
Equity
Unlisted Inv estments
Cash
-20%
-10%
0%
10%
20%
$0.00
$0.35
$0.70
$1.05
$1.40
Dec 13 Jun 14 Dec 14 Jun 15 Dec 15 Jun 16 Dec 16 Jun 17 Dec 17 Jun 18 Dec 18 Jun 19
Prem/Disc (RHS) Pre-Tax NTA (LHS) Share Price (LHS)

LISTED INVESTMENT COMPANIES & TRUSTS. 62
FUTURE GENERATION INVESTMENT CO (FGX)Domestic Focused Share Price and NTA Summary
Mandate: Fund of funds Benchmark: All Ordinaries Accumulation as at 30-Sep-19
Manager: Future Gen Investment Fund Annual Donation: 1.0% p.a. Share price $1.14
Listed: Sep-14 +The company does not charge a management fee or performance fee Pre-tax NTA $1.27
Post-tax NTA $1.24
Investment Strategy
Pre-tax NTA -10.4%
Post-tax NTA -8.4%
Historic Dividend (prior 12-mths)¹
Personnel Dividends (net) $0.0470
Yield 4.1%
Franking 100%
Grossed up yield 5.9%
Key Information ¹Not including special dividends/distribut ions
Exposure: International/Domestic, Equities/Fixed Income/Derivatives/Managed Funds, Cash Capital Structure
Style: Large/Medium/Small Cap, Balanced/Value/Growth, Passive/Active, Long/Short Ordinary shares 398.2m
Derivatives: Used for arbitrage and in anticipation of a decline in the market value of that security. Options/other 0.0m
Cash/Debt: $62m cash (30 Sep 2019) Fully diluted 398.2m
Dividend Reinvestment Plan: Yes, 2.5% discount to 4 day VWAP from (and including) ex-date Market capitalisation 454.0m
Other: Lieu of mgmt/perf. fees, a yearly donation of 1.0% of its NTA to support 'children at risk' charities.
Performance 3-mth 6-mth 1 year 3 yr p.a. 5 yr p.a. 10 yr p.a. FGX Share Price v ASX All Ords
Share price*
Performance -2.6% -3.9% -11.3% 3.5% 5.1% n/a
Index 2.8% 10.9% 12.1% 11.7% 9.7% 8.2%
Active return -5.4% -14.8% -23.4% -8.2% -4.6% n/a
NTA+
Performance 3.8% 8.2% 3.7% 6.6% 6.7% n/a
Benchmark 2.8% 10.9% 12.1% 11.7% 9.7% 8.2%
Active return 1.0% -2.7% -8.4% -5.1% -3.0% n/a
Share Price and NTA Fund Manager Allocations %
as at 30-Sep-19
Regal Funds 11.4
Bennelong Aus Equity 11.4
Paradice Investment 10.9
Eley Griffiths Group 6.8
Wilson Asset Management 6.0
Cooper Investors 5.3
L1 Capital 4.9
Sandon Capital 4.4
Watermark Funds 4.1
Risk/Return Indicators Sector Exposure (Portfolio) Firetrail Investments 3.7
Sharpe Standard Bennelong Long Short 3.1
Share price* Ratio Ratio Deviation CBG Asset Management 2.6
Year 1 -3.06 -1.17 11.2% Vinva Investment 2.5
Year 3 -1.01 0.13 8.8% LHC Capital 2.3
Year 5 -0.47 0.32 8.4% Tribeca Investment 2.3
NTA+ Centennial Asset Man. 1.5
Year 1 -2.54 0.18 10.6% Smallco Investment 1.5
Year 3 -1.22 0.61 7.0% QVG Capital 1.3
Year 5 -0.53 0.58 7.4% Lanyon Asset Mangement 1.0
% of Total 87.0* The share price benchmark has been compared against the S&P/ASX All Ordinaries Accumulat ion Index. + The NTA has been compared against
the S&P/ASX All Ordinaries Accumulat ion Index.
*+ M easurement of a LIC’s performance is calculated after all operat ing expenses, provision and payment of both income and realised capital gains tax and the reinvestment of dividends, and do not incorporate franking.
Index returns however are ent irely before any operat ing expenses or taxat ion. LIC returns will consequent ly be understated relat ive to the Index return.
FGX will invest in a portfolio of funds that are largely investing in Australian equities. The vehicle
will aim to provide a stream of fully franked dividends, achieve capital growth and to preserve
capital. The managers are able to invest in any asset class and utilise any investment strategy
in line with their investment mandate. Mandates include large-small cap, broad cap, deep
value, active extension, absolute return and activism. The composition of the portfolio will vary
over time, and the maximum allocation to a fund manager will be 20% of capital.
Premium/(Discount) share price to:
Investment Personnel: Geoff Wilson, Bruce Tomlinson, David Smythe, Gabriel Radzyminski,
Matthew Kidman & John Coombe. Directors: Jonathan Trollip, Geoff Wilson, David Leeton,
David Paradice, Gabriel Radzyminski, Kate Thorley, Caroline Gurney & Stephanie Lai.
Information
$1.00
$1.15
$1.30
$1.45
$1.60
Sep-18 Dec-18 Mar-19 Jun-19 Sep-19
All Ords Rebased FGX
Long Equities
Absolute Bias
Market Neutral
Cash
-20%
-10%
0%
10%
20%
$0.50
$0.75
$1.00
$1.25
$1.50
2014 2015 2016 2017 2018 2019
Prem/Disc (RHS) Pre-Tax NTA (LHS) Share Price (LHS)
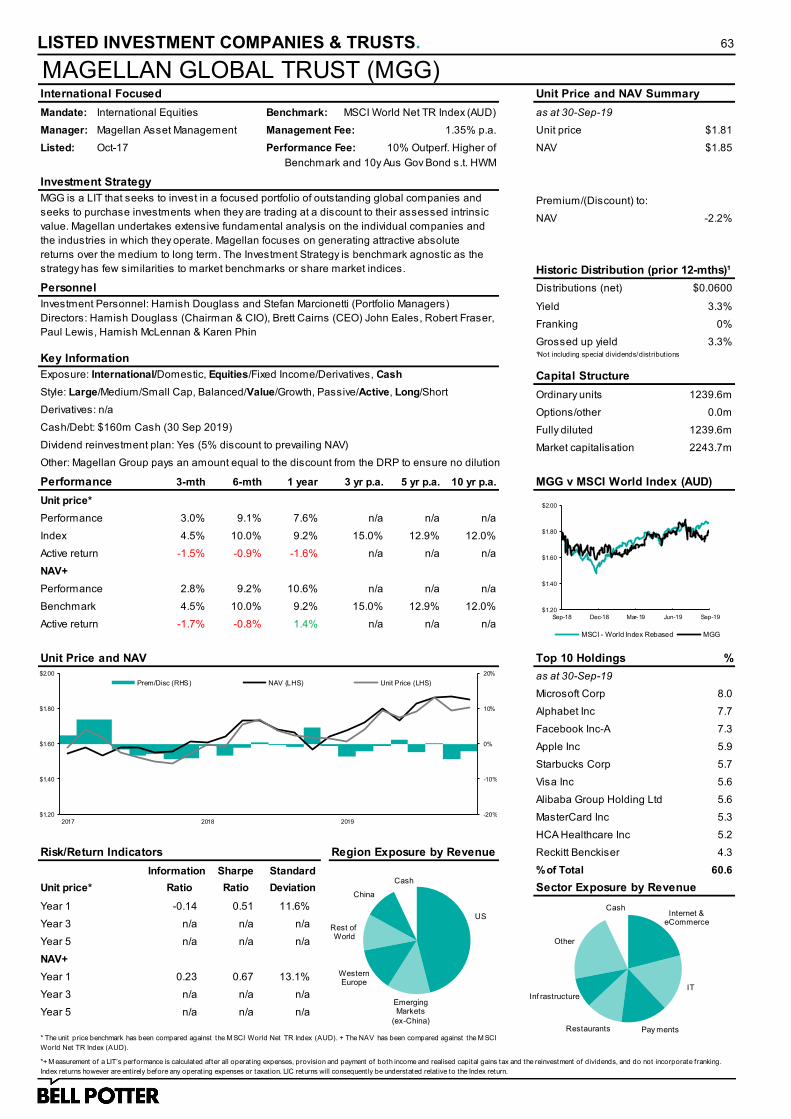
LISTED INVESTMENT COMPANIES & TRUSTS. 63
MAGELLAN GLOBAL TRUST (MGG)International Focused Unit Price and NAV Summary
Mandate: International Equities Benchmark: MSCI World Net TR Index (AUD) as at 30-Sep-19
Manager: Magellan Asset Management Management Fee: 1.35% p.a. Unit price $1.81
Listed: Oct-17 Performance Fee: 10% Outperf. Higher of NAV $1.85
Benchmark and 10y Aus Gov Bond s.t. HWM
Investment Strategy
NAV -2.2%
Historic Distribution (prior 12-mths)¹
Personnel Distributions (net) $0.0600
Yield 3.3%
Franking 0%
Grossed up yield 3.3%
Key Information ¹Not including special dividends/distribut ions
Exposure: International/Domestic, Equities/Fixed Income/Derivatives, Cash Capital Structure
Style: Large/Medium/Small Cap, Balanced/Value/Growth, Passive/Active, Long/Short Ordinary units 1239.6m
Derivatives: n/a Options/other 0.0m
Cash/Debt: $160m Cash (30 Sep 2019) Fully diluted 1239.6m
Dividend reinvestment plan: Yes (5% discount to prevailing NAV) Market capitalisation 2243.7m
Other: Magellan Group pays an amount equal to the discount from the DRP to ensure no dilution
Performance 3-mth 6-mth 1 year 3 yr p.a. 5 yr p.a. 10 yr p.a. MGG v MSCI World Index (AUD)
Unit price*
Performance 3.0% 9.1% 7.6% n/a n/a n/a
Index 4.5% 10.0% 9.2% 15.0% 12.9% 12.0%
Active return -1.5% -0.9% -1.6% n/a n/a n/a
NAV+
Performance 2.8% 9.2% 10.6% n/a n/a n/a
Benchmark 4.5% 10.0% 9.2% 15.0% 12.9% 12.0%
Active return -1.7% -0.8% 1.4% n/a n/a n/a
Unit Price and NAV Top 10 Holdings %
as at 30-Sep-19
Microsoft Corp 8.0
Alphabet Inc 7.7
Facebook Inc-A 7.3
Apple Inc 5.9
Starbucks Corp 5.7
Visa Inc 5.6
Alibaba Group Holding Ltd 5.6
MasterCard Inc 5.3
HCA Healthcare Inc 5.2
Risk/Return Indicators Region Exposure by Revenue Reckitt Benckiser 4.3
Sharpe Standard % of Total 60.6
Unit price* Ratio Ratio Deviation Sector Exposure by Revenue
Year 1 -0.14 0.51 11.6%
Year 3 n/a n/a n/a
Year 5 n/a n/a n/a
NAV+
Year 1 0.23 0.67 13.1%
Year 3 n/a n/a n/a
Year 5 n/a n/a n/a
* The unit price benchmark has been compared against the M SCI World Net TR Index (AUD). + The NAV has been compared against the M SCI
World Net TR Index (AUD).
*+ M easurement of a LIT’s performance is calculated after all operat ing expenses, provision and payment of both income and realised capital gains tax and the reinvestment of dividends, and do not incorporate franking.
Index returns however are ent irely before any operat ing expenses or taxat ion. LIC returns will consequent ly be understated relat ive to the Index return.
MGG is a LIT that seeks to invest in a focused portfolio of outstanding global companies and
seeks to purchase investments when they are trading at a discount to their assessed intrinsic
value. Magellan undertakes extensive fundamental analysis on the individual companies and
the industries in which they operate. Magellan focuses on generating attractive absolute
returns over the medium to long term. The Investment Strategy is benchmark agnostic as the
strategy has few similarities to market benchmarks or share market indices.
Premium/(Discount) to:
Investment Personnel: Hamish Douglass and Stefan Marcionetti (Portfolio Managers)
Directors: Hamish Douglass (Chairman & CIO), Brett Cairns (CEO) John Eales, Robert Fraser,
Paul Lewis, Hamish McLennan & Karen Phin
Information
$1.20
$1.40
$1.60
$1.80
$2.00
Sep-18 Dec-18 Mar-19 Jun-19 Sep-19
MSCI - World Index Rebased MGG
US
Emerging Markets
(ex-China)
Western Europe
Rest of World
China
Cash
-20%
-10%
0%
10%
20%
$1.20
$1.40
$1.60
$1.80
$2.00
2017 2018 2019
Prem/Disc (RHS) NAV (LHS) Unit Price (LHS)
Internet & eCommerce
IT
Pay mentsRestaurants
Inf rastructure
Other
Cash

LISTED INVESTMENT COMPANIES & TRUSTS. 64
MFF CAPITAL INVESTMENTS (MFF)International Focused Share Price and NTA Summary
Mandate: International Equities Benchmark: MSCI World Index (AUD) as at 30-Sep-19
Manager: MFF Capital Investments Ltd Management Fee: $4m p.a. Share price $3.17
Listed: 2006 Performance Fee: $1m p.a. over 10% Hurdle Pre-tax NTA $3.46
Performance Fee will cease at the period ending Dec 2019 Post-tax NTA $2.83
Investment Strategy
Pre-tax NTA -8.2%
Post-tax NTA 11.9%
Historic Dividend (prior 12-mths)¹
Personnel Dividends (net) $0.0350
Yield 1.1%
Franking 100%
Grossed up yield 1.6%
Key Information ¹Not including special dividends/distribut ions
Exposure: International/Domestic, Equities/Fixed Income/Derivatives, Cash Capital Structure
Style: Large/Medium/Small Cap, Balanced/Value/Growth, Passive/Active, Long/Short Ordinary shares 542.1m
Derivatives: n/a Options/other 0.0m
Cash/Debt: ~$33.7m Net Debt (30 Sep 2019) Fully diluted 542.1m
Dividend reinvestment plan: Yes Market capitalisation 1718.4m
Other: Magellan Asset Management (MAM) provides investment research and admin services
Performance 3-mth 6-mth 1 year 3 yr p.a. 5 yr p.a. 10 yr p.a. MFF v MSCI World Index (AUD)
Share price*
Performance 9.3% 13.0% 12.0% 23.7% 18.1% 20.1%
Index 4.5% 10.0% 9.2% 15.0% 12.9% 12.0%
Active return 4.8% 3.0% 2.8% 8.7% 5.2% 8.1%
NTA+
Performance 7.1% 15.1% 14.0% 22.0% 18.4% 18.9%
Benchmark 4.5% 10.0% 9.2% 15.0% 12.9% 12.0%
Active return 2.6% 5.1% 4.8% 7.0% 5.5% 6.9%
Share Price and NTA Top 20 Holdings %
as at 30-Sep-19
Visa 15.8
MasterCard 15.6
Home Depot 11.2
Bank of America 8.3
JP Morgan Chase 7.0
Alphabet 6.6
Lowe's 4.2
Wells Fargo 3.8
HCA Healthcare 3.5
Risk/Return Indicators Country Exposure (Top 20) US Bancorp 3.5
Sharpe Standard S&P Global 3.1
Share price* Ratio Ratio Deviation CVS Health 2.8
Year 1 0.29 0.66 15.6% Lloyds Banking Group 2.3
Year 3 0.84 1.46 14.6% Blackrock 2.1
Year 5 0.40 0.95 16.5% DBS Group 1.8
NTA+ United Overseas Bank 1.8
Year 1 0.86 0.72 16.9% Oversea Chinese Banking 1.4
Year 3 1.19 1.55 12.7% Microsoft 1.2
Year 5 0.78 1.13 14.1% Facebook 0.9
Capitaland 0.8
% of Total 97.7* The share price benchmark has been compared against the M SCI World price index in AUD. + The NTA has been compared against the M SCI
World price index in AUD.
*+ M easurement of a LIC’s performance is calculated after all operat ing expenses, provision and payment of both income and realised capital gains tax and the reinvestment of dividends, and do not incorporate franking.
Index and Trusts report before any operat ing expenses or taxat ion. LIC returns will be relat ively understated and as they pay tax at the corporate level this should be added back for a comparison with Index and Trusts.
The primary focus of the portfolio is to invest in large listed international companies that have
attractive business characteristics at a discount to their assessed intrinsic values. The
Directors believe that this will generate superior risk adjusted returns over the medium to long
term, while minimising the risk of permanent capital loss. MFF’s capital structure can be
reviewed and timely changed in the event market conditions present more attractive investment
opportunities, with the potential shift in focus away from predominately large cap securities.
Premium/(Discount) share price to:
Investment Personnel: Chris Mackay (MD & Portfolio Manager) & Marcia Venegas (Company
Secretary). Directors: Annabelle Chaplain (Chairman), John Ballard, Robert Fraser, Andy
Hogendijk, Peter Montgomery & Chris Mackay.
Information
$2.20
$2.50
$2.80
$3.10
$3.40
Sep-18 Dec-18 Mar-19 Jun-19 Sep-19
MSCI - World Index Rebased MFF
United States
Singapore UK
-50%
-25%
0%
25%
50%
$0.00
$0.90
$1.80
$2.70
$3.60
2007 2008 2009 2010 2011 2012 2013 2014 2015 2016 2017 2018 2019
Prem/Disc (RHS) Pre-Tax NTA (LHS) Share Price (LHS)

LISTED INVESTMENT COMPANIES & TRUSTS. 65
WAM GLOBAL LIMITED (WGB)International Focused Share Price and NTA Summary
Mandate: International equities Benchmark: MSCI World Index (AUD) as at 30-Sep-19
Manager: Wilson Asset Management Management Fee: 1.25% p.a. Share price $2.15
Listed: Jun-18 Performance Fee: 20% Outperf. of Benchmark Pre-tax NTA $2.42
Post-tax NTA $2.36
Investment Strategy
Pre-tax NTA -11.2%
Post-tax NTA -8.7%
Historic Dividend (prior 12-mths)¹
Personnel Dividends (net) $0.0200
Yield 0.9%
Franking 100%
Grossed up yield 1.3%
Key Information ¹Not including special dividends/distribut ions
Exposure: International/Domestic, Equities/Fixed Income/Derivatives, Cash Capital Structure
Style: Large/Medium/Small Cap, Balanced/Value/Growth, Passive/Active, Long/Short Ordinary shares 211.8m
Derivatives: Options/other 0.0m
Cash & Fixed Interest/Debt: $51m Cash & Fixed Interest (30 Sep 2019) Fully diluted 211.8m
Dividend reinvestment plan: n/a Market capitalisation 455.5m
Other: Affiliated with Wilson Asset Management
Performance 3-mth 6-mth 1 year 3 yr p.a. 5 yr p.a. 10 yr p.a. WGB v MSCI World Index (AUD)
Share price*
Performance 9.1% 10.8% -1.4% n/a n/a n/a
Index 4.5% 10.0% 9.2% 15.0% 12.9% 12.0%
Active return 4.6% 0.8% -10.6% n/a n/a n/a
NTA+
Performance 3.2% 8.7% 7.4% n/a n/a n/a
Benchmark 4.5% 10.0% 9.2% 15.0% 12.9% 12.0%
Active return -1.3% -1.3% -1.8% n/a n/a n/a
Share Price and NTA Top 20 Holdings %
as at 30-Sep-19
Kobe Bussan Co., Ltd
Bandai Namco Holdings Inc
Airbus SE
Aon plc
American Express Company
Danone S.A.
CDW Corporation
CME Group Inc
Deutsche Boerse AG Ordinary Shares
Risk/Return Indicators Portfolio Composition Entertainment One Ltd
Sharpe Standard CTS Eventim AG & Co KGaA
Share price* Ratio Ratio Deviation HCA Healthcare Inc
Year 1 -0.61 -0.22 14.1% IHS Markit Ltd
Year 3 n/a n/a n/a L3Harris Technologies Inc
Year 5 n/a n/a n/a Logitech International SA
NTA+ Nomad Foods Ltd
Year 1 -0.28 0.55 10.2% Thermo Fisher Scientific Inc.
Year 3 n/a n/a n/a Ubisoft Entertainment SA
Year 5 n/a n/a n/a Ulta Beauty Inc
Waste Management, Inc.* The share price benchmark has been compared against the M SCI World Accumulat ion Index (AUD). + The NTA has been compared against the
M SCI World Accumulat ion Index (AUD).
*+ M easurement of a LIC’s performance is calculated after all operat ing expenses, provision and payment of both income and realised capital gains tax and the reinvestment of dividends, and do not incorporate franking.
Index returns however are ent irely before any operat ing expenses or taxat ion. LIC returns will consequent ly be understated relat ive to the Index return.
WGB aims to provide exposure to international undervalued growth companies identified using
the Manager’s proven research-driven and market-driven investment processes . The research-
driven investment process involves extensive research, focusing on free cash flow, return on
equity and the quality of the potential investee company. Each company is rated with respect to
management, earnings growth potential, valuation and industry position. The process takes
advantage of short-term relative arbitrages and mispricing in global equity markets.
Premium/(Discount) share price to:
Investment Personnel: Geoff Wilson, Catriona Burns, Matt Haupt, Oscar Oberg, Adrian Siew,
Tobias Yao, John Ayoub, Nick Healy, Sam Koch, Cooper Rogers & Tyler McKay.
Directors: Geoff Wilson, Kate Thorley, Gabrielle Trainor & Caesar Bryan.
Information
$1.50
$1.75
$2.00
$2.25
$2.50
Sep-18 Dec-18 Mar-19 Jun-19 Sep-19
MSCI - World Index Rebased WGB
US
France
Germany
Japan
UK
Other
Cash
-20%
-10%
0%
10%
20%
$1.20
$1.60
$2.00
$2.40
$2.80
Jun 18 Jul 18 Aug 18 Sep 18 Oct 18 Nov 18 Dec 18 Jan 19 Feb 19 Mar 19 Apr 19 May 19 Jun 19 Jul 19 Aug 19 Sep 19
Prem/Disc (RHS) Pre-Tax NTA (LHS) Share Price (LHS)

LISTED INVESTMENT COMPANIES & TRUSTS. 66
PLATINUM CAPITAL (PMC)International Focused Share Price and NTA Summary
Mandate: Global Listed Equities Benchmark: MSCI ACWI Net Index (AUD) as at 30-Sep-19
Manager: Platinum Asset Management Management Fee: 1.1% p.a. Share price $1.5450
Listed: 1994 Performance Fee: 15% Outperf. of Benchmark Pre-tax NTA $1.5709
Post-tax NTA $1.5193
Investment Strategy
Pre-tax NTA -1.6%
Post-tax NTA 1.7%
Historic Dividend (prior 12-mths)¹
Personnel Dividends (net) $0.0700
Yield 4.5%
Franking 100%
Grossed up yield 6.5%
Key Information ¹Not including special dividends/distribut ions
Exposure: International/Domestic, Equities/Fixed Income/Derivatives, Cash Capital Structure
Style: Large/Medium/Small Cap, Balanced/Value/Growth, Passive/Active, Long/Short Ordinary shares 289.6m
Derivatives: Yes Options/other 0.0m
Cash/Debt: $50m Cash (30 Sep 2019) Fully diluted 289.6m
Dividend reinvestment plan:Yes, 2.5% discount to 5 day VWAP subsequent to cum-dividend date Market capitalisation 447.4m
Other: n/a
Performance 3-mth 6-mth 1 year 3 yr p.a. 5 yr p.a. 10 yr p.a. PMC v MSCI World Index (AUD)
Share price*
Performance 1.4% -2.1% -11.9% 6.9% 2.4% 3.8%
Index 3.9% 8.9% 8.7% 14.5% 12.3% 11.3%
Active return -2.5% -11.0% -20.6% -7.6% -9.9% -7.5%
NTA+
Performance 2.8% 3.5% 0.5% 8.3% 5.2% 6.8%
Benchmark 3.9% 8.9% 8.7% 14.5% 12.3% 11.3%
Active return -1.1% -5.4% -8.2% -6.2% -7.1% -4.5%
Share Price and NTA Top 10 Holdings %
as at 30-Sep-19
Samsung Electronics 3.9
Ping An Insurance 3.9
Glencore plc 2.8
Facebook Inc 2.8
Alphabet Inc 2.7
ZTO Express Inc ADR 2.5
Bharti Airtel Ltd 2.4
TechnipFMC Ltd 2.4
PICC Prop & Casualty 2.3
Risk/Return Indicators Net Sector Exposure Intel Corp 2.2
Sharpe Standard % of Total 27.9
Share price* Ratio Ratio Deviation
Year 1 -1.50 -1.36 10.1% Region Exposure
Year 3 -0.52 0.38 12.0%
Year 5 -0.70 0.00 12.2%
NTA+
Year 1 -1.93 -0.10 12.6%
Year 3 -1.06 0.64 9.3%
Year 5 -1.23 0.28 10.0%
* The share price benchmark has been compared against the M SCI All Country World Net Index (AUD). + The NTA has been compared against
the M SCI All Country World Net Index (AUD).
*+ M easurement of a LIC’s performance is calculated after all operat ing expenses, provision and payment of both income and realised capital gains tax and the reinvestment of dividends, and do not incorporate franking.
Index returns however are ent irely before any operat ing expenses or taxat ion. LIC returns will consequent ly be understated relat ive to the Index return.
PMC utilises a bottom-up, stock selection methodology and is focused on absolute returns
over returns relative to any index. Investments may be in global equities, perceived by the
Manager as being incorrectly valued by the market. This is combined with screening software
that allows the Company to select stocks for further evaluation based on a specific criteria, as
determined by the Manager’s hypothesis regarding social, political or economic change.
These factors are intended to bring together a portfolio of stocks with a below average risk.
Premium/(Discount) share price to:
Investment Personnel: Andrew Clifford (Portfolio Manager).
Directors: Margaret Towers (Chair), Jim Clegg, Richard Morath, Joanne Jefferies (Company
Secretary)
Information
$1.20
$1.45
$1.70
$1.95
$2.20
Sep-18 Dec-18 Mar-19 Jun-19 Sep-19
MSCI - World Index Rebased PMC
Financials
Materials
Industrials
Comm. Serv ices
IT
Other
Cash
-60%
-30%
0%
30%
60%
$0.00
$0.75
$1.50
$2.25
$3.00
2004 2005 2006 2007 2008 2009 2010 2011 2012 2013 2014 2015 2016 2017 2018 2019
Prem/Disc (RHS) Pre-Tax NTA (LHS) Share Price (LHS)
Shorts
Cash
Africa
South America
Australia
Japan
Europe
North America
Asia
-20% 0% 20% 40%

LISTED INVESTMENT COMPANIES & TRUSTS. 67
PM CAPITAL GLOBAL OPPORTUNITIES (PGF)International Focused Share Price and NTA Summary
Mandate: International Equities Benchmark: MSCI World Index (AUD) as at 30-Sep-19
Manager: PM Capital Management Fee: 1.0% p.a. Share price $1.07
Listed: Dec-13 Performance Fee: 15% Outperf. of Benchmark Pre-tax NTA $1.33
Post-tax NTA $1.26
Investment Strategy
Pre-tax NTA -19.8%
Post-tax NTA -15.3%
Historic Dividend (prior 12-mths)¹
Personnel Dividends (net) $0.0380
Yield 3.6%
Franking 100%
Grossed up yield 5.1%
Key Information ¹Not including special dividends/distribut ions
Exposure: International/Domestic, Equities/Fixed Income/Derivatives, Cash Capital Structure
Style: Large/Medium/Small Cap, Balanced/Value/Growth, Passive/Active, Long/Short Ordinary shares 353.0m
Derivatives: The Manager actively manages currency exposure Options/other 0.0m
Cash/Debt: n/a Fully diluted 353.0m
Dividend Reinvestment Plan: Yes Market capitalisation 377.7m
Other: Ability to short sell. Max net invested position is 130% of the portfolio's net market value.
Performance 3-mth 6-mth 1 year 3 yr p.a. 5 yr p.a. 10 yr p.a. PGF v MSCI World Index (AUD)
Share price*
Performance -0.5% -4.0% -14.5% 11.5% 4.8% n/a
Index 4.6% 9.9% 8.9% 15.0% 12.9% 12.0%
Active return -5.1% -13.9% -23.4% -3.5% -8.1% n/a
NTA+
Performance 2.8% 6.8% 0.9% 13.8% 7.6% n/a
Benchmark 4.6% 9.9% 8.9% 15.0% 12.9% 12.0%
Active return -1.8% -3.1% -8.0% -1.2% -5.3% n/a
Share Price and NTA Stock Example
as at 30-Sep-19
Howard Hughes Corporation
Cairn Homes
Bank of America
Alphabet
MGM China Holdings
KKR & Co L.P.
Freeport-McMoRan Copper
Risk/Return Indicators Domicile of Business (%) Portfolio Investment Weighting (%)
Sharpe Standard
Share price* Ratio Ratio Deviation
Year 1 -1.84 -0.92 17.7%
Year 3 -0.30 0.65 14.0%
Year 5 -0.74 0.15 15.3%
NTA+
Year 1 -1.08 -0.05 17.4%
Year 3 -0.17 0.89 12.9%
Year 5 -0.65 0.33 15.5%
* The share price benchmark has been compared against the M SCI World Accum Index in AUD. + The NTA has been compared against the M SCI
World Accum Index in AUD.
*+ M easurement of a LIC’s performance is calculated after all operat ing expenses, provision and payment of both income and realised capital gains tax and the reinvestment of dividends, and do not incorporate franking.
Index returns however are ent irely before any operat ing expenses or taxat ion. LIC returns will consequent ly be understated relat ive to the Index return.
PGF offers investors a diversified portfolio of around 40 listed global (including Australia)
equities, with an objective to provide long term capital growth to investors. The Manager utilises
a fundamental bottom-up, research intensive investment process, investing in a portfolio of
global companies which the Manager views as undervalued. Also note, PGF invests on a long
term basis with at least 7 year time horizon.
Premium/(Discount) share price to:
Investment Personnel: Paul Moore (CIO), Kevin Bertoli, Jarod Dawson, John Whelan, Doug
Huey, Uday Cheruvu, Clement Tseung, Annabelle Symons, Alex Wannaar. Directors: Andrew
McGill (Chairman), Brett Spork, Ben Skilbeck
Information
$1.00
$1.15
$1.30
$1.45
$1.60
Sep-18 Dec-18 Mar-19 Jun-19 Sep-19
MSCI - World Index Rebased PGF
Europe
North America
Asia (ex-Japan)
UK
Other
Short Equities
Materials
Gaming - Macau
GFC Euro Prop. Recovery
Other
GFC US House Recovery
Service Monopol ies
Alt. Invest. Managers
Global Domestic Banking
-20% 0% 20% 40%
-30%
-15%
0%
15%
30%
$0.00
$0.45
$0.90
$1.35
$1.80
2013 2014 2015 2016 2017 2018 2019
Prem/Disc (RHS) Pre-Tax NTA (LHS) Share Price (LHS)
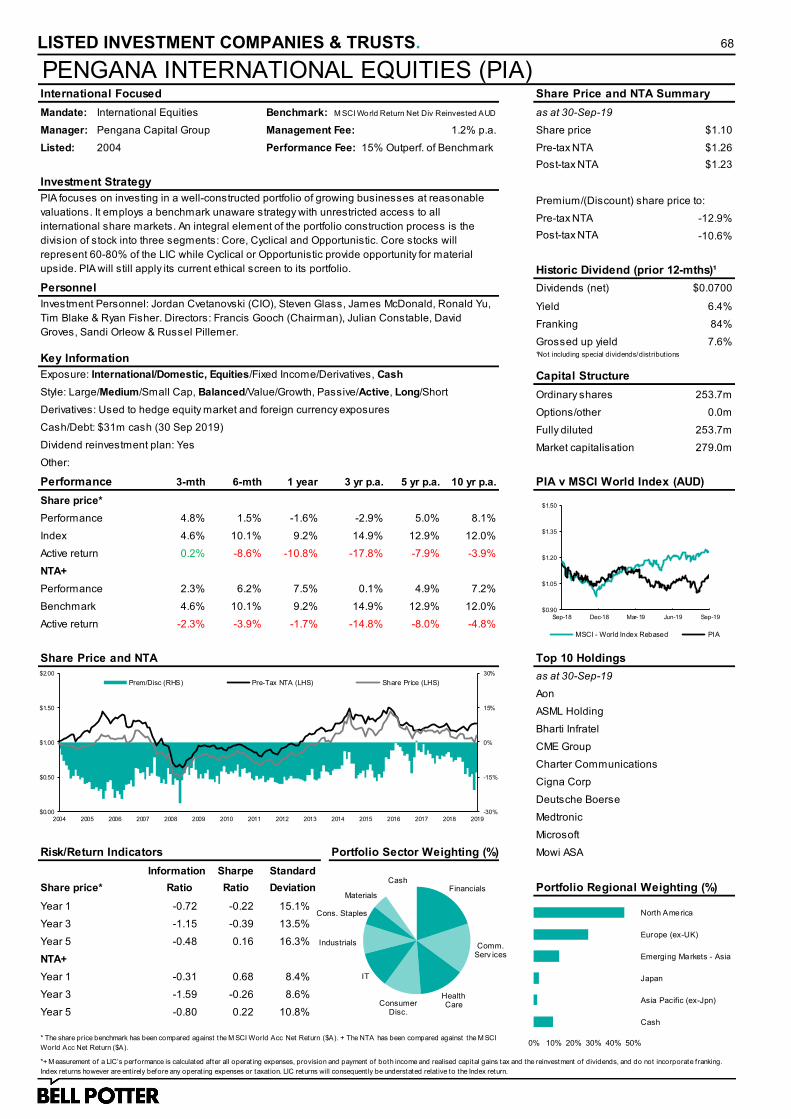
LISTED INVESTMENT COMPANIES & TRUSTS. 68
PENGANA INTERNATIONAL EQUITIES (PIA)International Focused Share Price and NTA Summary
Mandate: International Equities Benchmark: M SCI World Return Net Div Reinvested AUD as at 30-Sep-19
Manager: Pengana Capital Group Management Fee: 1.2% p.a. Share price $1.10
Listed: 2004 Performance Fee: 15% Outperf. of Benchmark Pre-tax NTA $1.26
Post-tax NTA $1.23
Investment Strategy
Pre-tax NTA -12.9%
Post-tax NTA -10.6%
Historic Dividend (prior 12-mths)¹
Personnel Dividends (net) $0.0700
Yield 6.4%
Franking 84%
Grossed up yield 7.6%
Key Information ¹Not including special dividends/distribut ions
Exposure: International/Domestic, Equities/Fixed Income/Derivatives, Cash Capital Structure
Style: Large/Medium/Small Cap, Balanced/Value/Growth, Passive/Active, Long/Short Ordinary shares 253.7m
Derivatives: Used to hedge equity market and foreign currency exposures Options/other 0.0m
Cash/Debt: $31m cash (30 Sep 2019) Fully diluted 253.7m
Dividend reinvestment plan: Yes Market capitalisation 279.0m
Other:
Performance 3-mth 6-mth 1 year 3 yr p.a. 5 yr p.a. 10 yr p.a. PIA v MSCI World Index (AUD)
Share price*
Performance 4.8% 1.5% -1.6% -2.9% 5.0% 8.1%
Index 4.6% 10.1% 9.2% 14.9% 12.9% 12.0%
Active return 0.2% -8.6% -10.8% -17.8% -7.9% -3.9%
NTA+
Performance 2.3% 6.2% 7.5% 0.1% 4.9% 7.2%
Benchmark 4.6% 10.1% 9.2% 14.9% 12.9% 12.0%
Active return -2.3% -3.9% -1.7% -14.8% -8.0% -4.8%
Share Price and NTA Top 10 Holdings
as at 30-Sep-19
Aon
ASML Holding
Bharti Infratel
CME Group
Charter Communications
Cigna Corp
Deutsche Boerse
Medtronic
Microsoft
Risk/Return Indicators Portfolio Sector Weighting (%) Mowi ASA
Sharpe Standard
Share price* Ratio Ratio Deviation Portfolio Regional Weighting (%)
Year 1 -0.72 -0.22 15.1%
Year 3 -1.15 -0.39 13.5%
Year 5 -0.48 0.16 16.3%
NTA+
Year 1 -0.31 0.68 8.4%
Year 3 -1.59 -0.26 8.6%
Year 5 -0.80 0.22 10.8%
* The share price benchmark has been compared against the M SCI World Acc Net Return ($A). + The NTA has been compared against the M SCI
World Acc Net Return ($A).
*+ M easurement of a LIC’s performance is calculated after all operat ing expenses, provision and payment of both income and realised capital gains tax and the reinvestment of dividends, and do not incorporate franking.
Index returns however are ent irely before any operat ing expenses or taxat ion. LIC returns will consequent ly be understated relat ive to the Index return.
PIA focuses on investing in a well-constructed portfolio of growing businesses at reasonable
valuations. It employs a benchmark unaware strategy with unrestricted access to all
international share markets. An integral element of the portfolio construction process is the
division of stock into three segments: Core, Cyclical and Opportunistic. Core stocks will
represent 60-80% of the LIC while Cyclical or Opportunistic provide opportunity for material
upside. PIA will still apply its current ethical screen to its portfolio.
Premium/(Discount) share price to:
Investment Personnel: Jordan Cvetanovski (CIO), Steven Glass, James McDonald, Ronald Yu,
Tim Blake & Ryan Fisher. Directors: Francis Gooch (Chairman), Julian Constable, David
Groves, Sandi Orleow & Russel Pillemer.
Information
$0.90
$1.05
$1.20
$1.35
$1.50
Sep-18 Dec-18 Mar-19 Jun-19 Sep-19
MSCI - World Index Rebased PIA
Financials
Comm. Serv ices
Health CareConsumer
Disc.
IT
Industrials
Cons. Staples
Materials
Cash
Cash
Asia Pacific (ex-Jpn)
Japan
Emerging Markets - Asia
Europe (ex-UK)
North America
0% 10% 20% 30% 40% 50%
-30%
-15%
0%
15%
30%
$0.00
$0.50
$1.00
$1.50
$2.00
2004 2005 2006 2007 2008 2009 2010 2011 2012 2013 2014 2015 2016 2017 2018 2019
Prem/Disc (RHS) Pre-Tax NTA (LHS) Share Price (LHS)

LISTED INVESTMENT COMPANIES & TRUSTS. 69
TEMPLETON GLOBAL GROWTH FUND (TGG)International Focused Share Price and NTA Summary
Mandate: Absolute return Benchmark: MSCI All Country World TR (AUD) as at 30-Sep-19
Manager: Templeton Global Equity Group Management Fee: 1.0% p.a. Share price $1.22
Listed: 1987 Performance Fee: None Pre-tax NTA $1.43
Post-tax NTA $1.40
Investment Strategy
Pre-tax NTA -14.8%
Post-tax NTA -13.3%
Historic Dividend (prior 12-mths)¹
Personnel Dividends (net) $0.0700
Yield 5.8%
Franking 100%
Grossed up yield 8.2%
Key Information ¹Not including special dividends/distribut ions
Exposure: International/Domestic, Equities/Fixed Income/Derivatives, Cash Capital Structure
Style: Large/Medium/Small Cap, Balanced/Value/Growth, Passive/Active, Long/Short Ordinary shares 210.8m
Derivatives: none. Options/other 0.0m
Cash/Debt: $20.5m cash (30 Sep 2019) Fully diluted 210.8m
Dividend reinvestment plan: Yes Market capitalisation 256.1m
Other:
Performance 3-mth 6-mth 1 year 3 yr p.a. 5 yr p.a. 10 yr p.a. TGG v MSCI World Index (AUD)
Share price*
Performance 4.5% 0.8% -8.9% 6.7% 2.1% 7.8%
Index 3.9% 8.9% 8.7% 14.5% 12.3% 11.3%
Active return 0.6% -8.1% -17.6% -7.8% -10.2% -3.5%
NTA+
Performance 1.7% 2.9% -2.4% 7.6% 5.0% 7.2%
Benchmark 3.9% 8.9% 8.7% 14.5% 12.3% 11.3%
Active return -2.2% -6.0% -11.1% -6.9% -7.3% -4.1%
Share Price and NTA Top 10 Holdings %
as at 30-Sep-19
Vodafone Group Plc 3.5
Wells Fargo 3.0
Royal Dutch Shell 3.0
BP Plc 3.0
Sanofi 2.8
Citigroup Inc 2.8
Standard Chartered Plc 2.6
BNP Paribas SA 2.6
Takeda Pharmaceutical 2.5
Risk/Return Indicators Portfolio Country Weighting Singapore Telecomm. 2.5
Sharpe Standard % of Total 28.3
Share price* Ratio Ratio Deviation
Year 1 -1.39 -0.84 12.6% Portfolio Regional Weighting (%)
Year 3 -0.86 0.43 10.1%
Year 5 -1.05 -0.02 12.8%
NTA+
Year 1 -2.18 -0.26 15.9%
Year 3 -1.60 0.46 11.2%
Year 5 -1.60 0.22 12.0%
* The share price benchmark has been compared against the M SCI All Country World Net Index. + The NTA has been compared against the M SCI
All Country World Net Index.
*+ M easurement of a LIC’s performance is calculated after all operat ing expenses, provision and payment of both income and realised capital gains tax and the reinvestment of dividends, and do not incorporate franking.
Index returns however are ent irely before any operat ing expenses or taxat ion. LIC returns will consequent ly be understated relat ive to the Index return.
TGG’s investment process endeavours to identify undervalued equity securities through
fundamental company analysis, using a global industry focus and a long-term investment
horizon. The investment approach can be characterised by three underlying tenets: Value,
Patience and Bottom-Up Analysis. The portfolio of investments is unhedged.
Premium/(Discount) share price to:
Directors: Chris Freeman (chairman), Gregory McGowan, Martin Warwick, Michael O'Brien, Alok
Sethi and Joanne Dawson.
Information
$1.00
$1.15
$1.30
$1.45
$1.60
Sep-18 Dec-18 Mar-19 Jun-19 Sep-19
MSCI - World Index Rebased TGG
United States
UK
FranceJapan
China
Germany
South Korea
Switzerland
Netherlands
Other
Other
Industr ials
Energy
Comm. Services
Health Care
Financials
0% 10% 20% 30%
-30%
-15%
0%
15%
30%
$0.00
$0.50
$1.00
$1.50
$2.00
2004 2005 2006 2007 2008 2009 2010 2011 2012 2013 2014 2015 2016 2017 2018 2019
Prem/Disc (RHS) Pre-Tax NTA (LHS) Share Price (LHS)

LISTED INVESTMENT COMPANIES & TRUSTS. 70
EVANS & PARTNERS GLOBAL DISRUPTION FUND (EGD)International Focused Unit Price and NTA Summary
Mandate: Global listed equities Benchmark: MSCI ACWI Net TR (AUD) as at 30-Sep-19
Manager: Evans & Partners IM Pty Ltd Management Fee: 0.95% p.a. Unit price $2.14
Listed: Aug-17 Performance Fee: None NTA $2.17
Investment Strategy
NTA -1.4%
Historic Distribution (prior 12-mths)¹
Personnel Distributions (net) $0.0000
Yield 0.0%
Franking n/a
Grossed up yield n/a
Key Information ¹Not including special dividends/distribut ions
Exposure: International/Domestic, Equities/Fixed Income/Derivatives, Cash Capital Structure
Style: Large/Medium/Small Cap, Balanced/Value/Growth, Passive/Active, Long/Short Ordinary units 121.5m
Derivatives: Options/other 0.0m
Cash/Fixed Income: $19.9m (30 Sep 2019) Fully diluted 121.5m
Dividend Reinvestment Plan: Yes Market capitalisation 259.9m
Other: Walsh & Company Investments Limited acts as the Responsible Entity of the Fund
Performance 3-mth 6-mth 1 year 3 yr p.a. 5 yr p.a. 10 yr p.a. EGD v MSCI World Index (AUD)
Unit price*
Performance 0.0% 7.0% -0.5% n/a n/a n/a
Index 3.9% 8.9% 8.7% 14.5% 12.3% 11.3%
Active return -3.9% -1.9% -9.2% n/a n/a n/a
NTA+
Performance 0.5% 4.3% -0.5% n/a n/a n/a
Benchmark 3.9% 8.9% 8.7% 14.5% 12.3% 11.3%
Active return -3.4% -4.6% -9.2% n/a n/a n/a
Unit Price and NTA Top 10 Holdings
as at 30-Sep-19
Adobe
Alibaba
Alphabet Inc
Amazon.com Inc
ASML Holding
Merck & Co Inc
Microsoft Corp
PayPal Holdings Inc
Salesforce.com Inc
Risk/Return Indicators Country Exposure Tencent Holdings Ltd
Sharpe Standard Sector Exposure (%)
Unit price* Ratio Ratio Deviation
Year 1 -0.93 -0.13 16.6%
Year 3 n/a n/a n/a
Year 5 n/a n/a n/a
NTA+
Year 1 -1.23 -0.13 17.9%
Year 3 n/a n/a n/a
Year 5 n/a n/a n/a
*+ M easurement of a LIT’s performance is calculated after all operat ing expenses, provision and payment of both income and realised capital gains tax and the reinvestment of dividends, and do not incorporate franking.
Index returns however are ent irely before any operat ing expenses or taxat ion. LIC returns will consequent ly be understated relat ive to the Index return.
* The unit price benchmark has been compared against the M SCI All Country World Net Index. + The NTA has been compared against the M SCI
All Country World Net Index.
EGD seeks to provide investors with capital growth over the long-term through exposure to
global listed companies that will benefit from disruptive innovation. Additionally, the Investment
Manager may seek to identify and source opportunities in unlisted Australian and international
companies that are typically at an earlier stage in their business life-cycle than the Fund’s
listed investments but which have a disruptive business model or technology that the
Investment Manager believes has the potential to be successful.
Premium/(Discount) to:
Investment Committee: David Evans (Chair), Richard Goyder, Paul Bassat, David Thodey, Sally
Herman, Jeffrey Cole & Raymond Tong (Portfolio Manager).
Responsible Entity Directors: Alex Maclachlan, Warwick Keneally & Mike Adams
Information
$1.60
$1.80
$2.00
$2.20
$2.40
Sep-18 Dec-18 Mar-19 Jun-19 Sep-19
MSCI - World Index Rebased EGD
United States
China
Australia
Netherlands
Taiwan
SwedenCash
Cash
Digital Enterta inment
Semi-Conductors
Health Care
Electronic Payments
Digital Advertising
E-Commerce
Software
0% 5% 10% 15% 20% 25%
-20%
-10%
0%
10%
20%
$0.00
$0.75
$1.50
$2.25
$3.00
Aug 17 Oct 17 Dec 17 Feb 18 Apr 18 Jun 18 Aug 18 Oct 18 Dec 18 Feb 19 Apr 19 Jun 19 Aug 19
Prem/Disc (RHS) NTA (LHS) Unit Price (LHS)

LISTED INVESTMENT COMPANIES & TRUSTS. 71
EVANS & PARTNERS GLOBAL FLAGSHIP FUND (EGF)International Focused Unit Price and NTA Summary
Mandate: Global listed equities Benchmark: MSCI World Index Net (AUD) as at 30-Sep-19
Manager: Evans & Partners IM Pty Ltd Management Fee: 1.25% p.a. Unit price $1.67
Listed: Jul-18 Performance Fee: 10% Outperf. of Benchmark NTA $1.72
Investment Strategy
NTA -2.9%
Historic Distribution (prior 12-mths)¹
Personnel Distributions (net) $0.1161
Yield 7.0%
Franking 0%
Grossed up yield 7.0%
Key Information ¹Not including special dividends/distribut ions
Exposure: International/Domestic, Equities/Fixed Income/Derivatives, Cash Capital Structure
Style: Large/Medium/Small Cap, Balanced/Value/Growth, Passive/Active, Long/Short Ordinary units 119.2m
Derivatives: Options/other 0.0m
Cash/Fixed Income: $9.8m (30 Sep 2019) Fully diluted 119.2m
Dividend Reinvestment Plan: Yes Market capitalisation 199.1m
Other: Walsh & Company Investments Limited acts as the Responsible Entity of the Fund
Performance 3-mth 6-mth 1 year 3 yr p.a. 5 yr p.a. 10 yr p.a. EGF v MSCI World Index (AUD)
Unit price*
Performance 4.4% 12.8% 15.9% n/a n/a n/a
Index 4.5% 10.0% 9.2% 15.0% 12.9% 12.0%
Active return -0.1% 2.8% 6.7% n/a n/a n/a
NTA+
Performance 5.5% 12.5% 16.9% n/a n/a n/a
Benchmark 4.5% 10.0% 9.2% 15.0% 12.9% 12.0%
Active return 1.0% 2.5% 7.7% n/a n/a n/a
Unit Price and NTA Top 10 Holdings
as at 30-Sep-19
Airbus SE
Alphabet
Aon
AstraZeneca
Danone
Intel
Johnson & Johnson
Novartis
Orsted
Risk/Return Indicators Country Exposure Unilever
Sharpe Standard Sector Exposure (%)
Unit price* Ratio Ratio Deviation
Year 1 0.68 1.38 10.3%
Year 3 n/a n/a n/a
Year 5 n/a n/a n/a
NTA+
Year 1 1.36 1.65 9.2%
Year 3 n/a n/a n/a
Year 5 n/a n/a n/a
*+ M easurement of a LIT’s performance is calculated after all operat ing expenses, provision and payment of both income and realised capital gains tax and the reinvestment of dividends, and do not incorporate franking.
Index returns however are ent irely before any operat ing expenses or taxat ion. LIC returns will consequent ly be understated relat ive to the Index return.
* The unit price benchmark has been compared against the M SCI World Index Net (AUD). + The NTA has been compared against the M SCI World
Index Net (AUD).
EGF aims to provide investors with capital growth and attractive risk-adjusted returns over the
medium to long-term through exposure to a portfolio of global listed equities. The portfolio will
be overweight countries and sectors which the investment team believes offer greater potential
for higher risk-adjusted returns. The investment team will actively manage the risk profile of the
Fund to provide Unitholders with an appropriate level of down side protection and upside gain
as broader investor sentiment in the market fluctuates.
Premium/(Discount) to:
Investment Personnel: Ted Alexander (Portfolio Manager), Jumana Nahhas, Kunal Valia & Ying
Luo.
Responsible Entity Directors: Alex MacLachlan, Warwick Keneally & Mike Adams.
Information
$1.20
$1.35
$1.50
$1.65
$1.80
Sep-18 Dec-18 Mar-19 Jun-19 Sep-19
MSCI - World Index Rebased EGF
United States
Europe (ex-UK)
UK
Germany
France
OtherCash
Cash
Energy
Utili ties
Consumer Disc.
Industr ials
Comm. Services
Financials
Consumer Staples
Health Care
IT
0% 5% 10% 15% 20%
-10%
-5%
0%
5%
10%
$1.00
$1.25
$1.50
$1.75
$2.00
Jul 18 Aug 18 Sep 18 Oct 18 Nov 18 Dec 18 Jan 19 Feb 19 Mar 19 Apr 19 May 19 Jun 19 Jul 19 Aug 19 Sep 19
Prem/Disc (RHS) NTA (LHS) Unit Price (LHS)

LISTED INVESTMENT COMPANIES & TRUSTS. 72
WCM GLOBAL GROWTH LIMITED (WQG)International Focused Share Price and NTA Summary
Mandate: International Equities Benchmark: MSCI ACWI ex-AUS ($AUD) as at 30-Sep-19
Manager: Contango Intl. Management Management Fee: 1.25% p.a. Share price $1.09
Listed: Jun-17 Performance Fee: 10% Outperf. of Benchmark Pre-tax NTA $1.30
(Capped at 0.75% of Portfolio Value) Post-tax NTA $1.23
Investment Strategy
Pre-tax NTA -15.8%
Post-tax NTA -11.5%
Historic Dividend (prior 12-mths)¹
Personnel Dividends (net) $0.0200
Yield 1.8%
Franking 0%
Grossed up yield 0.0%
Key Information ¹Not including special dividends/distribut ions
Exposure: International/Domestic, Equities/Fixed Income/Derivatives, Cash Capital Structure
Style: Large/Medium/Small Cap, Balanced/Value/Growth, Passive/Active, Long/Short Ordinary shares 174.2m
Derivatives: n/a Options/other 0.0m
Cash/Debt: $5m cash (30 Sep 2019) Fully diluted 174.2m
Dividend Reinvestment Plan: Yes Market capitalisation 189.9m
Other: WCM Investment Management acts as the Investment Adviser
Performance 3-mth 6-mth 1 year 3 yr p.a. 5 yr p.a. 10 yr p.a. WQG v MSCI World Index (AUD)
Share price*
Performance -0.9% -1.3% -0.9% n/a n/a n/a
Index 4.0% 9.2% 9.2% 15.1% 13.0% 12.0%
Active return -4.9% -10.5% -10.1% n/a n/a n/a
NTA+
Performance 2.2% -2.6% 0.7% n/a n/a n/a
Benchmark 4.0% 9.2% 9.2% 15.1% 13.0% 12.0%
Active return -1.8% -11.8% -8.5% n/a n/a n/a
Share Price and NTA Top 10 Holdings
as at 30-Sep-19
Shopify Inc. 4.3
Visa Inc. 4.1
Steris PLC 3.7
West Pharmaceutical Serv. 3.5
Boston Scientific Corp. 3.4
Chubb 3.4
Mercadolibre Inc. 3.1
McDonald’s Corp. 3.0
First Republic Bank 3.0
Risk/Return Indicators Regional Market Allocation (%) Crown Castle International Corp. 2.9
Sharpe Standard % of Total 34.5
Share price* Ratio Ratio Deviation Sector Breakdown (%)
Year 1 -0.93 -0.23 11.4%
Year 3 n/a n/a n/a
Year 5 n/a n/a n/a
NTA+
Year 1 -0.65 -0.08 14.3%
Year 3 n/a n/a n/a
Year 5 n/a n/a n/a
* The share price benchmark has been compared against the M SCI ACWI ex-AUS ($AUD). + The NTA has been compared against the M SCI
ACWI ex-AUS ($AUD).
*+ M easurement of a LIC’s performance is calculated after all operat ing expenses, provision and payment of both income and realised capital gains tax and the reinvestment of dividends, and do not incorporate franking.
Index returns however are ent irely before any operat ing expenses or taxat ion. LIC returns will consequent ly be understated relat ive to the Index return.
WQG aims to provide access to an actively managed portfolio of quality global companies
found primarily in the high growth consumer, technology and healthcare sectors. The portfolio
is managed by WCM Investment Management (WCM), a California-based specialist global
equity firm with an outstanding long-term investment track record. WCM’s investment process
is based on the belief that corporate culture is the biggest influence on a company’s ability to
grow its competitive advantage or ‘moat’.
Premium/(Discount) share price to:
Investment Personnel: Paul Black (Co-CEO & Investment Manager) & Kurt Winrich (Co-CEO)
Directors: Valentina Stojanovska, Michael Liu, Stephen Merlicek, Paul Rickard & Martin Switzer.
Information
$0.90
$1.00
$1.10
$1.20
$1.30
Sep-18 Dec-18 Mar-19 Jun-19 Sep-19
MSCI - World Index Rebased WQG
Americas
Asia/Pacif icEurope
Other
Cash
Energy
Real Estate
Comm. Services
Consumer Staples
Materials
Industr ials
Consumer Disc.
Financials
IT
Health Care
0% 5% 10% 15% 20% 25%
-30%
-15%
0%
15%
30%
$0.00
$0.45
$0.90
$1.35
$1.80
Jun 17 Sep 17 Dec 17 Mar 18 Jun 18 Sep 18 Dec 18 Mar 19 Jun 19 Sep 19
Prem/Disc (RHS) Pre-Tax NTA (LHS) Share Price (LHS)
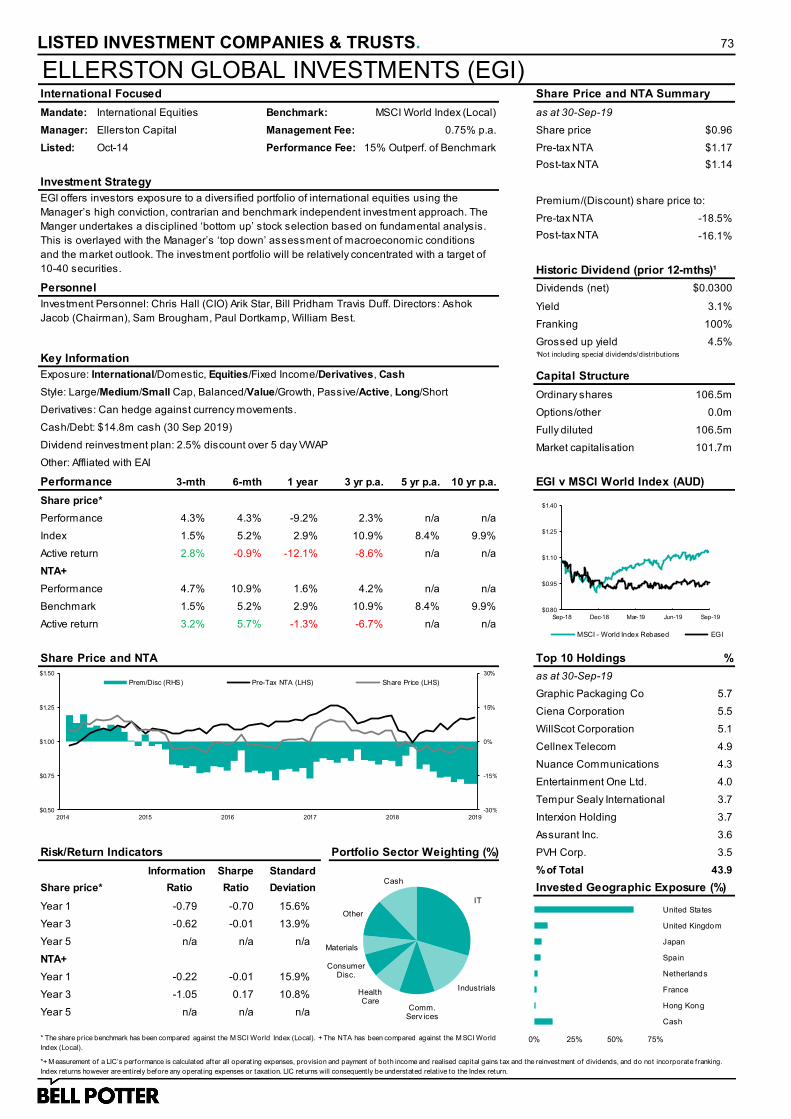
LISTED INVESTMENT COMPANIES & TRUSTS. 73
ELLERSTON GLOBAL INVESTMENTS (EGI)International Focused Share Price and NTA Summary
Mandate: International Equities Benchmark: MSCI World Index (Local) as at 30-Sep-19
Manager: Ellerston Capital Management Fee: 0.75% p.a. Share price $0.96
Listed: Oct-14 Performance Fee: 15% Outperf. of Benchmark Pre-tax NTA $1.17
Post-tax NTA $1.14
Investment Strategy
Pre-tax NTA -18.5%
Post-tax NTA -16.1%
Historic Dividend (prior 12-mths)¹
Personnel Dividends (net) $0.0300
Yield 3.1%
Franking 100%
Grossed up yield 4.5%
Key Information ¹Not including special dividends/distribut ions
Exposure: International/Domestic, Equities/Fixed Income/Derivatives, Cash Capital Structure
Style: Large/Medium/Small Cap, Balanced/Value/Growth, Passive/Active, Long/Short Ordinary shares 106.5m
Derivatives: Can hedge against currency movements. Options/other 0.0m
Cash/Debt: $14.8m cash (30 Sep 2019) Fully diluted 106.5m
Dividend reinvestment plan: 2.5% discount over 5 day VWAP Market capitalisation 101.7m
Other: Affliated with EAI
Performance 3-mth 6-mth 1 year 3 yr p.a. 5 yr p.a. 10 yr p.a. EGI v MSCI World Index (AUD)
Share price*
Performance 4.3% 4.3% -9.2% 2.3% n/a n/a
Index 1.5% 5.2% 2.9% 10.9% 8.4% 9.9%
Active return 2.8% -0.9% -12.1% -8.6% n/a n/a
NTA+
Performance 4.7% 10.9% 1.6% 4.2% n/a n/a
Benchmark 1.5% 5.2% 2.9% 10.9% 8.4% 9.9%
Active return 3.2% 5.7% -1.3% -6.7% n/a n/a
Share Price and NTA Top 10 Holdings %
as at 30-Sep-19
Graphic Packaging Co 5.7
Ciena Corporation 5.5
WillScot Corporation 5.1
Cellnex Telecom 4.9
Nuance Communications 4.3
Entertainment One Ltd. 4.0
Tempur Sealy International 3.7
Interxion Holding 3.7
Assurant Inc. 3.6
Risk/Return Indicators Portfolio Sector Weighting (%) PVH Corp. 3.5
Sharpe Standard % of Total 43.9
Share price* Ratio Ratio Deviation Invested Geographic Exposure (%)
Year 1 -0.79 -0.70 15.6%
Year 3 -0.62 -0.01 13.9%
Year 5 n/a n/a n/a
NTA+
Year 1 -0.22 -0.01 15.9%
Year 3 -1.05 0.17 10.8%
Year 5 n/a n/a n/a
* The share price benchmark has been compared against the M SCI World Index (Local). + The NTA has been compared against the M SCI World
Index (Local).
*+ M easurement of a LIC’s performance is calculated after all operat ing expenses, provision and payment of both income and realised capital gains tax and the reinvestment of dividends, and do not incorporate franking.
Index returns however are ent irely before any operat ing expenses or taxat ion. LIC returns will consequent ly be understated relat ive to the Index return.
EGI offers investors exposure to a diversified portfolio of international equities using the
Manager’s high conviction, contrarian and benchmark independent investment approach. The
Manger undertakes a disciplined ‘bottom up’ stock selection based on fundamental analysis.
This is overlayed with the Manager’s ‘top down’ assessment of macroeconomic conditions
and the market outlook. The investment portfolio will be relatively concentrated with a target of
10-40 securities.
Premium/(Discount) share price to:
Investment Personnel: Chris Hall (CIO) Arik Star, Bill Pridham Travis Duff. Directors: Ashok
Jacob (Chairman), Sam Brougham, Paul Dortkamp, William Best.
Information
$0.80
$0.95
$1.10
$1.25
$1.40
Sep-18 Dec-18 Mar-19 Jun-19 Sep-19
MSCI - World Index Rebased EGI
IT
Industrials
Comm. Serv ices
Health Care
Consumer Disc.
Materials
Other
Cash
Cash
Hong Kong
France
Netherlands
Spain
Japan
United Kingdom
United States
0% 25% 50% 75%
-30%
-15%
0%
15%
30%
$0.50
$0.75
$1.00
$1.25
$1.50
2014 2015 2016 2017 2018 2019
Prem/Disc (RHS) Pre-Tax NTA (LHS) Share Price (LHS)

LISTED INVESTMENT COMPANIES & TRUSTS. 74
ARGO GLOBAL LISTED INFRASTRUCTURE (ALI)International Focused Share Price and NTA Summary
Mandate: Global Listed Infrastructure Benchmark: FTSE Global Core 50/50 as at 30-Sep-19
Manager: Argo Service Company Management Fee: 1.20% p.a. Share price $2.33
Listed: Jul-15 Performance Fee: None Pre-tax NTA $2.62
Investment Strategy Post-tax NTA $2.49
Pre-tax NTA -11.1%
Post-tax NTA -6.4%
Personnel Historic Dividend (prior 12-mths)
Dividends (net) $0.0650
Yield 2.8%
Franking 100%
Grossed up yield 4.0%
Key Information
Exposure: International/Domestic, Equities/Fixed Income/Derivatives, Cash
Style: Large/Medium/Small Cap, Balanced/Value/Growth, Passive/Active, Long/Short Ordinary shares 142.0m
Derivatives: n/a Options/other 0.0m
Cash/Debt: $3.7m cash (30 Sep 2019) Fully diluted 142.0m
Dividend reinvestment plan: Yes Market capitalisation 330.7m
Other: Portfolio managed by Cohen & Steers (New York based)
Performance 3-mth 6-mth 1 year 3 yr p.a. 5 yr p.a. 10 yr p.a. ALI v MSCI World Index (AUD)
Share price*
Performance 4.9% 9.2% 24.5% 12.5% n/a n/a
Index 6.5% 12.4% 26.1% 14.5% 13.2% 11.3%
Active return -1.6% -3.2% -1.6% -2.0% n/a n/a
NTA+
Performance 6.4% 9.9% 21.6% 12.4% n/a n/a
Benchmark 6.5% 12.4% 26.1% 14.5% 13.2% 11.3%
Active return -0.1% -2.5% -4.5% -2.1% n/a n/a
Share Price and NTA Top 10 Holdings %
as at 30-Sep-19
NextEra Energy 6.5
American Tower 3.4
Crown Castle Internatonal 3.4
Transurban Group 3.2
SBA Communicatons 3.1
FirstEnergy 3.1
Alliant Energy 3.0
American Water Works Co. 2.9
Norfolk Southern 2.7
Risk/Return Indicators Portfolio Subsector Exposure Enbridge 2.7
Sharpe Standard % of Total 34.0
Share price* Ratio Ratio Deviation Portfolio Regional Exposure
Year 1 -0.25 2.15 10.6%
Year 3 -0.24 0.90 11.2%
Year 5 n/a n/a n/a
NTA+
Year 1 -1.56 3.37 5.9%
Year 3 -0.64 1.20 8.4%
Year 5 n/a n/a n/a
* The share price benchmark has been compared against the FTSE Global Core Infrastructure 50/50 Index. + The NTA has been compared against
the FTSE Global Core Infrastructure 50/50 Index.
*+ M easurement of a LIC’s performance is calculated after all operat ing expenses, provision and payment of both income and realised capital gains tax and the reinvestment of dividends, and do not incorporate franking.
Index returns however are ent irely before any operat ing expenses or taxat ion. LIC returns will consequent ly be understated relat ive to the Index return.
Premium/(Discount) share price to:
Capital Structure
Information
ALI invests in listed global infrastructure. Its investment strategy involves a top down approach
of their Global Investment universe – followed by a bottom up analysis of individual securities.
The portfolio is concentrated across 50 – 100 stocks with a significant weighting to US
Infrastructure securities. ALI believes this strategy offers a value add to investors as global
infrastructure is an asset class that has historically been characterised by stable income,
strong returns, low volatility and low correlation to broader equity and fixed income markets.
Investment Personnel: Cohen & Steers Inc, Ben Morton (Senior PM), Bob Becker (PM), Tyler
Rosenlicht (PM), Grace Ding, Humberto Medina, Thuy Quynh Dang, Kathleen Morris, Saagar
Parikh, Andrew Burd. Directors: Russell Higgins AO (Chairman), Joycelyn Morton, Andrea
Slattery, Jason Beddow.
$1.40
$1.65
$1.90
$2.15
$2.40
Sep-18 Dec-18 Mar-19 Jun-19 Sep-19
MSCI World Index Rebased ALI
Electric
Midstream Energy
Communications
Railway s
Other
Cash
-20%
-10%
0%
10%
20%
$0.00
$0.75
$1.50
$2.25
$3.00
2015 2016 2017 2018 2019
Prem/Disc (RHS) Pre-Tax NTA (LHS) Share Price (LHS)
United States
Europe
Canada
Asia Pacif ic
Other
Cash

LISTED INVESTMENT COMPANIES & TRUSTS. 75
GLOBAL VALUE FUND (GVF)International Focused Share Price and NTA Summary
Mandate: I'ntl (Multi Assets) Benchmark: BBSW 1 Year Rate + 4% as at 30-Sep-19
Manager: Mirabella Financial Services^ Management Fee: 1.5% p.a. Share price $1.02
Listed: Jul-14 Performance Fee: 15% Outperf. of Benchmark Pre-tax NTA $1.08
Post-tax NTA $1.06
Investment Strategy
Pre-tax NTA -5.8%
Post-tax NTA -4.4%
Historic Dividend (prior 12-mths)¹
Personnel Dividends (net) $0.0605
Yield 6.0%
Franking 84%
Grossed up yield 8.1%
Key Information ¹Not including special dividends/distribut ions
Exposure: International/Domestic, Equities/Fixed Income/Derivatives/Managed Funds, Cash Capital Structure
Style: Large/Medium/Small Cap, Balanced/Value/Growth, Passive/Active, Long/Short Ordinary shares 147.7m
Derivatives: Used for arbitrage and to manage currency exposures. Options/other 0.0m
Cash/Debt: n/a Fully diluted 147.7m
Dividend Reinvestment Plan: Yes Market capitalisation 149.9m
Other: n/a
Performance 3-mth 6-mth 1 year 3 yr p.a. 5 yr p.a. 10 yr p.a. GVF v MSCI ACWI (AUD)
Share price*
Performance 7.6% 1.4% -0.8% 4.8% 4.5% n/a
Index 1.8% 4.1% 4.2% 7.0% 6.1% 6.0%
Active return 5.8% -2.7% -5.0% -2.2% -1.6% n/a
NTA+
Performance 4.0% 6.6% 4.4% 6.1% 6.2% n/a
Benchmark 1.2% 2.6% 5.6% 5.9% 6.0% 7.0%
Active return 2.8% 4.0% -1.2% 0.2% 0.2% n/a
Share Price and NTA Top 5 Holdings %
as at 30-Sep-19
Highbridge Multi Strategy 9.4
Polar Cap Global Financial 8.8
Third Point Offshore USD 7.0
NB Global FR Inc. Fund 6.6
Pershing Square Holdings 5.6
% of Total 37.4
Risk/Return Indicators Portfolio Asset Exposure (%) Underlying Currency Exposure (%)
Sharpe Standard
Share price* Ratio Ratio Deviation
Year 1 -0.60 -0.31 8.5%
Year 3 -0.25 0.31 7.9%
Year 5 -0.20 0.26 7.8%
NTA+
Year 1 -0.22 0.46 5.6%
Year 3 0.04 0.73 5.1%
Year 5 0.02 0.53 7.1%
* The share price benchmark has been compared against the a weight ing of 50%M SCI ACWI (AUD) and 50%BBSW 1 Year Rate. + The NTA has
been compared against the BBSW 1 Year Rate + 4 %. ^The M anager has seconded the investment team at Staude Capital to manage the GVF.
*+ M easurement of a LIC’s performance is calculated after all operat ing expenses, provision and payment of both income and realised capital gains tax and the reinvestment of dividends, and do not incorporate franking.
Index returns however are ent irely before any operat ing expenses or taxat ion. LIC returns will consequent ly be understated relat ive to the Index return.
GVF invests globally using a discount capture strategy, owning a range of global assets
purchased at a discount to their intrinsic value. GVF aims to provide an alternative source of
market outperformance compared to more common stock selection strategies. The Manager
is based in London and has considerable experience in selecting global assets that fit this
mandate, and in identifying or creating catalysts that will be used to unlock this value. GVF is
the only ASX LIC to develop a strategy of investing in global LICs across all asset classes.
Premium/(Discount) share price to:
Investment Personnel: Miles Staude.
Directors: Jonathan Trollip (Chairman), Chris Cuffe, Geoff Wilson, Miles Staude.
Information
$0.80
$0.90
$1.00
$1.10
$1.20
Sep-18 Dec-18 Mar-19 Jun-19 Sep-19
MSCI ACWI Rebased GVF
Listed Equity
Listed Debt Instruments
Listed Hedge
Funds
Listed Priv ate
Equity
Other
Other
EUR
AUD
USD
0% 10% 20% 30% 40% 50%
-20%
-10%
0%
10%
20%
$0.50
$0.75
$1.00
$1.25
$1.50
2014 2015 2016 2017 2018 2019
Prem/Disc (RHS) Pre-Tax NTA (LHS) Share Price (LHS)
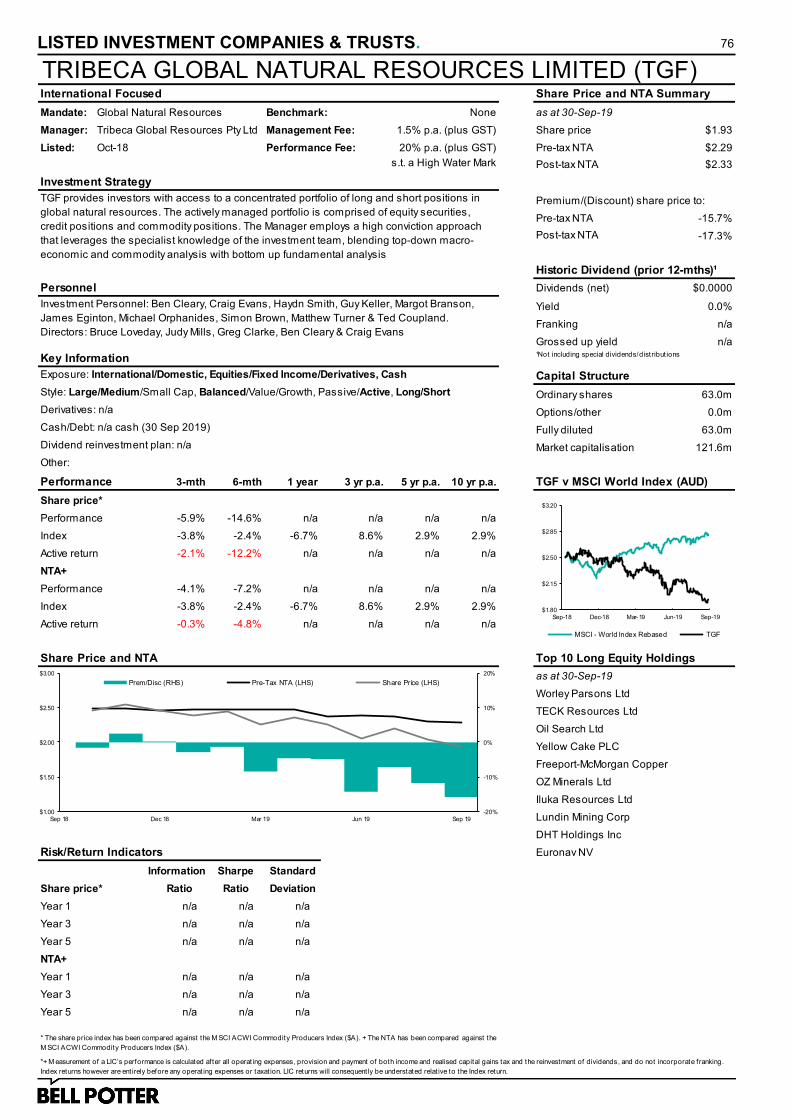
LISTED INVESTMENT COMPANIES & TRUSTS. 76
TRIBECA GLOBAL NATURAL RESOURCES LIMITED (TGF)International Focused Share Price and NTA Summary
Mandate: Global Natural Resources Benchmark: None as at 30-Sep-19
Manager: Tribeca Global Resources Pty Ltd Management Fee: 1.5% p.a. (plus GST) Share price $1.93
Listed: Oct-18 Performance Fee: 20% p.a. (plus GST) Pre-tax NTA $2.29
s.t. a High Water Mark Post-tax NTA $2.33
Investment Strategy
Pre-tax NTA -15.7%
Post-tax NTA -17.3%
Historic Dividend (prior 12-mths)¹
Personnel Dividends (net) $0.0000
Yield 0.0%
Franking n/a
Grossed up yield n/a
Key Information ¹Not including special dividends/distribut ions
Exposure: International/Domestic, Equities/Fixed Income/Derivatives, Cash Capital Structure
Style: Large/Medium/Small Cap, Balanced/Value/Growth, Passive/Active, Long/Short Ordinary shares 63.0m
Derivatives: n/a Options/other 0.0m
Cash/Debt: n/a cash (30 Sep 2019) Fully diluted 63.0m
Dividend reinvestment plan: n/a Market capitalisation 121.6m
Other:
Performance 3-mth 6-mth 1 year 3 yr p.a. 5 yr p.a. 10 yr p.a. TGF v MSCI World Index (AUD)
Share price*
Performance -5.9% -14.6% n/a n/a n/a n/a
Index -3.8% -2.4% -6.7% 8.6% 2.9% 2.9%
Active return -2.1% -12.2% n/a n/a n/a n/a
NTA+
Performance -4.1% -7.2% n/a n/a n/a n/a
Index -3.8% -2.4% -6.7% 8.6% 2.9% 2.9%
Active return -0.3% -4.8% n/a n/a n/a n/a
Share Price and NTA Top 10 Long Equity Holdings
as at 30-Sep-19
Worley Parsons Ltd
TECK Resources Ltd
Oil Search Ltd
Yellow Cake PLC
Freeport-McMorgan Copper
OZ Minerals Ltd
Iluka Resources Ltd
Lundin Mining Corp
DHT Holdings Inc
Risk/Return Indicators Euronav NV
Sharpe Standard
Share price* Ratio Ratio Deviation
Year 1 n/a n/a n/a
Year 3 n/a n/a n/a
Year 5 n/a n/a n/a
NTA+
Year 1 n/a n/a n/a
Year 3 n/a n/a n/a
Year 5 n/a n/a n/a
* The share price index has been compared against the M SCI ACWI Commodity Producers Index ($A). + The NTA has been compared against the
M SCI ACWI Commodity Producers Index ($A).
*+ M easurement of a LIC’s performance is calculated after all operat ing expenses, provision and payment of both income and realised capital gains tax and the reinvestment of dividends, and do not incorporate franking.
Index returns however are ent irely before any operat ing expenses or taxat ion. LIC returns will consequent ly be understated relat ive to the Index return.
TGF provides investors with access to a concentrated portfolio of long and short positions in
global natural resources. The actively managed portfolio is comprised of equity securities,
credit positions and commodity positions. The Manager employs a high conviction approach
that leverages the specialist knowledge of the investment team, blending top-down macro-
economic and commodity analysis with bottom up fundamental analysis
Premium/(Discount) share price to:
Investment Personnel: Ben Cleary, Craig Evans, Haydn Smith, Guy Keller, Margot Branson,
James Eginton, Michael Orphanides, Simon Brown, Matthew Turner & Ted Coupland.
Directors: Bruce Loveday, Judy Mills, Greg Clarke, Ben Cleary & Craig Evans
Information
$1.80
$2.15
$2.50
$2.85
$3.20
Sep-18 Dec-18 Mar-19 Jun-19 Sep-19
MSCI - World Index Rebased TGF
-20%
-10%
0%
10%
20%
$1.00
$1.50
$2.00
$2.50
$3.00
Sep 18 Dec 18 Mar 19 Jun 19 Sep 19
Prem/Disc (RHS) Pre-Tax NTA (LHS) Share Price (LHS)

LISTED INVESTMENT COMPANIES & TRUSTS. 77
FUTURE GENERATION GLOBAL INVEST CO (FGG)International Focused Share Price and NTA Summary
Mandate: Fund of funds Benchmark: MSCI AC World TR (AUD) as at 30-Sep-19
Manager: Future Gen Investment Fund Annual Donation: 1.0% p.a. Share price $1.30
Listed: Sep-15 +The company does not charge a management fee or performance fee Pre-tax NTA $1.42
Post-tax NTA $1.35
Investment Strategy
Pre-tax NTA -8.4%
Post-tax NTA -4.0%
Historic Dividend (prior 12-mths)¹
Personnel Dividends (net) $0.0150
Yield 1.2%
Franking 100%
Grossed up yield 1.6%
Key Information ¹Not including special dividends/distribut ions
Exposure: International/Domestic, Equities/Fixed Income/Derivatives/Managed Funds, Cash Capital Structure
Style: Large/Medium/Small Cap, Balanced/Value/Growth, Passive/Active, Long/Short Ordinary shares 392.5m
Derivatives: Used to enhanced or protect returns. Options/other 0.0m
Cash/Debt: $65.7m cash (30 Sep 2019) Fully diluted 392.5m
Dividend Reinvestment Plan: Yes Market capitalisation 510.2m
Other: Lieu of mgmt/perf. fees, a yearly donation of 1.0% of its NTA to support 'mental health' charities.
Performance 3-mth 6-mth 1 year 3 yr p.a. 5 yr p.a. 10 yr p.a. FGG v MSCI World Index (AUD)
Share price*
Performance -1.5% -5.1% -5.4% 8.3% n/a n/a
Index 3.9% 8.9% 8.7% 14.5% 12.3% 11.3%
Active return -5.4% -14.0% -14.1% -6.2% n/a n/a
NTA+
Performance 0.7% 5.7% 3.2% 10.8% n/a n/a
Benchmark 3.9% 8.9% 8.7% 14.5% 12.3% 11.3%
Active return -3.2% -3.2% -5.5% -3.7% n/a n/a
Share Price and NTA Fund Manager Allocations %
as at 30-Sep-19
Magellan Financial Group 12.4
Cooper Investors 11.3
Antipodes Partners 10.0
Marsico Capital 7.8
Nikko Asset Management 7.4
VGI Partners 6.9
Caledonia 5.8
Manikay Partners 5.8
Ellerston Capital 5.2
Risk/Return Indicators Sector Exposure (Portfolio) Morphic Asset Manage. 4.5
Sharpe Standard Munro Partners 4.2
Share price* Ratio Ratio Deviation Avenir Capital 3.5
Year 1 -1.10 -0.68 10.6% Paradice Investment Man. 3.4
Year 3 -0.54 0.61 9.7% Cash and Term Deposits 11.8
Year 5 n/a n/a n/a % of Total 100.0
NTA+
Year 1 -1.10 0.15 9.2%
Year 3 -0.90 1.10 7.7%
Year 5 n/a n/a n/a
* The share price benchmark has been compared against the M SCI All Country World TR Index. + The NTA has been compared against the M SCI
All Country World TR Index.
*+ M easurement of a LIC’s performance is calculated after all operat ing expenses, provision and payment of both income and realised capital gains tax and the reinvestment of dividends, and do not incorporate franking.
Index returns however are ent irely before any operat ing expenses or taxat ion. LIC returns will consequent ly be understated relat ive to the Index return.
FGG will invest in a portfolio of funds that are predominantly investing in Global equities. The
vehicle’s objective is to provide a stream of fully franked dividends and achieve capital growth .
FGG can invest in any asset class and utilise any investment style or strategy. Mandates
include long equities & absolute bias. The composition of the investment portfolio will vary over
time, and the maximum single allocation to a fund manager will be limited to 10%. FGG is
permitted to invest directly into global and domestic equities.
Premium/(Discount) share price to:
Investment Personnel: Sean Webster (Chair), Aman Ramrakha, Chris Donohoe, Gary Brader,
Geoff Wilson & Lukasz de Pourbaix. Directors: Belinda Hutchinson (Chair), Geoff Wilson, Frank
Caserotti, Geoff R Wilson, Jonathan Nicholas, Keira Grant & Sarah Morgan.
Information
$1.00
$1.15
$1.30
$1.45
$1.60
Sep-18 Dec-18 Mar-19 Jun-19 Sep-19
MSCI - World Index Rebased FGG
Long Equities
Absolute Bias
Cash
-20%
-10%
0%
10%
20%
$0.60
$0.85
$1.10
$1.35
$1.60
2015 2016 2017 2018 2019
Prem/Disc (RHS) Pre-Tax NTA (LHS) Share Price (LHS)

LISTED INVESTMENT COMPANIES & TRUSTS. 78
HEARTS AND MINDS INVESTMENTS LTD (HM1)Global Focused Share Price and NTA Summary
Mandate: Domestic/International Equity Benchmark: MSCI World Index (AUD) as at 30-Sep-19
Manager: Internal Annual Donation: 1.5% p.a. Share price $3.00
Listed: Nov-18 +The company does not charge a management fee or performance fee Pre-tax NTA $3.00
Post-tax NTA $2.86
Investment Strategy
Pre-tax NTA 0.0%
Post-tax NTA 4.9%
Historic Dividend (prior 12-mths)¹
Personnel Dividends (net) $0.0000
Yield 0.0%
Franking n/a
Grossed up yield n/a
Key Information ¹Not including special dividends/distribut ions
Exposure: International/Domestic, Equities/Fixed Income/Derivatives, Cash Capital Structure
Style: Large/Medium/Small Cap, Balanced/Value/Growth, Passive/Active, Long/Short Ordinary shares 200.0m
Derivatives: n/a Options/other 0.0m
Cash/Debt: $48m Cash/Fixed Income (30 Sep 2019) Fully diluted 200.0m
Dividend Reinvestment Plan: n/a Market capitalisation 600.0m
Other: Donation of 1.5% p.a. of its NTA to support medical research institutes across Australia
Performance 3-mth 6-mth 1 year 3 yr p.a. 5 yr p.a. 10 yr p.a. HM1 v MSCI World Index (AUD)
Share price*
Performance 1.7% 4.9% n/a n/a n/a n/a
Index 4.5% 10.0% 9.2% 15.0% 12.9% 12.0%
Active return -2.8% -5.1% n/a n/a n/a n/a
NTA+
Performance 0.3% 7.1% n/a n/a n/a n/a
Benchmark 4.5% 10.0% 9.2% 15.0% 12.9% 12.0%
Active return -4.2% -2.9% n/a n/a n/a n/a
Share Price and NTA Core Fund Managers
Caledonia Investments Pty Limited
Cooper Investors
Magellan Financial Group
Paradice Investment Management
Regal Funds Management
Risk/Return Indicators Business Domicile Sector Exposure (Portfolio)
Sharpe Standard
Share price* Ratio Ratio Deviation
Year 1 n/a n/a n/a
Year 3 n/a n/a n/a
Year 5 n/a n/a n/a
NTA+
Year 1 n/a n/a n/a
Year 3 n/a n/a n/a
Year 5 n/a n/a n/a
*+The share price and the NTA benchmark have been compared against the M SCI World Index (A$).
*+ M easurement of a LIC’s performance is calculated after all operat ing expenses, provision and payment of both income and realised capital gains tax and the reinvestment of dividends, and do not incorporate franking.
Index returns however are ent irely before any operat ing expenses or taxat ion. LIC returns will consequent ly be understated relat ive to the Index return.
HM1 originated from the investment ideas born out of the annual Sohn Hearts & Minds
Investment Leaders Conference. The portfolio consists of 25-35 domestic and international
long only investment ideas, split between the Conference Fund Managers (40%) and five Core
Fund Managers (60%), with the latter providing 3 investment recommendations each. A
management fee will be replaced by a donation of 1.5% of the average monthly NTA to
designated leading Australian medical research institutes annually, chosen annually.
Premium/(Discount) share price to:
Investment Personnel: Rory Lucas (CIO), David Wright, Lorraine Berends, Chris Cuffe, Brett
Paton & Paul Rayson. Directors: Chris Cuffe (Chair), Lorraine Berends, Guy Fowler, Matthew
Grounds, Michael Traill, Gary Weiss, Geoff Wilson & David Wright.
Information
$2.00
$2.30
$2.60
$2.90
$3.20
Sep-18 Dec-18 Mar-19 Jun-19 Sep-19
MSCI - World Index Rebased HM1
-10%
-5%
0%
5%
10%
$2.00
$2.35
$2.70
$3.05
$3.40
Nov 18 Dec 18 Jan 19 Feb 19 Mar 19 Apr 19 May 19 Jun 19 Jul 19 Aug 19 Sep 19
Prem/Disc (RHS) Pre-Tax NTA (LHS) Share Price (LHS)
0% 5% 10% 15% 20% 25%
Cash
Utili ties
Healthcare
Materials
Financials
Industr ials
Technology
Communicatons
Consumer Disc.
United States
Australia
Brazil
Hong Kong
Japan
Europe
China
Canada

LISTED INVESTMENT COMPANIES & TRUSTS. 79
PLATINUM ASIA INVESTMENTS LIMITED (PAI)International Focused Share Price and NTA Summary
Mandate: Asian (Ex-Japan) Listed Equity Benchmark: MSCI AC Asia Ex-Jpn (AUD) as at 30-Sep-19
Manager: Platinum Asset Management Management Fee: 1.1% p.a. Share price $0.94
Listed: Sep-15 Performance Fee: 15% Outperf. of Benchmark Pre-tax NTA $1.07
Post-tax NTA $1.07
Investment Strategy
Pre-tax NTA -12.1%
Post-tax NTA -12.1%
Historic Dividend (prior 12-mths)¹
Personnel Dividends (net) $0.0400
Yield 4.3%
Franking 100%
Grossed up yield 6.1%
Key Information ¹Not including special dividends/distribut ions
Exposure: International/Domestic, Equities/Fixed Income/Derivatives, Cash Capital Structure
Style: Large/Medium/Small Cap, Balanced/Value/Growth, Passive/Active, Long/Short Ordinary shares 363.0m
Derivatives: Yes Options/other 0.0m
Cash/Debt: $74m Cash (30 Sep 19) Fully diluted 363.0m
Dividend reinvestment plan: Yes, 2.5% discount to 5 day VWAP subsequent to cum-dividend date Market capitalisation 341.2m
Other: n/a
Performance 3-mth 6-mth 1 year 3 yr p.a. 5 yr p.a. 10 yr p.a. PAI v MSCI AC Asia Ex-Jpn (AUD)
Share price*
Performance -6.8% -8.6% -18.1% 4.2% n/a n/a
Index -1.7% -2.1% 1.1% 8.4% 7.2% 5.9%
Active return -5.1% -6.5% -19.2% -4.2% n/a n/a
NTA+
Performance 0.6% -0.6% 1.4% 7.0% n/a n/a
Benchmark -1.7% -2.1% 1.1% 8.4% 7.2% 5.9%
Active return 2.3% 1.5% 0.3% -1.4% n/a n/a
Share Price and NTA Top 10 Holdings %
as at 30-Sep-19
Samsung Electronics Co 5.8
Tencent Holdings 5.4
Taiwan Semiconductor 5.2
Alibaba Group Holding 5.0
Ping An Insurance 3.5
AIA Group Ltd 3.0
Meituan Dianping 3.0
Vietnam Enterprise 2.8
Kasikornbank PCL 2.8
Risk/Return Indicators Country Exposure (Portfolio) Axis Bank Limited 2.7
Sharpe Standard % of Total 39.2
Share price* Ratio Ratio Deviation
Year 1 -1.16 -1.00 20.0% Net Sector Exposure (Portfolio)
Year 3 -0.31 0.11 16.5%
Year 5 n/a n/a n/a
NTA+
Year 1 0.06 -0.03 12.2%
Year 3 -0.26 0.46 10.3%
Year 5 n/a n/a n/a
* The share price benchmark has been compared against the M SCI AC Asia Ex-Jpn (AUD) Index. + The NTA has been compared against the M SCI
AC Asia Ex-Jpn (AUD) Index.
*+ M easurement of a LIC’s performance is calculated after all operat ing expenses, provision and payment of both income and realised capital gains tax and the reinvestment of dividends, and do not incorporate franking.
Index returns however are ent irely before any operat ing expenses or taxat ion. LIC returns will consequent ly be understated relat ive to the Index return.
PAI aims to provide capital growth over the long-term through investing primarily in undervalued
listed securities of companies in the Asian region (ex-Japan) across sectors. In doing so, PAI
aims to achieve net returns over a five year plus investment horizon that are in excess of the
benchmark.
Premium/(Discount) share price to:
Investment Personnel: Joseph Lai (Portfolio Manager)
Directors: Margaret Towers, Ian Hunter, Malcolm Halstead & Joanne Jefferies (Company
Secretary)
Information
$0.90
$1.05
$1.20
$1.35
$1.50
Sep-18 Dec-18 Mar-19 Jun-19 Sep-19
MSCI AC Asia Ex-Jpn (AUD) Rebased PAI
China
India
Korea
Hong Kong
Taiwan
Other
Cash
-20%
-10%
0%
10%
20%
$0.50
$0.80
$1.10
$1.40
$1.70
2015 2016 2017 2018 2019
Prem/Disc (RHS) Pre-Tax NTA (LHS) Share Price (LHS)
Other
Industr ials
Real Estate
Comm. Services
IT
Financials
Consumer Disc
0% 5% 10% 15% 20%
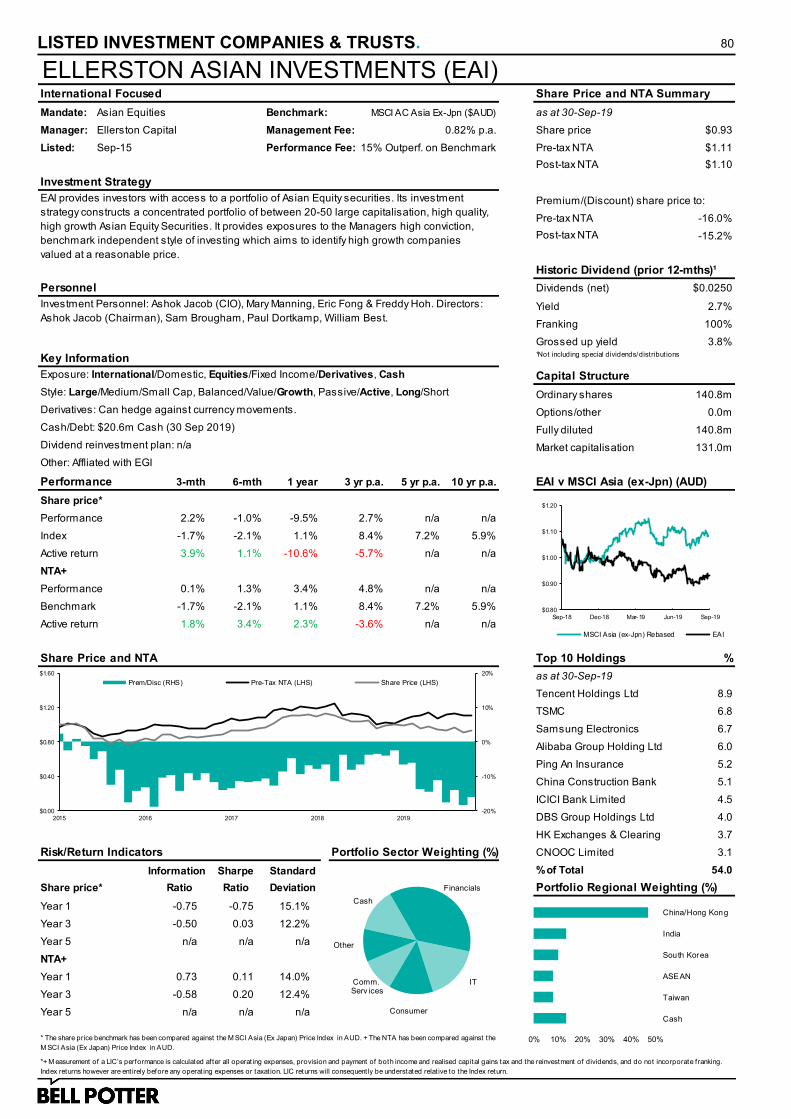
LISTED INVESTMENT COMPANIES & TRUSTS. 80
ELLERSTON ASIAN INVESTMENTS (EAI)International Focused Share Price and NTA Summary
Mandate: Asian Equities Benchmark: MSCI AC Asia Ex-Jpn ($AUD) as at 30-Sep-19
Manager: Ellerston Capital Management Fee: 0.82% p.a. Share price $0.93
Listed: Sep-15 Performance Fee: 15% Outperf. on Benchmark Pre-tax NTA $1.11
Post-tax NTA $1.10
Investment Strategy
Pre-tax NTA -16.0%
Post-tax NTA -15.2%
Historic Dividend (prior 12-mths)¹
Personnel Dividends (net) $0.0250
Yield 2.7%
Franking 100%
Grossed up yield 3.8%
Key Information ¹Not including special dividends/distribut ions
Exposure: International/Domestic, Equities/Fixed Income/Derivatives, Cash Capital Structure
Style: Large/Medium/Small Cap, Balanced/Value/Growth, Passive/Active, Long/Short Ordinary shares 140.8m
Derivatives: Can hedge against currency movements. Options/other 0.0m
Cash/Debt: $20.6m Cash (30 Sep 2019) Fully diluted 140.8m
Dividend reinvestment plan: n/a Market capitalisation 131.0m
Other: Affliated with EGI
Performance 3-mth 6-mth 1 year 3 yr p.a. 5 yr p.a. 10 yr p.a. EAI v MSCI Asia (ex-Jpn) (AUD)
Share price*
Performance 2.2% -1.0% -9.5% 2.7% n/a n/a
Index -1.7% -2.1% 1.1% 8.4% 7.2% 5.9%
Active return 3.9% 1.1% -10.6% -5.7% n/a n/a
NTA+
Performance 0.1% 1.3% 3.4% 4.8% n/a n/a
Benchmark -1.7% -2.1% 1.1% 8.4% 7.2% 5.9%
Active return 1.8% 3.4% 2.3% -3.6% n/a n/a
Share Price and NTA Top 10 Holdings %
as at 30-Sep-19
Tencent Holdings Ltd 8.9
TSMC 6.8
Samsung Electronics 6.7
Alibaba Group Holding Ltd 6.0
Ping An Insurance 5.2
China Construction Bank 5.1
ICICI Bank Limited 4.5
DBS Group Holdings Ltd 4.0
HK Exchanges & Clearing 3.7
Risk/Return Indicators Portfolio Sector Weighting (%) CNOOC Limited 3.1
Sharpe Standard % of Total 54.0
Share price* Ratio Ratio Deviation Portfolio Regional Weighting (%)
Year 1 -0.75 -0.75 15.1%
Year 3 -0.50 0.03 12.2%
Year 5 n/a n/a n/a
NTA+
Year 1 0.73 0.11 14.0%
Year 3 -0.58 0.20 12.4%
Year 5 n/a n/a n/a
* The share price benchmark has been compared against the M SCI Asia (Ex Japan) Price Index in AUD. + The NTA has been compared against the
M SCI Asia (Ex Japan) Price Index in AUD.
*+ M easurement of a LIC’s performance is calculated after all operat ing expenses, provision and payment of both income and realised capital gains tax and the reinvestment of dividends, and do not incorporate franking.
Index returns however are ent irely before any operat ing expenses or taxat ion. LIC returns will consequent ly be understated relat ive to the Index return.
EAI provides investors with access to a portfolio of Asian Equity securities. Its investment
strategy constructs a concentrated portfolio of between 20-50 large capitalisation, high quality,
high growth Asian Equity Securities. It provides exposures to the Managers high conviction,
benchmark independent style of investing which aims to identify high growth companies
valued at a reasonable price.
Premium/(Discount) share price to:
Investment Personnel: Ashok Jacob (CIO), Mary Manning, Eric Fong & Freddy Hoh. Directors:
Ashok Jacob (Chairman), Sam Brougham, Paul Dortkamp, William Best.
Information
$0.80
$0.90
$1.00
$1.10
$1.20
Sep-18 Dec-18 Mar-19 Jun-19 Sep-19
MSCI Asia (ex-Jpn) Rebased EAI
Financials
IT
Consumer
Comm. Serv ices
Other
Cash
Cash
Taiwan
ASEAN
South Korea
India
China/Hong Kong
0% 10% 20% 30% 40% 50%
-20%
-10%
0%
10%
20%
$0.00
$0.40
$0.80
$1.20
$1.60
2015 2016 2017 2018 2019
Prem/Disc (RHS) Pre-Tax NTA (LHS) Share Price (LHS)

LISTED INVESTMENT COMPANIES & TRUSTS. 81
PM CAPITAL ASIAN OPPORTUNITIES FUND (PAF)International Focused Share Price and NTA Summary
Mandate: Asian (Ex- Jpn) Equities Benchmark: MSCI AC Asia Ex-Jpn (AUD) as at 30-Sep-19
Manager: PM Capital Management Fee: 1.0% p.a. Share price $0.80
Listed: May-14 Performance Fee: 15% Outperf. of Benchmark Pre-tax NTA $1.00
Post-tax NTA $1.04
Investment Strategy
Pre-tax NTA -20.5%
Post-tax NTA -23.5%
Historic Dividend (prior 12-mths)¹
Personnel Dividends (net) $0.0350
Yield 4.4%
Franking 100%
Grossed up yield 6.3%
Key Information ¹Not including special dividends/distribut ions
Exposure: International/Domestic, Equities/Fixed Income/Derivatives, Cash Capital Structure
Style: Large/Medium/Small Cap, Balanced/Value/Growth, Passive/Active, Long/Short Ordinary shares 57.2m
Derivatives: The Manager actively manages currency exposure. Options/other 0.0m
Cash/Debt: n/a Fully diluted 57.2m
Dividend Reinvestment Plan: Yes Market capitalisation 45.5m
Other: The Manager has the ability to indirectly gear the portfolio by short selling.
Performance 3-mth 6-mth 1 year 3 yr p.a. 5 yr p.a. 10 yr p.a. PAF v MSCI Asia (ex-Jpn) Index
Share price*
Performance -14.3% -18.2% -28.8% -1.3% -0.2% n/a
Index -1.7% -2.1% 1.1% 8.4% 7.2% 5.9%
Active return -12.6% -16.1% -29.9% -9.7% -7.4% n/a
NTA+
Performance -3.0% -4.6% -10.5% 3.1% 2.6% n/a
Benchmark -1.7% -2.1% 1.1% 8.4% 7.2% 5.9%
Active return -1.3% -2.5% -11.6% -5.3% -4.6% n/a
Share Price and NTA Holding Example
as at 30-Sep-19
iCar Asia
Heineken Malaysia
Dali Food Group
MGM China Holdings
Sinopec Kantons
China Merchants Holdings International
Shinhan Financial
Freeport-McMoRan Copper
Risk/Return Indicators Domicile of listing (%) Portfolio Investment Weighting (%)
Sharpe Standard
Share price* Ratio Ratio Deviation
Year 1 -1.98 -1.35 22.7%
Year 3 -0.63 -0.19 19.2%
Year 5 -0.50 -0.15 17.5%
NTA+
Year 1 -1.21 -0.68 18.1%
Year 3 -0.59 0.05 13.3%
Year 5 -0.53 0.01 12.8%
* The share price benchmark has been compared against the M SCI Asia Ex-Japan (AUD) Index. + The NTA has been compared against the
M M SCI Asia Ex-Japan (AUD) Index.
*+ M easurement of a LIC’s performance is calculated after all operat ing expenses, provision and payment of both income and realised capital gains tax and the reinvestment of dividends, and do not incorporate franking.
Index returns however are ent irely before any operat ing expenses or taxat ion. LIC returns will consequent ly be understated relat ive to the Index return.
PAF offers investors with a diversified portfolio of around 15-35 Asian listed equities (ex-
Japan), of which the Manager considers to be undervalued. With a wide investment universive,
the Manager focuses on key thematics (like the gaming industry or the communications
industry) that the Manager believes will provide long term growth in Asia. The Manager's
investment process is a research intensive, bottom up approach which identifies both risk and
opportunity.
Premium/(Discount) share price to:
Investment Personnel: Paul Moore (CIO), Kevin Bertoli, Jarod Dawson, John Whelan, Uday
Cheruvu, Clement Tsueng, Annabelle Symons, Alex Waarnar. Directors: Brett Spork
(Chairman), Andrew McGill, Ben Skilbeck.
Information
$0.60
$0.85
$1.10
$1.35
$1.60
Sep-18 Dec-18 Mar-19 Jun-19 Sep-19
MSCI Asia (ex-Jpn) Rebased PAF
Hong Kong
Korea
North America
Australia
Malay sia
India
VietnamShort Equities
Onl ine & Ecommerce
Consumer - Breweries
Consumer - Other
Gaming
Infrastructure - Oil & Gas
Infrastructure - Other
Financials
Materials (Copper)
Other
-5% 0% 5% 10% 15% 20% 25%
-30%
-15%
0%
15%
30%
$0.00
$0.50
$1.00
$1.50
$2.00
2014 2015 2016 2017 2018 2019
Prem/Disc (RHS) Pre-Tax NTA (LHS) Share Price (LHS)
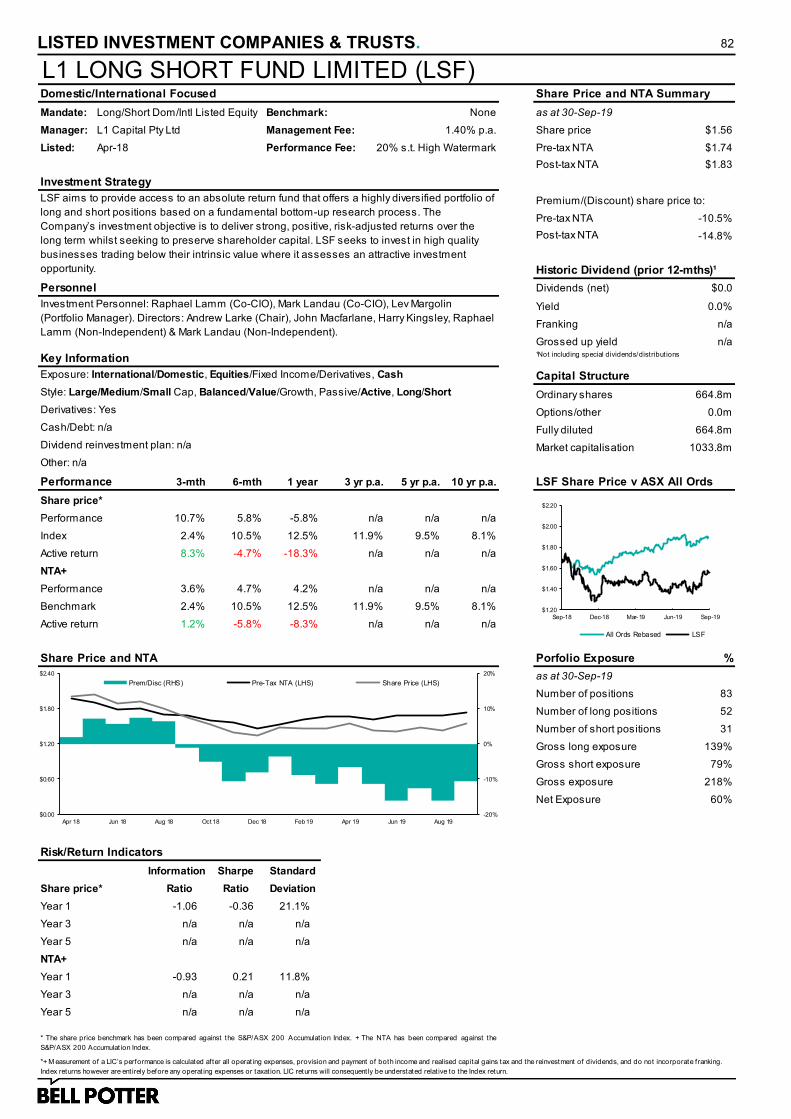
LISTED INVESTMENT COMPANIES & TRUSTS. 82
L1 LONG SHORT FUND LIMITED (LSF)Domestic/International Focused Share Price and NTA Summary
Mandate: Long/Short Dom/Intl Listed Equity Benchmark: None as at 30-Sep-19
Manager: L1 Capital Pty Ltd Management Fee: 1.40% p.a. Share price $1.56
Listed: Apr-18 Performance Fee: 20% s.t. High Watermark Pre-tax NTA $1.74
Post-tax NTA $1.83
Investment Strategy
Pre-tax NTA -10.5%
Post-tax NTA -14.8%
Historic Dividend (prior 12-mths)¹
Personnel Dividends (net) $0.0
Yield 0.0%
Franking n/a
Grossed up yield n/a
Key Information ¹Not including special dividends/distribut ions
Exposure: International/Domestic, Equities/Fixed Income/Derivatives, Cash Capital Structure
Style: Large/Medium/Small Cap, Balanced/Value/Growth, Passive/Active, Long/Short Ordinary shares 664.8m
Derivatives: Yes Options/other 0.0m
Cash/Debt: n/a Fully diluted 664.8m
Dividend reinvestment plan: n/a Market capitalisation 1033.8m
Other: n/a
Performance 3-mth 6-mth 1 year 3 yr p.a. 5 yr p.a. 10 yr p.a. LSF Share Price v ASX All Ords
Share price*
Performance 10.7% 5.8% -5.8% n/a n/a n/a
Index 2.4% 10.5% 12.5% 11.9% 9.5% 8.1%
Active return 8.3% -4.7% -18.3% n/a n/a n/a
NTA+
Performance 3.6% 4.7% 4.2% n/a n/a n/a
Benchmark 2.4% 10.5% 12.5% 11.9% 9.5% 8.1%
Active return 1.2% -5.8% -8.3% n/a n/a n/a
Share Price and NTA Porfolio Exposure %
as at 30-Sep-19
Number of positions 83
Number of long positions 52
Number of short positions 31
Gross long exposure 139%
Gross short exposure 79%
Gross exposure 218%
Net Exposure 60%
Risk/Return Indicators
Sharpe Standard
Share price* Ratio Ratio Deviation
Year 1 -1.06 -0.36 21.1%
Year 3 n/a n/a n/a
Year 5 n/a n/a n/a
NTA+
Year 1 -0.93 0.21 11.8%
Year 3 n/a n/a n/a
Year 5 n/a n/a n/a
* The share price benchmark has been compared against the S&P/ASX 200 Accumulat ion Index. + The NTA has been compared against the
S&P/ASX 200 Accumulat ion Index.
*+ M easurement of a LIC’s performance is calculated after all operat ing expenses, provision and payment of both income and realised capital gains tax and the reinvestment of dividends, and do not incorporate franking.
Index returns however are ent irely before any operat ing expenses or taxat ion. LIC returns will consequent ly be understated relat ive to the Index return.
LSF aims to provide access to an absolute return fund that offers a highly diversified portfolio of
long and short positions based on a fundamental bottom-up research process. The
Company’s investment objective is to deliver strong, positive, risk-adjusted returns over the
long term whilst seeking to preserve shareholder capital. LSF seeks to invest in high quality
businesses trading below their intrinsic value where it assesses an attractive investment
opportunity.
Premium/(Discount) share price to:
Investment Personnel: Raphael Lamm (Co-CIO), Mark Landau (Co-CIO), Lev Margolin
(Portfolio Manager). Directors: Andrew Larke (Chair), John Macfarlane, Harry Kingsley, Raphael
Lamm (Non-Independent) & Mark Landau (Non-Independent).
Information
$1.20
$1.40
$1.60
$1.80
$2.00
$2.20
Sep-18 Dec-18 Mar-19 Jun-19 Sep-19
All Ords Rebased LSF
-20%
-10%
0%
10%
20%
$0.00
$0.60
$1.20
$1.80
$2.40
Apr 18 Jun 18 Aug 18 Oct 18 Dec 18 Feb 19 Apr 19 Jun 19 Aug 19
Prem/Disc (RHS) Pre-Tax NTA (LHS) Share Price (LHS)

LISTED INVESTMENT COMPANIES & TRUSTS. 83
VGI PARTNERS GLOBAL INVESTMENTS LIMITED (VG1)International Focused Share Price and NTA Summary
Mandate: Long/Short Global Equity Benchmark: MSCI World Net TR Index (AUD) as at 30-Sep-19
Manager: VGI Partners Limited Management Fee: 1.5% p.a. Share price $2.33
Listed: Sep-17 Performance Fee: 15% (High Watermark) Pre-tax NTA $2.44
Post-tax NTA $2.44
Investment Strategy
Pre-tax NTA -4.5%
Post-tax NTA -4.5%
Historic Dividend (prior 12-mths)¹
Personnel Dividends (net) $0.0000
Yield 0.0%
Franking n/a
Grossed up yield n/a
Key Information ¹Not including special dividends/distribut ions
Exposure: International/Domestic, Equities/Fixed Income/Derivatives, Cash Capital Structure
Style: Large/Medium/Small Cap, Balanced/Value/Growth, Passive/Active, Long/Short Ordinary shares 406.9m
Derivatives: Yes Options/other 0.0m
Cash/Debt: Cash $439m (30 Sep 2019) Fully diluted 406.9m
Dividend reinvestment plan: n/a Market capitalisation 948.1m
Other: n/a
Performance 3-mth 6-mth 1 year 3 yr p.a. 5 yr p.a. 10 yr p.a. VG1 v MSCI World Index (AUD)
Share price*
Performance -1.7% -0.9% -4.9% n/a n/a n/a
Index 4.5% 10.0% 9.2% 15.0% 12.9% 12.0%
Active return -6.2% -10.9% -14.1% n/a n/a n/a
NTA+
Performance 1.7% 9.2% 10.2% n/a n/a n/a
Benchmark 4.5% 10.0% 9.2% 15.0% 12.9% 12.0%
Active return -2.8% -0.8% 1.0% n/a n/a n/a
Share Price and NTA Porfolio Exposure
as at 30-Sep-19
Number of positions 41
Number of long positions 20
Number of short positions 21
Gross long exposure 79%
Gross short exposure (24%)
Gross exposure 103%
Net Exposure 55%
Cash Weighting 45%
Risk/Return Indicators Region Exposure Top 5 Long Holdings %
Sharpe Standard as at 30-Sep-19
Share price* Ratio Ratio Deviation CME Group Inc. 11
Year 1 -1.75 -0.59 11.3% Amazon.com Inc. 7
Year 3 n/a n/a n/a Colgate Palmolive Co. 7
Year 5 n/a n/a n/a MasterCard Inc. 7
NTA+ Medibank Private Ltd. 6
Year 1 0.07 1.19 7.1% % of Total 38
Year 3 n/a n/a n/a
Year 5 n/a n/a n/a
*+ M easurement of a LIC’s performance is calculated after all operat ing expenses, management & performance fees, provision and payment of both income and realised capital gains tax and the reinvestment of dividends,
and do not incorporate franking. Index returns however are ent irely before any operat ing expenses or taxat ion. LIC returns will consequent ly be understated relat ive to the Index return.
VG1 aims to provide long term capital growth through investing in a concentrated Portfolio,
predominantly comprised of Long and Short Positions in global listed securities, actively
managed with a focus on capital preservation. The Company’s Investment Strategy will be
implemented by the Manager and is designed to capitalise on the Manager’s disciplined
investment approach and intensive research and review process.
Premium/(Discount) share price to:
Investment Personnel: Robert Luciano, Douglas Tynan, Robert Poiner.
Directors: David Jones (Chairman), Robert Luciano, Douglas Tynan, Lawrence Myers, Noel
Whittaker & Adelaide McDonald.
Information
* The share price benchmark has been compared against the M SCI World Net TR Index (AUD). + The NTA has been compared against the M SCI World Net TR Index (AUD). Share price and NTA performance data has
been adjusted for the recent Ent it lement Offer (announced M ay 2019). Part icipants in the VG1 Equity Raising were ent it led to apply for up to $1 worth of ordinary shares in the M anager IPO for every $4 worth of Shares
which they applied for in the VG1 Equity Raising
$1.80
$2.05
$2.30
$2.55
$2.80
Sep-18 Dec-18 Mar-19 Jun-19 Sep-19
MSCI World Index (AUD) Rebased VG1
-30%
-15%
0%
15%
30%
$0.75
$1.25
$1.75
$2.25
$2.75
Sep 17 Dec 17 Mar 18 Jun 18 Sep 18 Dec 18 Mar 19 Jun 19 Sep 19
Prem/Disc (RHS) Pre-Tax NTA (LHS) Share Price (LHS)
North America
Asia Pacif ic
UK & Europe

LISTED INVESTMENT COMPANIES & TRUSTS. 84
ANTIPODES GLOBAL INVESTMENT COMPANY (APL)International Focused Share Price and NTA Summary
Mandate: Absolute Return Benchmark: MSCI All Country World Net Index as at 30-Sep-19
Manager: Antipodes Partners Management Fee: 1.10% p.a. Share price $0.96
Listed: Oct-16 Performance Fee: 15% Outperf. of Benchmark Pre-tax NTA $1.12
Post-tax NTA $1.12
Investment Strategy
Pre-tax NTA -14.7%
Post-tax NTA -14.6%
Historic Dividend (prior 12-mths)¹
Personnel Dividends (net) $0.0450
Yield 4.7%
Franking 50%
Grossed up yield 5.7%
Key Information ¹Not including special dividends/distribut ions
Exposure: International/Domestic, Equities/Fixed Income/Derivatives, Cash Capital Structure
Style: Large/Medium/Small Cap, Balanced/Value/Growth, Passive/Active, Long/Short Ordinary shares 551.6m
Derivatives: Yes Options/other 0.0m
Cash/Debt: $55m cash (30 Sep 2019) Fully diluted 551.6m
Dividend reinvestment plan: Yes Market capitalisation 526.7m
Other: n/a
Performance 3-mth 6-mth 1 year 3 yr p.a. 5 yr p.a. 10 yr p.a. APL v MSCI World Index (AUD)
Share price*
Performance 2.7% -3.5% -16.2% n/a n/a n/a
Index 3.9% 8.9% 8.7% 14.5% 12.3% 11.3%
Active return -1.2% -12.4% -24.9% n/a n/a n/a
NTA+
Performance -2.1% 1.8% -11.9% n/a n/a n/a
Benchmark 3.9% 8.9% 8.7% 14.5% 12.3% 11.3%
Active return -6.0% -7.1% -20.6% n/a n/a n/a
Share Price and NTA Top 10 Holdings %
as at 30-Sep-19
Facebook 3.2
Microsoft 2.9
Ping An Insurance 2.8
Siemens 2.7
Samsung Electronics 2.7
Merck 2.5
KB Financial 2.5
Roche 2.5
Alibaba 2.5
Risk/Return Indicators Net Sector Exposure (%) Electricite de France 2.3
Sharpe Standard % of Total 26.6
Share price* Ratio Ratio Deviation Net Regional Exposure (%)
Year 1 -1.51 -1.04 17.3%
Year 3 n/a n/a n/a
Year 5 n/a n/a n/a
NTA+
Year 1 -2.99 -1.05 13.1%
Year 3 n/a n/a n/a
Year 5 n/a n/a n/a
* The share price benchmark has been compared against the M SCI All Country World Net Index. + The NTA has been compared against the M SCI
All Country World Net Index.
*+ M easurement of a LIC’s performance is calculated after all operat ing expenses, provision and payment of both income and realised capital gains tax and the reinvestment of dividends, and do not incorporate franking.
Index returns however are ent irely before any operat ing expenses or taxat ion. LIC returns will consequent ly be understated relat ive to the Index return.
APL is a global asset manager offering a pragmatic value approach. The objective of the
strategy is to generate absolute returns in excess of the benchmark, at below market levels of
risk. APL seeks to take advantage of the market’s tendency for irrational extrapolation , identify
investments that offer a high margin of safety and build portfolios with a capital preservation
focus. APL deploys multiple levers - longs, shorts and currency management - to manage risk
and drive returns. Typical net equity exposure is in the 50-100% range
Premium/(Discount) share price to:
Investment Personnel: Jacob Mitchell (PM), Andrew Baud (Deputy PM), Sunny Bangia (Deputy
PM), Graham Hay (Deputy PM). Directors: Jonathan Trollip (Chairman), Chris Cuffe, Lorraine
Berends, Andrew Findlay, Alex Ihlenfeldt.
Information
$0.80
$0.95
$1.10
$1.25
$1.40
Sep-18 Dec-18 Mar-19 Jun-19 Sep-19
MSCI World Index Rebased APL
-20%
-10%
0%
10%
20%
$0.50
$0.75
$1.00
$1.25
$1.50
2016 2017 2018 2019
Prem/Disc (RHS) Pre-Tax NTA (LHS) Share Price (LHS)
Australia
Rest of World
Korea/Taiwan
Japan
China/Hong Kong
Eurozone
North America
0% 5% 10% 15% 20%
Comms.
Industr ial
Hardware
Healthcare
Software
Banks
Internet
0% 5% 10%
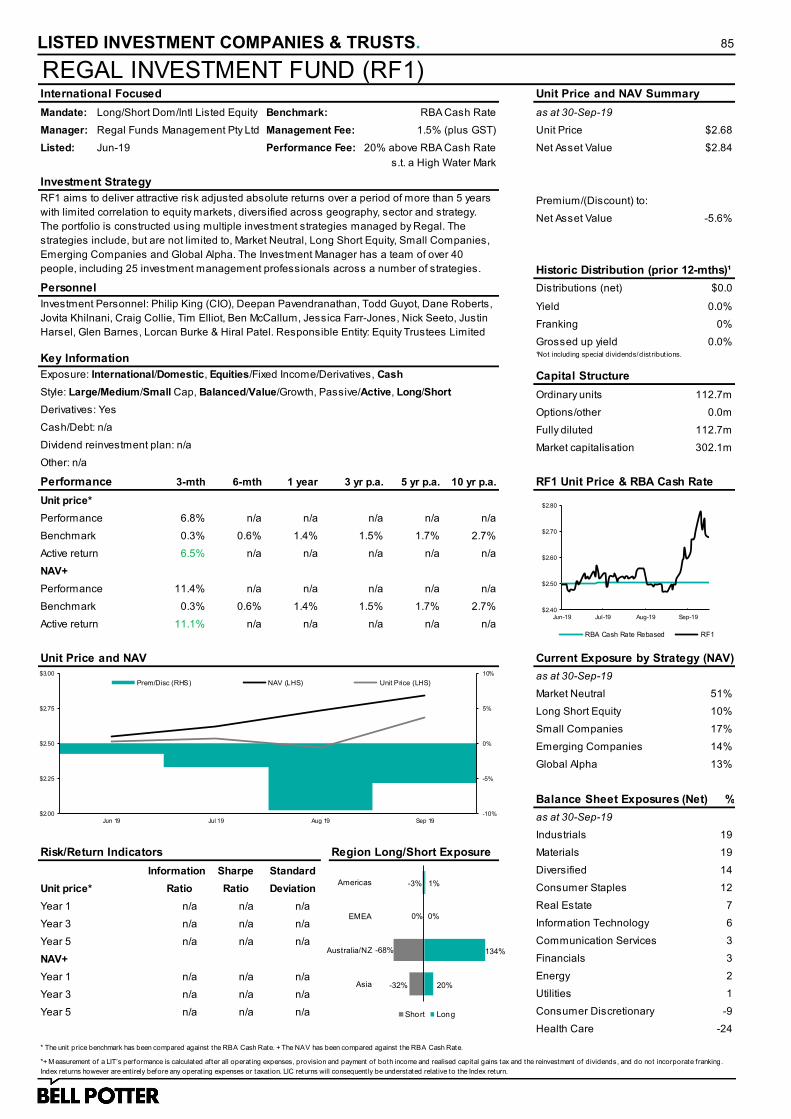
LISTED INVESTMENT COMPANIES & TRUSTS. 85
REGAL INVESTMENT FUND (RF1)International Focused Unit Price and NAV Summary
Mandate: Long/Short Dom/Intl Listed Equity Benchmark: RBA Cash Rate as at 30-Sep-19
Manager: Regal Funds Management Pty Ltd Management Fee: 1.5% (plus GST) Unit Price $2.68
Listed: Jun-19 Performance Fee: 20% above RBA Cash Rate Net Asset Value $2.84
s.t. a High Water Mark
Investment Strategy
Net Asset Value -5.6%
Historic Distribution (prior 12-mths)¹
Personnel Distributions (net) $0.0
Yield 0.0%
Franking 0%
Grossed up yield 0.0%
Key Information ¹Not including special dividends/distribut ions.
Exposure: International/Domestic, Equities/Fixed Income/Derivatives, Cash Capital Structure
Style: Large/Medium/Small Cap, Balanced/Value/Growth, Passive/Active, Long/Short Ordinary units 112.7m
Derivatives: Yes Options/other 0.0m
Cash/Debt: n/a Fully diluted 112.7m
Dividend reinvestment plan: n/a Market capitalisation 302.1m
Other: n/a
Performance 3-mth 6-mth 1 year 3 yr p.a. 5 yr p.a. 10 yr p.a. RF1 Unit Price & RBA Cash Rate
Unit price*
Performance 6.8% n/a n/a n/a n/a n/a
Benchmark 0.3% 0.6% 1.4% 1.5% 1.7% 2.7%
Active return 6.5% n/a n/a n/a n/a n/a
NAV+
Performance 11.4% n/a n/a n/a n/a n/a
Benchmark 0.3% 0.6% 1.4% 1.5% 1.7% 2.7%
Active return 11.1% n/a n/a n/a n/a n/a
Unit Price and NAV Current Exposure by Strategy (NAV)
as at 30-Sep-19
Market Neutral 51%
Long Short Equity 10%
Small Companies 17%
Emerging Companies 14%
Global Alpha 13%
Balance Sheet Exposures (Net) %
as at 30-Sep-19
Industrials 19
Risk/Return Indicators Region Long/Short Exposure Materials 19
Sharpe Standard Diversified 14
Unit price* Ratio Ratio Deviation Consumer Staples 12
Year 1 n/a n/a n/a Real Estate 7
Year 3 n/a n/a n/a Information Technology 6
Year 5 n/a n/a n/a Communication Services 3
NAV+ Financials 3
Year 1 n/a n/a n/a Energy 2
Year 3 n/a n/a n/a Utilities 1
Year 5 n/a n/a n/a Consumer Discretionary -9
Health Care -24
* The unit price benchmark has been compared against the RBA Cash Rate. + The NAV has been compared against the RBA Cash Rate.
*+ M easurement of a LIT’s performance is calculated after all operat ing expenses, provision and payment of both income and realised capital gains tax and the reinvestment of dividends, and do not incorporate franking.
Index returns however are ent irely before any operat ing expenses or taxat ion. LIC returns will consequent ly be understated relat ive to the Index return.
RF1 aims to deliver attractive risk adjusted absolute returns over a period of more than 5 years
with limited correlation to equity markets, diversified across geography, sector and strategy.
The portfolio is constructed using multiple investment strategies managed by Regal. The
strategies include, but are not limited to, Market Neutral, Long Short Equity, Small Companies,
Emerging Companies and Global Alpha. The Investment Manager has a team of over 40
people, including 25 investment management professionals across a number of strategies.
Premium/(Discount) to:
Investment Personnel: Philip King (CIO), Deepan Pavendranathan, Todd Guyot, Dane Roberts,
Jovita Khilnani, Craig Collie, Tim Elliot, Ben McCallum, Jessica Farr-Jones, Nick Seeto, Justin
Harsel, Glen Barnes, Lorcan Burke & Hiral Patel. Responsible Entity: Equity Trustees Limited
Information
$2.40
$2.50
$2.60
$2.70
$2.80
Jun-19 Jul-19 Aug-19 Sep-19
RBA Cash Rate Rebased RF1
-32%
-68%
0%
-3%
20%
134%
0%
1%
Asia
Australia/NZ
EMEA
Americas
Short Long
-10%
-5%
0%
5%
10%
$2.00
$2.25
$2.50
$2.75
$3.00
Jun 19 Jul 19 Aug 19 Sep 19
Prem/Disc (RHS) NAV (LHS) Unit Price (LHS)

LISTED INVESTMENT COMPANIES & TRUSTS. 86
AUSTRALIAN LEADERS FUND (ALF)Domestic Focused Share Price and NTA Summary
Mandate: Long/Short Aus & NZ Equity Benchmark: All Ordinaries Accumulation as at 30-Sep-19
Manager: Watermark Funds Management Management Fee: 1% p.a. Share price $0.97
Listed: Feb-04 Performance Fee: 20% Outperf. of Benchmark Pre-tax NTA $1.18
Post-tax NTA $1.17
Investment Strategy
Pre-tax NTA -17.8%
Post-tax NTA -17.1%
Historic Dividend (prior 12-mths)¹
Personnel Dividends (net) $0.0450
Yield 4.6%
Franking 72%
Grossed up yield 4.8%
Key Information ¹Not including special dividends/distribut ions
Exposure: International/Domestic, Equities/Fixed Income/Derivatives, Cash Capital Structure
Style: Large/Medium/Small Cap, Balanced/Value/Growth, Passive/Active, Long/Short Ordinary shares 240.2m
Derivatives: Ability to use share price index futures and other derivatives to manage exposures. Options/other 0.0m
Cash/Fixed Income: $305m (30 Sep 2019) Fully diluted 240.2m
Dividend Reinvestment Plan: Yes Market capitalisation 233.0m
Other:
Performance 3-mth 6-mth 1 year 3 yr p.a. 5 yr p.a. 10 yr p.a. ALF Share Price v ASX All Ords
Share price*
Performance 6.6% 7.2% -5.6% -10.7% -5.5% 5.4%
Index 2.8% 10.9% 12.1% 11.7% 9.7% 8.2%
Active return 3.8% -3.7% -17.7% -22.4% -15.2% -2.8%
NTA+
Performance 2.6% 2.6% 0.0% -1.3% 1.3% 4.8%
Benchmark 2.8% 10.9% 12.1% 11.7% 9.7% 8.2%
Active return -0.2% -8.3% -12.1% -13.0% -8.4% -3.4%
Share Price and NTA Top 20 Long Holdings %
as at 30-Jun-18
National Australia Bank 8.0
CSL Limited 4.8
Woolworths Group Limited 4.3
Westpac Banking Corp. 3.4
Xero Limited 2.9
Santos Ltd 2.8
Atlas Arteria 2.7
Insurance Australia Group 2.7
BHP Group Limited 2.6
Risk/Return Indicators Gross Portfolio Structure James hardie Industries 2.5
Sharpe Standard Elders Limited 2.4
Share price* Ratio Ratio Deviation Long Exposure 83.6% Coronado Global Res. 2.3
Year 1 -1.49 -0.97 7.6% Short Exposure -91.2% Infratil Limited 2.3
Year 3 -1.53 -1.14 11.4% Gross Exposure 174.8% Downer EDI Ltd 2.3
Year 5 -0.89 -0.62 12.9% Cash 107.5% Flight Centre Travel Group 2.2
NTA+ Net Exposure -7.5% Qube Holdings Limited 2.2
Year 1 -1.23 -0.45 3.8% Shopping Centres Aus 2.1
Year 3 -1.42 -0.81 4.5% ALS Limited 1.9
Year 5 -0.70 -0.20 5.5% TPG Telecom Limited 1.8
Sonic Healthcare Limited 1.8
% of Total 57.8* The share price benchmark has been compared against the S&P/ASX All Ordinaries Accumulat ion Index. + The NTA has been compared against
the S&P/ASX All Ordinaries Accumulat ion Index.
*+ M easurement of a LIC’s performance is calculated after all operat ing expenses, provision and payment of both income and realised capital gains tax and the reinvestment of dividends, and do not incorporate franking.
Index returns however are ent irely before any operat ing expenses or taxat ion. LIC returns will consequent ly be understated relat ive to the Index return.
ALF looks to invest in leading Australian companies, with strong business fundamentals on
attractive terms. The group has a long/short mandate that allows the company to take
advantage of both undervalued and overvalued securities. The proceeds raised from short
selling securities provides an additional source of funding for the group. These funds are
either retained in cash or re-invested into the investment portfolio of shares we expect to
outperform.
Premium/(Discount) share price to:
Investment Personnel: Justin Braitling (CIO), Daniel Broeren, Gaston Amoros, Harry Dudley,
Tim Hoff & Alex Gurman. Directors: Justin Braitling (Chairman), Julian Gosse, John Abernethy
and Geoff Wilson.
Information as at 30-Sep-19
$0.80
$0.90
$1.00
$1.10
$1.20
Sep-18 Dec-18 Mar-19 Jun-19 Sep-19
All Ords Rebased ALF
-40%
-20%
0%
20%
40%
$0.00
$0.50
$1.00
$1.50
$2.00
2004 2005 2006 2007 2008 2009 2010 2011 2012 2013 2014 2015 2016 2017 2018 2019
Prem/Disc (RHS) Pre-Tax NTA (LHS) Share Price (LHS)

LISTED INVESTMENT COMPANIES & TRUSTS. 87
ABSOLUTE EQUITY PERFORMANCE FUND (AEG)Domestic Focused Share Price and NTA Summary
Mandate: Market Neutral Benchmark: None as at 30-Sep-19
Manager: Bennelong Long Short Equity Management Fee: 1.5% p.a Share price $0.97
Listed: Dec-15 Performance Fee: 20% Positive Perf. s.t. HWM Pre-tax NTA $1.04
Post-tax NTA $1.05
Investment Strategy
Pre-tax NTA -6.8%
Post-tax NTA -7.7%
Historic Dividend (prior 12-mths)¹
Personnel Dividends (net) $0.0450
Yield 4.7%
Franking 100%
Grossed up yield 6.7%
Key Information ¹Not including special dividends/distribut ions
Exposure: International/Domestic, Equities/Fixed Income/Derivatives, Cash Capital Structure
Style: Large/Medium/Small Cap, Balanced/Value/Growth, Passive/Active, Long/Short Ordinary shares 98.5m
Derivatives: Mandate allows for use of derivatives Options/other 0.0m
Cash/Debt: $101m cash (30 Sep 2019) Fully diluted 98.5m
Dividend Reinvestment Plan: Yes (No discount) Market capitalisation 95.1m
Other: n/a
Performance 3-mth 6-mth 1 year 3 yr p.a. 5 yr p.a. 10 yr p.a. AEG Share Price v ASX All Ords
Share price*
Performance 14.9% 7.5% -15.5% 0.1% n/a n/a
Index 2.8% 10.9% 12.1% 11.7% 9.7% 8.2%
Active return 12.1% -3.4% -27.6% -11.6% n/a n/a
NTA+
Performance 5.2% 6.1% -7.5% 4.7% n/a n/a
Benchmark 0.3% 0.6% 1.4% 1.5% 1.7% 2.7%
Active return 4.9% 5.5% -8.9% 3.2% n/a n/a
Share Price and NTA Long Equity Positions Example
as at 30-Jun-19
Aristocrat Leisure Limited
Iluka Resources Limited
Transurban Group
ALS Limited
CSL Limited
Brambles Limited
TPG Telecom Limited
Orica Limited
Resmed Inc
Risk/Return Indicators Gross Portfolio Structure Origin Energy Limited
Sharpe Standard Oil Search Limited
Share price* Ratio Ratio Deviation Long Exposure 50.6% James Hardie Industries SE
Year 1 -1.28 -0.94 18.4% Short Exposure -49.4% Magellan Financial Group Limited
Year 3 -0.66 -0.15 15.7% Net Exposure 1.2% Macquarie Group Limited
Year 5 n/a n/a n/a Cash 98.8% Bluescope Steel Limited
NTA+ Total 100.0% Xero Limited
Year 1 -0.74 -0.77 12.0% Leverage Factor 4.5 Qantas Airways Limited
Year 3 0.25 0.18 12.9% Ramsay Health Care Limited
Year 5 n/a n/a n/a Woolworths Limited
Carsales.com Limited* The share price has been compared against the S&P/ASX All Ordinaries Accumulat ion Index. + The NTA has been compared against the RBA
Cash Rate.
*+ M easurement of a LIC’s performance is calculated after all operat ing expenses, provision and payment of both income and realised capital gains tax and the reinvestment of dividends, and do not incorporate franking.
Index returns however are ent irely before any operat ing expenses or taxat ion. LIC returns will consequent ly be understated relat ive to the Index return.
AEG focuses on minimising market risk, sector risk and exogenous risk by creating a market
neutral fund through a portfolio of pair trades within primarily the ASX 100. A Pair Trade involves
short selling a security and using the proceeds to purchase a security in a similar industry with
an equal dollar value. These trades exhibit low volatility and isolate company specific risk, a
risk the Manager believes they have a greater ability to control. Given the low volatility the
strategy is then leveraged approx. 4.5x to get a similar risk level to the ASX.
Premium/(Discount) share price to:
Investment Personnel: Sam Shepherd (PM), Sam Taylor, Steven Lambeth, Justin Hay, Daniel
Sanelli . Directors: Marc Fisher (Chairman),Graham Hand, Andrew Reeve-Parker.
Information as at 30-Sep-19
$0.80
$0.95
$1.10
$1.25
$1.40
Sep-18 Dec-18 Mar-19 Jun-19 Sep-19
All Ords Rebased AEG
-40%
-20%
0%
20%
40%
$0.60
$0.85
$1.10
$1.35
$1.60
2015 2016 2017 2018 2019
Prem/Disc (RHS) Pre-Tax NTA (LHS) Share Price (LHS)

LISTED INVESTMENT COMPANIES & TRUSTS. 88
URB INVESTMENTS (URB)Domestic Focused Share Price and NTA Summary
Mandate: Australian Listed Equity& Property Benchmark: 8.0% p.a. Hurdle as at 30-Sep-19
Manager: Contact Asset Mgmt Management Fee: 0.5% p.a. Share price $1.03
Listed: Apr-17 Performance Fee: 15% over 8.0% Hurdle Pre-tax NTA $1.19
Post-tax NTA $1.18
Investment Strategy
Pre-tax NTA -13.4%
Post-tax NTA -12.7%
Historic Dividend (prior 12-mths)¹
Personnel Dividends (net) $0.0225
Yield 2.2%
Franking 100%
Grossed up yield 3.1%
Key Information ¹Not including special dividends/distribut ions
Exposure: International/Domestic, Equities/Fixed Income/Property/Derivatives, Cash Capital Structure
Style: Large/Medium/Small Cap, Balanced/Value/Growth, Passive/Active, Long/Short Ordinary shares 74.0m
Derivatives: n/a Options/other 0.0m
Cash/Debt: $31m cash (30 Sep 2019) Fully diluted 74.0m
Dividend reinvestment plan: n/a Market capitalisation 76.2m
Other: n/a
Performance 3-mth 6-mth 1 year 3 yr p.a. 5 yr p.a. 10 yr p.a. URB Share Price v ASX All Ords
Share price*
Performance 1.9% 16.9% 10.1% n/a n/a n/a
Index 2.8% 10.9% 12.1% 11.7% 9.7% 8.2%
Active return -0.9% 6.0% -2.0% n/a n/a n/a
NTA+
Performance 7.0% 10.8% 14.6% n/a n/a n/a
Benchmark 1.9% 3.9% 8.0% 8.0% 8.0% 8.0%
Active return 5.1% 6.9% 6.6% n/a n/a n/a
Share Price and NTA Top 20 Holdings %
as at 30-Sep-19
PURT No 4: Penrith 8.7
Transurban Group 6.3
Lendlease Group 6.0
Sydney Airport 6.0
Harvey Norman Holdings 4.1
Home HQ Artarmon 3.3
Woolworths Limited 3.1
CIMIC Group 3.1
Regis Healthcare Limited 2.7
Risk/Return Indicators Portoflio Exposure 360 Capital Group Limited 2.5
Sharpe Standard Goodman Group 2.5
Share price* Ratio Ratio Deviation Ramsay Health Care 2.3
Year 1 -0.14 0.55 15.1% Mirvac Group 2.2
Year 3 n/a n/a n/a Wesfarmers Limited 2.0
Year 5 n/a n/a n/a Cedar Woods Properties 1.6
NTA+ Reece Limited 1.5
Year 1 0.91 1.77 7.3% AV Jennings 1.3
Year 3 n/a n/a n/a Blackwall Property Trust 1.2
Year 5 n/a n/a n/a REA Group 1.1
GDI Property Group 1.0
% of Total 62.5* The share price benchmark has been compared against the S&P/ASX All Ordinaries Accumulat ion Index. + The NTA has been compared against
the 8.0% performance benchmark.
*+ M easurement of a LIC’s performance is calculated after all operat ing expenses, provision and payment of both income and realised capital gains tax and the reinvestment of dividends, and do not incorporate franking.
Index returns however are ent irely before any operat ing expenses or taxat ion. LIC returns will consequent ly be understated relat ive to the Index return.
URB is a research driven LIC focused on capturing long-term value by investing in a diversified
portfolio of assets with exposure to urban renewal and regeneration. URB provides
shareholders access to a diversified portfolio of equity assets exposed to urban renewal as
well as direct access to exclusive urban renewal deals through a co-invest agreement with
Soul Pattinson in all Direct Property opportunities.
Premium/(Discount) share price to:
Investment Personnel: Tom Millner, Will Culbert. Directors: Warwick Negus (Chairman),
Victoria Weekes, Tony McDonald, Bruce Dungey.
Information
$0.80
$0.90
$1.00
$1.10
$1.20
Sep-18 Dec-18 Mar-19 Jun-19 Sep-19
All Ords Rebased URB
Equity Assets
Direct Property
Cash
-30%
-15%
0%
15%
30%
$0.40
$0.65
$0.90
$1.15
$1.40
2017 2018 2019
Prem/Disc (RHS) Pre-Tax NTA (LHS) Share Price (LHS)
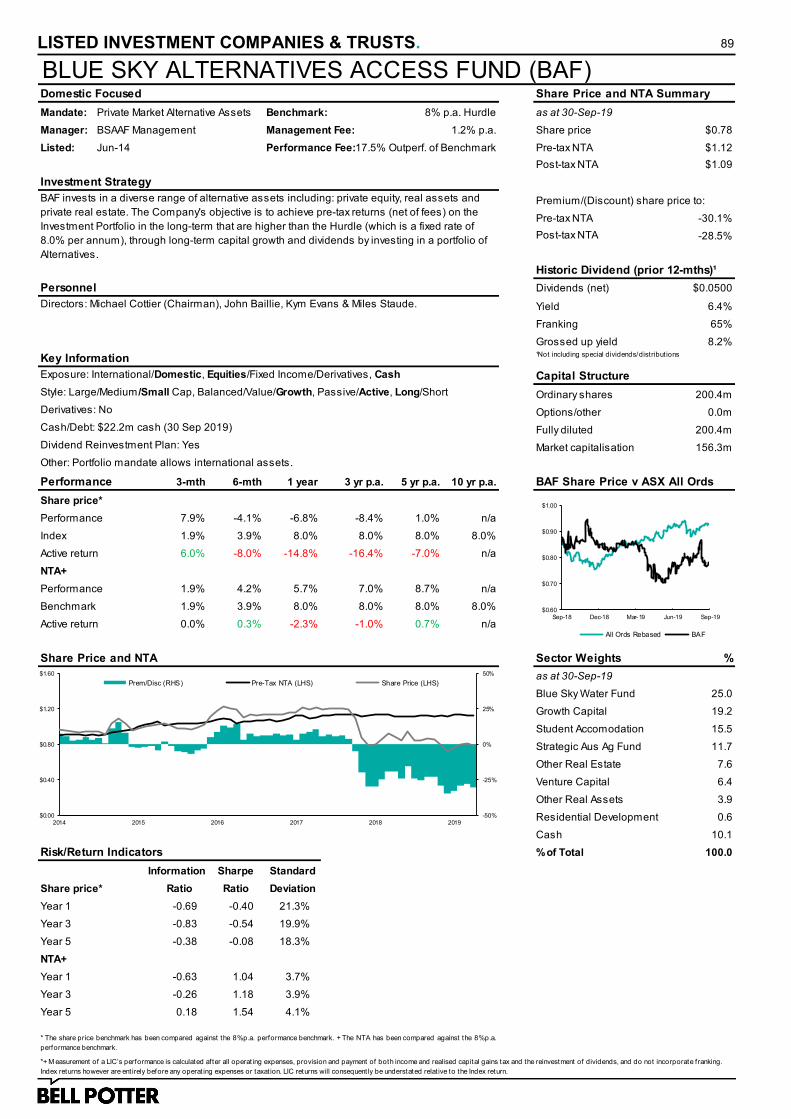
LISTED INVESTMENT COMPANIES & TRUSTS. 89
BLUE SKY ALTERNATIVES ACCESS FUND (BAF)Domestic Focused Share Price and NTA Summary
Mandate: Private Market Alternative Assets Benchmark: 8% p.a. Hurdle as at 30-Sep-19
Manager: BSAAF Management Management Fee: 1.2% p.a. Share price $0.78
Listed: Jun-14 Performance Fee:17.5% Outperf. of Benchmark Pre-tax NTA $1.12
Post-tax NTA $1.09
Investment Strategy
Pre-tax NTA -30.1%
Post-tax NTA -28.5%
Historic Dividend (prior 12-mths)¹
Personnel Dividends (net) $0.0500
Yield 6.4%
Franking 65%
Grossed up yield 8.2%
Key Information ¹Not including special dividends/distribut ions
Exposure: International/Domestic, Equities/Fixed Income/Derivatives, Cash Capital Structure
Style: Large/Medium /Small Cap, Balanced/Value/Growth, Passive/Active, Long/Short Ordinary shares 200.4m
Derivatives: No Options/other 0.0m
Cash/Debt: $22.2m cash (30 Sep 2019) Fully diluted 200.4m
Dividend Reinvestment Plan: Yes Market capitalisation 156.3m
Other: Portfolio mandate allows international assets.
Performance 3-mth 6-mth 1 year 3 yr p.a. 5 yr p.a. 10 yr p.a. BAF Share Price v ASX All Ords
Share price*
Performance 7.9% -4.1% -6.8% -8.4% 1.0% n/a
Index 1.9% 3.9% 8.0% 8.0% 8.0% 8.0%
Active return 6.0% -8.0% -14.8% -16.4% -7.0% n/a
NTA+
Performance 1.9% 4.2% 5.7% 7.0% 8.7% n/a
Benchmark 1.9% 3.9% 8.0% 8.0% 8.0% 8.0%
Active return 0.0% 0.3% -2.3% -1.0% 0.7% n/a
Share Price and NTA Sector Weights %
as at 30-Sep-19
Blue Sky Water Fund 25.0
Growth Capital 19.2
Student Accomodation 15.5
Strategic Aus Ag Fund 11.7
Other Real Estate 7.6
Venture Capital 6.4
Other Real Assets 3.9
Residential Development 0.6
Cash 10.1
Risk/Return Indicators % of Total 100.0
Sharpe Standard
Share price* Ratio Ratio Deviation
Year 1 -0.69 -0.40 21.3%
Year 3 -0.83 -0.54 19.9%
Year 5 -0.38 -0.08 18.3%
NTA+
Year 1 -0.63 1.04 3.7%
Year 3 -0.26 1.18 3.9%
Year 5 0.18 1.54 4.1%
* The share price benchmark has been compared against the 8%p.a. performance benchmark. + The NTA has been compared against the 8%p.a.
performance benchmark.
*+ M easurement of a LIC’s performance is calculated after all operat ing expenses, provision and payment of both income and realised capital gains tax and the reinvestment of dividends, and do not incorporate franking.
Index returns however are ent irely before any operat ing expenses or taxat ion. LIC returns will consequent ly be understated relat ive to the Index return.
BAF invests in a diverse range of alternative assets including: private equity, real assets and
private real estate. The Company's objective is to achieve pre-tax returns (net of fees) on the
Investment Portfolio in the long-term that are higher than the Hurdle (which is a fixed rate of
8.0% per annum), through long-term capital growth and dividends by investing in a portfolio of
Alternatives.
Premium/(Discount) share price to:
Directors: Michael Cottier (Chairman), John Baillie, Kym Evans & Miles Staude.
Information
$0.60
$0.70
$0.80
$0.90
$1.00
Sep-18 Dec-18 Mar-19 Jun-19 Sep-19
All Ords Rebased BAF
-50%
-25%
0%
25%
50%
$0.00
$0.40
$0.80
$1.20
$1.60
2014 2015 2016 2017 2018 2019
Prem/Disc (RHS) Pre-Tax NTA (LHS) Share Price (LHS)

LISTED INVESTMENT COMPANIES & TRUSTS. 90
PENGANA PRIVATE EQUITY TRUST (PE1)International Focused Unit Price and NAV Summary
Mandate: International Private Equity Benchmark: 8% p.a. Hurdle as at 30-Sep-19
Manager: Pengana Capital Limited Management Fee: 1.25% p.a. Unit price $1.45
Listed: Apr-19 Performance Fee: 20% Outperf. of Benchmark NAV $1.39
s.t. to a High Water Mark
Investment Strategy
NAV 4.2%
Historic Distribution (prior 12-mths)¹
Personnel Distributions (net) $0.0000
Yield 0.0%
Franking n/a
Grossed up yield n/a
Key Information ¹Not including special dividends/distribut ions
Exposure: International/Domestic, Equities/Fixed Income/Derivatives, Cash Capital Structure
Style: Large/Medium/Small Cap, Balanced/Value/Growth, Passive/Active, Long/Short Ordinary Units 164.0m
Derivatives: n/a Options/other 0.0m
Cash/Debt: n/a cash (30 Sep 2019) Fully diluted 164.0m
Dividend reinvestment plan: Yes Market capitalisation 237.8m
Other: Pengana Investment Management Limited acts as the Responsible Entity
Performance 3-mth 6-mth 1 year 3 yr p.a. 5 yr p.a. 10 yr p.a. PE1 v MSCI World Index (AUD)
Unit price*
Performance 14.2% n/a n/a n/a n/a n/a
Benchmark 1.9% 3.9% 8.0% 8.0% 8.0% 8.0%
Active return 12.3% n/a n/a n/a n/a n/a
NAV+
Performance 5.9% n/a n/a n/a n/a n/a
Benchmark 1.9% 3.9% 8.0% 8.0% 8.0% 8.0%
Active return 4.0% n/a n/a n/a n/a n/a
Unit Price and NAV Allocations by Investment Type %
as at 30-Sep-19
PE Co-Investments 9
PE Primaries 1
Opportunistic 9
Short Duration Credit 76
Alignment Shares 4
Cash 0
Values may not sum to 100% due to rounding.
Risk/Return Indicators
Sharpe Standard
Unit price* Ratio Ratio Deviation
Year 1 n/a n/a n/a
Year 3 n/a n/a n/a
Year 5 n/a n/a n/a
NAV+
Year 1 n/a n/a n/a
Year 3 n/a n/a n/a
Year 5 n/a n/a n/a
* The unit price benchmark has been compared against the 8% Return Hurdle. + The NAV has been compared against the 8% Return Hurdle.
*+ M easurement of a LIT’s performance is calculated after all operat ing expenses, provision and payment of both income and realised capital gains tax and the reinvestment of dividends, and do not incorporate franking.
Index returns however are ent irely before any operat ing expenses or taxat ion. LIC returns will consequent ly be understated relat ive to the Index return.
PE1 will invest in private equity, private credit and other opportunistic investments. The portfolio
is managed by Grosvenor Capital Management, L.P. and will be diversified across underlying
investment managers, geographies, sectors and strategies. Grosvenor Capital Management,
L.P. is a global alternative asset management firm with a record of investing in private markets
dating back to 1999. The Trust aims to deliver attractive returns and capital growth over an
investment horizon of at least 10 years, with a target income distribution of 4% p.a.
Premium/(Discount) to:
Investment Manager: Grosvenor Capital Management, L.P. Investment Personnel: Jonathan
Levin, Jason Metakis, Frederick Pollock, Brian Sullivan & Bradley Meyers.
Directors: Ellis Varejes, Ilan Zimerman, Russel Pillemer & Katrina Glendinning.
Information
$1.00
$1.15
$1.30
$1.45
$1.60
Apr-19 May-19 Jun-19 Jul-19 Aug-19 Sep-19
MSCI - World Index Rebased PE1
-10%
-5%
0%
5%
10%
$1.00
$1.15
$1.30
$1.45
$1.60
Apr 19 May 19 Jun 19 Jul 19 Aug 19 Sep 19
Prem/Disc (RHS) NAV (LHS) Unit Price (LHS)

LISTED INVESTMENT COMPANIES & TRUSTS. 91
BAILADOR TECHNOLOGY INVESTMENT (BTI)Domestic Focused Share Price and NTA Summary
Mandate: Aus/NZ Unlisted Techonology Benchmark: 8% p.a. Hurdle as at 30-Sep-19
Manager: Bailador Investment Management Management Fee: 1.75% p.a. Share price $0.95
Listed: Nov-14 Performance Fee:17.5% Outperf. of benchmark Pre-tax NTA $1.18
Calculated on the total NTA gain in the Fin. Year Post-tax NTA $1.11
Investment Strategy
Pre-tax NTA -19.5%
Post-tax NTA -14.4%
Historic Dividend (prior 12-mths)¹
Personnel Dividends (net) $0.0000
Yield 0.0%
Franking n/a
Grossed up yield n/a
Key Information ¹Not including special dividends/distribut ions
Exposure: International/Domestic, Equities/Fixed Income/Derivatives, Cash Capital Structure
Style: Large/Medium /Small Cap, Balanced/Value/Growth, Passive/Active, Long/Short Ordinary shares 120.2m
Derivatives: The Company may use Financial Derivatives Options/other 0.0m
Cash/Debt: $2.2m cash (30 Sep 2019) Fully diluted 120.2m
Dividend Reinvestment Plan: No Market capitalisation 114.2m
Other: Accrued performance fees can only be paid out of cash realisations of investments
Performance 3-mth 6-mth 1 year 3 yr p.a. 5 yr p.a. 10 yr p.a. BTI Share Price v ASX All Ords
Share price*
Performance -9.5% 18.8% 5.6% -3.4% n/a n/a
Benchmark 1.9% 3.9% 8.0% 8.0% 8.0% 8.0%
Active return -11.4% 14.9% -2.4% -11.4% n/a n/a
NTA+
Performance -9.9% 0.9% 1.7% 0.3% n/a n/a
Benchmark 1.9% 3.9% 8.0% 8.0% 8.0% 8.0%
Active return -11.8% -3.0% -6.3% -7.7% n/a n/a
Share Price and NTA Portfolio Holdings %
as at 30-Sep-19
SiteMinder 51.5
Instaclustr 13.4
Straker Translations 8.0
DocsCorp 7.7
Lendi 7.6
SMI 6.8
Rezdy 4.2
Brosa 2.1
Stackla 0.0
Risk/Return Indicators Implied Gain in Valuation (%) Viostream 0.0
Sharpe Standard Cash 1.6
Share price* Ratio Ratio Deviation Other -2.8
Year 1 -0.10 0.16 23.3% % of Total 100.0
Year 3 -0.55 -0.28 20.8%
Year 5 n/a n/a n/a
NTA+
Year 1 -0.38 0.00 16.4%
Year 3 -0.67 -0.18 11.6%
Year 5 n/a n/a n/a
* The share price benchmark has been compared against the 8%p.a. performance benchmark. + The NTA has been compared against the 8%p.a.
performance benchmark
*+ M easurement of a LIC’s performance is calculated after all operat ing expenses, provision and payment of both income and realised capital gains tax and the reinvestment of dividends, and do not incorporate franking.
Index returns however are ent irely before any operat ing expenses or taxat ion. LIC returns will consequent ly be understated relat ive to the Index return.
BTI invests in private Australian and New Zealand information technology companies that are
in the ‘expansion stage’ of their business cycle . These companies typically generate a
minimum of $5m in revenue from a growing customer base at attractive unit economics. The
Manager primarily focuses on companies that are addressing large global markets with
subscription or marketplace models.
Premium/(Discount) share price to:
Investment Personnel: David Kirk, Paul Wilson, James Johnstone, Bevin Shields & Michael
Hayes. Directors: David Kirk (Chairman), Paul Wilson, Andrew Bullock, Jolanta Masojada &
Brodie Arnhold.
Information
$0.60
$0.75
$0.90
$1.05
$1.20
Sep-18 Dec-18 Mar-19 Jun-19 Sep-19
All Ords Rebased BTI
Stackla
Viostream
Brosa
SMI
Rezdy
Lendi
DocsCorp
Straker Translations
Instaclustr
SiteMinder
-100% 100% 300% 500%
-50%
-25%
0%
25%
50%
$0.00
$0.40
$0.80
$1.20
$1.60
2014 2015 2016 2017 2018 2019
Prem/Disc (RHS) Pre-Tax NTA (LHS) Share Price (LHS)

LISTED INVESTMENT COMPANIES & TRUSTS. 92
GRYPHON CAPITAL INCOME TRUST (GCI)Domestic Focused Unit Price and NTA Summary
Mandate: Australian Fixed Income Benchmark: None as at 30-Sep-19
Manager: Gryphon Capital Investments Management Fee:0.72% p.a. (incl. GST & RITC) Unit price $2.08
Listed: May-18 Target Return: RBA Cash +3.50% (Net of Fees) NTA $2.01
Investment Strategy
NTA 3.7%
Historic Distribution (prior 12-mths)¹
Personnel Distribution (net) $0.1016
Yield 5.3%
Franking 0%
Grossed up yield 5.3%
Key Information ¹Not including special dividends/distribut ions
Exposure: International/Domestic, Equities/Fixed Income/Derivatives, Cash Capital Structure
Style: Large/Medium/Small Cap, Balanced/Value/Growth, Passive/Active, Long/Short Ordinary units 154.6m
Derivatives: n/a. Options/other 0.0m
Cash/Debt: $24.4m cash (30 Sep 2019) Fully diluted 154.6m
Dividend Reinvestment Plan: No Market capitalisation 321.6m
Other: One Managed Investment Funds Limited is the Responsible Entity
Performance 3-mth 6-mth 1 year 3 yr p.a. 5 yr p.a. 10 yr p.a. GCI Unit Price v RBA Cash Rate
Unit price*
Performance 2.1% 6.0% 11.0% n/a n/a n/a
Target return 1.1% 2.3% 4.9% 5.0% 5.2% 6.2%
Active return 1.0% 3.7% 6.1% n/a n/a n/a
NTA+
Performance 1.3% 2.6% 5.5% n/a n/a n/a
Target return 1.1% 2.3% 4.9% 5.0% 5.2% 6.2%
Active return 0.2% 0.3% 0.6% n/a n/a n/a
Share Price and NTA Rating Breakdown %
as at 30-Sep-19
AAA 2
AA* 10
A 28
BBB 30
BB 16
B 4
NR 7
Other 3
% of Total 100
Risk/Return Indicators Portfolio Profile *Includes Cash & Cash Equivalents
Sharpe Standard
Unit price* Ratio Ratio Deviation
Year 1 1.22 1.83 5.0%
Year 3 n/a n/a n/a
Year 5 n/a n/a n/a
NTA+
Year 1 1.47 9.06 0.4%
Year 3 n/a n/a n/a
Year 5 n/a n/a n/a
*+ M easurement of a LIT’s performance is calculated after all operat ing expenses, provision and payment of both income and realised capital gains tax and the reinvestment of dividends, and do not incorporate franking.
Index returns however are ent irely before any operat ing expenses or taxat ion. LIC returns will consequent ly be understated relat ive to the Index return.
GCI is a LIT aimed at providing Unitholders with exposure to the Australian securitised fixed
income market, a large market (> A$100 billion) which is dominated by institutional investors.
The investment objective of the Trust is to generate attractive risk adjusted returns principally
through monthly income distributions with a low risk of capital loss. The Trust’s Target Return
is RBA Cash Rate plus 3.50% per annum net of fees through the economic cycle. The Target
Return is not a forecast and is not guaranteed.
Premium/(Discount) to:
Investment Personnel: Steven Fleming, Ashley Burtenshaw, Sergey Podzorov, Shane Stanton &
Vijay Singh.
Information
* The unit price has been compared against the tartget rate RBA Cash +3.50% (Net of Fees). + The NTA has been compared against the target rate RBA Cash +3.50% (Net of Fees). From the incept ion date (21 M ay 2018)
through to Sep 2018, the GCI investment port folio was in a ramp-up stage as the trust looked to construct its target port folio. As stated in the GCI PDS, the returns during this phase were expected to be below the target
return and that the target returns would not be met unt il the full target port folio was in place. Target port folio was achieved by the end of Sep 2018.
$1.90
$1.95
$2.00
$2.05
$2.10
Sep-18 Dec-18 Mar-19 Jun-19 Sep-19
RBA Cash Rate Rebased GCI
Prime RMBS
ABS
Non-conf orming RMBS
Cash
-10%
-5%
0%
5%
10%
$1.20
$1.50
$1.80
$2.10
$2.40
May 18 Jul 18 Sep 18 Nov 18 Jan 19 Mar 19 May 19 Jul 19 Sep 19
Prem/Disc (RHS) NTA (LHS) Unit Price (LHS)
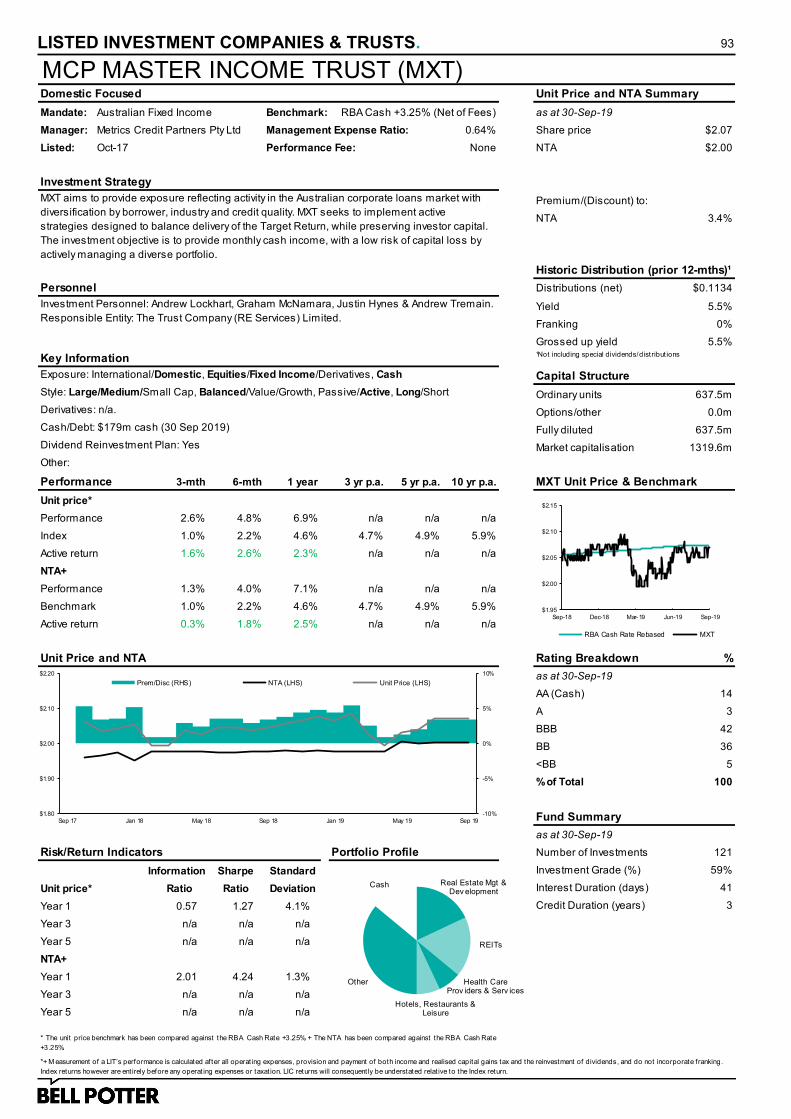
LISTED INVESTMENT COMPANIES & TRUSTS. 93
MCP MASTER INCOME TRUST (MXT)Domestic Focused Unit Price and NTA Summary
Mandate: Australian Fixed Income Benchmark: RBA Cash +3.25% (Net of Fees) as at 30-Sep-19
Manager: Metrics Credit Partners Pty Ltd Management Expense Ratio: 0.64% Share price $2.07
Listed: Oct-17 Performance Fee: None NTA $2.00
Investment Strategy
NTA 3.4%
Historic Distribution (prior 12-mths)¹
Personnel Distributions (net) $0.1134
Yield 5.5%
Franking 0%
Grossed up yield 5.5%
Key Information ¹Not including special dividends/distribut ions
Exposure: International/Domestic, Equities/Fixed Income/Derivatives, Cash Capital Structure
Style: Large/Medium/Small Cap, Balanced/Value/Growth, Passive/Active, Long/Short Ordinary units 637.5m
Derivatives: n/a. Options/other 0.0m
Cash/Debt: $179m cash (30 Sep 2019) Fully diluted 637.5m
Dividend Reinvestment Plan: Yes Market capitalisation 1319.6m
Other:
Performance 3-mth 6-mth 1 year 3 yr p.a. 5 yr p.a. 10 yr p.a. MXT Unit Price & Benchmark
Unit price*
Performance 2.6% 4.8% 6.9% n/a n/a n/a
Index 1.0% 2.2% 4.6% 4.7% 4.9% 5.9%
Active return 1.6% 2.6% 2.3% n/a n/a n/a
NTA+
Performance 1.3% 4.0% 7.1% n/a n/a n/a
Benchmark 1.0% 2.2% 4.6% 4.7% 4.9% 5.9%
Active return 0.3% 1.8% 2.5% n/a n/a n/a
Unit Price and NTA Rating Breakdown %
as at 30-Sep-19
AA (Cash) 14
A 3
BBB 42
BB 36
<BB 5
% of Total 100
Fund Summary
as at 30-Sep-19
Risk/Return Indicators Portfolio Profile Number of Investments 121
Sharpe Standard Investment Grade (%) 59%
Unit price* Ratio Ratio Deviation Interest Duration (days) 41
Year 1 0.57 1.27 4.1% Credit Duration (years) 3
Year 3 n/a n/a n/a
Year 5 n/a n/a n/a
NTA+
Year 1 2.01 4.24 1.3%
Year 3 n/a n/a n/a
Year 5 n/a n/a n/a
* The unit price benchmark has been compared against the RBA Cash Rate +3.25%. + The NTA has been compared against the RBA Cash Rate
+3.25%.
*+ M easurement of a LIT’s performance is calculated after all operat ing expenses, provision and payment of both income and realised capital gains tax and the reinvestment of dividends, and do not incorporate franking.
Index returns however are ent irely before any operat ing expenses or taxat ion. LIC returns will consequent ly be understated relat ive to the Index return.
MXT aims to provide exposure reflecting activity in the Australian corporate loans market with
diversification by borrower, industry and credit quality. MXT seeks to implement active
strategies designed to balance delivery of the Target Return, while preserving investor capital.
The investment objective is to provide monthly cash income, with a low risk of capital loss by
actively managing a diverse portfolio.
Premium/(Discount) to:
Investment Personnel: Andrew Lockhart, Graham McNamara, Justin Hynes & Andrew Tremain.
Responsible Entity: The Trust Company (RE Services) Limited.
Information
$1.95
$2.00
$2.05
$2.10
$2.15
Sep-18 Dec-18 Mar-19 Jun-19 Sep-19
RBA Cash Rate Rebased MXT
Real Estate Mgt & Dev elopment
REITs
Health Care Prov iders & Serv ices
Hotels, Restaurants & Leisure
Other
Cash
-10%
-5%
0%
5%
10%
$1.80
$1.90
$2.00
$2.10
$2.20
Sep 17 Jan 18 May 18 Sep 18 Jan 19 May 19 Sep 19
Prem/Disc (RHS) NTA (LHS) Unit Price (LHS)

LISTED INVESTMENT COMPANIES & TRUSTS. 94
MCP INCOME OPPORTUNITIES TRUST (MOT)Domestic Focused Unit Price and NTA Summary
Mandate: Australian Fixed Income Benchmark: RBA Cash Rate plus 6.0% p.a. as at 30-Sep-19
Manager: Metrics Credit Partners Pty Ltd Management Expense Ratio: 1.03% p.a. Unit price $2.07
Listed: Apr-19 Performance Fee: 15.38% p.a. over Benchmark NTA $2.01
Investment Strategy
NTA 3.2%
Historic Distribution (prior 12-mths)¹
Personnel Distributions (net) $0.1120
Yield 5.4%
Franking 0%
Grossed up yield 5.4%
Key Information ¹Not including special dividends/distribut ions. Annualised
Exposure: International/Domestic, Equities/Fixed Income/Derivatives, Cash Capital Structure
Style: Large/Medium/Small Cap, Balanced/Value/Growth, Passive/Active, Long/Short Ordinary units 150.1m
Derivatives: n/a. Options/other 0.0m
Cash/Debt: $15m cash (30 Sep 2019) Fully diluted 150.1m
Dividend Reinvestment Plan: Yes Market capitalisation 310.7m
Other:
Performance 3-mth 6-mth 1 year 3 yr p.a. 5 yr p.a. 10 yr p.a. MOT Unit Price & Benchmark
Unit price*
Performance 3.2% n/a n/a n/a n/a n/a
Benchmark 1.7% 3.5% 7.4% 7.5% 7.7% 8.7%
Active return 1.5% n/a n/a n/a n/a n/a
NTA+
Performance 2.0% n/a n/a n/a n/a n/a
Benchmark 1.7% 3.5% 7.4% 7.5% 7.7% 8.7%
Active return 0.3% n/a n/a n/a n/a n/a
Unit Price and NTA Rating Breakdown %
as at 30-Sep-19
Cash 5
Senior Loans 52
Subordinated Loans 42
Equity 1
% of Total 100
Fund Summary
as at 30-Sep-19
Number of Investments 57
Risk/Return Indicators Senior Ranking (%) 52%
Sharpe Standard Interest Duration (days) 36
Unit price* Ratio Ratio Deviation Credit Duration (years) 3
Year 1 n/a n/a n/a
Year 3 n/a n/a n/a
Year 5 n/a n/a n/a
NTA+
Year 1 n/a n/a n/a
Year 3 n/a n/a n/a
Year 5 n/a n/a n/a
* The unit price benchmark has been compared against the RBA Cash Rate plus 6.0%p.a. + The NTA has been compared against the RBA Cash
Rate plus 6.0% p.a.
*+ M easurement of a LIT’s performance is calculated after all operat ing expenses, provision and payment of both income and realised capital gains tax and the reinvestment of dividends, and do not incorporate franking.
Index returns however are ent irely before any operat ing expenses or taxat ion. LIC returns will consequent ly be understated relat ive to the Index return.
MOT aims to provide monthly income, preserve investor capital and manage investment risk
while seeking to provide potential for upside gains through investments in Private Credit and
other assets such as Warrants, Options, Preference Shares and Equity. The Trust will seek to
achieve its Investment Objective by gaining exposure to Wholesale Funds managed by Metrics.
The target cash income distribution is 7.0% p.a. and a total target return of 8.0% to 10.0% p.a.
through the economic cycle.
Premium/(Discount) to:
Investment Personnel: Andrew Lockhart, Graham McNamara, Justin Hynes & Andrew Tremain.
Responsible Entity: The Trust Company (RE Services) Limited.
Information
$1.95
$2.00
$2.05
$2.10
$2.15
Apr-19 May-19 Jun-19 Jul-19 Aug-19 Sep-19
RBA Cash Rate Rebased MOT
-10%
-5%
0%
5%
10%
$1.90
$1.95
$2.00
$2.05
$2.10
Apr 19 May 19 Jun 19 Jul 19 Aug 19 Sep 19
Prem/Disc (RHS) NTA (LHS) Unit Price (LHS)
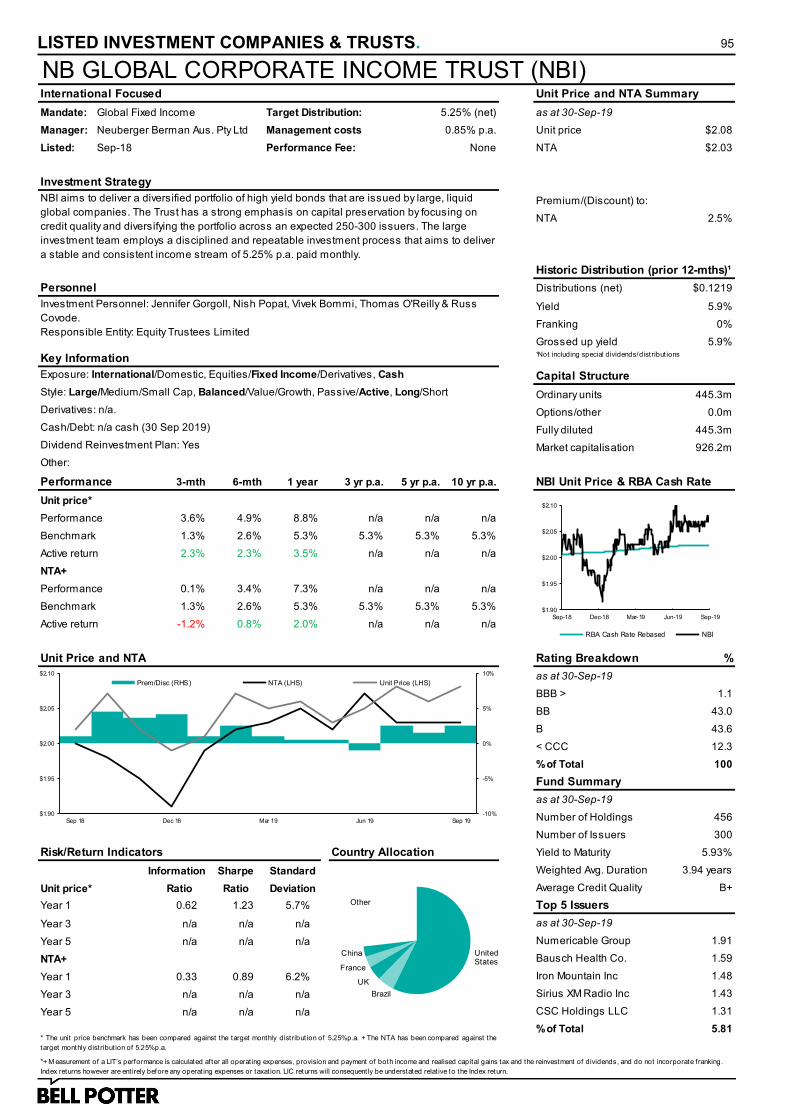
LISTED INVESTMENT COMPANIES & TRUSTS. 95
NB GLOBAL CORPORATE INCOME TRUST (NBI)International Focused Unit Price and NTA Summary
Mandate: Global Fixed Income Target Distribution: 5.25% (net) as at 30-Sep-19
Manager: Neuberger Berman Aus. Pty Ltd Management costs 0.85% p.a. Unit price $2.08
Listed: Sep-18 Performance Fee: None NTA $2.03
Investment Strategy
NTA 2.5%
Historic Distribution (prior 12-mths)¹
Personnel Distributions (net) $0.1219
Yield 5.9%
Franking 0%
Grossed up yield 5.9%
Key Information ¹Not including special dividends/distribut ions
Exposure: International/Domestic, Equities/Fixed Income/Derivatives, Cash Capital Structure
Style: Large/Medium/Small Cap, Balanced/Value/Growth, Passive/Active, Long/Short Ordinary units 445.3m
Derivatives: n/a. Options/other 0.0m
Cash/Debt: n/a cash (30 Sep 2019) Fully diluted 445.3m
Dividend Reinvestment Plan: Yes Market capitalisation 926.2m
Other:
Performance 3-mth 6-mth 1 year 3 yr p.a. 5 yr p.a. 10 yr p.a. NBI Unit Price & RBA Cash Rate
Unit price*
Performance 3.6% 4.9% 8.8% n/a n/a n/a
Benchmark 1.3% 2.6% 5.3% 5.3% 5.3% 5.3%
Active return 2.3% 2.3% 3.5% n/a n/a n/a
NTA+
Performance 0.1% 3.4% 7.3% n/a n/a n/a
Benchmark 1.3% 2.6% 5.3% 5.3% 5.3% 5.3%
Active return -1.2% 0.8% 2.0% n/a n/a n/a
Unit Price and NTA Rating Breakdown %
as at 30-Sep-19
BBB > 1.1
BB 43.0
B 43.6
< CCC 12.3
% of Total 100
Fund Summary
as at 30-Sep-19
Number of Holdings 456
Number of Issuers 300
Risk/Return Indicators Country Allocation Yield to Maturity 5.93%
Sharpe Standard Weighted Avg. Duration 3.94 years
Unit price* Ratio Ratio Deviation Average Credit Quality B+
Year 1 0.62 1.23 5.7% Top 5 Issuers
Year 3 n/a n/a n/a as at 30-Sep-19
Year 5 n/a n/a n/a Numericable Group 1.91
NTA+ Bausch Health Co. 1.59
Year 1 0.33 0.89 6.2% Iron Mountain Inc 1.48
Year 3 n/a n/a n/a Sirius XM Radio Inc 1.43
Year 5 n/a n/a n/a CSC Holdings LLC 1.31
% of Total 5.81* The unit price benchmark has been compared against the target monthly distribut ion of 5.25%p.a. + The NTA has been compared against the
target monthly distribut ion of 5.25% p.a.
*+ M easurement of a LIT’s performance is calculated after all operat ing expenses, provision and payment of both income and realised capital gains tax and the reinvestment of dividends, and do not incorporate franking.
Index returns however are ent irely before any operat ing expenses or taxat ion. LIC returns will consequent ly be understated relat ive to the Index return.
NBI aims to deliver a diversified portfolio of high yield bonds that are issued by large, liquid
global companies. The Trust has a strong emphasis on capital preservation by focusing on
credit quality and diversifying the portfolio across an expected 250-300 issuers. The large
investment team employs a disciplined and repeatable investment process that aims to deliver
a stable and consistent income stream of 5.25% p.a. paid monthly.
Premium/(Discount) to:
Investment Personnel: Jennifer Gorgoll, Nish Popat, Vivek Bommi, Thomas O'Reilly & Russ
Covode.
Responsible Entity: Equity Trustees Limited
Information
$1.90
$1.95
$2.00
$2.05
$2.10
Sep-18 Dec-18 Mar-19 Jun-19 Sep-19
RBA Cash Rate Rebased NBI
United States
Brazil
UK
France
China
Other
-10%
-5%
0%
5%
10%
$1.90
$1.95
$2.00
$2.05
$2.10
Sep 18 Dec 18 Mar 19 Jun 19 Sep 19
Prem/Disc (RHS) NTA (LHS) Unit Price (LHS)

LISTED INVESTMENT COMPANIES & TRUSTS. 96
PERPETUAL CREDIT INCOME TRUST (PCI)International Focused Unit Price and NTA Summary
Mandate: Domestic/Global Fixed Income Target Distribution: RBA Cash Rate + 3.25% as at 30-Sep-19
Manager: Perpetual Invest. Management Ltd. Management costs 0.88% p.a. (Estimated) Unit price $1.17
Listed: May-19 Performance Fee: None NTA $1.10
Investment Strategy
NTA 5.7%
Historic Distributions (prior 12-mths)¹
Personnel Distributions (net) $0.0395
Yield 3.4%
Franking 0%
Grossed up yield 3.4%
Key Information ¹Not including special dividends/distribut ions. Annualised
Exposure: International/Domestic, Equities/Fixed Income/Derivatives, Cash Capital Structure
Style: Large/Medium/Small Cap, Balanced/Value/Growth, Passive/Active, Long/Short Ordinary units 400.1m
Derivatives: n/a. Options/other 0.0m
Cash/Debt: $8.4m cash (30 Sep 2019) Fully diluted 400.1m
Dividend Reinvestment Plan: Yes Market capitalisation 466.1m
Other:
Performance 3-mth 6-mth 1 year 3 yr p.a. 5 yr p.a. 10 yr p.a. PCI Unit Price & RBA Cash Rate
Unit price*
Performance 5.1% n/a n/a n/a n/a n/a
Benchmark 1.0% 2.2% 4.6% 4.7% 4.9% 5.9%
Active return 4.1% n/a n/a n/a n/a n/a
NTA+
Performance 1.0% n/a n/a n/a n/a n/a
Benchmark 1.0% 2.2% 4.6% 4.7% 4.9% 5.9%
Active return 0.0% n/a n/a n/a n/a n/a
Share Price and NTA Rating Breakdown %
as at 30-Sep-19
A 13.8
BBB 52.3
BB+ and lower 5.9
Unrated 26.1
Cash 1.9
% of Total 100.0
Fund Summary
as at 30-Sep-19
Number of Holdings 87
Risk/Return Indicators Sector Allocation Number of Issuers 65
Sharpe Standard Running Yield 3.30%
Unit price* Ratio Ratio Deviation Weighted Avg. Life 4.6 years
Year 1 n/a n/a n/a Modified Duration 0.1 years
Year 3 n/a n/a n/a Seniority Breakdown
Year 5 n/a n/a n/a as at 30-Sep-19
NTA+ Senior 71.3
Year 1 n/a n/a n/a Subordinated 23.1
Year 3 n/a n/a n/a Deeply Subordinated 5.6
Year 5 n/a n/a n/a % of Total 100.0
* The unit price benchmark has been compared against the target monthly distribut ion of the RBA Cash Rate + 3.25%. + The NTA has been
compared against the target monthly distribut ion of the RBA Cash Rate + 3.25%.
*+ M easurement of a LIT’s performance is calculated after all operat ing expenses, provision and payment of both income and realised capital gains tax and the reinvestment of dividends, and do not incorporate franking.
Index returns however are ent irely before any operat ing expenses or taxat ion. LIC returns will consequent ly be understated relat ive to the Index return.
PCI invests in a portfolio of credit and fixed income assets diversified by country, asset type,
credit quality, loan maturity and issuer. The Manager will typically construct a portfolio of
approximately 50 to 100 assets. The Trust aims to provide an attractive and reliable monthly
income stream, targeting a total return of RBA Cash Rate plus 3.25% p.a. (net of fees) through
the economic cycle.
Premium/(Discount) to:
Investment Personnel:Michael Korber & Anne Moal.
Responsible Entity: Perpetual Trust Services Limited
Information
$1.00
$1.05
$1.10
$1.15
$1.20
Apr-19 May-19 Jun-19 Jul-19 Aug-19 Sep-19
RBA Cash Rate Rebased PCI
Corporate
Finance
Bank
Property
RMBS
OtherCash
-10%
-5%
0%
5%
10%
$1.00
$1.05
$1.10
$1.15
$1.20
May 19 Jun 19 Jul 19 Aug 19 Sep 19
Prem/Disc (RHS) NTA (LHS) Unit Price (LHS)

LISTED INVESTMENT COMPANIES & TRUSTS. 97
Appendix A: Glossary of terms Annualised Compound Total Returns: The Annualised Compound Total Return calculates the constant yearly return that would result in the initial value of an investment reaching its present value. Active Management: Investing with the goal of outperforming a benchmark index. Balanced Investing: Investing in securities with neither a preference for Growth or Value investing. Beta: In the context of this report, a Beta is a representation of the tendency of a company’s share price to respond to swings in the Market. A Beta of 1 indicates that a company’s share price will move in line with the Market. A Beta of greater than 1 indicates that a share’s price will be more volatile than the Market. Our Market Proxy is the All Ordinaries Accumulation Index. Dilutive Security: When a company issues additional shares in itself at a price below the current value of existing shares this will have a dilutive effect. Estimated Fully Diluted NTA: Some LICs have additional securities that have the ability to convert to, or create, new ordinary securities in the Company. If a security can be converted to ordinary securities at a price lower than the LIC’s NTA, this will dilute its NTA on a per share basis. Excess Return to Risk Ratio: This ratio, also known as the Sharpe Ratio (see Sharpe Ratio for definition), provides a measure of the return of each portfolio relative to the risk taken by the Investment Manager in achieving that return. A high return is only desirable if it does not come with too much additional risk (volatility of returns - see Standard Deviation). Grossed Up Dividend Yield: Dividends paid plus any franking credits passed on to shareholders. We have focused on this measure to enable valid comparison between LICs whose dividends are franked and those that are not. Growth Investing: Investing in securities with a bias towards higher projected Earnings Per Share growth rates and Return On Equity. Indirect Cost Ratio: The ICR, as defined in the Corporations Act 2001, is the ratio of the Fund’s management costs to average net assets. In layman's terms, it covers all expenditure, excluding transaction and finance costs, in the management of the Fund. This includes management fees, performance fees, marketing, audit, legal, rent, etc. We are using this method of calculation to standardise the cost ratios across our LIC universe, given many different interpretations of the MER calculations by LICs and the inability to confirm the calculation. ICR is generally accepted as the principal expense ratio calculation for the Managed Funds industry. Net Tangible Assets (NTA): Total assets of the Company minus any intangible assets such as goodwill and trademarks, less all liabilities of the Company. This is calculated before any theoretical tax is payable if the entire portfolio was sold. The largest liability of most LICs is the Management Fee, while some LICs also provide for performance fees, should the LIC’s portfolio achieve certain benchmarks. Management fees are generally a reflection of how actively a portfolio is managed as well as its size. Option Adjusted Portfolio Return: A LIC’s calculated portfolio return over a period may be negatively impacted if there are new securities issued during a period. This is because the Manager will not have been able to generate returns off the new funds over the entire period, which will detract from the performance of the overall portfolio. Accordingly, where new securities have been issued in a LIC we will remove the impact of those securities creating an Option Adjusted Portfolio Return. Passive Management: Investing in an attempt to track the return of the underlying benchmark index. Typically a passively managed portfolio has good diversification, low turnover (good for keeping down internal transaction costs), and lower management fees. Premium/Discount to Pre-Tax NTA: While share prices of LICs are generally based around their NTA, the vagaries of supply and demand, as well as the market perception of a company's outlook, mean that a LIC’s share price may move substantially below (discount) or above (premium) its NTA.
LISTED INVESTMENT COMPANIES & TRUSTS. 98
Appendix A: Glossary of terms (continued) Renounceable Rights Issue: This is an offer by the LIC to shareholders to purchase more shares in the Company. Given these rights are normally issued at a discount they have an inherent value that can be traded on the ASX. Stapled Options: These are options that cannot be traded individually. They are attached to a share or similar security and this combined security must be traded in a ‘bundle’. Total Shareholder Return (TSR): Highlights total increase in the value of $100 invested in a LIC over a given period by a shareholder on the assumption that dividends are reinvested. TSR takes into account grossed up dividends paid as well as share price appreciation and may differ from share price performance in this regard. Value Investing: Investing in securities that appear to be undervalued taking in to consideration certain valuation metrics.

LISTED INVESTMENT COMPANIES & TRUSTS. 99
Appendix B: Legend to Performance Measures The following provides an explanation of each item contained within ‘our performance measures’.
Figure 1 - Historical Performance of Pre-Tax NTA and Security Price versus the Benchmark Performance - The Annualised Compound Total Return calculates the compound yearly
return over a period, inclusive of dividends. Dividends are reinvested from the payment date using the most recent historical pre-tax NTA for the NTA performance calculation and the closing price of the security on the prepayment date for the security calculation. Where a LIC has been listed for less than three years each return has been adjusted to reflect the annualised return since its listing. Benchmark - The relevant benchmark has been selected by the Manager. In some instances, the exact Index as selected by a LIC will not be readily available. In such cases, we have determined the most appropriate surrogate index to provide readers with a reasonable guide as to the performance and volatility of that LIC’s benchmark. The benchmark is either sourced from IRESS or Bloomberg. Active-return - Active Return is the difference between the pre-tax NTA or security price and the underlying benchmark. A positive difference indicates an outperformance versus the benchmark and a negative difference indicates an underperformance relative to the benchmark. Figure 2 - Return and Premium/Discount to pre-tax NTA Share Price - The light grey line highlights the total increase in the value of $100 invested
by that Investment Manager over the time period (assumes dividends reinvested) on a pre-tax basis. Portfolio performance is measured in dollars on the left-hand axis of the Graph. Pre-Tax NTA - The black line provides a total increase in the value of $100 if the investor were able to liquidate the investment at the underlying Pre-Tax NTA over the time period (assumes dividends reinvested). Performance is also referenced to the left-hand axis of the Graph. Premium/Discount to Pre-Tax NTA - The light green columns represent the share price premium/discount relative to month-end pre-tax NTA and is measured as a percentage on the right-hand axis.
-30%
-20%
-10%
0%
10%
20%
30%
-$50
$0
$50
$100
$150
$200
$250
2001 2002 2003 2004 2005 2006 2007 2008 2009 2010 2011
Prem/Disc (RHS) Pre-Tax NTA (LHS) Share Price (LHS)
Performance 3-mth 6-mth 1 year 3 yr p.a. 5 yr p.a. 10 yr p.a.
Share price*
Performance 3.9% -6.0% -14.7% 5.4% -0.6% 6.9%
Index 1.9% -9.6% -11.4% 8.5% -2.1% 6.3%
Active return 2.0% 3.6% -3.3% -3.1% 1.5% 0.6%
NTA+
Performance 3.4% -7.8% -7.8% 9.0% 0.1% 7.4%
Benchmark 2.1% -9.7% -10.5% 7.6% -2.3% 6.2%
Active return 1.3% 1.9% 2.7% 1.4% 2.4% 1.2%

LISTED INVESTMENT COMPANIES & TRUSTS. 100
Appendix B: Legend to Performance Measures (continued) Figure 3 - Risk Return Indicators
Information Ratio - This
Ratio is a measure of the risk adjusted return of the LIC. It is defined as the Active Return divided by the Tracking Error. Active Return is the difference between the return of the security and the return of a selected benchmark index. The Tracking Error is the standard deviation of the Active Return. Sharpe Ratio - This Ratio provides a measure of the return of each LIC’s portfolio relative to the risk taken by the Investment Manager in achieving that return. A high return is only desirable if it does not come with too much additional risk (volatility of returns - see Standard Deviation). A Sharpe Ratio is calculated by subtracting a selected Risk Free Rate (Aust. Govt 10-year Bond yield) from a return, and dividing that by the Standard Deviation of that return. Standard Deviation: This is a measure of the dispersion of a portfolio’s returns around its average return. A data set that has many monthly returns a long way from the average return will have a greater standard deviation than a set of monthly returns that are close to the average. In the context of this report, we calculate the average monthly return of each LIC, as represented by changes in its NTA, and from this we can calculate a standard deviation from its average. Theoretically, a LIC that achieves the exact same return every month would have a standard deviation of zero. Tracking Error: This measures how much the return of a portfolio deviates from the return of its benchmark index. A data set that has a low Tracking Error means that its returns are closely tracking the Portfolio’s benchmark. Tracking Error is the standard deviation of the differences between the return of the portfolio and the return of the benchmark.
Risk/Return Indicators
Information Sharpe Standard Tracking
Share price* Ratio Ratio Deviation Error
Year 1 0.18 -0.02 16.4% 15.0%
Year 3 -0.40 -0.62 33.2% 30.2%
Year 5 0.16 -0.18 32.1% 30.5%
NTA+
Year 1 2.21 0.99 11.4% 3.1%
Year 3 -0.60 -0.56 29.2% 7.2%
Year 5 -0.65 -0.33 25.8% 10.1%
Iron
Gold
Diversified
Platinum
Copper
Coal
LISTED INVESTMENT COMPANIES & TRUSTS. 101
Appendix C: Disclosures
Future Generation Global Investment Company (FGG): Bell Potter Securities was a broker for the placement and share purchase plan in October 2018 and received a fee for the service. Future Generation Investment Company (FGX): Bell Potter Securities was a broker for the placement and share purchase plan in November 2018 and received a fee for the service. Gryphon Capital Income Trust (GCI): Bell Potter Securities was a Co-Manager for this IPO in May 2018 and received a fee for the service. Bell Potter Securities was a Co-Manager to the Entitlement Offer in June 2019 and received a fee for the service. Bell Potter Securities was a Co-Manager to the Entitlement Offer in November 2019 and received a fee for the service. Hearts and Minds Investments (HM1): Bell Potter Securities was a broker for this IPO in November 2018 and received a fee for the service. L1 Long Short Fund (LSF): Bell Potter Securities was a Co-Manager for this IPO in April 2018 and received a fee for the service. Magellan Global Trust (MGG): Bell Potter Securities was a Co-Lead Manager for this IPO in October 2017 and received a fee for the service. MCP Income Opportunities Trust (MOT): Bell Potter Securities acted as a Co-Manager to the IPO in April 2019 and received fees for that service. MCP Master Income Trust (MXT): Bell Potter Securities acted as a Co-Manager to the IPO in September 2017 and received fees for that service. Bell Potter Securities acted as a Co-Manager to the Entitlement Offer in March 2018 and received fees for that service. Bell Potter Securities acted as a Co-Manager to the Entitlement Offer in May 2019 and received fees for that service. NB Global Corporate Income Trust (NBI): Bell Potter Securities acted as a Co-Manager to the IPO in September 2018 and received fees for that service. Bell Potter Securities acted as a Co-Manager to the Entitlement Offer in May 2019 and received fees for that service. Partners Group Global Income Fund (PGG): Bell Potter Securities acted as a Co-Manager to the IPO in September 2019 and received fees for that service. Perpetual Credit Income Trust (PCI): Bell Potter Securities acted as a Co-Manager to the IPO in May 2019 and received fees for that service. Pengana Private Equity Trust (PE1): Bell Potter Securities acted as a Joint Lead Manager to the IPO in April 2019 and received fees for that service. Plato Income Maximiser Limited (PL8): Bell Potter Securities acted as a Co-Manager to the Entitlement Offer in August 2019 and received fees for that service.
LISTED INVESTMENT COMPANIES & TRUSTS. 102
Appendix C: Disclosures (continued)
Regal Investment Fund (RF1): Bell Potter Securities acted as a Joint Lead Manager to the IPO in May 2019 and received fees for that service. Thorney Opportunities Ltd (TOP): Bell Potter Securities acted as the Lead Manager for a share placement in November 2017 and received a fee for the service. Thorney Technologies Ltd (TEK): Bell Potter Securities acted as the Lead Manager for two placement offers to raise up to $15m in September 2017 and received a fee for the service. Tribeca Global Natural Resources (TGF): Bell Potter Securities was a Co-Manager for this IPO in October 2018 and received a fee for the service. URB Investments Limited (URB): Bell Potter Securities acted as a Joint Lead Manager for this IPO in April 2017 and received a fee for the service. WAM Global Limited (WGB): Bell Potter Securities was a Co-Manager for this IPO in June 2018 and received a fee for the service. WCM Global Growth Limited (WQG): Bell Potter Securities acted as a Joint Lead Manager for this IPO in June 2017 and received a fee for the service.
LISTED INVESTMENT COMPANIES & TRUSTS. 103
The following may affect your legal rights. Important Disclaimer:
This document is a private communication to clients and is not intended for public circulation or for the use of any third party, without the prior approval of Bell Potter Securities Limited. In the USA and the UK this research is only for institutional investors. It is not for release, publication or distribution in whole or in part to any persons in the two specified countries. In Hong Kong, this research is being distributed by Bell Potter Securities (HK) Limited which is licensed and regulated by the Securities and Futures Commission, Hong Kong. In the United States, this research is issued and distributed by Bell Potter Securities (US) LLC which is a registered broker-dealer and member of FINRA. Any person receiving this report from Bell Potter Securities (US) LLC and wishing to transact in any security described herein should do so with Bell Potter Securities (US) LLC.
This is general investment advice only and does not constitute personal advice to any person. Because this document has been prepared without consideration of any specific client’s financial situation, particular needs and investment objectives (‘relevant personal circumstances’), a Bell Potter Securities Limited investment adviser (or the financial services licensee, or the representative of such licensee, who has provided you with this report by arrangement with Bell Potter Securities Limited) should be made aware of your relevant personal circumstances and consulted before any investment decision is made on the basis of this document.
While this document is based on information from sources which are considered reliable, Bell Potter Securities Limited has not verified independently the information contained in the document and Bell Potter Securities Limited and its directors, employees and consultants do not represent, warrant or guarantee, expressly or impliedly, that the information contained in this document is complete or accurate. Nor does Bell Potter Securities Limited accept any responsibility for updating any advice, views opinions, or recommendations contained in this document or for correcting any error or omission which may become apparent after the document has been issued.
Except insofar as liability under any statute cannot be excluded. Bell Potter Securities Limited and its directors, employees and consultants do not accept any liability (whether arising in contract, in tort or negligence or otherwise) for any error or omission in this document or for any resulting loss or damage (whether direct, indirect, consequential or otherwise) suffered by the recipient of this document or any other person.
Research Policies:
For Bell Potter’s Research Coverage Decision Making Process and Research Independence Policy, please refer to our company website:
https://www.bellpotter.com.au/topnavigation/private-clients/stockbroking/research
Disclosure of interest:
Bell Potter Securities Limited, its employees, consultants and its associates within the meaning of Chapter 7 of the Corporations Law may receive commissions, underwriting and management fees from transactions involving securities referred to in this document (which its representatives may directly share) and may from time to time hold interests in the securities referred to in this document.
ANALYST CERTIFICATION
Each research analyst primarily responsible for the content of this research report, in whole or in part, certifies that with respect to each security or issuer that the analyst covered in this report: (1) all of the views expressed accurately reflect his or her personal views about those securities or issuers and were prepared in an independent manner and (2) no part of his or her compensation was, is, or will be, directly or indirectly, related to the specific recommendations or views expressed by that research analyst in the research report.
Bell Potter Securities Limited ACN25 006 390 7721 Level 29, 101 Collins Street Melbourne, Victoria, 3000 Telephone +61 3 9256 8700 www.bellpotter.com.au
Bell Potter Securities (HK) Limited Room 1701, 17/F Prosperity Tower, 39 Queens Road Central, Hong Kong, 0000 Telephone +852 3750 8400
Bell Potter Securities (US) LLC Floor 39 444 Madison Avenue, New York NY 10022, U.S.A Telephone +1 917 819 1410
Bell Potter Securities (UK) Limited 16 Berkeley Street London, England W1J 8DZ, United Kingdom Telephone +44 7734 2929
Listed Investment
Companies & Trusts