Embed Size (px)
Citation preview
“Listening In” to Find and Explore New
Combinations of Customer Needs
Glen L. Urban
and
John R. Hauser
September 9, 2003
Glen L. Urban is the David Austin Professor of Marketing, Sloan School of Management, Mas-sachusetts Institute of Technology, E56-305, 38 Memorial Drive, Cambridge, MA 02142, (617) 258-0679, fax (617) 253-7597, [email protected]. John R. Hauser is the Kirin Professor of Marketing, Sloan School of Management, Massachu-setts Institute of Technology, E56-314, 38 Memorial Drive, Cambridge, MA 02142, (617) 253-2929, fax (617) 253-7597, [email protected]. This research was supported by the Sloan School of Management, the eBusiness Center, the Cen-ter for Innovation in Product Development at M.I.T., and the General Motors Corporation. We gratefully acknowledge the contributions of our industrial collaborators, research assistants, and faculty colleagues: Vince Barabba, Iakov Bart, Ahmed Benabadji, Rupa Bhagwat, Brian Bower, Brian Chan, Hann-Ching Chao, Mitul Chatterjee, Shyn-Ren Chen, Thomas Cheng, Stanley Cheung, Frank Days, Ken Dabrowski, Benson Fu, Salman Khan, Christopher Mann, Rami Musa, Joseph Kim, Ken Lynch, Bill Qualls, James Ryan, Bilal Shirazi, Jonathon Shoemaker, Fareena Sultan, Andy Tian, Xingheng Wang, and Irene Wilson. This paper has benefited from presenta-tions at the Marketing Science Conferences in Wiesbaden Germany and in Edmonton Canada, the Marketing Science Conference on “New Methods for New Products, the MIT Marketing Workshop, the New England Marketing Conference, and the Stanford Marketing Workshop. Related information is available at mitsloan.mit.edu/vc and ebusiness.mit.edu.

“Listening In” to Find and Explore New Combinations of Customer Needs
Abstract
By “listening in” to ongoing dialogues between customers and web-based virtual advisors
(e.g., Kelley Blue Book’s Auto Choice Advisor) we identify new product opportunities based on
new combinations of customer needs. These data are available at little incremental cost and pro-
vide the scale necessary for complex products (e.g., 148 trucks and 129 customer needs in our
application). We describe and evaluate the methodologies with formal analysis, Monte Carlo
simulation (calibrated on real data), and a “proof-of-concept” application in the pickup-truck
category (over 1,000 web-based respondents). The application identified opportunities for new
truck platforms worth approximately $2.4-3.2 billion and $1-2 billion, respectively.
“Listening In” to Find and Explore New Combinations of Customer Needs
Identifying new platform opportunities is one of the most important roles of market intelligence.
Monitoring [web-based advisors] provides a rich source of observed in-market customer behavior that
complements our current inquiry tools which, by their nature, are forced to ask customers either to state
their intentions before they are actually in the market or to remember after the purchase what they did
(and why) when shopping for a vehicle. No form of inquiry is perfect, however, whatever its limitations,
the currency [of web-based advisors] presents a valuable source of market understanding that is already
streaming by and is of great value when used appropriately.
– Vince Barabba, General Motors General Manager of Corporate Strategy and Knowledge Development (responsible for overseeing GM’s New Business Development Network)
Unmet Combinations of Customer Needs Represent New Opportunities The advent of Internet has given customers more information about products in diverse
industries such as travel, health, autos, computers, home entertainment, and financial services.
For example, the fraction of people using the Internet for information and advice is large in
travel (70%), health (56%), and automobiles (62%). Monitoring Internet searches, undertaken
by potential customers in their own vested interests, has the potential to reveal new opportunities,
new “fishing grounds,” for new products and product platforms. In this paper we explore one set
of methodologies to use this information to identify new-product opportunities. While our appli-
cation is drawn from the automotive industry, the basic concepts are applicable for complex
products in both consumer and business-to-business markets, e.g., high-end copiers, home enter-
tainment centers, and financial services (Ulrich and Eppinger 1995).
Automobiles and trucks are indeed complex products. The investment for a new automo-
tive platform might require as much as $1-to-2 billion and 1,200 person-years of investment.
Such investments are justified by the scale of the market. For example, with approximately 150
trucks on the market, the average truck needs less than one percent of the marketplace to be prof-
itable; each share point is worth $800 million in annual revenue.
Most automotive platforms are redesigns to provide known combinations of customer
benefits (“needs”). However, long-term survival requires that new opportunities be identified.
For example, in the late 1980s, through a combination of qualitative focus groups and quantita-
tive perceptual mapping studies, a new opportunity was identified for luxury vehicles that could
haul moderate loads. Today this luxury SUV segment is one of the most profitable automotive
segments. Another example came from leading-edge users. In the 1960s teenagers and young
1
“Listening In” to Find and Explore New Combinations of Customer Needs
adults were customizing inexpensive vintage Fords with V8 engines – Ford recognized this op-
portunity for inexpensive sporty cars with large engines. The first production car in this “pony”
segment, the 1964½ Mustang, sold 420,000 units in the first year ($10 billion at today’s prices,
classicponycars.com/history.html). The 1983 Chrysler minivans provide a third example.
Growing families needed a vehicle that could carry a 4’x 8’ sheet of plywood, fit easily in cus-
tomers’ garages, drive like a passenger car, have a side door for small children, and incorporate a
sedan-like liftgate for shopping. Chrysler sold 210,000 units in the first year and dominated this
new segment for years to come (allpar.com/model/m/history.html). These are but some of the
many automotive examples where profitable new platforms filled previously unrecognized (by
the auto industry) combinations of consumer needs. The firms that identified first these new
combinations of customer needs were able to profitably exploit the opportunities for many years.
Finding new combinations of customer needs for complex products is no small challenge.
For example, trucks fulfill between 100-150 distinct customer needs, more if we include sound
and other subsystems. Because of the sheer magnitude of combinatorial combinations (e.g., 1052
in our application), existing products fulfill a tiny fraction of the potential combinations. Com-
plex products require large samples. For example, even if we had hypotheses about a new com-
bination of customer needs, we might still need detailed information on almost 500 or more re-
spondents to be comfortable that a needs-combination segment is worth further investigation.
Because multiple needs define a segment, it is not unusual for sample sizes in the automotive in-
dustry to approach 10,000 for targeted research and 100,000 for general searches. General Mo-
tors (GM) alone spends tens of millions of dollars each year searching for new needs’ combina-
tions and studying needs’ combinations once identified. Some studies are in the $500,000-to-$1
million range. Automotive firms desire methodologies that are more cost-effective and that can
be run continuously to identify new needs’-combination opportunities as soon as they occur.
In this paper we propose methodologies that provide a practical means to find combina-
tions of customer needs that represent profitable new opportunities. These methodologies ex-
ploit new data, click-streams from virtual advisors, that are available at little incremental cost yet
provide the scale (both number of products and number of needs) that is necessary to find oppor-
tunities in complex-product categories. For example, one virtual advisor, sponsored by GM, J.
D. Power, Kelley Blue Book, and Car Talk and based, in-part, on the methodologies in this pa-
per, has approximately 500,000 annual visitors.
2
“Listening In” to Find and Explore New Combinations of Customer Needs
The new data are obtained by “listening in” to ongoing “dialogues” created when cus-
tomers use the Internet to search for information and advice about automotive purchases. These
data are incentive compatible – customers are seeking advice and have an incentive to reveal
their needs. The virtual advisors generating these data are updated often to include new products
and new customer benefits (needs), providing evolving data with which to identify new combina-
tions of needs as soon as customers express those needs. We focus on the truck market to illus-
trate the methods. The methodologies extend readily to other complex-product categories such
as travel, medical, and office equipment.
We “listen in” by combining multiple stages: a Bayesian virtual advisor to obtain the
data, an opportunity trigger to identify when existing trucks do not fulfill desired combinations
of needs, a virtual engineer to explore and clarify the identified opportunity, a design palette to
explore how customers would design their own trucks, and a clustering procedure to estimate the
(rough) size of the segment of customers who desire these new combinations of needs. In this
paper we illustrate each stage, examine internal validity with Monte Carlo analyses, and provide
an example based on a sample of over 1,000 respondents. This “proof-of-concept” research was
run in parallel with existing methods yet identified a key segment at a much lower cost. It also
suggested a segment, still being explored, that existing methods may have missed. We begin by
discussing how “listening in” complements existing methods.
Existing Methods to Identify Profitable Combinations of Customer Needs With so much as stake, strategic marketing and marketing research groups invest heavily
in identifying new opportunities. They speak to leading edge users, maintain and monitor user
groups, sponsor special racing events, monitor chat rooms and user groups, and use a variety of
qualitative and ethnographic methods (Barabba 2003; Barabba and Zaltman 1991; Griffin and
Hauser 1993; Gutman 1992). For example, automotive firms invest heavily in quantitative
methods such as conjoint analyses, AIO studies (activities, interests, and opinions), and large-
scale “clinics” in which customers view and react to prototypes and concepts (Green and Srini-
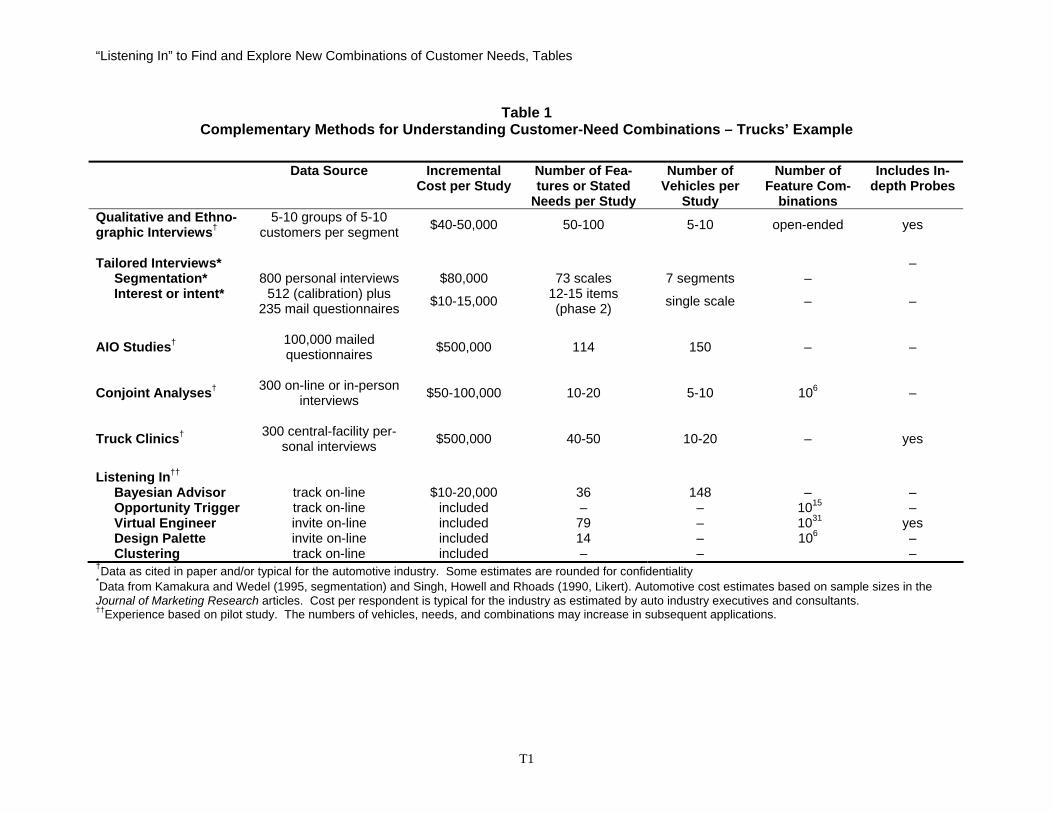
vasan 1990; Plummer 1974, Urban, Weinberg and Hauser 1996). Table 1 summarizes character-
istics of existing methods and “listening in.” The cost and sample-size data are typical for the
automotive industry. They are based on our experience and discussions with auto executives and
consultants.1
<Insert Table 1 about here.>
3
“Listening In” to Find and Explore New Combinations of Customer Needs
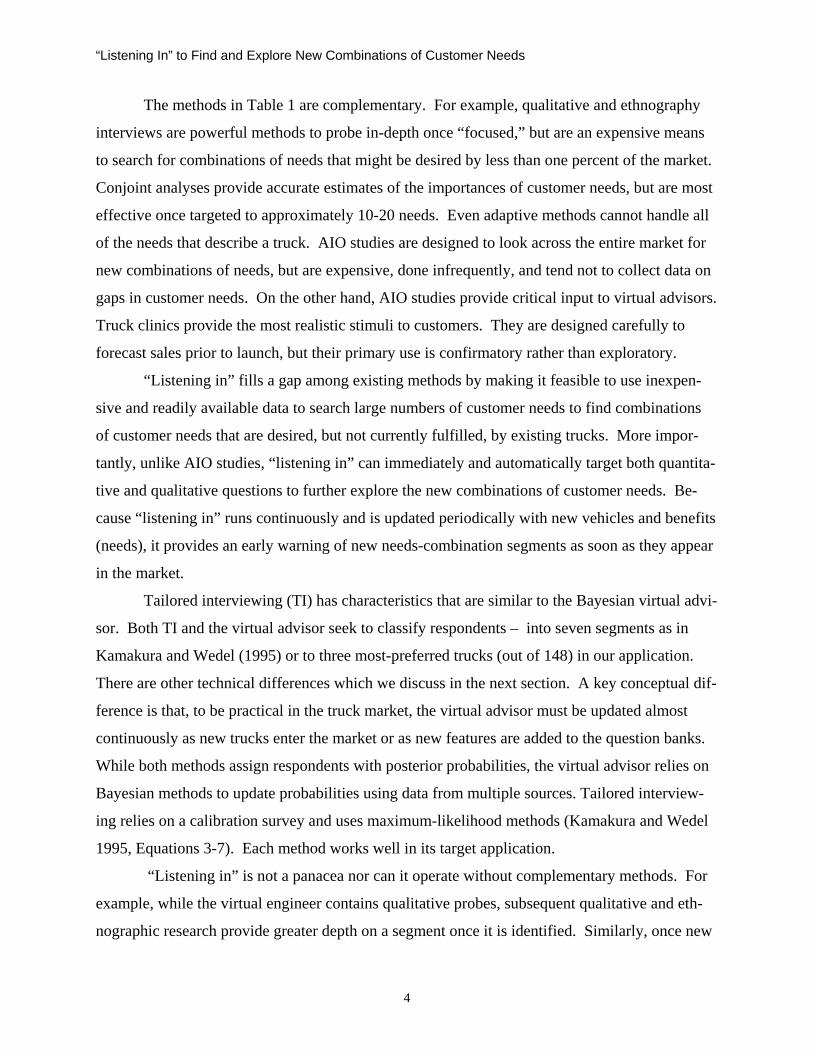
The methods in Table 1 are complementary. For example, qualitative and ethnography
interviews are powerful methods to probe in-depth once “focused,” but are an expensive means
to search for combinations of needs that might be desired by less than one percent of the market.
Conjoint analyses provide accurate estimates of the importances of customer needs, but are most
effective once targeted to approximately 10-20 needs. Even adaptive methods cannot handle all
of the needs that describe a truck. AIO studies are designed to look across the entire market for
new combinations of needs, but are expensive, done infrequently, and tend not to collect data on
gaps in customer needs. On the other hand, AIO studies provide critical input to virtual advisors.
Truck clinics provide the most realistic stimuli to customers. They are designed carefully to
forecast sales prior to launch, but their primary use is confirmatory rather than exploratory.
“Listening in” fills a gap among existing methods by making it feasible to use inexpen-
sive and readily available data to search large numbers of customer needs to find combinations
of customer needs that are desired, but not currently fulfilled, by existing trucks. More impor-
tantly, unlike AIO studies, “listening in” can immediately and automatically target both quantita-
tive and qualitative questions to further explore the new combinations of customer needs. Be-
cause “listening in” runs continuously and is updated periodically with new vehicles and benefits
(needs), it provides an early warning of new needs-combination segments as soon as they appear
in the market.
Tailored interviewing (TI) has characteristics that are similar to the Bayesian virtual advi-
sor. Both TI and the virtual advisor seek to classify respondents – into seven segments as in
Kamakura and Wedel (1995) or to three most-preferred trucks (out of 148) in our application.
There are other technical differences which we discuss in the next section. A key conceptual dif-
ference is that, to be practical in the truck market, the virtual advisor must be updated almost
continuously as new trucks enter the market or as new features are added to the question banks.
While both methods assign respondents with posterior probabilities, the virtual advisor relies on
Bayesian methods to update probabilities using data from multiple sources. Tailored interview-
ing relies on a calibration survey and uses maximum-likelihood methods (Kamakura and Wedel
1995, Equations 3-7). Each method works well in its target application.
“Listening in” is not a panacea nor can it operate without complementary methods. For
example, while the virtual engineer contains qualitative probes, subsequent qualitative and eth-
nographic research provide greater depth on a segment once it is identified. Similarly, once new
4
“Listening In” to Find and Explore New Combinations of Customer Needs
needs’ combinations are uncovered, conjoint analyses search these combinations in greater detail
and quantify the importance of the alternative needs. While “listening in” provides first-order
forecasts, truck clinics provide the accuracy necessary before $1-to-2 billion is committed to a
project. We illustrate below in a stylized manner how the “listening in” complements existing
methods for two practical situations in truck markets. In practice, applications are more iterative
and include other methods (Urban and Hauser 1993).
Identify Opportunities for a New Truck Platform
“listening in” ⇒ qualitative interviews ⇒ conjoint analysis ⇒ truck clinics ⇒ launch
Monitor Marketplace Changes for Vehicle “Refresh” Opportunities
“listening in” ⇒ conjoint analysis ⇒ truck clinics ⇒ launch
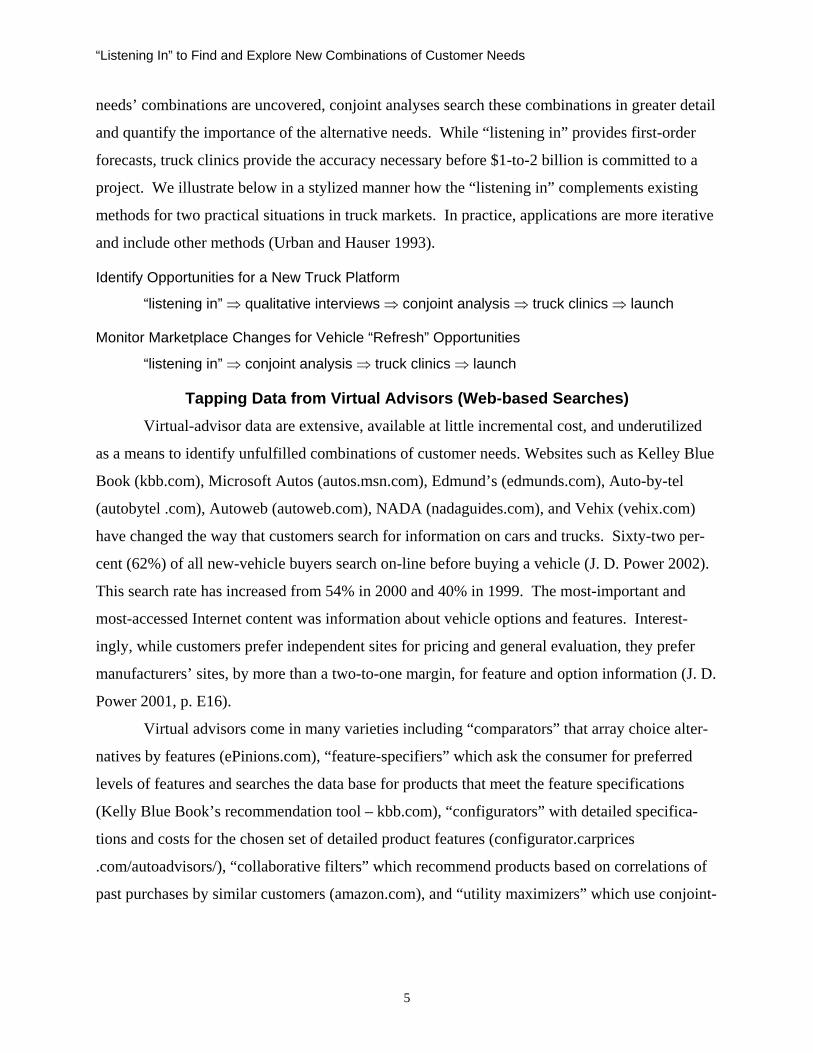
Tapping Data from Virtual Advisors (Web-based Searches) Virtual-advisor data are extensive, available at little incremental cost, and underutilized
as a means to identify unfulfilled combinations of customer needs. Websites such as Kelley Blue
Book (kbb.com), Microsoft Autos (autos.msn.com), Edmund’s (edmunds.com), Auto-by-tel
(autobytel .com), Autoweb (autoweb.com), NADA (nadaguides.com), and Vehix (vehix.com)
have changed the way that customers search for information on cars and trucks. Sixty-two per-
cent (62%) of all new-vehicle buyers search on-line before buying a vehicle (J. D. Power 2002).
This search rate has increased from 54% in 2000 and 40% in 1999. The most-important and
most-accessed Internet content was information about vehicle options and features. Interest-
ingly, while customers prefer independent sites for pricing and general evaluation, they prefer
manufacturers’ sites, by more than a two-to-one margin, for feature and option information (J. D.
Power 2001, p. E16).
Virtual advisors come in many varieties including “comparators” that array choice alter-
natives by features (ePinions.com), “feature-specifiers” which ask the consumer for preferred
levels of features and searches the data base for products that meet the feature specifications
(Kelly Blue Book’s recommendation tool – kbb.com), “configurators” with detailed specifica-
tions and costs for the chosen set of detailed product features (configurator.carprices
.com/autoadvisors/), “collaborative filters” which recommend products based on correlations of
past purchases by similar customers (amazon.com), and “utility maximizers” which use conjoint-
5
“Listening In” to Find and Explore New Combinations of Customer Needs
analysis-like methods to weight features (activebuyersguide.com). Other advisors use real peo-
ple accessed by e-mail (mayohealth.org) or in live chat rooms (nordstom.com).
The “listening in” methodology relies on data from a Bayesian virtual advisor – a method
that is well-matched to the opportunity trigger mechanism. However, the virtual engineer, the
design palette, and the clustering are not limited to working with a Bayesian virtual advisor.
These methodologies can work with any virtual advisor that provides recommendations at any
point in the questioning sequence and links customers’ responses to benefits that the customers
derive from vehicles.
A Bayesian Virtual Advisor We now describe a Bayesian virtual advisor. This advisor was developed as a prototype
for a major automotive manufacturer; a commercial system based, in part, this advisor is now in
place on the web. This virtual advisor combines two methods to recommend a set of four vehi-
cles to customers – a segmentation “gearbox” and a Bayesian advisor. The segmentation gear-
box divides people into segments based on grouping and assignment rules.2 The grouping is
based on a cluster analysis of a 114-item AIO questionnaire sent to 100,000 respondents (76 per-
sonal viewpoints and 38 preferred vehicle characteristics – including styling and design). The
AIO study by the automotive manufacturer identified forty-eight segments of which twenty-five
were relevant to pickup trucks. Customers were assigned to segments based on answers about
customer’s desires for features and options such as comfort, passenger capacity, and prestige as
well as about the customer’s anticipated use of the truck. In the virtual advisor one of the four
recommended vehicles is the vehicle bought most often by the segment to which the customer is
assigned. However, because the segmentation gearbox is designed to allocate people to seg-
ments rather than identify new opportunities, it is not the focus of this paper. Instead, we focus
on the Bayesian advisor which recommends three of the four vehicles.
Bayesian Advisor
The basic concept behind the Bayesian advisor is (1) to select sets of questions, known as
question banks, such that the answers provide the most information about which vehicle to rec-
ommend and (2) after each question bank to update the probabilities that describe the likelihoods
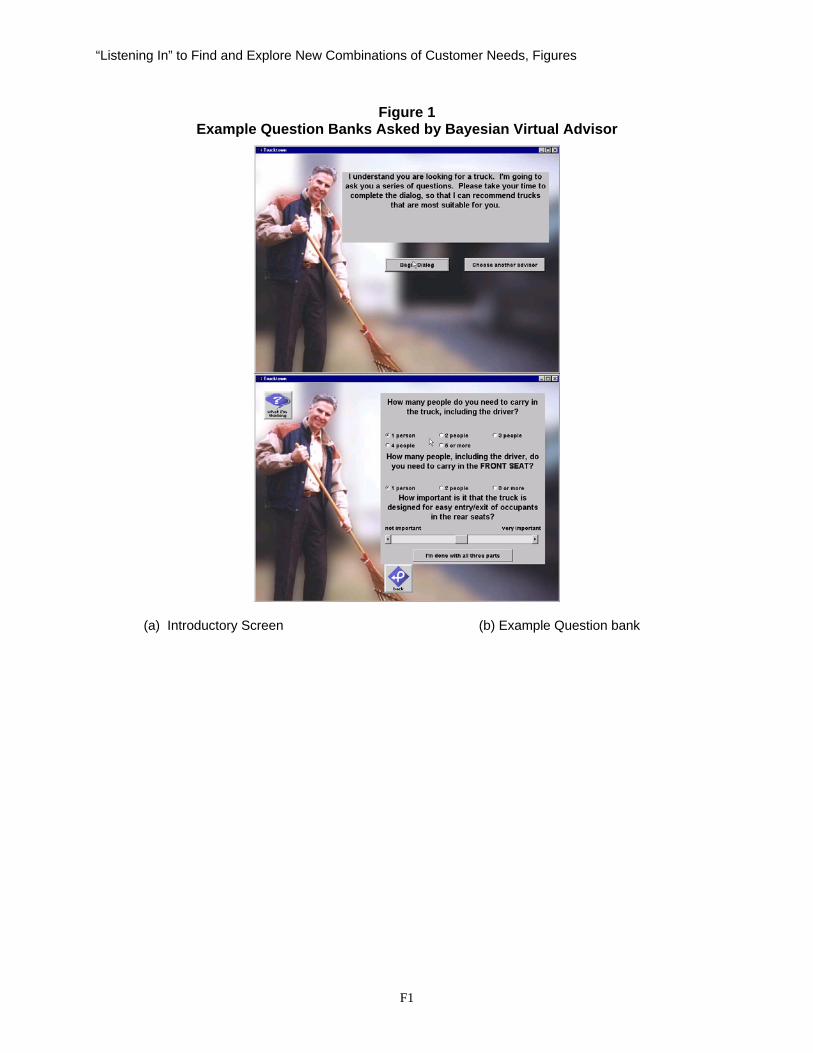
that each vehicle will be most preferred by the customer.3 Figure 1a illustrates the opening
screen of the virtual advisor (a neighbor who is a contractor and who has bought many trucks
over the years) and Figure 1b illustrates one of the question banks asked of customers. We de-
6
“Listening In” to Find and Explore New Combinations of Customer Needs
scribe first the Bayesian updating mechanism and then describe how this mechanism can be used
to select the maximum-information question bank. We later indicate how the conditional prob-
abilities and prior probabilities are obtained.
<Insert Figure 1 about here.>
We begin with the notation. Let Q be a set of question banks indexed from q = 1 to N.
For each question bank, q, let rq index the potential responses to that question bank where rq is a
nominal variable with values from 1 to nq. If there is more than one question in a question bank,
then nq represents the number of possible combinations of answers. If one of the questions in-
cludes a continuous sliding scale, it is discretized to a finite number of categories.
For each customer the order of the question banks is chosen adaptively. For a given cus-
tomer, let Rq-1 be the set of question banks up to, but not including, question bank q. Let vj indi-
cate vehicles from 1 to V. We are interested, at any point in the advisor’s questioning sequence,
in the likelihood that the customer will prefer vehicle j after having been asked question bank q.
We indicate this likelihood by P(vj | Rq-1, rq).
Suppose that we have available from earlier surveys, the conditional probabilities of how
customers, who prefer each vehicle, will answer the question banks. Then, we can use Bayes
Theorem to update recommendations.4
(1) ∑
=−−
−−− = V
jqjqjq
qjqjqqqj
RvPRvrP
RvPRvrPrRvP
111
111
)|(),|(
)|(),|(),|(
where P(vj | Rq-1) was the virtual advisor’s recommendation probability to the customer for vehi-
cle vj prior to asking the qth question bank.
However, even with data from full-scale surveys such as an AIO questionnaire with
100,000 responses, using Equation 1 is not feasible because the number of potential combina-
tions of responses grows exponentially with the number of question banks. For example, in our
study the dimensionality of RN, the number of unique paths through the advisor’s questions, is
1.4 x 10¹⁵. Fortunately we can make Equation 1 feasible based on the property of “local inde-
pendence.” This property appears reasonable for our data and has proven robust in simulations
and applications in the tailored-interviewing literature (e.g., Kamakura and Wedel Equation 11,
Singh, Howell, and Rhoades 1990, Equation 8). Local independence recognizes that there will
be non-zero correlations across vehicles in the answers to the question banks – those customers
7
“Listening In” to Find and Explore New Combinations of Customer Needs
who prefer a full-sized truck may also be likely to prefer a diesel engine. Indeed, it is this com-
bination of preferences upon which the advisor bases its recommendations. However, if we limit
ourselves to customers who prefer a Ford F350 Supercab, then, for those customers, responses to
the “size” question bank are approximately statistically independent of the responses to the “en-
gine type” question bank. This enables us to write P(rq, Rq-1| vj) ≅ P(rq | vj) P(rq-1 | vj)… P(r1 | vj)
which implies that P(rq | vj) ≅ P(rq | vj, Rq-1) by the laws of conditional probability. Using this
property, we rewrite Equation 1 as follows where P(vj | Rq-1) is obtained recursively:
(1’) ∑
=−
−− ≅ V
jqjjq
qjjqqqj
RvPvrP
RvPvrPrRvP
11
11
)|()|(
)|()|(),|(
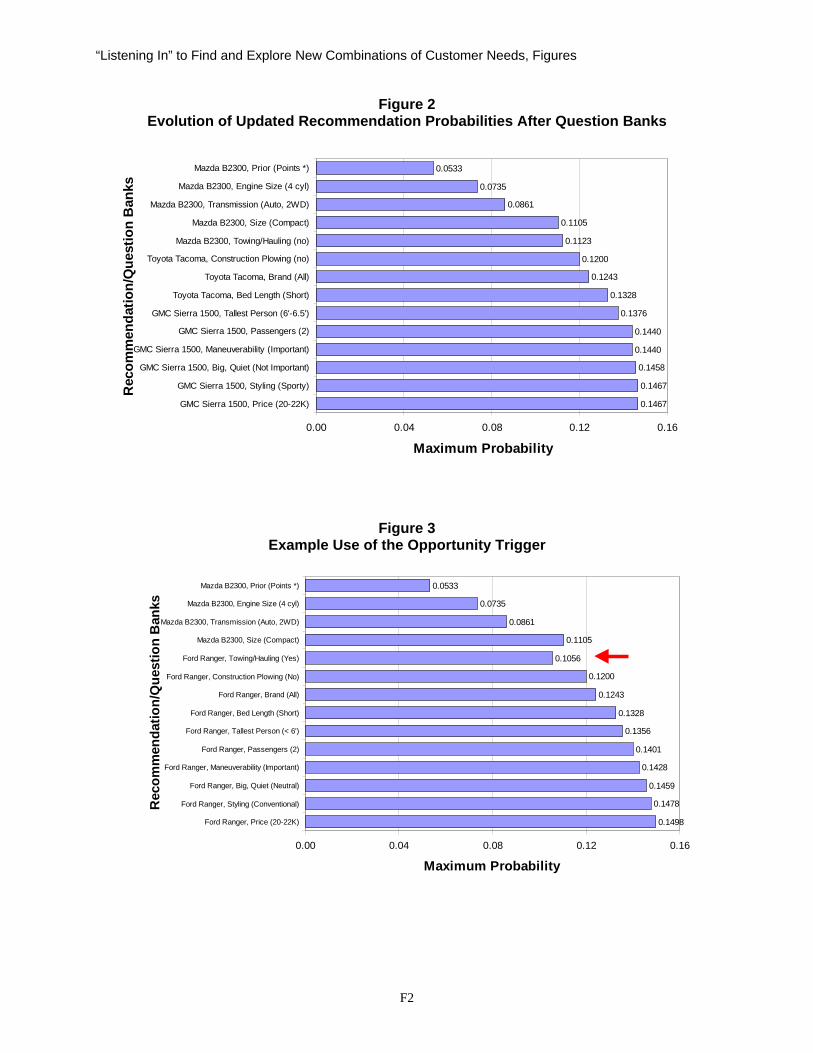
Figure 2 gives a simplified example for one customer of the evolution of the recommen-
dation probability. The current recommendation is given on the left and the probability that the
customer will purchase that recommended vehicle is given on the right. Also listed on the left
are the question bank and parts of the answer. For example, after the second question bank on
engine size, the customer answers “4 cylinders.” If the customer were to stop answering ques-
tion banks and request a recommendation, the advisor would recommend the Mazda B2300 and
forecast a 0.0735 probability that the customer would purchase the Mazda B2300. In Figure 2
the probability of purchase increases for the most preferred truck after each question bank is an-
swered. Note that the recommended vehicle changes after the fifth question bank and again after
the eighth question bank.
<Insert Figure 2 about here.>
Question Bank Selection
To select the next question bank the virtual advisor attempts to gain as much information
as possible from the customer. For example, if, after reviewing the responses, the advisor de-
cides that a question bank on towing capacity is likely to make one truck more highly probable
and all other trucks less probable, then that question bank might be a good candidate to ask next.
To do this formally, we turn to formal theory in which information is defined as the logarithm of
the relative odds (e.g., Gallagher 1968). That is, the information, I(vj | rq, Rq-1), provided by the
response to question bank q, equals log [P(vj | Rq-1, rq)/P(vj | Rq-1)]. This definition has a number
of nice theoretical properties including that (1) under an equal proportional loss rule, information
always increases when the probability of the maximum-choice truck increases, (2) the expected
8
“Listening In” to Find and Explore New Combinations of Customer Needs
information is maximized for the true probabilities, and (3) the information measure rewards sys-
tems that provide more finely-grained estimates (Kullback 1954; Savage 1971).5
In order to compute the expected information, we take the expectation over all possible
responses to question bank q and over all possible vehicles. The information that we expect
from question bank q is given by Equation 2.
(2) )|(
),|(log),|()|()|(
1
1
11
111
−
−
=−
=−− ∑∑=
qj
qqjn
rqjq
V
jqjq RvP
RrvPRvrPRvPRqEI
q
q
We use a two-step look-head algorithm. For each potential question bank and response on Step
1, the advisor computes the best second question bank and the expected information for that
question bank. It then selects the Step-1 question bank with the highest contingent expected in-
formation.
Initial Calibration
Two estimates are necessary and sufficient for the virtual advisor: prior probabilities,
P(vj), and the conditional response probabilities, P(rq | vj ). The virtual advisor obtains the prior
probabilities for each individual from a logit model based on five truck characteristics: price, fuel
economy, performance, reliability, and safety. Each customer is asked initial constant-sum, self-
explicated importance weights (wc) for these characteristics. (These prior weights are obtained
from questions that are asked prior to the question banks illustrated in Figure 2.) The prior prob-
abilities are estimated with Equation 3 where wc is the importance for the cth characteristic, xjc is
the value of characteristic c for vehicle vj, and β is a scaling parameter.
(3)
∑=
∑
∑
=
=
=V
j
xw
xw
j
cjcc
cjcc
e
evP
1
5
1
5
1
)(β
β
The characteristic values for each existing vehicle and the scaling parameters are obtained from
archival data and judgments by managers and engineers. For example, prior surveys to owners
help establish that the Toyota Tacoma 4x4 (regular cab) has a rating of 1.087 on fuel economy
and a rating of 1.241 on performance. For the GMC Sonoma 2WD Regular Cab the correspond-
ing ratings are 2.116 and 0.525 respectively. (Data disguised slightly.) The actual data were syn-
thesized from “an ongoing global effort” by the manufacturer “to understand consumers’ needs
and wants related to motor vehicles.” (Quotes from a proprietary study.) Part of this ongoing
9
“Listening In” to Find and Explore New Combinations of Customer Needs
global effort included data from the AIO questionnaire described earlier (76 “personal view-
points” and 38 “vehicle characteristics”). When new vehicles become available, managers and
engineers provide temporary estimates of the xjc’s.
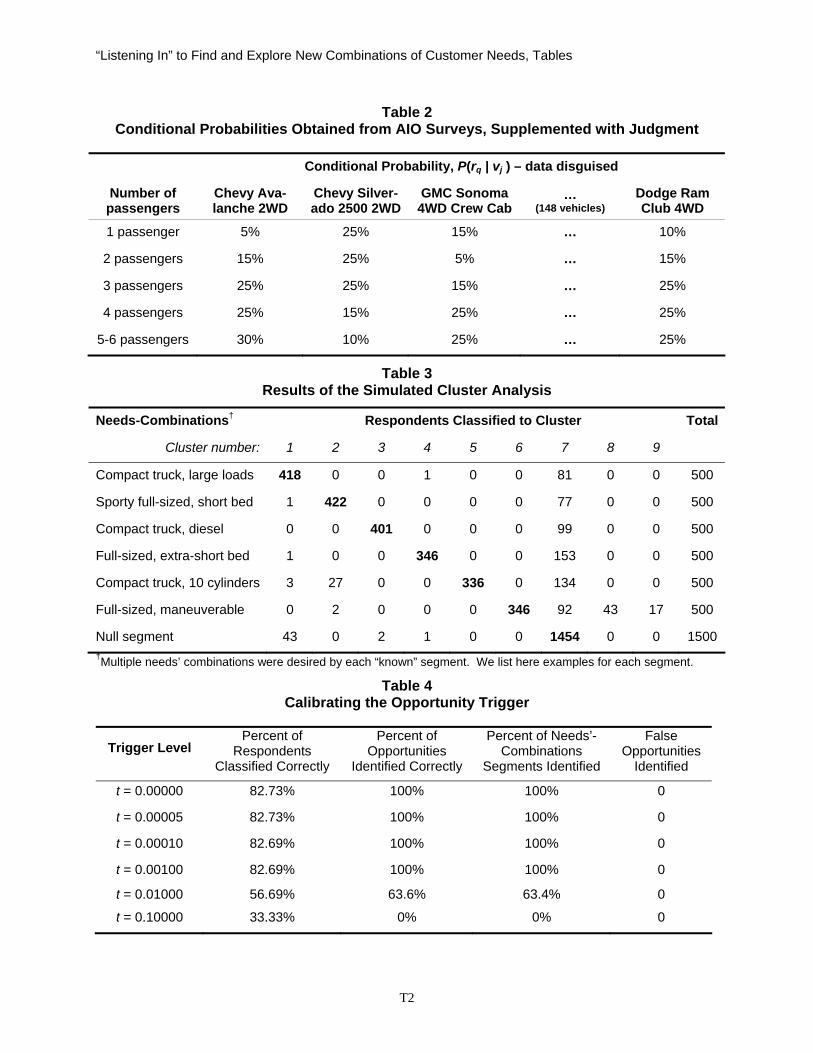
The conditional response probabilities are based on the ongoing AIO surveys, supple-
mented when necessary by experienced managers and engineers. For example, the survey data
suggest that customers who prefer the Toyota Tacoma 4x4 (regular cab) are likely to answer that
they prefer a four-wheel drive vehicle 84% of the time. They are likely to answer that they pre-
fer two-wheel drive only 16% of the time. Table 2 illustrates data , disguised slightly, on condi-
tional probabilities for numbers of passengers that are obtained from AIO studies. These data,
P(rq | vj), are sufficient for the updating equations (Equations 1’ and 2) if they are available for
all question banks in the virtual advisor.
<Insert Table 2 about here.>
Evolving Question Banks
Virtual advisors and “listening-in” are not one-shot studies. Markets evolve as customer
needs change and technology improves. Each year brings changing features and new truck
brands. To be effective in advising customers and identifying new opportunities, it must be rela-
tively simple to update the prior and conditional probabilities with data from multiple sources.
For example, suppose that four-wheel steering becomes a feature that is important to customers
(and a feature that helps the advisor recommend a truck). Suppose further that some truck
brands start offering this feature for the 2003 model year. We add a question bank on steering to
the set of available trucks. Because of the local independence property, we need only obtain in-
cremental data for the new question banks. We need to know how owners of each truck brand
will rate their vehicles on the new question bank. For new truck brands we need to know how
owners of the new brands will rate their vehicles on the characteristic values (xjc’s) and how they
will answer each question bank, P(rq | vj). These data are obtained from the periodic AIO sur-
veys or from other sources such as one-time surveys and judgment. In essence, the virtual advi-
sor (and “listening-in”) free-rides on surveys undertaken by the manufacturer for other purposes.
This adaptability is a key feature necessary for practical application and represents a conceptual
difference between the Bayesian virtual advisor and tailored interviewing. The former uses
Bayesian methods to incorporate new data from multiple sources while the latter relies on maxi-
mum-likelihood estimates obtained from a calibration survey. Each method is matched to its ap-
10

“Listening In” to Find and Explore New Combinations of Customer Needs
plication domain. However, future research might combine these relative strengths into an im-
proved methodology.
Opportunity Trigger Mechanism The next stages of “listening in” identify when opportunities exist and identify the com-
binations of customer needs that are not satisfied by existing vehicles.
Trigger Mechanism to Identify When Opportunities Exist
For many customers an existing vehicle will fulfill their needs and the updated recom-
mendation probabilities will evolve smoothly as in Figure 2. Existing vehicles satisfy the com-
binations of needs desired by these customers. However, for some customers, their answers to
question banks reveal inconsistencies. For example, suppose that (1) the customer has already
answered constant-sum importance question banks that indicate reliability and low price are im-
portant (price 30 points, performance 10 points, fuel economy 20 points, reliability 30 points,
and safety 10 points) and (2) the customer’s subsequent answers suggest an interest in a small
truck with a 4-cylinder engine, two-wheel drive, and automatic transmission. The Mazda B2300
fits these preferences best (see Figure 3 – Question banks 1 to 4). Given these answers the vir-
tual advisor decides that further information on towing and hauling will clarify recommenda-
tions. The advisor expects that the customer will want to haul relatively light loads such as small-
garden equipment or tow a jet ski. Knowing the exact towing and hauling needs will help the
advisor decide among a number of otherwise comparable light-duty trucks.
However, suppose the customer says that he or she plans to use the truck to haul heavy
materials and tow a large motor boat (weighing 6,500 pounds). No existing light-duty truck can
tow such heavy loads effectively and safely. On the other hand, no truck that can tow such
heavy loads can fill the customer’s requirements as expressed in earlier question banks. If
enough customers desire these combinations of features, this may be an opportunity worth inves-
tigating – a light-duty truck that can occasionally haul heavy materials or tow heavy loads. Note
that the goal is to define the opportunity by “needs” (light-duty, haul heavy materials) rather than
“features” (V8 engine). In this way, new vehicles can satisfy these newly identified combina-
tions of customer needs with features that may or may not be available in existing vehicles.
The intuition in this example is that the question bank on towing and hauling revealed
something about the customer’s underlying needs. This new information suggests that the cus-
tomer is not satisfied with the needs’ combinations provided by existing trucks; the virtual advi-
11

“Listening In” to Find and Explore New Combinations of Customer Needs
sor will have to revise its best-truck recommendation probability downward. This drop in the
maximum recommendation probability becomes a trigger for further investigation. We illustrate
this trigger mechanism by an arrow in the dialogue in Figure 3. Question Bank 5, which in-
cluded questions about towing and hauling, causes the most preferred vehicle to change from the
Mazda to a Ford Ranger (a slightly larger and more-powerful compact truck). Utility drops be-
cause this more powerful compact truck is an insufficient compromise to meet the towing and
hauling requirements and the requirements expressed in Question banks 1-4. (It has a 6-cylinder
engine and is more expensive.) A full-sized truck, such as the Chevrolet Silverado 1500, could
fulfill the towing and hauling requirements, but the advisor does not recommend the Silverado
because it does poorly on the other desired features. After further question banks, the recom-
mendation probabilities in Figure 3 again increase because the Ford Ranger fulfills the additional
requirements.
<Insert Figure 3 about here.>
The intuitive idea in Figure 3 has appeal, but before we incorporate the trigger mecha-
nism we must investigate it further. For example, the posterior probability might drop because
there is error in the customer’s response. If the trigger mechanism is too sensitive, it might iden-
tify many false need-conflicts and the true need-conflicts might be lost in the noise. On the other
hand, if it is not sensitive enough, the trigger mechanism might miss opportunities. We show
later in this paper, through simulation, how to select a sensitivity level for the trigger mechanism
such that segments of customers desiring known combinations of needs are recovered with suffi-
cient precision. In these simulations we begin with real data for the conditional probabilities and
create “known” segments. We then add error and examine how various sensitivity levels balance
false positives and false negatives. The simulations demonstrate that calibration is feasible and
that the performance of the “listening-in” mechanism is reasonably robust in the face of response
errors. It is also reasonably robust with respect to the sensitivity levels chosen for the trigger
mechanism. Having thus established a reasonable degree of internal validity we are more confi-
dent in applying the methodology to real data.
The other issue it theoretical. The intuition, above, assumes that a drop in posterior prob-
ability identifies a conflict in the desired customer needs that are fulfilled by existing vehicles. If
a question bank affected only the vehicle that was recommended prior to the qth question bank
and if that same vehicle were recommended after the qth question bank, then most random utility
12
“Listening In” to Find and Explore New Combinations of Customer Needs
models would suggest that a probability drop is an indicator of an underlying utility drop. For
example, both the logit and the probit models have this property. However, each question bank
can affect the probabilities of all 148 vehicles and change the identity of the recommended vehi-
cle based on the qth question bank. We demonstrate formally in the Appendix that the intuition
still holds. If the qth question bank does not change the identity of the recommended vehicle,
then a drop in posterior probability is a necessary and sufficient condition that the recommended
vehicle has characteristics in conflict with the customer’s preferences. The more complex issue
is when the qth question bank changes the identity of the recommended vehicle. We show for-
mally that if the recommended vehicle changes and the posterior probability drops, then it must
be the case that a truck with mixed characteristics would have higher utility than either the truck
recommended before the qth question bank or the truck recommended after the qth question bank.
We also show that the better-for-the-customer mixed-characteristic truck is not an existing truck.
Analyses to Identify Which Combinations of Customer Needs are Not Satisfied
When a probability drop identifies a potential conflict, we seek further information to
identify which customer needs are in conflict. Consider first a null hypothesis that the existing
trucks satisfy (almost all) customer needs’ combinations. This hypothesis implies that, if two
truck characteristics are positively correlated among existing trucks, then we expect them to be
positively correlated among customers’ preferences as revealed by their answers to the questions
banks. For example, based on existing trucks we expect a positive correlation across vehicles of
the probabilities that a customer (1) will use the truck for trailering heavy loads and (2) prefer a
rugged body style for that vehicle. Based on existing trucks we expect a negative correlation of
the probabilities that a customer will (1) use the truck for trailering heavy loads and (3) prefer a
compact body style. Because no existing truck satisfies these needs simultaneously, recommen-
dation probabilities will drop when the customer requests a compact truck that can tow heavy
loads (Appendix).
This means we can identify the needs’ combinations that caused the drop by examining
negative correlations among expected answers to the question banks for the questions answered
by those customers who experienced a probability drop. The probability drop challenges the null
hypothesis and its implications. That is, those customers who experience a probability drop want
some combinations of customer needs that, in the existing market, are negatively correlated. To
13
“Listening In” to Find and Explore New Combinations of Customer Needs
find the desired combinations from the set of all negatively correlated combinations we limit our
search to the need-combinations evaluated by those customers with probability drops.
Formally, let pqrrρ be the correlation across vehicles of the conditional probabilities of a
customer answering rq to question bank q and answering rp to question bank p.6 Let Ρ be the ma-
trix of these correlations (here Ρ is a capital ρ). Whenever a probability drop suggests a potential
opportunity, the “listening-in” algorithm examines all correlations corresponding to that cus-
tomer’s answers to the first q question banks ( qq rR Υ1− ). It flags those which are highly negative
(less than –0.30 in our application). Such negative correlations indicate why the (triggered) cus-
tomer’s desired benefits (needs) are not fulfilled by existing trucks (subject to statistical confi-
dence). The level of the flagging mechanism is set with simulation.
The opportunity trigger identifies those customers who have combinations of needs that
are not satisfied and flags specific entries in the Ρ-matrix to identify combinations of needs that
represent new opportunities. These combinations of needs are a working hypothesis for a new
opportunity. However, before the automotive firm can act upon that working hypothesis, it
needs further information about the potential opportunity. It needs more information because the
number of questions used by the virtual advisor is, by necessity, a compromise between efficient
recommendation (fewer questions) and probes for new combinations of needs (more questions).
To understand and explore the opportunity more completely, “listening in” complements the vir-
tual advisor and the trigger mechanism with a virtual engineer and a design palette.
A Virtual Engineer Clarifies the Opportunity The virtual engineer (VE) concentrates its questions to obtain relevant, more-detailed in-
formation about combinations of customer needs. The VE asks relatively few questions of each
targeted customer (six screens in our application), but, across many customers, its questions span
the needs-space. In our application, the VE explores an additional 79 features beyond the 36 fea-
tures explored in the virtual advisor. Like the virtual advisor, the VE is designed to be flexible;
its questions are updated continuously without re-commissioning large-scale AIO surveys.
The concept of a VE is simple; its implementation difficult. To be useful, the VE must
ask the customer those questions that inform the engineering design decisions that are necessary
to design a truck to meet the customers’ newly identified (potential) combination of needs. To
be credible to the customer, the VE must ask questions in a non-technical manner that relates to
14
“Listening In” to Find and Explore New Combinations of Customer Needs
how the customer uses the truck. Naturally, the VE evolves through application, but we describe
here the process by which the initial VE questions are created.
An engineering design team from a major automotive manufacturer considered the basic
engineering problem imposed by potential conflicting needs. The team then generated the ques-
tions that the team would need answered in order to clarify the opportunity and decide among
basic solutions to conflicts. The engineering team formulated the questions that they would ask
the customer if they were participating in the dialogue between the advisor and customer. For
example, if the customer wants a compact truck that can tow a large boat, then the engineering
team would ask about the type of boat (e.g., modest sailboat, large motor boat, or multiple jet
skis) and the weight of the boat(s) that the customer plans to tow. The engineering team would
also ask the customer why he or she wants a compact truck (e.g., low price, tight parking, high
maneuverability, fuel economy, etc.). All engineering questions are then rephrased into cus-
tomer language.
In addition to the questions identified by the engineering team, the VE includes open-
ended dialogues which enable the customer to elaborate further the reasons underlying the previ-
ously-unidentified combinations of needs. Figure 4 illustrates a sample dialogue in which the
VE introduces himself, asks about a conflict, gathers quantitative data, and asks for open-ended
comments. In this example, the conflict is between a full-sized truck and a 6-cyclinder engine.
<Insert Figure 4 about here.>
A Design Palette Solicits Customer Solutions to Potential Conflicts We supplement the VE with a design palette (DP) covering fourteen features. The DP’s
perspective is the customer’s own solutions (von Hippel 1986). The DP is similar to innovation
“tool-kits,” configurators, and choice-boards which enable customers to mix and match features
(Dahan and Hauser 2002; Hauser and Toubia 2003; Liechty, Ramaswamy and Cohen 2001; von
Hippel 2001).
The DP is illustrated in Figure 5. The customer (a) receives instructions, (b) changes the
size of the truck, and (c) changes the color. For brevity, we have not shown the many intermedi-
ate steps, some of which include new state-of-the-art truck features such as four-wheel steering
and extra-wide frames. However, changes do not come free to the customer. There are sophisti-
cated engineering/cost models underlying the DP. For example, if the customer changes the size
of the truck, then the price, fuel economy, and towing/payload capacity change accordingly. Af-
15
“Listening In” to Find and Explore New Combinations of Customer Needs
ter completing the redesign the customer is given the opportunity to indicate whether, and by
how much, he or she prefers the new design. (The customer may not prefer the new design be-
cause of accumulated “sticker shock” or because of an holistic judgment of the final truck.) In
the empirical application described later in this paper, 73% of the respondents who completed
the exercise indicated that they would purchase their custom-designed truck were it available.7
<Insert Figure 5 about here.>
Design palettes are evolving rapidly. For example, one system enables the customer to
adjust the length of the hood of a car or truck while the software automatically insures the integ-
rity of other design elements such as the windshield angle and window shape. The customer sim-
ply clicks on the hood and drags it forward or clicks on the front bumper and pushes it back. Us-
ing this advanced DP, the customer creates easily a Euro sports design (short front overhang,
high truck deck, low overall height) that is pleasing to the eye and incorporates many “design”
heuristics. Alternatively, by lengthening the front overhang and the hood the customer creates a
classic look with a long sloping back to the truck. The software is sufficiently advanced that the
customer can then rotate the model in all directions to get a full 3D view.
Together the virtual advisor, VE, and DP explore 129 customer needs (1052 combina-
tions, many needs are multi-level). These detailed data help the firm understand the customer-
need conflicts that led some customers to experience a probability drop. The philosophy behind
this “listening-in” search differs from conjoint analysis. Conjoint analysis collects data on the
importances of customer needs and searches to find needs’ combinations that satisfy a minimum
share of the market profitably. On the other hand, “listening in” monitors needs’ requests in or-
der to identify when customers request combinations of needs that are not now fulfilled by exist-
ing trucks. After the opportunities are identified, they can be explored further with conjoint
analysis.
Initial Sizing of the Opportunity The next stage of “listening in” groups customers according to their unmet combinations
of needs as revealed through flagging components of the Ρ-matrix (supplemented with the VE
and DP for interpretation). This estimate of market potential is a rough indicator, but it is suffi-
cient to identify potential opportunities for the fuzzy front end of an iterative product develop-
16
“Listening In” to Find and Explore New Combinations of Customer Needs
ment process. The firm evaluates these opportunities further with targeted qualitative and quan-
titative research.
Let Ai represent customer i’s answers to the question banks. For each Ai we identify a
subset, Ρi, of the Ρ-matrix, that represents strongly negative correlations. By clustering triggered
respondents on Ρi, we identify groups of customers with similar combinations of desired needs
that are not fulfilled (on average) by existing trucks. Subject to the caveat of self-selected cus-
tomers, the size of the cluster as a fraction of the initial sample is a rough indicator of the size of
the segment who desires the identified combinations of needs.8 To simulate a new truck “de-
sign,” we define a concept truck by the needs it fulfills as reflected by customers’ answers to the
question banks, P(rq | vj). These “data” are sufficient to calculate revised posterior probabilities
for all trucks, including the new truck concept (Equation 1’). Averaging the revised posterior
probabilities over respondents provides a rough estimate of the potential market share for the
new concept truck.
Monte Carlo Simulations: Sensitivity to Error and the Trigger Mechanism If successful, “listening in” will affect billion-dollar decisions on new truck platforms.
Before we can be confident in its application we must address three issues. First we want to
know whether “listening in” can recover opportunities from noisy data. This issue is best ad-
dressed with simulation because we can specify “known” segment of customers who have unmet
needs’ combinations. Second, applications require that the opportunity trigger be calibrated.
Here, too, simulation is best to determine the best trigger sensitivity. The final issues, relevance
and external validity, are best addressed with a “proof-of-concept” application in which we “lis-
ten in” to real customers in a pilot study to determine whether unmet combinations of needs can
be identified. We hope that the pilot study can, at least, identify combinations of needs that were
discovered in parallel by alternative studies (at much greater expense). Recall that the truck
manufacturers routinely spend tens of millions of dollars annually on market research.
Simulation Methodology
We use the conditional probabilities, P(rq | vj)’s. and Ρ-matrix correlations based on the
100,000-respondent AIO study supplemented by managerial judgment. Based on the “proof-of-
concept” study described below, we select three segments of customers whose needs are satisfied
by existing trucks (e.g., full-sized trucks that can tow and haul large loads). These three seg-
17
“Listening In” to Find and Explore New Combinations of Customer Needs
ments provide a base-line with which to test whether the methodology identifies false opportuni-
ties. Next we generate six segments with combinations of needs that are not satisfied by existing
trucks. We define their responses to the question banks to be consistent with their desired bene-
fits (needs). We seek to test whether “listening in” can recover these segments from noisy data.
Because of the multiple stages of “listening in,” this is far from assured. In total we generate
nine customer segments of 500 respondents each – a total of 4,500 simulated respondents.
We next add errors to the customer’s responses. For the rq’s, which are nominal vari-
ables, we randomly select E% of the questions to be answered incorrectly. The incorrect an-
swers are distributed among the remaining categories based on a uniform distribution. For the
wc’s, which are interval-scaled variables (mean = 20), we simulate response error by adding a
zero-mean, normally-distributed response error such that the standard deviation of the error
equals a specified number of points (e). For simplicity we truncate negative self-explicated im-
portances which, fortunately, occur with low probability. We then apply the “listening-in” equa-
tions to each of the 4,500 simulated respondents. For clustering the Ρ-matrix, we use a k-means
non-tree clustering algorithm based on the Euclidean norm defined on the matrix of negative cor-
relations from triggered respondents (respondents by potential conflict pairs). Details available
from the authors.
Internal Validity – Testing Recovery of Unmet Needs’ Combinations from Noisy Data
As a first test of internal validity we add moderate noise with e = 5 points and E = 10%.
We use a relatively sensitive opportunity trigger; we record conflict correlations whenever
- ≤ 0.00005. We examine sensitivity to this parameter below. ),|( 11 −qq RrvP )|( 11 −qRvP
Table 3 suggests that “listening in” can recover “known” needs’ combinations from mod-
erately noisy data. The entries indicate the number of respondents from a true segment (rows)
that were assigned to a cluster (columns). The largest number in each row is displayed in bold
text. We examine Table 3 at the macro level and at the micro level.
<Insert Table 3 about here.>
The managerial focus is at the macro level. First, we notice the diagonal nature of the
data in Table 3 – even with noise in the data, “listening in” identified all five segments. Next we
look at the unmet combinations of needs that defined each segment. For example, the first
“known” segment was defined by four need-conflicts: compact truck/tow large loads, compact
truck/haul large loads, 4-cylinder engine/tow large loads, and a 4-cyclinder engine/haul large
18
“Listening In” to Find and Explore New Combinations of Customer Needs
loads. In Cluster 1, the percentages of respondents who had these needs were 95.9%, 82.4%,
77.3%, and 73.3% respectively. No other need conflict was identified for more than 9.4% of the
Cluster-1 respondents. We obtain similar results for the other five “known” clusters. There were
no false-positive needs’ combinations identified at the macro level. (Clusters 8 and 9 are redun-
dant with Cluster 6.)
At the micro level, 82.7% of the respondents were classified correctly. Most of the mis-
classifications were respondents who were classified falsely to the null segment because of errors
in their responses. The simulation identified 21,096 conflict pairs compared to only 16,500 true
conflict pairs – 14% were false negatives and 36% were false positives. Thus, response errors
clearly affect the classification of specific respondents. Fortunately, the macro-level identifica-
tion of unmet needs’ combinations appears robust with respect to these micro errors. We now
test whether this insight generalizes to other levels of errors (e and E) and other sensitivities of
the opportunity trigger.
Setting the Sensitivity of the Opportunity Trigger and Its Relative Robustness
Table 4 repeats the simulations for various trigger sensitivities (t) varying from extremely
sensitive (t = 0.00000) to extremely insensitive (t = 0.10000). At both the macro- and micro-
levels, “listening in” is relatively robust with respect to the trigger level for t ≤ 0.001. For larger
sensitivities performance degrades. For extremely high t, all opportunities are missed. Based on
Table 4, and simulations with other levels of error, we recommend a sensitive trigger. The exact
level is less critical as long as the level is below 0.001.
<Insert Table 4 about here.>
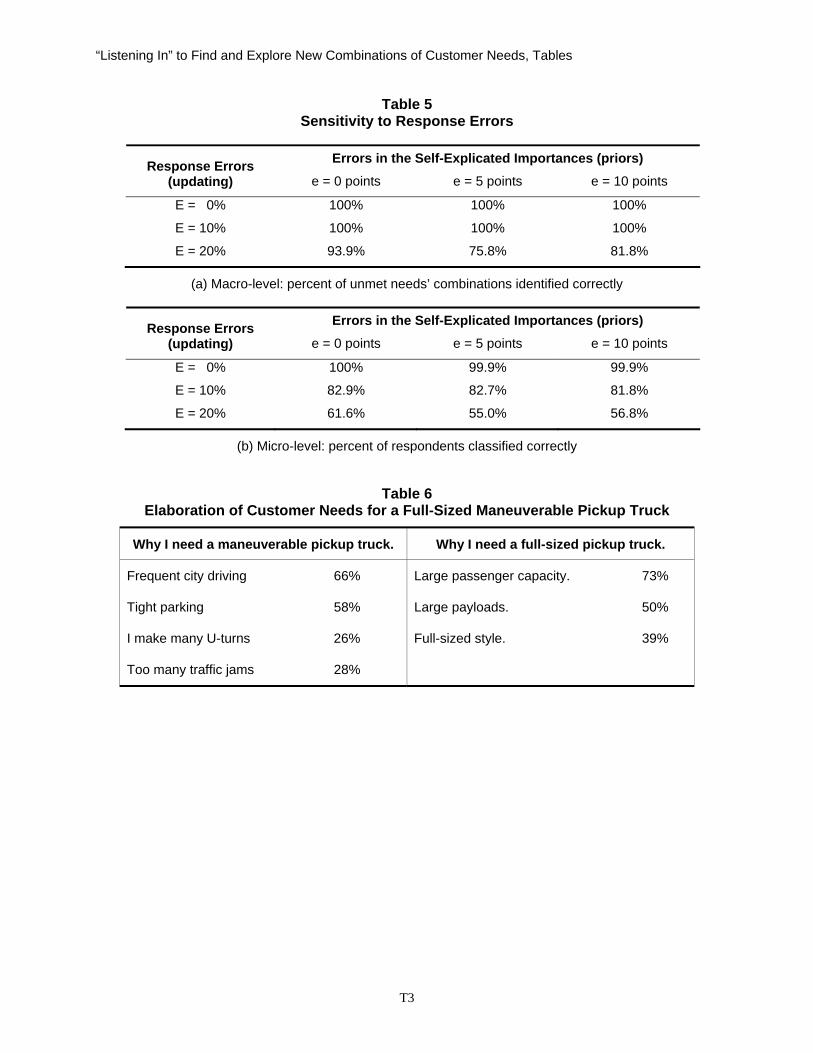
Sensitivity to the Level of Response Errors
We now explore the sensitivity of “listening in” to response errors in the constant-sum
question banks (e) and the nominal question banks (E). We examine performance at both the
macro-level (percent of needs’ combinations identified) and the micro-level (percent of respon-
dents classified correctly). Table 5 suggests that performance is relatively insensitive to errors in
the priors (wc’s), even for errors that are 50% of the mean response (10 points). This is not sur-
prising for a Bayesian system – the impact of the priors diminishes as more question banks are
answered. However, performance is sensitive to errors in the nominal question banks with clear
degradation at a 20% error. Such an error rate would correspond to 1 in 5 respondents saying
19
“Listening In” to Find and Explore New Combinations of Customer Needs
they want a compact truck when they really want a large truck. Table 5 indicates that care must
be taken in web design to engage customers with clear questions so that error rates (E) remain at
10% or lower.9
<Insert Table 5 about here.>
Summary
Together Tables 3, 4, and 5 suggest a reasonable level of internal validity despite errors
in both the prior preferences and the responses to the question banks. As long as the trigger level
is relatively sensitive (≤ 0.001) and the nominal error is moderate (≤10%), “listening in” can
identify “known” segments of customers who desire those combinations of needs that are not
met with existing trucks. Recovery is not perfect when there are response errors, but this level of
recovery should be sufficient for the fuzzy front end of product development, especially when fi-
nal managerial decisions are refined with subsequent qualitative and quantitative data.
“Proof-of-Concept” Application and Test Before bringing “listening in” on-line to a situation in which over 350,000 customers are
tracked annually, it was important to test the methodology in a pilot test with real customers. In
August of 2001 an automotive manufacturer sponsored a study in which 1,092 pickup-truck cus-
tomers were recruited from the Harris Interactive Panel and given a $20 incentive to participate
in the test.10 On average each customer spent 45 minutes with the virtual advisor, design palette,
and virtual engineer (when triggered). Most customers found the experience worthwhile. Cus-
tomers trusted the virtual advisor by an 8-to-1 margin over dealers and would be more likely to
purchase a vehicle recommended by the virtual advisor by a 4-to-1 margin over a vehicle rec-
ommended by a dealer. For the design palette, 78% found it an enjoyable experience and 82%
felt it was a serious exercise. When the virtual engineer was triggered, 88% found the questions
easy to answer and 77% felt that the virtual engineer related well to their needs. Interestingly,
56% of the customers reported that they would pay for the advise provided by the virtual advisor
if it were included in the price of the pickup truck that they purchased as a result of using the ad-
visor.
With a sensitive trigger, the most common pairwise conflicts were a maneuverable full-
sized truck (38%), a compact truck which could tow and haul heavy materials (14%), and a full-
sized truck with a six-cylinder engine (7%). Two segments of customers were identified who
20

“Listening In” to Find and Explore New Combinations of Customer Needs
expressed unmet combinations of needs. Segment 1 (S1) requested large trucks but indicated a
desire for maneuverability. S1 consisted of two groups – those who wanted a top-of-the-line
truck and those who wanted a standard full-sized pickup. Segment 2 (S2) requested a compact
truck that could tow and haul heavy loads. Table 6 provides more detail on S1. From the VE we
learn that respondents are using the full-sized truck for city driving. Large trucks fulfill critical
needs for large passenger capacity and large payloads. However, these respondents also desire
maneuverability – combinations of benefits (needs) that are not available with existing trucks.
<Insert Table 6 about here.>
The DP explored S1’s desires further. The features that they changed most often were
truck height (6’ to 7’), truck width (6’ to 7’), and steering (two-wheel to four-wheel steering).
This suggests that they are looking for an even larger truck, but that they would be interested in
four-wheel steering to gain maneuverability. Using the methods described earlier for market siz-
ing, we estimated the potential market share of a full-sized truck with four-wheel steering.
Based on cost models, we calculated that the extra features would increase the manufacturer’s
suggested retail price (MSRP) by $3,000. For this concept truck, the “listening-in” equations es-
timate a market-share increase for the manufacturer of 3-4% (the exact value is coded for confi-
dentiality).11 Such a $2.4-to-3.2 billion dollar per year opportunity is worth further investigation.
In addition, a compact truck with heavy-duty hauling and towing is estimated to be a $1-to-2 bil-
lion opportunity (values coded). Technically, these benefit (needs) combinations are feasible us-
ing a small truck platform with a strong frame, transmission, and engine.
After our study was complete we learned (previously unknown to us) that the automotive
manufacturer was in the process of introducing four-wheel steering in order to improve the ma-
neuverability of its top-of-the-line pickup truck (the 2002 GMC Denali). This combination of
needs had been identified with traditional methods (Table 1), but at a significantly greater cost.
This truck is selling well. We plan to monitor the sales of this truck to determine whether its
sales are in the rough range predicted by the market-sizing equations.. We could find no indica-
tion that traditional methods identified the need for a basic truck with four-wheel steering. We
plan to monitor whether such a combination of needs is confirmed with traditional methods.
Summary, Discussion, and Future Research In this paper we explore a methodology to “listen in” on customer dialogues with virtual
advisors in order to identify combinations of customer needs that are not fulfilled by existing
21

“Listening In” to Find and Explore New Combinations of Customer Needs
trucks. Monte Carlo analyses suggest that “listening in” is internally valid and relatively robust
with respect to response errors and trigger sensitivity. A “proof-of-concept” demonstration sug-
gests that unmet needs’ combinations for real respondents can be identified.
Like all methodologies, “listening in” will benefit from continuous improvement. Each
stage can be improved – better methods to identify priors, more efficient look-ahead algorithms,
improved calibration of the trigger mechanism, and better indicators of conflicting needs could
all benefit from further research. The dialogues, the user interfaces, and the presentation of
stimuli are all areas of potential improvement. For example, work is now underway to put more
“stretch” into the design palette and to give the virtual advisor and the virtual engineer personali-
ties based on “talking heads.” The various stages of “listening in” are designed to be modular.
Future research could explore other advisors, triggering mechanisms, means to identify and size
segments (e.g., latent structure analysis), and applications (e.g., telecommunications, consumer
electronics, travel services, and financial services).
22
“Listening In” to Find and Explore New Combinations of Customer Needs, Endnotes
Endnotes 1Table 1 also includes tailored interviewing, an approach that shows promise for automotive ap-plications, especially the segmentation gearbox used in the virtual advisor. 2The industry term, gearbox, is an analogy. Just as the gearbox in a car matches engine speed to wheel speed, the segmentation questions match the manufacturer’s vehicles to the customer.
3The global set of question banks, from which the algorithm selects, is drawn from cluster analy-ses of the ongoing AIO surveys, supplemented with managerial judgment. The set of question banks evolves based on ongoing market intelligence. These methods are state-of-the-art, but standard, marketing research practice. They are not the focus of this paper.
4 In most equations, we suppress the individual customer subscript, i, for simplicity.
5 For applications in marketing of information-theory-based reward functions see Hauser (1978) and Herniter (1973). For applications in psychology, see Prelec (2001).
6 Such correlations across vehicles are consistent with local independence which assumes re-sponse independence conditioned on a given vehicle. Local independence allows customers to be heterogeneous across vehicles in their answers to the question banks.
7 Due to self-preference learning, memory accessibility, and context effects, the preference for the self-designed truck might be inflated (Simmons, Bickart and Lynch 1993; Tourangeau, Rips and Rasinski 2000). This does not diminish the value of the design palette as a means to clarify opportunities.
8There is self-selection because customers choose to initiate dialogues with virtual advisors. Nonetheless, a large fraction of self-selected customers might still be an important opportunity. We expect less self-selection as more truck customers use the web to search for information.
9 There appears to be a slight anomaly in the last rows of Tables 5a and 5b. For E=20%, classifi-cation and identification appear to increase slightly with errors in the self-explicated impor-tances. This happens because the combination of errors pushes more respondents to the “no-conflict” clusters. As a result, a few more “no-conflict” respondents are classified correctly mak-ing it easier to achieve a “majority” in the remaining clusters. Neither difference is significant at the 0.05 level with a two-tailed t-test.
10 This initial test was based on a stratified random sample of the panel. For this test, all custom-ers were given the opportunity to use the design palette.
11 We obtain rough forecasts by adding a full-sized maneuverable pickup truck to the choice sets of the needs-segment customers. We obtain P(rq | vj) for the new vehicle by assuming a profile similar to an existing vehicle except for the critical responses on the size and maneuverability questions, which are changed to be consistent with the vehicle being both full-sized and maneu-verable. The iterative use of Equation 1 provides the estimates.
E1
“Listening In” to Find and Explore New Combinations of Customer Needs, Figures
Figure 1 Example Question Banks Asked by Bayesian Virtual Advisor
(a) Introductory Screen (b) Example Question bank
F1
“Listening In” to Find and Explore New Combinations of Customer Needs, Figures
Figure 2 Evolution of Updated Recommendation Probabilities After Question Banks
0.1467
0.1467
0.1458
0.1440
0.1440
0.1376
0.1328
0.1243
0.1200
0.1123
0.1105
0.0861
0.0735
0.0533
0.00 0.04 0.08 0.12 0.16
GMC Sierra 1500, Price (20-22K)
GMC Sierra 1500, Styling (Sporty)
GMC Sierra 1500, Big, Quiet (Not Important)
GMC Sierra 1500, Maneuverability (Important)
GMC Sierra 1500, Passengers (2)
GMC Sierra 1500, Tallest Person (6'-6.5')
Toyota Tacoma, Bed Length (Short)
Toyota Tacoma, Brand (All)
Toyota Tacoma, Construction Plowing (no)
Mazda B2300, Towing/Hauling (no)
Mazda B2300, Size (Compact)
Mazda B2300, Transmission (Auto, 2WD)
Mazda B2300, Engine Size (4 cyl)
Mazda B2300, Prior (Points *)
Rec
omm
enda
tion/
Que
stio
n B
anks
Maximum Probability
Figure 3
Example Use of the Opportunity Trigger
0.1498
0.1478
0.1459
0.1428
0.1401
0.1356
0.1328
0.1243
0.1200
0.1056
0.1105
0.0861
0.0735
0.0533
0.00 0.04 0.08 0.12 0.16
Ford Ranger, Price (20-22K)
Ford Ranger, Styling (Conventional)
Ford Ranger, Big, Quiet (Neutral)
Ford Ranger, Maneuverability (Important)
Ford Ranger, Passengers (2)
Ford Ranger, Tallest Person (< 6')
Ford Ranger, Bed Length (Short)
Ford Ranger, Brand (All)
Ford Ranger, Construction Plowing (No)
Ford Ranger, Towing/Hauling (Yes)
Mazda B2300, Size (Compact)
Mazda B2300, Transmission (Auto, 2WD)
Mazda B2300, Engine Size (4 cyl)
Mazda B2300, Prior (Points *)
Rec
omm
enda
tion/
Que
stio
n B
anks
Maximum Probability
F2

“Listening In” to Find and Explore New Combinations of Customer Needs, Figures
Figure 4 Virtual Engineer
(a) Introductory Screen (b) Example Dialogue
(c) Specific Questions to Elaborate (d) Open-ended Questions
F3
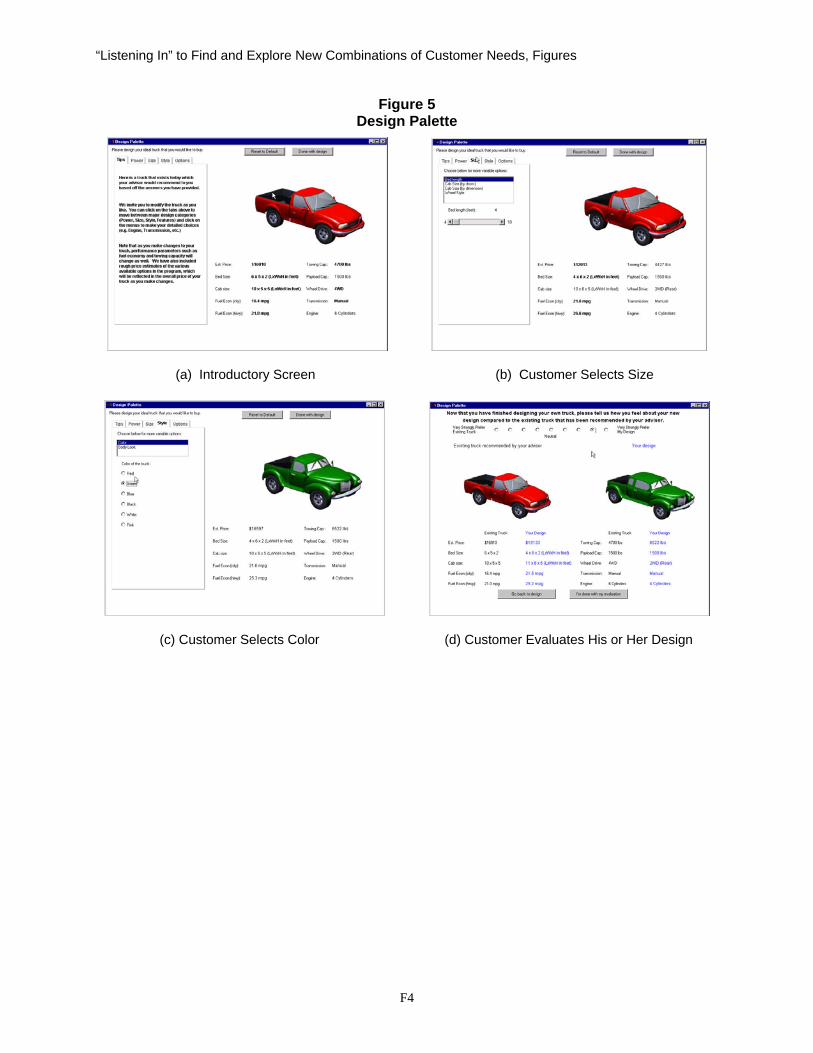
“Listening In” to Find and Explore New Combinations of Customer Needs, Figures
Figure 5 Design Palette
(a) Introductory Screen (b) Customer Selects Size
(c) Customer Selects Color (d) Customer Evaluates His or Her Design
F4
“Listening In” to Find and Explore New Combinations of Customer Needs, Tables
Table 1 Complementary Methods for Understanding Customer-Need Combinations – Trucks’ Example
Data Source Incremental
Cost per Study Number of Fea-tures or Stated
Needs per Study
Number of Vehicles per
Study
Number of Feature Com-
binations
Includes In-depth Probes
Qualitative and Ethno-graphic Interviews†
5-10 groups of 5-10 customers per segment $40-50,000 50-100 5-10 open-ended yes
Tailored Interviews* – Segmentation* 800 personal interviews $80,000 73 scales 7 segments – Interest or intent* 512 (calibration) plus
235 mail questionnaires
$10-15,000 12-15 items (phase 2) single scale – –
AIO Studies† 100,000 mailed
questionnaires $500,000 114 150 – –
Conjoint Analyses† 300 on-line or in-person
interviews $50-100,000 10-20 5-10 106 –
Truck Clinics† 300 central-facility per-
sonal interviews $500,000 40-50 10-20 – yes
Listening In††
Bayesian Advisor track on-line $10-20,000 36 148 – – Opportunity Trigger track on-line included – – 1015 – Virtual Engineer invite on-line included 79 – 1031 yes Design Palette invite on-line included 14 – 106 – Clustering track on-line included – – – †Data as cited in paper and/or typical for the automotive industry. Some estimates are rounded for confidentiality *Data from Kamakura and Wedel (1995, segmentation) and Singh, Howell and Rhoads (1990, Likert). Automotive cost estimates based on sample sizes in the Journal of Marketing Research articles. Cost per respondent is typical for the industry as estimated by auto industry executives and consultants. ††Experience based on pilot study. The numbers of vehicles, needs, and combinations may increase in subsequent applications.
T1
“Listening In” to Find and Explore New Combinations of Customer Needs, Tables
Table 2 Conditional Probabilities Obtained from AIO Surveys, Supplemented with Judgment
Conditional Probability, P(rq | vj ) – data disguised
Number of passengers
Chevy Ava-lanche 2WD
Chevy Silver-ado 2500 2WD
GMC Sonoma 4WD Crew Cab
… (148 vehicles)
Dodge Ram Club 4WD
1 passenger 5% 25% 15% … 10%
2 passengers 15% 25% 5% … 15%
3 passengers 25% 25% 15% … 25%
4 passengers 25% 15% 25% … 25%
5-6 passengers 30% 10% 25% … 25%
Table 3 Results of the Simulated Cluster Analysis
Needs-Combinations† Respondents Classified to Cluster Total
Cluster number: 1 2 3 4 5 6 7 8 9
Compact truck, large loads 418 0 0 1 0 0 81 0 0 500
Sporty full-sized, short bed 1 422 0 0 0 0 77 0 0 500
Compact truck, diesel 0 0 401 0 0 0 99 0 0 500
Full-sized, extra-short bed 1 0 0 346 0 0 153 0 0 500
Compact truck, 10 cylinders 3 27 0 0 336 0 134 0 0 500
Full-sized, maneuverable 0 2 0 0 0 346 92 43 17 500
Null segment 43 0 2 1 0 0 1454 0 0 1500 †Multiple needs’ combinations were desired by each “known” segment. We list here examples for each segment.
Table 4 Calibrating the Opportunity Trigger
Trigger Level
Percent of Respondents
Classified Correctly
Percent of Opportunities
Identified Correctly
Percent of Needs’-Combinations
Segments Identified
False Opportunities
Identified
t = 0.00000 82.73% 100% 100% 0
t = 0.00005 82.73% 100% 100% 0
t = 0.00010 82.69% 100% 100% 0
t = 0.00100 82.69% 100% 100% 0
t = 0.01000 56.69% 63.6% 63.4% 0
t = 0.10000 33.33% 0% 0% 0
T2
“Listening In” to Find and Explore New Combinations of Customer Needs, Tables
Table 5 Sensitivity to Response Errors
Errors in the Self-Explicated Importances (priors) Response Errors
(updating) e = 0 points e = 5 points e = 10 points
E = 0% 100% 100% 100%
E = 10% 100% 100% 100%
E = 20% 93.9% 75.8% 81.8%
(a) Macro-level: percent of unmet needs’ combinations identified correctly
Errors in the Self-Explicated Importances (priors) Response Errors (updating) e = 0 points e = 5 points e = 10 points
E = 0% 100% 99.9% 99.9%
E = 10% 82.9% 82.7% 81.8%
E = 20% 61.6% 55.0% 56.8%
(b) Micro-level: percent of respondents classified correctly
Table 6 Elaboration of Customer Needs for a Full-Sized Maneuverable Pickup Truck
Why I need a maneuverable pickup truck. Why I need a full-sized pickup truck.
Frequent city driving 66% Large passenger capacity. 73%
Tight parking 58% Large payloads. 50%
I make many U-turns 26% Full-sized style. 39%
Too many traffic jams 28%
T3
“Listening In” to Find and Explore New Combinations of Customer Needs, References
References
Balasubramanian, Siva K. and Wagner A. Kamakura (1989), “Measuring Consumer Attitudes
Toward the Marketplace with Tailored Interviews,” Journal of Marketing Research, 26,
(August), 311-326.
Barabba, Vincent P. (2003), Anticipate and Lead: The Sustained Competitive Advantage of
Knowledge-Based Adaptive Enterprise, forthcoming.
---- and Gerald Zaltman (1991), Hearing the Voice of the Market: Competitive Advantage
Through Creative Use of Information, (Boston MA: Harvard Business School Press).
Blackorby, C., D. Primont, and R. R. Russell (1975), “Budgeting, Decentralization, and Aggre-
gation,” Annals of Economic Social Measurement, 4, 1, 23-24.
Dahan, Ely and John R. Hauser (2002), “The Virtual Customer,” Journal of Product Innovation
Management, 19, 5, (September), 332-353.
Gallagher, Robert (1968), Information Theory and Reliable Communication, (New York, NY:
John Wiley & Sons).
Green, Paul E. and V. Srinivasan (1990), “Conjoint Analysis in Marketing: New Developments
With Implications for Research and Practice,” Journal of Marketing, 3-19.
Griffin, Abbie J. and John R. Hauser (1993), “The Voice of the Customer,” Marketing Science,
Winter, 1-27.
Gutman, Jonathan (1982), “A Means-End Chain Model Based on Customer Categorization
Processes.” Journal of Marketing, 46, (Spring), 60-72.
Hauser, John R. (1978), "Testing the Accuracy, Usefulness and Significance of Probabilistic
Models: An Information Theoretic Approach," Operations Research, 26, 3, (May-June),
406-421.
---- and Olivier Toubia (2003), “Properties of Preference Questions: Utility Balance, Choice
Balance, Configurators, and M-Efficiency,” MIT Center for Innovation in Product
Development, Cambridge, MA 02142 (August).
---- and Glen L. Urban (1986), "Value Priority Hypotheses for Consumer Budget Plans," Jour-
nal of Consumer Research, 12, 4, (March), 446-462.
Herniter, Jerry (1973), “An Entropy Model of Brand Purchase Behavior,” Journal of Marketing
Research, 10, 361-375.
R1
“Listening In” to Find and Explore New Combinations of Customer Needs, References
J. D. Power and Associates (2001, 2002), “New Autoshopper.com Study,” (Agoura Hills, CA: J.
D. Power and Associates).
Kamakura, Wagner A. and Michel Wedel (1995), “Life-Style Segmentation with Tailored Inter-
viewing,” Journal of Marketing Research, 32, (August), 308-317.
Kullback, S. (1954). Information Theory and Statistics, (New York: John Wiley & Sons).
Liechty, John, Venkatram Ramaswamy, Steven Cohen (2001), “Choice-Menus for Mass Cus-
tomization: An Experimental Approach for Analyzing Customer Demand With an Ap-
plication to a Web-based Information Service,” Journal of Marketing Research, 38, 2,
(May), 183-196.
McFadden, Daniel (1974), “Conditional Logit Analysis of Qualitative Choice Behavior,” Fron-
tiers in Econometrics, P. Zarembka, ed., (New York: Academic Press), 105-142.
Plummer, Joseph T. (1974), “The Concept and Application of Life Style Segmentation,” Journal
of Marketing, 38, (January), 33-37.
Prelec, Drazen (2001), “A Two-person Scoring Rule for Subjective Reports,” Working Paper
(Cambridge, MA: MIT Sloan School).
Simmons, Carolyn J., Barbara A. Bickart, and John G. Lynch, Jr. (1993), “Capturing and Creat-
ing Public Opinion in Survey Research,” Journal of Consumer Research, 30, (Septem-
ber), 316-329.
Singh, Jagdip, Roy D. Howell, and Gary K. Rhoads (1990), “Adaptive Designs for Likert-Type
Data: An Approach for Implementing Marketing Surveys,” Journal of Marketing Re-
search, 27, (August) 304-321.
Tourangeau, Roger, Lance J. Rips, and Kenneth A. Rasinski (2000), The Psychology of Survey Re-
sponse, (New York, NY: Cambridge University Press).
Ulrich, Karl T. and Steven D. Eppinger (1995), Product Design and Development, (New York, NY:
McGraw Hill).
Urban, Glen L. and John R. Hauser (1993), Design and Marketing of New Products, 2E, (Engle-
wood Cliffs, NJ: Prentice Hall, Inc.
----, Bruce Weinberg, and John R. Hauser (1996), "Premarket Forecasting of Really-New Prod-
ucts," Journal of Marketing, 60, 1, (January), 47-60.
von Hippel, Eric (1986), “Lead Users: A Source of Novel Product Concepts,” Management Sci-
ence, 32, 791-805.
R2

“Listening In” to Find and Explore New Combinations of Customer Needs, References
---- (2001), “Perspective: User Toolkits for Innovation,” Journal of Product Innovation Man-
agement, 18, 247-257.
Zaltman, Gerald (1997), “Rethinking Market Research: Putting People Back In,” Journal of
Marketing Research, 23, (November), 424-437.
R3
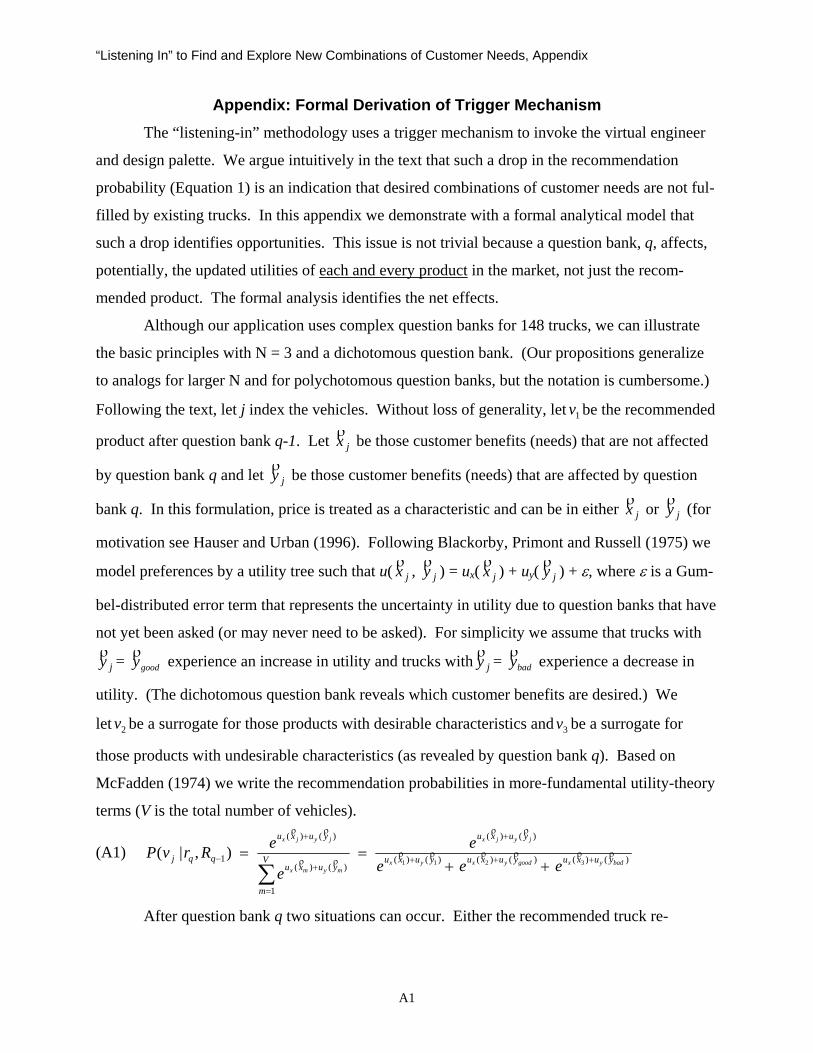
“Listening In” to Find and Explore New Combinations of Customer Needs, Appendix
Appendix: Formal Derivation of Trigger Mechanism The “listening-in” methodology uses a trigger mechanism to invoke the virtual engineer
and design palette. We argue intuitively in the text that such a drop in the recommendation
probability (Equation 1) is an indication that desired combinations of customer needs are not ful-
filled by existing trucks. In this appendix we demonstrate with a formal analytical model that
such a drop identifies opportunities. This issue is not trivial because a question bank, q, affects,
potentially, the updated utilities of each and every product in the market, not just the recom-
mended product. The formal analysis identifies the net effects.
Although our application uses complex question banks for 148 trucks, we can illustrate
the basic principles with N = 3 and a dichotomous question bank. (Our propositions generalize
to analogs for larger N and for polychotomous question banks, but the notation is cumbersome.)
Following the text, let j index the vehicles. Without loss of generality, let be the recommended
product after question bank q-1. Let
1v
jxρ be those customer benefits (needs) that are not affected
by question bank q and let jyρ be those customer benefits (needs) that are affected by question
bank q. In this formulation, price is treated as a characteristic and can be in either jxρ or jyρ (for
motivation see Hauser and Urban (1996). Following Blackorby, Primont and Russell (1975) we
model preferences by a utility tree such that u( jxρ , jyρ ) = ux( jxρ ) + uy( jyρ ) + ε, where ε is a Gum-
bel-distributed error term that represents the uncertainty in utility due to question banks that have
not yet been asked (or may never need to be asked). For simplicity we assume that trucks with
jyρ = goodyρ experience an increase in utility and trucks with jyρ = badyρ experience a decrease in
utility. (The dichotomous question bank reveals which customer benefits are desired.) We
let be a surrogate for those products with desirable characteristics and be a surrogate for
those products with undesirable characteristics (as revealed by question bank q). Based on
McFadden (1974) we write the recommendation probabilities in more-fundamental utility-theory
terms (V is the total number of vehicles).
2v 3v
(A1) )()()()()()(
)()(
1
)()(
)()(
1 3211),|(
badyxgoodyxyx
jyjx
mymx
jyjx
yuxuyuxuyuxu
yuxu
V
m
yuxu
yuxu
qqj eeee
e
eRrvP ρρρρρρ
ρρ
ρρ
ρρ
+++
+
=
+
+
− ++==
∑
After question bank q two situations can occur. Either the recommended truck re-
A1

“Listening In” to Find and Explore New Combinations of Customer Needs, Appendix
mains or the recommended truck becomes . It cannot become because, even if 1v 2v 3v 1yρ = badyρ ,
would still be preferred to . Propositions 1 and 2 address the two situations. Together they
indicate that, whenever the recommendation probability drops, an opportunity exists for a new,
higher-utility truck with mixed characteristics.
1v 3v
Proposition 1. If the recommended truck after question bank q is the same truck as that recommended after question bank q-1, then has undesirable characteristics (1v 1yρ =
badyρ ) if and only if decreases. If the probability decreases, a new truck with mixed characteristics has higher utility than the recommended truck. That new truck is not currently available in the marketplace.
),|( 11 −qq RrvP
Proposition 2. If the recommended truck after question bank q is different than the truck recommended after question bank q-1 and if the recommendation probability de-creases, then has undesirable characteristics (1v y1
ρ = badyρ ). A new truck with mixed characteristics has higher utility than the both the recommended truck after q-1 question banks and the recommended truck after q question banks. That new truck is not cur-rently available in the marketplace. Proofs. Straightforward algebra establishes that - is proportional to ),|( 11 −qq RrvP )|( 11 −qRvP
0)()()()()()( 3131 ≥− ++++ badyxxgoodyxx yuxuxuyuxuxu eeρρρρρρ
if 1yρ = goodyρ and )()()( 21 badyxx yuxuxueρρρ
++ - )()()( 21 goodyxx yuxuxueρρρ
++ ≤
0 if 1yρ = badyρ . Algebra also establishes that the proportionality (denominator) is positive. This
establishes the first statement in Proposition 1 and also implies that 1yρ = badyρ if the probability
drops. Since )()()()( 1111 badygoody yuxuyuxu +>+ρρ , a new product with 1xρ and goodyρ has higher
utility. If the recommended truck changes after question bank q, then <
and, because the recommendation probability decreases, we have <
. Thus < and, by Proposition 1, we have that
),|( 11 −qq RrvP
),|( 12 −qq RrvP ),|( 12 −qq RrvP
)|( 11 −qRvP ),|( 11 −qq RrvP )|( 11 −qRvP 1yρ = badyρ . This
establishes the first result in Proposition 2. Because was recommended before question bank q,
we have
1v
)()( 21 xuxu xxρρ
> and by supposition we have )( goody yu ρ - )( bady yu ρ > 0, thus a product with
the features, 1xρ and 2yρ , will have higher utility than either or . This establishes the second
result in Proposition 2. In both propositions we know that the new truck does not currently exist
because, if it were available, it would higher utility and, hence, would have been recommended.
1v 2v
A2

“Listening In” to Find and Explore New Combinations of Customer Needs, Appendix
Generalizations. If there are n2 trucks like v2 and n3 trucks like v3, then the analogs to Proposi-
tions 1 and 2 are readily proven. The numbers n2 and n3 enter the equations for -
, but the basic proofs remain intact. If there are many trucks with
),|( 11 −qq RrvP
)|( 11 −qRvP goodyρ or badyρ , but
with different jxρ , the expressions for - include more terms, but each can
be proven to have the correct sign – increases if
),|( 11 −qq RrvP )|( 11 −qRvP
goodyρ and decreases if badyρ . With these changes,
the remaining portions of the proofs follow as above.
We use Equation 1 to make the proofs transparent. Both propositions can be generalized
to other probability models with the appropriate characteristics. We leave the details of these
generalizations to the reader.
A3