Embed Size (px)
Citation preview

INSTITUTE OF SEISMOLOGY UNIVERSITY OF HELSINKI
REPORT S-45
LITHOSPHERE 2004 THIRD SYMPOSIUM ON
THE STRUCTURE, COMPOSITION AND EVOLUTION OF THE LITHOSPHERE IN FINLAND
PROGRAMME AND EXTENDED ABSTRACTSedited by
Carl Ehlers, Olav Eklund, Annakaisa Korja, Annika Kruuna, Raimo Lahtinen, Lauri J. Pesonen
Åbo Akademi University, Arken Campus,
Turku, November 10-11, 2004
Helsinki 2004

ii
Editor-in-Chief: Pekka Heikkinen Guest Editors: Carl Ehlers, Olav Eklund, Annakaisa Korja, Annika Kruuna,
Raimo Lahtinen, Lauri J. Pesonen
Publisher: Institute of Seismology P.O. Box 68 FIN-00014 University of Helsinki Finland Phone: +358-9-1911 (exchange) Fax: +358-9-191 51626 http://www.seismo.helsinki.fi
ISBN 951-45-7999-2 ISSN 0357-3060
Helsinki 2004 Helsinki University Press
iii
LITHOSPHERE 2004
THIRD SYMPOSIUM ONTHE STRUCTURE, COMPOSITION AND EVOLUTION
OF THE LITHOSPHERE IN FINLAND
SPONSORSFinnish National Committee of the International Litosphere Programme (ILP) Stiftelsen för Åbo Akademi Posiva Oy Institute of Seismology, University of Helsinki Åbo Akademi University
ORGANIZING COMMITTEE AND EDITORSCarl Ehlers Department of Geology and Mineralogy Åbo Akademi University 20500 Turku, Finland E-mail: [email protected] Eklund Department of Geology 20014 University of Turku, Finland E-mail: [email protected] Korja Institute of Seismology P.O. Box 26 00014 University of Helsinki, Finland E-mail: [email protected] Kruuna Department of Geology and Mineralogy Åbo Akademi University 20500 Turku, Finland E-mail: [email protected] Lahtinen Geological Survey of Finland P.O. Box 96 02151 Espoo, Finland E-mail: [email protected] J. Pesonen Department of Physical Sciences Devision of Geophysics P.O. Box 64 00014 University of Helsinki E-mail: [email protected]
ReferenceEhlers, C., Eklund, O., Korja, A., Kruuna, A., Lahtinen, R. and Pesonen, L.J., 2004 (Eds.)
Litosphere 2004 – Third Symposium on the Structure, Composition and Evolution of the Litosphere in Finland. Programme and Extended Abstracts, Turku, Finland, November 10- 11, 2004. Institute of Seismology, University of Helsinki, Report S-45, 131 Pages.
Keywords (GeoRef Thesaurus, AGI): lithosphere, crust, upper mantle, Fennoscandia, Finland, Precambrian, Baltic Shield, symposia

iv

v
TABLE OF CONTENTS
PREFACE vii PROGRAMME ix EXTENDED ABSTRACTS xiii
Ehlers, C., Skiöld, T. and Vaasjoki, M. Timing of Svecofennian crustal grovth and collissional tectonics in Åland, SW Finland.
1
Eklund, O., Jurvanen, T. and Väisänen, Markku. Tonalites and similar rocks formed in pre-to syn-collisional stages of the Svecofennian orogeny.
3
Engström, J. and Levin, T. Late-Svecofennian deformation – evidence from D4
structures on the Kemiö Island, SW Finland 7
Heikkinen, P., Kukkonen, I.T., Ekdahl, E., Hjelt, S.-E., Korja, A., Lahtinen, R.,
Yliniemi, J., Berzin, R. and FIRE Working Group. FIRE transects: New images of the Precambrian crust
11
Helenius, E.-M., Eklund, O., Väisänen, M. and Hölttä, P. Petrogenesis ofcharnockites in the Turku granulite area
17
Hjelt, S.-E. One more time: SVEKALAPKO; some seismological comments 21 Huhma, H., Hanski, E. and Vuollo, J. Sm-Nd isotopes in Paleoproterozoic mafic
rocks in Finland – rifting of Archean lithosphere and mantle sources 25
Hyvönen, T., Tiira, T., Rautioaho, E., Korja, A. and Heikkinen, P. Seismic tomographic images of the crust in southern and central Finland
29
Kaikkonen, P., Korja, T., Kozlovskaya, E., Moisio, K., Lahti, I. and Vaittinen, K.
A research project: An integrated 3-D geophysical model of the lithosphere in the central Fennoscandian Shield
35
Koivula, H., Poutainen, M., Johansson, J.M., Scherneck, H.-G., Milne, G.A.,
Mitrovica, J.X., Davis, J.L. and Vermeer, M. BIFROST: Continuous GPS measurements of the three dimensional deformation in Fennoscandia
39
Korhonen, J.V., Reeves, C., Ghidella, M., Maus, S., McLean, S. and Ravat, D.
World Digital Magnetic Anomaly Map - presenting lithospheric contribution to the Earth's total magnetic field
45
Korja, A., Lahtinen, R. and Nironen, M. The processes forming the Palaeoproterozoic Svecofennian
47
Kosunen, P., Korja, A., Nironen, M., Rämö, O.T. and Heikkinen, P. Stabilizationprocesses of Precambrian continental crust - an integrated geophysical-petrological study of the Central Finland Granitoid Complex
53
Kozlovskaya, E., Vescey, L., Plomerová, J., Babuska, V., Hjelt, S.-E. and Ratia, T.
Structure of the upper mantle beneath central Fennoscandian Shield fromseismic anisotropy studies
57
Kukkonen, I.T., Korja, A., Lahtinen, R., Heikkinen, P. and FIRE Working Group.Thermal modelling of crustal stacking and exhumation during thePalaeoproterozoic orogenic growth of the central Fennoscandian Shield
61
Kurhila, M., Vaasjoki, M., Mänttäri, I., Rämö, T. and Nironen, M. Single zircon U-Pb age results from the late Svecofennian microcline granites, southeastern Finland
63
Kuusisto, M., Kukkonen, I., Heikkinen, P. and Pesonen, L.J. Composition of the crust in the central Fennoscandian Shield: Lithological modelling of seismicvelocity data
67
Lauri, L.S., Huhma, H., Mänttäri, I. and Räsänen, J. New zircon and monazite ages and Nd isotope data on the Archean complex in Koillismaa, easternFinland
71

vi
Mertanen, S. Middle Proterozoic - Paleozoic tectono-thermal reactivation of the crust in southern Finland and northwestern Russia - paleomagnetic evidences
75
Mäkinen, J., Engfeldt, A., Harsson, B.G., Ruotsalainen, H., Strykowski, G., Oja, T.
and Wolf, D. The Fennoscandian Land Uplift Gravity Lines: Status 2004 81
Nyström, A.I., Whitehouse, M.J. and Kriegsman, L.M. Oxygen isotope and trace element zoning in garnets from granulite facies psammopelitic migmatite, SWFinland
89
Pedersen, K. Exploration of the Deep Subterranean Biosphere 95 Peltonen, P., Mänttäri, I. and Huhma, H. Isotopic constraints for the origin of the
mafic lower crust at the Karelian craton margin 97
Pirttijärvi, M., Kozlovskaya, E., Elo, S., Hjelt, S.-E. and Yliniemi, J. 3-D geophysical crustal model of Finland
101
Rämö, O.T., Mänttäri, I., Kohonen, J., Upton, B.G.J., Vaasjoki, M., Luttinen, A.V.,
Lindqvist, V., Lobaev, V., Cuney, M. and Sviridenko, L.P. The Lake Ladoga basin; preliminary insights into geochronology, igneous evolution, andtectonic significance
105
Siira, T., Junttila, J. and Strand, K. Clay Mineral Occurrence in Prydz Bay Rise (ODP Site 1165), Antarctica: Implications for the Middle Miocene and theMiddle Pliocene Ice Sheet Evolution
107
Sorjonen-Ward, P. Orogenic architecture and mineralization - general concepts, comparisons and relevance to Fennoscandia
111
Strand, K. IODP investigates the solid earth’s cycles and global environmentalchange
117
Tiensuu, K. and Strand, K. Integration of geophysical data with sedimentcomposition, examples from Prydz Bay (ODP Site 1166), Antarctica
119
Uski, M., Tiira, T., Korja, A. and Elo, S. The Anjalankoski earthquake swarm in May 2003
123
Woodard, J. and Hölttä, P. Carbonate vein-dykes in Naantali: a new occurrence ofcarbonatite in southwestern Finland?
127
vii
PREFACE
The tremendous amount of new seismic reflection profiles from the deep seismic FIRE
project will give us new and unique possibilities to study the structure and evolution of the lithosphere in Finland and will certainly keep both geophysicists and geologists busy for some time forward. One aim of the first Lithosphere meeting in 2000 was to increase the contact surface between geologists and geophysicists and to act as a forum for scientific correlation of surface geology and sub-surface geophysics. This is still the major aim of the present third biennial LITHOSPHERE 2004 symposium after the successful two earlier meetings. The earlier trend of studies concerning the more recent evolution and activities within our Fennoscandian Shield seems to continue, and it is our wish in the ILP Finnish National Committee that the symposium this time again will give a picture of the state of the art within our fields of research. We hope that LITHOSPHERE 2004 will promote more cooperation between geophysical and geological studies of the lithosphere and that it will stimulate further modelling and new research projects.
The two-day symposium will this time take place in the Arken campus, Åbo Akademi University, Tehtaankatu 2, Turku, November 10-11, 2004 with participation from the Universities in Helsinki, Turku and Oulu, the Geological Survey of Finland and the Finnish Geodetic Institute. The Symposium will be hosted by the ILP and supported by POSIVA Oy and Stiftelsen för Åbo Akademi. Posters prepared by graduate- or postgraduate students will be evaluated and the best will be awarded.
This symposium has the following themes:
Theme 1. The Structure and Composition of the Crust
Theme 2. Three-dimensional Models of Fennoscandia
Theme 3. Crustal Movements
Theme 4. Deep Biosphere and IODP
Theme 5. Initiating New ILP Proposals
Theme 6. Open Forum
Theme 7. General Discussion and Poster Awards
This special volume “Lithosphere 2004” contains the programme and extended abstracts of the symposium in alphabetical order.
Turku, October 28th, 2004
Carl Ehlers, Olav Eklund, Annakaisa Korja, Raimo Lahtinen, Lauri J. Pesonen Organizing Committee

viii

ix
PROGRAMME
Wednesday, November 10, 2004, 10.00-19.00
09.30 – 10.00 Registration at Åbo Akademi University, ARKEN campus Tehtaankatu 2, Turku
10.00-11.00 Opening Session
Chair Carl Ehlers
10.00.10.05 Opening of the symposium by the Organising Committee (Carl Ehlers)10.05-10.20 One more time: SVEKALAPKO; some seismological comments.
(S-E. Hjelt)10.20-11.00 FIRE transects: New images of the Precambrian crust.
(Heikkinen, P., Kukkonen, I.T., Ekdahl, E., Hjelt, S.-E., Korja, A., Lahtinen,
R., Yliniemi, J., Berzin, R. and FIRE Working Group)
14.50-15.15 Coffee Break
14.50–12.25 Three-dimensional Models of Fennoscandia
Chair Ilmo Kukkonen
11.10-11.35 3-D geophysical crustal model of Finland. (Pirttijärvi, M., Kozlovskaya, E., Elo, S., Hjelt, S-E., Yliniemi, J.)
11.35-12.00 Seismic tomographic images of the crust in southern and central Finland. (Hyvönen, T., Tiira, T., Rautioaho, E., Korja, A., Heikkinen, P.)
12.00-12.25 Structure of the upper mantel beneath central Fennoscandian Shield from seismic anisotropy studies. (Kozlovskaya, E., Vescey, L., Plomerová, J.,
Babuska, V., Hjelt, S.-E. and Ratia, T.)
12.25-13.30 Lunch break
13.30-15.10 The Structure and Composition of the Crust, Part I
Chair Pekka Nurmi
13.30-13.55 The processes forming the Palaeoproterozoic Svecofennian. (Korja, A., Lahtinen, R., Nironen, M.)
13.55-14.20 Thermal modelling of crustal stacking and exhumation during the Palaeo-proterozoic orogenic growth of the central Fennoscandian Shield.(Kukkonen, I.T., Korja, A., Lahtinen, R., Heikkinen, P., & FIRE Working
Group)
14.20-14.45 Isotopic constraints for the origin of the mafic lower crust at the Karelian Craton margin. (Peltonen, P., Mänttäri, I., Huhma, H.)
14.45-15.10 Orogenic architecture and mineralization - general concepts, comparisons and relevance to Fennoscandia. (Sorjonen-Ward, P.)
15.10-15.30 Coffee Break

x
15.30-17.00 Crustal Movements
Chair Krister Sundblad
15.30-15.55 The Lake Ladoga basin: preliminary insights into geochronology, igneous evolution, and tectonic significance.
(Rämö,O.T., Mänttäri, I., Kohonen, J., Upton, B.G.J., Vaasjoki, M., Luttinen,
A.V., Lindqvist, V., Lobaev, V., Cuney, M., Sviridenko, L.P.)15.55-16.20 Middle Proterozoic-Palaeozoic tectono-thermal reactivation of the crust in southern Finland and Northwestern Russia – paleomagnetic evidences. (Mertanen, S.)16.20-16.40 The Fennoscandian Land Uplift Gravity lines: Status 2004.
(Mäkinen, J., Engfeldet, A., Harsson, B.G., Ruotsalainen, H., Strykowski, G.,
Oja, T., Wolf, D.)
16.40-17.00 BIFROST: Continuous GPS measurements of the three dimensional deformation in Fennoscandia.
(Koivula, H., Poutanen, M., Johansson, J.M., Scherneck, H-G., Milne, G.A.,
Mitrovica, J.X., Davis, J.L., Vermeer, M.)
17.00-19.00 Poster Session
Chair Pekka Heikkinen
P1 Carbonate vein-dykes in Naantali: a new occurrence of carbonatite in SW Finland? (Woodard, J., Hölttä, P.)P2 Petrogenesis of charnockites in the Turku granulite area. (Helenius, E-M.,
Eklund, O., Väisänen, M., Hölttä, P.)P3 Single zircon U-Pb age results from the late Svecofennian microcline granites,
southwetern Finland. (Kurhila, M., Vaasjoki, M., Mänttäri, I., Rämö, T.,
Nironen, M.)P4 Late-Svecofennian deformation – evidence from D4 structures from the
Kemiö island, SW Finland. (Engström, J., Levin, T.)P5 The Anjalankoski earthquake swarm in May 2003.
(Uski, M., Korja, A., Elo, S.)P6 Integration of geophysical data with sediment composition, examples from Prydz Bay (ODP Site 1166) Antarctica. (Tiensuu, K., Strand, K.)P7 Clay mineral Occurrence in Prydz Bay Rize (ODP Site 1165) Antarctica: Implications for the Middle Miocene and the Middle Pliocene ice sheet evolution. (Siira, T., Junttila, J., Strand, K.)P8 World Digital Magnetic Anomaly Map - presenting lithospheric contribution
to the Earth's total magnetic field. (Korhonen, J.V., Reeves, C., Ghidella. M.,
Maus. S., McLean. S., Ravat. D.)
P9 Oxygen isotope and trace element zoning in garnets from granulite facies psammopelitic migmatite, SW Finland. (Nyström, A.I., Whitehouse, M.J.
Kriegsman, L.M.)
19- Conference Dinner
Organized by Pulterit ry at the “Gadolinia” building, Porthaniankatu 3.

xi
Thursday, November 11, 2004, 9.00 – 1700
09.00– 10.20 Deep Biosphere and IODP
Chair Olav Eklund
09.00 - 9.40 Key Note Lecture:
Exploration of the deep subterranean biosphere. (Pedersen, K.)
09.40-10.20 IODP investigates the solid earth’s cycles and global environmental change. (Strand, K.)
10.20 –10.40 Coffee Break
10.40-12.00 The Structure and Composition of the Crust, Part II
Chair Raimo Lahtinen
10.40-11.05 Timing of crustal growth and collissional tectonics in Åland SW Finland. (Ehlers, C., Skiöld, T., Vaasjoki, M.)
11.05-11.30 Tonalites and similar rocks formed in pre- to syn-collissional stages of the Svecofennian orogeny. (Eklund, O., Jurvanen, T., Väisänen, M.)
11.30-11.55 Composition of the crust in the central Fennoscandian Shield: Lithological modelling of seismic velocity data. (Kuusisto, M., Kukkonen, I., Heikkinen, P., Pesonen, L.J.)
12.00-13.00 Lunch
13.00 -14.00 Initiating New ILP Proposals – A Brainstorm Session
Chair Ilmo Kukkonen
14.00-14.50 The Structure and Composition of the Crust, Part III
Chair Annakaisa Korja
14.00-14.25 New zircon and monazite ages and Nd isotope data on the Arhean complex in Koillismaa, eastern Finland. (Lauri, L.S., Huhma, H., Mänttäri, I.,
Räsänen, J.)14.25-14.50 Sm-Nd isotopes in Palaeoproterozoic mafic rocks in Finland –rifting of
Archean lithosphere and mantle sources. (Huhma, H., Hanski, E., Vuollo, J.)
14.50-15.15 Coffee Break
15.15-16.00 Open Forum, Short Presentations (5-10 min)
Chair Sven-Erik Hjelt
ICDP (Kukkonen, I.T. et al.)
IGCP –projects
A research project: An integrated 3-D geophysical model of the lithosphere in the central Fennoscandian Shield (Kaikkonen et al.,)
Stabilization process of the Precambrian continental crust (Kosunen, P. et al.)
Proterozoic mantle enrichment from Ladoga to Juankoski (Shebanov, A. et
al.)

xii
16.00-16.30 Closing Session
Chair Olav Eklund
Poster Awards General Discussion Concluding Remarks

xiii
EXTENDED ABSTRACTS

xiv
EXTENDED ABSTRACTS


LITOSPHERE 10.- 11.11.2004 Page 1
Timing of Svecofennian crustal grovth and collissional tectonics in Åland, SW Finland
Carl Ehlers1, Torbjörn Skiöld2 and Matti Vaasjoki3
1Department of Geology and mineralogy, Åbo Akademi University, FIN-20 500 Turku, Finland 2Swedish Museum of Natural History, Box 50 007, SE-104 05 Stockholm, Sweden
3Geological Survey of Finland, FIN-02150 Espoo, Finland
In an effort to quantify the timing of the tectonomagmatic evolution of the Southern Svecofennian Arc Complex (SSAC), advanced radiometric techniques have been applied on structurally distinct rock complexes. We report the results of high-resolution ion micro probe spot analyses (SIMS) on zircon determined at the Nordic NORDSIM facility and measurements using isotope dilution mass spectrometry (ID-TIMS) on zircon, monazite and titanite applying both large-sample multi-grain as well as single-grain techniques (Ehlers, Skiöld, Vaasjoki 2004)
A collage of imbricated rock slabs, the result of tectonic shortening, representing the culmination of large-scale penetrative deformations in the Svecofennian has been investigated in the Torsholma area, Åland Islands. We consider this to be a key area of structural significance for resolving some important phases in Svecofennian tectonics.
Another structurally significant feature investigated is the South Finland Shear Zone (SFSZ), that transects the southwestern archipelago and follows the south coast of Finland. This shear zone forms the southern limit of the c. 1830 Ma Late Svecofennian Granite and Migmatite zone and also features deformations of a later stage when the southern region of the exposed Svecofennian was consolidated.
The accumulated age results and tectonic analyses may be summarized as follows. The Enklinge volcanic sequence (1885 6 Ma) is within error coeval with the intrusion of the abundant early-kinematic gneissose granodiorites whose average age of 1884 5 Ma marks the formation of new crust in this region. Some of these gneisses contain a significant amount of 2000 - 2080 Ma zircon. Altough many Svecofennian granitoids are known to contain heterogeneous (inherited) zircon populations, the Kökar gneiss is, to the best of our knowledge, the first case were inheritage from c. 2030 Ma sources has been unequivocally demonstrated in a syntectonic Svecofennian intrusive rock.
At Torsholma, the granodioritic orthogneisses (1879 6 Ma) similarly intruded the supracrustal series, and subsequently became metamorphosed into granulites. The mesoscopic recumbent folds and subhorizontal schistosities of these gneisses were transected by a set of steep amphibolitic dykes indicating an episode of extension. After this phase the gneisses were sandwiched between the supracrustal rocks, and subsequentlyintruded by granodioritic sheet-like intrusions (1861 19 Ma) with associated dykes (1865 7 Ma). This tectonic scenario took place during approximately 15 Ma (c. 1875 – 1860 Ma) and records the culmination of the Svecofennian collissional deformation.
Monazites and zircon overgrowth textures give concordant U-Pb ages of c. 1830 Ma in accordance with previous ages on surrounding late Svecofennian granites and migmatites of the LSGM zone in S Finland.
A steep undeformed pegmatite dyke with a monazite age of 1795±4 Ma transects the whole set of imbricated rock slabs in Torsholma (Fig. 2). The overlapping U-Pb ages of this and other pegmatites of the post-kinematic type intrusions, as well as the timing of the large-scale shear zones, indicate consolidation of the Svecofennian crust. This also

LITOSPHERE 10.- 11.11.2004 Page 2
indicates that deformation at this time was partitioned along steep discret crustal shears in contrast to the earlier subhorizontal crustal shortening and thickening seen in the Torsholma area. The transition between the earlier tectonic history of subhorizontal collissional crustal deformation, and the later phases of strain partitioning into steeply dipping shears must have happened after the intrusion of the subhorizontal granite sheets (c. 1830 Ma) belonging to the LSGM zone of southern Finland.
References Ehlers, C., Skiöld, T-B., Vaasjoki, M. 2004. Timing of Svecofennian crustal grovth and
collissional tectonics in Åland, SW Finland. Bull.Geol.Soc.Finland, vol. 76 (in print)

LITOSPHERE 10.- 11.11.2004 Page 3
Tonalites and similar rocks formed in pre-to syn-collisional stages of the Svecofennian orogeny
Olav Eklund, Terhi Jurvanen and Markku Väisänen
University of Turku, Department of Geology, Fi-20014, Turku, Finland Email: [email protected]
Tonalites are the pricipal continent forming rocks. Our preliminary results show that the tonalites in the accretionary arc complex of southern Finland may have been formed by several petrogenetic processes over a period of 80 Ma years (1900 Ma to 1820 Ma).
1) 1900 Ma tonalites and gabbros associated with volcanic rocks of the accretionary arc-complex of southern Finland. These tonalities can be classified as M-type granitoids.
2) The 1880 Ma Enklinge intrusion is a bimodal tonalite-gabbro intrusion with geochemical character of a typical syn-collisional rock series.
3) In Turku area (and areas in eastern Finland) tonalites evidence an adakitic geochemical signature, that may correspond to melting of a metabasalt at high (15 kbar) pressure. This metabasalt may represent a subducting plate.
4) In some areas of southern Finland melting of amphibolites to tonalities takes place due to high-T low-P regional metamorphism.
Keywords: Proterozoic tonalites, adakites
Compared to the late-, post- and anorogenic Svecofennian magmatism, the synorogenic magmatism has been little studied in Finland and Sweden. Even though tonalites are the principal crust forming rocks, very little effort have been made to study these rocks in detail in the proterozoic part of the Fennoscandian shield. From the accretionary arc complex of southern Finland there are studies by Arth et al. (1978) and Nurmi and
Haapala (1986) that deal with petrogenetic questions on these rocks. Tonalites have been described from a metamorphic point of view in southern Finalnd, where tonalite bodies appear in both amphibolite and granulite facies (Mäkitie 1993; Väisänen and Hölttä, 1999;
Väisänen et al., 2002; Helenius, 2003; Helenius et al. this volume). During the last few years the Department of Geology at Turku University has
collected data about the syn-orogenic magmatism and tonalite genesis from the accretionary arc complex of southern Finland. These studies have shown that the rocks that have generally been mapped as quartz-diorites, tonalites, trondhjemites and granodiorites in southern Finland were formed over a time span on 80 Ma through several petrogenetic processes. In this text the term tonalite is used to describe this group of rocks.
The study by Väisänen (2002) indicate that the tonalite associated with the earliest extrusive volcanic arc rocks in the Orijärvi area are approx. 1900 Ma. This age is contemporaneous with the age of volcanism in the are, why this tonalite may be considered as a pre-collisional tonalite or as defined by Pitcher (1993) a M-type granite.
The studies by Impola (2000) and Eklund (2002) indicate that the 1880 Ma (Suominen,
1991) quartz-diorite and tonalite in Kumlinge (Åland archipelago) seem to be magmatic differentiates from a more gabbroic magma, similar to that described by Arnt et al. (1978)
from the Kalanti area in SW Finland. The geochemical data in the thesis by Helenius
(2003) indicate that tonalities in the Turku area have high Na2O, Mg#, Sr/Y and La/Yb,

LITOSPHERE 10.- 11.11.2004 Page 4
geochemical signatures for adakitic rocks. This means that these tonalites may have been formed by partial melting of a meta-basalt at high pressure (around 15 kbar). This metabasalt may be a subducting slab. In figure 1 geochemistry from Enklinge tonalities and Turku tonalites are compared. The figure show that the two areas show different geochemistry with some overlappings.
Figure 1a. SiO2 versus Mg-number indicating that the tonalites from Turku are have higher Mg-number compared to tonalites from Enklinge area.
Figure 1b. Diagram showing higher Na2O contents for the tonalites in Turku area compared to Enklinge area.
Figure 1c. Sr/Y versus Y diagram that discriminate adakitic tonalites from calk-alkaline tonalites. Tonalites from Turku area plot in the adakite field and tonalites from Enklinge in the calk-alkaline field.
Figure 1d. La/Yb versus Yb diagram indicating that tonalites from Turku area have high La/Yb ratio and low Yb contents, typical for adakitic rocks.
LITOSPHERE 10.- 11.11.2004 Page 5
Lepistö (2003) and Naumanen (2003) investigated a tonalite at Höggrund (western Åland archipelago) that was associated with amphibolitic enclaves. The results of their study was that the tonalite was formed during the regional high T, low P metamorphism in southern Finland at 1840-1820 Ma by melting of amphibolites leaving an amphobile rich melanosome. Amphibolite melting experiments (samples from SW Finland) was undertaken by Lindberg (2002). He concluded that melting of amphibolites took place during the regional metamorphose in southern Finland due to excess of fluids in the system.
Observations of partial melting of amphibolite to tonalite as a consequence of the regional high-T Low-P metamorphism (at ca 1830 Ma) have been made by Kriegsman (1999) and Lindberg (2002). The regional metamorphism did also affect the tonalites, particularly in Turku area, the tonalites were objects to charnockitization at roughly 1820 Ma (Väisänen et al., 2002; Helenius, 2003).
These data show that we about tonalites can use a modified phrase initiated by H.H. Read, “there are tonalites and tonalites” (originally “there are granites and granites”).
References: Arth, J.G., Barker, F., Peterman, Z.E. & Friedman, I.,1978. Trondhjemite Suite of
southwest Finland and its Implications for the Origin of Tonalitic and Trondhjemitic Magmas. Journal of Petrology 19: 289-316.
van Duin, J.A., 1992. The Turku Granulite Area, SW Finland: a fluid-absent Svecofennian granulite occurrence. PhD thesis. Vrije Universiteit, Amsterdam, The Netherland,
234p.Eklund, O., 2002. Restite unmixing, fractional crystallization, and magma mingling in a
two floored magmatic plumbing system, SW Finland. In: Korkka-Niemi, K. (Ed.) Geologian tutkijapäivät, Helsinki 13th – 14th March 2002, abstracts, p. 26.
Helenius. E-M., 2003. Turun alueen charnockiittien petrogenesis. M.Sc. thesis, University of Turku, 72 p. (In Finnish)
Impola, J., 2000. Magma mixing and mingling in a synorogenic granitoid intrusion, Enklinge, Åland, SW Finland. In: 24. Nordiske Geologiske Vintermøte, Trondheim 6.-9. januar 2000, abstracts, p. 89.
Impola, J. (in prep.). Samanaikainen emäksinen ja hapan magmatismi varhais-proterotsooisessa synorogeenisessa granitoidissa, Enklinge, Ahvenanmaa, Lounais-Suomi. M.Sc. Thesis, University of Turku. (In Finnish)
Kriegsman, L., 1999. Program for the ESF Exploratory Workshop “Restite-melt and solid-vapour back reactions: implications for petrology, tectonics, and ore forming processes”, Turku University, Finland, 23-25 August 1999.
Lepistö, S., 2003. Proterotsooisten migmatiittien iästä, petrografiasta ja geokemiallisista ominaispiirteistä Höggrundin saarella, Ahvenanmaan läänissä. M.Sc Thesis, University of Turku, 65 p. (In Finnish)
Lindberg, D., 2002. Effecten av bor i smältningsstudier av metabasiter – en jämförelse med fältförhållanden I Pikis, sydvästra Finland. M.Sc. Thesis, Åbo Akademi University, 64 p. (In Swedish)
Mäkitie, H.,1993. P-T determinations of tonalite from Östersundom - lower granulite facies mineral assemblages in Sipoo, southern Finland. In: Autio, S. (ed.) Geological Survey of Finland, Current Research 1991-1992. Geological Survey of Finland.
Special Paper 18: 19-24.

LITOSPHERE 10.- 11.11.2004 Page 6
Naumanen, K., 2003. Höggrundin migmatiitin termobarometriaa, Ahvenanmaa. M.Sc. Thesis, University of Turku, 65 p. (In Finnish)
Nurmi, P.A. and Haapala, I., 1986. The Proterozoic granitoids of Finland: Granite types, metallogeny and relation to crustal evolution. Bulletin of the Geological Society of
Finland 58: 203-233. Pitcher, W.S., 1993. The nature and origin of granites. Blackie (Chapman-Hall), London,
321 pp. Suominen, V., 1991. The chronostratigraphy of southwestern Finland with special
reference to Postjotnian and Subjotnian diabases. Geological Survey of Finland,
Bulletin 356, 100p. Väisänen, M. & Hölttä, P., 1999. Structural and metamorphic evolution of the Turku
migmatite complex, southwestern Finland. Bulletin of the Geological Society of
Finland 71: 177-218. Väisänen, M., Mänttäri, I. & Hölttä, P., 2002. Svecofennian magmatic and metamorphic
evolution in southwestern Finland as revealed by U-Pb zircon SIMS geochronology. Precambrian Research 116: 111-127.
Väisänen, M., 2002. Tectonic evolution of the Palaeoproterozoic Svecofennian orogen in southwestern Finland. Annales Universitatis Turkuensis, AII, 154, 143 p.

LITOSPHERE 10.- 11.11.2004 Page 7
Late-Svecofennian deformation – evidence from D4 structures on the Kemiö Island, SW Finland
Jon Engström and Thomas Levin
Åbo Akademi University, Department of Geology and Mineralogy, FIN-20500 Turku, Finland. Email: [email protected]
The D1 structures in the study area on the Kemiö Island are mostly small-scale and transposed and overprinted by D2 structures. The D3 deformation phase can be seen as open folds at a regional scale and thus visible only indirectly in the outcrop pattern. An S4 crenulation cleavage in the quartz schist, small F4 folds in the marble and an S4 foliation in the sillimanite schist represent the late-Svecofennian deformation in the study area. These structures have a constant angle (ca. 25°) against the predominating S2 schistosity. As a result of the obtained structural and petrological data a tentative 3D-model of the geological structure is presented.
Keywords: Late-Svecofennian, structural geology, deformation, crenulation cleavage, sillimanite gneiss, quartz schist, Kemiö, SW Finland
The Kemiö Island in SW Finland and the studied Bjensböle area within the migmatite zone of southern Finland are rich in supracrustal rocks that expose evidence of the main deformation phases (D1-D4). The supracrustal rocks are covered by sheets of 1,84-1,81 Ga old microcline granite in the northern and southern parts of the island (Seitsaari 1955;
Dietvorst 1982). The rocks in the study area consist of low P/high T amphibolite facies sillimanite gneiss and low P/low T amphibolite facies quartz schist, separated by a metavolcanic amphibolite horizon in the central part of the area. Thin horizons of marble and black schist have been used as marker horizons.
Three major phases of deformation has been recognized in SW Finland (Schreurs &
Westra 1986; Ehlers et al. 1993; Selonen & Ehlers 1998; Väisänen 2002). The oldest structure in the study area, S0, is defined as the original bedding of the supracrustal rocks. The bedding is only seen at a few localities. The D1 structures are mostly small-scale and transposed and overprinted by D2 structures. The F2 folds are tight to isoclinal with sub-horisontal axial planes. The D2 phase also exhibits a penetrative axial plane foliation (S2).
SW Finland can be divided into two major geological and structural domains, the Kemiö-Orijärvi domain and the Turku domain. The Paimio shear zone separates these two domains from each other. The D3 deformation phase is well exposed in the Turku domain with visible S3 schistosities and small-scale F3 folding (Väisänen & Hölttä 1999). In the Kemiö-Orijärvi domain the D3 deformation phase only exhibit open folds at a regional scale; the D3 deformation phase seldom exhibits an own schistosity or small-scale folds and is thus visible only indirectly in the outcrop pattern. The mesoscopic structures studied in outcrops are thus predominantly D2 and D4.
A deformed and folded marble horizon in Bjensböle was studied. The marble layer dips gently towards N and is situated in the southern leg of an open regional F3 fold. The rocks on both sides of the marble are tilted and almost horizontal, with shallow dips towards the north. The S1+S2 schistosities in the marble are folded into open to tight asymmetric folds (wavelength 5-10 cm) plunging ca. 32o/20o. As these folds post-date and refold the S2 axial plane foliation and also refold the southern flank of an F3 fold, they have been identified as F4 folds representing the D4 deformational phase. The D4 phase is also visible in the quartz schist area. At a few localities the F2 folds have been refolded by D4, creating new small-scale F4 folds and a new S4 axial plane schistosity (fig. 1).

LITOSPHERE 10.- 11.11.2004 Page 8
Figure 1. Horizontal photo showing an intrafolial F2 fold and the D4 crenulation cleavage in the quartz schist.
Two generations of foliations are found in the sillimanite gneiss, one defined by biotite (S1+S2) and the other by sillimanite (S4). The sillimanite has grown along the S2 foliation plane of the micas, but has an overprinting direction of their own. This overprinting schistosity can also be seen at a smaller scale in thin sections. The S4 crenulation cleavage in the quartz schist, the small F4 folds in the marble and the S4 foliation in the sillimanite schist all have a general NE direction and a steep dip. The angle against the predominant E-W striking S2 schistosity (ca. 25˚) is also nearly constant.
As a result of the obtained structural and petrological data a tentative 3D-model of the geological structure showing the D2 and D4 deformation in the study area is presented (fig. 2). The D2 deformation exhibits an overturned tight F2 fold and the F4 folds are exposed both at a macroscopic and mesoscopic scale. The macroscopic folds (F4a) are open and extend over the entire study area. The smaller mesoscopic folds (F4b) include the crenulation cleavage and the marble folds and are restricted to the southern part of the study area. This implies that the D4 phase has deformed all the rocks in the study area, resulting in an approximately NE-SW striking axial plane direction, indicating a NW-SE directed compression for the D4 deformation. The structural evidence point to a dextral sense of regional shearing for the D4 deformation phase, possibly related to regional ductile shearing signifying the vaning stages of the late-Svecofennian transpressive deformation.

LITOSPHERE 10.- 11.11.2004 Page 9
Figure 2. Simplified schematic 3D-model of the study area showing an overturned F2 fold refolded by the D4 deformation phase. The D4 deformation phase exhibits folds in mesoscopic (F4a) and microscopic (F4b) scale. The open F3 structures are omitted from the model.
References Dietvorst, E.J.L., 1982: Prograde metamorphic zoning in amphibolite facies pelitic gneisses
from Kemiö, SW Finland. Geologische Rundschau 71, p. 245-262. Ehlers, C., Lindroos, A. & Selonen, O., 1993: The late-Svecofennian granite-migmatite
zone of southern Finland-a belt of transpressive deformation and granite emplacement. Precambrian Research 64, Elsevier Science Publishers B.V., Amsterdam, p. 295-309.
Schreurs, J. & Westra, L., 1986: The thermotectonic evolution of a Proterozoic, low pressure, granulite dome, West Uusimaa, SW Finland. Contributions to Mineralogy and Petrology 93, p. 236-250.

LITOSPHERE 10.- 11.11.2004 Page 10
Seitsaari, J., 1955: Pre-Quaternarey rocks, sheet 2012 Perniö. Geological map of Finland, 1:100000.
Selonen, O. & Ehlers, C., 1998: Structural observations on the Uusikaupunki trondhjemite sheet, SW Finland. GFF, Vol. 120, p. 379-382. Stockholm. ISSN 1103-5897.
Väisänen, M., 2002: Tectonic Evolution of the Paleoproterozoic Svecofennian Orogen in SW Finland. Ph.D. Thesis. Annales Universitatis Turkuensis, A II, 154, 143 p.
Väisänen, M. & Hölttä, P., 1999: Structural and metamorphic evolution of the Turku migmatite complex, SW Finland. Geological Society of Finland, Bulletin 71, Part 1, p. 177-218.

LITOSPHERE 10.- 11.11.2004 Page 11
FIRE transects: New images of the Precambrian crust
Pekka Heikkinen1, Ilmo T. Kukkonen2, Elias Ekdahl2, Sven-Erik Hjelt3, Annakaisa Korja1,Raimo Lahtinen2, Jukka Yliniemi4, Robert Berzin5 and FIRE Working Group
1Institute of Seismology, POB 68, FI-00014 University of Helsinki 2Geological Survey of Finland, POB 96, FI-02151 Espoo
3Institute of Geosciences, POB 3000, FI-90014 University of Oulu 4Sodankylä Geophysical Observatory, POB 3000, FI-90014 University of Oulu
5Spetsgeofizika S.G.E., 4 Krasnoselskaya str., Moscow, 107140, Russia Email: [email protected]
The FIRE (Finnish Reflection Experiment) consortium carried out Vibroseis measurements in the Fennoscandian Shield in 2001-2003 on four lines with a total length of 2135 km and transecting the major geological units on the Shield. The seismic reflection data provides new and in many regions unexpected images of the crustal structure of the Fennoscandian Shield. In the future, they will be an indispensable component of the studies of the tectonic evolution of the Shield.
Keywords: reflection seismics, crustal structure, Fennoscandia, Precambrian
1.IntroductionSeismic reflection profiling has turned out to be the most efficient tool in studying the deep structure of the earth’s crust. The large scale reflection surveys conducted during the last 10-15 years in Canada in the Lithoprobe project (Clowes et al., 1996), in Australia (Korsch,
1998) and also in the Fennoscandian Shield (BABEL Working Group, 1993a,b, Korja &
Heikkinen, 2004 ) have provided new insights on the structure and evolution of the Precambrian crust.
The FIRE (Finnish Reflection Experiment) consortium – consisting of the Geological Survey of Finland, and Universities of Helsinki and Oulu, with Russian company Spetsgeofizika S.G.E. as a contractor, carried out a total of 2165 km of Vibroseis measurements in the central part of the Fennoscandian Shield in 2001-2003. The four FIRE transects (Figure 1) run over the most important geological units of the Fennoscandian Shield. Where possible, the lines follow existing deep refractions profiles shot in 1981-1994 (Luosto, 1997 and refrerences therein; FENNIA Working Group, 1998).

LITOSPHERE 10.- 11.11.2004 Page 12
Figure 1. Seismic deep profiling lines in Finland on lithological map modified from Koistinen et al. (2001).
LITOSPHERE 10.- 11.11.2004 Page 13
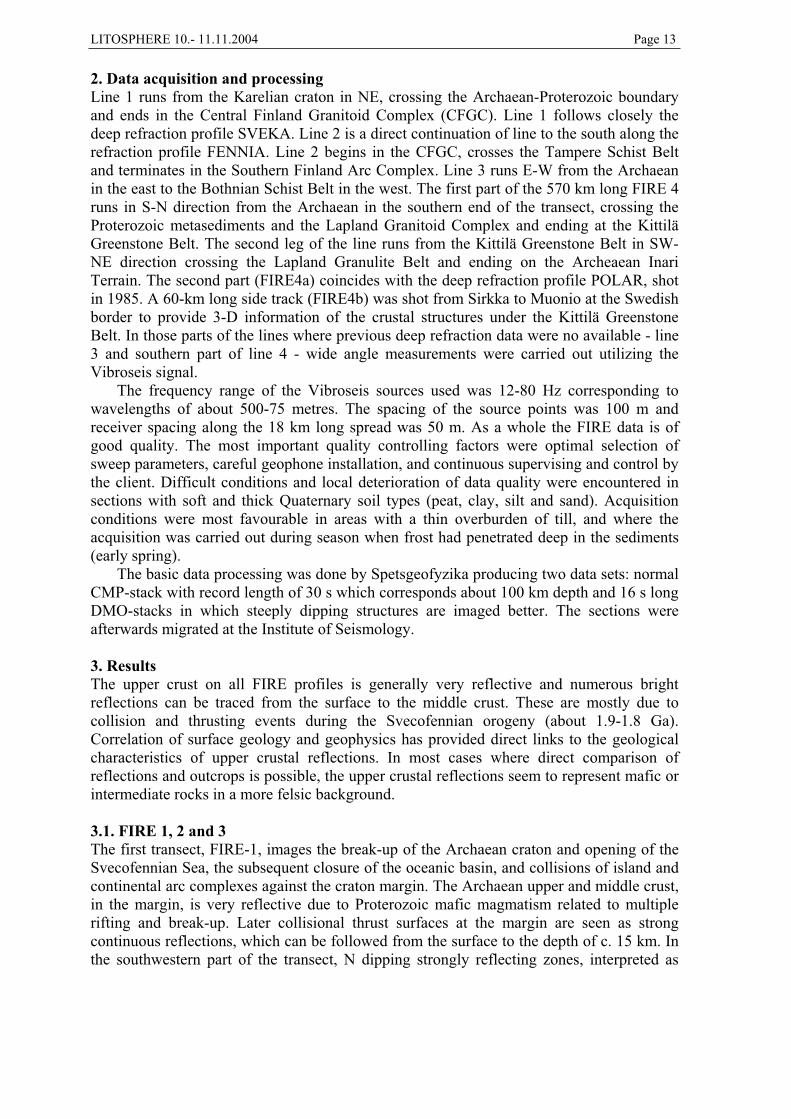
2. Data acquisition and processing Line 1 runs from the Karelian craton in NE, crossing the Archaean-Proterozoic boundary and ends in the Central Finland Granitoid Complex (CFGC). Line 1 follows closely the deep refraction profile SVEKA. Line 2 is a direct continuation of line to the south along the refraction profile FENNIA. Line 2 begins in the CFGC, crosses the Tampere Schist Belt and terminates in the Southern Finland Arc Complex. Line 3 runs E-W from the Archaean in the east to the Bothnian Schist Belt in the west. The first part of the 570 km long FIRE 4 runs in S-N direction from the Archaean in the southern end of the transect, crossing the Proterozoic metasediments and the Lapland Granitoid Complex and ending at the Kittilä Greenstone Belt. The second leg of the line runs from the Kittilä Greenstone Belt in SW-NE direction crossing the Lapland Granulite Belt and ending on the Archeaean Inari Terrain. The second part (FIRE4a) coincides with the deep refraction profile POLAR, shot in 1985. A 60-km long side track (FIRE4b) was shot from Sirkka to Muonio at the Swedish border to provide 3-D information of the crustal structures under the Kittilä Greenstone Belt. In those parts of the lines where previous deep refraction data were no available - line 3 and southern part of line 4 - wide angle measurements were carried out utilizing the Vibroseis signal.
The frequency range of the Vibroseis sources used was 12-80 Hz corresponding to wavelengths of about 500-75 metres. The spacing of the source points was 100 m and receiver spacing along the 18 km long spread was 50 m. As a whole the FIRE data is of good quality. The most important quality controlling factors were optimal selection of sweep parameters, careful geophone installation, and continuous supervising and control by the client. Difficult conditions and local deterioration of data quality were encountered in sections with soft and thick Quaternary soil types (peat, clay, silt and sand). Acquisition conditions were most favourable in areas with a thin overburden of till, and where the acquisition was carried out during season when frost had penetrated deep in the sediments (early spring).
The basic data processing was done by Spetsgeofyzika producing two data sets: normal CMP-stack with record length of 30 s which corresponds about 100 km depth and 16 s long DMO-stacks in which steeply dipping structures are imaged better. The sections were afterwards migrated at the Institute of Seismology.
3. Results The upper crust on all FIRE profiles is generally very reflective and numerous bright reflections can be traced from the surface to the middle crust. These are mostly due to collision and thrusting events during the Svecofennian orogeny (about 1.9-1.8 Ga). Correlation of surface geology and geophysics has provided direct links to the geological characteristics of upper crustal reflections. In most cases where direct comparison of reflections and outcrops is possible, the upper crustal reflections seem to represent mafic or intermediate rocks in a more felsic background.
3.1. FIRE 1, 2 and 3 The first transect, FIRE-1, images the break-up of the Archaean craton and opening of the Svecofennian Sea, the subsequent closure of the oceanic basin, and collisions of island and continental arc complexes against the craton margin. The Archaean upper and middle crust, in the margin, is very reflective due to Proterozoic mafic magmatism related to multiple rifting and break-up. Later collisional thrust surfaces at the margin are seen as strong continuous reflections, which can be followed from the surface to the depth of c. 15 km. In the southwestern part of the transect, N dipping strongly reflecting zones, interpreted as

LITOSPHERE 10.- 11.11.2004 Page 14
continental stacking structures, were discovered. Sharp, sub-horizontal and very continuous reflections on FIRE 1 and FIRE 2 at about 2 s TWT beneath the Central Finland Granitoid Complex possibly represent buried volcanic units or younger diabase sills.
A completely unexpected result of FIRE is the very continuous eastward dipping reflections recorded on FIRE 3 under the central Finland Granitoid Complex and the surrounding schists belts. The reflections are extending up to the margin of the Archaean craton in the east. These reflections which dominate the crustal scale image on FIRE 3, continue from the surface at least to the base of the upper crust, and possible even to the base of middle crust at about 40 km depth. Their origin is not yet understood, but these reflections could be attributed to stacking of crust during the Svecofennian orogeny at about 1.90 Ga ago, or to post-collisional extension. The crossing of FIRE 1 and 3 in western Finland will allow viewing of the reflecting structures in 3-D.
The FIRE results indicate that the reflection Moho is very deep and it is in a good agreement with the previous wide-angle studies. The reflection Moho is between the depths of 52km and 55 km, and it is diffuse in nature. The lower crustal reflectivity ends over a depth interval of about 3-5 km. The reflection Moho is gently undulating, and sharp variations in crustal thickness are usually not seen. However, near the eastern end of the FIRE 1, a sudden step-wise thinning of crust of about 15 km is seen under the Archaean craton. This result is supported by previous wide-angle studies. This jump is attributed to either collisional stacking of the crust or to tectonic underplating during the Svecofennian orogeny.
The lower crust mostly lacks long continuous reflections, and instead it comprises short (about 1 km long) and thin (<0.5 km thick) reflections. Strong, dipping reflections dominating the reflection image in the upper and middle crust have only weak or counterparts in the lower crust. Sharp reflection Moho was recorded only at two localities. The first one is at the western end of FIRE 3, close to a major crustal boundary between the Central Finland Granitoid Complex and the Bothnian Schist Belt, where the diffuse lower crust in the east changes into a laminated brightly reflective lower crust in the west across a sub-vertical crustal scale discontinuity. The second locality with reflective lower crust was recorded beneath the Lapland Granulite Belt on FIRE 4.
3.2. Fire 4 In general, the tectonic units along the FIRE 4 transect have distinct reflectivity patterns and especially in the lower crust quite different form those in the lines 1,2 and 3. The craton margin at the southern end is dominated by strong reflectivity in the upper 20 km-30 km, probably due to mafic magmatism related to the break-up of the craton and opening of the Proterozoic Peräpohja Basin. Except for the first few kilometres, the metasedimentary units and the southern part of the Lapland Granitoid Complex are characterized by weaker reflectivity. The nature of reflectivity changes clearly in the middle of the Lapland Granitoid Complex. In the northern part of the Granitoid Complex the upper and middle crust to the depth of 20 km are dominated by strong reflectivity.
The Kittilä Greenstone Belt is shown as a weakly reflective unit that is about 10 km thick. The reflective structures at the belt boundaries are well correlated with the previously known tectonic structures such as the Sirkka Line in Central Lapland, a major discontinuity in lithology and metamorphic grade. This S-dipping thrust surface can be followed to the depths of 10-20 km. The southwestern part of the Lapland Granulite Belt is visible as a zone of strong reflectivity whereas the northern part of the belt is weakly reflective. The belt as a whole is a wedge-shaped unit with maximum thickness of 15 km.

LITOSPHERE 10.- 11.11.2004 Page 15
The Moho boundary is clearly visible along the whole FIRE 4 at the depth range of 40-50 km and differing markedly from the other FIRE lines. Beneath the Archaean craton, the thickness of the crust is 42 km, thickening to 47-48 km beneath the Central Lapland Granitoid Complex, thinning back to 40-42 km beneath the Lapland Granulite Belt and thickening again to 50 km at the northern end of the line within the Archaean Inari Terrain. In the velocity model of the POLAR profile, the thinner crust beneath the Lapland Granulite Belt is characterized by lower velocities in the lower crust. In the reflection data this part is shown as a strongly reflective laminated zone extending beneath the Inari Terrain.
References BABEL Working Group, 1993a. Integrated seismic studies of the Baltic Shield using data
in the Gulf of Bothnia region. Geophysical Journal International, 112: 305-324.
BABEL Working Group, 1993b. Deep seismic reflection/refraction interpretation of crustal structure along BABEL profiles A and B in the southern Baltic Sea. Geophysical
Journal International, 112: 325-343.
Clowes, R.M., Calvert, A.J., Eaton, D.W., Hajnal, Z., Hall, J. and Ross, G.M.,1996. LITHOPROBE reflection studies of Archaean and Proterozoic crust in Canada. Tectonophysics 264, 65-88.
FENNIA Working Group, 1998. P- and S-velocity structure of the Fennoscandian Shield beneath the FENNIA profile in southern Finland. Institute of Seismology, University of
Helsinki. Report S-38. 15 p.
Koistinen, T. (comp.), Stephens, M. B. (comp.), Bogatchev, V. (comp.), Nordgulen, Ø. (comp.), Wennerström, M. (comp.), Korhonen, J. (comp.), 2001. Geological map of the Fennoscandian Shield, scale 1:2 000 000. Espoo : Trondheim : Uppsala : Moscow: Geological Survey of Finland : Geological Survey of Norway : Geological Survey of Sweden : Ministry of Natural Resources of Russia.,
Korja, A. and Heikkinen, P., 2004. The accretionary Svecofennian orogen – Insights from the BABEL profiles. Precambrian Research, in press.
Korja, A., Korja, T., Luosto, U. and Heikkinen, P., 1993. Seismic and geoelectric evidence for collisional and extensional events in the Fennoscandian Shield - implications for Precambrian crustal evolution. Tectonophysics, 219: 129-152.
Korsch, R.J., Goleby, B.R., Leven, J.H., Drummond, B.J., 1998. Crustal architecture of central Australia based on deep seismic reflection profiling. Tectonophysics 288, 57-69.
Luosto, U., Lanne, E., Korhonen, H., Guterch, A., Grad, M., Materzok, R. and Perchuc, E., 1984. Deep Structure of The Earth's Crust on the Sveka Profile in Central Finland. Annales Geophysicae, 2 (5): 559-570.
Luosto, U., Tiira, T., Korhonen, H., Azbel, I., Burmin, V., Buyanov, A., Kosminskaya, I., Ionkis, V. and Sharov, N., 1990. Crust and upper mantle structure along the DSS Baltic profile in SE Finland. Geophysical Journal International, 101: 89-110.
Luosto, U., 1997. Structure of the Earth’s Crust in Fennoscandia as Revealed from Refraction and Wide-Angle Reflection Studies. Geophysica, 33, 3-16.
LITOSPHERE 10.- 11.11.2004 Page 16
Yliniemi, J., Jokinen, J. and Luukkonen, E., 1996. Deep structure of the Earth's crust along the GGT/SVEKA transect extension to northeast. In: S. Autio and E. Ekdahl (Eds.), Global Geoscience Transect / SVEKA, Proceedings of the Kuopio Seminar, Finland, 25.-26.11.1993, Geological Survey of Finland, Report of Investigation, 136: 56.

LITOSPHERE 10.- 11.11.2004 Page 17
Petrogenesis of charnockites in the Turku granulite area
Eeva-Maria Helenius1, Olav Eklund1, Markku Väisänen1 and Pentti Hölttä2
1University of Turku, Department of Geology, FIN-20014 Turku, Finland 2Geological Survey of Finland, FIN-02150 Espoo, Finland
E-mail: [email protected]
Charnockites are either plutonic or metamorphic orthopyroxene-bearing quartzofeldspathic rocks. This study shows that the charnockitic rocks within the Turku granulite area were formed under granulite facies conditions from tonalitic granitoids through charnockitization reactions. Biotite and amphibole reacted with quartz to form pyroxene, plagioclase ± potassium feldspar.
Keywords: charnockitization, granitoid, metamorphism
1. IntroductionCharnockites are orthopyroxene-bearing quartzofeldspathic rocks, whose origin can be either plutonic or metamorphic. The term “charnockite” is by Sir Thomas Holland, who created the term in the end of the 19th century originally to mean only plutonic orthopyroxene-bearing rocks in India. The name was given after Job Charnock, the founder of Calcutta, whose tombstone is made of this type of rock. Nowadays the nomenclature of orthopyroxene-bearing felsic rocks created by Streckeisen (1974) and Le Maitre (1989) is used.
Charnockites are located mainly in the areas of high grade metamorphism. They are known in almost every continent, particularly in the Precambrian areas (Yardley 1989).Zhao et al. (1997) lists several models proposed for their origin: “intrusion of high-temperature, water-deficient felsic magmas into dry granulitic crust, in-situ dry anatexis during granulite metamorphism, residua after removal of granitic melts, cumulates of igneous fractionation, partial melting of granulitic mineral assemblages enhanced by CO2-fluxing, second-stage partial melting of melt-depleted granulitic source, crystal fractionation and crustal assimilation of mantle-derived gabbroic magmas, dehydration melting of dry Ti-enriched mafic underplates compositionally similar to high-Ti continental flood basalts”. The most popular model proposed for their origin is the dehydration of granitic to granodioritic rocks in granulite facies metamorphism. This means that the water-bearing minerals (micas, amphiboles) react to form dry minerals (pyroxenes, garnets) in high grade conditions.
Orthopyroxene is very characteristic mineral in charnockitic rocks. Pertite, mesopertite or antipertite are also common. Brownish grey, grayish yellow or greenish yellow tone is also characteristic of fresh charnockitic rocks. Rust-coloured orthopyroxene patches can usually be seen on the weathered surface (Parras 1958).
The earlier investigations of charnockites in the Turku granulite area are mainly of Hietanen (1947) and van Duin (1992). Hietanen made a petrological interpretation of charnockites in the Turku area. Her interpretation was that charnockites are magmatic. Van Duin’s (1992) interpretation of the pyroxene-bearing rocks in the Turku area was that the rocks of tonalite-trondhjemite-granodiorite (TTG) and charnockite series are plutonic and they were formed after differentiation of partial melts derived from the lower crust. The protolith for the TTG series rocks would have been amphibolite and for the charnockite series rocks garnet-bearing amphibolite. Väisänen et al. (2002) dated the zircons from the Turku charnockite with ion-probe. The cores gave ages of ca. 1870 Ma and the rims ca.
LITOSPHERE 10.- 11.11.2004 Page 18
1820 Ma. The former corresponds to the age of the syn-orogenic granitoids in southern Finland and the latter age corresponds well to the age of metamorphism in the area.
The aim of this study is to investigate the petrogenesis of charnockitic rocks in the Turku area by mineralogical methods. The study was focused on the pyroxenes, whose magmatic vs. metamorphic origin was investigated. The research area is situated in the SW Finland, around the city of Turku. Samples were taken from the rocks in four different intrusions in Turku, Lieto, Masku and Naantali to study their whole rock chemistry, petrography and mineral chemistry. Whole rock analyses were made in Canada by ACTLAB (Activation Laboratories Ltd.) and mineral analyses were made in Geological Survey of Finland.
2. The geology of the Turku granulite area The Turku granulite area is located within the Late Svecofennian Granite-Migmatite Zone (LSGM, Ehlers et al. 1993). It consists of supracrustal (pelitic) and infracrustal rocks. During the main period of the Svecofennian orogeny, 1.89-1.86 Ga ago, supracrustal rocks deformed and migmatised and the early Svecofennian granitoids (charnockite and TTG series) intruded into them mainly 1.88-1.86 Ga ago as plutons and sills. Charnockite series rocks are located mainly within the granulite facies area. Infracrustal rocks consist also of 1.83-1.81 Ga old microcline granites and post-tectonic c. 1.60 Ga old intrusions (diabase dikes, anorthosites, rapakivi granites).
High grade metamorphism in the southern Finland was caused by the thermal influence 1.83-1.81 Ga ago. Thermal influence caused the fluids to rise through the crust and the fluids influenced the rocks together with changes in temperature and pressure. Pressure and temperature estimates from garnet and cordierite bearing rocks indicate that the granulites reached temperatures in excess of 800 °C at approximately 6 kbar pressure while the adjacent amphibolite facies rocks crystallized at 650-700 °C and 4-5 kbar (Väisänen &
Hölttä 1999). There is no tectonic boundary between the amphibolite and granulite facies domain (Van Duin 1992).
3. Results Petrographic results show that the rocks are metamorphosed. The rocks are intermediate to felsic, homogeneous or deformed, granoblastic, and relatively even-grained. The grains are mainly anhedral and subhedral, except for small accessory minerals (apatite, zircon). The surface of the weathered rock is from light brown to dark grey and the colour of the fresh pyroxene-bearing rock is greenish. The rocks are metaluminous/peraluminous, calc-alkalic, island-arc–type granitoids. Six samples of ten are pyroxene-bearing. Three other samples of four contain hornblende and/or cummingtonite. The rocks plot in granodiorite, tonalite and quartz-diorite fields. Thus pyroxene-bearing rocks are enderbites, charnoenderbites and hypersthene-quartz-diorites.
TiO2 content of biotite and hornblende in the pyroxene-bearing rocks is clearly higher than in the Hbl/Bt-bearing rocks (Fig. 1). Ti-content increases as temperature rises (Henry
& Guidotti 2002) and its content helps to stabilise the biotite such that it persists throughout the metamorphic event (Harlov & Melzer 2002). This can indicate that the pyroxene-bearing rocks were formed as temperature rose in the Turku granulite area.

LITOSPHERE 10.- 11.11.2004 Page 19
Figure 1. TiO2 contents in biotites of the pyroxene-bearing rocks was clearly higher than in the Hbl/Bt-bearing rocks (pyroxe-absent). Circles are for biotite analyses from pyroxene-bearing rocks and crosses from pyroxene-absent rocks.
Feldspar content increased and biotite content decreased during metamorphism, as plagioclase was formed in the reaction where hornblende or biotite reacted with quartz to form pyroxenes and plagioclase. Pyroxene-bearing rocks contain more plagioclase than Hbl/Bt-rocks.
It is obvious that the structure of the rocks changes to more homogenous as the pyroxene content rises. This indicates that the charnockitization proceeded in some places further, and the rock was changed homogeneous and lost its cleavage. On the less charnockitizised areas the weak cleavage can be seen in the rocks and all the amphiboles have not reacted to form pyroxenes.
4. Conclusions Charnockitic rocks in the Turku area were formed during granulite facies metamorphism from tonalitic granitoids after charnockitization reactions. In the dehydration reaction biotite and amphibole reacted with quartz to form ortho- and clinopyroxene, plagioclase ± K-feldspar and Ti-bearing biotite.
Referencesvan Duin, J.A., 1992. The Turku Granulite Area, SW Finland: a fluid-absent Svecofennian
granulite occurrence. PhD thesis. Vrije Universiteit, Amsterdam, The Netherland, 234 p. Ehlers, C., Lindroos, A. & Selonen, O., 1993. The late Svecofennian granite-migmatite
zone of southern Finland – a belt of transpressive deformation and granite emplacement. Precambrian Research, 64, 295-309.
Harlov, D.E. & Melzer, S., 2002. Experimental partitioning of Rb and K between phlogopite and a concentrated (K,Rb)Cl brine: implications for the role of concentrated KCl brines in the depletion of Rb in phlogopite and the stability of phlogopite during charnockite genesis. Lithos, 64, 15-28.

LITOSPHERE 10.- 11.11.2004 Page 20
Henry, D.J. & Guidotti, C.V., 2002. Titanium in biotite from metapelitic rocks: Temperature effects, crystal-chemical controls, and petrologic applications. American
Mineralogist, 87, 375-382. Hietanen, A., 1947. Archean geology of the Turku district in southwestern Finland. Bulletin
of the Geological Society of America, 38, 1019-1084. Le Maitre, R.W. (Ed.), 1989. A classification of igneous rocks and glossary of terms,
recommendations of the International Union of Geological Sciences Subcommission on the systematics of igneous rocks. Blackwell Scientific Publications, Oxford, Blackwell.193 p.
Parras, K., 1958. On the charnockites in the light of a highly metamorphic rock complex in southwestern Finland. Bulletin de la Commission Géologique de Finlande, 181. 137 p.
Streckeisen, A.L., 1974. Classification and Nomenclature of Plutonic Rocks. Recommendations of the IUGS Subcommission on the Systematics of Igneous Rocks. Geologische Rundschau, 63, 773-785.
Väisänen, M. & Hölttä, P., 1999. Structural and metamorphic evolution of the Turku migmatite complex, southwestern Finland. Bulletin of the Geological Society of Finland,71, 177-218.
Väisänen, M., Mänttäri, I. & Hölttä, P., 2002. Svecofennian magmatic and metamorphic evolution in southwestern Finland as revealed by U-Pb zircon SIMS geochronology. Precambrian Research, 116, 111-127.
Yardley, B.W.D., 1989. An introduction to metamorphic petrology. Longman Earth
Science Series, Longman Scientific & Technical, New York & London. 248 p. Zhao, J.-x., Ellis, D.J., Kilpatrick, J.A. & McCulloch, M.T., 1997. Geochemical and Sr-Nd
isotopic study of charnockites and related rocks in the northern Prince Charles Mountains, East Antarctica: implications for charnockite petrogenesis and proterozoic crustal evolution. Precambrian Research, 81, 37-66.

LITOSPHERE 10.- 11.11.2003 Page 21
One more time: SVEKALAPKO; some seismological comments
Sven-Erik Hjelt
Turkanheimontie 8A1, FI-90230 Oulu 23, Finland Email: [email protected]
The SVEKALAPKO-project, one of the five key project of the ESF-supported EUROPROBE programme, was operative during the years 1995 - 2001. Two of the major experiments performed during the active phase of SVEKALAPKO were the BEARstudy and the seismic tomography experiment. The analysis of the great wealth of data has been going on actively. The paper summarizes once more some key results obtained so far from the tomography experiment. These comprise of tomographic slices of the ccntral Fennoscandian lithosphere, surface wave analysis, subcrustal anisotropy
Keywords: Fennoscandian Shield, crust, upper mantle, seismic tomography.
1. Introduction The key issue of the SVEKALAPKO-project (1995-2002) was to study the nature of the Fennoscandian lithosphere with 60km thick crust (Hjelt et al., 1996). The field campaign of two key experiments, the seismic tomography array and the deep electromagnetic BEAR array studies were successfully completed in 1998 and 1999 respectively and the analysis of the results has continued since then. The SVEKALAPKO project was summarized and the seismic tomography and BEAR subprojects were discussed in detail at the LITO2002 symposium (Hjelt and Daly, 2002, Kozlovskaja et al, 2002b; T Korja et al, 2002).
2. The seismic tomography experimentThe field work of the SVEKALAPKO deep seismic tomography experiment took place in 1998-1999. The first results not only corraborated, but also specified in more detail the known differences in the lithosphere beneath Fennoscandia and Central Europe (Bock et
al., 2001). The increasing difference between the 410 and 660 km regions from TOR to SVEKALAPKO areas was a clear indication of a cold lithosphere of the Shield at depth. Further studies modelled the depth extension of a high-velocity keel below the central Fennoscandian Shield down to about 300 km. The upper mantle P-wave velocities differ a few % from the standard reference model IASP91. The analysis of subcrustal anisotropic properties seem to delineate the major geologo-tectonic units of the central shield. Crustal velocity models are continuously improved in order to increase the accuracy of upper mantle models below the SVEKALAPKO seismic tomography array. (e.g. Alinaghi et al,
2003; Bock et al., 2001; Bruneton et al, 2002, 2004a, Kozlovskaya et al., 2002a,b , 2004
this issue; Plomerova et al, 2002; Sandoval et al., 2003)
3. Future studiesThe analysis of the seismic tomography data is still going on and much new details about the deep structure of the crust and upper mantle will certainly become available. Joint inversion of potential field and seismic tomographic data (Kozlovskaya et al., 2004,
Yliniemi et al., 2003) have significantly improved the crustal velocity models. Important new constraints on the lithospheric models have been obtained through combined analysis of seismic surface waves and xenoliths (Bruneton et al., 2004b).
Still mote interesting results are to expected from seismic reflection data obtained
LITOSPHERE 10.- 11.11.2003 Page 22
during the Russian-Finnish FIRE experiment with its more than 2000 km of lines across key geological structures in the Finnish part of the Fennoscandian Shield. (e.g. Heikkinen et
al., 2004 and Kukkonen et al., 2004)
Selected references Alinaghi, A., Bock, G., Kind, R., Hanka, W., Wylegalla, K, TOR and SVEKALAPKO
Working Groups, 2003. Receiver function analysis of the crust and upper mantle from the North German Basin to the Archaean Baltic Shield. Geoph. J. Int., 155, 641-652.
Bock, G. (Ed.) and SVEKALAPKO Seismic Tomography Working Group, 2001. Seismic probing of Archaean and Proterozoic Lithosphere in Fennoscandia. EOS Transactions
AGU, 82, 50, 621, 628-629. Bruneton, M, Farra, V., Pedersen, H.A. & the SVEKALAPKO Seismic Tomography
Working Group, 2002. Non-linear surface wave phase velocity inversion based on ray theory. Geophys. J. Int, 151, 583-596
Bruneton, M., Pedersen, H.A., Farra, V., Arndt, N.T. Vacher, P. & the SSTWG, 2004. Complex lithospheric structure under the central Baltic Shield from surface wave tomography. J. Geophys. Res., in press
Bruneton, M., Pedersen, H.A., Vacher, P., Kukkonen, I.T., Arndt, N.T., Funke, S., Friederich, W., Farra V., & the SSTWG, 2004. Layered lithospheric mantle in the central Baltic Shield from surface waves and xenoliths analysis. Earth Planet. Sc. Lett.,226, 41- 52. [doi: 10.1016/j.epsl.2004.07.034
Heikkinen, P., Kukkonen, I.T, Ekdahl, E., Hjelt, S.-E., Korja, A., Lahtinen, R., Vuollo, J., Yliniemi, J., Berzin, R, & FIRE Working Group, 2004. FIRE-4 transect in Lapland northern Finland. Seismix 2004 Workshop.
Hjelt, S-E., Daly, J.S. and SVEKALAPKO colleagues, 1996. SVEKALAPKO.Evolutionof Palaeo-proterozoic and Archaean Lithosphere. pp. 56- 67 in Gee, DG and Zeyen, HJ (editors): EUROPROBE 1996 - Lithospheric dynamics: Origin and evolution of
continents. Publ. by the EUROPROBE Secretariate, Uppsala University, 138 p. Hjelt, S-E. and Daly, J.S., 2002. The SVEKALAPKO Project: A contribution to an
improved understanding of the evolution of the Fennsocandian Shield. Pp. 15 - 20 in Lahtinen, R et al (eds), 2002. Lithosphere 2002, Second Symposium on the Structure, Composition and Evolution of the Lithosphere in Finland. Institute of Seismology, University of Helsinki, Report S- 42.
Korja, T., Hjelt, S-E., Kaikkonen, P., Kozlovskaja, E., Lahti, I., Pajunpää , K., Pulkkinen, A., Viljanen, A. and BEAR Working Group, 2002. Crust and upper mantle beneath Fennoscandia as imaged by the Baltic Electromagnetic Array Research (BEAR). Pp. 41 - 48 in Lahtinen, R et al (eds), 2002. Lithosphere 2002, Second Symposium on the Structure, Composition and Evolution of the Lithosphere in Finland. Institute of Seismology, University of Helsinki, Report S- 42.
Kozlovskaya, E., Pirttijärvi, M., Hjelt, S-E., Korhonen, J., Elo, S. and Yliniemi, J., 2002a. Crustal model of the Finnish part of the SVEKALAPKO research area: project status and first results. Pp. 55 - 58 in Lahtinen, R et al (eds), 2002. Lithosphere 2002, Second Symposium on the Structure, Composition and Evolution of the Lithosphere in Finland. Institute of Seismology, University of Helsinki, Report S- 42.
Kozlovskaya, E., Yliniemi, J., Hjelt, S-E., Komminaho, K. and SSTWG, 2002b. Lithosphere structure beneath southern Finland derived by the SVEKALAPKO seismic array research. Pp. 59 - 65 in Lahtinen, R et al (eds), 2002. Lithosphere 2002, Second Symposium on the Structure, Composition and Evolution of the Lithosphere in Finland. Institute of Seismology, University of Helsinki, Report S- 42.
LITOSPHERE 10.- 11.11.2003 Page 23
Kozlovskaya, E., Elo, S., Hjelt, S-E., Yliniemi, J., Pirttijärvi, M., SSTWG, 2004. 3D density model of the crust of southern and central Finland obtained from joint interpretation of SVEKALAPKO crustal P-wave velocity model and gravity data. Geoph . J. Int., 158, 827-848 [DOI: 10.1111/j.1365-246X.2004.02363x]
Kukkonen, I.T., Heikkinen, P., Ekdahl, E., Hjelt, S-E., Korja, A., Lahtinen, R.,Yliniemi, J., Berzin, R., & FIRE Working Group, 2004. FIRE transects: New images of the Precambrian crust in the Fennoscandian Shield. Seismix 2004 Workshop.
Plomerova, J., Hyvönen, T., Sandoval, S., Babushka,V and SSTWG, 2002. Structure of Fennoscandian mantle lithosphere from seismic velocity anisotropy. XXVII General Assembly of EGS, Geophysical Research Abstracts, 4, EGS02-A-02173.
Sandoval, S., Kissling, E., Ansorge, J. and the SSTWG, 2002. Three-Dimensional Seismic Crustal Model and Associated Effects on Teleseismic Tomography Beneath Central Fennoscandia (Baltic Shield). J. Geoph. Res., submitted
Sandoval, S., Kissling, E., Ansorge, J. and the SSTWG, 2003. High-Resolution body wave tomography beneath the SVEKALAPKO array: I. A-priori 3D crustal model and associated traveltime effects on teleseismic wavefronts. Geoph . J. Int., 153, 75-87.
Sandoval, S., Kissling, E., Ansorge, J. and the SSTWG, 2002. High-Resolution body wave tomography beneath the SVEKALAPKO array: II. Anomalous upper mantle structure beneath central Baltic Schield. Geoph . J. Int., submitted.
Yliniemi, J., Kozlovskaya, E., Hjelt, S.-E., Komminaho, K., Ushakov, A. and SSTWG. 2003. Structure of the crust and uppermost mantle beneath southern Finland revealed by analysis of local events registered by the SVEKALAPKO seismic array. Tectonophysics, submitted.
SSTWG = SVEKALAPKO Seismic Tomography Working Group:U. Achauer, A. Alinaghi, J. Ansorge, M. Bruneton, W. Friederich, M. Grad, A. Guterch, S-E. Hjelt, T. Hyvönen, E. Kissling, K. Komminaho, A. Korja, P. Heikkinen, E. Koszlovskaja, M.V. Nevsky, N. Pavlenkova, H. Pederesen, J. Plomerova, T. Raita, O. Riznichenko, R.G. Roberts, S. Sandoval, I.A. Sanina, N. Sharov, S.G. Volosov, E. Wielandt, K. Wylegalla, J. Yliniemi, Y. Yurov

LITOSPHERE 10.- 11.11.2003 Page 24
LITOSPHERE 10.- 11.11.2004 Page 25
Sm-Nd isotopes in Paleoproterozoic mafic rocks in Finland – rifting of Archean lithosphere and mantle sources
Hannu Huhma1, Eero Hanski2 and Jouni Vuollo3
1Geological Survey of Finland, P.O. Box 96, FIN-02151 Espoo, Finland 2Department of Geosciences, P.O. Box 3000, FIN-90014 University of Oulu, Finland
3Geological Survey of Finland, P.O. Box 77, FIN-96101 Rovaniemi, Finland Email: [email protected]
Isotopic studies on mafic dikes, intrusions and volcanic rocks have revealed that rifting of the Archean lithosphere took place at several stages, e.g., 2.45 Ga, 2.3 Ga, 2.2 Ga, 2.15 Ga, 2.1 Ga, 2.05 Ga, 2.0 Ga, 1.8 Ga. The initial Nd values range from very positive to strongly negative and suggest that some rocks were derived from a depleted mantle source whereas others have a large contribution from old enriched lithosphere.
Keywords: Sm-Nd isotopes, mafic rocks, Fennoscandian Shield
1. Introduction The range of ages of mafic rocks in the Fennoscandian Shield is well exemplified in the special volume containing vast U-Pb data and results from Northern Finland (Vaasjoki,
2001). The mafic rocks show a range of ages, mostly at c. 2.44 Ga, 2.21 Ga, 2.14 Ga, 2.05 Ga, and 2.0 Ga (Hanski et al., 2001a). Most of the U-Pb results date gabbroic rocks from intrusions and dikes, but can also be used to constrain the age of mafic volcanism, which has produced major formations especially in Lapland. Mafic rocks in a cratonic setting manifest rifting of the lithosphere and provide samples from the mantle. A large number of Sm-Nd mineral and whole-rock analyses have been made in order to constrain the age and origin of these rocks and the evolution of the lithosphere.
The emphasis has been on the Sm-Nd studies on most pristine mafic rocks available. Surprisingly well-preserved igneous rocks have been found after careful mapping and geological studies, even close to areas and zones of strong metamorphic reworking. The Sm-Nd mineral ages determined for such well-preserved rocks are generally consistent with the available U-Pb zircon ages. One exception is provided by the Rantavaara intrusion in Sodankylä, where the apparent old Sm-Nd mineral age is explained by slight crustal contamination in the intercumulus plagioclase, which is a minor phase in the ultramafic rock. Isotopic unequilibrium between clinopyroxene phenocrysts and whole rock may also cause problems in dating, as was observed e.g. in Suisarian picrites in Onega, Russia (Puchtel et al., 1998; Huhma et al., unpublished).
2. Results and discussion The main results on the mafic rocks from the cratonic area are summarized in the Nd-age diagram in Fig. 1. Most of the initial Nd values are based on the Sm-Nd mineral isochrons,and should thus give reliable estimates for the initial isotopic composition of the rocks in question. It should be noted, however, that some data are based only on analyses of whole rocks, and that some points have a relatively large error in age. Nevertheless, the data show a wide range in the initial Nd isotopic composition in the pre-1.9 Ga mafic rocks in the Fennoscandian Shield. Some rocks clearly were derived from a depleted mantle source, whereas others show a major contribution from old enriched lithosphere. It can be questioned whether this is due to crustal contamination, preferably at deep crustal levels, or due to heterogeneity of the subcontinental lithospheric mantle.

LITOSPHERE 10.- 11.11.2004 Page 26
The diagram also gives some previously published results from mafic volcanic rocks in Finland. These include the Sm-Nd ages for the Jeesiörova komatiites (2056±25 Ma, Hanski
et al 2001b), and Vesmajärvi tholeiites (1982±41 Ma, Hanski & Huhma, in press), which both were based on analyses of primary igneous pyroxene together with whole rocks. The age for Vesmajärvi metavolcanites is confirmed by a U-Pb zircon age of 2017±5 Ma obtained for several coeval felsic rocks (Rastas et al., 2001), which suggests that the initial 143Nd/144Nd ratios in the Vesmajärvi pyroxenes and whole rocks were the same ( Nd = +3.8).
The well-known 2.44 Ga layered intrusions manifest the first major Paleoproterozoic mafic magmatism, which have generally been considered as a sign of break-up of an Archean continent. Our studies have brought new occurrences to this family, i.e. the mafic intrusions of Tsohkoaivi in NW Lapland, Peuratunturi and Koulumaoiva in E Lapland, and several dikes crosscutting the Archean crust. It has also become clear that some mafic dikes show positive initial Nd values, which strongly contrast the general picture, i.e. the 2.44 Ga layered intrusions typically have negative initial Nd values of –1 to –2 (e.g., Huhma et al. 1990).
Also ultramafic metavolcanic rocks from the Mäntyvaara Formation in Salla, E Lapland provide initial Nd values at 2.44 Ga close to -2 (Hanski & Huhma, in press). The age is constrained by the crosscutting Onkamonlehto dike providing a minimum age of 2.33 Ga for the volcanic rocks (Manninen & Huhma, 2001). These LREE-enriched komatiites resemble the komatiites from the Vetreny belt (Puchtel et al., 1997). The low Nd values suggest that REE in these rocks were largely derived from lithospheric sources, which were enriched in LREE in late Archean times.
The age of the 2.3 Ga mafic rocks is well constrained in two places, i.e. at Tulisaari (Varpaisjärvi) and Karkuvaara (Pudasjärvi). The initial Nd isotopic composition ( Nd =+1.8)suggests that the mafic magma had an origin from a depleted mantle without major communication with Archean LREE-enriched material, and is thus very distinct from the bulk of the 2.44 Ga magmatism.
The 2.2 Ga differentiated mafic intrusions of the gabbro-wehrlite association (GWA) from distant places in the shield form a coherent group in the age- Nd diagram (Fig. 1). These rocks are characterized by a nearly chondritic initial Nd isotopic composition ( Nd =+0.6), which was also obtained for a granophyre in the Koli intrusion. This suggests that in situ contamination was not important in the genesis of these rocks, and the chemical composition of GWA suggests an origin from the subcontinental lithospheric mantle.
Many 2.1 Ga mafic rocks are characterized by positive Nd(t) values, which approach the composition of the (model) depleted mantle. This may be due to major attenuation of the lithosphere, which eventually allowed material from the convective mantle to escape to the surface. This is well exemplified by the Jeesiörova (Sattasvaara) komatiites and Jouttiaapa basalts. In contrast, the ore-bearing 2.06 Ga Keivitsa intrusion in Lapland shows major contribution from old enriched lithosphere. Particularly, the Ni-PGE-bearing ore type from Keivitsa with Nd(t) of –6.4 shows characteristics typical for late Archean crust (Fig. 1).

LITOSPHERE 10.- 11.11.2004 Page 27
Mafic rocks
Onkamonlehto
Rantavaara
Keivitsa
Keivitsa NI-PGE
TulisaariiKarkuvaara
Mäntyvaara
Runkaus
JouttiaapaJeesiörova
Jeesiörova
Vesmajärvi
Jormua
Jormua OIB
DM
CHUR
A1611 Archean diorite
-7
-5
-3
-1
1
3
5
1900 2000 2100 2200 2300 2400 2500
Age (Ma)
Ep
silo
n-N
dMafic intrusions, Lapland
Mafic intrusions
Mafic volcanics
Figure 1. Nd vs. age diagram for some pre-1.9 Ga mafic rocks from northern and eastern Finland and adjacent Russia.
3. Remarks Deep-crustal contamination of ultramafic magma may explain many features observed in mafic rocks, but the isotopic results also show that various mantle sources with distinct isotopic compositions have existed during the Paleoproterozoic. Further examples are provided by high-REE mantle-derived rocks, which show a range of initial Nd values from nearly chondritic (e.g. 2.6 Ga Siilinjärvi carbonatite, 2 Ga Jormua OIB, 1.8 Ga lamprophyres) to highly positive (e.g., the ca. 2 Ga Laivajoki and Kortejärvi carbonatites).
References Hanski, E., Huhma, H. & Vaasjoki, M. 2001a. Geochronology of northern Finland: a
summary and discussion. In: Vaasjoki, M. (ed.) Radiometric age determinations from Finnish Lapland and their bearing on the timing of Precambrian volcano-sedimentary sequences. Geological Survey of Finland. Special Paper 33, 255-279.
Hanski, E., Huhma, H., Rastas, P. & Kamenetsky, V.S., 2001b. The Palaeoproterozoic komatiite-picrite association of Finnish Lapland. Journal of Petrology, 42, 855-876.
Manninen, T. & Huhma, H. 2001. A new U-Pb zircon constraint from the Salla schist belt, northern Finland. In: Vaasjoki, M. (ed.) Radiometric age determinations from Finnish Lapland and their bearing on the timing of Precambrian volcano-sedimentary sequences. Geological Survey of Finland. Special Paper 33, 201-208.

LITOSPHERE 10.- 11.11.2004 Page 28
Puchtel, I.S., Haase, K.M., Hofmann, A.W., Chauvel, C., Kulikov, V.S., Garbe-Schönberg, C.-D. & Nemchin, A.A. 1997. Petrology and geochemistry of crustally contaminated komatiitic basalts from the Vetreny Belt, southeastern Baltic Shield: Evidence for an early Proterozoic mantle plume beneath rifted Archean continental lithosphere. Geochim. Cosmochim. Acta 61, 1205-1222.
Puchtel, I.S., Arndt, N.T., Hofmann, A.W., Haase, K.M., Kröner, A., Kulikov, V.S., Kulikova, V.V., Garbe-Schönberg, C.-D. & Nemchin, A.A. 1998. Petrogology of mafic lavas within the Onega plateau, central Karelia: evidence for 2.0 Ga plume-related continental crustal growth in the Baltic Shield. Contrib. Mineral. Petrol., 130, 134-153.
Rastas, P., Huhma, H., Hanski, E., Lehtonen, M. I., Härkönen, I., Kortelainen, V., Mänttäri, I. & Paakkola, J. 2001. U-Pb isotopic studies on the Kittilä greenstone area, central Lapland, Finland. In: Vaasjoki, M. (ed.) Radiometric age determinations from Finnish Lapland and their bearing on the timing of Precambrian volcano-sedimentary sequences. Geological Survey of Finland. Special Paper 33, 95-141.
Vaasjoki, M. (ed.) 2001. Radiometric age determinations from Finnish Lapland and their bearing on the timing of Precambrian volcano-sedimentary sequences. Geological
Survey of Finland. Special Paper 33. 279 p.

LITOSPHERE 10.- 11.11.2004 Page 29
Seismic tomographic images of the crust in southern and central Finland
Tellervo Hyvönen, Timo Tiira, Elisa Rautioaho, Annakaisa Korja and Pekka Heikkinen
Institute of Seismology, POB 68, FIN-00014 Helsinki University, Finland Email: [email protected]
Seismic velocity structures of the crust in South Finland are inverted from first P- and S-arrivals of 238 local events. The data set consists of 142 local events recorded at permanent seismic stations in 1992-1993, 26 controlled shots recorded at permanent stations and at the receivers on the DSS lines during the refraction surveys in 1981, 1982, 1991 and 1994 as well as 70 seismic events recorded by the SVEKALAPKO seismic tomography array in 1998-1999. Altogether 7700 P-phase and 6300 S-phase picks are inverted to velocity structures applying the tomography program Jive3d. The target volume is situated between longitude 20o-32-oE, latitude 59o-66oN and depth 0-70 km.
Keywords: Seismic tomography, vp /vs –ratio, crust, Finland
1. Introduction Local tomography inversions are commonly applied to local and regional earthquake data in seismically active regions, or to controlled source experiments with dense net of receivers and with hundreds of sources. In southern and central Finland earthquakes are weak (magnitude < 4) and rarely occurring, and the crustal structure is very complex and exceptionally thick (Luosto, 1997). The most prominent geological structure is the fractured suture zone between the Archean and Proterozoic parts crossing the study area in NW-SE direction.
In 1998/1999 a large-scale experiment, the Europrobe/SVEKALAPKO seismic tomography array (Bock and the SSTWG, 2001), was carried out by installing a network of 148 stations covering the whole south-central Finland and extending to the Russian Karelia (Fig. 1). The network recorded over 500 local and regional seismic events (earthquakes and explosions) during the nine months long operation period.
60 No
21 Eo
Seismic stations: broad band / short period
0 600 700 km500400300200100
800
700
600
500
400
300
200
100
0
km
Figure 1. The general geological map of the study area (Koistinen at al., 2001) is shown together with the SVEKALAPKO station network.
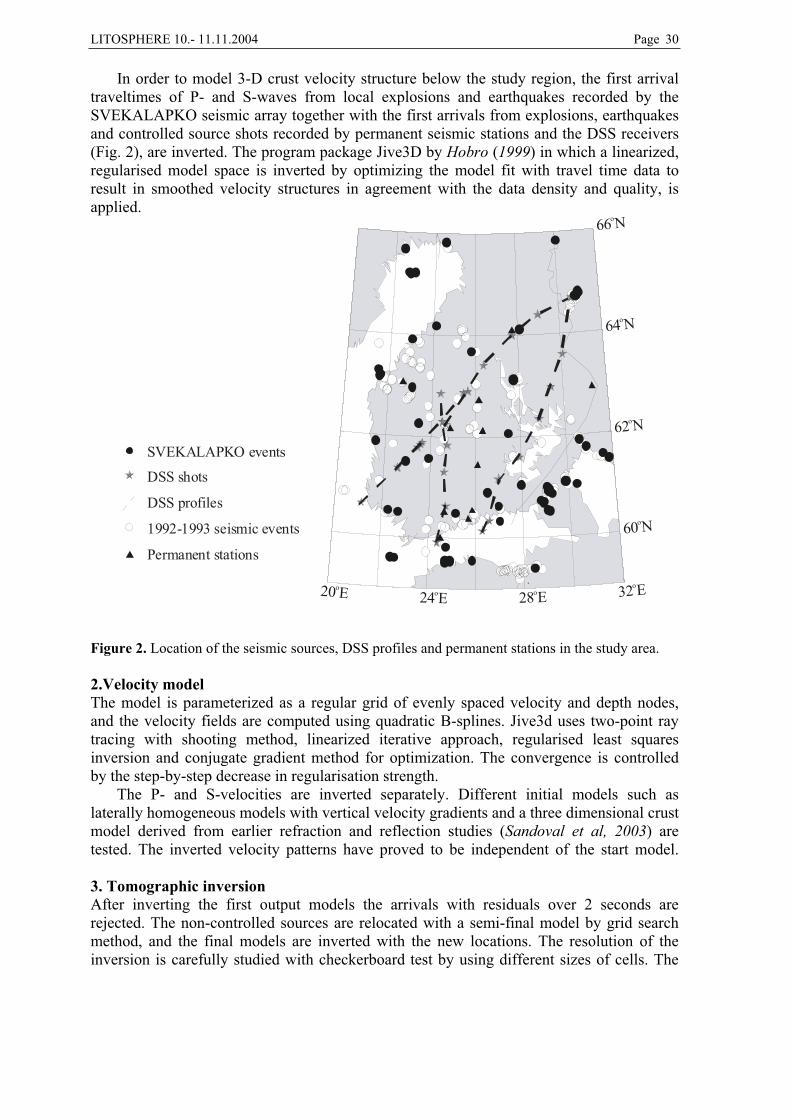
LITOSPHERE 10.- 11.11.2004 Page 30
In order to model 3-D crust velocity structure below the study region, the first arrival traveltimes of P- and S-waves from local explosions and earthquakes recorded by the SVEKALAPKO seismic array together with the first arrivals from explosions, earthquakes and controlled source shots recorded by permanent seismic stations and the DSS receivers (Fig. 2), are inverted. The program package Jive3D by Hobro (1999) in which a linearized, regularised model space is inverted by optimizing the model fit with travel time data to result in smoothed velocity structures in agreement with the data density and quality, is applied.
20 Eo
24 Eo 28 Eo 32 Eo
60 No
62 No
64 No
66 No
SVEKALAPKO events
DSS shots
DSS profiles
1992-1993 seismic events
Permanent stations
Figure 2. Location of the seismic sources, DSS profiles and permanent stations in the study area.
2.Velocity modelThe model is parameterized as a regular grid of evenly spaced velocity and depth nodes, and the velocity fields are computed using quadratic B-splines. Jive3d uses two-point ray tracing with shooting method, linearized iterative approach, regularised least squares inversion and conjugate gradient method for optimization. The convergence is controlled by the step-by-step decrease in regularisation strength.
The P- and S-velocities are inverted separately. Different initial models such as laterally homogeneous models with vertical velocity gradients and a three dimensional crust model derived from earlier refraction and reflection studies (Sandoval et al, 2003) are tested. The inverted velocity patterns have proved to be independent of the start model.
3. Tomographic inversionAfter inverting the first output models the arrivals with residuals over 2 seconds are rejected. The non-controlled sources are relocated with a semi-final model by grid search method, and the final models are inverted with the new locations. The resolution of the inversion is carefully studied with checkerboard test by using different sizes of cells. The

LITOSPHERE 10.- 11.11.2004 Page 31
vp/vs-ratio distribution (Figs. 3 & 4) is limited by the resolution of the S-waves, which is worse than the P-wave resolution. The results are very sensitive to data density and quality, and most of the inaccuracies originate from the uncertainties of quarry blast and earthquake locations or from the inaccuracies of the phase onset times.
Figure 3. A three-dimensional section of the vp/vs-ratio distribution is presented for southern and central Finland looking towards northwest. The intersecting lines are marked on the geological map. The image is created by a 3-D graphical user interface built of modules from the OpenDX visualization software package (Thompson et al., 2004).

LITOSPHERE 10.- 11.11.2004 Page 32
a)
b)
P-velocity (km/s) P-velocity (km/s)
Vp / Vs Vp / Vs
dist
ance
sou
th->
nort
h [k
m]
distance west->east [km]
0
200
400
600
800
0 200 400 6005.6
5.8
6.0
6.2
6.4
6.6
6.8
7.0
7.2
7.4
6.0
6.06.0
6.06.0 6.0
0
200
400
600
800
0 200 400 6005.6
5.8
6.0
6.2
6.4
6.6
6.8
7.0
7.2
7.4
dist
ance
sou
th->
nort
h [k
m]
distance west->east [km]
6.6
6.4
6.46.6
6.86.6
7.0
1.72
dist
ance
sou
th->
nort
h [k
m]
distance west->east [km]
1.72
1.7
1.74
1.74
1.74
1.74
1.72
1.76
1.8
1.60
1.64
1.68
1.72
1.76
1.80
0
200
400
600
800
0 200 400 600
dist
ance
sou
th->
nort
h [k
m]
distance west->east [km]
1.68 1.66
1.68
1.681.7
1.7
1.7
1.7
1.72
1.74
1.60
1.64
1.68
1.72
1.76
1.80
0
200
400
600
800
0 200 400 600
Depth 1 km Depth 20 km
Depth 1 km Depth 20 km
Figure 4. Results of the tomographic inversion at depths of 1 and 20 km. a) P-velocity and b) vp/vs-ratio distribution. The white colour masks out the regions with no rays.
4. Conclusions The final velocity models are smooth and in accordance with the sparse ray coverage over a large target volume. The horizontal resolution of the velocity structure is at least 60 km in most parts of the models. Tomographic velocity models agree with the 2D-ray tracing results of the DSS studies.
The vp/vs-ratio varies usually between 1.66-1.76 in the upper crust and between 1.72-1.82 in the lower crust. In the upper 10 km, the Archean and Paleoproterozoic domains are outlined by velocity differences in both P-velocity and vp/vs-ratio maps (Figs. 3 & 4). Higher velocities and lower vp/vs-ratios north-east of the isotope boundary at the surface (broken line in black in Fig. 1) are associated with the Archean lithologies.

LITOSPHERE 10.- 11.11.2004 Page 33
The Bothnian and Southern Finland Schist Belts have lower vp/vs-ratio than the Central Finland Granitoid Complex. Rapakivi granites of the upper crust are associated with high vp/vs-ratio rocks in the middle and lower crust.
References Bock, G. and the SVEKALAPKO STWG, 2001. Seismic probing of Archean and
Proterozoic lithosphere in Fennoscandia. EOS, 82, 621, 628-629.Hobro, J.W.D., 1999. Three-dimensional tomographic inversion of combined reflection and
refraction seismic travel time data. PhD thesis, Department of Earth Sciences, University of Cambridge, Cambridge.
Koistinen, T., Stephens, M.B., Bogatchev, V., Nordgulen, U., Wennerstrom, M., Korhonen, J. (Compilers), 2001. Geological map of the Fennoscandian Shield, scale 1:2 000000. Espoo: Trondheim: Uppsala: Moscow: Geological Survey of Finland: Geological
Survey of Norway: Geological Survey of Sweden: Ministry of Natural Resources of Russia.
Luosto, U., 1997. Structure of the Earth’s Crust in Fennoscandia as Revealed from refraction and Wide-Angle Reflection Studies. Geophysica, 33(1): 3-16.
Sandoval, S., Kissling, E., Ansorge, J. and the SVEKALAPKO STWG, 2003. High-resolution body wave tomography beneath the SVEKALAPKO array: I. A priori three-dimensional crustal model and associated travel time effects on teleseismic wave fronts. Geophys.J. Int., 153, 75-87.
Thompson, D., Braun, J. and Ford, R., 2004. OpenDX Paths to Visualization. Visualization and Imagery Solutions Inc., 207 p.

LITOSPHERE 10.- 11.11.2004 Page 34

LITOSPHERE 10.- 11.11.2004 Page 35
A research project: An integrated 3-D geophysical model of the lithosphere in the central Fennoscandian Shield
Pertti Kaikkonen1, Toivo Korja1, Elena Kozlovskaya2, Kari Moisio1, Ilkka Lahti1
and Katri Vaittinen1
1Department of Geophysics, Institute of Geosciences, POB 3000, FIN-90014, University of Oulu, Finland 2Sodankylä Geophysical Observatory/Oulu Unit, POB 3000, FIN-90014, University of Oulu, Finland
Email: [email protected], [email protected]
We present a new project that aims to integrate all the recent geophysical data available for central Fennoscandian Shield, i.e., seismic, potential field and electromagnetic data, and to create a 3-D geophysical model of the lithosphere that includes distribution of P- and S-wave velocity, density and electrical conductivity and give the explanation to this model in terms of rheology, pressure-temperature conditions and compositional variations.
Keywords: Fennoscandian Shield, crust, upper mantle, joint inversion, seismic tomography, potential fields, electromagnetic deep sounding
The research project An integrated 3-D geophysical model of the lithosphere in the central
Fennoscandian Shield is a part and simultaneously a continuation of several on-going projects carried out by the Department of Geophysics of University of Oulu and Oulu Unit of Sodankylä Geophysical Observatory of University of Oulu in collaboration with the Geological Survey of Finland and other research departments from Europe and Russia.
Two of the projects, the SVEKALAPKO Deep Seismic Tomography project and BEAR,
or Baltic Electromagnetic Array Research, are two important parts of multidisciplinary international EUROPROBE/SVEKALAPKO research, aiming at studying the evolution and structure of the lithosphere below Finland. The third project, called “3-D crustal model
of the Finnish part of the SVEKALAPKO research area” (3-DCM project) aims at joint interpretation of the SVEKALAPKO seismic data and potential field data in collaboration with the Geological Survey of Finland. A new portion of high-quality geophysical data was provided by two most recent projects. The FInnish REflection experiment (FIRE) started in 2001 and measured about 2100 km of reflection seismic profiles across the main geological boundaries in Finland (Kukkonen et al., 2002). The MT-FIRE project started in 2003 and aims to collect high-density AMT-MT data (period range 300 Hz – 10000 s) at two profiles collocated with the reflection seismic profiles FIRE-1 and FIRE-3 and along one profile between the two seismic profiles.
Although the EUROPROBE program of the European Science Foundation was officially finished in 2001, the interpretation of the data collected within its different projects and preparation of publication continues at least till the end of 2005. As a part of this final stage, the SVEKALAPKO Seismic Tomography Working Group and the BEAR Working Group are now continuing the data interpretation and integration of results of different methods (Hjelt and Daly, 2002). The EUROPROBE/SVEKALAPKO project was funded by the Academy of Finland till the end of 2002, while funding of the 3-DCM project continues until December 2004.
The recent results of the SVEKALAPKO Deep Seismic Tomography project (Alinaghi et al., 2003, Bruneton et al., 2002, Sandoval et al., 2002, 2003, Yliniemi et al., 2004) and the BEAR project (Engels et al., 2002) contain a lot of completely new information about the structure of the upper mantle below the SVEKALAPKO research area. Proper

LITOSPHERE 10.- 11.11.2004 Page 36
explanation of these results in terms of petrophysics, rheology and pressure- temperature conditions requires further modelling and integration with other geophysical methods that can provide self-consistent, integrated geophysical model of the lithosphere in the central Fennoscandian Shield. Joint interpretation of global gravity and tomography data by Deschamps et al. (2001, 2002) demonstrated that such an approach allows to give explanation of tomographic models in terms of thermal and compositional anomalies (iron content). Joint interpretation of SVEKALAPKO seismic data and gravity data has been also successfully applied in the 3-DCM project (Kozlovskaya et al., 2004).
That is why the main target of the proposed research is to integrate all the recent geophysical data available for central Fennoscandian Shield, i.e., seismic, potential field and electromagnetic data, and to create a 3-D geophysical model of the lithosphere that includes distribution of P- and S-wave velocity, density and electrical conductivity and give the explanation to this model in terms of rheology, pressure-temperature conditions and compositional variations. The model will provide a better image and understanding of processes that resulted in the present-day structure of the Archaean and Proterozioc lithosphere in the Fennoscandian Shield.
References Alinaghi, A., Bock, G., Kind, R., Hanka, W., Wyllegalla,K., TOR and SVEKALAPKO
Working Groups. 2003. Receiver function analysis of the crust and upper mantle from the North German Basin to the Archean Baltic Shield. Geoph. J. Int., 155, 641-652.
Bock, G. (ed) and SVEKALAPKO Seismic Tomography Working Group, 2001.Seismic probing of Archaean and Proterozoic Lithosphere in Fennoscandia. EOS Transactions
AGU, 82, 50, 621, 628-629. Bruneton, M., Farra, V., Pedersen, H.A. and the SVEKALAPKO Seismic Tomography
Working Group, 2002b.Non-linear surface wave phase velocity inversion based on ray theory. Geoph J. Int.,151,2, 583-596.
Deschamps, F., Snieder,R., Trampet, J. 2001. The relative density-to-shear velocity scaling in the uppermost mantle. Physics of the Earth and Planetary Interiors, 124, 193-211.
Deschamps, F., Trampet, J., Snieder,R., 2002. Anomalies of temperature and iron in the uppermost mantle inferred from gravity data and tomographic models. Physics of the
Earth and Planetary Interiors, 129, 245-264. Engels M., Korja T., and the BEAR Working Group, 2002. Multisheet modelling of the
electrical conductivity structure in the Fennoscandian Shield. Earth Planets Space, 54, 559-573.
Hjelt, S-E. and Daly, S. 2002. The SVEKALAPKO project: a contribution to an improved understanding of the evolution of the Fennoscandian Shield. LITO2002. In: Lahtinen, R., Korja, A., Arhe, K., Eklund, O., Hjelt, S-E., Pesonen, L.(ed) LITHOSPHERE 2002, second simposium on the structure, composition and evolution of the lithosphere in finland, Espoo, November 12-13, 2002. Programme and extended abstract. Int. of
Seismology, Univ. of Helsinki, Rep. S-42. Kozlovskaya, E., Elo, S., Hjelt, S.-E., Yliniemi, J., Pirttijärvi, M., SVEKALAPKO STWG,
2004. 3D density model of the crust of southern and central Finland obtained from joint interpretation of SVEKALAPKO crustal P-wave velocity model and gravity data. Geoph . J. Int., accepted.
LITOSPHERE 10.- 11.11.2004 Page 37
Kukkonen, I., Heikkinen, P., Ekdahl, E., Korja, A., Hjelt, S.-E., Yliniemi, J., Berzin, R. and FIRE Working Group. Project FIRE: Deep seismic reflection sounding in Finland. . In: Lahtinen, R., Korja, A., Arhe, K., Eklund, O., Hjelt, S-E., Pesonen, L. LITHOSPHERE 2002, second simposium on the structure, composition and evolution of the lithosphere in Finland, Espoo, November 12-13, 2002. Programme and extended abstract. Inst. of
Seismology, Univ. of Helsinki, Rep. S-42. p. 67-70. Sandoval, S., Kissling, E., Ansorge, J. and the SVEKALAPKO STWG, 2003. High-
Resolution body wave tomography beneath the SVEKALAPKO array: I. A-priori 3D crustal model and associated traveltime effects on teleseismic wavefronts. Geoph . J. Int., 153, 75-87.
Sandoval, S., Kissling, E., Ansorge, J. and the SVEKALAPKO STWG, 2004. High-Resolution body wave tomography beneath the SVEKALAPKO array: II. Anomalous upper mantle structure beneath central Baltic Shield. Geoph . J. Int., 157, 200-214.
Yliniemi, J., Kozlovskaya, E., Hjelt, S.-E., Komminaho, K., Ushakov, A. and SVEKALAPKO Seismic Tomography Working Group. 2004. Structure of the crust and uppermost mantle beneath southern Finland revealed by analysis of local events registered by the SVEKALAPKO seismic array. Tectonophysics, in press.

LITOSPHERE 10.- 11.11.2004 Page 38

LITOSPHERE 10.- 11.11.2004 Page 39
BIFROST: Continuous GPS measurements of the three dimensional deformation in Fennoscandia
H. Koivula1, M. Poutanen1, J.M. Johansson2, H-G. Scherneck2, G.A. Milne3, J.X. Mitrovica4, J.L. Davis4 and M. Vermeer5
1Department of Geodesy and Geodynamics, Finnish Geodetic Institute, Masala, Finland 2Chalmers Centre for Astrophysics and Space Science, Onsala, Sweden
3Department of Geological Scienses, University of Durham, Durham, United Kingdom 4Radio and Geoastronomy Division, Harward-Smithsonian Center for Astrophysics, Campridge,
Massachusetts, USA 5Institute of Geodesy, Helsinki University of Technology, Espoo, Finland
Ongoing BIFROST (Baseline Inferences for Fennoscandian Rebound Observations, Sealevel, and Tectonics) project uses a network of permanent GPS stations in Finland and Sweden to measure crustal deformation due to glacial isostatic adjustment (GIA). Project was initiated in 1993. In this paper we concentrate on the geodetic results of the project. We show series of 3D velocities that may be used as a new set of observables for GIA adjustment.
Keywords: vertical motion, space geodesy, glacial isostacy
1. Introduction Networks of permanent geodetic GPS (Global Positioning System) stations are providing a new method to determine present day crustal deformations. Modern space geodetic techniques allow us to measure both horizontal and vertical motions simultaneously in a well-defined reference frame to observe glacial isostatic adjustment (GIA). Over last 10 years the accuracy of the GPS determination has increased significantly. This is mainly due to advantages in GPS satellite constellation, GPS receiver design and processing techniques. The horizontal position estimates can be nowadays achieved at a few millimetre level and vertical rates some 2 times less accurately. Baseline Inferences for Fennoscandian Rebound Observations, Sea level, and Tectonics (BIFROST) is a project that was initiated in 1993 taking advantage of the tens of permanent GPS stations both in Finland and Sweden. The goal of the BIFROST is to directly measure the present day crustal deformation in Fennoscandia and provide a new GIA observable for determination of the Earth structure and Fennoscandian ice history. In this paper we present the results from the time series of nearly 2500 daily network solutions. (Johansson et al., 2002). BIFROST project has already obtained significant results in this regard (Johansson et al. 2002),(Milne et al., 2001), (Milne et al. 2004), (Scherneck et al., 2002).
2. The BIFROST GPS network The BIFROST GPS network consists of permanent networks in Finland and Sweden (Figure 1). In addition, also some of the IGS (International GPS Service) stations outside the area are included into analysis. A full documentation of the stations, equipments and their histories are given in Johansson et al., 2002.
The Swedish nationwide SWEPOS™ GPS network of 21 stations was established in 1993 and became fully operational in 1995. The standard monument for the SWEPOS™ station is a 3 m heated concrete pillar. The pillars are built on the bedrock. Onsala belongs both SWEPOS and IGS network. At Kiruna SWEPOS and IGS stations are separated by 5 km. The stability of the pillars is annually controlled by the theodolite measurements. The GPS antenna is replaced by a theodolite and horizontal and vertical angles are measured to

LITOSPHERE 10.- 11.11.2004 Page 40
a nearby network of steel pins. All SWEPOS™ stations are equipped with two or more GPS receivers which are connected to a single Dorne Margolin type antenna. (Johansson et
al., 2002), (Scherneck et al., 2002).The Finnish permanent GPS network FinnRef® consists of 12 GPS stations. The
network became fully operational between 1994 and 1996. Metsähovi station belongs both FinnRef and IGS network. Three different types of antenna platforms are used. A standard type is a 2.5 m heigh steel grid mast. It is estimated that the thermal expansion effect is less than 1 mm in a yearly cycle. The thermal expansion can also be controlled with temperature measurements. On three of the stations we have concrete pillars and on two stations we use higher masts. In the latter case the thermal expansion is compensated using an invar steel suspension system. The stability of the masts is also controlled with tachymeter measurements. In FinnRef stations the antenna is not removed during the tahymeter measurements but the antenna has a permanent pin under it on which the angles are measured from the auxiliary benchmarks around the pillar. The control measurements are performed every second or third year. (Johansson et al., 2002) (Koivula et al., 1997),(Koivula et al., 1999).
Figure 1. (a) BIFROST GPS network consists of 21 SWEPOS™ stations (triangles) and 12 FinnRef® stations (circles). In the processing the data from IGS (International GPS Service) is also included (diamond).

LITOSPHERE 10.- 11.11.2004 Page 41
Figure 2. Photograph of the FinnRef station at Romuvaara where the antenna platform is a concrete pillar. A Dorne Margolin type antenna is covered by a conical radome. (Photo: H. Koivula)
3. Data analysisAll the data from BIFROST GPS stations are collected in the data archive at Onsala. For the processing the dual frequency phase and code observations are used. The data are processed with GIPSY software which was developed at Jet Propulsion Laboratory (Webb
and Zumberge, 1993). Alternative solutions with Bernese software (Hugentobler et al.,
2001) have been computed at Onsala and at the Finnish Geodetic Institute. First the original GPS data is re-sampled into 300 s observing interval. The data are
processed in 30-hour sessions. For each session we estimate the receiver clock correction,

LITOSPHERE 10.- 11.11.2004 Page 42
three site coordinates, atmospheric zenith parameters and ambiguity parameters. The satellite orbits were strongly constrained to the precise orbit values distributed by the IGS (International GPS Service). The data below 15º were not used in the processing. Corrections for ocean loading and solid Earth tides are included into the model. The data are processed using non-fiducial technique where all stations have weak a priori constraints. Traditional fiducial technique where a network is surrounded by known stations which are kept fixed was rejected since we thought that the stability and the continuity of BIFROST network is better than the IGS network in general. The geodetic results shown in chapter 3 are processed without fixing the ambiquities. Tests show that 85-100 percent of ambiquities could be solved even over these long baselines. Independent tests in smaller data sets show that fixing ambiquities decreases the formal errors 20-30%. In the future the computer power and the Software are able to perform also ambiguity fixing in a reasonable time. Finally all the geodetic positions obtained by GIPSY are transformed into a common terrestrial reference frame. (Johansson et al., 2002) (Scherneck et al., 2002)
4. Geodetic Results Our standard geodetic solution includes a mean value, a constant rate, an admittance parameter for atmospheric loading and periodic terms with different frequencies. Also a bias parameter was included on times that were expected to influence on the rate estimates. These kind of known interruptions are changes or removals of antennas or antenna radomes etc. Numerical results are given in Johansson et al., 2002. In figure 3 we show an example of time series of three GPS stations. Metsähovi is a FinnRef station, Mårtsbo and Norrköping are SWEPOS™ stations. It is obvious that the time series have certain jumps. These jumps are connected to changes in antenna radomes or antennas or even to heavy snowstorms and introduced as bias into the rate estimation.
We find that the maximum uplift rate is ~10mm/yr. This agrees with the prediction by Lambeck (Lambeck 1998a, 1998b) better than 1 mm/yr. The results have been also compared to an independent GPS solutions and to the ones from the sea level and repeated precise levellings (Johansson et al., 2002) (Mäkinen et al., 2003). Generally, one can conclude, that the agreement with different methods are good, although some disagreements were discovered (Mäkinen et al., 2003). Some of these can be addressed to the data problems in GPS time series, mainly due to the snow accumulation on some Northenmost stations. Annual variations are also clearly visible (Poutanen et al., 2004).Also, horisontal movements are visible in data sets. These are within the model predicton of the GIA (Milne et al., 2001).
5. Conclusion BIFROST project has shown a power of long GPS time series in crustal deformation studies. A new set of observables has been created for GIA adjustment. The geodetic results of the BIFROST project provide a dense three dimensional determination of ongoing crustal deformations in Fennoscandia. Numerical values are published in (Johansson et al.,
2002). These values has been used and tested in various occasions. The results have already been used for predictions for Fennoscandian ice histories and estimating the bounds for lower and upper mantle viscocities (Milne et al., 2001), (Milne et al. 2004).

LITOSPHERE 10.- 11.11.2004 Page 43
Figure 3. Three examples of the BIFROST time series. Pictures show the differences in mm from the mean of the series. East component is at left, north component in the middle and the radial (height) component at the right. Light line indicates a model fit into the time series and vertical lines show places where offsets were introduced to time series. (Johansson et al., 2002)
Figure 4. The vertical and horizontal velocity fields according to BIFROST GPS processing. The GPS stations are shown as black circles. (a) The contour lines of a present day vertical velocities. Site specific 1 uncertainty is shown on every GPS station. The scale is shown at the top. (b) The present day horizontal velocities at each GPS station. 1 error ellipses are in a scale shown at the bottom. (Milne et al., 2004).

LITOSPHERE 10.- 11.11.2004 Page 44
References Hugentobler U., S. Schaen, and P. Fridez (eds) (2001). Bernese GPS Software Version 4.2.
Astronomical Institute, University of Berne.Johansson J.M., J.L. Davis, H.-G. Scherneck, G.A. Milne, M. Vermeer, J.X. Mitrovica,
R.A. Bennett, M. Ekman, G. Elgered, P. Elosegui, H. Koivula, M. Poutanen, B.O. Rönnäng, and I.I. Shapiro (2002) Continuous GPS measurements of postglacial adjustment in Fennoscandia, 1. Geodetic results. Journal of Geophysical Research, 107, B8
Koivula H., Ollikainen, M., Poutanen, M. 1997. Use of the Finnish permanent GPS network (FinnNet) in regional GPS campaigns. In: Brunner, F. (Eds), Advances in Positioning and Reference Frames, IAG Scientific Assembly, Rio de Janeiro, Brazil, September 3–9, 1997. Springer Verlag, Berlin Heidelberg New York. p 137–142.
Koivula H., Ollikainen, M., Poutanen, M., 1998: The Finnish permanent GPS network–FinnRef. The 13th General Meeting of the Nordic Geodetic Commission, May 25–29, 1998, Gävle, Sweden pp. 294-301.
Lambeck K., C. Smither and P. Johnston (1998a). Sea-level change, glacial rebound and mantel viscosity for northern Europe, Geophys. J. Int., 134, 102-144, 1998
Lambeck K., C. Smither and M. Ekman (1998b). Tests of glacial rebound models for Fennoscandinavia based on instrumented sea- and lake-level records, Geophys. J. Int., 135, 375-387, 1998.
Mäkinen, J., H. Koivula, M. Poutanen ja V. Saaranen, 2003. Vertical Velocities in Finland from Permanent GPS Networks and from Repeated Precise Levelling. Journal of Geodynamics, Vol 35, No.4-5, pp. 443-456.
Milne G.A., J.L. Davis, J.X. Mitrovica, H.-G. Scherneck, J.M. Johansson, M. Vermeer and H. Koivula (2001): Space-Geodetic Constraints on Glacial Isostatic Adjustment in Fennoscandia. Science, Vol. 291, 23 March 2001, pp. 2381-2385.
Milne G.A., J.X. Mitrovica, H.-G. Scherneck, J.L. Davis, J.M. Johansson, H. Koivula and M. Vermeer, 2004. Continuous GPS measurements of postglacial adjustment in Fennoscandia: 2. Modelling results. Journal of Geophysical Research, 109, No. B2.
Poutanen M., M. Ollikainen, H. Koivula, H. Virtanen, 2004: Periodic effects in GPS time series. In The state of GPS vertical positioning precsion: Separation of Earth processes
by space geodesy. Luxembourg 2003. (Ed. T. van Dam and O. Francis) Cahiers du Centre Européen de Géodynamique et de Séismologie. Vol. 23. p. 137-142.
Scherneck H.-G., J.M. Johansson, G. Elgered, J.L. Davis, B. Jonsson, G. Hedling, H. Koivula, M. Ollikainen, M. Poutanen, M. Vermeer, J.X. Mitrovica, and G.A. Milne, 2002. BIFROST: Observing the Three-Dimensional Deformation of Fennoscandia, in Glacial Isostatic Adjustment and the Earth System, edited by J.X. Mitrovica and B.L.A. Vermeersen, Geodynamics Series, Volume 29, American Geophysical Union, Washington, D.C.
Scherneck H.-G., J.M. Johansson, H. Koivula, T. van Dam, J.L. Davis, 2003. Vertical crustal motion observed in the BIFROST project. Journal of Geodynamics, Vol 35, No.4-5, pp.425-441.
Webb F. H. and J. F. Zumberge, 1993. An introduction to the GIPSY/OASIS-II, JPL Publ., D-11088, 1993.

LITOSPHERE 10.- 11.11.2004 Page 45
World Digital Magnetic Anomaly Map - presenting lithospheric contribution to the Earth's total magnetic field
J.V. Korhonen1, C. Reeves2, M. Ghidella3, S. Maus4, S. McLean5, D. Ravat6
1 Geological Survey of Finland, P.O. Box 96, FIN-02151 Espoo, Finland 2 ITC, PO Box 6, 7500 AA Enschede, The Netherlands
3 Instituto Antartico Argentino, Cerrito 1248, 1010 Buenos Aires, Argentina 4 GeoForschungsZentrum, Telegrafenberg, 14473 Potsdam, Germany
5 National Geophysical Data Center, NOAA E/GC1, 325 Broadway, Boulder, CO 80305-3328 USA 6 Southern Illinois University C'dale, Carbondale, IL 62901-4324, USA
Email: [email protected], [email protected]
Magnetic field of the Earth consists of two major, slowly changing components, namely the Core (Main) field and Lithospheric (Anomaly) Field. These components can be measured together only, and their separation without knowing either of the sources is an nonunique problem. The anomaly field is caused by magnetization of the upper lithosphere and hence reflects its geological properties. In lithospheric studies these are interpreted from the estimated anomalies and other geophysical-geodetic information. For years the International Association of Geomagnetism and Aeronomy (IAGA) has encouraged making a global magnetic anomaly map for science and education. Its task group for World Digital Magnetic Anomaly Map (WDMAM) aims to complete the first edition of the map as an international, geophysical-geological joint effort until 2007.
Key words: Magnetic anomaly, Magnetization, Lithosphere
1. 1979 and Boulder 1995, IUGG/IAGA presented resolutions to compile nationa. At Canberra l magnetic anomaly maps 1:2.5 million for further compilation of maps of the continents and finally making the anomaly map of the World plus releasing the data base beyond the map (Reeves et al. 1998). Working group for Magnetic Anomalies, Land and Sea (lately WG V9) supervised the task until IUGG/IAGA at Sapporo 2003, where a Task Force (WDMAM) was established to continue the work. During IGC32 at Florence 2004, co-operation between IUGG/IAGA and IUGS/CGMW was initiated for map completition.
(Korhonen et al. 2004)
2. The global magnetic anomaly map aims to display such component of the magnetic field that is caused by the ferrimagnetic uppermost part of the Lithosphere. The map will be smoothed as if the component were observed at an altitude of a few km above the Earth's surface. It will be suitable to study overall crustal structure, make regional and global crustal models, and serve as background information for more detailed geological and geophysical studies.
3. The map will be based mainly on airborne and seaborne magnetic surveys (e.g. Finn et
al. 2001). Satellite magnetic data will be used for such parts where near ground information is poor or missing (e.g. von Frese et al. 2002). Ground measurements will be used from magnetic observatories and areas where extensive ground surveys provide principal regional coverage (e.g. Korhonen et al 2002). At the moment open questions still remain to be solved, including anomaly calculation schemes and rights of data access and database distribution. The WDMAM plans to arrange a scientific session of magnetic anomaly compilation and show a tentative global anomaly map in the next IAGA meeting in Toulouse 2005. Further, the first edition of the map would be published and the database released in IUGG meeting in Perugia 2007.

LITOSPHERE 10.- 11.11.2004 Page 46
ReferenceFinn, C. A., Pilkington, M., Cuevas, A, Hernández, I. and Urrutia, J. 2001. New digital
magnetic anomaly database for North America. The Leading Edge -- August 2001 --
Volume 20, Issue 8, p. 870 von Frese, R.R.B., P.T. Taylor, and M. Chiappini (ed.s), 2002, Magnetic Anomalies of the
Antarctic, Tectonophysics, v. 247, pp. 1-187.Korhonen, J.V., Aaro. S., All, T., Nevanlinna, H., Skilbrei, J.R., Säävuori, H., Vaher, R.,
Zhdanova, L. and Koistinen, T. 2002. Magnetic Anomaly Map of the Fennoscandian Shield 1: 2 000 000. Geological Surveys of Finland, Norway and Sweden and Ministry
of Natural Resources of Russian Federation. ISBN 951-690-817-9Korhonen J., Reeves C., Ghidella M., Maus S., McLean S., Ravat D., 2004. World Digital
Magnetic Anomaly Map. Abstracts of the 32 IGC, Florence, Italy. 20-28 August 2004,
Part 1, 779.
RReeeevveess,, CC..,, MMaaccnnaabb,, RR..,, aanndd MMaasscchheennkkoovv,, SS.. 11999988.. CCoommppiilliinngg aallll tthhee wwoorrlldd’’ss mmaaggnneettiiccaannoommaalliieess.. EEOOSS,, TTrraannssaaccttiioonnss ooff tthhee AAmmeerriiccaann GGeeoopphhyyssiiccaall UUnniioonn,, vvooll 7799,, pp 333388..
Introduction to the WDMAM: http://www.ngdc.noaa.gov/IAGA/vmod/TaskGroupWDMAM-04July12s.pdf
Preliminary scientific program for IAGA Toulouse 2005: http://www.omp.obs-mip.fr/cnfgg/IAGA2005/iaga2005_scientific_program.pdf
TTeerrrreessttrriiaall mmaaggnneettiissmm::http://denali.gsfc.nasa.gov/terr_mag/
Dissertation on Global Lithospheric Magnetic Modelling http://www.diss.fu-berlin.de/2003/270/indexe.html
North American Compilation: http://crustal.usgs.gov/projects/namad/
Antarctic:http://www.geology.ohio-state.edu/geophys/admap/

LITOSPHERE 10.- 11.11.2004 Page 47
The processes forming the Palaeoproterozoic Svecofennian
Annakaisa Korja1, Raimo Lahtinen2 and Mikko Nironen2
1Institute of Seismology, POB 68, FIN -00014 University of Helsinki,Finland 2Geological Survey of Finland, POB 96, FIN-02151 Espoo, Finland
Email: [email protected]
This paper focuses on the processes associated with the formation of the Svecofennian. It is suggested that the Svecofennian domain comprises of at least five orogens each having compressional and extensional stages. The complexity arises from interacting processes, small plates and different tectonic environments existing on opposing margins of a plate at a given time. In addition to the plate driving forces also gravitational forces were important during Palaeoproterozoic crustal and lithospheric growth.
Keywords: Svecofennian, Fennoscandia, lithosphere, orogeny
1. Introduction Plate boundary forces create variable tectonic environments that overlap in time and space. The Palaeoproterozoic Svecofennian domain of Fennoscandia (Figure 1) is comparable in size and complexity to Cenozoic Central Europe, and to present Indonesian archipelago where several processes operate simultaneously and where the change from one tectonic setting to another is rather abrupt
An orogeny is by definition a process of creation of mountain belts by tectonic activity (Bates and Jackson, 1995). Thickening of the lithosphere during collision induce gravitational and mechanical instabilities that tend to be stabilized instantaneously (Figure 2.). When the stabilization processes are included the orogenic cycle is characterized by thickening of the crust, thermal maturation, partial melting and syn- to post-convergence gravitational collapse (Vanderhaeghe and Teyssier, 2001).
Palaeoproterozoic orogenies have been interpreted to be formed in a compressional regime implying semicontinuous convergence over a long time, and as a consequence the stages of these orogenies have been called synorogenic, lateorogenic and postorogenic. One example of the proposed long-lasting orogeny is the Svecofennian Orogeny (100 Ma; Gáal and Gorbatschev, 1987). If it is assumed that the forces acting on the plates were in the Precambrian similar to those acting on the plates today, the long-lasting orogenies with only collisional phases are impossible and other more complicated explanations with both collisional and extensional stages must be looked for.
2. Geological background At the southern rim of northern Svecofennian (Northern Svecofennian subprovince of Gáal and
Gorbatschev, 1987; Figure 1) the oldest lithological units comprise few older volcanic rocks and granites (>1.95 Ga; Knaften (K)) south of the Skellefte district (SD) and 1.92 Ga old tonalitic rocks interlayered with volcanic and turbiditic rocks in the Savo Belt (SB). The area was later intruded by synkinematic granitoids between 1.89 Ga and 1.88 Ga and by post-kinematic pyroxene-bearing granitoids at 1.885 Ga. The Skellefte district (SD; 1.89-1.88 Ga) in the northern Svecofennian of Sweden is composed of two groups of calc-alkaline metavolcanic and metasedimentary rocks intruded by a variety of granites.
In the eastern part of the Central Svecofennian (Central Svecofennian subprovince of Gáal and Gorbatschev, 1987) the Central Finland Granitoid Complex (CFGC) comprising

LITOSPHERE 10.- 11.11.2004 Page 48
mainly calc-alkaline I-type granitoids (1.88-1.89 Ga) with minor amounts of 1.87 Ga postkinematic pyroxene-bearing granitoids. The complex is surrounded by migmatites with tonalite leucosome that were formed from immature psammites 1.89-1.88 Ga ago. The Bothnian Basin (BB) in the western part of the Central Svecofennian is composed of psammitic metagreywackes interbedded with black shales and minor mafic volcanic rocks as well as 1.89-1.87 Ga old calc-alkaline granitoids.
The Southern Svecofennian (South Svecofennian subprovince of Gáal and
Gorbatschev, 1987) includes the 1.90-1.89 Ga Bergslagen area (BA) and Uusimaa Belt (UB), partly formed in an intra-arc basin of a mature continental arc. Arc-type volcanic rocks are also found in the Häme belt (HB in Fig. 2).
In central and northern Sweden, granites with similar age distribution (1.84-1.82 Ga) occur in the Bothnian Basin and in the Skellefte district. The latest major magmatic episodes are expressed as granitoid and volcanic rocks in the Transscandinavian Igneous Belt (TIB) (1.80-1.78 Ga) in Sweden.
Figure 1. Orogenic processes forming the continental crust after Coward, 1994; Rey et al., 2001).a) thickening by stacking of continental slivers, b) unstable thickened crust, c) gravitational collapse by upper crustal deformation only d) gravitational collapse by lower crustal flow only (blind collapse).

LITOSPHERE 10.- 11.11.2004 Page 49
Figure 2. Distribution of microcontinental nuclei and terrane boundaries in the Fennoscandian Shield (Lahtinen et al., 2004).
a)Hidden and exposed pre-1.92 Ga old crustal units of the Fennoscandian Shield. b) Major Palaeoproterozoic terranes of the Fennoscandian Shield. Abbreviations: BA – Bergslagen area; BB – Bothnian Basin; CFGC - Central Finland Granitoid Complex; HB – Häme Belt; K – Knaften; SB – Savo Belt; SD – Skellefte district; TB – Tampere Belt; UB – Uusimaa Belt.

LITOSPHERE 10.- 11.11.2004 Page 50
3. Tectonic model In the following the processes operating in the major orogenic stages of the plate tectonic model by Lahtinen et al. (2004) are outlined. The model is divided into five stages: 1) continental rifting, 2) micro-continental accretion, 3) extension of the accreted crust, 4) continent-continent collision and 5) gravitational collapse stages.
After the destruction of the Archean continental plate at 2.1 Ga new juvenile arcs were initiated. Arcs of different evolutionary stages started to assemble and to form microcontinents. By 1.89 Ga several small plates carrying continental fragments had accreted to the Karelian continent. Oblique collision caused some of the shear zones at or close to the terrane boundaries. The microcontinental collision stage resulted in thickened lithosphere in the core area.
The newly formed continental interior was thermally and gravitationally unstable, and as soon as active compression shifted towards the margins extension took over in the interior. A collapse took place at 1.87 Ga when the postkinematic pyroxene bearing granitoids intruded in the the Central Finland Granitoid Complex. The collapse spread towards the orogenic fronts where its effects were more profound. This means that while the orogen was being destroyed in the central parts subduction was still in operation at the margins. At the end of the microcontinent accretion stage a larger but unstable continental plate (Fennoscandia) had developed.
By 1.80 Ga lithospheric convergence had brought Fennoscandia in contact with Laurentia in the northeast, Amazonia in the west, Sarmatia in the southeast and an unknown continent in the southwest. The net result was that several continent-continentcollisions were localized around the Fennoscandian nucleus.
After the continent-continent collisions Fennoscandia underwent a major stabilization period with gravitational collapses, thermal resetting and late tectono-magmatic episodes. This period is characterized by rapid uplift, voluminous granitoid magmatism and pegmatite intrusions around the Svecofennian nucleus.
4. Discussion In the model, the Northern and Central Svecofenninan Subprovinces of Gaal and
Gorbatshev (1987) were formed during the Lapland-Savo and Fennian orogenies. The northern Svecofennian comprises of more juvenile island arc material whereas the Central Svecofennian is cored by older continental crustal blocks (the Keitele and Bothnia microcontinents). The Southern Svecofennian Subprovince was initiated in the collision between the Bergslagen microcontinent and the newly formed Lapland-Savo orogenic belt. The Southern Svecofennian was, however, heavily reworked during the Svecobaltic orogeny induced by the collision of the Sarmatian crustal segment (Gorbatschev and
Bogdanova 1993) with the Fennoscandian crustal segment. In the model the Southern Svecofennian Subprovince is divided into older Southern Svecofennian and younger Svecobaltia terranes. Another new terrane, the Umeå allochton, is also separated from the northern and central Svecofennian. It resulted from the collision between Amazonia and Fennoscandia at 1.8x Ga (Nordic orogeny). Although there is considerable overlap in the terrane distributions, the evolutionary models differ markedly. In the model of Gáal and
Gorbatshev (1987) the Svecofennian was formed during a long semi-continuous orogeny, which is here divided into several separate orogenic cycles with extensional collapse stages following intimately collisions.
LITOSPHERE 10.- 11.11.2004 Page 51
The youngest zircons from mantle and lower crustal xenolith rocks in eastern Finland verify mantle activity up to 1.8 Ga (Peltonen and Mänttäri, 2001). These ages are interpreted to mark gravitational collapse that took place between 1.80 and 1.75 Ga. Large-scale collapse was possible only after all the long-term compressions at the margins had ceased. The collapse was a combination of several smaller collapses and perhaps of the lithospheric delamination after the Nordic orogeny. However, the small volume and lithospheric origin of mantle magmatism in the central parts of Svecofennia does not favour asthenospheric upwelling in the area.
5. Conclusions It is concluded that the orogenies even in the Palaeoproterozoic Fennoscandia were short and distinct and that they included alternating collisional and extensional stages. The complexity arises from interacting processes, small plates and different tectonic environments existing on opposing margins of a plate at a given time. The duration of the Proterozoic orogenies approaches that of the Phanerozoic ones.
It is concluded that the "Svecofennian orogeny" comprises of at least five orogenic periods each having compressional and extensional stages. In addition to the plate driving forces also gravitational forces were important during Palaeoproterozoic crustal and lithospheric growth. Gravitational collapse must have occurred with or without lithospheric delamination.
References Bates, R.L. and Jackson, J.A., (Eds), 1995. Glossary of Geology, Third Edition. American
Geological Institute, Alexandria, Virginia, U.S.A. Coward, M., 1994. Continental collision. In: Hancock, P.L. (ed) Continental Deformation.
Pergamon Press, Oxford, 264-288. Gáal, G., Gorbatschev, R., 1987. An Outline of the Precambrian evolution of the Baltic
Shield. Precambrian Research 35, 15-52. Gorbatschev, R., Bogdanova, S. 1993. Frontiers in the Baltic Shield. Precambrian Research
64, 3-21. Lahtinen, R., Korja, A. and Nironen, M., 2004. Palaeoproterozoic tectonic evolution of
the Fennoscandian Shield. In. Lehtinen, M., Nurmi, P. and Rämö, T. (Eds.) The Precambrian Bedrock of Finland - Key to the evolution of the Fennoscandian Shield. Elsevier Science B.V (in press).
Peltonen, P., Mänttäri, I., 2001. An ion-microprobe U-Pb-Th study of zircon xenocrysts from the Lahtojoki kimberlite pipe, eastern Finland. Bulletin of the Geological Society of
Finland 73, 47-58. Rey, P., Vanderhaeghe, O. and Teyssier, C., 2001. Gravitational collapse of the
continental crust: definition, regimes and modes. Tectonophysics 342, 435-449. Vanderhaeghe, O. and Teyssier, C., 2001. Crustal-scale rheological ransitions during late-
orogenic collapse. Tectonphysics 335, 211-228.

LITOSPHERE 10.- 11.11.2004 Page 52

LITOSPHERE 10.- 11.11.2004 Page 53
Stabilization processes of Precambrian continental crust - an integrated geophysical-petrological study of the Central Finland Granitoid Complex
Paula Kosunen1, Annakaisa Korja1, Mikko Nironen2, Tapani O. Rämö3, Pekka Heikkinen1
1Institute of Seismology, POB 68, FIN-00014 University of Helsinki 2Geological Survey of Finland, POX 98, FIN-02151 ESPOO 3Department of geology, POB , FIN-University of Helsinki
Email: [email protected]
The origin of the Central Finland Granitoid Complex is studied in an interdisclipinary study using both geophysical and geological data. The project focuses on crustal processes affecting thickened continental lithosphere, structures related to the stabilization of the crust, and formation of large igneous complexes.
Keywords: Central Finland, granitoid, reflection seismic
New continental crust and lithosphere are formed in island arcs and ocean plateaus and can be either preserved or destroyed in the following continental collisions. The collisions induce gravitational and thermal instabilities to the thickened crust and mantle lithosphere; these instabilities are the driving force of the postcollisional evolution of the orogenic areas. According to current views, the orogens may evolve through gravitational collapse (Rey et
al., 2001) or through mantle delaminaton (Houseman and McKenzie, 1981), the theories of which have been developed to explain the postcollisional magmatism and related geophysical anomalies observed in active orogens like the Cordilleras and the Himalayas. The developing crustal structures cannot, however, be studied in active orogens, but should rather be studied in older, stabilized ones with deeper erosional levels.
The Svecofennian orogen in the Fennoscandian Shield is a good example of an old (1.95-1.80 Ga), stabilized orogen with an erosional level of 15-20 km, and has been described in plate tectonic framework as long (50-100 Ma), semi-continuous collisional process similar to other Proterozoic orogenies (Nironen, 1997; Windley, 1993). Korja (1995) and Lahtinen et al. (2004) suggested that orogenic collapse took place after the Svecofennian orogeny. Structures related to gravitational collapse have, however, not been described from the Fennoscandian Shield, and are poorly described in Precambrian terranes elsewhere, as interpretations have been concentrating on collisional structures proving Precambrian plate tectonics.
This project will concentrate on searching for the structures related to the stabilization of the crust in the central part of the Svecofennian orogen that is occupied by the Central Finland Granitoid Complex (Fig.1), which is thought to represent a type locality of stable crust with postcollisional crustal evolution. The CFGC mainly comprises calc-alkaline I-type granitoids (1.89-1.88 Ga) with minor amounts of mafic plutonic rocks as well as remnants of deformed sedimentary and volcanic rocks, and was later intruded by a younger group of hypabyssal rocks and dikes as well as postkinematic granitoids at 1.88-1.87 Ga (Huhma, 1986; Elliott et al., 1998; Nironen et al., 2000). The CFGC is cross-cut by two FIRE (Finnish Reflection Experiment) deep seismic reflection lines (FIRE 1&2 and 3), whose preliminary interpretation (Korja et al., in prep.) indicates that the Granitoid Complex was formed on top of a stack of continental slices as a result of extension. A beautiful rift-related structure is found in the lower and middle crust. The main goal of this project is to test whether the structures found on the FIRE lines were formed by either gravitational collapse or by lithospheric delamination.

LITOSPHERE 10.- 11.11.2004 Page 54
Central Finland provides an excellent possibility to combine new deep seismic reflection (FIRE) and tomographic (SVEKALAPKO) data on the structure of the lithosphere with detailed structural and petrologic studies to provide insight into the processes of crustal stabilization and formation of large igneous complexes. The Svecofennian example can be used to postulate what may happen to the modern orogenic crust and what processes will stabilize it.
Figure1. FIRE deep seismic reflection lines 1 and 3 on the lithological map of the Central Finland Granitoid Complex. The index map after Koistinen et al. (2001), the CFGC map modified from Korsman et al. (1997).
References Elliott B.A., Rämö O.T., Nironen M., 1998. Mineral chemistry constraints on the
evolution of the 1.88-1.87 Ga post-kinematic granite plutons in the Central Finland Granitoid Complex. Lithos 45: 109-129.
Houseman, G.A., McKenzie, D.P. and Molnar, P., 1981. Convective instability of thickened boundary layer and its relevance for the thermal evolution of the continental convergent belts. Journal of Geophysical Research 86, 6115-6132.
Huhma, H., 1986. Sm-Nd, U-Pb and Pb-Pb isotopic evidence for the origin of the Early Proterozoic Svecokarelian crust in Finland. Geological Survey of Finland Bulletin 337, 48 p.
Koistinen, T., Stephens, M.B., Bogatchev, V., Nordgulen, Ø., Wennerström, M., Korhonen, J., 2001. Geological map of the Fennoscandian Shield, scale 1 : 2 000 000. Geological Surveys of Finland, Norway and Sweden and the North-West Department
of Natural Resources of Russia.

LITOSPHERE 10.- 11.11.2004 Page 55
Korja, A. 1995. Structure of the Svecofennian crust – growth and destruction of the Svecofennian orogen. Ph.D. thesis, Institute of Seismology, University of Helsinki,
Report S-31, 36 p. Korsman, K., Koistinen, T., Kohonen, J., Wennerström, M., Ekdahl, E., Honkamo, M.,
Idman, H., Pekkala, Y. (eds.), 1997. Suomen kallioperäkartta – Berggrundskarta över Finland- Bedrock map of Finland 1 : 1 000 000. Geological Survey of Finland, Espoo,
Finland.Lahtinen, R., Korja, A. and Nironen, M., 2004. Palaeoproterozoic tectonic evolution of the
Fennoscandian Shield. In. Lehtinen, M., Nurmi, P. and Rämö, T. (Eds.) The Precambrian Bedrock of Finland - Key to the evolution of the Fennoscandian Shield. Elsevier Science B.V (in press).
Nironen M., 1997. The Svecofennian Orogen: a tectonic model. Precambrian Research
86: 21-44. Nironen, M., Elliott, B.A., Rämö, O.T., 2000. 1.88-1.87 Ga post-kinematic intrusions of
the Central Finland Granitoid Complex: a shift from C-type to A-type magmatism during lithospheric convergance. Lithos 53, 37-58.
Rey, P., Vanderhaeghe, O., Teyssier, C., 2001. Gravitational collapse of the continental crust: definition, regimes and modes. Tectonophysics 342: 435-449.
Windley, B.F. 1993. Proterozoic anorogenic magmatism and its orogenic connections. J.
Geol. Soc. London 150, 39-50.

LITOSPHERE 10.- 11.11.2004 Page 56

LITOSPHERE 10.- 11.11.2004 Page 57
Structure of the upper mantle beneath central Fennoscandian Shield from seismic anisotropy studies
Elena Kozlovskaya1, Ludek Vescey2, Jaroslava Plomerová2, Vladislav Babuska2,Sven-Erik Hjelt3 and Tero Raita1
1Sodankylä geophysical observatory/Oulu Unit, POB 3000, FIN-90014, University of Oulu, Finland 2Institute of Geophysics, Czech Academy of Sciences, Bo ní II/1401, 14131 Prague 4, Czech Republic
3Department of Geophysics, Institute of Geosciences, POB 3000, FIN-90014, University of Oulu, Finland Email: [email protected]
The SVEKALAPKO deep seismic tomography experiment was conducted in 1998-1999 in central and southern Finland. An important part of the project is seismic anisotropy study carried out by the Institute of Geophysics of Czech Academy of Science, at present in collaboration with the Sodankylä Geophysical Observatory of Oulu University and with the Department of Geophysics of Oulu University. The study revealed several domains with different anisotropic pattern below the SVEKALAPKO seismic array. In particular, strong anisotropy and rather homogeneous orientation of anisotropic material in the upper mantle was revealed beneath Archean domain. On the contrary, the anisotropic pattern corresponding to the Proterozoic domain seems to be more heterogeneous and the anisotropy seems to be weaker in the central part.
Keywords: Lithosphere, mantle, seismic anisotropy, SVEKALAPKO
The main goal of all geophysical studies in the EUROPROBE/SVEKALAPKO multidisciplinary project (Hjelt and Daly, 1996, Hjelt and Daly, 2002) was to investigate deep structure of the lithosphere-asthenosphere boundary and structures within the lithosphere of the central part of the Fennoscandian Shield (Hjelt and Daly, 1996, Hjelt and Daly, 2002). As a part of this multidisciplinary research, the SVEKALAPKO deep seismic tomography experiment aimed at studying details of the crust and lithosphere under the central Fennoscandian Shield (Bock et al., 2001).
An important part of the SVEKALAPKO seismic array research is the seismic anisotropy studie. The main method of seismic anisotropy investigation implied in the SVEKALAPKO project is joint inversion of shear wave splitting parameters and longitudinal wave residuals aiming at retrieving the orientation of seismic anisotropic structures in the mantle lithosphere (Šilený and Plomerová (1996), Plomerová et al. (1996)). Such an approach results in retrieving a self-consistent 3-D orientation of the anisotropic structures in the upper mantle and in distinguishing between hexagonal and orthorhombic anisotropy models.
Plomerova et al. (1999, 2001, 2003) presented first results of seismic anisotropy investigations achieved by joint interpretation of P-wave residuals and S-wave splitting parameters beneath the central Finland. They demonstrated the differences in lithosphere thickness beneath the TOR and SVEKALAPKO arrays, similarly to findings of 3-D isotropic tomography, receiver functions or surface wave analysis (Bock et al., 2001). The result also indicated clear difference in anisotropic structure of Archaean and Proterozoic domains below the SVEKALAPKO area with several smaller regions in each of them.
In 2003-2004 the seismic anisotropy study continued in collaboration with the Department of Geophysics and Sodankylä Geophysical Observatory of Oulu University. The project was supported by the Academy of Finland and the Academy of Science of Czech Republic via the system of exchange visits grants. During this period the shear wave splitting data were analyzed and new methods and software of joint inversion of anisotropic

LITOSPHERE 10.- 11.11.2004 Page 58
shear wave splitting parameters and longitudinal wave residuals has been developed by L. Vescey and E. Kozlovskaya (Kozlovskaya et al., 2003). The method was tested with the data of the SVEKALAPKO and several other previous projects. At present, the code was applied to interpretation of the SVEKALAPKO body wave data. The study confirmed several domains with different anisotropic structure below the SVEKALAPKO seismic array. In particular, strong anisotropy and uniform orientation of anisotropic material in the upper mantle was revealed beneath Archean domain. On the contrary, the anisotropic pattern corresponding to the Proterozoic domain is more heterogeneous with weaker anisotropy in the central part. This may result from different orientation of mantle material within different tectonic units of this region and their collision. Alternatively, it may be an artefact resulting from weak anisotropy and/or from insufficient azimuth coverage of events in S-wave splitting data. Therefore, further analysis of shear wave splitting aiming at improving the azimuth coverage will provide more detailed information about seismic anisotropy of individual Proterozoic domains.
ReferencesBock, G. (ed) and SVEKALAPKO Seismic Tomography Working Group, 2001.Seismic
probing of Archaean and Proterozoic Lithosphere in Fennoscandia. EOS Transactions AGU, 82, 50, 621, 628-629.
Hjelt, S-E, Daly, S and SVEKALAPKO colleagues, 1996. SVEKALAPKO.Evolution of Palaeoproterozoic and Archaean Lithosphere. pp. 56- 67 in Gee, DG and Zeyen, HJ (editors): EUROPROBE 1996 – Lithospheric dynamics: Origin and evolution of continents. Publ. by theEUROPROBE Secretariate, Uppsala University, 138 pp.
Hjelt, S-E., Daly, S. 2002. The SVEKALAPKO project: a contribution to an improved understanding of the evolution of the Fennoscandian Schield. LITO2002. In: Lahtinen, R., Korja, A., Arhe, K., Eklund, O., Hjelt, S-E., Pesonen, L. LITHOSPHERE 2002, second simposium on the structure, composition and evolution of the lithosphere in finland, Espoo, November 12-13, 2002. Programme and extended abstract. Int. of Seismology, Univ. of Helsinki, Rep. S-42.
Kozlovskaya, E., Vescey, L., Plomerova, J., Raita, T., SVEKALAPKO STWG. 2003. A multiobjective optimisation approach to joint inversions of anisotropic parameters of teleseismic body waves aiming at retrieving deep structure of the lithosphere. EGS-AGU-EUG Joint Assembly, Nice, France, 6-11.04. 2003. Geophysical Research abstracts, 5.
Plomerová, J., Šileny, J., Babuška, V., 1996. Joint interpretation of upper-mantle anisotropy based on teleseismic P-travel-time delays and inversion of shear-wave splitting parameters. PEPI, 95, 293-309.
Plomerová, J., Hyvönen, T,, Kouba, D., Vescey, L., Babuska, V. 1999. Seismic anisotropy of deep lithosphere of tectonic domains sepatated by the Archean-Proterozoic paleosuture in Finland. SVEKALAPKO 4th Workshop, Lammi, Finland. 18-21.11.1999. Abstracts. 55.
Plomerová, J., Kouba, D.,Hyvönen, T., Sandoval, S., Babuska, V. and SSTWG. 2001. Seismic anisotropy beneath SVEKALAPKO-status raport. SVEKALAPKO 6th Workshop, Lammi, Finland. 29.11-2.12.2001. Abstracts. 45.
Plomerova, J, Hyvonen, T., Babuska, V., Vecsey, L., Raita, T. and the SSTWGroup; TOR WGroup, 2003. Seismic-wave anisotropy of the subcrustal lithosphere of Fennoscandia based on body-wave data recorded during the international passive experiments. EGU-
AGU Joint Meeting, Nice 2003-04, abstract EAE03-A-03891

LITOSPHERE 10.- 11.11.2004 Page 59
Šileny, J., Plomerová, J., 1996. Inversion of shear wave splitting parameters to retrieve three- dimensional orientation of anisotropy in continental lithosphere. PEPI, 95, 277-292.
AppendixThe SVEKALAPKO Seismic Tomography Working Group: U. Achauer, A. Alinaghi, J. Ansorge,G. Bock, M. Bruneton, W. Friederich, M. Grad, A. Guterch, S.-E-. Hjelt, T. Hyvönen, E. Isanina, E. Kissling, K.Komminaho, A. Korja, P. Heikkinen, E. Kozlovskaya, M.V. Nevsky, N.Pavlenkova, H. Pedersen, J. Plomerova, T. Raita, O. Riznichenko, R.G. Roberts, S. Sandoval, I.A. Sanina, N.V. Sharov, J. Tiikkainen, L. Vescey, S.G. Volosov, E. Wieland, K. Wyegalla, J. Yliniemi, Y. Yurov.

LITOSPHERE 10.- 11.11.2004 Page 60

LITOSPHERE 10.- 11.11.2004 Page 61
Thermal modelling of crustal stacking and exhumation during the Palaeoproterozoic orogenic growth of the central Fennoscandian Shield
Ilmo T. Kukkonen1, Annakaisa Korja2, Raimo Lahtinen1, Pekka Heikkinen2
and FIRE Working Group
1Geological Survey of Finland, P.O. Box 96, FIN-02151 Espoo, Finland 2Institute of Seismology, University of Helsinki, P.O. Box 26, FIN-00014 Helsinki, Finland
Email: [email protected]
We present results on numerical modelling of the thermal evolution of the crust in the central Fennoscandian Shield during the Palaeoproterozoic orogeny (c. 1.92-1.87 Ga). The models suggest that the crustal evolution can be successfully modelled by stacking of crustal columns which simulate the collsional and accretionary processes. Stacking is followed by warming of the lithosphere by conductive heat transfer and natural radiogenic heat production of the rocks. On the other hand, exhumation of the crust leads to cooling of the lithosphere due to removal of radiogenic heat sources from the lithosphere. Our results indicate that conductive heat transfer and the distribution of radiogenic elements in the crust are major factors controlling the thermal evolution of the crust. No large-scale magmatic heating is required. However, the transport of radiogenic elements to the upper crust by melts originating from lower and middle crust is an essential mechanism leading to final thermal stabilization of the lithosphere.
Keywords: lithosphere, thermal evolution, numerical models, Fennoscandian Shield
1. Introduction Thermal evolution of the continental crust in the Fennoscandian Shield during the Palaeoproterozoic orogeny (c. 1.92-1.87 Ga) was modelled with one-dimensional stacking and exhumation models. The crustal evolution of the central part of the Fennoscandian Shield was characterized by break-up of the Archaean craton (c. 2.2-2.0 Ga ago), opening of an oceanic basin to the west of the craton, and subsequent closure of the oceanic basin and accretion of arcs and microcontinents to the western margin of the craton at about 1.92-1.87 Ga ago. The Archaean wedge-shaped cratonic margin was both overthrust by a 15-20 km thick stack of Paleoproterozoic arc material and underthrust by 20 km of mafic underplate. Today, these events are observed, e.g., in the reflection seismic results by the Finnish Reflection Experiment (FIRE project) and in the lower amphibolite facies overprinting at the present erosion level of the Archaean craton. Further to the west in the Proterozoic part the crustal accretion was characterized by stacking of small plates of continental material as well as related granitoid magmatism.
2. Thermal modelling Thermal models were constructed using data on present thermal conductivity and heat production data as well as crustal structures revealed from seismic data. Crustal stacking and exhumation were simulated with 1-dimensional numerical heat conduction models in which the thermal regime was calibrated with heat production estimates based on geochemistry. In the models, the decay of radioactive elements with time as well as geological and isotope data on thermal constraints on the thermal evolution of bedrock in the area were accounted for.

LITOSPHERE 10.- 11.11.2004 Page 62
3. Results and conclusions The results support continental accretion by stacking processes. Rapid exhumation rate and partial melting events that facilitated the transport of elements responsible of radiogenic heat generation (U, Th and K) to upper crustal levels were crucial factors in the thermal stabilization of the newly accreted continental crust.
The P-T-t paths constructed with the modelings are in good agreement with the documented geological evolution of the area. The results provide further constraints on the present composition and metamorphic grade of crustal units, such as degree of eclogitization of the lowermost crust.
Figure 1. An example of the thermal modelling of the lithosphere in the Fennoscandian Shield. The model simulates the Palaeoproterozoic thrusting of metasediments on top of the Archaean craton and simultaneous underthrusting of arc-type warm lower crust at the Moho level. Geotherms are presented for different moments of time during the orogeny. Thick arrows indicate the depth-temperature path experienced by the (present) lower crustal rocks.
LITOSPHERE 10.- 11.11.2004 Page 63
Single zircon U-Pb age results from the late Svecofennian microcline granites, southeastern Finland
Matti Kurhila1, Matti Vaasjoki2, Irmeli Mänttäri2, Tapani Rämö1, Mikko Nironen2
1Department of Geology, P.O. Box 64, 00014 University of Helsinki 2Geological Survey of Finland, P.O. box 96, 02151 Espoo
Email: [email protected]
Keywords: lateorogenic, granite, U-Pb chronology, secondary ion mass spectrometry, zircon
1. Introduction In southeastern Finland, the belt of the late Svecofennian microcline granites extends over the boundary of the Svecofennian and Karelian crustal domains. In order to draw conclusions about the source rocks of the granites and to date the collision of the arc complex of southern Finland in this area, we have carried out ion microprobe zircon analysis on five granite samples along the eastern part of this granite belt. Previous TIMS U-Pb datings are somewhat controversial, suggesting 1.80-1.82 Ga emplacement ages for these granites (Nykänen, 1983; Vaasjoki & Mänttäri, 2000; unpublished data by Vaasjoki & Kurhila).
2. Sample materialOur sampling sites were 1) A1721 Kaisavuori in Valkeala between the Vyborg and Ahvenisto rapakivi plutons, 2) A1751 Pulkkila in the middle of Sulkava thermal dome, 3) A1724 Pihlajaniemi at the margin of the Puruvesi batholith and 4) A1711 Rastiniemi at the center of the same Puruvesi batholith. In addition, an old sample A1307 Jaani from Mäntyharju adjacent to the Ahvenisto rapakivi granite pluton was included, mainly to clarify the somewhat heterogeneous results of a previous TIMS dating by Vaasjoki &
Mänttäri (2000). All the sampled granite bodies are in many ways similar to each other. They are peraluminous and contain variable amounts of garnet, features that are commonly associated with S-type granites.
The Kaisavuori granite is a relatively homogeneous and coarse-grained, garnet-rich granite. It is rich in rutile and magnetite, some of which is transformed into hematite giving the rock a reddish colour. The rock has a very weak and varying magmatic orientation, which is best seen in the sparse K-feldspar megacrysts.
The sample of Pulkkila granite is from the central part of the Sulkava thermal dome (Korsman et al., 1984) west of Sulkava town. The rock differs petrographically from other samples in this study. It is more plagioclase-rich, has less organized microcline structure and is devoid of monazite, which is a very abundant accessory mineral in all the other samples.
The Pihlajaniemi granite represents the marginal phase of the Puruvesi batholith. It is almost white, with irregularly dispersed garnet and abundant mica gneiss inclusions, which have been reworked to various extents. The rock also grades to pegmatite in places, and is altogether quite inhomogeneous.
The sample of Rastiniemi comes from the central phase of the Puruvesi batholith. It is porphyric, with prominent K-feldspar megacrysts and hardly any garnet. In contrast to the marginal area of the batholith, the granite of the whole central part is homogeneous.

LITOSPHERE 10.- 11.11.2004 Page 64
Figure 1. Concordia plots showing the ion microprobe U-Pb zircon data on the studied samples. Discordant analyses are excluded. The errors are at 2 sigma level, unless otherwise indicated. Decay constant errors are ignored.
3. Age results The U-Pb age results are collectively presented in figure 1. In most cases, they confirm the existing conventional U-Pb ages, though some new aspects did emerge.
The Kaisavuori granite has a rather uniform zircon population with an age of 1811±6 Ma (fig. 1 a). However, if we exclude three small possibly metamorphic zircon crystals and one rim of a prismatic crystal, the age becomes 1820±10 Ma. The metamorphic zircons would then have a discordia age of 1804±9 Ma.
The zircon ages from the Pulkkila granite form two clusters (fig 1 b). The older one approaches, at 1862±7 Ma, the age of the final stages of the Svecofennian orogeny (eg.
Vaasjoki, 1996). As the Sulkava migmatite dome is thought to have formed by ascent of a

LITOSPHERE 10.- 11.11.2004 Page 65
mixture of melted and unmelted metasediments (Korsman et al., 1984), this age is interpreted as the age of the source rock. The younger age, 1790±8 Ma, dates the cooling of the ascended melt. The result is slightly younger than previous ones dating the thermal event of Sulkava area (cf. Korsman et al., 1984; Vaasjoki & Sakko, 1988), although the 1796±5 Ma monazite age from Härkälä metapelite (Vaasjoki & Sakko, 1988) north of Sulkava overlaps with our present result.
Although the two types of granites of the Puruvesi area are somewhat different in terms of petrography and geochemistry, their ages and zircon inheritance patterns are almost identical (fig. 1 c and d). The ages of magmatic zircons in both types cluster at about 1800 Ma. In addition they contain some older, both Proterozoic and Archean inherited zircon cores and whole crystals. It is therefore evident that the source rocks of the Puruvesi pluton were essentially sedimentary rocks composed of both Proterozoic and Archean detrital material.
The conventional U-Pb zircon dating of the Jaani granite in Mäntyharju by Vaasjoki &
Mänttäri (2000) had pointed to a heterogeneous zircon source material. In their study, a discordia line defined by four fractions, consisting of zircons of obviously mixed ages, resulted in an age of approximately1880 Ma. Monazites were considerably younger at 1822 ±1 Ma. The secondary ion mass spectrometry reveals a multi-stage origin of the source material for the Jaani granite (fig 1 e). The main phase has almost the same age as the monazites, 1816±4 Ma. There is also a considerable amount of analyzed spots that plot between 1850 and 2100 Ma. Even some Archean zircon crystals were detected. The presence of Archean material is surprising, as there are no Archean country rocks anywhere near the sample site. The result argues strongly for a sedimentary origin of the source rock.
4. Conclusions The emplacement of the lateorogenic granites of southeastern Finland occurred roughly between 1820 Ma and 1800 Ma. The extensional zone assumed to have produced the granites seems to have propagated eastwards. An exception to this pattern is the Sulkava granite, which is related to a later thermal event that ceased at about 1790 Ma. The considerable amount of inherited zircons suggests the granites were formed from sedimentary source rocks.
References Korsman, K., Hölttä, P., Hautala, T. and Wasenius, P., 1984. Metamorphism as an indicator
of evolution and structure of the crust in Eastern Finland. Geological Survey of
Finland, Bulletin 328. 40 pp. Nykänen, O., 1983. Punkaharjun ja Parikkalan kartta-alueiden kallioperä. Suomen
geologinen kartta 1:100 000 : kallioperäkarttojen selitykset, lehdet 4124+4142, 4123+4114. 81 pp.
Vaasjoki, M., 1996. Explanation to the geochronological map of southern Finland : the development of the continental crust with special reference to the Svecofennian orogeny. Geological Survey of Finland, Report of investigation 135. 30 pp. + 1 app. map.
Vaasjoki, M. and Mänttäri, I., 2000. Jaanin migmatisoiva mikrokliinigraniitti Ahveniston kompleksin pohjoispuolella : zirkonien ja monatsiitin radiometriset iät. Geologi 52 (3), p. 65-68.
Vaasjoki, M. and Sakko, M., 1988. Evolution of the Raahe-Ladoga zone in Finland: Isotopic constrains. In: Korsman, K. (ed.) 1988. Tectono-metamorphic evolution of the Raahe-Ladoga zone. Geological Survey of Finland, Bulletin 343. p.7-33.

LITOSPHERE 10.- 11.11.2004 Page 66

LITOSPHERE 10.-11.11.2004 Page 67
Composition of the crust in the central Fennoscandian Shield: Lithological modelling of seismic velocity data
Minna Kuusisto1, Ilmo Kukkonen2, Pekka Heikkinen2 and Lauri J. Pesonen3
1Geological Survey of Finland, P.O. Box 96, FIN-02151 Espoo, Finland 2Institute of Seismology, PL 68, 00014 University of Helsinki, Finland 3Division of Geophysics, PL 64, 00014 University of Helsinki, Finland
Email: [email protected]
In this study we report the first results of an investigation aiming at the lithological interpretation of the crust in the central Fennoscandian Shield using seismic wide-angle data and literature data on P-velocities of different rock types. The velocities adopted from wide-angle velocity models were compared with laboratory measurements of different rock types corrected for the crustal PT conditions in the study area. The velocity data indicate that the P-velocity does not only increase step-wise at boundaries of major crustal layers, but there is also a gradual increase of velocity within the layers. On the other hand, the laboratory measurements of velocities indicate that no single rock type is able to provide the gradual downward increasing trends. Thus, there must be gradual vertical changes in rock composition. The downward increase of velocities indicates that the composition of the crust becomes gradually more mafic when the depth increases. We have calculated vertical velocity profiles for a range of possible crustal lithological compositions.
Keywords: seismic velocity, crust
1. Introduction Seismic velocities of crystalline rocks are controlled mainly by mineralogical composition, pressure and temperature. To a minor degree, factors such as rock texture, anisotropy, porosity and fracturing also influence the velocities. Literature data on velocities measured as functions of temperature and pressure are available for a large number of different rock types. On the other hand, high quality velocities from wide-angle data are also available on many areas, but the lithological interpretation of the crustal velocities is rarely attempted. In this study we report the first results of an investigation aiming at the lithological interpretation of the crust using seismic data in the central part of the Fennoscandian Shield. The study area is challenging because of the anomalously thick crust (52 km on average), a thick high-velocity lower crust, and abundance of granitoids in the upper crust.
2. Seismic velocity dataThe study area is well covered by previous wide-angle studies, and in the present work we apply the results from SVEKA’81, SVEKA’91, FENNIA, BALTIC and POLAR profiles (Luosto, 1997 and references therein). P-wave velocity data were adopted from the original ray tracing models. When plotted as functions of depth, the velocities form distinct layers step-wise increases at layer boundaries as is expected for any crustal section. However, within the major crustal layers, conspicuous trends of increasing velocities are observed. In order to avoid modelling artefacts to be interpreted in this connection, we have carefully analysed the original data.
Laboratory measurements on velocities measured as functions of temperature and pressure are available in literature for different rock types. Here we applied velocities, and pressure and temperature derivatives taken from Christensen and Mooney (1995). The laboratory velocities were corrected for the Finnish conditions using a xenolith-calibrated geotherm (Kukkonen et al., 2003) representative for the central Fennoscandian Shield.

LITOSPHERE 10.-11.11.2004 Page 68
Figure 1. P-wave velocity of some rock types in PT conditions of the Finnish crust together with wide-angle model data from SVEKA'81.
3. Preliminary resultsThe wide-angle model velocities were compared with laboratory measurements of different rock types (an example is shown in figure 1). The results indicate that no single rock type is able to provide the downward increasing trends within different crustal layers: assuming that the velocities from wide-angle models are representative of the real in situ velocities, there must be gradual vertical changes in rock composition. It indicates that the composition of the crust becomes gradually more mafic within the major crustal layers, and that the compositional changes in the crust are not limited only to major layer boundaries.
The lithological interpretation of crustal velocities is a non-unique problem if only seismic velocity data is available. Nevertheless, to constrain the possible lithological types in different crustal layers, we have calculated velocities of different plausible mixtures of rock types. Here it should be taken into account that the available laboratory measurements limit the possible rock type assortment. The first results suggest that the upper crust (about 0-15 km) is reasonably well represented by a mixture of the major rock types outcropping on the surface (granitoids, felsic gneiss and a little of mafic rocks). The upper part of the middle (about 15-30 km) crust is bracketed between felsic and mafic granulite, diorite, amphibolite, diabase and anorthosite, and a mixture of them and felsic rocks is suggested for this depth layer. In the lower part of the middle crust (about 30-40 km), the rocks can be represented as a mixture of amphibolite, gabbroic rocks, and mafic garnet granulite. The lower crust (about 40-60 km) can be interpreted as a mixture of mafic garnet granulite and mafic eclogite.

LITOSPHERE 10.-11.11.2004 Page 69
ReferenceChristensen, N.I. & Mooney, W.D. 1995. Seismic Velocity structure and composition of
the Continental Crust: A Global View, Journal of Geophysical Research, Vol. 100, No. B7, p. 0761-9788.
Kukkonen, I.T., Kinnunen, K.A. & Peltonen, P., 2003. Mantle xenoliths and thick lithosphere in the Fennoscandian Shield, Physics and Chemistry of Earth, 28 (2003), p. 349-360.
Luosto, U., 1997. Structure of the Earth’s Crust in Fennoskandia as Releved from Refraction and Wide-Angle Reflection Studies, Geophysica, 33(1), 3-16.

LITOSPHERE 10.-11.11.2004 Page 70

LITOSPHERE 10.- 11.11.2004 Page 71
New zircon and monazite ages and Nd isotope data on the Archean complex in Koillismaa, eastern Finland
Laura S. Lauri1, Hannu Huhma2, Irmeli Mänttäri2 and Jorma Räsänen3
1Department of Geology, P.O. Box 64, 00014 University of Helsinki, Finland 2Geological Survey of Finland, P.O. Box 96, 02151 Espoo, Finland
3Geological Survey of Finland, P.O. Box 77, 96101 Rovaniemi, Finland Email: [email protected]
The Archean complex in Koillismaa, eastern Finland, mainly consists of TTG-association gneisses that are at least 2.8 Ga old and younger ca. 2.7 Ga granitoids. Both lithologies contain 2.695 Ga monazite. The age and Nd isotope composition of the Archean rocks in Koillismaa area are consistent with data acquired from other parts of the Archean Karelian province.
Keywords: Koillismaa, Archean, Karelian province, U–Pb geochronology, monazite, Nd isotope
1. IntroductionThe Koillismaa area forms the northernmost part of the eastern Finland Archean block that belongs to the Karelian Province of the Fennoscandian shield. The area consists of late Archean rocks that are intruded by younger units such as the early Paleoproterozoic layered gabbros (Alapieti, 1982) and related silicic rocks (Lauri, 2004) and several generations of mafic dikes (Vuollo, 1994). The Archean complex in Koillismaa is little studied so far and age data especially is sparse; only an imprecise U–Pb zircon date of ~2.7 Ga is available from the area (Lauerma, 1982). The major rock types of the complex are variably deformed TTG-association gneisses that are cut and migmatized by younger granitic-granodioritic intrusions and dikes. Minor greenstone occurrences have also been found. Aeromagnetic data and preliminary mapping indicate that the area consists of several blocks with varying erosional level. In some blocks the metamorphic grade extends up to granulite facies.
2. U–Pb geochronologySix samples were collected for U–Pb geochronology from the Archean complex in Koillismaa (Fig. 1). Two of these were from a granulite facies orthogneiss block, and four represented younger granitoids that cut the gneisses. Several zircon fractions were analyzed from all samples (Lauri et al., 2004). The acquired zircon ages are rather imprecise but they indicate that the granulitic gneisses are at least 2.8 Ga old. Sample A1661, with the U–Pb zircon age of 2808±20 Ma, is the oldest sample so far analyzed in the Koillismaa area (Fig. 1). The younger granites show heterogeneous zircon populations with crystallization ages around 2.7 Ga.
Monazite was found from two granulitic gneisses and two younger granites (Fig. 1). All monazites show concordant 2.695 Ga ages (Lauri et al., 2004).

LITOSPHERE 10.- 11.11.2004 Page 72
Figure 1. Bedrock map of the Koillismaa area (modified after Räsänen et al., 2003 and Lauri et al.,
2004).
3. Nd isotope geochemistryEight samples from the Archean complex were analyzed for Nd isotopes (Fig. 1). The initial Nd values (at 2800 Ma for the gneisses and at 2700 Ma for the granitoids) vary mostly between –0.8 and –3.8 and the TDM model ages (after DePaolo, 1981) are between 2900 and 3100 Ma (Lauri et al., 2004). One sample (A1644) shows a markedly different
Nd value of +0.9 and TDM model age of 2791 Ma (Fig. 1) that are close to the values acquired from the Archean rocks on the Russian side (see Amelin and Neymark, 1998).
4. Discussion and conclusions The ages so far determined for the orthogneisses of the Archean Karelian province of the Fennoscandian shield are mainly between 2.85 and 2.68 Ga, although >3.0 Ga old rocks are also known (e.g., Vaasjoki et al., 1999 and references therein; Hölttä et al., 2000; Hanski
et al., 2001; Juopperi and Vaasjoki, 2001; Luukkonen, 2001; Evins et al., 2002; Mänttäri
and Hölttä, 2002; Mutanen and Huhma, 2003). The initial Nd values for these rocks are
LITOSPHERE 10.- 11.11.2004 Page 73
between 1.6 and –4.8 and TDM model ages vary between 2.75 and 3.61 Ga (Huhma, 1986;
O’Brien et al., 1993; Hölttä et al., 2000; Hanski et al., 2001; Halla, 2002). The zircon ages and Nd isotope data acquired from the Archean complex in Koillismaa are consistent with the main Neoarchean phase of crustal growth in the Karelian Province. The 2.9 to 3.1 Ga TDM ages of the Archean rocks suggest that even older rocks might be found from Koillismaa with more extensive sampling.
The monazite ages measured from the Koillismaa samples are at least some 10 Ma younger than the zircon ages of the granites and over 100 Ma younger than the zircon ages of the granulitic gneisses. The similarity of the monazite ages in both lithologies indicates a common cause for monazite growth. Although the zircon population in the granites is heterogeneous and at least partly inherited, the ~2.7 Ga zircon and monazite age is interpreted as the crystallization age for the granites. The timing of the granulite facies metamorphism in the gneisses is unknown but the monazite growth may have been induced by the heating and fluid flow associated with the intrusion of the granites at ~2.7 Ga. In some parts of the Karelian province, granulite facies metamorphism occurred at ~2.63 Ga (e.g., Hölttä et al, 2000; Mänttäri and Hölttä, 2002). In Koillismaa area, the Archean magmatic and metamorphic activity seems to have ceased at ~2.69 Ga. Later disturbance is negligible, as the K–Ar ages of the hornblendes and biotites are also Archean (Kontinen et
al., 1992).
ReferencesAlapieti, T. 1982. The Koillismaa layered igneous complex, Finland – its structure,
mineralogy and geochemistry, with emphasis on the distribution of chromium. Geol.
Surv. Finland, Bull. 319.Amelin, Yu.V. and Neymark, L.A. 1998. Lead isotope geochemistry of Paleoproterozoic
layered intrusions in the eastern Baltic Shield: Inferences about magma sources and U-Th-Pb fractionation in the crust-mantle system. Geochim. Cosmochim. Acta 62(3),493–505.
DePaolo, D. J. 1981. Neodymium isotopes in the Colorado Front Range and crust-mantle evolution in the Proterozoic. Nature 291, 684–687.
Evins, P.M., Mansfeld, J., Laajoki, K. 2002. Geology and Geochronology of the Suomujärvi Complex: a new Archaean gneiss region in the NE Baltic Shield, Finland. Precambrian Res. 116, 285–306.
Halla, J. 2002. Origin and Paleoproterozoic reactivation of Neoarchean high-K granitoid rocks in eastern Finland. Annales Academiae Scientiarum Fennicae Geologica–
Geographica 163.Hanski, E., Walker, R. J., Huhma, H., Suominen, I. 2001. The Os and Nd isotopic
systematics of the c. 2.44 Ga Akanvaara and Koitelainen mafic layered intrusions in northern Finland. Precambrian Res. 109, 73–102.
Hölttä, P., Huhma, H., Mänttäri, I., Paavola, J. 2000. P-T-t development of Archaean granulites in Varpaisjärvi, central Finland. II. Dating of high-grade metamorphism with the U–Pb and Sm–Nd methods. Lithos 50(1–3), 121–136.
Huhma, H. 1986. Sm–Nd, U–Pb and Pb–Pb isotopic evidence for the origin of the Early Proterozoic Svecokarelian crust in Finland. Geol. Surv. Finland, Bull. 337.
Juopperi, H., Vaasjoki, M. 2001. U–Pb age determinations from Archean rocks in eastern Lapland. In: Vaasjoki, M. (Ed.) Radiometric age determinations from Finnish Lapland and their bearing on the timing of Precambrian volcano-sedimentary sequences. Geol.
Surv. Finland, Spec. Paper 33, 209–228.

LITOSPHERE 10.- 11.11.2004 Page 74
Kontinen, A., Paavola, J., Lukkarinen, H. 1992. K–Ar ages of hornblende and biotite from Late Archean rocks of eastern Finland – interpretation and discussion of tectonic implications. Geol. Surv. Finland, Bull. 365.
Lauerma, R. 1982. On the ages of some granitoid and schist complexes in northern Finland. Bull. Geol. Soc. Finland 54(1–2), 85–100.
Lauri, L.S. 2004. Petrogenesis of felsic igneous rocks associated with the Paleoproterozoic Koillismaa layered igneous complex, Finland. In electronic format:
http://ethesis.helsinki.fi. Lauri, L.S., Rämö, O.T., Huhma, H., Mänttäri, I., Räsänen, J. 2004. Petrogenesis of silicic
magmatism related to ~2.44 Ga rifting of the Archean crust in Koillismaa, eastern Finland. Lithos (in review).
Luukkonen, E.J. 2001. Lentiiran kartta-alueen kallioperä. Suomen geologinen kartta 1:100 000, lehdet 4414 + 4432. Explanation to the maps of Pre-Quaternary Rocks, sheets 4414 + 4432. Geol. Surv. Finland (in Finnish, with English summary).
Mänttäri, I., Hölttä, P. 2002. U–Pb dating of zircons and monazites from Archean granulites in Varpaisjärvi, Central Finland: Evidence for multiple metamorphism and Neoarchean terrane accretion. Precambrian Res. 118, 101–131.
Mutanen, T., Huhma, H. 2003. The 3.5 Ga Siurua trondhjemite gneiss in the Archean Pudasjärvi Granulite Belt, northern Finland. Bull. Geol. Soc. Finland 75(1–2), 55–68.
O’Brien, H., Huhma, H., Sorjonen–Ward, P. 1993. Petrogenesis of the late Archean Hattu schist belt, Ilomantsi, eastern Finland: geochemistry and Sr, Nd isotopic composition. In: Nurmi, P. A. and Sorjonen–Ward, P. (eds.). Geological development, gold mineralization and exploration methods in the late Archean Hattu schist belt, Ilomantsi, eastern Finland. Geol. Surv. Finland, Spec. Paper 17, 147–184.
Räsänen, J., Iljina, M., Karinen, T., Lauri, L., Salmirinne, H., Vuollo, J. 2003. Geologic map of the Koillismaa area, northeastern Finland, 1:200 000. Geol. Surv. Finland (inelectronic format, data available at the database of the Geological Survey of Finland, Rovaniemi Unit).
Vaasjoki, M., Taipale, K., Tuokko, I. 1999. Radiometric ages and other isotopic data bearing on the evolution of Archaean crust and ores in the Kuhmo-Suomussalmi area, eastern Finland. In: Kähkönen, Y. and Lindqvist, K. (Eds.). Studies related to the Global Geoscience Trasects/SVEKA Project in Finland. Bull. Geol. Soc. Finland 71(1),155–176.
Vuollo, J. 1994. Paleoproterozoic basic igneous events in eastern Fennoscandian Shield between 2.45 Ga and 1.97 Ga, studied by means of mafic dike swarms and ophiolites in Finland. Acta Univ. Ouluensis, Ser. A 250.

LITOSPHERE 10.- 11.11.2004 Page 75
Middle Proterozoic - Paleozoic tectono-thermal reactivation of the crust in southern Finland and northwestern Russia - paleomagnetic evidences
Satu Mertanen
Geological Survey of Finland, P.O. Box 96, FI-02151 Espoo, Finland Email: [email protected]
Paleomagnetic investigations on shear and fault zones in southern Finland and on 1.8 Ga shoshonitic intrusions and lamprophyric dykes at Lake Ladoga area in nortwestern Russia evidence a partial or total remagnetization of the formations during the emplacement of the ca. 1.64 and 1.54 Ga rapakivi granites. In addition, the shear and fault zones in southern Finland testify repeateded reactivation during the Caledonian orogeny at ca. 420-440 Ma.
Keywords: remagnetization, paleomagnetism, shear zone, rapakivi granite, Proterozoic, Paleozoic, Finland, Russia, Fennoscandian shield
1. Introduction Paleomagnetic studies have been carried out on shear and fault zones of the Svecofennian crust in the Helsinki capital area in southern Finland (Fig. 1). One of the purposes of the paleomagnetic study was to test the ability of remanent magnetizations to discover the relationships between different shear zones and to address timing for their evolution (Pajunen et al., 2002). Based on these investigations, the shear and fault zones have proven to carry multiple remanent magnetizations (Mertanen et al., 2004a,b). The remagnetizations were acquired mainly as a result of fluid flow within the zones of weakness, leading to the formation of new magnetic minerals. The most extensive studied shear zones, the Porkkala-Mäntsälä shear zone, has been especially vulnerable to later reactivation, evidenced by three remanent magnetization components. Two of the components can be related to the emplacement of the Subjotnian, ca. 1.64 Ga Onas and Bodom rapakivi granites. The third remanence component is suggested to originate from a much younger tectonic process during Middle Silurian at ca. 420-440 Ma, when the shear zones were reactevated as a result of the Caledonian orogenic events.
New paleomagnetic results of an ongoing investigation (Eklund, 2003) on 1.8 Ga post-collisional shoshonitic intrusions (Eklund et al., 1998) and coeval lamprophyric dykes at Lake Ladoga area (Fig. 1) also evidence Subjotnian reactivation. In addition to the primary 1.8 Ga remanence, the intrusions and dykes carry partial remagnetizations, which according to the pole positions were acquired at the time of the emplacement of the ca. 1.54 Ga Salmi rapakivi granite. Furthermore, paleomagnetic studies on undated dolerite dykes between the Salmi and Wiborg batholits imply considerable Subjotnian dyke magmatism which, thus forms an additional possible source for remagnetization. The new paleomagnetic results from the shear zones in southern Finland and from the intrusive rocks at Lake Ladoga area will be presented here.
2. Sampling and methods In southern Finland, at the Helsinki area (Fig. 1) samples were taken from altogether 17 shear zones which were chosen according to their mineralogy, location and strike of the shear structure. Nine of the studied sites gave stable paleomagnetic results.
At Lake Ladoga area in Russia (Fig. 1), sampling was carried out on three undeformed ca. 1.8 Ga Svecofennian post-collisional shoshonitic intrusions; Vuoksa, Ojajärvi and

LITOSPHERE 10.- 11.11.2004 Page 76
Elisenvaara and on five lamprophyric dykes and six doleritic dykes further northeast from the intrusions. Two of the lamprophyric dykes give consistent results, although the rest were magnetically too unstable to be used in further investigations. Three of the doleritic dykes yield a consistent, distinctive remanence direction while the remanence directions of the rest of the dolerite dykes form another directional group, and probably represent Postjotnian dyke magmatism. The results of the Postjotnian dykes are not handeled here.
Petrophysical properties; density and magnetic susceptibility, were measured for all specimens before palaeomagnetic measurements. Remanence measurements were made on 2G-Enterprises SQUID magnetometer and on Schoenstedt magnetometer. Demagnetizations were done both by alternating field (AF) up to peak field of 160 mT and thermally up to peak temperature of 680ºC. However, most of the samples from the shear zones could not be thermally demagnetized due to magneto-mineralogical alterations during heating. Magnetic carriers were identified by thermomagnetic analysis, applying stepwise heating up to 700ºC. The acquisition of isothermal remanent magnetization (IRM) was studied in four selected specimens from the shear zones that showed stable remanence directions. One to two polished thin sections were studied from each site.
Figure 1. Geological map (Koistinen et al., 2001) of southeastern Finland and northwestern Russia showing the two study locations. In the Helsinki area the studies were carried out on shear and fault zones and in the Lake Ladoga area, on shoshonitic intrusions and mafic dykes.
3. Results Shear and fault zones of the Helsinki area
Altogether five remanence components were isolated in the shear zones. The characteristic remanent magnetization, component C, was isolated only in the shear zones, but not in the host granites and gneisses. It was isolated both in low and high coercivities upon AF demagnetization. Unblocking temperatures of thermally demagnetized samples suggest that the remanence possibly resides both in titanomaghemite and titanomagnetite. Another commonly observed remanence, component SB1, was isolated in the shear zones in unblocking temperatures below 680ºC, suggesting hematite as the main remanence carrier. The characteristic remanence component, SB2, of the sites within the Porkkala-Mäntsälä

LITOSPHERE 10.- 11.11.2004 Page 77
shear zone, whether taken from the host rocks or the mylonite is extremely stable upon AF demagnetization. Thermal demagnetizations imply titanomaghemite as the main remanence carrier. A fourth remanence component B was sporadically observed in some of the mylonite and gneiss samples. Part of the shear zones and host rocks, despite of beeing in most cases too unstable to yield stable remanence directions, carry a component called A.
In order to obtain timing for the acquisition of magnetizations, the virtual geomagnetic poles (VGP's) of the remanence components were compared with the well-defined, dated Precambrian 'key poles' (Fig.2a) of the Fennoscandian Shield (see Buchan et al., 2000), and with the well-defined Early Ordovician to Permian segment of the Apparent Polar Wander Path (APWP) (Fig. 2b) of the Fennoscandian shield (e.g. Torsvik et al., 1996; Smethurst, et
al., 1998; Torsvik and Rehnström 2001;2003). Based on the obtained ages, following interpretations for the origin of components are suggested.
On the basis of the closeness of pole A to the known 1.88 and 1.84 Ga key poles, the remanence component A was acquired during the Svecofennian orogenic events. Although not fully matching with the known key poles, the remanence probably represents the original Svecofennian magnetization that has preserved in part of the formations.
Poles SB1 and SB2 compare well with the known Subjotnian ca. 1.63 and 1.58 Ga poles, respectively. It is suggested that component SB1 was aquired at ca. 1.63 Ga during the extensional phase at the time of the rapakivi intrusions and related dikes, when chemical or thermo chemical remanent magnetization (CRM/TCRM) was formed due to fluid migration along the faults. In that process new hematite was precipitated. Remanence component SB2 was obtained at three studied sites, all locating within the Porkkala-Mäntsälä shear zone. The pole position suggests an age of ca. 1.58 Ga for component SB2.The age difference of poles SB1 and SB2 may thus imply fluid activity and remagnetization that lasted about 50 Ma. Component SB2 resides mainly in titanomaghemite that is implied to have been formed due to partial oxidation of titanomagnetite. Consequently, components SB1 and SB2, residing in different magnetic minerals were probably precipitated in two hydrothermal fluid flow events during Subjotnian at 1.63 Ga and 1.58 Ga and thus signify different compositions of fluids. On the other hand, pole SB2 fits well to the Phanerozoic APW path, giving an age of 440 Ma. It is therefore suggested that remanence component SB2 may also have been formed in the tectonic events related to the Caledonian orogeny.
The most common remanence component obtained in the shear zones is component C. Based on pole position on the Phanerozoic APW path, component C was acquired during Middle Silurian, at ca. 420 Ma. It is proposed that this remanence was formed due to release of tectonic stress caused by the Caledonian orogeny which resulted to the movement of fluids in the shear zones and fractures. In addition, it is implied that pervasive mild reheating event related to burial after the Caledonian orogeny is partly responsible for the remagnetization.
Pole B represents a magnetization that has been sporadically obtained over the whole Fennoscandan Shield. It does not match with any known Precambrian key poles, but it compares well with the Phanerozoic paleopoles, attesting to a Carboniferous-Permian age of ca. 300-230 Ma. It is implied that it may be related to the late sedimentary processes after the Caledonian orogeny.

LITOSPHERE 10.- 11.11.2004 Page 78
Figure 2. Mean palaeomagnetic poles for components A (triangels), B (circles), C (squares), SB1
(quadrangles), and SB2 (pentagons) from the shear zones. The A95 confidence circles are shown around the mean poles (no A95 values were calculated for the B pole because only two sites). Closed (open) symbols denote normal (reversed) polarity and half opened symbols mixed polarity. a) The crosses with shaded A95 circles denote the ‘key poles’, the ages of which are indicated (see Buchan et al., 2000, Pesonen et al., 2003).b) Fennoscandian APW path (Torsvik, et al., 1996, Smethurst et al., 1998; Torsvik and Rehnström
2001;2003) with relevant ages indicated. Components B, C and SB2 are switched to opposite polarity fom their positions in Fig. (a). c) Poles VK, OJ, EL and ES are from the Vuoksa, Ojajärvi and Elisenvaara shoshonitic intrusions, poles IV and RE from lamprophyric dykes at Lake Ladoga area. d) Poles LA, LB an LC are from doleritic dykes at ake Ladoga area. See text.
Intrusions and dykes of the Lake Ladoga area
The quartz monzonite of the large Vuoksa intrusion (1802+/-17 Ma, U-Pb, zircon, Konopelko and Ivanikov, 1996) has a characteristic SE declination and intermediate negative inclination direction, while the quartz monzonites of the Ojajärvi intrusion (1800-1805 Ma, K-Ar, amphibole, Ivanikov et al. 1996) yields an opposite direction of NW declination and intermediate positive inclination. In both intrusions, few samples show antipodal directions. The remanence resides in titanomagnetite. The calculated pole corresponds to the known 1.88-1.84 Ga key poles (Buchan et al., 2000) of the Fennoscandian Shield (Fig. 2d). The remanence directions of the Elisenvaara intrusion (1.80+/-6 Ma, U-Pb, zircon, D. Konopelko and M. Vaasjoki, 2002, pers.comm.), which is exposed as two pipe-like bodies, differ from the directions of the Vuoksa and Ojajärvi intrusions. One of the studied sites (EL, Fig. 2d), comprising of a variety of shoshonitic rock types, yields SE declinations with steep negative inclinations. By applying a tectonic correction, probably due to local tilting of the site, the remanence becomes aligned with the Vuoksa direction. The other Elisenvaara body (ES, Fig. 2d) of a homogenous syenite yields SW declinations with low inclinations. The calculated pole is in agreement with the 1.54 Ga key pole of the Fennoscandian Shield (Fig. 2d). Hence, this Elisenvaara body was evidently totally remagnetized during Subjotnian. A smilar remanence direction was also observed as a partial overprint in the other Elisenvaara body (EL) as well as in some samples of the Vuoksa and Ojajärvi intrusions (Fig. 2d), implying a pervasive reactivation of the intrusions during Subjotnian.
The two magnetically stable lamprophyric dykes (IV and RE, Fig. 2d) show typical Svecofennian remanence directions (component A) that correspond to the remanence directions obtained in the Ojajärvi and Vuoksa intrusions. In these dykes the remanence shows only normal polarity. The main remanence direction is isolated below the maximum unblocking temperature of ca. 580ºC suggesting that the remanence resides in titanomagnetite. Both lamprophyric dykes carry another remanence component, S, as a

LITOSPHERE 10.- 11.11.2004 Page 79
partial overprint that is isolated by thermal demagnetizations (Fig. 3) in temperatures below 370ºC, suggesting titanomaghemite as the remanence carrier. This direction corresponds to the partial overprint direction obtained in the Vuoksa and Ojajärvi intrusions, and as the characteristic component in the Elisenvaara intrusion. Based on the well-defined pole position of the remanence of dyke IV (Fig. 3), the remanence was acquired during Subjotnian, at ca. 1.54 Ga.
Three of the dioritic dykes at Lake Ladoga area (Fig. 2c) carry their own characteristic remanence direction. The remanence resides in titanomagnetite. The poles compare rather well, although not fully matching with the 1.63 - 1.54 Ga key poles of the Fennoscandian Shield (Fig. 2d). Based on these ages, it is suggested that the dioritic dykes represent dyke magmatism that took place during the time between the emplacement of the Wiborg and Salmi rapakivi batholits. Emplacement of the diorite dykes form a plausible source for the partial remagnetization of the 1.8 Ga old shoshonitic intrusions and lamprophyric dykes.
Figure 3. Thermal demagnetization behaviour of a lamprophyric dyke (IV) from Lake Ladoga area. The occurrence of a lower temperature component S and a higher temperature component A is visible in the steroplot (a), intensity decay curve (b) and Zijderweld plot (c).
4. Conclusions Paleomagnetic studies both in southern Finland and northewestern Russia evidence the vast effect of the Subjotnian magmatism into the adjacent rocks. In both areas, a Subjotnian remanent magnetization was isolated as a partial overprint in rocks that are not in close contact to the rapakivi granites. In southern Finland the shear zones have acted as channels for fluids that probably originated in the process of emplacement of the rapakivi granites, and were able to precipitate new magnetic material. At Lake Ladoga area, the thermal effect of rapakivi granites may have extended to the intermediate areas between the rapakivi batholits, and, in addition, in this area the emplacement of the coeval Subjotnian dykes probably form another source for reactivation. Furthermore, the paleomagnetic results imply that the youngest tectonic event observed in the shear and fault zones of southern Finland is related to the Caledonian orogenic and sedimentary events.
References Buchan, K., Mertanen, S., Elming, S.-Å., Park, R.G., Pesonen, L.J., Bylund, G., and
Abrahamsen, N., 2000. The drift of Laurentia and Baltica in the Proterozoic: a comparison based on key paleomagnetic poles. Tectonophysics 319, 167-198
Eklund, O., 2003. The Ladoga dyke project. Geologi 55 (9-10), 246-249.

LITOSPHERE 10.- 11.11.2004 Page 80
Eklund, O., Konopelko, D. Rutanen, H., Fröjdö, S. and Shebanov, A. D., 1998. 1.8 Ga Svecofennian post-collisional shoshonitic magmatism in the Fennoscandian shield. Lithos 45, 87-108.
Ivanikov, V.V., Konopelko, D.L., Puskarov, Yu.D., Rublov, A.G. and Rungenen, G.I., 1996. Apatite-bearing ultramafic/mafic rocks of NW Ladoga region—Riphean riftorogenic or early Proterozoic postorogenic? Vestnik St. Peterburgskogo Universiteta 28, pp. 76–81 (in Russian)
Koistinen, T., Stephens, M. B., Bogatchev, V., Nordgulen, Ø., Wennerström, M. and Korhonen, J., 2001. Geological map of the Fennoscandian Shield, scale 1:2 000 000. Geological Surveys of Finland, Norway and Sweden and the North-West Department of Natural Resources of Russia.
Konopelko, D.L., Ivanikov, V.V., 1996. Postorogenic intrusion of the NW Ladoga region. In: Haapala, I., Rämö, O.T., Kosunen, P. (Eds.), The Seventh International Symposium on Rapakivi Granites and Related Rocks, Helsinki. Abstract Vol., Helsinki Univ. Press, p. 37.
Mertanen, S., Airo, M.-L., Elminen, T., Niemelä, R., Pajunen, M. Wasenius, P. and Wennerström, M., 2004. Remagnetizations of shear and fault zones in southern Finland; paleomagnetic evidence for Mesoproterozoic - Paleozoic reactivation of the Paleoproterozoic crust. Geological Survey of Finland, Special Paper (submitted).
Mertanen, S., Pajunen, M. and Elminen, T., 2004. Multiple remagnetization events of shear zones in southern Finland. In: S. Mertanen (ed.), Supercontinents, remagnetizations and geomagnetic modelling. Extended Abstracts of the Workshop and Symposium of the 5th Nordic Paleomagnetic Workshop, Suitia – Helsinki, Finland, September 25-30, 2004. Geological Survey of Finland, Espoo, Report Q29.1/2004/1.
Pesonen, L.J., Elming, S.-Å ., Mertanen, S., Pisarevski, S., D´Agrella-Filho, M.S., Meert, J., Schmidt, P.W., Abrahamsen, N., Bylund, G., 2003. Palaeomagnetic configuration of continents during the Proterozoic. Tectonophysics 375, 289-324.
Pajunen, M., Airo, M-L., Elminen, T., Niemelä, R., Salmelainen, J., Vaarma, M, Wasenius, P. ja Wennerström, M., 2002. Kallioperän rakennettavuusmalli taajamiin. Menetelmäkehitys ja ohjeistus. Geologian tutkimuskeskus, Raportti K.21.42/2002/5, 95 s.
Smethurst, M.A., Khramov, A.N., Pisarevsky, S.A., 1998, paleomagnetism of the Lower Ordovician Orthoceras Limestone, St.Petersburg, a revised drift history for Baltica in the early Paleozoic. Geophys. J. Int. 44-56.
Torsvik, T.H., and Rehnström, E.F., 2001. Cambrian paleomagnetic data from Baltica: Implications for true polar wander and Cambrian paleogeography. J. Geological Soc. 158, 321-329.
Torsvik, T.H., and Rehnström, E.F., 2003. The Tornquist Sea and Baltica-Avalonia docking. Tectonophysics 362, 67-82.
Torsvik, T.H., Smethurst, M.A., Meert, J.G., Van der Voo, R., McKerrow, W.S., Brasier, M.D., Sturt, B.A. and Walderhaug, H.J., 1996. Continental break-up and collision in the Neoproterozoic and Paleozoic - A tale of Baltica and Laurentia. Earth-Science Reviews 40, 229-258.

LITOSPHERE 10.- 11.11.2004 Page 81
The Fennoscandian Land Uplift Gravity Lines: Status 2004
J. Mäkinen1, A. Engfeldt2, B.G. Harsson3, H. Ruotsalainen1, G. Strykowski4, T. Oja5
and D. Wolf6
1Finnish Geodetic Institute, Geodeetinrinne 2, FIN-02430 Masala, Finland 2Lantmäteriet, Lantmäterigatan 2, SE-801 82 Gävle, Sweden
3Norwegian Mapping Authority, Kartverksveien 21, N-3507 Hønefoss, Norway 4National Survey and Cadastre, Rentemestervej 8, DK-2400 København NV, Denmark
5Estonian Land Board, Mustamäe tee 51, EE10602 Tallinn, Estonia 6GeoForschungsZentrum Potsdam, Telegrafenberg, D-14473 Potsdam, Germany
Email: [email protected]
The Fennoscandian Land Uplift Gravity Lines consist of four east-west profiles across the Fennoscandian postglacial rebound area, along the approximate latitudes 65º, 63º, 61º, and 56ºN. Repeated relative gravity measurements have been performed 1975–2000 (65ºN), 1966–2003 (63ºN), 1976–1983 (61ºN), and 1977–2003 (56ºN). The line 63ºN has most observations. From the measurements along it up to 1993, Ekman and
Mäkinen (1996) deduced the ratio –0.20 µgal/mm between surface gravity change and uplift relative to the Earth’s center of mass. Since that time, more gravity measurements have been taken. On the eastern part of the line 63ºN, they result in slightly smaller estimates for the rate of gravity. New estimates of uplift and model predictions are also available. The updated gravity change combined with various estimates of uplift gives ratios between –0.16 and –0.20 µgal/mm. On the western part of the line 63ºN an apparently anomalous change in gravity difference requires further study. In the future, the measurements will be performed using absolute gravity techniques.
Keywords: Postglacial rebound, gravity change, Fennoscandia, glacial isostatic adjustment
1. IntroductionThe Fennoscandian Land Uplift Gravity Lines are high-precision relative gravity profiles across the Fennoscandian postglacial rebound (PGR) area (Figure 1). They run east-west, approximately along the latitudes 65º, 63º, 61º, and 56ºN. The concept and methodology were largely developed by the late A. Kiviniemi (1930–2004), who started measurements on the Finnish section of the line 63ºN 1966 (Kiviniemi, 1974). Other sections (Pettersson,
1974) and other lines followed (Table 1). The work has been performed in Nordic cooperation (with guests from institutions around the world) and coordinated through the Nordic Geodetic Commission (http://www.nkg.fi), in particular through its Working Group for Geodynamics. Kiviniemi (1974) and Mäkinen et al. (1986) described the measurement methods. Mäkinen et al. (1986) gave the station descriptions, an account of the computation methods, and a detailed catalogue of results until 1986.
Table 1. Relative gravity campaigns on the Fennoscandian Land Uplift Gravity Lines 1966–2003. FI=Finnish section.
Line Full campaigns Partial campaigns 65ºN 1975, 1980, 1981 1999, 2000 (FI) 63ºN Every 5 years
1966–2003 Every 1–3 years 1966–2003 (FI)
61ºN 1976, 1983 56ºN 1977, 1984, 2003

LITOSPHERE 10.- 11.11.2004 Page 82
When the work started, the general features of the vertical motion associated with the Fennoscandian PGR were already rather well known. The research agenda was to determine g , the rate of change in surface gravity, and compare it with h , the rate of crustal
uplift. The ratio hg / would then allow conclusions on the physics of the uplift (Kiviniemi,
1974).This paper reviews the status of the work in 2004. An expanded version appears
elsewhere (Mäkinen et al., submitted).
Figure 1. The Fennoscandian Land Uplift Gravity Lines. The named stations on the line 63ºN are used in this paper. The isolines show postglacial rebound rates (mm/yr) relative to mean sea level according to Ekman (1996).
2. Uplift and gravity change Two simple geometric images of the uplift process have often been used to construct bounds for hg / (Honkasalo and Kukkamäki, 1964). Assume first that the uplift is due to decompression with no additional mass. Then at a point above the surface of the Earth and fixed relative to its centre of mass gravity is not changing at all. At a point moving with the surface of the Earth, gravity change can be obtained with the free air gradient. This leads to the “free air model” hg / = –0.31 µgal/mm. (1 µgal = 10–8m/s2).
LITOSPHERE 10.- 11.11.2004 Page 83
Suppose, second, there is no decompression, but an inflow of mass in the upper mantle is pushing the crust upwards. Then at a point slightly above the surface of the Earth and fixed relative to its centre of mass, gravity increase can be approximated by the attraction of a Bouguer sheet with the density of the upper mantle (3300 kg/m3). At a point moving with the surface, this leads to hg / = –0.17 µgal/mm, the “Bouguer model”.
This latter figure is close to the relationship (–1 µgal)/(6.5 mm) = –0.15 µgal/mm, obtained numerically by Wahr et al. (1995). They used several models of the glacial isostatic adjustment (GIA), all with Maxwell rheology of the mantle but different viscosity profiles. See also Fang and Hager (2001).
In the discussion above, h refers to the Earth’s centre of mass (“absolute uplift”). GPS observations give absolute uplift rates. Uplift rates from tide gauges refer to the mean sea level (“apparent uplift”), and rates from repeated precise levelling to the geoid. We thus have
NHh (1a)
ea HHH (1b)
HereaH is apparent uplift, H is uplift relative to the geoid, N is the uplift of the geoid,
andeH (neglecting changes in sea surface topography) the eustatic rise in mean sea level.
In this paper we are concerned with uplift differences between stations. From them, eH
is eliminated, i.e. aH differences and H differences are identical. However, H differences
need to be corrected for N to obtain h . Ekman and Mäkinen (1996) estimated (using their observed Hg / ) that N differences are roughly 6% of H differences. The GIA model by Milne et al. (2001) gives approximately the same percentage.
To avoid a clogged notation, we use g , h , H , N to refer both to values at sites and to differences between sites. It will be clear from the context, which one is intended.
3. Previous estimates Ekman and Mäkinen (1996) divided the line 63˚N into two parts (Figure 1): the western part Vågstranda–Kramfors (W), and the eastern part Vaasa–Joensuu (E). Writing symbolically with conventional one-sigma standard errors
mm/yr0.56.9
gal/yr20.052.1)( obshg (W) (2a)
mm/yr0.54.7-
gal/yr14.000.1)( obshg (E) (2b)
With the relevant Student’s t-distributions the ratios correspond to the 95% confidence intervals
086.0220.0)( obsHg µgal/mm (W) (3a)
080.0213.0)( obsHg µgal/mm (E) (3b)
After an iterative calculation of N to obtain NHh , Ekman and Mäkinen (1996)
found the corresponding intervals for hg

LITOSPHERE 10.- 11.11.2004 Page 84
086.0208.0)( obshg µgal/mm (W) (4a)
080.0200.0)( obshg µgal/mm (E) (4b)
The combined 95% confidence interval is
058.0204.0)( obshg µgal/mm (5)
from which they concluded that the free air model is ruled out by the observations. The results (1975–2000) on the Finnish section of the line 65ºN were analyzed by
Ruotsalainen (2002). The estimated hg agrees with (5) but due to the paucity of observations its uncertainty is still rather large,
In the following we summarize new results of the line 63ºN since 1993 and check to which extent they modify the numbers in equations (2)…(5).
4. New gravity results Since 1993, there have been two campaigns on the western part of the line 63ºN, in 1998 and 2003. Their results do not agree with the earlier ones (Figure 2, left). Weighted regression now gives
24.007.1g µgal/yr (W) (6)
where the error estimate is the conventional one-sigma. This is a large change from the previous estimate –1.52 µgal/yr (numerator of equation 2a).
There is no comparable anomaly on the eastern part of the line, with five new campaigns (Figure 2, right). Weighted regression gives
09.091.0g µgal/yr (E) (7)
again with the conventional one-sigma error estimate. This g is slightly smaller than the previous estimate +1.00 µgal/yr (numerator of equation 2b).
We are currently screening the results in more detail to understand the ostensible jump in the time series on the western part.
Figure 2. Results of the relative gravity measurements on the western part (left) and on the eastern part (right) of the line 63ºN. Each point is the unweighted mean of all gravimeters in the particular year. Regression lines are calculated with the number of gravimeters as weights. The solid line uses all data, the dotted line uses data until 1993.

LITOSPHERE 10.- 11.11.2004 Page 85
5. New uplift results and ratios On the eastern part of the line, the value of H in the denominator of equation (2b), i.e.,
5.07.4H mm/yr (8)
results from two Finnish precise levellings, the same that underlie Figure 1. Now H
values from three levellings are available (Mäkinen and Saaranen, 1998). Furthermore, the land uplift stations at Joensuu and Vaasa are within 0.1 km and 2 km, respectively, of continuous GPS stations in the FinnRef® network. For these stations, h values are available both from FinnRef®
(Mäkinen et al., 2003) and BIFROST (Johansson et al., 2002)
processing of five years of GPS observations. We use the winter-edited results (op. cit.)In addition, we employ predicted
aH values from the GIA model by Lambeck et al.
(1998). The main observational constraints for this GIA model are relative sea level histories, although it has been fine-tuned by a fit to the tide gauge rates computed by Ekman
(1996). The GIA model by Milne et al. (2001) uses the same ice history, but the rheology is fitted to 3-D velocities from the BIFROST project (Johansson et al., 2002).
The uplift results and corresponding ratios hg are collected in Table 2. The new estimate of g and most of the new uplift estimates bring the ratio closer to the Bouguer model. On the western part of the line the gravity measurements and the resulting g value
are still under scrutiny. Therefore we have not computed new hg ratios.
Table 2. The ratio hg on the eastern part of the line 63ºN, computed using different values of g
and h or H . The old g is from equation (2b) and the new g from equation (5). The sources of h or
H are described in the text. The H values are marked by an asterisk. They are multiplied by 1.06 to obtain h . The previous estimate of hg is shown in boldface.
Sourceof h or H
h or H *mm/yr
hg
old g
µgal/mm
hg
new g
µgal/mm Two levellings1892–1955
–4.7* –0.21 –0.18
Three levellings1892–2004
–5.5* –0.17 –0.16
Continuous GPS, FinnRef®
–5.7 –0.18 –0.16
Continuous GPS, BIFROST
–4.8 –0.20 –0.18
Lambeck et al.
(1998) GIA model –4.2* –0.22 –0.20
Milne et al.(2001) GIA model
–5.3 –0.19 –0.17
6. Summary and discussion We have used new gravity observations and new uplift results on the eastern part of the 63ºN line to compute new estimates of the ratio between gravity change and vertical motion connected with postglacial rebound. On this part, the previous estimate is –0.21 µgal/mm. The new estimates are –0.16…–0.20 µgal/mm. They are thus closer to the ratio for the

LITOSPHERE 10.- 11.11.2004 Page 86
Bouguer model (–0.17 µgal/mm). On the western part of the line an apparently anomalous gravity change must be further studied before any conclusions can be drawn.
For this kind of study, relative gravity measurements are less accurate and more laborious than absolute measurements. Therefore the time series will be continued with absolute gravimeters. The end points of the 63ºN line, and the Danish section of the 56ºN line have already been equipped with absolute stations. For the other lines, we are studying the possibility of using portable absolute meters directly on the outdoor sites.
Acknowledgments The measurements since 1993 were made (in addition to the authors) by L. Engman, L.-Å. Haller, E. Roland, P. Rouhiainen, H. Skatt, H. Virtanen, and K. Wieczerkowski. H.-G. Scherneck provided predictions from the GIA model by Milne et al. (2001). Digitized isobases of the map by Ekman (1996) were supplied by B.-G. Reit. Instructive discussions with M. Ekman are gratefully acknowledged.
References Ekman, M., 1996. A consistent map of the postglacial uplift of Fennoscandia. Terra Nova
8, 158–165. Ekman, M. and Mäkinen J., 1996. Recent postglacial rebound, gravity change and mantle
flow in Fennoscandia. Geophys. J. Int. 126, 229–234. Fang, M. and Hager, B.H., 2001. Vertical deformation and absolute gravity. Geophys. J.
Int. 146, 539–548. Honkasalo T. and Kukkamäki T.J., 1964: On the use of gravity measurements for
investigation of the land upheaval in Fennoscandia. Fennia 89, 21–24. Johansson, J.M., Davis, J.L., Scherneck, H.-G., Milne, G.A., Vermeer, M., Mitrovica J.X.,
Bennett, R.A., Ekman, M., Elgered, G., Elósegui, P., Koivula, H., Poutanen, M., Rönnäng, B.O., Shapiro, I.I. (2002): Continuous GPS measurements of postglacial adjustment in Fennoscandia, 1. Geodetic results. J. Geophys. Res. 107 (B8), DOI 10.1029/2001JB000400.
Kiviniemi A., 1974. High precision measurements for studying the secular variation in gravity in Finland. Publ. Finn. Geod. Inst. 78, 64 p.
Kakkuri, J., 1997. Postglacial deformation of the Fennoscandian crust. Geophysica 33, 99–109.
Lambeck, K., Smither, C., Ekman, M., 1998. Tests of glacial rebound models for Fennoscandia based on instrumented sea- and lake-level records. Geophys. J. Int. 135, 375–387.
Mäkinen J. and Saaranen V., 1998. Determination of postglacial land uplift from the three precise levellings in Finland. J. Geodesy 72, 516–529.
Mäkinen, J., M. Ekman, Å. Midtsundstad and O. Remmer, 1986. The Fennoscandian land uplift gravity lines 1966–1984. Rep. Finn. Geod. Inst. 85:4, 238 p.
Mäkinen, J., Koivula, H., Poutanen, M., Saaranen, V., 2003. Vertical velocities in Finland from permanent GPS networks and from repeated precise levelling. J. Geodynamics 35, 443–456.
Mäkinen, J., Engfeldt, A., Harsson, B.G., Ruotsalainen, H., Strykowski, G., Oja, T., Wolf, D., submitted. The Fennoscandian Land Uplift Gravity Lines 1966–2003. Paper given at the IAG Symposium “Gravity, Geoid and Space Missions—GGSM2004”, Porto, Portugal, August 30 to September 3, 2004. Submitted to the Proceedings.
LITOSPHERE 10.- 11.11.2004 Page 87
Milne, G.A., Davis, J.L., Mitrovica, J.X., Scherneck, H.-G., Johansson, J.M., Vermeer, M., Koivula, H., 2001. Space-Geodetic Constraints on Glacial Isostatic Adjustment in Fennoscandia. Science 291, 2381–2385.
Pettersson, L., 1975. Studium av sekulär ändring i tyngdkraften utefter latitud 63º mellan Atlanten och Bottenhavet. In: The 7th meeting of the Nordic Geodetic Commission,
Copenhagen, May 6–10, 1974. Referat, Bind I. Danish Geodetic Institute, 103–125. Ruotsalainen, H. (2002): The Fennoscandian land uplift gravity lines—a tool for the Nordic
geodynamical studies. In: M. Poutanen, H. Suurmäki (eds.), Proceedings of the XIV
General Meeting of the Nordic Geodetic Commission, Espoo, Finland, October 1–5, 2002. Finnish Geodetic Institute, 107–110.
Wahr J., Han D., Trupin A., 1995. Predictions of vertical uplift caused by changing polar ice volumes on a viscoelastic earth. Geophys. Res. Lett. 22, 977–980.

LITOSPHERE 10.- 11.11.2004 Page 88
LITOSPHERE 10.- 11.11.2004 Page 89
Oxygen isotope and trace element zoning in garnets from granulite facies psammopelitic migmatite, SW Finland
Annika I. Nyström1, Martin J. Whitehouse2 and Leo M. Kriegsman3
1Dept. of Geology, University of Turku, FIN-20014 Turun Yliopisto, Finland 2Swedish Museum of Natural History, Box 50007, SE-10405 Stockholm, Sweden
3National Museum of Natural History / Naturalis, Leiden, Netherlands Email: [email protected], [email protected], [email protected]
Oxygen isotopes (16O and 18O) and trace elements in profiles over garnet were analysed using a Cameca 1270 ion probe at the NORDSIM facility in Stockholm, Sweden. The garnets are from the mesosome, melanosome and leucosome of a psammopelitic granulite facies sample. Mn shows patterns typical for high-grade garnets which have been retrogressed at rims in melanosome and mesosome whereas the leucosome garnet has a smooth pattern with some lower and some higher concentrations ca 2-3 mm inside the rim. Decreased Ti, Y and REE at rims of melanosome and mesosome garnets can be coupled with retrogression of garnet and growth of biotite and accessory phases. 18O (SMOW) show variations of up to 7 per mil (2 ~0.5 to 1.4 ‰) between different regions of the garnets. The patterns are different from what would be expected during garnet growth in a closed system during increasing temperature.
Keywords: oxygen isotopes, trace elements, garnet, psammopelitic migmatite
1. Introduction Both major and trace element zoning patterns in garnets may be excellent tools in solving the metamorphic history of a sample; e.g. Mn can be used to confirm retrogression at rims of garnet (e.g. Spear 1993) and Y and REE zoning can be coupled with accessory phases (Pyle & Spear 1999; Rubatto 2002; Nyström & Kriegsman 2003; Whitehouse & Platt
2003). Garnet oxygen isotope zoning patterns can potentially be used as well, but are dependent on bulk rock composition, on the presence or absence of fluids and on thereaction and PT history (Kohn 1993). We analysed Mn, oxygen isotopes and trace elements on garnets situated in the mesosome, melanosome and leucosome of the same psammopelitic, stromatic migmatite sample from the Turku granulite facies area in SW Finland in order to study the behaviour of O-isotopes during partial melting and back reaction. The garnets have grown during near isobaric heating from ca. 700-800°C at 6-7 kbar (Johannes et al., 2003).
2. Mineralogy and textures Thin sections of the same sample (but containing different garnet grains than the ones analysed by SIMS) show that the mesosome and melanosome commonly contain cordierite with inclusions of sillimanite whereas sillimanite is not found in garnets. Instead, the garnet commonly encloses biotite and locally cordierite, quartz, plagioclase (uncommon), opaques, monazite and zircon. The textures are interpreted as growth of cordierite followed by garnet production by Crd + Bt + Qtz ( Pl Kfs) = Grt + L and Bt + Qtz + Pl = Grt + L (or Kfs + H2O). In one case inclusions of cordierite and cordierite rimming garnet in melanosome showed the same extinction angle indicating that locally cordierite and garnet have grown together. Leucosome garnets contain mainly inclusions of lobate quartz, but also some biotite can be found in the innermost regions. It is possible that part of the leucosome garnet has crystallized from melt.
Garnet in especially meso- and melanosome may be rimmed by cordierite alone but more commonly biotite, quartz and plagioclase are also present. In places biotite +

LITOSPHERE 10.- 11.11.2004 Page 90
plagioclase quartz rim garnet without cordierite. These textures suggest a reversal of above reactions on the retrograde path. Small sillimanite needles ( biotite and quartz) at some garnet-cordierite interfaces may have formed via: Crd + Grt + L = Sil + Bt + Qtz (+ Pl). Leucosome garnet is commonly surrounded only by quartz and feldspars but in places also by biotite + quartz feldspars, indicating local retrogression.
3. Analytical methods Slabs of garnet were cut and mounted in epoxy. In situ analyses of oxygen isotopes and trace elements were performed in spots along the slabs using a Cameca IMS1270 large geometry ion probe at the NORDSIM facility in Stockholm, Sweden. The oxygen isotopes (16O and 18O) were analysed using a Cs+ primary beam with a spatial resolution of 15 µm, electron beam charge-compensation, and double Faraday cup collection. External reproducibility of the UWG-2 garnet (Valley et al., 1995) varied between 0.5 and 1 per mil (2 ) for the different analytical sessions.
Mn and REE, Y, Sr, Th and Ti were analysed in the same spots as the oxygen isotopes using a 30 m O2
- primary beam and a hybrid mono/multicollection electron multiplier detection protocol (Whitehouse, 2004). We used NIST 610 (Pearce et al. 1996) as an internal standard. A value of 36.82 wt % SiO2 in the garnets was used for calculations (average garnet SiO2 content in the same sample). Detection limits for most elements are <10 ppb. Analytical errors range from ca. ±50% RSD for the lowest concentration elements such as La (ca. 10 ppb) to <2% RSD for higher concentration elements such as Y and Sr (ca. 100 ppm).
4. Analytical results Some chemical patterns over mesosome, melanosome and leucosome garnets are presented in Fig. 1. Garnet core regions have relatively flat Mn patterns whereas the contents increase at rims in melanosome and mesosome garnets. In the leucosome garnet shows a low Mn content ca 2 mm from one rim, whereas this rim has similar contents as the core. At ca 1.5 mm from the other rim Mn is slightly increased but drops again towards the rim. Core regions of leucosome and melanosome garnet have higher Mn concentrations (ca 10000-12000 ppm) than mesosome garnet (ca 7000 – 8000 ppm). The patterns of Sr more or less follow manganese and correlation coefficients between Mn and Sr within the garnets are 0.58-0.67. Mesosome and melanosome garnets show a decrease in REE and Ti contents in rim regions where Mn and Sr increase. In core regions of mesosome garnet HREE first decrease, then increase before the decrease towards rims. In the melanosome garnet HREE increases away from core before decreasing at rims. In the leucosome garnet Ti rather increases at rims whereas REE are fairly constant at one rim and show lower values at the other. Average HREE contents are highest in the leucosome garnet. It also shows an increase in HREE away from core regions.
The location of garnet cores was interpreted on the basis of inclusion patterns in mesosome and melanosome garnets and based on geometry in leucosome garnet. These spots coincide with increased 18O (SMOW): mesosome 12.09 ‰ 0.92 (2 ), melanosome 11.47 ‰ 1.03 (2 ) and leuco (average of two spots) 12.79 ‰ ( 0.54 & 0.65 (2 )) which start to decreases away from core regions. The mesosome garnet shows humps with increased 18O ca 2-3 mm from both rims before reaching a ca 7 per mil ‰ level at rims. In the melanosome 18O first drops by ca 1 per mil on one side, then is constant until it increases close to the rim where it reaches the core level. Towards the other rim the values drop by ca 2 per mil. The variations are small compared to errors and the oxygen isotope pattern may be interpreted as flat in the melanosome garnet. In the leucosome garnet the

LITOSPHERE 10.- 11.11.2004 Page 91
18O first decreases towards rims but 2-4 mm from the rims there are humps with higher values which then decrease again reaching ca 6.4 ‰ close to one rim. At the outermost rims the value jumps to over 13 ‰. At the other rim 18O reaches ca 9 ‰. In the mesosome garnet one spot was negative and had extreme errors and is excluded from the results. Also in the leucosome garnet one spot was negative but with an error similar as in other analyses. It deviates so much from other results that it is excluded. Negative 18O may be produced in minerals by interaction with meteoric water (Elsenheimer & Valley, 1993) and possibly the analysis hit a crack.
Figure 1. Chemical zoning patterns in garnet from mesosome (left column), melanosome (centre) and leucosome (right column) of a psammopelitic stromatic migmatite sample in Turku, SW Finland.
5. Discussion Flat Mn trends in core regions of garnets is consistent with equilibration of Mn at high metamorphic grade whereas the increasing Mn at rims in melanosome and mesosome garnet is in accordance with the retrogressed appearance (Spear 1993). Decreased REE in the same areas where Mn increases at rims of melanosome and mesosome garnet can be

LITOSPHERE 10.- 11.11.2004 Page 92
interpreted by the growth of accessory phases during restite -melt back reaction between garnet and melt which is in accordance with results by Frasier et al., 1997; Degeling et al.,
2001, Pyle & Spear, 1999 and Nyström and Kriegsman, 2003. The decrease of Ti at rims of melanosome and mesosome garnets may indicate transfer of Ti to biotite growing on the retrograde path whereas the increased (or unmodified) Ti at rims of in leucosome garnet is in accordance with a lack of biotite growth and with a partition coefficient larger for garnet than felsic melt (compilation in Rollinson 1993) which suggests that rims of leucosome garnet may have crystallized from melt. It is surprising that Sr follows the pattern of Mn in all analysed garnets as feldspars are common products of restite – melt back reaction and garnet has a low partition coefficient for Sr (<1) in felsic melt compared to feldspars (compilation in Rollinson, 1993). Bea et al. (1994) noticed that compared to leucosome veins K-feldspar has low Sr contents whereas plagioclase has higher which may indicate lack of retrograde plagioclase production at rims of the analysed garnets.
Generally 18O patterns start with a decrease away from interpreted core regions of garnets, opposite to what would be expected during prograde garnet growth by dehydration reactions in a closed system (Kohn et al., 1993). Decreasing trends in a closed system can occur in garnets growing during cooling (Kohn & Valley, 1993). However, the changes in our samples appear too large for cooling in a closed system and textures indicate early garnet growth during increasing temperatures. The Tc, Dodson closure temperature for garnet is ca 800 ºC (Kohn & Valley, 1998), very close to peak metamorphic temperatures (Väisänen & Hölttä, 1999). The diffusion rate for oxygen in garnet is however slow (Kohn
& Valley, 1998) and growth zoning is not likely to have been largely altered between peak and the closure temperature if it was exceeded. Oxygen isotope ratios measured by SIMS may be affected by an instrumental mass fractionation which partly depends on the mineral composition. This matrix effect can be minimized by using a standard with a composition close to the analysed sample (Vielzeuf et al., 2003). Since we used a garnet standard with a composition fairly close to the analysed garnets and variations in 18O are not believed to be caused by the matrix effect. Large variations with decreasing 18O may be interpreted in terms of interaction with a low 18O fluid during garnet growth and / or recrystallization (Chamberlain & Conrad, 1993; Elsenheimer & Valley, 1993; Hoffbauer et al., 1994;
Crowe et al., 2001) and according to Farquhar et al. (1996) open system interactions may occur at any stage of metamorphism. Farquhar et al. (1996) studied a ca 900ºC granulite facies terrain and concluded that O-isotopes were changed in most minerals during high temperature open system processes, not however in garnet.
External fluids would not generally be expected in granulite facies areas as dehydrating areas below would be expected already to be dyhydrated due to higher temperature. We prefer to consider the possibilities that 1) local original variations in source composition may be large and that dehydration melting of various layers in the psammopelitic rocks has produced fluids with variable O-isotopic composition which have circulated on local scale and enhanced zoning in garnets; 2) at high metamorphic grades the presence of melt changes the distribution of oxygen isotopes between garnet and the melt compared to lower grades where dehydration has produced mainly vapour and 3) the composition of existing fluid (more CO2 rich) may affect the O-isotope distribution. It cannot be excluded that restite – melt back reaction (with dissolved fluid released from last crystallizing melt) may have some effect on O-isotope distribution and also it must be considered that the migmatites occur together with S-type granites all of which are not in situ and which could have affected the oxygen isotopes by releasing fluids during crystallization.
Jumps in the trends of 18O suggest that the garnets may consist of aggregates and have not uniformly grown from one centre. As the Mn pattern within garnets is generally flat

LITOSPHERE 10.- 11.11.2004 Page 93
indicating equilibration at high grade these jumps may also indicate the slow diffusion of oxygen isotopes suggesting that decreasing 18O from core is a true prograde feature. Local compositions deviating from the general trends may also be due to small inclusions.
References Bea, F., Pereira, M.D. and Stroh, A., 1994. Mineral/leucosome trace-element partitioning in
a peraluminous migmatite (a laser ablation-ICP-MS study). Chemical Geology, 117, 291-312
Chamberlain, C.P. & Conrad, M.E., 1993. Oxygen-isotope zoning in garnet: A record of volatile transport. Geochimica et Cosmochimica Acta, 57, 2613-2629.
Crowe, D.E., Riciputi, L.R., Bezenek, S. & Ignatiev, A., 2001. Oxygen isotope and trace element zoning in hydrothermal garnets; windows into large-scale fluid-flow behaviour. Geology (Boulder), 29, (6), 479-482.
Degeling, H., Eggins, S. & Ellis, D.J., 2001. Zr budget for metamorphic reactions, and the formation of zircon from garnet breakdown. Mineralogical Magazine, 65, 749-758.
Elsenheimer, D. & Valley, J.W., 1993. Submillimeter scale zonation of 18O in quartz and feldspar, Isle of Skye, Scotland. Geochimica et Cosmochimica Acta, 57, 3669-3676.
Farquhar, J., Rumble, D and Pattison, D.R.M., 1996. Oxygen isotope evidence for high-temperature open system interactions in the granulite facies Minto province, northern Quebec, Canada. Abstracts with Programs, Geological Society of America 28, 7, 229.
Fraser, G., Ellis, D. & Eggins, S., 1997. Zirconium abundance in granulite-facies minerals, with implications for zircon geochronology in high grade rocks. Geology, 25, 607-610
Hoffbauer, R., Hoernes, S. and Fiorentini, E., 1994. Oxygen isotope thermometry based on a refined increment method and its application to granulite-grade rocks from Sri Lanka. Precambrian Research, 66, 199-220.
Johannes, W., Ehlers, C., Kriegsman, L.M. and Mengel, K., 2003. The link between migmatites and S-type granites in the Turku area, southern Finland. Lithos, 68, 69-90.
Kohn, M.J., 1993. Modeling of prograde mineral 18O changes in metamorphic systems. Contributions to Mineralogy and Petrology, 113, 249-261.
Kohn, M.J. & Valley, J.W., 1993. High-T fluids in the Fall Mountain nappe, southwestern New Hampshire: Infiltration vs. anatexis. (abs.) Eos, 74, 332.
Kohn, M.J. & Valley, J.W., 1998. Obtaining equilibrium oxygen isotope fractionations from rocks: theory and examples. Contributions to Mineralogy and Petrology, 132,209-224.
Kohn, M.J., Valley, J.W., Elsenheimer, D., and Spicuzza, M.J., 1993. O isotope zoning in garnet and staurolite: Evidence for closed-system mineral growth during regional metamorphism. America Mineralogist, 78, 988-1001.
Nyström, A.I. & Kriegsman, L.M., 2003. Prograde and retrograde reactions, garnet zoning patterns, and accessory phase behaviour in SW Finland migmatites, with implications for geochronology. In: Vance, D., Müller, W. and Villa, I.M. (eds.), Geochronology: linking the isotopic record with Petrology and Textures. Geological Society of London,
Special publications, 220, 213-230. Pearce, N.J.G., Perkins, W.T., Westgate, J.A., Gorton, M.P., Neal, C.R. and Chenery, S.P.,
1996. A compilation of new and published major and trace element data for NIST SRM 610 and NIST SRM 612 glass reference materials. Geostandard Newsletters, 21, 115-144.
Pyle, J.M. & Spear, F.S., 1999. Yttrium zoning in garnet; coupling of major and accessory phases during metamorphic reactions. Geological Materials Research, 1 (6), 1-49.

LITOSPHERE 10.- 11.11.2004 Page 94
Rollinson, H., 1993. Using Geochemical Data: Evaluation, Presentation, Interpretation. Longman Scientific & Technical, Essex, England, 352 pp.
Rubatto, D., 2002. Zircon trace element geochemistry: partitioning with garnet and the link between U-Pb ages and metamorphism. Chemical Geology, 184, 123-138.
Spear, F.S., 1993. Metamorphic Phase Equilibria and Pressure-Temperature-Time Paths. Mineralogical Society of America, Monograph, 799 pp.
Väisänen, M. & Hölttä, P., 1999. Structural and metamorphic evolution of the Turku mimatite complex, southwestern Finland. Bulletin of the Geological Society of Finland,
71, 177-218. Valley, J.W., Kitchen, N., Kohn, M.J., Niendorf, R. and Spicuzza, M.J., 1995. UWG-2, a
garnet standard for oxygen isotope ratios: Strategies for high precision and accuracy with laser heating. Geochimica et Cosmochimica Acta, 59, 5223-5231.
Vielzeuf, D., Champenois, M., Valley, J.W. & Brunet, F., 2003. SIMS analyses of oxygen isotopes: matrix effects in Fe-Mg-Ca garnets. Geophysical Research Abstracts, 5, 10926.
Whitehouse, M.J., 2004. Multi-collector SIMS analysis of trace lanthanides in zircon (ZrSiO4). Geostandards and Geoanalytical Research, 28, 195-201.
Whitehouse, M.J. & Platt, J.P., 2003. Dating high-grade metamorphism-constraints from rare-earth elements in zircon and garnet. Contributions to Mineralogy and Petrology,145, 61-74.

LITOSPHERE 10.- 11.11.2004 Page 95
Exploration of the Deep Subterranean Biosphere
Karsten Pedersen
Department of Cell and Molecular Biology, Section Microbiology Göteborg University, Box 462; SE-405 30 Göteborg,
Email: [email protected]
The exploration of deep subteranean microbial life began about 20 years ago and it has revealed an earlier unknown, vast deep biosphere [1]. Rough estimates argue that about half of planet Earth’s living biomass is out of sight, dwelling below the ground surface and under the sea floor [7]. The numbers for sub-continental life has a high uncertainty and need more exploration to become accurate. The deepest subsurface location at which life can be found correlates with the maximum temperature for life (about 120 °C) and varies from a couple of meters to at least 10 km, depending on the place explored [2]. Oxygen is virtually absent just below the groundwater table, and the electrochemical potential (Eh)rapidly drops to negative values with depth. To be able to reach the intra-terrestrials we must make a hole (or a tunnel). The preferred way of scientific drilling is to use core drilling. Contamination is a threat to all microbiological sampling and it is particularly complicated to control contamination when investigating the microbiology of deep subterranean environments. It must be clarified that the organisms isolated or otherwise detected were present in the sample before drilling. Therefore, the possible contamination of sediment samples with organisms from the drill water is usually controlled by addition of dissolved and particulate tracers [e.g. 5, 6]. Once the cores have been retrieved they can be analysed for mineralogy and microbiology [3]. The hole in the ground can later be explored in several different ways. Typically, you pack off the water conducting fracture or aquifer that you are interested in. One simple way is to pump water though tubings, but with 1000 m boreholes it takes time and much happens on the way, including a pressure drop and changes in temperature. A second option is to lower samplers and open them at sampling depth. Then, the pressure will be kept at in situ level. This is the preferred option for microbiology. Finally you may need consider to bring an advanced field laboratory to the site, as samples for microbiology deteriorate quickly.
There are two main routs to explore the biogeochemistry of the subterranean biosphere. One is to sample and analyse microbial diversity, activity and distribution of active microbial life [3]. The other main rout is to analyse traces of this biosphere. We can analyse various biosignatures such as anomalies in stable the isotope composition or presence of organic molecules typical for life. A very obvious proof for subterranean life is the detection of fossils [4], provided it can be argued that the organisms of origin for the fossil were active in the explored subterranean environment.
Numbers and diversity of intra-terrestrial microbes are high, but some microbial groups, such as strict aerobes, pathogens and photosynthetic organisms are lacking for obvious reasons. The metabolic activity of deep dwelling microbes is often found to be very slow. The availability of energy and nutrients is more often than not diffusion limited in deep environments. Therefore, many intra-terrestrials are driving in one of the slowest metabolic lanes known. Who needs to rush when the circumstances during the next millennium will be almost identical to the one that just passed by? Patience and slowness are characteristics that will win over abilities to grow fast and act quickly. Such endurance

LITOSPHERE 10.- 11.11.2004 Page 96
qualities likely dominated among the first organisms on our planet. Those might have originated deep underground in a non-competitive environment.
References
1. Pedersen K (1993) The deep subterranean biosphere. Earth-Science Reviews 34:243-260
2. Pedersen K (2000) Exploration of deep intraterrestrial life - current perspectives. FEMS Microbiol Lett 185:9-16
3. Pedersen K (2001) Diversity and activity of microorganisms in deep igneous rock aquifers of the Fennoscandian Shield. In: Fredrickson JK, Fletcher M (eds) Subsurface microbiology and biogeochemistry. New York: Wiley-Liss Inc., pp 97-139
4. Pedersen K, Ekendahl S, Tullborg E-L, Furnes H, Thorseth I-G, Tumyr O (1997) Evidence of ancient life at 207 m depth in a granitic aquifer. Geology 25:827-830
5. Russell BF, Phelps TJ, Griffin WT, Sargent KA (1992) Procedures for sampling deep subsurface microbial communities in unconsolidated sediments. Ground Water Monitoring Review 12:96-104
6. Smith DC, Spivack AJ, Fisk MR, Haveman SA, Staudigel H, and ODP L1SSP (2000) Tracer-based estimates of drilling-induced microbial contamination of deep sea crust. Geomicrobiology Journal 17:207-219
7. Whitman WB, Coleman DC, Wiebe WJ (1998) Prokaryotes: The unseen majority. Proc Natl Acad Sci U S A 95:6578-6583

LITOSPHERE 10.- 11.11.2004 Page 97
Isotopic constraints for the origin of the mafic lower crust at the Karelian craton margin
Petri Peltonen, Irmeli Mänttäri and Hannu Huhma
Geological Survey of Finland, P.O. Box 96, FIN-02151, Espoo, Finland Email: [email protected]
Lower crustal xenoliths recovered from the c.600 Ma old Kaavi-Kuopio kimberlites, eastern Finland, provide us direct access to the chemical composition, physical state and age of the craton margin lower crust. We provide new ion probe U-Pb zircon dates, and Nd, Sr and Pb isotope analyses for mafic granulite xenoliths, which imply that the Karelian craton lower crust is hybrid in composition. It still contains remnants of Early Archean 3.5 Ga old granulites, which became mixed with younger underplating magmas during the Svecofennian–Archean collision, and later recrystallised by transient post-orogenic heating. Wider implications for the origin of Early Archean tectosphere will also be discussed.
Keywords: lower crust, xenoliths, kimberlite, zircon, Nd-Sr, Archean, Proterozoic, Karelia, craton
1. Introduction The lower crust of Archean cratons remains a poorly characterised realm. Although exposed Archean granulites are relatively common, it is not always evident whether they represent lower continental crust or granulites formed at transient high pressure-temperature conditions during continent–continent collisions (Rudnick, 1992). Therefore, xenolith suites which show clear evidence for derivation from the present lower crust of Archean cratons provide invaluable sight into the origin of the first emergent continents on Earth. Such xenoliths may bear fundamental information on the growth mechanism of the Archean crust, allow more accurate estimates of its total volume to be made, and may constrain the origin of the underlying mantle root and indicate whether it has remained coupled with the crust through the multi-phase geological history of the Archean craton.
2. ResultsTwenty-two lower crustal xenoliths, mainly representing mafic garnet granulites, from the Kaavi–Kuopio kimberlites, have been studied in detail. Mineral thermometry (Hölttä et al.,
2000), together with isotopic and general petrological constraints imply that this sample suite is derived from the geophysically-determined, dense, high-velocity layer at the base of the crust (45–60 km deep). Single grain zircon U-Pb dates and Nd model ages (TDM) both imply that this is hybrid layer consisting of both Archean and Proterozoic mafic granulites. Crystallisation ages of up to ~ 3.5 Ga equal to the oldest upper crustal ages (Mutanen and
Huhma, 2003), rendering it possible that thick continental crust existed in the Early Archean. Recrystallisation or dissolution-precipitation reactions of Archean zircons led to Proterozoic zircon dates that coincide with major events of basic magmatism within the craton. Most important post-Archean lower crustal growth took place due to ~ 1.9 Ga accretion of the Svecofennian arc complex to the craton margin when underplating basaltic magmas became mingled with Archean mafic lower crust. Later, at post-orogenic times ~ 1.80 Ga, lower crust became transiently heated, probably by magmas ponded at uppermost lithospheric mantle. Overall, Karelian lower crust records geological evolution of the craton through an epoch of over 3 billion years, implying that upper and lower crust have remained coupled since their origin in the Early Archean. Finally, our results are a new

LITOSPHERE 10.- 11.11.2004 Page 98
piece in the emerging data from several continents that emphasises the global importance of the 3.5 Ga episode. We suggest, that it represents a superplume event – more widespread than previously recognised (Condie, 2001) – when a significant fraction of Early Archean continental crust was formed.
Figure 1. (A) Generalised geological map of the Fennoscandian Shield showing the location of the garnet granulite-bearing kimberlites, and the oldest known upper crust locality at Siurua. Shaded are is Archean granite-greenstone terrain and white is post-Archean, mainly Svecofennian rocks. Other abbreviations: Global Geoscience Transect -line (GGT); Iisalmi block (I), Pudasjärvi block (P), and Eastern Finland complex (E). (B) Cross-section along the GGT-profile (modified from Korsman et
al., 1999 and Lehtonen et al., 2004). Note that only upper half of the lithospheric mantle is shown, its total thickness exceeding 240 km at this locality (Kukkonen & Peltonen, 1999).

LITOSPHERE 10.- 11.11.2004 Page 99
Figure 2. Examples of lower crustal xenoliths that have yielded Early Archean isotopic ages: (A) Mafic granulite xenolith L87, that has yielded U-Pb single grain zircon ages of > 3.5 Ga. (B) Two-pyroxene gneiss xenolith L104 that yielded neodymium model age T(DM) of ~ 3.7 Ga.
References Condie, K.C., 2001. Mantle plumes and their record in earth history. Cambridge University
Press, 366 pp. Hölttä, P., Huhma, H., Mänttäri, I., Peltonen, P. and Juhanoja, J., 2000. Petrology and
geochemistry of mafic granulite xenoliths from the Lahtojoki kimberlite pipe, eastern Finland. Lithos 51, 109–133.
Korsman, K., Korja, T., Pajunen, M., Virransalo, P. and GGT/SVEKA Working Group, 1999, The GGT/SVEKA Transect: Structure and evolution of the continental crust in the Palaeoproterozoic Svecofennian orogen in Finland. Int. Geol. Rev. 41, 287–333.
Kukkonen, I.T. and Peltonen, P., 1999. Xenolith-controlled geotherm for the central Fennoscandian Shield: Implications for lithosphere-asthenosphere relations. Tectonophysics 304, 301–315.
LITOSPHERE 10.- 11.11.2004 Page 100
Lehtonen, M., O´Brien, H.E., Peltonen, P., Johanson, B.S. and Pakkanen, L.K., 2004. Layered mantle at the Karelian Craton margin: P–T of mantle xenocrysts and xenoliths from the Kaavi–Kuopio kimberlites, Finland. Lithos 77, 593–608.
Mutanen, T. and Huhma, H., 2003. The 3.5 Ga Siurua trondhjemite gneiss in the Archean Pudasjärvi Granulite Belt, northern Finland. Bull. Geol. Soc. Finland 75, 51–68.
Rudnick, R.L., 1992. Xenoliths – samples of lower continental crust. In: Fountain, D.M. et al. (Eds.), The Continental Lower Crust, Developments in Geotectonics, vol. 23, Elsevier, Amsterdam, pp. 269–316.

LITOSPHERE 10.- 11.11.2004 Page 101
3-D geophysical crustal model of Finland
Markku Pirttijärvi1,3, Elena Kozlovskaya2, Seppo Elo1, Sven-Erik Hjelt3
and Jukka Yliniemi2
1Geological Survey of Finland, P.O. Box 96, FIN-02151, espoo, Finland 2Sodankylä geophysical observatory/Oulu Unit, POB 3000, FIN-90014, University of Oulu, Finland
3Department of Geophysics, Institute of Geosciences, POB 3000, FIN-90014, University of Oulu, Finland Email: markku.pirttijä[email protected], [email protected]
The 3DCM project aims to construct a 3D geophysical model of the crust beneath southern and central Finland using joint interpretation of seismic and potential field data. The project is carried out by the Department of Geosciences of University of Oulu and the Geological Survey of Finland (GSF). The main results of the 3DCM project are regional 3D P- and S-wave seismic velocity models and a regional 3D density model of the crust of southern and central Finland. In addition, new interactive software for large-scale (regional scale) 3D problems of joint interpretation of seismic and potential field data has been developed.
Keywords: Fennoscandian Shield, crust, lithosphere, joint inversion
1. On-going research: 3DCM project The research project "Three-dimensional crustal model of the Finnish part of the
SVEKALAPKO research area" (3DCM) is a joint venture between the scientists of the University of Oulu and the Geological Survey of Finland (GSF) who have worked in the SVEKALAPKO project and the Crustal Model Program.
The main objective of the 3DCM project is to construct a 3-D geophysical model of the crust beneath the SVEKALAPKO research area in the southern and central Finland. The model is based on the joint use of the seismic body wave data of local events registered during the SVEKALAPKO deep seismic tomography (SST) experiment, the potential field data (gravity and magnetic), digital geological maps, and the petrophysical database of the Geological Survey of Finland.
The model is required to improve inversion of SST and FIRE (Finnish Reflection Experiment) data and will advance the understanding of the tectono-geologic develop-ment of the Finnish bedrock.
2. The main results of the 3DCM project At the moment, a regional 3-D density model of the SVEKALAPKO area has been created using joint interpretation of gravity data and existing seismic P-wave velocity model (Kozlovskaya et al, 2004a). The model comprises a volume of 1024 x830 x 72 km3 and has been calculated on a 2 x 2 x 2 km3 regular grid.
The 3-D P-wave and S-wave seismic velocity models of the crust of the SVEKALAPKO area were obtained from interpretation of the SVEKALAPKO local events data (Yliniemi et al., 2004, Kozlovskaya et al., 2004b). The models demonstrate the difference between the velocity structure of the Archaean and Proterozoic domains in the study area and good correlation of lateral velocity variations with major geological structures. In addition, the interpretation of local event data revealed several new details of the Moho boundary in the area and two groups of upper mantle reflectors beneath southern and central Finland at a depth of 70-90 km and 100-130 km (Yliniemi et al., 2004).

LITOSPHERE 10.- 11.11.2004 Page 102
3. Software development Compilation of the comprehensive large-scale 3-D geophysical crustal model demonstrated that existing techniques for 2-D and 3-D data processing (i.e. conventional filtration, gridding, interpolation etc.) are not sufficient in the case when the data are produced by various geophysical methods with different space resolution. The 3-D gravity modelling with the use of the existing petrophysical maps demonstrated that conventional interpolation of irregularly spaced data produces artefacts, which can result in misleading interpretations (Kozlovskaya et al. 2004a).
Therefore new gridding method and corresponding software (Petrock) has been developed to create improved maps of physical properties of bedrock of Finland from irregularly sampled data (bulk density and magnetic properties). The new interpolation method employed in the Petrock program uses the digital geological maps of Finland to provide additional weight to the interpolated and extrapolated values (Pirttijärvi, 2004a).
In addition, new interactive software for large-scale (regional scale) problems of joint interpretation of seismic and potential field data has been developed. The programs use parameterisation of 3-D distributions of geophysical parameters (seismic velocity, density, magnetisation etc.) by rectangular blocks (Pirttijärvi, 2003a,b,2004a,b,c). The Bloxer program (Fig. 1) allows interactive visualisation and handling of multi-parametric 3-D models. It contains many advanced features such as: editing of the parameter value and the size of the blocks, import and export of 3 D parametric data, dynamic memory allocation, and binary model files. The Grablox and Magblox programs are used for the forward modelling and inversion of gravity and magnetic field data with 3-D block models. Their inversion algorithm is based on the new linearised inversion method described in the PhD thesis of Pirttijärvi (2003c). The number of blocks used in the models is only restricted by the available computer memory. Moreover, in magnetic field modelling the inherent variation of Earth's external magnetic field can be taken into account. All programs are written in Fortran90 language for the MS Windows operating system. The visualisation and the user interface are based on DISLIN graphics library that allows the programs to be compiled and run also on Linux and Unix systems.
4. Further studies: enhanced 3-D geophysical crustal model of Finland Further development of the crustal seismic model within the 3DCM project will be based on teleseismic receiver functions study (in collaboration with the Institute of Physics of the Earth of the Russian Academy of Sciences). The existing regional 3-D density model of the crust will be improved with the use of new map of the bedrock density of Finland and the data of FIRE seismic experiment (profiles FIRE1, FIRE2 and FIRE3). The model will be extended to the north using the new map of the bedrock density of Finland, the data of FIRE4 seismic reflection profile and results of previous seismic studies in northern Finland.
The mutual interaction of the 3DCM project with the Finnish Reflection Experiment (FIRE) experiment will improve the existing 3-D crustal model (in particularly, its uppermost part) and through the joint interpretation of the data of the FIRE project and potential fields will provide improved models in some key areas (for example, the areas of known ore deposits in Finland. Such interpretation will make it possible to investigate connection between reflectivity patterns produced by seismic reflection experiments and other physical properties (density and magnetisation), which is not completely understood in Finnish bedrock conditions.

LITOSPHERE 10.- 11.11.2004 Page 103
Figure 1. Screendump of the BLOXER program illustrating the graphical user interface and details of a vertical cross-section of the 3-D density model model (Kozlovskaya et al., 2004). The graphical user interface and the visualisation are based on DISLIN graphics library.
References Kozlovskaya, E., Elo, S., Hjelt, S.-E., Yliniemi, J., Pirttijärvi, M., SVEKALAPKO Seismic
Tomography Working Group, 2004a. 3-D density model of the crust of southern and central Finland obtained from joint interpretation of SVEKALAPKO crustal P-wave velocity model and gravity data. Geoph. J. Int., 158, 827-848.
Kozlovskaya, E., S.-E. Hjelt, J. Yliniemi, A. Ushakov, S. Elo, M. Pirttijärvi and SVEKALAPKO Seismic Tomography Working Group. 2004b. 3-D inversion of P-and S-wave arrivals from local events recorded during the SVEKALAPKO deep seismic experiment. 1st EGU General Assembly, Nice, France, 25-31 April, 2004, Geophysical Research Abstracts, EGU04-A-03485.
Pirttijärvi, M., 2003a: MIF2BNA - Conversion of polygon data of Mapinfo MIF/MID files into LIT file format. Version 1.0, pp. 7.
Pirttijärvi, M., 2003b: MAGBLOX - Magnetic field interpretation and modelling software based on 3 D block model. Version 1.2, pp. 16.
Pirttijärvi, M. 2003c. Numerical modeling and inversion of geophysical electromagnetic measurements using a thin plate model. Acta Univ. Oul., A403, University of Oulu.
Pirttijärvi, M., 2004a: PETROCK - Lithologically weighted interpolation of petrophysical data. Version 1.0, pp. 12.
Pirttijärvi, M., 2004b: GRABLOX - Gravity field interpretation and modelling software based on 3 D block model. Version 1.3, pp. 16.
Pirttijärvi, M., 2004c: BLOXER - Interactive visualization and editing of 3-D block models. Version 1.5, pp. 27.

LITOSPHERE 10.- 11.11.2004 Page 104
Pirttijärvi, M., E. Kozlovskaya, S. Elo, S.-E. Hjelt and J. Yliniemi. 2004. 3-D potential field modeling using a block model. 1st EGU General Assembly, Nice, France, 25-31 April, 2004, Geophysical Research Abstracts, EGU04-A-02903.
Yliniemi, J., Kozlovskaya, E., Hjelt, S.-E., Komminaho, K., Ushakov, A. and SVEKALAPKO Seismic Tomography Working Group. 2004. Structure of the crust and uppermost mantle beneath southern Finland revealed by analysis of local events registered by the SVEKALAPKO seismic array. Tectonophysics, in print.

LITOSPHERE 10.- 11.11.2004 Page 105
The Lake Ladoga basin; preliminary insights into geochronology, igneous evolution, and tectonic significance
O.T. Rämö1, I. Mänttäri2, J. Kohonen2, B.G.J. Upton3, M. Vaasjoki2, A.V. Luttinen1, V. Lindqvist1, V. Lobaev4, M. Cuney5, and L.P. Sviridenko6
1Department of Geology, P.O. Box 64, FI-00014 University of Helsinki, Finland 2Geological Survey of Finland, P.O. Box 96, FI-02151, Espoo, Finland
3Department of Geology and Geophysics, University of Edinburgh, Edinburgh EH9 3JW, U.K. 4All Russian Geological Research Institute (VSEGEI), 74 Sredny pr., 199106, Saint-Petersburg, Russia
5Université Henri-Poincaré – Nancy I, B.P. 23, F-54501 Vandœuvre, France 6Institute of Geology Karelian Research Centre, Russian Academy of Sciences, 185610 Petrozavodsk,
Karelia, Russia Email: [email protected]
Mesoproterozoic red-bed type sedimentary rocks, intercalated basalts, and subvolcanic mafic sills and dikes in the Lake Ladoga basin of Russian Karelia probably represent an intimate continuation of the magmatic events that led to the formation of the the locus classicus rapakivi granites in southeastern Finland and adjacent Russian Karelia in southeasternmost Fennoscandia. The mafic rocks of the basin are, in general, a CFB type, bear the Nd isotopic characteristics of ancient (Neoarchean) lithosphere, and yield a minimum age of 1460 Ma for the formation of the basin.
Keywords: basalt, dolerite, red-bed, basin, rapakivi granite, Mesoproterozoic
1. Geologic setting The south-central part of the Fennoscandian (or Baltic) shield in Sweden, Finland, and adjacent Russia experienced widespread continental flood basalt (CFB)-type basaltic magmatism and red-bed sedimentation in the Mesoproterozoic (e.g., Kohonen and Rämö, in
press). Published U-Pb zircon/baddeleyite data indicate ages of ca. 1260 Ma and ca. 950 Ma for this magmatism in southwestern Finland and central Sweden, respectively (Suominen, 1991; Söderlund et al., 2004). In the Lake Ladoga region, Russian Karelia, the Mesoproterozoic record registers the formation of a complex faulted-bounded basin, ca. 150 km in diameter, with intercalated sandstone, doleritic sills and dikes, and mafic lavas (e.g., Amantov et al., 1996). The mafic subvolcanic rocks are exposed on islands and skerries in the northeastern part of the basin (Valaam, Mantsinsaari, and Lunkulansaari islands) and basaltic lavas (eleven flows with an average thickness of about 15 m) are intercalated with clastic (mostly arkosic) sandstones in a section revealed by deep drilling in the Salmi-Tulemajoki region.
2. Geochemical observations In general, the Lake Ladoga dolerites and lavas are alkaline, relatively evolved (< 6 wt. % MgO, 43–57 wt. % SiO2), and strongly enriched in the light rare earth elements. The dolerites of the Valaam Island (and a gabbro from Lunkulansaari) have initial Nd (at 1460 Ma) values between -9.6 and -8.6. This points to a Neoarchean, metasomatically enriched lithospheric mantle source (cf. Upton et al., 1996). Our preliminary Nd isotope data on the Tulemajoki basalts and basaltic cobbles on the coast of the Valaam Island have Nd (at 1460 Ma) values of -5.8 to -4.1. These basalts may have been derived from a different source than the (more unradiogenic) subvolcanic mafic rocks.

LITOSPHERE 10.- 11.11.2004 Page 106
3. Geochronology and tectonic implications One concordant and one nearly concordant baddeleyite fraction from the dolerite on the Valaam Island in the northwestern part of Lake Ladoga yielded 207Pb-206Pb ages of 1459 ± 3 Ma and 1457 ± 2 Ma, respectively. This shows that the Mesoproterozoic CFB magmatism in the southeastern Fennoscandian shield commenced at least ca. 200 Ma earlier than previously anticipated and thus very shortly after the emplacement of the classic, 1670–1530 Ma (Vaasjoki et al., 1991; Suominen, 1991; Amelin et al., 1997), rapakivi granites. The basin formation probably started during the emplacement of the extension-related rapakivi intrusions as a result of thermal contraction of the rift zones, and the relatively thin crust hosting the rapakivi granites permitted ascent of the mantle-derived basaltic magmas. Whether the generation of these CFBs was related to a mantle plume is yet to be determined. In stratigraphy, the Mesoproterozoic basalts of the Lake Ladoga basin belong to the lower part of the basin (e.g., Amantov et al., 1996) and may actually represent basic volcanism related to the rapakivi event.
References Amantov, A., Laitakari, I. and Poroshin, Ye., 1996. Jotnian and Postjotnian: Sandstones
and diabases in the surroundings of the Gulf of Finland. Geol. Surv. Finland, Spec.
Pap. 21, 99-113.Amelin, Yu.V., Larin, A.M. and Tucker, R.D., 1997. Chronology of multiphase
emplacement of the Salmi rapakivi granite-anorthosite complex, Baltic Shield: implications for magmatic evolution. Contrib. Mineral. Petrol. 127, 353-368.
Kohonen, J. and Rämö, O.T., in press. Sedimentary rocks, diabases, and late cratonic evolution. In: Lehtinen, M., Nurmi, P.A., and Rämö, O.T. (Eds.), Precambrian Geology of Finland – Key to the Evolution of the Fennoscandian Shield. Developments in
Precambrian Geology, Elsevier Science B.V. Söderlund, U., Patchett, P.J., Vervoort, J.D. and Isachsen, C.E., 2004. The 176Lu decay
constant determined by Lu-Hf and U-Pb isotope systematics of Precambrian mafic intrusions. Earth Planet. Sci. Lett. 219, 311-324.
Suominen, V., 1991. The chronostratigraphy of SW Finland with special reference to the Postjotnian and Subjotnian diabases. Geol. Surv. Finland Bull. 356, 100 p.
Upton, B.G.J., Rämö, O.T., Vaasjoki, M., Sviridenko, L.P. and Svetov, A., 1998. Constraints on petrogenesis of Mesoproterozoic CFBs from the SE Fennoscandian Shield: Trace element and Nd isotopic evidence. Abstracts of ICOG-9, 1998 Beijing. Chinese Sci. Bull. 43, 134.
Vaasjoki, M., Rämö, O.T. and Sakko, M., 1991. New U-Pb ages from the Wiborg rapakivi area: constraints on the temporal evolution of the rapakivi granite - anorthosite - diabase dyke association of southeastern Finland. Precambrian Res. 51, 227-243.
LITOSPHERE 10.- 11.11.2004 Page 107
Clay Mineral Occurrence in Prydz Bay Rise (ODP Site 1165), Antarctica: Implications for the Middle Miocene and the Middle Pliocene Ice Sheet
Evolution
Tuija Siira1,2 , Juho Junttila1,2 , Kari Strand2
1 Department of Geosciences, University of Oulu, Linnanmaa, 2 Thule Institute, University of Oulu, Linnanmaa
Email: [email protected]
The aims of this study are on the evaluation of climatic variability in the East Antarctic during 1) possible “warm” interval of the middle Pliocene and 2) the middle Miocene glacial event based on clay mineral occurrence. The results on the middle Pliocene with increasing smectite content and decreasing illite content may indicate dynamic conditions in the ice sheet behavior. The preliminary results on the middle Miocene sequence show possible indications of the climatic transition.
Keywords: Ocean Drilling Program, Antarctica, clay minerals, ice sheet evolution
1. Introduction This study is a part of the larger Ocean Drilling Program (ODP) project, which represents the expertise in polar geosciences at the University of Oulu. From the beginning of 2004 the Integrated Ocean Drilling Program continued the work of ODP. It is an international organization that investigates global problems, especially in the field of geosciences. One of the major themes is the study of past climates.
The East Antarctic Ice sheet has existed for more than 33 Ma, but it has fluctuated considerably and has been one of the major driving forces of global sea level and climate throughout the Cenozoic era (Ehrmann and Mackenzen, 1992; Barret, 1999). Oxygen isotope records have been used to infer episodes of increased ice volume at 33.6 Ma, (Eocene/Oligocene boundary), 23.7 Ma (Oligocene/Miocene boundary), 12 to 16 Ma (middle Miocene), and 2.7 Ma (late Pliocene), the latter marking the onset of Northern Hemisphere glaciation (Flower and Kennett, 1994). However, data from other research proxies is also needed for better understanding of the Antarctic cryosphere and its relations to global climates and deep ocean circulation. It will also improve the evaluation of the long-term stability of Cenozoic ocean-climate system (cf. Flower and Kennett, 1994). The aims of this study are on the evaluation of climatic variability of the 1) “warm” interval of the middle Pliocene and 2) the middle Miocene glacial event based on clay mineral occurrence.
2. Regional setting and study material Site 1165 was drilled on the Wild Drift (66°E and 79°E) on the Continental Rise off Prydz Bay, East Antarctica, to a total depth of 999.1 m below the seafloor (mbsf). The drilling recovered an extensive suite of terrigenous and hemipelagic sediments of the early Miocene to Pleistocene age (Shipboard Scientific Party, 2001). One of the interests in this study is the high resolution sediment sequence between 0 and 50 mbsf which consist of a well-preserved section of Pliocene- to Pleistocene-age sediments. From this 50 meter sequence, a more intensely studied middle Pliocene from ~3.2 Ma (cf. Whitehead and Bohaty, 2003)was analyzed in 10 cm intervals. The other interest is from the middle to late Miocene sequence between 150 to 326 mbsf which is aged between ~10.0 to ~14.8 Ma (Florindo et
al., 2003).
LITOSPHERE 10.- 11.11.2004 Page 108
3. Methods X-ray diffraction (XRD) was performed on oriented clay samples as described by Hardy
and Tucker (1988). Diffractograms were recorded by a Siemens D 5000 with copper radiation (40kV, 40mA) at angles ranging from 2° to 32° 2 (0.02° 2 per second) immediately after the sample treatments. The principal four clay minerals smectite, illite kaolinite and chlorite were analysed by their basal spacings. MacDiff software version 4.2.5 (http://www.geologie.uni-frankfurt.de/Staff/Homepages/Petschick/RainerE.html) was used to quantify clay minerals. Since no internal standards were used, the precise accuracy of this procedure is not known, but the quantitative analyses justify interpretations of fluctuations around +/- 2%.
4. The middle Pliocene “warm” period The East Antarctic Ice Sheet has a controversial glacial past. Some recent studies have shown that it may have varied from a polythermal, dynamic condition to a predominantly cold stable state as recently as the Pliocene time. Multiproxy study of the middle Pliocene could show the intervals of expansions of the ice sheet across the continental shelves and Antarctic cryospheric evolution, particularly during the middle Pliocene “warm” period 3.15 to 2.85 Ma (cf. Dowsett et al. 1999; Murphy et al, 2002) which may provide an indication of how Earth may respond to future global warming. The clay mineral results on the middle Pliocene with increasing smectite content and decreasing illite content may indicate warm and dynamic conditions in the ice sheet behavior.
5. The middle Miocene climatic transition The middle Miocene represents the major phase of East Antarctic ice sheet expansion. The middle Miocene glacial event at ~14.8 – 14.2 is one of the largest climatic events during the Cenozoic. It occurred after the climatic optimum in the early middle Miocene (17 - 15 Ma) (Zachos et al., 2001) During the transition from ~14.8 to 12.9 Ma, climatic developments included major growth of the East Antarctic Ice Sheet and associated Antarctic cooling as well as a distinct increase in the meridional temperature gradient, large fluctuations in sea level followed by a global sea level fall, and important changes in deep water circulation, including increased production of Southern Component Water (Flower and Kennett, 1994).
East Antarctic ice sheet growth and polar cooling also had large effects on global carbon cycling and on the terrestrial biosphere, including aridification of mid-latitude continental regions. (Flower and Kennett, 1994). The ODP Leg 188 Site 1165 provides record of the long-term lower to upper Miocene transition from a temperate climate to cold climate glaciation, with superimposed short-term glacier fluctuations since early Miocene time (Shipboard Scientific Party, 2001).The preliminary results on the middle Miocene sequence show possible indications of the climatic transition. Research of this kind, integrated with other palaeoenvironmental data may improve significantly our knowledge of the past Antarctic climate and our understanding of its evolution.

LITOSPHERE 10.- 11.11.2004 Page 109
References Barrett, P.J. 1999. Antarctic climate history over the last 100 million years. In: Barret, P.,
Orombelli, G. (Eds.), Geological records of Global and Planetary change. Terra Antartica Rpts., col. 3, pp.53 – 72.
Dowsett, H.J., Barron, J.A., Poore, R.Z., Thompson, R.S., Cronin, T.M., Ishman, S.E., Willard, D., 1999. Middle Pliocene paleoenvironmental reconstruction: PRISM2. U.S.
Geological Survey Open File Report, 99-535:23. Ehrmann, W.U and Mackensen A. 1992. Sedimentological evidence for the formation of an
East Antarctic ice sheet in Eocene/Oligocene time. Palaeogeography,Palaeoclimatology, Palaeoecology 93, 85 – 112.
Florindo, F., Bohaty, S.M., Erwin, P.S., Richter, C., Roberts, A.P., Whalen, P.A. and Whitehead, J.M. 2003. Magnetobiostratigraphic chronology and palaeoenvironmental history of Cenozoic sequences from ODP sites 1165 and 1166, Prydz Bay, Antarctica. Palaeogeography, Palaeoclimatology, Palaeoecology 198, 69 – 100.
Flower, B.P. and Kennett, J.P. 1994. The Middle Miocene climatic transition: East Antrarctic ice sheet development, deep ocean circulation and global carbon cycling. Palaeogeography, Palaeoclimatology, Palaeoecology 108, 537 – 555.
Hardy, R., Tucker, M., 1988. X-ray powder diffraction of sediments. In Tucker, M. (edit.) Techniques in sedimentology. Blackwell Scientific Publications, Oxford, 191-228.
Murphy, L., Warnke, D.A., Andersson, C., Channell, J., Stoner, J., 2002. History of ice rafting at South Atlantic ODP Site 177-1092 during the Gauss and late Gilbert Chrons. Palaeogeography, Palaeoclimatology, Palaeoecology 182: 183-196
Shipboard Scientific Party, 2001. Site 1165. In O’Brien, P.E., Cooper, A.K., Richter, C., et al., Proc. ODP, Init. Repts., 188, 1–191 [CD-ROM]. Available from: Ocean Drilling Program, Texas A&M University, College Station TX 77845-9547, USA.
Whitehead, J.M., Bohaty, S.M., 2003. Data report: Quaternary-Pliocene diatom biostratigraphy of ODP Sites 1165 and 1166, Cooperation Sea and Prydz Bay. In
Cooper, A.K., O'Brien, P.E., and Richter, C. (Eds.), Proc. ODP, Sci. Results, 188
[Online]. Available from http://www.odp.tamu.edu/publications/188_SR/008/008.htm. Zachos, J., Pagani, M., Sloan, L., Thomas, E. and Billups, K. 2001. Trends, Rhythms, and
Aberrations in Global Climate 65 Ma to Present. Science 292, 686 – 693.

LITOSPHERE 10.- 11.11.2004 Page 110

LITOSPHERE 10.- 11.11.2004 Page 111
Orogenic architecture and mineralization - general concepts, comparisons and relevance to Fennoscandia
Peter Sorjonen-Ward
Geological Survey of Finland, PO Box 70211, Kuopio, Finland Email: [email protected]
Interactions between orogenic architecture and thermal evolution are considered with respect to their role in mineral endowment. Genreic and specific examples of seismically defined architecture and mineralization are given, with emphasis on the Yilgarn craton and comparisons with Fennoscandia.
Keywords: seismic architecture, thermal evolution, gold mineralization, Yilgarn, Fennoscandia, numerical modeling.
1. Architecture of mineral systemsThe importance of deformation and structural architecture in controlling fluid pathways and favourable depositional sites for hydrothermal ore deposits – particularly orogenic gold - is now widely recognized. Structural controls are evident across a range of scales and crustal depths, from pluton-centered hydrothermal systems in the upper crust, to plate-scale ductile shear zones systems channelling fluids during high-grade regional metamorphism.
In recent years, exploration strategies have been shifting away from empirical targeting of anomalies towards a more comprehensive understanding of the geological context of mineral systems, in an effort to define what makes a terrain prospective. Mass-balance constraints and metal enrichments in many hydrothermal mineral systems demand fluid access to large crustal volumes, and efficient transfer and focussing of fluids towards the ultimate site of deposition. Derivation of fluids from a deep crustal source implies the existence of some mechanism or process that enhances permeability in inherently low-permeability crystalline rocks. Moreover, the presence or absence of mineralization does not depend on favourable architecture alone. In addition, sustained fluid supply is required, as well as appropriate combinations of thermal, pressure and chemical gradients to optimize metal extraction, transport and deposition
In order to undertake such an integrated analysis of orogenic evolution, we need to1. constrain both the 3-dimensional architecture of the terrain2. document the thermal evolution, and nature and distribution of heat sources and
transport, in order to establish the timing and nature of fluid and metal transport and deposition.
3. assess the role of the mantle in crustal orogenic evolution–is its effect dynamic in terms of its buoyancy and rigidity? does mantle heat flux control heat distribution and temperature-dependent rheology? does crustal magmatism and fluid flow involve material transfer from the mantle itself ?
We are then in a better position to consider the following issues: Can we identify critical structural architectures that are inherently favourable for the accumulation and preservation of mineral deposits?

LITOSPHERE 10.- 11.11.2004 Page 112
Is the thermal history and lower crustal composition conducive to efficient fluid tranpsort and focussing during deformation? Are there distinctive geochemical or isotopic signatures that link crustal granitic magmatism or sedimentary basin characteristics with a particular mineralization event?Does early cratonic history predetermine subsequent mineralization potential, in which case we have an effective tool in terrain selection, or can refertilization of mantle lithosphere lead to new endowment? Have secular trends in thermal evolution or geochemical differentiation (eg. composition and buoyancy of Archean versus younger lithospheric mantle) influenced orogenic processes?
Seismic surveys across a number of terrains on various continents and ranging in age from Archean to Cenozoic are now providing us with unprecendented opportunities for comparing orogenic evolution. Examples of well mineralised and prospective terrains for which seismic data are available include the Yilgarn Craton, Mount Isa Inlier, Curnamona Craton, Victoria, central New South Wales and Tasmania in Australia, and the Archean Abitibi belt (and other LITHOPROBE transects) in Canada, the Andes, Alaska, Sierra Nevada and the Witwatersrand Basin of the Kaapvaal Craton.
Examples of terrains that are not currently globally significant mineral producers, but whose seismic architecture and geodynamic evolution are relatively well constrained include the New England Fold Belt and Arunta Inlier in Australia, the Tibetan-Himalyan collision zone, the European Alps, New Zealand, Japan and the Archean and Proterozoic of the Fennoscandian Shield (Korja et al., 1993).
This presentation does not provide answers, but is intended to stimulate discussion on similarites and differences between Fennoscandian crustal architecture and a number of other terrains, with emphasis on implications for mineralization.
2. Different types of orogenic architecture First order controls on orogenic archtiecture reflect a dynamic balance between externally imposed forces and the evolving internal thermal and material properties of the orogen. External boundary conditions include:
rate of plate convergenceduration of plate convergence direction of plate convergence mantle heat flux and thermal regime Factors internal to the orogen include: inherited basement structure overlying basin architecture lithospheric composition, including compositional variatiosn controlling melting, and distribution of radiogenic heat production) lithospheric thickness, buoyancy and elevation lithospheric anisotropy
Coupling between crustal and lithosphere during convergence has essentially two principal geometries, as illustrated in Figure 1.

LITOSPHERE 10.- 11.11.2004 Page 113
Figure 1. The two fundamental collisional orogenic architectures – subduction away from the orogen, and subdcution beneath the orogen (Cook and Varsek, 1994).
Two general types of fold belt profiles may be distinguished – (1) asymmetric, foreland migrating wedges with various combinations of imbricates, duplexes and antiformal stacks, and (2) doubly vergent profiles, with either tectonic wedges, backthrusts and triangle zones, or conversely, divergent thrusts leading to pop-up wedges. A critical feature in all of these architectures is, by analogy with traps in petroleum systems, the potential exists for creating fault-bounded domains of differential uplift and overpressuring beneath relatively impermeable units that act as seals to contain hydrothermal systems.
Because many gold deposits occur in vein systems, where quartz-dominated lithologies define the brittle-ductile transition is also interesting to speculate whether there is a thermal and rheological feedback that maintains fluid supply and focussing in critical state, a characteristic of self-organizing systems (Bak, 1996).
3. Asymmetric, foreland migrating fold and thrust belts
A foreland-propagating fold and thrust belt will have a different thermal evolution and uplift history depending on rate and duration of convergence. This architecture is evidently favourable for fluid migration and formation of relatively low temperature zinc mineralization in deforming sedimentary basins but may be less favourable for orogenic gold however, as the typical clockwise P-T-t evolution means that thermal equilibration in the overthrust terrain is attained after peak deformation. However, this settings is typical for

LITOSPHERE 10.- 11.11.2004 Page 114
porphyry Cu-Au deposits formed from pluton-driven hydrothermal systems in uplifting terrain in mamgmatic arcs. However, because such deposits are associated with uplift in elevated terrain, their long term preservation potential is likely to be low, except by a combination of rapid subsidence and orogenic collapse and temporary burial beneath a foreland basin.
4. Doubly vergent deformation and tectonic wedging
Doubly vergent orogeny (Koons 1990) such as described from the Southern Alps of New Zealand have the form of large divergent, pop-up wedges, with the potential to provide uplift in combination with efficient fluid transfer, including deep penetration of meteoric fluids (Craw et al. 2001). This is one mechanism for addressing the problematic issue of early metamorphic dehydration and the relatively late timing of many orogenic gold systems.
It is also common for divergent architectures to develop by late stage backthrusting. The thermal and tectonic evolution associated with such retrowedge formation has also been analyzed numerically (Jamieson et al. 1998); it appears that after initiation of a retrowedge, tectonic imbrication in the middle and lower crust can develop with opposite vergence to that in the overriding wedge. These features are variously referred to as tectonic wedges or triangle zones, which are commonly developed during folding and thrusting in inverted sedimentary basins (Jamison 1993). This architecture is of particular interest in that it has the potential to generate effective permeable seals during orogenic deformation; this may then enhance focussing, circulation and retention of fluids within a middle crustal environment, compatible with greenschist facies conditions during mineralization. The process may also lead to an effective decoupling of lower crustal and upper crustal deformation styles late orogenic isostatic readjustment may provide a greater opportunity for exhumation and preservation of greenschist facies crustal levels.
This type of architecture and history can be inferred from seismic and geologic data from the late Archean Yilgarn craton (Drummond et al. 2000; Sorjonen-Ward et al., 2002)as shown in Figure 2. It is also likely to be relevant to the evolution of Lapland and the context of gold mineralization, where the bivergent nature of deformation has long been recognized . Although the polarity of orogeny in the Yilgarn is not so well defined as in Lapland, with no obvious foreland, the architecture and thermal regime at the time of mineralization are better constrained.

LITOSPHERE 10.- 11.11.2004 Page 115
Figure 2. a-c: summary sketches of principal seismic reflectors in Eastern Goldfields Traverse EGF-01, from Drummond et al. (2000), and Sorjonen-Ward et al. (2002); d, e: general concept of tectonic wedging (after Jamison 1993).
It appears from the regional context of mineralization that most Yilgarn gold deposits formed at a relatively late stage in the structural and thermal evolution of the craton, perhaps 30 Ma or more after the earliest deformation events. Structural studies of vein systems favour a compressive rather than extensional deformation regime during mineralization. It is therefore reasonable to infer that mineralization occurred during mineralization. It is therefore concluded that mineralization occurred during active uplift and exhumation but during ongoing compression. The seismically defined detachment zone may record an effective mechanical decoupling between the upper crust, which deforms in a very heterogeneous manner, accompanied by uplift and erosion, and the middle and lower crust, which displays a distinct asymmetric tectonic imbrication. Indeed the sesimic data
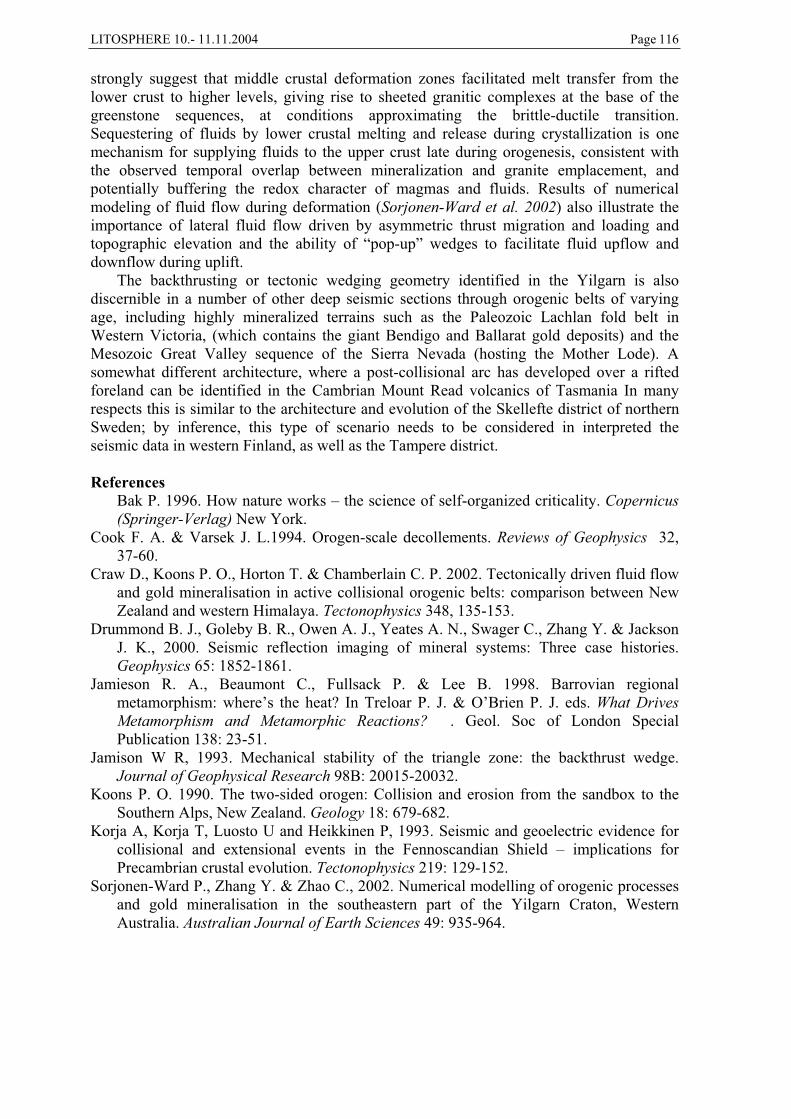
LITOSPHERE 10.- 11.11.2004 Page 116
strongly suggest that middle crustal deformation zones facilitated melt transfer from the lower crust to higher levels, giving rise to sheeted granitic complexes at the base of the greenstone sequences, at conditions approximating the brittle-ductile transition. Sequestering of fluids by lower crustal melting and release during crystallization is one mechanism for supplying fluids to the upper crust late during orogenesis, consistent with the observed temporal overlap between mineralization and granite emplacement, and potentially buffering the redox character of magmas and fluids. Results of numerical modeling of fluid flow during deformation (Sorjonen-Ward et al. 2002) also illustrate the importance of lateral fluid flow driven by asymmetric thrust migration and loading and topographic elevation and the ability of “pop-up” wedges to facilitate fluid upflow and downflow during uplift.
The backthrusting or tectonic wedging geometry identified in the Yilgarn is also discernible in a number of other deep seismic sections through orogenic belts of varying age, including highly mineralized terrains such as the Paleozoic Lachlan fold belt in Western Victoria, (which contains the giant Bendigo and Ballarat gold deposits) and the Mesozoic Great Valley sequence of the Sierra Nevada (hosting the Mother Lode). A somewhat different architecture, where a post-collisional arc has developed over a rifted foreland can be identified in the Cambrian Mount Read volcanics of Tasmania In many respects this is similar to the architecture and evolution of the Skellefte district of northern Sweden; by inference, this type of scenario needs to be considered in interpreted the seismic data in western Finland, as well as the Tampere district.
ReferencesBak P. 1996. How nature works – the science of self-organized criticality. Copernicus
(Springer-Verlag) New York. Cook F. A. & Varsek J. L.1994. Orogen-scale decollements. Reviews of Geophysics 32,
37-60.Craw D., Koons P. O., Horton T. & Chamberlain C. P. 2002. Tectonically driven fluid flow
and gold mineralisation in active collisional orogenic belts: comparison between New Zealand and western Himalaya. Tectonophysics 348, 135-153.
Drummond B. J., Goleby B. R., Owen A. J., Yeates A. N., Swager C., Zhang Y. & Jackson J. K., 2000. Seismic reflection imaging of mineral systems: Three case histories.Geophysics 65: 1852-1861.
Jamieson R. A., Beaumont C., Fullsack P. & Lee B. 1998. Barrovian regional metamorphism: where’s the heat? In Treloar P. J. & O’Brien P. J. eds. What Drives
Metamorphism and Metamorphic Reactions? . Geol. Soc of London Special Publication 138: 23-51.
Jamison W R, 1993. Mechanical stability of the triangle zone: the backthrust wedge. Journal of Geophysical Research 98B: 20015-20032.
Koons P. O. 1990. The two-sided orogen: Collision and erosion from the sandbox to the Southern Alps, New Zealand. Geology 18: 679-682.
Korja A, Korja T, Luosto U and Heikkinen P, 1993. Seismic and geoelectric evidence for collisional and extensional events in the Fennoscandian Shield – implications for Precambrian crustal evolution. Tectonophysics 219: 129-152.
Sorjonen-Ward P., Zhang Y. & Zhao C., 2002. Numerical modelling of orogenic processes and gold mineralisation in the southeastern part of the Yilgarn Craton, Western Australia. Australian Journal of Earth Sciences 49: 935-964.
LITOSPHERE 10.- 11.11.2004 Page 117
IODP investigates the solid earth’s cycles and global environmental change
Kari Strand
Thule Institute, P.O. Box 7300, FIN-90014 University of Oulu, Finland Email: [email protected]
Finland has a membership in the Integrated Ocean Drilling Program (IODP) through the European Consortium for Ocean Research Drilling (ECORD). IODP uses multiple drilling platforms to accomplish the goals of the Initial Science Plan. It has three major themes: 1) The deep biosphere and the subseafloor ocean; 2) Environmental change, processes, and effects; and 3) Solid earth cycles and geodynamics.
Keywords: Earth’s dynamics, climatic change, resources and deep biosphere
1. IODP 2003-2013 IODP builds upon the legacies of the Deep Sea Drilling Project (1968-1983) and the Ocean Drilling Program (1983-2003). IODP is an international scientific research initiative that began its scientific work in 2004. European Consortium for Ocean Research Drilling (ECORD) is formed through a joint action of the European scientific community together with funding agencies presently from fourteen nations to provide a single European-based entity in IODP. The Academy of Finland supports the Finnish membership in IODP. ECORD’s role is to co-ordinate Europe’s participation in IODP. ECORD in structured into 4 components parts: ECORD Council, Managing Agency (EMA), Science Support and Advisory Committee (ESSAC) and Science Operator (ESO).
Overall IODP program management is provided by IODP Management International, Inc. (IODP-MI) having offices in Washington, D.C. and Sapporo, Japan, and is responsible for program-wide science planning, oversight of engineering development, publications, education and outreach, site survey data management, and core sample depositories. IODP-MI receives advice from the international IODP Science Advisory Structure (SAS).
IODP explores the history and structure of the earth as recorded in seafloor sediments and rocks. IODP will use the drill ship JOIDES Resolution for its first expeditions. In addition, IODP will utilize a riser vessel currently under construction in Japan named Chikyu ("Earth") to achieve program’s science goals. European countries (ECORD) will contribute mission specific platforms (MSP) for drilling in shallow water (less than 30 m) and ice-covered regions. MSPs are necessary to investigates earth’s regions and processes that where previously inaccessible or poorly understood such as Arctic. The first MSP operation was taken place August 7 to September 16, 2004. The Arctic Coring Expedition (ACEX) investigated Arctic climate history by drilling along the Lomonosov Ridge. The cores contain evidence of a dramatic defrostering of the Arctic Ocean near the North Pole 55 million years ago and a long, slow slide towards the perennial ice cover of recent times (Kerr, 2004).
2. IODP’s scientific themes IODP is science-driven. The initial science plan describes the goals of the program and has three major themes: 1) The deep biosphere and the subseafloor ocean; 2) Environmental change, processes, and effects; and 3) Solid earth cycles and geodynamics.
Eight initiatives are identified that are ready to be addressed within the next decade of drilling: 1) Deep biosphere; 2) Gas hydrate; 3) Extreme climates; 4) Rapid climate changes;

LITOSPHERE 10.- 11.11.2004 Page 118
5) Continental breakup & sedimentary basin formation; 6) Large igneous provinces; 7) 21st
century moholes; and 8) Seismogenic zone.
3. IODPFinland.oulu.fi This portal is planned to support Finnish membership in IODP. It will provide basic information and important links to those web sites that relate to the program. This site is especially planned for easy start for Finnish scientists and students to look for opportunities for participation for coming expeditions, find educational resources or to begin planning or jointing to international drilling proposal initiatives. Participation is open to scientists and engineers (professors, research scientists, technologists, graduate students) from all IODP member countries.
Responsibility of updating the national IODP/ECORD portal for information and announcements is for Finnish ESSAC delegates. To support Finnish membership in IODP also a group of experts from universities and surveys is established.
ReferencesEuropean Consortium for Ocean Research Drilling (ECORD) website:
http://www.ecord.org (cited 2004-09-30). Integrated Ocean Drilling Program (IODP) initiative website: http://www.iodp.org (cited
2004-09-30)IODP Finland website: http://iodpfinland.oulu.fi (cited 2004-009-30) Earth, Oceans and Life., 2001. IODP Initial Science Plan for 2003-2013, 110 p.
(http://www.iodp.org/downloads/IODP_Init_Sci_Plan.pdf) Kerr, R.A., 2004. Signs of a warm, ice-free Arctic. Science 305, 1693.
(http://www.sciencemag.org/cgi/reprint/305/5691/1693a.pdf)

LITOSPHERE 10.-11.11.2004 Page 119
Integration of geophysical data with sediment composition, examples from Prydz Bay (ODP Site 1166), Antarctica
Karla Tiensuu1 and Kari Strand2
1Department of Geosciences, Division of Geophysics, P.O.Box 3000, FIN-90014 University of Oulu, Finland 2Thule Institute, P.O.Box 7300, FIN-90014 University of Oulu, Finland
Email: [email protected]
Integration of geophysical and sedimentological data can improve the reliability and accuracy of data interpretation. For example P-wave velocity and density values are very informative when used alongside with geological data.
Keywords: Ocean Drilling Program, Prydz Bay, Antarctica, geophysical and sedimentological data
1. Introduction The Ocean Drilling Program (ODP) was a broad international scientific program, which worked in the field of Earth Sciences and it has continued IODP phase from the beginning of 2004 (Strand et al., 2002). ODP and IODP data are used for studying the structure and evolution of the Earth. In addition to this, programs provide a good possibility to study past climatic conditions and variations. Finland participates in IODP as a member of the European Consortium.
The ODP depositories and databases include samples from seafloor sediments and rocks as well as geophysical in situ –borehole measurements and sediments’ physical properties. These databases are Janus database (available in the web: http://iodp.tamu.edu/janusweb/general/dbtable.cgi) and LDEO’s database (http://www.ldeo.columbia.edu/BRG/ODP/DATABASE/index.html).
In this work there has been used material from ODP Leg 188, Site 1166, which is located on the continental shelf in Prydz Bay, East Antarctica. The used data consist petrophysical and geophysical borehole logging measurements, concrete samples and thin sections. This paper is based on Tiensuu’s M.Sc. thesis (2004).
Different data types were studied together and it was considered, whether certain geophysical data have characteristics, which could be useful in determining the boundaries and in identifying sediment or rock material in the specific units. Correlating geophysical measurements with mineralogical and sedimentological data has been the basic idea in this work, thus aid to improve also sedimentological interpretation. (Tiensuu, 2004)
2. Some notifications of data integration Geophysical measurements can improve the quality and reliability of the available data. Usage of a wide range of different geophysical logging methods together with petrophysical and geological methods, and coupling their results together may solve the problems caused by poor core recovery, which is often the case in ocean research.
3. P-wave notices P-wave velocity seems to be one of the most promising petrophysical parameters in order to solve the state of compaction and sedimentological history. One benefit of seismic velocities is that they can be measured with logging methods and when the core recovery is sufficient, also petrophysically.

LITOSPHERE 10.-11.11.2004 Page 120
4. Density notices The use of petrophysical density data is more restricted by core recovery problems than seismic velocity data and it also does not tend to be sensitive enough for small variations. Not even logging data is very sensitive for small-scale variations. Density data measured with logging methods are more continuous and usually of better quality than petrophysical data, due to the fractioning of actual samples during drilling.
High density values suggest relating with high clay fraction content. Naturally the used methods also affect the results. Bulk density mean and median values measured with logging tool HLDS were regularly higher than those of petrophysical results, and also the standard deviation was in a remarkably lower level. Higher densities are due to that in logging techniques measured material does not break, meanwhile in conventional petrophysical research some cracks are formed during the drilling. These cracks form more easily into the core than to the surrounding.
5. General notices Generally, it seems that standard deviation values remain remarkably lower in logging data than they do in petrophysical data. We see that as an indication of better data quality, something expectable due to higher sampling frequency and less destructive (less crack-forming) methods. In case of high-quality geological samples also petrophysical methods can provide significant data. The best combination would be utilizing geophysical logging methods alongside with different geological, mineralogical and geochemical methods.
This study has verified the assumption that geophysical measurements can increase and augment the available data. Geophysical data can be used at least for making educated guesses for material type, even if there are no concrete samples, which is often the case in borehole studies. Usage of a wide range of different geological, petrophysical and geophysical logging methods and coupling their results together can bring some ease to the problem caused by poor core recovery.
6. Conclusions In conclusion, the best combination would be utilizing geophysical logging methods alongside with geological (petrographical and geochemical) methods. In case of high-quality geological samples also petrophysical methods can expand the general view of research subject and provide significant new details; thus improving the validity of the conclusions. Regarding to the glacial history of Prydz Bay, the integration of geophysical data with sediment composition, has proven to be a useful approach. However, apparent correlations may not always imply a causal relationship, and relations of different variables are often complex. Therefore, caution is recommended when drawing final conclusions from the integrated data. Many times, however, more reliable interpretations can be made by integrating sediment compositions with measured geophysical properties at the same intervals. Especially geophysical logging data can be used to infer sediment and rock properties in intervals with low core recovery.
There is also a need for further studies of the subject together with statistical analysis. More detailed mineralogical and petrological studies combined with petrophysical and in
situ –measurements could give valuable information on mineral content’s relation to physical properties. Especially the mineral content, studied by e.g. electron microprobe and reflected light microscope (ore microscope), of the opaque minerals could be interesting.

LITOSPHERE 10.-11.11.2004 Page 121
References Strand, K., Ehlers, C. & Tiensuu, K., 2002. Earth Dynamics and Environmental Change are
the Headlines in the IODP, the Successor to the Successful ODP. In: Lahtinen, R., Korja, A., Arhe, K., Eklund, O., Hjelt, S.-E. & Pesonen, L.J. (eds.). Lithosphere 2002 – Second Symposium on the Structure, Composition and Evolution of the Lithosphere in Finland. Programme and Extended Abstracts. Espoo, Finland, November 12-13, 2002. Institute of Seismology, University of Helsinki, report S-42. 146 p.
Tiensuu, K., 2004. Integration of geophysical data with sediment composition of ODP Leg 188, Site 1166, Prydz Bay, Antarctica. M.Sc. thesis, University of Oulu. 56 p + CD-ROM.

LITOSPHERE 10.-11.11.2004 Page 122

LITOSPHERE 10.- 11.11.2004 Page 123
The Anjalankoski earthquake swarm in May 2003
Marja Uski1, Timo Tiira1, Annakaisa Korja1 and Seppo Elo2
1Institute of Seismology, POB 68, FI-00014 University of Helsinki, Finland 2Geological Survey of Finland, POB 96, FI-02150 Espoo, Finland
Email: [email protected]
Composite focal mechanism of the May 2003 earthquake swarm in Anjalankoski, SE Finland corresponds to dip-slip motion along a nearly vertical fault plane. The epicenters of the 16 earthquakes can be associated with the internal intrusion boundary of the Vyborg rapakivi batholith. The events are most likely occurring at depths between 1 to 2 km below the surface. The unusually shallow swarm activity is characteristic to the Vyborg rapakivi area in southeastern Finland.
Keywords: Earthquake swarm, relative location, focal mechanism, Finland
1. Introduction During May 2003, the Finnish seismograph network recorded a swarm of 16 earthquakes in Anjalankoski, SE Finland (Fig.1). In spite of the small size of the events (ML=0.6-2.1), the swarm was widely felt in the area surrounding Anjalankoski. Rattling of windows and small dishes accompanied by explosion- or thunder-like sounds were typical descriptions of the felt effects. These effects and excitation of a strong Rg phase on seismograms recorded at epicenter-station distances up to 150 km suggested that the focuses were most likely very shallow.
Historical reports revealed that most of the macroseismic epicenters in figure 1 also represent double or multiple earthquakes, accompanied by similar felt effects as the Anjalankoski swarm. The duration of individual swarms varied from several days to several years, the time gap between the largest subsequent swarms being ca. 50 years. The best known historical swarm occurred in Lapinjärvi, about 40 km SW of Anjalankoski. A total of 23 earthquakes were reported felt there during August 1951 and October 1956. The Anjalankoski swarm is, however, the first one verified by instrument recordings.
2. Geological and geophysical backgroundThe bedrock of southern Finland has been formed in the Svecofennian orogeny between 1.9 and 1.8 Ga. The regional scale lithological units and prominent shear zones are striking SW-NE. The Svecofennian lithologies have been intruded by rapakivi granite between 1.65 and 1.50 Ga. The earthquake swarms occur within the Vyborg rapakivi batholith consisting of number of small intrusions. The intrusions take an elliptical form with an elongated axis in 060o direction (Fig.1; Härme, 1980). This is also the main strike direction of the regional magnetic and Bouguer anomalies. Main directions of vertical joints are 060o and 330o
(Simonen, 1987). Vertical fault surfaces with fluorite and calcite fillings also occur in 060o
direction in the Loviisa area (Sundblad and Alm, 2000)
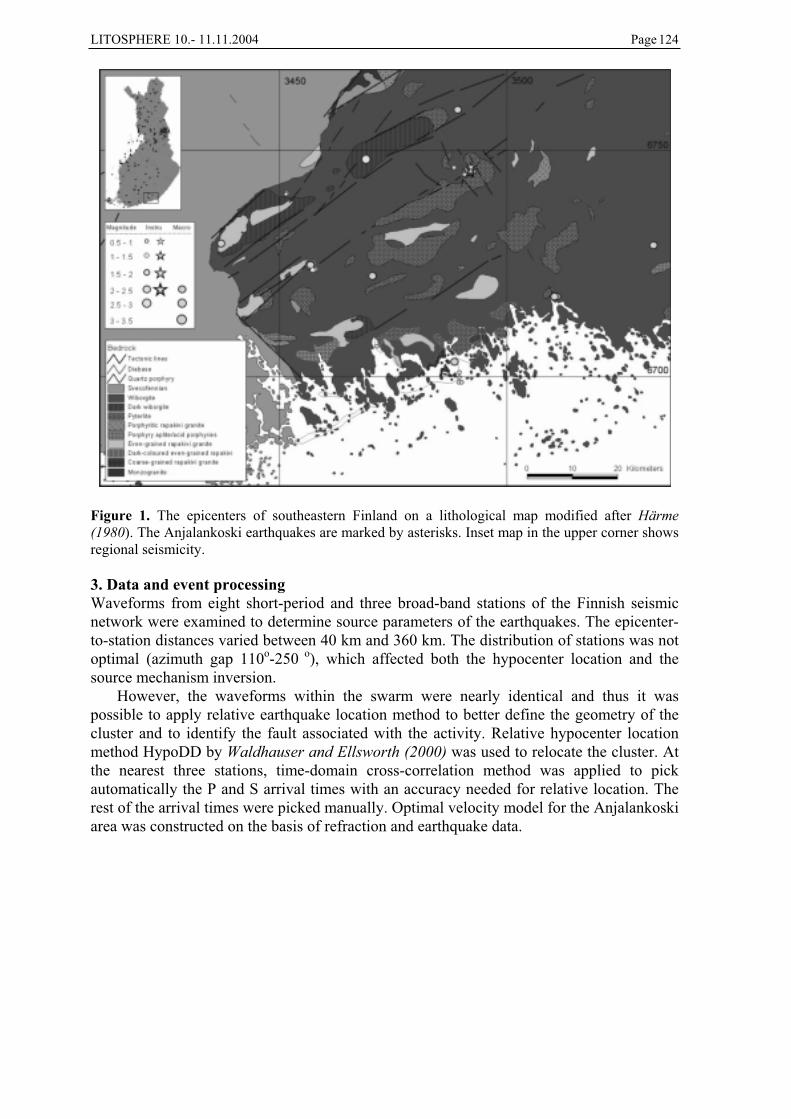
LITOSPHERE 10.- 11.11.2004 Page 124
Figure 1. The epicenters of southeastern Finland on a lithological map modified after Härme
(1980). The Anjalankoski earthquakes are marked by asterisks. Inset map in the upper corner shows regional seismicity.
3. Data and event processingWaveforms from eight short-period and three broad-band stations of the Finnish seismic network were examined to determine source parameters of the earthquakes. The epicenter-to-station distances varied between 40 km and 360 km. The distribution of stations was not optimal (azimuth gap 110o-250 o), which affected both the hypocenter location and the source mechanism inversion.
However, the waveforms within the swarm were nearly identical and thus it was possible to apply relative earthquake location method to better define the geometry of the cluster and to identify the fault associated with the activity. Relative hypocenter location method HypoDD by Waldhauser and Ellsworth (2000) was used to relocate the cluster. At the nearest three stations, time-domain cross-correlation method was applied to pick automatically the P and S arrival times with an accuracy needed for relative location. The rest of the arrival times were picked manually. Optimal velocity model for the Anjalankoski area was constructed on the basis of refraction and earthquake data.

LITOSPHERE 10.- 11.11.2004 Page 125
Figure 2. Vertical component record of an Anjalankoski earthquake at station FIA0 (D=80 km) at Sysmä. Synthetic section shows the excitation of Rg phase relative to body wave phases (P, S) as a function of source depth. Synthetic seismograms have been calculated using the composite focal mechanism and the local velocity model. Note that Rg is not well developed for sources deeper than 2 km.
Composite fault plane solution of the five strongest earthquakes was determined using P-wave polarity data together with SV/P and SH/P phase amplitude ratios. Synthetic waveform modeling (Fig. 2) was used to further constrain and verify the source and structural parameters. The methods were described in detail in Uski et al. (2003).
4. Results and conclusions - Both the historical and the instrumental earthquake data indicate that unusually shallow swarm activity is characteristical to the Vyborg rapakivi area in southeastern Finland. - The composite fault plane solution corresponds to dip-slip motion along a nearly vertical or a horizontal fault plane. - The nodal plane striking 252o/82o coincides with an internal intrusion boundary of the Vyborg rapakivi batholith. - The relocated epicenters are also aligned along a SWW-NEE trending zone. - Relative location as well as synthetic waveform modeling of the Rg wave suggested that the events have been unusually shallow, most likely occurring 1 to 2 km below the surface.

LITOSPHERE 10.- 11.11.2004 Page 126
ReferencesHärme, M., 1980. General Geologic Map of Finland 1 : 400 000. Map of Pre-Quaternary
rocks, Sheet C1-D1, Helsinki, 95 p. Geol. Surv. Finland, Espoo. Simonen, A., 1987. Pre-quaternary rocks of the map-sheet areas of the rapakivi massif in
SE Finland (in Finnish), 49 p. Geol. Surv. Finland, Espoo.Sundblad C. and Alm, E., 2000. Flusspatförande spricksystem i den prekambriska
berggrunden i Östersjöregionen, 40 p. Norges teknisk-naturvitenskaplige universitet, N-
7491, Trondheim.
Uski, M., Hyvönen, T., Korja A. and Airo Meri-Liisa, 2003. Focal mechanisms of three earthquakes in Finland and their relation to surface faults. Tectonophysics 363, 141-157.
Waldhauser, F. and Ellsworth, W.L., 2000. A double-difference earthquake location algorithm: method and application to the northern Hayward fault, California. Bull.
Seism. Soc. Am. 90,1353- 1368.