Embed Size (px)
Citation preview
Litigation Risk, Financial Reporting Quality, and
Critical Audit Matters in the Audit Report: Early U.S. Evidence
Valbona Sulcaj
Von Allmen School of Accountancy
Gatton College of Business & Economics
University of Kentucky
Email: [email protected]
September 2020
This paper is based on my dissertation work, currently being completed at the University of Kentucky. I
am very grateful to Monika Causholli (advisor and chair), Dave Ziebart (co-chair), Brian Bratten, and
Joseph Waddington, for their guidance, advice, and constructive feedback throughout the process. I really
appreciate the suggestions from Nicole T. Jenkins and the participants at the University of Kentucky. I also
thank the participants at the 2020 AAA Annual Meeting, the 2020 AAA SPARK Meeting, and the 2020
AAA/Deloitte/J. Michael Cook Doctoral Consortium for helpful comments. I gratefully acknowledge
research support from the Von Allmen School of Accountancy at the University of Kentucky.
Litigation Risk, Financial Reporting Quality, and
Critical Audit Matters in the Audit Report: Early U.S. Evidence
Abstract
This study presents evidence on the critical audit matters (CAMs) communicated in audit reports
following the adoption of the new audit standard – AS 3101. A CAM is defined as any matter
arising from the audit of the financial statements relating to material accounts or disclosures, that
were communicated to the audit committee, and that involved especially challenging, subjective,
or complex auditor judgment (PCAOB, 2017). I examine whether the perceived increased
exposure to litigation risk will affect auditor CAM reporting behavior and how the reported CAMs
map into financial reporting quality. Consistent with litigation hypothesis, I find a positive
association between litigation risk and number of CAMs communicated in the audit report,
suggesting that auditors try to preempt negative consequences from shareholder lawsuits by
reporting more CAMs when litigation risk is higher. The results also show that the number of
CAMs in the audit report increases as financial reporting quality decreases, suggesting that audit
reports reflect the quality of financial statements. On the other hand, I do not find significant
relationships between litigation risk or financial reporting quality and CAMs readability. However,
as the quality of financial reporting decreases, in presence of litigation risk, the CAMs readability
decreases significantly. This decrease is driven by auditor response rather than CAM description,
consistent with obfuscation hypothesis. These results suggest complementary effects of litigation
risk, financial reporting quality, and their interaction on the quantity and quality of CAM
disclosures. Lastly, I examine the variation in audit effort and costs and find that audit fees and
audit report lags are positively associated with number of CAMS but not associated with their
readability. Overall these results are consistent with the notion that auditors will disclose issues
they are legally obligated to without necessarily making them more readable or understandable.
Keywords: Critical Audit Matters, Audit Report, Litigation Risk, Financial Reporting Quality,
Audit Fees, Disclosure Readability.
1
1. Introduction
The public auditor is an important mediator between investors and public companies with the
critical role of providing reasonable assurance that the financial statements are free of material
misstatements. However, the traditional pass/fail audit reporting model has led to a highly
standardized audit report that provides little information, creating an expectation gap between the
auditor and the users of financial statements. After numerous calls from investors to address this
issue, the PCAOB issued a new audit reporting standard that requires auditors to communicate the
critical audit matters (CAMs) that surfaced during the audit engagement. A CAM is defined as any
matter arising from the audit of the financial statements in areas involving material accounts or
disclosures, that were communicated or required to be communicated to the audit committee, and
that involved especially challenging, subjective, or complex auditor judgment (PCAOB, 2017). A
CAM disclosure has two components: (1) the description of the matter and principal considerations
that led the auditor to determine that a matter is critical, and (2) the auditor’s response as to how
the CAM was addressed during the audit engagement. This study examines whether the quantity
and quality of CAM disclosures are associated with litigation risk, financial reporting quality, and
the interaction between the two. It also examines whether and to what extent audit effort and costs
vary with the quantity and quality of CAM disclosures.
The Statement on Audit Standard no. 107, Section 312 (AICPA, 2005), that provides guidance
on auditors’ considerations of audit risks, describes litigation risk as an important component of
auditors’ business risk.1 Indeed, during the entire PCAOB public outreach period prior to the
issuance of the new reporting standard, auditors have expressed as one of the major concerns that
1 SAS no. 107, Section 312, states that auditors are exposed to loss of or injury to their professional practice from
litigation regarding financial statements audited and reported on. Available here:
https://www.aicpa.org/content/dam/aicpa/research/standards/auditattest/downloadabledocuments/au-00312.pdf
2
the new requirements would significantly increase the exposure to legal liabilities.2 For example,
in one of its comment letters, the Center for Audit Quality (CAQ), cautioned on the substantial
risk that whatever the auditor communicates in the report might be challenged after the fact, for
example in a shareholder lawsuit following a stock price decline.3 Recent experimental studies
using jurors as participants, provide mixed findings on the effect of a CAM disclosure on jurors’
assessment of auditor liability (e.g. Brasel et al., 2016; Backof et al., 2018). The evidence seems
inconclusive and it is unclear as to whether and how these findings might affect audit practice.
However, more closely related to this study, earlier archival literature confirms that auditors
consider litigation risks in their reporting decisions. For example, Kaplan and Williams (2013) and
Krishnan and Krishnan (1996) find that ex-ante litigation risk increases the likelihood that auditor
issues a going concern report. Consistent with the litigation hypothesis (Skinner, 1994), these
findings suggest that when litigation risk is high, auditor will issue a report that may serve as a
forewarning to financial statement users in order to preempt negative consequences from eventual
shareholder lawsuits. Hence, I hypothesize that the incentive to mitigate legal liabilities will
motivate the auditor to include more CAMs in the audit report when litigation risk is higher.
The new reporting requirements intend to avoid standardized language since the PCAOB has
guided that each CAM be tailored to the specific audit engagement (PCAOB, 2017). Moreover,
the descriptions are also expected to be at a level that investors and other financial statement users
would understand (PCAOB, 2019). The guidance on plain English writing and issues to avoid
when communicating in regulatory filings, part of the SEC's Plain English Handbook (1998),
reinforces the expectation that auditor disclosures should be easy to read and process. Disclosure
2 The comment letters received in response to the proposed standard for the expanded auditor’s report are available
at: https://pcaobus.org/Rulemaking/Pages/Docket034Comments.aspx and https://www.sec.gov/comments/pcaob-
2017- 01/pcaob201701.htm. 3 The CAQ is an autonomous, nonprofit public policy advocacy organization whose members are public audit firms.
3
readability is defined as the effective communication of relevant information (Loughran and
McDonald, 2014). Bloomfield (2008) proposes a potential negative relationship between litigation
risk and 10-K readability, where in the presence of litigation risks the readability decreases in order
to obfuscate the poor performance and/or because more authority in preparing the report is handed
over to lawyers who normally use more complex language and legal jargon. Therefore, I
hypothesize that CAMs readability is decreasing in auditor perceived litigation risk.
Traditionally, the majority of audit opinions have been unqualified (Brazel et al., 2011) and,
since they are all very similar, it has been difficult to infer the relative financial reporting quality
from the audit report. However, often auditors have followed professional standards that enable
them to include, at their discretion, additional paragraphs of emphasis of a matter to the traditional
unqualified audit report. Czerney et al. (2014) find that financial statements with audit reports
containing additional explanatory language are significantly more likely to be subsequently
restated than financial statements without such language, suggesting that auditors will report
consistent with the inherent quality of financial statements. However, the line of research that
evidences negative consequences such as client loss and decrease in future clients and fee growth
(e.g. Lennox, 2000; Ettredge et al., 2011; Newton et al., 2016; Cowle and Rowe, 2018), suggests
that audit market penalizes auditors for reporting information critical of management. Since CAM
disclosures relate to matters that are both critical and material, they might be a source of tension
or disagreement between auditor and client to the point that the auditor chooses to maintain an
amiable relationship rather than making the client “look bad” when reporting CAMs.
I expect these two countervailing forces to affect the quantity and quality of CAM disclosures
in different ways. Consistent with the notion that auditors will feel legally obligated to touch upon
critical issues but not necessarily increase clarity on the issues, I hypothesize that as the quality of
4
financial reporting decreases, the number of CAMs in the audit report will increase, while CAMs’
readability will decrease. This is also consistent with the notion that qualitative disclosure is more
difficult to verify and with the literature that suggests that managers write less readable disclosures
in order to obfuscate poor performance and poor reporting quality (i.e. obfuscation hypothesis Li,
2008; Lo et al, 2017) or because the accounting issues are inherently more complex, (i.e.
information hypothesis in Bloomfield, 2008).
Next, I also consider the interaction between litigation risk and financial reporting quality.
Based on the above arguments, I expect litigation risk to accentuate the relationship between
financial reporting quality and CAMs disclosure whereby in presence of litigation risk, financial
reporting quality is negatively (positively) associated with CAMs number (readability).
Lastly, I turn the focus on whether audit effort and costs vary with the number and readability
of CAMs communicated in the audit reports. Prior studies that examine consequences of similar
standard requirements in other jurisdictions such as the United Kingdom and New Zealand, (e.g.
Reid et al., 2019; Li et al., 2018) report mix findings. The evidence seems inconclusive and it is
unclear as to whether and how audit fees will vary in the U.S. following the new standard.
However, some of the audit firms have noted that they have prepared to meet the new reporting
requirements by training auditors and performing CAM disclosures dry runs (CAQ, 2018b).
Additional auditor hours appear to be necessary in order to draft, review, and negotiate the new
CAM disclosures with the audit committees. Therefore, I predict that audit firms will increase
audit effort and charge higher audit fees as the number and readability of CAM disclosures
increases.
I obtain CAMs and auditor data from Audit Analytics and client accounting data from
Compustat databases. I limit the sample period to auditor signature date February 29, 2020 in order
5
to control for possible effects on auditor reporting behavior from COVID-19. The proxy for
litigation risk follows the notion that auditor litigation risk arises solely from the association with
the client (Bell et al., 2001). Therefore, I create an indicator for whether the client operates in a
highly litigious industry following Francis et al. (1994) who shows that shareholder litigation of
corporate disclosure varies with the industry. Their findings have been supported by later studies
(e.g. Kaplan and Williams, 2013) who find higher levels of auditor litigation risk in certain
industries such as computers, electronics, and biotechnology. Next, I use the absolute value of
discretionary accruals estimated as suggested in Kothari et al. (2005) to proxy for financial
reporting quality. I use Bog index and text length in wordcount as measures of CAMs readability
while also examining the readability of CAM components: description and auditor response. Audit
effort and costs are proxied by audit fees and audit report lag.
I estimate a regression model for the number and readability of CAMs in the auditor report
depending on litigation risk, financial reporting quality, interaction between the two, and other
covariates. Consistent with my prediction in the first hypothesis, I find a positive and significant
association between litigation risk and number of reported CAMs, suggesting that auditors will
attempt to mitigate legal liability by communicating more CAMs in their report. The CAMs
readability, however, is not associated with litigation risk and I cannot reject the null in this case.
Furthermore, as predicted, there is a negative association between financial reporting quality and
the number of CAMs communicated in the audit report. The CAMs readability, however, is not
associated with financial reporting quality and I cannot reject the null. Lastly, the interaction
between litigation risk and financial reporting quality does not have an incremental effect on the
number of CAMs but a significantly negative effect on CAMs readability as measured by the Bog
6
index. Overall, these results suggest complementary effects of litigation risk, financial reporting
quality, and their interaction on the number and readability of reported CAMs.4
To test my last set of hypotheses, following prior related literature (e.g. Reid et al., 2019;
Gutierrez et al., 2018), I estimate an OLS regression that models audit fees and audit report lag.
As expected, the test results show that as the number of CAMs in audit report increases, audit
effort and costs increase providing support for the hypothesis. However, while audit fees are not
affected by CAMs readability or wordcount, the audit report lag is affected only by the CAMs
length (wordcount) but not by CAMs readability. Thus, I cannot reject the null hypotheses in this
case. These results are consistent with the notion that auditors will disclose issues they are legally
obligated to, without necessarily making them more readable or understandable. Future research
can examine why auditors focus on making the CAMs lengthier rather than making them more
readable, and to what extent CAMs disclosure represent boilerplate language.
This study faces a few limitations that remain to be addressed by future research. First, the
changes in reporting requirements are very recent and the limited sample size may limit the power
of some of the tests which may not be able to detect a significant effect even if there is one. Second,
this study uses only one year of data and therefore cannot determine whether the increase in audit
costs are of temporary or persistent nature. Nevertheless, I believe that my results suggesting a
negative association between financial reporting quality and number of reported CAMs can be of
interest to investors when evaluating the CAMs disclosed in the audit report. Moreover, the results
suggesting a positive association between number of reported CAMs and audit fees can be of
4 In untabulated analysis, I explore the extent of boilerplate language in CAMs using WCopyFind program (e.g.,
Campbell et al., 2020) to capture language similarity between each pair of CAMs. Results from regressions with
Quadratic Assignment Procedure for dyadic boilerplate data show a positive and significant coefficient on pairwise
Litigation risk. Moreover, a comparison of standardized coefficients from QAP analysis suggest that language
similarity in CAMs is mainly affected by audit firm (0.640, p<0.001), CAM topic (0.195, p<0.001), litigation (0.013,
p<0.005), audit office (0.012, p<0.001), and audit partner (0.009, p<0.001).
7
interest to managers when exploring ways to mitigate the high audit costs and long audit report
lags. The results suggesting a positive association between litigation risk and number of reported
CAMs confirm that auditors report consistent with their concerns voiced during the PCAOB public
outreach period prior to standard adoption and can be of interest to standard setters when
evaluating the cost benefits of new reporting requirements.
This study extends prior literature in three important ways. This is the first study to examine
the reporting of CAMs in response to litigation exposure. I extend prior literature that examines
auditor reporting behavior in relation to litigation risk (e.g., Kaplan and Williams, 2013; Krishnan
and Krishnan, 1996) by showing that auditors will communicate more CAMs to financial
statements users when they perceive higher litigation risk. Second, this study is the first to examine
how CAMs communicated in the audit report relate to financial reporting quality and provides
evidence consistent with auditor reporting reflecting the quality of financial statements. Lastly,
this study extends prior audit fees literature by examining the association between audit fees and
number of reported CAMs. I provide evidence consistent with the notion that increased effort is
required when preparing audit reports that include greater number of CAMs.
The remainder of this study is organized as follows: Section 2 provides background
information on auditor report requirements, reviews the related literature, and develops the
hypotheses. Section 3 explains the research design. Section 4 describes the results and Section 5
concludes.
2. Background and hypotheses development
2.1. Background Information
In June 2017 the PCAOB adopted the new auditor’s reporting standard – AS 3101: The
Auditor's Report on an Audit of Financial Statements When the Auditor Expresses an Unqualified
8
Opinion – with the objective of making the audit report more relevant to investors by requiring
auditors to provide more information about the specific audit engagement. The standard introduced
the most significant change to the audit report in the last 70 years – a considerable expansion of
the binary model. Prior research on users’ assessment of the auditor’s report has evidenced the
existence of an expectation gap between financial statement users and auditors (Church et al.,
2008). While still useful as confirming evidence, the traditional pass/fail audit report has been
considered insufficient in the recent increased information asymmetry between investors and
companies due to growing complexity in financial reporting (Ferguson, 2016). Thus, the AS 3101
aims at narrowing, if not closing, the expectation gap formed over years between investors’
demand for information and what audit reports provide.
The new standard is the culmination of a long process that began with the U.S. Department of
the Treasury’s Advisory Committee on the Auditing Profession recommending on its 2008 Final
Report that PCAOB should consider making improvements to the auditor’s standard reporting
model. Following this recommendation, the PCAOB started a process of outreach to investors,
auditors, audit committee members, and preparers of financial statements asking for their views
on audit report. Based on the concerns expressed from investors and other financial statement
users, in June 2011 the PCAOB issued a concept release seeking public comments on potential
changes to the audit reporting model.5
In August 2013—two years and 155 comment letters later—the Board issued the first proposal
of the new auditor reporting standard which received great interest from many different
stakeholders.6 The inclusion of CAMs as part of an expanded audit report draw particular attention.
5 See the PCAOB’s Concept Release at https://pcaobus.org//Rulemaking/Docket034/Concept_Release.pdf 6 Comment letters received in response to the proposed standard for the expanded auditor’s report are
available at: https://pcaobus.org/Rulemaking/Pages/Docket034Comments.aspx and
https://www.sec.gov/comments/pcaob-2017- 01/pcaob201701.htm.
9
The majority of the commenters shared the PCAOB view that CAMs could help investors and
other financial statement users focus on aspects of financial statements that the auditor also found
to be challenging and could enable them to analyze more closely any related financial statement
accounts and disclosures. However, there were some investors that believed the proposal did not
go far enough in mandating that auditors share their expert opinions of risks in the company's
accounting, financial reporting, or operations. Meanwhile, many of the auditors commented that
the requirements were too burdensome (Hanson, 2016).
Among the suggestions for improving the proposed standard, the CAQ cautioned that any
expansion of the auditor’s report is almost certain to lead to additional legal liability exposure for
the independent auditor: “There is a real and substantial risk that whatever the auditor says will be
challenged, after the fact, for example following a stock price decline. An investor might allege
that the auditor should have said more in its reporting of CAMs, claiming that some detail known
to the auditor should have been communicated in the report.”7
After considering the different perspectives from all interested parties, in June 2017, the
PCAOB adopted the new auditor reporting standard, AS 3101, approved by the SEC in October
2017. According to AS 3101, the audit report should disclose CAMs encountered during a specific
audit engagement where a CAM is defined as a matter required to be communicated to the audit
committee, that relates to accounts or disclosures that are material to the financial statements, and
involved especially challenging, subjective, or complex auditor judgment. Besides the topic, the
CAM disclosure includes a description of the matter and principal considerations that led the
auditor to determine the matter as a CAM, and how the CAM was addressed during the audit
(PCAOB, 2019; CAQ, 2018). Although research findings have suggested that the auditor’s report
7 https://pcaobus.org/Rulemaking/Docket034/99b_CAQ.pdf
10
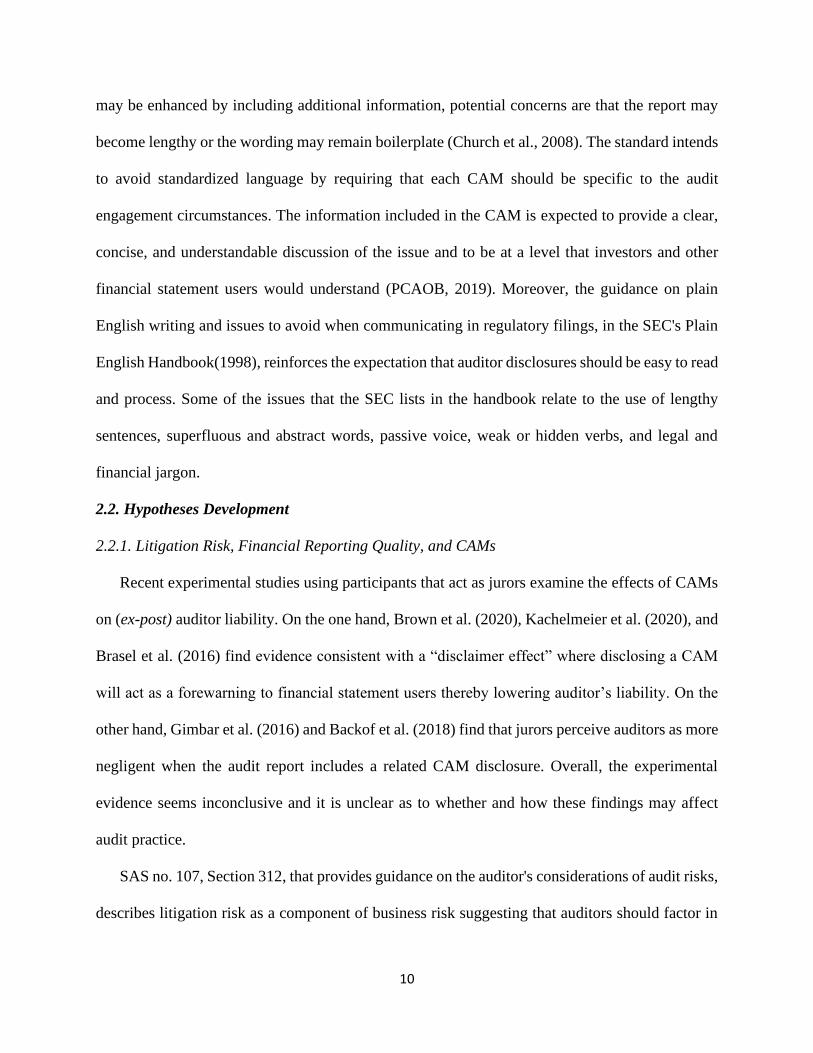
may be enhanced by including additional information, potential concerns are that the report may
become lengthy or the wording may remain boilerplate (Church et al., 2008). The standard intends
to avoid standardized language by requiring that each CAM should be specific to the audit
engagement circumstances. The information included in the CAM is expected to provide a clear,
concise, and understandable discussion of the issue and to be at a level that investors and other
financial statement users would understand (PCAOB, 2019). Moreover, the guidance on plain
English writing and issues to avoid when communicating in regulatory filings, in the SEC's Plain
English Handbook(1998), reinforces the expectation that auditor disclosures should be easy to read
and process. Some of the issues that the SEC lists in the handbook relate to the use of lengthy
sentences, superfluous and abstract words, passive voice, weak or hidden verbs, and legal and
financial jargon.
2.2. Hypotheses Development
2.2.1. Litigation Risk, Financial Reporting Quality, and CAMs
Recent experimental studies using participants that act as jurors examine the effects of CAMs
on (ex-post) auditor liability. On the one hand, Brown et al. (2020), Kachelmeier et al. (2020), and
Brasel et al. (2016) find evidence consistent with a “disclaimer effect” where disclosing a CAM
will act as a forewarning to financial statement users thereby lowering auditor’s liability. On the
other hand, Gimbar et al. (2016) and Backof et al. (2018) find that jurors perceive auditors as more
negligent when the audit report includes a related CAM disclosure. Overall, the experimental
evidence seems inconclusive and it is unclear as to whether and how these findings may affect
audit practice.
SAS no. 107, Section 312, that provides guidance on the auditor's considerations of audit risks,
describes litigation risk as a component of business risk suggesting that auditors should factor in
11
litigation risks when setting fees, planning and conducting their work, and also when issuing
reports (AICPA, 2005). Literature has shown that auditors face considerable reputation losses
beyond litigation damages (Weber et al., 2008; Skinner and Srinavasan, 2012). Given the potential
financial and reputational costs at stake, auditors respond in some way to heightened litigation
risk. Consistently, prior archival research finds that litigation risk is positively associated with
audit fees (Venkataraman et al., 2008) and auditor resignation (Shu, 2000; Krishnan and Krishnan,
1997). Moreover, consistent with litigation hypothesis (Skinner, 1994), studies also confirm that
auditors consider litigation risk in their reporting decisions. For example, Kaplan and Williams
(2013) and Krishnan and Krishnan (1996) find that higher perceived litigation risks increase the
likelihood that auditor issues a going concern report. These findings suggest that when litigation
risk is higher, auditors may issue a report that serves as a warning to financial statement users in
order to preempt negative consequences like shareholder lawsuits and associated legal costs. Thus,
I expect auditors to increase the number of reported CAMs in the presence of high litigation risk.
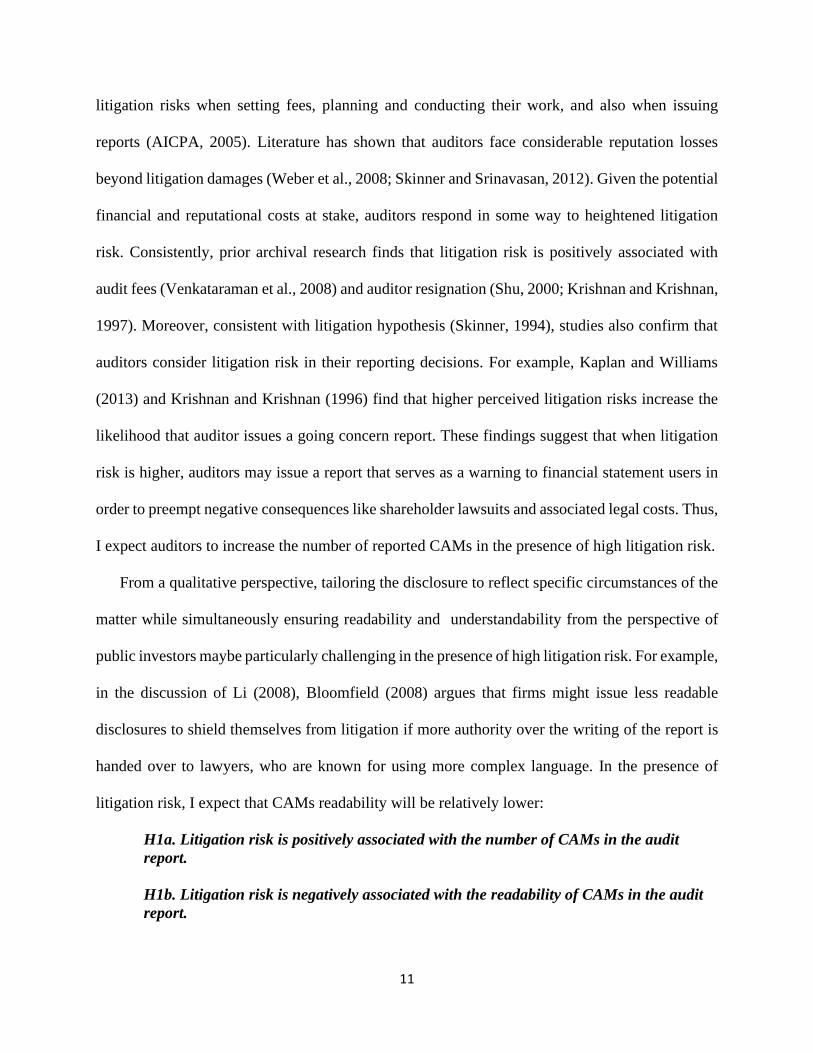
From a qualitative perspective, tailoring the disclosure to reflect specific circumstances of the
matter while simultaneously ensuring readability and understandability from the perspective of
public investors maybe particularly challenging in the presence of high litigation risk. For example,
in the discussion of Li (2008), Bloomfield (2008) argues that firms might issue less readable
disclosures to shield themselves from litigation if more authority over the writing of the report is
handed over to lawyers, who are known for using more complex language. In the presence of
litigation risk, I expect that CAMs readability will be relatively lower:
H1a. Litigation risk is positively associated with the number of CAMs in the audit
report.
H1b. Litigation risk is negatively associated with the readability of CAMs in the audit
report.
12
The public auditor has the critical role of providing reasonable assurance that the financial
statements are free of material misstatements (PCAOB, 2018). However, the traditional model has
led to a highly standardized audit report that provides little information to financial statements
users. The majority of audit opinions are unqualified (Brazel et al., 2011). As such, it is difficult
to infer anything with respect to the relative financial reporting quality of public companies.
Auditors, however, often have followed professional standards that enable them to include, at
their discretion, additional paragraphs of emphasis of a matter to the traditional unqualified audit
report. Czerney et al. (2014) examine whether there is an association between the additional
explanatory language and financial statements quality and find that financial statements with audit
reports containing explanatory language are significantly more likely to be subsequently restated
than financial statements without such language. Their results support the notion that auditors can
expand their reports in order to reflect the inherent quality of financial statements.
However, unlike the explanatory language, CAM disclosure relates to matters that are both
critical and material and may serve as a source of tension or disagreement between the auditor and
the client to the point that would cause the auditor to choose between maintaining an amiable
relationship or risk making the client “look bad” when reporting CAMs. Prior literature examining
the behavior of unhappy clients evidences a higher likelihood of client loss. Lennox (2000) finds
that auditor changes occur more often after companies receive modified opinions. Also, Ettredge
et al. (2011) and Newton et al. (2016) show that clients engage successfully in shopping for clean
internal control opinions. Furthermore, the loss of a client can have a negative domino effect on
other clients, too. For example, Cowle and Rowe (2018) examine whether the audit market
penalizes auditors for reporting information critical of management and find that following the
issuance of an internal control material weakness audit opinion, the audit firm experiences an
13
overall decrease in future clients and fee growth. These results support the notion that the audit
market disincentivizes auditors from disclosing critical information about their clients.
These two countervailing forces may affect the quantity and quality of CAM disclosures in
different ways. On the one hand, in order to comply with standard requirements and professional
standards, we would expect auditors to expand their reports and the number of CAMs to increase
as the financial statements quality decreases, thus reflecting a number of accounting issues. On the
other hand, from a qualitative perspective, it is inherently more difficult to write about critical
issues. Moreover, prior studies argue that qualitative disclosure shares key characteristics of cheap
talk and is usually more difficult to verify, compared to quantitative disclosure (Baginski et al.,
2016). Further, management disclosures literature shows that managers write less readable
disclosures in order to obfuscate poor performance (Li, 2008; Lo et al, 2017), supporting the notion
that managers may not want investors to understand a subject they are legally obligated to touch
upon. To the extent that auditors feel compelled to tailor the disclosure in a way that does not make
them and their client “look bad”, they are likely to craft more complex and less readable CAM
disclosures. Hence, the second set of hypotheses:
H2a. Financial reporting quality is negatively associated with the number of CAMs in
the audit report.
H2b. Financial reporting quality is positively associated with the readability of CAMs
in the audit report.
Lastly, we also need to consider the interplay between litigation risk and financial reporting
quality. Prior literature suggests that the audit environment and jurors culpability conclusions
create incentives for “overly cautious audits” or “defensive auditing” (Peecher et al., 2013). Based
on the arguments explained above, it is likely that litigation risk will accentuate the relationship
between financial reporting quality and CAMs disclosure. Hence the third set of hypotheses:
14
H3a. In presence of litigation risk, financial reporting quality is negatively associated
with the number of CAMs in the audit report.
H3b. In presence of litigation risk, financial reporting quality is positively associated
with the readability of CAMs in the audit report.
2.2.3. CAMs in the Audit Report and Audit Effort
An increase in audit costs due to increased audit effort has been another major concern of
auditors during the discussions of the new standard proposal. AS 3101 requires the auditor to
disclose in the report the critical matters encountered during the specific audit engagement. The
disclosure of each CAM should include a description of the CAM that includes the principal
considerations that led the auditor to determine that the matter is a CAM, and an explanation of
auditor’s response to address the issue during the audit. Thus, relative to the binary pass/fail, the
new model represents a significant expansion in the audit report which would require increased
audit effort on both, the quantity and quality of disclosures. Quantitatively, auditors would spend
more audit hours when the number of critical matters they address increases and these matters are
disclosed in the report. From a qualitative perspective, tailoring the disclosure to reflect specific
circumstances of the matter while ensuring understandability from the perspective of public
investors would also require additional hours in preparing the audit report. Therefore, we would
expect higher audit effort as the number and readability of CAMs disclosed in the audit report
increases.
Studies examining similar requirements in other jurisdictions provide inconclusive evidence.
Reid et al. (2019) and Gutierrez et al. (2018) examine the impact of auditor report changes in the
U.K. and find no evidence of a significant increase in audit fees. On the other hand, Li et al. (2018)
investigates the impact of new and revised audit reporting standards on audit fees in the New
Zealand and find evidence of a significant increase in audit fees.
15
In the U.S. some of the audit firms have noted that they have been preparing to meet the new
reporting requirements by training auditors and performing CAM disclosures dry runs prior to the
standard effective date. Additional auditor hours appear to be necessary in order to identify and
also to draft, review, and discuss more readable CAMs in the audit report. In response, audit firms
are expected to increase audit effort and charge higher audit fees as the number and quality of
CAM disclosures increases.
H4a. The number of CAMs in the audit report is positively associated with the audit
effort (costs).
H4b. The readability of CAMs in the audit report is positively associated with the audit
effort (costs).
I acknowledge that, due to audit market competition, audit firms might not be able to transfer
the additional costs to client firms and are constrained to absorb this burden, or the dry runs have
prepared auditors to effortlessly draft and report the critical matters. The extent to which these
occur, biases against my predicted results.
3. Research design
3.1. Sample Construction and Variable Definition
This study performs an analysis of the cross-sectional variation of number of CAMs in the
expanded audit reports. The sample includes client firms with large accelerated filer status with
available data on Compustat and Audit Analytics. Since June 30, 2019, auditors have started to
disclose CAMs in the audit report and Audit Analytics has been tracking the CAMs communicated
in each report. I obtain from Audit Analytics data feed the text files containing the Description and
the auditor Response for each CAMs and combine these components to create the CAM disclosure.
I limit my sample period to February 29, 2020 for the auditor signature date, in order to control for
possible changes in auditor reporting behavior due to negative consequences from COVID-19.
16
I start with measuring the readability scores for each CAM (Cam_Readability) and its
respective components, Description (Descr_Readability) and Response (Resp_Readability). I use
three readability measures from prior research. The first is the Bog Index, a new multi-faceted
readability measure, which captures the plain English writing attributes recommended by
linguistics experts and highlighted in the SEC’s Plain English Handbook (SEC, 1998b). This
measure has been introduced and validated by the multi-method study from Bonsall IV et al. (2017)
and is constructed using the StyleWriter software. The Bog index rates the style and readability of
a document according to document type and the target audience. I set these criteria as “Report”
and “Public”, respectively. The formula considers three elements: Sentence Bog, which identifies
readability issues stemming from sentence length and is higher for longer sentences; Word Bog,
which captures the word difficulty and considers issues from overwriting, passive verbs, hidden
verbs, legal terms, and wording phrases based on a proprietary list of more than 200,000 graded
words, instead of simply counting syllables or word length as in traditional measures; and, Pep
which reduces the index because it captures writing attributes that facilitate the understanding of
a text by summing items such as interesting words and sentence variety. By construction, higher
values of Bog index (Bog) indicate lower readability. I also employ the simple document length
measured by the number of words contained in the document (Length).
Next, I aggregate the data at the client firm level to calculate the number of critical matters
(nrCAMs) communicated in the audit report and other variables, from merging with accounting
data from COMPUSTAT, and audit fees and internal control weaknesses data from Audit
Analytics. The proxy for litigation risk is based on the notion that auditor litigation risk of
shareholders lawsuits arises solely from the association with the client (Bell et al., 2001). Hence,
I follow prior literature (e.g. Francis et al., 1994; Cassell et al., 2013) and create an indicator
17
variable, Litigation, equal to one for client firms in highly litigious industries such as
biotechnology (SIC codes 2833-2836), computers (SIC codes 3570-3577 and 7370-7374),
electronics (SIC codes 3600-3674), and retailing (SIC codes 5200-5961), and zero otherwise. To
proxy for financial reporting quality, I use the absolute value of discretionary accruals (Abs_da)
estimated from a regression based on the Jones (1991) modified model (Dechow et al. 1995) as
adjusted for performance in Kothari et al. (2005). By construction, higher values of absolute
discretionary accruals indicate lower financial reporting quality. Lastly, to measure audit costs and
effort, I use audit fees and audit report lag from the fiscal year-end date, respectively. See
Appendix B for a detailed definition of all the variables and respective data sources.
3.2. Empirical Models
3.2.1. Litigation Risk, Financial Reporting Quality, and Reported CAMs
The first set of hypotheses predicts that for clients in litigious industries the auditor is more
likely to issue a relatively more expanded report disclosing a greater number of CAMs that are
more complex or less readable. The second set of hypotheses predicts that the financial reporting
quality is positively related to the number of CAMs and CAMs that are more difficult to process.
The third set of hypotheses predicts an interaction effect where the presence of litigation risk will
accentuate the relationship between financial reporting quality and quantity and quality of CAMs
disclosure. To test these hypotheses, I estimate the following regression model:
CAMs = β0 + β1(Litigation) + β2(Abs_da) + β3(Litigation x Abs_da) + β4(Tenure) + β5(Big4)
+ Β6(Busy) + β7(Size) + β8(Countweak) + β9(Mtb) + β10(Roa) + β11(Leverage) +
β12(Loss) + β13(Exter_fin) + β14(Restruct) + β15(Complexity) + β16(Inventory) +
β17(Receivables) + IND + ε (1)
The dependent variable CAMs is either the number of issues included as CAMs in the audit
report (nrCAMS) or the Readability of CAMs proxied by the measures explained above. Litigation
is the indicator equal to one when the client operates in a litigious industry and zero otherwise;
18
H1a predicts a positive β1 when the model estimates the number of CAMs and H1b predicts a
negative β1 when the model estimates CAMs readability. Abs_da is the absolute value of
discretionary accruals estimated based on Kothari et al. (2005) model; H2a predicts a positive β2
when estimating the number of CAMs and H2b predicts a negative β2 when estimating CAMs
readability. The interaction term captures the incremental effect of financial reporting quality on
CAMs in presence of litigation risk; H3a predicts a positive β3 when estimating the number of
CAMs and H3b predicts a negative β3 when estimating CAMs readability. The model controls for
the effects of auditor size (Big4), familiarity with client’s issues (Tenure) and a busy financial
reporting season (Busy). I also control for issues potentially arising from client’s internal controls
or other business operations and activities that could affect the variables of interest. Hence,
Countweak is the number of internal control weaknesses over financial reporting, Complexity is
the logarithmic value of the number of operating segments, Receivables is the amount of accounts
receivable scaled by total assets, and Inventory is the total value of inventory scaled by total assets.
I also control for events that could make the audit process more challenging by including the
variable Restruct that captures whether the firm underwent any restructuring during the fiscal year.
Moreover, firms that experience a loss or financial distress may systematically differ from other
firms in terms of litigation risk or financial reporting. Thus, the model controls for net loss (Loss),
debt (Leverage), and external financing (Exter_fin). Next, I control for other firm characteristics
typically affecting reporting quality such total assets (Size), performance (Roa), and growth (Mtb).
Lastly, to capture CAMs systematic differences across industries I include industry fixed effects
(IND).
3.2.2. Reported CAMs and Audit Fees and Audit Report Lag
19
My fourth set of hypotheses predicts a positive association between number and readability of
CAMs communicated in audit report and audit effort and costs. Following the audit fees literature
(e.g., Hay et al., 2006) and the literature that examines audit fees as the result of expanded auditor
report in other institutional settings (e.g., Reid et al., 2019; Gutierrez et al., 2018; Li et al., 2018),
I estimate the following regression model:
Ln_AFees (or Ln_Replag) = γ0 + γ1(nrCAMs or Readability) + γ2(Big4) + γ3(Tenure) +
γ4(Busy) + γ5(Size) + γ6(Countweak) + γ7(Complexity) + γ8(Age) +
γ9(Restruct) + γ10(Cfo) + γ11(Receivables) + γ12(Inventory) +
γ13(Loss) + γ14(Mtb) + γ15(Roa) + γ16(Exter_fin) + γ17(Zscore) +
γ18(Litigation) + γ19(Abs_da) + IND + ε (2)
The dependent variable is either the natural logarithm of audit fees (Ln_AFees) or the natural
logarithm of audit report lag (Ln_Replag) calculated as the number of days between the fiscal year-
end date and the auditor signature date. nrCAMs is the number of critical matters communicated
in audit report and H4a predicts a positive and significant γ1 coefficient. Readability refers to one
of the scores described above, which are decreasing in higher readability, and H4b predicts a
negative and significant γ1 coefficient. Since audit effort may vary based on financial reporting
season and quality and expertise of the auditor, the model controls for auditor quality (Big4),
knowledge of client (Tenure) and busy season (Busy). Next, larger and more complex client firms
require greater effort from the auditor during the audit engagement. Therefore, I control for client
total assets (Size), operating segments (Complexity), cash flows from operations (Cfo), inventories
(Inventory), and accounts receivable (Receivables). The model also controls for the effect of
weaknesses in the internal controls over financial reporting (Countweak) and restructuring events
(Restruct) on both, audit efforts and critical matters in audit report. I also include control variables
that capture difficulties in the audit arising from client performance (Roa), operating loss (Loss)
and financial distress (Exter_fin, Zscore). I also consider cases when auditing may require different
levels of effort depending on client growth (Mtb) and life cycle (Age). Moreover, I control for
20
litigation risk and quality of financial reporting because, as explained above, I expect those to
affect CAMs, while literature suggests they also affect audit effort. To capture any other systematic
differences in audit effort across industries I include industry fixed effects based on the two-digit
SIC codes (IND).
4. Results
4.1. Descriptive Statistics and Univariate Results
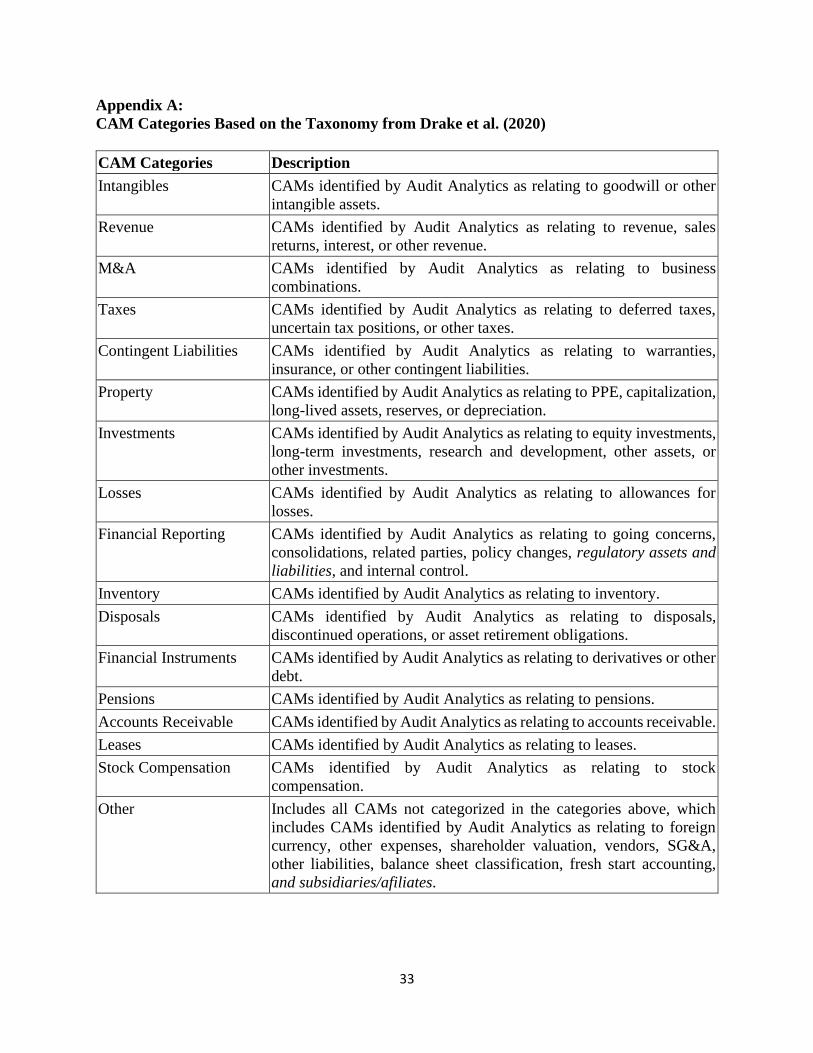
Table 1 reports the number of CAMs per each topic. I create the frequency distribution of
CAMs across several topic categories as illustrated in Figure 1a, borrowing the taxonomy from
Drake et al. (2020, pg.26) for consistency with the related literature. From a total of 3,124 reported
CAMs, the most frequent categories are Intangible assets including Goodwill (16 percent),
Revenues (15 percent), M&A or business combinations (12 percent), and Taxes (10 percent). The
financial reporting issues represent about 6% of the total CAMs and include, among others, matters
related to internal controls, policy changes, and related party transactions. The less frequent CAMs
are included in the category Other and relate to foreign currency, regulatory assets and liabilities,
shareholder valuation, SG&A, vendors, other expenses, other liabilities, balance sheet
classification, and fresh start accounting. For more details on CAM categories formation refer to
Appendix A borrowed from Drake et al. (2020). Figure 1b shows CAM frequency by auditor. EY
has disclosed the highest number of CAMs, about 31 percent of the total. Other non-Big 4 auditors
overall disclosed less than ten percent. This is not surprising given that these clients are large
accelerated filers and are mostly audited by larger auditors.
After aggregating the CAMs data from Audit Analytics, there are 1,896 unique audit client-
year observations. Figure 1c shows that the number of CAMs per audit report ranges from one to
five where the majority (52 percent) of audit reports disclose only one CAM. All issuers received
21
at least one CAM in the audit report and this is consistent with the expectation mentioned in the
new audit standard (AS 3101.12).8 As shown in Table 2, Panel A, which presents the descriptive
statistics for the full sample at the audit report level, the average number of disclosed CAMs is
1.65 CAMs per report, and less than 25 percent of audited clients have three or more CAMs.
Furthermore, 24 percent of sample client firms are part of a highly litigious industries, less than
25 percent have a range of one to six material weaknesses in the internal controls over financial
reporting, and 90 percent of them are audited by one of the big four public accounting firms.
Table 2, Panel B presents descriptive statistics of readability scores at the CAM level. The Bog
index (Cam_Bog) ranges from 56 to 238, with a mean score of 114. Recall that higher values of
Bog indicate lower document readability and the threshold that StyleWriter sets to the rate of
“Excellent Writing” of a public report is a score of 30, meaning that none of the CAMs disclosed
represents an excellent writing. To put these measures in perspective, Bonsall et all. (2017) show
that the mean Bog of 10-K and management prospectus filings are about 84 and 86, respectively,
after fiscal year 2000. This is consistent with the results of a more recent study, Cassell et al.
(2020), who also find that while the SEC initial comment letters have a mean Bog index of 60, the
companies’ responses are more difficult to read as the mean Bog index is 78. Summarizing, it
appears that on average, auditor CAM disclosures readability as measured by the Bog index is
lower than 10-Ks and SEC comment letters. When examining each of the components, CAM
description and auditor response, separately, the results show that both indexes have much wider
ranges—which suggests a higher variability in these components’ readabilities—than in the case
8 AS 3101.12 states that it is expected that, in most audits, the auditor would determine that at least one matter involved
especially challenging, subjective, or complex auditor judgment.
22
of whole CAMs.9 The next measure, wordcount (Cam_length) ranges from 122 to 1,109 words
with a mean 360 words.
Table 3 shows the results from the univariate tests. As preliminary evidence, we observe
positive and significant coefficients of correlations between the number of CAMs (nrCAMs) and
audit fees (Ln_afees), and between the number of CAMs (nrCAMs) and audit report lag
(Ln_Replag). There are also positive coefficients of correlations between litigation risk (Litigation)
and the number of CAMs (nrCAMs), and absolute value of discretionary accruals (Abs_da) and
the number of CAMs (nrCAMs), albeit of a weaker magnitude. Furthermore, the coefficients of
correlation between litigation risk and disclosure readability are negative across all measures. On
the other hand, the correlation coefficients between audit effort and disclosure readability are
positive across all different measures. Meanwhile the correlation coefficients between financial
reporting quality and disclosure readability are not consistent. I next proceed with multivariate
tests to control for confounding effects from the other identified factors.
4.2. Multivariate Results
4.2.1. Litigation Risk, Financial Reporting Quality, and Reported CAMs Test Results
Table 4 shows the results from model 1 when the dependent variable is the number of CAMs.
I estimate a negative binomial regression to examine how litigation risk, financial reporting
quality, and their interaction are related to the number of CAMs in the audit report. The first
column shows the results before adding the interaction term while the second column shows the
results from the expanded model. In both columns the coefficient on Litigation is positive and
highly significant (0.1367, p<0.01; 0.1616, p<0.01) which suggests a positive association between
9 The zero minimum values of in the response component represent few cases of Going Concern CAM topic where
the auditor do not provide explanations of how they addressed the matter during the audit.
23
auditor perceived litigation risk and number of CAMs in the audit report, providing support for
H1a. The coefficient on Abs_da is also positive and significant in both columns (0.7270, p<0.01;
0.9615, p<0.01) which suggests a positive association between financial reporting quality and
number of CAMs in the audit report, providing support for H2a. Lastly, the coefficient on the
interaction term has a negative sign but is not significant at conventional levels. Thus, H3a is not
supported.
Regarding the control variables, thet number of CAMs per audit report is positively associated
with client firm size (Size), number of internal control weaknesses (Countweak), operating loss
(Loss), number of segments (Complexity), and restructuring events (Restruct). Meanwhile, the big
four public accounting firms (Big4) seem to disclose relatively fewer CAMs per report. Lastly,
growth client firms (Mtb) receive fewer CAMs per report, on average.
Table 5 shows the results from model 1 when estimating OLS regressions at the CAM level
where the dependent variable is either the readability of CAMs (column 1), or the readability of
descriptions (column 2), or the readability of responses (column 3), measured by the logarithmic
values of Bog and the total number of words. Across different measures (panels A and B), the
coefficient on Litigation is not significant (column 1). Even when examining separately each
component, CAM description (columns 2) and auditor response (column 3), the results do not
support any association between litigation risk and readability. Thus, H1b is not supported.
Next, results in panels A and B show that the coefficient on Abs_da is not significant (column
1). I examine separately each CAM component and while there is no supporting evidence for the
association between financial reporting and CAM description readability (column 2), the evidence
from auditor response (column 3) is inconsistent since only the result in panel B seem to suggest
24
that as the financial reporting quality decreases the auditor responses in CAM disclosures become
more lengthy. Thus, H2b is not supported.
Lastly, the coefficient on the interaction term between Litigation and Abs_da is significantly
positive when using the Bog measure but insignificant when using the wordcount measure. This
implies that even though CAMs are not necessary lengthier, they are less readable and
understandable as the financial reporting quality decreases, in presence of litigation risk. Given
that this reconciling explanation implies that financial reporting quality is positively associated
with CAMs readability, I conclude that H3b is supported. Interestingly, results from examining
each component separately in panel A, suggest that the significance on the interaction coefficient
is because the auditor response (column 3) is less readable (0.5973, p<0.05) and not because the
issue is inherently more complex to describe (the coefficient in column 2 is not significant).
Summarizing, the results show a positive and significant association between litigation risk
and number of CAMs (H1a), a negative and significant association between financial reporting
quality and number of CAMs (H2a), but no significant decrease in CAMs readability (H1b and
H2b). Furthermore, the interaction between litigation risk and financial reporting quality does not
have an incremental effect on the number of CAMs (H3a) but a significantly negative effect on
CAMs readability (H3b) as measured by the Bog index.
4.2.2. Reported CAMs and Audit Fees and Audit Report Lag Test Results
I estimate OLS regressions, as modelled in (2), to test for the association between the quantity
and readability of CAMs and the audit effort and costs proxied by audit fees and audit report lag.
Table 6 reports the results from the tests where the variable of interest is the number of CAMs. In
column 1, audit effort is proxied by the natural logarithm of audit fees and as expected the
coefficient on the number of CAMs is positive and significant (0.0875, p<0.01); in column 2, audit
25
effort is proxied by the natural logarithm of the number of days between client fiscal year-end date
and auditor signature date and as expected the coefficient on the number of CAMs is positive and
significant (0.0124, p<0.05). These results suggest that as the number of CAMs in audit report
increases, audit effort and costs increase as well, providing the support for H4a.10
Further, the coefficients on control variables are largely consistent with prior literature.
Specifically, the big four public accounting firms charge higher audit fees as suggested by the
coefficient on Big4 (0.3001, p<0.01). Furthermore, larger (Size) and more complex client firms
(Complexity, Receivables), and clients undergoing restructuring events (Restruct) and with more
material weaknesses (Countweak) pay higher audit fees as suggested by the significantly positive
respective coefficients.
Table 7, panel A, reports the results from model (2) where the variable of interest is CAMs
readability as measured by the Bog index. These results do not show evidence that supports any
associations between CAMs (Descriptions, Responses) readability and audit fees or audit report
lag. Meanwhile, results in Panel B show that CAMs (Descriptions, Responses) length measured
by the total number of words is not associated with audit fees, but is positively associated with the
audit report lag. When examining CAMs components separately, the results suggest that this
association is driven by the auditor response (column 6) and not the CAM description (column 5).
Given the overall inconclusive results, I cannot reject the null hypotheses of H4b. Summarizing,
while audit fees are not affected by CAMs readability or text length, the audit report lag is affected
only by the CAMs text length but not by CAMs readability. It remains to be examined why auditors
10 In untabulated analyses, I add the firm as its own control in the pre standard adoption period. Although the
requirements took effect in 2019, auditors started preparing since in 2017 when the standard was adopted, hence I
drop years within the transition period and keep only fiscal year 2016 as the sample control period while allowing the
number of CAMs to vary during the fiscal year 2019—the sample treatment period. Result again support the
conclusion that audit fees increase as the number of CAMs in the audit report increases.
26
are disclosing lengthier but not more readable reports and to what extent CAMs disclosures
represent boilerplate language.
5. Conclusions
This study presents early evidence on the number and textual quality of CAMs communicated
in audit reports of large accelerated filers as part of new reporting requirements introduced by AS
3101. Specifically, I examine whether the number of reported CAMs in the audit report and the
readability and length of CAMs varies with litigation risk, financial reporting quality, and the
interaction of these two factors. I also examine whether audit effort proxied by audit fees and audit
report lag varies with the number and readability of CAMs in audit reports. These examinations
are motivated by the discussions and comments from public accounting firms during the PCAOB
public outreach period, prior to the adoption of the new audit standard. These comments suggest
that higher exposure to litigation risk of shareholder lawsuits and related legal costs, as well as
higher audit costs due to increased reporting efforts are the main issues that have concerned
auditors as potential negative consequences of the new reporting requirements.
First, I focus on auditor reporting behavior. One the one hand, I predict that the number of
reported CAMs is increasing in litigation risk, decreasing in financial reporting quality, and
decreasing in the interaction between the two, where in presence of litigation risk, the number of
CAMs increases further more as the quality of financial statements drops. Given that CAMs are
expected to be tailored to the specific engagement and crafted consistently with the SEC’s Plain
English Handbook(1998b) such that investors can easily understand them I also examine CAMs
readability. On the other hand, I predict that CAMs readability is decreasing in litigation risk,
increasing in financial reporting quality, and increasing in the interaction between the two, where
27
in presence of litigation risk, CAMs readability decreases as the quality of financial statements
decreases consistent with obfuscation hypothesis.
The test results show positive and significant association between litigation risk and number
of CAMs (H1a), negative and significant association and between financial reporting quality and
number of CAMs (H2a), but no significant decrease in CAMs readability (H1b and H2b).
Furthermore, the interaction between litigation risk and financial reporting quality does not have
an incremental effect on the number of CAMs (H3a) but a significantly negative effect on CAMs
readability (H3b) as measured by the Bog index. Overall, these results suggest complementary
effects of litigation risk, financial reporting quality, and their interaction on the quantity and quality
of reported CAMs.
Next, I focus on audit effort and costs and predict that audit fees and audit report lag are
increasing in the number of CAMs in audit report, and increasing in CAMs readability and length.
proxied by audit fees and audit report lag. The test results from estimating model (2) show that as
the number of CAMs in audit report increases, audit effort and costs increase. However, while
audit fees are not associated with the readability or length of CAMs, the audit report lag is
associated with CAMs length but not with CAMs readability.
Overall these results are consistent with the notion that auditors will disclose issues they are
legally obligated to, without necessarily making them more readable or understandable. Future
research can examine why auditors spend more time on making the CAMs lengthier but not on
making them more readable, and to what extent CAM disclosures represent boilerplate language.
This study faces a few limitations. First, the changes in reporting requirements are very recent
and the limited sample size may limit the power of some of the tests which may not be able to
detect a significant effect even if there is one. Second, this study uses only one of year data and it
28
is not able to determine whether the auditor reporting behavior and the increase in audit costs are
of temporary or persistent nature. These limitations remain to be addressed by future research.
Nevertheless, I believe that the results reported in this study suggesting a negative association
between financial reporting quality and number of reported CAMs can be of interest to investors
when evaluating the CAMs disclosed in the audit report. Moreover, the results suggesting a
positive association between number of reported CAMs and audit fees can be of interest to
managers when exploring ways to mitigate the high audit costs and long audit report lags. Further,
the results suggesting a positive association between litigation risk and number of reported CAMs
confirm that auditors report consistent with their concerns voiced during the PCAOB public
outreach period prior to standard adoption and can be of interest to standard setters when
evaluating the cost benefits of new reporting requirements.
29
REFERENCES
Backof, A. G., K. O. Bowlin , & B. M. Goodson. 2018. The Importance of Clarification of
Auditors’ Responsibilities Under the New Audit Reporting Standards. Available at
SSRN: https://ssrn.com/abstract=2446057 or http://dx.doi.org/10.2139/ssrn.2446057
Baginski, S., Demers, E., Wang, C., & Yu, J. (2016). Contemporaneous verification of language:
evidence from management earnings forecasts. Review of Accounting Studies, 21(1),
165-197.
Bell, T. B., Landsman, W. R., & Shackelford, D. A. (2001). Auditors' perceived business risk
and audit fees: Analysis and evidence. Journal of Accounting research, 39(1), 35-43.
Bloomfield, R., 2008. Discussion of “annual report readability, current earnings, and earnings
persistence”. Journal of Accounting and Economics, 45(2-3), pp.248-252.
Brasel, K., M. M. Doxey, J. H. Grenier, and A. Reffett. 2016. Risk Disclosure Preceding
Negative Outcomes: The Effects of Reporting Critical Audit Matters on Judgments of
Auditor Liability. The Accounting Review: September 2016, Vol. 91, No. 5, pp. 1345-
1362.
Brazel, J. F., P. Caster, S. Davis, S. M. Glover, D. J. Janvrin, T. M. Kozloski, and M. Pevzner.
2011. Comments by the Auditing Standards Committee of the Auditing Section of the
American Accounting Association on the PCAOB Rulemaking Docket Matter No. 34:
PCAOB Release No. 2011-003, Concept Release on Possible Revisions to PCAOB
Standards Related to Reports on Audited Financial Statement. Current Issues in Auditing
5 (2): C1–C14.
Brown, T., Majors, T.M. and Peecher, M.E., 2020. Evidence on how different interventions
affect juror assessment of auditor legal culpability and responsibility for damages after
auditor failure to detect fraud. Accounting, Organizations and Society, p.101172.
Campbell, J.L., Ettredge, M., Guo, F. and Wiebe, Z., 2020. Information Asymmetry in Spinoffs:
The Role of Incremental Disclosure. Available at SSRN 3220724.
Cassell, C. A., Dreher, L. M., and Myers, L. A., 2013. Reviewing the SEC's Review Process: 10-
K Comment Letters and the Cost of Remediation. The Accounting Review, 88, 6, 1875-
1908.
Center for Audit Quality (CAQ). 2018. Critical audit matters: Key Concepts and FAQs for Audit
Committees, Investors, and Other Users of Financial Statements. Available at:
https://www.thecaq.org/critical-audit-matters-key-concepts-and-faqs-audit-committees-
investors-and-other-users-financial/
Center for Audit Quality (CAQ). 2018b. Critical audit matters: Lessons Learned, Questions to
Consider, and an Illustrative Example. Available at: https://www.thecaq.org/critical-
audit-matters-lessons-learned-questions-consider-and-illustrative-example/
Christensen, B.E., S.M. Glover, and C.J., Wolfe. 2014. Do critical audit matter paragraphs in the
audit report change nonprofessional investors' decision to invest?. Auditing: A Journal of
Practice & Theory, 33(4), pp.71-93.
30
Cowle, E., & S. P. Rowe. 2018. Don't Make Me Look Bad: How the Audit Market Penalizes
Auditors for Doing Their Job. Available at SSRN: https://ssrn.com/abstract=3228321
Czerney, K., Schmidt, J. J., & Thompson, A. M. 2014. Does Auditor Explanatory Language in
Unqualified Audit Reports Indicate Increased Financial Misstatement Risk? Accounting
Review, 89(6), 2115–2149. https://doi-org.ezproxy.uky.edu/10.2308/accr-50836
Dechow, P. M, R. G Sloan, & Sweeney, A. P. 1995. Detecting earnings management. The
Accounting Review, 70 (2), 193-225.
Drake, Katharine D. and Goldman, Nathan C. and Lusch, Stephen J. and Schmidt, Jaime J. 2020.
Have Critical Audit Matter Disclosures Indirectly Benefitted Investors by Constraining
Earnings Management? Evidence from Tax Accounts (May 20, 2020). Available at
SSRN: https://ssrn.com/abstract=3606701 or http://dx.doi.org/10.2139/ssrn.3606701
Ettredge, M., J. Heintz, C. Li, and S. Scholz. 2011. Auditor Realignments Accompanying
Implementation of SOX 404 ICFR Reporting Requirements. Accounting Horizons 25 (1):
17–39.
Ferguson, L. H. 2016. Statement on Reproposed Auditing Standard on the Auditor's Report.
Available at: https://pcaobus.org/News/Speech/Pages/Ferguson-statement-ARM-
051116.aspx
Francis, J., Philbrick, D., Schipper, K. 1994. Shareholder litigation and corporate disclosures.
Journal of Accounting Research, 32 (2), 137–164.
Gimbar, C., B. Hansen, & M. E. Ozlanski. 2016. Early evidence on the effects of critical audit
matters on auditor liability. Current Issues in Auditing, Vol.10, No.1, pp.A24-A33.
Gutierrez, E. F., Minutti-Meza, M., Tatum, K., and Vulcheva, M. 2018. Consequences of
Adopting an Expanded Auditor's Report in the United Kingdom. Review of Accounting
Studies, Forthcoming; University of Miami Business School Research Paper No. 18-1.
Available at SSRN: https://ssrn.com/abstract=2741174
Hanson, J. D. 2016. Statement on Reproposed Auditing Standard on the Auditor's Report.
Available at: https://pcaobus.org/News/Speech/Pages/Hanson-statement-ARM-
051116.aspx
Hay, D., Knechel, W. R., and Wong, N. 2006. Audit fees: A meta-analysis of the effect of
demand and supply attributes. Contemporary Accounting Research 23: 141–91.
Jones, J. J. 1991. Earnings management during import relief investigations. Journal of
Accounting Research, 29 (2), 193-228.
Kachelmeier, S.J., Rimkus, D., Schmidt, J.J. and Valentine, K. 2020. The Forewarning Effect of
Critical Audit Matter Disclosures Involving Measurement Uncertainty. Contemp Account
Res. Accepted Author Manuscript. doi:10.1111/1911-3846.12583
Kaplan, S. E., & Williams, D. D. 2013. Do going concern audit reports protect auditors from
litigation? A simultaneous equations approach. The Accounting Review, 88(1), 199-232.
Kothari, S., A, J. Leone, & Wasley, C. 2005. Performance matched discretionary accrual
measures. Journal of Accounting and Economics, 39 (1), 163-197.
31
Krishnan, J., and Krishnan, J. 1996. The role of economic trade-offs in the audit opinion
decision: An empirical analysis. Journal of Accounting, Auditing, and Finance 3 (Fall):
1607-1638.
Krishnan, J., and Krishnan, J. 1997. Litigation risk and auditor resignations. The Accounting
Review 72 (October): 539-560.
Lennox, C. 2000. Do companies successfully engage in opinion-shopping? Evidence from the
UK, Journal of Accounting and Economics, Volume 29, Issue 3, 321-337.
Li, H. A., and Hay, D., and Lau, D. 2018. Assessing the Impact of the New Auditor's Report.
Available at SSRN: https://ssrn.com/abstract=3120822
Li, F. 2008. Annual report readability, current earnings, and persistence. J.Account.Econ.45,221–
247.
Lo, K., F. Ramos, and R. Rogo. 2017. Earnings management and annual report readability.
J.Account.Econ.63,1-25.
Loughran, T. and McDonald, B., 2014. Measuring readability in financial disclosures. The
Journal of Finance, 69(4), pp.1643-1671.
Newton, N. J., J. S. Persellin, D. Wang, and M. S. Wilkins. 2016. Internal Control Opinion
Shopping and Audit Market Competition. The Accounting Review6, Vol. 91, No. 2, pp.
603-623.
Peecher, M.E., Solomon, I. and Trotman, K.T., 2013. An accountability framework for financial
statement auditors and related research questions. Accounting, Organizations and
Society, 38(8), pp.596-620.
Public Company Accounting Oversight Board (PCAOB). 2017. The Auditor’s Report on an
Audit of Financial Statements When the Auditor Expresses an Unqualified Opinion and
Related Amendments to PCAOB Standards. Release No. 2017-001; June 1. Washington,
D.C.: PCAOB.
Public Company Accounting Oversight Board (PCAOB). 2019. Implementation of Critical Audit
Matters: The Basics. Available at:
https://pcaobus.org/Standards/Documents/Implementation-of-Critical-Audit-Matters-
The-Basics.pdf
Reid, L.C., Carcello, J.V., Li, C., Neal, T.L. and Francis, J.R. 2019. Impact of Auditor Report
Changes on Financial Reporting Quality and Audit Costs: Evidence from the United
Kingdom. Contemp Account Res, 36: 1501-1539.
Securities and Exchange Commission (SEC). 1998. A Plain English Handbook: How to Create
Clear SEC Disclosure. SEC Office of Investor Education and Assistance Washington,
District of Columbia.
Securities and Exchange Commission (SEC). 2017. Comments on PCAOB Rulemaking: File No.
PCAOB-2017-01. Available at: https://www.sec.gov/comments/pcaob-2017-
01/pcaob201701.htm
Securities and Exchange Commission (SEC). 2017. Release No. 34-81916; File No. PCAOB-
2017-01. Available at: https://www.sec.gov/rules/pcaob/2017/34-81916.pdf
32
Shu, S. 2000. Auditor resignations: Client effects and legal liability. Journal of Accounting and
Economics 29 (2): 173-205.
Skinner, D. 1994. Why Firms Voluntarily Disclose Bad News. Journal of Accounting Research,
32(1), 38-60. doi:10.2307/2491386.
Skinner, D. and Srinivasan, S. 2012. “Audit quality and auditor reputation: Evidence from
Japan.” The Accounting Review 87: 1737–65.
Venkataraman, R., Weber, J., Willenborg, M. 2008. Litigation risk, audit quality, and audit fees:
Evidence from initial public offerings. The Accounting Review 83 (5): 1315-1346.
Weber, J., Willenborg, M and Zhang, J. 2008. “Does auditor reputation matter? The case of
KPMG Germany and ComROAD AG.” Journal of Accounting Research 46: 941–72.
33
Appendix A:
CAM Categories Based on the Taxonomy from Drake et al. (2020)
CAM Categories Description
Intangibles CAMs identified by Audit Analytics as relating to goodwill or other
intangible assets.
Revenue CAMs identified by Audit Analytics as relating to revenue, sales
returns, interest, or other revenue.
M&A CAMs identified by Audit Analytics as relating to business
combinations.
Taxes CAMs identified by Audit Analytics as relating to deferred taxes,
uncertain tax positions, or other taxes.
Contingent Liabilities CAMs identified by Audit Analytics as relating to warranties,
insurance, or other contingent liabilities.
Property CAMs identified by Audit Analytics as relating to PPE, capitalization,
long-lived assets, reserves, or depreciation.
Investments CAMs identified by Audit Analytics as relating to equity investments,
long-term investments, research and development, other assets, or
other investments.
Losses CAMs identified by Audit Analytics as relating to allowances for
losses.
Financial Reporting CAMs identified by Audit Analytics as relating to going concerns,
consolidations, related parties, policy changes, regulatory assets and
liabilities, and internal control.
Inventory CAMs identified by Audit Analytics as relating to inventory.
Disposals CAMs identified by Audit Analytics as relating to disposals,
discontinued operations, or asset retirement obligations.
Financial Instruments CAMs identified by Audit Analytics as relating to derivatives or other
debt.
Pensions CAMs identified by Audit Analytics as relating to pensions.
Accounts Receivable CAMs identified by Audit Analytics as relating to accounts receivable.
Leases CAMs identified by Audit Analytics as relating to leases.
Stock Compensation CAMs identified by Audit Analytics as relating to stock
compensation.
Other Includes all CAMs not categorized in the categories above, which
includes CAMs identified by Audit Analytics as relating to foreign
currency, other expenses, shareholder valuation, vendors, SG&A,
other liabilities, balance sheet classification, fresh start accounting,
and subsidiaries/afiliates.
34
APPENDIX B.
Variable Definitions
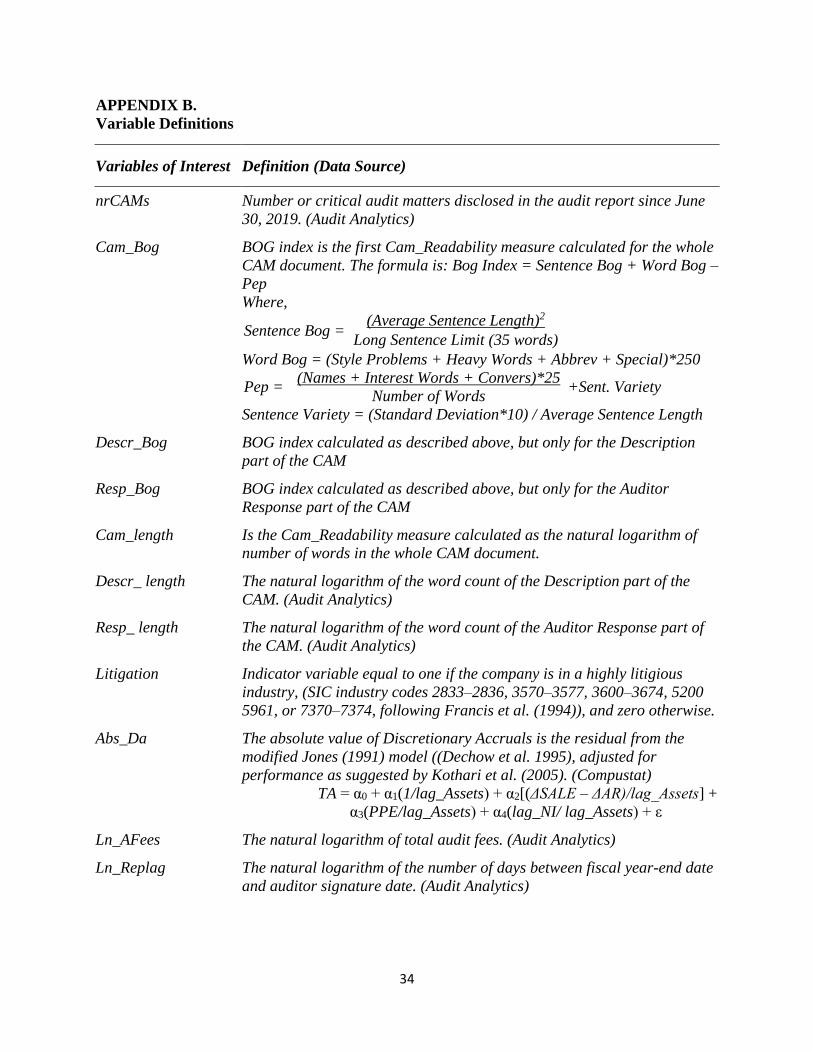
Variables of Interest Definition (Data Source)
nrCAMs Number or critical audit matters disclosed in the audit report since June
30, 2019. (Audit Analytics)
Cam_Bog
BOG index is the first Cam_Readability measure calculated for the whole
CAM document. The formula is: Bog Index = Sentence Bog + Word Bog –
Pep
Where,
Sentence Bog = (Average Sentence Length)2
Long Sentence Limit (35 words)
Word Bog = (Style Problems + Heavy Words + Abbrev + Special)*250
Pep = (Names + Interest Words + Convers)*25
+Sent. Variety Number of Words
Sentence Variety = (Standard Deviation*10) / Average Sentence Length
Descr_Bog
BOG index calculated as described above, but only for the Description
part of the CAM
Resp_Bog
BOG index calculated as described above, but only for the Auditor
Response part of the CAM
Cam_length Is the Cam_Readability measure calculated as the natural logarithm of
number of words in the whole CAM document.
Descr_ length
The natural logarithm of the word count of the Description part of the
CAM. (Audit Analytics)
Resp_ length The natural logarithm of the word count of the Auditor Response part of
the CAM. (Audit Analytics)
Litigation Indicator variable equal to one if the company is in a highly litigious
industry, (SIC industry codes 2833–2836, 3570–3577, 3600–3674, 5200
5961, or 7370–7374, following Francis et al. (1994)), and zero otherwise.
Abs_Da The absolute value of Discretionary Accruals is the residual from the
modified Jones (1991) model ((Dechow et al. 1995), adjusted for
performance as suggested by Kothari et al. (2005). (Compustat)
TA = α0 + α1(1/lag_Assets) + α2[(ΔSALE – ΔAR)/lag_Assets] +
α3(PPE/lag_Assets) + α4(lag_NI/ lag_Assets) + ε
Ln_AFees The natural logarithm of total audit fees. (Audit Analytics)
Ln_Replag The natural logarithm of the number of days between fiscal year-end date
and auditor signature date. (Audit Analytics)
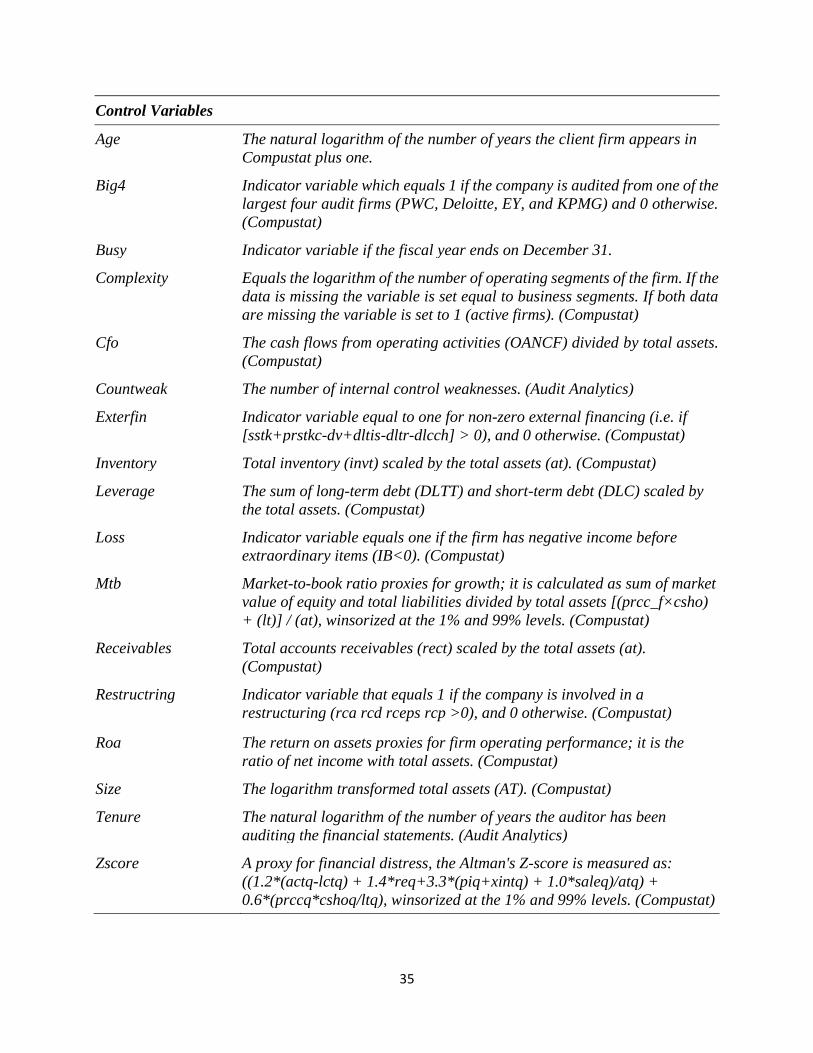
35
Control Variables
Age The natural logarithm of the number of years the client firm appears in
Compustat plus one.
Big4 Indicator variable which equals 1 if the company is audited from one of the
largest four audit firms (PWC, Deloitte, EY, and KPMG) and 0 otherwise.
(Compustat)
Busy Indicator variable if the fiscal year ends on December 31.
Complexity Equals the logarithm of the number of operating segments of the firm. If the
data is missing the variable is set equal to business segments. If both data
are missing the variable is set to 1 (active firms). (Compustat)
Cfo The cash flows from operating activities (OANCF) divided by total assets.
(Compustat)
Countweak The number of internal control weaknesses. (Audit Analytics)
Exterfin Indicator variable equal to one for non-zero external financing (i.e. if
[sstk+prstkc-dv+dltis-dltr-dlcch] > 0), and 0 otherwise. (Compustat)
Inventory Total inventory (invt) scaled by the total assets (at). (Compustat)
Leverage The sum of long-term debt (DLTT) and short-term debt (DLC) scaled by
the total assets. (Compustat)
Loss Indicator variable equals one if the firm has negative income before
extraordinary items (IB<0). (Compustat)
Mtb Market-to-book ratio proxies for growth; it is calculated as sum of market
value of equity and total liabilities divided by total assets [(prcc_f×csho)
+ (lt)] / (at), winsorized at the 1% and 99% levels. (Compustat)
Receivables Total accounts receivables (rect) scaled by the total assets (at).
(Compustat)
Restructring Indicator variable that equals 1 if the company is involved in a
restructuring (rca rcd rceps rcp >0), and 0 otherwise. (Compustat)
Roa The return on assets proxies for firm operating performance; it is the
ratio of net income with total assets. (Compustat)
Size The logarithm transformed total assets (AT). (Compustat)
Tenure The natural logarithm of the number of years the auditor has been
auditing the financial statements. (Audit Analytics)
Zscore A proxy for financial distress, the Altman's Z-score is measured as:
((1.2*(actq-lctq) + 1.4*req+3.3*(piq+xintq) + 1.0*saleq)/atq) +
0.6*(prccq*cshoq/ltq), winsorized at the 1% and 99% levels. (Compustat)
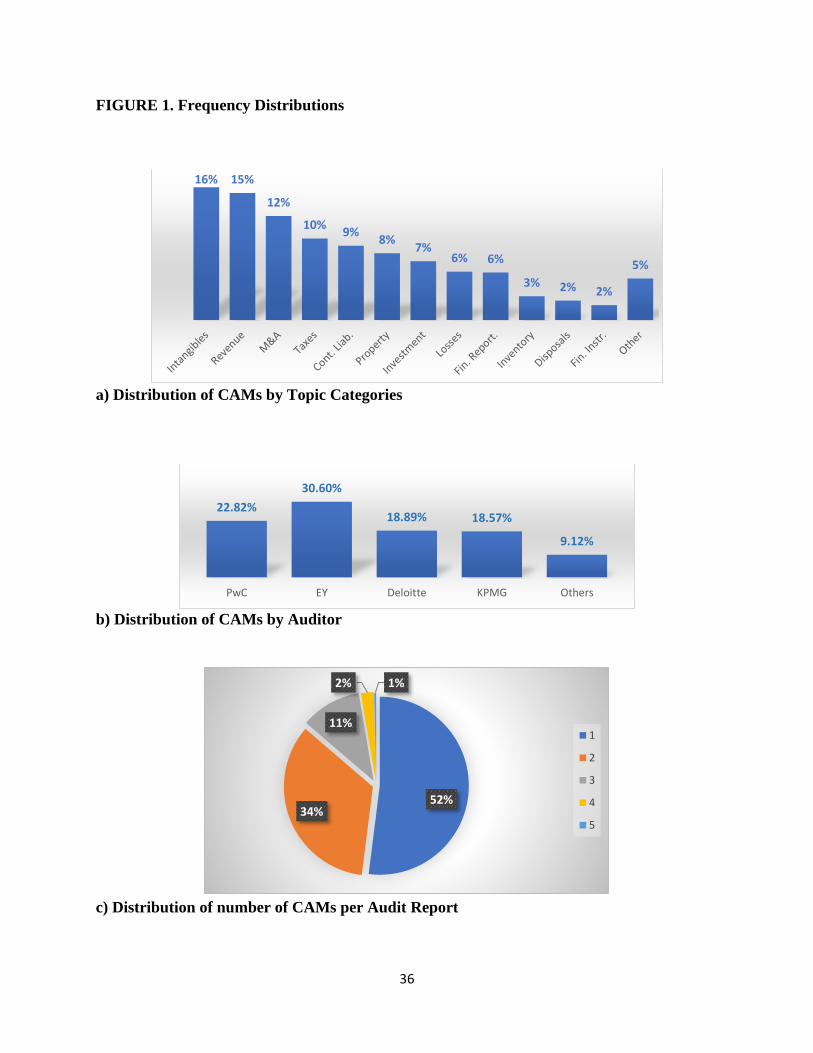
36
FIGURE 1. Frequency Distributions
a) Distribution of CAMs by Topic Categories
b) Distribution of CAMs by Auditor
c) Distribution of number of CAMs per Audit Report
16% 15%
12%
10%9%
8%7%
6% 6%
3% 2% 2%
5%
22.82%
30.60%
18.89% 18.57%
9.12%
PwC EY Deloitte KPMG Others
52%34%
11%
2% 1%
1
2
3
4
5
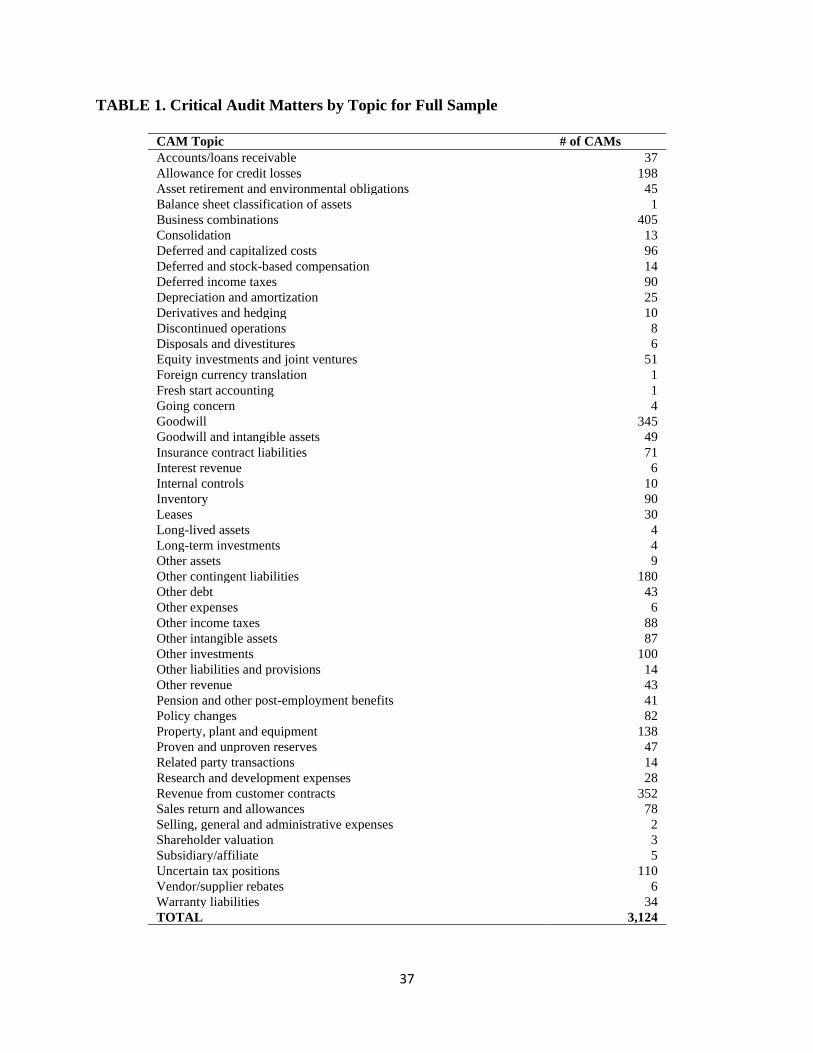
37
TABLE 1. Critical Audit Matters by Topic for Full Sample
CAM Topic # of CAMs
Accounts/loans receivable 37
Allowance for credit losses 198
Asset retirement and environmental obligations 45
Balance sheet classification of assets 1
Business combinations 405
Consolidation 13
Deferred and capitalized costs 96
Deferred and stock-based compensation 14
Deferred income taxes 90
Depreciation and amortization 25
Derivatives and hedging 10
Discontinued operations 8
Disposals and divestitures 6
Equity investments and joint ventures 51
Foreign currency translation 1
Fresh start accounting 1
Going concern 4
Goodwill 345
Goodwill and intangible assets 49
Insurance contract liabilities 71
Interest revenue 6
Internal controls 10
Inventory 90
Leases 30
Long-lived assets 4
Long-term investments 4
Other assets 9
Other contingent liabilities 180
Other debt 43
Other expenses 6
Other income taxes 88
Other intangible assets 87
Other investments 100
Other liabilities and provisions 14
Other revenue 43
Pension and other post-employment benefits 41
Policy changes 82
Property, plant and equipment 138
Proven and unproven reserves 47
Related party transactions 14
Research and development expenses 28
Revenue from customer contracts 352
Sales return and allowances 78
Selling, general and administrative expenses 2
Shareholder valuation 3
Subsidiary/affiliate 5
Uncertain tax positions 110
Vendor/supplier rebates 6
Warranty liabilities 34
TOTAL 3,124
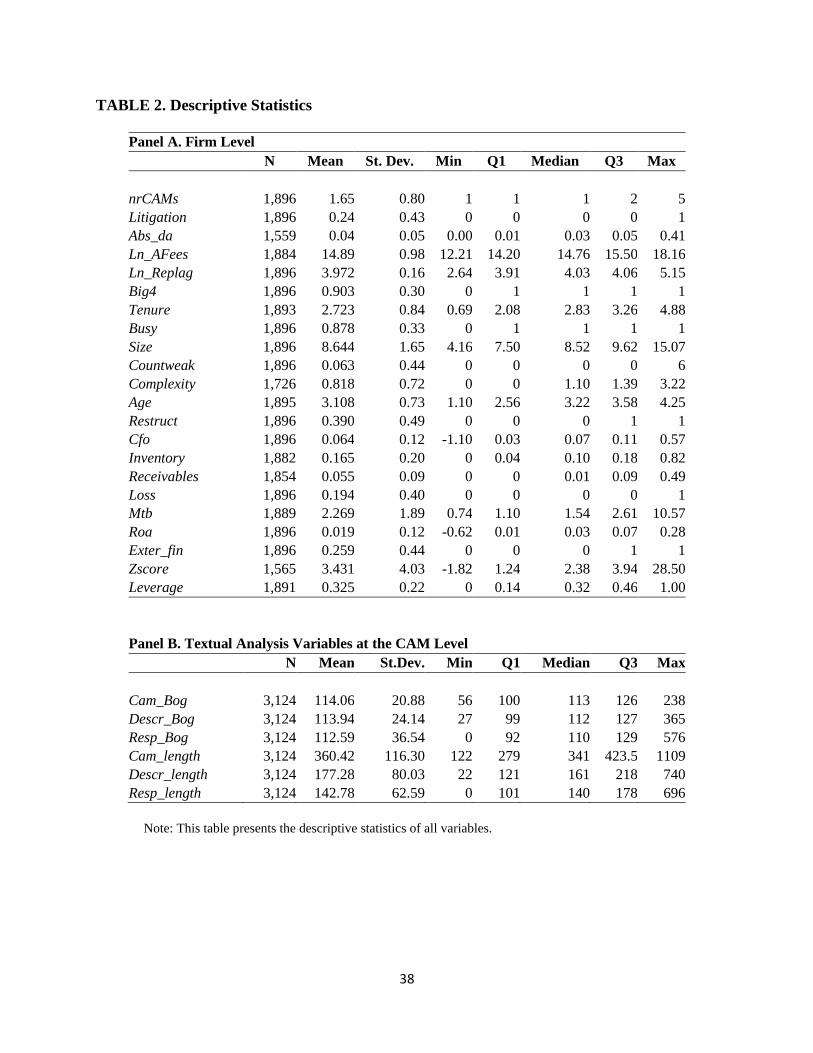
38
TABLE 2. Descriptive Statistics
Panel A. Firm Level
N Mean St. Dev. Min Q1 Median Q3 Max
nrCAMs 1,896 1.65 0.80 1 1 1 2 5
Litigation 1,896 0.24 0.43 0 0 0 0 1
Abs_da 1,559 0.04 0.05 0.00 0.01 0.03 0.05 0.41
Ln_AFees 1,884 14.89 0.98 12.21 14.20 14.76 15.50 18.16
Ln_Replag 1,896 3.972 0.16 2.64 3.91 4.03 4.06 5.15
Big4 1,896 0.903 0.30 0 1 1 1 1
Tenure 1,893 2.723 0.84 0.69 2.08 2.83 3.26 4.88
Busy 1,896 0.878 0.33 0 1 1 1 1
Size 1,896 8.644 1.65 4.16 7.50 8.52 9.62 15.07
Countweak 1,896 0.063 0.44 0 0 0 0 6
Complexity 1,726 0.818 0.72 0 0 1.10 1.39 3.22
Age 1,895 3.108 0.73 1.10 2.56 3.22 3.58 4.25
Restruct 1,896 0.390 0.49 0 0 0 1 1
Cfo 1,896 0.064 0.12 -1.10 0.03 0.07 0.11 0.57
Inventory 1,882 0.165 0.20 0 0.04 0.10 0.18 0.82
Receivables 1,854 0.055 0.09 0 0 0.01 0.09 0.49
Loss 1,896 0.194 0.40 0 0 0 0 1
Mtb 1,889 2.269 1.89 0.74 1.10 1.54 2.61 10.57
Roa 1,896 0.019 0.12 -0.62 0.01 0.03 0.07 0.28
Exter_fin 1,896 0.259 0.44 0 0 0 1 1
Zscore 1,565 3.431 4.03 -1.82 1.24 2.38 3.94 28.50
Leverage 1,891 0.325 0.22 0 0.14 0.32 0.46 1.00
Panel B. Textual Analysis Variables at the CAM Level
N Mean St.Dev. Min Q1 Median Q3 Max
Cam_Bog 3,124 114.06 20.88 56 100 113 126 238
Descr_Bog 3,124 113.94 24.14 27 99 112 127 365
Resp_Bog 3,124 112.59 36.54 0 92 110 129 576
Cam_length 3,124 360.42 116.30 122 279 341 423.5 1109
Descr_length 3,124 177.28 80.03 22 121 161 218 740
Resp_length 3,124 142.78 62.59 0 101 140 178 696
Note: This table presents the descriptive statistics of all variables.
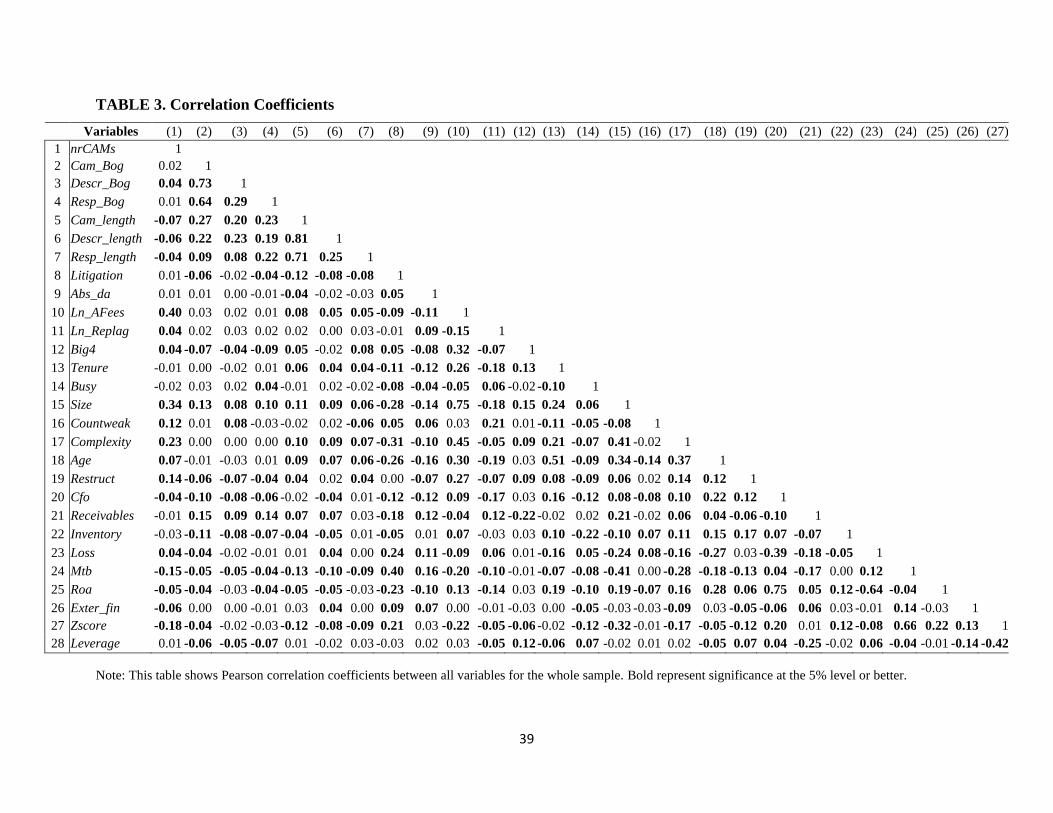
39
TABLE 3. Correlation Coefficients
Variables (1) (2) (3) (4) (5) (6) (7) (8) (9) (10) (11) (12) (13) (14) (15) (16) (17) (18) (19) (20) (21) (22) (23) (24) (25) (26) (27)
1 nrCAMs 1
2 Cam_Bog 0.02 1
3 Descr_Bog 0.04 0.73 1
4 Resp_Bog 0.01 0.64 0.29 1
5 Cam_length -0.07 0.27 0.20 0.23 1
6 Descr_length -0.06 0.22 0.23 0.19 0.81 1
7 Resp_length -0.04 0.09 0.08 0.22 0.71 0.25 1
8 Litigation 0.01 -0.06 -0.02 -0.04 -0.12 -0.08 -0.08 1
9 Abs_da 0.01 0.01 0.00 -0.01 -0.04 -0.02 -0.03 0.05 1
10 Ln_AFees 0.40 0.03 0.02 0.01 0.08 0.05 0.05 -0.09 -0.11 1
11 Ln_Replag 0.04 0.02 0.03 0.02 0.02 0.00 0.03 -0.01 0.09 -0.15 1
12 Big4 0.04 -0.07 -0.04 -0.09 0.05 -0.02 0.08 0.05 -0.08 0.32 -0.07 1
13 Tenure -0.01 0.00 -0.02 0.01 0.06 0.04 0.04 -0.11 -0.12 0.26 -0.18 0.13 1
14 Busy -0.02 0.03 0.02 0.04 -0.01 0.02 -0.02 -0.08 -0.04 -0.05 0.06 -0.02 -0.10 1
15 Size 0.34 0.13 0.08 0.10 0.11 0.09 0.06 -0.28 -0.14 0.75 -0.18 0.15 0.24 0.06 1
16 Countweak 0.12 0.01 0.08 -0.03 -0.02 0.02 -0.06 0.05 0.06 0.03 0.21 0.01 -0.11 -0.05 -0.08 1
17 Complexity 0.23 0.00 0.00 0.00 0.10 0.09 0.07 -0.31 -0.10 0.45 -0.05 0.09 0.21 -0.07 0.41 -0.02 1
18 Age 0.07 -0.01 -0.03 0.01 0.09 0.07 0.06 -0.26 -0.16 0.30 -0.19 0.03 0.51 -0.09 0.34 -0.14 0.37 1
19 Restruct 0.14 -0.06 -0.07 -0.04 0.04 0.02 0.04 0.00 -0.07 0.27 -0.07 0.09 0.08 -0.09 0.06 0.02 0.14 0.12 1
20 Cfo -0.04 -0.10 -0.08 -0.06 -0.02 -0.04 0.01 -0.12 -0.12 0.09 -0.17 0.03 0.16 -0.12 0.08 -0.08 0.10 0.22 0.12 1
21 Receivables -0.01 0.15 0.09 0.14 0.07 0.07 0.03 -0.18 0.12 -0.04 0.12 -0.22 -0.02 0.02 0.21 -0.02 0.06 0.04 -0.06 -0.10 1
22 Inventory -0.03 -0.11 -0.08 -0.07 -0.04 -0.05 0.01 -0.05 0.01 0.07 -0.03 0.03 0.10 -0.22 -0.10 0.07 0.11 0.15 0.17 0.07 -0.07 1
23 Loss 0.04 -0.04 -0.02 -0.01 0.01 0.04 0.00 0.24 0.11 -0.09 0.06 0.01 -0.16 0.05 -0.24 0.08 -0.16 -0.27 0.03 -0.39 -0.18 -0.05 1
24 Mtb -0.15 -0.05 -0.05 -0.04 -0.13 -0.10 -0.09 0.40 0.16 -0.20 -0.10 -0.01 -0.07 -0.08 -0.41 0.00 -0.28 -0.18 -0.13 0.04 -0.17 0.00 0.12 1
25 Roa -0.05 -0.04 -0.03 -0.04 -0.05 -0.05 -0.03 -0.23 -0.10 0.13 -0.14 0.03 0.19 -0.10 0.19 -0.07 0.16 0.28 0.06 0.75 0.05 0.12 -0.64 -0.04 1
26 Exter_fin -0.06 0.00 0.00 -0.01 0.03 0.04 0.00 0.09 0.07 0.00 -0.01 -0.03 0.00 -0.05 -0.03 -0.03 -0.09 0.03 -0.05 -0.06 0.06 0.03 -0.01 0.14 -0.03 1
27 Zscore -0.18 -0.04 -0.02 -0.03 -0.12 -0.08 -0.09 0.21 0.03 -0.22 -0.05 -0.06 -0.02 -0.12 -0.32 -0.01 -0.17 -0.05 -0.12 0.20 0.01 0.12 -0.08 0.66 0.22 0.13 1
28 Leverage 0.01 -0.06 -0.05 -0.07 0.01 -0.02 0.03 -0.03 0.02 0.03 -0.05 0.12 -0.06 0.07 -0.02 0.01 0.02 -0.05 0.07 0.04 -0.25 -0.02 0.06 -0.04 -0.01 -0.14 -0.42
Note: This table shows Pearson correlation coefficients between all variables for the whole sample. Bold represent significance at the 5% level or better.
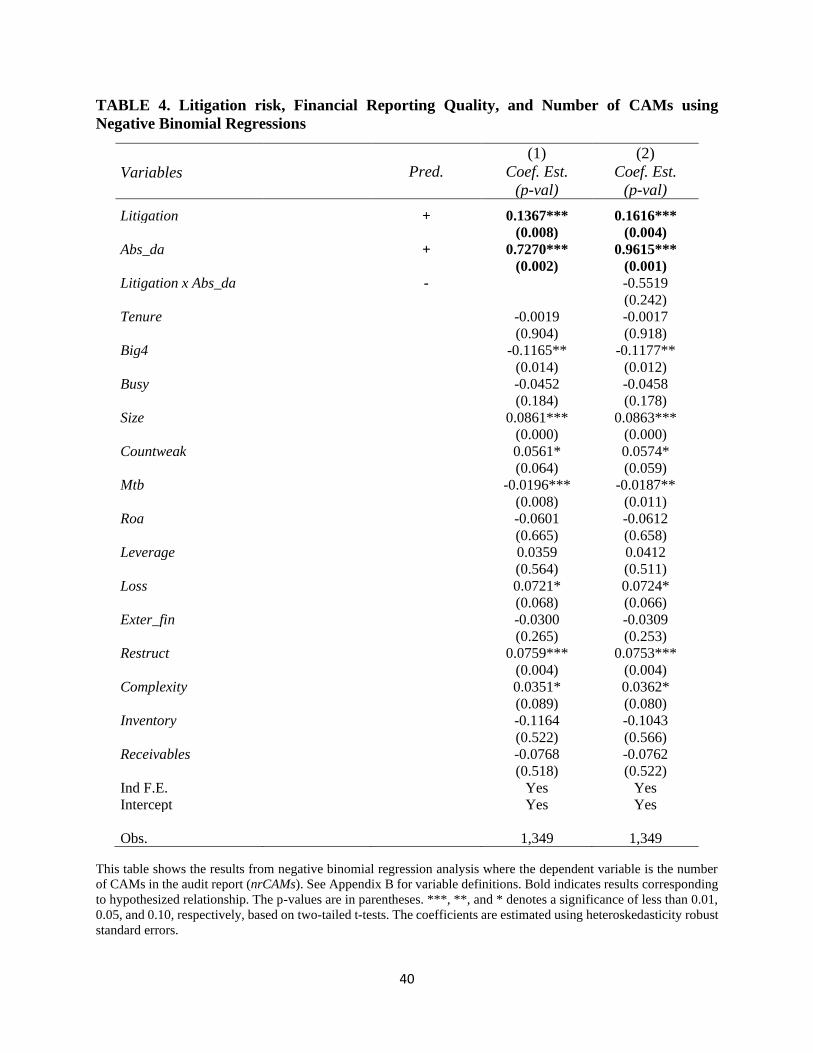
40
TABLE 4. Litigation risk, Financial Reporting Quality, and Number of CAMs using
Negative Binomial Regressions
(1) (2)
Variables
Pred. Coef. Est.
(p-val)
Coef. Est.
(p-val)
Litigation + 0.1367*** 0.1616***
(0.008) (0.004)
Abs_da + 0.7270*** 0.9615***
(0.002) (0.001)
Litigation x Abs_da - -0.5519
(0.242)
Tenure -0.0019 -0.0017
(0.904) (0.918)
Big4 -0.1165** -0.1177**
(0.014) (0.012)
Busy -0.0452 -0.0458
(0.184) (0.178)
Size 0.0861*** 0.0863***
(0.000) (0.000)
Countweak 0.0561* 0.0574*
(0.064) (0.059)
Mtb -0.0196*** -0.0187**
(0.008) (0.011)
Roa -0.0601 -0.0612
(0.665) (0.658)
Leverage 0.0359 0.0412
(0.564) (0.511)
Loss 0.0721* 0.0724*
(0.068) (0.066)
Exter_fin -0.0300 -0.0309
(0.265) (0.253)
Restruct 0.0759*** 0.0753***
(0.004) (0.004)
Complexity 0.0351* 0.0362*
(0.089) (0.080)
Inventory -0.1164 -0.1043
(0.522) (0.566)
Receivables -0.0768 -0.0762
(0.518) (0.522)
Ind F.E. Yes Yes
Intercept Yes Yes
Obs. 1,349 1,349
This table shows the results from negative binomial regression analysis where the dependent variable is the number
of CAMs in the audit report (nrCAMs). See Appendix B for variable definitions. Bold indicates results corresponding
to hypothesized relationship. The p-values are in parentheses. ***, **, and * denotes a significance of less than 0.01,
0.05, and 0.10, respectively, based on two-tailed t-tests. The coefficients are estimated using heteroskedasticity robust
standard errors.
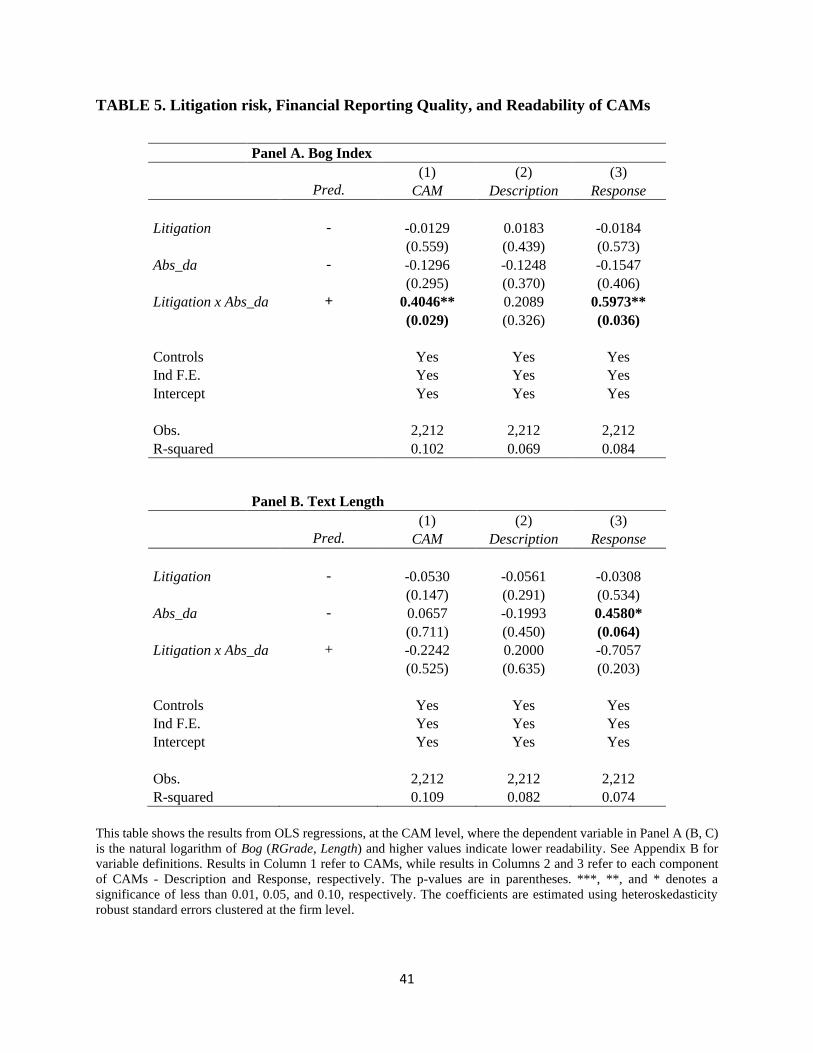
41
TABLE 5. Litigation risk, Financial Reporting Quality, and Readability of CAMs
Panel A. Bog Index
(1) (2) (3)
Pred. CAM Description Response
Litigation - -0.0129 0.0183 -0.0184
(0.559) (0.439) (0.573)
Abs_da - -0.1296 -0.1248 -0.1547
(0.295) (0.370) (0.406)
Litigation x Abs_da + 0.4046** 0.2089 0.5973**
(0.029) (0.326) (0.036)
Controls Yes Yes Yes
Ind F.E. Yes Yes Yes
Intercept Yes Yes Yes
Obs. 2,212 2,212 2,212
R-squared 0.102 0.069 0.084
Panel B. Text Length
(1) (2) (3)
Pred. CAM Description Response
Litigation - -0.0530 -0.0561 -0.0308
(0.147) (0.291) (0.534)
Abs_da - 0.0657 -0.1993 0.4580*
(0.711) (0.450) (0.064)
Litigation x Abs_da + -0.2242 0.2000 -0.7057
(0.525) (0.635) (0.203)
Controls Yes Yes Yes
Ind F.E. Yes Yes Yes
Intercept Yes Yes Yes
Obs. 2,212 2,212 2,212
R-squared 0.109 0.082 0.074
This table shows the results from OLS regressions, at the CAM level, where the dependent variable in Panel A (B, C)
is the natural logarithm of Bog (RGrade, Length) and higher values indicate lower readability. See Appendix B for
variable definitions. Results in Column 1 refer to CAMs, while results in Columns 2 and 3 refer to each component
of CAMs - Description and Response, respectively. The p-values are in parentheses. ***, **, and * denotes a
significance of less than 0.01, 0.05, and 0.10, respectively. The coefficients are estimated using heteroskedasticity
robust standard errors clustered at the firm level.
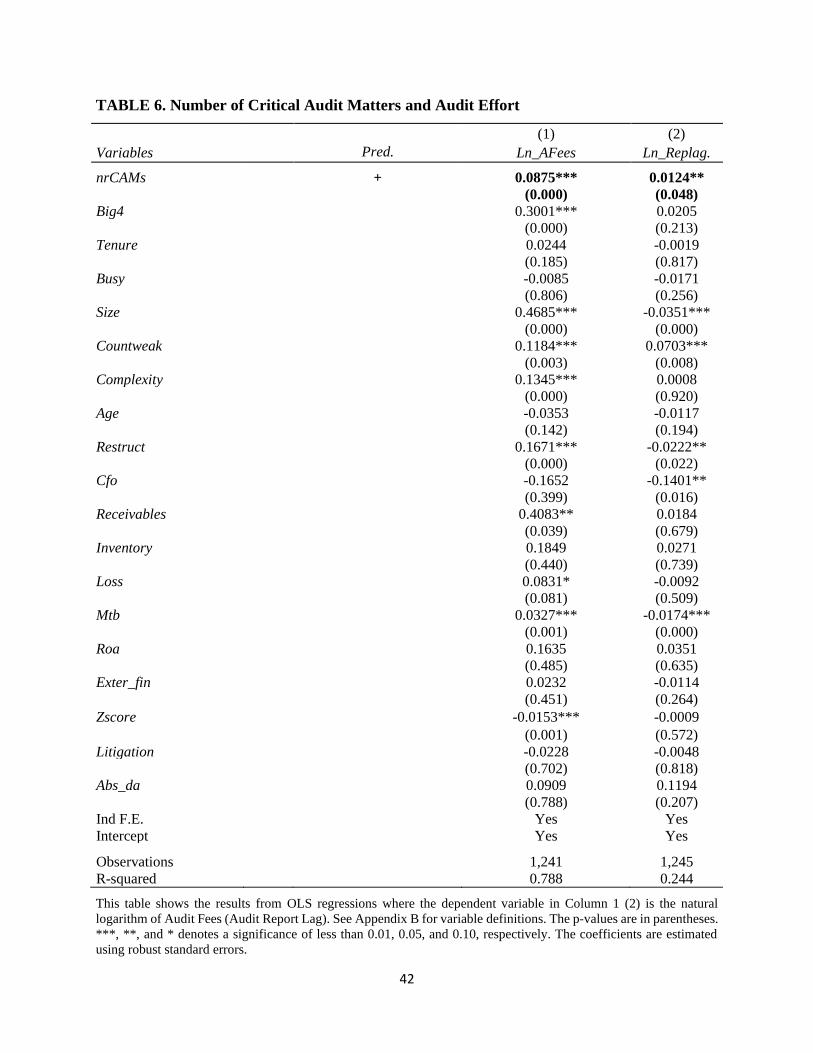
42
TABLE 6. Number of Critical Audit Matters and Audit Effort
(1) (2)
Variables Pred. Ln_AFees Ln_Replag.
nrCAMs + 0.0875*** 0.0124**
(0.000) (0.048)
Big4 0.3001*** 0.0205
(0.000) (0.213)
Tenure 0.0244 -0.0019
(0.185) (0.817)
Busy -0.0085 -0.0171
(0.806) (0.256)
Size 0.4685*** -0.0351***
(0.000) (0.000)
Countweak 0.1184*** 0.0703***
(0.003) (0.008)
Complexity 0.1345*** 0.0008
(0.000) (0.920)
Age -0.0353 -0.0117
(0.142) (0.194)
Restruct 0.1671*** -0.0222**
(0.000) (0.022)
Cfo -0.1652 -0.1401**
(0.399) (0.016)
Receivables 0.4083** 0.0184
(0.039) (0.679)
Inventory 0.1849 0.0271
(0.440) (0.739)
Loss 0.0831* -0.0092
(0.081) (0.509)
Mtb 0.0327*** -0.0174***
(0.001) (0.000)
Roa 0.1635 0.0351
(0.485) (0.635)
Exter_fin 0.0232 -0.0114
(0.451) (0.264)
Zscore -0.0153*** -0.0009
(0.001) (0.572)
Litigation -0.0228 -0.0048
(0.702) (0.818)
Abs_da 0.0909 0.1194
(0.788) (0.207)
Ind F.E. Yes Yes
Intercept Yes Yes
Observations 1,241 1,245
R-squared 0.788 0.244
This table shows the results from OLS regressions where the dependent variable in Column 1 (2) is the natural
logarithm of Audit Fees (Audit Report Lag). See Appendix B for variable definitions. The p-values are in parentheses.
***, **, and * denotes a significance of less than 0.01, 0.05, and 0.10, respectively. The coefficients are estimated
using robust standard errors.
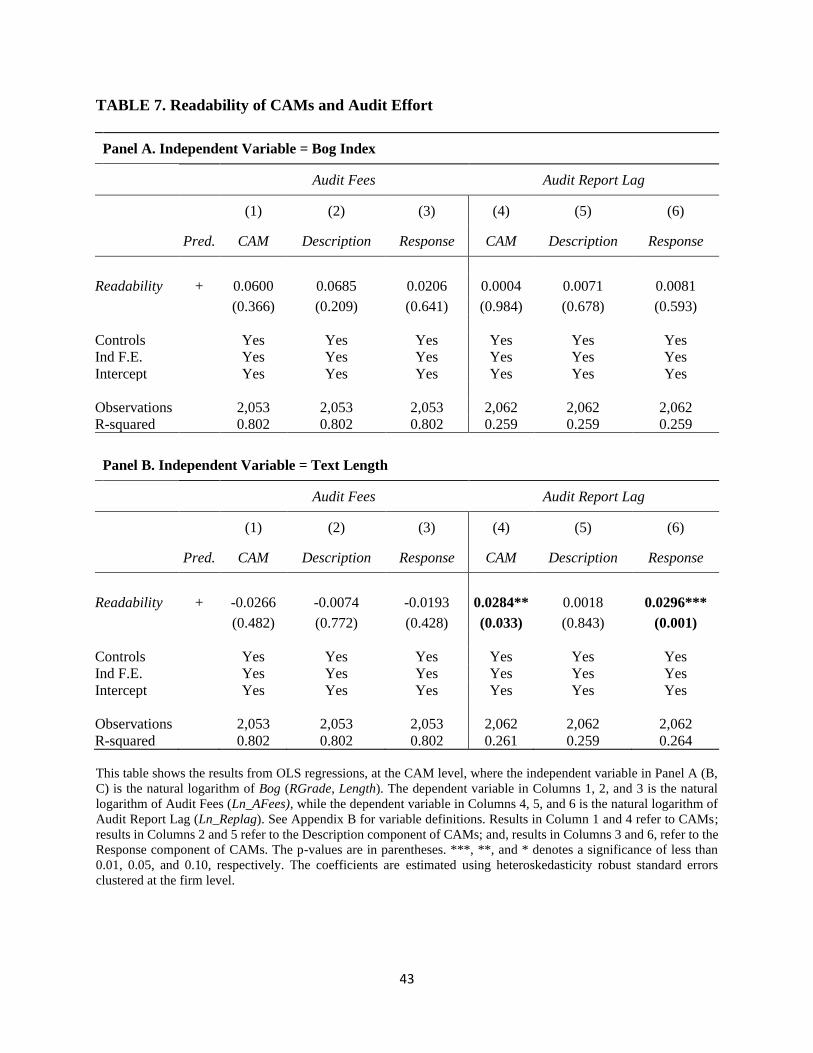
43
TABLE 7. Readability of CAMs and Audit Effort
Panel A. Independent Variable = Bog Index
Audit Fees Audit Report Lag
(1) (2) (3) (4) (5) (6)
Pred. CAM Description Response CAM Description Response
Readability + 0.0600 0.0685 0.0206 0.0004 0.0071 0.0081
(0.366) (0.209) (0.641) (0.984) (0.678) (0.593)
Controls Yes Yes Yes Yes Yes Yes
Ind F.E. Yes Yes Yes Yes Yes Yes
Intercept Yes Yes Yes Yes Yes Yes
Observations 2,053 2,053 2,053 2,062 2,062 2,062
R-squared 0.802 0.802 0.802 0.259 0.259 0.259
Panel B. Independent Variable = Text Length
Audit Fees Audit Report Lag
(1) (2) (3) (4) (5) (6)
Pred. CAM Description Response CAM Description Response
Readability + -0.0266 -0.0074 -0.0193 0.0284** 0.0018 0.0296***
(0.482) (0.772) (0.428) (0.033) (0.843) (0.001)
Controls Yes Yes Yes Yes Yes Yes
Ind F.E. Yes Yes Yes Yes Yes Yes
Intercept Yes Yes Yes Yes Yes Yes
Observations 2,053 2,053 2,053 2,062 2,062 2,062
R-squared 0.802 0.802 0.802 0.261 0.259 0.264
This table shows the results from OLS regressions, at the CAM level, where the independent variable in Panel A (B,
C) is the natural logarithm of Bog (RGrade, Length). The dependent variable in Columns 1, 2, and 3 is the natural
logarithm of Audit Fees (Ln_AFees), while the dependent variable in Columns 4, 5, and 6 is the natural logarithm of
Audit Report Lag (Ln_Replag). See Appendix B for variable definitions. Results in Column 1 and 4 refer to CAMs;
results in Columns 2 and 5 refer to the Description component of CAMs; and, results in Columns 3 and 6, refer to the
Response component of CAMs. The p-values are in parentheses. ***, **, and * denotes a significance of less than
0.01, 0.05, and 0.10, respectively. The coefficients are estimated using heteroskedasticity robust standard errors
clustered at the firm level.