Embed Size (px)
Citation preview
8/18/2019 litracy rate trends pakistan
http://slidepdf.com/reader/full/litracy-rate-trends-pakistan 1/155
8/18/2019 litracy rate trends pakistan
http://slidepdf.com/reader/full/litracy-rate-trends-pakistan 2/155
Contributors
Description and Analysis
Prof. Dr. Zafar Iqbal
Review and Improvement
Dr. Anjum Riyazul HaqueMr. Hassan Abdi Keynan
Dr. Iffat Farah
Dr. Eshya Mujahid Mukhtar
Dr. S. M. AijazDr. Hamid Khan Niazi
Tabulation and Projections
Mr. Saeed AhmedMr. Fakhar-ud-Din
Coordination
Mr. Arshad Saeed Khan
1st Printed – March 2002, Reprinted – August 2002, Revised Edition – May 2003
The authors are responsible for the choice, presentation and interpretation of data and information in this report, and
for the opinions expressed therein, which are not necessarily those of UNESCO.
8/18/2019 litracy rate trends pakistan
http://slidepdf.com/reader/full/litracy-rate-trends-pakistan 3/155
8/18/2019 litracy rate trends pakistan
http://slidepdf.com/reader/full/litracy-rate-trends-pakistan 4/155
Literacy Trends in Pakistan
UNESCO Office, IslamabadMay, 2003
8/18/2019 litracy rate trends pakistan
http://slidepdf.com/reader/full/litracy-rate-trends-pakistan 5/155
PART – I
AN ANALYSIS OF LITERACY TRENDS INPAKISTAN
8/18/2019 litracy rate trends pakistan
http://slidepdf.com/reader/full/litracy-rate-trends-pakistan 6/155
TABLE OF CONTENTS
Part I – An Analysis of Literacy Trends in Pakistan
Literacy Trends in Pakistan
1. Rationale, Need and Significance of Literacy
2. Data Sources3. Expected Use
4. Literacy defined in some other countries
5. International Context of Definitions
6. Changing Definitions of Literacy in Pakistan
7. Functional Literacy
8. Levels of Functional Literary and Programmes in a Global Perspective
9. Literacy Scenario at the International level
10. Literacy and Basic Education in Pakistan11. Current Literacy Situation in Pakistan
12. Regions of Low and High Literacy Rate in Pakistan according to Census of 1998
13. Factors Affecting Literacy Rate in Pakistan
13.1 Allocations for Education
13.2 Public Expenditure on Primary Education
13.3 Gender issues
13.4 Participation Rate
13.5 Lack of Institutional Infrastructure
14 Literacy And Fertility-A Strong Correlation
15. Dakar Framework for Action
15.1 Six Goals of Dakar Framework for Action (2000)
16. Literacy and National Plan of Action for EFA (2001-2015)
17. United Nations Literacy Decade
8/18/2019 litracy rate trends pakistan
http://slidepdf.com/reader/full/litracy-rate-trends-pakistan 7/155
List of Analytical Tables in Part-I
Table – 1 Definitions of Literacy in Selected Countries
Table – 2 Definitions and Status of Literacy in Different Census Years of Pakistan
Table – 3 Comparison of Pakistan with other South Asian countries in respect of Literacy Rate and other related factors – Year 1998.
Table – 4 Adult Literacy – Plan Allocations, Targets and Strategies
Table – 5 Adult Literacy – Policy, Targets and Strategies
Table – 6 Various Statistical Measures of Literacy in Pakistan in 1998 (age 10
+
)Table – 7 Various Statistical Measures of Female Literacy in Pakistan in 1998 (age 10+)
Table – 8 Literacy Growth Rate Trends of Age 10+ – 1981-1998 (by Provinces)
Table – 9 Measures of Variability for Rural Literacy in Pakistan – 1998
Table – 10 Number of Districts in Various Literacy Regions – (1981-1998)
Table – 11 Districts in Various Literacy Regions (Age 10 and above) in four Provinces of Pakistan during 1981 – 1998
Table – 12 Public Expenditure on Primary and Basic Education in Pakistan.
Table – 13 Allocations for Adult Literacy, Non-Formal and Mass Education in Pakistan
Table – 14 Participation Rate of School Going Children in Pakistan (by Provinces)
Table – 15 Mean Fertility Rate Comparisons in Pakistan (by Provinces)
List of Graphs in Part-I
1. Line Graph - Growth of Literacy Rate in Pakistan.
2. Bar Graph - Population of Literates/Illiterates in Pakistan (1972-1998)
3. Line Graph - Literacy Rate – Male & Female
4. Bar Graph - Literacy and Fertility – A Strong Co-relation (The Case of Sindh)
8/18/2019 litracy rate trends pakistan
http://slidepdf.com/reader/full/litracy-rate-trends-pakistan 8/155
8/18/2019 litracy rate trends pakistan
http://slidepdf.com/reader/full/litracy-rate-trends-pakistan 9/155
8/18/2019 litracy rate trends pakistan
http://slidepdf.com/reader/full/litracy-rate-trends-pakistan 10/155
8/18/2019 litracy rate trends pakistan
http://slidepdf.com/reader/full/litracy-rate-trends-pakistan 11/155
8/18/2019 litracy rate trends pakistan
http://slidepdf.com/reader/full/litracy-rate-trends-pakistan 12/155
4
district. This information on literacy and participation rate will be useful for district level planners under the new Devolution Order or system of
Local Government. Inter-district comparisons and analyses of regional disparities of literacy and primary education also offer valuable guidanceto provincial and national level planners and policy-makers, and provide an invaluable tool for the researchers.
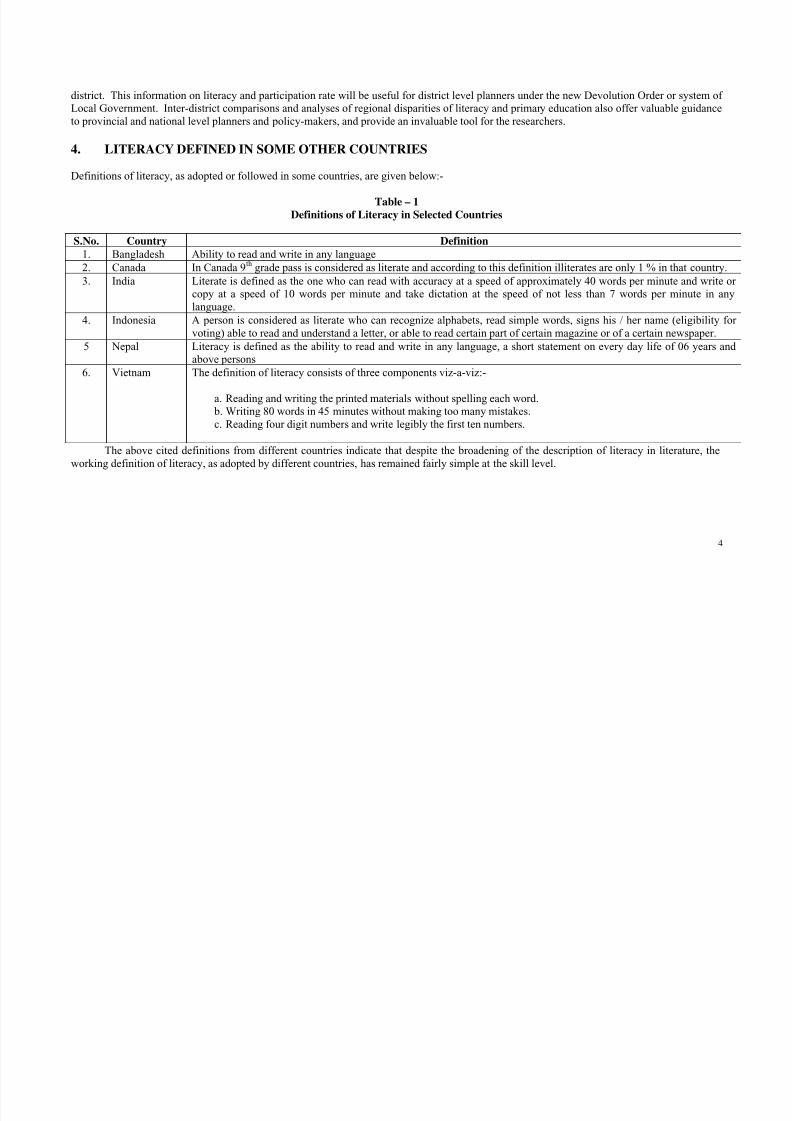
4. LITERACY DEFINED IN SOME OTHER COUNTRIES
Definitions of literacy, as adopted or followed in some countries, are given below:-
Table – 1
Definitions of Literacy in Selected Countries
S.No. Country Definition
1. Bangladesh Ability to read and write in any language
2. Canada In Canada 9th
grade pass is considered as literate and according to this definition illiterates are only 1 % in that country.
3. India Literate is defined as the one who can read with accuracy at a speed of approximately 40 words per minute and write or
copy at a speed of 10 words per minute and take dictation at the speed of not less than 7 words per minute in any
language.
4. Indonesia A person is considered as literate who can recognize alphabets, read simple words, signs his / her name (eligibility forvoting) able to read and understand a letter, or able to read certain part of certain magazine or of a certain newspaper.
5 Nepal Literacy is defined as the ability to read and write in any language, a short statement on every day life of 06 years and
above persons
6. Vietnam The definition of literacy consists of three components viz-a-viz:-
a. Reading and writing the printed materials without spelling each word.
b. Writing 80 words in 45 minutes without making too many mistakes.
c. Reading four digit numbers and write legibly the first ten numbers.
The above cited definitions from different countries indicate that despite the broadening of the description of literacy in literature, the
working definition of literacy, as adopted by different countries, has remained fairly simple at the skill level.
8/18/2019 litracy rate trends pakistan
http://slidepdf.com/reader/full/litracy-rate-trends-pakistan 13/155
8/18/2019 litracy rate trends pakistan
http://slidepdf.com/reader/full/litracy-rate-trends-pakistan 14/155
6
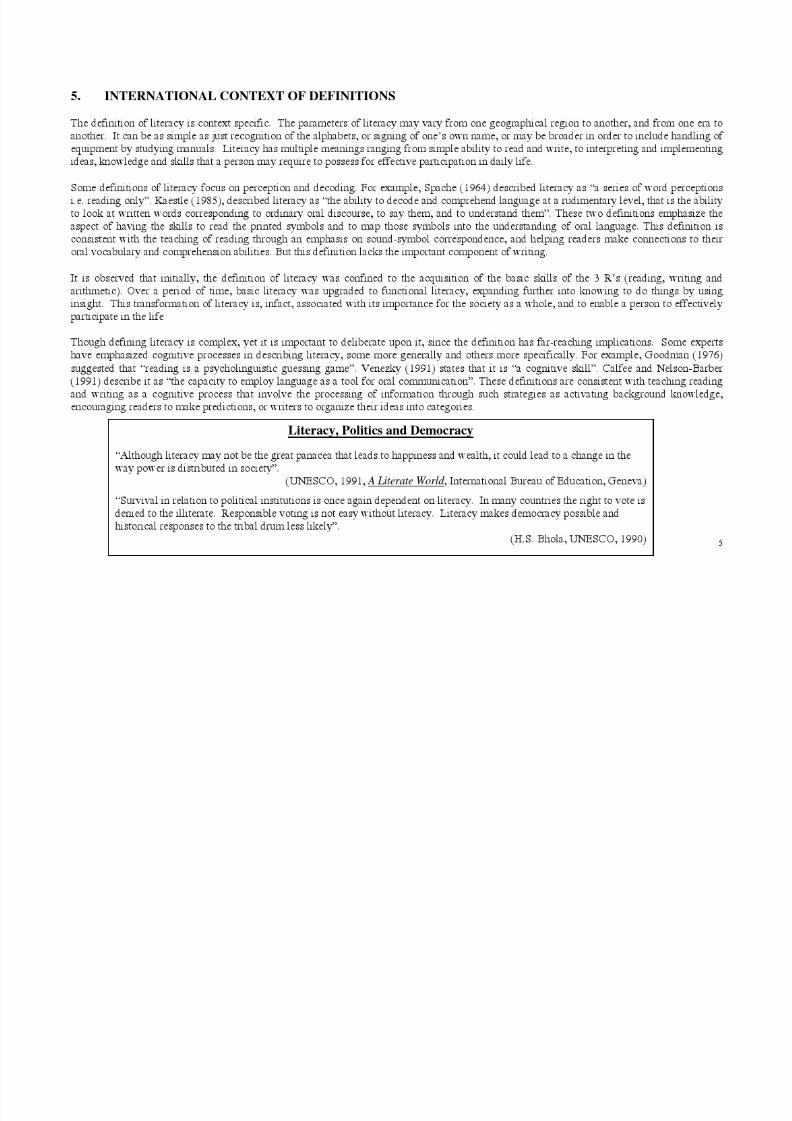
In the present day context, when paper and pencil are being replaced by the key board, calculators are performing mathematical functions and
the internet has become the source of information, there is every possibility that books may loose their relative value. This element whileincreasing the access of people to vast sources of knowledge, may hamper other equally important skills.
Literacies of the Future
The enormous range of potential applications for computers makes it likely that an element of re-definition will
inevitably accrue in respect of what is understood by “basic literacy”. Familiarity with keyboards or other input
devices could replace the pen or pencil, not as the most commonly available physical means of producing written
texts, but tested in schools and other formal educational settings. Such shifts in the physical means of producing textare by no means unprecedented, but the advent of micro-computers is significant because their purchase and support
will always entail relatively large expenditures (at least compared to pens and pencils) with the resulting scope for
increased national and international disparities in access to the new variants of literacy.
UNESCO, 1990, “ The Future of Literacy and Literacies of the Future” , in Literacy Lessons, IBE, UNESCO Geneva/France , page .6.
With this overview of definitions of literacy in mind, we now see as how it has been defined in Pakistan over a period of time.
8/18/2019 litracy rate trends pakistan
http://slidepdf.com/reader/full/litracy-rate-trends-pakistan 15/155
7
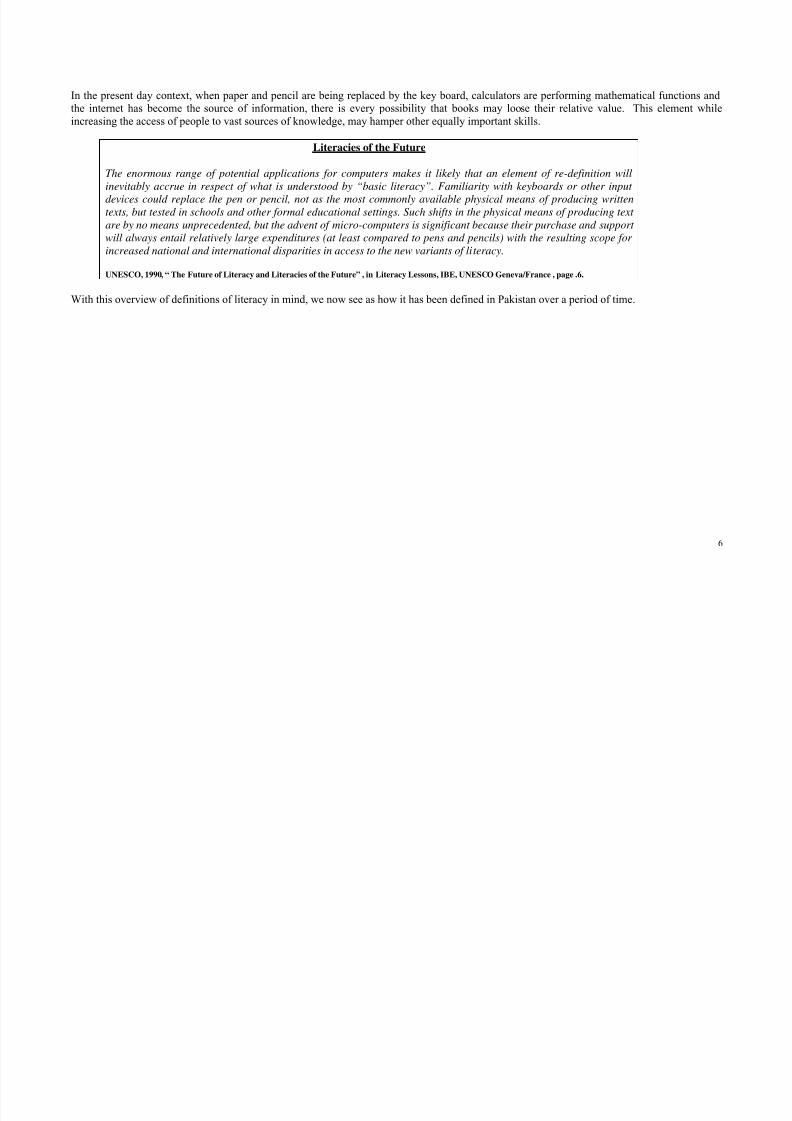
6. CHANGING DEFINITIONS OF LITERACY IN PAKISTAN
The definition of literacy, in Pakistan, has evolved and improved since the first Census in 1951. The following table indicates the changing
definitions of literacy.
Table – 2
Definitions and Status of Literacy in Different Census Years of Pakistan
Year of
Census
Definition of Literacy Age
group
Literacy rate (%)
Total Urban Rural
1951 “One who can read a clear print in any language”. All
Ages
Both Sexes 17.9
Female 13.9
1961 “One who is able to read with understanding a simple letter in
any language.”
Age 5
and
above
Both Sexes 16.9 34.8 10.6
Female 6.7 21.3 2.2
1972 “One who is able to read and write in some language with
understanding.”
Age
10 andabove
Both Sexes 21.7 41.5 14.3
Female 11.6 30.9 4.7
1981 “One who can read newspaper and write a simple letter.” Age
10 and
above
Both Sexes 26.2 47.1 17.3
Female 16.0 37.3 7.3
1998 “One who can read newspaper and write a simple letter, in any
language.
Age
10 and
above
Both Sexes 43.92 63.08 33.64
Female 32.02 55.16 20.09
8/18/2019 litracy rate trends pakistan
http://slidepdf.com/reader/full/litracy-rate-trends-pakistan 16/155
8
7. FUNCTIONAL LITERACY
The definition of literacy as well as the specific age group of the literate population, for census purposes, kept on changing both at the national
and international levels. Two definitions of functional literacy are provided below as an example.
Functionally literate: is a person “who can with understanding, both read and write a short simple statement on his everyday
life”. (UNESCO. IBE.1976)
Another definition of functionally literate person by Gray (1956) is provided below:
‘A person is functionally literate when he has acquired the knowledge and skills in reading and writing, which enable him to
engage effectively in all those activities in which literacy is normally assumed in his culture or group’.
Gray, W.S. The Teaching of Reading and Writing, Paris, UNESCO, 1956. (Monographs on Fundamental Education, X)
This definition appears to be very simple and old, however the phrase “every day life” contains the seeds for evolution and transformation. As
life patterns, including amenities, gadgets, and procedures of transaction etc. change with time, the definition of functional literacy will have to
correspond to them.
8. LEVELS OF FUNCTIONAL LITERACY AND PROGRAMMES IN A GLOBAL PERSPECTIVE
There are three levels with specific programmes. These are described below:-
Basic Level (Level-I)
A) TARGET GROUP
i) Adults who have never been to school or who have dropped out of school before acquiring literacy skills.
ii) Adults unable to read and write simple words, paragraphs or any other type of written statement without the help of a
teacher.
8/18/2019 litracy rate trends pakistan
http://slidepdf.com/reader/full/litracy-rate-trends-pakistan 17/155
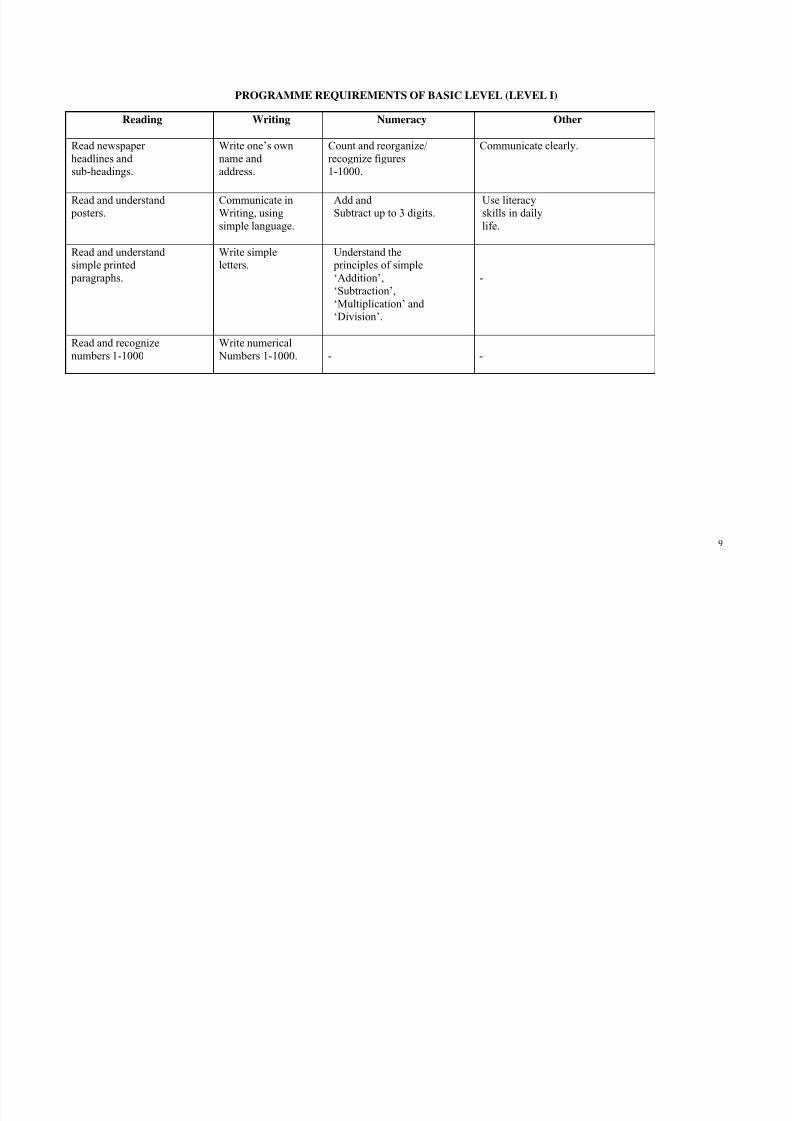
9
PROGRAMME REQUIREMENTS OF BASIC LEVEL (LEVEL I)
Reading Writing Numeracy Other
Read newspaper
headlines and
sub-headings.
Write one’s own
name and
address.
Count and reorganize/
recognize figures
1-1000.
Communicate clearly.
Read and understand
posters.
Communicate in
Writing, usingsimple language.
Add and
Subtract up to 3 digits.
Use literacy
skills in dailylife.
Read and understand
simple printed
paragraphs.
Write simple
letters.
Understand the
principles of simple
‘Addition’,
‘Subtraction’,
‘Multiplication’ and
‘Division’.
-
Read and recognize
numbers 1-1000
Write numerical
Numbers 1-1000. - -
8/18/2019 litracy rate trends pakistan
http://slidepdf.com/reader/full/litracy-rate-trends-pakistan 18/155
10
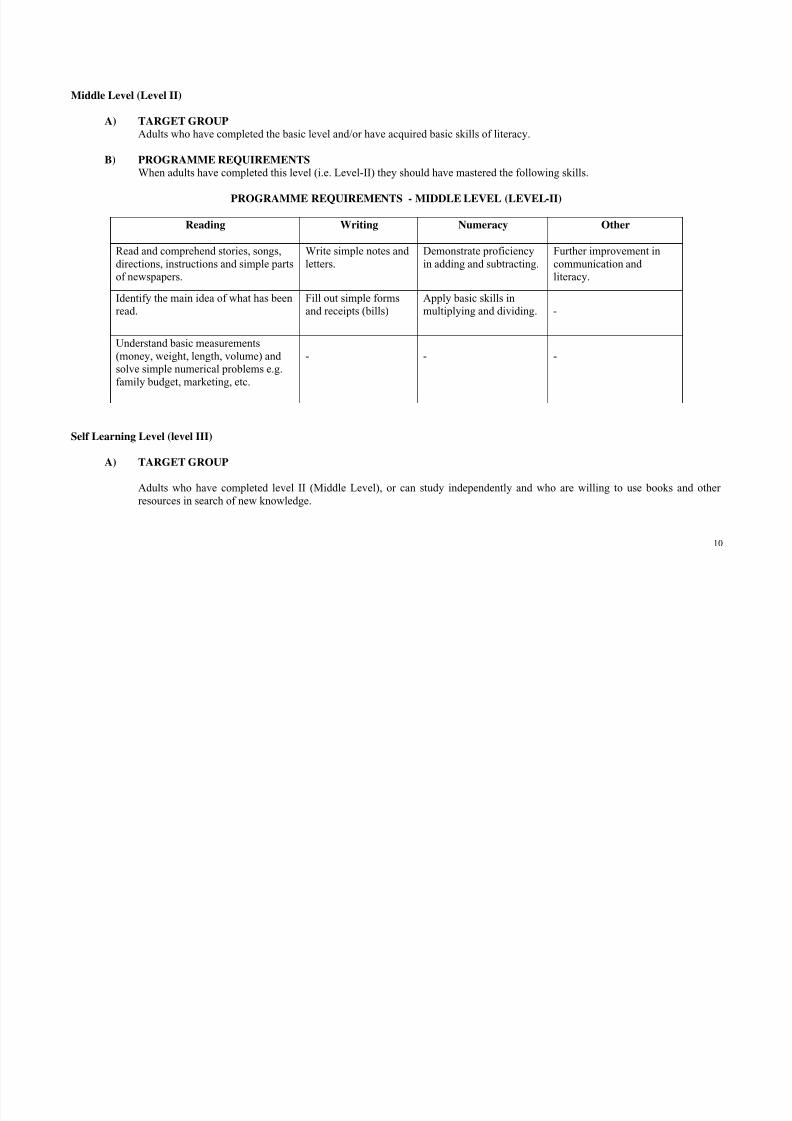
Middle Level (Level II)
A) TARGET GROUP
Adults who have completed the basic level and/or have acquired basic skills of literacy.
B) PROGRAMME REQUIREMENTS
When adults have completed this level (i.e. Level-II) they should have mastered the following skills.
PROGRAMME REQUIREMENTS - MIDDLE LEVEL (LEVEL-II)
Reading Writing Numeracy Other
Read and comprehend stories, songs,
directions, instructions and simple parts
of newspapers.
Write simple notes and
letters.
Demonstrate proficiency
in adding and subtracting.
Further improvement in
communication and
literacy.
Identify the main idea of what has been
read.
Fill out simple forms
and receipts (bills)
Apply basic skills in
multiplying and dividing. -
Understand basic measurements
(money, weight, length, volume) and
solve simple numerical problems e.g.
family budget, marketing, etc.
- - -
Self Learning Level (level III)
A) TARGET GROUP
Adults who have completed level II (Middle Level), or can study independently and who are willing to use books and other
resources in search of new knowledge.
8/18/2019 litracy rate trends pakistan
http://slidepdf.com/reader/full/litracy-rate-trends-pakistan 19/155
11
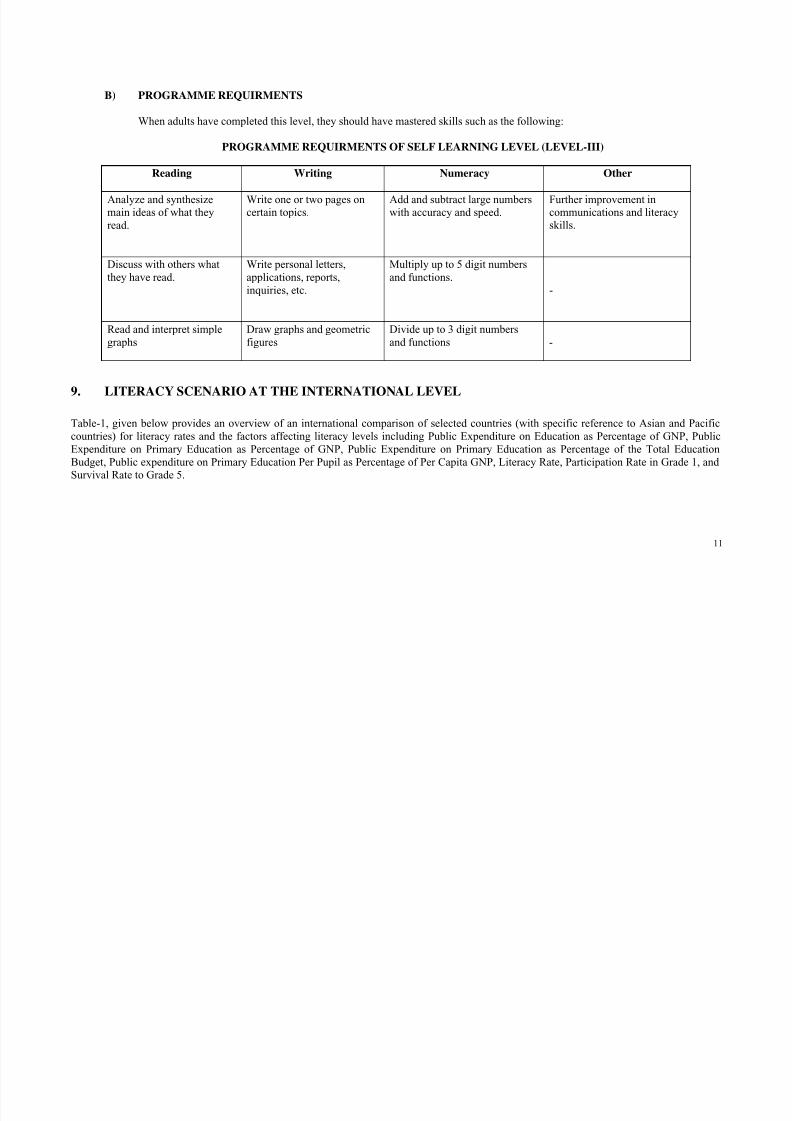
B) PROGRAMME REQUIRMENTS
When adults have completed this level, they should have mastered skills such as the following:
PROGRAMME REQUIRMENTS OF SELF LEARNING LEVEL (LEVEL-III)
Reading Writing Numeracy Other
Analyze and synthesize
main ideas of what theyread.
Write one or two pages on
certain topics.
Add and subtract large numbers
with accuracy and speed.
Further improvement in
communications and literacyskills.
Discuss with others what
they have read.
Write personal letters,
applications, reports,
inquiries, etc.
Multiply up to 5 digit numbers
and functions.
-
Read and interpret simple
graphs
Draw graphs and geometric
figures
Divide up to 3 digit numbers
and functions -
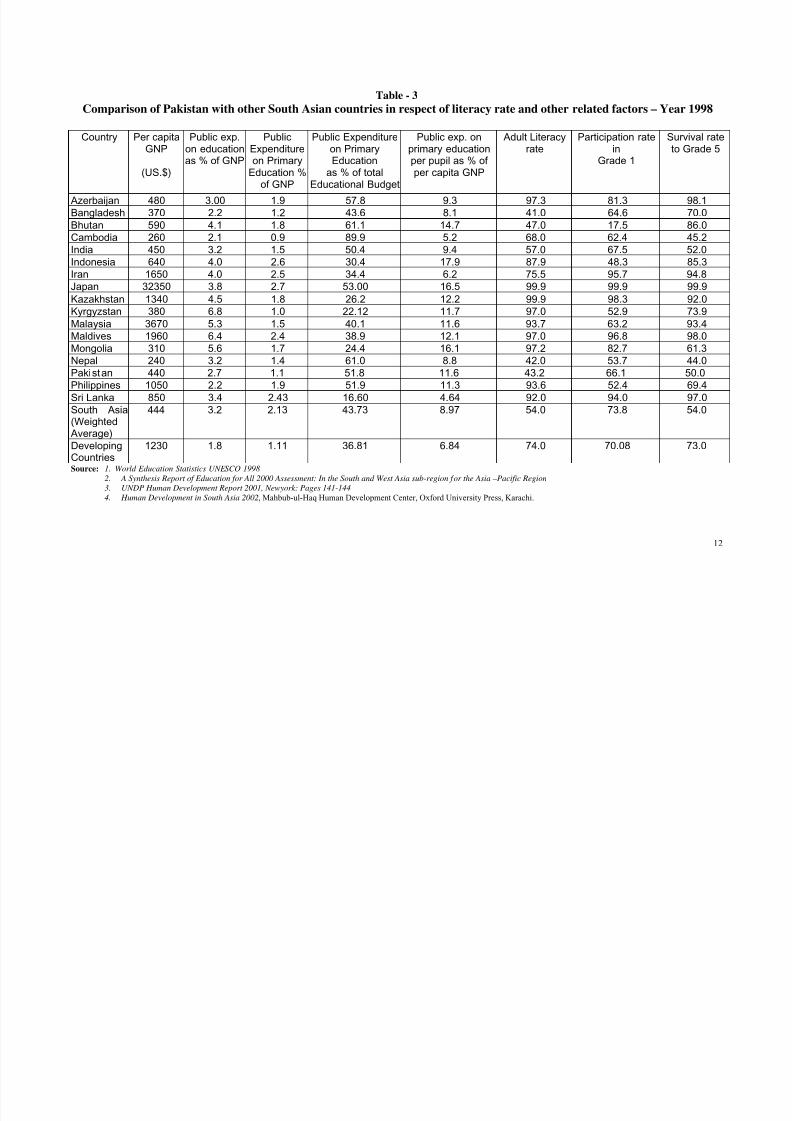
9. LITERACY SCENARIO AT THE INTERNATIONAL LEVEL
Table-1, given below provides an overview of an international comparison of selected countries (with specific reference to Asian and Pacific
countries) for literacy rates and the factors affecting literacy levels including Public Expenditure on Education as Percentage of GNP, Public
Expenditure on Primary Education as Percentage of GNP, Public Expenditure on Primary Education as Percentage of the Total Education
Budget, Public expenditure on Primary Education Per Pupil as Percentage of Per Capita GNP, Literacy Rate, Participation Rate in Grade 1, and
Survival Rate to Grade 5.
8/18/2019 litracy rate trends pakistan
http://slidepdf.com/reader/full/litracy-rate-trends-pakistan 20/155
12
Table - 3
Comparison of Pakistan with other South Asian countries in respect of literacy rate and other related factors – Year 1998
Country Per capitaGNP
(US.$)
Public exp.on educationas % of GNP
PublicExpenditureon Primary
Education %of GNP
Public Expenditureon PrimaryEducation
as % of totalEducational Budget
Public exp. onprimary educationper pupil as % ofper capita GNP
Adult Literacyrate
Participation ratein
Grade 1
Survival rateto Grade 5
Azerbaijan 480 3.00 1.9 57.8 9.3 97.3 81.3 98.1
Bangladesh 370 2.2 1.2 43.6 8.1 41.0 64.6 70.0Bhutan 590 4.1 1.8 61.1 14.7 47.0 17.5 86.0Cambodia 260 2.1 0.9 89.9 5.2 68.0 62.4 45.2India 450 3.2 1.5 50.4 9.4 57.0 67.5 52.0Indonesia 640 4.0 2.6 30.4 17.9 87.9 48.3 85.3Iran 1650 4.0 2.5 34.4 6.2 75.5 95.7 94.8Japan 32350 3.8 2.7 53.00 16.5 99.9 99.9 99.9Kazakhstan 1340 4.5 1.8 26.2 12.2 99.9 98.3 92.0Kyrgyzstan 380 6.8 1.0 22.12 11.7 97.0 52.9 73.9
Malaysia 3670 5.3 1.5 40.1 11.6 93.7 63.2 93.4Maldives 1960 6.4 2.4 38.9 12.1 97.0 96.8 98.0Mongolia 310 5.6 1.7 24.4 16.1 97.2 82.7 61.3Nepal 240 3.2 1.4 61.0 8.8 42.0 53.7 44.0Pakistan 440 2.7 1.1 51.8 11.6 43.2 66.1 50.0
Philippines 1050 2.2 1.9 51.9 11.3 93.6 52.4 69.4Sri Lanka 850 3.4 2.43 16.60 4.64 92.0 94.0 97.0South Asia(Weighted
Average)
444 3.2 2.13 43.73 8.97 54.0 73.8 54.0
DevelopingCountries
1230 1.8 1.11 36.81 6.84 74.0 70.08 73.0
Source: 1. World Education Statistics UNESCO 1998
2. A Synthesis Report of Education for All 2000 Assessment: In the South and West Asia sub-region for the Asia –Pacific Region
3.
UNDP Human Development Report 2001, Newyork: Pages 141-144
4.
Human Development in South Asia 2002, Mahbub-ul-Haq Human Development Center, Oxford University Press, Karachi.
8/18/2019 litracy rate trends pakistan
http://slidepdf.com/reader/full/litracy-rate-trends-pakistan 21/155
8/18/2019 litracy rate trends pakistan
http://slidepdf.com/reader/full/litracy-rate-trends-pakistan 22/155
14___________________________________________________________________________________________________________
*Source: Human Development in South Asia 2002, Mahbub-ul-Haq Human Development Center, Oxford University Press, Karachi.
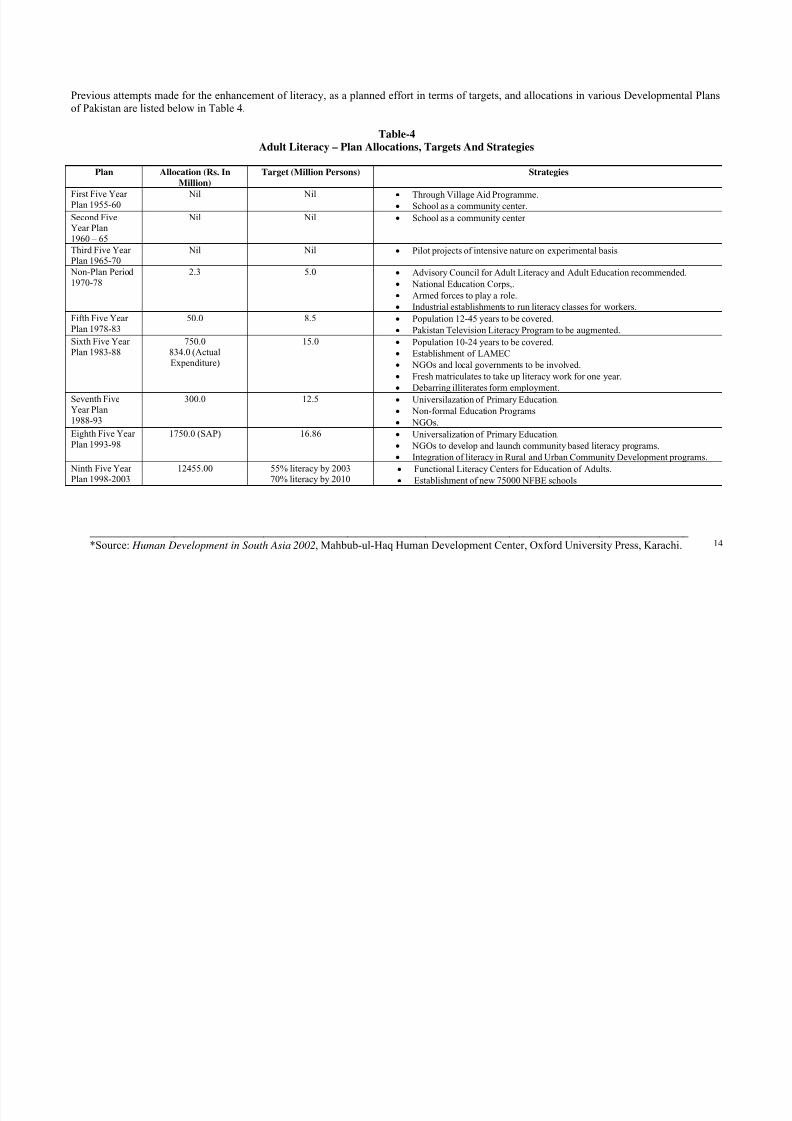
Previous attempts made for the enhancement of literacy, as a planned effort in terms of targets, and allocations in various Developmental Plans
of Pakistan are listed below in Table 4.
Table-4
Adult Literacy – Plan Allocations, Targets And Strategies
Plan Allocation (Rs. In
Million)
Target (Million Persons) Strategies
First Five Year
Plan 1955-60
Nil Nil • Through Village Aid Programme.
• School as a community center.
Second FiveYear Plan
1960 – 65
Nil Nil • School as a community center
Third Five YearPlan 1965-70
Nil Nil • Pilot projects of intensive nature on experimental basis
Non-Plan Period
1970-78
2.3 5.0 • Advisory Council for Adult Literacy and Adult Education recommended.
• National Education Corps,.
• Armed forces to play a role.
• Industrial establishments to run literacy classes for workers.
Fifth Five Year
Plan 1978-83
50.0 8.5 • Population 12-45 years to be covered.
• Pakistan Television Literacy Program to be augmented.
Sixth Five YearPlan 1983-88
750.0834.0 (Actual
Expenditure)
15.0 • Population 10-24 years to be covered.
• Establishment of LAMEC
• NGOs and local governments to be involved.
• Fresh matriculates to take up literacy work for one year.
• Debarring illiterates form employment.
Seventh FiveYear Plan
1988-93
300.0 12.5 • Universilazation of Primary Education.
• Non-formal Education Programs
• NGOs.
Eighth Five YearPlan 1993-98
1750.0 (SAP) 16.86 • Universalization of Primary Education.• NGOs to develop and launch community based literacy programs.
• Integration of literacy in Rural and Urban Community Development programs.
Ninth Five YearPlan 1998-2003
12455.00 55% literacy by 200370% literacy by 2010
• Functional Literacy Centers for Education of Adults.
• Establishment of new 75000 NFBE schools
8/18/2019 litracy rate trends pakistan
http://slidepdf.com/reader/full/litracy-rate-trends-pakistan 23/155
15
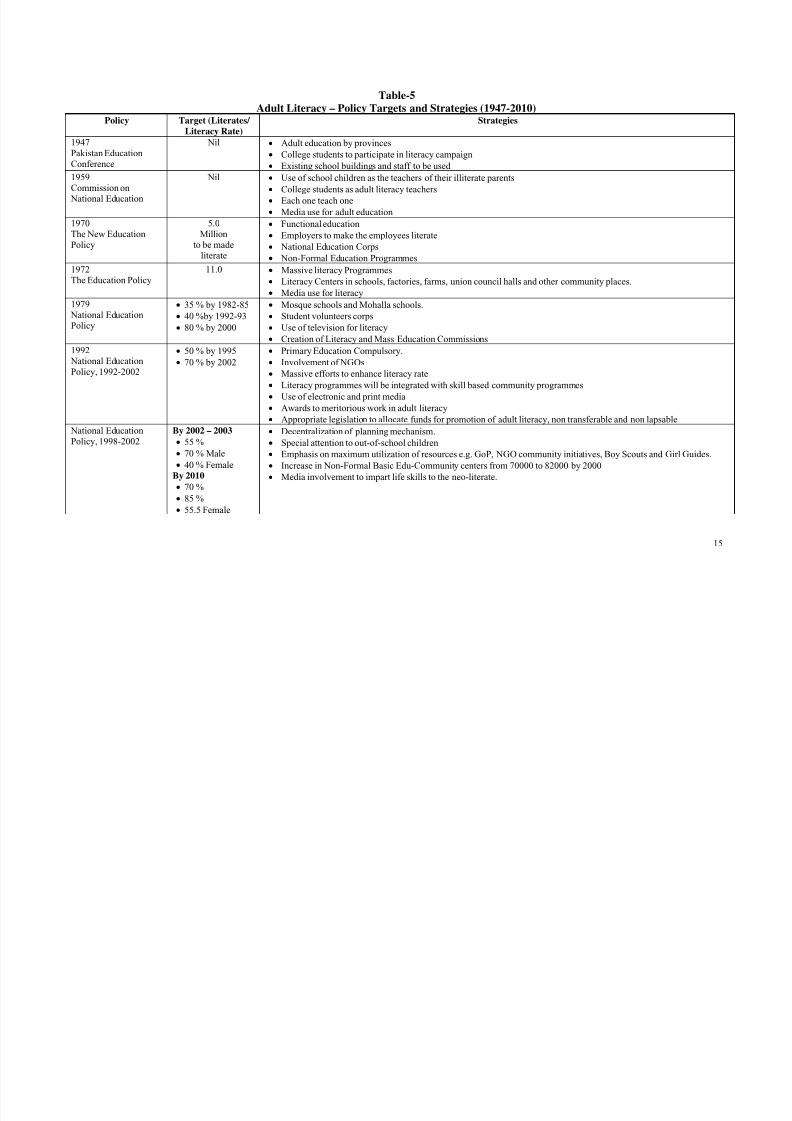
Table-5
Adult Literacy – Policy Targets and Strategies (1947-2010)Policy Target (Literates/
Literacy Rate)
Strategies
1947
Pakistan Education
Conference
Nil • Adult education by provinces
• College students to participate in literacy campaign
• Existing school buildings and staff to be used
1959
Commission on National Education
Nil • Use of school children as the teachers of their illiterate parents
• College students as adult literacy teachers
• Each one teach one
• Media use for adult education
1970
The New Education
Policy
5.0
Million
to be madeliterate
• Functional education
• Employers to make the employees literate
• National Education Corps
• Non-Formal Education Programmes
1972The Education Policy
11.0 • Massive literacy Programmes
• Literacy Centers in schools, factories, farms, union council halls and other community places.
• Media use for literacy
1979
National Education
Policy
• 35 % by 1982-85
• 40 %by 1992-93
• 80 % by 2000
• Mosque schools and Mohalla schools.
• Student volunteers corps
• Use of television for literacy• Creation of Literacy and Mass Education Commissions
1992
National Education
Policy, 1992-2002
• 50 % by 1995
• 70 % by 2002
• Primary Education Compulsory.
• Involvement of NGOs
• Massive efforts to enhance literacy rate
• Literacy programmes will be integrated with skill based community programmes
• Use of electronic and print media
• Awards to meritorious work in adult literacy
• Appropriate legislation to allocate funds for promotion of adult literacy, non transferable and non lapsable
National EducationPolicy, 1998-2002
By 2002 – 2003• 55 %
• 70 % Male
• 40 % Female
By 2010
• 70 %
• 85 %
• 55.5 Female
• Decentralization of planning mechanism.• Special attention to out-of-school children
• Emphasis on maximum utilization of resources e.g. GoP, NGO community initiatives, Boy Scouts and Girl Guides.
• Increase in Non-Formal Basic Edu-Community centers from 70000 to 82000 by 2000
• Media involvement to impart life skills to the neo-literate.
8/18/2019 litracy rate trends pakistan
http://slidepdf.com/reader/full/litracy-rate-trends-pakistan 24/155
16
11. CURRENT LITERACY SITUATION IN PAKISTAN
The overall literacy rate in Pakistan has been improving albeit at a very slow pace. In 1951, the overall literacy rate in Pakistan was 16.41 %.
After 50 years, the current estimated literacy rate for 2003 is 51.13%. Roughly, and on an average, literacy rate in Pakistan has been growing at
the rate of 3.085* % annually. On the other hand, the total number of illiterates in Pakistan has almost doubled in absolute numbers. In 1951,
there were only 22.54 million illiterates in Pakistan, 1998 Census results show that illiterate population has risen to 48.84 million. In terms of
provincial comparisons, during the period of 1981 to 1998, the literacy rate in the province of Punjab increased at a rate of 3.1681* %, while that
of the province of Sindh marked the slowest/lowest rate of literacy growth, of 2.1588* %. The analysis becomes more interesting and
astonishing when we study the district level trends, particularly the male-female disparities.
The literacy scenario based on the 1998 census, has been presented in detailed statistical tables in PART-II of this report. Analysis in respect of
male–female and rural-urban disparities is presented in the following tables (6-9).
* Formula used for calculating the annual growth rate is given in the Annex-A at the end.
8/18/2019 litracy rate trends pakistan
http://slidepdf.com/reader/full/litracy-rate-trends-pakistan 25/155
17
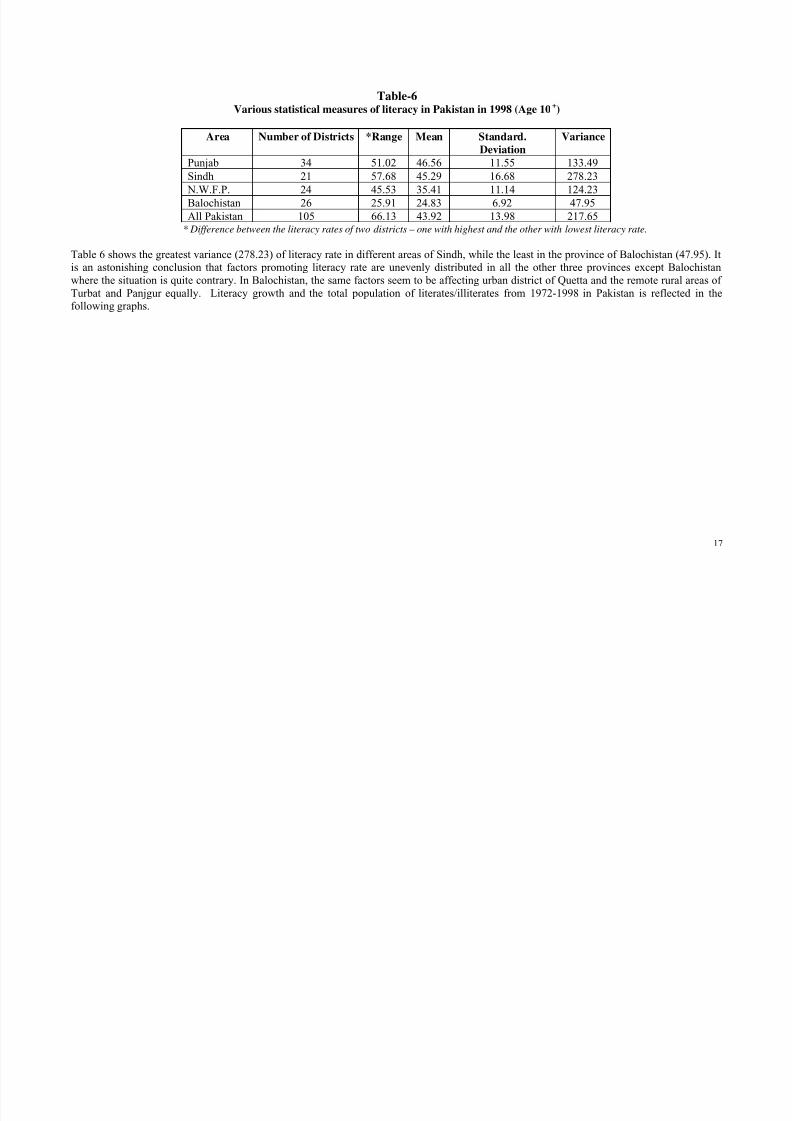
Table-6
Various statistical measures of literacy in Pakistan in 1998 (Age 10
+
)
Area Number of Districts *Range Mean Standard.
Deviation
Variance
Punjab 34 51.02 46.56 11.55 133.49
Sindh 21 57.68 45.29 16.68 278.23
N.W.F.P. 24 45.53 35.41 11.14 124.23
Balochistan 26 25.91 24.83 6.92 47.95
All Pakistan 105 66.13 43.92 13.98 217.65* Difference between the literacy rates of two districts – one with highest and the other with lowest literacy rate.
Table 6 shows the greatest variance (278.23) of literacy rate in different areas of Sindh, while the least in the province of Balochistan (47.95). It
is an astonishing conclusion that factors promoting literacy rate are unevenly distributed in all the other three provinces except Balochistan
where the situation is quite contrary. In Balochistan, the same factors seem to be affecting urban district of Quetta and the remote rural areas of
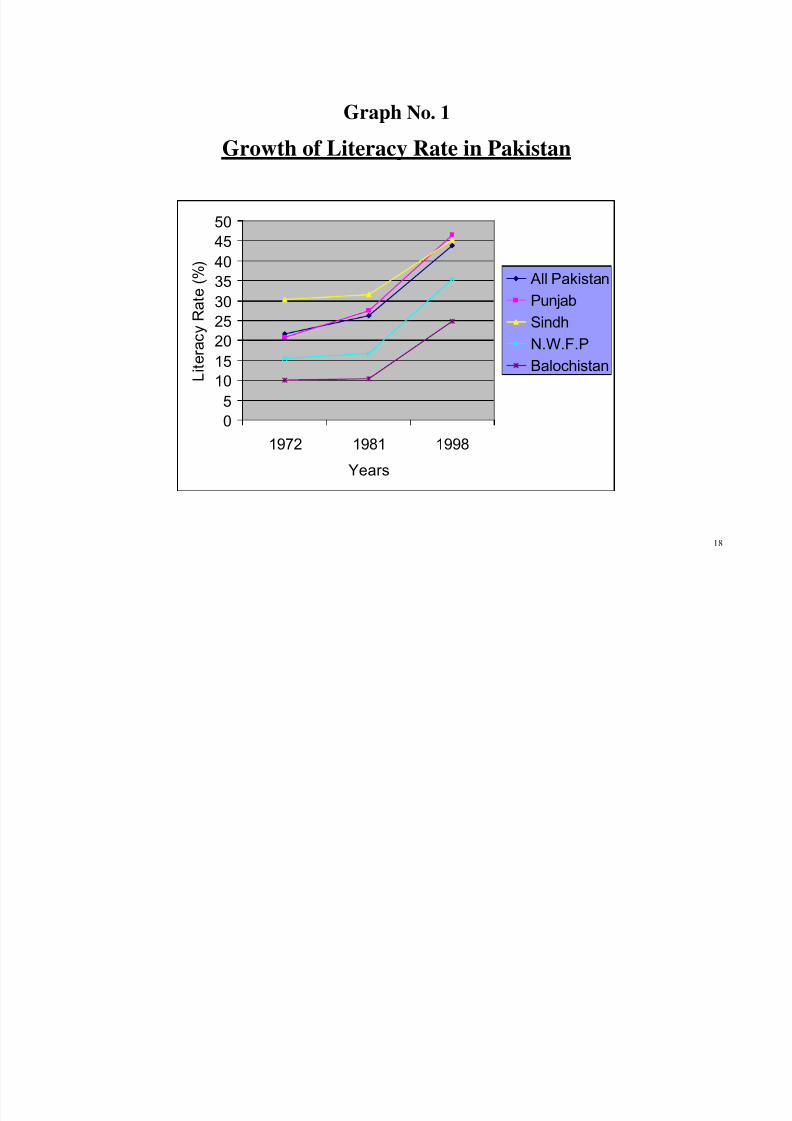
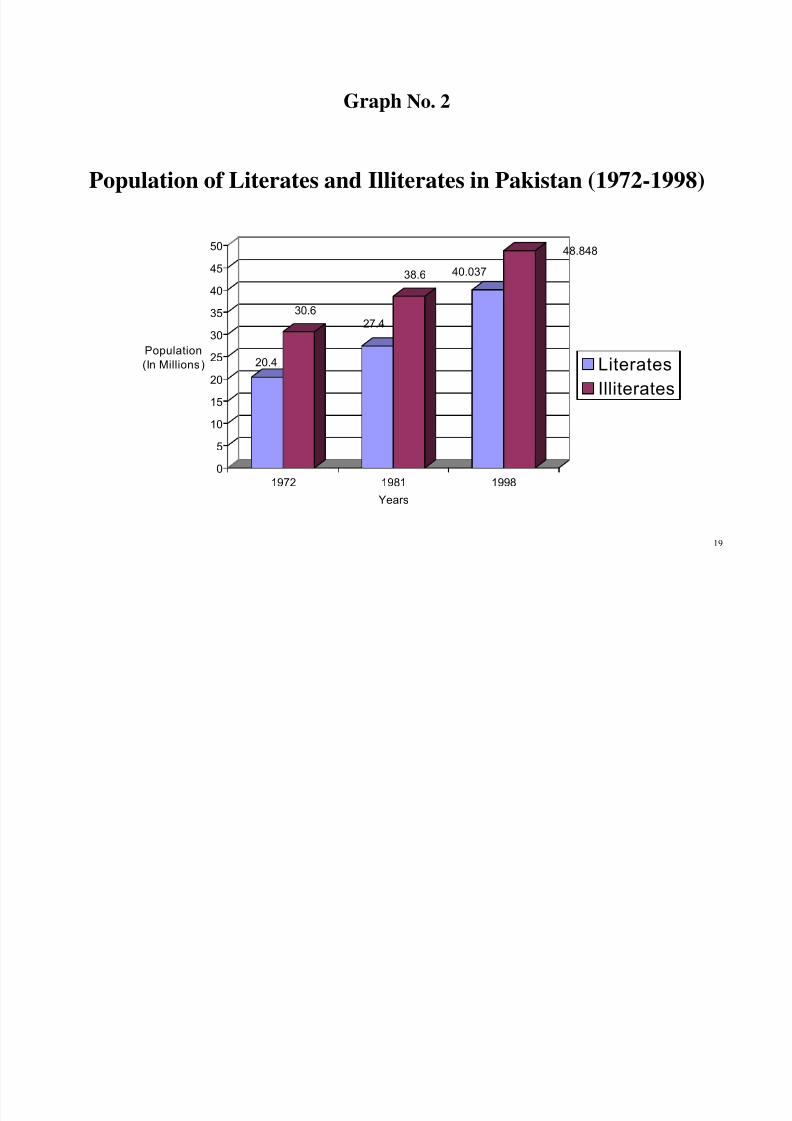
Turbat and Panjgur equally. Literacy growth and the total population of literates/illiterates from 1972-1998 in Pakistan is reflected in the
following graphs.
8/18/2019 litracy rate trends pakistan
http://slidepdf.com/reader/full/litracy-rate-trends-pakistan 26/155
18
Graph No. 1
Growth of Literacy Rate in Pakistan
0
5
10
15
2025
30
35
40
4550
1972 1981 1998
Years
L i t e r a c y
R a t e ( % )
All Pakistan
Punjab
SindhN.W.F.P
Balochistan
8/18/2019 litracy rate trends pakistan
http://slidepdf.com/reader/full/litracy-rate-trends-pakistan 27/155
19
Graph No. 2
Population of Literates and Illiterates in Pakistan (1972-1998)
20.4
30.6
27.4
38.6 40.037
48.848
0
5
10
15
20
25
30
35
40
45
50
Population
(In Millions)
1972 1981 1998
Years
Literates
Illiterates
8/18/2019 litracy rate trends pakistan
http://slidepdf.com/reader/full/litracy-rate-trends-pakistan 28/155
20
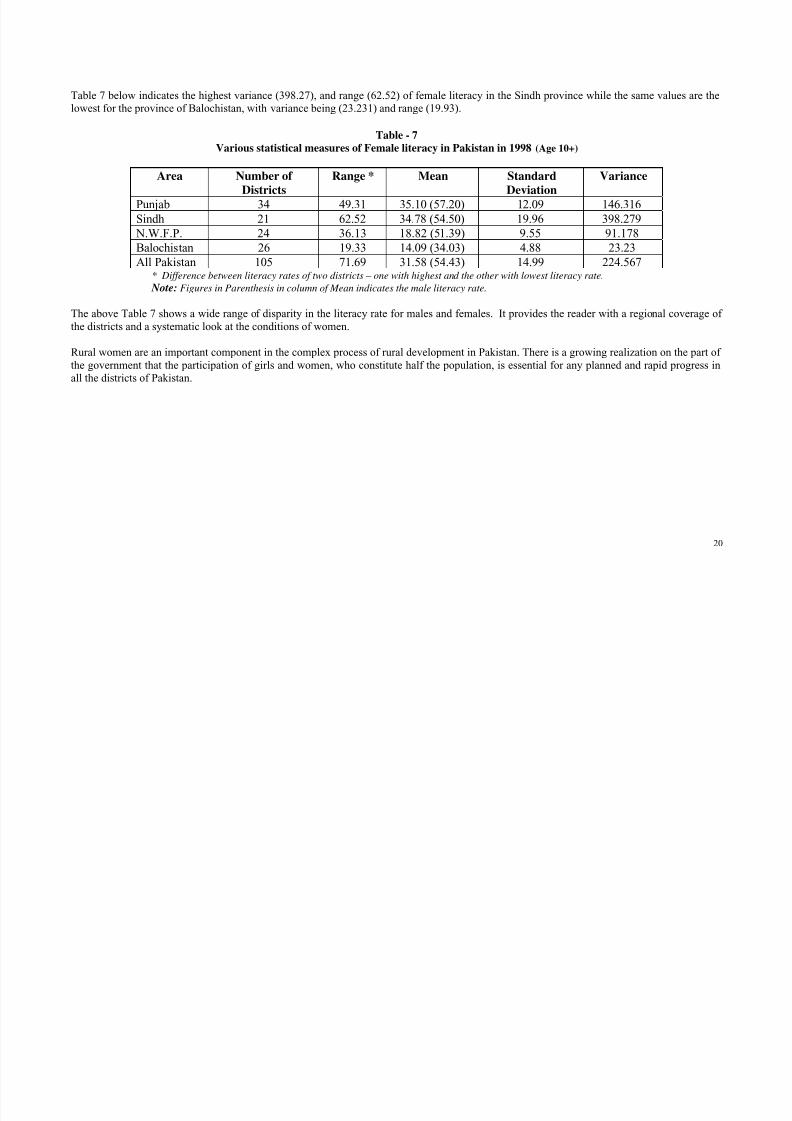
Table 7 below indicates the highest variance (398.27), and range (62.52) of female literacy in the Sindh province while the same values are the
lowest for the province of Balochistan, with variance being (23.231) and range (19.93).
Table - 7
Various statistical measures of Female literacy in Pakistan in 1998 (Age 10+)
Area Number of
Districts
Range * Mean Standard
Deviation
Variance
Punjab 34 49.31 35.10 (57.20) 12.09 146.316
Sindh 21 62.52 34.78 (54.50) 19.96 398.279 N.W.F.P. 24 36.13 18.82 (51.39) 9.55 91.178
Balochistan 26 19.33 14.09 (34.03) 4.88 23.23
All Pakistan 105 71.69 31.58 (54.43) 14.99 224.567* Difference between literacy rates of two districts – one with highest and the other with lowest literacy rate.
Note: Figures in Parenthesis in column of Mean indicates the male literacy rate.
The above Table 7 shows a wide range of disparity in the literacy rate for males and females. It provides the reader with a regional coverage of
the districts and a systematic look at the conditions of women.
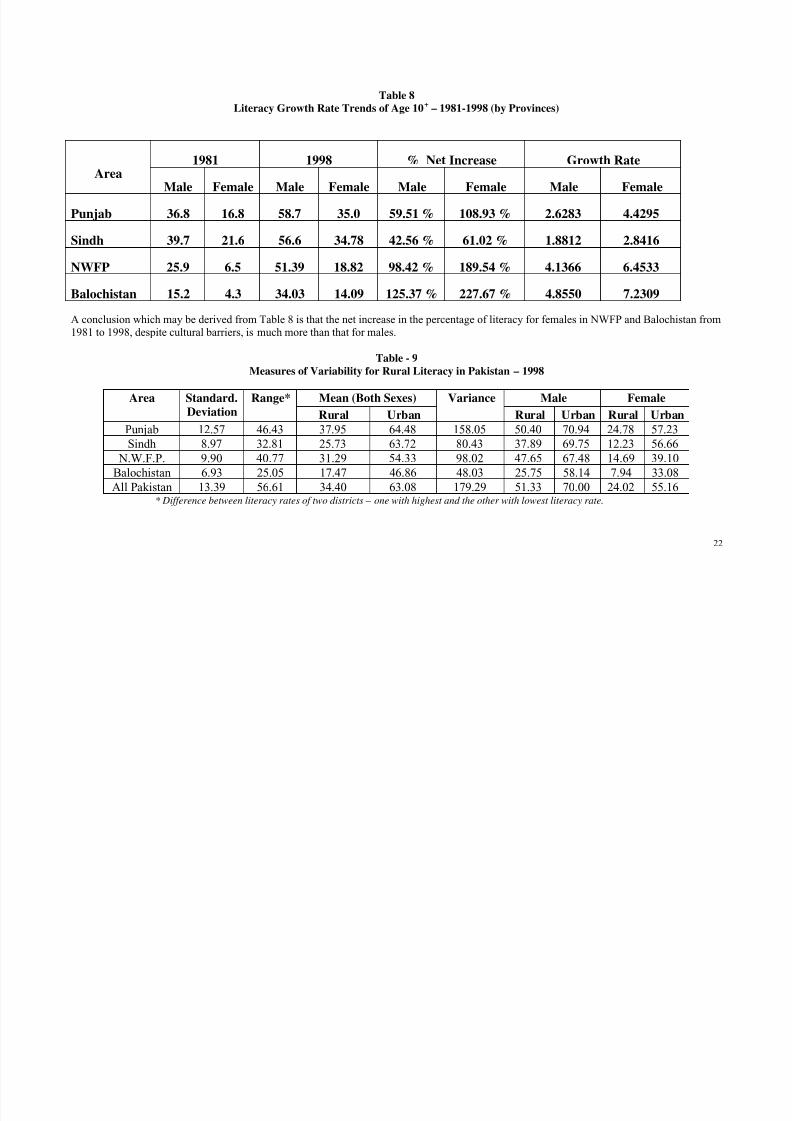
Rural women are an important component in the complex process of rural development in Pakistan. There is a growing realization on the part of
the government that the participation of girls and women, who constitute half the population, is essential for any planned and rapid progress in
all the districts of Pakistan.
8/18/2019 litracy rate trends pakistan
http://slidepdf.com/reader/full/litracy-rate-trends-pakistan 29/155
21
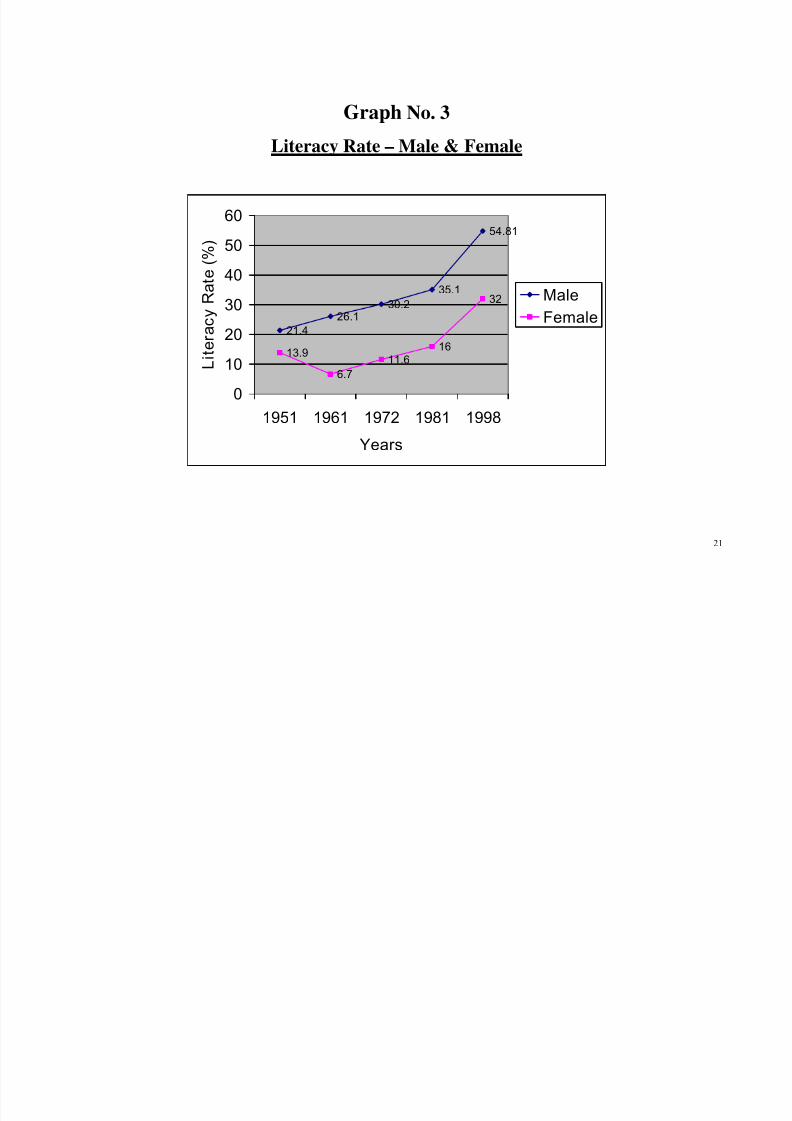
Graph No. 3
Literacy Rate – Male & Female
21.4
26.1
30.2
35.1
54.81
13.9
6.7
11.6
16
32
0
10
20
30
40
50
60
1951 1961 1972 1981 1998
Years
L i t e r a c y R a t e ( % )
Male
Female
8/18/2019 litracy rate trends pakistan
http://slidepdf.com/reader/full/litracy-rate-trends-pakistan 30/155
8/18/2019 litracy rate trends pakistan
http://slidepdf.com/reader/full/litracy-rate-trends-pakistan 31/155
8/18/2019 litracy rate trends pakistan
http://slidepdf.com/reader/full/litracy-rate-trends-pakistan 32/155
24
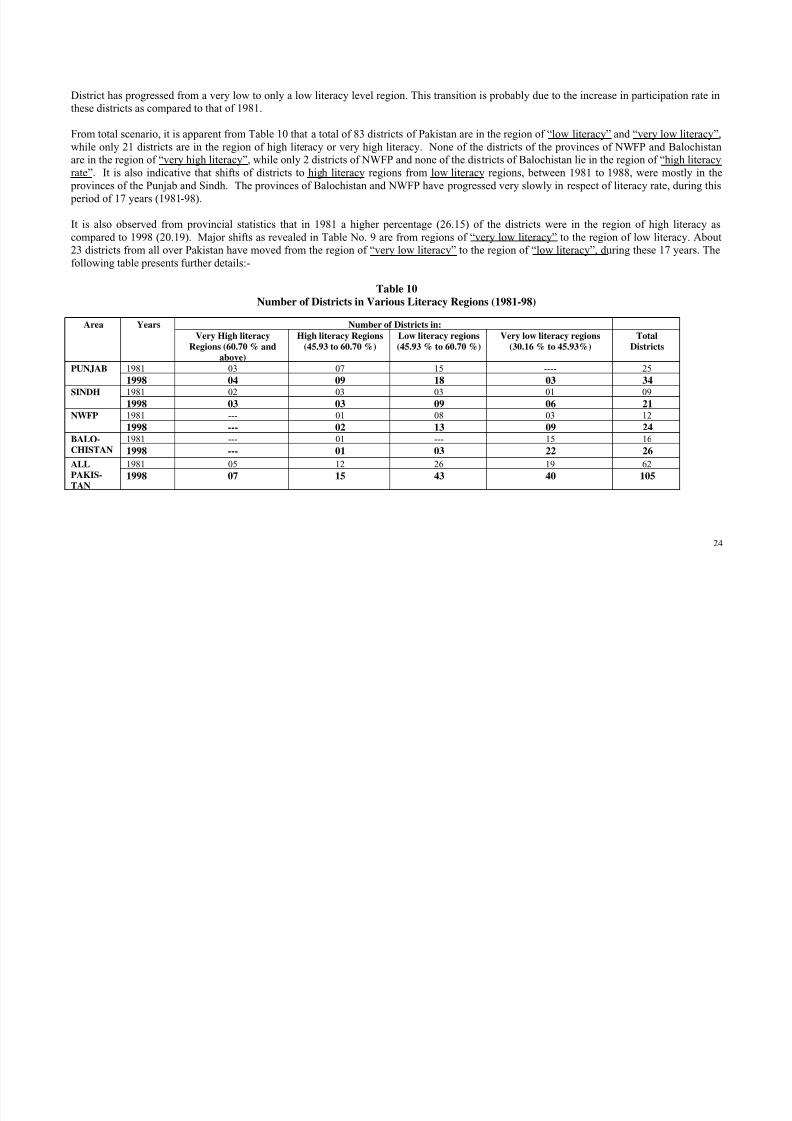
District has progressed from a very low to only a low literacy level region. This transition is probably due to the increase in participation rate in
these districts as compared to that of 1981.
From total scenario, it is apparent from Table 10 that a total of 83 districts of Pakistan are in the region of “low literacy” and “very low literacy”,
while only 21 districts are in the region of high literacy or very high literacy. None of the districts of the provinces of NWFP and Balochistan
are in the region of “very high literacy”, while only 2 districts of NWFP and none of the districts of Balochistan lie in the region of “high literacy
rate”. It is also indicative that shifts of districts to high literacy regions from low literacy regions, between 1981 to 1988, were mostly in the
provinces of the Punjab and Sindh. The provinces of Balochistan and NWFP have progressed very slowly in respect of literacy rate, during this
period of 17 years (1981-98).
It is also observed from provincial statistics that in 1981 a higher percentage (26.15) of the districts were in the region of high literacy ascompared to 1998 (20.19). Major shifts as revealed in Table No. 9 are from regions of “very low literacy” to the region of low literacy. About
23 districts from all over Pakistan have moved from the region of “very low literacy” to the region of “low literacy”, during these 17 years. The
following table presents further details:-
Table 10
Number of Districts in Various Literacy Regions (1981-98)
Area Years Number of Districts in:Very High literacy
Regions (60.70 % and
above)
High literacy Regions
(45.93 to 60.70 %)
Low literacy regions
(45.93 % to 60.70 %)
Very low literacy regions
(30.16 % to 45.93%)
Total
Districts
PUNJAB 1981 03 07 15 ---- 25
1998 04 09 18 03 34SINDH 1981 02 03 03 01 09
1998 03 03 09 06 21NWFP 1981 --- 01 08 03 12
1998 --- 02 13 09 24BALO-
CHISTAN
1981 --- 01 --- 15 16
1998 --- 01 03 22 26
ALL
PAKIS-
TAN
1981 05 12 26 19 62
1998 07 15 43 40 105
8/18/2019 litracy rate trends pakistan
http://slidepdf.com/reader/full/litracy-rate-trends-pakistan 33/155
25
Variations in the literacy rates of different districts of Pakistan deserve special consideration for developing future strategies for the promotion of
literacy in the country. As far as under-developed districts are concerned, unless these are not brought at par with comparatively developed
districts, gender disparities are not likely to be eliminated. Further, it is inconceivable to promote balanced socio-economic development in the
country without removing such sharp disparities in the field of literacy and basic education. The challenge has to be taken up by the new district
governments, as well as new elected government as a joint venture with a strong “political will” which is required for promotion of literacy.
8/18/2019 litracy rate trends pakistan
http://slidepdf.com/reader/full/litracy-rate-trends-pakistan 34/155
26
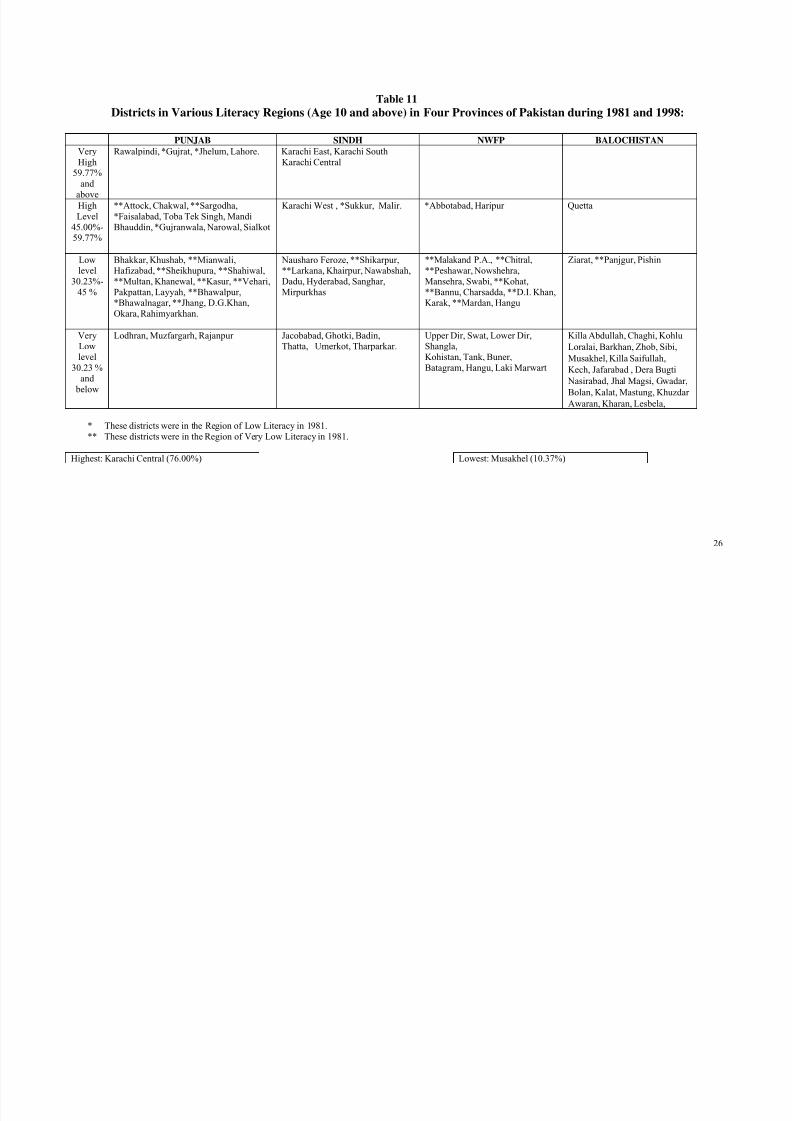
Table 11
Districts in Various Literacy Regions (Age 10 and above) in Four Provinces of Pakistan during 1981 and 1998:
PUNJAB SINDH NWFP BALOCHISTAN
Very
High59.77%
and
above
Rawalpindi, *Gujrat, *Jhelum, Lahore. Karachi East, Karachi South
Karachi Central
High
Level
45.00%-59.77%
**Attock, Chakwal, **Sargodha,
*Faisalabad, Toba Tek Singh, Mandi
Bhauddin, *Gujranwala, Narowal, Sialkot
Karachi West , *Sukkur, Malir. *Abbotabad, Haripur Quetta
Lowlevel
30.23%-
45 %
Bhakkar, Khushab, **Mianwali,Hafizabad, **Sheikhupura, **Shahiwal,
**Multan, Khanewal, **Kasur, **Vehari,
Pakpattan, Layyah, **Bhawalpur,*Bhawalnagar, **Jhang, D.G.Khan,
Okara, Rahimyarkhan.
Nausharo Feroze, **Shikarpur,**Larkana, Khairpur, Nawabshah,
Dadu, Hyderabad, Sanghar,
Mirpurkhas
**Malakand P.A., **Chitral,
**Peshawar, Nowshehra,
Mansehra, Swabi, **Kohat,
**Bannu, Charsadda, **D.I. Khan,Karak, **Mardan, Hangu
Ziarat, **Panjgur, Pishin
VeryLow
level
30.23 %and
below
Lodhran, Muzfargarh, Rajanpur Jacobabad, Ghotki, Badin,Thatta, Umerkot, Tharparkar.
Upper Dir, Swat, Lower Dir,Shangla,
Kohistan, Tank, Buner,
Batagram, Hangu, Laki Marwart
Killa Abdullah, Chaghi, Kohlu
Loralai, Barkhan, Zhob, Sibi,
Musakhel, Killa Saifullah,
Kech, Jafarabad , Dera Bugti
Nasirabad, Jhal Magsi, Gwadar,
Bolan, Kalat, Mastung, Khuzdar
Awaran, Kharan, Lesbela,
* These districts were in the Region of Low Literacy in 1981.
** These districts were in the Region of Very Low Literacy in 1981.
Highest: Karachi Central (76.00%) Lowest: Musakhel (10.37%)
8/18/2019 litracy rate trends pakistan
http://slidepdf.com/reader/full/litracy-rate-trends-pakistan 35/155
8/18/2019 litracy rate trends pakistan
http://slidepdf.com/reader/full/litracy-rate-trends-pakistan 36/155
28
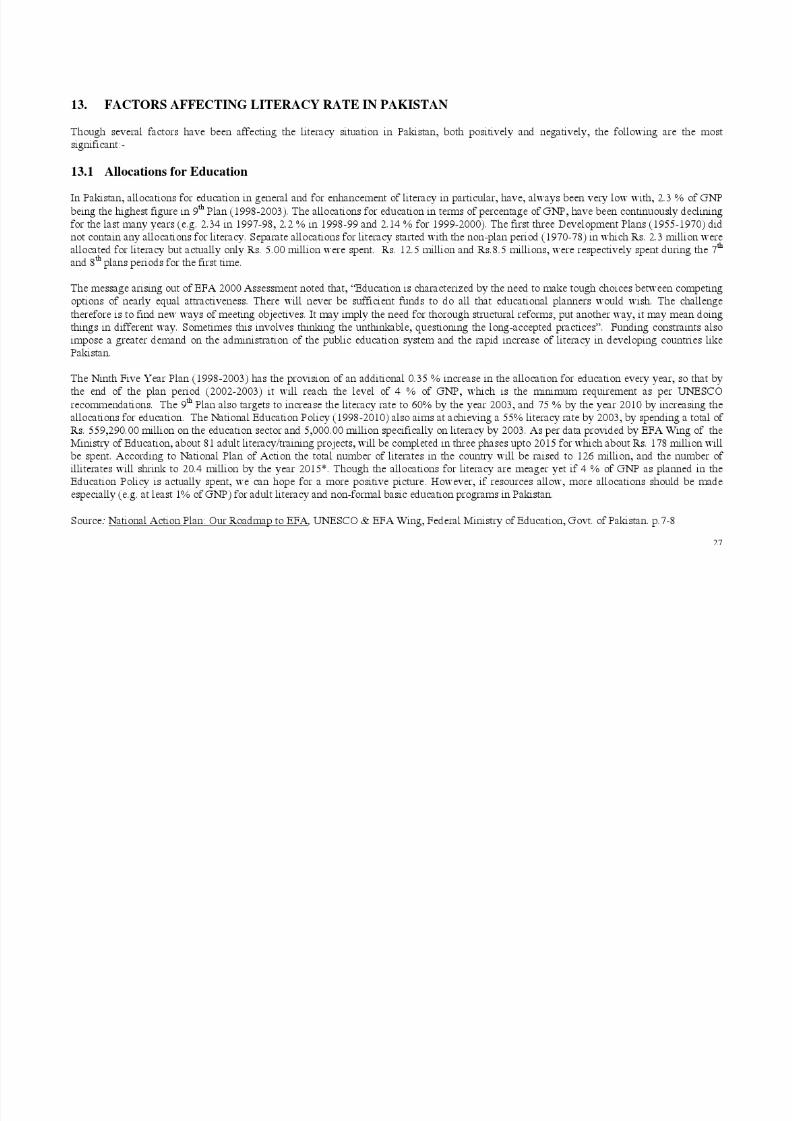
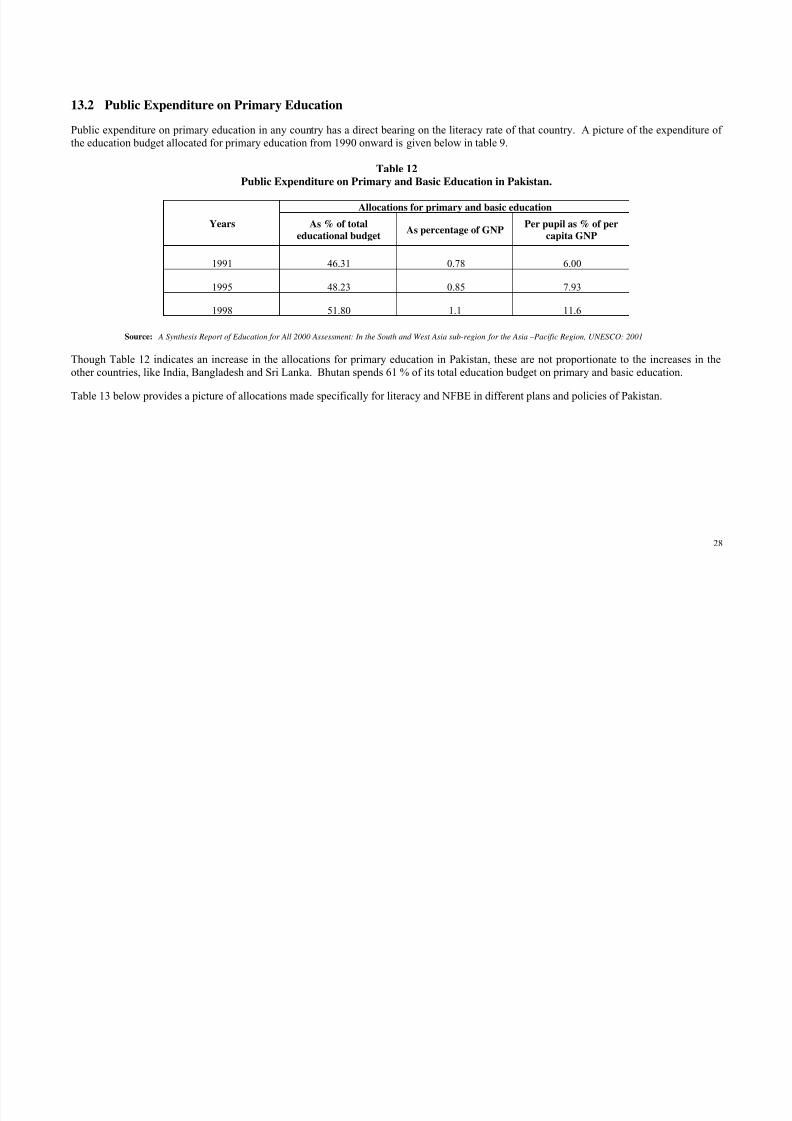
13.2 Public Expenditure on Primary Education
Public expenditure on primary education in any country has a direct bearing on the literacy rate of that country. A picture of the expenditure of
the education budget allocated for primary education from 1990 onward is given below in table 9.
Table 12
Public Expenditure on Primary and Basic Education in Pakistan.
Years
Allocations for primary and basic education
As % of totaleducational budget
As percentage of GNP Per pupil as % of percapita GNP
1991 46.31 0.78 6.00
1995 48.23 0.85 7.93
1998 51.80 1.1 11.6
Source: A Synthesis Report of Education for All 2000 Assessment: In the South and West Asia sub-region for the Asia –Pacific Region, UNESCO: 2001
Though Table 12 indicates an increase in the allocations for primary education in Pakistan, these are not proportionate to the increases in the
other countries, like India, Bangladesh and Sri Lanka. Bhutan spends 61 % of its total education budget on primary and basic education.
Table 13 below provides a picture of allocations made specifically for literacy and NFBE in different plans and policies of Pakistan.
8/18/2019 litracy rate trends pakistan
http://slidepdf.com/reader/full/litracy-rate-trends-pakistan 37/155
8/18/2019 litracy rate trends pakistan
http://slidepdf.com/reader/full/litracy-rate-trends-pakistan 38/155
8/18/2019 litracy rate trends pakistan
http://slidepdf.com/reader/full/litracy-rate-trends-pakistan 39/155
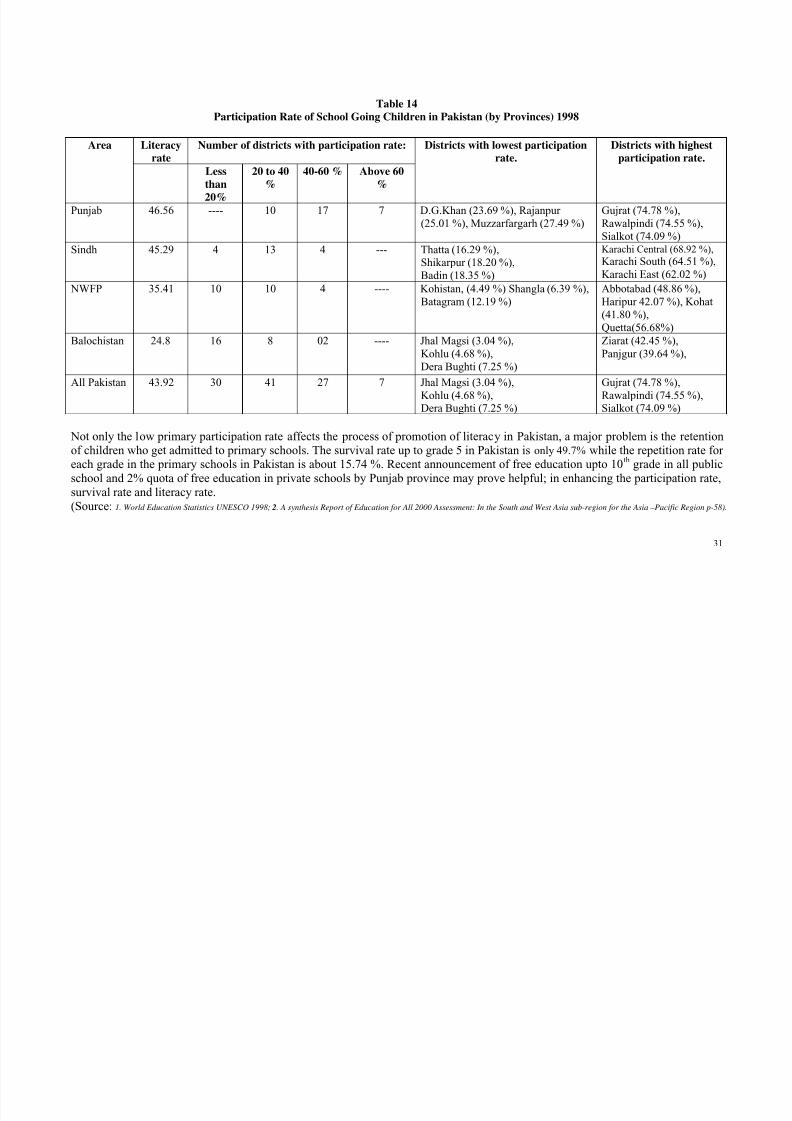
31
Table 14
Participation Rate of School Going Children in Pakistan (by Provinces) 1998
Area Literacy
rate
Number of districts with participation rate: Districts with lowest participation
rate.
Districts with highest
participation rate.
Less
than
20%
20 to 40
%
40-60 % Above 60
%
Punjab 46.56 ---- 10 17 7 D.G.Khan (23.69 %), Rajanpur
(25.01 %), Muzzarfargarh (27.49 %)
Gujrat (74.78 %),
Rawalpindi (74.55 %),Sialkot (74.09 %)
Sindh 45.29 4 13 4 --- Thatta (16.29 %),
Shikarpur (18.20 %),
Badin (18.35 %)
Karachi Central (68.92 %),
Karachi South (64.51 %),
Karachi East (62.02 %)
NWFP 35.41 10 10 4 ---- Kohistan, (4.49 %) Shangla (6.39 %),
Batagram (12.19 %)
Abbotabad (48.86 %),
Haripur 42.07 %), Kohat
(41.80 %),
Quetta(56.68%)Balochistan 24.8 16 8 02 ---- Jhal Magsi (3.04 %),
Kohlu (4.68 %),
Dera Bughti (7.25 %)
Ziarat (42.45 %),
Panjgur (39.64 %),
All Pakistan 43.92 30 41 27 7 Jhal Magsi (3.04 %),
Kohlu (4.68 %),
Dera Bughti (7.25 %)
Gujrat (74.78 %),
Rawalpindi (74.55 %),
Sialkot (74.09 %)
Not only the low primary participation rate affects the process of promotion of literacy in Pakistan, a major problem is the retentionof children who get admitted to primary schools. The survival rate up to grade 5 in Pakistan is only 49.7% while the repetition rate foreach grade in the primary schools in Pakistan is about 15.74 %. Recent announcement of free education upto 10th grade in all public
school and 2% quota of free education in private schools by Punjab province may prove helpful; in enhancing the participation rate,
survival rate and literacy rate.
(Source: 1. World Education Statistics UNESCO 1998; 2. A synthesis Report of Education for All 2000 Assessment: In the South and West Asia sub-region for the Asia –Pacific Region p-58).
8/18/2019 litracy rate trends pakistan
http://slidepdf.com/reader/full/litracy-rate-trends-pakistan 40/155
8/18/2019 litracy rate trends pakistan
http://slidepdf.com/reader/full/litracy-rate-trends-pakistan 41/155
33
Table 15
Mean Fertility Rate Comparison in Pakistan (By Provinces)
Area Literacy
rate
Female literacy
rate
Average numbers of children born by women who are:
Illiterate Literate Matric & above Degree Holders &
above
Punjab 46.56 35.10 4.46 3.97 3.02 1.97
Sindh 45.29 34.78 5.33 4.01 3.68 2.38
NWFP 35.41 18.82 5.03 3.41 3.07 2.98
Balochistan 24.83 14.09 4.13 3.11 2.91 2.12
All Pakistan 43.92 31.58 4.71 3.63 3.21 2.59
Source: Census Report of 1998.
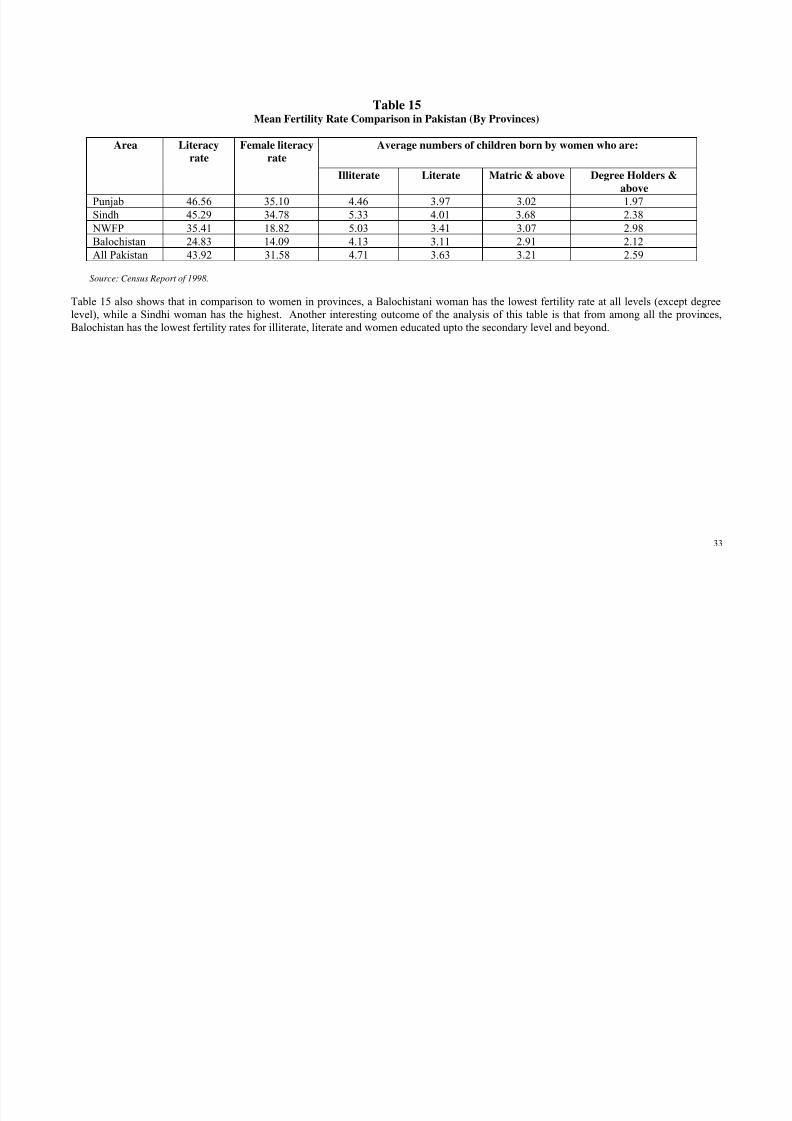
Table 15 also shows that in comparison to women in provinces, a Balochistani woman has the lowest fertility rate at all levels (except degree
level), while a Sindhi woman has the highest. Another interesting outcome of the analysis of this table is that from among all the provinces,
Balochistan has the lowest fertility rates for illiterate, literate and women educated upto the secondary level and beyond.
8/18/2019 litracy rate trends pakistan
http://slidepdf.com/reader/full/litracy-rate-trends-pakistan 42/155
34
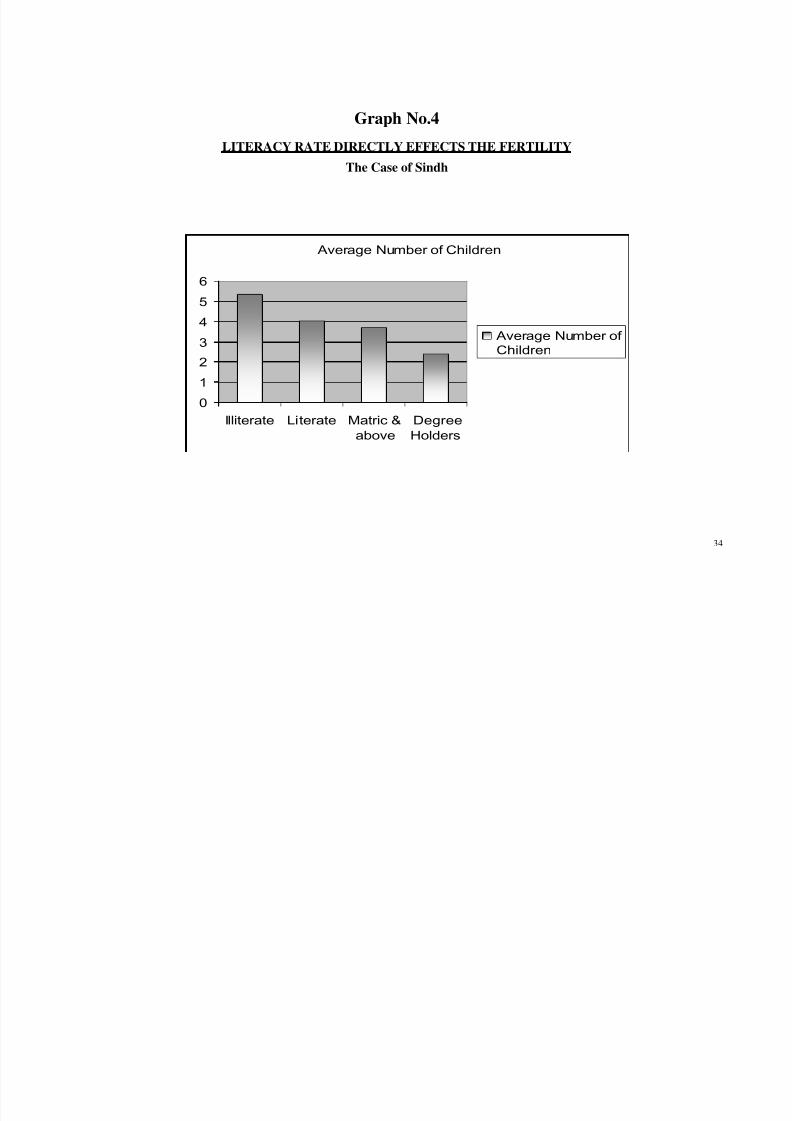
Graph No.4
LITERACY RATE DIRECTLY EFFECTS THE FERTILITY
The Case of Sindh
Average Number of Children
0
1
2
3
4
5
6
Illiterate Literate Matric &
above
Degree
Holders
Average Number of
Children
8/18/2019 litracy rate trends pakistan
http://slidepdf.com/reader/full/litracy-rate-trends-pakistan 43/155
35
15. DAKAR FRAMEWORK OF ACTION (2000)
The Dakar Framework for Action provided a guideline for enhancing literacy by declaring that, education is a fundamental human right. “It is
the key to sustainable development and peace and stability within and among countries, and thus an indispensable means for effective
participation in the societies and economies of the twenty-first century, which are affected by rapid globalization”. The Declaration further
affirms that “political will and stronger national leadership” are needed for the effective and successful implementation of National Plans in each
of the countries concerned. However, political will must be underpinned by resources. The international community acknowledges that many
countries currently lack the resources to achieve education for all within an acceptable time frame. New financial resources preferably in the
form of grants and concessional assistance, must therefore be mobilized by bilateral and multilateral funding agencies, including the World Bank
and regional development banks, and the private sector”.
15.1 Six Goals of Dakar Framework of Action for EFA:
1. Expanding and improving comprehensive early childhood care and education, especially for the most vulnerable and disadvantaged children.
2. Ensuring that by 2015 all children, particularly girls, in difficult circumstances and those belonging to ethnic minorities, have access to and
complete free and compulsory primary education of good quality;
3.
Ensuring that the learning needs of all young people and adults are met through equitable access to appropriate learning of life skills programmes;
4. Achieving a 50 percent improvement in levels of adult literacy by 2015, especially for women, and equitable access to basic and continuing
education for all adults;
5.
Eliminating gender disparities in primary and secondary education by 2005, and achieving gender equality in education by 2015, with a
focus on ensuring girls’ full and equal access to and achievement in basic education of good quality;
6.
Improving all aspects of the quality of education and ensuring excellence of all so that recognized and measurable learning outcomes are
achieved by all, especially in literacy, numeracy and essential life skills.
8/18/2019 litracy rate trends pakistan
http://slidepdf.com/reader/full/litracy-rate-trends-pakistan 44/155
36
16.
LITERACY AND NATIONAL PLAN OF ACTION FOR EFA (2001-2015)
Consequent upon the World Conference on Education For All (Jomtien, Thailand 1990) and as a follow up of Dakar Framework of Action 2000,
Ministry of Education, Govt. of Pakistan, had developed a National Plan of Action for EFA (2001-2015). Thrust areas of NPA for EFA include
primary education, adult literacy, and early childhood education. The NPA for EFA has been focused to achieve the following main objectives:
1. To reach the disadvantaged population groups in rural and urban areas with emphasis on out of school girls, and illiterate women.
2.
To promote community participation and ownership of basic education programs at grassroots level.
3.
To improve the relevance and quality of basic education through enhancing learning achievements of the children, youth and adults.
The NPA (2001-2015) derives its roots from Article 37-B of “Constitution of Pakistan” which states that State shall “remove illiteracy and
provide free and compulsory secondary education within minimum possible period”. In addition to the Constitution of Pakistan, the NPA for
EFA derives its directions from major policy documents of Pakistan, like National Education Policy 1998-2010, Education Sector Reforms
(ESR), and Education Sector Development Program under Perspective Development Plan (2001-2011) etc.
The NPA for EFA (2001-2015) aims to:
i.
Increase literacy rate upto 86 %.
ii. Impart literacy skill to 81 million illiterate adults.
iii.
A total of 525,000 literacy courses or classes/cycles will be organized during 2001-2015.
iv.
About 90,000 Non Formal Basic Education schools and 110,000 Vocational/Trade Centres will be opened.
v.
An estimated amount of Rs.180.0 Billion will be needed for the component of Adult Literacy.
The National Plan of Action for EFA (2001-2015) was finalized and launched on 3rd
April 2003, by the Ministry of Education. The actual
implementation of NPA will however be linked with the provision of substantial resources needed for this purpose. It is estimated that anadditional amount of Rs.430 billion will be needed to achieve EFA targets. The NPA envisages to mobilize Rs.178 billion from national
resources, and there exist a finance gap of Rs.253 billion. Now the question arises that who will fill this gap ? In case the Government of
Pakistan can not succeed in mobilizing additional resources, this NPA will merely remain a planning document, and will not transform into
reality.
8/18/2019 litracy rate trends pakistan
http://slidepdf.com/reader/full/litracy-rate-trends-pakistan 45/155
8/18/2019 litracy rate trends pakistan
http://slidepdf.com/reader/full/litracy-rate-trends-pakistan 46/155
38
17.1 Why has it been established?
There are three reasons which justify the Decade:
• One in five people over the age of 15 cannot communicate through literacy or take any part in the surrounding literate environment. The
EFA Global Monitoring Report 2002 spelled out the scope of the challenge – over 862 million people without access to literacy. Two thirds
of these people are women, with illiteracy thus adding to the deprivation and subordination to which women are already subject. In an
interconnected world where literacy is a key to communication such exclusion is unacceptable.
•
Literacy is a human right. Basic education, within which literacy is the key learning tool, was recognised as a human right over 50 yearsago, in the Universal Declaration of Human Rights. It is a scandal that this right continues to be violated for such a large proportion of
humanity.
• Literacy efforts up to now have proved inadequate, at national and international levels. The Decade is an opportunity to make a sustained
collective effort which will go beyond one-shot programmes or campaigns.
The Literacy Decade is an initiative of the United Nations General Assembly, adopted unanimously in a resolution of December 2001. Thus it
expresses strongly the collective will of the international community, both those who face a big literacy challenge and those who may be in a position to give assistance in meeting it. The nations of the world recognise that the promotion of literacy is in the interest of all, as part of
efforts towards peace, respect and exchange in a globalising world.
The Literacy Decade is also part of broader international work in education and development. The Education for All (EFA) goal of increasing
literacy rates by 50% by 2015 provides the overall target for the Decade, and the Millennium Development Goals (MDG) set the Decade in the
context of poverty reduction. Literacy promotion is at the heart of both EFA and MDG goals.
17.2 How will it make a difference?The International Plan of Action for the Literacy Decade proposes six lines of action to implement literacy for all:
Policy change: policies must provide a framework for local participation in literacy, including multilingual approaches and freedom of
expression. National policy environments must link literacy promotion with strategies of poverty reduction and with programmes in agriculture,
health, HIV/AIDS prevention, conflict resolution and other social concerns.
8/18/2019 litracy rate trends pakistan
http://slidepdf.com/reader/full/litracy-rate-trends-pakistan 47/155
8/18/2019 litracy rate trends pakistan
http://slidepdf.com/reader/full/litracy-rate-trends-pakistan 48/155
40
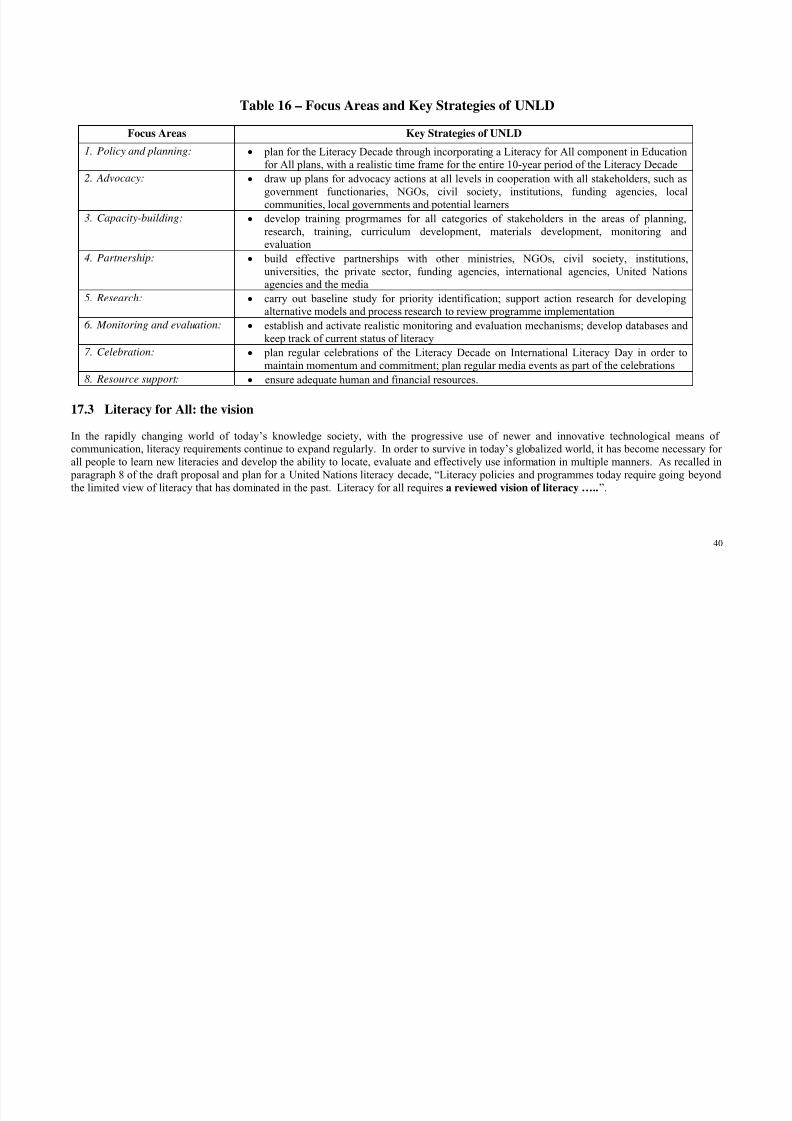
Table 16 – Focus Areas and Key Strategies of UNLD
Focus Areas Key Strategies of UNLD
1.
Policy and planning: • plan for the Literacy Decade through incorporating a Literacy for All component in Education
for All plans, with a realistic time frame for the entire 10-year period of the Literacy Decade
2.
Advocacy: • draw up plans for advocacy actions at all levels in cooperation with all stakeholders, such as
government functionaries, NGOs, civil society, institutions, funding agencies, local
communities, local governments and potential learners
3.
Capacity-building: • develop training progrmames for all categories of stakeholders in the areas of planning,
research, training, curriculum development, materials development, monitoring and
evaluation
4.
Partnership: • build effective partnerships with other ministries, NGOs, civil society, institutions,
universities, the private sector, funding agencies, international agencies, United Nations
agencies and the media
5.
Research: • carry out baseline study for priority identification; support action research for developing
alternative models and process research to review programme implementation
6.
Monitoring and evaluation: •
establish and activate realistic monitoring and evaluation mechanisms; develop databases and
keep track of current status of literacy
7.
Celebration: • plan regular celebrations of the Literacy Decade on International Literacy Day in order to
maintain momentum and commitment; plan regular media events as part of the celebrations
8.
Resource support: • ensure adequate human and financial resources.
17.3 Literacy for All: the vision
In the rapidly changing world of today’s knowledge society, with the progressive use of newer and innovative technological means ofcommunication, literacy requirements continue to expand regularly. In order to survive in today’s globalized world, it has become necessary for
all people to learn new literacies and develop the ability to locate, evaluate and effectively use information in multiple manners. As recalled in
paragraph 8 of the draft proposal and plan for a United Nations literacy decade, “Literacy policies and programmes today require going beyond
the limited view of literacy that has dominated in the past. Literacy for all requires a reviewed vision of literacy …..”.
8/18/2019 litracy rate trends pakistan
http://slidepdf.com/reader/full/litracy-rate-trends-pakistan 49/155
8/18/2019 litracy rate trends pakistan
http://slidepdf.com/reader/full/litracy-rate-trends-pakistan 50/155
8/18/2019 litracy rate trends pakistan
http://slidepdf.com/reader/full/litracy-rate-trends-pakistan 51/155
8/18/2019 litracy rate trends pakistan
http://slidepdf.com/reader/full/litracy-rate-trends-pakistan 52/155
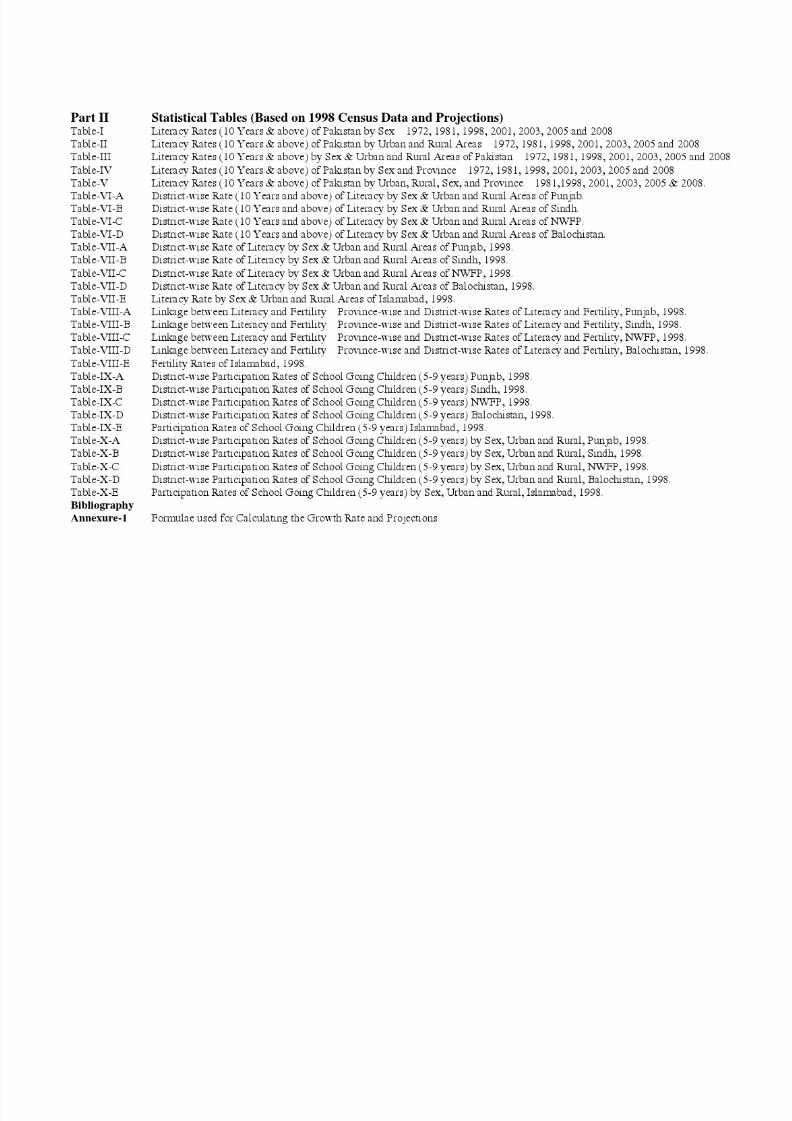
T bl I
8/18/2019 litracy rate trends pakistan
http://slidepdf.com/reader/full/litracy-rate-trends-pakistan 53/155
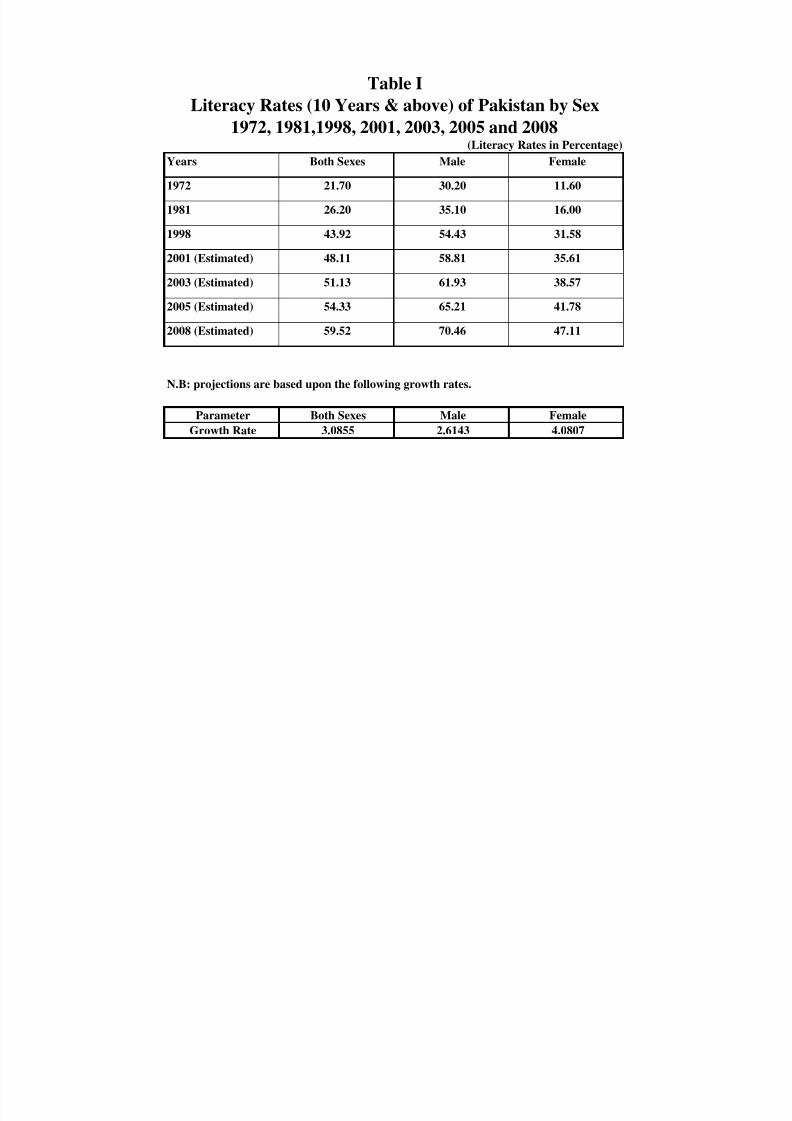
(Literacy Rates in Percentage)
Years Both Sexes Male Female
1972 21.70 30.20 11.60
1981 26.20 35.10 16.00
1998 43.92 54.43 31.58
2001 (Estimated) 48.11 58.81 35.61
2003 (Estimated) 51.13 61.93 38.57
2005 (Estimated) 54.33 65.21 41.78
2008 (Estimated) 59.52 70.46 47.11
Parameter Both Sexes Male Female
Growth Rate 3.0855 2.6143 4.0807
N.B: projections are based upon the following growth rates.
Table I
Literacy Rates (10 Years & above) of Pakistan by Sex
1972, 1981,1998, 2001, 2003, 2005 and 2008

8/18/2019 litracy rate trends pakistan
http://slidepdf.com/reader/full/litracy-rate-trends-pakistan 54/155

8/18/2019 litracy rate trends pakistan
http://slidepdf.com/reader/full/litracy-rate-trends-pakistan 55/155

8/18/2019 litracy rate trends pakistan
http://slidepdf.com/reader/full/litracy-rate-trends-pakistan 56/155
Table II
8/18/2019 litracy rate trends pakistan
http://slidepdf.com/reader/full/litracy-rate-trends-pakistan 57/155
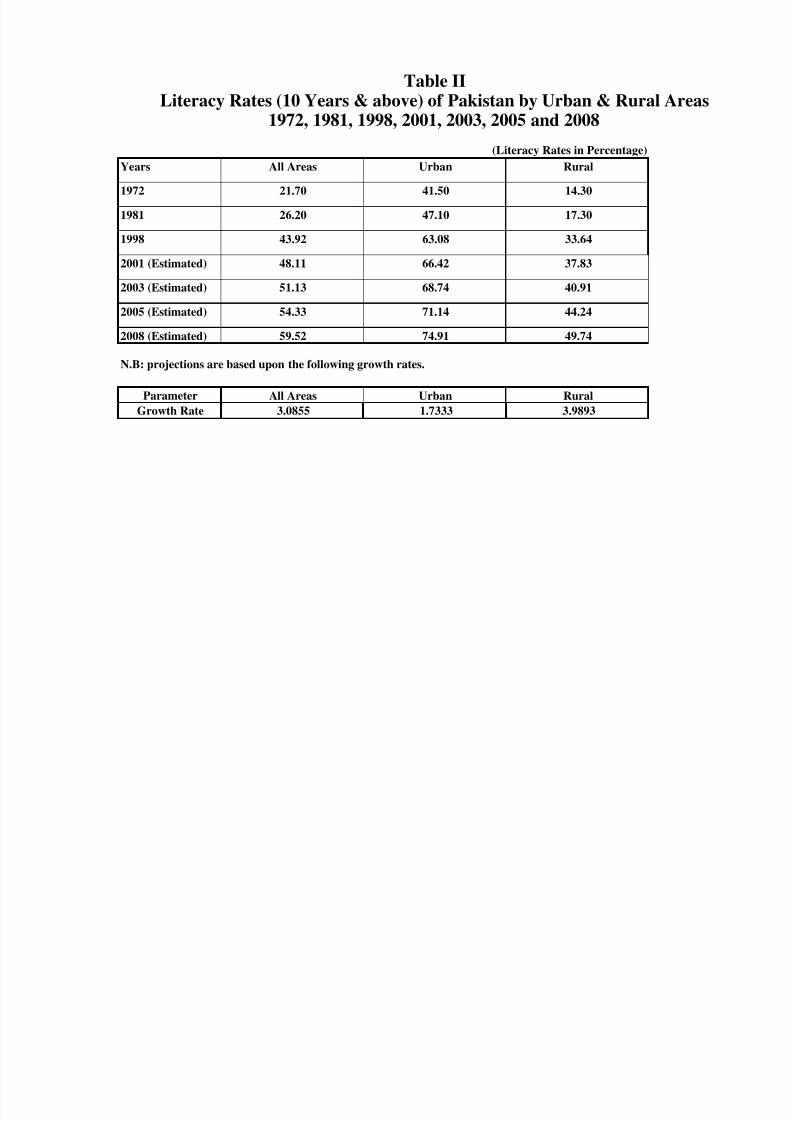
(Literacy Rates in Percentage)
Years All Areas Urban Rural
1972 21.70 41.50 14.30
1981 26.20 47.10 17.30
1998 43.92 63.08 33.64
2001 (Estimated) 48.11 66.42 37.83
2003 (Estimated) 51.13 68.74 40.91
2005 (Estimated) 54.33 71.14 44.24
2008 (Estimated) 59.52 74.91 49.74
Parameter All Areas Urban Rural
Growth Rate 3.0855 1.7333 3.9893
N.B: projections are based upon the following growth rates.
Literacy Rates (10 Years & above) of Pakistan by Urban & Rural Areas
1972, 1981, 1998, 2001, 2003, 2005 and 2008
Table II

8/18/2019 litracy rate trends pakistan
http://slidepdf.com/reader/full/litracy-rate-trends-pakistan 58/155

8/18/2019 litracy rate trends pakistan
http://slidepdf.com/reader/full/litracy-rate-trends-pakistan 59/155

8/18/2019 litracy rate trends pakistan
http://slidepdf.com/reader/full/litracy-rate-trends-pakistan 60/155
Table III
8/18/2019 litracy rate trends pakistan
http://slidepdf.com/reader/full/litracy-rate-trends-pakistan 61/155
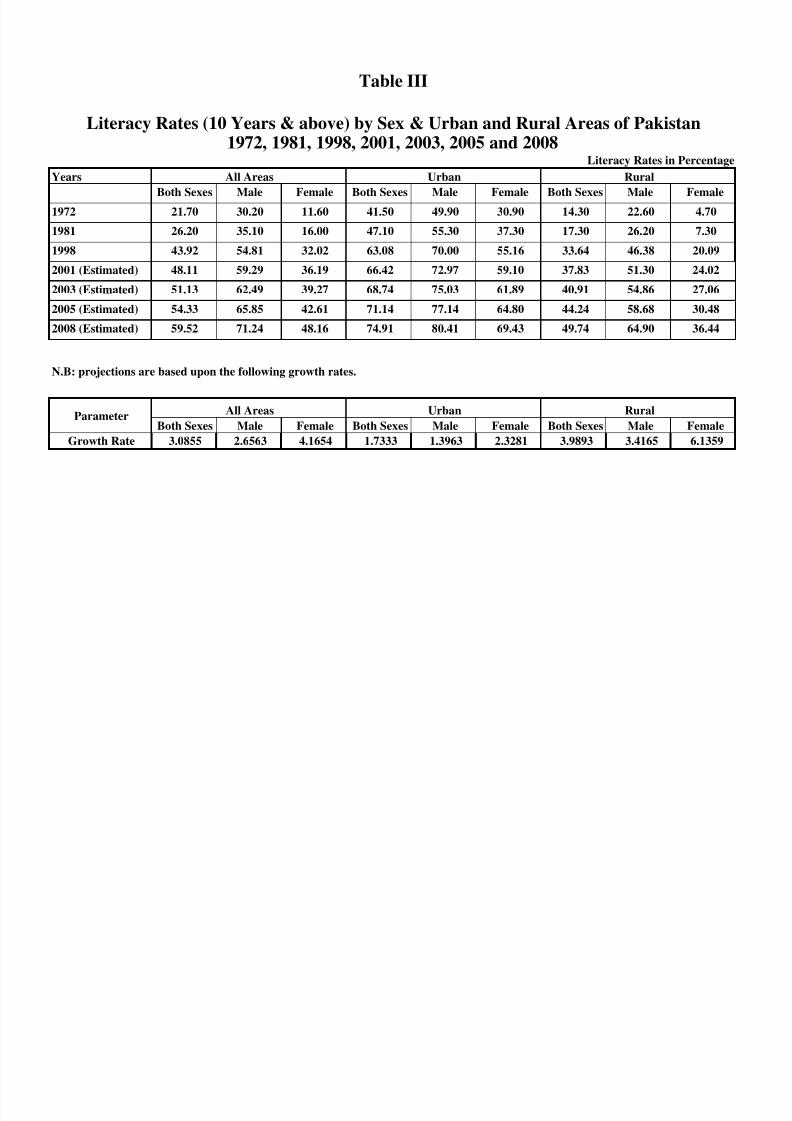
Years
Both Sexes Male Female Both Sexes Male Female Both Sexes Male Female
1972 21.70 30.20 11.60 41.50 49.90 30.90 14.30 22.60 4.70
1981 26.20 35.10 16.00 47.10 55.30 37.30 17.30 26.20 7.30
1998 43.92 54.81 32.02 63.08 70.00 55.16 33.64 46.38 20.09
2001 (Estimated) 48.11 59.29 36.19 66.42 72.97 59.10 37.83 51.30 24.02
2003 (Estimated) 51.13 62.49 39.27 68.74 75.03 61.89 40.91 54.86 27.06
2005 (Estimated) 54.33 65.85 42.61 71.14 77.14 64.80 44.24 58.68 30.48
2008 (Estimated) 59.52 71.24 48.16 74.91 80.41 69.43 49.74 64.90 36.44
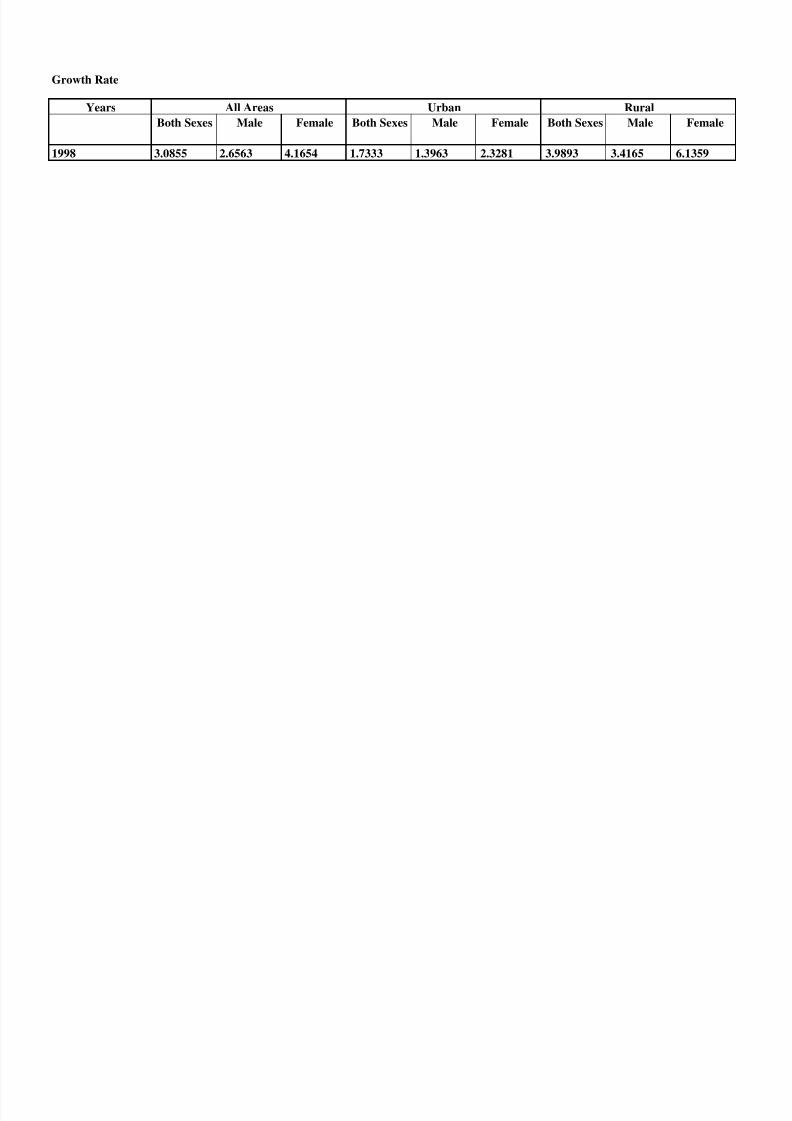
Both Sexes Male Female Both Sexes Male Female Both Sexes Male Female
Growth Rate 3.0855 2.6563 4.1654 1.7333 1.3963 2.3281 3.9893 3.4165 6.1359
Parameter All Areas Urban Rural
N.B: projections are based upon the following growth rates.
All Areas Urban Rural
Literacy Rates in Percentage
Literacy Rates (10 Years & above) by Sex & Urban and Rural Areas of Pakistan1972, 1981, 1998, 2001, 2003, 2005 and 2008
Growth Rate
8/18/2019 litracy rate trends pakistan
http://slidepdf.com/reader/full/litracy-rate-trends-pakistan 62/155
Years
Both Sexes Male Female Both Sexes Male Female Both Sexes Male Female
1998 3.0855 2.6563 4.1654 1.7333 1.3963 2.3281 3.9893 3.4165 6.1359
All Areas Urban Rural

8/18/2019 litracy rate trends pakistan
http://slidepdf.com/reader/full/litracy-rate-trends-pakistan 63/155

8/18/2019 litracy rate trends pakistan
http://slidepdf.com/reader/full/litracy-rate-trends-pakistan 64/155
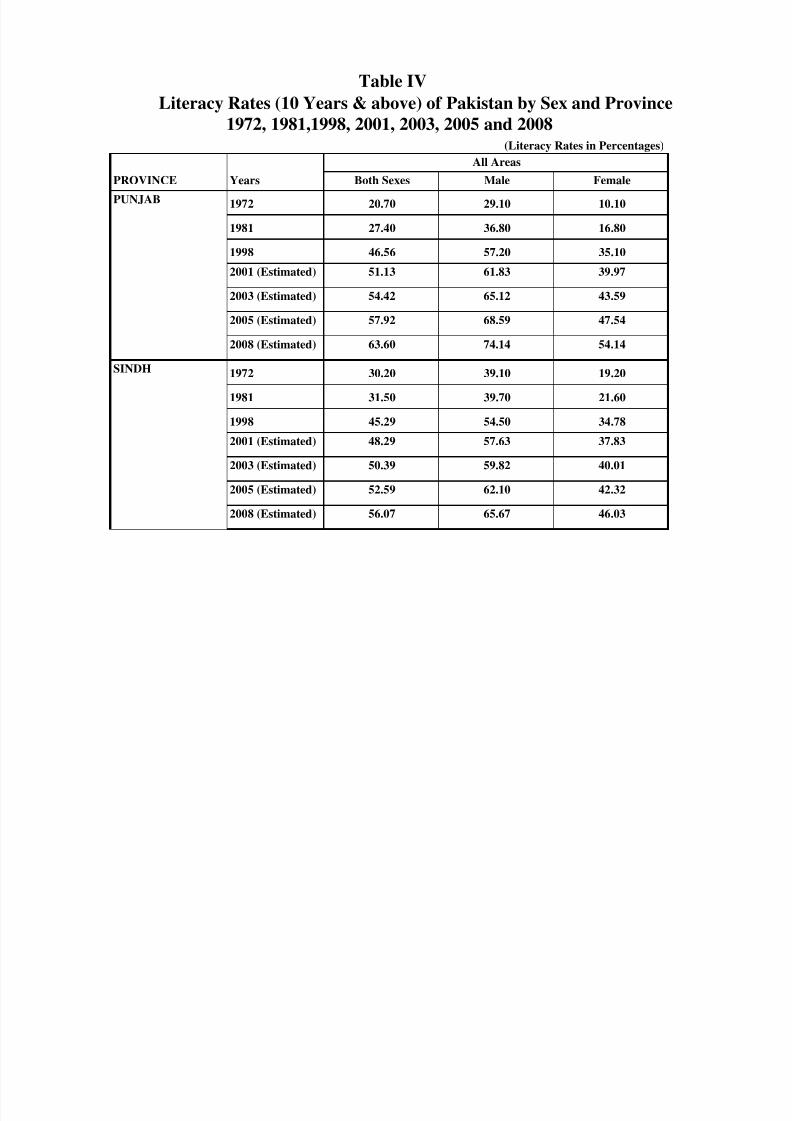
Table IV
Li R (10 Y & b ) f P ki b S d P i
8/18/2019 litracy rate trends pakistan
http://slidepdf.com/reader/full/litracy-rate-trends-pakistan 65/155
PROVINCE Years Both Sexes Male Female
1972 20.70 29.10 10.10
1981 27.40 36.80 16.80
1998 46.56 57.20 35.10
2001 (Estimated) 51.13 61.83 39.97
2003 (Estimated) 54.42 65.12 43.59
2005 (Estimated) 57.92 68.59 47.54
2008 (Estimated) 63.60 74.14 54.14
1972 30.20 39.10 19.20
1981 31.50 39.70 21.60
1998 45.29 54.50 34.78
2001 (Estimated) 48.29 57.63 37.83
2003 (Estimated) 50.39 59.82 40.01
2005 (Estimated) 52.59 62.10 42.32
2008 (Estimated) 56.07 65.67 46.03
SINDH
(Literacy Rates in Percentages)
All Areas
1972, 1981,1998, 2001, 2003, 2005 and 2008
Literacy Rates (10 Years & above) of Pakistan by Sex and Province
PUNJAB
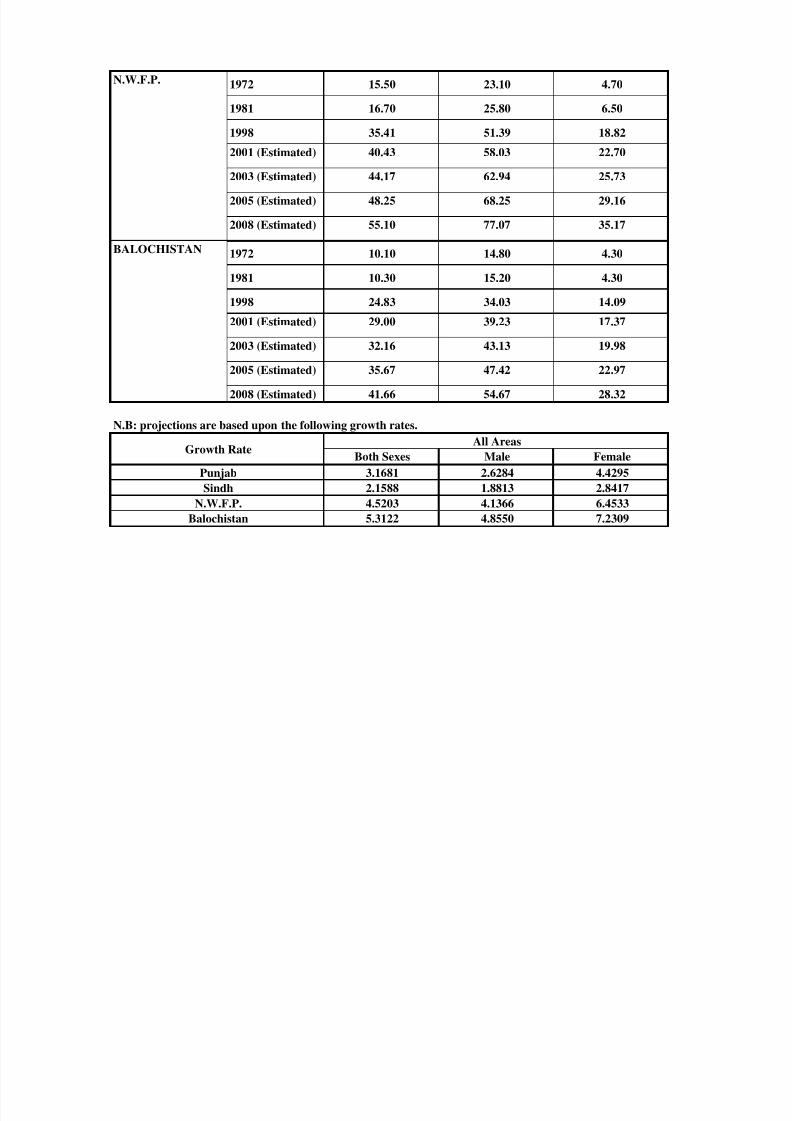
1972 15.50 23.10 4.70N.W.F.P.
8/18/2019 litracy rate trends pakistan
http://slidepdf.com/reader/full/litracy-rate-trends-pakistan 66/155
1981 16.70 25.80 6.50
1998 35.41 51.39 18.82
2001 (Estimated) 40.43 58.03 22.70
2003 (Estimated) 44.17 62.94 25.73
2005 (Estimated) 48.25 68.25 29.16
2008 (Estimated) 55.10 77.07 35.17
1972 10.10 14.80 4.30
1981 10.30 15.20 4.30
1998 24.83 34.03 14.09
2001 (Estimated) 29.00 39.23 17.37
2003 (Estimated) 32.16 43.13 19.98
2005 (Estimated) 35.67 47.42 22.97
2008 (Estimated) 41.66 54.67 28.32
Both Sexes Male Female
3.1681 2.6284 4.4295
2.1588 1.8813 2.8417
4.5203 4.1366 6.4533
5.3122 4.8550 7.2309
BALOCHISTAN
N.W.F.P.
Balochistan
N.B: projections are based upon the following growth rates.
All Areas
Punjab
Sindh
Growth Rate
Growth Rate
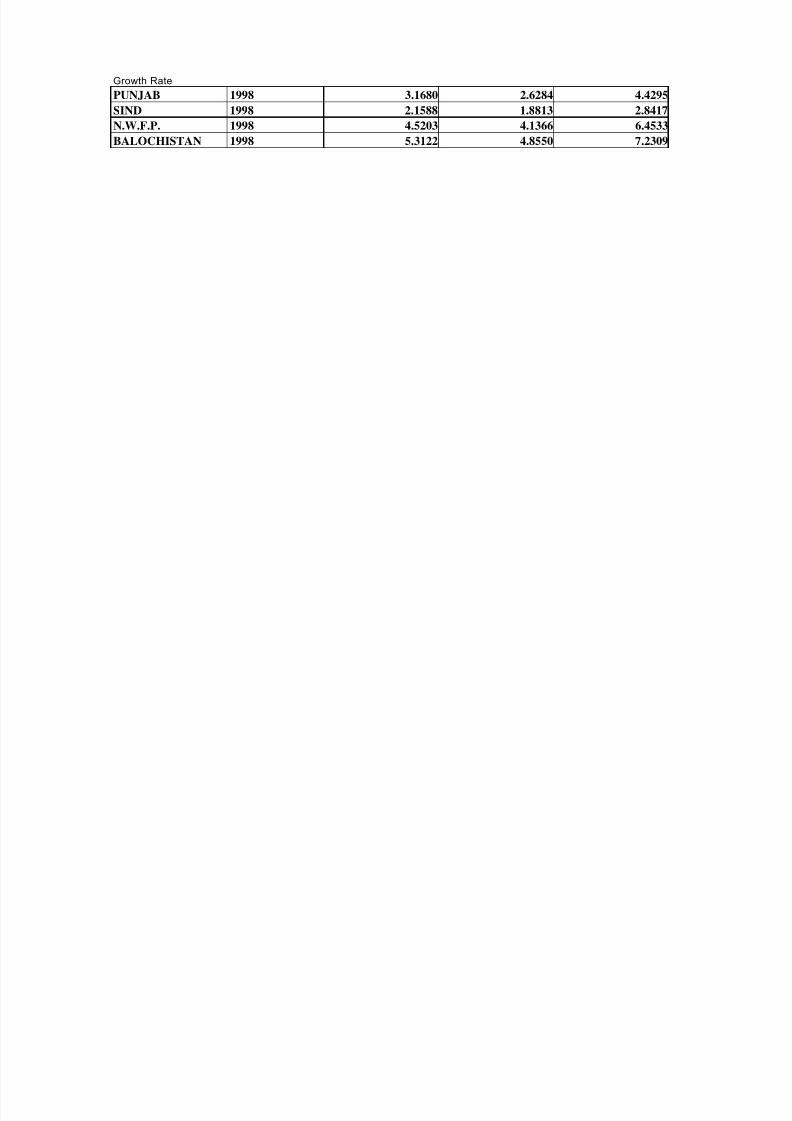
PUNJAB 1998 3.1680 2.6284 4.4295
8/18/2019 litracy rate trends pakistan
http://slidepdf.com/reader/full/litracy-rate-trends-pakistan 67/155
J
SIND 1998 2.1588 1.8813 2.8417
N.W.F.P. 1998 4.5203 4.1366 6.4533BALOCHISTAN 1998 5.3122 4.8550 7.2309

8/18/2019 litracy rate trends pakistan
http://slidepdf.com/reader/full/litracy-rate-trends-pakistan 68/155

8/18/2019 litracy rate trends pakistan
http://slidepdf.com/reader/full/litracy-rate-trends-pakistan 69/155

8/18/2019 litracy rate trends pakistan
http://slidepdf.com/reader/full/litracy-rate-trends-pakistan 70/155
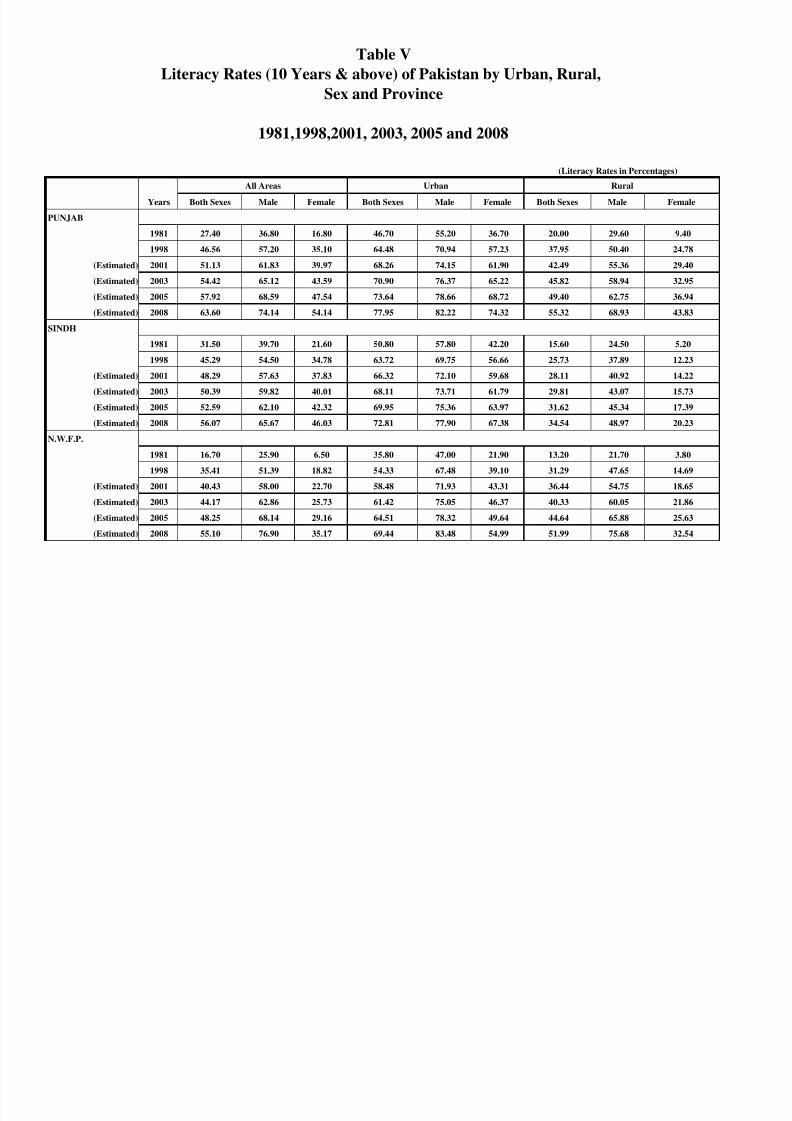
Table V
Literacy Rates (10 Years & above) of Pakistan by Urban, Rural,
Sex and Province
8/18/2019 litracy rate trends pakistan
http://slidepdf.com/reader/full/litracy-rate-trends-pakistan 71/155
(Literacy Rates in Percentages)
Years Both Sexes Male Female Both Sexes Male Female Both Sexes Male Female
PUNJAB
1981 27.40 36.80 16.80 46.70 55.20 36.70 20.00 29.60 9.40
1998 46.56 57.20 35.10 64.48 70.94 57.23 37.95 50.40 24.78
(Estimated) 2001 51.13 61.83 39.97 68.26 74.15 61.90 42.49 55.36 29.40
(Estimated) 2003 54.42 65.12 43.59 70.90 76.37 65.22 45.82 58.94 32.95
(Estimated) 2005 57.92 68.59 47.54 73.64 78.66 68.72 49.40 62.75 36.94
(Estimated) 2008 63.60 74.14 54.14 77.95 82.22 74.32 55.32 68.93 43.83
SINDH
1981 31.50 39.70 21.60 50.80 57.80 42.20 15.60 24.50 5.20
1998 45.29 54.50 34.78 63.72 69.75 56.66 25.73 37.89 12.23
(Estimated) 2001 48.29 57.63 37.83 66.32 72.10 59.68 28.11 40.92 14.22
(Estimated) 2003 50.39 59.82 40.01 68.11 73.71 61.79 29.81 43.07 15.73
(Estimated) 2005 52.59 62.10 42.32 69.95 75.36 63.97 31.62 45.34 17.39
(Estimated) 2008 56.07 65.67 46.03 72.81 77.90 67.38 34.54 48.97 20.23
N.W.F.P.
1981 16.70 25.90 6.50 35.80 47.00 21.90 13.20 21.70 3.80
1998 35.41 51.39 18.82 54.33 67.48 39.10 31.29 47.65 14.69
(Estimated) 2001 40.43 58.00 22.70 58.48 71.93 43.31 36.44 54.75 18.65
(Estimated) 2003 44.17 62.86 25.73 61.42 75.05 46.37 40.33 60.05 21.86
(Estimated) 2005 48.25 68.14 29.16 64.51 78.32 49.64 44.64 65.88 25.63
(Estimated) 2008 55.10 76.90 35.17 69.44 83.48 54.99 51.99 75.68 32.54
All Areas Urban Rural
1981,1998,2001, 2003, 2005 and 2008
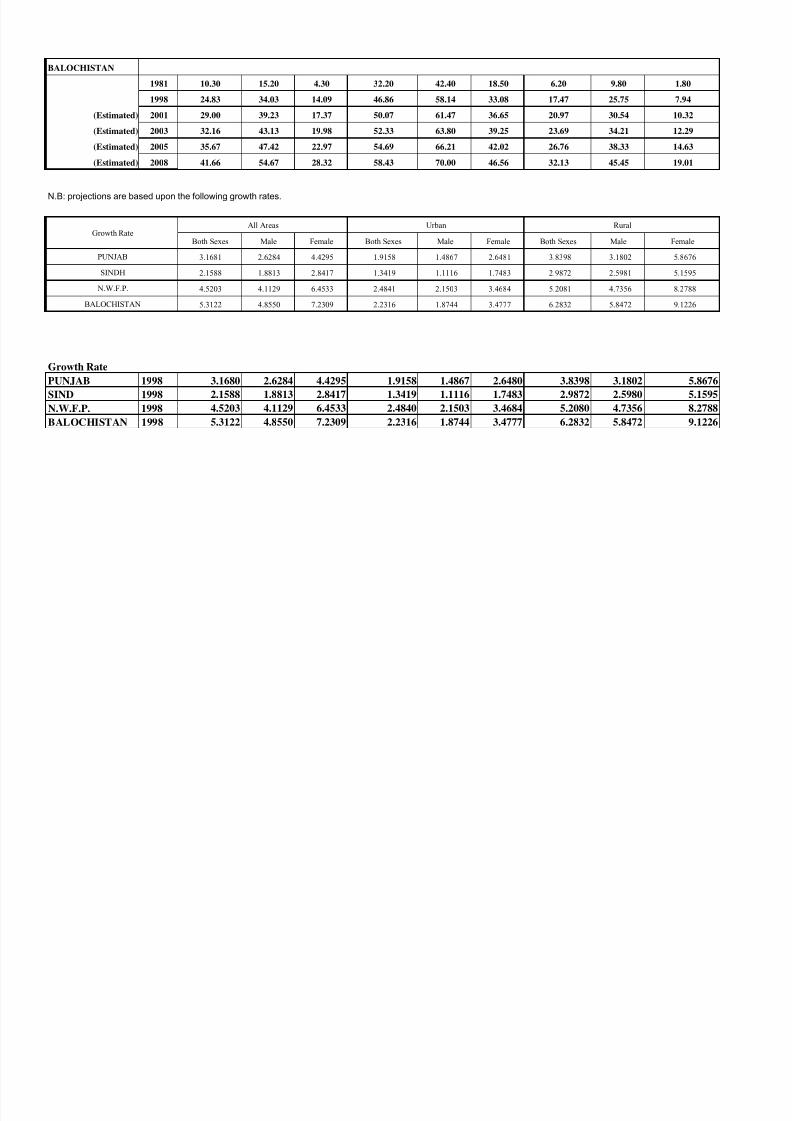
BALOCHISTAN
1981 10.30 15.20 4.30 32.20 42.40 18.50 6.20 9.80 1.80
1998 24.83 34.03 14.09 46.86 58.14 33.08 17.47 25.75 7.94
8/18/2019 litracy rate trends pakistan
http://slidepdf.com/reader/full/litracy-rate-trends-pakistan 72/155
(Estimated) 2001 29.00 39.23 17.37 50.07 61.47 36.65 20.97 30.54 10.32
(Estimated) 2003 32.16 43.13 19.98 52.33 63.80 39.25 23.69 34.21 12.29
(Estimated) 2005 35.67 47.42 22.97 54.69 66.21 42.02 26.76 38.33 14.63
(Estimated) 2008 41.66 54.67 28.32 58.43 70.00 46.56 32.13 45.45 19.01
Both Sexes Male Female Both Sexes Male Female Both Sexes Male Female
3.1681 2.6284 4.4295 1.9158 1.4867 2.6481 3.8398 3.1802 5.8676
2.1588 1.8813 2.8417 1.3419 1.1116 1.7483 2.9872 2.5981 5.1595
4.5203 4.1129 6.4533 2.4841 2.1503 3.4684 5.2081 4.7356 8.2788
5.3122 4.8550 7.2309 2.2316 1.8744 3.4777 6.2832 5.8472 9.1226
Growth Rate
PUNJAB 1998 3.1680 2.6284 4.4295 1.9158 1.4867 2.6480 3.8398 3.1802 5.8676
SIND 1998 2.1588 1.8813 2.8417 1.3419 1.1116 1.7483 2.9872 2.5980 5.1595
N.W.F.P. 1998 4.5203 4.1129 6.4533 2.4840 2.1503 3.4684 5.2080 4.7356 8.2788
BALOCHISTAN 1998 5.3122 4.8550 7.2309 2.2316 1.8744 3.4777 6.2832 5.8472 9.1226
SINDH
N.W.F.P.
BALOCHISTAN
N.B: projections are based upon the following growth rates.
All Areas Urban Rural
Growth Rate
PUNJAB

8/18/2019 litracy rate trends pakistan
http://slidepdf.com/reader/full/litracy-rate-trends-pakistan 73/155
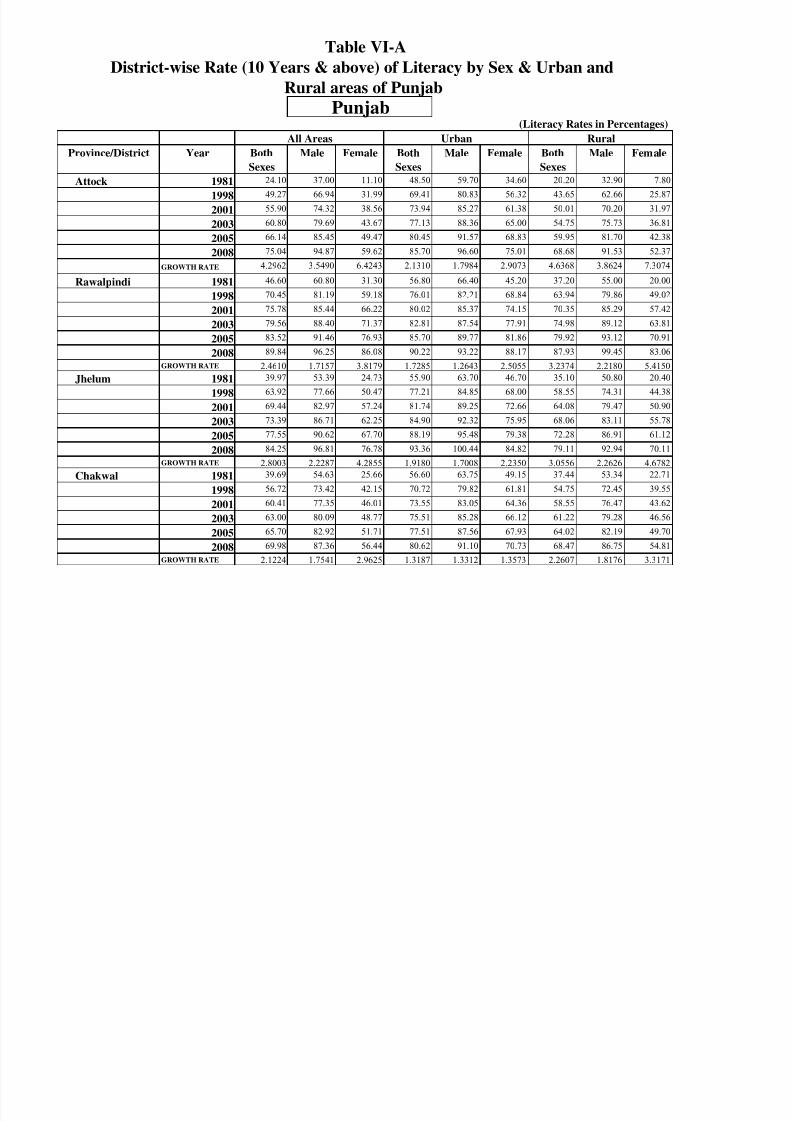
Table VI-A
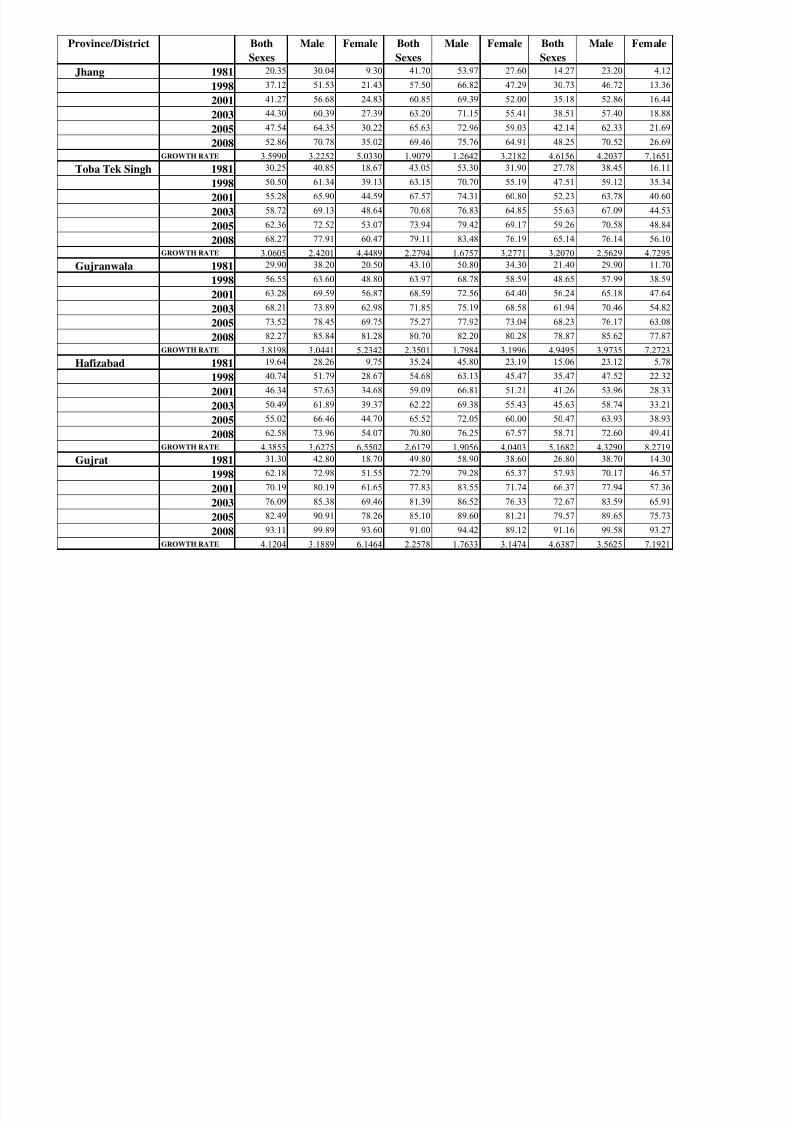
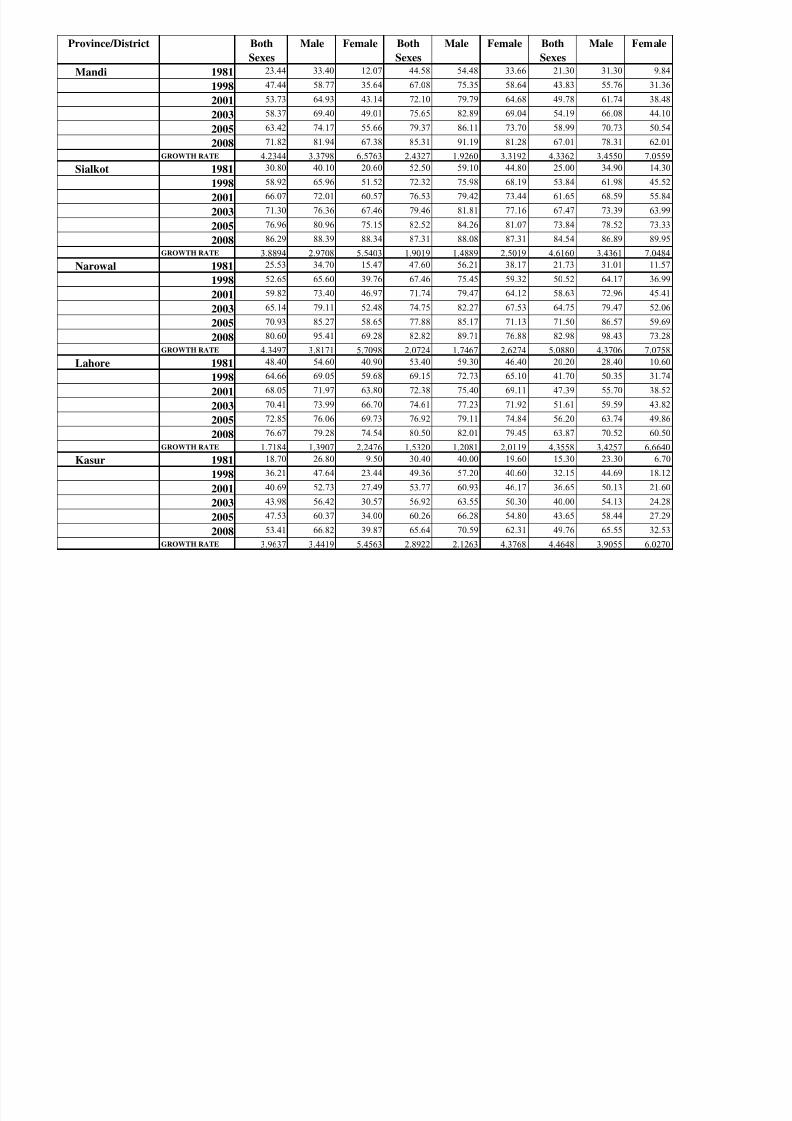
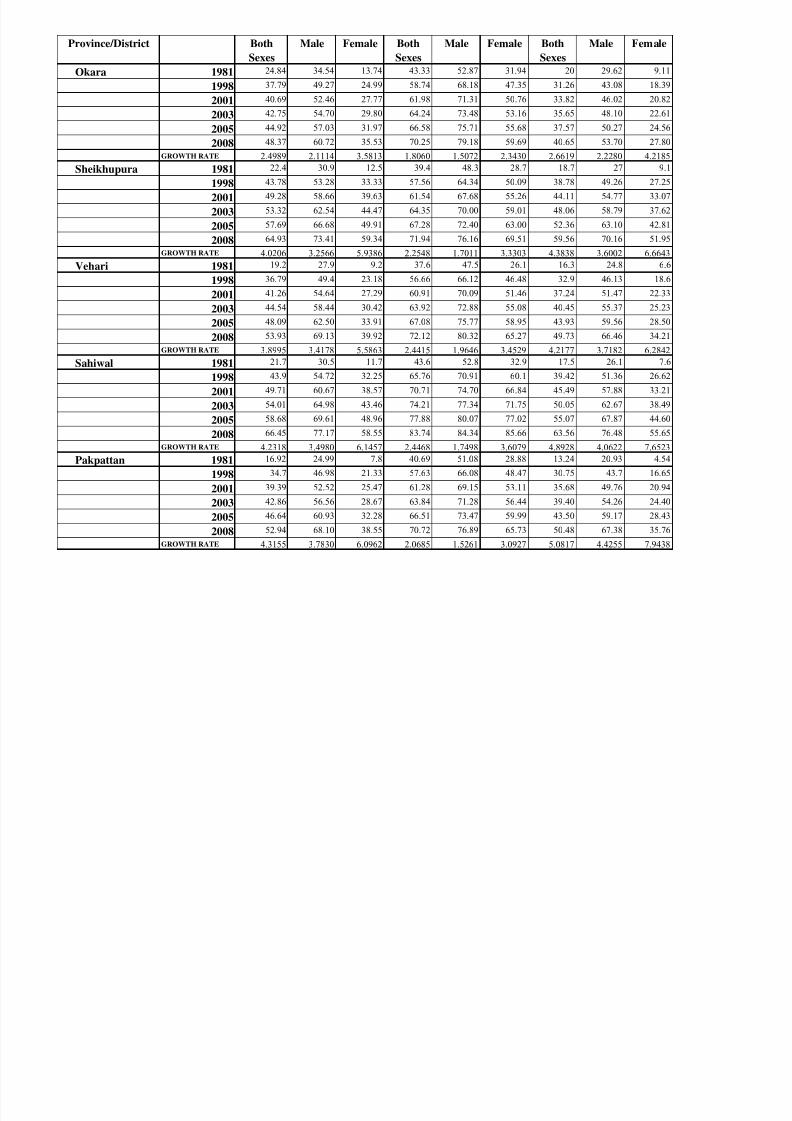
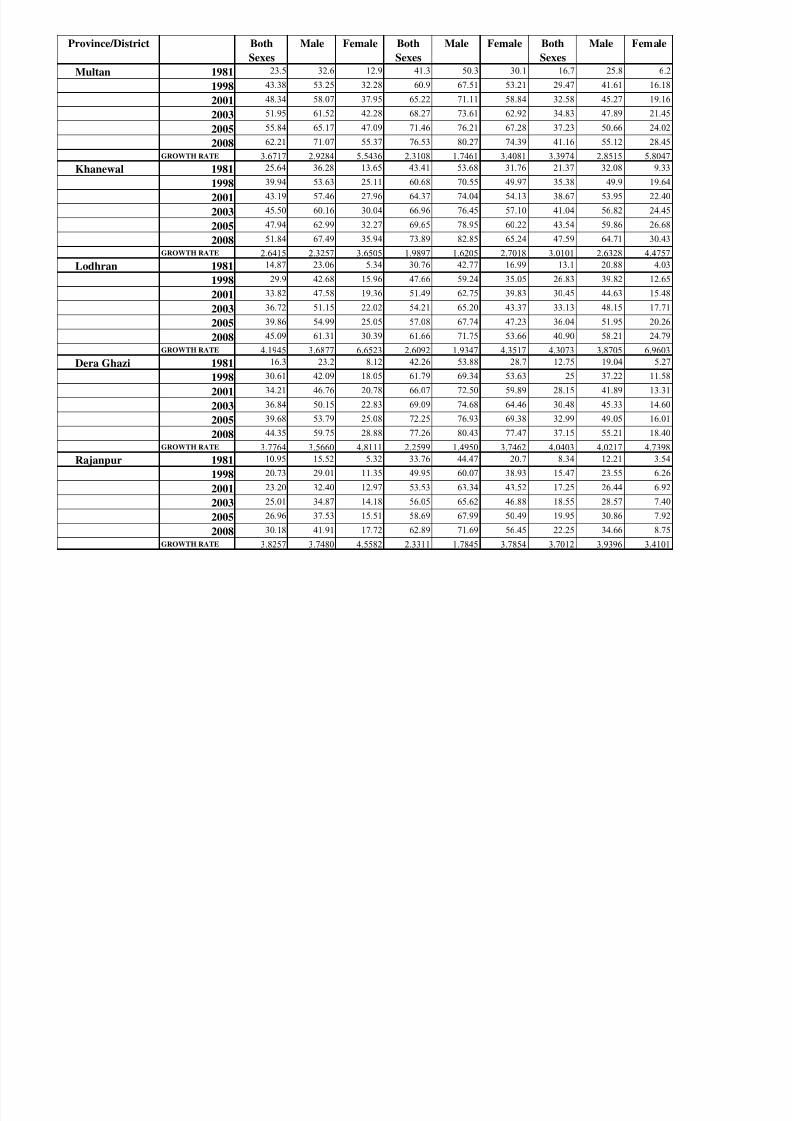
District-wise Rate (10 Years & above) of Literacy by Sex & Urban and
Rural areas of Punjab
Punjab
8/18/2019 litracy rate trends pakistan
http://slidepdf.com/reader/full/litracy-rate-trends-pakistan 74/155
(Literacy Rates in Percentages)
Province/District Year Both
Sexes
Male Female Both
Sexes
Male Female Both
Sexes
Male Female
Attock 1981 24.10 37.00 11.10 48.50 59.70 34.60 20.20 32.90 7.80
1998 49.27 66.94 31.99 69.41 80.83 56.32 43.65 62.66 25.87
2001 55.90 74.32 38.56 73.94 85.27 61.38 50.01 70.20 31.97
2003 60.80 79.69 43.67 77.13 88.36 65.00 54.75 75.73 36.81
2005 66.14 85.45 49.47 80.45 91.57 68.83 59.95 81.70 42.38
2008 75.04 94.87 59.62 85.70 96.60 75.01 68.68 91.53 52.37
GROWTH RATE 4.2962 3.5490 6.4243 2.1310 1.7984 2.9073 4.6368 3.8624 7.3074
Rawalpindi 1981 46.60 60.80 31.30 56.80 66.40 45.20 37.20 55.00 20.00
1998 70.45 81.19 59.18 76.01 82.21 68.84 63.94 79.86 49.02
2001 75.78 85.44 66.22 80.02 85.37 74.15 70.35 85.29 57.42
2003 79.56 88.40 71.37 82.81 87.54 77.91 74.98 89.12 63.81
2005 83.52 91.46 76.93 85.70 89.77 81.86 79.92 93.12 70.91
2008 89.84 96.25 86.08 90.22 93.22 88.17 87.93 99.45 83.06
GROWTH RATE 2.4610 1.7157 3.8179 1.7285 1.2643 2.5055 3.2374 2.2180 5.4150
Jhelum 1981 39.97 53.39 24.73 55.90 63.70 46.70 35.10 50.80 20.40
1998 63.92 77.66 50.47 77.21 84.85 68.00 58.55 74.31 44.38
2001 69.44 82.97 57.24 81.74 89.25 72.66 64.08 79.47 50.90
2003 73.39 86.71 62.25 84.90 92.32 75.95 68.06 83.11 55.78
2005 77.55 90.62 67.70 88.19 95.48 79.38 72.28 86.91 61.12
2008 84.25 96.81 76.78 93.36 100.44 84.82 79.11 92.94 70.11
GROWTH RATE 2.8003 2.2287 4.2855 1.9180 1.7008 2.2350 3.0556 2.2626 4.6782
Chakwal 1981 39.69 54.63 25.66 56.60 63.75 49.15 37.44 53.34 22.71
1998 56.72 73.42 42.15 70.72 79.82 61.81 54.75 72.45 39.55
2001 60.41 77.35 46.01 73.55 83.05 64.36 58.55 76.47 43.62
2003 63.00 80.09 48.77 75.51 85.28 66.12 61.22 79.28 46.56
2005 65.70 82.92 51.71 77.51 87.56 67.93 64.02 82.19 49.70
2008 69.98 87.36 56.44 80.62 91.10 70.73 68.47 86.75 54.81
GROWTH RATE 2.1224 1.7541 2.9625 1.3187 1.3312 1.3573 2.2607 1.8176 3.3171
All Areas
Punjab
RuralUrban
Province/District Year Both
Sexes
Male Female Both
Sexes
Male Female Both
Sexes
Male Female
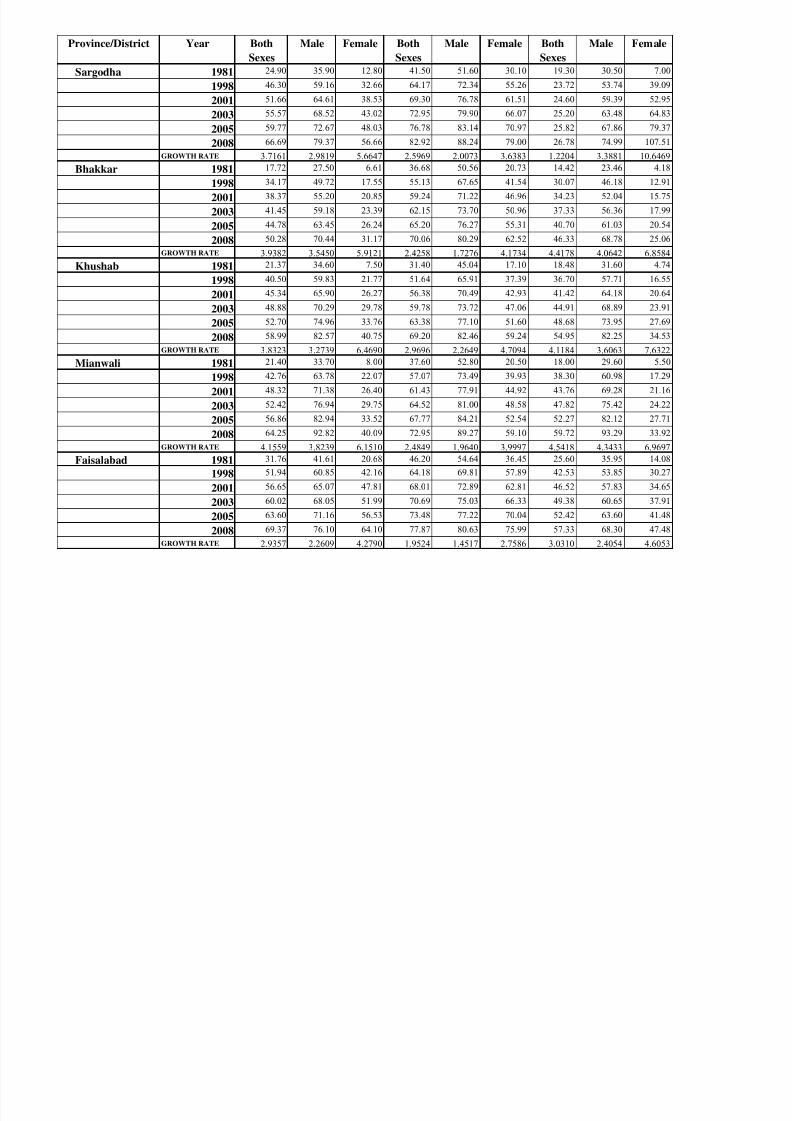
Sargodha 1981 24.90 35.90 12.80 41.50 51.60 30.10 19.30 30.50 7.00
1998 46.30 59.16 32.66 64.17 72.34 55.26 23.72 53.74 39.09
2001 51.66 64.61 38.53 69.30 76.78 61.51 24.60 59.39 52.95
2003 55 57 68 52 43 02 72 95 79 90 66 07 25 20 63 48 64 83
8/18/2019 litracy rate trends pakistan
http://slidepdf.com/reader/full/litracy-rate-trends-pakistan 75/155
2003 55.57 68.52 43.02 72.95 79.90 66.07 25.20 63.48 64.83
2005 59.77 72.67 48.03 76.78 83.14 70.97 25.82 67.86 79.37
2008 66.69 79.37 56.66 82.92 88.24 79.00 26.78 74.99 107.51
GROWTH RATE 3.7161 2.9819 5.6647 2.5969 2.0073 3.6383 1.2204 3.3881 10.6469
Bhakkar 1981 17.72 27.50 6.61 36.68 50.56 20.73 14.42 23.46 4.18
1998 34.17 49.72 17.55 55.13 67.65 41.54 30.07 46.18 12.91
2001 38.37 55.20 20.85 59.24 71.22 46.96 34.23 52.04 15.75
2003 41.45 59.18 23.39 62.15 73.70 50.96 37.33 56.36 17.99
2005 44.78 63.45 26.24 65.20 76.27 55.31 40.70 61.03 20.54
2008 50.28 70.44 31.17 70.06 80.29 62.52 46.33 68.78 25.06
GROWTH RATE 3.9382 3.5450 5.9121 2.4258 1.7276 4.1734 4.4178 4.0642 6.8584
Khushab 1981 21.37 34.60 7.50 31.40 45.04 17.10 18.48 31.60 4.74
1998 40.50 59.83 21.77 51.64 65.91 37.39 36.70 57.71 16.55
2001 45.34 65.90 26.27 56.38 70.49 42.93 41.42 64.18 20.64
2003 48.88 70.29 29.78 59.78 73.72 47.06 44.91 68.89 23.91
2005 52.70 74.96 33.76 63.38 77.10 51.60 48.68 73.95 27.69
2008 58.99 82.57 40.75 69.20 82.46 59.24 54.95 82.25 34.53
GROWTH RATE 3.8323 3.2739 6.4690 2.9696 2.2649 4.7094 4.1184 3.6063 7.6322
Mianwali 1981 21.40 33.70 8.00 37.60 52.80 20.50 18.00 29.60 5.50
1998 42.76 63.78 22.07 57.07 73.49 39.93 38.30 60.98 17.29
2001 48.32 71.38 26.40 61.43 77.91 44.92 43.76 69.28 21.16
2003 52.42 76.94 29.75 64.52 81.00 48.58 47.82 75.42 24.22
2005 56.86 82.94 33.52 67.77 84.21 52.54 52.27 82.12 27.71
2008 64.25 92.82 40.09 72.95 89.27 59.10 59.72 93.29 33.92
GROWTH RATE 4.1559 3.8239 6.1510 2.4849 1.9640 3.9997 4.5418 4.3433 6.9697
Faisalabad 1981 31.76 41.61 20.68 46.20 54.64 36.45 25.60 35.95 14.08
1998 51.94 60.85 42.16 64.18 69.81 57.89 42.53 53.85 30.27
2001 56.65 65.07 47.81 68.01 72.89 62.81 46.52 57.83 34.65
2003 60.02 68.05 51.99 70.69 75.03 66.33 49.38 60.65 37.91
2005 63.60 71.16 56.53 73.48 77.22 70.04 52.42 63.60 41.48
2008 69.37 76.10 64.10 77.87 80.63 75.99 57.33 68.30 47.48
GROWTH RATE 2.9357 2.2609 4.2790 1.9524 1.4517 2.7586 3.0310 2.4054 4.6053
Province/District Both
Sexes
Male Female Both
Sexes
Male Female Both
Sexes
Male Female
Jhang 1981 20.35 30.04 9.30 41.70 53.97 27.60 14.27 23.20 4.12
1998 37.12 51.53 21.43 57.50 66.82 47.29 30.73 46.72 13.36
2001 41.27 56.68 24.83 60.85 69.39 52.00 35.18 52.86 16.44
2003 44 30 60 39 27 39 63 20 71 15 55 41 38 51 57 40 18 88
8/18/2019 litracy rate trends pakistan
http://slidepdf.com/reader/full/litracy-rate-trends-pakistan 76/155
2003 44.30 60.39 27.39 63.20 71.15 55.41 38.51 57.40 18.88
2005 47.54 64.35 30.22 65.63 72.96 59.03 42.14 62.33 21.69
2008 52.86 70.78 35.02 69.46 75.76 64.91 48.25 70.52 26.69
GROWTH RATE 3.5990 3.2252 5.0330 1.9079 1.2642 3.2182 4.6156 4.2037 7.1651
Toba Tek Singh 1981 30.25 40.85 18.67 43.05 53.30 31.90 27.78 38.45 16.11
1998 50.50 61.34 39.13 63.15 70.70 55.19 47.51 59.12 35.34
2001 55.28 65.90 44.59 67.57 74.31 60.80 52.23 63.78 40.60
2003 58.72 69.13 48.64 70.68 76.83 64.85 55.63 67.09 44.53
2005 62.36 72.52 53.07 73.94 79.42 69.17 59.26 70.58 48.84
2008 68.27 77.91 60.47 79.11 83.48 76.19 65.14 76.14 56.10
GROWTH RATE 3.0605 2.4201 4.4489 2.2794 1.6757 3.2771 3.2070 2.5629 4.7295
Gujranwala 1981 29.90 38.20 20.50 43.10 50.80 34.30 21.40 29.90 11.70
1998 56.55 63.60 48.80 63.97 68.78 58.59 48.65 57.99 38.59
2001 63.28 69.59 56.87 68.59 72.56 64.40 56.24 65.18 47.64
2003 68.21 73.89 62.98 71.85 75.19 68.58 61.94 70.46 54.82
2005 73.52 78.45 69.75 75.27 77.92 73.04 68.23 76.17 63.08
2008 82.27 85.84 81.28 80.70 82.20 80.28 78.87 85.62 77.87
GROWTH RATE 3.8198 3.0441 5.2342 2.3501 1.7984 3.1996 4.9495 3.9735 7.2723
Hafizabad 1981 19.64 28.26 9.75 35.24 45.80 23.19 15.06 23.12 5.78
1998 40.74 51.79 28.67 54.68 63.13 45.47 35.47 47.52 22.32
2001 46.34 57.63 34.68 59.09 66.81 51.21 41.26 53.96 28.33
2003 50.49 61.89 39.37 62.22 69.38 55.43 45.63 58.74 33.21
2005 55.02 66.46 44.70 65.52 72.05 60.00 50.47 63.93 38.93
2008 62.58 73.96 54.07 70.80 76.25 67.57 58.71 72.60 49.41
GROWTH RATE 4.3855 3.6275 6.5502 2.6179 1.9056 4.0403 5.1682 4.3290 8.2719
Gujrat 1981 31.30 42.80 18.70 49.80 58.90 38.60 26.80 38.70 14.30
1998 62.18 72.98 51.55 72.79 79.28 65.37 57.93 70.17 46.57
2001 70.19 80.19 61.65 77.83 83.55 71.74 66.37 77.94 57.36
2003 76.09 85.38 69.46 81.39 86.52 76.33 72.67 83.59 65.91
2005 82.49 90.91 78.26 85.10 89.60 81.21 79.57 89.65 75.73
2008 93.11 99.89 93.60 91.00 94.42 89.12 91.16 99.58 93.27
GROWTH RATE 4.1204 3.1889 6.1464 2.2578 1.7633 3.1474 4.6387 3.5625 7.1921
Province/District Both
Sexes
Male Female Both
Sexes
Male Female Both
Sexes
Male Female
Mandi 1981 23.44 33.40 12.07 44.58 54.48 33.66 21.30 31.30 9.84
1998 47.44 58.77 35.64 67.08 75.35 58.64 43.83 55.76 31.36
2001 53.73 64.93 43.14 72.10 79.79 64.68 49.78 61.74 38.48
2003 58 37 69 40 49 01 75 65 82 89 69 04 54 19 66 08 44 10
8/18/2019 litracy rate trends pakistan
http://slidepdf.com/reader/full/litracy-rate-trends-pakistan 77/155
2003 58.37 69.40 49.01 75.65 82.89 69.04 54.19 66.08 44.10
2005 63.42 74.17 55.66 79.37 86.11 73.70 58.99 70.73 50.54
2008 71.82 81.94 67.38 85.31 91.19 81.28 67.01 78.31 62.01
GROWTH RATE 4.2344 3.3798 6.5763 2.4327 1.9260 3.3192 4.3362 3.4550 7.0559
Sialkot 1981 30.80 40.10 20.60 52.50 59.10 44.80 25.00 34.90 14.30
1998 58.92 65.96 51.52 72.32 75.98 68.19 53.84 61.98 45.52
2001 66.07 72.01 60.57 76.53 79.42 73.44 61.65 68.59 55.84
2003 71.30 76.36 67.46 79.46 81.81 77.16 67.47 73.39 63.99
2005 76.96 80.96 75.15 82.52 84.26 81.07 73.84 78.52 73.33
2008 86.29 88.39 88.34 87.31 88.08 87.31 84.54 86.89 89.95
GROWTH RATE 3.8894 2.9708 5.5403 1.9019 1.4889 2.5019 4.6160 3.4361 7.0484
Narowal 1981 25.53 34.70 15.47 47.60 56.21 38.17 21.73 31.01 11.57
1998 52.65 65.60 39.76 67.46 75.45 59.32 50.52 64.17 36.99
2001 59.82 73.40 46.97 71.74 79.47 64.12 58.63 72.96 45.41
2003 65.14 79.11 52.48 74.75 82.27 67.53 64.75 79.47 52.06
2005 70.93 85.27 58.65 77.88 85.17 71.13 71.50 86.57 59.69
2008 80.60 95.41 69.28 82.82 89.71 76.88 82.98 98.43 73.28
GROWTH RATE 4.3497 3.8171 5.7098 2.0724 1.7467 2.6274 5.0880 4.3706 7.0758
Lahore 1981 48.40 54.60 40.90 53.40 59.30 46.40 20.20 28.40 10.60
1998 64.66 69.05 59.68 69.15 72.73 65.10 41.70 50.35 31.74
2001 68.05 71.97 63.80 72.38 75.40 69.11 47.39 55.70 38.52
2003 70.41 73.99 66.70 74.61 77.23 71.92 51.61 59.59 43.82
2005 72.85 76.06 69.73 76.92 79.11 74.84 56.20 63.74 49.86
2008 76.67 79.28 74.54 80.50 82.01 79.45 63.87 70.52 60.50
GROWTH RATE 1.7184 1.3907 2.2476 1.5320 1.2081 2.0119 4.3558 3.4257 6.6640
Kasur 1981 18.70 26.80 9.50 30.40 40.00 19.60 15.30 23.30 6.70
1998 36.21 47.64 23.44 49.36 57.20 40.60 32.15 44.69 18.12
2001 40.69 52.73 27.49 53.77 60.93 46.17 36.65 50.13 21.60
2003 43.98 56.42 30.57 56.92 63.55 50.30 40.00 54.13 24.28
2005 47.53 60.37 34.00 60.26 66.28 54.80 43.65 58.44 27.29
2008 53.41 66.82 39.87 65.64 70.59 62.31 49.76 65.55 32.53
GROWTH RATE 3.9637 3.4419 5.4563 2.8922 2.1263 4.3768 4.4648 3.9055 6.0270
Province/District Both
Sexes
Male Female Both
Sexes
Male Female Both
Sexes
Male Female
Okara 1981 24.84 34.54 13.74 43.33 52.87 31.94 20 29.62 9.11
1998 37.79 49.27 24.99 58.74 68.18 47.35 31.26 43.08 18.39
2001 40.69 52.46 27.77 61.98 71.31 50.76 33.82 46.02 20.82
2003 42.75 54.70 29.80 64.24 73.48 53.16 35.65 48.10 22.61
8/18/2019 litracy rate trends pakistan
http://slidepdf.com/reader/full/litracy-rate-trends-pakistan 78/155
2003
2005 44.92 57.03 31.97 66.58 75.71 55.68 37.57 50.27 24.56
2008 48.37 60.72 35.53 70.25 79.18 59.69 40.65 53.70 27.80
GROWTH RATE 2.4989 2.1114 3.5813 1.8060 1.5072 2.3430 2.6619 2.2280 4.2185
Sheikhupura 1981 22.4 30.9 12.5 39.4 48.3 28.7 18.7 27 9.1
1998 43.78 53.28 33.33 57.56 64.34 50.09 38.78 49.26 27.25
2001 49.28 58.66 39.63 61.54 67.68 55.26 44.11 54.77 33.07
2003 53.32 62.54 44.47 64.35 70.00 59.01 48.06 58.79 37.62
2005 57.69 66.68 49.91 67.28 72.40 63.00 52.36 63.10 42.81
2008 64.93 73.41 59.34 71.94 76.16 69.51 59.56 70.16 51.95
GROWTH RATE 4.0206 3.2566 5.9386 2.2548 1.7011 3.3303 4.3838 3.6002 6.6643
Vehari 1981 19.2 27.9 9.2 37.6 47.5 26.1 16.3 24.8 6.6
1998 36.79 49.4 23.18 56.66 66.12 46.48 32.9 46.13 18.6
2001 41.26 54.64 27.29 60.91 70.09 51.46 37.24 51.47 22.33
2003 44.54 58.44 30.42 63.92 72.88 55.08 40.45 55.37 25.23
2005 48.09 62.50 33.91 67.08 75.77 58.95 43.93 59.56 28.50
2008 53.93 69.13 39.92 72.12 80.32 65.27 49.73 66.46 34.21
GROWTH RATE 3.8995 3.4178 5.5863 2.4415 1.9646 3.4529 4.2177 3.7182 6.2842
Sahiwal 1981 21.7 30.5 11.7 43.6 52.8 32.9 17.5 26.1 7.6
1998 43.9 54.72 32.25 65.76 70.91 60.1 39.42 51.36 26.62
2001 49.71 60.67 38.57 70.71 74.70 66.84 45.49 57.88 33.21
2003 54.01 64.98 43.46 74.21 77.34 71.75 50.05 62.67 38.49
2005 58.68 69.61 48.96 77.88 80.07 77.02 55.07 67.87 44.60
2008 66.45 77.17 58.55 83.74 84.34 85.66 63.56 76.48 55.65
GROWTH RATE 4.2318 3.4980 6.1457 2.4468 1.7498 3.6079 4.8928 4.0622 7.6523
Pakpattan 1981 16.92 24.99 7.8 40.69 51.08 28.88 13.24 20.93 4.54
1998 34.7 46.98 21.33 57.63 66.08 48.47 30.75 43.7 16.65
2001 39.39 52.52 25.47 61.28 69.15 53.11 35.68 49.76 20.94
2003 42.86 56.56 28.67 63.84 71.28 56.44 39.40 54.26 24.40
2005 46.64 60.93 32.28 66.51 73.47 59.99 43.50 59.17 28.43
2008 52.94 68.10 38.55 70.72 76.89 65.73 50.48 67.38 35.76
GROWTH RATE 4.3155 3.7830 6.0962 2.0685 1.5261 3.0927 5.0817 4.4255 7.9438
Province/District Both
Sexes
Male Female Both
Sexes
Male Female Both
Sexes
Male Female
Multan 1981 23.5 32.6 12.9 41.3 50.3 30.1 16.7 25.8 6.2
1998 43.38 53.25 32.28 60.9 67.51 53.21 29.47 41.61 16.18
2001 48.34 58.07 37.95 65.22 71.11 58.84 32.58 45.27 19.16
2003 51.95 61.52 42.28 68.27 73.61 62.92 34.83 47.89 21.45
8/18/2019 litracy rate trends pakistan
http://slidepdf.com/reader/full/litracy-rate-trends-pakistan 79/155
2003
2005 55.84 65.17 47.09 71.46 76.21 67.28 37.23 50.66 24.02
2008 62.21 71.07 55.37 76.53 80.27 74.39 41.16 55.12 28.45
GROWTH RATE 3.6717 2.9284 5.5436 2.3108 1.7461 3.4081 3.3974 2.8515 5.8047
Khanewal 1981 25.64 36.28 13.65 43.41 53.68 31.76 21.37 32.08 9.33
1998 39.94 53.63 25.11 60.68 70.55 49.97 35.38 49.9 19.64
2001 43.19 57.46 27.96 64.37 74.04 54.13 38.67 53.95 22.40
2003 45.50 60.16 30.04 66.96 76.45 57.10 41.04 56.82 24.45
2005 47.94 62.99 32.27 69.65 78.95 60.22 43.54 59.86 26.68
2008 51.84 67.49 35.94 73.89 82.85 65.24 47.59 64.71 30.43
GROWTH RATE 2.6415 2.3257 3.6505 1.9897 1.6205 2.7018 3.0101 2.6328 4.4757
Lodhran 1981 14.87 23.06 5.34 30.76 42.77 16.99 13.1 20.88 4.03
1998 29.9 42.68 15.96 47.66 59.24 35.05 26.83 39.82 12.65
2001 33.82 47.58 19.36 51.49 62.75 39.83 30.45 44.63 15.48
2003 36.72 51.15 22.02 54.21 65.20 43.37 33.13 48.15 17.71
2005 39.86 54.99 25.05 57.08 67.74 47.23 36.04 51.95 20.26
2008 45.09 61.31 30.39 61.66 71.75 53.66 40.90 58.21 24.79
GROWTH RATE 4.1945 3.6877 6.6523 2.6092 1.9347 4.3517 4.3073 3.8705 6.9603
Dera Ghazi 1981 16.3 23.2 8.12 42.26 53.88 28.7 12.75 19.04 5.27
1998 30.61 42.09 18.05 61.79 69.34 53.63 25 37.22 11.58
2001 34.21 46.76 20.78 66.07 72.50 59.89 28.15 41.89 13.31
2003 36.84 50.15 22.83 69.09 74.68 64.46 30.48 45.33 14.60
2005 39.68 53.79 25.08 72.25 76.93 69.38 32.99 49.05 16.01
2008 44.35 59.75 28.88 77.26 80.43 77.47 37.15 55.21 18.40
GROWTH RATE 3.7764 3.5660 4.8111 2.2599 1.4950 3.7462 4.0403 4.0217 4.7398
Rajanpur 1981 10.95 15.52 5.32 33.76 44.47 20.7 8.34 12.21 3.54
1998 20.73 29.01 11.35 49.95 60.07 38.93 15.47 23.55 6.26
2001 23.20 32.40 12.97 53.53 63.34 43.52 17.25 26.44 6.92
2003 25.01 34.87 14.18 56.05 65.62 46.88 18.55 28.57 7.40
2005 26.96 37.53 15.51 58.69 67.99 50.49 19.95 30.86 7.92
2008 30.18 41.91 17.72 62.89 71.69 56.45 22.25 34.66 8.75
GROWTH RATE 3.8257 3.7480 4.5582 2.3311 1.7845 3.7854 3.7012 3.9396 3.4101
Province/District Both
Sexes
Male Female Both
Sexes
Male Female Both
Sexes
Male Female
Layyah 1981 18.9 28.58 7.78 45.68 58.28 31.38 16.01 25.39 5.22
1998 38.68 52.98 23.39 62.45 72.6 51.54 34.92 49.86 18.95
2001 43.89 59.08 28.40 65.99 75.47 56.26 40.07 56.17 23.79
2003 47.75 63.53 32.33 68.47 77.45 59.64 43.92 60.81 27.69

8/18/2019 litracy rate trends pakistan
http://slidepdf.com/reader/full/litracy-rate-trends-pakistan 80/155
2005 51.95 68.31 36.80 71.03 79.47 63.22 48.14 65.83 32.22
2008 58.94 76.17 44.69 75.06 82.62 69.01 55.25 74.16 40.46
GROWTH RATE 4.3027 3.6973 6.6892 1.8565 1.3008 2.9618 4.6942 4.0496 7.8792
Muzaffargarh 1981 16.8 25.8 6.3 40.3 51.1 27.7 14.1 22.9 3.9
1998 28.45 40.87 14.77 55.53 64.83 44.92 24.12 36.96 10.05
2001 31.22 44.33 17.17 58.76 67.61 48.92 26.52 40.22 11.88
2003 33.22 46.79 18.98 61.02 69.53 51.78 28.25 42.55 13.28
2005 35.34 49.39 20.98 63.37 71.50 54.81 30.09 45.01 14.84
2008 38.78 53.57 24.38 67.05 74.57 59.70 33.08 48.98 17.54
GROWTH RATE 3.1472 2.7430 5.1398 1.9036 1.4098 2.8847 3.2084 2.8559 5.7262
Bahawalpur 1981 20.43 27.44 12.21 42.85 52.22 31.86 13.67 19.96 6.29
1998 35.03 44.86 23.95 57 65.28 47.12 26.31 36.44 15.13
2001 38.53 48.93 26.97 59.94 67.90 50.49 29.53 40.52 17.66
2003 41.05 51.84 29.20 61.99 69.71 52.87 31.90 43.50 19.59
2005 43.74 54.92 31.61 64.11 71.56 55.36 34.45 46.69 21.72
2008 48.10 59.90 35.60 67.42 74.44 59.32 38.67 51.92 25.36
GROWTH RATE 3.2226 2.9336 4.0426 1.6927 1.3217 2.3287 3.9266 3.6042 5.2987
Bahawalnagar 1981 19.53 28.33 9.6 30.31 40.33 18.71 17.21 25.71 7.67
1998 35.07 45.52 23.78 52.86 61.22 43.86 30.81 41.77 18.96
2001 38.89 49.49 27.91 58.31 65.90 50.98 34.14 45.50 22.24
2003 41.66 52.33 31.05 62.25 69.22 56.35 36.57 48.18 24.74
2005 44.63 55.34 34.55 66.46 72.70 62.29 39.16 51.01 27.52
2008 49.49 60.17 40.55 73.32 78.26 72.40 43.40 55.57 32.29
GROWTH RATE 3.5035 2.8289 5.4807 3.3257 2.4856 5.1391 3.4849 2.8958 5.4679
Rahim Yar 1981 20.00 28.00 10.6 44.5 53.6 33.7 15.1 22.9 6.1
1998 33.09 43.4 21.82 57.03 64.97 48.45 26.92 37.88 14.91
2001 36.16 46.89 24.78 59.58 67.21 51.66 29.81 41.40 17.46
2003 38.37 49.37 26.98 61.35 68.75 53.91 31.91 43.92 19.39
2005 40.71 51.98 29.37 63.16 70.33 56.26 34.16 46.60 21.54
2008 44.50 56.16 33.37 65.99 72.75 59.98 37.83 50.93 25.22
GROWTH RATE 3.0061 2.6115 4.3384 1.4700 1.1381 2.1585 3.4595 3.0048 5.3980
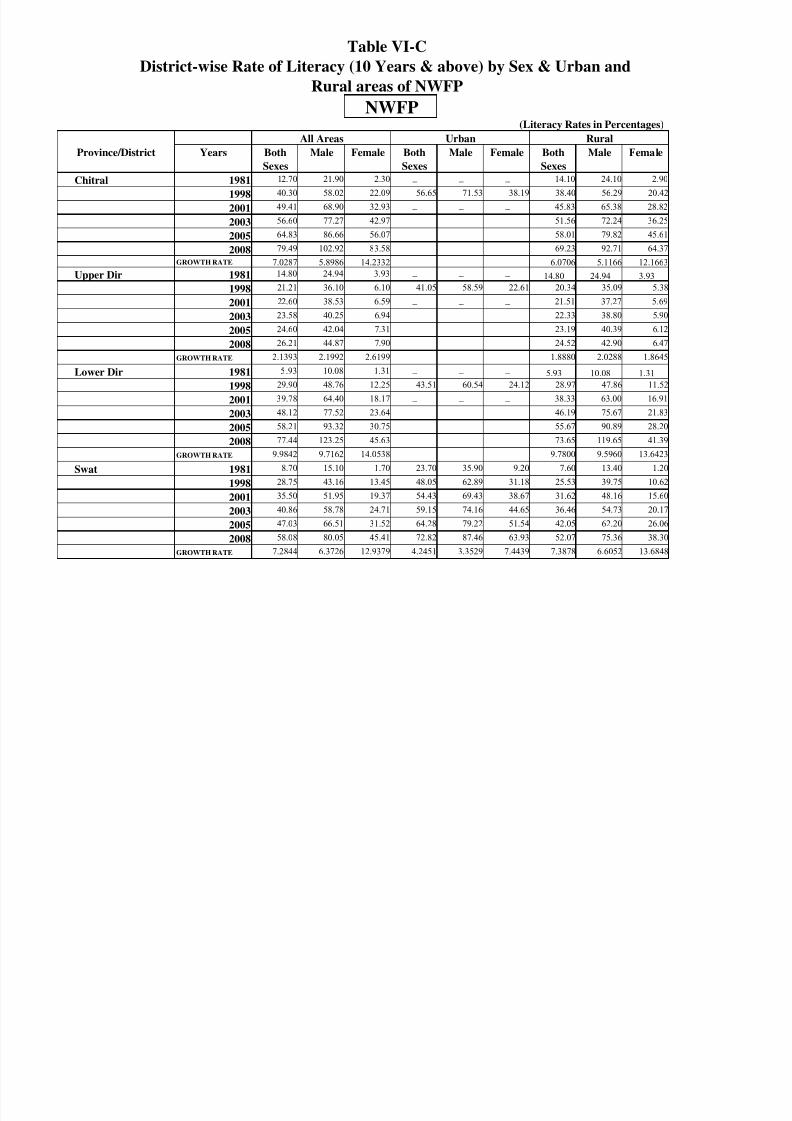
Table VI-C
District-wise Rate of Literacy (10 Years & above) by Sex & Urban and
Rural areas of NWFP
NWFP
8/18/2019 litracy rate trends pakistan
http://slidepdf.com/reader/full/litracy-rate-trends-pakistan 81/155
(Literacy Rates in Percentages)
Province/District Years Both
Sexes
Male Female Both
Sexes
Male Female Both
Sexes
Male Female
Chitral 1981 12.70 21.90 2.30 − − − 14.10 24.10 2.90
1998 40.30 58.02 22.09 56.65 71.53 38.19 38.40 56.29 20.42
2001 49.41 68.90 32.93 − − − 45.83 65.38 28.82
2003 56.60 77.27 42.97 51.56 72.24 36.25
2005 64.83 86.66 56.07 58.01 79.82 45.61
2008 79.49 102.92 83.58 69.23 92.71 64.37
GROWTH RATE 7.0287 5.8986 14.2332 6.0706 5.1166 12.1663
Upper Dir 1981 14.80 24.94 3.93 − − − 14.80 24.94 3.93
1998 21.21 36.10 6.10 41.05 58.59 22.61 20.34 35.09 5.38
2001 22.60 38.53 6.59 − − − 21.51 37.27 5.69
2003 23.58 40.25 6.94 22.33 38.80 5.90
2005 24.60 42.04 7.31 23.19 40.39 6.12
2008 26.21 44.87 7.90 24.52 42.90 6.47
GROWTH RATE 2.1393 2.1992 2.6199 1.8880 2.0288 1.8645
Lower Dir 1981 5 .93 10.08 1.31 − − − 5.93 10.08 1.31
1998 29.90 48.76 12.25 43.51 60.54 24.12 28.97 47.86 11.52
2001 39.78 64.40 18.17 − − − 38.33 63.00 16.91
2003 48.12 77.52 23.64 46.19 75.67 21.83
2005 58.21 93.32 30.75 55.67 90.89 28.20
2008 77.44 123.25 45.63 73.65 119.65 41.39
GROWTH RATE 9.9842 9.7162 14.0538 9.7800 9.5960 13.6423
Swat 1981 8.70 15.10 1.70 23.70 35.90 9.20 7.60 13.40 1.20
1998 28.75 43.16 13.45 48.05 62.89 31.18 25.53 39.75 10.62
2001 35.50 51.95 19.37 54.43 69.43 38.67 31.62 48.16 15.60
2003 40.86 58.78 24.71 59.15 74.16 44.65 36.46 54.73 20.17
2005 47.03 66.51 31.52 64.28 79.22 51.54 42.05 62.20 26.06
2008 58.08 80.05 45.41 72.82 87.46 63.93 52.07 75.36 38.30
GROWTH RATE 7.2844 6.3726 12.9379 4.2451 3.3529 7.4439 7.3878 6.6052 13.6848
All Areas Urban Rural
Province/District Years Both
Sexes
Male Female Both
Sexes
Male Female Both
Sexes
Male Female
Shangla 1981 4.82 8.64 0.55 − − − 4.82 8.64 0.55
1998 14.73 25.16 3.71 − − − 14.73 25.16 3.71
2001 17.94 30.38 5.20 − − − 17.94 30.38 5.20
All Areas Urban Rural
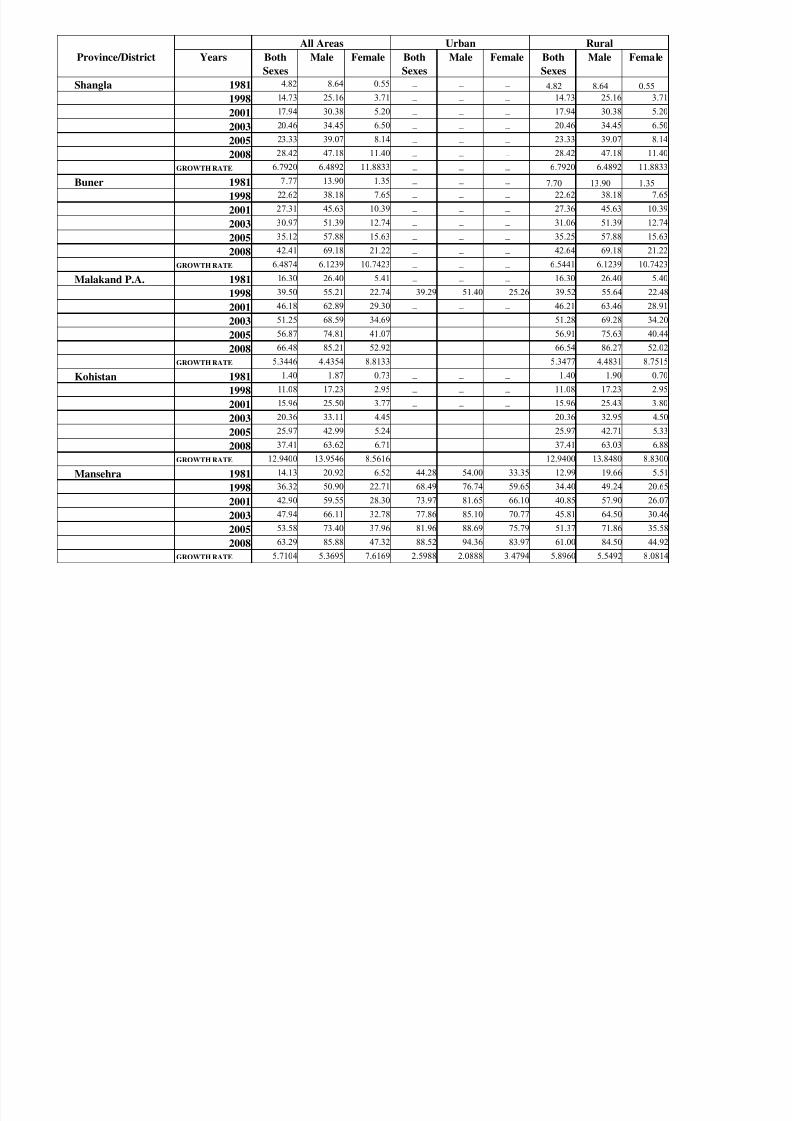
8/18/2019 litracy rate trends pakistan
http://slidepdf.com/reader/full/litracy-rate-trends-pakistan 82/155
2003 20.46 34.45 6.50 − − − 20.46 34.45 6.50
2005 23.33 39.07 8.14 − − − 23.33 39.07 8.14
2008 28.42 47.18 11.40 − − − 28.42 47.18 11.40
GROWTH RATE 6.7920 6.4892 11.8833 − − − 6.7920 6.4892 11.8833
Buner 1981 7 .77 13.90 1.35 − − − 7.70 13.90 1.35
1998 22.62 38.18 7.65 − − − 22.62 38.18 7.65
2001 27.31 45.63 10.39 − − − 27.36 45.63 10.39
2003 30.97 51.39 12.74 − − − 31.06 51.39 12.74
2005 35.12 57.88 15.63 − − − 35.25 57.88 15.63
2008 42.41 69.18 21.22 − − − 42.64 69.18 21.22
GROWTH RATE 6.4874 6.1239 10.7423 − − − 6.5441 6.1239 10.7423
Malakand P.A. 1981 16.30 26.40 5.41 − − − 16.30 26.40 5.40
1998 39.50 55.21 22.74 39.29 51.40 25.26 39.52 55.64 22.48
2001 46.18 62.89 29.30 − − − 46.21 63.46 28.91
2003 51.25 68.59 34.69 51.28 69.28 34.20
2005 56.87 74.81 41.07 56.91 75.63 40.44
2008 66.48 85.21 52.92 66.54 86.27 52.02
GROWTH RATE 5.3446 4.4354 8.8133 5.3477 4.4831 8.7515
Kohistan 1981 1.40 1.87 0.73 − − − 1.40 1.90 0.70
1998 11.08 17.23 2.95 − − − 11.08 17.23 2.95
2001 15.96 25.50 3.77 − − − 15.96 25.43 3.80
2003 20.36 33.11 4.45 20.36 32.95 4.50
2005 25.97 42.99 5.24 25.97 42.71 5.33
2008 37.41 63.62 6.71 37.41 63.03 6.88
GROWTH RATE 12.9400 13.9546 8.5616 12.9400 13.8480 8.8300
Mansehra 1981 14.13 20.92 6.52 44.28 54.00 33.35 12.99 19.66 5.51
1998 36.32 50.90 22.71 68.49 76.74 59.65 34.40 49.24 20.65
2001 42.90 59.55 28.30 73.97 81.65 66.10 40.85 57.90 26.07
2003 47.94 66.11 32.78 77.86 85.10 70.77 45.81 64.50 30.46
2005 53.58 73.40 37.96 81.96 88.69 75.79 51.37 71.86 35.58
2008 63.29 85.88 47.32 88.52 94.36 83.97 61.00 84.50 44.92
GROWTH RATE 5.7104 5.3695 7.6169 2.5988 2.0888 3.4794 5.8960 5.5492 8.0814
Province/District Years Both
Sexes
Male Female Both
Sexes
Male Female Both
Sexes
Male Female
Batagram 1981 3.52 5.63 0.71 − − − − − −
1998 18.31 29.40 6.48 − − − 18.31 29.40 6.48
2001 24.49 39.36 9.57 − − − 19.45 31.56 6.67
29 74 47 81 12 42 20 26 33 09 6 80
All Areas Urban Rural
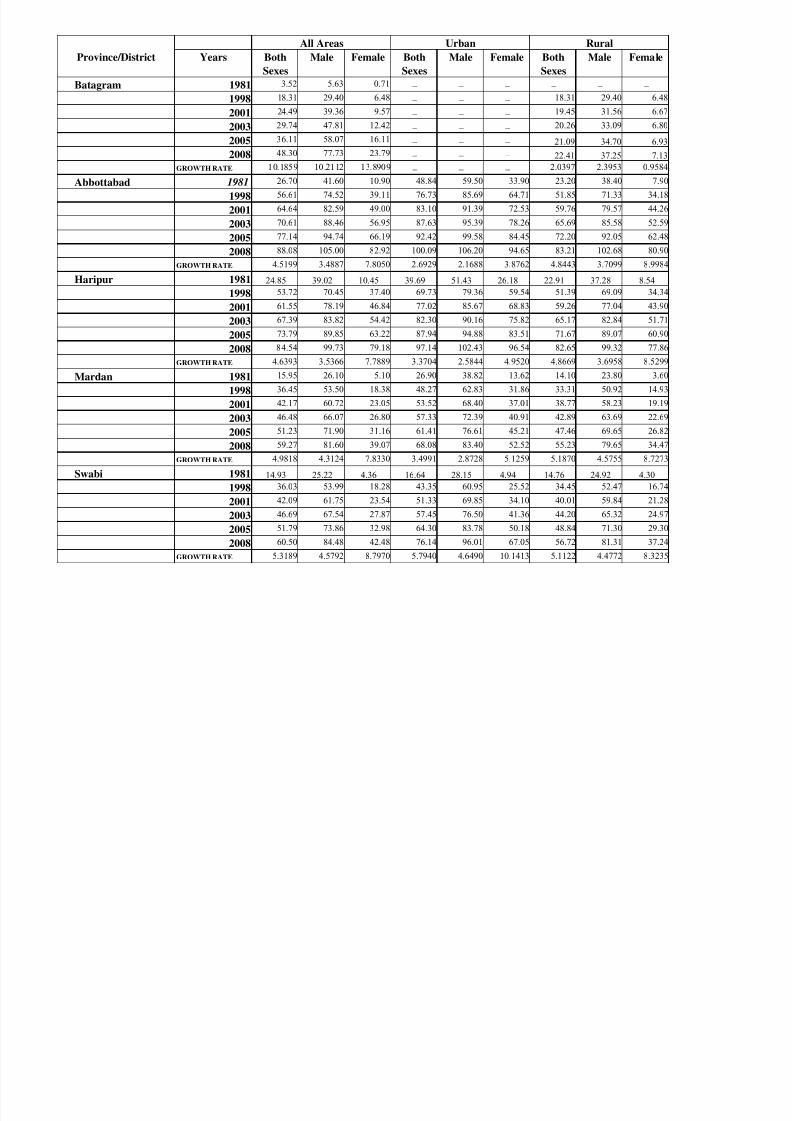
8/18/2019 litracy rate trends pakistan
http://slidepdf.com/reader/full/litracy-rate-trends-pakistan 83/155
2003 29.74 47.81 12.42
− − − 20.26 33.09 6.80
2005 36.11 58.07 16.11 − − − 21.09 34.70 6.93
2008 48.30 77.73 23.79 − − − 22.41 37.25 7.13
GROWTH RATE 1 0. 185 9 10 .21 12 1 3. 890 9 − − − 2.0397 2.3953 0.9584
Abbottabad 1981 26.70 41.60 10.90 48.84 59.50 33.90 23.20 38.40 7.90
1998 56.61 74.52 39.11 76.73 85.69 64.71 51.85 71.33 34.18
2001 64.64 82.59 49.00 83.10 91.39 72.53 59.76 79.57 44.26
2003 70.61 88.46 56.95 87.63 95.39 78.26 65.69 85.58 52.59
2005 77.14 94.74 66.19 92.42 99.58 84.45 72.20 92.05 62.48
2008 88.08 105.00 82.92 100.09 106.20 94.65 83.21 102.68 80.90
GROWTH RATE 4.5199 3.4887 7.8050 2.6929 2.1688 3.8762 4.8443 3.7099 8.9984
Haripur 1981 24.85 39.02 10.45 39.69 51.43 26.18 22.91 37.28 8.54
1998 53.72 70.45 37.40 69.73 79.36 59.54 51.39 69.09 34.34
2001 61.55 78.19 46.84 77.02 85.67 68.83 59.26 77.04 43.90
2003 67.39 83.82 54.42 82.30 90.16 75.82 65.17 82.84 51.71
2005 73.79 89.85 63.22 87.94 94.88 83.51 71.67 89.07 60.90
2008 8 4.54 99.73 79.18 97.14 102.43 96.54 82.65 99.32 77.86
GROWTH RATE 4.6393 3.5366 7.7889 3.3704 2.5844 4.9520 4.8669 3.6958 8.5299
Mardan 1981 15.95 26.10 5.10 26.90 38.82 13.62 14.10 23.80 3.60
1998 36.45 53.50 18.38 48.27 62.83 31.86 33.31 50.92 14.93
2001 42.17 60.72 23.05 53.52 68.40 37.01 38.77 58.23 19.19
2003 46.48 66.07 26.80 57.33 72.39 40.91 42.89 63.69 22.69
2005 51.23 71.90 31.16 61.41 76.61 45.21 47.46 69.65 26.82
2008 59.27 81.60 39.07 68.08 83.40 52.52 55.23 79.65 34.47
GROWTH RATE 4.9818 4.3124 7.8330 3.4991 2.8728 5.1259 5.1870 4.5755 8.7273
Swabi 1981 14.93 25.22 4.36 16.64 28.15 4.94 14.76 24.92 4.30
1998 36.03 53.99 18.28 43.35 60.95 25.52 34.45 52.47 16.74
2001 42.09 61.75 23.54 51.33 69.85 34.10 40.01 59.84 21.28
2003 46.69 67.54 27.87 57.45 76.50 41.36 44.20 65.32 24.97
2005 51.79 73.86 32.98 64.30 83.78 50.18 48.84 71.30 29.30
2008 60.50 84.48 42.48 76.14 96.01 67.05 56.72 81.31 37.24
GROWTH RATE 5.3189 4.5792 8.7970 5.7940 4.6490 10.1413 5.1122 4.4772 8.3235
Province/District Years Both
Sexes
Male Female Both
Sexes
Male Female Both
Sexes
Male Female
Charsadda 1981 13.29 21.43 4.71 19.19 30.06 7.02 11.70 19.11 3.40
1998 31.11 46.92 14.07 39.82 55.26 23.07 28.97 44.87 11.88
2001 36.15 53.88 17.07 45.29 61.53 28.46 34.00 52.16 14.81
39 95 59 08 19 41 49 36 66 10 32 74 37 82 57 67 17 16
All Areas Urban Rural
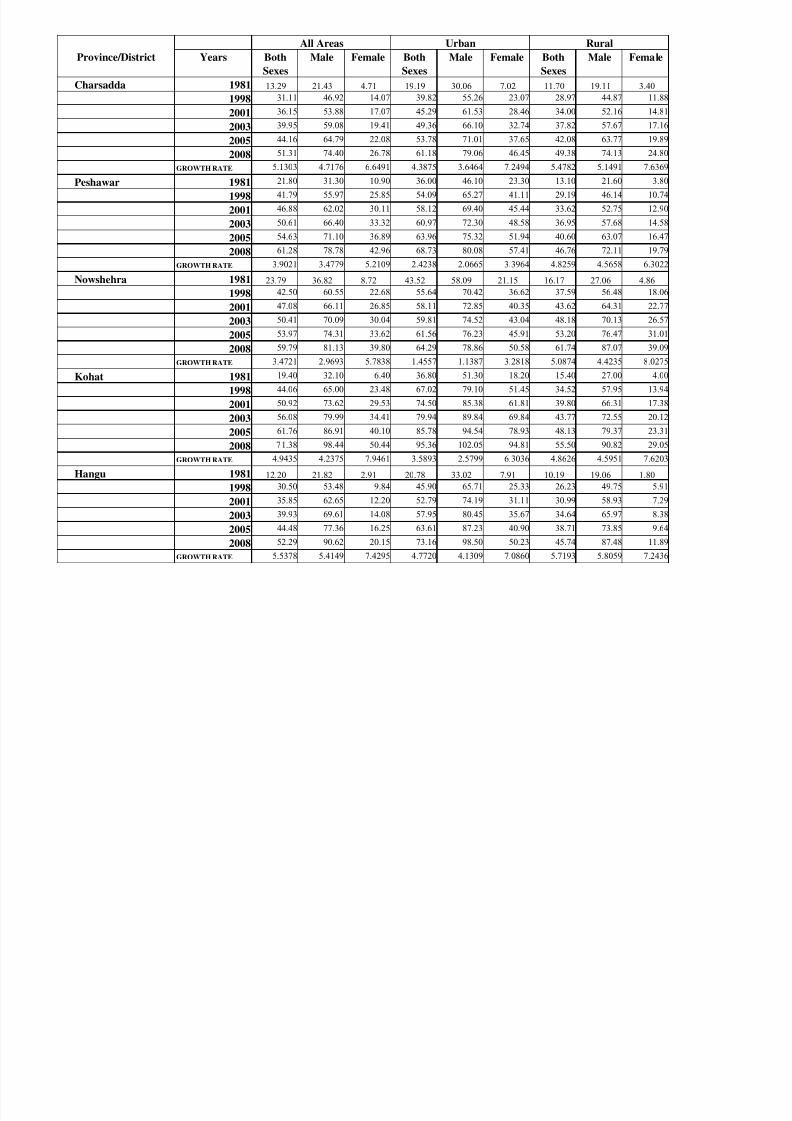
8/18/2019 litracy rate trends pakistan
http://slidepdf.com/reader/full/litracy-rate-trends-pakistan 84/155
2003 39.95 59.08 19.41 49.36 66.10 32.74 37.82 57.67 17.16
2005 44.16 64.79 22.08 53.78 71.01 37.65 42.08 63.77 19.89
2008 51.31 74.40 26.78 61.18 79.06 46.45 49.38 74.13 24.80
GROWTH RATE 5.1303 4.7176 6.6491 4.3875 3.6464 7.2494 5.4782 5.1491 7.6369
Peshawar 1981 21.80 31.30 10.90 36.00 46.10 23.30 13.10 21.60 3.80
1998 41.79 55.97 25.85 54.09 65.27 41.11 29.19 46.14 10.74
2001 46.88 62.02 30.11 58.12 69.40 45.44 33.62 52.75 12.90
2003 50.61 66.40 33.32 60.97 72.30 48.58 36.95 57.68 14.58
2005 54.63 71.10 36.89 63.96 75.32 51.94 40.60 63.07 16.47
2008 61.28 78.78 42.96 68.73 80.08 57.41 46.76 72.11 19.79
GROWTH RATE 3.9021 3.4779 5.2109 2.4238 2.0665 3.3964 4.8259 4.5658 6.3022
Nowshehra 1981 23.79 36.82 8.72 43.52 58.09 21.15 16.17 27.06 4.86
1998 42.50 60.55 22.68 55.64 70.42 36.62 37.59 56.48 18.06
2001 47.08 66.11 26.85 58.11 72.85 40.35 43.62 64.31 22.77
2003 50.41 70.09 30.04 59.81 74.52 43.04 48.18 70.13 26.57
2005 53.97 74.31 33.62 61.56 76.23 45.91 53.20 76.47 31.01
2008 59.79 81.13 39.80 64.29 78.86 50.58 61.74 87.07 39.09
GROWTH RATE 3.4721 2.9693 5.7838 1.4557 1.1387 3.2818 5.0874 4.4235 8.0275
Kohat 1981 19.40 32.10 6.40 36.80 51.30 18.20 15.40 27.00 4.00
1998 44.06 65.00 23.48 67.02 79.10 51.45 34.52 57.95 13.94
2001 50.92 73.62 29.53 74.50 85.38 61.81 39.80 66.31 17.38
2003 56.08 79.99 34.41 79.94 89.84 69.84 43.77 72.55 20.12
2005 61.76 86.91 40.10 85.78 94.54 78.93 48.13 79.37 23.31
2008 7 1.38 98.44 50.44 95.36 102.05 94.81 55.50 90.82 29.05
GROWTH RATE 4.9435 4.2375 7.9461 3.5893 2.5799 6.3036 4.8626 4.5951 7.6203
Hangu 1981 12.20 21.82 2.91 20.78 33.02 7.91 10.19 19.06 1.80
1998 30.50 53.48 9.84 45.90 65.71 25.33 26.23 49.75 5.91
2001 35.85 62.65 12.20 52.79 74.19 31.11 30.99 58.93 7.29
2003 39.93 69.61 14.08 57.95 80.45 35.67 34.64 65.97 8.38
2005 44.48 77.36 16.25 63.61 87.23 40.90 38.71 73.85 9.64
2008 52.29 90.62 20.15 73.16 98.50 50.23 45.74 87.48 11.89
GROWTH RATE 5.5378 5.4149 7.4295 4.7720 4.1309 7.0860 5.7193 5.8059 7.2436
Province/District Years Both Male Female Both Male Female Both Male Female
Karak 1981 19.3 34.75 3.57 24.75 40.01 7.39 18.93 34.37 3.32
1998 41.92 68.15 18.12 53.84 75.59 31.78 41.07 67.59 17.20
2001 48.07 76.75 24.14 61.75 84.57 41.11 47.09 76.16 22.99
2003 52.66 83.08 29.22 67.67 91.14 48.81 51.58 82.46 27.90
57.69 89.93 35.37 74.15 98.23 57.94 56.50 89.29 33.86
All Areas Urban Rural
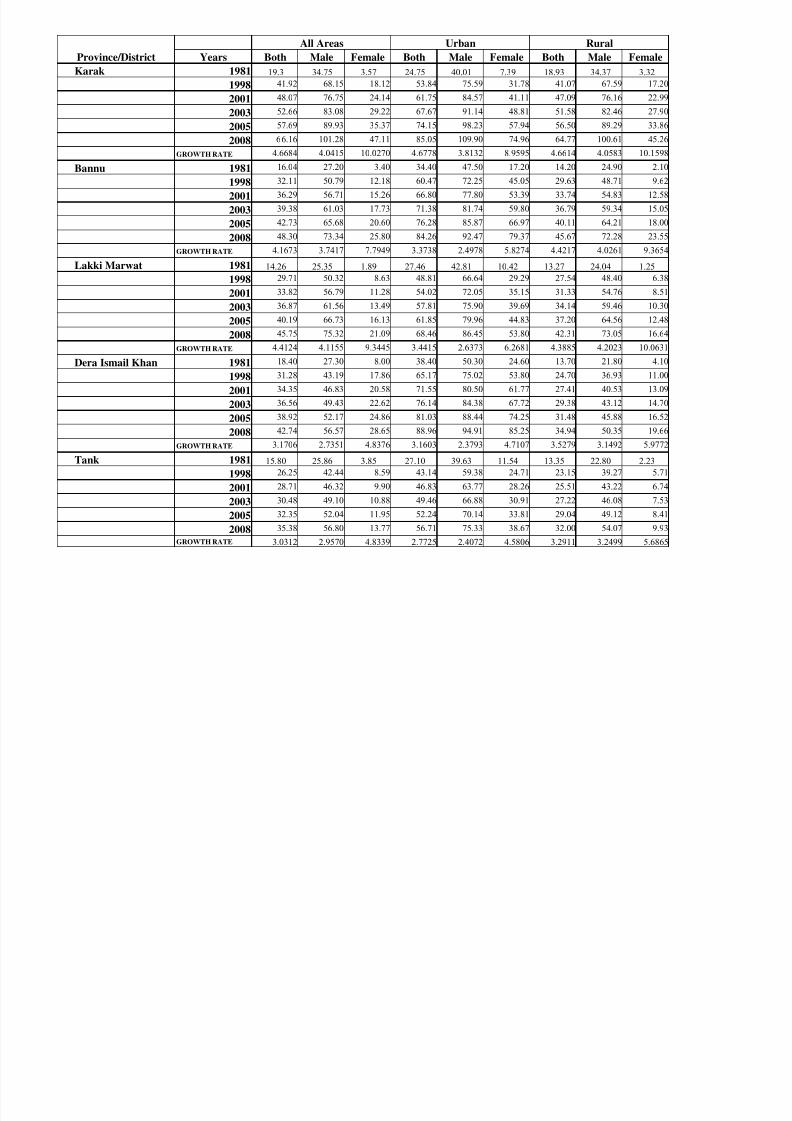
8/18/2019 litracy rate trends pakistan
http://slidepdf.com/reader/full/litracy-rate-trends-pakistan 85/155
2005 57.69 89.93 35.37 74.15 98.23 57.94 56.50 89.29 33.86
2008 6 6.16 101.28 47.11 85.05 109.90 74.96 64.77 100.61 45.26
GROWTH RATE 4.6684 4.0415 10.0270 4.6778 3.8132 8.9595 4.6614 4.0583 10.1598
Bannu 1981 16.04 27.20 3.40 34.40 47.50 17.20 14.20 24.90 2.10
1998 32.11 50.79 12.18 60.47 72.25 45.05 29.63 48.71 9.62
2001 36.29 56.71 15.26 66.80 77.80 53.39 33.74 54.83 12.58
2003 39.38 61.03 17.73 71.38 81.74 59.80 36.79 59.34 15.05
2005 42.73 65.68 20.60 76.28 85.87 66.97 40.11 64.21 18.00
2008 48.30 73.34 25.80 84.26 92.47 79.37 45.67 72.28 23.55
GROWTH RATE 4.1673 3.7417 7.7949 3.3738 2.4978 5.8274 4.4217 4.0261 9.3654
Lakki Marwat 1981 14.26 25.35 1.89 27.46 42.81 10.42 13.27 24.04 1.25
1998 29.71 50.32 8.63 48.81 66.64 29.29 27.54 48.40 6.38
2001 33.82 56.79 11.28 54.02 72.05 35.15 31.33 54.76 8.51
2003 36.87 61.56 13.49 57.81 75.90 39.69 34.14 59.46 10.30
2005 40.19 66.73 16.13 61.85 79.96 44.83 37.20 64.56 12.48
2008 45.75 75.32 21.09 68.46 86.45 53.80 42.31 73.05 16.64
GROWTH RATE 4.4124 4.1155 9.3445 3.4415 2.6373 6.2681 4.3885 4.2023 10.0631
Dera Ismail Khan 1981 18.40 27.30 8.00 38.40 50.30 24.60 13.70 21.80 4.10
1998 31.28 43.19 17.86 65.17 75.02 53.80 24.70 36.93 11.00
2001 34.35 46.83 20.58 71.55 80.50 61.77 27.41 40.53 13.09
2003 36.56 49.43 22.62 76.14 84.38 67.72 29.38 43.12 14.70
2005 38.92 52.17 24.86 81.03 88.44 74.25 31.48 45.88 16.52
2008 42.74 56.57 28.65 88.96 94.91 85.25 34.94 50.35 19.66
GROWTH RATE 3.1706 2.7351 4.8376 3.1603 2.3793 4.7107 3.5279 3.1492 5.9772
Tank 1981 15.80 25.86 3.85 27.10 39.63 11.54 13.35 22.80 2.23
1998 26.25 42.44 8.59 43.14 59.38 24.71 23.15 39.27 5.71
2001 28.71 46.32 9.90 46.83 63.77 28.26 25.51 43.22 6.74
2003 30.48 49.10 10.88 49.46 66.88 30.91 27.22 46.08 7.53
2005 32.35 52.04 11.95 52.24 70.14 33.81 29.04 49.12 8.41
2008 35.38 56.80 13.77 56.71 75.33 38.67 32.00 54.07 9.93
GROWTH RATE 3.0312 2.9570 4.8339 2.7725 2.4072 4.5806 3.2911 3.2499 5.6865
Table VI-D
District-wise Rate of Literac 10 Years & above b Sex & Urban and
Rural areas of Balochistan
Balochistan
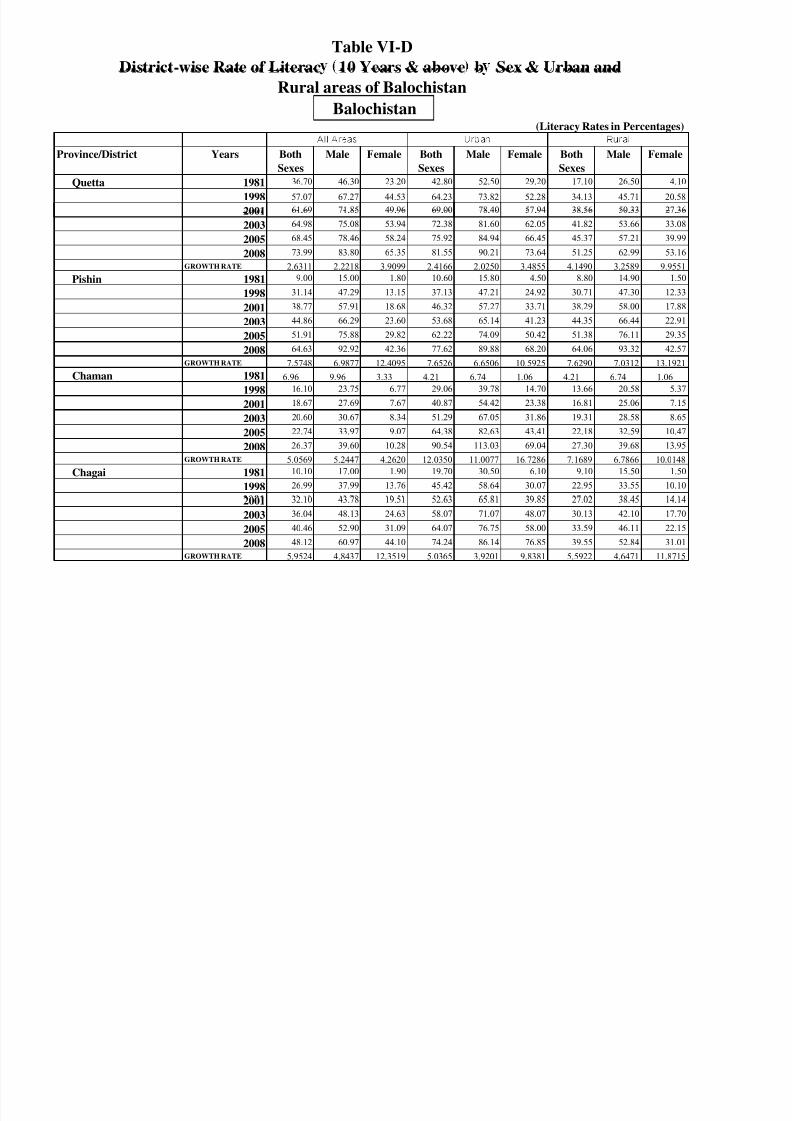
8/18/2019 litracy rate trends pakistan
http://slidepdf.com/reader/full/litracy-rate-trends-pakistan 86/155
(Literacy Rates in Percentages)
Province/District Years Both
Sexes
Male Female Both
Sexes
Male Female Both
Sexes
Male Female
Quetta 1981 36.70 46.30 23.20 42.80 52.50 29.20 17.10 26.50 4.10
1998 57.07 67.27 44.53 64.23 73.82 52.28 34.13 45.71 20.58
2001 61.69 71.85 49.96 69.00 78.40 57.94 38.56 50.33 27.36
. . . . . . . . .
2003 64.98 75.08 53.94 72.38 81.60 62.05 41.82 53.66 33.08
2005 68.45 78.46 58.24 75.92 84.94 66.45 45.37 57.21 39.99
2008 73.99 83.80 65.35 81.55 90.21 73.64 51.25 62.99 53.16
GROWTH RATE 2.6311 2.2218 3.9099 2.4166 2.0250 3.4855 4.1490 3.2589 9.9551
Pishin 1981 9.00 15.00 1.80 10.60 15.80 4.50 8.80 14.90 1.50
1998 31.14 47.29 13.15 37.13 47.21 24.92 30.71 47.30 12.33
2001 38.77 57.91 18.68 46.32 57.27 33.71 38.29 58.00 17.88
2003 44.86 66.29 23.60 53.68 65.14 41.23 44.35 66.44 22.91
2005 51.91 75.88 29.82 62.22 74.09 50.42 51.38 76.11 29.35
2008 64.63 92.92 42.36 77.62 89.88 68.20 64.06 93.32 42.57
GROWTH RATE 7.5748 6.9877 12.4095 7.6526 6.6506 10.5925 7.6290 7.0312 13.1921
Chaman 1981 6.96 9.96 3.33 4.21 6.74 1.06 4.21 6.74 1.06
1998 16.10 23.75 6.77 29.06 39.78 14.70 13.66 20.58 5.37
2001 18.67 27.69 7.67 40.87 54.42 23.38 16.81 25.06 7.15
2003 20.60 30.67 8.34 51.29 67.05 31.86 19.31 28.58 8.65
2005 22.74 33.97 9.07 64.38 82.63 43.41 22.18 32.59 10.47
2008 26.37 39.60 10.28 90.54 113.03 69.04 27.30 39.68 13.95
GROWTH RATE 5.0569 5.2447 4.2620 12.0350 11.0077 16.7286 7.1689 6.7866 10.0148
Chagai 1981 10.10 17.00 1.90 19.70 30.50 6.10 9.10 15.50 1.50
1998 26.99 37.99 13.76 45.42 58.64 30.07 22.95 33.55 10.10
2001 32.10 43.78 19.51 52.63 65.81 39.85 27.02 38.45 14.14
2003 36.04 48.13 24.63 58.07 71.07 48.07 30.13 42.10 17.70
2005 40.46 52.90 31.09 64.07 76.75 58.00 33.59 46.11 22.15
2008 48.12 60.97 44.10 74.24 86.14 76.85 39.55 52.84 31.01
GROWTH RATE 5.9524 4.8437 12.3519 5.0365 3.9201 9.8381 5.5922 4.6471 11.8715
Province/District Years Both Male Female Both Male Female Both Male Female
Al l Areas Urban Rural
Loralai 1981 5.50 8.70 1.60 32.60 42.30 16.90 4.00 6.60 0.80
1998 20.47 30.12 9.24 53.28 66.15 33.39 15.82 24.25 6.39
2001 25.81 37.50 12.59 58.11 71.58 37.65 20.16 30.51 9.22
2003 30 13 43 40 15 48 61 56 75 45 40 79 23 70 35 56 11 77
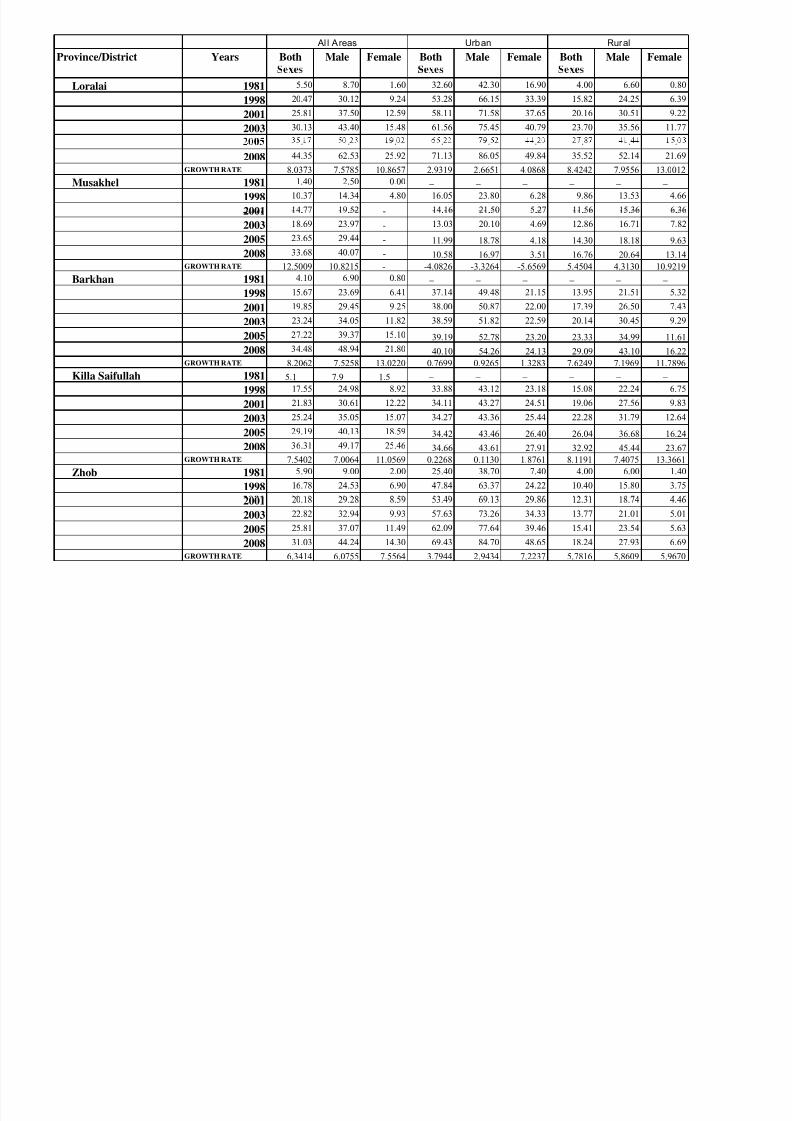
8/18/2019 litracy rate trends pakistan
http://slidepdf.com/reader/full/litracy-rate-trends-pakistan 87/155
2003 30.13 43.40 15.48 61.56 75.45 40.79 23.70 35.56 11.77
. . . . . . . . .
2008 44.35 62.53 25.92 71.13 86.05 49.84 35.52 52.14 21.69
GROWTH RATE 8.0373 7.5785 10.8657 2.9319 2.6651 4.0868 8.4242 7.9556 13.0012
Musakhel 1981 1.40 2.50 0.00 − − − − − −
1998 10.37 14.34 4.80 16.05 23.80 6.28 9.86 13.53 4.66
2001 14.77 19.52 - 14.16 21.50 5.27 11.56 15.36 6.36. . . . . . . .
2003 18.69 23.97 - 13.03 20.10 4.69 12.86 16.71 7.82
2005 23.65 29.44 - 11.99 18.78 4.18 14.30 18.18 9.63
2008 33.68 40.07 - 10.58 16.97 3.51 16.76 20.64 13.14
GROWTH RATE 12.5009 10.8215 - -4.0826 -3.3264 -5.6569 5.4504 4.3130 10.9219
Barkhan 1981 4.10 6.90 0.80 − − − − − −
1998 15.67 23.69 6.41 37.14 49.48 21.15 13.95 21.51 5.32
2001 19.85 29.45 9.25 38.00 50.87 22.00 17.39 26.50 7.43
2003 23.24 34.05 11.82 38.59 51.82 22.59 20.14 30.45 9.29
2005 27.22 39.37 15.10 39.19 52.78 23.20 23.33 34.99 11.61
2008 34.48 48.94 21.80 40.10 54.26 24.13 29.09 43.10 16.22
GROWTH RATE 8.2062 7.5258 13.0220 0.7699 0.9265 1.3283 7.6249 7.1969 11.7896
Killa Saifullah 1981 5.1 7.9 1.5 − − − − − −
1998 17.55 24.98 8.92 33.88 43.12 23.18 15.08 22.24 6.75
2001 21.83 30.61 12.22 34.11 43.27 24.51 19.06 27.56 9.83
2003 25.24 35.05 15.07 34.27 43.36 25.44 22.28 31.79 12.64
2005 29.19 40.13 18.59 34.42 43.46 26.40 26.04 36.68 16.24
2008 36.31 49.17 25.46
34.66 43.61 27.91 32.92 45.44 23.67GROWTH RATE 7.5402 7.0064 11.0569 0.2268 0.1130 1.8761 8.1191 7.4075 13.3661
Zhob 1981 5.90 9.00 2.00 25.40 38.70 7.40 4.00 6.00 1.40
1998 16.78 24.53 6.90 47.84 63.37 24.22 10.40 15.80 3.75
2001 20.18 29.28 8.59 53.49 69.13 29.86 12.31 18.74 4.46
2003 22.82 32.94 9.93 57.63 73.26 34.33 13.77 21.01 5.01
2005 25.81 37.07 11.49 62.09 77.64 39.46 15.41 23.54 5.63
2008 31.03 44.24 14.30 69.43 84.70 48.65 18.24 27.93 6.69
GROWTH RATE 6.3414 6.0755 7.5564 3.7944 2.9434 7.2237 5.7816 5.8609 5.9670
Province/District Years Both Male Female Both Male Female Both Male Female
Al l Areas Urban Rural
Sibi 1981 11.50 17.60 4.40 25.30 33.60 15.00 7.50 12.80 1.60
1998 25.47 35.25 13.60 41.63 52.25 29.08 17.92 27.44 6.19
2001 29.31 39.85 16.60 45.45 56.48 32.68 20.90 31.39 7.86
2003 32.18 43.24 18.95 48.20 59.50 35.33 23.15 34.34 9.22
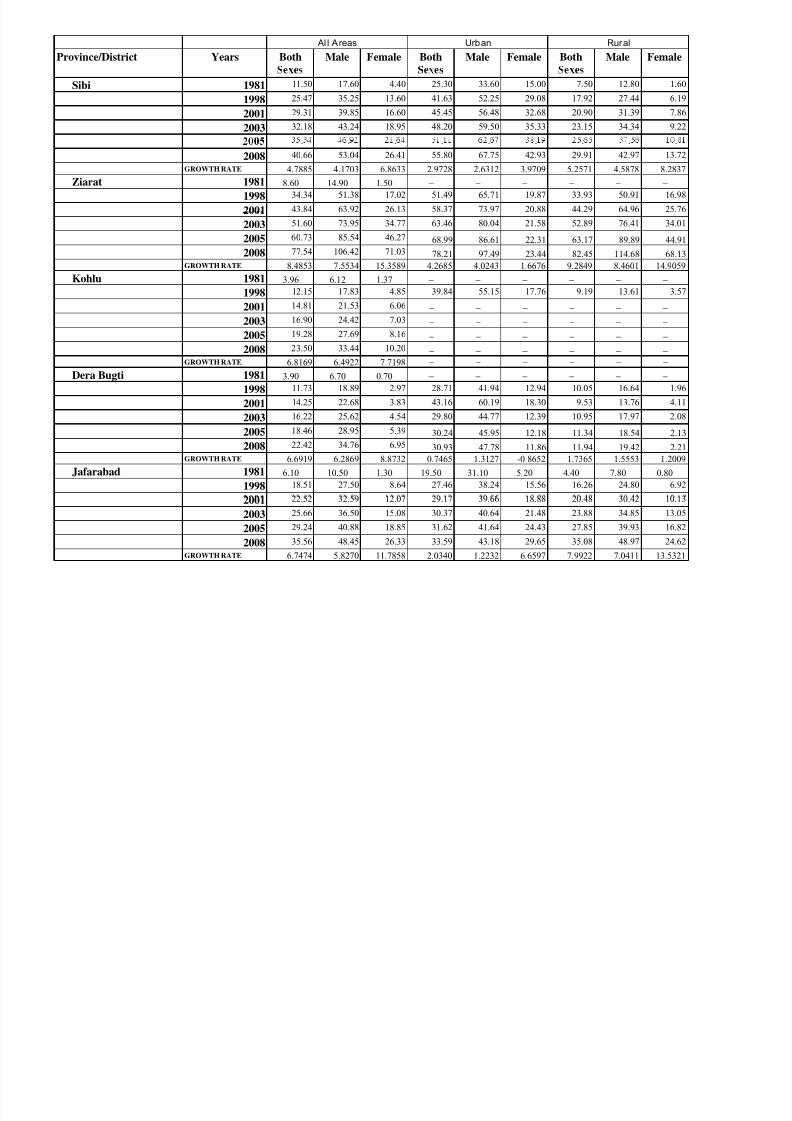
8/18/2019 litracy rate trends pakistan
http://slidepdf.com/reader/full/litracy-rate-trends-pakistan 88/155
2003. . . . . . . . .
2008 40.66 53.04 26.41 55.80 67.75 42.93 29.91 42.97 13.72
GROWTH RATE 4.7885 4.1703 6.8633 2.9728 2.6312 3.9709 5.2571 4.5878 8.2837
Ziarat 1981 8.60 14.90 1.50 − − − − − −
1998 34.34 51.38 17.02 51.49 65.71 19.87 33.93 50.91 16.98
2001 43.84 63.92 26.13 58.37 73.97 20.88 44.29 64.96 25.76
2003 51.60 73.95 34.77 63.46 80.04 21.58 52.89 76.41 34.01
2005 60.73 85.54 46.27 68.99 86.61 22.31 63.17 89.89 44.91
2008 77.54 106.42 71.03 78.21 97.49 23.44 82.45 114.68 68.13
GROWTH RATE 8.4853 7.5534 15.3589 4.2685 4.0243 1.6676 9.2849 8.4601 14.9059
Kohlu 1981 3.96 6.12 1.37 − − − − − −
1998 12.15 17.83 4.85 39.84 55.15 17.76 9.19 13.61 3.57
2001 14.81 21.53 6.06 − − − − − −
2003 16.90 24.42 7.03 − − − − − −
2005 19.28 27.69 8.16 − − − − − −
2008 23.50 33.44 10.20 − − − − − −
GROWTH RATE 6.8169 6.4922 7.7198 − − − − − −
Dera Bugti 1981 3.90 6.70 0.70 − − − − − −
1998 11.73 18.89 2.97 28.71 41.94 12.94 10.05 16.64 1.96
2001 14.25 22.68 3.83 43.16 60.19 18.30 9.53 13.76 4.11
2003 16.22 25.62 4.54 29.80 44.77 12.39 10.95 17.97 2.08
2005 18.46 28.95 5.39 30.24 45.95 12.18 11.34 18.54 2.13
2008 22.42 34.76 6.95
30.93 47.78 11.86 11.94 19.42 2.21GROWTH RATE 6.6919 6.2869 8.8732 0.7465 1.3127 -0.8652 1.7365 1.5553 1.2009
Jafarabad 1981 6.10 10.50 1.30 19.50 31.10 5.20 4.40 7.80 0.80
1998 18.51 27.50 8.64 27.46 38.24 15.56 16.26 24.80 6.92
2001 22.52 32.59 12.07 29.17 39.66 18.88 20.48 30.42 10.13
2003 25.66 36.50 15.08 30.37 40.64 21.48 23.88 34.85 13.05
2005 29.24 40.88 18.85 31.62 41.64 24.43 27.85 39.93 16.82
2008 35.56 48.45 26.33 33.59 43.18 29.65 35.08 48.97 24.62
GROWTH RATE 6.7474 5.8270 11.7858 2.0340 1.2232 6.6597 7.9922 7.0411 13.5321
Province/District Years Both Male Female Both Male Female Both Male Female
Al l Areas Urban Rural
Nasirabad 1981 4.70 8.10 0.80 17.40 27.20 4.70 3.70 6.60 0.50
1998 12.69 19.51 5.06 21.78 32.77 8.86 11.05 17.06 4.39
2001 15.12 22.78 7.01 22.66 33.87 9.91 13.40 20.17 6.44
2003 17.00 25.27 8.70 23.27 34.62 10.68 15.24 22.56 8.32
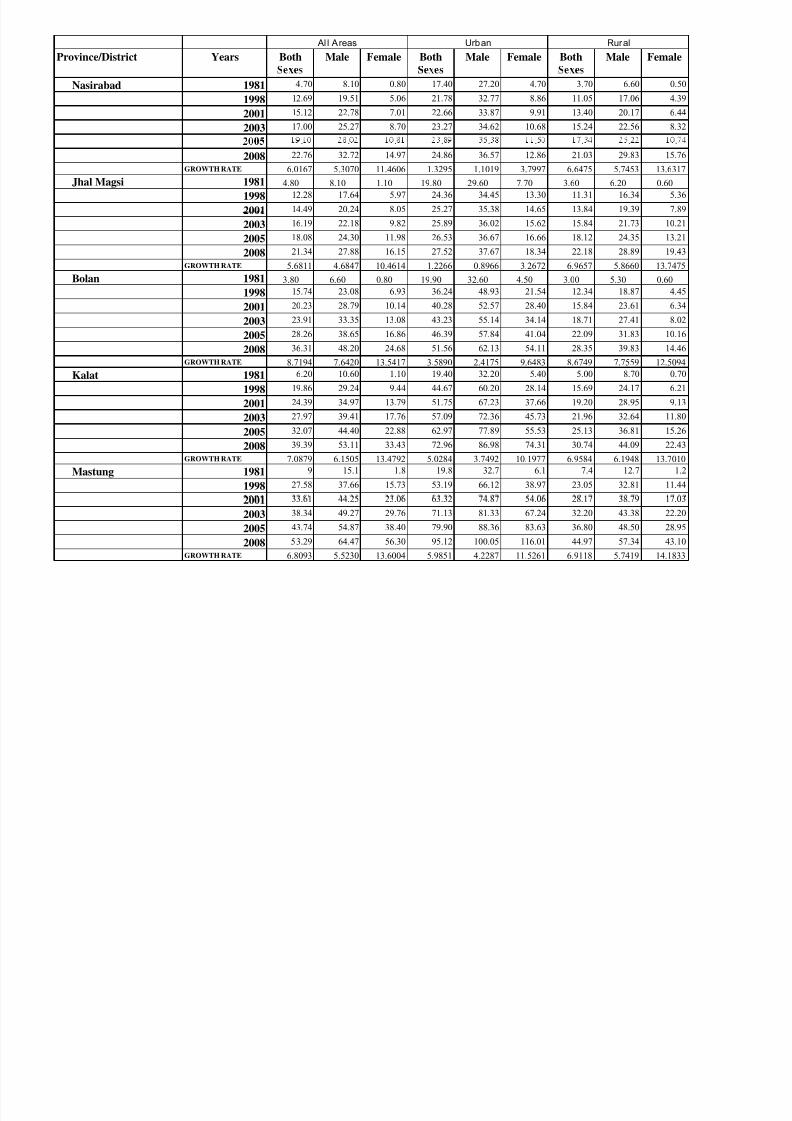
8/18/2019 litracy rate trends pakistan
http://slidepdf.com/reader/full/litracy-rate-trends-pakistan 89/155
2003. . . . . . . . .
2008 22.76 32.72 14.97 24.86 36.57 12.86 21.03 29.83 15.76
GROWTH RATE 6.0167 5.3070 11.4606 1.3295 1.1019 3.7997 6.6475 5.7453 13.6317
Jhal Magsi 1981 4.80 8.10 1.10 19.80 29.60 7.70 3.60 6.20 0.60
1998 12.28 17.64 5.97 24.36 34.45 13.30 11.31 16.34 5.36
2001 14.49 20.24 8.05 25.27 35.38 14.65 13.84 19.39 7.89
2003 16.19 22.18 9.82 25.89 36.02 15.62 15.84 21.73 10.21
2005 18.08 24.30 11.98 26.53 36.67 16.66 18.12 24.35 13.21
2008 21.34 27.88 16.15 27.52 37.67 18.34 22.18 28.89 19.43
GROWTH RATE 5.6811 4.6847 10.4614 1.2266 0.8966 3.2672 6.9657 5.8660 13.7475
Bolan 1981 3.80 6.60 0.80 19.90 32.60 4.50 3.00 5.30 0.60
1998 15.74 23.08 6.93 36.24 48.93 21.54 12.34 18.87 4.45
2001 20.23 28.79 10.14 40.28 52.57 28.40 15.84 23.61 6.34
2003 23.91 33.35 13.08 43.23 55.14 34.14 18.71 27.41 8.02
2005 28.26 38.65 16.86 46.39 57.84 41.04 22.09 31.83 10.16
2008 36.31 48.20 24.68 51.56 62.13 54.11 28.35 39.83 14.46
GROWTH RATE 8.7194 7.6420 13.5417 3.5890 2.4175 9.6483 8.6749 7.7559 12.5094
Kalat 1981 6.20 10.60 1.10 19.40 32.20 5.40 5.00 8.70 0.70
1998 19.86 29.24 9.44 44.67 60.20 28.14 15.69 24.17 6.21
2001 24.39 34.97 13.79 51.75 67.23 37.66 19.20 28.95 9.13
2003 27.97 39.41 17.76 57.09 72.36 45.73 21.96 32.64 11.80
2005 32.07 44.40 22.88 62.97 77.89 55.53 25.13 36.81 15.26
2008 39.39 53.11 33.43 72.96 86.98 74.31 30.74 44.09 22.43
GROWTH RATE 7.0879 6.1505 13.4792 5.0284 3.7492 10.1977 6.9584 6.1948 13.7010
Mastung 1981 9 15.1 1.8 19.8 32.7 6.1 7.4 12.7 1.2
1998 27.58 37.66 15.73 53.19 66.12 38.97 23.05 32.81 11.44
2001 33.61 44.25 23.06 63.32 74.87 54.06 28.17 38.79 17.03
2003 38.34 49.27 29.76 71.13 81.33 67.24 32.20 43.38 22.20
2005 43.74 54.87 38.40 79.90 88.36 83.63 36.80 48.50 28.95
2008 5 3.29 64.47 56.30 95.12 100.05 116.01 44.97 57.34 43.10
GROWTH RATE 6.8093 5.5230 13.6004 5.9851 4.2287 11.5261 6.9118 5.7419 14.1833
Province/District Years Both Male Female Both Male Female Both Male Female
Al l Areas Urban Rural
Khuzdar 1981 4.20 7.00 0.70 15.30 23.30 3.70 3.20 5.40 0.40
1998 17.46 25.33 8.39 30.71 42.01 17.57 12.28 18.77 4.83
2001 22.45 31.78 13.01 34.73 46.62 23.13 15.57 23.39 7.50
2003 26.55 36.98 17.42 37.69 49.96 27.78 18.24 27.08 10.05
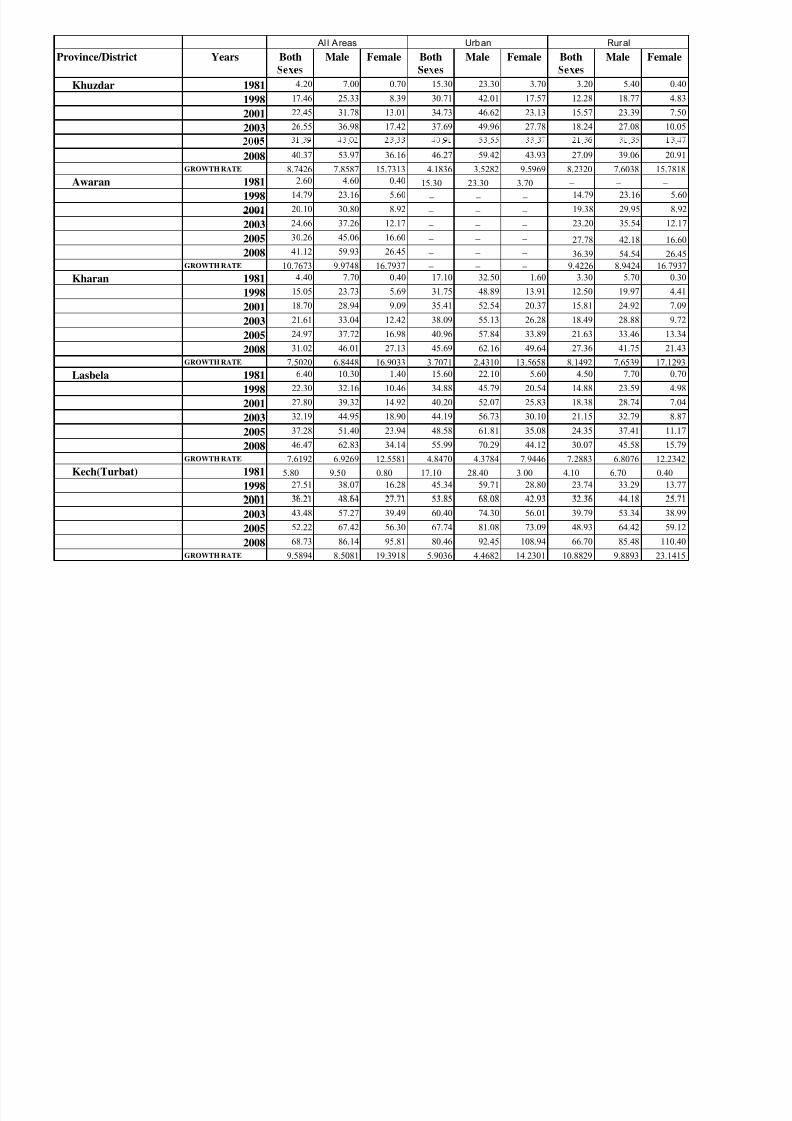
8/18/2019 litracy rate trends pakistan
http://slidepdf.com/reader/full/litracy-rate-trends-pakistan 90/155
2003. . . . . . . . .
2008 40.37 53.97 36.16 46.27 59.42 43.93 27.09 39.06 20.91
GROWTH RATE 8.7426 7.8587 15.7313 4.1836 3.5282 9.5969 8.2320 7.6038 15.7818
Awaran 1981 2.60 4.60 0.40 15.30 23.30 3.70 − − −
1998 14.79 23.16 5.60 − − − 14.79 23.16 5.60
2001 20.10 30.80 8.92 − − − 19.38 29.95 8.92
2003 24.66 37.26 12.17 − − − 23.20 35.54 12.17
2005 30.26 45.06 16.60 − − − 27.78 42.18 16.60
2008 41.12 59.93 26.45 − − − 36.39 54.54 26.45
GROWTH RATE 10.7673 9.9748 16.7937 − − − 9.4226 8.9424 16.7937
Kharan 1981 4.40 7.70 0.40 17.10 32.50 1.60 3.30 5.70 0.30
1998 15.05 23.73 5.69 31.75 48.89 13.91 12.50 19.97 4.41
2001 18.70 28.94 9.09 35.41 52.54 20.37 15.81 24.92 7.09
2003 21.61 33.04 12.42 38.09 55.13 26.28 18.49 28.88 9.72
2005 24.97 37.72 16.98 40.96 57.84 33.89 21.63 33.46 13.34
2008 31.02 46.01 27.13 45.69 62.16 49.64 27.36 41.75 21.43
GROWTH RATE 7.5020 6.8448 16.9033 3.7071 2.4310 13.5658 8.1492 7.6539 17.1293
Lasbela 1981 6.40 10.30 1.40 15.60 22.10 5.60 4.50 7.70 0.70
1998 22.30 32.16 10.46 34.88 45.79 20.54 14.88 23.59 4.98
2001 27.80 39.32 14.92 40.20 52.07 25.83 18.38 28.74 7.04
2003 32.19 44.95 18.90 44.19 56.73 30.10 21.15 32.79 8.87
2005 37.28 51.40 23.94 48.58 61.81 35.08 24.35 37.41 11.17
2008 46.47 62.83 34.14 55.99 70.29 44.12 30.07 45.58 15.79
GROWTH RATE 7.6192 6.9269 12.5581 4.8470 4.3784 7.9446 7.2883 6.8076 12.2342
Kech(Turbat) 1981 5.80 9.50 0.80 17.10 28.40 3.00 4.10 6.70 0.40
1998 27.51 38.07 16.28 45.34 59.71 28.80 23.74 33.29 13.77
2001 36.21 48.64 27.71 53.85 68.08 42.93 32.36 44.18 25.71
2003 43.48 57.27 39.49 60.40 74.30 56.01 39.79 53.34 38.99
2005 52.22 67.42 56.30 67.74 81.08 73.09 48.93 64.42 59.12
2008 68.73 86.14 95.81 80.46 92.45 108.94 66.70 85.48 110.40
GROWTH RATE 9.5894 8.5081 19.3918 5.9036 4.4682 14.2301 10.8829 9.8893 23.1415
Province/District Years Both Male Female Both Male Female Both Male Female
Al l Areas Urban Rural
Gwadar 1981 6.10 10.80 0.90 11.60 20.60 1.80 2.80 4.90 0.30
1998 25.47 35.52 13.81 34.07 46.27 19.87 14.84 22.19 6.38
2001 32.78 43.82 22.36 41.20 53.37 30.36 19.92 28.97 10.94
2003 38.78 50.41 30.83 46.77 58.70 40.27 24.24 34.60 15.68
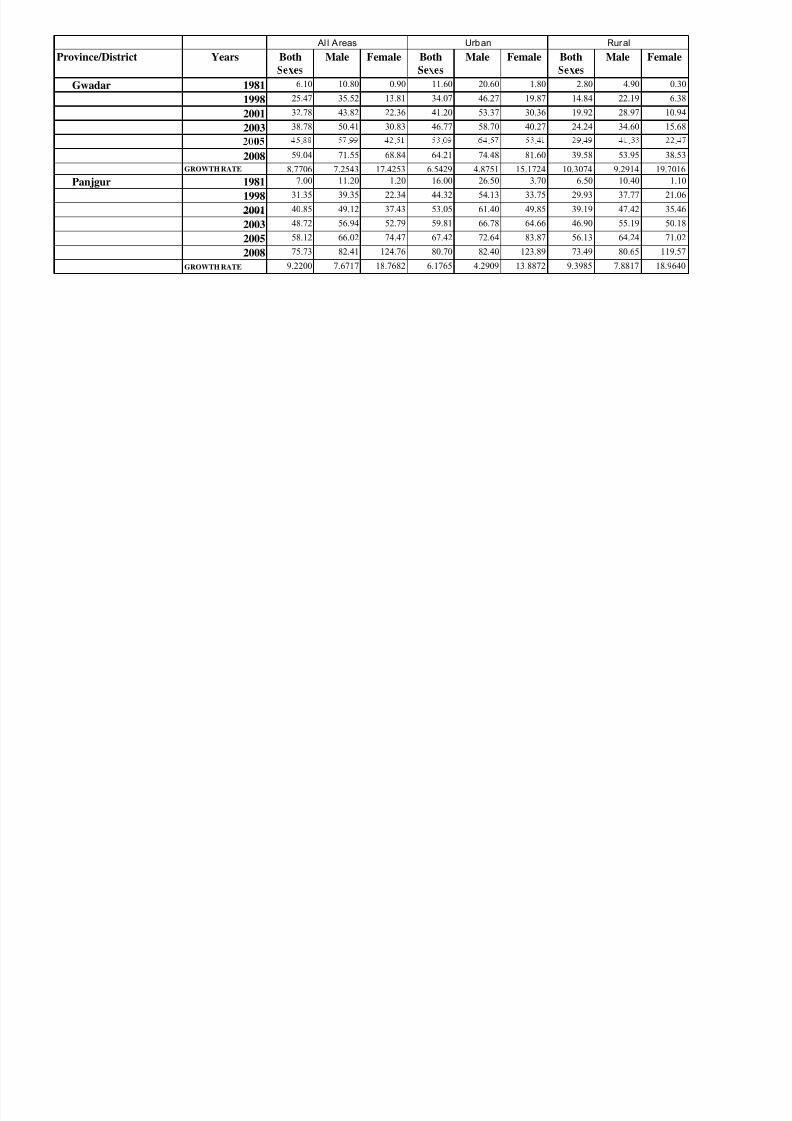
8/18/2019 litracy rate trends pakistan
http://slidepdf.com/reader/full/litracy-rate-trends-pakistan 91/155
2003. . . . . . . . .
2008 59.04 71.55 68.84 64.21 74.48 81.60 39.58 53.95 38.53
GROWTH RATE 8.7706 7.2543 17.4253 6.5429 4.8751 15.1724 10.3074 9.2914 19.7016
Panjgur 1981 7.00 11.20 1.20 16.00 26.50 3.70 6.50 10.40 1.10
1998 31.35 39.35 22.34 44.32 54.13 33.75 29.93 37.77 21.06
2001 40.85 49.12 37.43 53.05 61.40 49.85 39.19 47.42 35.46
2003 48.72 56.94 52.79 59.81 66.78 64.66 46.90 55.19 50.18
2005 58.12 66.02 74.47 67.42 72.64 83.87 56.13 64.24 71.02
2008 75.73 82.41 124.76 80.70 82.40 123.89 73.49 80.65 119.57
GROWTH RATE 9.2200 7.6717 18.7682 6.1765 4.2909 13.8872 9.3985 7.8817 18.9640
(Literacy Rates in Percentages)R l
Sindh
All A U b
Table VI-B
District-wise Rate of Literacy (10 Years & above) by Sex & Urban and
Rural areas of Sindh
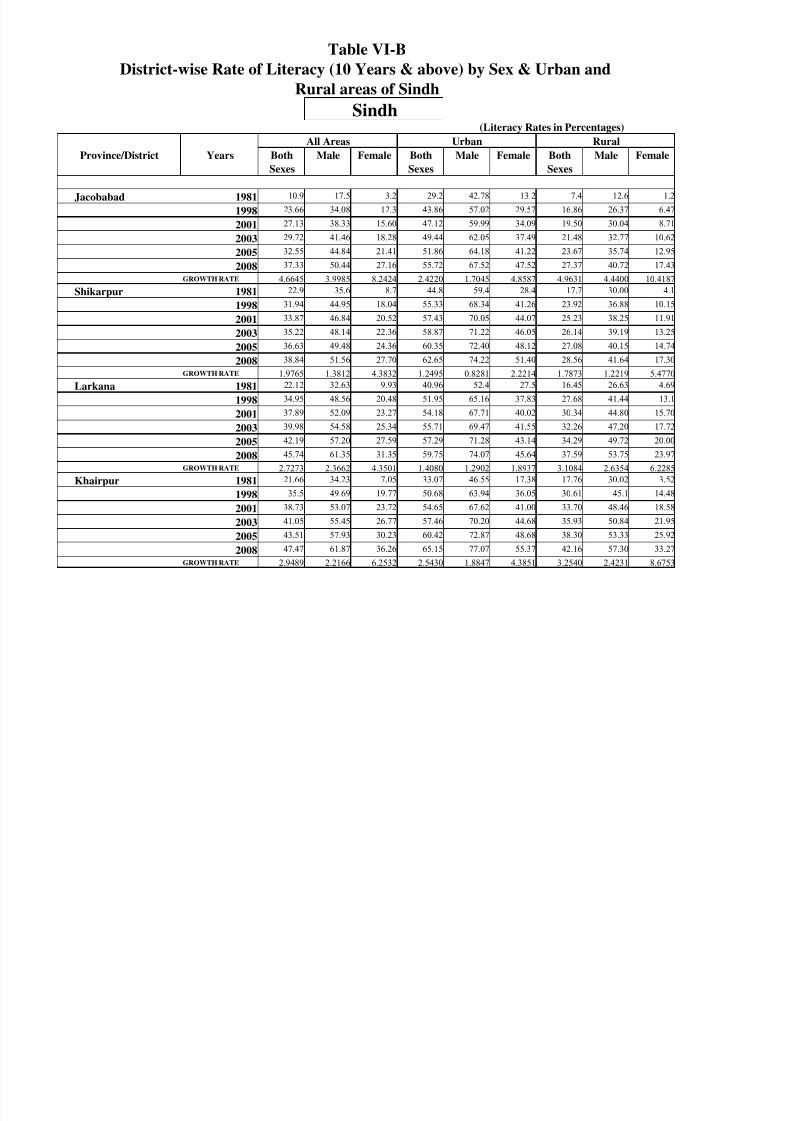
8/18/2019 litracy rate trends pakistan
http://slidepdf.com/reader/full/litracy-rate-trends-pakistan 92/155
(Literacy Rates in Percentages)
Province/District Both
Sexes
Male Female Both
Sexes
Male Female Both
Sexes
Male Female
1981 10.9 17.5 3.2 29.2 42.78 13.2 7.4 12.6 1.2
1998 23.66 34.08 12.3 43.86 57.02 29.57 16.86 26.37 6.47
2001 27.13 38.33 15.60 47.12 59.99 34.09 19.50 30.04 8.71
2003 29.72 41.46 18.28 49.44 62.05 37.49 21.48 32.77 10.62
2005 32.55 44.84 21.41 51.86 64.18 41.22 23.67 35.74 12.95
2008 37.33 50.44 27.16 55.72 67.52 47.52 27.37 40.72 17.43
GROWTH RATE 4.6645 3.9985 8.2424 2.4220 1.7045 4.8587 4.9631 4.4400 10.4187
1981 22.9 35.6 8.7 44.8 59.4 28.4 17.7 30.00 4.1
1998 31.94 44.95 18.04 55.33 68.34 41.26 23.92 36.88 10.15
2001 33.87 46.84 20.52 57.43 70.05 44.07 25.23 38.25 11.91
2003 35.22 48.14 22.36 58.87 71.22 46.05 26.14 39.19 13.25
2005 36.63 49.48 24.36 60.35 72.40 48.12 27.08 40.15 14.74
2008 38.84 51.56 27.70 62.65 74.22 51.40 28.56 41.64 17.30
GROWTH RATE 1.9765 1.3812 4.3832 1.2495 0.8281 2.2214 1.7873 1.2219 5.4770
1981 22.12 32.63 9.93 40.96 52.4 27.5 16.45 26.63 4.69
1998 34.95 48.56 20.48 51.95 65.16 37.83 27.68 41.44 13.1
2001 37.89 52.09 23.27 54.18 67.71 40.02 30.34 44.80 15.70
2003 39.98 54.58 25.34 55.71 69.47 41.55 32.26 47.20 17.72
2005 42.19 57.20 27.59 57.29 71.28 43.14 34.29 49.72 20.00
2008 45.74 61.35 31.35 59.75 74.07 45.64 37.59 53.75 23.97
GROWTH RATE 2.7273 2.3662 4.3501 1.4080 1.2902 1.8937 3.1084 2.6354 6.2285
1981 21.66 34.23 7.05 33.07 46.55 17.38 17.76 30.02 3.52
1998 35.5 49.69 19.77 50.68 63.94 36.05 30.61 45.1 14.48
2001 38.73 53.07 23.72 54.65 67.62 41.00 33.70 48.46 18.58
2003 41.05 55.45 26.77 57.46 70.20 44.68 35.93 50.84 21.95
2005 43.51 57.93 30.23 60.42 72.87 48.68 38.30 53.33 25.92
2008 47.47 61.87 36.26 65.15 77.07 55.37 42.16 57.30 33.27
GROWTH RATE 2.9489 2.2166 6.2532 2.5430 1.8847 4.3851 3.2540 2.4231 8.6753
Rural
Years
Jacobabad
All Areas Urban
Larkana
Shikarpur
Khairpur
Province/District Both
Sexes
Male Female Both
Sexes
Male Female Both
Sexes
Male Female
1981 26.34 37.49 12.81 43.86 54.35 31.13 18.77 30.21 4.9
1998 46.62 59.83 31.22 59.76 70.59 46.9 31.72 47.4 13.78
2001 51.56 64.97 36.53 63.11 73.92 50.42 34.80 51.32 16.54
2003 55.14 68.65 40.57 65.45 76.23 52.91 37.01 54.11 18.68
2005 58 98 72 53 45 05 67 88 78 61 55 52 39 37 57 06 21 09
Sukkur
All Areas Urban Rural
Years
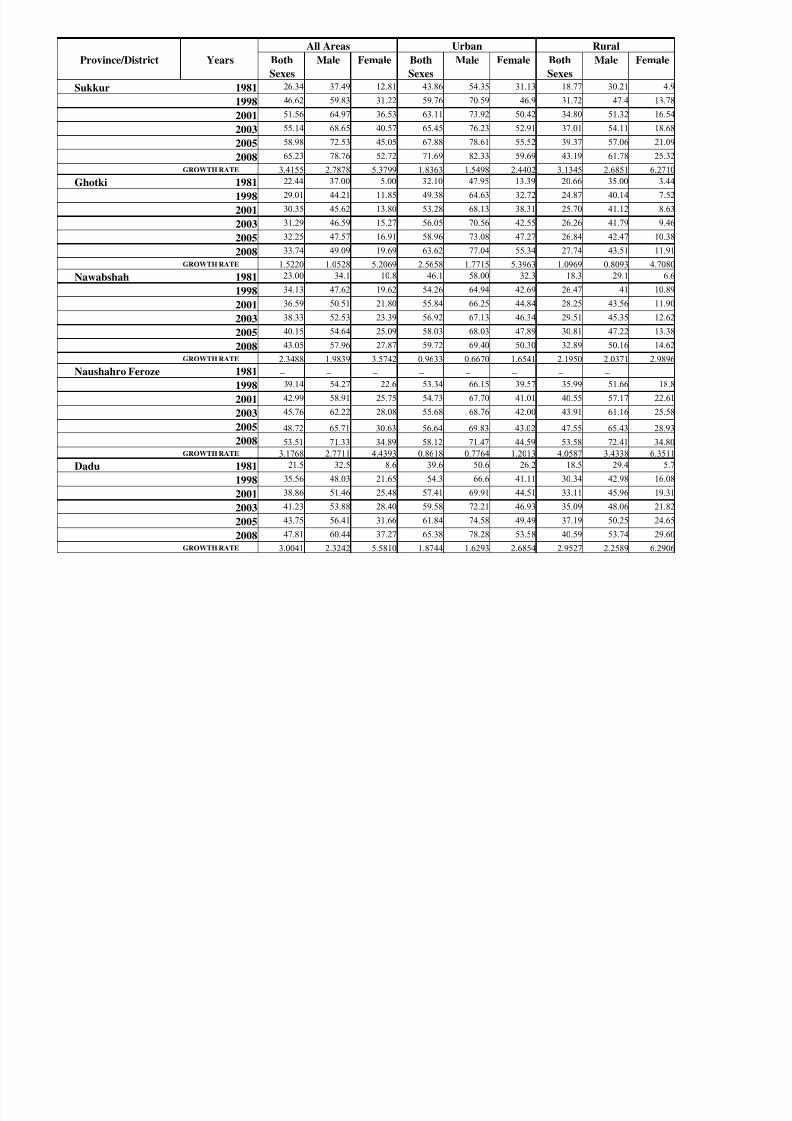
8/18/2019 litracy rate trends pakistan
http://slidepdf.com/reader/full/litracy-rate-trends-pakistan 93/155
2005 58.98 72.53 45.05 67.88 78.61 55.52 39.37 57.06 21.09
2008 65.23 78.76 52.72 71.69 82.33 59.69 43.19 61.78 25.32
GROWTH RATE 3.4155 2.7878 5.3799 1.8363 1.5498 2.4402 3.1345 2.6851 6.2710
1981 22.44 37.00 5.00 32.10 47.95 13.39 20.66 35.00 3.44
1998 29.01 44.21 11.85 49.38 64.63 32.72 24.87 40.14 7.52
2001 30.35 45.62 13.80 53.28 68.13 38.31 25.70 41.12 8.63
2003 31.29 46.59 15.27 56.05 70.56 42.55 26.26 41.79 9.46
2005 32.25 47.57 16.91 58.96 73.08 47.27 26.84 42.47 10.38
2008 33.74 49.09 19.69 63.62 77.04 55.34 27.74 43.51 11.91
GROWTH RATE 1.5220 1.0528 5.2069 2.5658 1.7715 5.3963 1.0969 0.8093 4.7080
1981 23.00 34.1 10.8 46.1 58.00 32.3 18.3 29.1 6.6
1998 34.13 47.62 19.62 54.26 64.94 42.69 26.47 41 10.89
2001 36.59 50.51 21.80 55.84 66.25 44.84 28.25 43.56 11.90
2003 38.33 52.53 23.39 56.92 67.13 46.34 29.51 45.35 12.62
2005 40.15 54.64 25.09 58.03 68.03 47.89 30.81 47.22 13.38
2008 43.05 57.96 27.87 59.72 69.40 50.30 32.89 50.16 14.62
GROWTH RATE 2.3488 1.9839 3.5742 0.9633 0.6670 1.6541 2.1950 2.0371 2.9896
1981 − − − − − − − − −
1998 39.14 54.27 22.6 53.34 66.15 39.57 35.99 51.66 18.8
2001 42.99 58.91 25.75 54.73 67.70 41.01 40.55 57.17 22.61
2003 45.76 62.22 28.08 55.68 68.76 42.00 43.91 61.16 25.58
2005 48.72 65.71 30.63 56.64 69.83 43.02 47.55 65.43 28.93
2008 53.51 71.33 34.89 58.12 71.47 44.59 53.58 72.41 34.80
GROWTH RATE 3.1768 2.7711 4.4393 0.8618 0.7764 1.2013 4.0587 3.4338 6.3511
1981 21.5 32.5 8.6 39.6 50.6 26.2 18.5 29.4 5.7
1998 35.56 48.03 21.65 54.3 66.6 41.11 30.34 42.98 16.08
2001 38.86 51.46 25.48 57.41 69.91 44.51 33.11 45.96 19.31
2003 41.23 53.88 28.40 59.58 72.21 46.93 35.09 48.06 21.82
2005 43.75 56.41 31.66 61.84 74.58 49.49 37.19 50.25 24.65
2008 47.81 60.44 37.27 65.38 78.28 53.58 40.59 53.74 29.60
GROWTH RATE 3.0041 2.3242 5.5810 1.8744 1.6293 2.6854 2.9527 2.2589 6.2906
Ghotki
Naushahro Feroze
Nawabshah
Dadu
Province/District Both
Sexes
Male Female Both
Sexes
Male Female Both
Sexes
Male Female
1981 28.7 36.5 19.8 41.2 48.3 33 18.1 26.4 9.00
1998 44.25 52.63 34.97 61.3 67.32 54.58 24.84 35.76 12.89
2001 47.76 56.14 38.66 65.75 71.38 59.65 26.27 37.73 13.73
2003 50.26 58.61 41.34 68.90 74.23 63.29 27.26 39.10 14.33
2005 52 89 61 19 44 20 72 20 77 18 67 14 28 30 40 52 14 94
Hyderabad
All Areas Urban Rural
Years
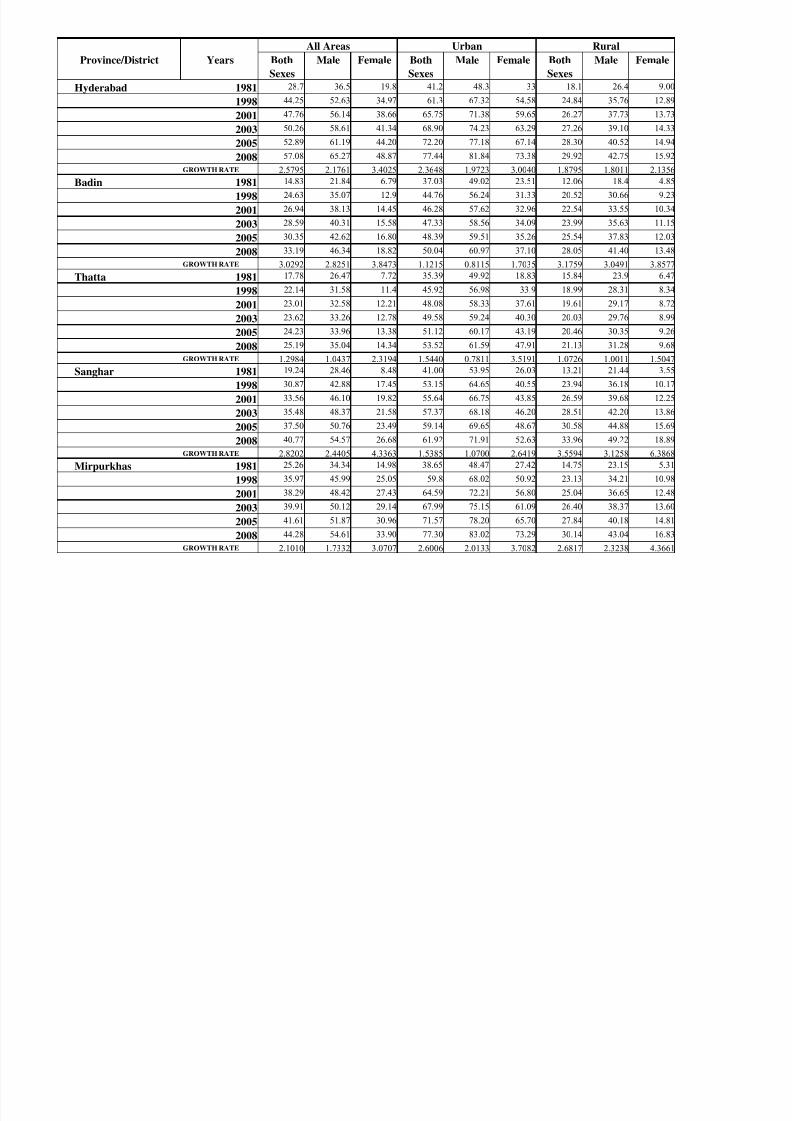
8/18/2019 litracy rate trends pakistan
http://slidepdf.com/reader/full/litracy-rate-trends-pakistan 94/155
2005 52.89 61.19 44.20 72.20 77.18 67.14 28.30 40.52 14.94
2008 57.08 65.27 48.87 77.44 81.84 73.38 29.92 42.75 15.92
GROWTH RATE 2.5795 2.1761 3.4025 2.3648 1.9723 3.0040 1.8795 1.8011 2.1356
1981 14.83 21.84 6.79 37.03 49.02 23.51 12.06 18.4 4.85
1998 24.63 35.07 12.9 44.76 56.24 31.33 20.52 30.66 9.23
2001 26.94 38.13 14.45 46.28 57.62 32.96 22.54 33.55 10.34
2003 28.59 40.31 15.58 47.33 58.56 34.09 23.99 35.63 11.15
2005 30.35 42.62 16.80 48.39 59.51 35.26 25.54 37.83 12.03
2008 33.19 46.34 18.82 50.04 60.97 37.10 28.05 41.40 13.48
GROWTH RATE 3.0292 2.8251 3.8473 1.1215 0.8115 1.7035 3.1759 3.0491 3.8577
1981 17.78 26.47 7.72 35.39 49.92 18.83 15.84 23.9 6.47
1998 22.14 31.58 11.4 45.92 56.98 33.9 18.99 28.31 8.34
2001 23.01 32.58 12.21 48.08 58.33 37.61 19.61 29.17 8.72
2003 23.62 33.26 12.78 49.58 59.24 40.30 20.03 29.76 8.99
2005 24.23 33.96 13.38 51.12 60.17 43.19 20.46 30.35 9.26
2008 25.19 35.04 14.34 53.52 61.59 47.91 21.13 31.28 9.68
GROWTH RATE 1.2984 1.0437 2.3194 1.5440 0.7811 3.5191 1.0726 1.0011 1.5047
1981 19.24 28.46 8.48 41.00 53.95 26.03 13.21 21.44 3.55
1998 30.87 42.88 17.45 53.15 64.65 40.55 23.94 36.18 10.17
2001 33.56 46.10 19.82 55.64 66.75 43.85 26.59 39.68 12.25
2003 35.48 48.37 21.58 57.37 68.18 46.20 28.51 42.20 13.86
2005 37.50 50.76 23.49 59.14 69.65 48.67 30.58 44.88 15.69
2008 40.77 54.57 26.68 61.92 71.91 52.63 33.96 49.22 18.89
GROWTH RATE 2.8202 2.4405 4.3363 1.5385 1.0700 2.6419 3.5594 3.1258 6.3868
1981 25.26 34.34 14.98 38.65 48.47 27.42 14.75 23.15 5.31
1998 35.97 45.99 25.05 59.8 68.02 50.92 23.13 34.21 10.98
2001 38.29 48.42 27.43 64.59 72.21 56.80 25.04 36.65 12.48
2003 39.91 50.12 29.14 67.99 75.15 61.09 26.40 38.37 13.60
2005 41.61 51.87 30.96 71.57 78.20 65.70 27.84 40.18 14.81
2008 44.28 54.61 33.90 77.30 83.02 73.29 30.14 43.04 16.83
GROWTH RATE 2.1010 1.7332 3.0707 2.6006 2.0133 3.7082 2.6817 2.3238 4.3661
Badin
Sanghar
Mirpurkhas
Thatta
Province/District Both
Sexes
Male Female Both
Sexes
Male Female Both
Sexes
Male Female
1981 16.4 23.7 7.9 38.2 49.2 25.5 11.9 18.4 4.2
1998 18.32 28.33 6.91 57.27 71.14 41.68 16.35 26.17 5.14
2001 18.68 29.24 6.75 61.51 75.92 45.46 17.29 27.85 5.33
2003 18.93 29.86 6.64 64.51 79.29 48.16 17.95 29.03 5.45
2005 19 17 30 49 6 54 67 66 82 81 51 03 18 63 30 26 5 59
Tharparkar
Years
All Areas Urban Rural
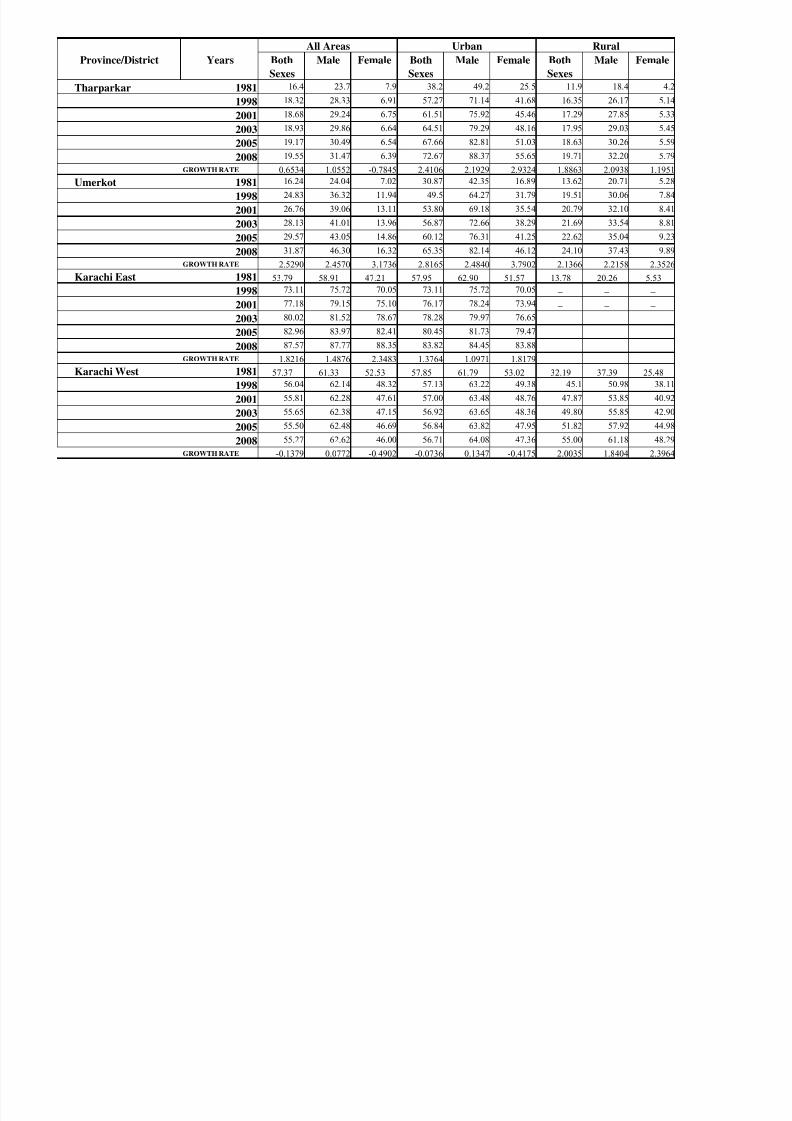
8/18/2019 litracy rate trends pakistan
http://slidepdf.com/reader/full/litracy-rate-trends-pakistan 95/155
2005 19.17 30.49 6.54 67.66 82.81 51.03 18.63 30.26 5.59
2008 19.55 31.47 6.39 72.67 88.37 55.65 19.71 32.20 5.79
GROWTH RATE 0.6534 1.0552 -0.7845 2.4106 2.1929 2.9324 1.8863 2.0938 1.1951
1981 16.24 24.04 7.02 30.87 42.35 16.89 13.62 20.71 5.28
1998 24.83 36.32 11.94 49.5 64.27 31.79 19.51 30.06 7.84
2001 26.76 39.06 13.11 53.80 69.18 35.54 20.79 32.10 8.41
2003 28.13 41.01 13.96 56.87 72.66 38.29 21.69 33.54 8.81
2005 29.57 43.05 14.86 60.12 76.31 41.25 22.62 35.04 9.23
2008 31.87 46.30 16.32 65.35 82.14 46.12 24.10 37.43 9.89
GROWTH RATE 2.5290 2.4570 3.1736 2.8165 2.4840 3.7902 2.1366 2.2158 2.3526
1981 53.79 58.91 47.21 57.95 62.90 51.57 13.78 20.26 5.53
1998 73.11 75.72 70.05 73.11 75.72 70.05 − − −
2001 77.18 79.15 75.10 76.17 78.24 73.94 − − −
2003 80.02 81.52 78.67 78.28 79.97 76.65
2005 82.96 83.97 82.41 80.45 81.73 79.47
2008 87.57 87.77 88.35 83.82 84.45 83.88
GROWTH RATE 1.8216 1.4876 2.3483 1.3764 1.0971 1.8179
1981 57.37 61.33 52.53 57.85 61.79 53.02 32.19 37.39 25.48
1998 56.04 62.14 48.32 57.13 63.22 49.38 45.1 50.98 38.11
2001 55.81 62.28 47.61 57.00 63.48 48.76 47.87 53.85 40.92
2003 55.65 62.38 47.15 56.92 63.65 48.36 49.80 55.85 42.90
2005 55.50 62.48 46.69 56.84 63.82 47.95 51.82 57.92 44.98
2008 55.27 62.62 46.00 56.71 64.08 47.36 55.00 61.18 48.29
GROWTH RATE -0.1379 0.0772 -0.4902 -0.0736 0.1347 -0.4175 2.0035 1.8404 2.3964
Karachi East
Karachi West
Umerkot
Province/District Both
Sexes
Male Female Both
Sexes
Male Female Both
Sexes
Male Female
1981 53.15 59.48 45.33 53.15 59.48 45.33 − − −
1998 67.59 71.63 62.67 67.59 71.63 62.67 − − −
2001 70.52 74.02 66.36 70.52 74.02 66.36 − − −
2003 72.54 75.65 68.93 72.54 75.65 68.93
2005 74.62 77.33 71.61 74.62 77.33 71.61
Urban Rural
Years
Karachi South
All Areas
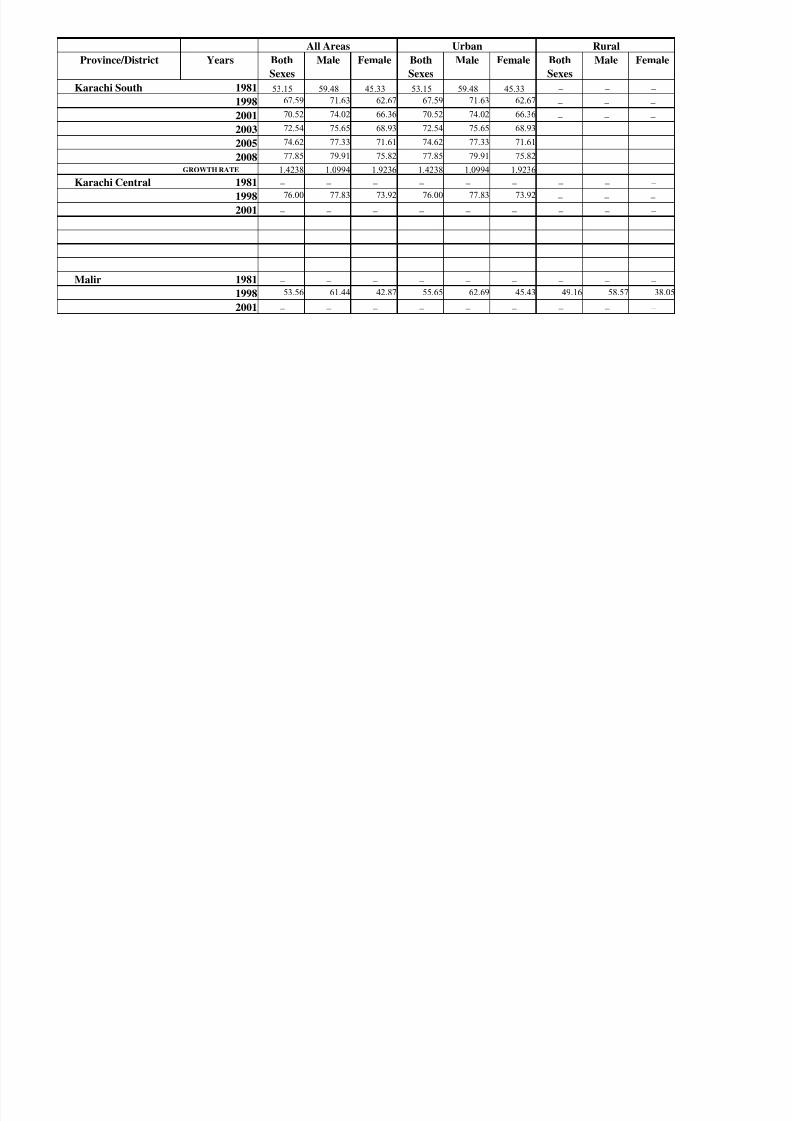
8/18/2019 litracy rate trends pakistan
http://slidepdf.com/reader/full/litracy-rate-trends-pakistan 96/155
2005 74.62 77.33 71.61 74.62 77.33 71.61
2008 77.85 79.91 75.82 77.85 79.91 75.82
GROWTH RATE 1.4238 1.0994 1.9236 1.4238 1.0994 1.9236
1981 − − − − − − − − −
1998 76.00 77.83 73.92 76.00 77.83 73.92 − − −
2001 − − − − − − − − −
1981 − − − − − − − − −
1998 53.56 61.44 42.87 55.65 62.69 45.43 49.16 58.57 38.05
2001 − − − − − − − − −
Malir
Karachi Central
Table VII-A
1998
District-wise Rate of Literacy by Sex & Urban and
Rural areas of Punjab
Punjab
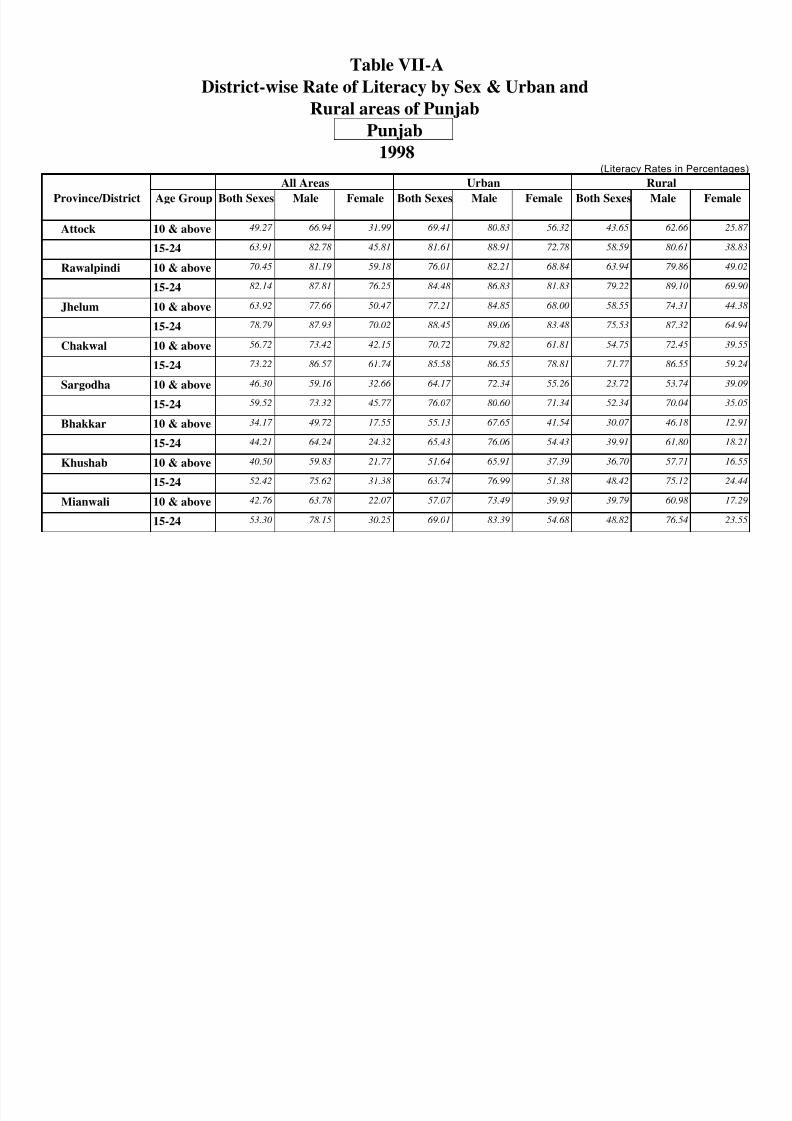
8/18/2019 litracy rate trends pakistan
http://slidepdf.com/reader/full/litracy-rate-trends-pakistan 97/155
Province/District Both Sexes Male Female Both Sexes Male Female Both Sexes Male Female
10 & above 49.27 66.94 31.99 69.41 80.83 56.32 43.65 62.66 25.87
15-24 63.91 82.78 45.81 81.61 88.91 72.78 58.59 80.61 38.83
10 & above 70.45 81.19 59.18 76.01 82.21 68.84 63.94 79.86 49.02
15-24 82.14 87.81 76.25 84.48 86.83 81.83 79.22 89.10 69.90
10 & above 63.92 77.66 50.47 77.21 84.85 68.00 58.55 74.31 44.38
15-24 78.79 87.93 70.02 88.45 89.06 83.48 75.53 87.32 64.94
10 & above 56.72 73.42 42.15 70.72 79.82 61.81 54.75 72.45 39.55
15-24 73.22 86.57 61.74 85.58 86.55 78.81 71.77 86.55 59.24
10 & above 46.30 59.16 32.66 64.17 72.34 55.26 23.72 53.74 39.09
15-24 59.52 73.32 45.77 76.07 80.60 71.34 52.34 70.04 35.05
10 & above 34.17 49.72 17.55 55.13 67.65 41.54 30.07 46.18 12.91
15-24 44.21 64.24 24.32 65.43 76.06 54.43 39.91 61.80 18.21
10 & above 40.50 59.83 21.77 51.64 65.91 37.39 36.70 57.71 16.55
15-24 52.42 75.62 31.38 63.74 76.99 51.38 48.42 75.12 24.44
10 & above 42.76 63.78 22.07 57.07 73.49 39.93 39.79 60.98 17.29
15-24 53.30 78.15 30.25 69.01 83.39 54.68 48.82 76.54 23.55
Jhelum
Attock
Age Group
Bhakkar
Khushab
Chakwal
Sargodha
1998 (Literacy Rates in Percentages)
j
RuralAll Areas Urban
Mianwali
Rawalpindi
Province/District Both Sexes Male Female Both Sexes Male Female Both Sexes Male Female
10 & above 51.94 60.85 42.16 64.18 69.81 57.89 42.53 53.85 30.27
15-24 64.74 71.81 57.36 74.94 76.57 73.20 55.96 67.60 44.09
10 & above 37.12 51.53 21.43 57.50 66.82 47.29 30.73 46.72 13.36
Urban Rural
Age Group
All Areas
Jhang
Faisalabad
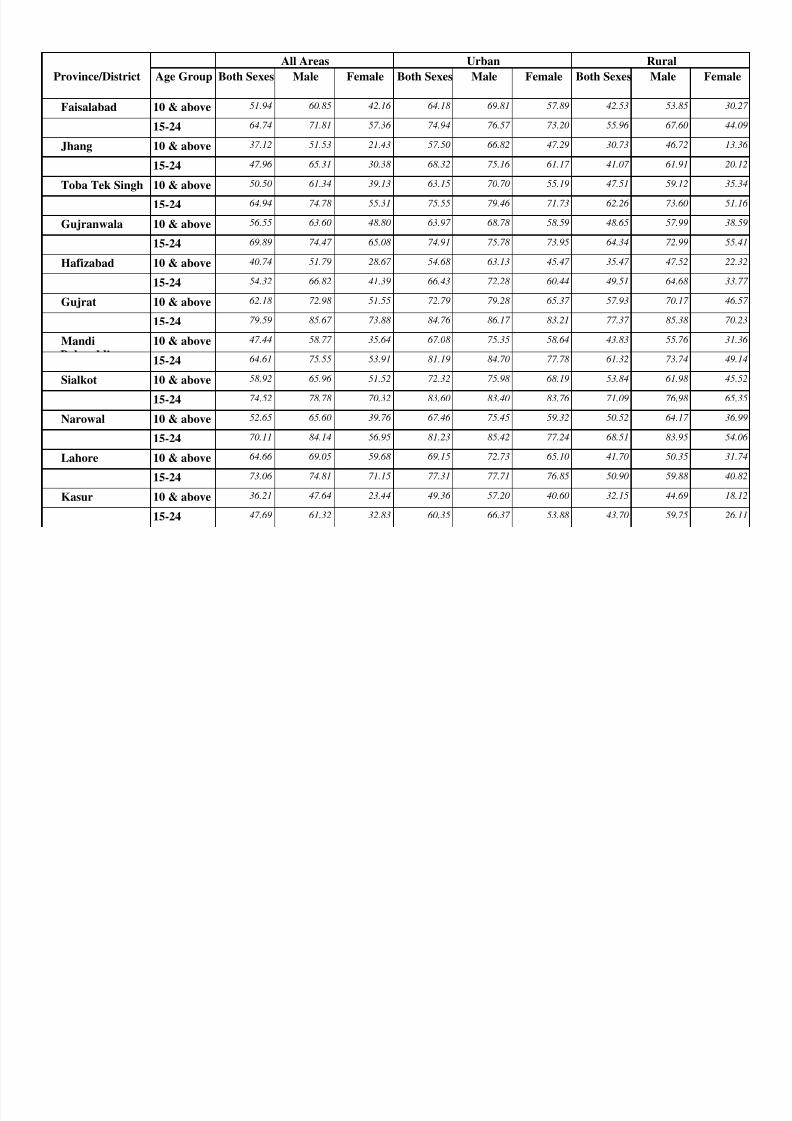
8/18/2019 litracy rate trends pakistan
http://slidepdf.com/reader/full/litracy-rate-trends-pakistan 98/155
10 & above 37.12 51.53 21.43 57.50 66.82 47.29 30.73 46.72 13.36
15-24 47.96 65.31 30.38 68.32 75.16 61.17 41.07 61.91 20.12
10 & above 50.50 61.34 39.13 63.15 70.70 55.19 47.51 59.12 35.34
15-24 64.94 74.78 55.31 75.55 79.46 71.73 62.26 73.60 51.16
10 & above 56.55 63.60 48.80 63.97 68.78 58.59 48.65 57.99 38.59
15-24 69.89 74.47 65.08 74.91 75.78 73.95 64.34 72.99 55.41
10 & above 40.74 51.79 28.67 54.68 63.13 45.47 35.47 47.52 22.32
15-24 54.32 66.82 41.39 66.43 72.28 60.44 49.51 64.68 33.77
10 & above 62.18 72.98 51.55 72.79 79.28 65.37 57.93 70.17 46.57
15-24 79.59 85.67 73.88 84.76 86.17 83.21 77.37 85.38 70.23
10 & above 47.44 58.77 35.64 67.08 75.35 58.64 43.83 55.76 31.36
15-24 64.61 75.55 53.91 81.19 84.70 77.78 61.32 73.74 49.14
10 & above 58.92 65.96 51.52 72.32 75.98 68.19 53.84 61.98 45.52
15-24 74.52 78.78 70.32 83.60 83.40 83.76 71.09 76.98 65.35
10 & above 52.65 65.60 39.76 67.46 75.45 59.32 50.52 64.17 36.99
15-24 70.11 84.14 56.95 81.23 85.42 77.24 68.51 83.95 54.06
10 & above 64.66 69.05 59.68 69.15 72.73 65.10 41.70 50.35 31.74
15-24 73.06 74.81 71.15 77.31 77.71 76.85 50.90 59.88 40.82
10 & above 36.21 47.64 23.44 49.36 57.20 40.60 32.15 44.69 18.12
15-24 47.69 61.32 32.83 60.35 66.37 53.88 43.70 59.75 26.11
Gujrat
Mandi
Gujranwala
Hafizabad
Sialkot
Narowal
Lahore
Kasur
Toba Tek Singh
Jhang
Province/District Both Sexes Male Female Both Sexes Male Female Both Sexes Male Female
10 & above 37.79 49.27 24.99 58.74 68.18 47.35 31.26 43.08 18.39
15-24 49.31 62.52 41.57 68.96 74.86 62.42 43.04 58.42 27.48
Age Group
Okara
All Areas Urban Rural
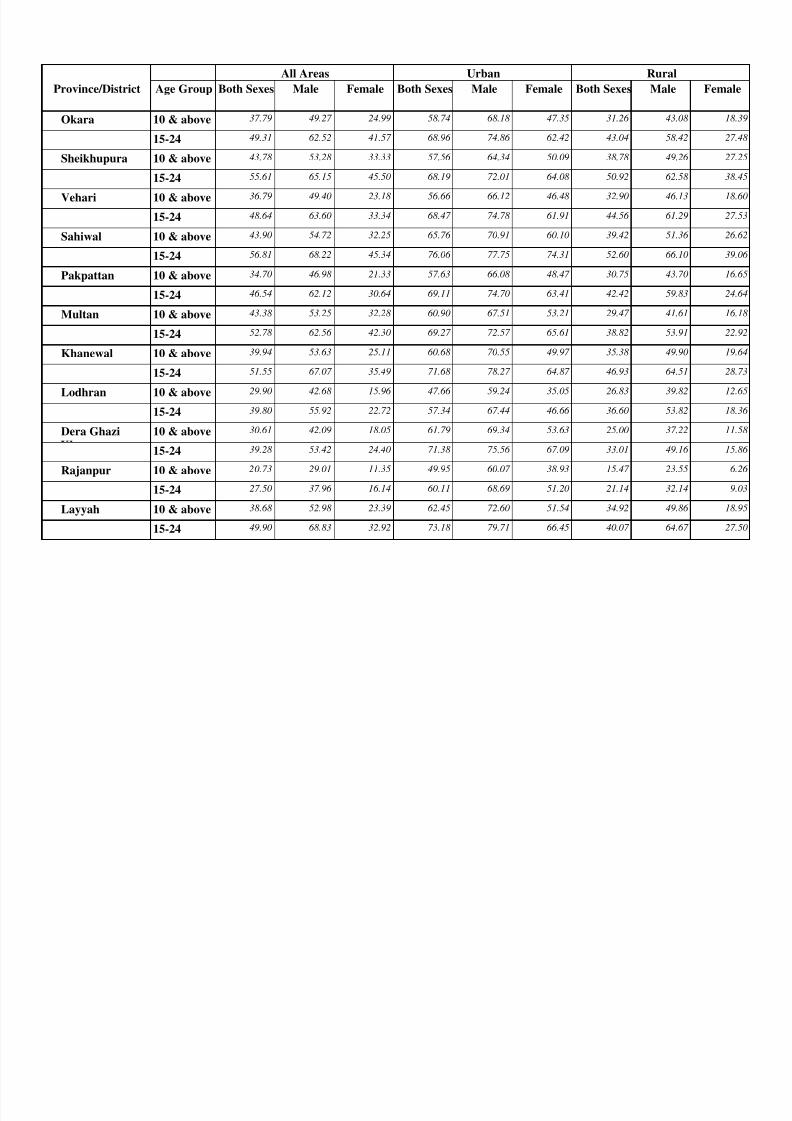
8/18/2019 litracy rate trends pakistan
http://slidepdf.com/reader/full/litracy-rate-trends-pakistan 99/155
10 & above 43.78 53.28 33.33 57.56 64.34 50.09 38.78 49.26 27.25
15-24 55.61 65.15 45.50 68.19 72.01 64.08 50.92 62.58 38.45
10 & above 36.79 49.40 23.18 56.66 66.12 46.48 32.90 46.13 18.60
15-24 48.64 63.60 33.34 68.47 74.78 61.91 44.56 61.29 27.53
10 & above 43.90 54.72 32.25 65.76 70.91 60.10 39.42 51.36 26.62
15-24 56.81 68.22 45.34 76.06 77.75 74.31 52.60 66.10 39.06
10 & above 34.70 46.98 21.33 57.63 66.08 48.47 30.75 43.70 16.65
15-24 46.54 62.12 30.64 69.11 74.70 63.41 42.42 59.83 24.64
10 & above 43.38 53.25 32.28 60.90 67.51 53.21 29.47 41.61 16.18
15-24 52.78 62.56 42.30 69.27 72.57 65.61 38.82 53.91 22.92
10 & above 39.94 53.63 25.11 60.68 70.55 49.97 35.38 49.90 19.64
15-24 51.55 67.07 35.49 71.68 78.27 64.87 46.93 64.51 28.73
10 & above 29.90 42.68 15.96 47.66 59.24 35.05 26.83 39.82 12.65
15-24 39.80 55.92 22.72 57.34 67.44 46.66 36.60 53.82 18.36
10 & above 30.61 42.09 18.05 61.79 69.34 53.63 25.00 37.22 11.58
15-24 39.28 53.42 24.40 71.38 75.56 67.09 33.01 49.16 15.86
10 & above 20.73 29.01 11.35 49.95 60.07 38.93 15.47 23.55 6.26
15-24 27.50 37.96 16.14 60.11 68.69 51.20 21.14 32.14 9.03
10 & above 38.68 52.98 23.39 62.45 72.60 51.54 34.92 49.86 18.95
15-24 49.90 68.83 32.92 73.18 79.71 66.45 40.07 64.67 27.50
Vehari
Sahiwal
Sheikhupura
Khanewal
Pakpattan
Multan
Layyah
Lodhran
Dera Ghazi
Rajanpur
Province/District Both Sexes Male Female Both Sexes Male Female Both Sexes Male Female
10 & above 28.45 40.87 14.77 55.53 64.83 44.92 24.12 36.96 10.05Muzaffargarh
Age Group
All Areas Urban Rural
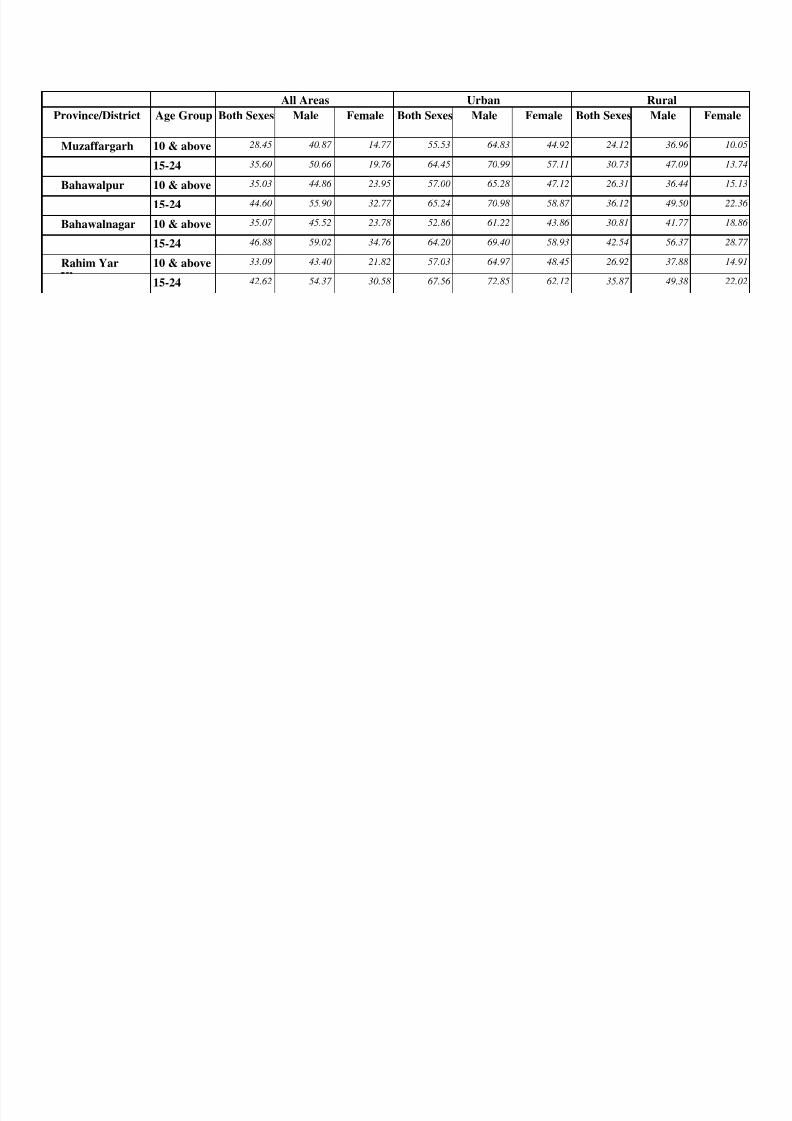
8/18/2019 litracy rate trends pakistan
http://slidepdf.com/reader/full/litracy-rate-trends-pakistan 100/155
15-24 35.60 50.66 19.76 64.45 70.99 57.11 30.73 47.09 13.74
10 & above 35.03 44.86 23.95 57.00 65.28 47.12 26.31 36.44 15.13
15-24 44.60 55.90 32.77 65.24 70.98 58.87 36.12 49.50 22.36
10 & above 35.07 45.52 23.78 52.86 61.22 43.86 30.81 41.77 18.86
15-24 46.88 59.02 34.76 64.20 69.40 58.93 42.54 56.37 28.77
10 & above 33.09 43.40 21.82 57.03 64.97 48.45 26.92 37.88 14.91
15-24 42.62 54.37 30.58 67.56 72.85 62.12 35.87 49.38 22.02
Bahawalnagar
Rahim Yar
g
Bahawalpur
Table VII-D
District-wise Rate of Literacy by Sex & Urban and
Rural areas of Balochistan
B l hi t1998
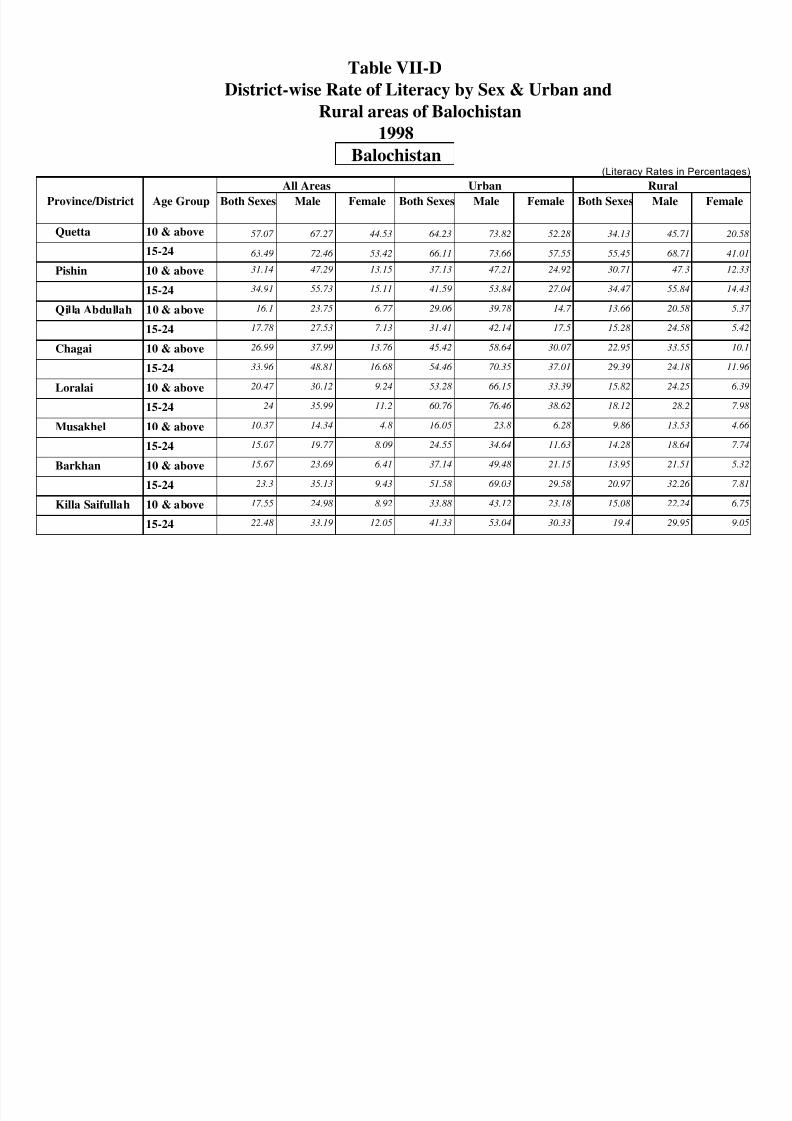
8/18/2019 litracy rate trends pakistan
http://slidepdf.com/reader/full/litracy-rate-trends-pakistan 101/155
Province/District Age Group Both Sexes Male Female Both Sexes Male Female Both Sexes Male Female
Quetta 10 & above 57.07 67.27 44.53 64.23 73.82 52.28 34.13 45.71 20.58
15-24 63.49 72.46 53.42 66.11 73.66 57.55 55.45 68.71 41.01
Pishin 10 & above 31.14 47.29 13.15 37.13 47.21 24.92 30.71 47.3 12.33
15-24 34.91 55.73 15.11 41.59 53.84 27.04 34.47 55.84 14.43
Qilla Abdullah 10 & above 16.1 23.75 6.77 29.06 39.78 14.7 13.66 20.58 5.37
15-24 17.78 27.53 7.13 31.41 42.14 17.5 15.28 24.58 5.42
Chagai 10 & above 26.99 37.99 13.76 45.42 58.64 30.07 22.95 33.55 10.1
15-24 33.96 48.81 16.68 54.46 70.35 37.01 29.39 24.18 11.96
Loralai 10 & above 20.47 30.12 9.24 53.28 66.15 33.39 15.82 24.25 6.39
15-24 24 35.99 11.2 60.76 76.46 38.62 18.12 28.2 7.98
Musakhel 10 & above 10.37 14.34 4.8 16.05 23.8 6.28 9.86 13.53 4.66
15-24 15.07 19.77 8.09 24.55 34.64 11.63 14.28 18.64 7.74
Barkhan 10 & above 15.67 23.69 6.41 37.14 49.48 21.15 13.95 21.51 5.32
15-24 23.3 35.13 9.43 51.58 69.03 29.58 20.97 32.26 7.81
Killa Saifullah 10 & above 17.55 24.98 8.92 33.88 43.12 23.18 15.08 22.24 6.75
15-24 22.48 33.19 12.05 41.33 53.04 30.33 19.4 29.95 9.05
(Literacy Rates in Percentages)
All Areas Urban
Balochistan
Rural
Province/District Age Group Both Sexes Male Female Both Sexes Male Female Both Sexes Male Female
Zhob 10 & above 16.78 24.53 6.9 47.84 63.37 24.22 10.4 15.8 3.75
15-24 21.12 30.95 9.03 57.72 74.99 31.23 12.73 19.75 4.59
All Areas Urban Rural
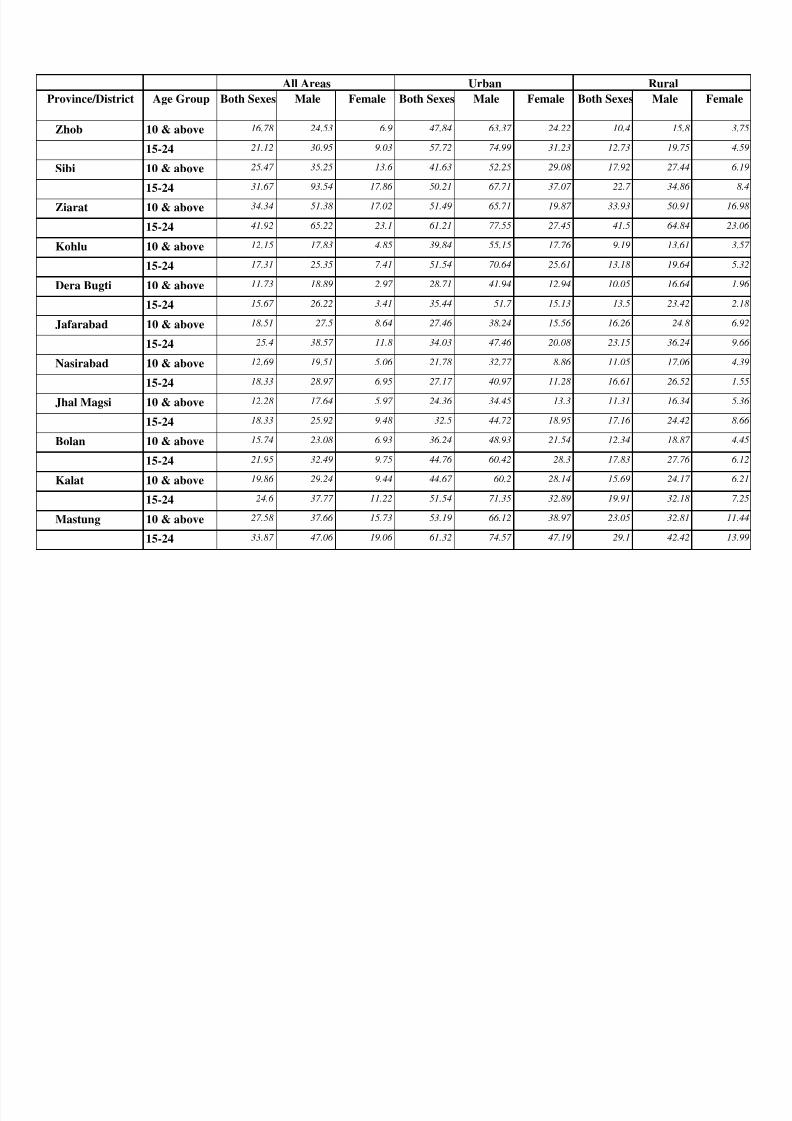
8/18/2019 litracy rate trends pakistan
http://slidepdf.com/reader/full/litracy-rate-trends-pakistan 102/155
Sibi 10 & above 25.47 35.25 13.6 41.63 52.25 29.08 17.92 27.44 6.19
15-24 31.67 93.54 17.86 50.21 67.71 37.07 22.7 34.86 8.4
Ziarat 10 & above 34.34 51.38 17.02 51.49 65.71 19.87 33.93 50.91 16.98
15-24 41.92 65.22 23.1 61.21 77.55 27.45 41.5 64.84 23.06
Kohlu 10 & above 12.15 17.83 4.85 39.84 55.15 17.76 9.19 13.61 3.57
15-24 17.31 25.35 7.41 51.54 70.64 25.61 13.18 19.64 5.32
Dera Bugti 10 & above 11.73 18.89 2.97 28.71 41.94 12.94 10.05 16.64 1.96
15-24 15.67 26.22 3.41 35.44 51.7 15.13 13.5 23.42 2.18
Jafarabad 10 & above 18.51 27.5 8.64 27.46 38.24 15.56 16.26 24.8 6.92
15-24 25.4 38.57 11.8 34.03 47.46 20.08 23.15 36.24 9.66
Nasirabad 10 & above 12.69 19.51 5.06 21.78 32.77 8.86 11.05 17.06 4.39
15-24 18.33 28.97 6.95 27.17 40.97 11.28 16.61 26.52 1.55
Jhal Magsi 10 & above 12.28 17.64 5.97 24.36 34.45 13.3 11.31 16.34 5.36
15-24 18.33 25.92 9.48 32.5 44.72 18.95 17.16 24.42 8.66
Bolan 10 & above 15.74 23.08 6.93 36.24 48.93 21.54 12.34 18.87 4.45
15-24 21.95 32.49 9.75 44.76 60.42 28.3 17.83 27.76 6.12
Kalat 10 & above 19.86 29.24 9.44 44.67 60.2 28.14 15.69 24.17 6.21
15-24 24.6 37.77 11.22 51.54 71.35 32.89 19.91 32.18 7.25
Mastung 10 & above 27.58 37.66 15.73 53.19 66.12 38.97 23.05 32.81 11.44
15-24 33.87 47.06 19.06 61.32 74.57 47.19 29.1 42.42 13.99
Province/District Age Group Both Sexes Male Female Both Sexes Male Female Both Sexes Male Female
Khuzdar 10 & above 17.46 25.33 8.39 30.71 42.01 17.57 12.28 18.77 4.83
15-24 22.34 33.41 10.81 35.91 49.86 21.76 16.48 26.45 6.12
All Areas Urban Rural
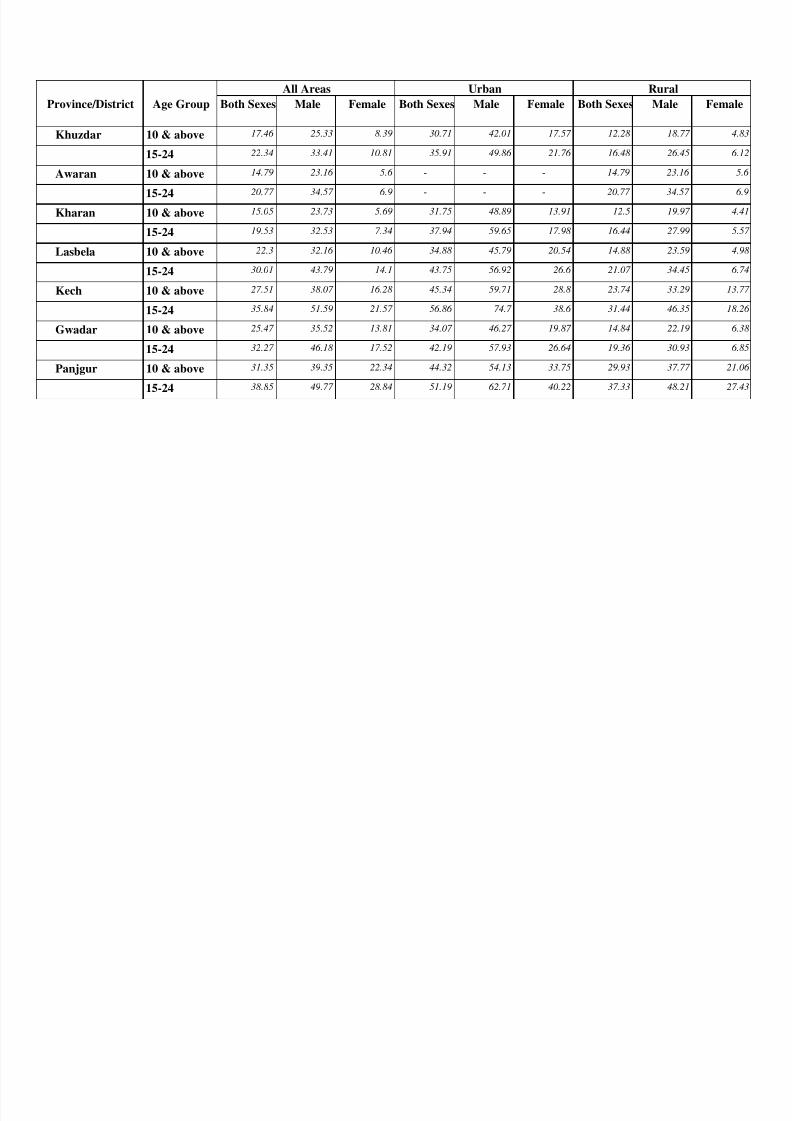
8/18/2019 litracy rate trends pakistan
http://slidepdf.com/reader/full/litracy-rate-trends-pakistan 103/155
15-24 22.34 33.41 10.81 35.91 49.86 21.76 16.48 26.45 6.12
Awaran 10 & above 14.79 23.16 5.6 - - - 14.79 23.16 5.6
15-24 20.77 34.57 6.9 - - - 20.77 34.57 6.9
Kharan 10 & above 15.05 23.73 5.69 31.75 48.89 13.91 12.5 19.97 4.41
15-24 19.53 32.53 7.34 37.94 59.65 17.98 16.44 27.99 5.57
Lasbela 10 & above 22.3 32.16 10.46 34.88 45.79 20.54 14.88 23.59 4.98
15-24 30.01 43.79 14.1 43.75 56.92 26.6 21.07 34.45 6.74
Kech 10 & above 27.51 38.07 16.28 45.34 59.71 28.8 23.74 33.29 13.77
15-24 35.84 51.59 21.57 56.86 74.7 38.6 31.44 46.35 18.26
Gwadar 10 & above 25.47 35.52 13.81 34.07 46.27 19.87 14.84 22.19 6.38
15-24 32.27 46.18 17.52 42.19 57.93 26.64 19.36 30.93 6.85
Panjgur 10 & above 31.35 39.35 22.34 44.32 54.13 33.75 29.93 37.77 21.06
15-24 38.85 49.77 28.84 51.19 62.71 40.22 37.33 48.21 27.43

8/18/2019 litracy rate trends pakistan
http://slidepdf.com/reader/full/litracy-rate-trends-pakistan 104/155
Table VII-CDistrict-wise Rate of Literacy by Sex & Urban and
Rural areas of NWFP
N.W.F.P.1998
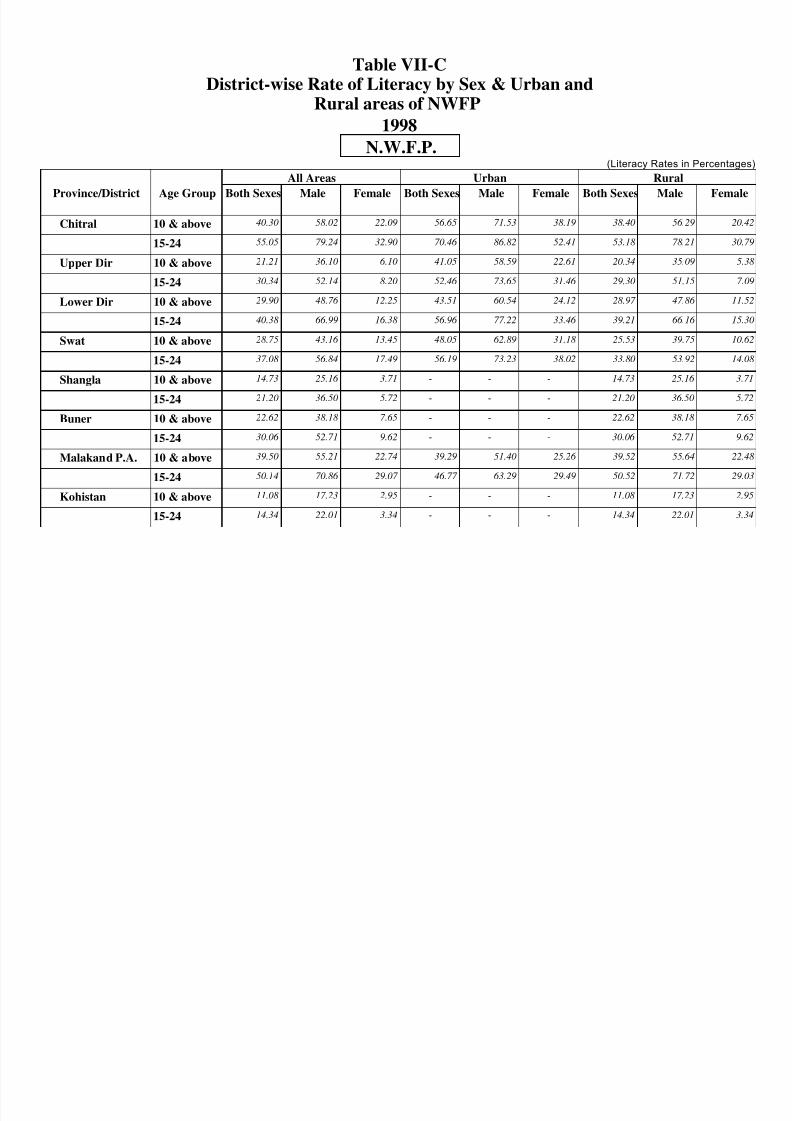
8/18/2019 litracy rate trends pakistan
http://slidepdf.com/reader/full/litracy-rate-trends-pakistan 105/155
Province/District Age Group Both Sexes Male Female Both Sexes Male Female Both Sexes Male Female
Chitral 10 & above 40.30 58.02 22.09 56.65 71.53 38.19 38.40 56.29 20.42
15-24 55.05 79.24 32.90 70.46 86.82 52.41 53.18 78.21 30.79
Upper Dir 10 & above 21.21 36.10 6.10 41.05 58.59 22.61 20.34 35.09 5.38
15-24 30.34 52.14 8.20 52.46 73.65 31.46 29.30 51.15 7.09
Lower Dir 10 & above 29.90 48.76 12.25 43.51 60.54 24.12 28.97 47.86 11.52
15-24 40.38 66.99 16.38 56.96 77.22 33.46 39.21 66.16 15.30
Swat 10 & above 28.75 43.16 13.45 48.05 62.89 31.18 25.53 39.75 10.62
15-24 37.08 56.84 17.49 56.19 73.23 38.02 33.80 53.92 14.08
Shangla 10 & above 14.73 25.16 3.71 - - - 14.73 25.16 3.71
15-24 21.20 36.50 5.72 - - - 21.20 36.50 5.72
Buner 10 & above 22.62 38.18 7.65 - - - 22.62 38.18 7.65
15-24 30.06 52.71 9.62 - - - 30.06 52.71 9.62
Malakand P.A. 10 & above 39.50 55.21 22.74 39.29 51.40 25.26 39.52 55.64 22.48
15-24 50.14 70.86 29.07 46.77 63.29 29.49 50.52 71.72 29.03
Kohistan 10 & above 11.08 17.23 2.95 - - - 11.08 17.23 2.95
15-24 14.34 22.01 3.34 - - - 14.34 22.01 3.34
(Literacy Rates in Percentages)
All Areas Urban Rural
Province/District Age Group Both Sexes Male Female Both Sexes Male Female Both Sexes Male Female
Mansehra 10 & above 36.32 50.90 22.71 68.49 76.74 59.65 34.87 49.24 20.65
15-24 46.53 65.56 30.79 80.25 85.62 74.88 44.40 64.14 28.27
Batagram 10 & above 18.31 29.40 6.48 - - -
18.31 29.40 6.48
15 24 24 44 40 69 7 92 24 44 40 69 7 92
All Areas Urban Rural
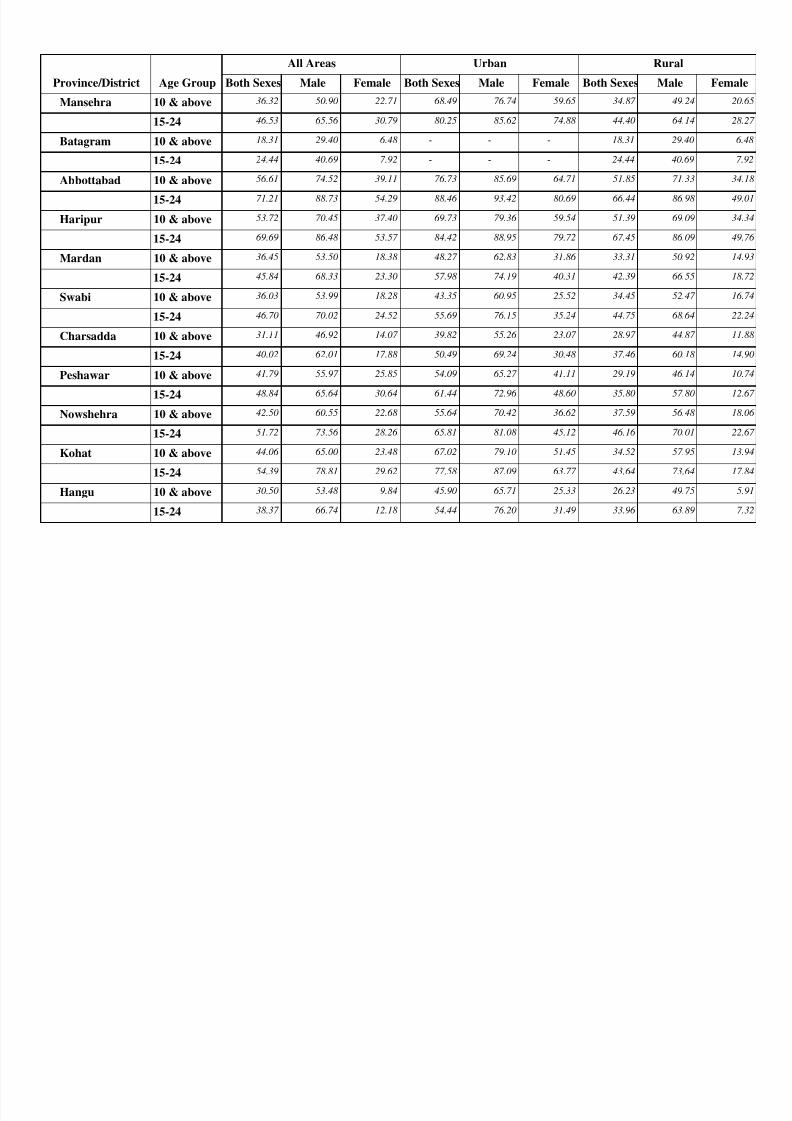
8/18/2019 litracy rate trends pakistan
http://slidepdf.com/reader/full/litracy-rate-trends-pakistan 106/155
15-24 24.44 40.69 7.92 - - - 24.44 40.69 7.92
Abbottabad 10 & above 56.61 74.52 39.11 76.73 85.69 64.71 51.85 71.33 34.18
15-24 71.21 88.73 54.29 88.46 93.42 80.69 66.44 86.98 49.01
Haripur 10 & above 53.72 70.45 37.40 69.73 79.36 59.54 51.39 69.09 34.34
15-24 69.69 86.48 53.57 84.42 88.95 79.72 67.45 86.09 49.76
Mardan 10 & above 36.45 53.50 18.38 48.27 62.83 31.86 33.31 50.92 14.93
15-24 45.84 68.33 23.30 57.98 74.19 40.31 42.39 66.55 18.72
Swabi 10 & above 36.03 53.99 18.28 43.35 60.95 25.52 34.45 52.47 16.74
15-24 46.70 70.02 24.52 55.69 76.15 35.24 44.75 68.64 22.24
Charsadda 10 & above 31.11 46.92 14.07 39.82 55.26 23.07 28.97 44.87 11.88
15-24 40.02 62.01 17.88 50.49 69.24 30.48 37.46 60.18 14.90
Peshawar 10 & above 41.79 55.97 25.85 54.09 65.27 41.11 29.19 46.14 10.74
15-24 48.84 65.64 30.64 61.44 72.96 48.60 35.80 57.80 12.67
Nowshehra 10 & above 42.50 60.55 22.68 55.64 70.42 36.62 37.59 56.48 18.06
15-24 51.72 73.56 28.26 65.81 81.08 45.12 46.16 70.01 22.67
Kohat 10 & above 44.06 65.00 23.48 67.02 79.10 51.45 34.52 57.95 13.94
15-24 54.39 78.81 29.62 77.58 87.09 63.77 43.64 73.64 17.84
Hangu 10 & above 30.50 53.48 9.84 45.90 65.71 25.33 26.23 49.75 5.91
15-24 38.37 66.74 12.18 54.44 76.20 31.49 33.96 63.89 7.32
Province/District Age Group Both Sexes Male Female Both Sexes Male Female Both Sexes Male Female
Karak 10 & above 41.92 68.15 18.12 53.84 75.59 31.78 41.07 67.59 17.20
15-24 54.00 86.08 25.28 65.19 87.81 43.50 53.18 85.95 23.97
Bannu 10 & above 32.11 50.79 12.18 60.47 72.25 45.05 29.63 48.71 9.62
15-24 39 02 62 43 15 80 68 41 78 55 56 59 36 51 60 93 12 58
All Areas Urban Rural
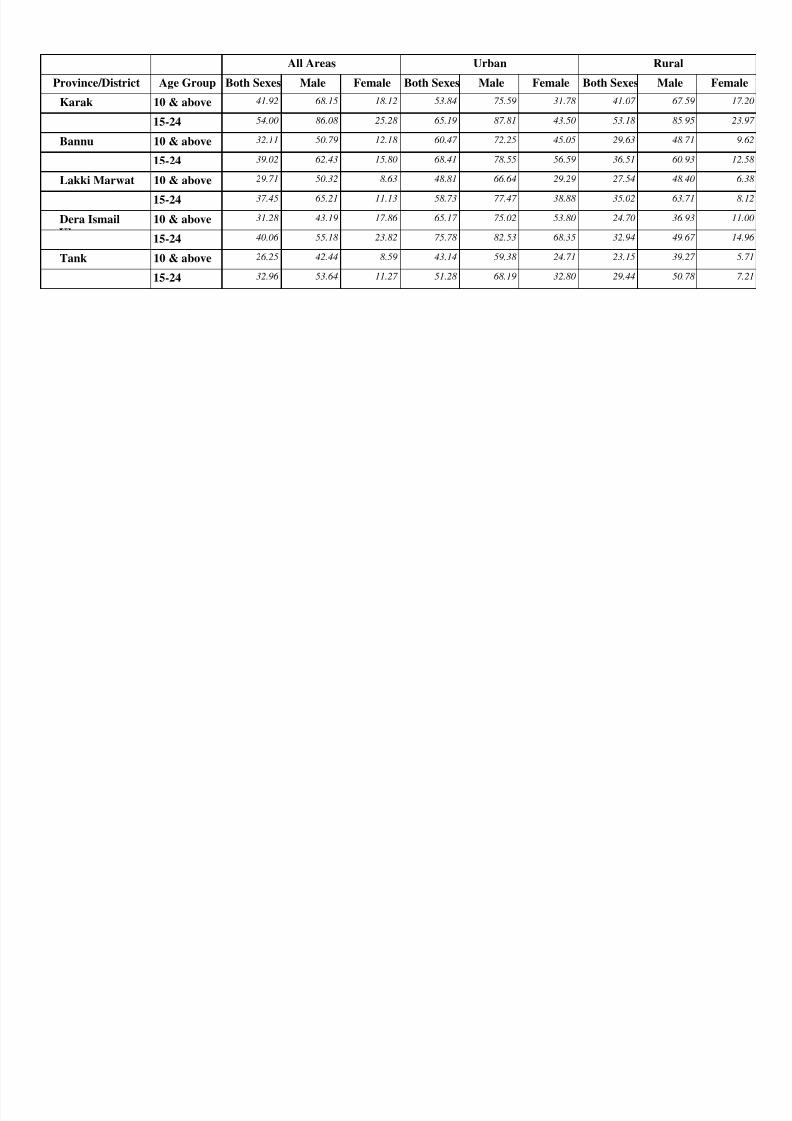
8/18/2019 litracy rate trends pakistan
http://slidepdf.com/reader/full/litracy-rate-trends-pakistan 107/155
15-24 39.02 62.43 15.80 68.41 78.55 56.59 36.51 60.93 12.58
Lakki Marwat 10 & above 29.71 50.32 8.63 48.81 66.64 29.29 27.54 48.40 6.38
15-24 37.45 65.21 11.13 58.73 77.47 38.88 35.02 63.71 8.12
Dera Ismail 10 & above 31.28 43.19 17.86 65.17 75.02 53.80 24.70 36.93 11.00
15-24 40.06 55.18 23.82 75.78 82.53 68.35 32.94 49.67 14.96
Tank 10 & above 26.25 42.44 8.59 43.14 59.38 24.71 23.15 39.27 5.71
15-24 32.96 53.64 11.27 51.28 68.19 32.80 29.44 50.78 7.21
Table VII-E
Literacy Rates by Sex & Urban and RuralAreas of Islamabad
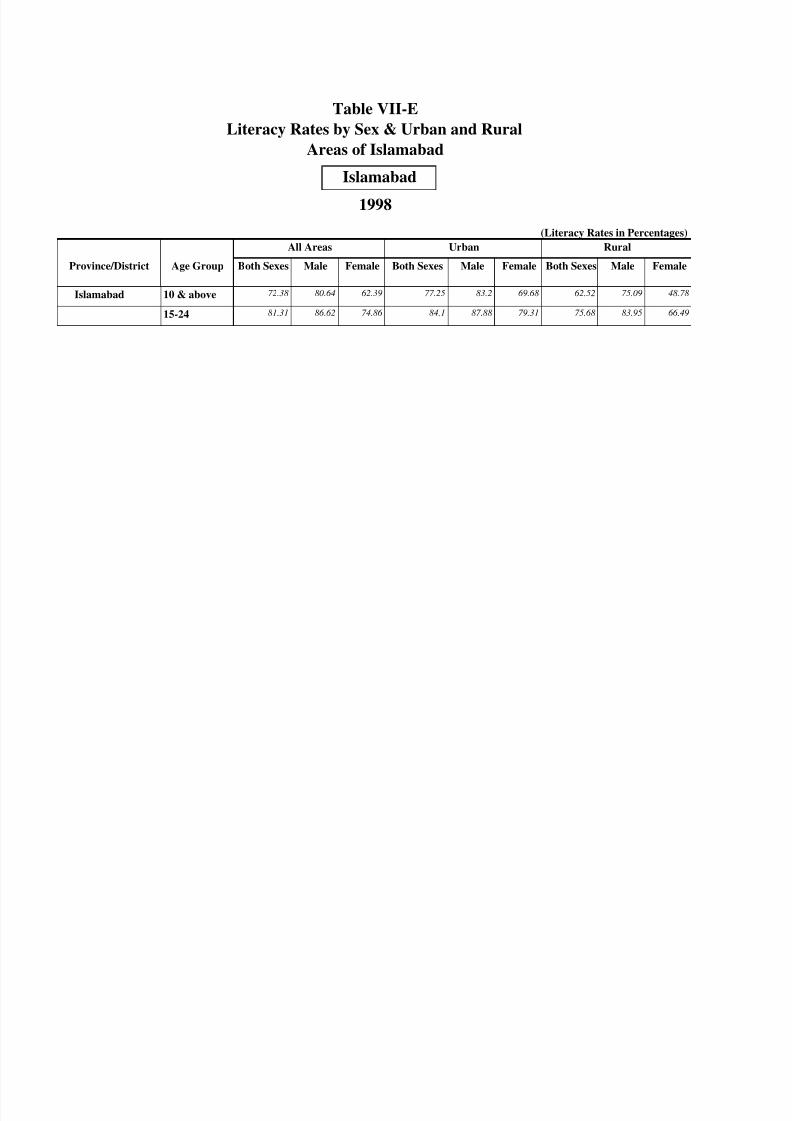
8/18/2019 litracy rate trends pakistan
http://slidepdf.com/reader/full/litracy-rate-trends-pakistan 108/155
Province/District Both Sexes Male Female Both Sexes Male Female Both Sexes Male FemaleAge Group
1998
(Literacy Rates in Percentages)
All Areas Urban Rural
Islamabad
10 & above 72.38 80.64 62.39 77.25 83.2 69.68 62.52 75.09 48.78
15-24 81.31 86.62 74.86 84.1 87.88 79.31 75.68 83.95 66.49
Islamabad
District-wise Rate of Literacy by Sex & Urban andTable VII-B
1998
Rural areas of Sindh
Sindh
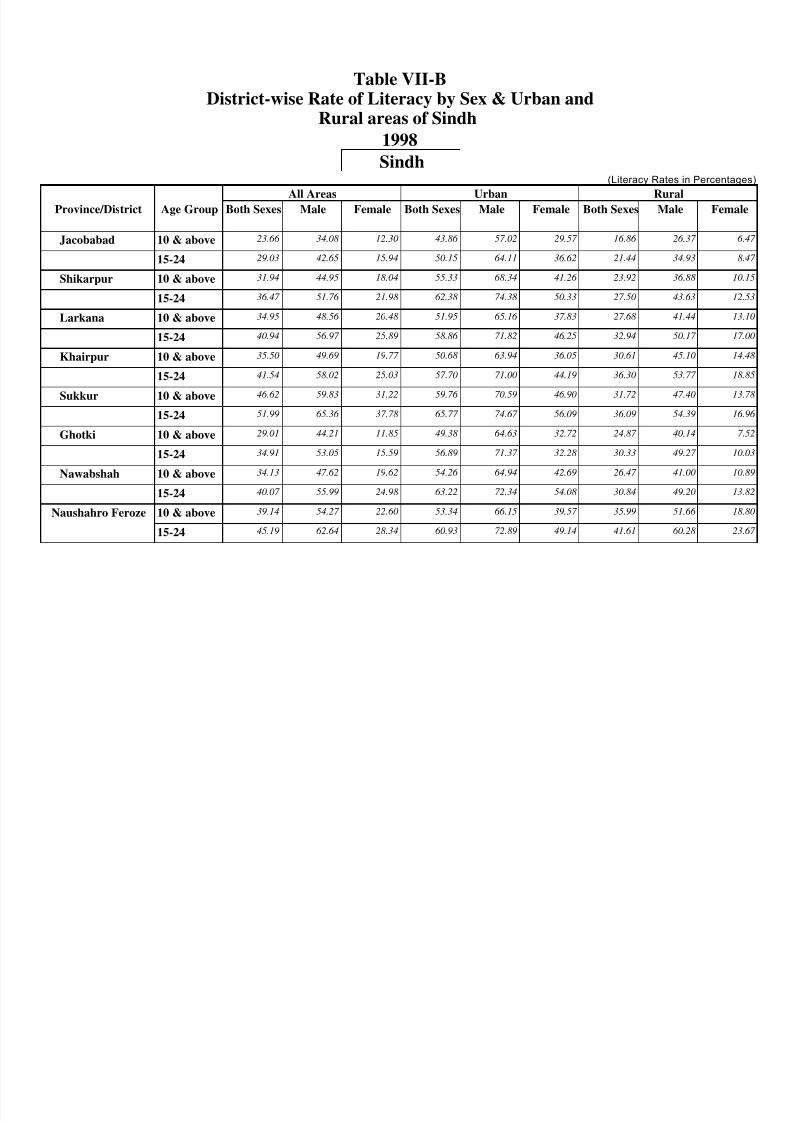
8/18/2019 litracy rate trends pakistan
http://slidepdf.com/reader/full/litracy-rate-trends-pakistan 109/155
Province/District Both Sexes Male Female Both Sexes Male Female Both Sexes Male Female
10 & above 23.66 34.08 12.30 43.86 57.02 29.57 16.86 26.37 6.47
15-24 29.03 42.65 15.94 50.15 64.11 36.62 21.44 34.93 8.47
10 & above 31.94 44.95 18.04 55.33 68.34 41.26 23.92 36.88 10.15
15-24 36.47 51.76 21.98 62.38 74.38 50.33 27.50 43.63 12.53
10 & above 34.95 48.56 20.48 51.95 65.16 37.83 27.68 41.44 13.10
15-24 40.94 56.97 25.89 58.86 71.82 46.25 32.94 50.17 17.00
10 & above 35.50 49.69 19.77 50.68 63.94 36.05 30.61 45.10 14.48
15-24 41.54 58.02 25.03 57.70 71.00 44.19 36.30 53.77 18.85
10 & above 46.62 59.83 31.22 59.76 70.59 46.90 31.72 47.40 13.78
15-24 51.99 65.36 37.78 65.77 74.67 56.09 36.09 54.39 16.96
10 & above 29.01 44.21 11.85 49.38 64.63 32.72 24.87 40.14 7.52
15-24 34.91 53.05 15.59 56.89 71.37 32.28 30.33 49.27 10.03
10 & above 34.13 47.62 19.62 54.26 64.94 42.69 26.47 41.00 10.89
15-24 40.07 55.99 24.98 63.22 72.34 54.08 30.84 49.20 13.82
10 & above 39.14 54.27 22.60 53.34 66.15 39.57 35.99 51.66 18.80
15-24 45.19 62.64 28.34 60.93 72.89 49.14 41.61 60.28 23.67
Naushahro Feroze
Sukkur
Ghotki
Nawabshah
Shikarpur
Larkana
Khairpur
Sindh
Rural
Jacobabad
Age Group
All Areas Urban
(Literacy Rates in Percentages)
Province/District Both Sexes Male Female Both Sexes Male Female Both Sexes Male Female
10 & above 35.56 48.03 21.65 54.30 66.60 41.11 30.34 42.98 16.08
15-24 40.86 54.29 27.57 60.56 72.02 49.82 35.12 49.30 20.88
10 & b 44 25 52 63 34 97 61 30 67 32 54 58 24 84 35 76 12 89
Dadu
Age Group
All Areas Urban Rural
H d b d
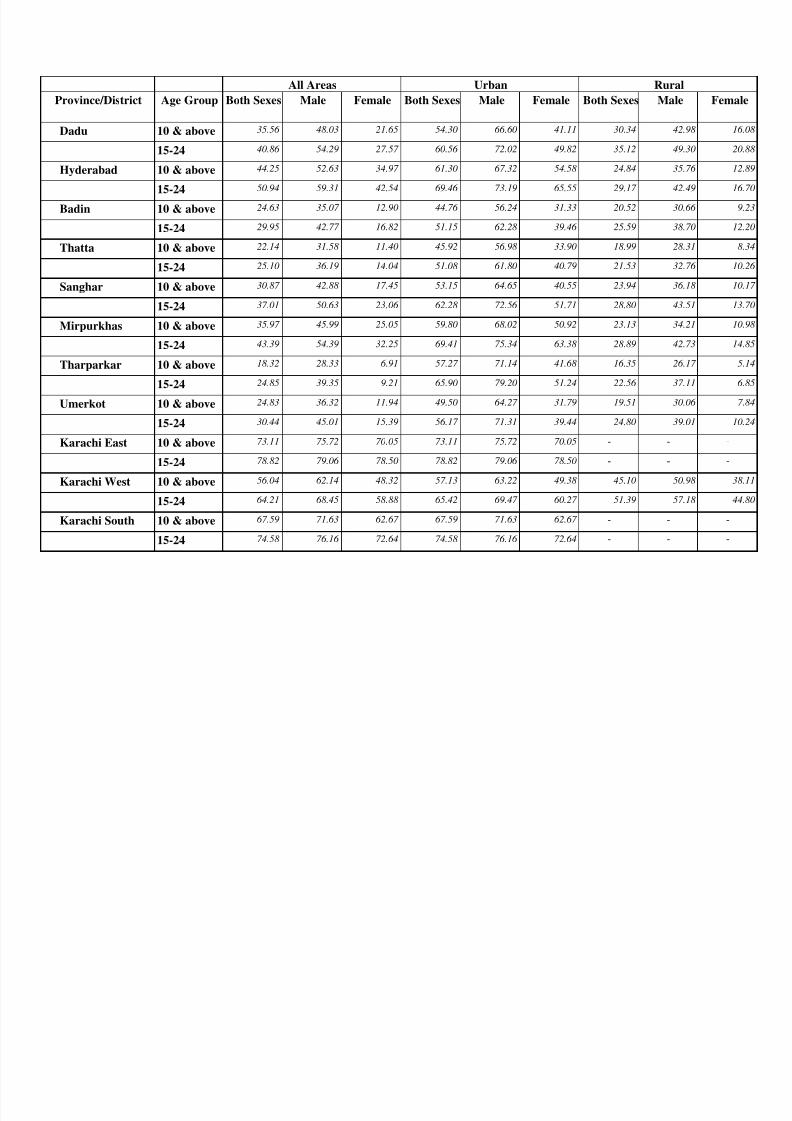
8/18/2019 litracy rate trends pakistan
http://slidepdf.com/reader/full/litracy-rate-trends-pakistan 110/155
10 & above 44.25 52.63 34.97 61.30 67.32 54.58 24.84 35.76 12.89
15-24 50.94 59.31 42.54 69.46 73.19 65.55 29.17 42.49 16.70
10 & above 24.63 35.07 12.90 44.76 56.24 31.33 20.52 30.66 9.23
15-24 29.95 42.77 16.82 51.15 62.28 39.46 25.59 38.70 12.20
10 & above 22.14 31.58 11.40 45.92 56.98 33.90 18.99 28.31 8.34
15-24 25.10 36.19 14.04 51.08 61.80 40.79 21.53 32.76 10.26
10 & above 30.87 42.88 17.45 53.15 64.65 40.55 23.94 36.18 10.17
15-24 37.01 50.63 23.06 62.28 72.56 51.71 28.80 43.51 13.70
10 & above 35.97 45.99 25.05 59.80 68.02 50.92 23.13 34.21 10.98
15-24 43.39 54.39 32.25 69.41 75.34 63.38 28.89 42.73 14.85
10 & above 18.32 28.33 6.91 57.27 71.14 41.68 16.35 26.17 5.14
15-24 24.85 39.35 9.21 65.90 79.20 51.24 22.56 37.11 6.85
10 & above 24.83 36.32 11.94 49.50 64.27 31.79 19.51 30.06 7.84
15-24 30.44 45.01 15.39 56.17 71.31 39.44 24.80 39.01 10.24
10 & above 73.11 75.72 70.05 73.11 75.72 70.05 - - -
15-24 78.82 79.06 78.50 78.82 79.06 78.50 - - -
10 & above 56.04 62.14 48.32 57.13 63.22 49.38 45.10 50.98 38.11
15-24 64.21 68.45 58.88 65.42 69.47 60.27 51.39 57.18 44.80
10 & above 67.59 71.63 62.67 67.59 71.63 62.67 - - -
15-24 74.58 76.16 72.64 74.58 76.16 72.64 - - -
Karachi South
Umerkot
Karachi East
Mirpurkhas
Tharparkar
Thatta
Karachi West
Sanghar
Badin
Hyderabad
Province/District Both Sexes Male Female Both Sexes Male Female Both Sexes Male Female
10 & above 76.00 77.83 73.92 76.00 77.83 73.92 - - -
15 24 81 17 80 56 81 82 81 17 80 56 81 82
Karachi Central
Age Group
All Areas Urban Rural
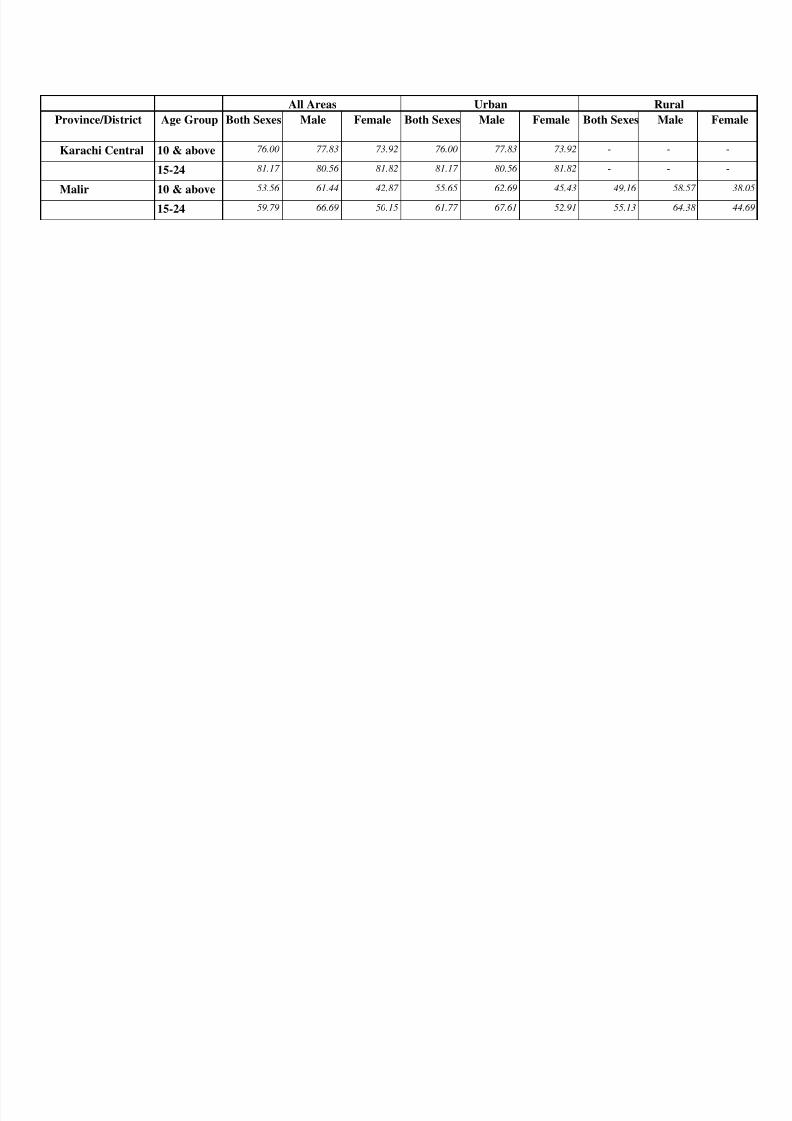
8/18/2019 litracy rate trends pakistan
http://slidepdf.com/reader/full/litracy-rate-trends-pakistan 111/155
15-24 81.17 80.56 81.82 81.17 80.56 81.82 - - -
10 & above 53.56 61.44 42.87 55.65 62.69 45.43 49.16 58.57 38.05
15-24 59.79 66.69 50.15 61.77 67.61 52.91 55.13 64.38 44.69
Malir
Table VIII-A
1998
Linkage between Literacy & FertilityProvince-wise and District-wise Rates of Literacy & Fertility
Illit t Lit t M t i & b D & b
(Literacy Rates in Percentages)
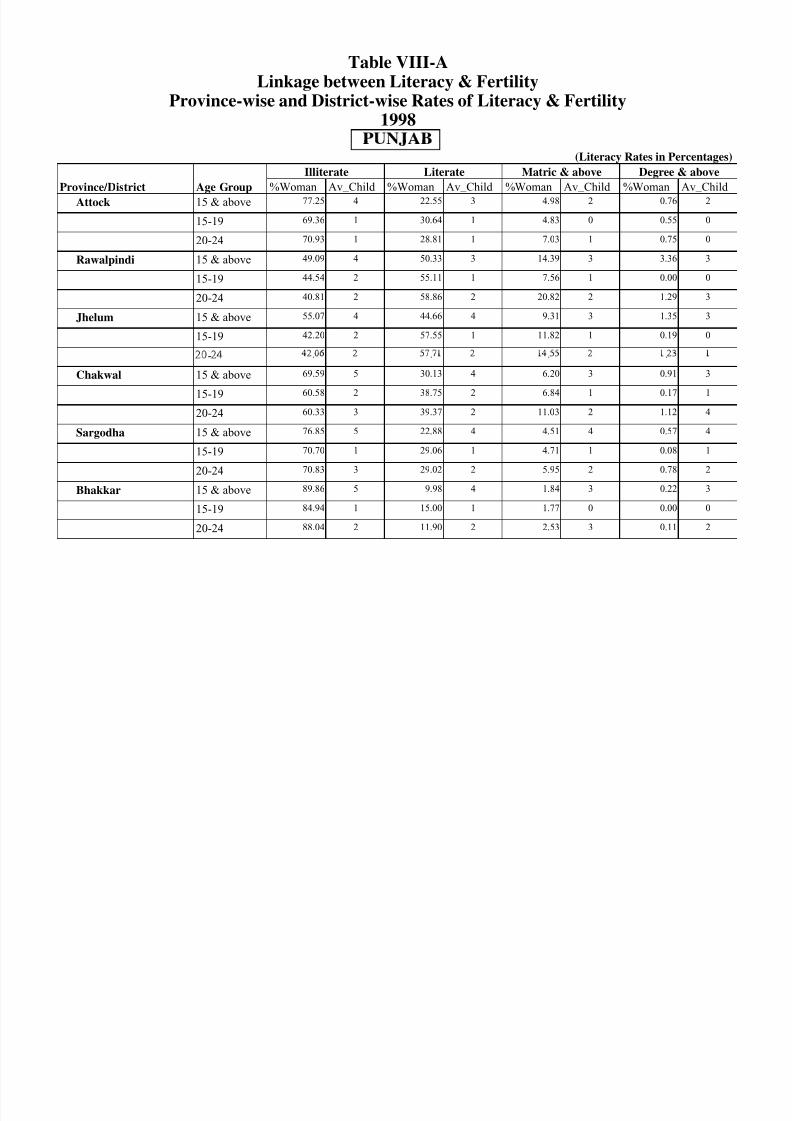
8/18/2019 litracy rate trends pakistan
http://slidepdf.com/reader/full/litracy-rate-trends-pakistan 112/155
Province/District Age Group %Woman %Woman Av_Child %Woman Av_Child %Woman Av_Child
Attock 15 & above 4 22.55 3 4.98 2 0.76 2
Illiterate Literate Matric & above Degree & above
Av_Child
77.25
15-19 1 30.64 1 4.83 0 0.55 0
20-24 1 28.81 1 7.03 1 0.75 0
Rawalpindi 15 & above 4 50.33 3 14.39 3 3.36 3
15-19 2 55.11 1 7.56 1 0.00 0
69.36
70.93
49.09
44.54
20-24 2 58.86 2 20.82 2 1.29 3
Jhelum 15 & above 4 44.66 4 9.31 3 1.35 3
15-19 2 57.55 1 11.82 1 0.19 0
40.81
55.07
42.20
- . . .
Chakwal 15 & above 5 30.13 4 6.20 3 0.91 3
15-19 2 38.75 2 6.84 1 0.17 1
20-24 3 39.37 2 11.03 2 1.12 4
60.58
60.33
.
69.59
Sargodha 15 & above 5 22.88 4 4.51 4 0.57 4
15-19 1 29.06 1 4.71 1 0.08 1
20-24 3 29.02 2 5.95 2 0.78 2
Bhakkar 15 & above 5 9.98 4 1.84 3 0.22 3
76.85
70.70
70.83
89.86
15-19 1 15.00 1 1.77 0 0.00 0
20-24 2 11.90 2 2.53 3 0.11 2
84.94
88.04
Literate Matric & above Degree & aboveIlliterate
Province/District Age Group %Woman %Woman Av_Child %Woman Av_Child %Woman Av_Child
Khushab 15 & above 4 13.27 3 2.74 3 0.53 3
15-19 2 21.49 1 2.96 1 0.00 0
20-24 2 16.31 2 3.42 1 0.49 2
86.36
78.51
83.20
Av_Child
Mianwali 15 & above 5 12.89 4 3.36 3 0.51 3
15-19 2 15.36 2 3.18 2 0.41 0
86.89
84.30
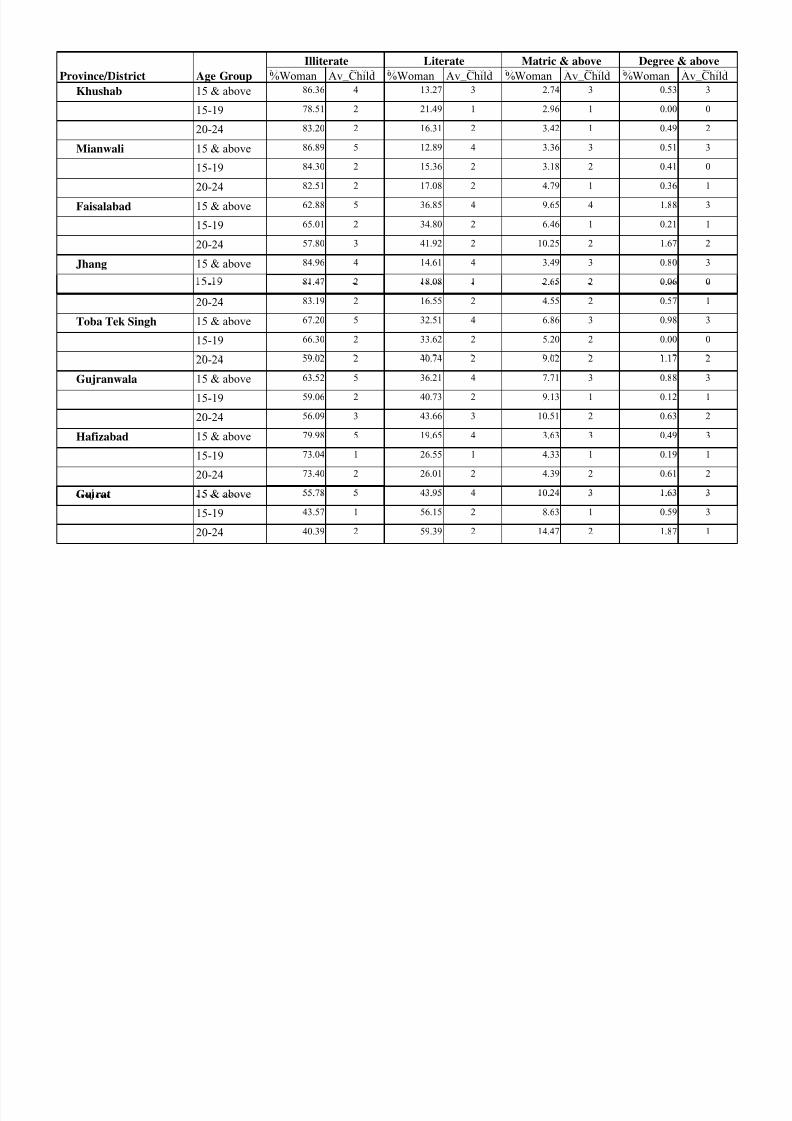
8/18/2019 litracy rate trends pakistan
http://slidepdf.com/reader/full/litracy-rate-trends-pakistan 113/155
15 19
20-24 2 17.08 2 4.79 1 0.36 1
Faisalabad 15 & above 5 36.85 4 9.65 4 1.88 3
82.51
62.88
15-19 2 34.80 2 6.46 1 0.21 1
20-24 3 41.92 2 10.25 2 1.67 2
Jhang 15 & above 4 14.61 4 3.49 3 0.80 3
- 2 18.08 1 2.65 2 0.06 0
65.01
57.80
84.96
81.47- . . .
20-24 2 16.55 2 4.55 2 0.57 1
Toba Tek Singh 15 & above 5 32.51 4 6.86 3 0.98 3
15-19 2 33.62 2 5.20 2 0.00 0
67.20
66.30
83.19
.
20-24 2 40.74 2 9.02 2 1.17 2
Gujranwala 15 & above 5 36.21 4 7.71 3 0.88 3
15-19 2 40.73 2 9.13 1 0.12 1
20-24 3 43.66 3 10.51 2 0.63 2
59.02
63.52
59.06
56.09
Hafizabad 15 & above 5 19.65 4 3.63 3 0.49 3
15-19 1 26.55 1 4.33 1 0.19 1
20-24 2 26.01 2 4.39 2 0.61 2
Gu rat 15 & above 5 43.95 4 10.24 3 1.63 3
79.98
73.04
73.40
55.78 . . .
15-19 1 56.15 2 8.63 1 0.59 3
20-24 2 59.39 2 14.47 2 1.87 1
.
43.57
40.39
Literate Matric & above Degree & aboveIlliterate
Province/District Age Group %Woman %Woman Av_Child %Woman Av_Child %Woman Av_Child
Mandi Bahauddin 15 & above 5 24.23 4 3.99 3 0.55 4
15-19 1 30.84 1 2.87 1 0.00 0
20-24 2 36.09 2 6.81 1 0.54 2
Av_Child
63.85
75.62
69.16
Sialkot 15 & above 6 45.29 4 32.40 5 1.45 4
15-19 1 58.78 1 12.53 1 0.39 1
54.50
41.07
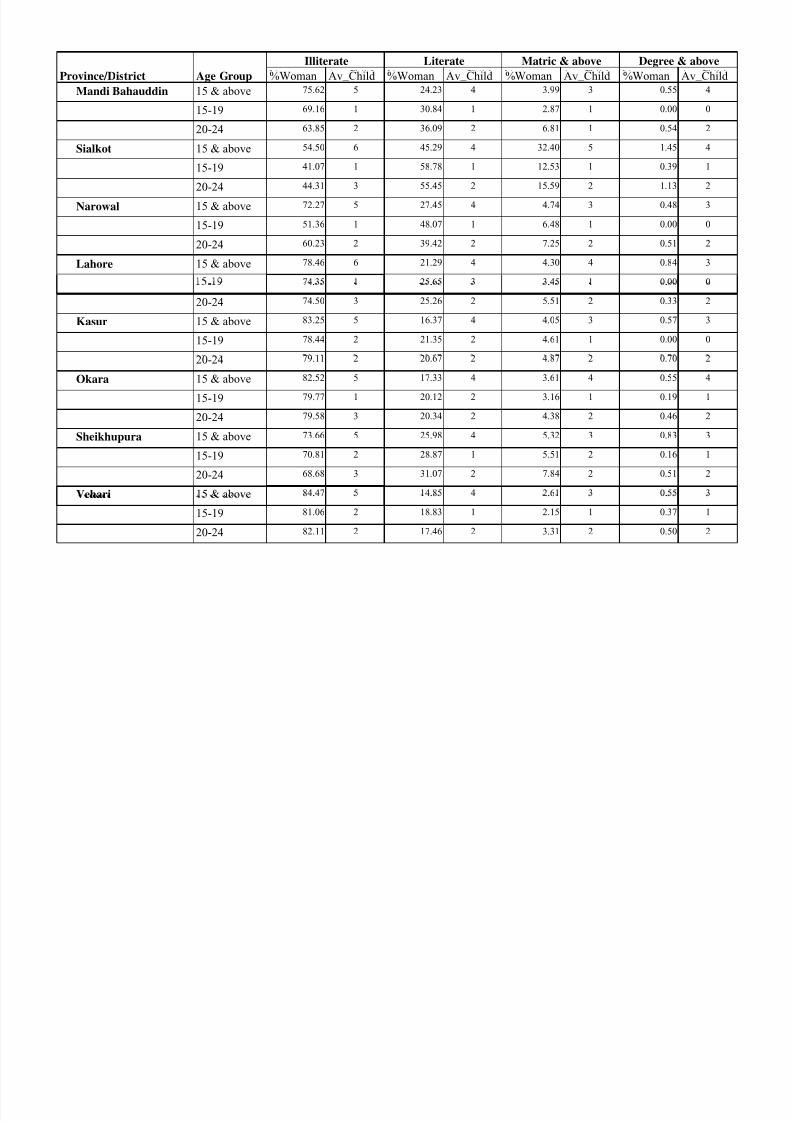
8/18/2019 litracy rate trends pakistan
http://slidepdf.com/reader/full/litracy-rate-trends-pakistan 114/155
20-24 3 55.45 2 15.59 2 1.13 2
Narowal 15 & above 5 27.45 4 4.74 3 0.48 3
44.31
72.27
15-19 1 48.07 1 6.48 1 0.00 0
20-24 2 39.42 2 7.25 2 0.51 2
Lahore 15 & above 6 21.29 4 4.30 4 0.84 3
- 1 25.65 3 3.45 1 0.00 0
78.46
74.35
51.36
60.23
- . . .
20-24 3 25.26 2 5.51 2 0.33 2
Kasur 15 & above 5 16.37 4 4.05 3 0.57 3
15-19 2 21.35 2 4.61 1 0.00 0
.
74.50
83.25
78.44
20-24 2 20.67 2 4.87 2 0.70 2
Okara 15 & above 5 17.33 4 3.61 4 0.55 4
15-19 1 20.12 2 3.16 1 0.19 1
20-24 3 20.34 2 4.38 2 0.46 279.58
79.11
82.52
79.77
Sheikhupura 15 & above 5 25.98 4 5.32 3 0.83 3
15-19 2 28.87 1 5.51 2 0.16 1
20-24 3 31.07 2 7.84 2 0.51 2
Vehari 15 & above 5 14.85 4 2.61 3 0.55 3
73.66
70.81
68.68
84.47 . . .
15-19 2 18.83 1 2.15 1 0.37 1
20-24 2 17.46 2 3.31 2 0.50 2
.
81.06
82.11

8/18/2019 litracy rate trends pakistan
http://slidepdf.com/reader/full/litracy-rate-trends-pakistan 115/155
Degree & aboveIlliterate Literate Matric & above
Province/District Age Group %Woman %Woman Av_Child %Woman Av_Child %Woman Av_Child
Muzaffargarh 15 & above 5 9.90 5 2.24 4 0.32 3
15-19 2 11.01 2 1.71 1 0.07 0
20-24 3 11.40 3 2.75 2 - -
Av_Child
90.03
88.99
88.47
Bahawalpur 15 & above 5 15.88 4 3.58 3 0.64 3
15-19 2 17.28 1 3.17 1 0.15 1
83.83
82.50
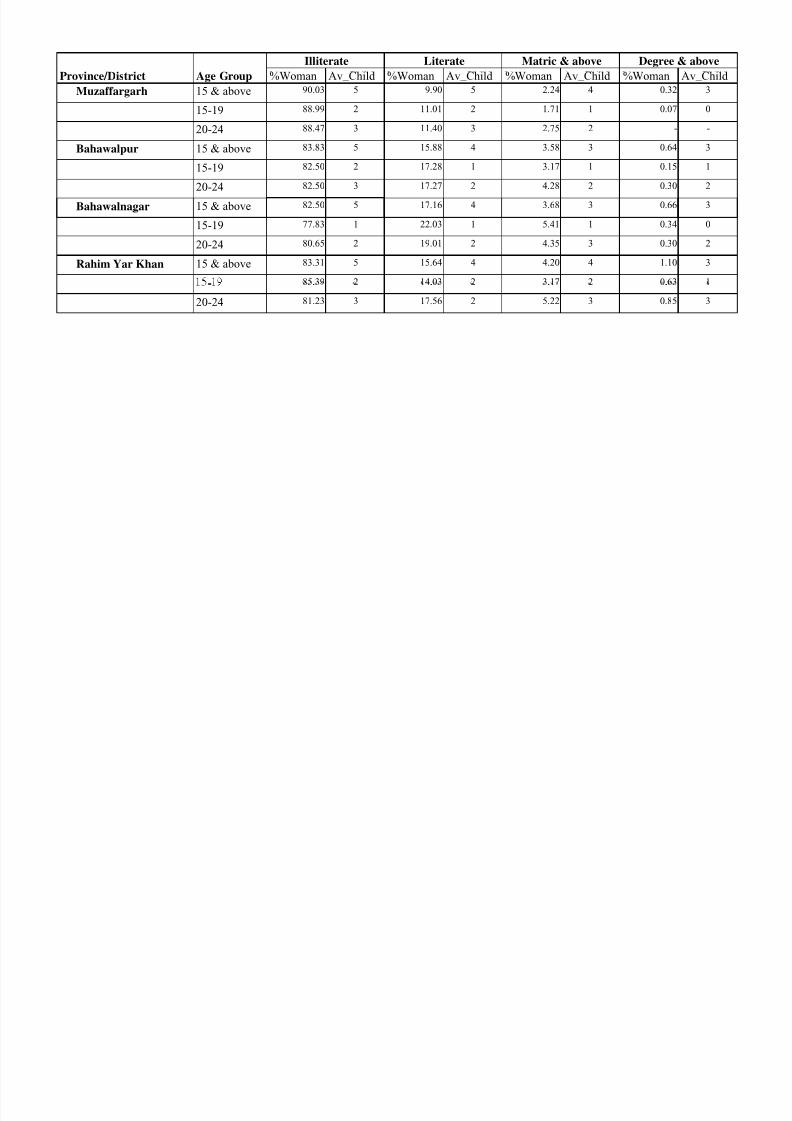
8/18/2019 litracy rate trends pakistan
http://slidepdf.com/reader/full/litracy-rate-trends-pakistan 116/155
20-24 3 17.27 2 4.28 2 0.30 2
Bahawalnagar 15 & above 5 17.16 4 3.68 3 0.66 3
82.50
82.50
15-19 1 22.03 1 5.41 1 0.34 0
20-24 2 19.01 2 4.35 3 0.30 2
Rahim Yar Khan 15 & above 5 15.64 4 4.20 4 1.10 3
- 2 14.03 2 3.17 2 0.63 185.39
77.83
80.65
83.31
- . . .
20-24 3 17.56 2 5.22 3 0.85 3
.
81.23
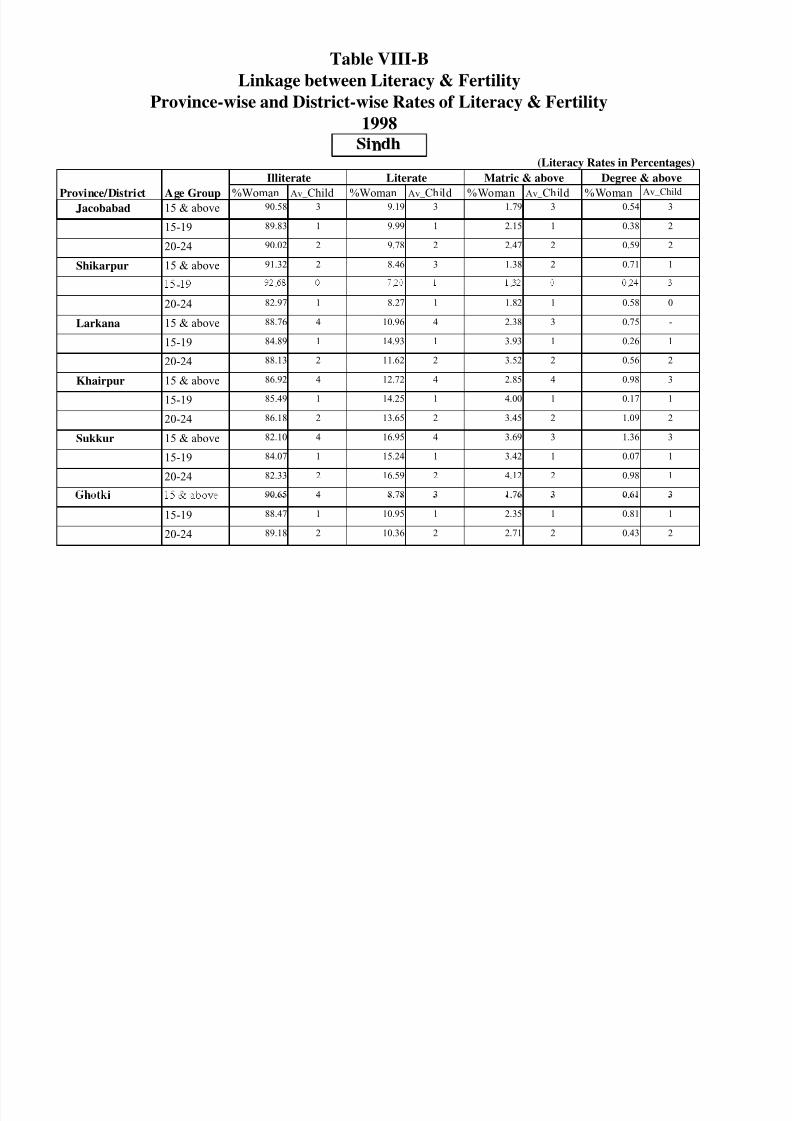
8/18/2019 litracy rate trends pakistan
http://slidepdf.com/reader/full/litracy-rate-trends-pakistan 117/155
Av Child
Literate Matric & above Degree & aboveIlliterate
v_ v_ _
Nawabshah 15 & above 4 11.02 4 2.45 3 1.20 4
15-19 2 14.40 1 3.79 1 0.95 1
20-24 2 12.92 2 3.21 2 1.38 3
88.30
85.24
86.74
v_
aus a ro eroze a ove . . .
15-19 1 13.15 1 2.63 1 0.76 1
20 24 2 13 57 2 2 94 3
.
86.54
86 03
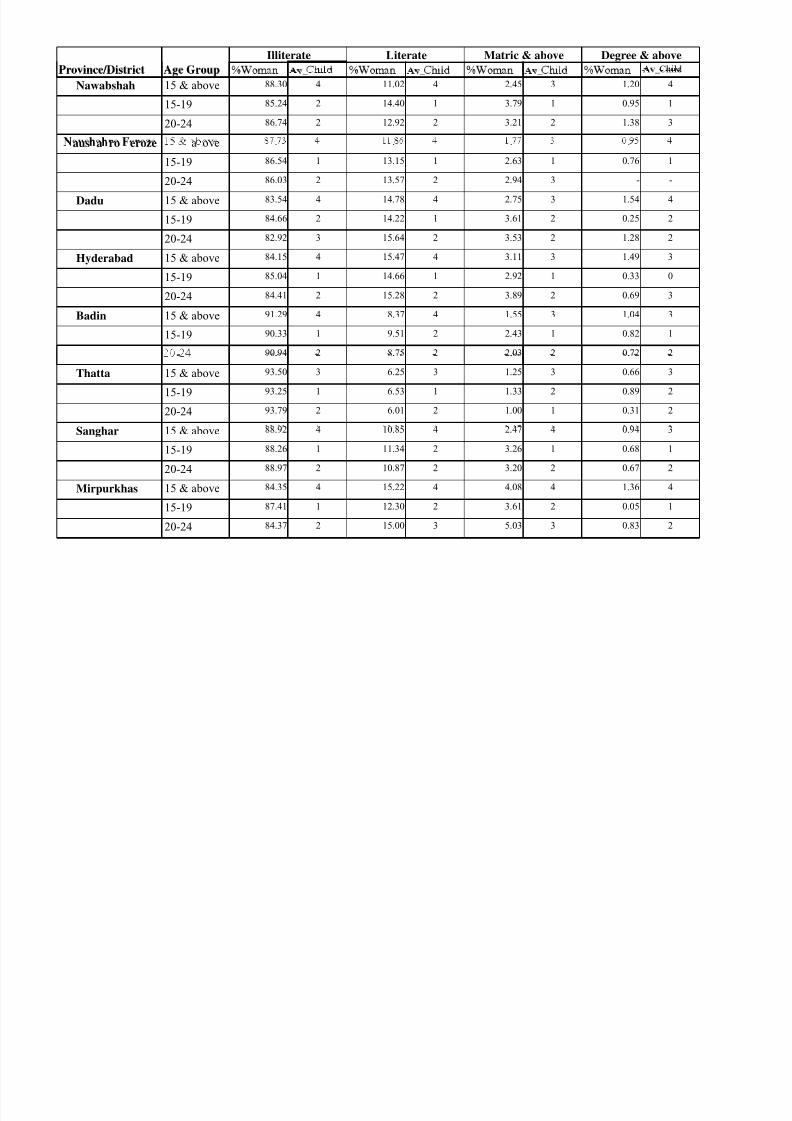
8/18/2019 litracy rate trends pakistan
http://slidepdf.com/reader/full/litracy-rate-trends-pakistan 118/155
20-24 2 13.57 2 2.94 3 - -
Dadu 15 & above 4 14.78 4 2.75 3 1.54 4
86.03
83.54
15-19 2 14.22 1 3.61 2 0.25 2
20-24 3 15.64 2 3.53 2 1.28 2
Hyderabad 15 & above 4 15.47 4 3.11 3 1.49 3
15-19 1 14.66 1 2.92 1 0.33 0
84.66
82.92
84.15
85.04
20-24 2 15.28 2 3.89 2 0.69 3
Badin 15 & above 4 8.37 4 1.55 3 1.04 3
15-19 1 9.51 2 2.43 1 0.82 1
- 2 8.75 2 2.03 2 0.72 2
91.29
90.33
84.41
90.94- . . .
Thatta 15 & above 3 6.25 3 1.25 3 0.66 3
15-19 1 6.53 1 1.33 2 0.89 2
20-24 2 6.01 2 1.00 1 0.31 2
.
93.50
93.25
93.79
Sanghar 15 & above 4 10.85 4 2.47 4 0.94 3
15-19 1 11.34 2 3.26 1 0.68 1
20-24 2 10.87 2 3.20 2 0.67 2
Mirpurkhas 15 & above 4 15.22 4 4.08 4 1.36 4
88.92
88.26
88.97
84.35
15-19 1 12.30 2 3.61 2 0.05 1
20-24 2 15.00 3 5.03 3 0.83 2
87.41
84.37
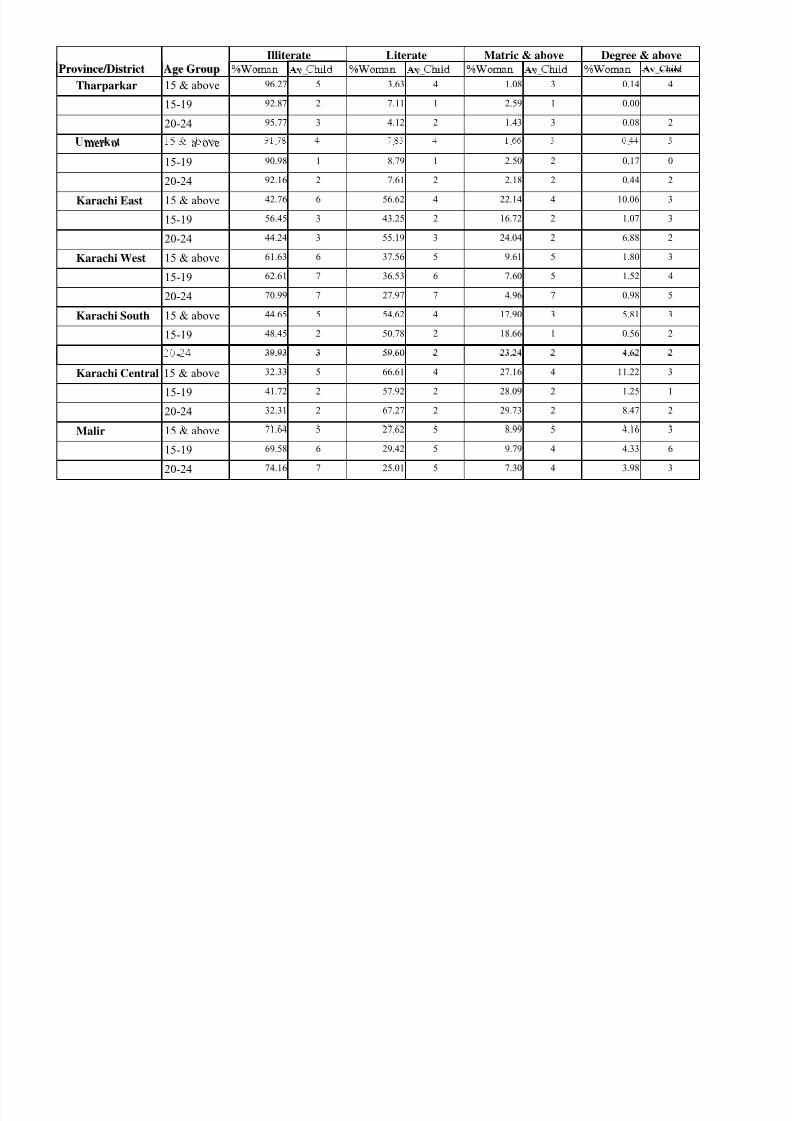
8/18/2019 litracy rate trends pakistan
http://slidepdf.com/reader/full/litracy-rate-trends-pakistan 119/155
Table VIII-C
1998
Province-wise and District-wise Rates of Literacy & Fertility
Linkage between Literacy & Fertility
NWFP(Literacy Rates in Percentages)
Illiterate Literate Matric & above Degree & above
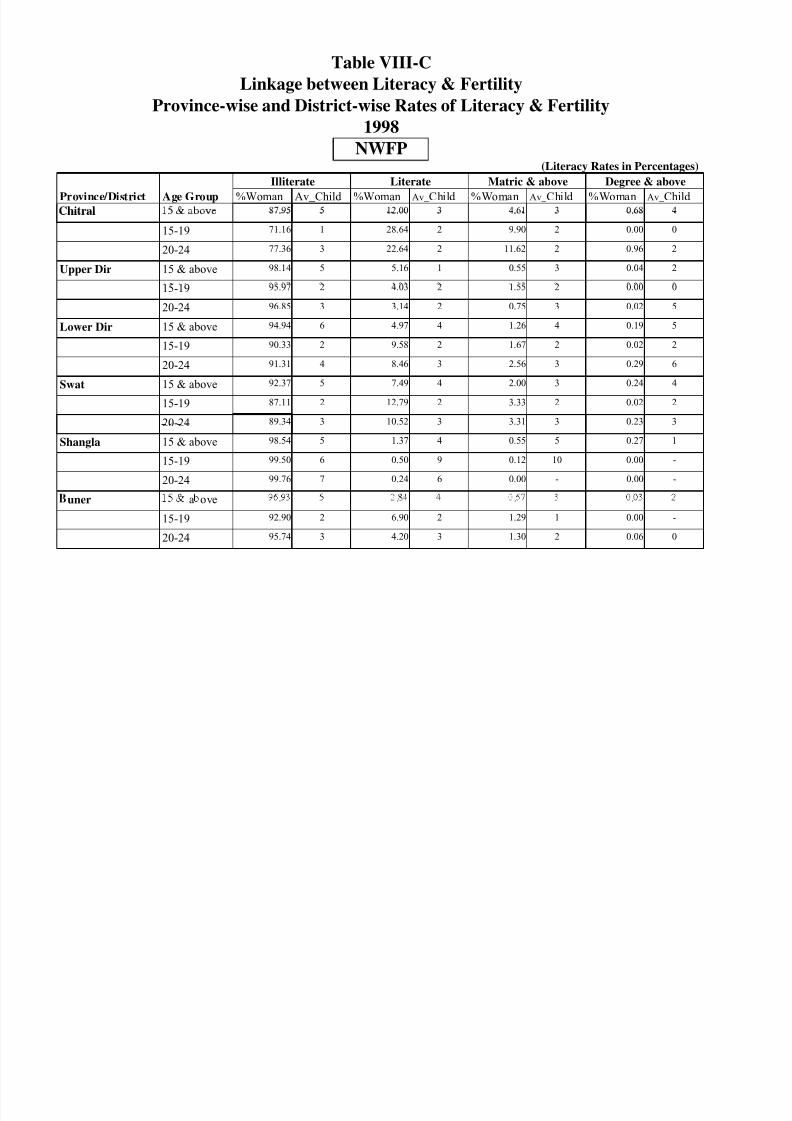
8/18/2019 litracy rate trends pakistan
http://slidepdf.com/reader/full/litracy-rate-trends-pakistan 120/155
Province/District Age Group %Woman %Woman Av_ Child %Woman Av_ Child %Woman Av_ Child
5 12.00 3 4.61 3 0.68 4
Illiterate Literate Matric & above Degree & above
Av_Child
87.95 . . .
15-19 1 28.64 2 9.90 2 0.00 0
20-24 3 22.64 2 11.62 2 0.96 2
Upper Dir 15 & above 5 5.16 1 0.55 3 0.04 2
.
71.16
77.36
98.14
15-19 2 4.03 2 1.55 2 0.00 0
20-24 3 3.14 2 0.75 3 0.02 5
Lower Dir 15 & above 6 4.97 4 1.26 4 0.19 5
15-19 2 9.58 2 1.67 2 0.02 2
95.97
96.85
94.94
90.33
20-24 4 8.46 3 2.56 3 0.29 6
Swat 15 & above 5 7.49 4 2.00 3 0.24 4
15-19 2 12.79 2 3.33 2 0.02 2
20-24 3 10.52 3 3.31 3 0.23 3
87.11
89.34
91.31
92.37
Shangla 15 & above 5 1.37 4 0.55 5 0.27 1
15-19 6 0.50 9 0.12 10 0.00 -
20-24 7 0.24 6 0.00 - 0.00 -
98.54
99.50
99.76
uner a ove . . .
15-19 2 6.90 2 1.29 1 0.00 -
20-24 3 4.20 3 1.30 2 0.06 095.74
.
92.90
Literate Matric & above Degree & aboveIlliterate
Prov nce D str ct Age roup %Woman %Woman Av_ Child %Woman Av_ Child %Woman Av_ Child
Malakand P.A. 15 & above 5 10.14 4 3.46 3 0.49 4
15-19 2 17.39 2 4.94 2 0.09 1
20-24 3 14.71 3 6.11 2 0.23 2
Av_Child
88.76
81.32
84.18
Kohistan 15 & above 4 0.53 3 0.14 3 - -
15-19 1 0.27 2 0.00 - 0.00 -
20 24 2 1 72 2 0 44 2 0 00
99.44
99.73
98 28
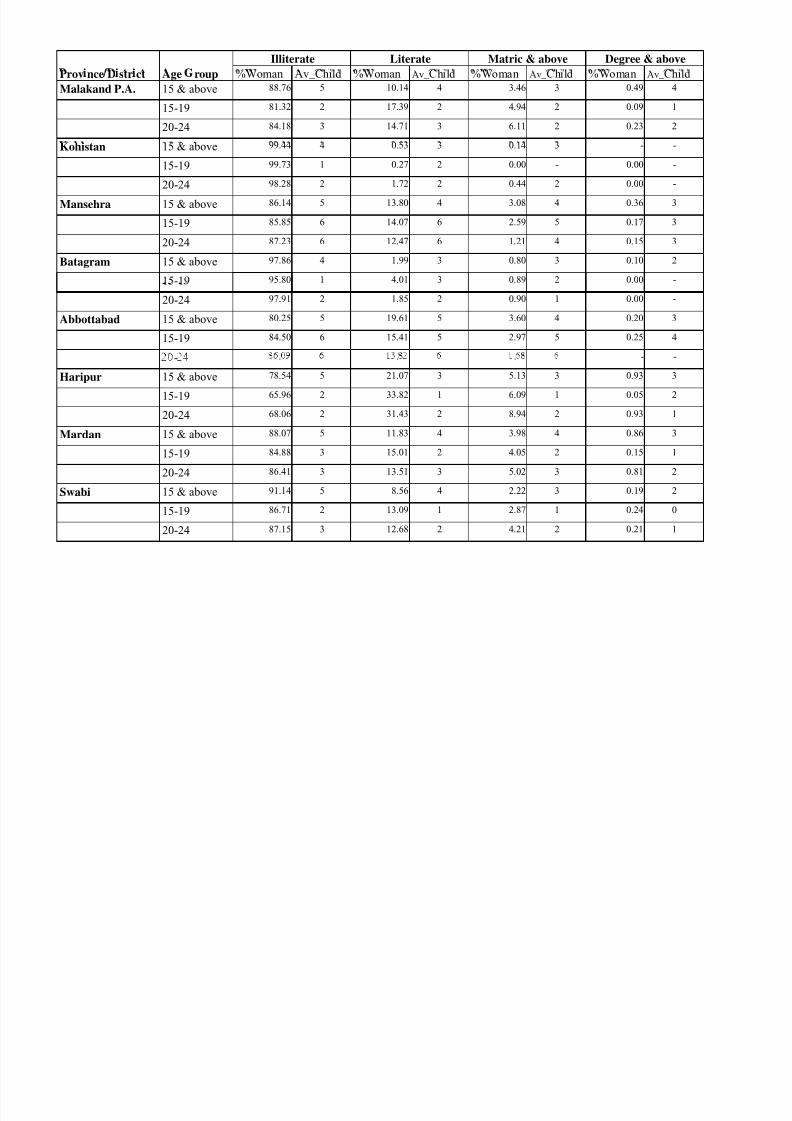
8/18/2019 litracy rate trends pakistan
http://slidepdf.com/reader/full/litracy-rate-trends-pakistan 121/155
20-24 2 1.72 2 0.44 2 0.00 -
Mansehra 15 & above 5 13.80 4 3.08 4 0.36 3
98.28
86.14
15-19 6 14.07 6 2.59 5 0.17 3
20-24 6 12.47 6 1.21 4 0.15 3
Batagram 15 & above 4 1.99 3 0.80 3 0.10 2
15-19 1 4.01 3 0.89 2 0.00 -
85.85
87.23
97.86
95.80
20-24 2 1.85 2 0.90 1 0.00 -
Abbottabad 15 & above 5 19.61 5 3.60 4 0.20 3
15-19 6 15.41 5 2.97 5 0.25 484.50
97.91
80.25
- . . - -
Haripur 15 & above 5 21.07 3 5.13 3 0.93 3
15-19 2 33.82 1 6.09 1 0.05 2
20-24 2 31.43 2 8.94 2 0.93 1
.
78.54
65.96
68.06
Mardan 15 & above 5 11.83 4 3.98 4 0.86 3
15-19 3 15.01 2 4.05 2 0.15 1
20-24 3 13.51 3 5.02 3 0.81 2
Swabi 15 & above 5 8.56 4 2.22 3 0.19 2
88.07
84.88
86.41
91.14
15-19 2 13.09 1 2.87 1 0.24 0
20-24 3 12.68 2 4.21 2 0.21 1
86.71
87.15
Literate Matric & above Degree & aboveIlliterate
Prov nce D str ct Age roup %Woman %Woman Av_ Child %Woman Av_ Child %Woman Av_ Child
Charsadda 15 & above 5 6.58 4 2.43 3 0.51 3
15-19 2 11.42 2 3.83 2 0.29 4
20-24 3 8.73 2 3.49 2 0.33 290.86
93.08
88.48
Av_Child
Peshawar 15 & above 5 42.27 4 17.78 4 17.66 3
15-19 3 37.10 3 19.45 2 3.63 0
20 24 4 41 73 3 18 04 3 17 86 2
57.78
62.78
58 24
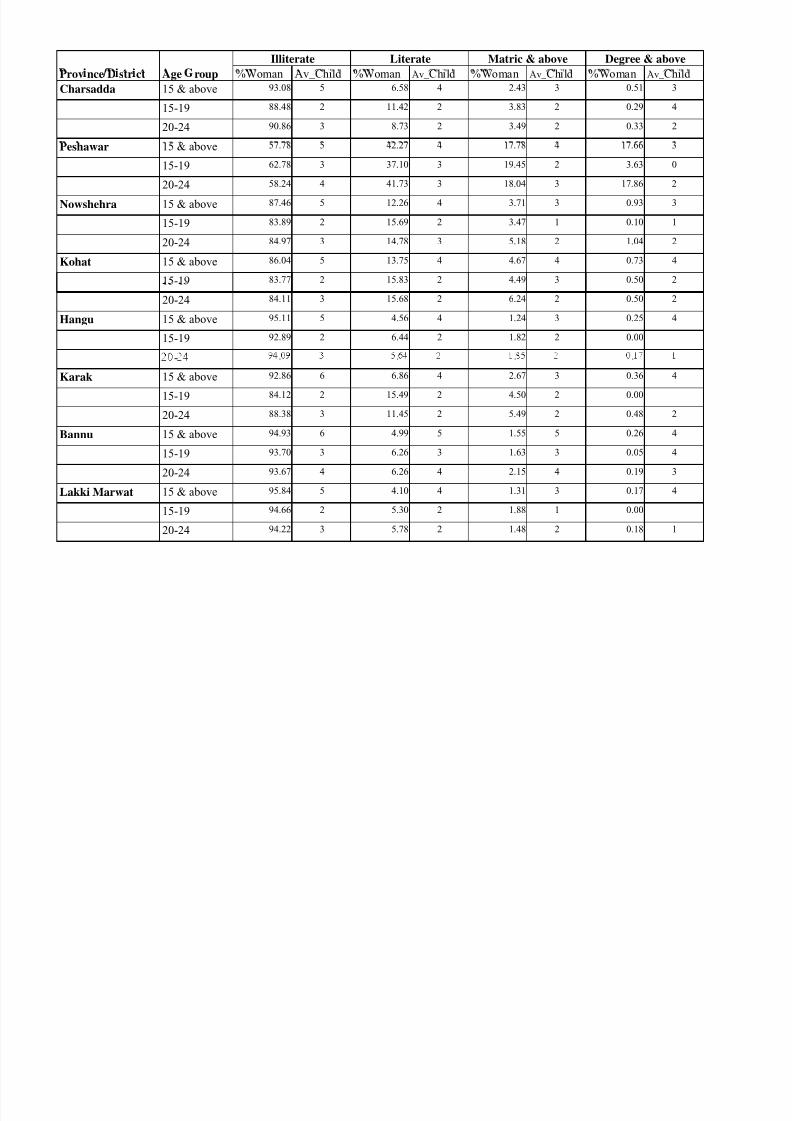
8/18/2019 litracy rate trends pakistan
http://slidepdf.com/reader/full/litracy-rate-trends-pakistan 122/155
20-24 4 41.73 3 18.04 3 17.86 2
Nowshehra 15 & above 5 12.26 4 3.71 3 0.93 3
58.24
87.46
15-19 2 15.69 2 3.47 1 0.10 1
20-24 3 14.78 3 5.18 2 1.04 2
Kohat 15 & above 5 13.75 4 4.67 4 0.73 4
15-19 2 15.83 2 4.49 3 0.50 2
86.04
83.77
83.89
84.97
20-24 3 15.68 2 6.24 2 0.50 2
Hangu 15 & above 5 4.56 4 1.24 3 0.25 4
15-19 2 6.44 2 1.82 2 0.00
84.11
95.11
92.89
- . . .
Karak 15 & above 6 6.86 4 2.67 3 0.36 4
15-19 2 15.49 2 4.50 2 0.00
20-24 3 11.45 2 5.49 2 0.48 288.38
.
92.86
84.12
Bannu 15 & above 6 4.99 5 1.55 5 0.26 4
15-19 3 6.26 3 1.63 3 0.05 4
20-24 4 6.26 4 2.15 4 0.19 3
Lakki Marwat 15 & above 5 4.10 4 1.31 3 0.17 4
94.93
93.70
93.67
95.84
15-19 2 5.30 2 1.88 1 0.00
20-24 3 5.78 2 1.48 2 0.18 194.22
94.66
Illiterate Literate Matric & above Degree & above
Prov nce D str ct Age roup %Woman %Woman Av_ Child %Woman Av_ Child %Woman Av_ Child
Dera Ismail Khan 15 & above 5 12.37 4 3.96 4 1.15 3
15-19 2 12.12 2 4.12 2 0.59 1
20-24 3 11.51 2 4.05 2 0.87 2
Av_Child
87.28
87.57
88.05
Tank 15 & above 5 4.04 4 1.25 3 0.20 3
15-19 2 6.79 2 2.21 1 0.00
20-24 3 4.67 2 1.76 3 0.14 3
93.00
95.19
95.74
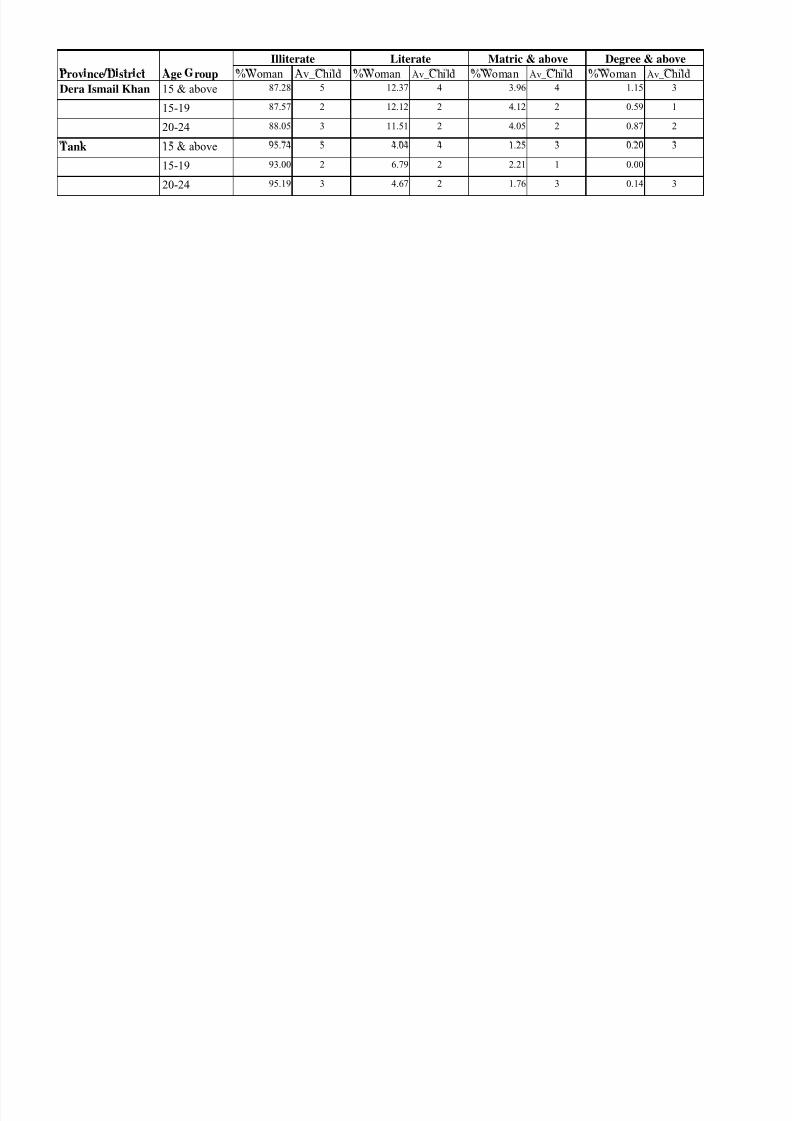
8/18/2019 litracy rate trends pakistan
http://slidepdf.com/reader/full/litracy-rate-trends-pakistan 123/155
20-24 3 4.67 2 1.76 3 0.14 395.19
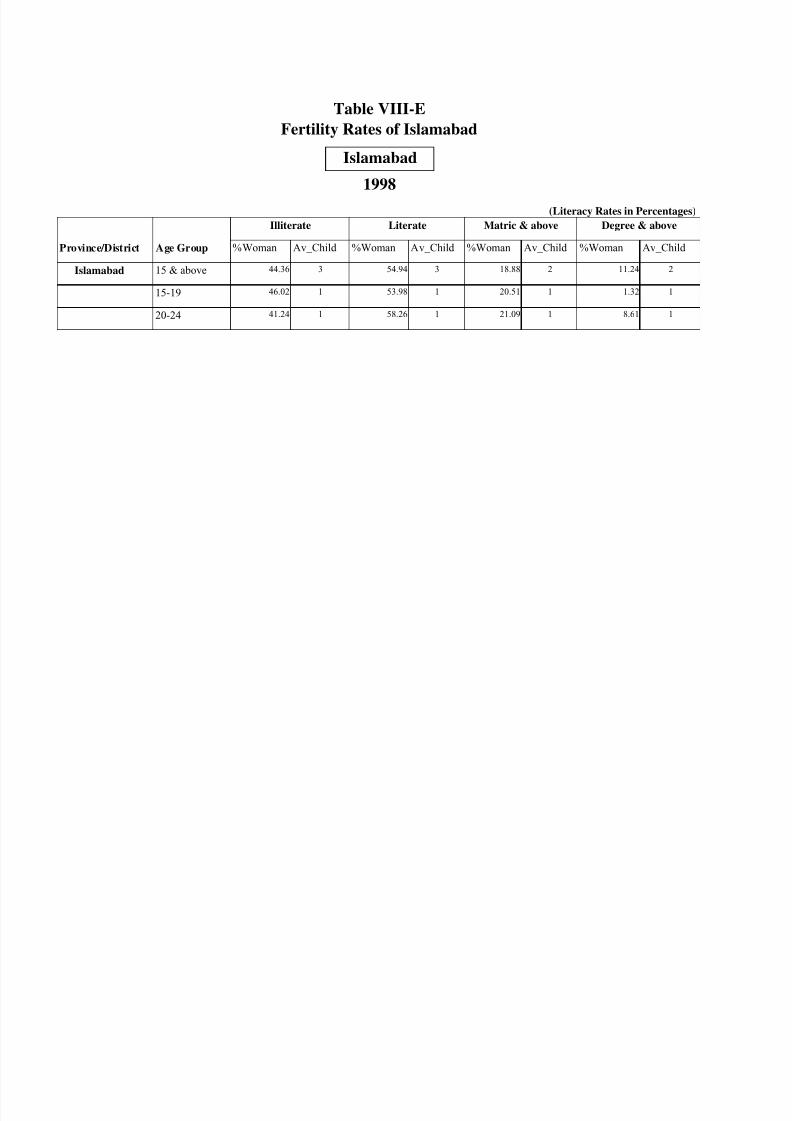
8/18/2019 litracy rate trends pakistan
http://slidepdf.com/reader/full/litracy-rate-trends-pakistan 124/155
Table VIII-DLinkage between Literacy & Fertility
Province-wise and District-wise Rates of Literacy & Fertility1998
Province/District Age Group %Woman %Woman Av Child %Woman Av Child %Woman Av Child
Matric & above Degree & aboveIlliterate Literate
Av Child
(Literacy Rates in Percentages)
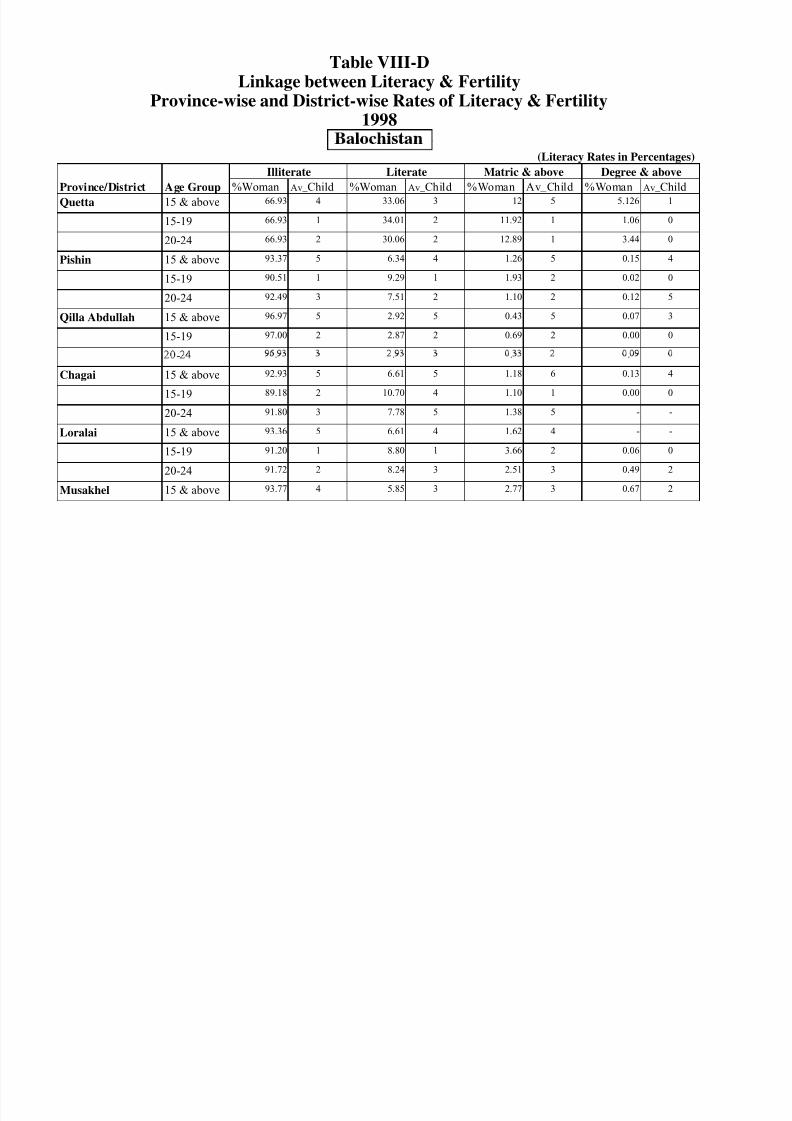
8/18/2019 litracy rate trends pakistan
http://slidepdf.com/reader/full/litracy-rate-trends-pakistan 125/155
Province/District Age Group %Woman %Woman Av_ Child %Woman Av_Child %Woman Av_ Child
Quetta 15 & above 4 33.06 3 12 5 5.126 1
Av_ Child
66.93
15-19 1 34.01 2 11.92 1 1.06 0
20-24 2 30.06 2 12.89 1 3.44 0
Pishin 15 & above 5 6.34 4 1.26 5 0.15 4
15-19 1 9.29 1 1.93 2 0.02 090.51
66.93
66.93
93.37
20-24 3 7.51 2 1.10 2 0.12 5
Qilla Abdullah 15 & above 5 2.92 5 0.43 5 0.07 3
15-19 2 2.87 2 0.69 2 0.00 0
92.49
96.97
97.00
- . . .
Chagai 15 & above 5 6.61 5 1.18 6 0.13 4
15-19 2 10.70 4 1.10 1 0.00 0
20-24 3 7.78 5 1.38 5 - -
89.18
91.80
.
92.93
Loralai 15 & above 5 6.61 4 1.62 4 - -
15-19 1 8.80 1 3.66 2 0.06 0
20-24 2 8.24 3 2.51 3 0.49 2
Musakhel 15 & above 4 5.85 3 2.77 3 0.67 2
93.36
91.20
91.72
93.77
Literate Matric & above Degree & aboveIlliterate
Province/District Age Group %Woman %Woman Av_ Child %Woman Av_Child %Woman Av_ Child
Barkhan 15 & above 4 2.67 3 0.81 3 - -
15-19 1 3.65 1 1.28 1 0.06 1
20-24 2 3.97 2 0.98 2 0.24 0
Av_ Child
96.41
96.35
95.17
Killa Saifullah 15 & above 4 6.88 3 1.53 4 0.04 0
15-19 2 7.77 0 0.83 0 0.00 -
20-24 2 9.73 2 2.45 3 0.21 0
93.12
92.23
90.27
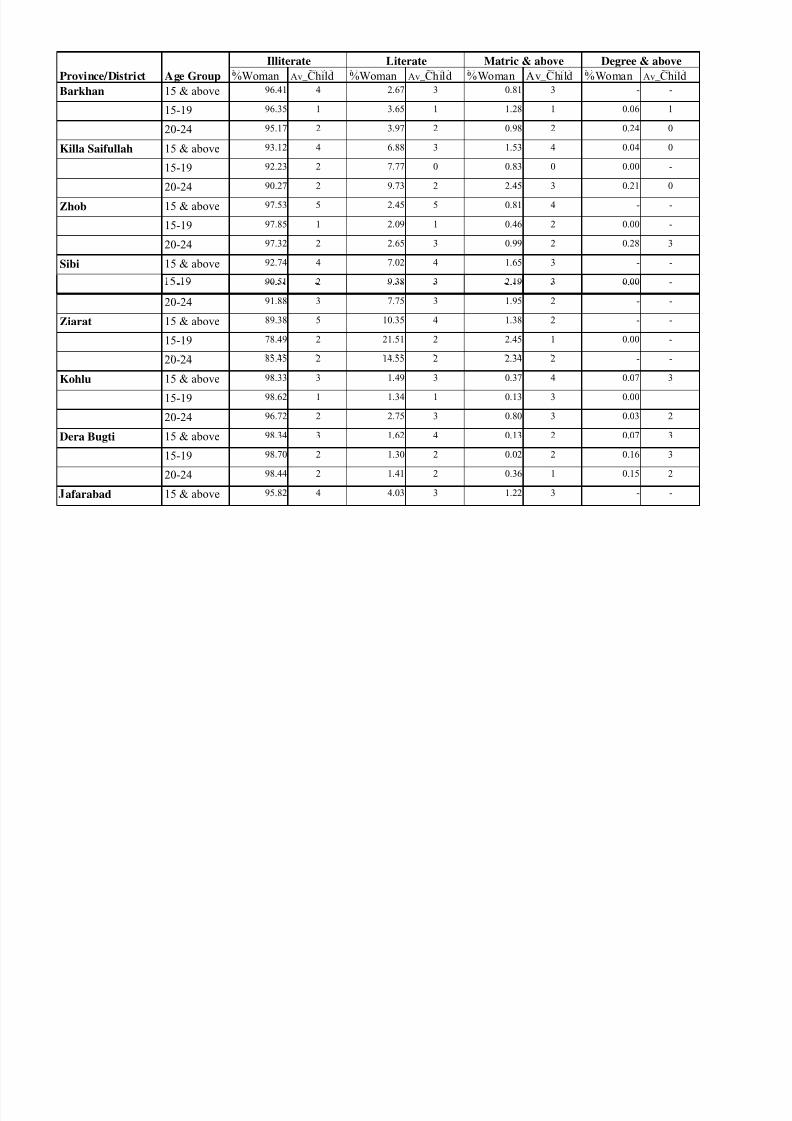
8/18/2019 litracy rate trends pakistan
http://slidepdf.com/reader/full/litracy-rate-trends-pakistan 126/155
20 24
Zhob 15 & above 5 2.45 5 0.81 4 - -97.53
15-19 1 2.09 1 0.46 2 0.00 -
20-24 2 2.65 3 0.99 2 0.28 3
Sibi 15 & above 4 7.02 4 1.65 3 - -
- 2 9.38 3 2.19 3 0.00 -
97.85
97.32
92.74
90.51- . . .
20-24 3 7.75 3 1.95 2 - -
Ziarat 15 & above 5 10.35 4 1.38 2 - -
15-19 2 21.51 2 2.45 1 0.00 -78.49
91.88
.
89.38
20-24 2 14.55 2 2.34 2 - -
Kohlu 15 & above 3 1.49 3 0.37 4 0.07 3
15-19 1 1.34 1 0.13 3 0.00
20-24 2 2.75 3 0.80 3 0.03 2
85.45
98.33
98.62
96.72
Dera Bugti 15 & above 3 1.62 4 0.13 2 0.07 3
15-19 2 1.30 2 0.02 2 0.16 3
20-24 2 1.41 2 0.36 1 0.15 2
afarabad 15 & above 4 4.03 3 1.22 3 - -
98.34
98.70
98.44
95.82
Literate Matric & above Degree & aboveIlliterate
Province/District Age Group %Woman %Woman Av_ Child %Woman Av_Child %Woman Av_ Child
Nasirabad 15 & above 3 1.31 3 0.36 3 - -
15-19 1 1.97 2 0.57 2 0.00 -
20-24 2 2.19 2 0.76 2 - -97.77
98.67
98.03
Av_ Child
Jhal Magsi 15 & above 4 1.63 4 0.45 3 - -
15-19 1 2.11 1 0.42 0 0.85 0
20-24 3 1.45 1 0.58 2 0.58 1
97.87
97.46
97.39
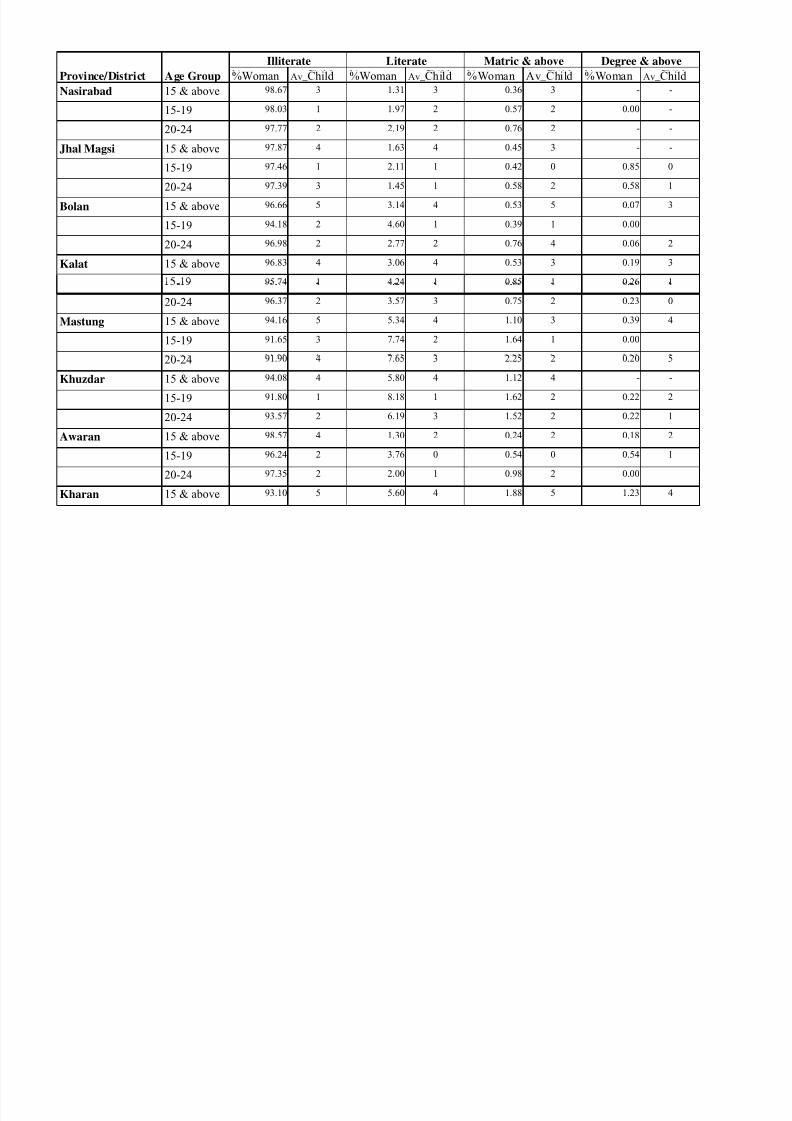
8/18/2019 litracy rate trends pakistan
http://slidepdf.com/reader/full/litracy-rate-trends-pakistan 127/155
Bolan 15 & above 5 3.14 4 0.53 5 0.07 396.66
15-19 2 4.60 1 0.39 1 0.00
20-24 2 2.77 2 0.76 4 0.06 2
Kalat 15 & above 4 3.06 4 0.53 3 0.19 3
- 1 4.24 1 0.85 1 0.26 1
96.83
95.74
94.18
96.98
- . . .
20-24 2 3.57 3 0.75 2 0.23 0
Mastung 15 & above 5 5.34 4 1.10 3 0.39 4
15-19 3 7.74 2 1.64 1 0.00
.
96.37
94.16
91.65
20-24 4 7.65 3 2.25 2 0.20 5
Khuzdar 15 & above 4 5.80 4 1.12 4 - -
15-19 1 8.18 1 1.62 2 0.22 2
20-24 2 6.19 3 1.52 2 0.22 193.57
91.90
94.08
91.80
Awaran 15 & above 4 1.30 2 0.24 2 0.18 2
15-19 2 3.76 0 0.54 0 0.54 1
20-24 2 2.00 1 0.98 2 0.00
Kharan 15 & above 5 5.60 4 1.88 5 1.23 4
98.57
96.24
97.35
93.10
Matric & above Degree & aboveIlliterate Literate
Province/District Age Group %Woman %Woman Av_ Child %Woman Av_Child %Woman Av_ Child
Lasbela 15 & above 4 5.53 4 1.06 4 0.23 -
15-19 2 8.14 1 1.37 2 0.00 -
20-24 2 7.91 3 1.55 4 0.05 1
94.31
91.56
91.76
Av_ Child
Kech 15 & above 5 8.63 4 2.17 4 0.34 4
15-19 2 19.21 1 4.17 1 0.42 1
20-24 4 1.23 3 0.39 2 0.03 2
91.07
80.56
8.72
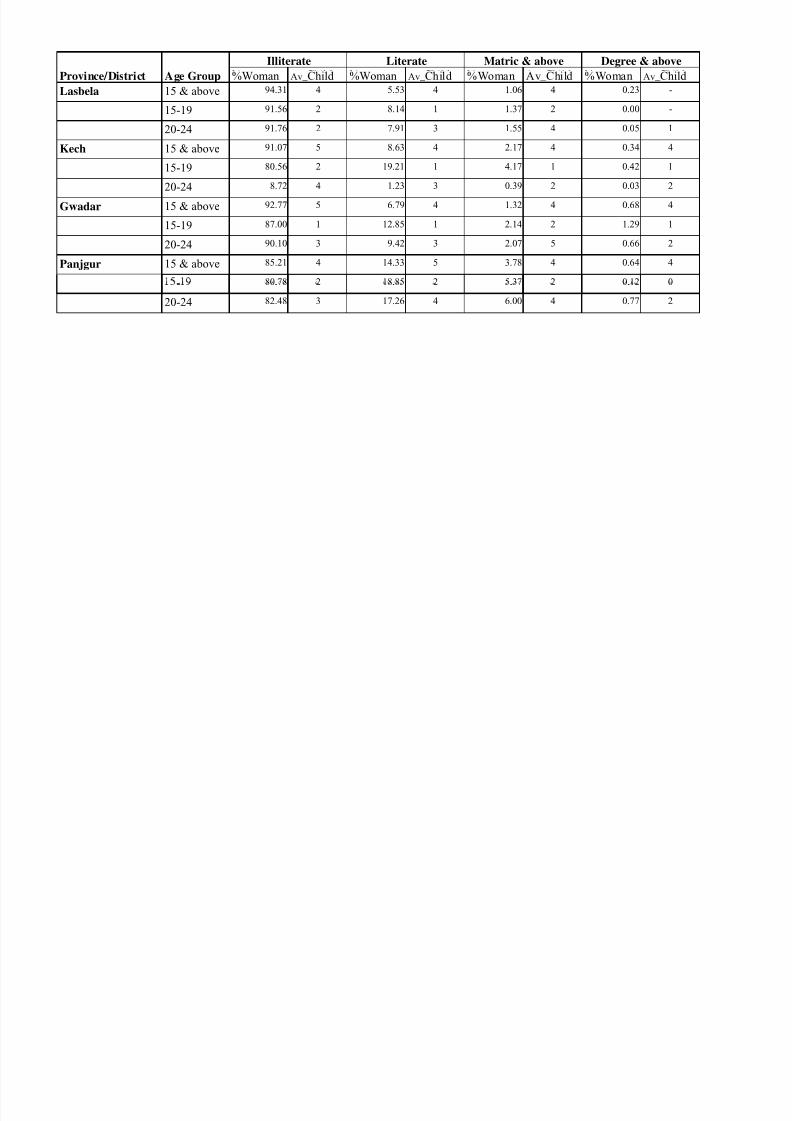
8/18/2019 litracy rate trends pakistan
http://slidepdf.com/reader/full/litracy-rate-trends-pakistan 128/155
Gwadar 15 & above 5 6.79 4 1.32 4 0.68 492.77
15-19 1 12.85 1 2.14 2 1.29 1
20-24 3 9.42 3 2.07 5 0.66 2
Panjgur 15 & above 4 14.33 5 3.78 4 0.64 4
- 2 18.85 2 5.37 2 0.12 0
90.10
85.21
80.78
87.00
- . . .
20-24 3 17.26 4 6.00 4 0.77 2
.
82.48
Table IX-A
District-wise Participation Rates of School going Children (5-9 Years)
1998
PUNJAB
Province/District/ Population School Going Participation Rate
Age Group (5-9) Upto Primary Level 1998
%
Part c pat on Rates n Percentages
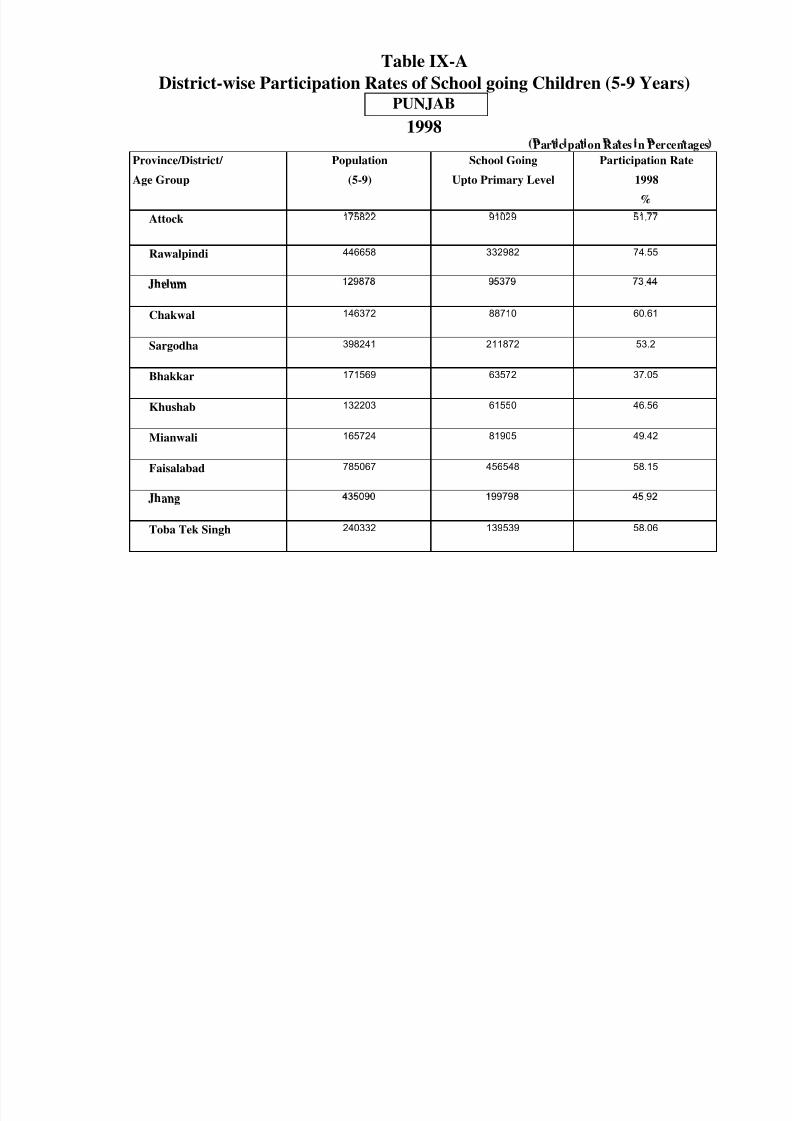
8/18/2019 litracy rate trends pakistan
http://slidepdf.com/reader/full/litracy-rate-trends-pakistan 129/155
%
Attock 175822 91029 51.77
Rawalpindi 446658 332982 74.55
e um .
Chakwal 146372 88710 60.61
Sargodha 398241 211872 53.2
Bhakkar 171569 63572 37.05
Khushab 132203 61550 46.56
Mianwali 165724 81905 49.42
Faisalabad 785067 456548 58.15
ang .
Toba Tek Singh 240332 139539 58.06
Province/District/ Population School Going Participation Rate
Age Group (5-9) Upto Primary Level 1998
%
Gujranwala 505867 292733 57.87
Hafizabad 121681 67016 55.08
Gujrat 290755 217418 74.78
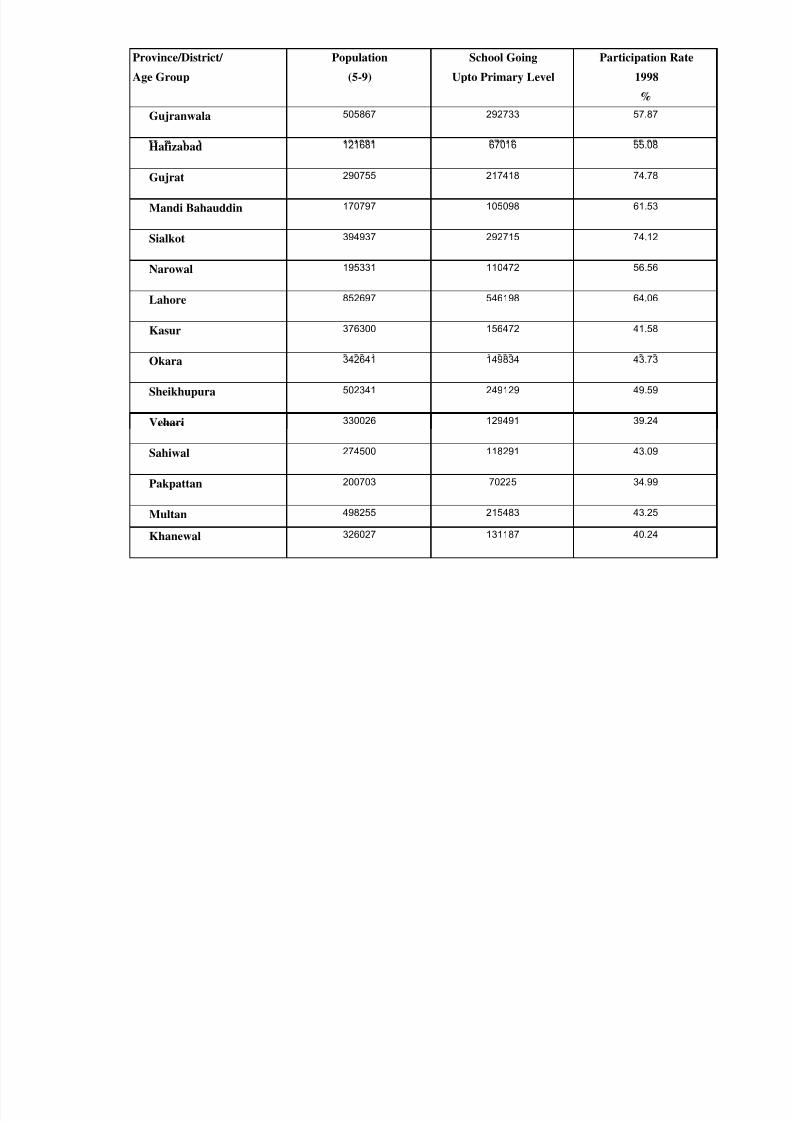
8/18/2019 litracy rate trends pakistan
http://slidepdf.com/reader/full/litracy-rate-trends-pakistan 130/155
Mandi Bahauddin 170797 105098 61.53
Sialkot 394937 292715 74.12
Narowal 195331 110472 56.56
Lahore 852697 546198 64.06
Kasur 376300 156472 41.58
Okara 342641 149834 43.73
Sheikhupura 502341 249129 49.59
Vehari 330026 129491 39.24
Sahiwal 274500 118291 43.09
Pakpattan 200703 70225 34.99
Multan 498255 215483 43.25
Khanewal 326027 131187 40.24
Province/District/ Population School Going Participation Rate
Age Group (5-9) Upto Primary Level 1998
%
Lodhran 199103 62903 31.59
Dera Ghazi Khan 297694 70523 23.69
Rajanpur 200718 50190 25.01
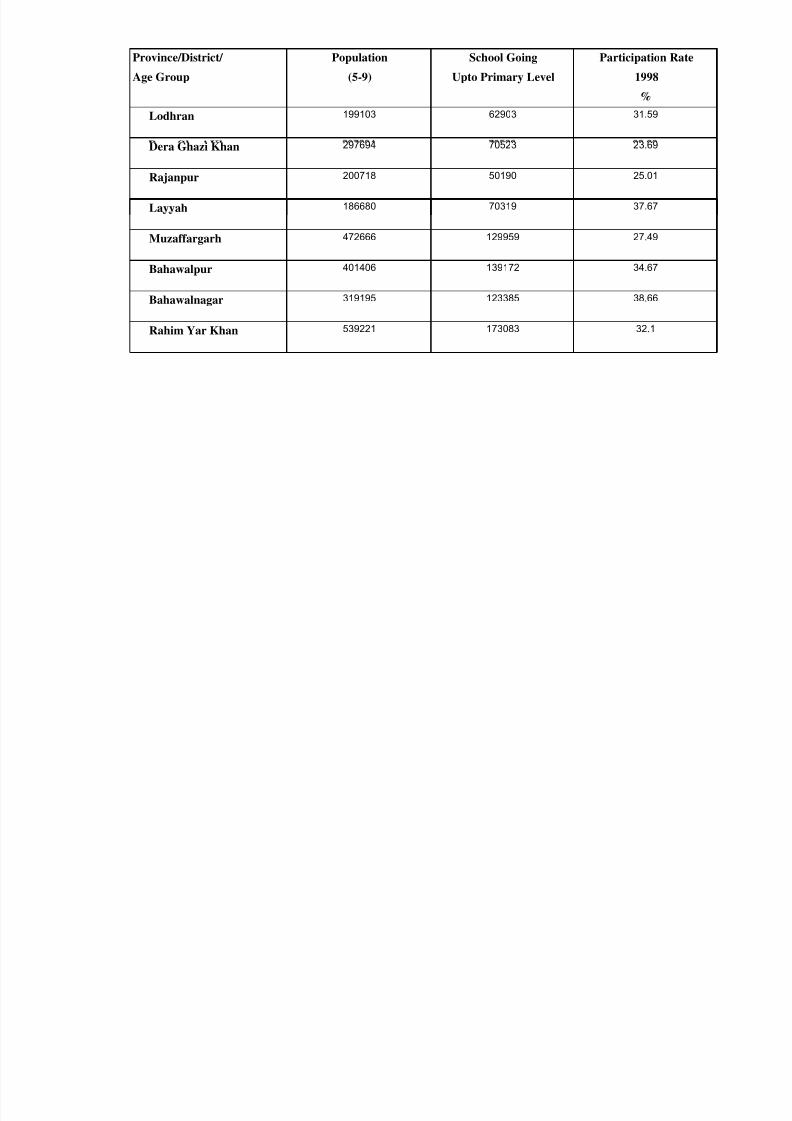
8/18/2019 litracy rate trends pakistan
http://slidepdf.com/reader/full/litracy-rate-trends-pakistan 131/155
Layyah 186680 70319 37.67
Muzaffargarh 472666 129959 27.49
Bahawalpur 401406 139172 34.67
Bahawalnagar 319195 123385 38.66
Rahim Yar Khan 539221 173083 32.1
Table IX-B
District-wise Participation Rates of School going Children (5-9 Years)
1998
Sindh
Province/District/ Population School Going Participation Rate
Age Group (5-9) Upto Primary Level 1998
%
ar c pa on a es n ercen ages
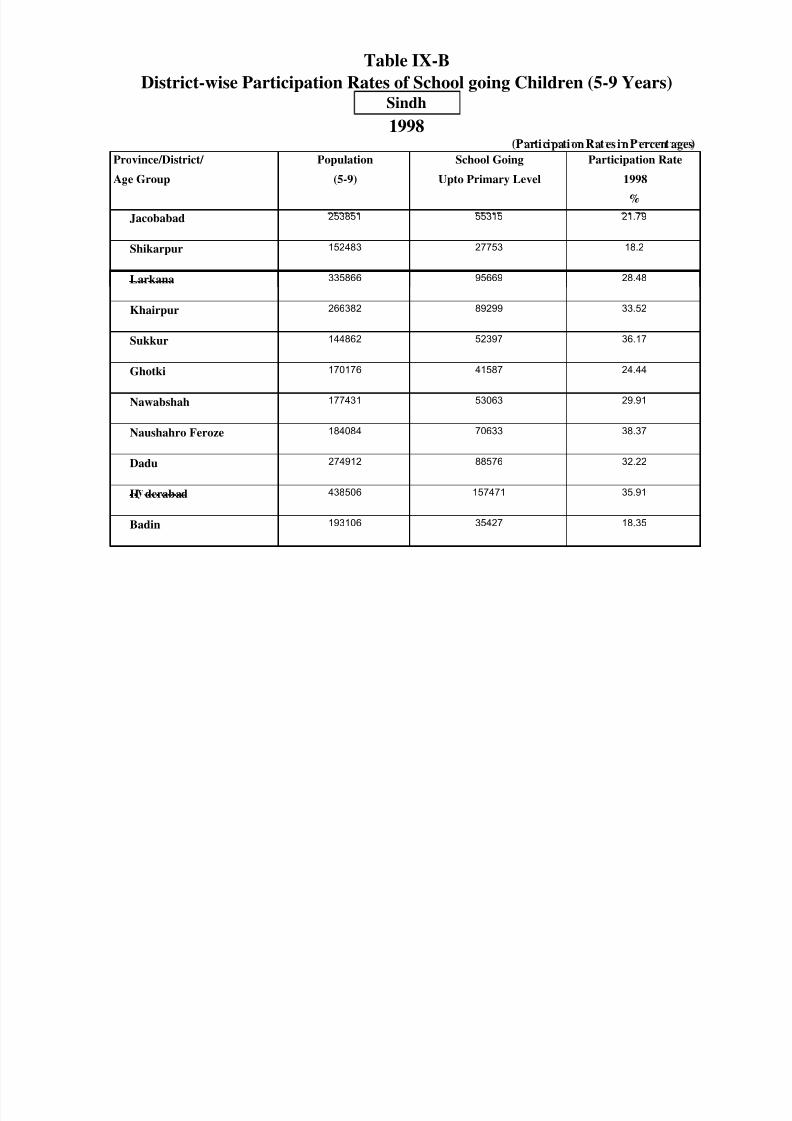
8/18/2019 litracy rate trends pakistan
http://slidepdf.com/reader/full/litracy-rate-trends-pakistan 132/155
%
28.48Larkana 335866 95669
21.79
Shikarpur 152483 27753 18.2
Jacobabad 253851 55315
36.17Sukkur 144862 52397
Khairpur 266382 89299 33.52
29.91Nawabshah 177431 53063
Ghotki 170176 41587 24.44
32.22
H derabad 438506 157471 35.91
88576Dadu 274912
Naushahro Feroze 184084 70633 38.37
Badin 193106 35427 18.35
Province/District/ Population School Going Participation Rate
Age Group (5-9) Upto Primary Level 1998
%
16.29187145 30489Thatta
148380 42596Mirpurkhas
242843 73582 30.3Sanghar
28.71
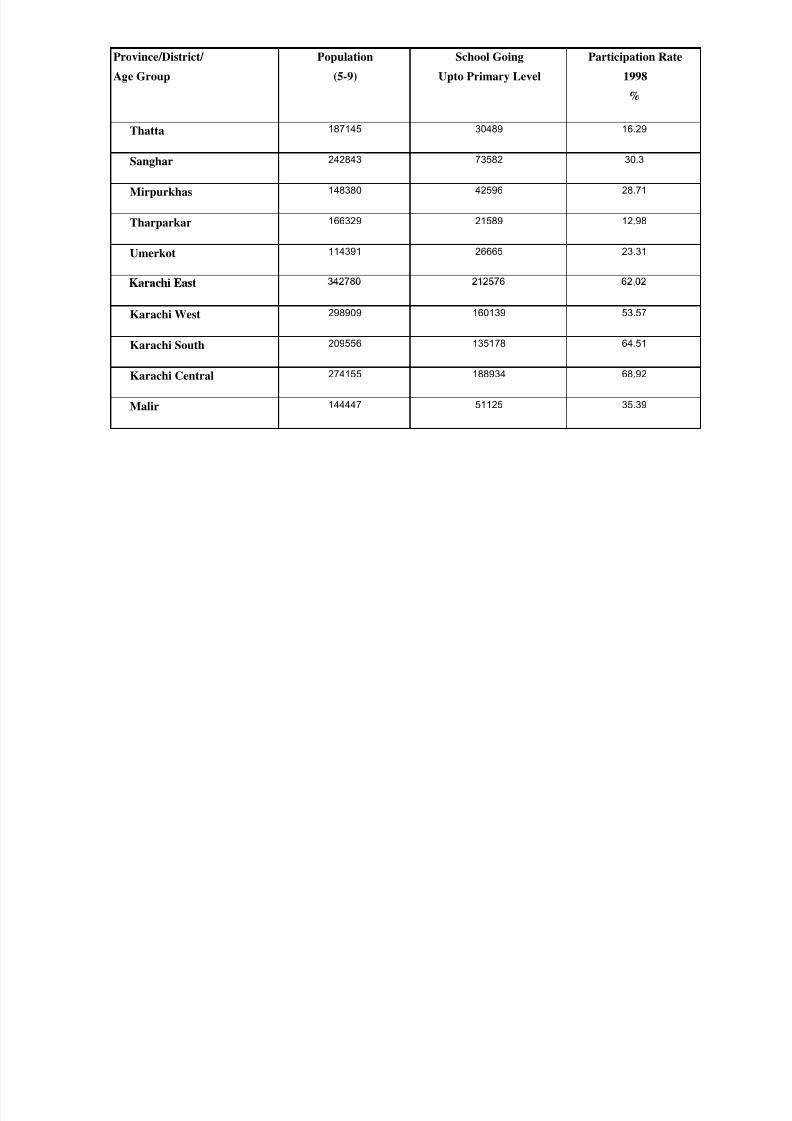
8/18/2019 litracy rate trends pakistan
http://slidepdf.com/reader/full/litracy-rate-trends-pakistan 133/155
23.31114391 26665Umerkot
Tharparkar 166329 21589 12.98
53.57
Karachi South 209556 135178 64.51
298909 160139Karachi West
.
274155 188934 68.92Karachi Central
35.39Malir 144447 51125
Table IX-C
N.W.F.P
District-wise Participation Rates of School going Children (5-9 Years)
1998
Province/District/ Population School Going Participation Rate
Age Group (5-9) Upto Primary Level 1998
(Participation Rates in Percentages)
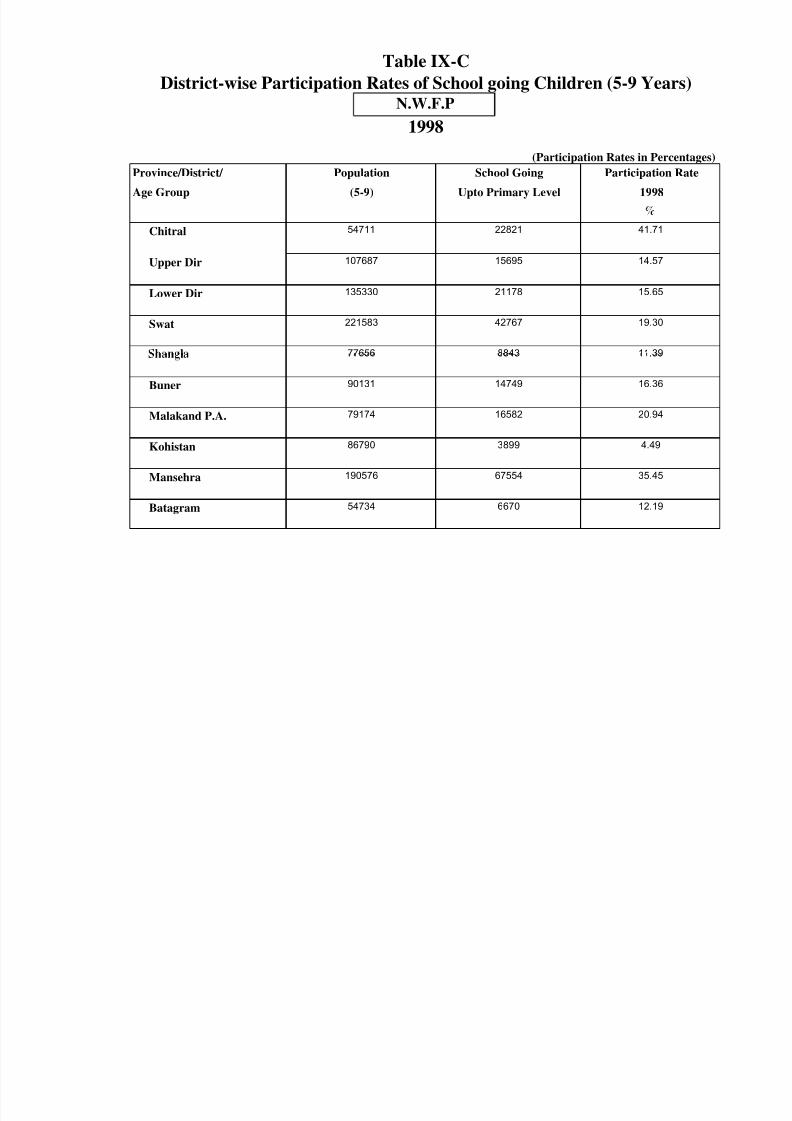
8/18/2019 litracy rate trends pakistan
http://slidepdf.com/reader/full/litracy-rate-trends-pakistan 134/155
Chitral 54711 22821
Upper Dir 107687 15695 14.57
41.71
Lower Dir
Swat 221583 42767 19.30
77656 8843 11.39
135330 21178 15.65
Buner
Malakand P.A.
90131 14749 16.36
79174 16582 20.94
.
Kohistan
Mansehra
86790 3899 4.49
190576 67554 35.45
Batagram 54734 6670 12.19
Province/District/ Population School Going Participation Rate
Age Group (5-9) Upto Primary Level 1998
%
Abbottabad 132384 64682 48.86
Haripur
Mardan 247479 70885 28.64
101670 42777 42.07
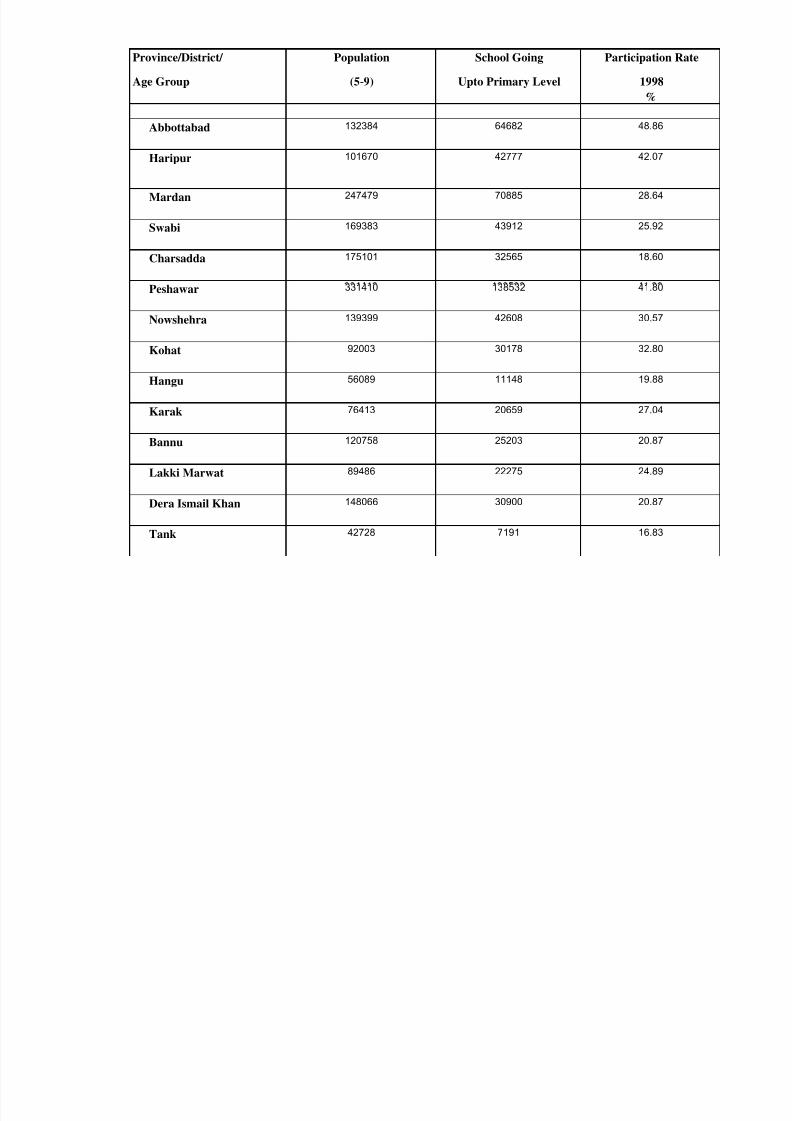
8/18/2019 litracy rate trends pakistan
http://slidepdf.com/reader/full/litracy-rate-trends-pakistan 135/155
Swabi
Charsadda 175101 32565 18.60
169383 43912 25.92
Peshawar
Nowshehra
Kohat
139399 42608 30.57
92003 30178 32.80
331410 138532 41.80
Hangu
Karak
19.8856089 11148
76413 20659 27.04
Bannu
Lakki Marwat 89486 22275 24.89
20.87120758 25203
Dera Ismail Khan
Tank
20.87
42728 7191 16.83
148066 30900
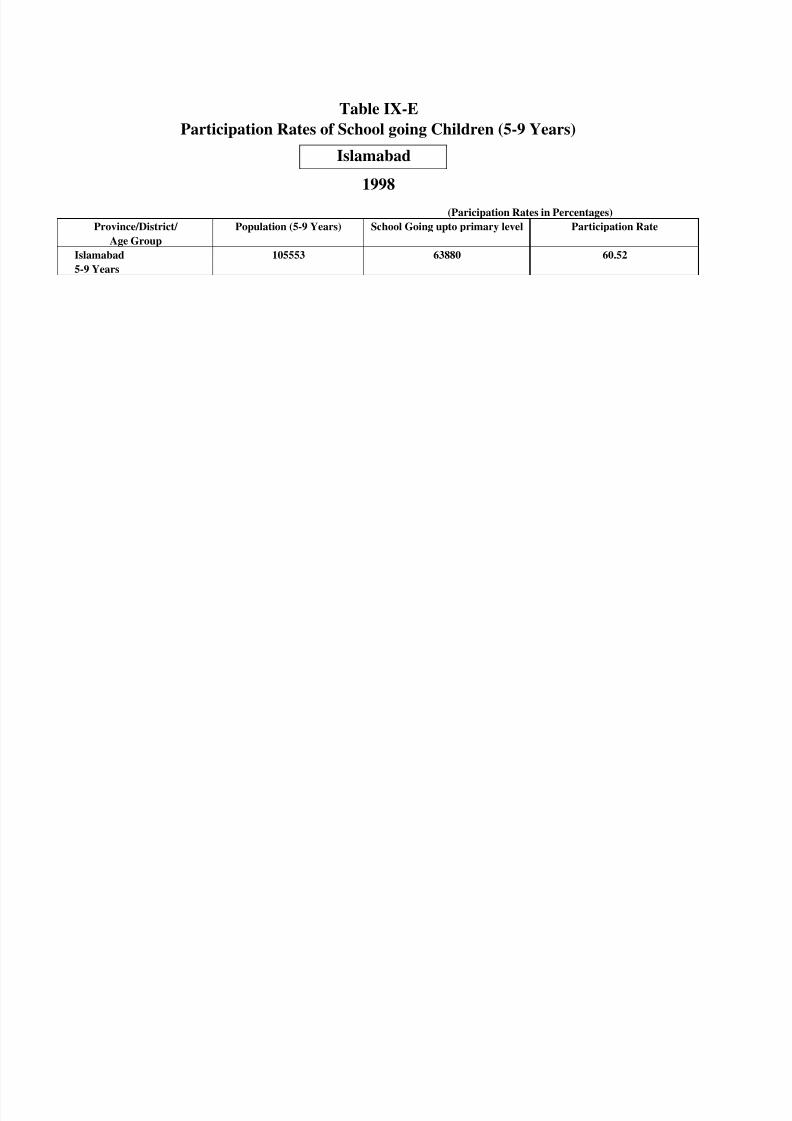
8/18/2019 litracy rate trends pakistan
http://slidepdf.com/reader/full/litracy-rate-trends-pakistan 136/155
Table IX-D
Balochistan
Literac Rates in Percenta es
1998
District-wise Participation Rates of School going Children (5-9 Years)
Population School Going Participation Rate
(5-9) Upto Primary Level 1998
%
Quetta 112442 64864 57.68
Population
(5-9)
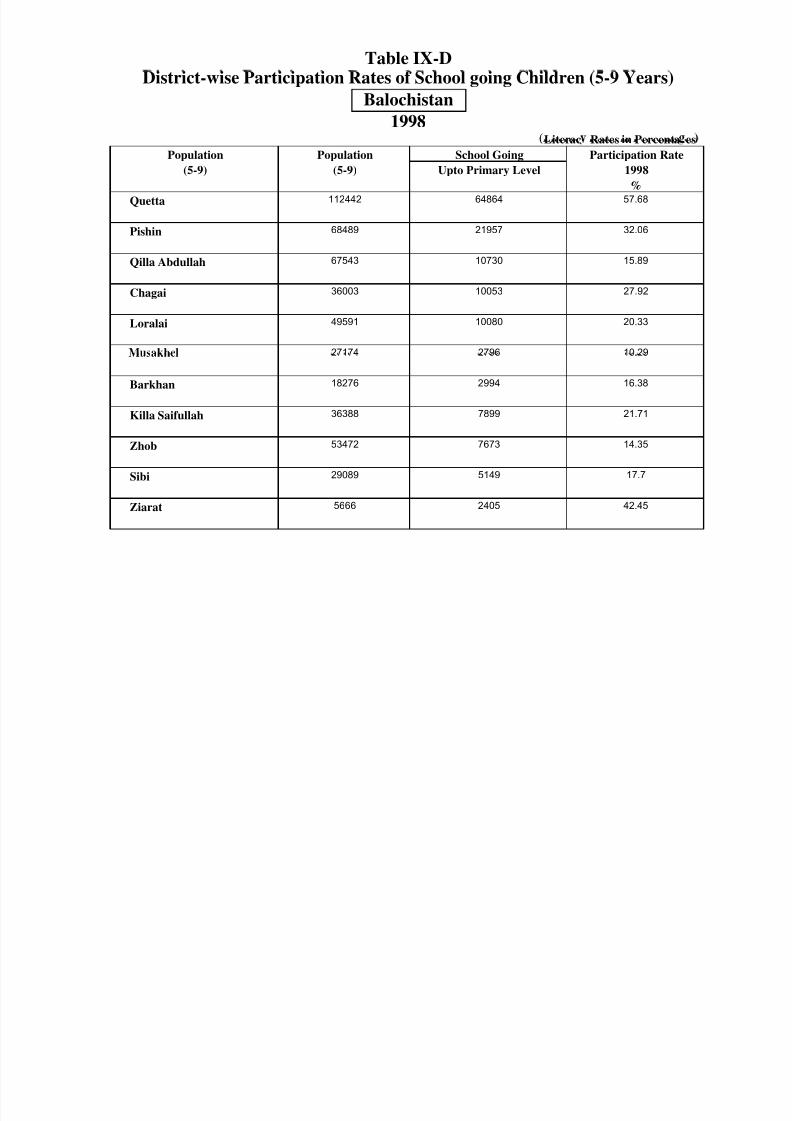
8/18/2019 litracy rate trends pakistan
http://slidepdf.com/reader/full/litracy-rate-trends-pakistan 137/155
2195768489 32.06
Qilla Abdullah 67543 10730 15.89
Pishin
10053
2796
27.92
Loralai 49591 10080 20.33
Chagai 36003
10.2927174
7899
.
Barkhan 18276 2994 16.38
21.71Killa Saifullah 36388
5149
Zhob 53472 7673 14.35
17.7Sibi 29089
Ziarat 5666 2405 42.45
Population School Going Participation RatePopulation
p o r mary eve
%
-
785 4.68
Dera Bugti 33234 2411 7.25
Kohlu 16771
13191 17.69
Nasirabad 43163 3211 7.44
Jafarabad 74570
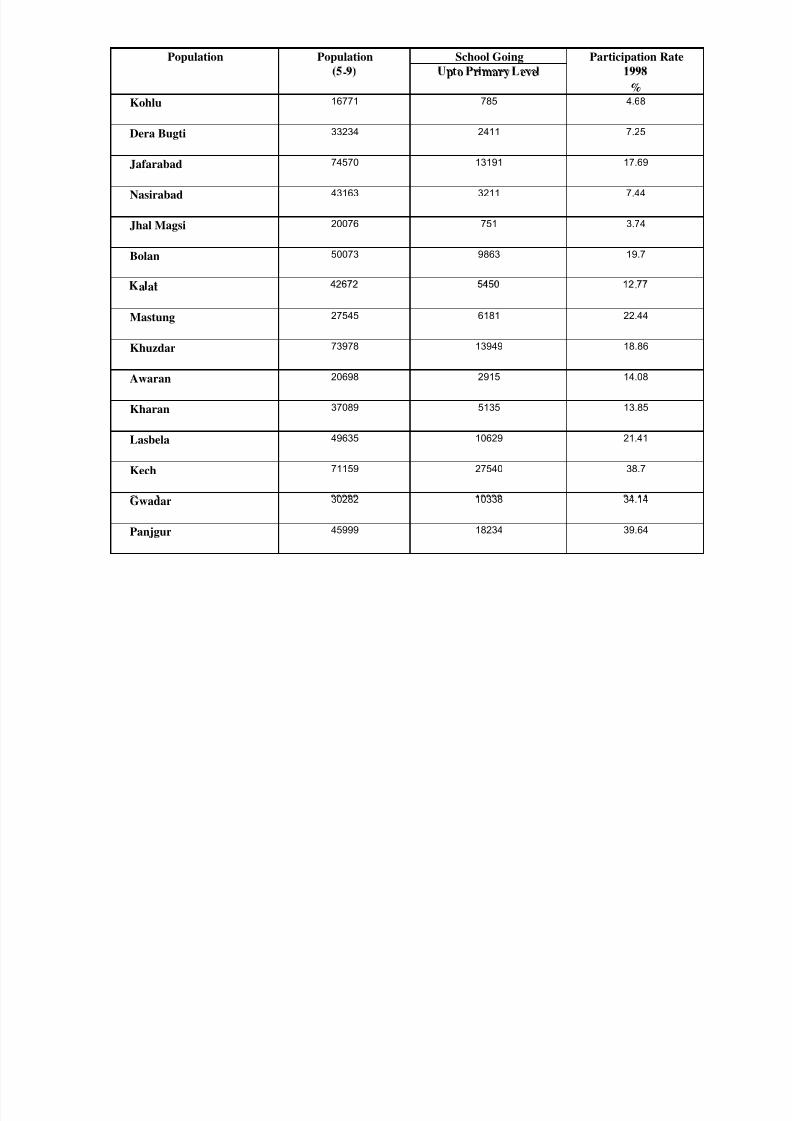
8/18/2019 litracy rate trends pakistan
http://slidepdf.com/reader/full/litracy-rate-trends-pakistan 138/155
751 3.74
Bolan 50073 9863 19.7
Jhal Magsi 20076
13949
.
Mastung 27545 6181 22.44
a at
18.86Khuzdar 73978
5135
Awaran 20698 2915 14.08
13.85Kharan 37089
27540
Lasbela 49635 10629 21.41
38.7Kech 71159
18234
Gwadar 30282 10338 34.14
39.64Panjgur 45999
Table X-C
District-wise Participation Rates of School going Children 5-9 Years
by Sex, Urban and Rural
1998
I N.W.F.P. I
Participation Rates in Percentages
ProvincelDistrictl
All Areas Urban
Rural
Age Group
Both Sexes Male Female Both Sexes Male Female Both Sexes Male Female
N.W.F.P.
24.65 30.05 18.73 40.83 44.40 36.98 22.62 28.34
16.34
Chitral
41.71 46.31
36.85 55.88
60.14 51.34
40.38 45 35.5
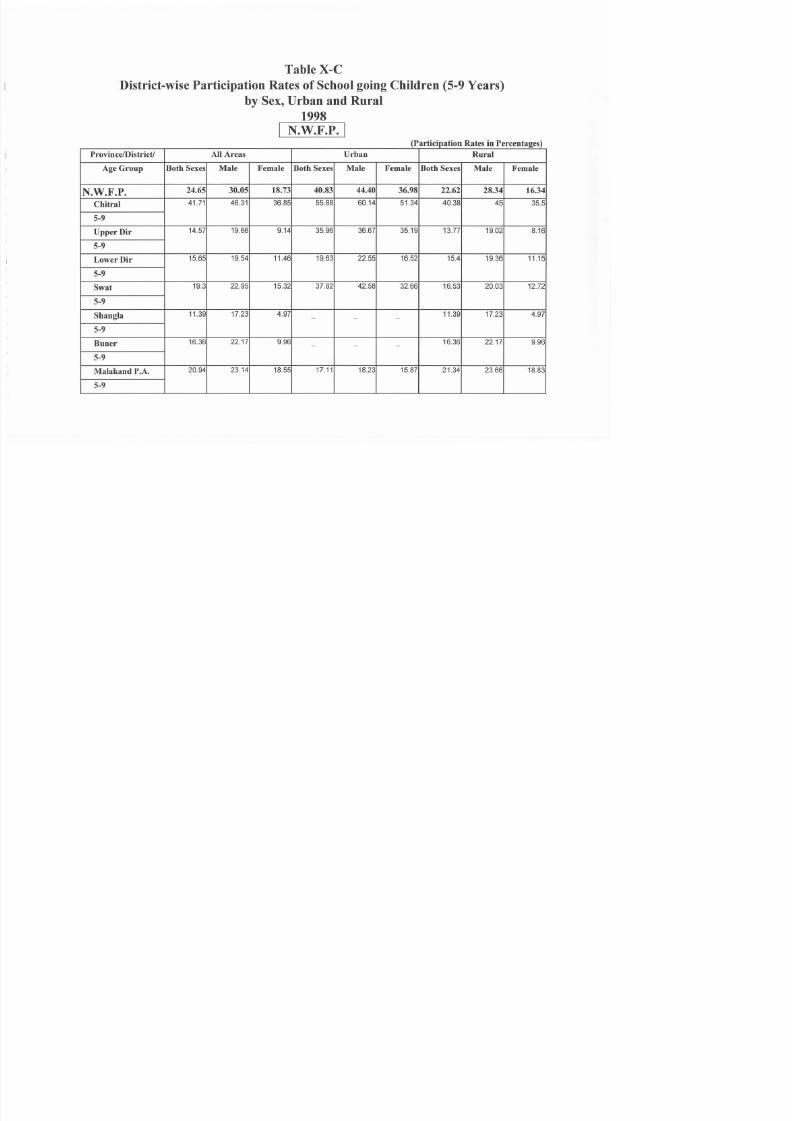
8/18/2019 litracy rate trends pakistan
http://slidepdf.com/reader/full/litracy-rate-trends-pakistan 139/155
5-9
Upper Dir
14.57 19.66 9.14 35.96 36.67 35.19 13.77 19.02
8.16
5-9
Lower Dir
15.65
19.54 11.46 19.63 22.55 16.52
15.4 19.36 11.15
5-9
Swat
19.3 22.95 15.32 37 82 42 58 32.66 16.53
20.03 12.72
5-9
Shangla
11.39 17.23 4.97 11.39 17.23 4.97
-
-
5-9
Buner
16.36 22.17 9.96 16.36
22.17 9.96
-
-
5-9
Malakand P.A.
20.94 23.14 8 55 17.11 18.23 15.87 21.34
23.66 18.83
5-9
ProvincelDistrictl All Areas
Urban
Rural
Age Group
Both Sexes Male Female Both Sexes Male Female Both Sexes
Male Female
Kohistan
4 49 6 81 1 47
4 49 6 81
1 47
5 9
Mansehra
35 45 39 56
30 97 64 28 67 15 61 28
34 06
38 27
29 48
5 9
Batagram
12 19 16 73 7 25
12 19 16 73
7 25
5 9
Abbottabad
48 86
51 98
45 5
56 48
57 53 55 3 47 52
50 97
43 83
5 9
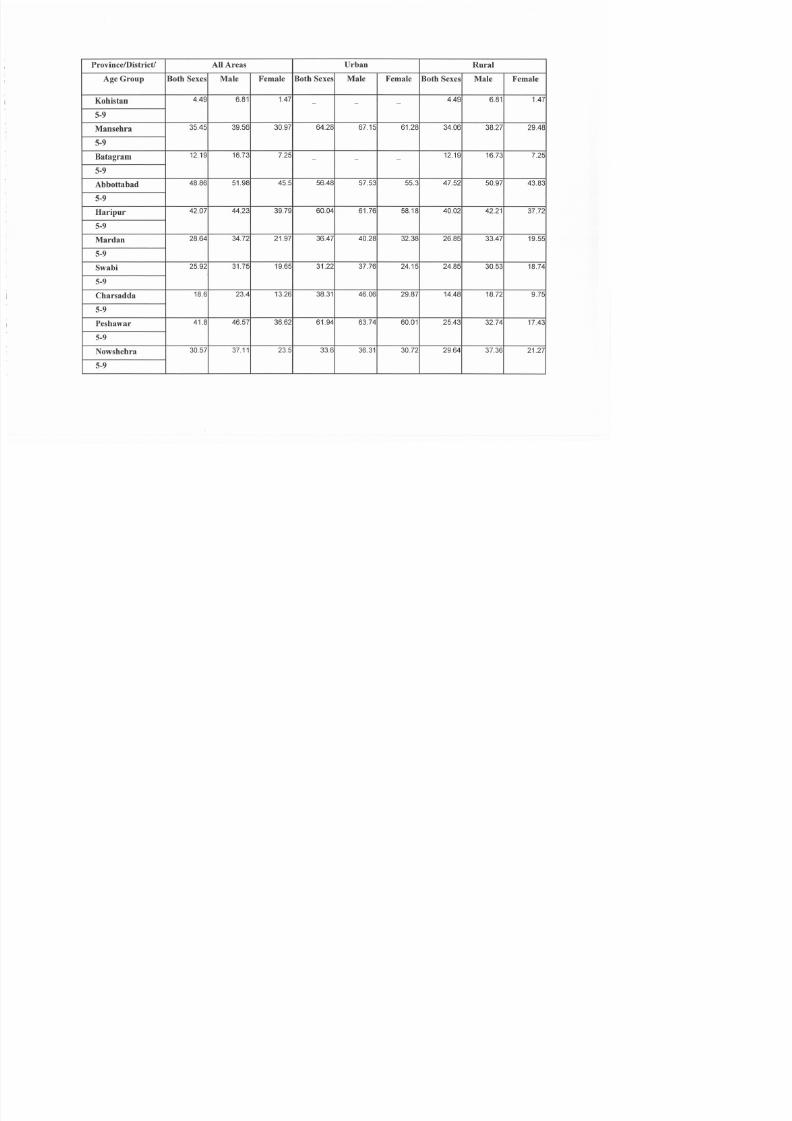
8/18/2019 litracy rate trends pakistan
http://slidepdf.com/reader/full/litracy-rate-trends-pakistan 140/155
Haripur
42 07 44 23 39 79 60 04 61 76 58 18 40 02 42 21
37 72
5 9
Mardan
28 64
34 72 21 97 36 47 40 28 32 38
26 85 33 47 19 55
5 9
Swabi
25 92 31 75 19 65 31 22 37 76 24 15 24 85 30 53 18 74
5 9
Charsadda
18 6 23 4 13 26 38 31 46 06 29 87 14 48 18 72 9 75
5 9
Peshawar
41 8 46 57 36 62
61 94
63 74 60 01 25 43 32 74 17 43
5 9
Nowshehra
30 57 37 11 23 5 33 6 36 31 30 72 29 64 37 36 21 27
5 9
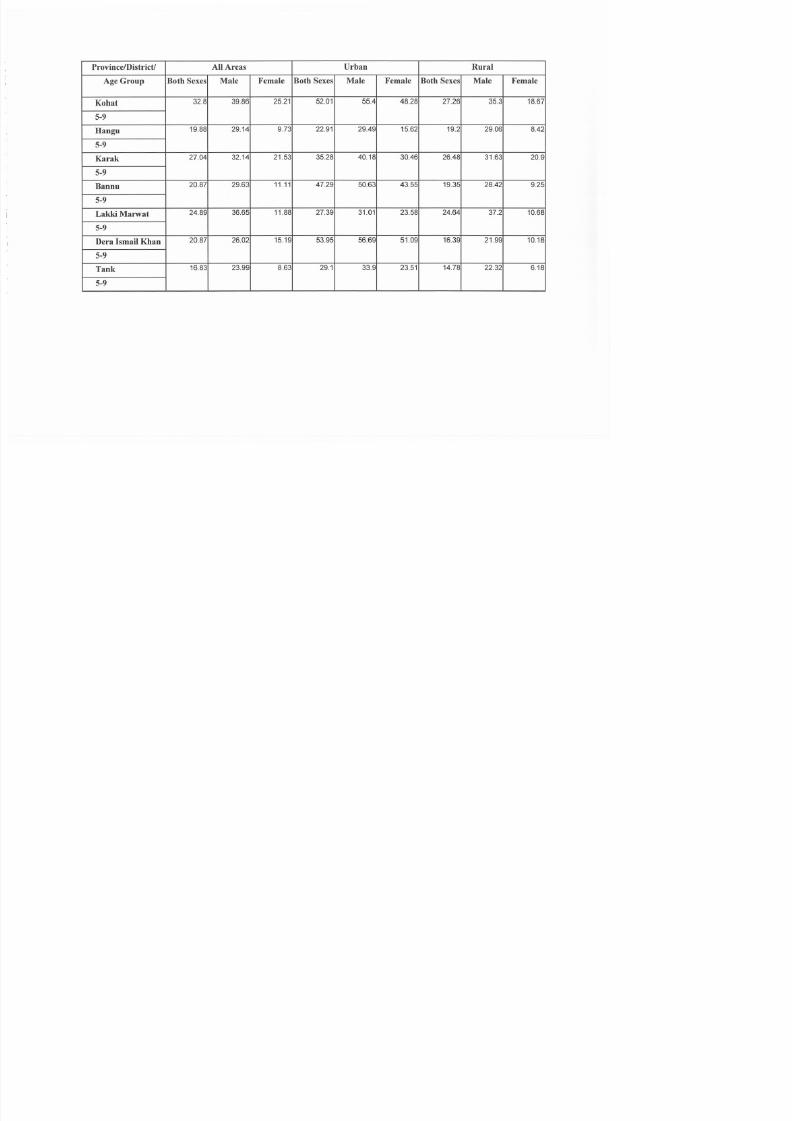
8/18/2019 litracy rate trends pakistan
http://slidepdf.com/reader/full/litracy-rate-trends-pakistan 141/155
District-wise
Table X-B
Participation Rates of Schoolgoing Children
5-9
Years
by Sex Urban and Rural
1998
I
Sindh
I
Participation Rates in Percentages
Province/District/ All Areas Urban
Rural
Age Group
Both Sexes Male Female Both Sexes Male Female Both Sexes Male Female
Sind
33.97 37.49 29.97 48.32 51.33 45.02 22.85 27.12 17.94
Jacobabad
21.79 25.98
16.67
40.4 44.76 35.41 16.16 20.52 10.74
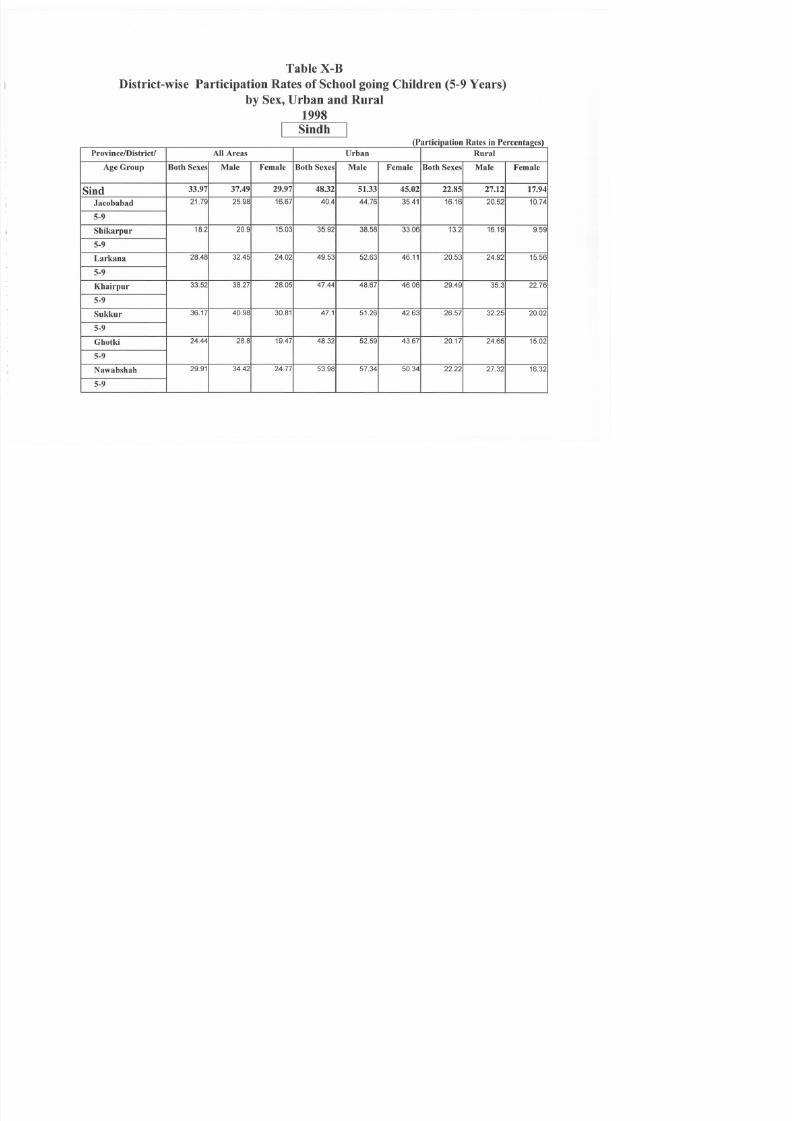
8/18/2019 litracy rate trends pakistan
http://slidepdf.com/reader/full/litracy-rate-trends-pakistan 142/155
5-9
Shikarpur
18.2 20.9 15.03 35.92 38.58 33.06 13.2 16.19
9.59
5-9
Larkana
28.48 32.45 24.02
49.53 52.63
46.11
20.53 24.92 15.56
5-9
Khairpur
33.52 38.27 28.05 47.44
48.67 46.06 29.49
35.3 22.76
5-9
Sukkur
36.17 40.98 30.81 47.1 51.26 42.63 26.57
32.25 20.02
5-9
Ghotki
24.44 28.8 19.47 48.32 52.59 43.67 20.17
24.65 15.02
5-9
Nawabshah
29.91 34.42 24.77 53.98 57.34 50.34 22.22
27.32 16.32
5-9
Province/District/
All Areas
Urban
Rural
Age Group
Both Sexes Male
Female
Both Sexes
Male
Female Both Sexes
Male
Female
Naushahro Feroze
38 37 45 38
30 29
53 12
59 01
46 52 35 33
42 62
26 89
5 9
Dadu
32 22 36 74 27
52 27
57 26
46 69 27 08
31 57
21 84
5 9
Hyderabad
35 91 40 46
30 92
48 96
53 25 44 37
24 91
29 91
19 31
5 9
Badin
18 35
20 96 15 41
39 13
41 11
36 96
14 56
17 35
11 42
5 9
Thatta
16 29
19 73
12 29
38 39
40 13 36 42
13 78
17 46
9 5
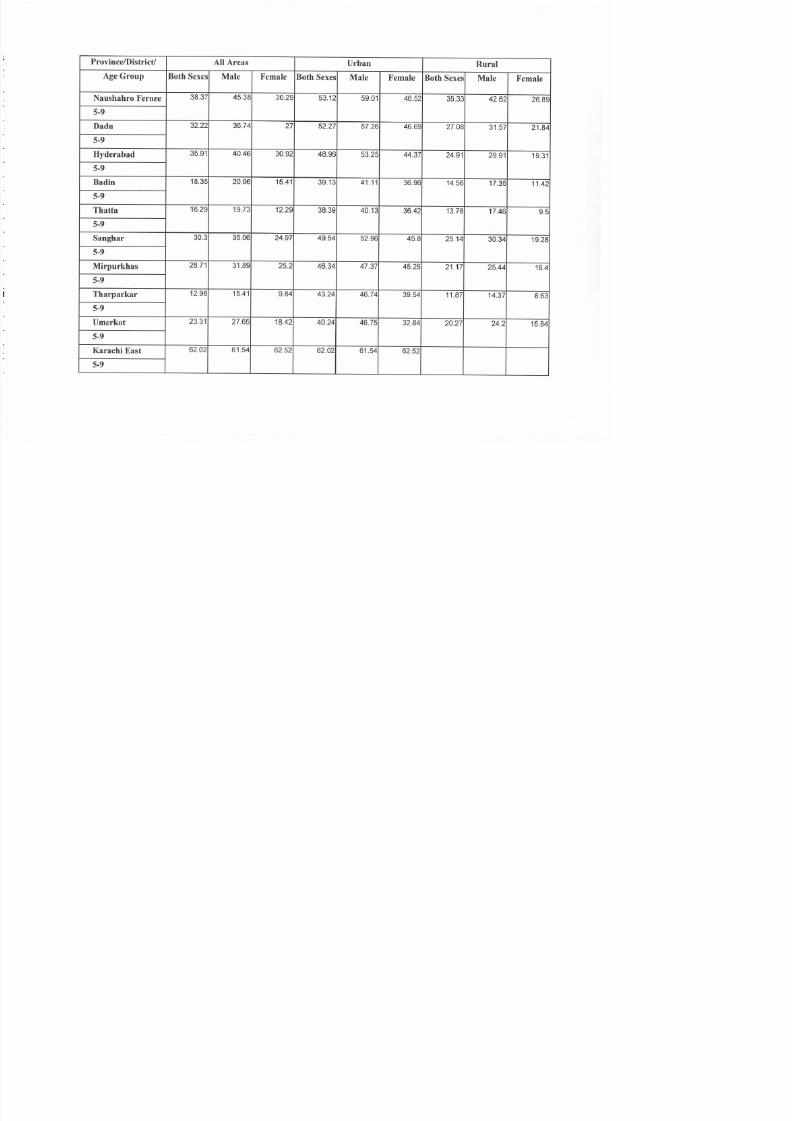
8/18/2019 litracy rate trends pakistan
http://slidepdf.com/reader/full/litracy-rate-trends-pakistan 143/155
5 9
Sanghar
30 3
35 06
24 97
49 54
52 96 45 8
25 14
30 34
19 28
5 9
Mirpurkhas
28 71
31 89
25 2
46 34
47 37 45 25
21 17
25 44
16 4
5 9
Tharparkar
12 98
15 41
9 84 43 24
46 74
39 54
11 87
14 37
8 63
5 9
Umerkot
23 31
27 65
18 42 40 24
46 75
32 84
20 27
24 2
15 84
5 9
Karachi East
62 02
61 54
62 52 62 02
61 54
62 52
5 9
ProvincelDistrictl
All Areas Urban Rural
Age Group
Both Sexes Male
Female Both Sexes Male Female Both Sexes Male
Female
Karachi West
53 57
56 27 50 72
54 14
56 59 51 55 48 49 53 41
43 23
5 9
Karachi South
64 51
66 27 62 66 64 51 66 27 62 66
5 9
Karachi Central
68 92
70 11 67 66 68 92 70 11 67 66
5 9
Malir
35 39 37 98 32 6 31 25 32 92 29 45 43 2 47 51 38 54
5 9
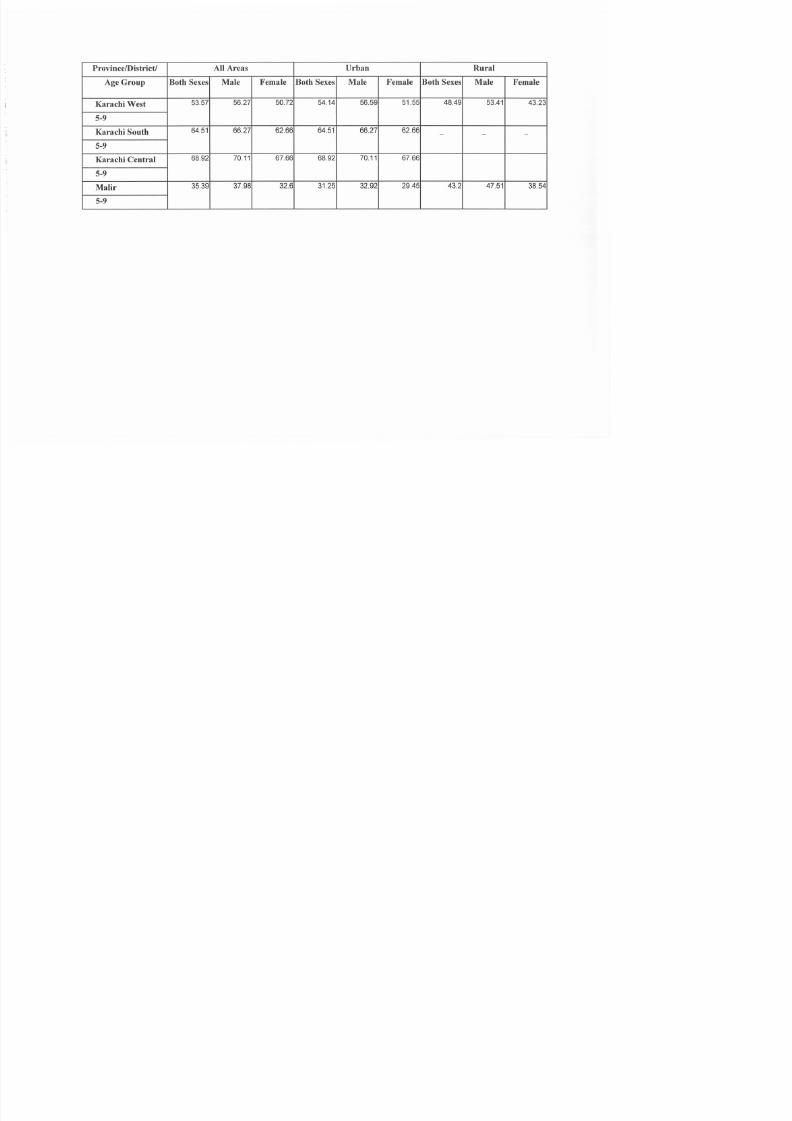
8/18/2019 litracy rate trends pakistan
http://slidepdf.com/reader/full/litracy-rate-trends-pakistan 144/155
Table X-D
District-wise Participation Rates of School going Children 5-9 Years
by Sex, Urban and Rural
1998
I
Balochistan
I
Participation Rates in Percentages
ProvincelDistrictl All Areas Urban Rural
Age Group
Both Sexes Male Female
Both Sexes
Male Female
Both Sexes
Male Female
Balochistan
24.29
28.48
19.29
46.57
51.25
41.26 18.20
22.43 13.08
Quetta
57068
61.87 53.09 62.29 67.61 57.78 45.19 48.31 41.68
5-9
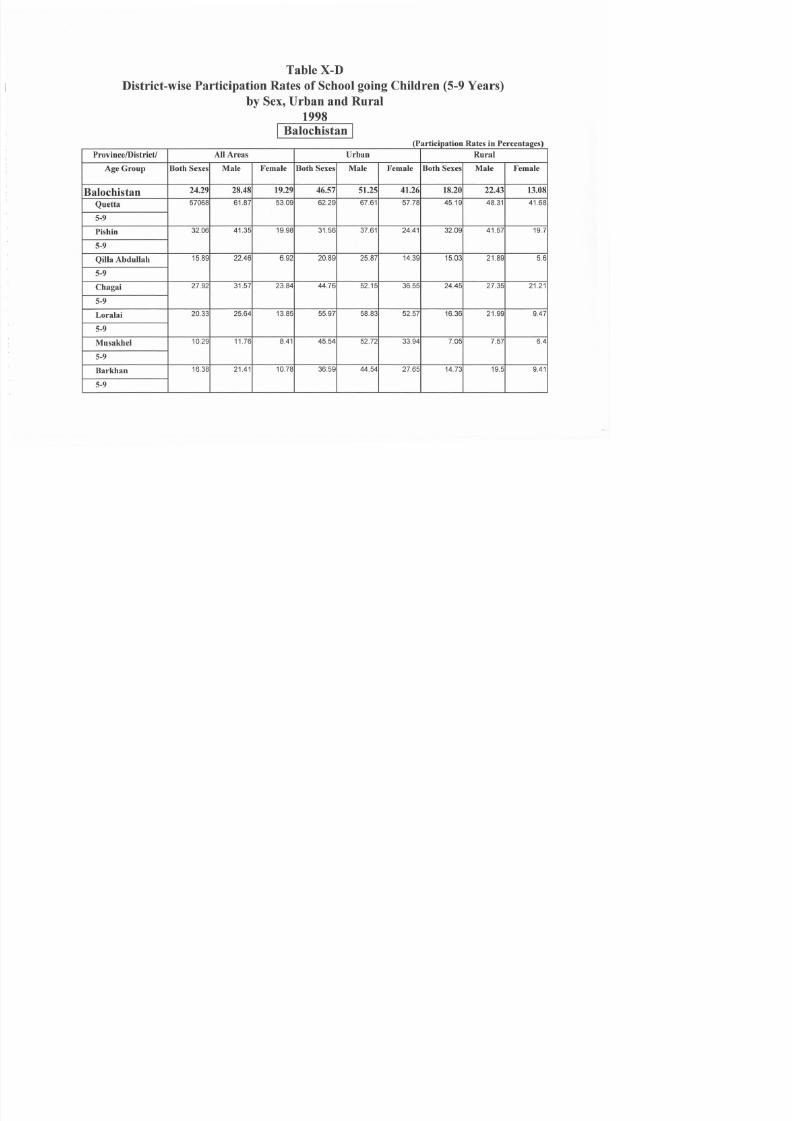
8/18/2019 litracy rate trends pakistan
http://slidepdf.com/reader/full/litracy-rate-trends-pakistan 145/155
Pishin
32.06
41.35
19.98
31.56
37.61
24.41
32.09 41.57 19.7
5-9
Qilla Abdullah
15.89 22.46 6.92 20.89 25.87 14.39 15.03 21.89 5.6
5-9
Chagai
27.92 31.57 23.84 44.76 52.15 36.55 24.45 27.35 21.21
5-9
Loralai
20.33 25.64 13.85 55.97 58.83 52.57 16.36 21.99
9.47
5-9
Musakhel
10.29 11.76
8.41 45.54
52.72 33.94
7.05 7.57 6.4
5-9
Barkhan
16.38
21.41
10.78
36.59
44.54
27.65 14.73 19.5 9.41
5-9
ProvincelDistrictl
All Areas Urban Rural
Age Group
Both Sexes Male Female Both Sexes Male Female Both Sexes Male Female
Killa Saifullah
21 71
25 4 17 17 43 35
44 59 41 71 18 52
22 21 13 47
5 9
Zhob
14 35
18 59
9 15 48 32
54 81 39 52
9 14 12 74 4 78
5 9
Sibi
17 7
20 59 14 4 30 05 32 96 26 77 11 98
14 92 8 58
5 9
Ziarat
42 45 48 8 34 61 17 19 20 13 79 42 73 49 13
34 85
5 9
Kohlu
4 68 5 92
3 12 40 12
48 55
29 4 1 24
1 76 0 59
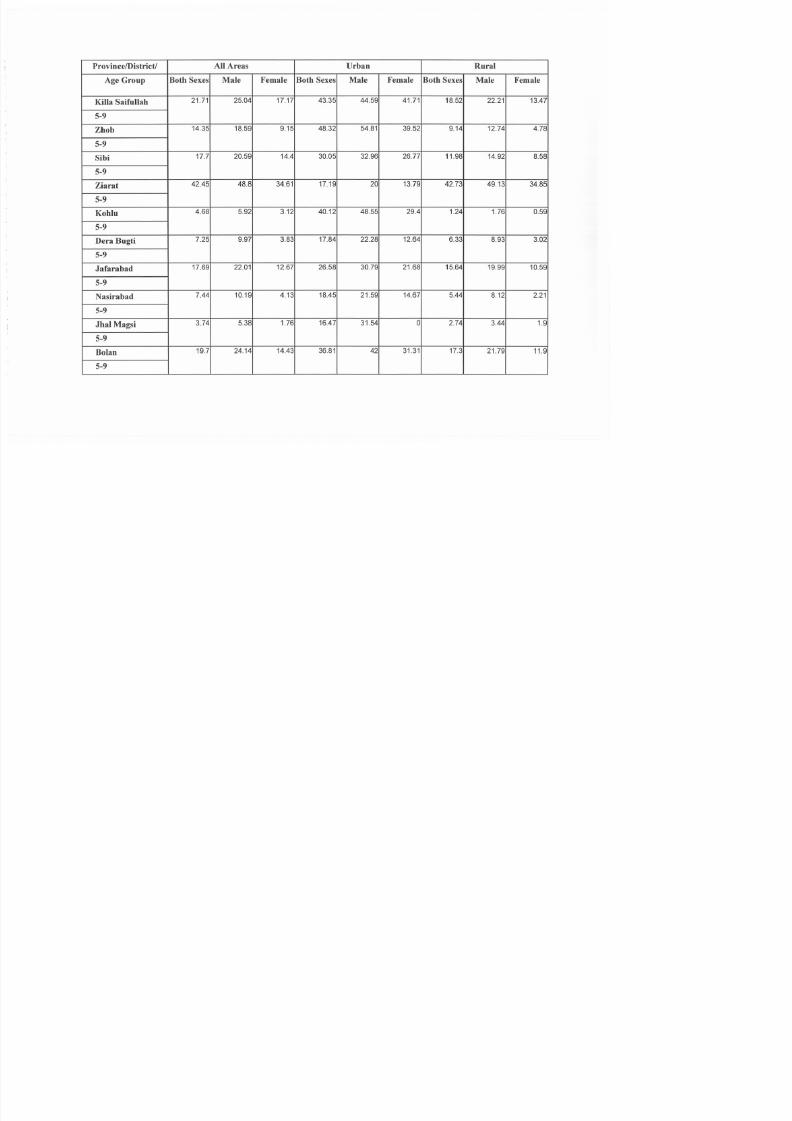
8/18/2019 litracy rate trends pakistan
http://slidepdf.com/reader/full/litracy-rate-trends-pakistan 146/155
5 9
Dera Bugti
7 25 9 97 3 83 17 84 22 28 12 64 6 33 8 93 3 02
5 9
Jafarabad
17 69 22 01
12 67 26 58
30 79 21 68 15 64
19 99
1 59
5 9
Nasirabad
7 44
10 19 4 13
18 45
21 59 14 67 5 44
8 12 2 21
5 9
Jhal Magsi
3 74 5 38 1 76 16 47 31 54 0 2 74
3 44 1 9
5 9
Bolan
19 7 24 14 14 43 36 81 42 31 31 17 3 21 79
11 9
5 9
ProvincelDistrictl
All Areas Urban
Rural
Age Group
Both
Sexes
Male Female Both
Sexes
Male Female Both
Sexes
Male Female
Kalat
12 77 16 74 8 38 47 76
56 46
38 67 7 38 10 81 3 55
9
Mastung
22 44 28 8 16 22 49 72
53 98
44 99 17 98 23 83 11 52
9
Khuzdar
18 86 21 41
16
30 95 34 3 27 21 14 23
16 48 11 73
9
Awaran
14 08 15 92 11 93
14 08 15 92 11 93
9
Kharan
13 85
17 72
9 39
34 8 44 89
22 32 10 79
13 74 7 37
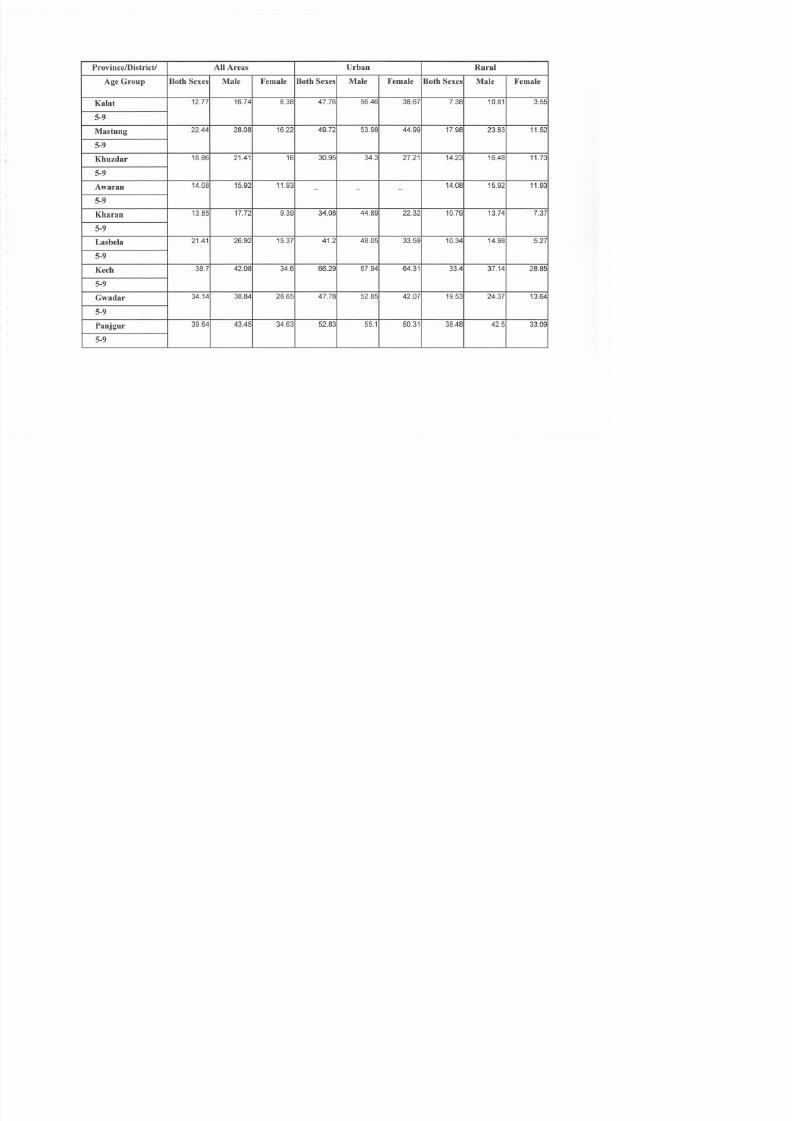
8/18/2019 litracy rate trends pakistan
http://slidepdf.com/reader/full/litracy-rate-trends-pakistan 147/155
9
Lasbela
21 41 26 92 15 37 41 2 48 5 33 59 10 34 14 98 5 27
9
Kech
38 7
42 08 34 6 66 29
67 94 64 31 33 4
37 14 28 85
9
Gwadar
34 14 38 84 28 65 47 78 52 85
42 07 19 53
24 37
13 64
9
Panjgur
39 64 43 45 34 63 52 83 55 1 5 31 38 48 42 5
33 9
9
Table X-A
District-wise Participation Rates of School going Children 5-9 Years
by Sex, Urban and Rural
1998
I Punjab I
Participation Rates in Percentages
Province/Districtl All Areas Urban Rural
Age Group
Both Sexes Male Female
Both Sexes Male Female Both Sexes Male Female
PUD.jab
48.20 52.28
43.83 62.95 64.95 60.81 44.28
48.93 39.29
Attock
51.77
57.78 45.43 64.6 67.31 61.7 48.51 55.34 41.32
5-9
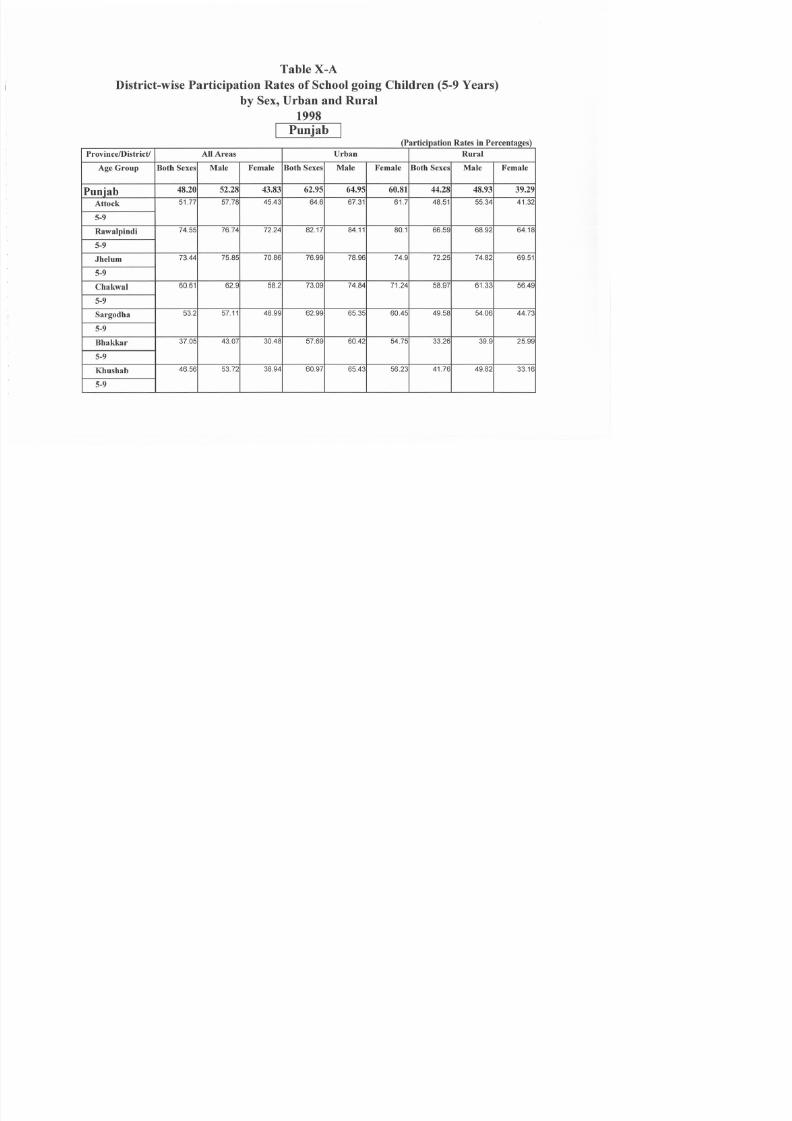
8/18/2019 litracy rate trends pakistan
http://slidepdf.com/reader/full/litracy-rate-trends-pakistan 148/155
Rawalpindi
74.55 76.74 72 24 82 17 84 11 8 1 66 59 68 92 64 18
5-9
Jhelum
73.44
75 85 7 86 76 99 78 96 74 9 72 25 74 82 69 51
5-9
Chakwal
60.61 62 9 58 2 73 9 74 84 71 24 58 97 61 33 56 49
5-9
Sargodha
53.2 57 11 48 99 62 99 65.35 60.45 49 58 54 6 44 73
5-9
Bhakkar
37.05 43.07 30.48 57 69 60.42 54 75 33 26 39.9 25.99
5-9
Khushab
46.56 53.72 38.94 6 97 65.43 56 23 41 76 49 82 33.16
5-9
Province/District/ All Areas
Urban
Rural
Age Group
Both Sexes Male Female
Both Sexes Male Female Both Sexes Male Female
Mianwali
49 42
55 99 42 39 65 18 68 76 61 43 45 7 53 02 37 84
5 9
Faisalabad
58 15 59 79 56 4 65 79 66 57 64 97 52 9 55 18 50 43
5 9
Jhang
45 92
54 21 36 88 57 92
6 54
55 1 42 45 52 39 31 55
5 9
Toba Tek Singh
58 6 60 49 55 45
65 7 67 4 63 92 56 33
58 94 53 51
5 9
Gujranwala
57 87 59 1 56 55 61 42 62 76 60 01
54 5
55 67 53 24
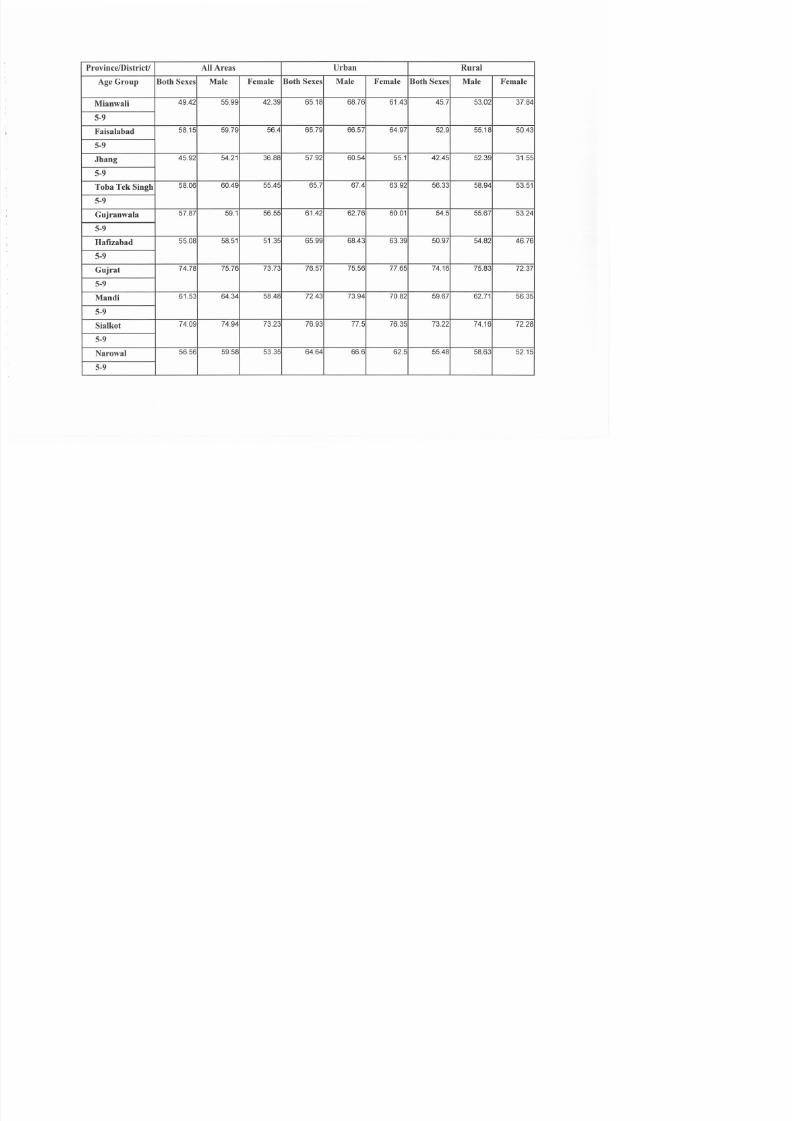
8/18/2019 litracy rate trends pakistan
http://slidepdf.com/reader/full/litracy-rate-trends-pakistan 149/155
5 9
HafIzabad
55 8 58 51
51 35 65 99 68 43 63 39 50 97 54 82
46 76
5 9
Gujrat
74 78 75 76 73 73 76 57 75 56 77 65 74 16 75 83 72 37
5 9
Mandi
61 53
64 34 58 48 72 43 73 94 70 82 59 67 62 71 56 35
5 9
Sialkot
74 9 74 94 73 23 76 93 77 5 76 35 73 22 74 16 72 28
5 9
Narowal
56 56 59 58 53 35 64 64 66 6 62 5 55 48 58 63 52 15
5 9
Province District All Areas
Urban Rural
Age
Group
Both Sexes Male Female Both Sexes Male Female
Both
Sexes
Male
Female
Lahore
64 1 65 55 62 46
67 36
68 53
66 19 51 7 54 17 47 98
5 9
Kasur
41 58
44 57
38 37
58 8
59 69
57 85 36 84 4 42 33
9
Okara
43 56 48 7
38 41 56 83 57 48 56 18 39 87 46 28 33 46
5 9
Sheikhupura
49 59
51 92 47 1 6 3 61 17 58 82 46 1 48 75 43 6
5 9
Vehari
39 24 43 51 34 63
55 36 58 12 52 38 36 3 4 85 31 39
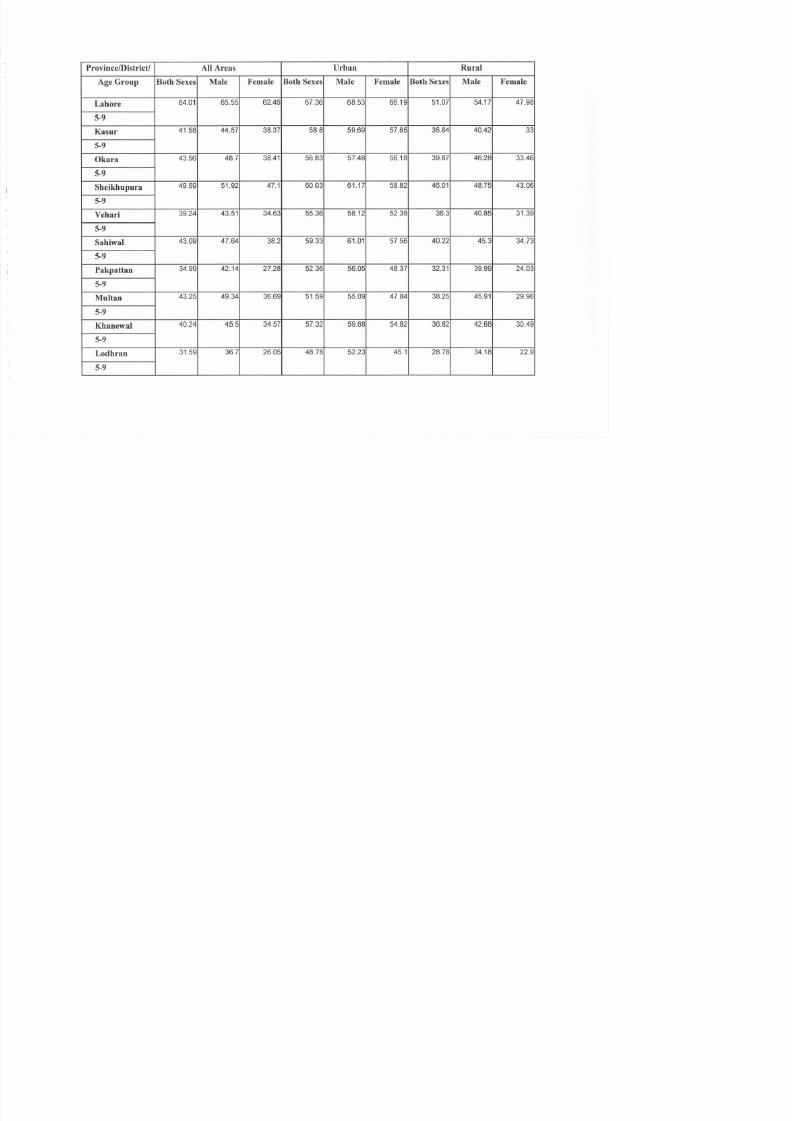
8/18/2019 litracy rate trends pakistan
http://slidepdf.com/reader/full/litracy-rate-trends-pakistan 150/155
5 9
Sahiwal
43 9 47 64 38 2 59 33 61 1 57 56 4 22 45 3 34 73
5 9
Pakpattan
34 99
42 14 27 28 52 36 56 5 48 37 32 31 39 99 24 3
5 9
Multan
43 25
49 34 36 69 51 59 55 9 47 84 38 25 45 91 29 96
5 9
Khanewal
4 24
45 5 34 57 57 32 59 68 54 82 36 82 42 68 3 49
5 9
Lodhran
31 59 36 7 26 5 48 78 52 23 45 1 28 78 34 18 22 9
5 9
ProvincelDistrictl All
Areas
Urban
Rural
Age
Group
Both
Sexes
Male Female Both
Sexes
Male Female Both
Sexes
Male
Female
Dera Ghazi
23 69 28 61
18 26
74 18
74 8 73 53 16 86
22 49
1 63
9
Rajanpur
25 1
3 72 18 57 55 66
59 24 51 86 2 24 26 43 13 2
9
Layyah
37 67 43 3 31 84 58 82
6 73 56 77 34 92 4 75 28 57
9
Muzaffargarh
27 49 33 27 21 21 57 61 58 9 56 21 23 51
29 89 16 56
9
Bahawalpur
34 67 38 26 3 77 56 7
58 75 54 51 27 31 31 48 22 75

8/18/2019 litracy rate trends pakistan
http://slidepdf.com/reader/full/litracy-rate-trends-pakistan 151/155
9
Bahawalnagar
38 66 42 46 34 57 55 7 57 43 52 56 34 9 39 5
3 44
9
Rahim Yar
31 89
35 64 28 15 63 29
65 5 61 53 25 29 32 2 68
9
Table X-E
Participation Rates ofSchoolgoingChildren
by Sex,Urban and Rural Islamabad
I Islamabad I
1998
participation Rates in Percentages
ProvincelDistrictl
All Areas Urban
Rural
Age Group
Both Sexes Male Female Both Sexes Male Female
Both Sexes
Male Female
Islamabad
60 52 61 26 59 73
62 75 62 68 62 83 56 8 58 88
54 59
09 May
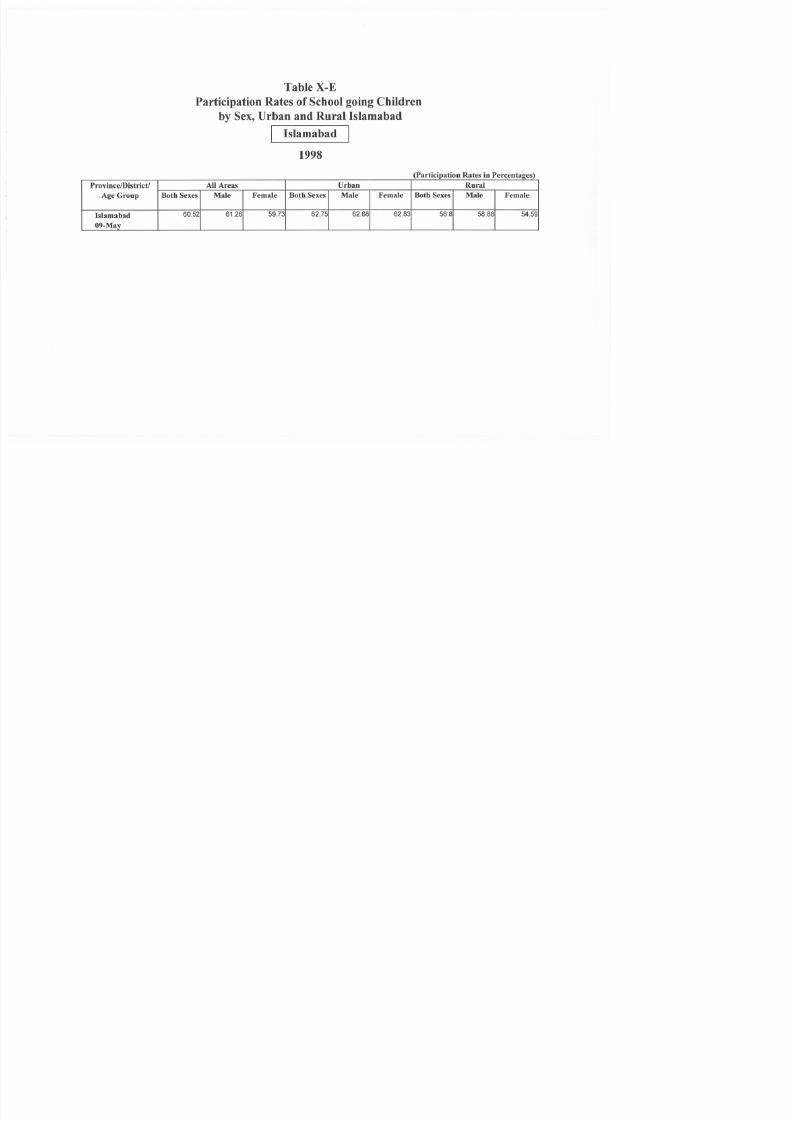
8/18/2019 litracy rate trends pakistan
http://slidepdf.com/reader/full/litracy-rate-trends-pakistan 152/155
BIBLIOGRAPHY
Adam Curle. Planning for Education in Pakistan: A Personal Case Study, Replica Books, 1999.
Bhola H.S. Literacy Lessons: Literacy for Survival and for More Than Mere Survival. (Literacy Lessons, International Literacy Year),
International Bureau of Education. Geneva, 1989.
Bouge, Donald J. Principles of Demography, New York: John Wiley and Sons, Inc, 1961.
Calfee, Robert, and Nelson-Barber, Sharon, Cross-cultural perspectives on classroom discourse and literacy, NY: Teachers College Press,
1991
8/18/2019 litracy rate trends pakistan
http://slidepdf.com/reader/full/litracy-rate-trends-pakistan 153/155
1991.
Geraldo, Nasimento. Illiteracy in Figures: UNESCO, Paris, France. 1992
Ghafoor, Abdul. Quest for Literacy, National Education and Training Commission , Ministry of Education , Govt. of Pakistan , Islamabad,
August 1994.
Ghafoor, Abdul and Khan, Arshad Saeed, Literacy Efforts in Pakistan, National Education and Training Commission, Islamabad-Pakistan 1994.
Goodman, K., and Y. Goodman. Learning to Read Is Natural, Paper presented at Conference on Theory and Practice of Beginning Reading
Instruction, Pittsburgh, April 13, 1976.
Levine, Kenneth. Literacy Lesson: The Future of Literacy and Literacies of the Future: (Literacy Lessons)
Myers, Robert. World Education Forum: Education For All 2000 Assessment. Thematic Studies. Early Childhood Care and Development,
UNESCO Paris 2000.
Richard L. Venezky, Carl F. Kaestle, and Andrew Sum, The Subtle Danger: Reflections on the Literacy Abilities of America's Young Adults,
Educational Testing Service, 1987.
Spache, G.D. Reading in the Elementry School, Bosten, MA: Allyn & Bacon, 1964.
Skilbeck, M.. Education for All. Trends and Issues from an OECD Perspective, Western Europe and North America. Regional Report for the
EFA 2000 Assessment, 2000.
UNESCO. 50 Years of Education. United Nations Educational, Scientific and Cultural Organization,. Paris:1997.
UNESCO. World Education Forum, Final Report, Paris: 2000
Venezky, R. L., Wagner, D. A., & Ciliberti, B. S. (Eds.), Toward defining literacy. Newark, DE: International Reading Association, 1991.
Wagner, Daniel A. ; Literacy Lesson: Literacy and Research: past, present and future. (Literacy Lessons, International Literacy Year)
International Bureau of Education. Geneva, 1990.
Wagner, Daniel A. World Education Forum: Education For All 2000 Assessment .The Thematic Studies. Literacy and Adult Education.
UNESCO, Paris: 2000.
8/18/2019 litracy rate trends pakistan
http://slidepdf.com/reader/full/litracy-rate-trends-pakistan 154/155
Whitman, Cheryl Vince. et al. World Education Forum: Education For All 2000 Assessment. Thematic Studies. School Heath and Nutrition,UNESCO, Paris: 2000.
Annexure - 1
S.No. Year of census Litracy Rate Growth Rate
1 1951 16.4
2 1961 16.3 -0.06114357
3 1972 21.7 2.635467846
4 1981 26.2 2.115932219
5 1998 43.92 3.085530026
Formulae used for Calculating the Growth Rate and Projections
Growth Rates of Literacy in Pakistan
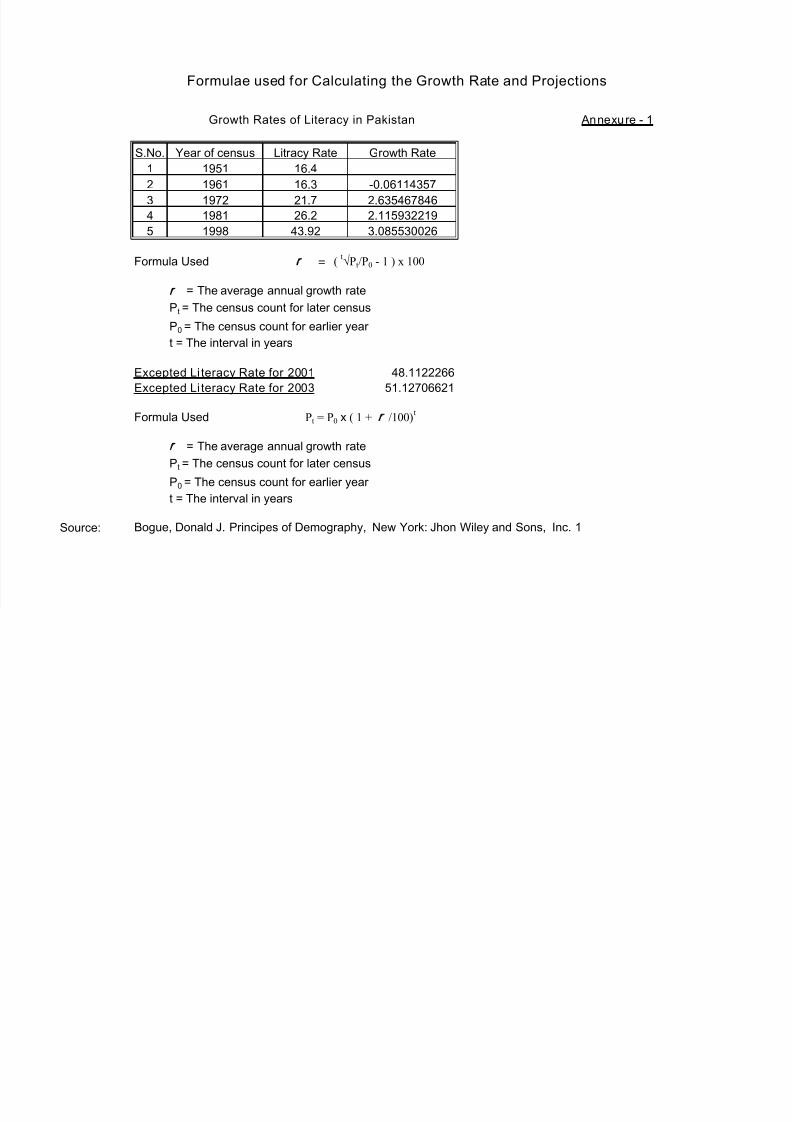
8/18/2019 litracy rate trends pakistan
http://slidepdf.com/reader/full/litracy-rate-trends-pakistan 155/155
5 998 3 9 3 0855300 6
48.1122266
51.12706621
Source:
= ( t√Pt/P0 - 1 ) x 100
Excepted Li teracy Rate for 2001
= The average annual growth rate
P0 = The census count for earlier year
t = The interval in years
Pt = The census count for later census
Excepted Li teracy Rate for 2003
P0 = The census count for earlier year
t = The interval in years
Bogue, Donald J. Principes of Demography, New York: Jhon Wiley and Sons, Inc. 1
Formula Used Pt = P0 x ( 1 + /100)t
= The average annual growth rate
Pt = The census count for later census
Formula Used