Embed Size (px)
Citation preview
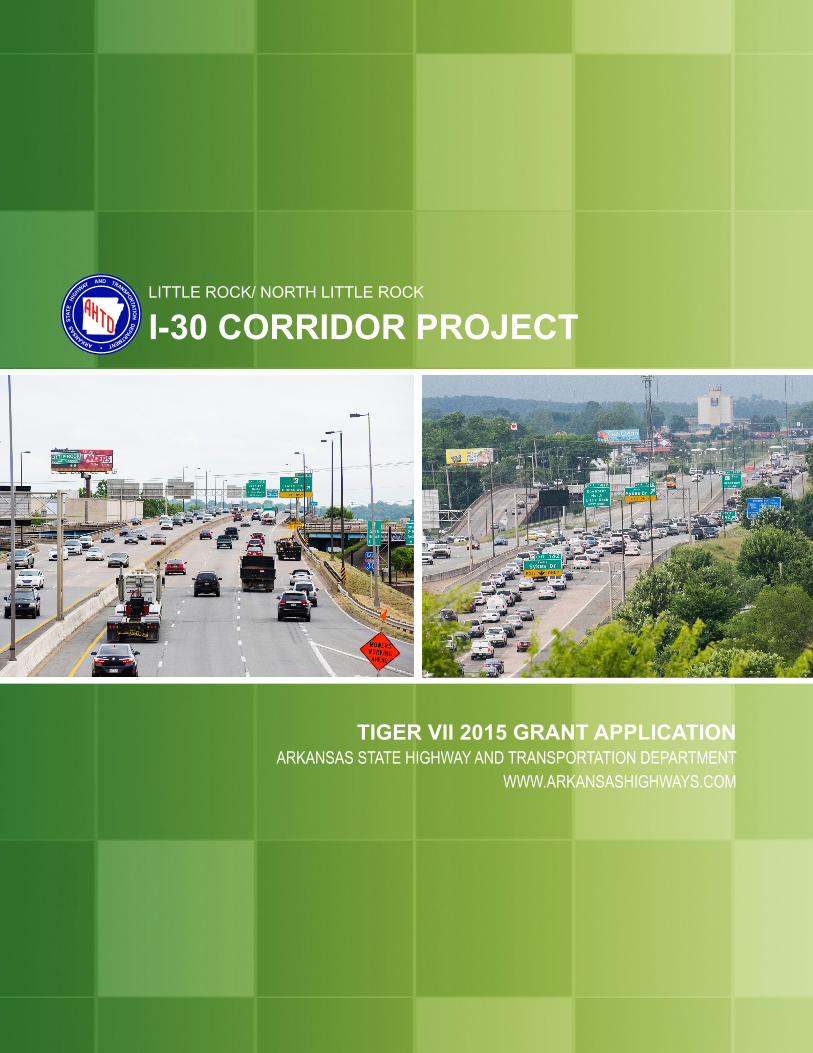
TIGER VII 2015 GRANT APPLICATIONARKANSAS STATE HIGHWAY AND TRANSPORTATION DEPARTMENT
WWW.ARKANSASHIGHWAYS.COM
LITTLE ROCK/ NORTH LITTLE ROCK
I-30 CORRIDOR PROJECT
TIGER VII Discretionary Grant Application 2015
TABLE OF CONTENTS
A. OVERVIEW ............................................................................................................3B. PROJECT DESCRIPTION .................................................................................. 4C. PROJECT LOCATION ......................................................................................... 6D. PROJECT PARTIES ............................................................................................. 9E. GRANT FUNDS AND SOURCES/USES OF PROJECT FUNDS ........... 12F. SELECTION CRITERIA ..................................................................................... 13 I) PRIMARY SELECTION CRITERIA .................................................................. 13 a) State of Good Repair ................................................................................ 13 b) Quality of Life ............................................................................................ 16 d) Safety........................................................................................................22 II) SECONDARY SELECTION CRITERIA ........................................................... 24 a) Innovation ................................................................................................. 24 b) Partnership ............................................................................................... 25G. RESULTS OF BENEFIT-COST ANALYSIS ................................................. 27H. PROJECT READINESS ................................................................................... 28I. FEDERAL WAGE RATE CERTIFICATION .................................................29J. NOTICE OF REVISION .....................................................................................30
LIST OF FIGURES AND TABLES
Figure 1 [I-30 Corridor Project Map] ............................................. 4Table 1 [Needs and Purpose] ....................................................... 4Figure 2 [PEL Recommendation].................................................. 5Figure 3 [I-30 Corridor Project Area] ............................................ 6Table 2 [Population] ...................................................................... 6Table 3 [Median Income] .............................................................. 6Table 4 [Population by Race] ........................................................ 7Table 5 [Metropolitan Statistical Areas] ......................................... 7Table 6 [Major Employers in Central Arkansas] ............................ 7Figure 4 [Concentrated Employment Areas] ................................. 8Table 7 [PEL Technical Work Group Members] ...........................11Table 8 [Funding Source] ............................................................ 12Figure 5 [I-30 Pavement Condition] ............................................ 13Figure 6 [I-40 Pavement Condition] ............................................ 13Figure 7 [Functional Deficiencies] .............................................. 14Figure 8 [I-30 Arkansas River Bridge] ......................................... 14Figure 9 [Spalled Bearing Pad] ................................................... 15
Figure 10 [Beam Corrosion] ....................................................... 15Figure 11 [Navigation Channel Obstruction] ............................... 15Figure 12 [Existing 2014 Peak Hour Mobility] ............................. 17Figure 13 [Existing 2014 Peak Hour Speed Profiles] ................. 17Figure 14 [Future 2041 No Action Peak Hour Mobility] .............. 19Figure 15 [Future 2041 No Action Peak Hour Speed Profiles] ... 19Figure 16 [Future 2041 PEL Recommended Alternative Mobility] .................................................................... 20Figure 17 [Future 2041 PEL Recommended Peak Hour Speed Profiles] ..................................................................... 21Table 9 [PEL Recommended Alternatives)] ................................ 21Table 10 [Historic Crash Rates (2010-2012)] ............................. 22Figure 18 [I-30/I-40 Main Lane KA Crash Types (2010-2012]] .. 23Table 11 [Improvement Alternatives Comparison] ...................... 24Table 12 [List of Partners] .......................................................... 26Table 13 [Results of Benefit-Cost Analysis] ................................ 27Table 14 [Project Readiness] ...................................................... 28
TIGER VII Discretionary Grant Application 2015
| 3
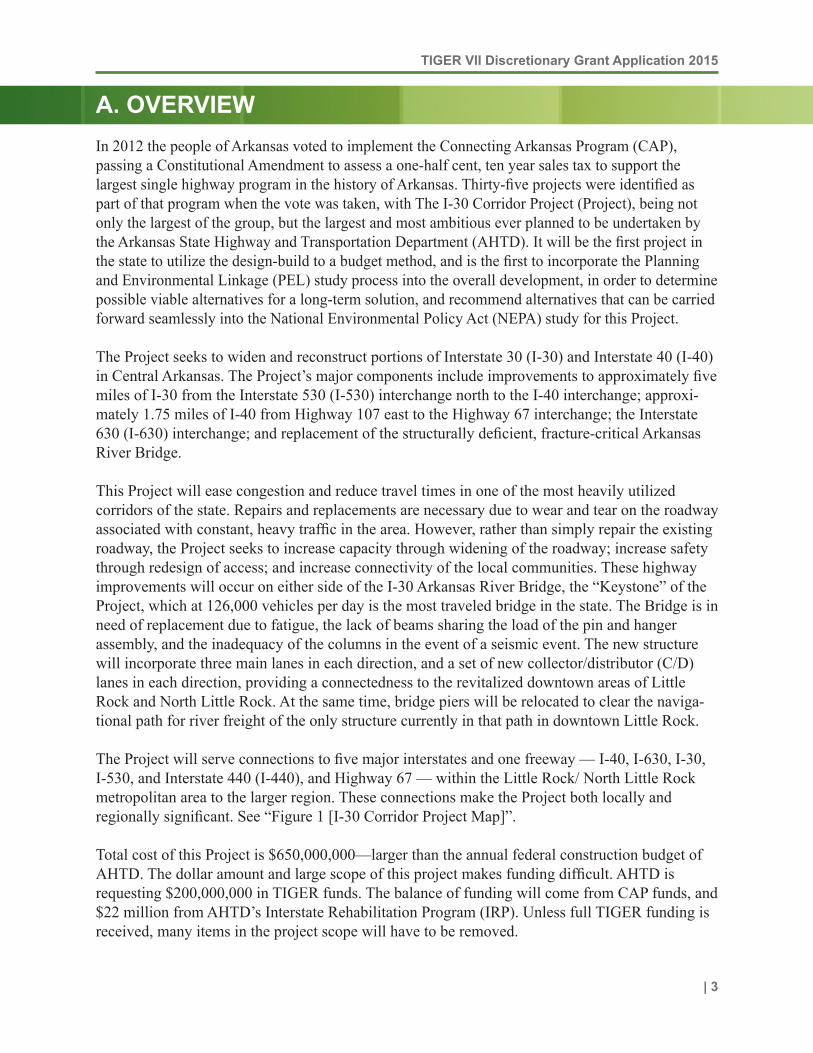
A. OVERVIEWIn 2012 the people of Arkansas voted to implement the Connecting Arkansas Program (CAP), passing a Constitutional Amendment to assess a one-half cent, ten year sales tax to support the largest single highway program in the history of Arkansas. Thirty-five projects were identified as part of that program when the vote was taken, with The I-30 Corridor Project (Project), being not only the largest of the group, but the largest and most ambitious ever planned to be undertaken by the Arkansas State Highway and Transportation Department (AHTD). It will be the first project in the state to utilize the design-build to a budget method, and is the first to incorporate the Planning and Environmental Linkage (PEL) study process into the overall development, in order to determine possible viable alternatives for a long-term solution, and recommend alternatives that can be carried forward seamlessly into the National Environmental Policy Act (NEPA) study for this Project.
The Project seeks to widen and reconstruct portions of Interstate 30 (I-30) and Interstate 40 (I-40) in Central Arkansas. The Project’s major components include improvements to approximately five miles of I-30 from the Interstate 530 (I-530) interchange north to the I-40 interchange; approxi-mately 1.75 miles of I-40 from Highway 107 east to the Highway 67 interchange; the Interstate 630 (I-630) interchange; and replacement of the structurally deficient, fracture-critical Arkansas River Bridge.
This Project will ease congestion and reduce travel times in one of the most heavily utilized corridors of the state. Repairs and replacements are necessary due to wear and tear on the roadway associated with constant, heavy traffic in the area. However, rather than simply repair the existing roadway, the Project seeks to increase capacity through widening of the roadway; increase safety through redesign of access; and increase connectivity of the local communities. These highway improvements will occur on either side of the I-30 Arkansas River Bridge, the “Keystone” of the Project, which at 126,000 vehicles per day is the most traveled bridge in the state. The Bridge is in need of replacement due to fatigue, the lack of beams sharing the load of the pin and hanger assembly, and the inadequacy of the columns in the event of a seismic event. The new structure will incorporate three main lanes in each direction, and a set of new collector/distributor (C/D) lanes in each direction, providing a connectedness to the revitalized downtown areas of Little Rock and North Little Rock. At the same time, bridge piers will be relocated to clear the naviga-tional path for river freight of the only structure currently in that path in downtown Little Rock.
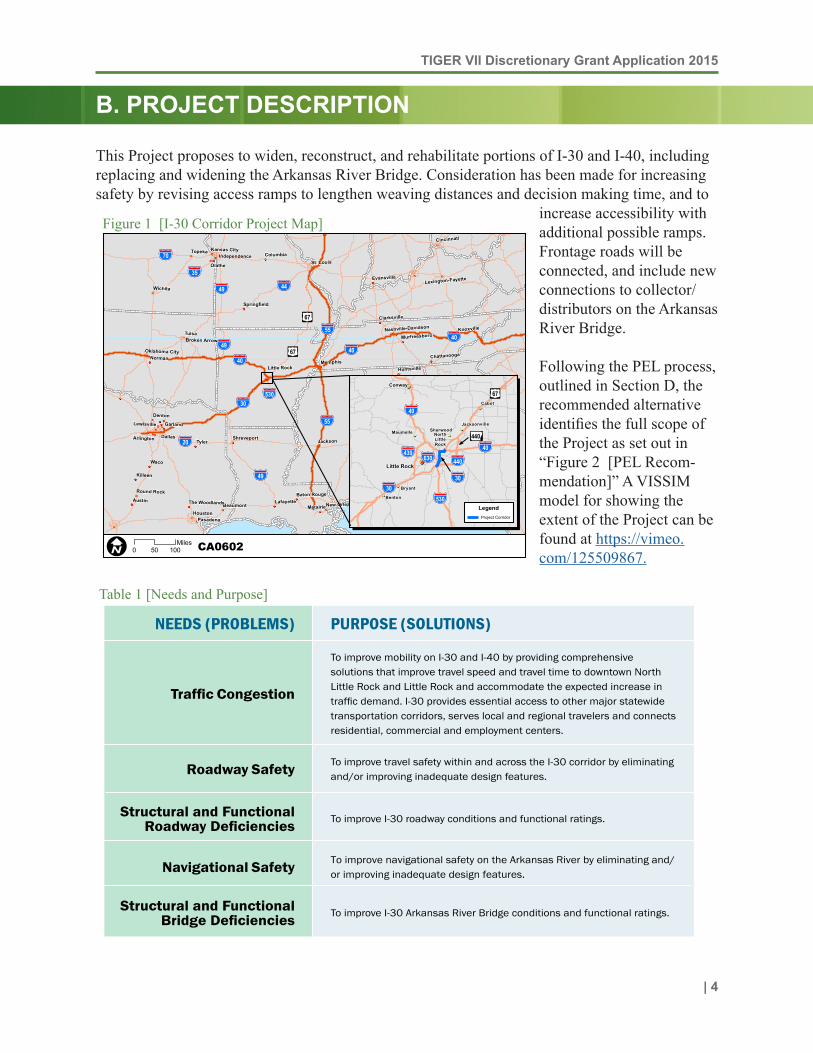
The Project will serve connections to five major interstates and one freeway — I-40, I-630, I-30, I-530, and Interstate 440 (I-440), and Highway 67 — within the Little Rock/ North Little Rock metropolitan area to the larger region. These connections make the Project both locally and regionally significant. See “Figure 1 [I-30 Corridor Project Map]”.
Total cost of this Project is $650,000,000—larger than the annual federal construction budget of AHTD. The dollar amount and large scope of this project makes funding difficult. AHTD is requesting $200,000,000 in TIGER funds. The balance of funding will come from CAP funds, and $22 million from AHTD’s Interstate Rehabilitation Program (IRP). Unless full TIGER funding is received, many items in the project scope will have to be removed.
TIGER VII Discretionary Grant Application 2015
| 4
B. PROJECT DESCRIPTION
This Project proposes to widen, reconstruct, and rehabilitate portions of I-30 and I-40, including replacing and widening the Arkansas River Bridge. Consideration has been made for increasing safety by revising access ramps to lengthen weaving distances and decision making time, and to
increase accessibility with additional possible ramps. Frontage roads will be connected, and include new connections to collector/distributors on the Arkansas River Bridge.
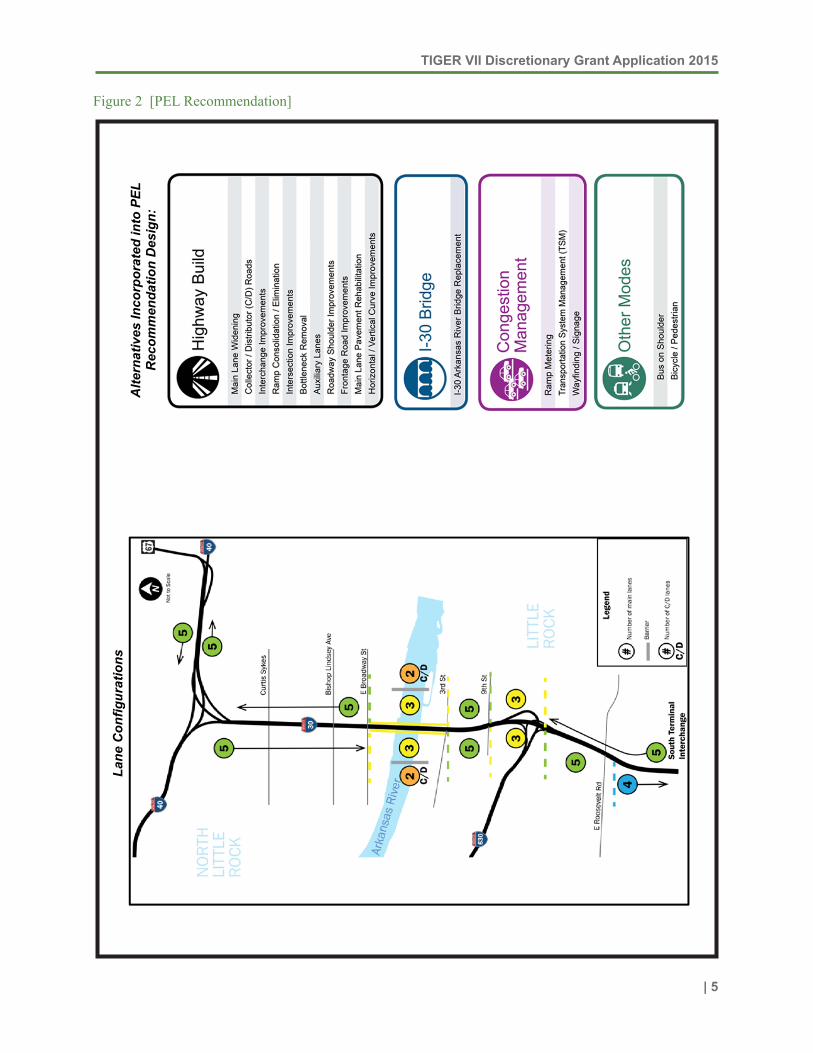
Following the PEL process, outlined in Section D, the recommended alternative identifies the full scope of the Project as set out in “Figure 2 [PEL Recom-mendation]” A VISSIM model for showing the extent of the Project can be found at https://vimeo.com/125509867.
5
INTRODUCTION
INTRO TO VISIONING WORKSHOP Visioning Workshop Quick Facts
WHAT: I-30 Visioning Workshop
JOB: CA0602 I-530-Hwy. 67 (Widening & Reconst.) (I-30 & I-40)
JOB OWNER: Arkansas State Highway and Transportation Department
DATE: November 19, 2014
TIME: 8:15 a.m. – 4:00 p.m.
WHERE : Garver
ADDRESS: 4701 Northshore Drive, North Little Rock, Arkansas
Visioning Workshop Purpose and Scope
This first Visioning Workshop invited stakeholders in the community to provide input and prioritize their ideas for the I-30 corridor. This included insight into preserving and enhancing aesthetic, historic, and community resources. A second Visioning Workshop will be held during the NEPA/Schematic phase to examine potential Context Sensitive Solutions (CSS) and design concepts in greater detail. Based on stakeholder feedback and available funding, CSS/aesthetic guidelines will be developed following this second Visioning Workshop and included in the Design-Build request for proposals, pending AHTD approval.
NEEDS (PROBLEMS) PURPOSE (SOLUTIONS)
Traffic Congestion
To improve mobility on I-30 and I-40 by providing comprehensive solutions that improve travel speed and travel time to downtown North Little Rock and Little Rock and accommodate the expected increase in traffic demand. I-30 provides essential access to other major statewide transportation corridors, serves local and regional travelers and connects residential, commercial and employment centers.
Roadway Safety To improve travel safety within and across the I-30 corridor by eliminating and/or improving inadequate design features.
Structural and Functional Roadway Deficiencies To improve I-30 roadway conditions and functional ratings.
Navigational Safety To improve navigational safety on the Arkansas River by eliminating and/or improving inadequate design features.
Structural and Functional Bridge Deficiencies To improve I-30 Arkansas River Bridge conditions and functional ratings.
Table 1 [Needs and Purpose]
Figure 1 [I-30 Corridor Project Map]
44
70
35
40
49
30530
49
20
40
55
55
4940
Waco
Tyler
Tulsa
Denton
Dallas
Austin
Norman
Topeka
Olathe
Mobile
Killeen
Houston
Garland
Memphis
Jackson
Wichita
Atlanta
Pasadena
Beaumont
Columbia
Metairie
Columbus
Arlington
Knoxville
St. Louis
Lafayette
Round Rock
Lewisville
Cincinnati
Shreveport
Evansville
Montgomery
Huntsville
Birmingham
Clarksville
Chattanooga
Springfield
New Orleans
Baton Rouge
Kansas City
Tallahassee
Little Rock
MurfreesboroBroken Arrow
Independence
The Woodlands
Oklahoma City
Lexington-Fayette
Nashville-Davidson
65
10
85
59
16
575
675
110
359
231
80
84
43
Benton
NorthLittleRock
Little Rock
Conway
Cabot
Bryant
SherwoodMaumelle
Jacksonville
0 10050Miles CA0602
LegendProject Corridor
40
30
43040
440
530
630
30
67
67
440
67
TIGER VII Discretionary Grant Application 2015
| 5
I-30
PE
L R
epor
t C
A06
02
21
Figu
re 8
. PE
L R
ecom
men
datio
n
Alte
rnat
ives
Inco
rpor
ated
into
PEL
R
ecom
men
datio
n D
esig
n:
Lane
Con
figur
atio
nsFigure 2 [PEL Recommendation]
TIGER VII Discretionary Grant Application 2015
| 6
C. PROJECT LOCATION
30
165
161
67
630
10
70
70
630
30
30
40
40
440
365
107
100
365138A
1
3 4
138B
138
1A
139A
139A
139B139B
139A
140
140B
141A
141A
141B
141B
142
143A
143B
153B
153A
153B
154
156 157
155
1A
1B1
152
1
1B 1A
2A
2B
Che
ster
Sta
te
Bro
adw
ay
MLK
Ch
ildre
n's
Way
S. B
atte
ry
Cen
ter
Loui
sian
a
Mai
nS
cott
Cum
berl
and
Com
mer
ce
E. 9th
E. 6th
E. 3rd
E. 15th
E. 17th
E. 21st
E. Roosevelt
E. 28th
S. A
rch
St.
Co
nfed
era
te
Spr
inge
r
Riverfront
E. Broadway
N. C
ypre
ss
N. L
ocus
t
Curtis SykesE. 15th
Bishop LindseyE. 7th
E. 13th
Nor
th H
ills
E. 19th
Mai
n
JFK
Pershing
Percy Machin
DoyleVenable
Robin
son
Cam
p
MacA
rthur
Pike
Springhill
E. McCain
McCain
Markham
Markham
NorthLIttleRock
LITTLE ROCK
70
176
70
367
367
365
ARKANSAS
RIVERState
CapitolClinton
PresidentialLibrary
HeiferVillage
VerizonArena
OldStateHouse
Dickey-Stephens
Park
StatehouseConvention
Center
Baptist HealthMedical Center
LL AA KK EE WW OO OO DD
B A R I N GB A R I N GC R O S SC R O S S
R O S ER O S EC I T YC I T Y
Ft. RootsVA Hospital
P A R KP A R KH I L LH I L L
ClintonNationalAirport
Connecting Arkansas Job CA0602Little Rock & North Little Rock, AR
PM: PS: AJD: 3-10-2015
0 10.5Miles
Figure 3 [I-30 Corridor Project Area]
2010 Census, Population Little Rock North Little
Rock White 46.7% 51.6%
Black or African American 42.3% 39.7%Native American 0.4% 0.4%
Asian / Pacific Islander 2.8% 1.0%Hispanic or Latino 6.8% 5.7%
Two or More Races 1.7% 2.1%Data from United States Census Bureau
Median Income Little Rock North Little
Rock National
Median household income $44,896 $40,170 $53,046Population below the
poverty Line18.6% 21.9% 15.4%
Data from United States Census Bureau
2013 est. Census, population
Little Rock North Little
RockTotal
People 197,357 66,075 255,828Households 79,263 25,772 102,894
Density (peo./mile2) 4,624 1,210Data from United States Census Bureau
Year MSA 2013 724,385 2010 699,757 2000 610,518
Data from United States Census Bureau
Table 3 [Median Income]
2010 Census, Population Little Rock North Little
Rock White 46.7% 51.6%
Black or African American 42.3% 39.7%Native American 0.4% 0.4%
Asian / Pacific Islander 2.8% 1.0%Hispanic or Latino 6.8% 5.7%
Two or More Races 1.7% 2.1%Data from United States Census Bureau
Median Income Little Rock North Little
Rock National
Median household income $44,896 $40,170 $53,046Population below the
poverty Line18.6% 21.9% 15.4%
Data from United States Census Bureau
2013 est. Census, population
Little Rock North Little
RockTotal
People 197,357 66,075 255,828Households 79,263 25,772 102,894
Density (peo./mile2) 4,624 1,210Data from United States Census Bureau
Year MSA 2013 724,385 2010 699,757 2000 610,518
Data from United States Census Bureau
Table 2 [Population]
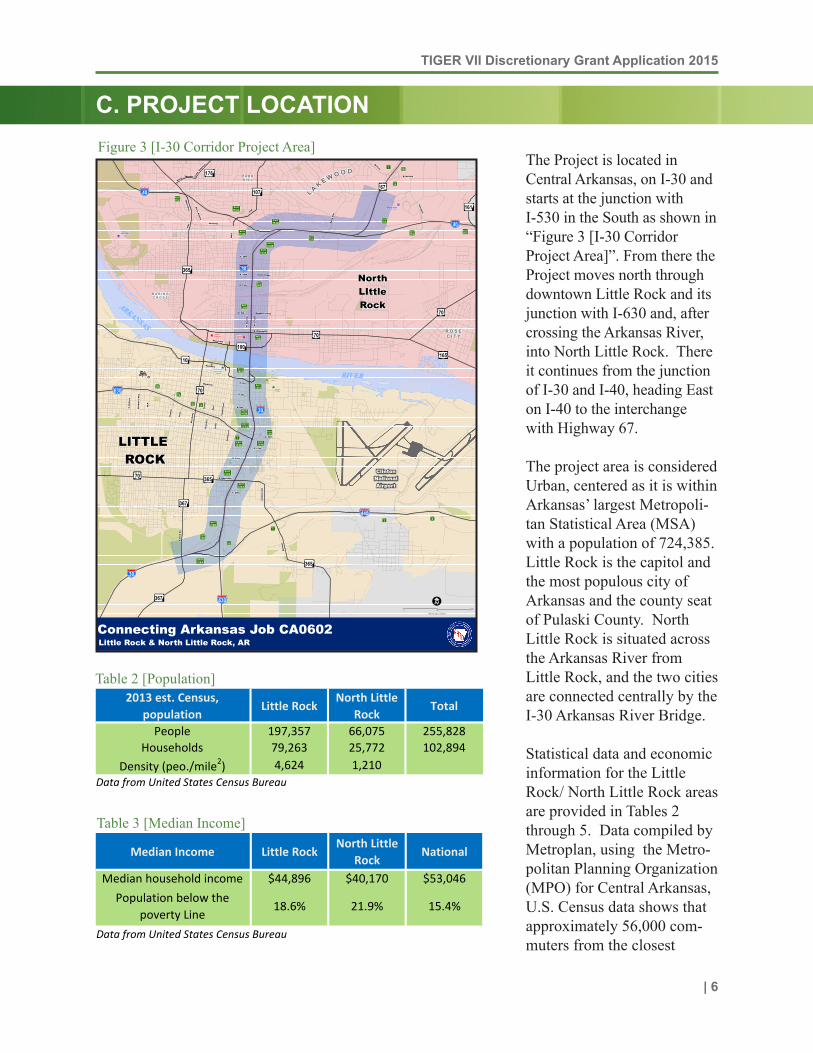
The Project is located in Central Arkansas, on I-30 and starts at the junction with I-530 in the South as shown in “Figure 3 [I-30 Corridor Project Area]”. From there the Project moves north through downtown Little Rock and its junction with I-630 and, after crossing the Arkansas River, into North Little Rock. There it continues from the junction of I-30 and I-40, heading East on I-40 to the interchange with Highway 67.
The project area is considered Urban, centered as it is within Arkansas’ largest Metropoli-tan Statistical Area (MSA) with a population of 724,385. Little Rock is the capitol and the most populous city of Arkansas and the county seat of Pulaski County. North Little Rock is situated across the Arkansas River from Little Rock, and the two cities are connected centrally by the I-30 Arkansas River Bridge.
Statistical data and economic information for the Little Rock/ North Little Rock areas are provided in Tables 2 through 5. Data compiled by Metroplan, using the Metro-politan Planning Organization (MPO) for Central Arkansas, U.S. Census data shows that approximately 56,000 com-muters from the closest
TIGER VII Discretionary Grant Application 2015
| 7
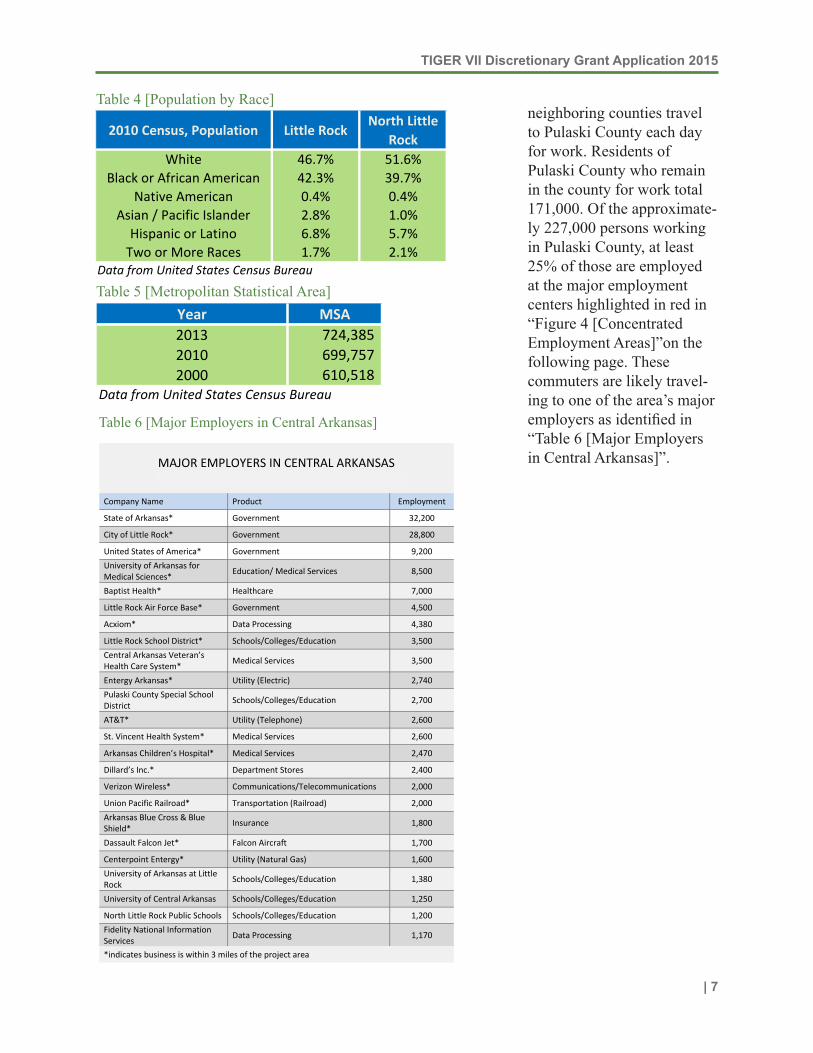
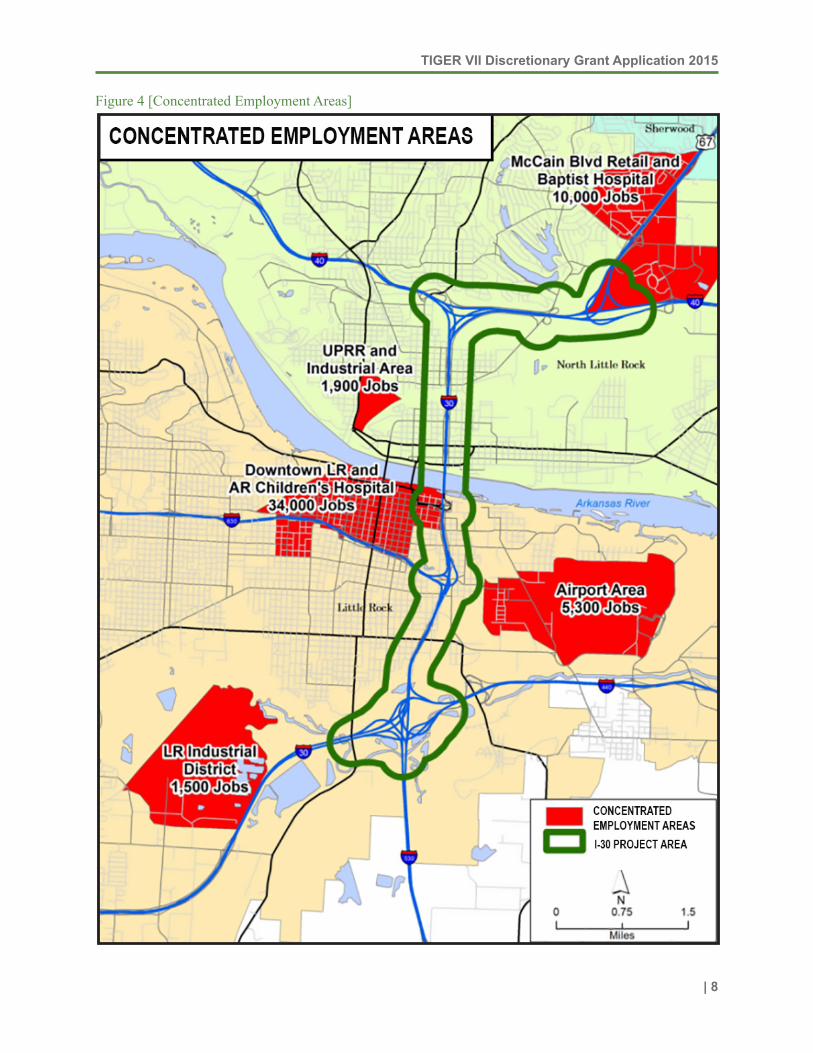
neighboring counties travel to Pulaski County each day for work. Residents of Pulaski County who remain in the county for work total 171,000. Of the approximate-ly 227,000 persons working in Pulaski County, at least 25% of those are employed at the major employment centers highlighted in red in “Figure 4 [Concentrated Employment Areas]”on the following page. These commuters are likely travel-ing to one of the area’s major employers as identified in “Table 6 [Major Employers in Central Arkansas]”.
2010 Census, Population Little Rock North Little
Rock White 46.7% 51.6%
Black or African American 42.3% 39.7%Native American 0.4% 0.4%
Asian / Pacific Islander 2.8% 1.0%Hispanic or Latino 6.8% 5.7%
Two or More Races 1.7% 2.1%Data from United States Census Bureau
Median Income Little Rock North Little
Rock National
Median household income $44,896 $40,170 $53,046Population below the
poverty Line18.6% 21.9% 15.4%
Data from United States Census Bureau
2013 est. Census, population
Little Rock North Little
RockTotal
People 197,357 66,075 255,828Households 79,263 25,772 102,894
Density (peo./mile2) 4,624 1,210Data from United States Census Bureau
Year MSA 2013 724,385 2010 699,757 2000 610,518
Data from United States Census Bureau
Table 4 [Population by Race]
2010 Census, Population Little Rock North Little
Rock White 46.7% 51.6%
Black or African American 42.3% 39.7%Native American 0.4% 0.4%
Asian / Pacific Islander 2.8% 1.0%Hispanic or Latino 6.8% 5.7%
Two or More Races 1.7% 2.1%Data from United States Census Bureau
Median Income Little Rock North Little
Rock National
Median household income $44,896 $40,170 $53,046Population below the
poverty Line18.6% 21.9% 15.4%
Data from United States Census Bureau
2013 est. Census, population
Little Rock North Little
RockTotal
People 197,357 66,075 255,828Households 79,263 25,772 102,894
Density (peo./mile2) 4,624 1,210Data from United States Census Bureau
Year MSA 2013 724,385 2010 699,757 2000 610,518
Data from United States Census Bureau
Table 5 [Metropolitan Statistical Area]
Table 6 [Major Employers in Central Arkansas]
MAJOR EMPLOYERS IN CENTRAL ARKANSAS (Excluding State, Federal, and Local Government Employees)
Company Name Product Employment
State of Arkansas* Government 32,200
City of Little Rock* Government 28,800
United States of America* Government 9,200 University of Arkansas for Medical Sciences* Education/ Medical Services 8,500
Baptist Health* Healthcare 7,000
Little Rock Air Force Base* Government 4,500
Acxiom* Data Processing 4,380
Little Rock School District* Schools/Colleges/Education 3,500 Central Arkansas Veteran’s Health Care System* Medical Services 3,500
Entergy Arkansas* Utility (Electric) 2,740 Pulaski County Special School District Schools/Colleges/Education 2,700
AT&T* Utility (Telephone) 2,600
St. Vincent Health System* Medical Services 2,600
Arkansas Children’s Hospital* Medical Services 2,470
Dillard’s Inc.* Department Stores 2,400
Verizon Wireless* Communications/Telecommunications 2,000
Union Pacific Railroad* Transportation (Railroad) 2,000 Arkansas Blue Cross & Blue Shield* Insurance 1,800
Dassault Falcon Jet* Falcon Aircraft 1,700
Centerpoint Entergy* Utility (Natural Gas) 1,600 University of Arkansas at Little Rock Schools/Colleges/Education 1,380
University of Central Arkansas Schools/Colleges/Education 1,250
North Little Rock Public Schools Schools/Colleges/Education 1,200 Fidelity National Information Services Data Processing 1,170
*indicates business is within 3 miles of the project area
TIGER VII Discretionary Grant Application 2015
| 8
Figure 4 [Concentrated Employment Areas]
TIGER VII Discretionary Grant Application 2015
| 9
D. PROJECT PARTIES
Statewide PartiesThe primary party in this Project is the Arkansas State Highway and Transportation Department. AHTD has partnered with Metroplan, the City of Little Rock, and the City of North Little Rock. They are committed to the success of this, and all projects, of regional significance in their area. The Project is funded in partnership with the People of Arkansas through IRP and CAP dollars.
Interstate Rehabilitation Program• In a special election held November 8, 2011, the citizens of Arkansas voted to allow the
Arkansas Highway Commission to issue up to $575 million in Grant Anticipation Reve-nue Vehicles bonds to help finance improvements and repairs to existing interstates in Arkansas. This program in combination with existing federal and state revenues, is expected to support $1.2 billion in construction on our interstate highways over the life of the program. This program will provide $22 million for the Project.
Connecting Arkansas Program• This program is the largest highway construction program ever undertaken by AHTD. In
early 2011, the Arkansas Legislature voted to include Issue #1 on the General Election ballot. On November 6, 2012, Arkansas voters approved this ten-year, half-cent sales tax to improve highway and infrastructure projects throughout the state. This constitutional amendment will finance widening, improvements, and completion of certain state high-ways. Thirty-five projects in 19 corridors will improve Arkansas’ transportation system by expanding selected two-lane roadways to four-lane highways, adding new lanes to identified interstate highways, and building two new highways. The $1.8 billion CAP receives revenue from a temporary half-cent sales tax that will end after 10 years when the bonds are paid off. The temporary tax is shared statewide by consumers and road users. Taxes were not raised on groceries, medicine, or gas. This program provides $427 million for the Project.
Local PartiesOn a more local level, the communities impacted by the Project have been engaged and participat-ed extensively through the PEL process. Significant outreach resulting in community involve-ment has brought the surrounding areas and the businesses, schools, and attractions, together as partners with the AHTD in seeking funding for the Project.
Planning and Environmental Linkages Study Activities• A PEL Study was conducted by AHTD to conduct analysis and planning activities with
resource agencies and the public in order to produce transportation planning products to effectively serve the communities’ transportation needs. By following the PEL process, fewer negative impacts and more effective environmental stewardship and decisions are expected to result. An added benefit is significant public involvement in project develop-ment arising from a number of public meetings.
6th
Arch
7th
I
3rd
16th
F
Hills
2nd
Pike
Mai
n
5th
River
A
Cro
ss
Scot
t
B
Mccain
Locu
st
G
H
13th
Broa
dway
Stat
e
Frazier
Roosevelt
Gai
nes
Washington
3 M
21st
Wright
C
Loui
sian
a
Bond
eixiD
mlaP
Cantrell
Skyline
Pula
ski
Che
ster
Lincoln
PershingCalvary
Springer
34th
Wat
er
15th
E
635
8th
Park
er
27th
9th
naV
22nd
D
neB
39th
Baucum
Interstate 440
Ira
Bethany
38th
Kay
12th
17th
Poe
Col
lege
Lindsey
Brag
g
Waterside
Com
mer
ce
Loch
rebueZ
Laharpe
Bank
head
Gribble
elpmeT
Carter
Flor
a
Garland
Riverfront
Rin
go
14th
Percy Machin
Fron
tage
School
Arkansas
Cru
tche
r
Barb
er
Mills
Sprin
g
Cherry Hill
Long 17Th
Pope
23rd
Atkins
Cal
houn
dryB
Just
in
Richards
sdnomdE
Curtis Sykes
hceeB
18th
Cen
ter
Doug
las
26th
Trust
Edge
24th
llihgnirpS
ralpoP
Bolton
Izar
d
hcriB
28th
Tow
nsen
d
Idlewild
Picron
Elm
notluF
Walters
19th
10th
Ora
nge
Che
rry
Ferry
Will
ow
Vict
ory
Fourch
e Dam
G
30th
Vanc
e
37th
Phillips
redneB
Gum
Canilora
Sam Evans
lezaH
Scenic
Airp
ort
36th
Gregory
Dooley
Cor
ning
31st
Athens
33rd
Fran
k
Gor
don
Gray
nilknarF
Kellett
Buck
eye
Oak
ley
World
Dug
an
25th
Dav
id G
rund
fest
Jr
aveneG
Lori
Pine
Mcm
ath
Desoto
President Clinton
Oliv
e
Cap
itol
Taylor
35th
Sloane
Martin
Belmont
20th
Floral
Bish
op
Barbara
llessuR
Last
noiraM
Thom
as
Cyp
res
Fairpoint
latseV
Rus
tic
ailongaM
Health Care
Hay
s
yoreL
Car
son
Tuxedo
Turner
Jeck
Airp
ort
Capitol
10th
Roosevelt
Pine
Izar
d
20th
11th
Sprin
g
19th
Ferry
17th
22nd
Dixie
38th
12th
18th
Rin
go
4th
26th
4th
6th
Mai
n
16th
8th
21st
2nd
8th
17th
Mar
ion
19th
Wal
nut
2nd
2nd
War
den
Interstate 440
D
9th
8th
12th
9th10th
2nd
8th
evilO
33rd
11th
18th
High
17th
36th
4th
10th
4th
367
365
10100
5
365
440
40
630
30
67
70
165
Pulaski County
Fourche Creek
Arkansas River
Shilcotts Bayou
Little Rock
North Little Rock
Lake Number Two
Lakewood Lake Number One
CA0602Study Area
Arkansas State Highway & Transportation Department
CA0602Interstate 530 – Highway 67
May 2015
30
PLANNING AND ENVIRONMENTAL LINKAGES REPORT
TIGER VII Discretionary Grant Application 2015
| 10
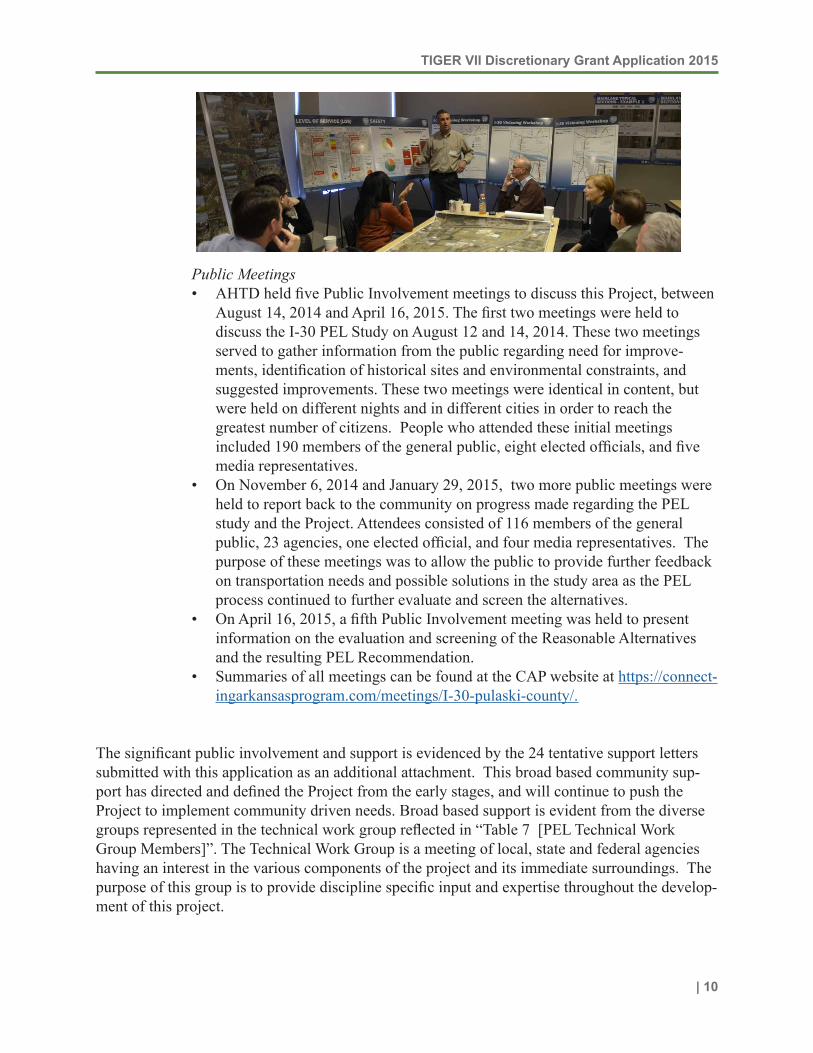
Public Meetings• AHTD held five Public Involvement meetings to discuss this Project, between
August 14, 2014 and April 16, 2015. The first two meetings were held to discuss the I-30 PEL Study on August 12 and 14, 2014. These two meetings served to gather information from the public regarding need for improve-ments, identification of historical sites and environmental constraints, and suggested improvements. These two meetings were identical in content, but were held on different nights and in different cities in order to reach the greatest number of citizens. People who attended these initial meetings included 190 members of the general public, eight elected officials, and five media representatives.
• On November 6, 2014 and January 29, 2015, two more public meetings were held to report back to the community on progress made regarding the PEL study and the Project. Attendees consisted of 116 members of the general public, 23 agencies, one elected official, and four media representatives. The purpose of these meetings was to allow the public to provide further feedback on transportation needs and possible solutions in the study area as the PEL process continued to further evaluate and screen the alternatives.
• On April 16, 2015, a fifth Public Involvement meeting was held to present information on the evaluation and screening of the Reasonable Alternatives and the resulting PEL Recommendation.
• Summaries of all meetings can be found at the CAP website at https://connect-ingarkansasprogram.com/meetings/I-30-pulaski-county/.
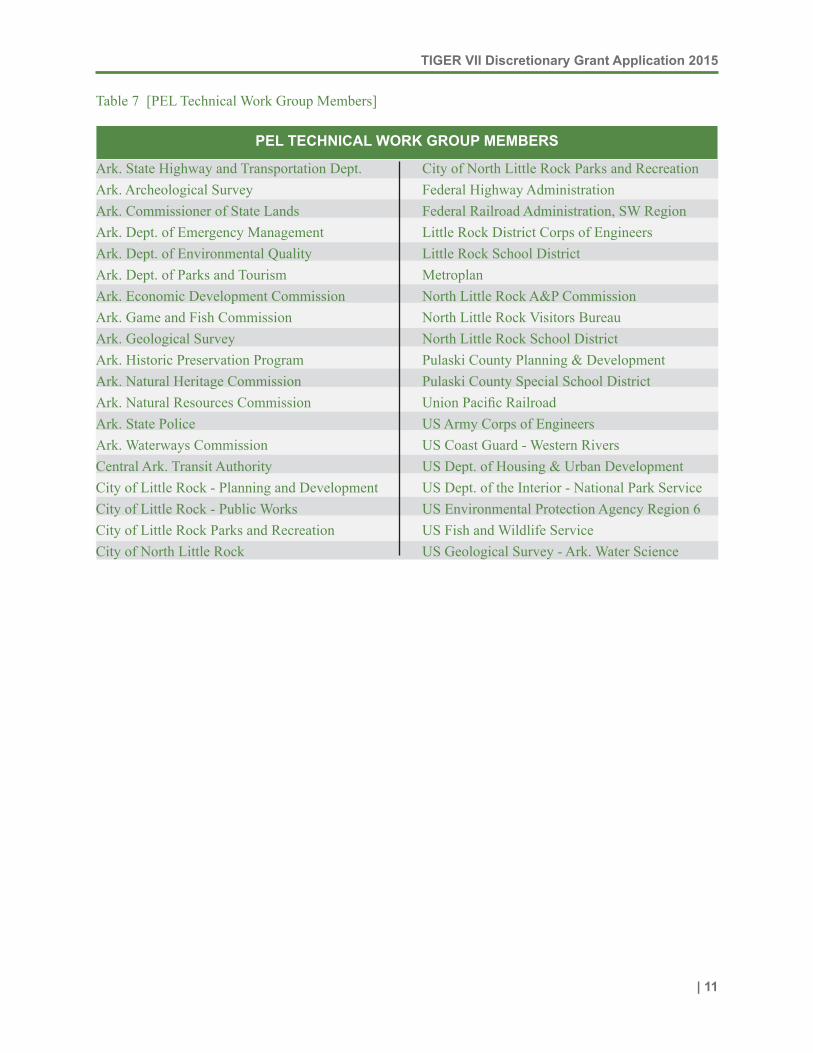
The significant public involvement and support is evidenced by the 24 tentative support letters submitted with this application as an additional attachment. This broad based community sup-port has directed and defined the Project from the early stages, and will continue to push the Project to implement community driven needs. Broad based support is evident from the diverse groups represented in the technical work group reflected in “Table 7 [PEL Technical Work Group Members]”. The Technical Work Group is a meeting of local, state and federal agencies having an interest in the various components of the project and its immediate surroundings. The purpose of this group is to provide discipline specific input and expertise throughout the develop-ment of this project.
CA0602
28
30
Economic Development• AHTD likely will not have money for full wish list. How to
come up with extra funding to improve neighborhood connectivity and character of corridor. Options: bond issues, TIF improvement, speak to general funds, create regional mobility authority, and/or other improvement district. Take away is AHTD doesn’t have the funding for all we want to do. Need to pick up improvements above and beyond basic improvements.
Connectivity• Depending where you live impacts whether you want
mobility or connectivity. Connectivity is important at neighborhoods.
• Needs to be considered for better improvement – lighting, visibility, safety.
• LR side - visual connectivity across the corridor from river to I-630 interchange. Past that, southern end of corridor, future possibility of improvement at Hasting property. Future trolley lines possible, too.
• Jeff Hathaway said reworking ramps at River Market. Chris East said taking out circular turn arounds for split hybrid. Removing parking under those bridges. Make space for people.
• Deck park between 6th and 9th. Infrastructure for future development. Splitting lanes to make wide enough for future column line.
• Divided boulevard at Cantrell. Make a usable space.
MASON ELLIS (GREEN)Economic Development
• Future economic developments – Hanger Hill neighborhood redevelopment. Assisted living neighborhood.
• TIF/TRZ
• Growth on eastern side as development comes south from Clinton Library.
• 9th Street turning into important corridor, access to airport.
• Cloverleaf development at Cantrell – better use of space.
• MacArthur Park area – prime development area for campus feel.
• Dark Hollow location – Pentecostal school and development. Inaccessible to this area. Need access to future development.
RED TEAM
TIGER VII Discretionary Grant Application 2015
| 11
Table 7 [PEL Technical Work Group Members]
Ark. State Highway and Transportation Dept.Ark. Archeological SurveyArk. Commissioner of State LandsArk. Dept. of Emergency Management Ark. Dept. of Environmental Quality Ark. Dept. of Parks and Tourism Ark. Economic Development Commission Ark. Game and Fish Commission Ark. Geological Survey Ark. Historic Preservation ProgramArk. Natural Heritage CommissionArk. Natural Resources CommissionArk. State PoliceArk. Waterways Commission Central Ark. Transit Authority City of Little Rock - Planning and DevelopmentCity of Little Rock - Public Works City of Little Rock Parks and Recreation City of North Little Rock
City of North Little Rock Parks and Recreation Federal Highway Administration Federal Railroad Administration, SW RegionLittle Rock District Corps of Engineers Little Rock School DistrictMetroplan North Little Rock A&P Commission North Little Rock Visitors BureauNorth Little Rock School District Pulaski County Planning & Development Pulaski County Special School DistrictUnion Pacific Railroad US Army Corps of Engineers US Coast Guard - Western RiversUS Dept. of Housing & Urban Development US Dept. of the Interior - National Park Service US Environmental Protection Agency Region 6 US Fish and Wildlife ServiceUS Geological Survey - Ark. Water Science
PEL TECHNICAL WORK GROUP MEMBERS
TIGER VII Discretionary Grant Application 2015
| 12
E. GRANT FUNDS AND SOURCES/USES OF PROJECT FUNDS
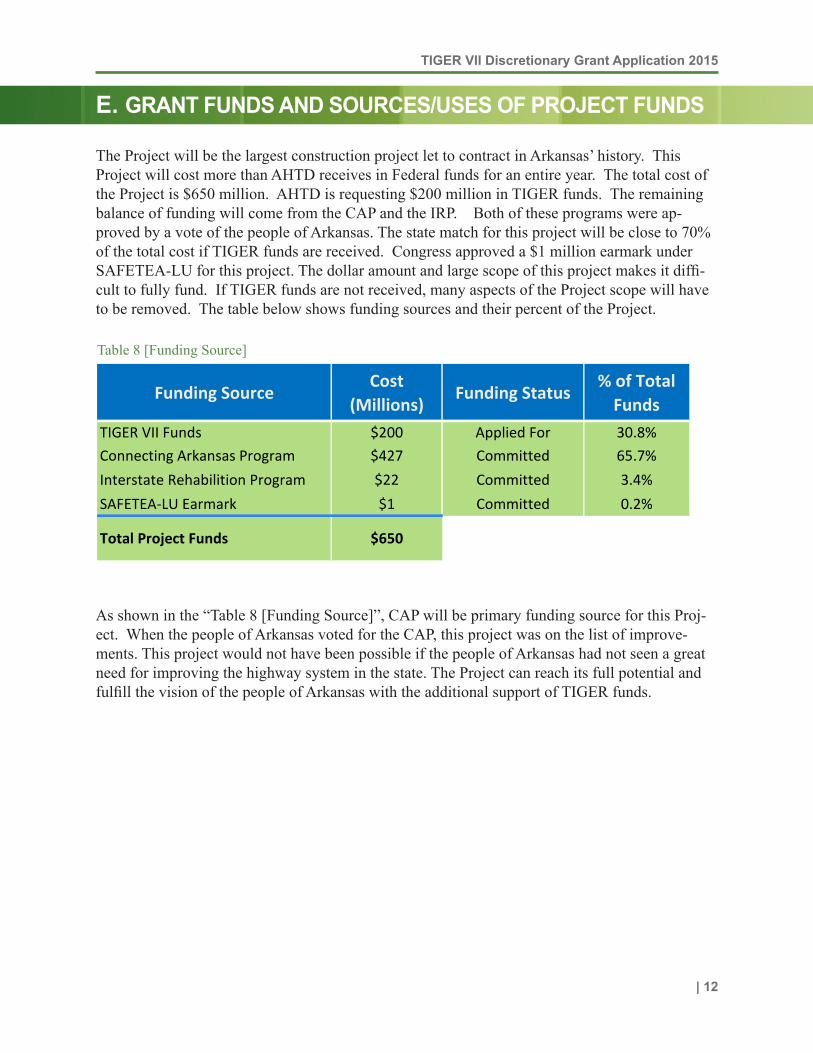
The Project will be the largest construction project let to contract in Arkansas’ history. This Project will cost more than AHTD receives in Federal funds for an entire year. The total cost of the Project is $650 million. AHTD is requesting $200 million in TIGER funds. The remaining balance of funding will come from the CAP and the IRP. Both of these programs were ap-proved by a vote of the people of Arkansas. The state match for this project will be close to 70% of the total cost if TIGER funds are received. Congress approved a $1 million earmark under SAFETEA-LU for this project. The dollar amount and large scope of this project makes it diffi-cult to fully fund. If TIGER funds are not received, many aspects of the Project scope will have to be removed. The table below shows funding sources and their percent of the Project.
As shown in the “Table 8 [Funding Source]”, CAP will be primary funding source for this Proj-ect. When the people of Arkansas voted for the CAP, this project was on the list of improve-ments. This project would not have been possible if the people of Arkansas had not seen a great need for improving the highway system in the state. The Project can reach its full potential and fulfill the vision of the people of Arkansas with the additional support of TIGER funds.
Table 8 [Funding Source]
Funding SourceCost
(Millions)Funding Status
% of Total Funds
TIGER VII Funds $200 Applied For 30.8%Connecting Arkansas Program $427 Committed 65.7%Interstate Rehabilition Program $22 Committed 3.4%SAFETEA-LU Earmark $1 Committed 0.2%
Total Project Funds $650
TIGER VII Discretionary Grant Application 2015
| 13
F. SELECTION CRITERIA
I) PRIMARY SELECTION CRITERIA
a) State of Good Repair
Structural and Functional Deficiencies of I-30 and I-40This portion of I-30 was originally constructed in the 1960s with 10-inch jointed concrete pavement over eight inches of aggregate base material. In the early 1980s, this section was overlaid with a one-half inch stress absorbing membrane and 5.5 inches of asphalt. Likewise, the I-40 pavement section was originally constructed in the 1960s with 10 inches of concrete pave-ment over 9 to 11 inches of aggregate material. In the mid-1980s, the section was overlaid with one inch of asphalt and six inches of continuously reinforced concrete pavement.
Currently, the existing surface shows moderate to severe levels of cracking along both I-30 and I-40, including alligator cracking, joint reflective cracking, longitudinal and transverse cracking, and linear cracking. Other roadway distresses include lane and shoulder separation and patch deterioration. Portions of I-30 and I-40 within the study area will likely require some level of pavement rehabilitation within the expected time frame of this Project in order to meet adequate structural performance for the typical 20-year design life utilized for pavement analysis.
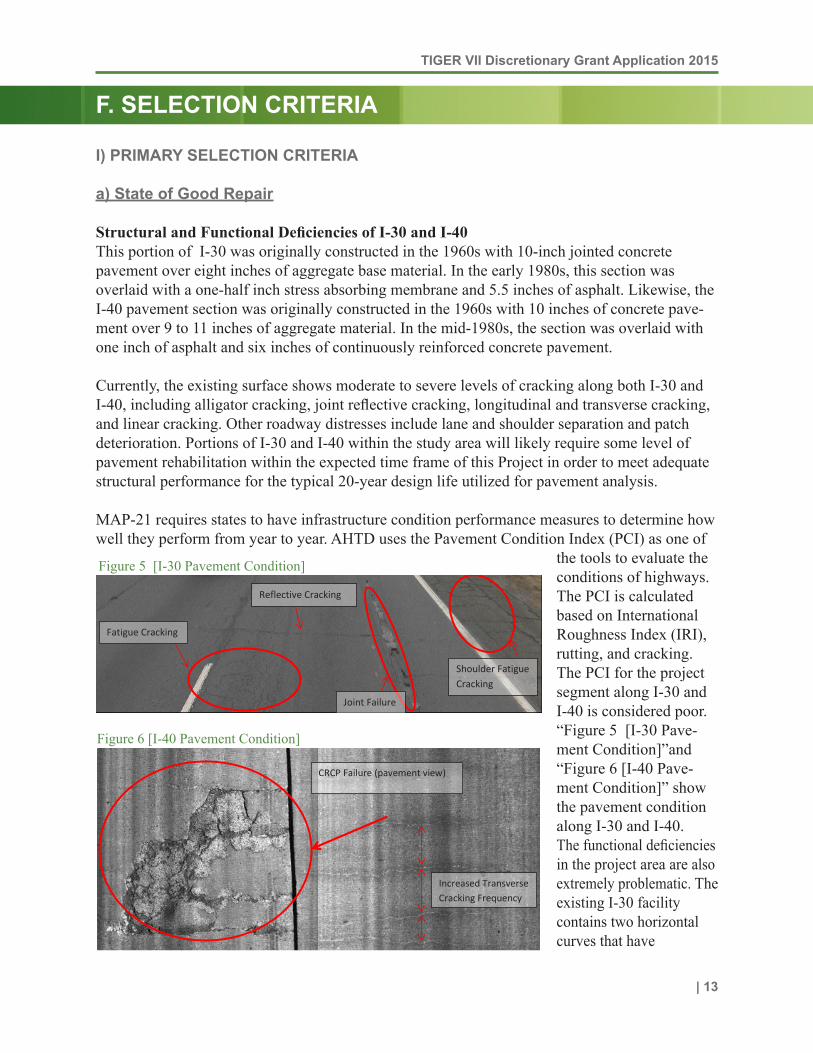
MAP-21 requires states to have infrastructure condition performance measures to determine how well they perform from year to year. AHTD uses the Pavement Condition Index (PCI) as one of
the tools to evaluate the conditions of highways. The PCI is calculated based on International Roughness Index (IRI), rutting, and cracking. The PCI for the project segment along I-30 and I-40 is considered poor. “Figure 5 [I-30 Pave-ment Condition]”and “Figure 6 [I-40 Pave-ment Condition]” show the pavement condition along I-30 and I-40. The functional deficiencies in the project area are also extremely problematic. The existing I-30 facility contains two horizontal curves that have
Structural and Functional Deficiencies of I-30 and I-40
This portion of I-30 was originally constructed in the 1960s with 10-inch jointed concrete pavement over eight inches of aggregate base material. In the early 1980s, this section was overlaid with a one-half inch stress absorbing membrane and 5.5 inches of asphalt. Likewise, the I-40 pavement section was originally constructed in the 1960s with 10 inches of concrete pavement over 9 to 11 inches of aggregate material. In the mid-1980s, the section was overlaid with one inch of asphalt and six inches of continuously reinforced concrete pavement.
Currently, the existing surface shows moderate to severe levels of cracking along both I-30 and I-40, including alligator cracking, joint reflective cracking, longitudinal and transverse cracking, and linear cracking. Other roadway distresses include lane and shoulder separation and patch deterioration. Portions of I-30 and I-40 within the study area will likely require some level of pavement rehabilitation within the expected timeframe of this project in order to meet adequate structural performance for the typical 20-year design life utilized for pavement analysis.
MAP-21 requires states to have infrastructure condition performance measures to determine how well they perform from year to year. AHTD uses the Pavement Condition Index (PCI) as one of the tools to evaluate the conditions of highways. The PCI is calculated based on International Roughness Index (IRI), rutting and cracking. The PCI for the project segment along I-30 and I-40 is considered poor. Figures XXX and XXX show the pavement condition along I-30 and I-40.
Figure XXX – I-30 Pavement condition.
Joint Failure
Reflective Cracking
Fatigue Cracking
Shoulder Fatigue Cracking
Figure 5 [I-30 Pavement Condition]
Figure XXX – I-40 Pavement condition.
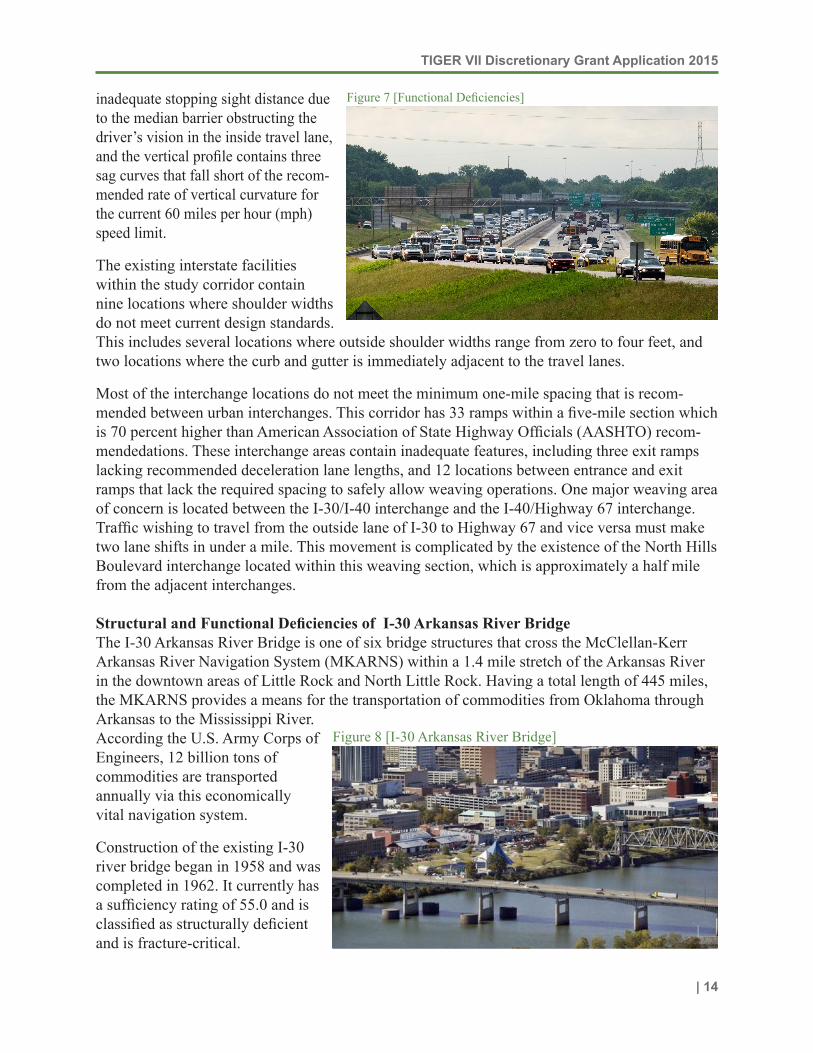
The functional deficiencies in the project area are currently more problematic than the structural deficiencies. The existing I-30 facility contains two horizontal curves that have inadequate stopping sight distance due to the median barrier obstructing the driver’s vision in the inside travel lane, and the vertical profile contains three sag curves that fall short of the recommended rate of vertical curvature for the current 60 miles per hour (mph) speed limit.
The existing interstate facilities within the study corridor contain nine locations where shoulder widths do not meet current design standards. This includes several locations where outside shoulder widths range from zero to four feet, and two locations where the curb and gutter is immediately adjacent to the travel lanes.
Most of the interchange locations do not meet the minimum one-mile spacing that is recommended between urban interchanges. This corridor has 33 ramps within a five-mile section which is 70 percent higher than recommended. These interchange areas contain inadequate features, including three exit ramps lacking recommended deceleration lane lengths, and 12 locations between entrance and exit ramps that lack the required spacing to safely allow weaving operations. One major weaving area of concern is located between the I-30/I-40 interchange and the I-40/Highway 67 interchange. Traffic wishing to travel from the outside lane of I-30 to
CRCP Failure (pavement view)
Increased Transverse Cracking Frequency
Figure 6 [I-40 Pavement Condition]
TIGER VII Discretionary Grant Application 2015
| 14
inadequate stopping sight distance due to the median barrier obstructing the driver’s vision in the inside travel lane, and the vertical profile contains three sag curves that fall short of the recom-mended rate of vertical curvature for the current 60 miles per hour (mph) speed limit.
The existing interstate facilities within the study corridor contain nine locations where shoulder widths do not meet current design standards. This includes several locations where outside shoulder widths range from zero to four feet, and two locations where the curb and gutter is immediately adjacent to the travel lanes.
Most of the interchange locations do not meet the minimum one-mile spacing that is recom-mended between urban interchanges. This corridor has 33 ramps within a five-mile section which is 70 percent higher than American Association of State Highway Officials (AASHTO) recom-mendedations. These interchange areas contain inadequate features, including three exit ramps lacking recommended deceleration lane lengths, and 12 locations between entrance and exit ramps that lack the required spacing to safely allow weaving operations. One major weaving area of concern is located between the I-30/I-40 interchange and the I-40/Highway 67 interchange. Traffic wishing to travel from the outside lane of I-30 to Highway 67 and vice versa must make two lane shifts in under a mile. This movement is complicated by the existence of the North Hills Boulevard interchange located within this weaving section, which is approximately a half mile from the adjacent interchanges.
Structural and Functional Deficiencies of I-30 Arkansas River BridgeThe I-30 Arkansas River Bridge is one of six bridge structures that cross the McClellan-Kerr Arkansas River Navigation System (MKARNS) within a 1.4 mile stretch of the Arkansas River in the downtown areas of Little Rock and North Little Rock. Having a total length of 445 miles, the MKARNS provides a means for the transportation of commodities from Oklahoma through Arkansas to the Mississippi River. According the U.S. Army Corps of Engineers, 12 billion tons of commodities are transported annually via this economically vital navigation system.
Construction of the existing I-30 river bridge began in 1958 and was completed in 1962. It currently has a sufficiency rating of 55.0 and is classified as structurally deficient and is fracture-critical.
Figure 7 [Functional Deficiencies]
Figure 8 [I-30 Arkansas River Bridge]
TIGER VII Discretionary Grant Application 2015
| 15
The structure has numerous deficiencies including hundreds of fatigue cracks, a large horizontal crack that passes through an entire footing and is visible on both sides, and the steel bent caps have cracks and section loss from corrosion. Further, the structure is not designed for seismic resistance, and is located in an area influenced by the New Madrid seismic zone. Extensive modifications required for rehabilitating these structural deficiencies are not cost effective for a bridge of this age. Therefore, the bridge must be replaced.
A look at the functional deficiencies of the superstructure show that while the width meets minimum standards, it is less than desirable. The shoulder widths are below current standards. Reduced shoulder width can lead to driver discomfort and in turn result in decreased speed and increased congestion. This reduced bridge width can also lead to an increase in crashes because there is no additional space to maneuver around an obstacle in the roadway. Further, the lack of adequate shoulders does not allow for the storage of disabled vehicles and the passage of emer-gency response vehicles, causing further congestion following a crash.
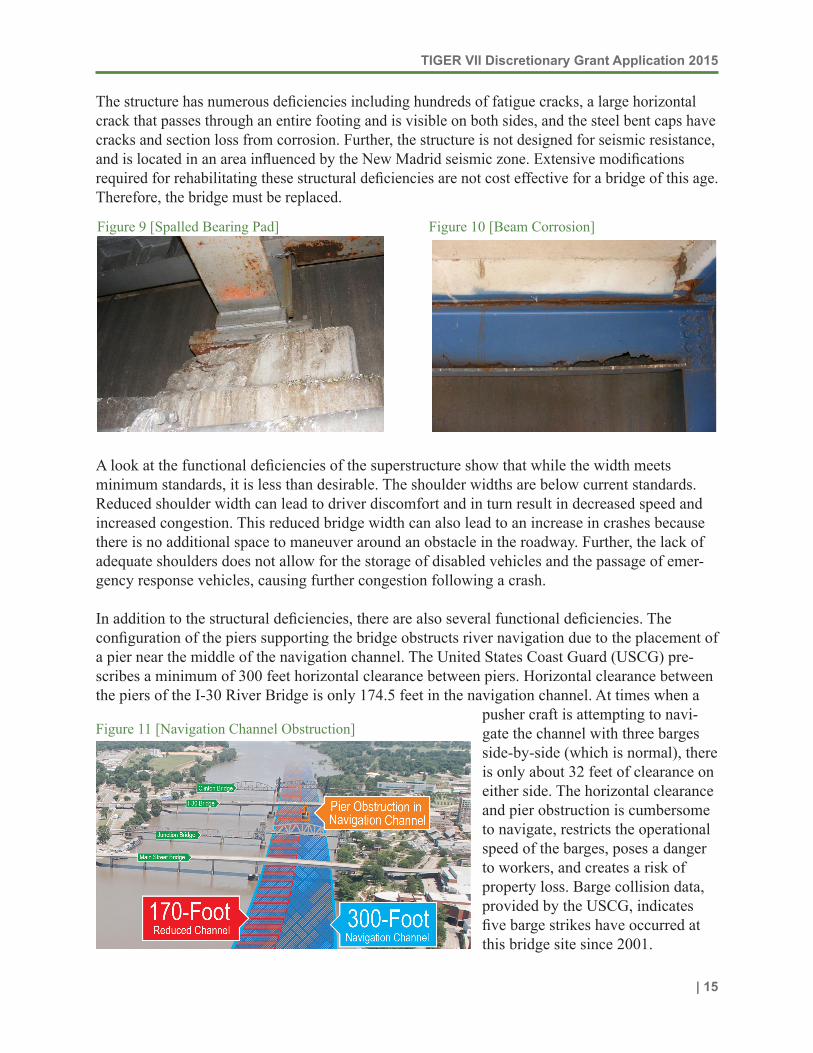
In addition to the structural deficiencies, there are also several functional deficiencies. The configuration of the piers supporting the bridge obstructs river navigation due to the placement of a pier near the middle of the navigation channel. The United States Coast Guard (USCG) pre-scribes a minimum of 300 feet horizontal clearance between piers. Horizontal clearance between the piers of the I-30 River Bridge is only 174.5 feet in the navigation channel. At times when a
pusher craft is attempting to navi-gate the channel with three barges side-by-side (which is normal), there is only about 32 feet of clearance on either side. The horizontal clearance and pier obstruction is cumbersome to navigate, restricts the operational speed of the barges, poses a danger to workers, and creates a risk of property loss. Barge collision data, provided by the USCG, indicates five barge strikes have occurred at this bridge site since 2001.
Figure 11 [Navigation Channel Obstruction]
Figure XXX – Corner of bearing pad has spalled.
Figure XXX – Corrosion of Beam has rusted through.
In addition to the structural deficiencies, there are also several functional deficiencies.
A look at the functional deficiencies of the superstructure show that while the width meets minimum standards, it is less than desirable. The shoulders are below current standards and reduced shoulder width can lead to driver discomfort and in turn result in decreased speed and increased congestion. This reduced bridge width can also lead to an increase in traffic accidents because there is no additional space to maneuver around an obstacle in the roadway. Further, the lack of adequate shoulders does not allow for the storage of disabled vehicles and the passage of emergency response vehicles, causing further congestion following a crash.
The configuration of the piers supporting the bridge obstructs river navigation due to the placement of a pier near the middle of the navigation channel. The United States Coast Guard
Figure 9 [Spalled Bearing Pad] Figure 10 [Beam Corrosion]
TIGER VII Discretionary Grant Application 2015
| 16
b) Quality of Life
The I-30 Corridor Project seeks to make a significant difference in the quality of life for the residents of Central Arkansas. The primary vehicle for this difference will be increased capacity, with corresponding reduced congestion, which is ultimately the overarching goal of the Project. In addition to the benefits that come from reduced congestion, other features will be incorporated that will increase the effectiveness of local transit; will increase connectedness of vibrant retail districts; and set the groundwork for future and continued implementation of pedestrian and bicy-cle connectivity within the local community.
Traffic CongestionPerhaps no element of highway transportation has as great an impact on individual well-being and quality of life as the issue of congestion. These are well documented in any number of studies and reports—from the well-known annual Urban Mobility Report of the Texas A&M Transportation Institute to what are seemingly monthly studies showing adverse effects from congestion. Increased commute lengths from congestion have surprisingly negative impacts. A 2011 study published in the journal BMC Public Health found that commute lengths have ad-verse physical health costs, with the primary ill-effects being poor sleep quality, exhaustion, and low general health. Stress was understandably apparent as well.
Traffic congestion also has an increasingly negative impact upon the quality of life of families. In a 2005 survey, for example, 52% of Northern Virginia commuters reported that their travel times to work had increased in the past year, leading 70% of working parents to report having insuffi-cient time to spend with their children and 63% of respondents to report having insufficient time to spend with their spouses.
The list could go on and on, from time estimates lost (38 hours per year nationally, on average) to lack of reliability resulting in an inability to know how long a regular trip will take. This project will address one of the most congested areas of the state, and analyses performed show significant improvement to congestion, and hence congestion related quality of life issues, as a result of the recommended improvements.
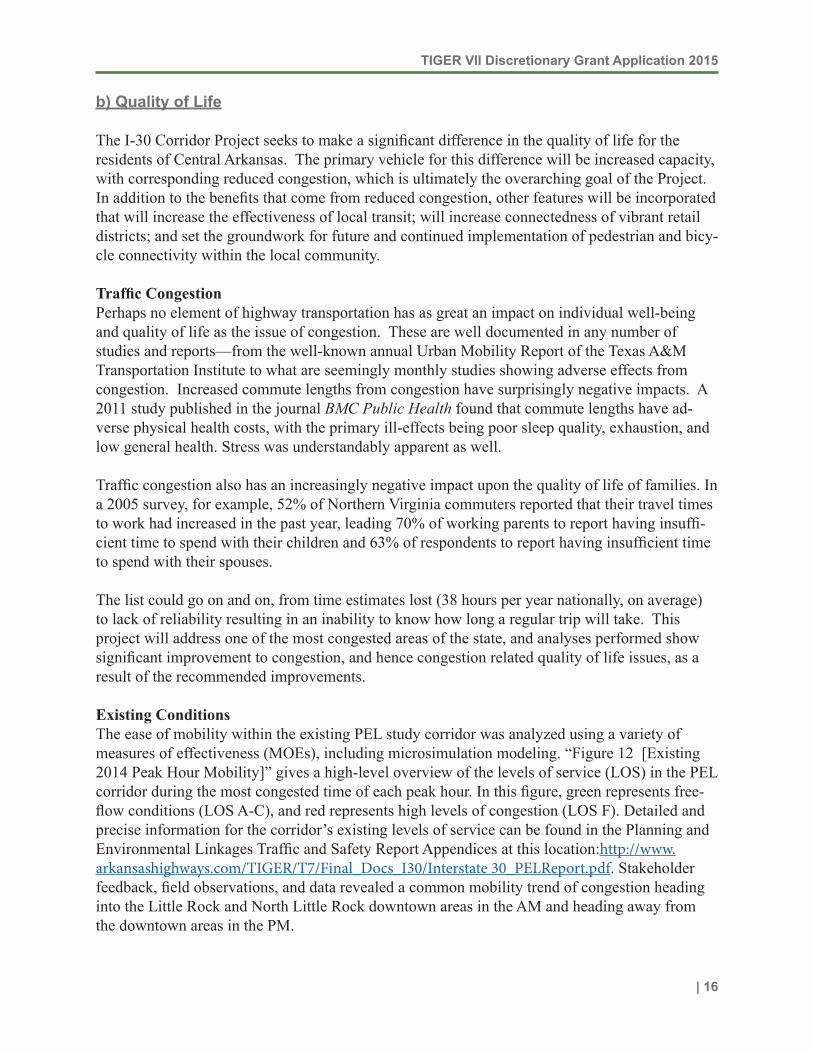
Existing ConditionsThe ease of mobility within the existing PEL study corridor was analyzed using a variety of measures of effectiveness (MOEs), including microsimulation modeling. “Figure 12 [Existing 2014 Peak Hour Mobility]” gives a high-level overview of the levels of service (LOS) in the PEL corridor during the most congested time of each peak hour. In this figure, green represents free-flow conditions (LOS A-C), and red represents high levels of congestion (LOS F). Detailed and precise information for the corridor’s existing levels of service can be found in the Planning and Environmental Linkages Traffic and Safety Report Appendices at this location:http://www.arkansashighways.com/TIGER/T7/Final_Docs_I30/Interstate 30_PELReport.pdf. Stakeholder feedback, field observations, and data revealed a common mobility trend of congestion heading into the Little Rock and North Little Rock downtown areas in the AM and heading away from the downtown areas in the PM.
TIGER VII Discretionary Grant Application 2015
| 17
mobility trend of congestion heading into the Little Rock and North Little Rock downtown areas in the AM and heading away from the downtown areas in the PM.
Figure X: Existing 2014 Peak Hour Mobility
AM Peak Hour PM Peak Hour
Another useful measure of mobility relates to speed and duration. Speeds for each peak period are shown throughout the length of the corridor over the entire two-hour period in Figure XX. Colors ranging from green to dark red represent speeds ranging from free-flow to standstill, respectively.
Figure 12 [Existing 2014 Peak Hour Mobility]
Figure XX: Existing 2014 Peak Hour Speed Profiles
AM (Westbound) PM (Eastbound)
The average speed for vehicles on I-30 eastbound between I-630 and the Arkansas River at 5:00 pm on a typical day is approximately 20-30 mph. The graphs also show the progression of backups and location of bottlenecks on the freeway main lanes. Bottlenecks occur when traffic is congested in a particular section of a roadway segment, causing sizeable queues upstream of the congested area. This congestion limits the amount of traffic able to get downstream of the congested area. In the southbound direction during the AM peak, it is evident that the Arkansas River Bridge is the location of a bottleneck. North of the bridge, queues related to congestion slowly build from the bridge all the way back to Highway 67. Because of the backup, traffic south of this point is able to move at free flow speed. Peak direction travel speeds were approximately 30-40 miles per hour on average which resulted in travel times of approximately 11-12 minutes. Since corridor travel times during free flow conditions are approximately 5-7 minutes, peak hour travel times are almost twice as long as free flow travel. For each 15-minute subdivision within the two-hour study period, at least one LOS segment in the corridor operates at LOS F. Most of the analyzed intersections in the corridor performed at LOS A-D. No Action Future Conditions
Highway 67 at McCain
I-40 at Hwy 67 Merge
I-30 at I-40 Merge
I-30 at River Bridge
I-30 at I-630
I-30 at I-530/I-440 Interchange
I-30 at 65th Street
Highway 67 at McCain
I-40 at Hwy 67 Merge
I-30 at I-40 Merge
I-30 at River Bridge
I-30 at I-630
I-30 at I-530/I-440 Interchange
I-30 at 65th Street
Approx. 1.5 hours of speeds <40 mph Speeds drop as low as 10-20 mph
Approx. 1.5 hours of speeds <40 mph Speeds drop as low as 10-20 mph
Figure 13 [Existing 2014 Peak Hour Speed Profiles]
TIGER VII Discretionary Grant Application 2015
| 18
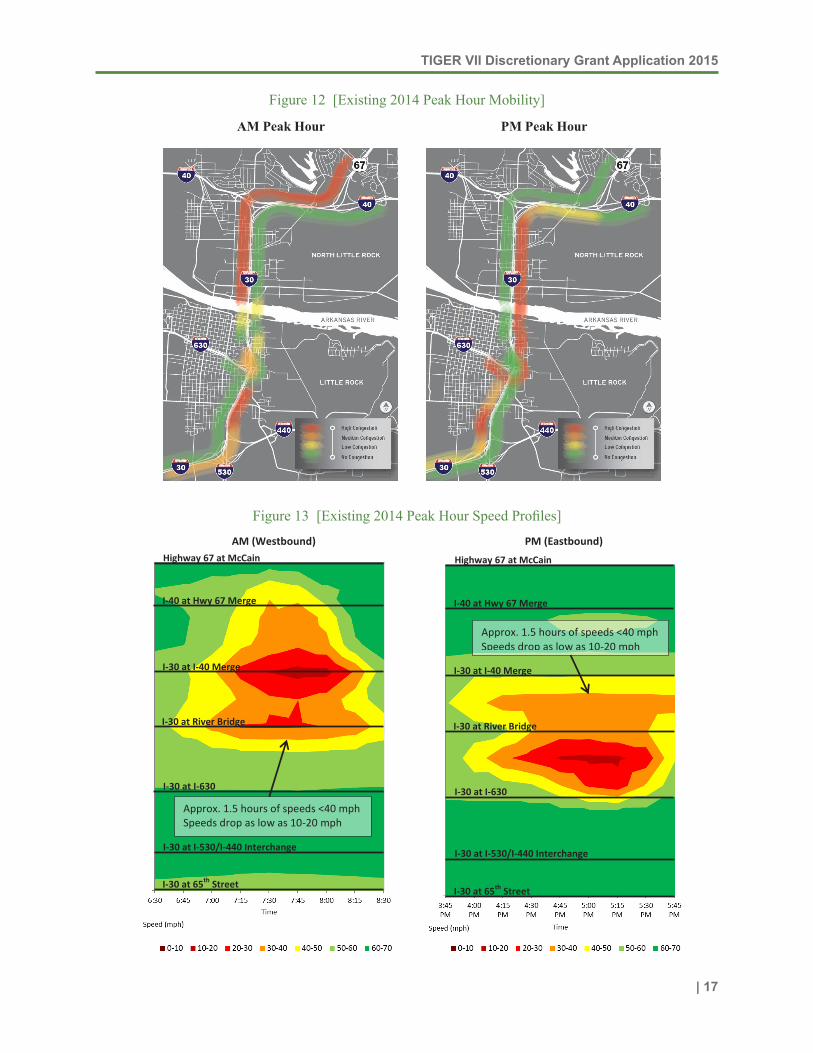
Another useful measure of mobility relates to speed and duration. Speeds for each peak period are shown throughout the length of the corridor over the entire two-hour period in “Figure 13 [Existing 2014 Peak Hour Speed Profiles]”. Colors ranging from green to dark red represent speeds ranging from free-flow to standstill, respectively.
The average speed for vehicles on I-30 eastbound between I-630 and the Arkansas River at 5:00 pm on a typical day is approximately 20-30 mph. The graphs also show the progression of backups and location of bottlenecks on the freeway main lanes. Bottlenecks occur when traffic is congested in a particular section of a roadway segment, causing sizeable queues upstream of the congested area. This congestion limits the amount of traffic able to get downstream of the con-gested area.
In the westbound direction during the AM peak, it is evident that the Arkansas River Bridge is the location of a bottleneck. North of the bridge, queues related to congestion slowly build from the bridge all the way back to Highway 67. Because of the backup, traffic south of this point is able to move at free flow speed.
Peak direction travel speeds were approximately 30-40 miles per hour on average which resulted in travel times of approximately 11-12 minutes through the study area. Since corridor travel times during free flow conditions are approximately 5-7 minutes, peak hour travel times are almost twice as long as free flow travel. For each 15-minute subdivision within the two-hour study period, at least one segment in the corridor operates at LOS F. Most of the analyzed inter-sections in the corridor performed at LOS A-D.
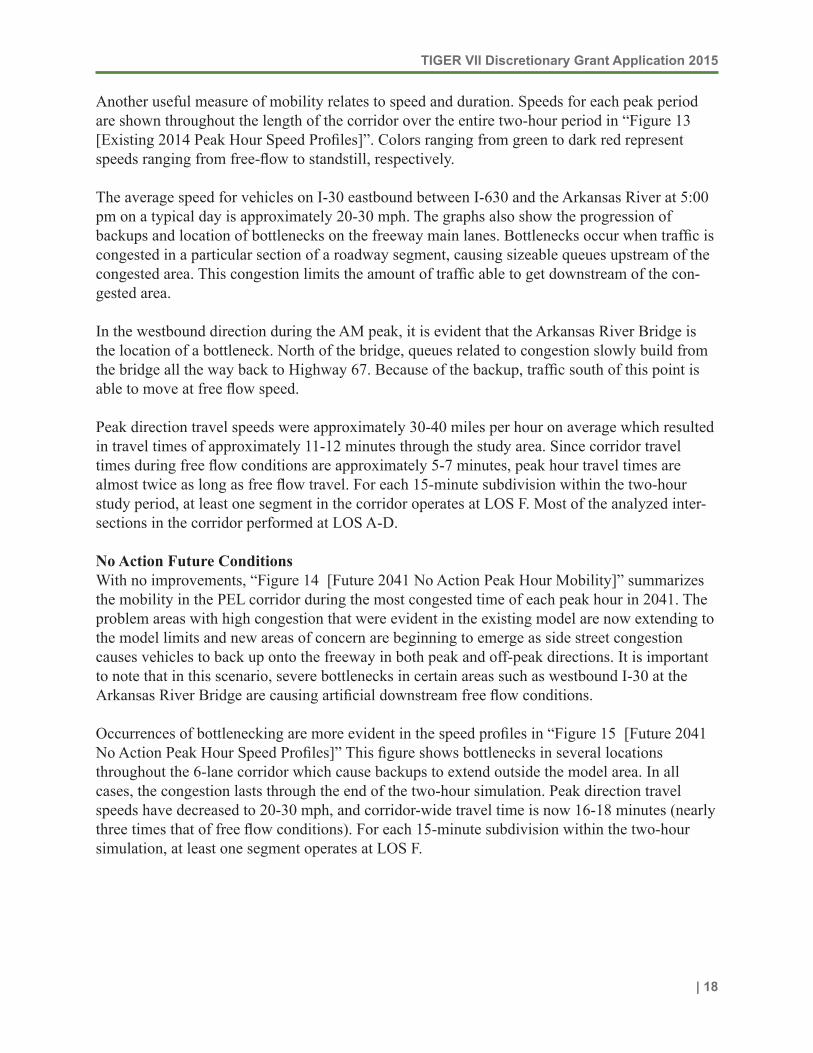
No Action Future ConditionsWith no improvements, “Figure 14 [Future 2041 No Action Peak Hour Mobility]” summarizes the mobility in the PEL corridor during the most congested time of each peak hour in 2041. The problem areas with high congestion that were evident in the existing model are now extending to the model limits and new areas of concern are beginning to emerge as side street congestion causes vehicles to back up onto the freeway in both peak and off-peak directions. It is important to note that in this scenario, severe bottlenecks in certain areas such as westbound I-30 at the Arkansas River Bridge are causing artificial downstream free flow conditions.
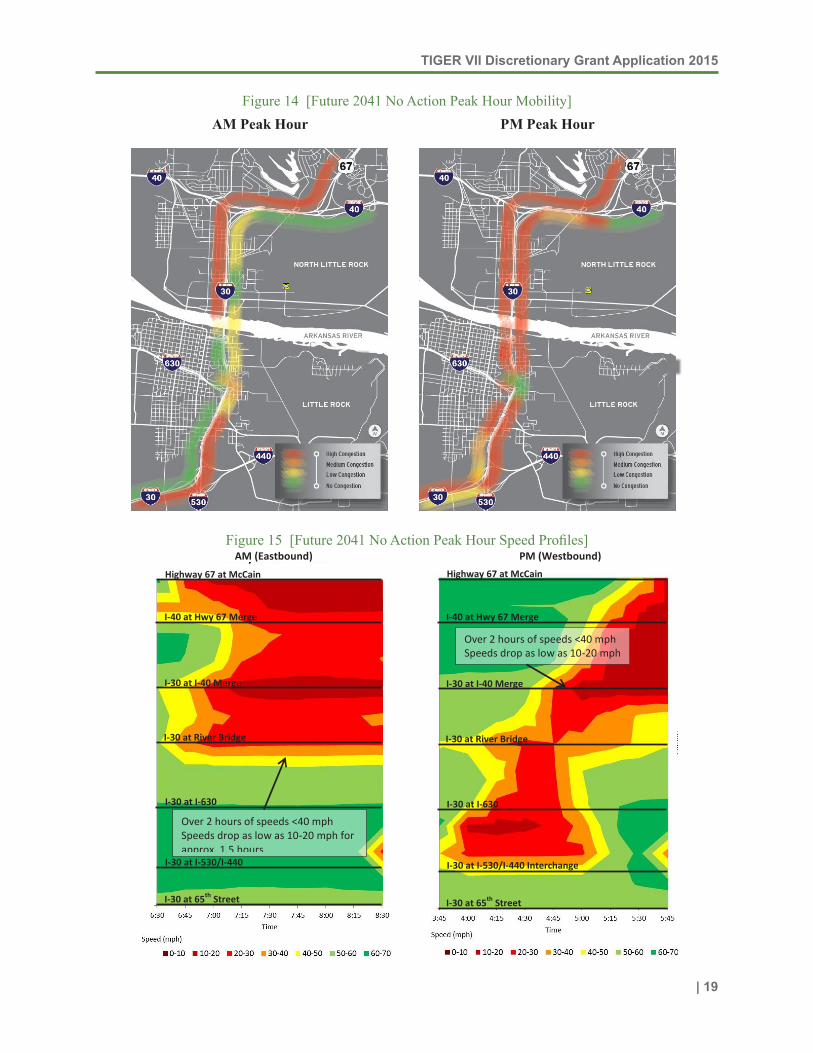
Occurrences of bottlenecking are more evident in the speed profiles in “Figure 15 [Future 2041 No Action Peak Hour Speed Profiles]” This figure shows bottlenecks in several locations throughout the 6-lane corridor which cause backups to extend outside the model area. In all cases, the congestion lasts through the end of the two-hour simulation. Peak direction travel speeds have decreased to 20-30 mph, and corridor-wide travel time is now 16-18 minutes (nearly three times that of free flow conditions). For each 15-minute subdivision within the two-hour simulation, at least one segment operates at LOS F.
TIGER VII Discretionary Grant Application 2015
| 19
Figure 14 [Future 2041 No Action Peak Hour Mobility]
Peak direction travel speeds were approximately 30-40 miles per hour on average which resulted in travel times of approximately 11-12 minutes through the study area. Since corridor travel times during free flow conditions are approximately 5-7 minutes, peak hour travel times are almost twice as long as free flow travel. For each 15-minute subdivision within the two-hour study period, at least one segment in the corridor operates at LOS F. Most of the analyzed intersections in the corridor performed at LOS A-D.
No Action Future Conditions
With no improvements, Figure XXX summarizes the mobility in the PEL corridor during the most congested time of each peak hour in 2041. The problem areas with high congestion that were evident in the existing model are now extending to the model limits and new areas of concern are beginning to emerge as side street congestion causes vehicles to back up onto the freeway in both peak and off-peak directions. It is important to note that in this scenario, severe bottlenecks in certain areas such as westbound I-30 at the Arkansas River Bridge are causing artificial downstream free flow conditions.
Figure XXX: Future 2041 No Action Peak Hour Mobility
AM Peak Hour PM Peak Hour
Figure 15 [Future 2041 No Action Peak Hour Speed Profiles]Figure XXXX: Future 2041 No Action Peak Hour Speed Profiles
AM (Eastbound) PM (Westbound)
PEL Recommended Alternative Future Conditions It was determined that a corridor improvement with a 10-Lane cross section and Downtown C/D system near the Arkansas River Bridge between 3rd Street in Little Rock and Broadway Street in North Little Rock would provide the best mobility and safety solution for the I-30 PEL study corridor. The northern limits of the C/D system are far enough to the south that it creates a longer weaving distance between the C/D system and the I-40 interchange. Figure XXXXX summarizes the 10-Lane Downtown C/D mobility in the PEL corridor during the most congested time of each peak hour. This scenario experiences 5-10 percent congestion. The two areas where reduced speeds are evident are related to constraints outside of the study area. In the AM peak (eastbound) direction, traffic experiences a slowdown just south of I-630. This is because the demand exceeds the capacity for vehicles using the flyover ramp to westbound I-630. In the PM peak (westbound) direction, reduced speeds occur mostly outside of the study area due to demand exceeding capacity on westbound I-30 at 65th street.
Highway 67 at McCain
I-40 at Hwy 67 Merge
I-30 at I-40 Merge
I-30 at River Bridge
I-30 at I-630
I-30 at I-530/I-440 Interchange
I-30 at 65th Street
Highway 67 at McCain
I-40 at Hwy 67 Merge
I-30 at I-40 Merge
I-30 at River Bridge
I-30 at I-630
I-30 at I-530/I-440 Interchange
I-30 at 65th Street
Over 2 hours of speeds <40 mph Speeds drop as low as 10-20 mph for approx. 1.5 hours
Over 2 hours of speeds <40 mph Speeds drop as low as 10-20 mph
TIGER VII Discretionary Grant Application 2015
| 20
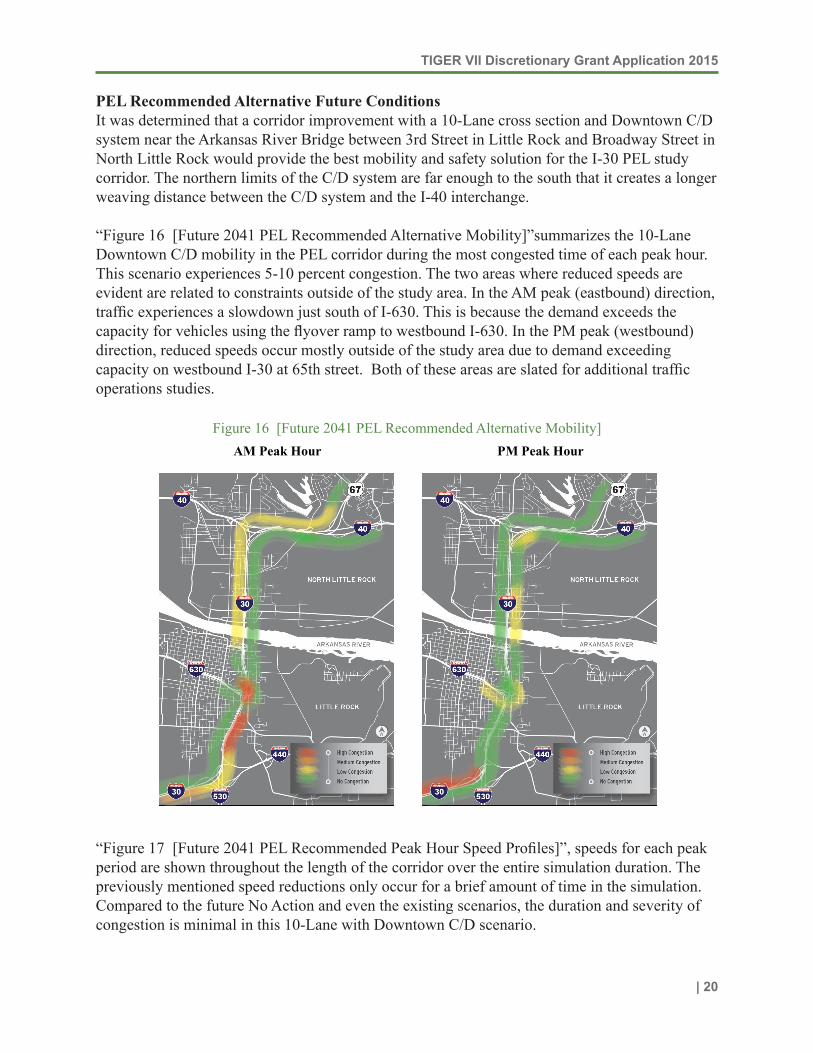
PEL Recommended Alternative Future Conditions It was determined that a corridor improvement with a 10-Lane cross section and Downtown C/D system near the Arkansas River Bridge between 3rd Street in Little Rock and Broadway Street in North Little Rock would provide the best mobility and safety solution for the I-30 PEL study corridor. The northern limits of the C/D system are far enough to the south that it creates a longer weaving distance between the C/D system and the I-40 interchange.
“Figure 16 [Future 2041 PEL Recommended Alternative Mobility]”summarizes the 10-Lane Downtown C/D mobility in the PEL corridor during the most congested time of each peak hour. This scenario experiences 5-10 percent congestion. The two areas where reduced speeds are evident are related to constraints outside of the study area. In the AM peak (eastbound) direction, traffic experiences a slowdown just south of I-630. This is because the demand exceeds the capacity for vehicles using the flyover ramp to westbound I-630. In the PM peak (westbound) direction, reduced speeds occur mostly outside of the study area due to demand exceeding capacity on westbound I-30 at 65th street. Both of these areas are slated for additional traffic operations studies.
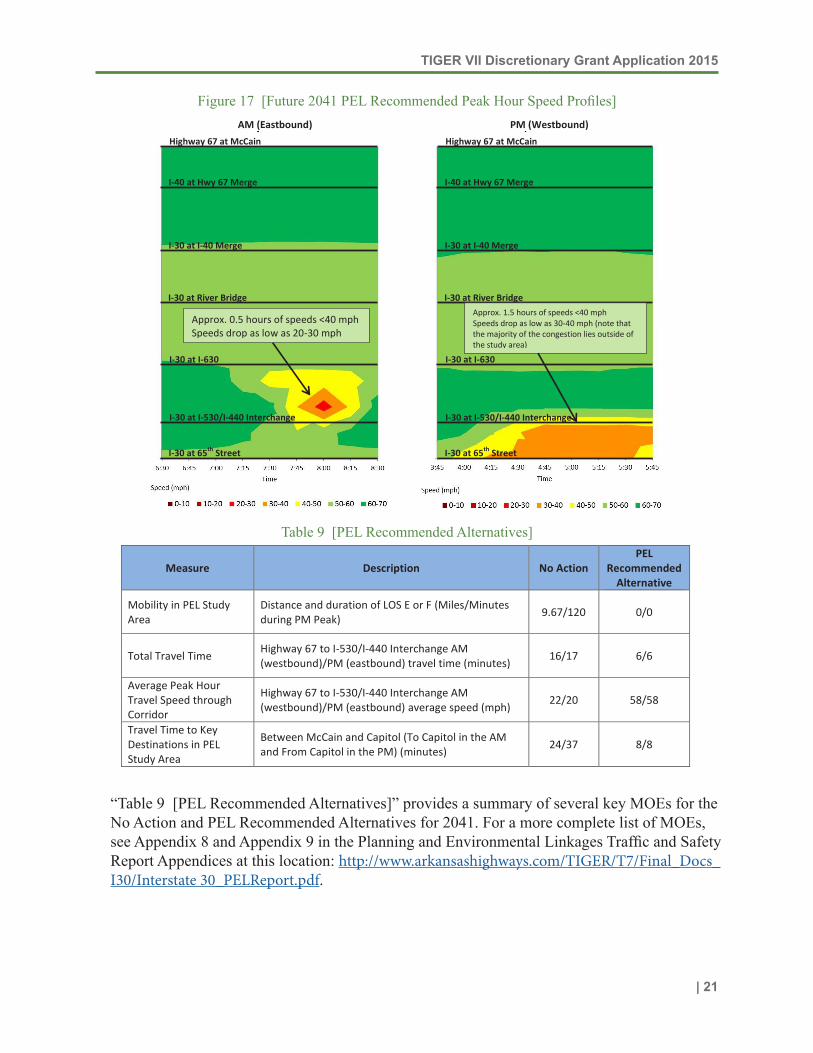
“Figure 17 [Future 2041 PEL Recommended Peak Hour Speed Profiles]”, speeds for each peak period are shown throughout the length of the corridor over the entire simulation duration. The previously mentioned speed reductions only occur for a brief amount of time in the simulation. Compared to the future No Action and even the existing scenarios, the duration and severity of congestion is minimal in this 10-Lane with Downtown C/D scenario.
Figure XXXXX: Future 2041 PEL Recommended Alternative Mobility
AM Peak Hour PM Peak Hour
In Figure XXXXXX, speeds for each peak period are shown throughout the length of the corridor over the entire simulation duration. The previously mentioned speed reductions only occur for a brief amount of time in the simulation. Compared to the future No Action and even the existing scenarios, the duration and severity of congestion is minimal in this 10-Lane with Downtown C/D scenario.
Table X provides a summary of several key MOEs for the No Action and PEL Recommended Alternatives for 2041. For a more complete list of MOEs, see Appendix 8 and Appendix 9 in the Planning and Environmental Linkages Traffic and Safety Report Appendices at this location: www.arkansashighways.com/
Figure 16 [Future 2041 PEL Recommended Alternative Mobility]
TIGER VII Discretionary Grant Application 2015
| 21
“Table 9 [PEL Recommended Alternatives]” provides a summary of several key MOEs for the No Action and PEL Recommended Alternatives for 2041. For a more complete list of MOEs, see Appendix 8 and Appendix 9 in the Planning and Environmental Linkages Traffic and Safety Report Appendices at this location: http://www.arkansashighways.com/TIGER/T7/Final_Docs_I30/Interstate 30_PELReport.pdf.
Figure 17 [Future 2041 PEL Recommended Peak Hour Speed Profiles]
Figure XXXXXX: Future 2041 PEL Recommended Alternative Peak Hour Speed Profiles
AM (Eastbound) PM (Westbound)
Table X: Future 2041 Measures of Effectiveness Summary
Measure Description No Action PEL
Recommended Alternative
Mobility in PEL Study Area
Distance and duration of LOS E or F (Miles/Minutes during PM Peak) 9.67/120 0/0
Total Travel Time Highway 67 to I-530/I-440 Interchange AM (westbound)/PM (eastbound) travel time (minutes) 16/17 6/6
Average Peak Hour Travel Speed through Corridor
Highway 67 to I-530/I-440 Interchange AM (westbound)/PM (eastbound) average speed (mph) 22/20 58/58
Travel Time to Key Destinations in PEL Study Area
Between McCain and Capitol (To Capitol in the AM and From Capitol in the PM) (minutes) 24/37 8/8
Highway 67 at McCain
I-40 at Hwy 67 Merge
I-30 at I-40 Merge
I-30 at River Bridge
I-30 at I-630
I-30 at I-530/I-440 Interchange
I-30 at 65th Street
Highway 67 at McCain
I-40 at Hwy 67 Merge
I-30 at I-40 Merge
I-30 at River Bridge
I-30 at I-630
I-30 at I-530/I-440 Interchange
I-30 at 65th Street
Approx. 0.5 hours of speeds <40 mph Speeds drop as low as 20-30 mph
Approx. 1.5 hours of speeds <40 mph Speeds drop as low as 30-40 mph (note that the majority of the congestion lies outside of the study area)
Table 9 [PEL Recommended Alternatives]
TIGER VII Discretionary Grant Application 2015
| 22
Other Quality Of Life ImpactsThe recommendations include implementation and utilization of bus-on-shoulders, increasing the efficiency and ride ability of available transit. This provides additional methods of transportation in an area where residential information indicates a significant portion of residents are classified as low income.
The connector distributor lanes incorporated into the I-30 Arkansas River Bridge will provide an ease of connectivity not previously available to these two cities, and provide north-south connec-tions for both cities’ downtown areas.
Opportunities to enhance safety and reconnect east and west sides of I-30 would be heightened through better visual connections and safe sight lines and vistas over and under the interstate. Where possible, longer bridge spans will be explored, including minimizing column placements and depressing of corridor sections at strategic locations. Visibility under bridges should be developed to improve pedestrian and bicycle safety. This could be achieved through greater sidewalk widths, longer bridge spans or sloped abutments where necessary and enhanced pedes-trian and vehicular safety lighting under bridge structures and along pathways.
c) Safety
The planned improvements to the I-30/I-40 Corridors will have a positive impact on the safety of road users. Crash data from 2010, 2011, and 2012 (the latest three years of available data) were reviewed for the analysis within the PEL study limits. A few key locations between I-630 and I-40 exhibit large clusters of crashes consistently throughout the three year study period, such as I-30 at Broadway Street, I-30 at Markham Street and I-30 at Curtis Sykes Drive.
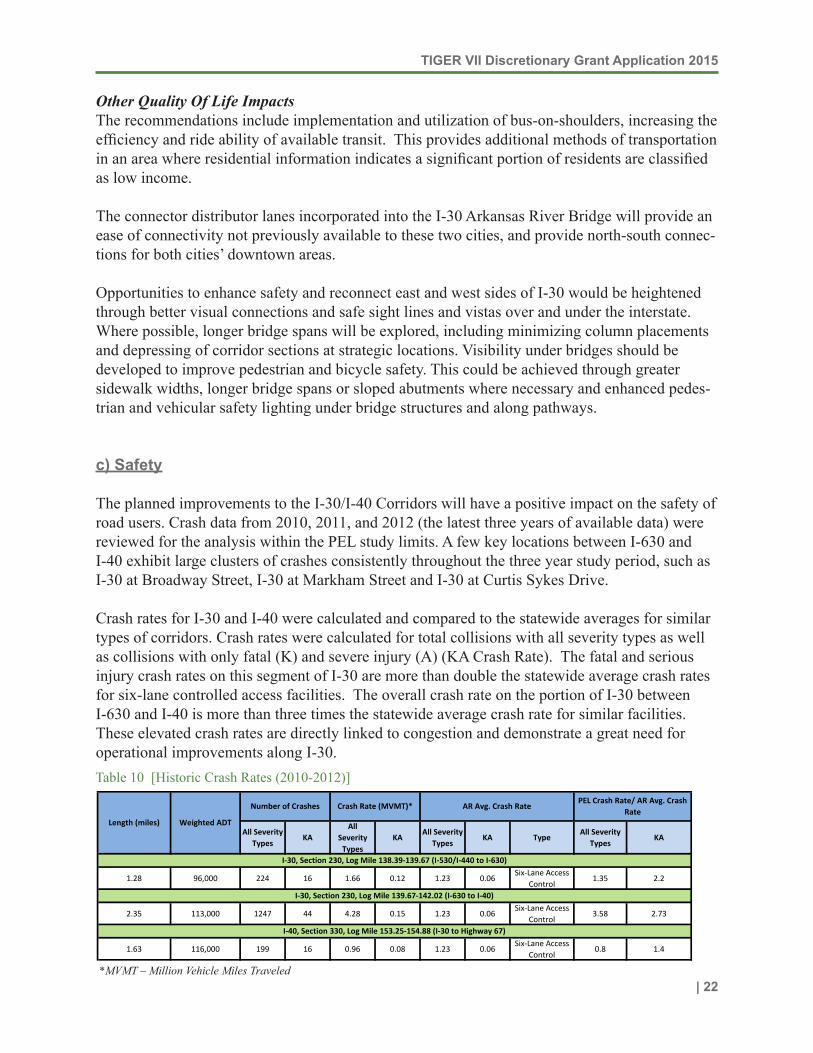
Crash rates for I-30 and I-40 were calculated and compared to the statewide averages for similar types of corridors. Crash rates were calculated for total collisions with all severity types as well as collisions with only fatal (K) and severe injury (A) (KA Crash Rate). The fatal and serious injury crash rates on this segment of I-30 are more than double the statewide average crash rates for six-lane controlled access facilities. The overall crash rate on the portion of I-30 between I-630 and I-40 is more than three times the statewide average crash rate for similar facilities. These elevated crash rates are directly linked to congestion and demonstrate a great need for operational improvements along I-30. Table 10 [Historic Crash Rates (2010-2012)]
All Severity Types
KAAll
Severity Types
KAAll Severity
TypesKA Type
All Severity Types
KA
1.28 96,000 224 16 1.66 0.12 1.23 0.06Six-Lane Access
Control1.35 2.2
2.35 113,000 1247 44 4.28 0.15 1.23 0.06Six-Lane Access
Control3.58 2.73
1.63 116,000 199 16 0.96 0.08 1.23 0.06Six-Lane Access
Control0.8 1.4
I-40, Section 330, Log Mile 153.25-154.88 (I-30 to Highway 67)
AR Avg. Crash RatePEL Crash Rate/ AR Avg. Crash
RateCrash Rate (MVMT)*Number of Crashes
I-30, Section 230, Log Mile 138.39-139.67 (I-530/I-440 to I-630)
I-30, Section 230, Log Mile 139.67-142.02 (I-630 to I-40)
Length (miles) Weighted ADT
*MVMT – Million Vehicle Miles Traveled
TIGER VII Discretionary Grant Application 2015
| 23
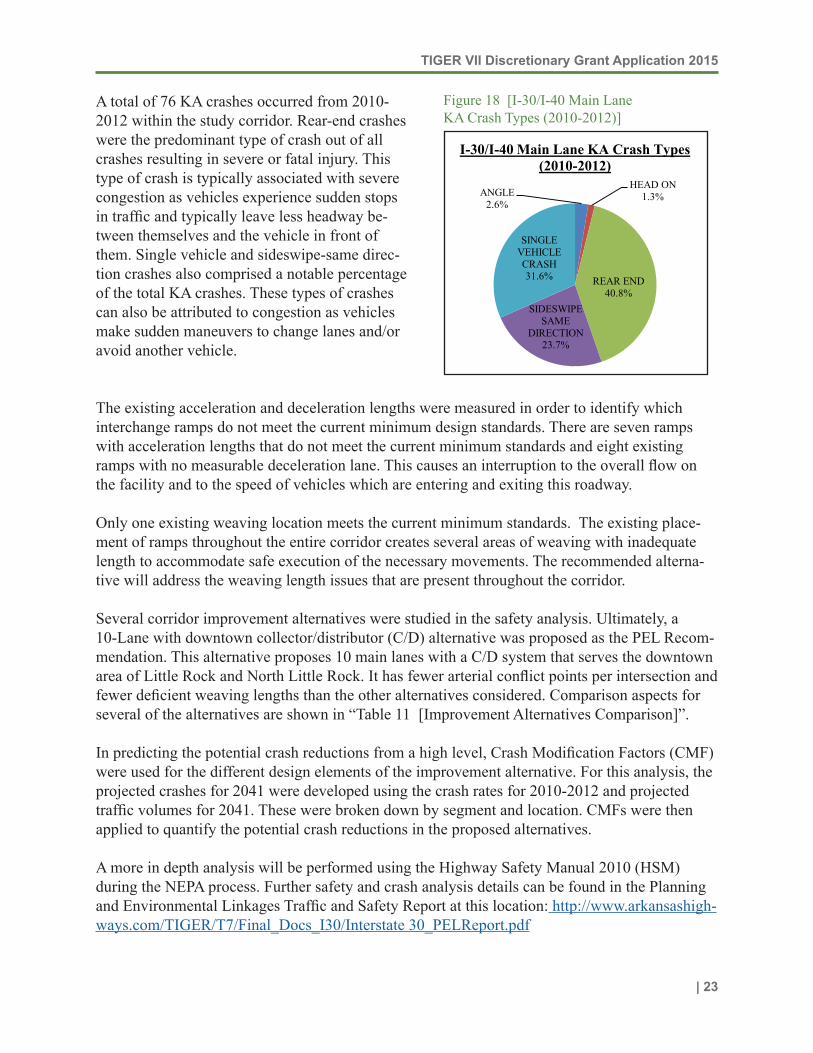
A total of 76 KA crashes occurred from 2010-2012 within the study corridor. Rear-end crashes were the predominant type of crash out of all crashes resulting in severe or fatal injury. This type of crash is typically associated with severe congestion as vehicles experience sudden stops in traffic and typically leave less headway be-tween themselves and the vehicle in front of them. Single vehicle and sideswipe-same direc-tion crashes also comprised a notable percentage of the total KA crashes. These types of crashes can also be attributed to congestion as vehicles make sudden maneuvers to change lanes and/or avoid another vehicle.
The existing acceleration and deceleration lengths were measured in order to identify which interchange ramps do not meet the current minimum design standards. There are seven ramps with acceleration lengths that do not meet the current minimum standards and eight existing ramps with no measurable deceleration lane. This causes an interruption to the overall flow on the facility and to the speed of vehicles which are entering and exiting this roadway.
Only one existing weaving location meets the current minimum standards. The existing place-ment of ramps throughout the entire corridor creates several areas of weaving with inadequate length to accommodate safe execution of the necessary movements. The recommended alterna-tive will address the weaving length issues that are present throughout the corridor.
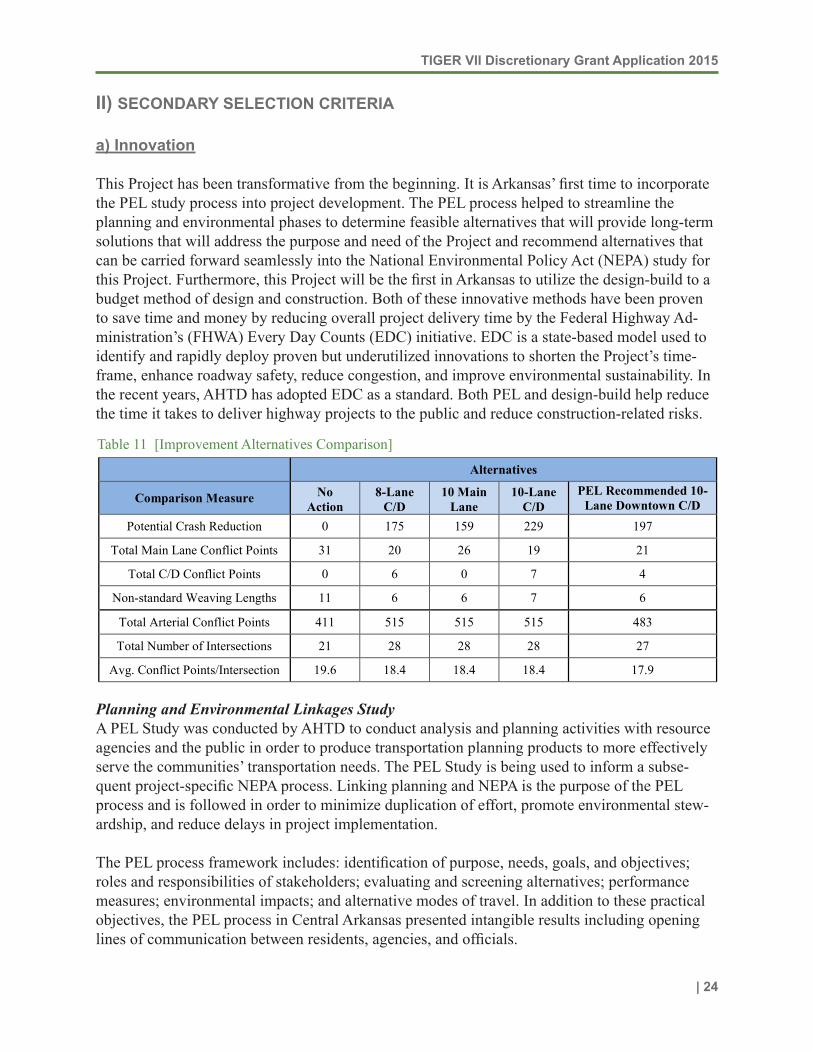
Several corridor improvement alternatives were studied in the safety analysis. Ultimately, a 10-Lane with downtown collector/distributor (C/D) alternative was proposed as the PEL Recom-mendation. This alternative proposes 10 main lanes with a C/D system that serves the downtown area of Little Rock and North Little Rock. It has fewer arterial conflict points per intersection and fewer deficient weaving lengths than the other alternatives considered. Comparison aspects for several of the alternatives are shown in “Table 11 [Improvement Alternatives Comparison]”.
In predicting the potential crash reductions from a high level, Crash Modification Factors (CMF) were used for the different design elements of the improvement alternative. For this analysis, the projected crashes for 2041 were developed using the crash rates for 2010-2012 and projected traffic volumes for 2041. These were broken down by segment and location. CMFs were then applied to quantify the potential crash reductions in the proposed alternatives.
A more in depth analysis will be performed using the Highway Safety Manual 2010 (HSM) during the NEPA process. Further safety and crash analysis details can be found in the Planning and Environmental Linkages Traffic and Safety Report at this location: http://www.arkansashigh-ways.com/TIGER/T7/Final_Docs_I30/Interstate 30_PELReport.pdf
Safety The planned improvements to the I-30/I-40 Corridors will have a positive impact on the safety of road users. Crash data from 2010, 2011, and 2012 (the latest three years of available data) were reviewed for the analysis within the PEL study limits. A few key locations between I-630 and I-40 exhibit large clusters of crashes consistently throughout the three year study period, such as I-30 at Broadway Street, I-30 at Markham Street and I-30 at Curtis Sykes Drive. Crash rates for I-30 and I-40 were calculated and compared to the statewide averages for similar types of corridors. Crash rates were calculated for total collisions with all severity types as well as collisions with only fatal (K) and severe injury (A) (KA Crash Rate). The fatal and serious injury crash rates on this segment of I-30 are more than double the statewide average crash rates for six-lane controlled access facilities. The overall crash rate on the portion of I-30 between I-630 and I-40 is more than three times the statewide average crash rate for similar facilities. These elevated crash rates are directly linked to congestion and demonstrate a great need for operational improvements along I-30.
Historic Crash Rates (2010-2012)
Number of Crashes
Crash Rate (MVMT*) AR Avg. Crash Rate
PEL Crash Rate/ AR Avg
Crash Rate
Length (miles)
Weighted ADT
All Severity
Types KA
All Severity
Types KA
All Severity
Types KA Type
All Severity
Types KA
I-30, Section 230, Log Mile 138.39-139.67 (I-530/I-440 to I-630)
1.28 96,000 224 16 1.66 0.12 1.23 0.06 Six-Lane Access Control 1.35 2.20
I-30, Section 230, Log Mile 139.67-142.02 (I-630 to I-40)
2.35 113,000 1247 44 4.28 0.15 1.23 0.06 Six-Lane Access Control 3.58 2.73
I-40, Section 330, Log Mile 153.25-154.88 (I-30 to Highway 67)
1.63 116,000 199 16 0.96 0.08 1.23 0.06 Six-Lane Access Control 0.80 1.40
*MVMT – Million Vehicle Miles Traveled
A total of 76 KA crashes occurred from 2010-2012 within the study corridor. Rear-end crashes were the predominant type of crash that resulted in severe or fatal injuries. This type of crash is typically associated with severe congestion as vehicles experience sudden stops in traffic and typically leave less headway between themselves and the vehicle in front of them. Single vehicle and sideswipe-same direction crashes also comprised a notable percentage of the total KA crashes. These types of crashes could also be attributed to congestion as vehicles make sudden maneuvers to change lanes and/or avoid another vehicle.
ANGLE 2.6%
HEAD ON 1.3%
REAR END 40.8%
SIDESWIPE SAME
DIRECTION 23.7%
SINGLE VEHICLE CRASH 31.6%
I-30/I-40 Main Lane KA Crash Types (2010-2012)
Figure 18 [I-30/I-40 Main Lane KA Crash Types (2010-2012)]
TIGER VII Discretionary Grant Application 2015
| 24
II) SECONDARY SELECTION CRITERIA
a) Innovation
This Project has been transformative from the beginning. It is Arkansas’ first time to incorporate the PEL study process into project development. The PEL process helped to streamline the planning and environmental phases to determine feasible alternatives that will provide long-term solutions that will address the purpose and need of the Project and recommend alternatives that can be carried forward seamlessly into the National Environmental Policy Act (NEPA) study for this Project. Furthermore, this Project will be the first in Arkansas to utilize the design-build to a budget method of design and construction. Both of these innovative methods have been proven to save time and money by reducing overall project delivery time by the Federal Highway Ad-ministration’s (FHWA) Every Day Counts (EDC) initiative. EDC is a state-based model used to identify and rapidly deploy proven but underutilized innovations to shorten the Project’s time-frame, enhance roadway safety, reduce congestion, and improve environmental sustainability. In the recent years, AHTD has adopted EDC as a standard. Both PEL and design-build help reduce the time it takes to deliver highway projects to the public and reduce construction-related risks.
Planning and Environmental Linkages StudyA PEL Study was conducted by AHTD to conduct analysis and planning activities with resource agencies and the public in order to produce transportation planning products to more effectively serve the communities’ transportation needs. The PEL Study is being used to inform a subse-quent project-specific NEPA process. Linking planning and NEPA is the purpose of the PEL process and is followed in order to minimize duplication of effort, promote environmental stew-ardship, and reduce delays in project implementation.
The PEL process framework includes: identification of purpose, needs, goals, and objectives; roles and responsibilities of stakeholders; evaluating and screening alternatives; performance measures; environmental impacts; and alternative modes of travel. In addition to these practical objectives, the PEL process in Central Arkansas presented intangible results including opening lines of communication between residents, agencies, and officials.
The existing acceleration and deceleration lengths were measured in order to identify which interchange ramps currently do not meet the minimum requirements. There are seven ramps with acceleration lengths that do not currently meet the minimum standards and eight existing ramps with no measurable deceleration lane. This causes an interruption to the overall flow and speed of vehicles. Only one existing weaving location meets the minimum AASHTO requirement. The existing placement of ramps throughout the entire corridor creates several areas of weaving with inadequate length to accommodate safe execution of the necessary movements. The recommended alternative will address many of the weaving length issues throughout the corridor. Several corridor improvement alternatives were studied during the safety analysis. Ultimately, a 10-Lane with Downtown Collector/Distributor (C/D) alternative was proposed as the PEL Recommendation. This alternative proposes 10 Main Lanes with a C/D system that serves the downtown area of Little Rock and North Little Rock. It has fewer arterial conflict points per intersection and fewer deficient weaving lengths than the other alternatives considered. Comparison aspects for several of the alternatives are shown below.
Improvement Alternatives Comparison
Alternatives
Comparison Measure No Action
8-Lane C/D
10 Main Lane
10-Lane C/D
PEL Recommended 10-Lane Downtown C/D
Potential Crash Reduction 0 175 159 229 197
Total Main Lane Conflict Points 31 20 26 19 21
Total C/D Conflict Points 0 6 0 7 4
Non-standard Weaving Lengths 11 6 6 7 6
Total Arterial Conflict Points 411 515 515 515 483
Total Number of Intersections 21 28 28 28 27
Avg. Conflict Points/Intersection 19.6 18.4 18.4 18.4 17.9
In predicting the potential crash reductions from a high level, crash modification factors were used for the different design elements of the improvement alternative. For this analysis, the projected crashes for 2041 were developed using the crash rates for 2010-2012 and projected traffic volumes for 2041. These were broken down by segment and location. CMFs were then applied to quantify the potential crash reductions in the proposed alternatives. A more in depth analysis will be performed using the Highway Safety Manual 2010 (HSM) during the NEPA process. Further safety and crash analysis details can be found in the Planning and Environmental Linkages Traffic and Safety Report at this location: www.arkansashighways.com/
Table 11 [Improvement Alternatives Comparison]
TIGER VII Discretionary Grant Application 2015
| 25
Design-Build For the first time in Arkansas history, a project will be constructed using an innovative type of project delivery known as design-build. The design-build method of procurement will be benefi-cial to the state of Arkansas and developers because, under this construction method, the design build firm has an incentive to reduce costs across a facility’s entire lifecycle, such as using innovative design that reduces construction costs, high-quality project delivery that lowers the cost of construction.
The design-build to a budget method has been deemed the best fit for the Project because of the Project’s size and limited budget. The method will allow a contractor to propose a cost-effective, innovative engineering and construction solution for a project of this scale. Alternative Technical Concepts (ATC), another EDC innovation, are commonly used processes in design-build project delivery, and may be utilized during the course of this Project. ATCs are typically used on large design build projects where the best-value selection may depend on the degree of innovation in the technical solution offered.
b) Partnership
Sir Isaac Newton championed collaboration by saying “We build too many walls and not enough bridges.” AHTD builds highways and bridges by collaborating with various partners throughout the state and the nation. However, the citizens of Arkansas are AHTD’s most important partners. In November 2012, those partners voted to approve the Connecting Arkansas Program, a ten-year, half-cent sales tax to improve highway and infrastructure projects throughout the state. The Project was included as an integral part of the Connecting Arkansas Program. As a result, the citizens of Arkansas are prepared to fund over 60% of the Project, if TIGER funding is awarded.
AHTD held public meetings regarding the Project, where hundreds of stakeholders expressed concerns including congestion, safety, and mobility. These concerns were integral to planning this Project. The Department also conducted a “visioning workshop” to gain perspective and ideas from multiple, diverse, stakeholders including the Partners in “Table 12 [List of Partners]”
While the foregoing stakeholders brought unique perspectives, project benefits will reach far beyond these individual stakeholders to visitors to the region and all of the citizens of Arkansas. The Interstate 30 corridor serves the Bill and Hillary Clinton National Airport, Little Rock Port facilities and rail facilities including Union Pacific and Amtrak. All Arkansas citizens directly or indirectly depend on the multi-modal facilities served by the Project for the movement of goods and services. Considering the multiple perspectives of stakeholders was imperative to planning the Project. However, the citizens of Arkansas ultimately supported this Project ideally and financially, by voting to allow the state to fund CAP projects such as this one.
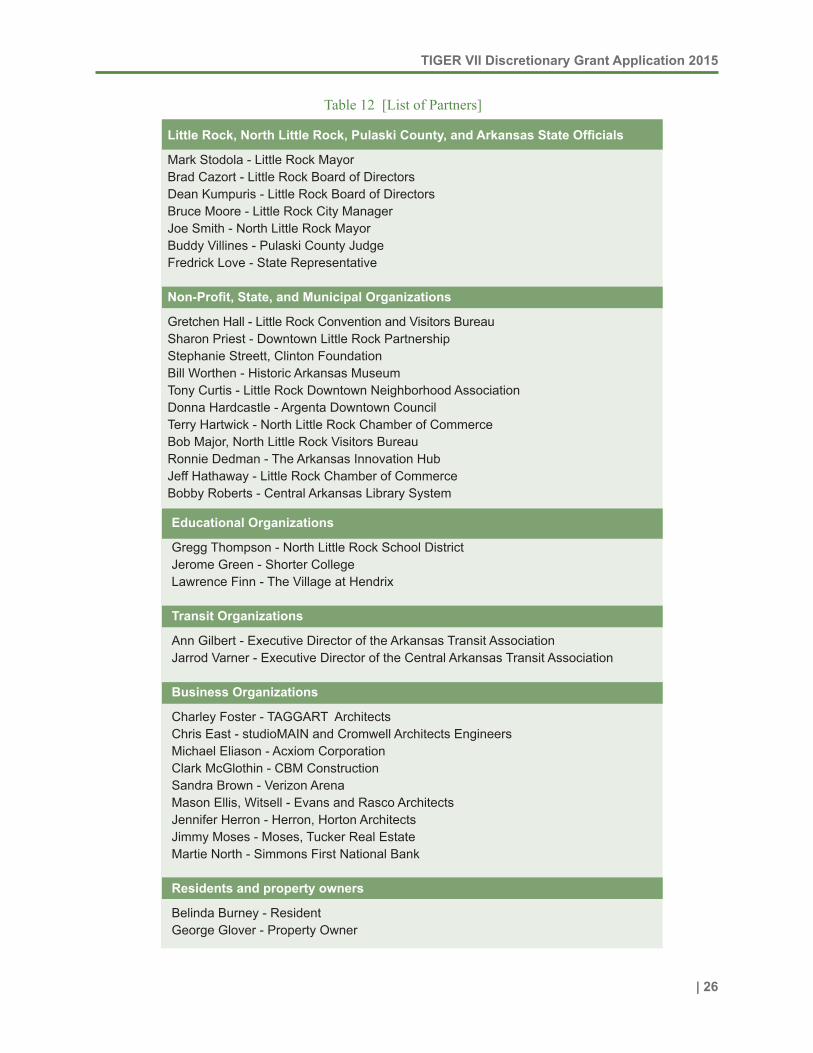
TIGER VII Discretionary Grant Application 2015
| 26
Table 12 [List of Partners]
Little Rock, North Little Rock, Pulaski County, and Arkansas State Officials
Mark Stodola - Little Rock Mayor Brad Cazort - Little Rock Board of DirectorsDean Kumpuris - Little Rock Board of DirectorsBruce Moore - Little Rock City ManagerJoe Smith - North Little Rock MayorBuddy Villines - Pulaski County JudgeFredrick Love - State Representative
Non-Profit, State, and Municipal Organizations
Gretchen Hall - Little Rock Convention and Visitors BureauSharon Priest - Downtown Little Rock PartnershipStephanie Streett, Clinton FoundationBill Worthen - Historic Arkansas MuseumTony Curtis - Little Rock Downtown Neighborhood AssociationDonna Hardcastle - Argenta Downtown CouncilTerry Hartwick - North Little Rock Chamber of CommerceBob Major, North Little Rock Visitors BureauRonnie Dedman - The Arkansas Innovation HubJeff Hathaway - Little Rock Chamber of CommerceBobby Roberts - Central Arkansas Library System
Educational Organizations
Gregg Thompson - North Little Rock School District Jerome Green - Shorter College Lawrence Finn - The Village at Hendrix
Transit Organizations
Ann Gilbert - Executive Director of the Arkansas Transit AssociationJarrod Varner - Executive Director of the Central Arkansas Transit Association
Business Organizations
Charley Foster - TAGGART ArchitectsChris East - studioMAIN and Cromwell Architects EngineersMichael Eliason - Acxiom CorporationClark McGlothin - CBM ConstructionSandra Brown - Verizon ArenaMason Ellis, Witsell - Evans and Rasco ArchitectsJennifer Herron - Herron, Horton ArchitectsJimmy Moses - Moses, Tucker Real EstateMartie North - Simmons First National Bank
Residents and property owners
Belinda Burney - ResidentGeorge Glover - Property Owner
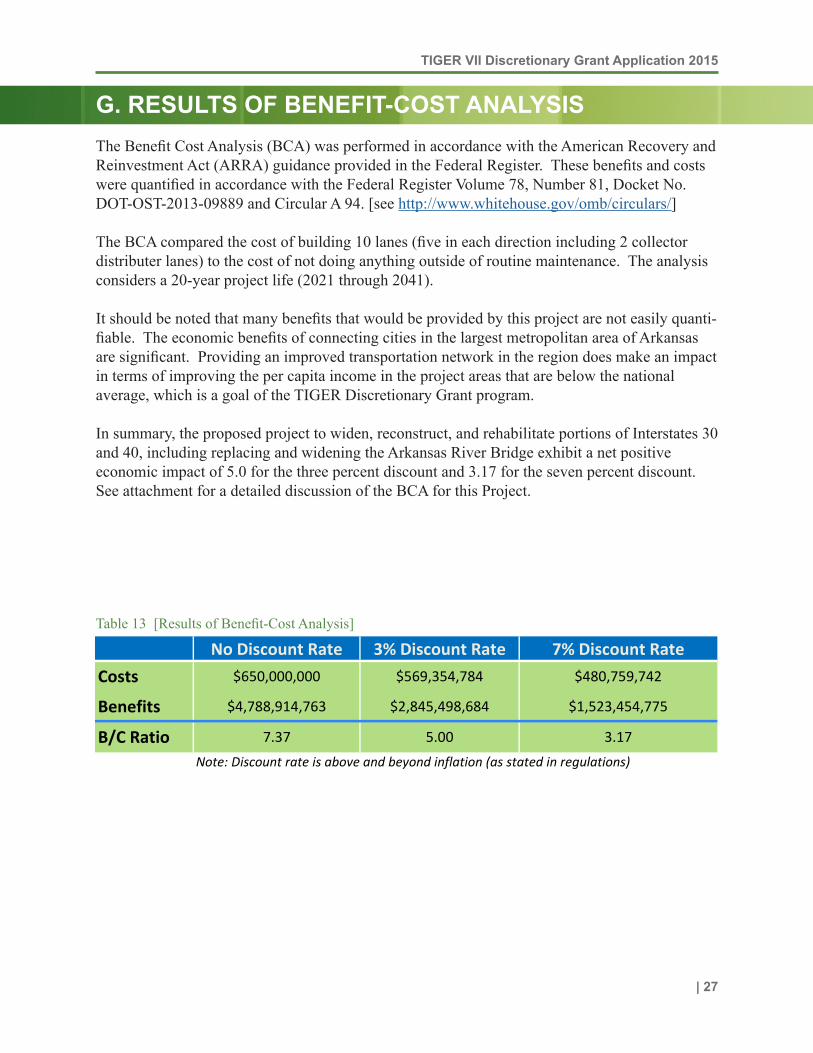
TIGER VII Discretionary Grant Application 2015
| 27
G. RESULTS OF BENEFIT-COST ANALYSISThe Benefit Cost Analysis (BCA) was performed in accordance with the American Recovery and Reinvestment Act (ARRA) guidance provided in the Federal Register. These benefits and costs were quantified in accordance with the Federal Register Volume 78, Number 81, Docket No. DOT-OST-2013-09889 and Circular A 94. [see http://www.whitehouse.gov/omb/circulars/]
The BCA compared the cost of building 10 lanes (five in each direction including 2 collector distributer lanes) to the cost of not doing anything outside of routine maintenance. The analysis considers a 20-year project life (2021 through 2041).
It should be noted that many benefits that would be provided by this project are not easily quanti-fiable. The economic benefits of connecting cities in the largest metropolitan area of Arkansas are significant. Providing an improved transportation network in the region does make an impact in terms of improving the per capita income in the project areas that are below the national average, which is a goal of the TIGER Discretionary Grant program.
In summary, the proposed project to widen, reconstruct, and rehabilitate portions of Interstates 30 and 40, including replacing and widening the Arkansas River Bridge exhibit a net positive economic impact of 5.0 for the three percent discount and 3.17 for the seven percent discount. See attachment for a detailed discussion of the BCA for this Project.
No Discount Rate 3% Discount Rate 7% Discount RateCosts $650,000,000 $569,354,784 $480,759,742
Benefits $4,788,914,763 $2,845,498,684 $1,523,454,775
B/C Ratio 7.37 5.00 3.17Note: Discount rate is above and beyond inflation (as stated in regulations)
Table 13 [Results of Benefit-Cost Analysis]
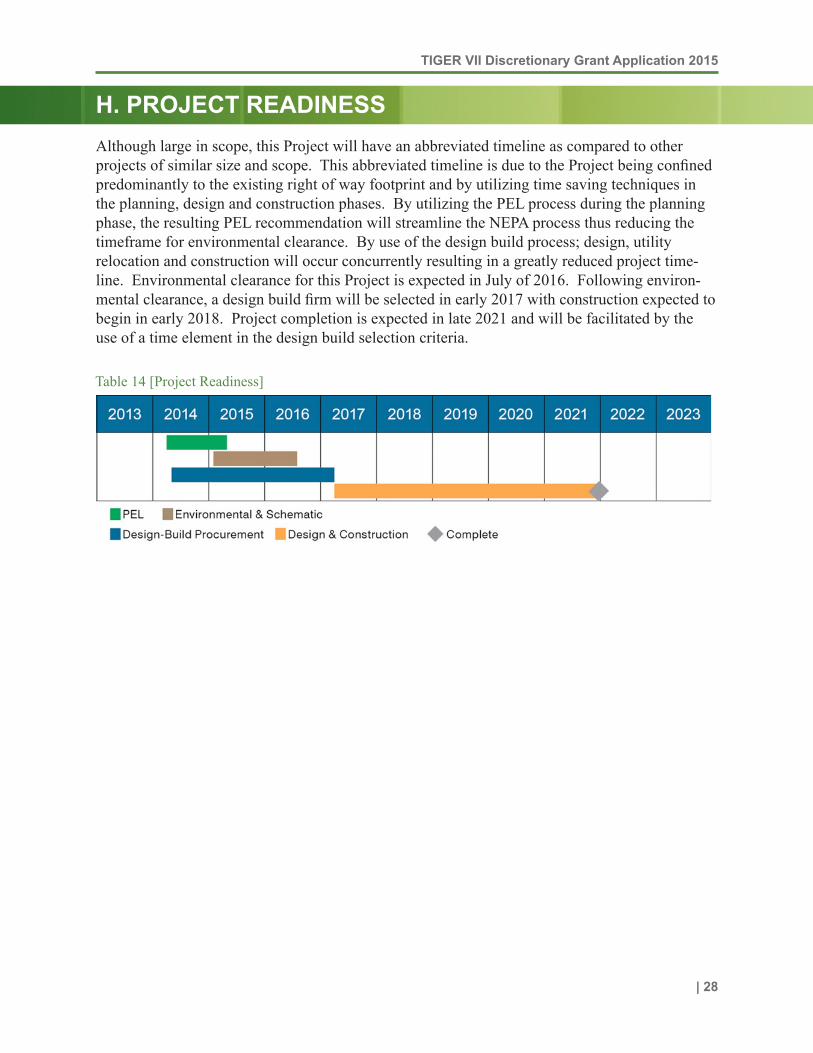
TIGER VII Discretionary Grant Application 2015
| 28
H. PROJECT READINESSAlthough large in scope, this Project will have an abbreviated timeline as compared to other projects of similar size and scope. This abbreviated timeline is due to the Project being confined predominantly to the existing right of way footprint and by utilizing time saving techniques in the planning, design and construction phases. By utilizing the PEL process during the planning phase, the resulting PEL recommendation will streamline the NEPA process thus reducing the timeframe for environmental clearance. By use of the design build process; design, utility relocation and construction will occur concurrently resulting in a greatly reduced project time-line. Environmental clearance for this Project is expected in July of 2016. Following environ-mental clearance, a design build firm will be selected in early 2017 with construction expected to begin in early 2018. Project completion is expected in late 2021 and will be facilitated by the use of a time element in the design build selection criteria.
Table 14 [Project Readiness]
TIGER VII Discretionary Grant Application 2015
| 29
I. FEDERAL WAGE RATE CERTIFICATION
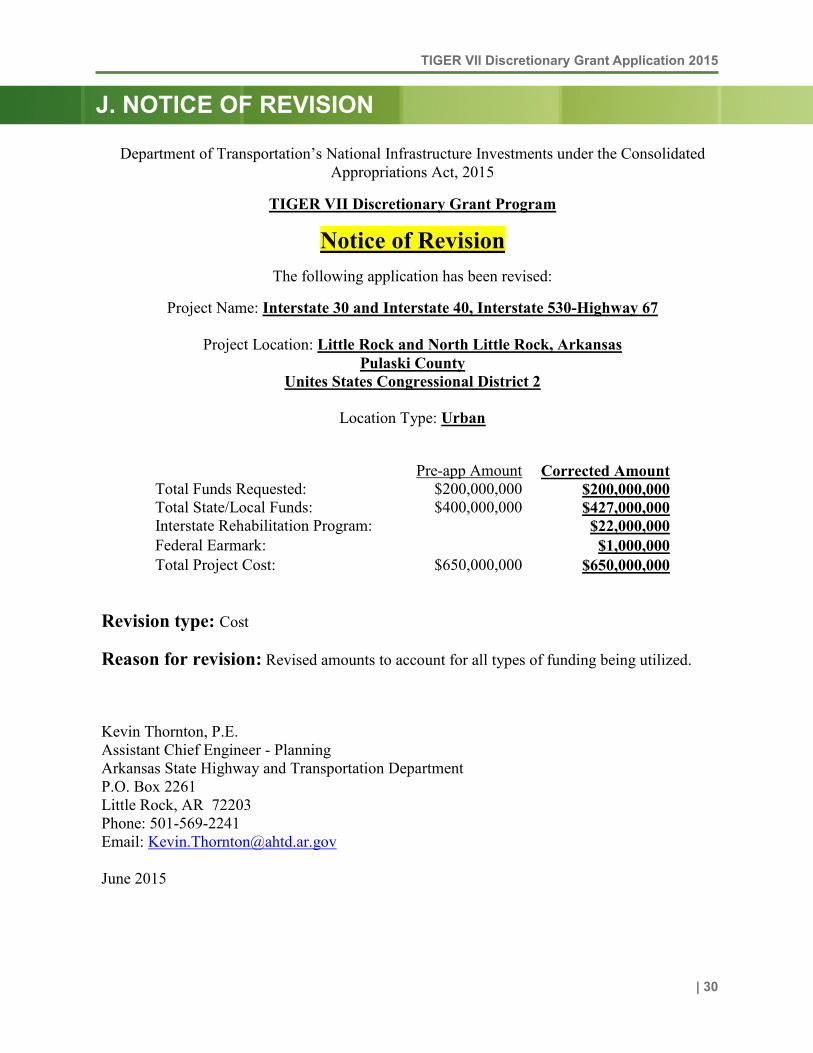
TIGER VII Discretionary Grant Application 2015
| 30
Department of Transportation’s National Infrastructure Investments under the Consolidated Appropriations Act, 2015
TIGER VII Discretionary Grant Program
Notice of RevisionThe following application has been revised:
Project Name: Interstate 30 and Interstate 40, Interstate 530-Highway 67
Project Location: Little Rock and North Little Rock, ArkansasPulaski County
Unites States Congressional District 2
Location Type: Urban
Pre-app Amount Corrected AmountTotal Funds Requested: $200,000,000 $200,000,000Total State/Local Funds: $400,000,000 $427,000,000Interstate Rehabilitation Program: $22,000,000Federal Earmark: $1,000,000Total Project Cost: $650,000,000 $650,000,000
Revision type: Cost
Reason for revision: Revised amounts to account for all types of funding being utilized.
Kevin Thornton, P.E.Assistant Chief Engineer - PlanningArkansas State Highway and Transportation DepartmentP.O. Box 2261Little Rock, AR 72203Phone: 501-569-2241Email: [email protected]
June 2015
J. NOTICE OF REVISION