Embed Size (px)
Citation preview
Livelihood Enhancement and Protection (LEP) Project
District Bannu & Lakki Marwat, Khyber Pakhtunkhwa
(2011-13)
PROJECT COMPLETION REPORT
Project Partner Organizations:
Community Mobilization & Development Organization (CMDO) Pakistan Poverty Alleviation Fund (PPAF)
Community Motivation
& Development Organization
40-C, Sahibzada Abdul Qayyum Road, University Town, Peshawar, NWFP-Pakistan Phone: + 92 91 5703614- 16, Fax: + 92 91 5851341 Email: [email protected]
2
Table of Contents Page Number 1. Introduction 3 2. Methodology 4 3. Activities Implemented 5 3.1 Poverty Profiling and Need Assessment 5 3.2 Livelihood Investment Plans 7 3.3 Interventions on Livelihood Enhancement & Protection 12 3.3.1 Livelihood Interventions through Assets Distribution 13 3.3.2 Livelihood Interventions through Vocational Skills Trainings 14 3.4 Evaluating Project Impacts on the Livelihoods of Beneficiaries 15 3.4.1 Case Studies of Project Beneficiaries 18 4. Summary of Project’s Outputs 20 5. Issues and Challenges 21 6. Lessons Learned & Recommendations 21 7. Conclusion 21 List of Tables Table 1 Union Council wise Poverty Profile of Project Areas 6 Table 2 Types of Assets and Corresponding Livelihood Intervention 12 Table 3 Union Council wise Number of Assets Distributed and Vocational Skills Provided 13 Table 4 Union Council Wise Livelihood Interventions through Assets Distribution 13 Table 5 Union Council Wise Livelihood Interventions through Vocational Skills Trainings 14 Table 6 Project Beneficiaries variations in Expenditures 17 List of Figures Figure 1 Sustainable Livelihoods Framework 4 Figure 2 Poverty Score Card Calculation Process 6 Figure 3 L LIP and Household’s Asset Pentagon 7 Figure 4 Analyzing Human Capital of a Program Beneficiary 8 Figure 5 Analyzing Social Capital of a Program Beneficiary 9 Figure 6 Analyzing Natural Capital of a Program Beneficiary 9 Figure 7 Analyzing Physical Capital of a Program Beneficiary 10 Figure 8 Analyzing Financial Capital of a Program Beneficiary 10 Figure 9 Livelihood Pentagon of a Program Beneficiary 11 Figure 10 Sample of LIP Format of a Program Beneficiary 11 Figure 11 Income Variations after Assets Distributed to Small Hotel Owners 15 Figure 12 Income Variations after Assets Distributed to Livestock Raisers 16 Figure 13 Income Variations after Assets Distributed to Small Shop Keepers 16 Figure 14 Income Variations after Assets Distributed to Small Vocational Workshops Owners 17
3
1. Introduction Community Mobilization and Development Organization (CMDO) in partnership with Pakistan Poverty Alleviation Fund (PPAF) is actively engaged in implementing number of development programs in poverty stricken areas of FATA and Khyber Pakhtunkhwa (KP) over a period of last one decade. Such development programs mainly include Human and Institutional Development (HID), Livelihood Enhancement and Protection (LEP), and Community Physical Infrastructure (CPI). All such development programs activities also being implemented in the highly underdeveloped southern districts Bannu and Lakki Marwat of KP province. CMDO over a period of last few years has been able to establish a vast grass root network of Community Organizations (COs), Village Organizations (VOs) and Local Support Organizations (LSOs) in the selected intervened union councils of districts Bannu and Lakki Marwat. All such community institutions actively participated in implementing CMDO-PPAF LEP program activities in the selected 4 union councils of these districts. The intervened union councils under LEP program included Zeraki Pirba Khel and Khander Khan Khel from district Bannu and union councils Marmandi Azeem and Kaka Khel from district Lakki Marwat. With the majority of local population already disadvantaged by unevenly distributed resources and state institutions with limited effectiveness, the project districts have experienced worsening poverty levels as a result of conflict. Both project districts are generally considered as low human development districts in the province. Due to the low level of education, health and economy, the Human Development Index (HDI) Ranks of Districts Bannu and Lakki Marwat are 15 and 14 respectively out of the total 20 districts in Khyber Pakhtunkhwa province. The HDI values in these districts are 0.495 and 0.501 respectively. The levels of multiple deprivations in district Lakki Marwat is 53.2 which is comparatively higher to medium level 47.3 in district Bannu1. The rural deprivation levels in both districts are higher than to the urban deprivation. The intervened union councils in district Bannu and Lakki Marwat are one of the least developed and backward areas where limited employment opportunities exist for the local poverty stricken population. The majority land is dry and arid which restricted the growth of agriculture and live stock sectors. Hence, presently there is minimal scope for employment in the farming and livestock sectors. Further, despite the presence of major companies, such as Lakki Cement, Bannu Woolen Mills, Bannu Sugar Mills and Bannu Floor Mills, none attract sizeable quantities of the labor force. Even small cottage industries are limited in scale; while their presence is small in Lakki Marwat, in Bannu it is negligible. Similarly, there are no major mineral deposits in the areas. Due to the limited farming, mining, and industrial sectors activities, the unemployment and poverty rates in the project areas are higher. The security situation is also directly affected by prevailing Taliban conflicts in the adjoining tribal agencies. The resulting fallout in violence, displacement and criminality has placed increased pressure on resources and as made it difficult for families to maintain their activities and earn a regular income. Based on the application of Sustainable Livelihood Framework (SLF), the CMDO-PPAF LEP program activities during 2011-13 mainly included participatory need assessment, poverty profiling, identification and prioritization of beneficiaries, preparation of Livelihood Investment Plan (LIP), transfer of productive assets to the Ultra Poor, and imparting vocational skills trainings for enhancing livelihood options among the poor households in the intervened areas. The application of SLF in CMDO-PPAF LEP program was 1 Indices of Multiple Deprivations and Human Development, Khyber Pakhtunkhwa Province, UNDP - SPRSM Project
4
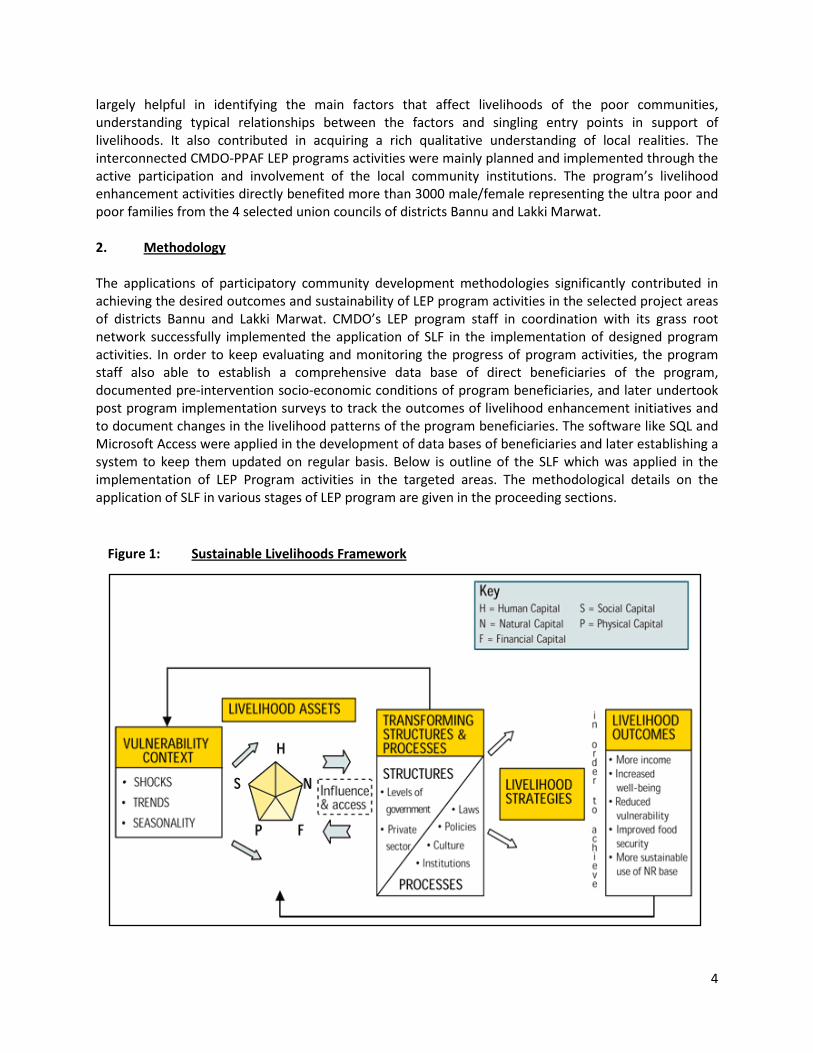
largely helpful in identifying the main factors that affect livelihoods of the poor communities, understanding typical relationships between the factors and singling entry points in support of livelihoods. It also contributed in acquiring a rich qualitative understanding of local realities. The interconnected CMDO-PPAF LEP programs activities were mainly planned and implemented through the active participation and involvement of the local community institutions. The program’s livelihood enhancement activities directly benefited more than 3000 male/female representing the ultra poor and poor families from the 4 selected union councils of districts Bannu and Lakki Marwat. 2. Methodology The applications of participatory community development methodologies significantly contributed in achieving the desired outcomes and sustainability of LEP program activities in the selected project areas of districts Bannu and Lakki Marwat. CMDO’s LEP program staff in coordination with its grass root network successfully implemented the application of SLF in the implementation of designed program activities. In order to keep evaluating and monitoring the progress of program activities, the program staff also able to establish a comprehensive data base of direct beneficiaries of the program, documented pre-intervention socio-economic conditions of program beneficiaries, and later undertook post program implementation surveys to track the outcomes of livelihood enhancement initiatives and to document changes in the livelihood patterns of the program beneficiaries. The software like SQL and Microsoft Access were applied in the development of data bases of beneficiaries and later establishing a system to keep them updated on regular basis. Below is outline of the SLF which was applied in the implementation of LEP Program activities in the targeted areas. The methodological details on the application of SLF in various stages of LEP program are given in the proceeding sections.
Figure 1: Sustainable Livelihoods Framework
5
3. Activities Implemented CMDO-PPAF LEP Program activities implemented during 2011-13 mainly included poverty profiling/need assessment, preparation of Livelihood Investment Plan (LIP), transfer of productive assets to the Ultra Poor and Very Poor, imparting vocational skills trainings for enhancing livelihood options, and establishment of evaluation and monitoring system to track changes happened in the livelihood of selected program beneficiaries. The below sections are providing methodological details and outcomes of these implemented program activities. 3.1 Poverty Profiling and Need Assessment CMDO LEP program staff in coordination with its functional COs undertook poverty profiling and need assessment activities in the project areas. In line with SLF approach, the household level livelihoods profiling and needs assessments was conducted in the two Union Councils (UCs) of Bannu district and two UCs of Lakki Marwat district. The poverty profiling activities took place from January 2012 to March 2012, after which needs assessment activities commenced, ended in June 2012. Community organizations (COs) were involved at each stage of the project. The profiling and needs assessment process mainly involved three major steps. Step 1: Participatory Wealth Ranking (PWR) The PWR tool was used for identifying poor households in a community. In each UC, CO’s held village-level meetings through which the communities identified the wealthiest and poorest households in the area. In this manner, a list totaling 4179 households were identified and categorized as Ultra Poor, Very Poor, and Poor Households. Step 2: Poverty Scorecard (PSC) The PSC calculates a household’s poverty level using 12 indicators. When the points from each indicator are added up, the total provides a score ranging from 0 to 100 (0 being the most poor and 100 being the least poor), as shown in below Figure 2. The score then corresponds with the probability that a household is poor. The score set is divided into four subsets, each of which is categorized in a specific poverty ranking. COs completed the PSCs of households identified through PWR. Those which ranked as ‘ultra poor’ and ‘very poor’ were chosen as potential target beneficiaries of the LEP Program. Step 3: Participatory Need Assessment (PNA) The applications of PWR and PSC tools led towards undertaking a lengthy consultative process on participatory need assessment activities of the selected LEP program beneficiaries. In line with the analysis derived from Livelihood Assets Pentagons of selected beneficiaries, the program staff facilitated them in the selection of appropriate livelihood enhancement options and developing Livelihood Investment Plans (LIPs) for them.
6
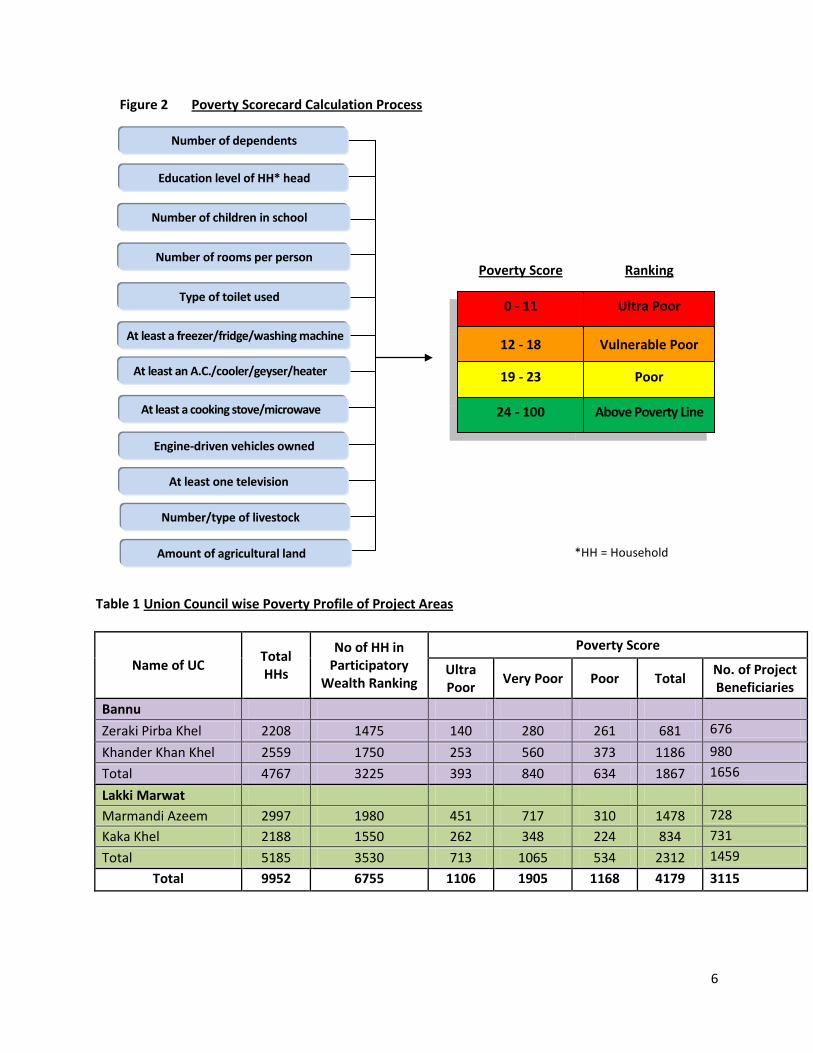
Figure 2 Poverty Scorecard Calculation Process
*HH = Household
Table 1 Union Council wise Poverty Profile of Project Areas
Name of UC Total HHs
No of HH in Participatory
Wealth Ranking
Poverty Score
Ultra Poor Very Poor Poor Total No. of Project
Beneficiaries Bannu Zeraki Pirba Khel 2208 1475 140 280 261 681 676
Khander Khan Khel 2559 1750 253 560 373 1186 980 Total 4767 3225 393 840 634 1867 1656
Lakki Marwat Marmandi Azeem 2997 1980 451 717 310 1478 728 Kaka Khel 2188 1550 262 348 224 834 731 Total 5185 3530 713 1065 534 2312 1459
Total 9952 6755 1106 1905 1168 4179 3115
Ranking
Ultra Poor
Vulnerable Poor
Poor
Above Poverty Line
Poverty Score
0 - 11
12 - 18
19 - 23
24 - 100
Education level of HH* head
Number of children in school
Number of rooms per person
Type of toilet used
At least an A.C./cooler/geyser/heater
At least a cooking stove/microwave
Engine-driven vehicles owned
At least one television
Number/type of livestock
Amount of agricultural land
Number of dependents
At least a freezer/fridge/washing machine
7
The consolidated poverty profile project data presented in Table 1 indicates that out of the total 9952 households in 4 selected union councils of districts Bannu and Lakki Marwat 6755 households participated in the wealth ranking activities. The poverty score card calculation process later contributed in the identification of 4179 poor households from the entire project area out of which 1106 HH were ultra poor, 1905 were very poor, and 1168 were categorized as poor households. The Table 1 also reflects that 3115 poor HH out of the identified 4179 poor HH were selected as potential LEP Program beneficiaries. It also shows that 1656 program beneficiaries were from 2 union councils of district Bannu and 1459 HH beneficiaries were from other two union councils of district Lakki Marwat. 3.2 Livelihood Investment Plans (LIPs)
CMDO LEP program staff in coordination with respective COs facilitated selected 3115 program beneficiaries in the preparation of their LIPs. The LIP format developed by the PPAF was slightly amended to accommodate local realities. The LIPs preparation process was critical from the perspective of capturing livelihood information from a household considered eligible for support. Particularly, by gathering data of household members and their access to various types of assets, it was useful for determining a household’s livelihood strengths and weaknesses as well as developing an appropriate plan of action for livelihood support. COs visited household beneficiaries and completed their LIPs.
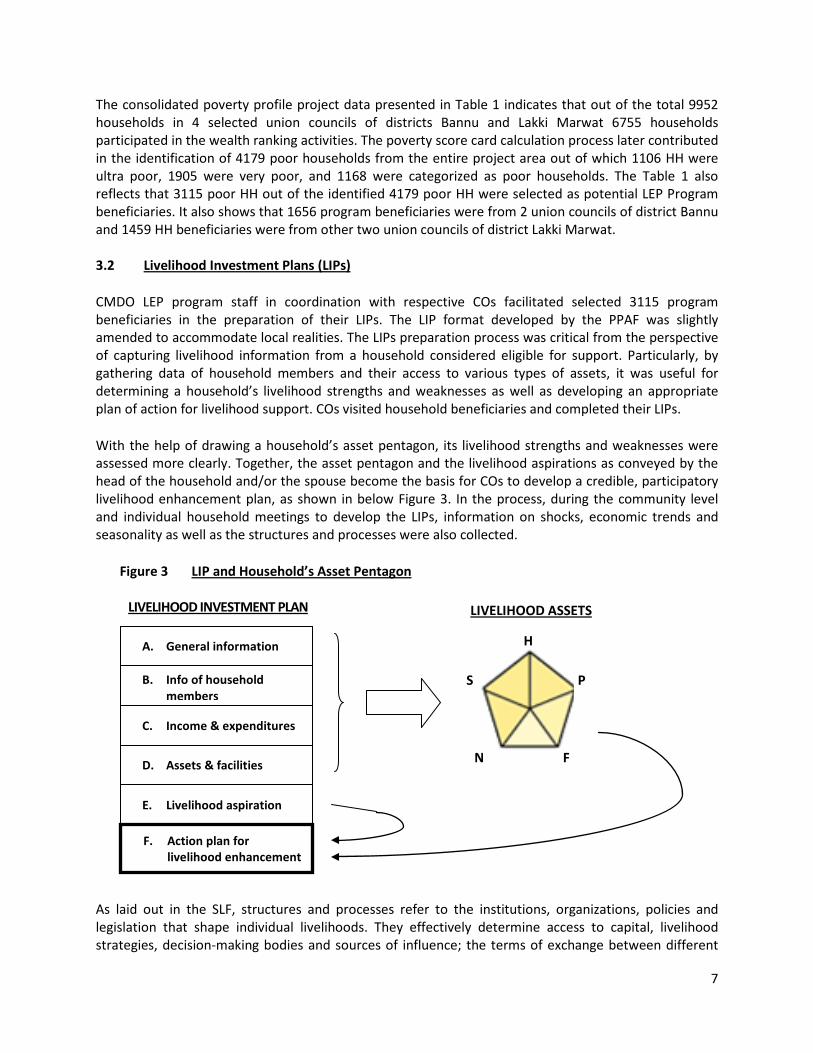
With the help of drawing a household’s asset pentagon, its livelihood strengths and weaknesses were assessed more clearly. Together, the asset pentagon and the livelihood aspirations as conveyed by the head of the household and/or the spouse become the basis for COs to develop a credible, participatory livelihood enhancement plan, as shown in below Figure 3. In the process, during the community level and individual household meetings to develop the LIPs, information on shocks, economic trends and seasonality as well as the structures and processes were also collected.
Figure 3 LIP and Household’s Asset Pentagon
As laid out in the SLF, structures and processes refer to the institutions, organizations, policies and legislation that shape individual livelihoods. They effectively determine access to capital, livelihood strategies, decision-making bodies and sources of influence; the terms of exchange between different
LIVELIHOOD ASSETS LIVELIHOOD INVESTMENT PLAN
B. Info of household members
A. General information
C. Income & expenditures
D. Assets & facilities
E. Livelihood aspiration
F. Action plan for livelihood enhancement
N F
S
H
P
8
types of capital; and the economic and other returns to any given livelihood strategy. They also directly impact on whether people are able to achieve a feeling of inclusion and wellbeing. Thus, the preparation of LIPs provided an opportunity for CMDO to assess the overall strengths and weaknesses of the livelihood environment in the project area, generated household level livelihood enhancement roadmaps for addressing gaps, via specific capacity-building measures, and setting each house hold level target outcomes and devising practicable strategies to achieve them.
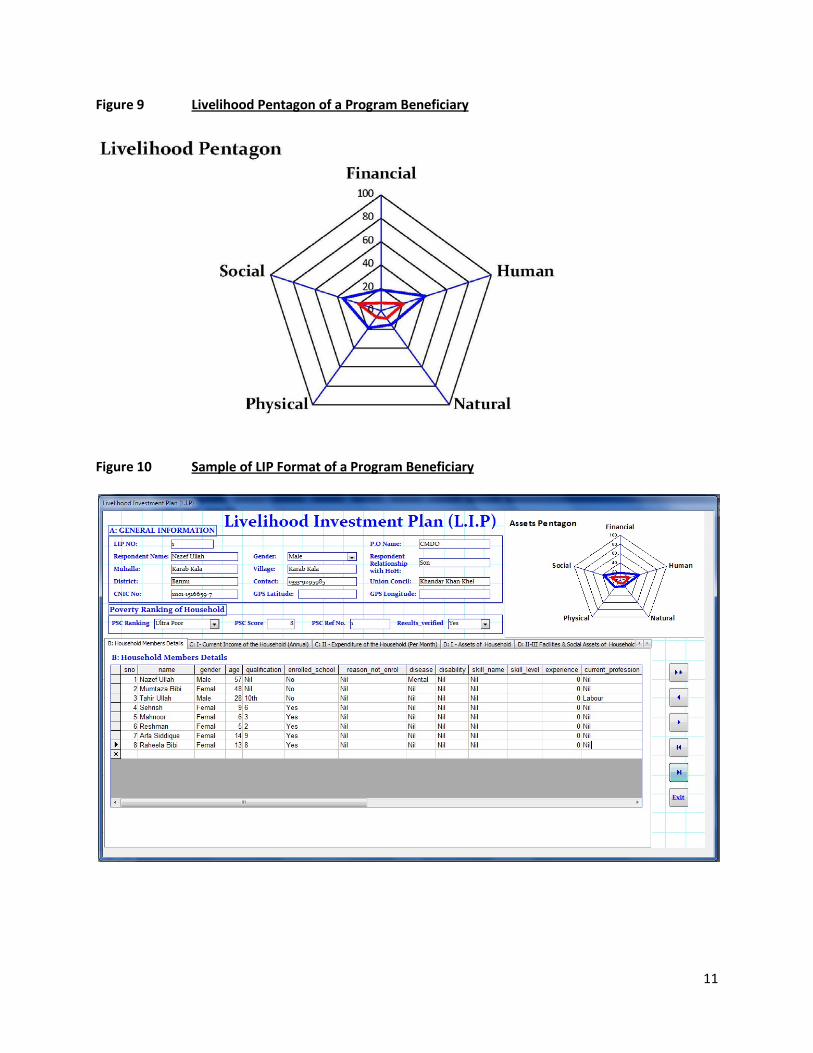
During the preparation of LIPs, extensive information was gathered and analyzed in order to use it for drawing an accurate picture of each household beneficiary’s access to key livelihood assets which mainly include human, natural, social, physical and financial capitals. Livelihood Asset Pentagon of each program beneficiary was drawn in order to get visual representation of information regarding HH’s assets. Each corner of the pentagon represented the level of access to a specific type of asset. The centre point of the pentagon, where the lines meet, represents zero access to assets while the outer perimeter represents maximum access. Therefore, the shape of the pentagon can show schematically the variation in people’s access to assets. Below are further details about the five capitals and some selected examples of program beneficiaries in relation to analyzing their capitals, drawing assets pentagon, and preparing LIPs of selected 3115 program beneficiaries.
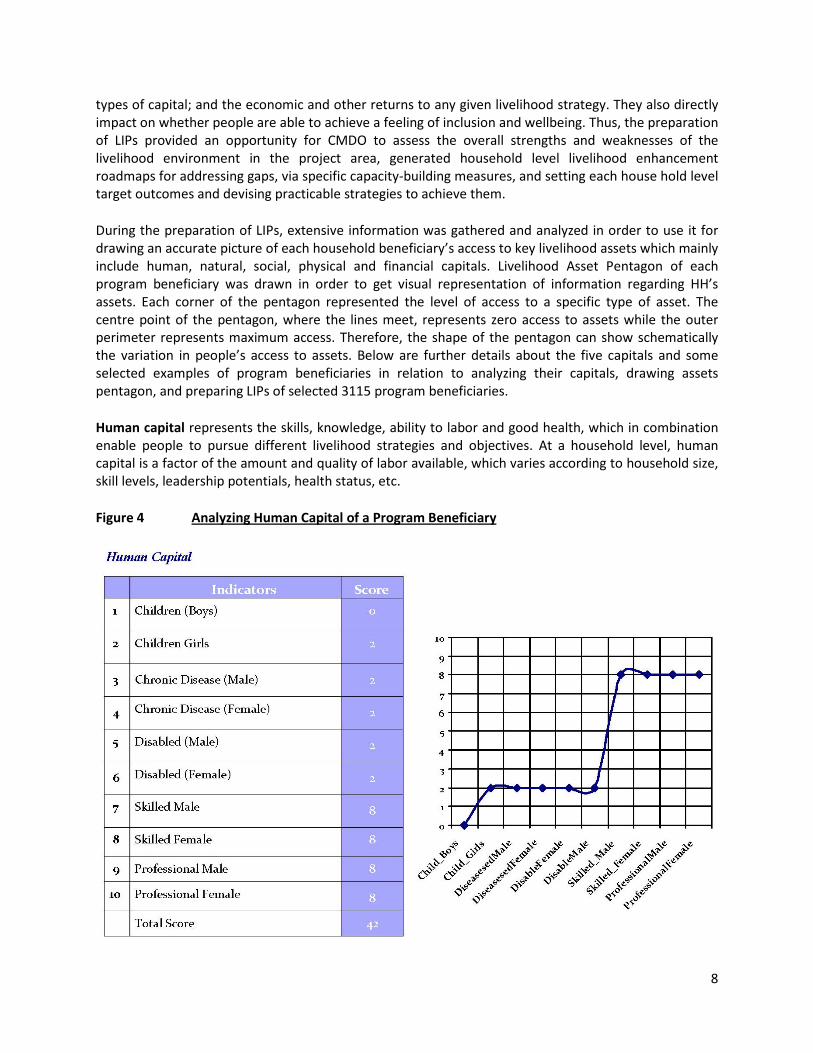
Human capital represents the skills, knowledge, ability to labor and good health, which in combination enable people to pursue different livelihood strategies and objectives. At a household level, human capital is a factor of the amount and quality of labor available, which varies according to household size, skill levels, leadership potentials, health status, etc.
Figure 4 Analyzing Human Capital of a Program Beneficiary
9
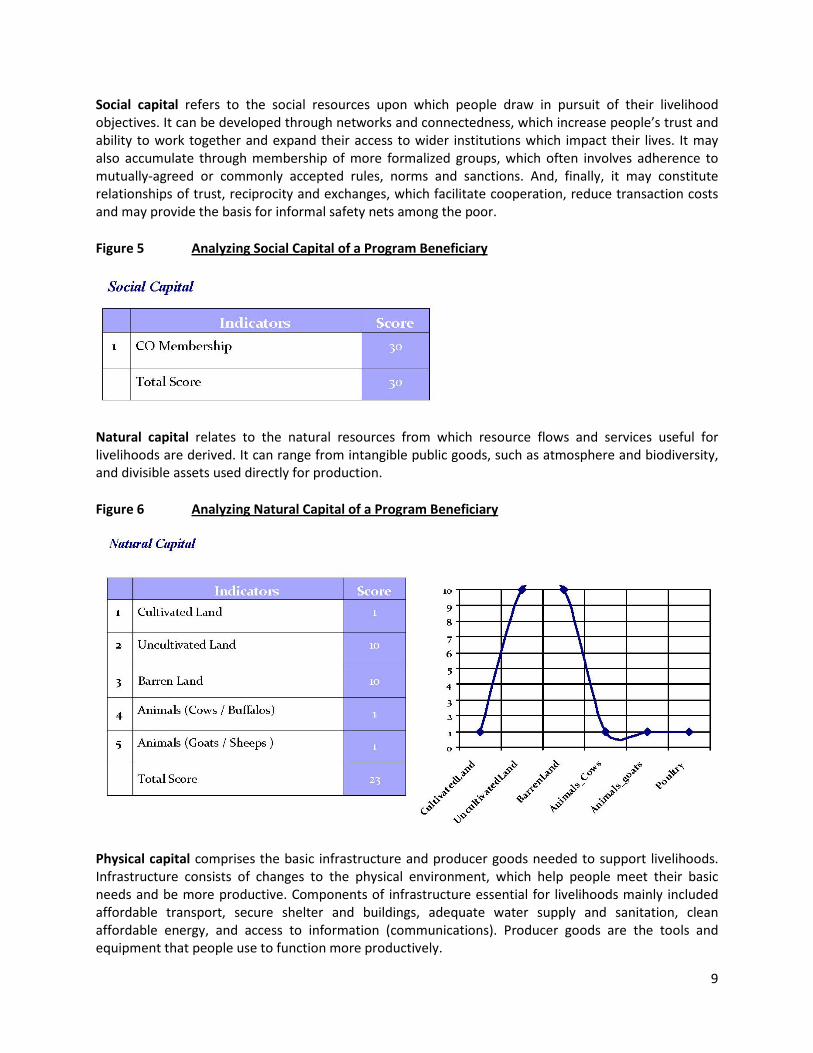
Social capital refers to the social resources upon which people draw in pursuit of their livelihood objectives. It can be developed through networks and connectedness, which increase people’s trust and ability to work together and expand their access to wider institutions which impact their lives. It may also accumulate through membership of more formalized groups, which often involves adherence to mutually-agreed or commonly accepted rules, norms and sanctions. And, finally, it may constitute relationships of trust, reciprocity and exchanges, which facilitate cooperation, reduce transaction costs and may provide the basis for informal safety nets among the poor.
Figure 5 Analyzing Social Capital of a Program Beneficiary
Natural capital relates to the natural resources from which resource flows and services useful for livelihoods are derived. It can range from intangible public goods, such as atmosphere and biodiversity, and divisible assets used directly for production.
Figure 6 Analyzing Natural Capital of a Program Beneficiary
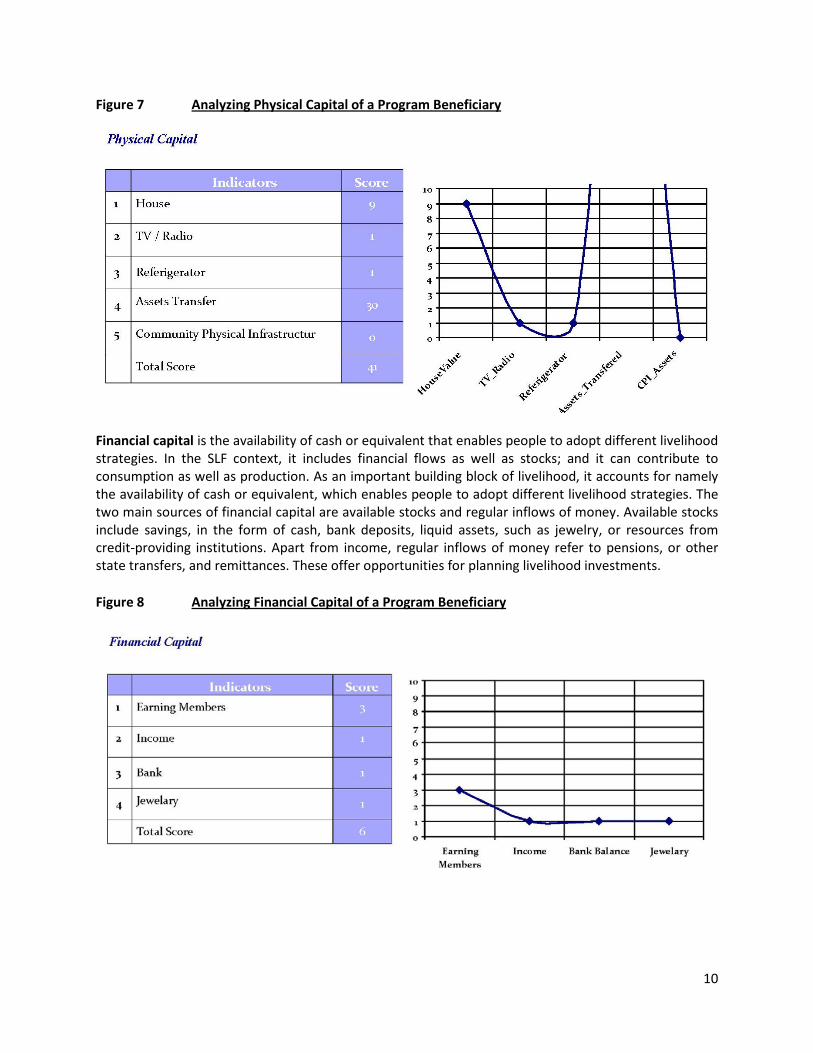
Physical capital comprises the basic infrastructure and producer goods needed to support livelihoods. Infrastructure consists of changes to the physical environment, which help people meet their basic needs and be more productive. Components of infrastructure essential for livelihoods mainly included affordable transport, secure shelter and buildings, adequate water supply and sanitation, clean affordable energy, and access to information (communications). Producer goods are the tools and equipment that people use to function more productively.
10
Figure 7 Analyzing Physical Capital of a Program Beneficiary
Financial capital is the availability of cash or equivalent that enables people to adopt different livelihood strategies. In the SLF context, it includes financial flows as well as stocks; and it can contribute to consumption as well as production. As an important building block of livelihood, it accounts for namely the availability of cash or equivalent, which enables people to adopt different livelihood strategies. The two main sources of financial capital are available stocks and regular inflows of money. Available stocks include savings, in the form of cash, bank deposits, liquid assets, such as jewelry, or resources from credit-providing institutions. Apart from income, regular inflows of money refer to pensions, or other state transfers, and remittances. These offer opportunities for planning livelihood investments.
Figure 8 Analyzing Financial Capital of a Program Beneficiary
11
Figure 9 Livelihood Pentagon of a Program Beneficiary
Figure 10 Sample of LIP Format of a Program Beneficiary
12
3.3 Interventions on Livelihood Enhancement & Protection
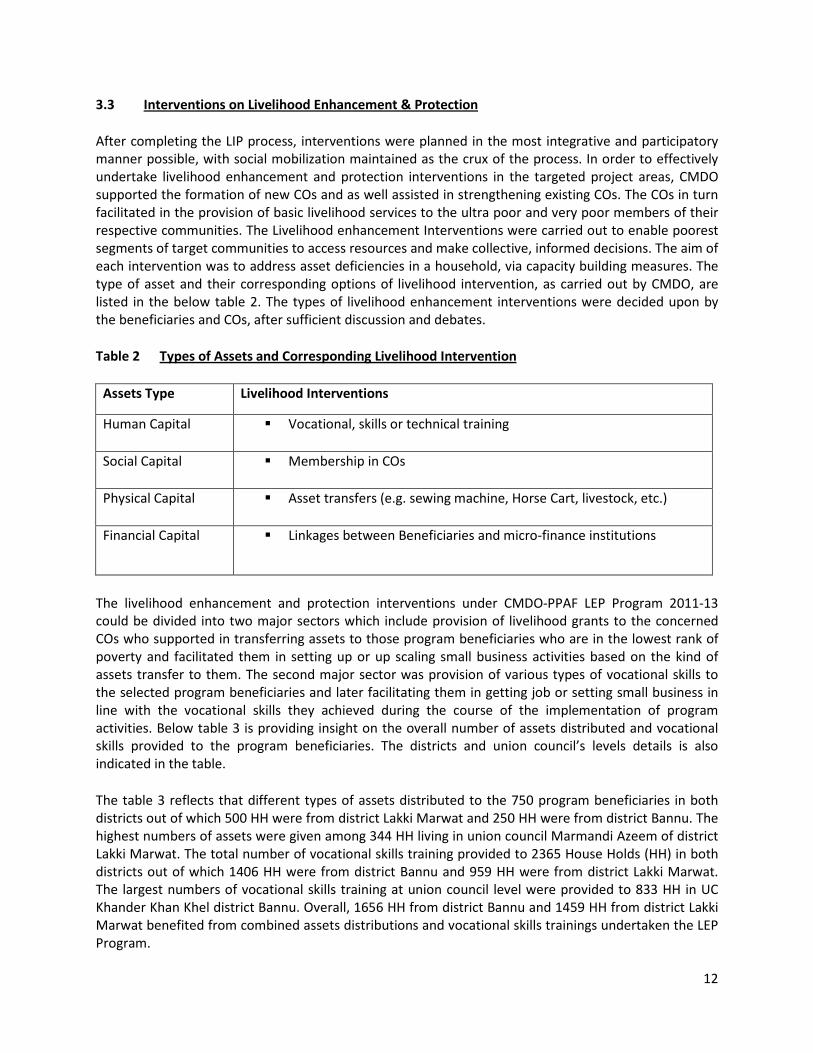
After completing the LIP process, interventions were planned in the most integrative and participatory manner possible, with social mobilization maintained as the crux of the process. In order to effectively undertake livelihood enhancement and protection interventions in the targeted project areas, CMDO supported the formation of new COs and as well assisted in strengthening existing COs. The COs in turn facilitated in the provision of basic livelihood services to the ultra poor and very poor members of their respective communities. The Livelihood enhancement Interventions were carried out to enable poorest segments of target communities to access resources and make collective, informed decisions. The aim of each intervention was to address asset deficiencies in a household, via capacity building measures. The type of asset and their corresponding options of livelihood intervention, as carried out by CMDO, are listed in the below table 2. The types of livelihood enhancement interventions were decided upon by the beneficiaries and COs, after sufficient discussion and debates.
Table 2 Types of Assets and Corresponding Livelihood Intervention
Assets Type Livelihood Interventions
Human Capital Vocational, skills or technical training
Social Capital Membership in COs
Physical Capital Asset transfers (e.g. sewing machine, Horse Cart, livestock, etc.)
Financial Capital Linkages between Beneficiaries and micro-finance institutions
The livelihood enhancement and protection interventions under CMDO-PPAF LEP Program 2011-13 could be divided into two major sectors which include provision of livelihood grants to the concerned COs who supported in transferring assets to those program beneficiaries who are in the lowest rank of poverty and facilitated them in setting up or up scaling small business activities based on the kind of assets transfer to them. The second major sector was provision of various types of vocational skills to the selected program beneficiaries and later facilitating them in getting job or setting small business in line with the vocational skills they achieved during the course of the implementation of program activities. Below table 3 is providing insight on the overall number of assets distributed and vocational skills provided to the program beneficiaries. The districts and union council’s levels details is also indicated in the table.
The table 3 reflects that different types of assets distributed to the 750 program beneficiaries in both districts out of which 500 HH were from district Lakki Marwat and 250 HH were from district Bannu. The highest numbers of assets were given among 344 HH living in union council Marmandi Azeem of district Lakki Marwat. The total number of vocational skills training provided to 2365 House Holds (HH) in both districts out of which 1406 HH were from district Bannu and 959 HH were from district Lakki Marwat. The largest numbers of vocational skills training at union council level were provided to 833 HH in UC Khander Khan Khel district Bannu. Overall, 1656 HH from district Bannu and 1459 HH from district Lakki Marwat benefited from combined assets distributions and vocational skills trainings undertaken the LEP Program.
13
Table 3 Union Council wise Number of Assets Distributed and Vocational Skills Provided
Name of UC Number of Assets Distributed
Number of Vocational Skills Trainings
Grand Total
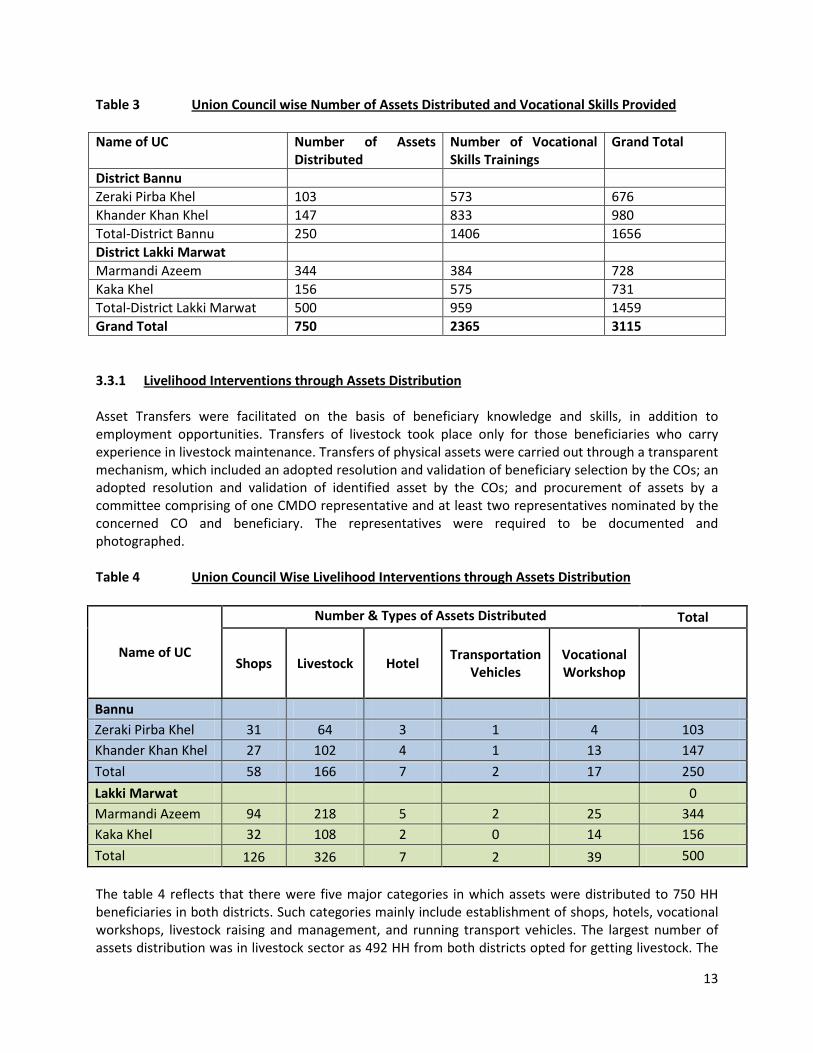
District Bannu Zeraki Pirba Khel 103 573 676 Khander Khan Khel 147 833 980 Total-District Bannu 250 1406 1656 District Lakki Marwat Marmandi Azeem 344 384 728 Kaka Khel 156 575 731 Total-District Lakki Marwat 500 959 1459 Grand Total 750 2365 3115 3.3.1 Livelihood Interventions through Assets Distribution Asset Transfers were facilitated on the basis of beneficiary knowledge and skills, in addition to employment opportunities. Transfers of livestock took place only for those beneficiaries who carry experience in livestock maintenance. Transfers of physical assets were carried out through a transparent mechanism, which included an adopted resolution and validation of beneficiary selection by the COs; an adopted resolution and validation of identified asset by the COs; and procurement of assets by a committee comprising of one CMDO representative and at least two representatives nominated by the concerned CO and beneficiary. The representatives were required to be documented and photographed. Table 4 Union Council Wise Livelihood Interventions through Assets Distribution
Name of UC
Number & Types of Assets Distributed Total
Shops Livestock Hotel Transportation Vehicles
Vocational Workshop
Bannu Zeraki Pirba Khel 31 64 3 1 4 103 Khander Khan Khel 27 102 4 1 13 147 Total 58 166 7 2 17 250 Lakki Marwat 0 Marmandi Azeem 94 218 5 2 25 344 Kaka Khel 32 108 2 0 14 156 Total 126 326 7 2 39 500 The table 4 reflects that there were five major categories in which assets were distributed to 750 HH beneficiaries in both districts. Such categories mainly include establishment of shops, hotels, vocational workshops, livestock raising and management, and running transport vehicles. The largest number of assets distribution was in livestock sector as 492 HH from both districts opted for getting livestock. The
14
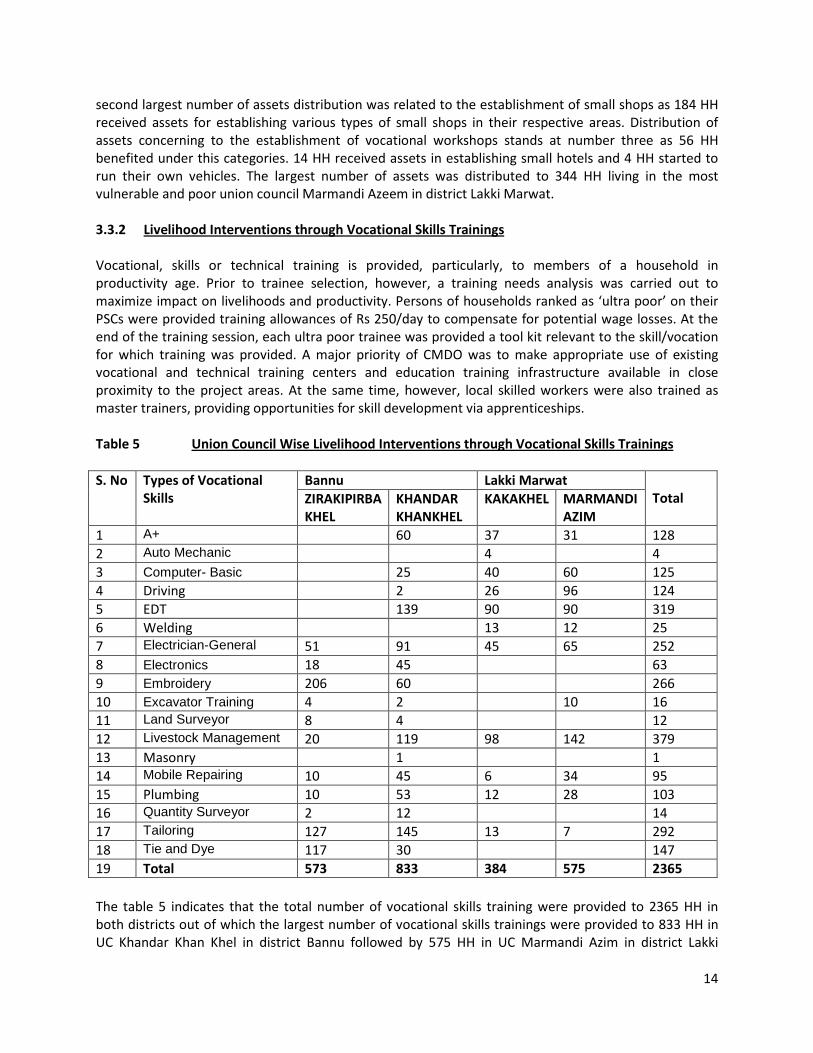
second largest number of assets distribution was related to the establishment of small shops as 184 HH received assets for establishing various types of small shops in their respective areas. Distribution of assets concerning to the establishment of vocational workshops stands at number three as 56 HH benefited under this categories. 14 HH received assets in establishing small hotels and 4 HH started to run their own vehicles. The largest number of assets was distributed to 344 HH living in the most vulnerable and poor union council Marmandi Azeem in district Lakki Marwat. 3.3.2 Livelihood Interventions through Vocational Skills Trainings Vocational, skills or technical training is provided, particularly, to members of a household in productivity age. Prior to trainee selection, however, a training needs analysis was carried out to maximize impact on livelihoods and productivity. Persons of households ranked as ‘ultra poor’ on their PSCs were provided training allowances of Rs 250/day to compensate for potential wage losses. At the end of the training session, each ultra poor trainee was provided a tool kit relevant to the skill/vocation for which training was provided. A major priority of CMDO was to make appropriate use of existing vocational and technical training centers and education training infrastructure available in close proximity to the project areas. At the same time, however, local skilled workers were also trained as master trainers, providing opportunities for skill development via apprenticeships. Table 5 Union Council Wise Livelihood Interventions through Vocational Skills Trainings S. No Types of Vocational
Skills Bannu Lakki Marwat
Total ZIRAKIPIRBA KHEL
KHANDAR KHANKHEL
KAKAKHEL MARMANDI AZIM
1 A+ 60 37 31 128 2 Auto Mechanic 4 4 3 Computer- Basic 25 40 60 125 4 Driving 2 26 96 124 5 EDT 139 90 90 319 6 Welding 13 12 25 7 Electrician-General 51 91 45 65 252 8 Electronics 18 45 63 9 Embroidery 206 60 266 10 Excavator Training 4 2 10 16 11 Land Surveyor 8 4 12 12 Livestock Management 20 119 98 142 379 13 Masonry 1 1 14 Mobile Repairing 10 45 6 34 95 15 Plumbing 10 53 12 28 103 16 Quantity Surveyor 2 12 14 17 Tailoring 127 145 13 7 292 18 Tie and Dye 117 30 147 19 Total 573 833 384 575 2365 The table 5 indicates that the total number of vocational skills training were provided to 2365 HH in both districts out of which the largest number of vocational skills trainings were provided to 833 HH in UC Khandar Khan Khel in district Bannu followed by 575 HH in UC Marmandi Azim in district Lakki
15
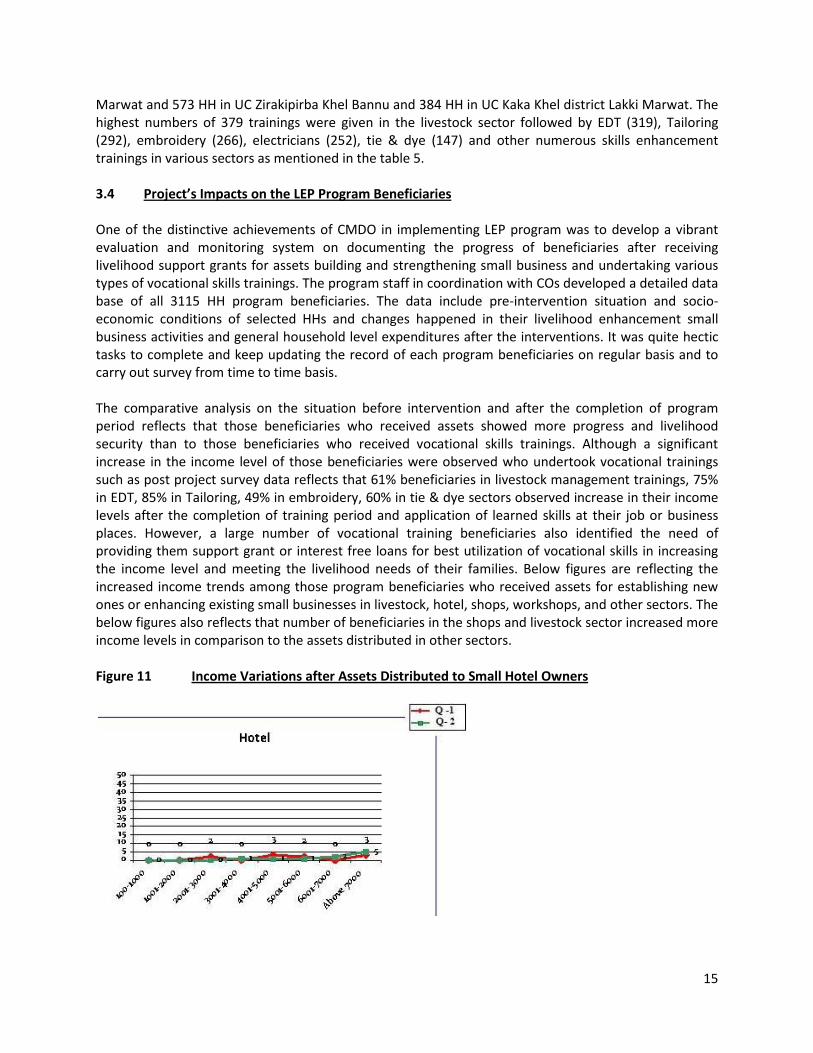
Marwat and 573 HH in UC Zirakipirba Khel Bannu and 384 HH in UC Kaka Khel district Lakki Marwat. The highest numbers of 379 trainings were given in the livestock sector followed by EDT (319), Tailoring (292), embroidery (266), electricians (252), tie & dye (147) and other numerous skills enhancement trainings in various sectors as mentioned in the table 5. 3.4 Project’s Impacts on the LEP Program Beneficiaries One of the distinctive achievements of CMDO in implementing LEP program was to develop a vibrant evaluation and monitoring system on documenting the progress of beneficiaries after receiving livelihood support grants for assets building and strengthening small business and undertaking various types of vocational skills trainings. The program staff in coordination with COs developed a detailed data base of all 3115 HH program beneficiaries. The data include pre-intervention situation and socio-economic conditions of selected HHs and changes happened in their livelihood enhancement small business activities and general household level expenditures after the interventions. It was quite hectic tasks to complete and keep updating the record of each program beneficiaries on regular basis and to carry out survey from time to time basis. The comparative analysis on the situation before intervention and after the completion of program period reflects that those beneficiaries who received assets showed more progress and livelihood security than to those beneficiaries who received vocational skills trainings. Although a significant increase in the income level of those beneficiaries were observed who undertook vocational trainings such as post project survey data reflects that 61% beneficiaries in livestock management trainings, 75% in EDT, 85% in Tailoring, 49% in embroidery, 60% in tie & dye sectors observed increase in their income levels after the completion of training period and application of learned skills at their job or business places. However, a large number of vocational training beneficiaries also identified the need of providing them support grant or interest free loans for best utilization of vocational skills in increasing the income level and meeting the livelihood needs of their families. Below figures are reflecting the increased income trends among those program beneficiaries who received assets for establishing new ones or enhancing existing small businesses in livestock, hotel, shops, workshops, and other sectors. The below figures also reflects that number of beneficiaries in the shops and livestock sector increased more income levels in comparison to the assets distributed in other sectors. Figure 11 Income Variations after Assets Distributed to Small Hotel Owners
16
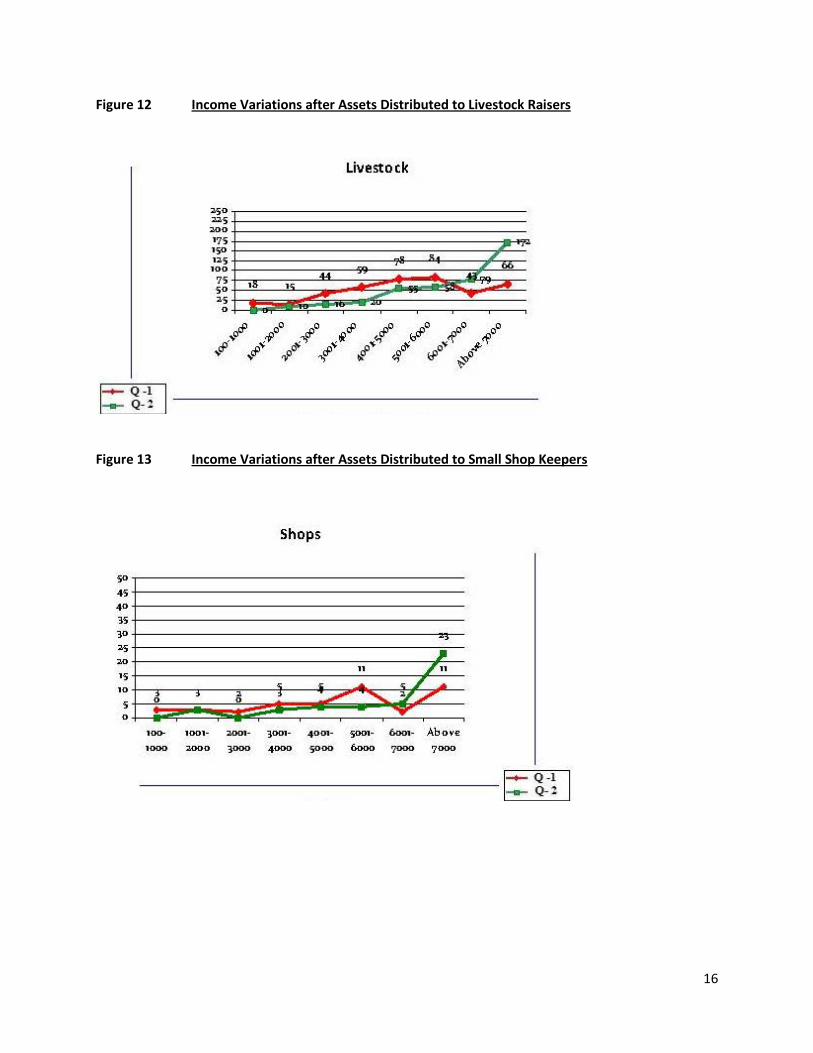
Figure 12 Income Variations after Assets Distributed to Livestock Raisers
Figure 13 Income Variations after Assets Distributed to Small Shop Keepers
17
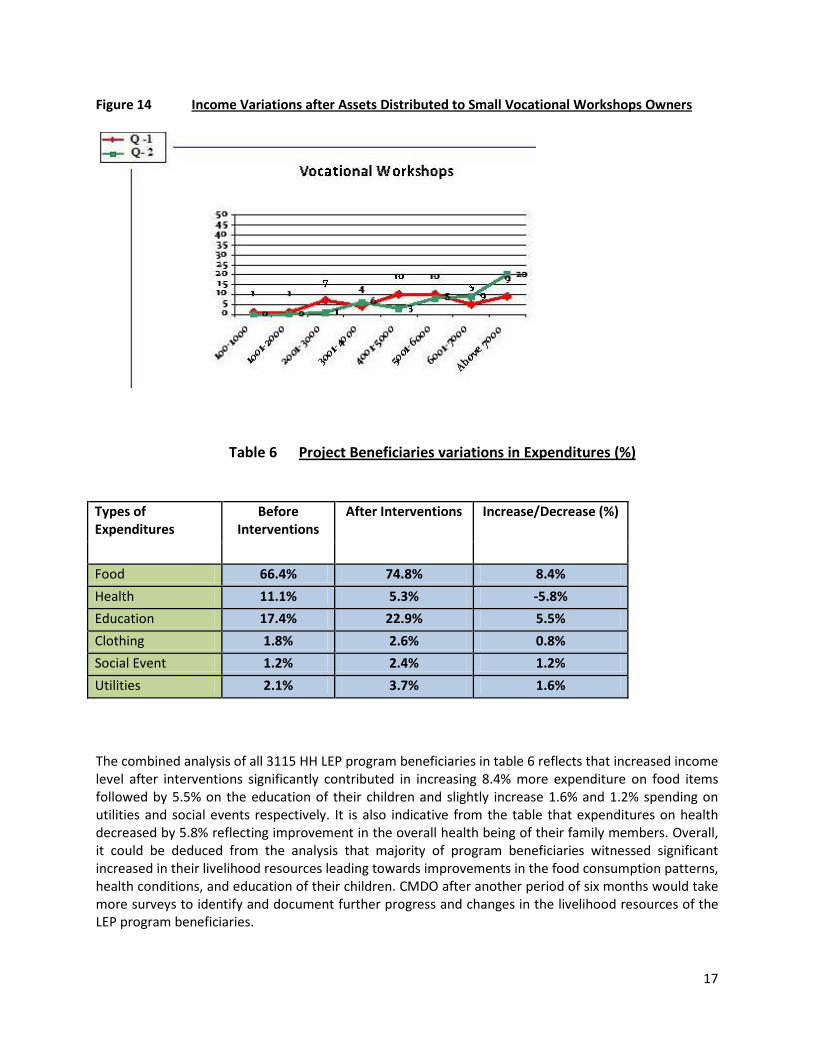
Figure 14 Income Variations after Assets Distributed to Small Vocational Workshops Owners
Table 6 Project Beneficiaries variations in Expenditures (%)
Types of Expenditures
Before Interventions
After Interventions Increase/Decrease (%)
Food 66.4% 74.8% 8.4% Health 11.1% 5.3% -5.8% Education 17.4% 22.9% 5.5% Clothing 1.8% 2.6% 0.8% Social Event 1.2% 2.4% 1.2% Utilities 2.1% 3.7% 1.6% The combined analysis of all 3115 HH LEP program beneficiaries in table 6 reflects that increased income level after interventions significantly contributed in increasing 8.4% more expenditure on food items followed by 5.5% on the education of their children and slightly increase 1.6% and 1.2% spending on utilities and social events respectively. It is also indicative from the table that expenditures on health decreased by 5.8% reflecting improvement in the overall health being of their family members. Overall, it could be deduced from the analysis that majority of program beneficiaries witnessed significant increased in their livelihood resources leading towards improvements in the food consumption patterns, health conditions, and education of their children. CMDO after another period of six months would take more surveys to identify and document further progress and changes in the livelihood resources of the LEP program beneficiaries.
18
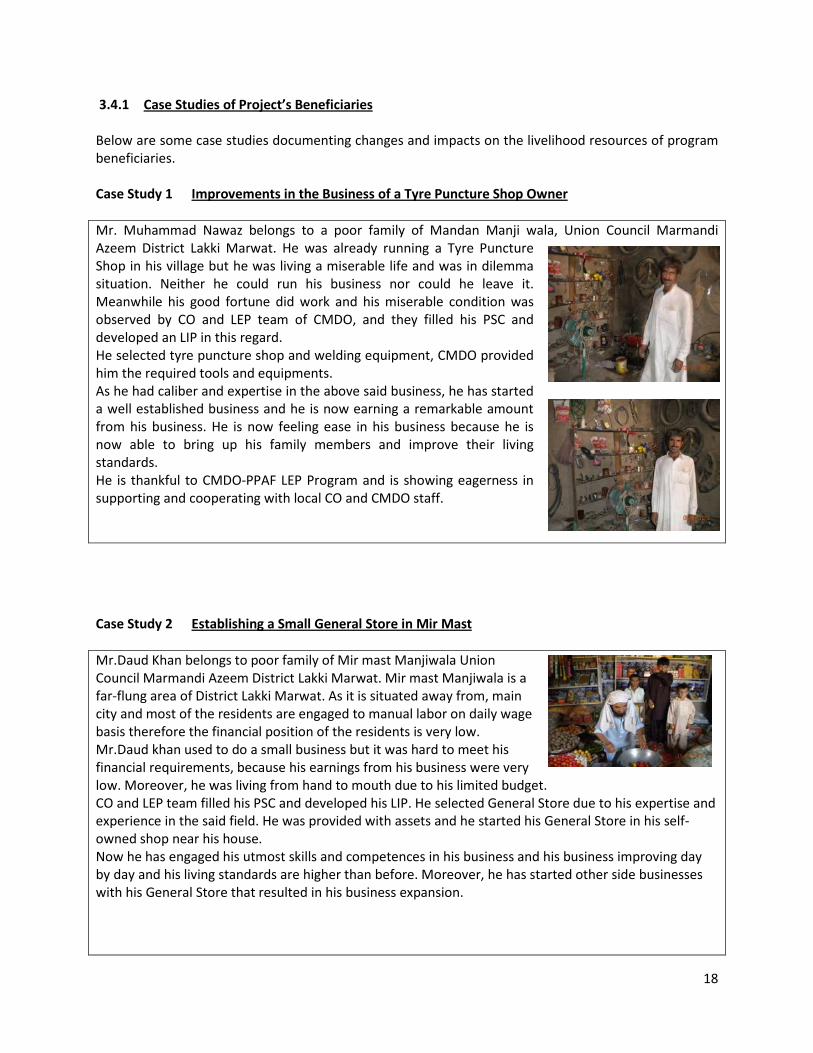
3.4.1 Case Studies of Project’s Beneficiaries Below are some case studies documenting changes and impacts on the livelihood resources of program beneficiaries. Case Study 1 Improvements in the Business of a Tyre Puncture Shop Owner Mr. Muhammad Nawaz belongs to a poor family of Mandan Manji wala, Union Council Marmandi Azeem District Lakki Marwat. He was already running a Tyre Puncture Shop in his village but he was living a miserable life and was in dilemma situation. Neither he could run his business nor could he leave it. Meanwhile his good fortune did work and his miserable condition was observed by CO and LEP team of CMDO, and they filled his PSC and developed an LIP in this regard. He selected tyre puncture shop and welding equipment, CMDO provided him the required tools and equipments. As he had caliber and expertise in the above said business, he has started a well established business and he is now earning a remarkable amount from his business. He is now feeling ease in his business because he is now able to bring up his family members and improve their living standards. He is thankful to CMDO-PPAF LEP Program and is showing eagerness in supporting and cooperating with local CO and CMDO staff. Case Study 2 Establishing a Small General Store in Mir Mast Mr.Daud Khan belongs to poor family of Mir mast Manjiwala Union Council Marmandi Azeem District Lakki Marwat. Mir mast Manjiwala is a far-flung area of District Lakki Marwat. As it is situated away from, main city and most of the residents are engaged to manual labor on daily wage basis therefore the financial position of the residents is very low. Mr.Daud khan used to do a small business but it was hard to meet his financial requirements, because his earnings from his business were very low. Moreover, he was living from hand to mouth due to his limited budget. CO and LEP team filled his PSC and developed his LIP. He selected General Store due to his expertise and experience in the said field. He was provided with assets and he started his General Store in his self-owned shop near his house. Now he has engaged his utmost skills and competences in his business and his business improving day by day and his living standards are higher than before. Moreover, he has started other side businesses with his General Store that resulted in his business expansion.
19
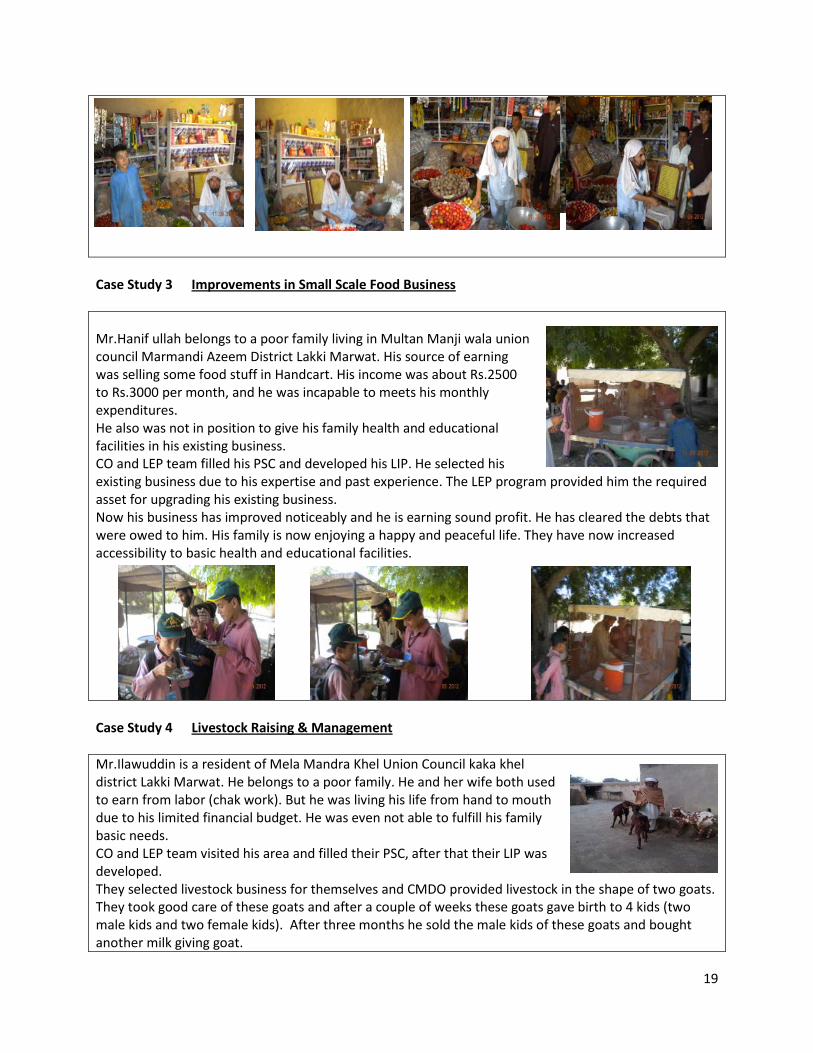
Case Study 3 Improvements in Small Scale Food Business Mr.Hanif ullah belongs to a poor family living in Multan Manji wala union council Marmandi Azeem District Lakki Marwat. His source of earning was selling some food stuff in Handcart. His income was about Rs.2500 to Rs.3000 per month, and he was incapable to meets his monthly expenditures. He also was not in position to give his family health and educational facilities in his existing business. CO and LEP team filled his PSC and developed his LIP. He selected his existing business due to his expertise and past experience. The LEP program provided him the required asset for upgrading his existing business. Now his business has improved noticeably and he is earning sound profit. He has cleared the debts that were owed to him. His family is now enjoying a happy and peaceful life. They have now increased accessibility to basic health and educational facilities.
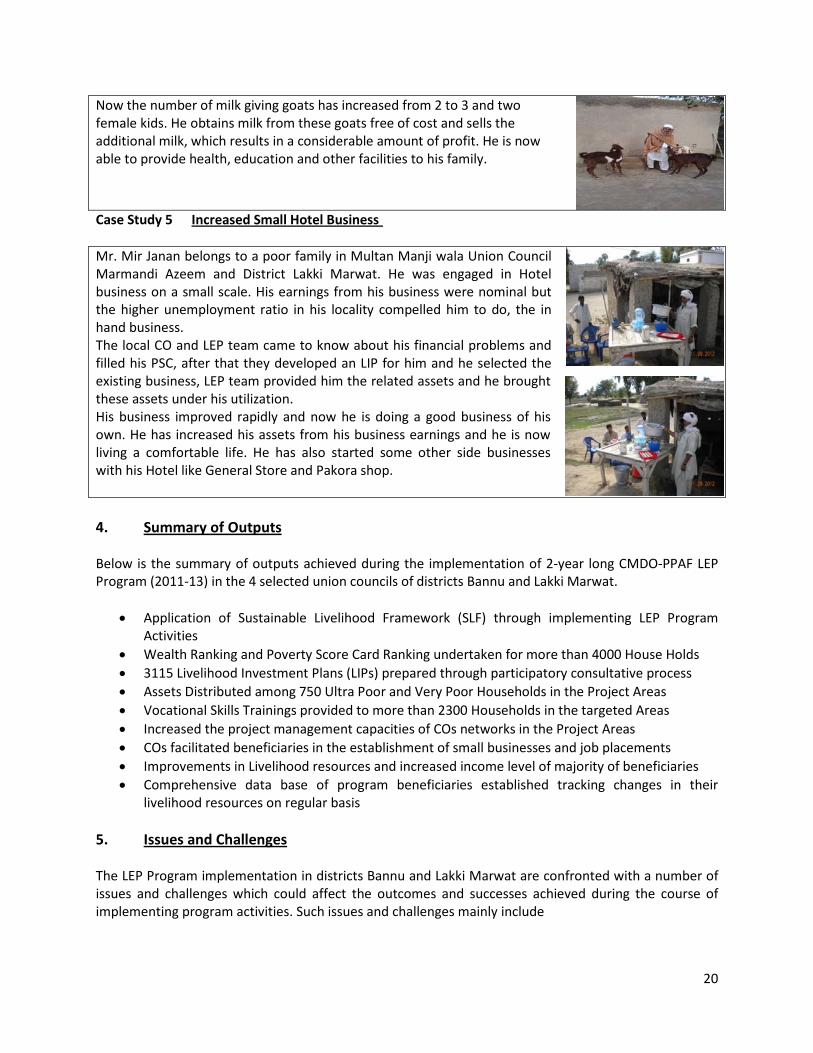
Case Study 4 Livestock Raising & Management Mr.Ilawuddin is a resident of Mela Mandra Khel Union Council kaka khel district Lakki Marwat. He belongs to a poor family. He and her wife both used to earn from labor (chak work). But he was living his life from hand to mouth due to his limited financial budget. He was even not able to fulfill his family basic needs. CO and LEP team visited his area and filled their PSC, after that their LIP was developed. They selected livestock business for themselves and CMDO provided livestock in the shape of two goats. They took good care of these goats and after a couple of weeks these goats gave birth to 4 kids (two male kids and two female kids). After three months he sold the male kids of these goats and bought another milk giving goat.
20
Now the number of milk giving goats has increased from 2 to 3 and two female kids. He obtains milk from these goats free of cost and sells the additional milk, which results in a considerable amount of profit. He is now able to provide health, education and other facilities to his family.
Case Study 5 Increased Small Hotel Business Mr. Mir Janan belongs to a poor family in Multan Manji wala Union Council Marmandi Azeem and District Lakki Marwat. He was engaged in Hotel business on a small scale. His earnings from his business were nominal but the higher unemployment ratio in his locality compelled him to do, the in hand business. The local CO and LEP team came to know about his financial problems and filled his PSC, after that they developed an LIP for him and he selected the existing business, LEP team provided him the related assets and he brought these assets under his utilization. His business improved rapidly and now he is doing a good business of his own. He has increased his assets from his business earnings and he is now living a comfortable life. He has also started some other side businesses with his Hotel like General Store and Pakora shop. 4. Summary of Outputs Below is the summary of outputs achieved during the implementation of 2-year long CMDO-PPAF LEP Program (2011-13) in the 4 selected union councils of districts Bannu and Lakki Marwat.
• Application of Sustainable Livelihood Framework (SLF) through implementing LEP Program Activities
• Wealth Ranking and Poverty Score Card Ranking undertaken for more than 4000 House Holds • 3115 Livelihood Investment Plans (LIPs) prepared through participatory consultative process • Assets Distributed among 750 Ultra Poor and Very Poor Households in the Project Areas • Vocational Skills Trainings provided to more than 2300 Households in the targeted Areas • Increased the project management capacities of COs networks in the Project Areas • COs facilitated beneficiaries in the establishment of small businesses and job placements • Improvements in Livelihood resources and increased income level of majority of beneficiaries • Comprehensive data base of program beneficiaries established tracking changes in their
livelihood resources on regular basis 5. Issues and Challenges The LEP Program implementation in districts Bannu and Lakki Marwat are confronted with a number of issues and challenges which could affect the outcomes and successes achieved during the course of implementing program activities. Such issues and challenges mainly include
21
• The overall macro-economic situation at national and provincial level could restrict the livelihood enhancement and protection process of program beneficiaries. The small scale businesses of program beneficiaries could be affected by high inflation rate, food items price hike, and oil price hike in the international market.
• The spillover effects of ongoing war against terrorism in the neighboring parts of project districts
has heavily contributed in increasing the insecurity and vulnerabilities of program beneficiaries towards violence, mental illness, and threats of displacements. It is also contributing in highly slow pace of development and trade/business activities in the project areas.
• Gender issues need to be addressed in the project areas in long term perspectives. Due to
cultural constraints, participation of women in program activities is not up to the desirable levels. There is need to sensitize local population on the equal development rights of women and encourage them for increased women participation in future program activities.
6. Recommendations The future LEP program activities should integrate livelihood enhancement activities with the
provision of interest free loan for the establishment of small to medium scale enterprises and social entrepreneurships in the backward poverty stricken areas of districts Bannu and Lakki Marwat.
CMDO should undertake external level participatory evaluation of implemented LEP Program in order to develop more locally specific action guidelines for bringing improvements in the future LEP program activities and as well develop policy recommendations for local public institutions for up-scaling and replicating successful LEP program experiences in other under developed areas of districts Bannu and Lakki Marwat.
7. Conclusion The implementation of CMDO-PPAF LEP program activities in 4 selected union councils of districts Bannu and Lakki Marwat demonstrated that introduction and strengthening of sustainable livelihood options among ultra poor and poor households is highly desirable action for addressing the current high scale poverty reduction challenges in the intervened southern districts of Khyber Pakhtunkhwa Province. The adaptation and application of Sustainable Livelihood Framework (SLF) and active participation of community institutions also largely contributed in achieving the set targets and outcomes of LEP Program. It is highly desirable at this stage to further strengthen LEP program in the intervened project areas. The future program actions may include linking enterprise and social entrepreneurships development activities with the livelihood investment plans of future program beneficiaries.