Embed Size (px)
Citation preview

Living in Near Poverty in the United States: 1966–2012
U.S. Department of Commerce Economics and Statistics Administration U.S. CENSUS BUREAU
By Charles Hokayem and Misty L. Heggeness1
INTRODUCTION
The official U.S. poverty thresholds create an explicit boundary that defines who lives in poverty, and the U.S. Census Bureau reports annually on this vulnerable pop-ulation (DeNavas-Walt, Proctor, and Smith, 2013). Less is known about the low-income population living just above official poverty thresholds. This report describes individu-als and families living near poverty—those individuals whose family incomes are close to, but not below, official poverty thresholds.
Unlike the definition of poverty, there is no legislative mandate or policy directive defining near poverty. Histori-cally, the Census Bureau has provided detailed tables of the number and proportion of the population with fam-ily income between 100 and 125 percent of the poverty thresholds and referred to this group as near poor. For consistency, this report defines individuals in near poverty in the same way, and it relies on data from the 1967–2013 Current Population Survey (CPS) Annual Social and Eco-nomic Supplement (ASEC) spanning over 45 years.2
This report provides descriptive characteristics of individu-als in near poverty covering 1966–2012. It also provides a comparison with characteristics of individuals living in poverty. The demographic characteristics include age, sex, race, family type, and region, as well as educational attain-ment, employment status, and health insurance coverage.
1 Charles Hokayem is an Economist in the Poverty Statistics Branch at the U.S. Census Bureau. Misty L. Heggeness is a Labor Economist at the National Institutes of Health. The analysis in this report was conducted while Misty Heggeness was employed by the U.S. Census Bureau.
2 This report uses the first available and most recently available CPS ASEC, 1967 and 2013, respectively.
Since federal and state assistance programs are targeted to the low-income population, including those in near poverty, this report also gives assis-tance program participation rates of those in near poverty. These programs include public assistance, Temporary Assistance to Needy Families (TANF), the Supplemental Nutrition Assistance Program (SNAP, formerly known as Food Stamps), the Earned Income Tax Credit (EITC), and the National School Lunch Program.3
HIGHLIGHTS
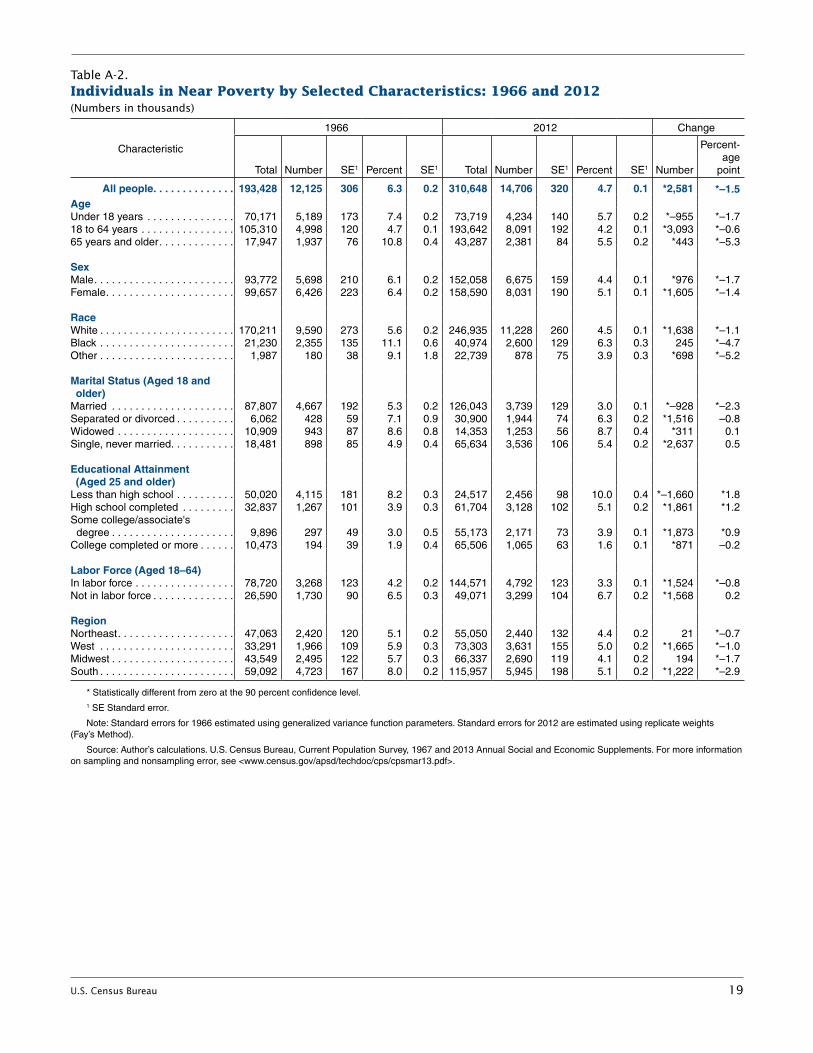
• In2012,14.7millionpeopleintheUnitedStateshad family incomes between 100 and 125 percent of their poverty threshold. The near-poverty rate for individuals decreased from 6.3 percent in 1966 to 4.7 percent in 2012.
• Individualswithlessthanahighschooldegreehad a near-poverty rate of 10.0 percent in 2012, while individuals with a college degree or more had a near-poverty rate of 1.6 percent during the same year.
• Approximately32.5percentofindividualslivingnear poverty in 2012 received SNAP benefits, while 84.6 percent of individuals in near poverty lived with a family member receiving a free or reduced lunch in school.
3 Public assistance programs include Aid to Families With Dependent Children (AFDC) and TANF.
Issued May 2014P60-248
Current Population Reports

2 U.S. Census Bureau
• In2012,about20.7percentofindi-viduals in near poverty qualified for the EITC. In contrast, 16.7 percent of individuals in poverty qualified for the EITC.
• In2012,theshareofthenear- poverty population covered by public health insurance was 43.6 percent, while the share of the poverty population covered by public health insurance was 50.2 percent.
• From2011to2012,theflowofindi-viduals exiting near poverty was sta-tistically unchanged from the flow of individuals entering near poverty.
• From2010to2012,18stateshada 3-year average near-poverty rate lower than the national average; 12 states had a 3-year average near-poverty rate higher than the national rate; and 20 states and the District of Columbia had a 3-year average near-poverty rate not statistically different from the national average.
BACKGROUND
There has been interest in understand-ing the dynamics of those individuals living in near poverty since the develop-ment of poverty measurement in the 1960’s. Mollie Orshansky was known as a federal employee of the Social Secu-rity Administration (SSA) who in the 1960’s developed what is the modern day poverty measure. Less well known is Orshansky’s interest in the near poor, even during the development of the official poverty measure. Orshansky in a 1966 Social Security Bulletin article wrote:
“What is perhaps more striking than the steady reduction in the number of the very poor is the failure to reduce the number just above the minimum poverty line: There are today, just as there were in 1959, about 15-3/4 mil-lion persons in households with income that is above the poverty level but still below what might be considered
SOURCE OF ESTIMATES
The data in this report are from the CPS ASEC covering 1967–2013 and were collected in the 50 states and the District of Columbia. The data do not represent residents in Puerto Rico and the U.S. Island Areas.* The data are based on a sample of about 100,000 addresses. The estimates in this report are controlled to independent national population estimates by age, sex, race, and Hispanic origin for March 2013. The estimates for 2011 and 2012 use population controls based on the 2010 Census.
The CPS is a household survey primarily used to collect employ-ment data. The sample universe for the basic CPS consists of the resident civilian noninstitutionalized population of the United States. People in institutions, such as prisons, long-term care hospitals, and nursing homes, are not eligible to be interviewed in the CPS. Students living in dormitories are included in the estimates only if information about them is reported in an inter-view at their parents’ home. Since the CPS is a household survey, persons who are homeless and not living in shelters are not included in the sample. The sample universe for the CPS ASEC is slightly larger than that of the basic CPS since it includes mili-tary personnel who live in a household with at least one other civilian adult, regardless of whether they live off post or on post. All other Armed Forces are excluded. For further documentation about the CPS ASEC, see <www.census.gov/prod/techdoc/cps /cpsmar13.pdf>.
* U.S. Island Areas include American Samoa, Guam, the Commonwealth of the Northern Mariana Islands, and the Virgin Islands of the United States.
STATISTICAL ACCURACY
Most of the data from the CPS ASEC were collected in March (with some data collected in February and April). The estimates in this report (which may be shown in text, figures, and tables) are based on responses from a sampling of the population and may differ from actual values because of sampling variability or other factors. As a result, apparent differences between the estimates for two or more groups may not be statistically sig-nificant. All comparative statements have undergone statistical testing and are significant at the 90 percent confidence level, unless otherwise noted. In this report, the variances of estimates were calculated using both the Successive Difference Replication method and the Generalized Variance Function approach. Further information about the source and accuracy of the estimates is available at <www.census.gov/hhes/www/p60_245sa.pdf>.

U.S. Census Bureau 3
a reasonable minimum. It will be noticed that from 1959 to 1960, as the count of the poor rose, the number just above the poverty line did drop, only to climb again the following year as the poverty rolls started down. This reciprocal trend suggests that there may be a siz-able group in the population living always on the margin—wavering between dire poverty and a level only slightly higher but never really free from the threat of [de]priva-tion. (25)”
In the same article, Orshansky also discussed the SSA’s two levels of poverty thresholds. They are the “economy” level, which includes just those living under poverty thresholds, and the “low-income” level, which includes both those living under poverty thresholds and those living under 133 percent of poverty thresholds. She defined the near poor as those living at 100 to 133 percent of poverty thresholds (Orshansky, 1966).
In January 1969, an interagency Poverty Level Review committee formed to study price and geo-graphic adjustments related to the poverty measure proposed to index poverty thresholds to the Con-sumer Price Index (CPI) and to set farm thresholds at 85 percent of nonfarm thresholds. The committee also agreed to compute additional poverty tabulations for 125 percent of the poverty level, slightly lower than Orshansky’s original 133 percent of poverty thresholds for the near poor (Fisher, 1992). Later that year, the Bureau of the Budget issued a memorandum directing all Federal Executive Branch agencies to use thresholds with the CPI and farm adjustments (Fisher, 1992). This memorandum established Orshansky’s thresholds with these adjustments as the federal govern-ment’s official poverty thresholds.
The memorandum did not include Orshanky’s “low-income” level definition of the near poor. Instead, there was a provision to publish statistics on the population below 125 percent of the poverty thresh-old, recognizing that this level was essentially the same as Orshansky’s “low-income” level (Fisher 1992).
By 1971, the Census Bureau’s Current Population Reports included tables about persons below the “near-poverty” level using this 125 percent of poverty threshold definition (Table 9, U.S. Census Bureau, 1971). Tables reporting the number and propor-tion of the population in near pov-erty are regularly published on the Census Bureau Web site with the release of the annual poverty esti-mates.4 To be consistent with this reporting of those in near poverty, this report defines the near poor using the 125 percent definition.5
DEFINING NEAR POVERTY
The same family income used to determine who is in poverty is also used to determine who is in near poverty.6 For information about how the Census Bureau determines who is in poverty each year, see the “Definition of Official Poverty” box on this page. Family income is compared to a near-poverty threshold range. If family income falls in the near-poverty threshold range, the family and every individual in it are con-sidered in near poverty. The lower
4 The most recent table can be found in Table 6, “Historical Poverty Tables—People,” at <www.census.gov/hhes/www/poverty /data/historical/hstpov6.xls>.
5 For an analysis using alternative near-poor definitions, see Heggeness and Hokayem (2013).
6 Family income refers to the income of members in a family where a family is defined as a group of two people or more (one of whom is the householder) related by birth, marriage, or adoption and residing together. Household income refers to income of members in a household where a household consists of all occupiers of a housing unit.
DEFINITION OF OFFICIAL POVERTY
Following the Office of Man-agement and Budget’s Sta-tistical Policy Directive 14, the U.S. Census Bureau uses a set of dollar value thresh-olds that vary by family size and composition to deter-mine who is in poverty. If a family’s total money income is less than the applicable threshold, then that family and every individual in it are considered in poverty. The official poverty thresholds are updated annually for inflation using the Consumer Price Index (CPI-U). The official poverty definition uses money income before taxes and tax credits and excludes capital gains and noncash benefits (such as SNAP benefits and housing assistance). The thresholds do not vary geographically.
bound of this range is the poverty threshold, while the upper bound for this range is 125 percent of the poverty threshold. Table A-1 gives the near-poverty threshold range for 2012. Like poverty thresholds, these ranges vary by family size and composition.
As an example, consider a family of four including two adults and two children. For this family the poverty threshold is $23,283. Individuals in a two adult, two child family below $23,283 in 2012 live in official poverty. Therefore, the lower bound of the near-poverty threshold range is $23,283. Multiplying $23,283 by 1.25 gives the upper bound for

4 U.S. Census Bureau
the near-poverty threshold range, or $29,104. Therefore, the near-poverty threshold range for a fam-ily of four with two adults and two children is $23,283–$29,104.
RESULTS
NEAR-POVERTY RATES BY SELECTED CHARACTERISTICS: 1966 AND 2012
Figure 1 shows the rates of individ-uals in poverty and in near poverty from 1966 to 2012.7 While the pov-erty rate has fluctuated between 11 percent and 15 percent over this
7 Heggeness and Hokayem (2013) show the near-poverty rate for alternative defini-tions (133 percent, 150 percent, and 200 percent).
time period, the near-poverty rate has been less variable. The near-poverty rate decreased from 6.3 percent in 1966 to 4.7 percent in 2012 (Table A-2). Notably, while the poverty rate appears to move with the business cycle, the near-poverty rate does not.
Figure 2 shows the near-poverty rate for individuals by selected characteristics for 1966 (blue square) and 2012 (pink square). Arrows connect the squares to indicate the size and direction of the change. Black arrows represent a percentage point decrease from 1966 to 2012, while green arrows
represent a percentage point increase from 1966 to 2012.
Age, Sex, Race, and Marital Status
In 2012, individuals aged 65 years and older had near-poverty rates not statistically different from those of children under 18 years old (5.5 percent and 5.7 percent, respec-tively). While adults aged 18 to 64 had lower near-poverty rates (4.2 percent) than children (5.7 percent) and those aged 65 and older (5.5 percent) in 2012, all age groups experienced a decline in near-poverty rates between 1966 and 2012. Those aged 65 years and older experienced the largest
Figure 1.Near-Poverty and Poverty Rate: 1966–2011
Note: For more information on sampling and nonsampling error, see <www.census.gov/apsd/techdoc/cps/cpsmar13.pdf>. Shaded areas indicate recessions.Source: Author’s calculations. U.S. Census Bureau, Current Population Survey, 1967–2013 Annual Social and Economic Supplements.
Poverty(<100%)
Year
Near Poverty(100–<125%)
Percent
0
2
4
6
8
10
12
14
16
18
20
2011200620011996199119861981197619711966

U.S. Census Bureau 5
decrease in near-poverty status, from 10.8 percent in 1966 down to 5.5 percent in 2012 (Figure 2 and Table A-2). For children, the near-poverty rate decreased from 7.4 percent to 5.7 percent. While adults aged 18 to 64 had the lowest rates
in both years, they also experi-enced the smallest decrease in near-poverty status, about 0.6 percentage points.
Women had higher rates of near poverty than men in 2012, 5.1
percent and 4.4 percent, respec-tively. The near-poverty rate for women in 1966 (6.4 percent) was not statistically different from the near-poverty rate for men (6.1 percent). The near-poverty rate fell for both men and women (1.7
Figure 2.Individuals in Near Poverty by Selected Characteristics: 1966 and 2012
Note: For information on sampling and nonsampling error, see <www.census.gov/apsd/techdoc/cps/cpsmar13.pdf>.Source: Authors' calculations. U.S. Census Bureau, 1967 and 2013 Annual Social and Economic Supplements.
1966
2012
All individuals
Under 18 years
18 to 64 years
65 years and older
Men
Women
White
Black
Other race
Married
Separated/divorced
Widowed
Single, never married
Less than high school
High school
Some college/associate’s
College or more
In labor force
Not in labor force
Northeast
West
Midwest
South
0 2 4 6 8 10 12
Percent

6 U.S. Census Bureau
percentage points for men and 1.4 percentage points for women).
The near-poverty rate for Blacks was 6.3 percent in 2012, higher than near-poverty rates for Whites and individuals from other races.8 Blacks and individuals from other races experienced larger declines in near poverty than Whites. In 1966, 11.1 percent of Black individuals were in near poverty, compared with 6.3 percent in 2012, and 9.1 percent of individuals from other races were in near poverty, com-pared with 3.9 percent in 2012.
Near-poverty rates were high-est among widowed in 2012 (8.7 percent) and lowest among married individuals (3.0 percent). Married persons experienced the largest decrease in near poverty, a fall of about 2.3 percentage points from 1966 to 2012. The changes in the near-poverty rates for other marital groups were not statistically significant.
8 Though categorical definitions of race and ethnicity have changed over time in nationally representative household survey data, this report categorizes individuals based on the more basic coding scheme to be compatible with CPS ASEC data covering 1966. Individuals are grouped into the follow-ing categories for the purposes of this report: White, Black, and Other race. In 2012, we group White only into White, Black only into Black, and all other racial categories (includ-ing multiple categories) into Other race. Data on Hispanic individuals that use the current 2012 definition of Hispanic ethnicity are not available in the 1966 data.
Educational Attainment, Labor Force Participation, and Regional Differences
In 2012, individuals with the most educational attainment were the least vulnerable to being in near poverty, while individuals with the least educational attainment were the most vulnerable. Those with less than a high school degree faced a near-poverty rate of 10.0 percent, and those with a college degree or more faced a near- poverty rate of 1.6 percent. While more education reduces the likeli-hood of near poverty, near-poverty rates increased for those with less than a high school degree (1.8 percentage points), those with a high school degree (1.2 percentage points), and those with some col-lege or associate’s degree (0.9 per-centage points) from 1966 to 2012. The change in the near-poverty rate of individuals who completed college or higher education from 1966 to 2012 was not statistically significant.
In 2012, adults in the labor force had a lower near-poverty rate than adults not in the labor force. While the rate of near poverty decreased slightly for adults in the labor force from 1966 to 2012 (4.2 percent in 1966 compared with 3.3 percent in 2012), there was no significant change in the rate of near poverty for adults not in the labor force (6.5 percent compared to 6.7 percent, respectively).
The South and West experienced higher near poverty than the Northeast and Midwest in 2012. The Northeast had the lowest near-poverty rate in 1966 (5.1 percent).9 All regions experienced declines in near poverty from 1966 to 2012. The South, with the highest near- poverty rate in 1966, experienced the largest decline in near poverty, down to 5.1 percent in 2012 from 8.0 percent in 1966.
Family Type
Figure 3 displays the near-poverty rate of families in 1966 and 2012 by family type and the change in the near-poverty rate over this time. In 2012, the near-poverty rate for all families was 3.9 per-cent (Table A-3). That year, 7.3 percent of families with a female householder, no husband present; 5.8 percent of families with a male householder, no wife present; and 2.8 percent of married-couple families lived in near poverty. Married-couple families had the largest decline in near poverty, down 2.5 percentage points from 1966 to 2012. The changes in near- poverty rates for other family types were not statistically significant.
NEAR-POVERTY AND POVERTY RATES BY SELECTED CHARACTERISTICS: 2012
Those in poverty and near pov-erty are often intertwined with each other, so this section pro-vides a comparison of these two
9 The West and Midwest were not statisti-cally different from each other in 1966.

U.S. Census Bureau 7
low-income groups. Figures 4 and 5 along with Tables A-4 and A-5 com-pare these groups along several characteristics and family types. In Figures 4 and 5, red squares indicate the poverty rate and green squares indicate the near-poverty rate. In 2012, the official poverty rate was 15.0 percent, and 46.5 million people lived in poverty. At the same time, the near-poverty rate was 4.7 percent, and 14.7 mil-lion people lived in near poverty.
Age, Sex, Race, and Marital Status
All age groups were more likely to be in poverty than in near poverty. Compared with other age groups, children had the highest poverty rate; however, they did not have the highest near-poverty rate. The near-poverty rate for children is not statistically different from
the near-poverty rate for those aged 65 and older.
Both women and men were more than three times as likely to live in poverty than in near poverty. Just as women had higher rates of living near poverty compared with men (5.1 percent compared with 4.4 percent), they also had higher rates of living in poverty (16.3 percent compared to 13.6 percent).
Black individuals were over twice as likely to live in poverty in 2012 as White individuals (27.0 percent compared to 13.0 percent). How-ever, this is not true for individuals living near poverty. Blacks were 1.4 times more likely to live in near poverty than their White counterparts.
In 2012, rates of near poverty were highest among widowed (8.7
percent) and lowest among married individuals (3.0 percent). This com-pares with living in poverty, where the highest rates were for those individuals who are single, never-married (20.6 percent) and sepa-rated or divorced (19.5 percent). Furthermore, individuals who are married are the least likely to be in poverty (6.9 percent).
Educational Attainment, Labor Force Participation, and Health Insurance Coverage
For both those living in and near poverty, educational attainment matters. Individuals with less than a high school degree or a high school degree had higher rates of living in near poverty and poverty than their counterparts with some college/associates degree or col-lege completed. Approximately 29.7 percent of individuals with
Figure 3.Family Near-Poverty Rates by Family Type: 1966 and 2012
Note: For information on sampling and nonsampling error, see <www.census.gov/apsd/techdoc/cps/cpsmar13.pdf>.Source: Authors' calculations. U.S. Census Bureau, 1967 and 2013 Annual Social and Economic Supplements.
1966
2012
All individuals
Married couple
Female housholder, no husband present
Male householder, no wife present
Percent0 2 4 6 8 10

8 U.S. Census Bureau
Figure 4.Near-Poverty and Poverty Rates by Selected Characteristics: 2012
Note: For information on sampling and nonsampling error, see <www.census.gov/apsd/techdoc/cps/cpsmar13.pdf>.Source: Authors' calculations. U.S. Census Bureau, 2013 Annual Social and Economic Supplement.
Near poverty
PovertyAll individuals
Under 18 years
18 to 64 years
65 years and older
Men
Women
White
Black
Other race
Married
Separated/divorced
Widowed
Single, never married
Less than high school
High school
Some college/associate’s degree
College or more
In labor force
Not in labor force
With private health insurance
With public health insurance
Not insured
North
West
Midwest
South
0 5
10
1510 20 25 30 35 40
Percent

U.S. Census Bureau 9
less than a high school degree lived in poverty and 10.0 percent lived in near poverty. This compares with approximately 4.5 percent of indi-viduals with college degrees living in poverty and 1.6 percent living near poverty.
Not being in the labor force is associated with being over three times more likely to live in poverty than being in the labor force (28.4 percent compared to 8.7 percent). Not being in the labor force is associated with being two times more likely to live in near poverty than being in the labor force (6.7 percent compared to 3.3 percent).
Poverty and near-poverty rates vary by type of health insurance coverage. In 2012, 36.4 percent of individuals with public (no private) health insurance coverage lived in poverty, 28.5 percent of individuals with no health insurance coverage lived in poverty, and 4.8 percent of individuals with private coverage
lived in poverty. During this time, 10.0 percent of individuals with public (no private) coverage lived in near poverty, 8.0 percent of indi-viduals with no health insurance coverage lived in near poverty, and 2.3 percent of individuals with private coverage lived in poverty.
Family Type
Approximately four times as many families lived in poverty than in near poverty in 2012 (11.8 percent and 3.9 percent, respectively). Just as families composed of a female householder, no husband pres-ent had the highest rate of living near poverty by family type (7.3 percent), they also had the high-est rate of living in poverty (30.9 percent). The near-poverty and poverty rates for families with a male householder, no wife present were 5.8 percent and 16.4 percent, respectively.
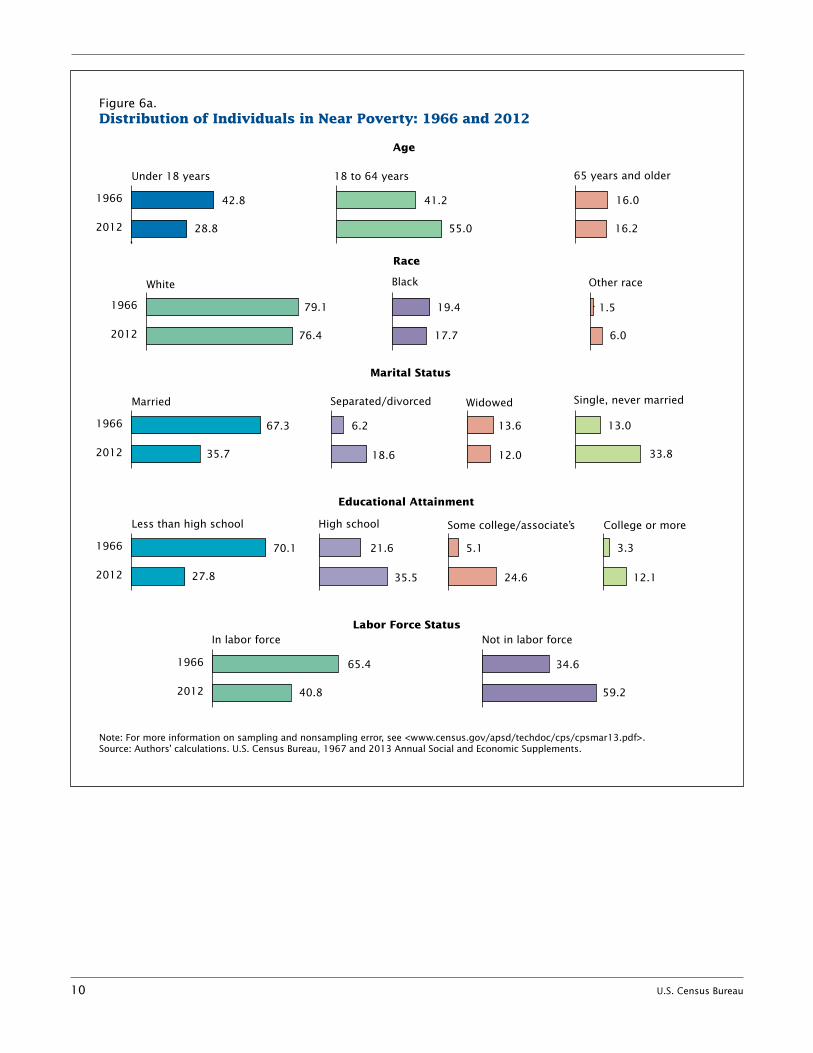
DISTRIBUTION OF NEAR POVERTY BY SELECTED CHARACTERISTICS: 1966 AND 2012
Another way to describe the near-poverty population is to examine the distribution of people in near poverty by selected characteris-tics. Figures 6a and 6b show how the distribution of people in near poverty and the total population has changed from 1966 to 2012. These estimates are also in Table A-6. Each bar in the figure shows the representation of each group within the near-poverty popula-tion, or the proportion of the near poor having that characteristic. For example, the first panel shows the distribution by age category. In 1966, children under 18 years old composed 42.8 percent of the near-poverty population, adults aged 18 to 64 composed 41.2 percent of the near-poverty popula-tion, and those aged 65 and older composed 16.0 percent of that
Figure 5.Family Near-Poverty and Poverty Rates by Family Type: 2012
Note: For information on sampling and nonsampling error, see <www.census.gov/apsd/techdoc/cps/cpsmar13.pdf>.Source: Authors' calculations, U.S. Census Bureau, 2013 Annual Social and Economic Supplement.
Near poverty
Poverty
All individuals
Married-couple
Female housholder, no husband present
Male householder, no wife present
Percent0 5 10
10
15 20 25 30 35
10 U.S. Census Bureau
Figure 6a.Distribution of Individuals in Near Poverty: 1966 and 2012
Note: For more information on sampling and nonsampling error, see <www.census.gov/apsd/techdoc/cps/cpsmar13.pdf>.Source: Authors’ calculations. U.S. Census Bureau, 1967 and 2013 Annual Social and Economic Supplements.
Age
42.8
28.8
18 to 64 yearsUnder 18 years 65 years and older
2012
1966 41.2
55.0
16.0
16.2
Marital Status
42.8
35.7
67.3
WidowedMarried Separated/divorced Single, never married
2012
1966 6.2
18.6
13.6
12.0
13.0
33.8
Educational Attainment
42.8
27.8
70.1
Some college/associate’sLess than high school High school College or more
2012
1966 21.6
35.5
5.1
24.6
59.2
3.3
12.1
Labor Force Status
65.4
40.8
Not in labor forceIn labor force
2012
1966 34.6
Race
79.1
76.4
BlackWhite Other race
2012
1966 19.4
17.7
1.5
6.0
U.S. Census Bureau 11
Figure 6b.Distribution of Total Population: 1966 and 2012
Note: For more information on sampling and nonsampling error, see <www.census.gov/apsd/techdoc/cps/cpsmar13.pdf>.Source: Authors’ calculations. U.S. Census Bureau, 1967 and 2013 Annual Social and Economic Supplements.
Age
36.4
23.9
18 to 64 yearsUnder 18 years 65 years and older
2012
1966 54.4
62.2
9.3
13.9
Marital Status
42.8
35.7
71.2
53.2
WidowedMarried Separated/divorced Single, never married
2012
1966 4.9
13.0
8.9
6.1
15.0
27.7
Educational Attainment
11.9
48.5
Some college/associate’sLess than high school High school College or more
2012
1966 31.8
29.8
9.6
26.7
25.3
10.2
31.712.1
Labor Force Status
74.8
74.740.8
Not in labor forceIn labor force
2012
1966 25.3
Race
88.0
79.5
BlackWhite Other race
2012
1966 11.0
13.2
1.0
7.3

12 U.S. Census Bureau
population.10 The bars representing these shares sum to 100 percent. A comparison to the shares in 2012 shows children composed a smaller share of the near-poverty popula-tion (28.8 percent), and nonelderly adults composed a larger share of the near-poverty population (55.0 percent) in 2012 compared with 1966.
The distribution of the near-poverty population by marital status has changed from 1966 to 2012. Most notably, the proportion of the near poor that was married decreased from 67.3 percent in 1966 to 35.7 percent in 2012. The proportion that was separated or divorced tripled from 6.2 percent in 1966 to 18.6 percent in 2012. The propor-tion that was single, never married increased from 13.0 percent in 1966 to 33.8 percent in 2012.
The near-poverty population has seen dramatic shifts in shares by educational attainment. In 1966, the share of the near-poverty popu-lation that had less than a high school degree was 70.1 percent, a share that has fallen to 27.8 per-cent in 2012. All other educational attainment groups make up a larger share of the near-poverty popula-tion in 2012 than in 1966. The share for those with a high school diploma increased to 35.5 percent from 21.6 percent. The share for those with some college or an associate’s degree increased from 5.1 percent to 24.6 percent, while the share for those with college or
10 The difference between 42.8 percent of the near-poverty population as children and 41.2 percent of the near-poverty population as adults aged 18 to 64 is not statistically significant.
more increased from 3.3 percent to 12.1 percent.
A larger proportion of the near-poverty population is not in the labor force in 2012 (59.2 percent) compared with 1966 (34.6 per-cent), while the proportion of the near-poverty population in the labor force is smaller (40.8 percent in 2012 compared with 65.4 per-cent in 1966).
DISTRIBUTION OF INDIVIDUALS IN POVERTY AND NEAR POVERTY BY SELECTED CHARACTERISTICS: 2012
As previously mentioned, those in poverty and near poverty are often intertwined with each other. This section provides another com-parison of these two low-income groups by examining their distribu-tions by selected characteristics for 2012 in Figure 7 and Table A-7. Children and adults compose a smaller proportion of the near- poverty population than the poverty population, while those aged 65 and older compose a larger proportion of the near- poverty population.
White individuals represent a larger share of the near-poverty popula-tion than the poverty population (76.4 percent compared with 68.8 percent), while Black individuals represent a smaller share (17.7 per-cent compared with 23.8 percent).
Comparing the distribution by marital status shows married individuals make up a larger share of the near-poverty population (35.7 percent compared with 28.4 percent), and single, never married individuals make up a smaller share
of the near-poverty population (33.8 percent compared to 44.5 percent).
Interestingly, the difference in shares of each population by edu-cational attainment are either not statistically significant (high school degree and college or more) or dif-fer by a small magnitude (less than high school and some college/asso-ciate’s degree).
Differences in shares exist by type of health insurance. The share of the near-poverty population cov-ered by public (no private) health insurance (43.6 percent) is smaller than the share of the poverty population (50.2 percent) cov-ered by public (no private) health insurance. The opposite is true for private coverage, where the share of the near-poverty population with private coverage (30.4 percent) exceeds the share of the poverty population with private coverage (20.4 percent). The difference in shares for those without health insurance is 3.4 percentage points.
PROGRAM PARTICIPATION
Though individuals in near poverty do not have incomes below poverty thresholds, they still participate in a multitude of needs-based federal and local assistance programs. The eligibility for most of these programs typically include income above poverty thresholds. Figure 8 shows trends in program par-ticipation of those in near poverty covering 1981–2012.11 Table A-8 gives the estimates for 1981 and 2012. The near-poverty measure
11 The CPS ASEC began collecting program participation data in the early 1980’s.

U.S. Census Bureau 13
Figure 7.Distribution of Individuals in Near Poverty, Poverty, and Total Population: 2012
Note: For more information on sampling and nonsampling error, see <www.census.gov/apsd/techdoc/cps/cpsmar13.pdf>.Source: Authors’ calculations. U.S. Census Bureau, 2013 Annual Social and Economic Supplement.
Age
23.9
28.8
34.6
18 to 64 yearsUnder 18 years 65 years and older
Poverty
Near poverty
Population 62.2
57.0
55.0
13.9
16.2
8.4
Marital Status
53.2
35.7
28.4
WidowedMarried Separated/divorced Single, never married
Poverty
Near poverty
Population 13.0
18.6
19.9
6.1
12.0
7.2
27.7
33.8
44.5
Educational Attainment
11.9
27.8
29.9
Some college/associate’sLess than high school High school College or more
Poverty
Near poverty
Population 29.8
35.5
35.2
26.7
24.6
22.7
59.2
52.7
3.3
12.1
12.1
Labor Force Satus
74.7
40.8
47.4
Not in labor forceIn labor force
Poverty
Near poverty
Population 25.3
Race
79.1
68.8
76.4
BlackWhite Other race
Poverty
Near poverty
Population 13.2
23.8
17.7
7.3
6.0
7.4
Health Insurance Coverage
15.4
20.4
30.4
Public health insurancePrivate health insurance Not insured
Poverty
Near poverty
Population 63.9
43.6
50.2
20.7
26.0
29.4

14 U.S. Census Bureau
in this report does not account for income from all assistance programs. The Research Supple-mental Poverty Measure, published for 2009–2012, does account for benefits from assistance programs. Heggeness and Hokayem (2013) show the near-poverty rate using this measure.
For over 3 decades covering 1981–2012, the most popular assistance program among the near poor is the National School Lunch Program. In 2012, 84.6 percent of individuals in near poverty lived with a fam-ily member who received free or reduced lunch in school. This is not surprising since the National School Lunch Program covers children living with families whose income
is below 185 percent of the pov-erty guidelines. Another popular program in 2012 among those in near poverty was the SNAP. Nearly one-third of those in near poverty, 32.5 percent, lived in a household receiving SNAP benefits in 2012, compared with 22.6 percent in 1981. About 1 in 5 qualified for the EITC in 2012, compared with less than 1 in 10 in 1981.
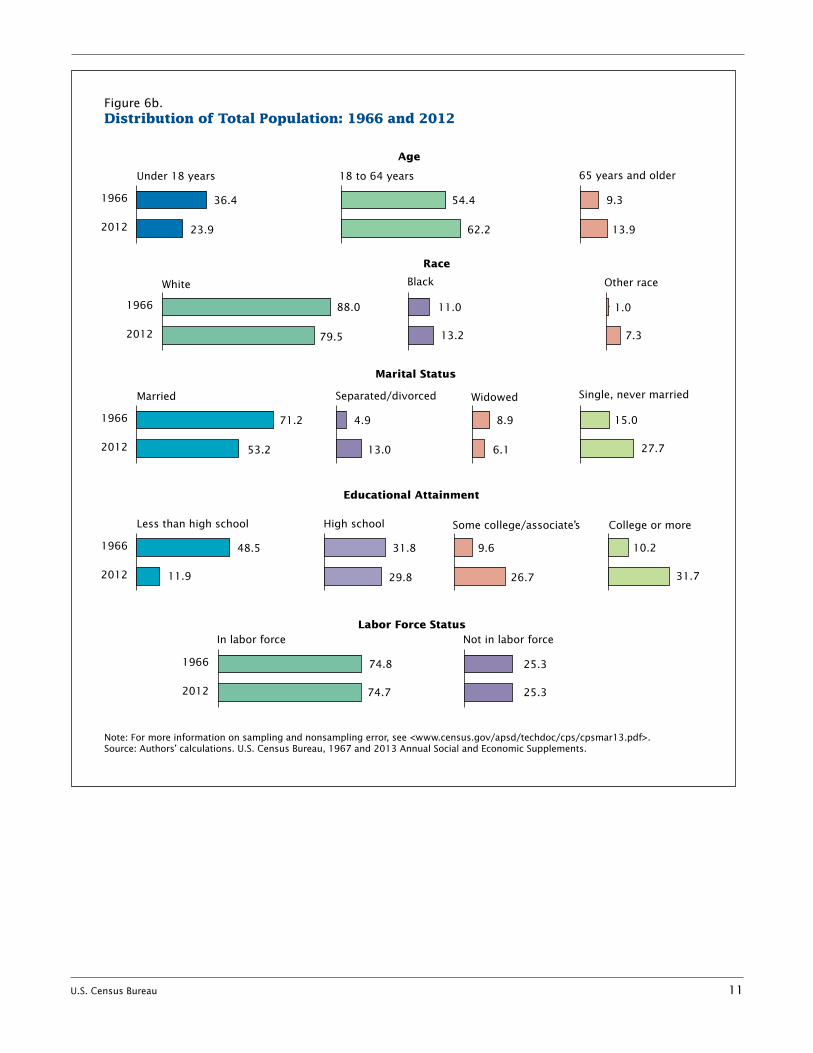
Figure 9 and Table A-9 compare the participation in assistance programs of individuals in near poverty and individuals in poverty for 2012. Individuals in poverty tend to participate in these pro-grams more than individuals in near poverty; however, a higher percentage of individuals in near
poverty qualified for the EITC. In 2012, the SNAP participation rate for individuals in poverty was 50.6 percent, 18.2 percentage points higher than the SNAP participation rate for individuals in near pov-erty. During this year, 8.2 percent of individuals in poverty received public assistance (TANF), while 3.4 percent of individuals in near pov-erty received public assistance.
TRANSITIONS INTO AND OUT OF NEAR POVERTY
Earlier in this report, Figure 1 showed trends in the near-poverty rate and the poverty rate over 4 decades. Interestingly, the near-poverty rate remains more stable over this time period than the poverty rate, even across business
Figure 8.Proportion of Individuals in Near Poverty Receiving Assistance: 1981–2011
Note: For more information on sampling and nonsampling error, see <www.census.gov/apsd/techdoc/cps/cpsmar13.pdf>. Shaded areas indicate recessions.Source: Author’s calculations. U.S. Census Bureau, Current Population Survey, 1982–2013 Annual Social and Economic Supplements.
School lunch
Year
Food stamps/SNAP
WIC
Energy assistanceHousing subsidy
Public assistance
EITC
Percent
0
10
20
30
40
50
60
70
80
90
100
2011200620011996199119861981
U.S. Census Bureau 15
cycles. One might ask why the rate of individuals living near poverty is relatively flat. Figure 10 depicts transitions into and out of near poverty from 2011 to 2012. This figure takes advantage of the interview structure of the CPS that allows linking an individual across 2 consecutive years.12 The figure
12 The Current Population Survey uses a rotating sample design where a household address is in the sample for 4 months, out for 8 months, and back in for 4 months. This sample design allows the linking of house-holds and individuals from one ASEC inter-view to the next. More details about linking CPS data files can be found here: <www.census.gov/cps/files/How%20 To%20Link%20CPS%20Public%20Use%20Files .pdf>. The CPS does not follow individu-als who move which may influence rates of entering and exiting near poverty. The Survey of Income and Program Participation does follow individuals who move and can also be used to study transitions into and out of near poverty over a longer period of time.
is based on the group of individu-als in both 2011 and 2012, not the entire sample each year. The horizontal line in the figure divides the population into three groups (poverty, near poverty, and above near poverty), and the arrows indicate the number of individuals who enter near poverty (green), exit near poverty (red), and stay in near poverty (blue).13 In 2011, 3.9 million individuals were in near poverty, and 4.1 million individuals were in near poverty in 2012. From 2011 to 2012, 3.3 million individu-als entered near poverty, which is not statistically different from the 3.1 million individuals who exited
13 Table A-10 shows the entrances and exits by poverty and near-poverty status for 2011 to 2012.
near poverty. During this time period, 783,000 individuals stayed in near poverty.
Figure 10 provides some evidence showing that the near-poverty rate remains stable over time because the flow of individuals exiting near poverty is statistically unchanged from the flow of individuals enter-ing near poverty. Hokayem and Heggeness (2014) provide a more detailed analysis of transitions into and out of near poverty for the period 2004 to 2012.
NEAR-POVERTY RATES BY STATE, 3-YEAR AVERAGE, 2010–2012
For state-level poverty and near-poverty rates calculated from
Figure 9.Proportion of Individuals in Near Poverty and Poverty Receiving Assistance: 2012
Note: For more information on sampling and nonsampling error, see <www.census.gov/apsd/techdoc/cps/cpsmar13.pdf>.Source: Author’s calculations. U.S. Census Bureau, Current Population Survey, 2013 Annual Social and Economic Supplement.
Percent
8.2
Near povertyPoverty
3.4
8.3
7.1
11.9
9.9
26.2
19.8
16.7
20.7
50.6
32.5
84.6
88.5
0 20 40 60 80 100
School lunch program
Food stamps/SNAP
Earned Income Tax Credit
WIC
Energy assistance
Housing subsidies
Public assistance

16 U.S. Census Bureau
the CPS ASEC, the Census Bureau recommends using a 3-year aver-age.14 Figure 11 shows a map of state near-poverty rates compared with the national 3-year aver-age using data referring to 2010, 2011, and 2012. Table A-11 also presents the number of individu-als in near poverty by state. The 3-year average near-poverty rate for the United States was 4.7 percent. Figure 11 classifies each state into one of three categories: higher than the national 3-year average (blue shade), lower than the national 3-year average (yellow
14 See Current Population Survey, 2013 Annual Social and Economic Supplement Technical Documentation at <www.census .gov/prod/techdoc/cps/cpsmar13.pdf> for a discussion on calculating state estimates.
shade), or not statistically different from the national 3-year average (green shade). Eighteen states had a 3-year average near-poverty rate lower than the national average, including Alaska (3.5 percent), Maryland (2.9 percent), and Vir-ginia (3.7 percent). Twelve states had a 3-year average rate that is higher than the 3-year average national rate, including California (5.3 percent), Florida (5.1 percent), and Kentucky (6.3 percent). Twenty states and the District of Columbia had a 3-year average near-poverty rate that is not statistically differ-ent, including Alabama (4.7 per-cent), Georgia (4.9 percent), and New York (5.0 percent).
CONCLUSION
When considering individuals living in the low-income population, it is relevant to understand the group living in poverty as well as the group living just above poverty thresholds. This report provides timely and relevant descriptive information on individuals living just above poverty thresholds, the near poor. While there is no legisla-tive mandate or official definition of near poverty, this report defines near poverty as individuals with family income between 100 and 125 of percent of official poverty thresholds. It reports on individuals in near poverty using data from the CPS ASEC covering over 45 years, 1966–2012.
The rate of individuals in near poverty has remained more stable than the rate of individuals in poverty over the past 4 decades. Approximately 1 in 20 individuals, 4.7 percent, lived in near poverty in the United States in 2012. Children, adults aged 18 to 64, and those aged 65 and older were less likely to be in near poverty in 2012 than in 1966; married-couple families were also less likely to be living near poverty. Individuals with higher educational attainment had lower near-poverty rates. The near-poverty population participated in federal and state assistance pro-grams with participation highest in the National School Lunch Program and the SNAP in 2012. A higher percentage of the near-poverty population than the poverty population qualified for the EITC.
Source: Authors' calculations. U.S. Census Bureau, 1967 and 2013 Annual Social and Economic Supplements. For information on sampling and nonsampling error, see <www.census.gov/apsd/techdoc/cps/cpsmar13.pdf>.
Figure 10.Moving Into and Out of Near Poverty: Evidence From 2011 and 2012 Exit near poverty
Enter near povertyStay near poverty
Poverty
Near poverty in 2011 Enter near poverty Exit near poverty Near poverty in 2012
Near poverty
1,146 2,150
1,045
783
2,095Above near poverty
3,923 + 3,296 – 3,140 = 4,079
(In thousands)
Note: For more information on sampling and nonsampling error, see <www.census.gov/apsd/techdoc/cps/cpsmar13.pdf>.Source: Author’s calculations. U.S. Census Bureau, Current Population Survey, 2012 and 2013 Annual Social and Economic Supplements.

U.S. Census Bureau 17
REFERENCES
DeNavas-Walt, Carmen, Bernadette D. Proctor, and Jessica C. Smith, “Income, Poverty, and Health Insur-ance Coverage in the United States: 2012,” U.S. Census Bureau, Current Population Reports, P60-245, U.S. Government Printing Office, Washington, DC, 2013.
Fisher, Gordon, “The Develop-ment and History of the Poverty
Thresholds,” Social Security Bulletin 55(4) (1992): 3–14.
Heggeness, Misty L. and Charles Hokayem, “Life on the Edge: Living Near Poverty in the United States, 1966–2011,” U.S. Census Bureau SEHSD Working Paper 2013-02, Washington, DC, 2013.
Hokayem, Charles and Misty L. Heggeness, “Factors Influencing Transitions Into and Out of Near
Poverty: 2004–2012,” U.S. Census Bureau SEHSD Working Paper 2014-05, Washington, DC, 2014.
Orshansky, Mollie, “Recounting the Poor—A Five-Year Review,” Social Security Bulletin 20 (1966): 20–37.
U.S. Bureau of the Census, Pov-erty Increases by 1.2 Million in 1970, Current Population Reports, P60-77, U.S. Government Printing Office, Washington, DC, 1971.
MT
AK
NM
OR MN
KS
SD
ND
MO
WA
FL
IL IN
WI NY
PA
MI
OHIA
ME
MA
CT
AZ
HI
NV
TX
COCA
WY
UT
ID
NE
OK
GA
AR
AL
NC
MS
LA
TN
KYVA
SC
WV
RI
DE MD DC
NJ
Figure 11.Comparison of State Near-Poverty Rate to National Poverty Rate,3-year Average: 2010–2012
VTNH
United States = 4.7 percent
State compared to national
Higher
Not statistically different
Lower
Source: U.S. Census Bureau, Current Population Survey, 2011–2013 Annual Social and Economic Supplements.

18 U.S. Census Bureau
Table
A-1
. N
ear-
Povert
y T
hre
sh
old
Ran
ge f
or
20
12
by S
ize o
f Fam
ily a
nd
Nu
mb
er
of
Rela
ted
Ch
ild
ren
Un
der
18
Years
(In d
olla
rs)
Siz
e of
fam
ily u
nit
Rel
ated
chi
ldre
n un
der
18 y
ears
Non
eO
neTw
oT
hree
Fou
rF
ive
Six
Sev
enE
ight
or
mor
e
On
e p
erso
n
(un
rela
ted
ind
ivid
ual
)
Und
er 6
5 ye
ars
. . .
. . . .
. . . .
. .11
,945
–14,
931
65
yea
rs a
nd o
ver
. . . .
. . . .
. . .
11,0
11–1
3,76
4
Two
peo
ple
H
ouse
hold
er u
nder
65
year
s . .
.15
,374
–19,
218
15,8
25–1
9,78
1
Hou
seho
lder
65
year
s an
d ov
er .
13,8
78–1
7,34
815
,765
–19,
706
Th
ree
peo
ple
. . .
. . . .
. . . .
. . . .
.17
,959
–22,
449
18,4
80–2
3,10
018
,498
–23,
123
Fo
ur
peo
ple
. . .
. . . .
. . . .
. . . .
. .23
,681
–29,
601
24,0
69–3
0,08
623
,283
–29,
104
23,3
64–2
9,20
5F
ive
peo
ple
. . .
. . . .
. . . .
. . . .
. . .
28,5
58–3
5,69
828
,974
–36,
218
28,0
87–3
5,10
927
,400
–34,
250
26,9
81–3
3,72
6S
ix p
eop
le . .
. . . .
. . . .
. . . .
. . . .
.32
,847
–41,
059
32,9
78–4
1,22
332
,298
–40,
373
31,6
47–3
9,55
930
,678
–38,
348
30,1
04–3
7,63
0S
even
peo
ple
. . .
. . . .
. . . .
. . . .
.37
,795
–47,
244
38,0
31–4
7,53
937
,217
–46,
521
36,6
51–4
5,81
435
,594
–44,
493
34,3
62–4
2,95
333
,009
–41,
261
Eig
ht
peo
ple
. . .
. . . .
. . . .
. . . .
. .42
,271
–52,
839
42,6
44–5
3,30
541
,876
–52,
345
41,2
04–5
1,50
540
,249
–50,
311
39,0
38–4
8,79
837
,777
–47,
221
37,4
57–4
6,82
1N
ine
peo
ple
or
mo
re .
. . . .
. . . .
.50
,849
–63,
561
51,0
95–6
3,86
950
,416
–63,
020
49,8
45–6
2,30
648
,908
–61,
135
47,6
20–5
9,52
546
,454
–58,
068
46,1
65–5
7,70
644
,387
–55,
484
Sou
rce:
Aut
hors
’ cal
cula
tions
.
U.S. Census Bureau 19
Table A-2.Individuals in Near Poverty by Selected Characteristics: 1966 and 2012(Numbers in thousands)
Characteristic
1966 2012 Change
Total Number SE1 Percent SE1 Total Number SE1 Percent SE1 Number
Percent-age
point
All people . . . . . . . . . . . . . . 193,428 12,125 306 6 .3 0 .2 310,648 14,706 320 4 .7 0 .1 *2,581 *–1 .5AgeUnder 18 years . . . . . . . . . . . . . . . 70,171 5,189 173 7 .4 0 .2 73,719 4,234 140 5 .7 0 .2 *–955 *–1 .718 to 64 years . . . . . . . . . . . . . . . . 105,310 4,998 120 4 .7 0 .1 193,642 8,091 192 4 .2 0 .1 *3,093 *–0 .665 years and older . . . . . . . . . . . . . 17,947 1,937 76 10 .8 0 .4 43,287 2,381 84 5 .5 0 .2 *443 *–5 .3
SexMale . . . . . . . . . . . . . . . . . . . . . . . . 93,772 5,698 210 6 .1 0 .2 152,058 6,675 159 4 .4 0 .1 *976 *–1 .7Female . . . . . . . . . . . . . . . . . . . . . . 99,657 6,426 223 6 .4 0 .2 158,590 8,031 190 5 .1 0 .1 *1,605 *–1 .4
RaceWhite . . . . . . . . . . . . . . . . . . . . . . . 170,211 9,590 273 5 .6 0 .2 246,935 11,228 260 4 .5 0 .1 *1,638 *–1 .1Black . . . . . . . . . . . . . . . . . . . . . . . 21,230 2,355 135 11 .1 0 .6 40,974 2,600 129 6 .3 0 .3 245 *–4 .7Other . . . . . . . . . . . . . . . . . . . . . . . 1,987 180 38 9 .1 1 .8 22,739 878 75 3 .9 0 .3 *698 *–5 .2
Marital Status (Aged 18 and older)Married . . . . . . . . . . . . . . . . . . . . . 87,807 4,667 192 5 .3 0 .2 126,043 3,739 129 3 .0 0 .1 *–928 *–2 .3Separated or divorced . . . . . . . . . . 6,062 428 59 7 .1 0 .9 30,900 1,944 74 6 .3 0 .2 *1,516 –0 .8Widowed . . . . . . . . . . . . . . . . . . . . 10,909 943 87 8 .6 0 .8 14,353 1,253 56 8 .7 0 .4 *311 0 .1Single, never married . . . . . . . . . . . 18,481 898 85 4 .9 0 .4 65,634 3,536 106 5 .4 0 .2 *2,637 0 .5
Educational Attainment (Aged 25 and older)Less than high school . . . . . . . . . . 50,020 4,115 181 8 .2 0 .3 24,517 2,456 98 10 .0 0 .4 *–1,660 *1 .8High school completed . . . . . . . . . 32,837 1,267 101 3 .9 0 .3 61,704 3,128 102 5 .1 0 .2 *1,861 *1 .2Some college/associate's degree . . . . . . . . . . . . . . . . . . . . . 9,896 297 49 3 .0 0 .5 55,173 2,171 73 3 .9 0 .1 *1,873 *0 .9College completed or more . . . . . . 10,473 194 39 1 .9 0 .4 65,506 1,065 63 1 .6 0 .1 *871 –0 .2
Labor Force (Aged 18–64)In labor force . . . . . . . . . . . . . . . . . 78,720 3,268 123 4 .2 0 .2 144,571 4,792 123 3 .3 0 .1 *1,524 *–0 .8Not in labor force . . . . . . . . . . . . . . 26,590 1,730 90 6 .5 0 .3 49,071 3,299 104 6 .7 0 .2 *1,568 0 .2
RegionNortheast . . . . . . . . . . . . . . . . . . . . 47,063 2,420 120 5 .1 0 .2 55,050 2,440 132 4 .4 0 .2 21 *–0 .7West . . . . . . . . . . . . . . . . . . . . . . . 33,291 1,966 109 5 .9 0 .3 73,303 3,631 155 5 .0 0 .2 *1,665 *–1 .0Midwest . . . . . . . . . . . . . . . . . . . . . 43,549 2,495 122 5 .7 0 .3 66,337 2,690 119 4 .1 0 .2 194 *–1 .7South . . . . . . . . . . . . . . . . . . . . . . . 59,092 4,723 167 8 .0 0 .2 115,957 5,945 198 5 .1 0 .2 *1,222 *–2 .9
* Statistically different from zero at the 90 percent confidence level .1 SE Standard error .
Note: Standard errors for 1966 estimated using generalized variance function parameters . Standard errors for 2012 are estimated using replicate weights (Fay’s Method) .
Source: Author’s calculations . U .S . Census Bureau, Current Population Survey, 1967 and 2013 Annual Social and Economic Supplements . For more information on sampling and nonsampling error, see <www .census .gov/apsd/techdoc/cps/cpsmar13 .pdf> .

20 U.S. Census Bureau
Table A-3.Families in Near Poverty by Family Type: 1966 and 2012(Numbers in thousands)
Characteristic
1966 2012 Change
Total Number SE1 Percent SE1 Total Number SE1 Percent SE1 Number
Per-centage
point
All families . . . . . . . . . . . . . . . 58,915 3,564 76 6 .0 0 .1 80,944 3,149 82 3 .9 0 .1 * –415 *–2 .2
Family TypeMarried-couple . . . . . . . . . . . . . . . . . . 42,697 2,264 62 5 .3 0 .1 59,224 1,656 59 2 .8 0 .1 *–608 *–2 .5Female householder, no husband present . . . . . . . . . . . . . . . . . . . . . . . 5,154 407 27 7 .9 0 .5 15,489 1,132 48 7 .3 0 .3 *725 –0 .6Male householder, no wife present . . 1,130 58 10 5 .1 0 .9 6,231 361 24 5 .8 0 .4 *303 0 .7
* Statistically different from zero at the 90 percent confidence level .1 SE Standard error .
Note: Standard errors for 1966 estimated using generalized variance function parameters . Standard errors for 2012 are estimated using replicate weights (Fay’s Method) .
Source: Author’s calculations . U .S . Census Bureau, Current Population Survey, 1967 and 2013 Annual Social and Economic Supplements . For more information on sampling and nonsampling error, see <www .census .gov/apsd/techdoc/cps/cpsmar13 .pdf> .

U.S. Census Bureau 21
Table A-4.Individuals in Near Poverty and Poverty by Selected Characteristics: 2012(Numbers in thousands)
Characteristic
Near poverty Poverty Difference
Total Number SE1 Percent SE1 Total Number SE1 Percent SE1 Number
Percent-age
point
All people . . . . . . . . . . . . . . 310,648 14,706 320 4 .7 0 .1 310,648 46,496 546 15 .0 0 .2 *31,790 *10 .2AgeUnder 18 years . . . . . . . . . . . . . . . 73,719 4,234 140 5 .7 0 .2 73,719 16,073 272 21 .8 0 .4 *11,840 *16 .118 to 64 years . . . . . . . . . . . . . . . . 193,642 8,091 192 4 .2 0 .1 193,642 26,497 317 13 .7 0 .2 *18,406 *9 .565 years and older . . . . . . . . . . . . . 43,287 2,381 84 5 .5 0 .2 43,287 3,926 106 9 .1 0 .2 *1,545 *3 .6
GenderMen . . . . . . . . . . . . . . . . . . . . . . . . 152,058 6,675 159 4 .4 0 .1 152,058 20,656 282 13 .6 0 .2 *13,982 *9 .2Women . . . . . . . . . . . . . . . . . . . . . 158,590 8,031 190 5 .1 0 .1 158,590 25,840 321 16 .3 0 .2 *17,809 *11 .2
RaceWhite . . . . . . . . . . . . . . . . . . . . . . . 246,935 11,228 260 4 .5 0 .1 246,935 31,982 449 13 .0 0 .2 *20,754 *8 .4Black . . . . . . . . . . . . . . . . . . . . . . . 40,974 2,600 129 6 .3 0 .3 40,974 11,079 256 27 .0 0 .6 *8,480 *20 .7Other . . . . . . . . . . . . . . . . . . . . . . . 22,739 878 75 3 .9 0 .3 22,739 3,435 156 15 .1 0 .6 *2,556 *11 .2
Marital Status (Aged 18 and older)Married . . . . . . . . . . . . . . . . . . . . . 126,043 3,739 129 3 .0 0 .1 126,043 8,636 198 6 .9 0 .2 *4,898 *3 .9Separated or divorced . . . . . . . . . . 30,900 1,944 74 6 .3 0 .2 30,900 6,040 124 19 .5 0 .3 *4,096 *13 .3Widowed . . . . . . . . . . . . . . . . . . . . 14,353 1,253 56 8 .7 0 .4 14,353 2,198 72 15 .3 0 .5 *945 *6 .6Single, never married . . . . . . . . . . . 65,634 3,536 106 5 .4 0 .2 65,634 13,548 219 20 .6 0 .3 *10,012 *15 .3
Educational Attainment (Aged 25 and older)Less than high school . . . . . . . . . . 24,517 2,456 98 10 .0 0 .4 24,517 7,275 151 29 .7 0 .5 *4,819 *19 .7High school completed . . . . . . . . . 61,704 3,128 102 5 .1 0 .2 61,704 8,562 169 13 .9 0 .3 *5,434 *8 .8Some college/associate's degree . . . . . . . . . . . . . . . . . . . . . 55,173 2,171 73 3 .9 0 .1 55,173 5,520 115 10 .0 0 .2 *3,350 *6 .1College completed or more . . . . . . 65,506 1,065 63 1 .6 0 .1 65,506 2,949 87 4 .5 0 .1 *1,884 *2 .9
Labor Force (Aged 18–64)In labor force . . . . . . . . . . . . . . . . . 144,571 4,792 123 3 .3 0 .1 144,571 12,546 202 8 .7 0 .1 *7,754 *5 .4Not in labor force . . . . . . . . . . . . . . 49,071 3,299 104 6 .7 0 .2 49,071 13,951 208 28 .4 0 .3 *10,652 *21 .7
Health Insurance CoverageWith private coverage . . . . . . . . . . . 198,678 4,476 146 2 .3 0 .1 198,678 9,481 232 4 .8 0 .1 *5,005 *2 .5With public, no private coverage . . 64,095 6,413 186 10 .0 0 .3 64,095 23,355 374 36 .4 0 .4 *16,942 *26 .4Not insured . . . . . . . . . . . . . . . . . . 47,876 3,816 147 8 .0 0 .3 47,876 13,660 246 28 .5 0 .4 *9,844 *20 .6
RegionNortheast . . . . . . . . . . . . . . . . . . . . 55,050 2,440 132 4 .4 0 .2 55,050 7,490 183 13 .6 0 .3 *5,050 *9 .2West . . . . . . . . . . . . . . . . . . . . . . . 73,303 3,631 155 5 .0 0 .2 73,303 11,049 249 15 .1 0 .3 *7,418 *10 .1Midwest . . . . . . . . . . . . . . . . . . . . . 66,337 2,690 119 4 .1 0 .2 66,337 8,851 236 13 .3 0 .4 *6,161 *9 .3South . . . . . . . . . . . . . . . . . . . . . . . 115,957 5,945 198 5 .1 0 .2 115,957 19,106 417 16 .5 0 .4 *13,161 *11 .3
* Statistically different from zero at the 90 percent confidence level .1 SE Standard error .
Note: Standard errors for 2012 are estimated using replicate weights (Fay’s Method) .
Source: Author’s calculations . U .S . Census Bureau, Current Population Survey, 2013 Annual Social and Economic Supplement . For more information on sampling and nonsampling error, see <www .census .gov/apsd/techdoc/cps/cpsmar13 .pdf> .

22 U.S. Census Bureau
Table A-5.Families in Near Poverty and Poverty by Family Type: 2012(Numbers in thousands)
Characteristic
Near poverty Poverty Difference
Total Number SE1 Percent SE1 Total Number SE1 Percent SE1 Number
Percent-age
point
All families . . . . . . . . . . . . . . . 80,944 3,149 82 3 .9 0 .1 80,944 9,520 140 11 .8 0 .2 * 6,371 * 7 .9
Family TypeMarried-couple . . . . . . . . . . . . . . . . . . 59,224 1,656 59 2 .8 0 .1 59,224 3,705 88 6 .3 0 .1 *2,049 *3 .5Female householder, no husband present . . . . . . . . . . . . . . . . . . . . . . . 15,489 1,132 48 7 .3 0 .3 15,489 4,793 119 30 .9 0 .6 *3,661 *23 .6Male householder, no wife present . . 6,231 361 24 5 .8 0 .4 6,231 1,023 49 16 .4 0 .7 *662 *10 .6
* Statistically different from zero at the 90 percent confidence level .1 SE Standard error .
Note: Standard errors for 2012 are estimated using replicate weights (Fay’s Method) .
Source: Author’s calculations . U .S . Census Bureau, Current Population Survey, 2013 Annual Social and Economic Supplement . For more information on sampling and nonsampling error, see <www .census .gov/apsd/techdoc/cps/cpsmar13 .pdf> .

U.S. Census Bureau 23
Table A-6.Distribution of Individuals in Near Poverty: 1966 and 2012(Numbers in thousands)
Characteristic
Near poverty Total population
1966 2012 Percentage point change
1966 2012 Percentage point changePercent SE1 Percent SE1 Percent SE1 Percent SE1
AgeUnder 18 years . . . . . . . . . . . . . 42 .8 1 .1 28 .8 0 .59 *–14 .0 36 .4 0 .5 23 .9 0 .03 *–12 .518 to 64 years . . . . . . . . . . . . . . 41 .2 0 .8 55 .0 0 .57 *13 .8 54 .4 0 .3 62 .2 0 .04 *7 .965 years and older . . . . . . . . . . . 16 .0 0 .6 16 .2 0 .53 0 .2 9 .3 0 .4 13 .9 0 .03 4 .6
GenderMen . . . . . . . . . . . . . . . . . . . . . . 47 .0 1 .3 45 .4 0 .47 –1 .6 48 .5 0 .5 49 .0 0 .01 0 .5Women . . . . . . . . . . . . . . . . . . . 53 .0 1 .3 54 .6 0 .47 1 .6 51 .5 0 .4 51 .0 0 .01 –0 .5
RaceWhite . . . . . . . . . . . . . . . . . . . . . 79 .1 1 .0 76 .4 0 .86 *–2 .8 88 .0 0 .2 79 .5 0 .05 *–8 .5Black . . . . . . . . . . . . . . . . . . . . . 19 .4 1 .0 17 .7 0 .77 –1 .7 11 .0 0 .6 13 .2 0 .02 2 .2Other . . . . . . . . . . . . . . . . . . . . . 1 .5 0 .3 6 .0 0 .47 *4 .5 1 .0 0 .6 7 .3 0 .06 *6 .3
Marital Status (Aged 18 and older)Married . . . . . . . . . . . . . . . . . . . 67 .3 1 .6 35 .7 0 .81 *–31 .6 71 .2 0 .4 53 .2 0 .21 *–18 .0Separated or divorced . . . . . . . . 6 .2 0 .8 18 .6 0 .65 *12 .4 4 .9 0 .8 13 .0 0 .13 *8 .1Widowed . . . . . . . . . . . . . . . . . . 13 .6 1 .2 12 .0 0 .53 –1 .6 8 .9 0 .8 6 .1 0 .08 –2 .8Single, never married . . . . . . . . . 13 .0 1 .1 33 .8 0 .65 *20 .8 15 .0 0 .7 27 .7 0 .15 *12 .7
Educational Attainment (Aged 25 and older)Less than high school . . . . . . . . 70 .1 1 .7 27 .8 0 .89 *–42 .2 48 .5 2 .0 11 .9 0 .14 *–36 .6High school completed . . . . . . . 21 .6 1 .5 35 .5 0 .87 *13 .9 31 .8 0 .7 29 .8 0 .20 *–2 .0Some college/associate's degree . . . . . . . . . . . . . . . . . . . 5 .1 0 .8 24 .6 0 .71 *19 .6 9 .6 0 .8 26 .7 0 .16 *17 .1College completed or more . . . . 3 .3 0 .7 12 .1 0 .65 *8 .8 10 .2 0 .8 31 .7 0 .21 *21 .5
Labor Force (Aged 18-64)In labor force . . . . . . . . . . . . . . . 65 .4 1 .5 40 .8 0 .74 *–24 .6 74 .8 0 .3 74 .7 0 .17 –0 .1Not in labor force . . . . . . . . . . . . 34 .6 1 .5 59 .2 0 .74 *24 .6 25 .3 0 .6 25 .3 0 .17 0 .1
RegionNortheast . . . . . . . . . . . . . . . . . . 20 .9 0 .9 16 .6 0 .77 *–4 .3 25 .7 0 .5 17 .7 0 .03 *–8 .0West . . . . . . . . . . . . . . . . . . . . . 16 .9 1 .1 24 .7 0 .92 *7 .8 23 .8 0 .5 21 .4 0 .04 *–2 .4Midwest . . . . . . . . . . . . . . . . . . . 21 .5 0 .9 18 .3 0 .75 –3 .2 32 .3 0 .5 37 .3 0 .04 5 .0South . . . . . . . . . . . . . . . . . . . . . 40 .7 0 .9 40 .4 1 .02 *–0 .3 18 .2 0 .5 23 .6 0 .04 *5 .4
* Statistically different from zero at the 90 percent confidence level .1 SE Standard error .
Note: Standard errors for 1966 estimated using generalized variance function parameters . Standard errors for 2012 are estimated using replicate weights (Fay’s Method) .
Source: Author’s calculations . U .S . Census Bureau, Current Population Survey, 1967 and 2013 Annual Social and Economic Supplements . For more information on sampling and nonsampling error, see <www .census .gov/apsd/techdoc/cps/cpsmar13 .pdf> .

24 U.S. Census Bureau
Table A-7.Distribution of Individuals in Near Poverty and Poverty: 2012(Numbers in thousands)
CharacteristicNear poverty Poverty Percentage
point difference
Total population
Percent SE1 Percent SE1 Percent SE1
AgeUnder 18 years . . . . . . . . . . . . . . . 28 .8 0 .59 34 .6 0 .33 *5 .8 23 .9 0 .0318 to 64 years . . . . . . . . . . . . . . . . 55 .0 0 .57 57 .0 0 .29 *2 .0 62 .2 0 .0465 years and older . . . . . . . . . . . . . 16 .2 0 .53 8 .4 0 .22 *–7 .8 13 .9 0 .03
GenderMen . . . . . . . . . . . . . . . . . . . . . . . . 45 .4 0 .47 44 .4 0 .28 *–1 .0 49 .0 0 .01Women . . . . . . . . . . . . . . . . . . . . . 54 .6 0 .47 55 .6 0 .28 *1 .0 51 .0 0 .01
RaceWhite . . . . . . . . . . . . . . . . . . . . . . . 76 .4 0 .86 68 .8 0 .54 *–7 .6 79 .5 0 .05Black . . . . . . . . . . . . . . . . . . . . . . . 17 .7 0 .77 23 .8 0 .47 *6 .2 13 .2 0 .02Other . . . . . . . . . . . . . . . . . . . . . . . 6 .0 0 .47 7 .4 0 .32 *1 .4 7 .3 0 .06
Marital Status (Aged 18 and older)Married . . . . . . . . . . . . . . . . . . . . . 35 .7 0 .81 28 .4 0 .52 *–7 .3 53 .2 0 .21Separated or divorced . . . . . . . . . . 18 .6 0 .65 19 .9 0 .38 *1 .3 13 .0 0 .13Widowed . . . . . . . . . . . . . . . . . . . . 12 .0 0 .53 7 .2 0 .22 *–4 .7 6 .1 0 .08Single, never married . . . . . . . . . . . 33 .8 0 .65 44 .5 0 .52 *10 .8 27 .7 0 .15
Educational Attainment (Aged 25 and older)Less than high school . . . . . . . . . . 27 .8 0 .89 29 .9 0 .47 *2 .1 11 .9 0 .14High school completed . . . . . . . . . 35 .5 0 .87 35 .2 0 .49 –0 .2 29 .8 0 .20Some college/associate's degree . . . . . . . . . . . . . . . . . . . . . 24 .6 0 .71 22 .7 0 .44 *–1 .9 26 .7 0 .16College completed or more . . . . . . 12 .1 0 .65 12 .1 0 .36 0 .1 31 .7 0 .21
Labor Force (Aged 18-64)In labor force . . . . . . . . . . . . . . . . . 40 .8 0 .74 47 .4 0 .49 *6 .6 74 .7 0 .17Not in labor force . . . . . . . . . . . . . . 59 .2 0 .74 52 .7 0 .49 *–6 .6 25 .3 0 .17
Health Insurance CoverageWith private coverage . . . . . . . . . . 30 .4 0 .83 20 .4 0 .45 *–10 .1 15 .4 0 .13With public, no private coverage . . 43 .6 0 .84 50 .2 0 .50 *6 .6 63 .9 0 .22Not insured . . . . . . . . . . . . . . . . . . 26 .0 0 .75 29 .4 0 .42 *3 .4 20 .7 0 .17
RegionNortheast . . . . . . . . . . . . . . . . . . . . 16 .6 0 .77 16 .1 0 .36 –0 .5 17 .7 0 .03West . . . . . . . . . . . . . . . . . . . . . . . 24 .7 0 .92 23 .8 0 .49 *–0 .9 21 .4 0 .04Midwest . . . . . . . . . . . . . . . . . . . . . 18 .3 0 .75 19 .0 0 .50 *0 .8 37 .3 0 .04South . . . . . . . . . . . . . . . . . . . . . . . 40 .4 1 .02 41 .1 0 .64 0 .7 23 .6 0 .04
* Statistically different from zero at the 90 percent confidence level .1 SE Standard error .
Note: Standard errors for 1966 estimated using generalized variance function parameters . Standard errors for 2012 are estimated using replicate weights (Fay’s Method) .
Source: Author’s calculations . U .S . Census Bureau, Current Population Survey, 1967 and 2013 Annual Social and Economic Supplements . For more information on sampling and nonsampling error, see <www .census .gov/apsd/techdoc/cps/cpsmar13 .pdf> .

U.S. Census Bureau 25
Table A-8.Program Participation of Individuals in Near Poverty: 1981 and 2012(Numbers in thousands)
Program
1981 2012 Change
Total Number SE1 Percent SE1 Total Number SE1 Percent SE1 Number
Percent-age
point
Public assistance . . . . . . . . . . . . . 11,926 1,582 112 13 .3 0 .9 14,706 496 62 3 .4 0 .4 *–1,086 *–9 .9Food stamps/SNAP . . . . . . . . . . . 11,926 2,691 146 22 .6 1 .1 14,706 4,772 186 32 .5 1 .1 *2,082 *9 .9Housing subsidies . . . . . . . . . . . . 4,659 248 45 5 .3 0 .9 7,218 510 60 7 .1 0 .8 *263 1 .8Energy assistance . . . . . . . . . . . . 11,926 1,233 99 10 .3 0 .8 14,706 1,451 96 9 .9 0 .6 217 –0 .5Earned Income Tax Credit . . . . . . 11,926 976 88 8 .2 0 .7 14,706 3,047 84 20 .7 0 .4 *2,071 *12 .5School lunch program . . . . . . . . . 4,579 3,144 158 68 .7 1 .9 6,029 5,103 203 84 .6 1 .2 *1,959 *16 .0WIC (only since 2000) . . . . . . . . . 7,430 1,659 115 22 .3 1 .4 8,500 1,679 120 19 .8 1 .1 20 –2 .6
* Statistically different from zero at the 90 percent confidence level .1 SE Standard error .
Note: Standard errors for 1981 estimated using generalized variance function parameters . Standard errors for 2012 are estimated using replicate weights (Fay’s Method) .
Source: Author’s calculations . U .S . Census Bureau, Current Population Survey, 1982 and 2013 Annual Social and Economic Supplements . For more information on sampling and nonsampling error, see <www .census .gov/apsd/techdoc/cps/cpsmar13 .pdf> .
Table A-9.Program Participation of Individuals in Near Poverty and Poverty: 2012(Numbers in thousands)
Program
Near poverty Poverty Difference
Total Number SE1 Percent SE1 Total Number SE1 Percent SE1 Number
Percent-age
point
Public assistance . . . . . . . . . . . . . 14,706 496 62 3 .4 0 .4 46,496 3,821 186 8 .2 0 .4 *3,325 *4 .8Food stamps/SNAP . . . . . . . . . . . 14,706 4,772 186 32 .5 1 .1 46,496 23,550 459 50 .6 0 .6 *18,778 *18 .2Housing subsidies . . . . . . . . . . . . 7,218 510 60 7 .1 0 .8 25,525 2,122 112 8 .3 0 .4 *1,612 *1 .2Energy assistance . . . . . . . . . . . . 14,706 1,451 96 9 .9 0 .6 46,496 5,515 205 11 .9 0 .4 *4,065 *2 .0Earned Income Tax Credit . . . . . . 14,706 3,047 84 20 .7 0 .4 46,496 7,745 138 16 .7 0 .2 *4,698 *–4 .1School lunch program . . . . . . . . . 6,029 5,103 203 84 .6 1 .2 21,923 19,405 412 88 .5 0 .6 *14,302 *3 .9WIC . . . . . . . . . . . . . . . . . . . . . . . 8,500 1,679 120 19 .8 1 .1 30,258 7,921 254 26 .2 0 .7 *6,242 *6 .4
* Statistically different from zero at the 90 percent confidence level .1 SE Standard error .
Note: Standard errors for 2012 are estimated using replicate weights (Fay’s Method) .
Source: Author’s calculations . U .S . Census Bureau, Current Population Survey, 2013 Annual Social and Economic Supplement . For more information on sampling and nonsampling error, see <www .census .gov/apsd/techdoc/cps/cpsmar13 .pdf> .
Table A-10.Near Poverty Entrances and Exits: 2011 and 2012(Numbers in thousands)
2011 Status2012 Status
Poverty (below 100 percent)
Near poverty (100–125 percent)
Above near poverty (above 125 percent)
Poverty (below 100 percent) . . . . . . . . . . . . . . . . . . 6,618 1,146 3,858 Standard error . . . . . . . . . . . . . . . . . . . . . . . . . . . . 217 85 136Near poverty (100–125 percent) . . . . . . . . . . . . . . . 1,045 783 2,095 Standard error . . . . . . . . . . . . . . . . . . . . . . . . . . . . 76 60 112Above near poverty (above 125 percent) . . . . . . . . 4,012 2,150 76,000 Standard error . . . . . . . . . . . . . . . . . . . . . . . . . . . . 155 109 658
Note: Standard errors are estimated using replicate weights (Fay’s method) .
Source: U .S . Census Bureau, Current Population Survey, 2012 and 2013 Annual Social and Economic Supplement . For information on sampling and nonsam-pling error, see <www .census .gov/prod//techdoc/cps/cpsmar13 .pdf> .

26 U.S. Census Bureau
Table A-11.Individuals in Near Poverty by State, 3-Year Average: 2010–2012
State
3-year averageDifference from
national rate2010–2012
Total Number Standard error Percent Standard error
United States . . . . . . . . . . . . 308,411 14,578 182 4 .7 0 .1
Alabama . . . . . . . . . . . . . . . . . . . . . 4,764 225 30 4 .7 0 .6 0 .0Alaska . . . . . . . . . . . . . . . . . . . . . . . 703 25 3 3 .5 0 .4 *–1 .2Arizona . . . . . . . . . . . . . . . . . . . . . . 6,538 318 28 4 .9 0 .4 0 .1Arkansas . . . . . . . . . . . . . . . . . . . . . 2,899 197 16 6 .8 0 .6 *2 .1California . . . . . . . . . . . . . . . . . . . . . 37,582 1,973 76 5 .3 0 .2 *0 .5Colorado . . . . . . . . . . . . . . . . . . . . . 5,055 197 15 3 .9 0 .3 *–0 .8Connecticut . . . . . . . . . . . . . . . . . . . 3,524 105 10 3 .0 0 .3 *–1 .7Delaware . . . . . . . . . . . . . . . . . . . . . 897 44 4 4 .9 0 .5 0 .2District of Columbia . . . . . . . . . . . . . 619 26 3 4 .2 0 .5 –0 .5Florida . . . . . . . . . . . . . . . . . . . . . . . 18,970 971 51 5 .1 0 .3 *0 .4
Georgia . . . . . . . . . . . . . . . . . . . . . . 9,665 470 34 4 .9 0 .4 0 .1Hawaii . . . . . . . . . . . . . . . . . . . . . . . 1,335 58 6 4 .4 0 .5 –0 .4Idaho . . . . . . . . . . . . . . . . . . . . . . . . 1,568 99 8 6 .3 0 .5 *1 .6Illinois . . . . . . . . . . . . . . . . . . . . . . . . 12,736 608 38 4 .8 0 .3 0 .0Indiana . . . . . . . . . . . . . . . . . . . . . . . 6,359 234 27 3 .7 0 .4 *–1 .0Iowa . . . . . . . . . . . . . . . . . . . . . . . . . 3,005 130 11 4 .3 0 .4 –0 .4Kansas . . . . . . . . . . . . . . . . . . . . . . . 2,800 134 10 4 .8 0 .4 0 .1Kentucky . . . . . . . . . . . . . . . . . . . . . 4,305 269 18 6 .3 0 .4 *1 .5Louisiana . . . . . . . . . . . . . . . . . . . . . 4,459 263 23 5 .9 0 .5 *1 .2Maine . . . . . . . . . . . . . . . . . . . . . . . . 1,318 47 5 3 .6 0 .3 *–1 .1
Maryland . . . . . . . . . . . . . . . . . . . . . 5,828 167 17 2 .9 0 .3 *–1 .9Massachusetts . . . . . . . . . . . . . . . . . 6,537 245 23 3 .8 0 .4 *–1 .0Michigan . . . . . . . . . . . . . . . . . . . . . 9,724 449 35 4 .6 0 .4 –0 .1Minnesota . . . . . . . . . . . . . . . . . . . . 5,282 198 14 3 .8 0 .3 *–1 .0Mississippi . . . . . . . . . . . . . . . . . . . . 2,915 180 17 6 .2 0 .6 *1 .5Missouri . . . . . . . . . . . . . . . . . . . . . . 5,926 227 23 3 .8 0 .4 *–0 .9Montana . . . . . . . . . . . . . . . . . . . . . . 988 58 6 5 .8 0 .7 *1 .1Nebraska . . . . . . . . . . . . . . . . . . . . . 1,825 74 6 4 .0 0 .3 *–0 .7Nevada . . . . . . . . . . . . . . . . . . . . . . 2,704 133 12 4 .9 0 .5 0 .2New Hampshire . . . . . . . . . . . . . . . . 1,301 38 4 2 .9 0 .3 *–1 .8
New Jersey . . . . . . . . . . . . . . . . . . . 8,698 342 33 3 .9 0 .4 *–0 .8New Mexico . . . . . . . . . . . . . . . . . . . 2,045 115 12 5 .6 0 .6 *0 .9New York . . . . . . . . . . . . . . . . . . . . . 19,248 961 52 5 .0 0 .3 0 .3North Carolina . . . . . . . . . . . . . . . . . 9,499 496 33 5 .2 0 .4 0 .5North Dakota . . . . . . . . . . . . . . . . . . 673 21 3 3 .2 0 .4 *–1 .6Ohio . . . . . . . . . . . . . . . . . . . . . . . . . 11,350 471 37 4 .1 0 .3 *–0 .6Oklahoma . . . . . . . . . . . . . . . . . . . . 3,720 161 17 4 .3 0 .5 –0 .4Oregon . . . . . . . . . . . . . . . . . . . . . . . 3,824 184 16 4 .8 0 .4 0 .1Pennsylvania . . . . . . . . . . . . . . . . . . 12,630 502 35 4 .0 0 .3 *–0 .7Rhode Island . . . . . . . . . . . . . . . . . . 1,038 44 4 4 .3 0 .4 –0 .5
South Carolina . . . . . . . . . . . . . . . . . 4,612 245 17 5 .3 0 .4 *0 .6South Dakota . . . . . . . . . . . . . . . . . . 810 36 3 4 .4 0 .4 –0 .3Tennessee . . . . . . . . . . . . . . . . . . . . 6,354 343 22 5 .4 0 .3 *0 .7Texas . . . . . . . . . . . . . . . . . . . . . . . . 25,606 1,422 66 5 .6 0 .3 *0 .8Utah . . . . . . . . . . . . . . . . . . . . . . . . . 2,810 115 13 4 .1 0 .5 –0 .6Vermont . . . . . . . . . . . . . . . . . . . . . . 618 22 2 3 .6 0 .3 *–1 .1Virginia . . . . . . . . . . . . . . . . . . . . . . . 7,934 290 25 3 .7 0 .3 *–1 .1Washington . . . . . . . . . . . . . . . . . . . 6,794 317 26 4 .7 0 .4 –0 .1West Virginia . . . . . . . . . . . . . . . . . . 1,813 98 13 5 .4 0 .7 0 .7Wisconsin . . . . . . . . . . . . . . . . . . . . 5,643 205 15 3 .6 0 .3 *–1 .1Wyoming . . . . . . . . . . . . . . . . . . . . . 563 24 3 4 .3 0 .5 –0 .4
* Statistically different from zero at the 90 percent confidence level .
Note: Standard errors for 2012 are estimated using replicate weights (Fay’s Method) .
Source: Author’s calculations . U .S . Census Bureau, Current Population Survey, 2011–2013 Annual Social and Economic Supplements . For more information on sampling and nonsampling error, see <www .census .gov/apsd/techdoc/cps/cpsmar13 .pdf> .


![Poverty Myths...60 will be below the official poverty line for at least one year, and another 10% will be near the poverty line for a year.[2] A literature review on poverty dynamics](https://img.pdfslide.net/doc/110x75/5f3c44b99b207c16bd568492/poverty-myths-60-will-be-below-the-official-poverty-line-for-at-least-one-year.jpg)