Embed Size (px)
Citation preview

The Plant Cell, Vol. 7, 2053-2067, December 1995 0 1995 American Society of Plant Physiologists
lmmunocytological Localization of an Epitope-Tagged Plasma Membrane Proton Pump (H+-ATPase) in Phloem Companion Cells
Natal ie D. DeWitt ' a n d Michael R. Sussman2
Cell and Molecular Biology Program and Department of Horticulture, University of Wisconsin, 1575 Linden Drive, Madison, Wisconsin 53706-1 590
In higher plants, the plasma membrane proton pump (H+-ATPase) is encoded by a surprisingly large multigene family whose members are expressed in different tissues. Using an 18-amino acid epitope tag derived from the animal oncogene c-Myc, we have performed immunocytolocalization measurements of the protein expressed by one member of this family, AHA3 (Arabidopsis H+-ATPase isoform 3). lmmunofluorescence studies with tissue sections of transgenic plants have revealed that c-Myc-tagged AHA3 is restricted to the plasma membrane of phloem companion cells, whereas other AHA isoproteins are more widely distributed in the plasma membrane of other cell types. Electron microscopy with immunogold- labeled tissue sections suggests that there is a high concentration of proton pumps in the plasma membrane of compan- ion cells but a much lower concentration in the plasma membrane of sieve elements. Due to plasmodesmata connecting the plasma membrane of these two adjacent cell types, i t is likely that the proton motive fome generated by the proton pump in companion cells can serve to power the uptake of sugar by proton-coupled symporters in either the companion cell or sieve element cell. The abundance of the proton pump in the plasma membrane of companion cells supports an apoplastic model for phloem loading in which the metabolic energy that drives sugar uptake is consumed by AHA3 at the companion cell plasma membrane. These experiments with a genetically altered integral plasma membrane pro- tein demonstrate the uti l i ty of using a short c-Myc sequence as an epitope tag in Arabidopsis. Furthermore, our results demonstrate that, using genes encoding individual members of a gene family, i t is possible to label plasma membrane proteins immunologically in specific, differentiated cell types of higher plants.
INTRODUCTION
Fick's Law predicts that over small distances (e.g., 1 to 2 mm), simple diffusion is sufficient for the movement of solutes neces- sary to support life. However, for transport over longer distances, multicellular organisms have evolved specialized structures to ensure that sugars and other solutes are sup- plied to cells far removed from nutrient sources. In higher plants, the phloem is a unique structure responsible for long- distance movement of sugars, hormones, and other nutrients. Within the phloem vasculature are two anatomically distinct cell types, the sieve tube element and the companion cell. Al- though these two contiguous cells originate by unequal cell division of a common mother cell, their morphologies are strik- ingly distinct and suggest that each performs unique physiological functions (Evert, 1990). The presence of a nu- cleus and the abundance of organelles and ribosomes in the
Current address: Biology Department, The Plant Laboratory, Univer- sity of York, Heslington, York, YO1 5DD, England.
To whom correspondence should be addressed.
companion cell suggest that this cell is active in protein syn- thesis and metabolism. In contrast, the scarcity of organelles within the sieve elements and the presence of sieve plate pores in the cross walls between each column of cells appear to be specializations that allow rapid and massive movement of sug- ars and other solutes. Whereas the morphological differences between sieve tube cells and companion cells imply differences in their respective transport functions, little or no cytochemi- cal or biochemical data exist on the structure and function of specific plasma membrane transport proteins residing in each cell type.
The primary active transport system at the plasma mem- brane of plants is a P-type proton pump (H+-ATPase), which generates the proton motive force used to drive the uptake and accumulation of solutes within each cell (for example, see Bush, 1993). Many plant genes have been cloned encoding proteins with structural characteristics of P-type cation-translocating ATPases, afamily of proteins also found in fungi, bacteria, and animals. These proteins couple ATP hydrolysis to ion trans- location, thereby generating ion gradients across cellular membranes and maintaining the osmotic and chemical balance

2054 The Plant Cell
of the cytoplasm. At least 10 genes encoding P-type ATPases have been identified in Arabidopsis, and based on identity with amino acid sequence derived from the purified enzyme, these were predicted to encode plasma membrane proton pumps (H+-ATPases) (Harper et al., 1989, 1994; Pardo and Serrano, 1989; Serrano, 1989; Sussman, 1994). Using a yeast expres- sion system, this prediction was recently confirmed for severa1 H+-ATPase isoforms (Palmgren and Christensen, 1993, 1994).
The experiments performed in this study were prompted by our previous reporter gene studies of one of 10 genes encoding the Arabidopsis plasma membrane H+-ATPase. These experi- ments demonstrated that the promoter for AHA3 (Arabidopsis H+-ATPase isoform 3) drives reporter gene expression only in cells within the phloem of vegetative tissue, which suggested that we had identified the proton pump providing the driving force for loading solutes into the phloem (DeWitt et al., 1991). Similar studies with upstream sequences of three other gene isoforms, AHA10, AHA2, and AHAS, reveal different expres- sion patterns, with the AHAlO promoter directing expression only in cells of the seed integument (Harper et al., 1994), AHAP in the root epidermis and cortex (J.F. Harper, unpublished results), and AHAS in the anthers of transgenic tobacco (Houlné and Boutry, 1994).
Whereas our previous study of the AHA3 gene promoter raised the possibility that the biochemical properties of the AHA3 protein are uniquely suited to providing energy for phloem loading and translocation, an immunological approach that distinguished AHA3 from the other isoproteins was re- quired to test this hypothesis directly. Here, we describe AHA3-specific immunolocalization studies, using the AHA3 gene tagged with sequences encoding a c-Myc epitope, to dis- tinguish it immunologically from other highly conserved AHA isoproteins. lmmunofluorescence in tissue sections of trans- genic plants revealed that expression of the c-Myc-tagged AHA3 polypeptide is restricted to phloem companion cells and not sieve elements or parenchyma cells. In contrast, other H+-ATPase isoproteins were more generally distributed in nonphloem cell types, and within the phloem, these isoproteins were found in phloem parenchyma cells in addition to com- panion cells. c-Myc was shown to be an appropriate epitope tag for Arabidopsis immunocytochemistry because there was little or no background immunoreactivity in wild-type plants. We also used immunogold labeling to determine quantitatively that H+-ATPases are much more abundant in the plasma membrane of companion cells than in sieve elements, which appear to be virtually devoid of H+-ATPases.
RESULTS
A plant expression plasmid vector was constructed contain- ing 5 kb of AHAStranscribed genomic sequence, 4 kb of 5' upstream sequence, and 2.3 kb of downstream sequences. Using site-directed mutagenesis, BamHl sites were inserted
into one of two separate sites in the C-terminal coding se- quences, corresponding to cytoplasmically located amino acids 904 and 944 (Figure 1A). The nucleotide sequence encoding a 14-amino acid c-Myc epitope (Kolodziej and Young, 1991) was translationally fused to a genomic clone encoding AHA3 (Figure 1B). The two different modified AHA3 genes were cloned into an Agrobacterium binary plasmid, and at least six independently transformed kanamycin-resistant Arabidopsis plants were generated with each plasmid. Results shown are typical of the transgene present in multiple transgenic plant lines and thus are independent of the chromosomal location of the transgene.
As a first test of whether the epitope-tagged AHA3 protein was expressed, microsomes were prepared from crude extracts of transgenic plant lines transformed with the construct en- coding AHA3 with an epitope inserted at either amino acid position 904 or 944. SDSPAGE and immunoblot analyses were performed using commercially available monoclonal antibodies generated against the c-Myc epitope. As shown in Figure 2A,
A
B
AHA3 :
9 O 4 / m y c :
GGYRELS E1
GGYREDPPEOKLISEEDLLDPEI
AHA3 : DIETAG HYTV
9 44 / m y c : DIETADPPEOICLISEEDLLDPIE&IKI
Figure 1. Location and Structure of the c-Myc Epitope Tag within the Plasma Membrane Proton Pump (H+-ATPase).
(A) A model for the predicted topological structure of theAHA3-encoded protein, based on a computer-assisted hydropathy plot. Open diamonds denote the lwo positions at the C terminus, either amino acid 904 or 944, where the epitope was inserted. (B) Amino acid sequence of the c-Myc epitope. AHA3 residues deleted in the epitope-tagged proteins are shown in boldface, as are AHA3- c-Myc residues that are additions or substitutions to the wild-type se- quence. Amino acids encoding the c-Myc epitope are underscored.

Companion Cell-Specific H+-ATPase 2055
there was little or no wild-type protein reactive with the anti-c-Myc antibody in wild-type membranes. In contrast, in mem-branes from transgenic plants expressing either of the twoc-Myc-tagged ATPases, a strong c-Myc immunoreactive bandwas observed at 100 kD, the predicted molecular mass for theH+-ATPase.
Interestingly, the 944-c-Myc protein ran as a single band,whereas the 904-c-Myc protein ran as a doublet. This pattern,which was consistently and reproducibly observed with extractsfrom independent transgenic lines, is probably due to proteol-ysis of the more C-terminal 944 epitope. Thus, a proteolyzed944 protein would be undetectable with the anti-c-Myc anti-body, whereas both the proteolyzed and intact forms of the904 c-Myc would be evident and appear as a doublet. Basedon this immunoblot result, it is likely that a proteolytic cleav-age site exists between amino acids 904 and 944.
The identity of this protein as the plasma membrane protonpump was confirmed by stripping the epitope antibody fromthese blots and reprobing with a polyclonal antibody directedagainst the C terminus of AHA2 (DeWitt, 1994). An immuno-blot using this polyclonal anti-H+-ATPase antibody to probeArabidopsis microsomal proteins is shown in Figure 2B. TheAHA2 isoform was previously shown to be expressed predom-inantly in roots (Harper et al., 1990), but structural similaritiesbetween the C termini of the known members of the AHA genefamily (see Harper et al., 1994; Sussman, 1994) suggest thatmost or all AHA isoforms are recognized by this antibody. Forexample, comparison of the C-terminal 102 amino acids ofAHA2 with AHA1 and AHA3 shows 87 and 80% amino acididentity, respectively. The high immunoreactivity of this AHA2-derived antibody with AHA3 was experimentally verified by im-munoblotting a 160-kD AHA3/p-glucuronidase chimeric protein(DeWitt, 1994).
Using indirect immunofluorescence, the cellular and sub-cellular localization of AHA3-c-Myc was determined in leaf andstem transections. Leaf sections of plants expressing AHA3-c-Myc (904 and 944) displayed highly specific labeling of adiscrete population of phloem cells in both major and minorveins (Figures 3A to 3C). The cells were labeled predominantlyat their periphery such that they had a "halo" appearance, con-sistent with plasma membrane labeling. Leaf sections ofuntransformed wild-type control plants displayed no labeling(Figure 3D), confirming that the staining observed in AHA3-c-Myc-transformed plants is specific for the c-Myc-taggedAHA3 protein. Similarly, no labeling of freehand stem sectionsfrom wild-type plants was observed using anti-c-Myc sera (Fig-ure 4A), whereas stem sections of plants transformed withAHA3-c-Myc strongly and specifically labeled a discrete popu-lation of cells in the phloem (Figure 4B). Multiple lines of the904- and 944-tagged constructs were tested, and all displayedthis staining pattern.
The cells specifically labeled by the anti-c-Myc sera wereidentified as phloem companion cells, based on the size, ar-rangement, cytoplasmic density, and contents of differentphloem cells. Most strikingly, the labeled cells contained dense
-200-116-97
-66-45
B
200
PI
Figure 2. SDS-PAGE Immunoblots of Membranes from Wild-Type andTransgenic Plants.(A) Immunoblot of AHA3-c-Myc. Microsomal proteins (60 ng) from un-transformed control plants (WT) and from AHA3-c-Myc-expressingtransgenic plants, with AHA3 tagged at either amino acid 904 or aminoacid 944. Proteins were immunoreacted with the anti-c-Myc mono-clonal antibody designated 9E10.2. Molecular weight in kilodaltons isindicated at right.(B) Immunoblot of wild-type H+-ATPase. Microsomal proteins (15 ng)from wild-type plants immunoreacted with anti-t-T-ATPase sera (I) orpreimmune serum (PI). Molecular weight in kilodaltons is indicatedat left.
cytoplasm and chloroplasts, which are characteristics of com-panion cells rather than sieve elements. Confocal microscopyconfirmed that chloroplast autofluorescence appeared withinthe same focal plane as the c-Myc immunofluorescent label,and thus, chloroplasts were contained within labeled cellsrather than beneath them (data not shown). Special care was

2056 The Plant Cell
Figure 3. Anti-c-Myc Labeling of Leaf Veins in Plants Expressing AHA3-c-Myc.
Frozen cryostat sections (8 urn) were labeled with anti-c-Myc monoclonal mouse antibody and FITC-conJugated anti-mouse IgG, sera(A) to (C) show labeling of vein transections from Arabidopsis expressing AHA3-c-Myc, and (D) shows labeling of vein transection from untrans-formed control Arabidopsis. Bar in (C) (labeled p) indicates 15 urn and applies to all panels.(A) Major vein transection showing labeling in a subset of phloem cells (p) but not xylem (x) and mesophyll (m) cells.(B) Minor vein transection showing labeling in a subset of phloem cells (p) but not xylem (unlabeled) or mesophyll (m) cells.(C) Intermediate vein transection showing labeling in a subset of phloem cells (p) but not xylem (x), mesophyll (unlabeled), or epidermal (e) cells.(D) Major vein transection showing absence of labeling in phloem (p) cells of untransformed control plants. Autofluorescence from xylem (x) isvisible as a dark green background.(E) Schematic drawing of the transection of an Arabidopsis major vein, with a mesophyll cell (m), and xylem (x) and phloem (p) tissues labeled.

Companion Cell-Specific H+-ATPase 2057
CA
Figure 4. Anti-c-Myc Labeling of a Stem Cross-Section in Plants Ex-pressing AHA3-c-Myc.
Stem transections (free hand) were labeled with anti-c-Myc mousemonoclonal antibodies and FITC-conjugated anti-mouse IgG, sera.In (A), the bar labeled p indicates 25 im and applies to both (A) and (B).(A) Labeling of stem transection from untransformed control Arabidop-sis. Cortical (c) and phloem (p) cells show no labeling, and xylem (x)shows only autofluorescence.(B) Stem transection from Arabidopsis expressing AHA3-c-Myc, show-ing intense, cell-specific labeling in a subset of phloem cells but notcortical (c) or xylem (x) cells.(C) Schematic drawing of a vein transection from an Arabidopsis stem,with the cortex (C), phloem (P), xylem (X), and cambium (CA) labeled.
taken to assess labeling of phloem parenchyma cells, which,based on their "transfer cell" morphology suggestive of mem-brane transport function (DeWitt, 1994), might be expected toexpress high levels of H+-ATPase (although not necessarilyAHA3). However, under our labeling and plant growth condi-
tions, anti-c-Myc labeling of phloem parenchyma transferlikecells in leaves was not observed.
A trivial explanation for the absence of labeling in non-com-panion cells is that the other cell types are not as accessibleto antibodies under these labeling conditions. To address thispossibility, cells were labeled with anti-actin sera. Examina-tion of stained leaf sections using confocal microscopy revealedthat anti-c-Myc sera predominantly labeled the cell periph-ery. In contrast, anti-actin label was distributed throughout thecytoplasm, although it sometimes appeared concentrated nearorganelles or at the plasma membrane (DeWitt, 1994). More-over, anti-actin sera labeled nearly all cells of the vein as wellas some adjacent mesophyll cells. Phloem parenchyma andmesophyll cells must therefore be accessible to antibodies inthis procedure, in support of our conclusion that AHA3-c-Myclocalization is restricted to companion cell plasma membranes.
A more rigorous means of identifying cell types within thephloem is electron microscopy using immunogold-labeledsections. Unfortunately, immunogold studies with Lowicryl-embedded ultrathin sections from transgenic plants did notprovide significant labeling with anti-c-Myc monoclonal anti-bodies, perhaps because of fixation conditions that reducedimmunoreactivity of the epitopes or resin-embedding proce-dures that masked the epitopes. However, using the polyclonalantibody directed against all AHA isoforms and mild fixationconditions, we were able to observe significant immunogoldlabeling of the plasma membrane in companion cells. In theseexperiments, the structure of Arabidopsis stem and leaf veinswas first examined under optimal fixation conditions using elec-tron microscopy to identify the arrangement of cell types withinthe phloem and to determine their size and contents. Figure5 shows a typical companion cell-sieve element complex froman Arabidopsis bolting stem fixed for standard transmissionelectron microscopy. In stems, the companion cells are usu-ally equal to or smaller in size than sieve elements and containstrikingly dense cytoplasmic ground material, numerous mi-tochondria, chloroplasts, and large vacuoles. In contrast, sieveelements are devoid of most organelles and cytoplasmicground material but contain starch granules and a parietal ar-rangement of smooth endoplasmic reticulum, mitochondria,and plastids (see DeWitt, 1994, for a more detailed descrip-tion of Arabidopsis phloem cell ultrastructure).
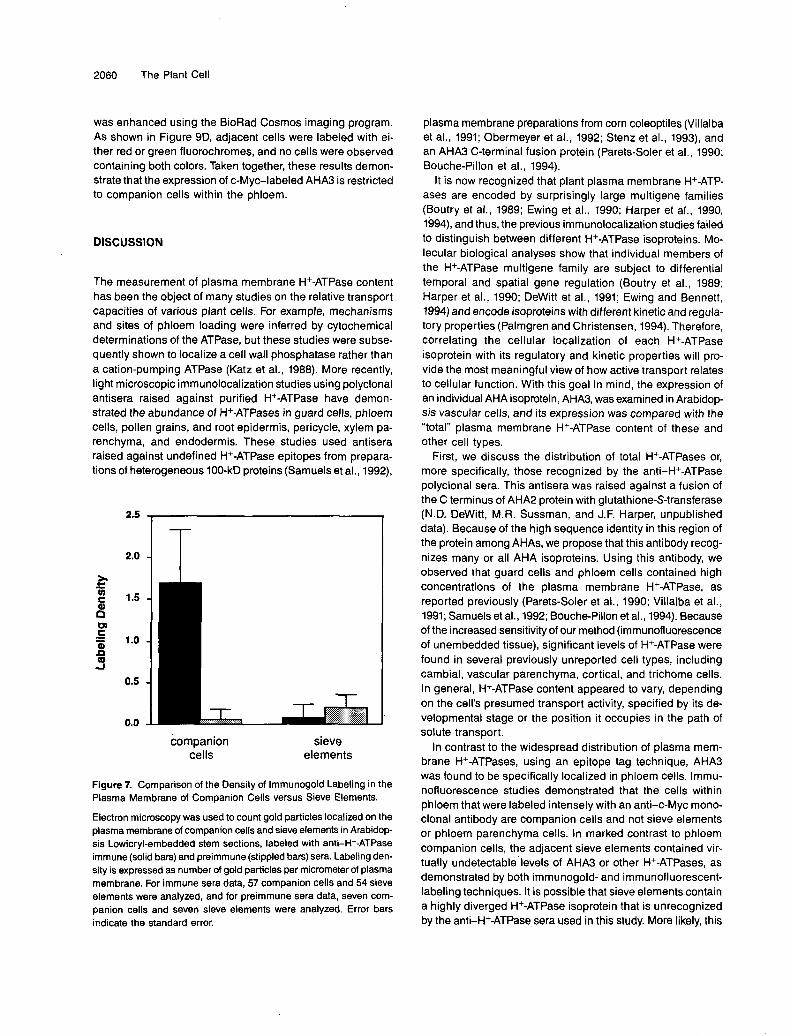
Lowicryl-embedded stem sections were labeled withanti-H+-ATPase sera, and electron microscopy revealed thatimmunogold label was concentrated on the plasma membraneof companion cells, with little or no labeling of sieve elements(Figure 6). In plasmolyzed cells, the immunogold label clearlyfollowed the contours of the plasma membrane and was notassociated with the cell wall. Companion cell-sieve elementcomplexes were randomly selected and photographed, andtheir plasma membrane-associated gold particles werecounted. On average, companion cells contained 1.7 gold par-ticles per micrometer of plasma membrane, whereas sieveelements contained 0.2 gold particles per micrometer of plasmamembrane, an amount that is not significantly different fromthe background (Figure 7). Because of technical limitations,

2058 The Plant Cell
Figure 5. Companion Cell-Sieve Element Complex in Transection ofArabidopsis Bolting Stem.
The cytoplasm visible in the companion cell (cc) is extremely denseand contains numerous mitochondria and other organelles. The sieveelement (se) is devoid of most organelles but contains fibrillar P-proteinand a parietal layer of smooth endoplasmic reticulum. Bar = 1 urn.
such as inaccessibility of antigen to antibodies and potentialclustering of primary and secondary antibodies, these valuesprobably reflect the relative levels of H+-ATPase in companioncells and sieve elements rather than absolute concentrationsof H+-ATPase in the plasma membrane.
Fixation conditions that yielded the best cellular preserva-tion (i.e., glutaraldehyde-paraformaldehyde mixtures) yieldedlow signal and high nonspecific labeling. Difficulties were pre-viously reported in localizing yeast H+-ATPases usingimmunogold labeling with antisera against the C terminus(Monk et al., 1991). Epitope mapping experiments confirmedthat the yeast C terminus had low antigenicity (Serrano et al.,1993), presumably because the conformational configurationof the C terminus impedes antibody-antigen recognition. Thephloem H+-ATPase localized in this study was also sensitiveto fixation and resin embedding, perhaps because of similarproperties. Despite the suboptimal ultrastructural preservation,this analysis did confirm that H+-ATPases are abundant incompanion cells and virtually undetectable in sieve elementsand that most of the labeling in companion cells is concen-trated on the plasma membrane. These results are in generalagreement with those of Bouche-Pillon et al. (1994), who, usingan ATPase polyclonal antibody with ultrathin sections of We/afaba minor veins, observed many immunogold particles onthe plasma membrane of phloem transfer cells but few on theplasma membrane of sieve tubes.
Our electron microscopic studies were especially useful forevaluating results from light microscopic immunofluorescence
studies, in which we compared the "general" H+-ATPase dis-tribution with the epitope-tagged AHA3 distribution. Parallelimmunofluorescence experiments with the anti-H+-ATPasepolyclonal sera demonstrated labeling of multiple cell types(Figures 8A to 81), in contrast to specific labeling of compan-ion cells by anti-c-Myc sera shown in Figures 3 and 4. In stemsections (Figures 8A to 8F), companion cells and guard cellswere labeled most intensely, followed by phloem parenchyma,xylem parenchyma, cortical, and cambial cells. Little labelingwas observed in pith cells and sieve elements, and no label-ing was observed in tracheary elements, consistent with theabsence of plasma membrane in those structures. In leaf sec-tions (Figures 8G to 81), numerous cell types were also labeled:guard cells, companion cells, phloem parenchyma, vascularparenchyma, and mesophyll. In most cells, the plasma mem-brane was predominantly labeled, although nonspecificlabeling was sometimes observed on chloroplasts.
Double-labeled immunofluorescence was used to comparemore directly the distribution of AHA3-c-Myc with that of otherAHAs present in leaves and stems, as shown in Figures 9Ato 9C. Anti-c-Myc and anti-H+-ATPase sera were individuallyor simultaneously applied to sections and visualized withrhodamine red-conjugated and fluorescein isothiocyanate(FITC)-conjugated secondary antibodies, respectively. Cellslabeled by anti-H+-ATPase appeared green, cells labeled byanti-c-Myc appeared red, and cells labeled by both antiseraappeared yellow-orange. When sections were treated withanti-H+-ATPase sera only and viewed with the double-bandpass filter, only green fluorescence was observed (Figure 9A).When sections were treated with anti-c-Myc sera only andviewed with the double-band pass filter, only red fluorescencewas observed (data not shown). When sections were treatedwith both sera and viewed with the double-band pass filter,both green and yellow-orange fluorescence was observed (Fig-ure 9B), indicating that both sera labeled a subset of cells andthat anti-H+-ATPase sera labeled the remainder of cells.
We determined that overlap in labeling between the anti-c-Myc and anti-H+-ATPase antibodies occurs exclusively incompanion cells. In stem sections labeled only with anti-H+-ATPase sera, companion cells as well as cortical, cambial,and phloem parenchyma cells appeared green (Figure 9A).However, in stems from plants expressing AHA3-c-Myc labeledwith both anti-H+-ATPase and anti-c-Myc, cortical, cambialand phloem parenchyma cells appeared green, whereas onlycompanion cells appeared yellow-orange (Figure 9B). Thus,companion cells are labeled by both antisera, whereas theother cell types are labeled exclusively by anti-H+-ATPasesera. In comparisons of double-labeled companion cells andguard cells, companion cells again were labeled by both sera,whereas guard cells were labeled only by anti-H+-ATPasesera (DeWitt, 1994).
To reduce the glare from chloroplast autofluorescence whenusing the double-band pass filter, it was sometimes neces-sary to make adjustments that reduced the anti-c-Myc signalsuch that in these figures it appears weaker than the anti-H+-ATPase signal. However, for the following reasons, the speci-

Companion Cell-Specific H+-ATPase 2059
Figure 6. Immunogold Localization of H+-ATPases in Arabidopsis Stem Companion Cell-Sieve Element Complexes.(A) Control in which the transection was treated with preimmune sera and gold-conjugated secondary antibody. Note the absence of gold particleson the companion cell (cc) plasma membrane, se, sieve element. Bar = 0.5 urn.(B) Higher magnification of boxed region in (A), showing absence of gold particles in the plasma membrane of companion and adjacent cells.Bar = 0.5 urn.(C) Transection treated with anti-H+-ATPase sera and immunogold-conjugated secondary antibody, showing gold particles on plasma membraneof companion cells (cc) but not sieve elements (se). Bar = 0.5 urn.(D) Higher magnification of boxed region in (C), showing gold particles on the plasma membrane (pm) of companion cells but not adjacent phloemparenchyma or sieve elements. Bar = 0.5 urn.
ficity of companion cell labeling is not an artifact resultingfrom weak anti-c-Myc labeling. First, the double-labeling ex-periments were conducted using different combinations ofantibodies and fluorochromes, and the same results were ob-served, that is, anti-c-Myc labeled companion cells only,whereas anti-H+-ATPase labeled multiple cell types. Second,under identical imaging conditions, anti-c-Myc labeling of com-panion cells gave an intensity equal to the anti-H+-ATPaselabeling of companion cells without labeling of any other celltype.
As a final confirmation that sieve elements contained unde-tectable amounts of c-Myc-tagged AH A3, we also performed
double-labeling experiments with a recently derived monoclo-nal antibody directed against a sieve element-specific isoformof p-amylase (Wang et al., 1995). This antibody, designatedRS5, was visualized with a secondary antibody coupled to thered fluorochrome rhodamine, whereas the anti-c-Myc mono-clonal antibody was visualized with a secondary antibodycoupled to the green fluorochrome FITC. An image at the ex-citation wavelength corresponding to each fluorochrome wascollected using a laser confocal microscope in the dual chan-nel mode (568 nm for rhodamine and 488 nm for FITC), andafter digitization and merging, pseudocolors denoting rhoda-mine as red and FITC as green were assigned, and contrast
2060 The Plant Cell
was enhanced using the BioRad Cosmos imaging program. AS shown in Figure 9D, adjacent cells were labeled with ei- ther red or green fluorochromes, and no cells were observed containing both colors. Taken together, these results demon- strate that the expression of c-Myc-labeled AHA3 is restricted to companion cells within the phloem.
DlSCUSSlON
The measurement of plasma membrane H+-ATPase content has been the object of many studies on the relative transport capacities of various plant cells. For example, mechanisms and sites of phloem loading were inferred by cytochemical determinations of the ATPase, but these studies were subse- quently shown to localize a cell wall phosphatase rather than a cation-pumping ATPase (Katz et al., 1988). More recently, light microscopic immunolocalization studies using polyclonal antisera raised against purified H+-ATPase have demon- strated the abundance of H+-ATPases in guard cells, phloem cells, pollen grains, and root epidermis, pericycle, xylem pa- renchyma, and endodermis. These studies used antisera raised against undefined H+-ATPase epitopes from prepara- tions of heterogeneous 100-kD proteins (Samuels et al., 1992),
2.5
2.0
1.5
1 .o
0.5
0.0
companion sieve cells elements
Figure 7. Comparison of the Density of lmmunogold Labeling in the Plasma Membrane of Companion Cells versus Sieve Elements.
Electron microscopy w,as used to count gold particles localized on the plasma membrane of companion cells and sieve elements in Arabidop- sis Lowicryl-embedded stem sections, labeled with anti-H+-ATPase immune (solid bars) and preimmune (stippled bars) sera. Labeling den- sity is expressed as number of gold particles per micrometer of plasma membrane. For immune seia data, 57 companion cells and 54 sieve elements were analyzed, and for preimmune sera data, seven com- panion cells and seven sieve elements were analyzed. Error bars indicate the standard error.
plasma membrane preparations from corn coleoptiles (Villalba et ai., 1991; Obermeyer et ai., 1992; Stenz et ai., 1993), and an AHA3 C-terminal fusion protein (Parets-Soler et al., 1990; Bouche-Pillon et ai., 1994).
It is now recognized that plant plasma membrane H+-ATP- ases are encoded by surprisingly large multigene families (Boutry et ai., 1989; Ewing et ai., 1990; Harper et ai., 1990, 1994), and thus, the previous immunolocalization studies failed to distinguish between different H+-ATPase isoproteins. Mo- lecular biological analyses show that individual members of the H+-ATPase multigene family are subject to differential temporal and spatial gene regulation (Boutry et ai., 1989; Harper et ai., 1990; DeWitt et ai., 1991; Ewing and Bennett, 1994) and encode isoproteins with different kinetic and regula- tOry properties (Palmgren and Christensen, 1994). Therefore, correlating the cellular localization of each H+-ATPase isoprotein with its regulatory and kinetic properties will pro- vide the most meaningful view of how active transport relates to cellular function. With this goal in mind, the expression of an individual AHA isoprotein, AHA3, was examined in Arabidop- SiS vascular cells, and its expression was compared with the “total” plasma membrane H+-ATPase content of these and other cell types.
First, we discuss the distribution of total H+-ATPases or, more specifically, those recognized by the anti-H+-ATPase polyclonal sera. This antisera was raised against a fusion of the C terminus of AHA2 protein with glutathione-S-transferase (N.D. DeWitt, M.R. Sussman, and J.F. Harper, unpublished data). Because of the high sequence identity in this region of the protein among AHAs, we propose that this antibody recog- nizes many or ali AHA isoproteins. Using this antibody, we observed that guard cells and phloem cells contained high concentrations of the plasma membrane H+-ATPase, as reported previously (Parets-Soler et al., 1990; Villalba et al., 1991; Samuels et al., 1992; Bouche-Pillon et ai., 1994). Because of the increased sensitivity of our method (immunofluorescence of unembedded tissue), significant levels of H+-ATPase were found in severa1 previously unreported cell types, including cambial, vascular parenchyma, cortical, and trichome cells. In general, H+-ATPase content appeared to vary, depending on the cell’s presumed transport activity, specified by its de- velopmental stage or the position it occupies in the path of solute transport.
In contrast to the widespread distribution of plasma mem- brane H+-ATPases, using an epitope tag technique, AHA3 was found to be specifically localized in phloem cells. Immu- nofluorescence studies demonstrated that the cells within phloem that were labeled intensely with an anti-c-Myc mono- clonal antibody are companion cells and not sieve elements or phloem parenchyma cells. In marked contrast to phloem companion cells, the adjacent sieve elements contained vir- tually undetectable’levels of AHA3 or other H+-ATPases, as demonstrated by both immunogold- and immunofluorescent- labeling techniques. It is possible that sieve elements contain a highly diverged H+-ATPase isoprotein that is unrecognized by the anti-H+-ATPase sera used in this study. More likely, this

Companion Cell-Specific H+-ATPase 2061
Figure 8. Distribution of H*-ATPases in Arabidopsis Stem Vascular Bundles and Leaf Veins.
Stem transections were labeled with either anti-f-T-ATPase immune sera shown in (A), (C), (E), (G), and (H) or with preimmune sera shownin (B), (D), (F), and (I) and detected with FITC-conjugated secondary antisera. Labeled sections were viewed with an epifluorescent microscopeat x100 magnification using an FITC filter.(A) Vascular bundle, labeled with immune sera, showing labeling of the companion cells (cc) and phloem parenchyma (pp) of the phloem (ph).Cortical cells (co) are moderately labeled, as are vascular parenchyma cells of the xylem (x). se, sieve element.(B) Vascular bundle similar to that shown in (A), labeled with preimmune sera. No labeling is evident in phloem (ph) or cortex (c); however, au-tofluorescence of xylem (x) is visible.(C) Another view of vascular bundle with immune sera, showing labeling of vascular parenchyma but not tracheary elements (x) or pith (pi).(D) Same view of vascular bundle as (C) labeled with preimmune sera, showing no labeling of vascular parenchyma or pith (pi) but showingautofluorescence from xylem (x).(E) Periphery of stem section labeled with immune sera, showing intense labeling of guard cells (gc) and moderate labeling of cortical cells (co).(F) Outer edge of stem section labeled with preimmune sera, showing no labeling of guard cells (gc) or cortical cells.(G) through (I) show leaf veins, either major veins in (G) and (I) or minor veins in (H).

2062 The Plant Cell
Figure 9. Arabidopsis Stem Vascular Bundle Stained with Various Combinations of Anti-c-Myc and Anti-H+-ATPase Immune and PreimmuneSera.
(A) Stem transection from plant expressing AHA3-c-Myc, labeled with anti-H+-ATPase immune sera and FITC-conjugated secondary antibody,viewed with double-band pass filter specific for both FITC and rhodamine red. All plasma membrane labeling of phloem cells appears green,including companion cells (arrow).(B) Another stem transection from a plant expressing AHA3-c-Myc, labeled with both anti-H*-ATPase immune and anti-c-Myc sera, detectedwith FITC- and rhodamine red-conjugated secondary antibodies, respectively, and viewed with double-band pass filter. Phloem parenchyma,vascular parenchyma, and cambial cells appear green, whereas companion cells appear yellow-orange (arrow).(C) Stem transection from untransformed control plant, labeled with anti-H+-ATPase preimmune and anti-c-Myc sera, detected with FITC-andrhodamine red-conjugated secondary antibodies, respectively, and viewed with double-band pass filter. Only autofluorescence from xylem andchloroplasts is evident.(D) Distribution of a sieve element-specific antigen and AHA3-c-Myc in vascular bundles. Arabidopsis stems were double labeled with RS5(anti-p-amylase) and anti-c-Myc sera, and detected with rhodamine red- and FITC-conjugated secondary antibodies, respectively. An imageat the excitation wavelength corresponding to each fluorochrome was collected using a laser confocal microscope in the dual channel mode(X = 488 nm for FITC and 568 nm for rhodamine red). Images were digitized and merged, assigned pseudocolors denoting rhodamine red (red)and FITC (green), and contrast stretched using the Bio-Rad Cosmos imaging program. RS5 is shown labeling the periphery of sieve elements(red), and anti-c-Myc is shown labeling the periphery of adjacent companion cells (green). (A) to (C) are at half the magnification of (D). Bar =10 nm and shows location of phloem.
observation reflects a passive role in establishing the protonmotive force that drives the sucrose carriers that mediatephloem loading. It is perhaps unsurprising that this highlyspecialized ancillary cell type, which is devoid of organellessuch as nuclei and Golgi complexes, has relinquished its rolein active membrane transport and serves simply as a conduit,as its streamlined morphology implies. Because of the highspeed and volume with which solutes flow through the sievetube, the H+-ATPases' requirement for high levels of ATP mayhave necessitated their partitioning into companion cells, where
ATP can accumulate without being swept away in the trans-port stream.
It may be important to note that due to extensive plasmodes-mata connections (Evert, 1990; Lucas and Wolf, 1993) betweenthe companion cell and sieve tube elements, a highly nega-tive electric potential generated by the proton pump in thecompanion cell would be instantaneously transferred to thesieve tube cell. Hence, although the sieve element plasmamembrane may be devoid of ATPase, it could neverthelessmaintain a high electric potential and thus be capable of driving

Companion Cell-Specific H+-ATPase 2063
the influx of sugars directly from the apoplast without a con- tribution from the companion cell (see Figure 10). Studies localizing the proton-coupled sugar carriers, similar to those performed in this study with the ATPase protein, are needed to test this idea. In a recent study using a monospecific poly- clonal antibody, one isoform of the gene family encoding the plasma membrane sucrose carrier was immunocytochemically localized in companion cells, but not sieve elements, within the phloem of petioles from Planfago major(Stadler et al., 1995). It remains to be established whether other isoforms of the su- crose carrier gene family are similarly absent from sieve elements.
lmmunolocalization approaches avoid potential artifacts in- herent with P-glucuronidase/promoter fusion studies (Plegt and Bino, 1989; Mascarenhas and Hamilton, 1992; Uknes et al., 1993) and offer improved resolution of localizations in cellular and subcellular compartments. However, high levels of amino acid homology between AHA isoproteins have impeded gener- ation of specific antibodies for localization studies. At least 10
cc sucrose H+TF-
Y H + 4
sucrose
I H + sucrose
SE
i _ _ _ _ _
=I= sucrose H + e:+ I
I sucrose
sucrose T H+ Figure 10. Model of Transport Functions Partitioned between Cells within the Phloem during Apoplastic Loading.
AHA3 proteins (closed circles) in the companion cell plasma mem- brane pump consume ATP and pump protons out of the cell, generating a H+ chemical gradient and an electric potential (ul). This elec- trochemical gradient in turn is used by sucrose transporters (open circles) to load sucrose into the companion cell (CC)-sieve element (SE) complex. For longdistance transport via the sieve elements, su- crose either moves first into the companion cell and is then passively transferred through plasmodesmata (denoted by bidirectional arrow traversing the two cell types) to the sieve elements or is moved directly across the plasma membrane of sieve elements. The results of our study indicate that the proton pump is partitioned mainly in the plasma membrane of companion cells, with little or no pump present in the plasma membrane of sieve elements. The location of sucrose carriers shown in this diagram is uncertain because it has not yet been ex- perimentally established for all members of the sucrose carrier gene family (Stadler et al., 1995).
Arabidopsis H+-ATPase isoforms exist (Harper et al., 1994), and to date, only five of those have been fully cloned and se- quenced. Until the complete sequence of the remaining isoforms is available, it is difficult to ensure the design of AHA3- specific antisera. Moreover, potentially isoform-specific antisera cannot be tested for cross-reactivity with the other isoforms until full-length clones are available.
There are severa1 advantages to using epitope tagging as a means of unambiguously determining the cellular and sub- cellular location of AHA3. First, epitope tagging added only 16 (904 construct) or 22 (944 construct) amino acids, which likely had minimal impact on transcriptional, translational, and post-translational regulation. As a precaution, AHA3 was tagged at two positions, and the consistency of cellular local- ization was confirmed in multiple transgenic lines expressing both constructs. Second, tagging all AHAs with c-Myc will pro- vide a standard for future localization studies and will eliminate variations in antisera affinities. Third, specificity of labeling was unambiguously confirmed using untransformed wild-type tis- sue as a genetically negative control.
The role for multiple plant plasma membrane H+-ATPase isoproteins is unknown. One explanation is that the different genes encoding these isoproteins have evolved genetic con- trol mechanisms for independently modulating levels of H+-ATPase protein during differentiation. For example, the promoter for one isoform might contain the transcription ma- chinery to specify extremely high levels of H+-ATPase expression needed for guard cell function but not the low lev- els needed in adjacent epidermal cells. Another explanation for multigene families is that different AHA isoproteins pos- sess regulatory or kinetic differences and are uniquely suited to the physiological needs of various tissues. This latter pos- sibility was recently supported by evidence for differences in the kinetic and regulatory properties of AHAl, AHAP, and AHA3 isoproteins expressed in yeast (Palmgren and Christensen, 1994).
In conclusion, this study indicates that AHA3 is specifically expressed in the plasma membrane of phloem companion cells. Overall H+-ATPase content in different cell types ap- pears to vary, depending on the cell's transport activity, whereas AHA3 expression is always restricted to companion cells and seems unaffected by the physiological and developmental de- mands of surrounding tissue. For example, AHA3 expression in fully expanded leaves, which are specialized for massive photoassimilate export, was not appreciably higher than in stems, which, as essentially nonphotosynthetic tissues, are not expected to be similarly engaged.
Now that the specific localization of AHA3-c-Myc in compan- ion cell plasma membrane has been determined, subcellular fractionation may provide a means of separating vesicles con- taining AHA3-c-Myc from other cellular membranes, thus isolating companion cell plasma membranes from heteroge- neous membrane preparations. For example, immunological affinity purification procedures could be used to isolate com- panion cell plasma membrane vesicles containing AHA3-

2064 The Plant Cell
c-Myc, which could then be used to identify companion cell-specific membrane proteins and biochemical activities. In addition, epitope tagging other AHA gene isoforms ex- pressed in a variety of cell types could help to identify plasma membrane vesicle populations from different cell types, thus clarifying a source of ambiguity and heterogeneity in mem- brane fractionation and biochemical analyses. Extending this analysis to other transport proteins will provide valuable tools for dissecting and analyzing functionally distinct membrane transport proteins that were previously indistinguishable using biochemical and immunocytochemical approaches. Assign- ing these biochemical activities to cells within the plant will provide a coherent view of plant transport that integrates mem- brane transport functions with cellular architecture.
METHODS
Construction of AHAB Plasmids and Site-Directed Mutagenesis
The DNA clone LgAHA3-6, which contains Arabidopsis H+-ATPase isoform 3 (AHA3) genomic sequences, was described by Harper et al. (1990). The genomic interval containing AHA3 spans -12 kb and was subcloned in two pieces into pBluescript SK- (Stratagene, LaJolla, CA). The plasmid containing the 9-kb Spel fragment (4 kb of 5‘flank- ing sequences and 5 kb of genomic coding sequences) was designated pgAHA3S. The plasmid containing the 3-kb Xbal-Sal1 fragment (3’end of the coding region and 2.3 kb of 3’ flanking sequences) was desig- nated pgAHA3-3’SX. 5’ and 3’flanking and coding sequences of AHA3 were cloned into
the plant expression vector pBIN19 (Bevan, 1984) in multiple steps. First, the 4.4-kb Xbal-Sal1 fragment from pgAHA3-3’SX was cloned into the Xbal-Sal1 sites of pBIN19. The resulting plasmid was designated pBIN3XS. The 2.4-kb Spel-Xbal fragment of this plasmid was replaced with the 9-kb Spel fragment from pgAHA3S. The resulting plasmid, pBIN:3S, contained -12 kb of AHABgenomic sequence, including all coding sequences and 5‘and 3’flanking sequences. This plasmid was later used to introduce the epitope tags into theAHA3 coding sequence and for Arabidopsis transformation.
A Clal deletion of pgAHA3S was generated, leaving the 2.7-kb 3‘ portion of the clone. This fragment, designated pSSCla, was used for site-directed mutagenesis to introduce BamHl sites at nucleotide po- sitions 5180 and 5370, using the dut- ung- method (Kunkel et al., 1987). The degenerate mutagenesis oligonucleotides 2BM 903 (ATCT- CAGGATCCTCTCTGTAAC[C/T][A/T]CCT) and 2BM 944 (GTGGGG- ATCCG[C/G][T/A]GT[T/C/A]TCAATGTC) contained nucleotide substitu- tions to introduce BamHl sites at nucleotides encoding amino acids 904 and 944, respectively (degenerate nucleotides are indicated by parentheses). Using reagents in the Muta-Gene Phagemid In Vitm Muta- genesis Kit v.2 (Bio-Rad), single-stranded DNA templates of the p3SCla clone were prepared from a dut- ung- RZ1032 strain followed by su- perinfection by M13K07 helper phage. Oligonucleotides 2BM903 and 2BM944 were phosphorylated and annealed to the single-stranded template. T7 DNA polymerase was used to prime synthesis of the com- plementary strand from the mutagenesis primers, and the plasmid was circularized with T4 DNA ligase. Mutant plasmids containing the new BamHl sites were then propagated and designated p3SCla-904 and p3SCla-944.
Construction of c-Myc-Tagged AHAB Clones
Single-stranded complementary oligonucleotides for the c-Myc epi- tope (coding strand, 5’-AAGGATCCTCCGGAGCAAAAGCTTATCAGT- GAG-3’; noncoding strand, 5‘-GAAGCTATAGCAACTGCTTCTCTCAT- AGA-39 were annealed, and complementary strands were synthesized with Klenow. The double-stranded primers were phenol-chloroform extracted, ethanol precipitated, digested with BamHl and Bgll, and ligated into the BamHl site of p3SCla-904 and p3SCla-944 (introduced by site-directed mutagenesis as described above). Clones were se- quenced to confirm correct orientation and fusion sequences. Sequencing revealed that all944 clones were missing two nucleotides, which resulted in the loss of the termination codon, changed the last two amino acids, and added three amino acids to the end &e., planned sequence, CTAGATCCCCACACCGTTTAATAA; observed sequence with deletion, CTAGATCCCCACCGTTTAATAAATATTTAA; deleted nucleotides are underlined, stop codons are in bold).
The 904 clones were sequenced from a Pmll site (nucleotide 4542) to a Hpal site (nucleotide 5270), and 944 clones were sequenced from a Hpal site (nucleotide 5270) to an Spel site (nucleotide 5719) to con- firm that there were no errors introduced by the site-directed mutagenesis procedure. The 904 clones’ Hpal-Pmll fragment and the 944 clones’ Hpal-Spel fragment, each containing epitope tag se- quences, were then cloned back into parenta1 p3SCla, replacing the native sequences.
Sequences at the fusion sites are as follows, with native AHA3 se- quences in italics, BamHl and BamHI-Bglll sites underlined, and c-Myc epitope sequences in bold: 904 AHA3-myc, GGT GGT TAC AGA GAG GAT CCT CCG GAG CAA AAG CTTATC AGT GAG GAA GAC TTGCTAGATCCTGAGATE 944AHA3-myc, GACATTGAGACA GCG -- GAT CCT CCG GAG CAA AAG CTTATC AGT GAG GAA GAC TTG CTA GAT CCC CAC CGT TTAATA AAG ATT.
For the final construction, the Clal-Spel fragments, now containing the epitope tags, were cloned into pBIN:gAHA3, which had been lin- earized with Spel, then partiallydigested with Clal, thus replacing the native sequences spanning the Clal-Spel sites with ones containing epitope tags. To confirm that sites had not been deleted during this procedure, the native pBIN19 and pgAHA3S clones were digested with the various four base cutters and electrophoretically analyzed to ac- count for all fragments. Agrobacterium and Arabidopsis transformations were conducted as described by DeWitt et al. (1991).
Antibodies
Anti-H+-ATPase polyclonal antibodies were generated against a fu- sion protein of the AHAP C terminus and glutathione Stransferase protein (N.D. DeWitt, M.R. Sussman, and J.F. Harper, unpublished data). Antisera for immunolocalizations were precleared against glutathione S-transferase. Monoclonal RS5 (anti-p-amylase, IgM) was the kind gift of R . Sjolund (University of lowa, lowa City). Anti-c-Myc monoclonal 9E10.2 was obtained from Oncogene Science (Manhasset, NY). Sources of fluorochrome-conjugated secondary antibodies were as follows: rabbit anti-mouse IgG, fluorescein, Cappell (Durham, NC); goat anti-mouse lgGl rhodamine red, Southern Biotechnology As- sociates (Birmingham, AL); goat anti-rabbit IgG fluorescein, Cappell; affinity-purified goat anti-mouse IgM fluorescein, Cappell; and goat anti-mouse IgM rhodamine, Sigma.

Companion Cell-Specific H+-ATPase 2065
Microsomal Protein Preparation for lmmunoblot
All manipulations were conducted on ice or in a cold room, with prechilled buffers. Arabidopsis plants were grown under continuous light on solid Murashige and Skoog media (Sigma) containing kanamy- cin (50 mg/mL) or no kanamycin for wild-type control plants. Whole plants were frozen'in liquid nitrogen and then ground in a mortar with a pestle. Extraction buffer containing 290 mM sucrose, 25 mM EDTA, 250 mM Tris, pH 8.5, 2 mM phenylmethyl sulfonyl fluoride, and 76 mM P-mercaptoethanol was added to ground tissue (2 mL/g wet weight). Tissue was homogenized with five passes of a Teflon (Du Pont) glass homogenizer, and the homogenate was spun for 5 sec in a microcen- trifuge to remove cell wall material and large debris. After repeating this step once, supernatant was transferred to a fresh tube and cen- trifuged for 1 hr. The microsomal pellet was suspended in fresh extraction buffer, and protein concentrations were determined (Lowry et al., 1951).
lmmunoblotting
Samples were solubilized by incubating for 15 min at 25OC in 3 x solubilization buffer (100 mM Tris, pH 6.8, 3.7% [w/v] SDS, 5% [w/v] DTT, 20% [w/v] sucrose, 0.3% [w/v] bromphenol blue). After separat- ing proteins by SDS-PAGE on 8% (wlv) (for anti-H+-ATPase blot) or 6% (wlv) (for 9E10.2 blot) acrylamide gels, proteins were transferred to Immobilon-P polyvinylidene difluoride membranes (Millipore), using a Hoefer Transphor apparatus (Hoefer Scientific Instruments, San Fran- cisco, CA), at 500 mA for 12 hr, at 4%. Transfer buffer consisted of 192 mM glycine, 25 mM Tris-base, and 0.02% (w/v) SDS.
The blot was blocked overnight in 20 mM Tris, pH 7.6, 137 mM NaCI, 0.1% (v/v) Tween 20 (TBS-T) with 5% (w/v) nonfat dry milk. Primary antiserum dilutions were as follows: anti-H+-ATPase CTF, 1:2000; and anti-c-Myc 9E10.2, 1:2000. For 9E10.2 immunoblots, an intermediate antiserum incubation step was included: rabbit anti-mouse IgG, 1:2000; 1-hr incubation, followed by four washes for 15 min each in TBS-T. Goat anti-rabbit horseradish peroxidase-conjugated secondary antibody (Amersham) was diluted to 1:2000 in blocking buffer. Primary and sec- ondary incubations were for 1 hr at room temperature and were followed by four washes for 15 min each in TBS-T. ECL chemiluminescent re- agents (Amersham) were used for detection.
lndirect lmmunofluorescence
Stem sections ( 4 0 0 to 500 pm) were handcut using Teflon (Du Pont) razor blades (Ted Pella, Redding, CA). Sections were either used im- mediately or fixed for 1 hr in 4% (w/v) paraformaldehyde and 50 mM sodium phosphate, pH 7.2. Rosette leaves were embedded in TFM freezing medium (Fisher Scientific) and frozen with Histo-Freeze 22 aerosol spray (Fisher Scientific). Eight-micron sections were cut with a cryostat, collected on poly-L-lysine-coated slides, and stored at 4OC. Before immunostaining, slides containing leaf sections were incubated for 5 min in PBS to remove freezing medium.
Sections were blocked for 45 min in 2.5% (w/v) nonfat dry milk, 10% (v/v) normal serum in PBS. Dry milk solution was warmed to 60% and centrifuged before use. Blocking serum was from the animal species that produced secondary antibody. For immunofluorescence, antibodies were diluted in blocking buffer at the following concentrations: 9E10.2, 1:5; H+-ATPase polyclonal, 1:20; and RS5, 1:lOOO. Sections were in- cubated for 1 hr in primary antisera diluted in blocking buffer, then
washed three times for 15 min each in PBS. Secondary antisera were diluted in blocking buffer at 1:lOO. Sections were incubated in diluted secondary antibodies for 1 hr, followed by three washes for 15 min each in PBS.
lmmunostained sections were mounted in 90% (v/v) glycerol, 10% (v/v) PBS, containing 0.2% (w/v) p-phenyldiamine to prevent pho- tobleaching. For epifluorescent microscopy, samples were observed on an inverted microscope (Nikon, Melville, NY), using fluorescein isothiocyanate (FITC), rhodamine red, or double FITChhodamine red filters (Fryer Company, Huntley, IL). Some samples were also exam- ined for immunofluorescence using a laser scanning confocal microscope (model MRC-600; Bio-Rad) equipped with a filter for reduc- ing chloroplast autofluorescence (SWP filter 935; Reynard Enterprises, Laguna Niguel, CA).
Controls for lmmunofluorescence Labeling Specificity
As controls for polyclonal anti-H+-ATPase labeling, sections were incubated with preimmune sera (cleared against glutathione S-trans- ferase) and with secondary antibodies alone. As controls for 9E10.2 labeling, antibody incubations were performed simultaneously on sec- tions from untransformed control plants. For epifluorescent and confocal double-labeling experiments, absence of signal bleed-through was confirmed by examining single-labeled samples using individual wave- length filters.
Tissue Preparation for Standard Electron Microscopy
Arabidopsis thaliana (ecotype Bensheim) was grown in pots for 8-hr day lengths. Rosette leaves and bolting stems were submerged in 100 mM sodium phosphate buffer, pH 7, and cut into 4-mm-wide pieces. Tissue was fixed in 3% (v/v) glutaraldehyde, 100 mM sodium phos- phate, pH 7, for 4 hr, and then washed four times for 15 min each in 100 mM sodium phosphate, pH 7, and postfixed in 1% (v/v) OsO, over- night at 4OC. After three washes of 5 min each in 100 mM sodium phosphate, pH 7, tissue was dehydrated through an acetone series (10,30,50,70, and 90%) for 15 min each, followed by two washes with 100% acetone for 30 min each. Tissue was infiltrated with Spurr's resin as follows: 1:2 Spurr's, acetone, overnight; 2:l Spurr's, acetone, 2 hr; and 100% Spurr's, three times for 2 hr each. Tissue was placed in freshly mixed Spurr's resin and cured in a vacuum oven at 7OoC over- night. Silver-gold sections were collected on Formvar-coated slot grids or uncoated copper grids. Sections were poststained with 2% (w/v) uranyl acetate (aqueous) for 30 min at P C , followed by alkaline lead citrate for 10 min at room temperature. Specimens were observed with an electron microscope (Model 410; Philips Electronic Instruments, Mahwah, NJ).
Tissue Preparation for lmmunogold Labeling
A. tbaliana (ecotype Bensheim) was grown in pots for 8-hr daylengths. Bolting stems from 3- to 6-week-old plants were submerged in 50 mM phosphate buffer, pH 7, and cut into 4-mm-wide pieces. Tissue was fixed in 4% (w/v) paraformaldehyde, 100 mM sodium phosphate, pH 7, for 4 hr, then washed four times for 15 min each in 100 mM sodium phosphate, pH 7. Tissue was then dehydrated through an ethanol se- ries: 30, 50, 70, and 90%, then two times with 100% ethanol for 15 min each. The 30% ethanol was at 4OC, and all other steps were at

2066 The Plant Cell
-2OOC. Tissue was then infiltrated with Lowicryl, also at -2OOC: 1:l ethanol, Lowicryl; 1:2 ethanol, Lowicryl; and 100% Lowicryl. Samples were kept in 100% Lowicryl for 5 days, changing to fresh resin each day. Resin was polymerized with UV light for 2 days at -2OOC and then for 1 day at room temperature. Silver-gold sections were collected on Formvar-coated nickel grids and immunolabeled.
lmmunogold Labeling
Nonspecific binding sites were blocked for 15 min with 5% (w/v) non- fat dry milk, O.lO/o (w/v) BSA, in TBST (20 mM Tris, pH 7,500 mM NaCI, 0.5% [v/v] Tween 20) and then for 15 min with 5% (v/v) normal goat serum in TBSTween. Polyclonal anti-H+-ATPase immune and preim- mune sera (cleared) were diluted 130 in 5% goat serum/TBST and incubated overnight at 4OC. Grids were washed in TBS-T five times for 5 min each. Grids were then incubated for 1 hr in goat anti-rabbit IgG-15-nm gold conjugate (Ted Pella), diluted 1:25 in 5% (v/v) goat serum in TBST Grids were washed two times for 5 min each in TBS-T and three times for 5 min each in double-distilled H20. Sections were poststained in 2% (w/v) uranyl acetate for 30 min at 37T and observed with a Philips 410 electron microscope.
ACKNOWLEDGMENTS
We thank Dr. Richard Sjolund for help with immunofluorescence and Dr. Ray Evert for assistance in identifying phloem cell types and use of his microscopic facilities. We are grateful to Dr. Bill Russin and Renate Bromberg for training in electron microscopy; to Dr. Jeffrey F. Harper for the degenerate mutagenesis primers; and to Dr. Jeffrey Young, Dr. Fernando Camilo, and Jennifer Gottwald for critical reading of the manu- script. This research was supported by grants from the Department of Energy/National Science FoundationlUnited States Department of Agriculture Collaborative Program in Plant Biology (No. BIR 92-20331) and from the Department of Energy (No. DE-F602-88ER13938).
Received July 7, 1995; accepted October 9, 1995.
REFERENCES
Bevan, M. (1984). Binary Agrobacferium vectors for plant transforma- tion. Nucleic Acids Res. 12, 8711-8721.
Bouche-Pillon, S., Fleurat-Lessard, P., Fromont, J.-C., Serrano, R., and Bonnemain, J.-L. (1994). lmmunolocalization of the plasma membrane H+-ATPase in minor veins of Vicia faba in relation to phloem loading. Plant Physiol. 105, 691-697.
Boutry, M., Michelet, B., and Goffeau, A. (1989). Molecular cloning of a family of plant genes encoding a protein homologous to plasma membrane H+-translocating ATPases. Biochem. Biophys. Res. Commun. 162, 567-574.
Bush, D.R. (1993). Proton-coupled sugar and amino acid transporters in plants. Annu. Rev. Plant Physiol. Plant MOI. Biol. 44, 513-542.
DeWitt, N.D. (1994). Epitope Tagging and Reporter Gene Studies Iden- tify an Arabidopsis Plasma Membrane Proton Pump Specific for
Phloem Companion Cells. PhD dissertation (Madison, WI: Univer- sity of Wisconsin).
DeWitt, N.D., Harper, J.F., and Sussman, M.R. (1991). Evidence for a plasma membrane proton pump in phloem cells of higher plants. Plant J. 1, 121-128.
Evert, R.F. (1990). Dicotyledons. In Sieve Elements-Comparative Structure, Induction, and Development, H.-D. Behnke and R.D. Sjolund, eds (Berlin: Springer-Verlag). pp. 103-137.
Ewing, N.N., and Bennett, A.B. (1994). Assessment of the number and expression of P-type H+-ATPase genes in tomato. Plant Phys- iol. 106, 547-557.
Ewing, N.N., Wimmers, L.E., Meyer, D.J., Chetelat, R.T., and Bennett, A.B. (1990). Molecular cloning of tomato plasma mem- brane H+-ATPase. Plant Physiol. 94, 1874-1881.
Harper, J.F., Surowy, T.K., and Sussman, M.R. (1989). Molecular cloning and sequence of cDNA encoding the plasma membrane proton pump (H+-ATPase) of Arabidopsis thaliana. Proc. Natl. Acad. Sci. USA 86, 1234-1238.
Harper, J.F., Manney, L., DeWitt, N.D., Yoo, M.H., and Sussman, M.R. (1990). The Arabidopsis fhaliana plasma membrane H(+)- ATPase multigene family: Genomic sequence and expression of a third isoform. J. Biol. Chem. 265, 13601-13608.
Harper, J.F., Manney, L., and Sussman, M.R. (1994). Evidence for at least ten plasma membrane H+-ATPase genes in Arabidopsis, and complete genomic sequence of AHAIO which is expressed pri- marily in developing seeds. MOI. Gen. Genet. 244, 572-587.
Houlné, G., and Boutry, M. (1994). ldentification of an Arabidopsis fhaliana gene encoding a plasma membrane H+-ATPase whose ex- pression is restricted to anther tissue. Plant J. 5, 311-317.
Katr, D.B., Sussman, M.R., Mierzwa, R.J., and Evert, R.F. (1988). Cytochemical localization of ATPase activity in oat roots localizes a plasma membrane-associated soluble phosphatase, not a pro- ton pump. Plant Physiol. 86, 841-847.
Kolodziej, I?, and Young, R.A. (1991). Epitope tagging and protein surveillance. Methods Enzymol. 194, 508-519.
Kunkel, T.A., Roberts, J.D., and Zakour, R.A. (1987). Rapid and effi- cient site-specific mutagenesis without phenotypic selection. Methods Enzymol. 154, 367-382.
Lowry, O.H., Rosebrough, N.J., Farr, A., and Randall, R.J. (1951). Protein measurement with the Folin phenol reagent. J. Biol. Chem. 193, 265-275.
Lucas, W.J., and Wolf, S. (1993). Plasmodesmata: The intercellular organelles of green plants. Trends Cell Biol. 3, 308-315.
Mascarenhas, J.P., and Hamilton, D.A. (1992). Artifacts in the local- ization of GUS activity in anthers of petunia transformed with a CaMV 3%-GUS construct. Plant J. 2, 405-408.
Monk, B.C., Montesinos, C., Ferguson, C , Leonard, K., and Serrano, R. (1991). lmmunological approaches to the transmembrane topol- ogy and conformational changes of the carboxyl-terminal regulatory domain of yeast plasma membrane Hf-ATPase. J. Biol. Chem. 266,
Obermeyer, G., Liitzelschwab, M., Heumann, H.G., and Weisenseel, M.H. (1992). lmmunolocalization of H+-ATPases in the plasma membrane of pollen grains and pollen tubes of Lilium longiflorum. Protoplasma In, 55-63.
Palmgren, M.G., and Christensen, G. (1993). Complementation in situ of the yeast plasma membrane H+-ATPase pmal by an H+-ATPase gene from a heterologous species. FEBS Lett. 317, 216-222.
18097-18103.

Companion Cell-Specific H+-ATPase 2067
Palmgren, M.G., and Christensen, G. (1994). Functional compari- sons between plant plasma membrane H+-ATPase isoforms expressed in yeast. J. Biol. Chem. 269, 3027-3033.
Pardo, J.M., and Serrano, R. (1989). Structure of a plasma membrane H+-ATPase gene from the plant Arabidopsis thaliana. J. Biol. Chem.
Parets-Soler, A., Pardo, J.M., and Serrano, R. (1990). Im- munocytolocalization of plasma membrane H+-ATPase. Plant Physiol. 93, 1654-1658.
Plegt, L., and Bino, R.J. (1989). PGlucuronidase activity during development of the male gametophyte from transgenic and non- transgenic plants. MOI. Gen. Genet. 216, 321-327.
Samuels, A.L., Fernando, M., and Glass, D.M. (1992). Immunofluo- rescent localization of plasma membrane H+-ATPase in barley roots and effects of K+ nutrition. Plant Physiol. 99, 1509-1514.
Serrano, R. (1989). Structure and function of plasma membrane ATPase. Annu. Rev. Plant Physiol. Plant MOI. Biol. 40, 61-94.
Serrano, R., Monk, B.C., Villalba, J.M., Montesinos, C., and Weiler, E.W. (1993). Epitope mapping and accessibility of immunodominant regions of yeast plasma membrane H+-ATPase. Eur. J. Biochem. 21 2, 737-744.
264, 8557-8562.
Stadler, R., Brandner, J., Schulz, A., Gahrtz, M., and Sauer, N. (1995). Phloem loading by the PmSUC2 sucrose carrier from Plan- tago major occurs into companion cells. Plant Cell 7, 1545-1554.
Stenz, H.-G., Heumann, H.-G., and Weisenseel, M.H. (1993). High concentration of plasma membrane H+-ATPase in root caps of Lepidium sativum L. Naturwissenschaften 80, 317-319.
Sussman, M.R. (1994). Molecular analysis of proteins in the plant plasma membrane. Annu. Rev. Plant Physiol. Plant MOI. Biol. 44, 253-281.
Uknes, S., Dincher, S., Friedrich, L., Negrotto, D., Williams, S., Thompson-Taylor, H., Potter, S., Ward, E., and Ryals, J. (1993). Regulation of pathogenesis-related protein-la gene expression in tobacco. Plant Cell 5, 159-169.
Villalba, J.M., Liitzelschwab, M., and Serrano, R. (1991). Im- munocytolocalization of plasma-membrane H+-ATPase in maize coleoptiles and enclosed leaves. Planta 185, 458-461.
Wang, O., Monroe, J., and Sjolund, R.D. (1995). ldentification and characterization of a phloem-specific P-amylase. Plant Physiol. 109, 743-750.

DOI 10.1105/tpc.7.12.2053 1995;7;2053-2067Plant Cell
N D DeWitt and M R Sussman(H(+)-ATPase) in phloem companion cells.
Immunocytological localization of an epitope-tagged plasma membrane proton pump
This information is current as of February 28, 2019
Permissions X
https://www.copyright.com/ccc/openurl.do?sid=pd_hw1532298X&issn=1532298X&WT.mc_id=pd_hw1532298
eTOCs http://www.plantcell.org/cgi/alerts/ctmain
Sign up for eTOCs at:
CiteTrack Alerts http://www.plantcell.org/cgi/alerts/ctmain
Sign up for CiteTrack Alerts at:
Subscription Information http://www.aspb.org/publications/subscriptions.cfm
is available at:Plant Physiology and The Plant CellSubscription Information for
ADVANCING THE SCIENCE OF PLANT BIOLOGY © American Society of Plant Biologists


![[1-3] Microsomal Lipid... · Chem.-Biol. Interactions, 50 (1984) 361-366 Elsevier Scientific Publishers Ireland Ltd. Short Communication 361 MICROSOMAL LIPID PEROXIDATION AND OXIDATIVE](https://img.pdfslide.net/doc/110x75/6089787ce01a1042bc238926/1-3-microsomal-lipid-chem-biol-interactions-50-1984-361-366-elsevier.jpg)