Embed Size (px)
Citation preview
LNG in Asia: At the Crossroads
Dr. Fereidun Fesharaki, Chairman FACTS Global Energy (FGE)
Singapore International Energy Week
Singapore October 25, 2012
The dissemination, distribution, or copying by any means whatsoever without FACTS Global Energy’s prior written consent is strictly prohibited.
2
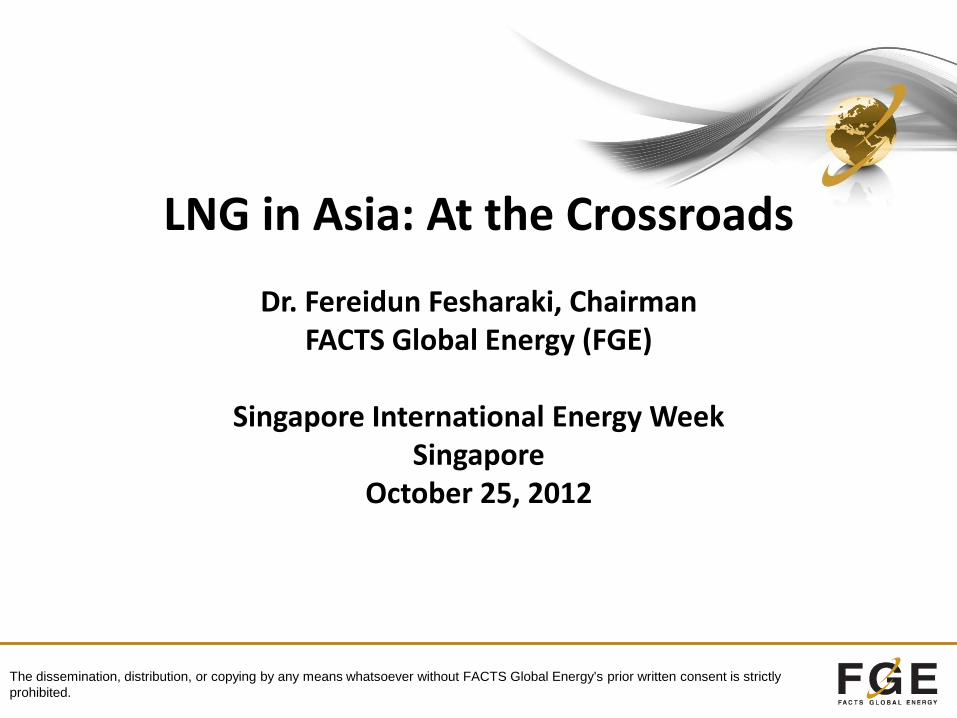
Longer-Term Oil Market: A Range to Consider
0
20
40
60
80
100
120
140
160
180
200Brent in US$/bbl
Brent Dated (US$/bbl) (Scenario 1)Brent Dated (US$/bbl) (Scenario 2)
Ceiling
US$100-130/bbl
Floor
US$80-100/bbl
3
0
25
50
75
100
125
150
175
200
225
250
275
2000 2001 2002 2003 2004 2005 2006 2007 2008 2009 2010 2011 2012
mm
t
Asia Europe Americas Middle East
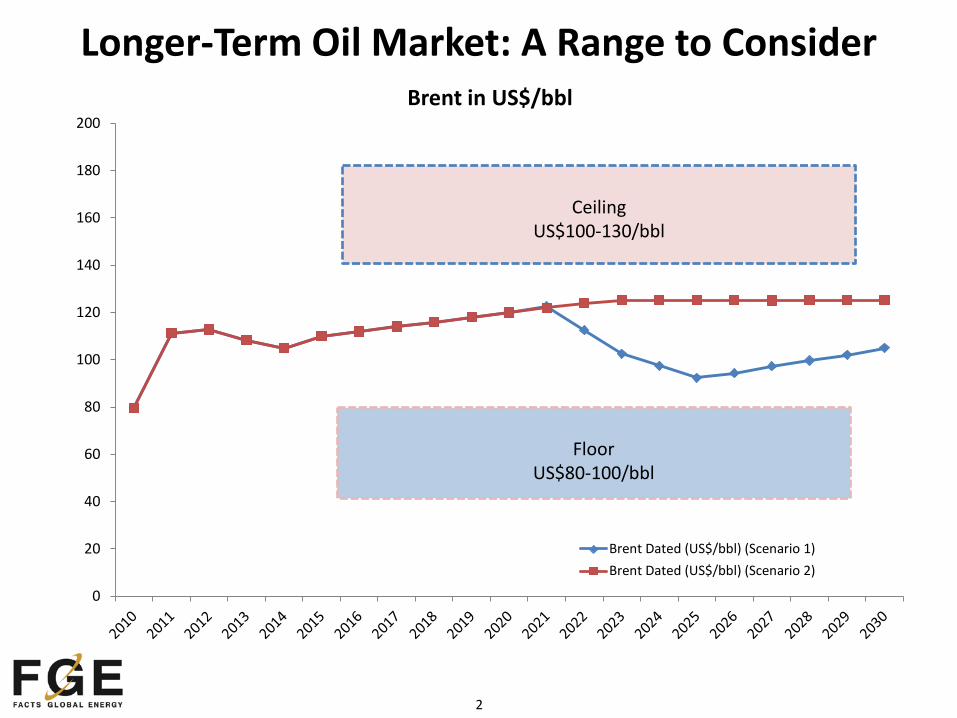
Global LNG Trade: 2000-2012 6%
Global LNG Trade: Asia is Still King
72%
23%
5%
2000
64%
27%
8% 1%
2011
Note: 2000-2011 data are actual, 2012 is forecast.

4
(8.0)
(6.0)
(4.0)
(2.0)
0.0
2.0
4.0
6.0
8.0
10.0
12.0
14.0
16.0
18.0
20.0
22.0
24.0
2006 2007 2008 2009 2010 2011 2012 2013 2014 2015 2020
mm
tpa
Asia Pacific LNG Imports by Country (Year-on-Year Change)
New Markets*
CN+IN
JKT
* Indonesia, Malaysia, Singapore, and Thailand.
New terminals and long-term contracts
startups
Longer-Term Outlook: Who Leads the Growth?
‘Shrinking’ demand
Recovery in LNG demand →↑
Industrial sector gas demand; cost competitiveness;
seasonality drivers
New terminals startups;
domestic gas supply deficits
Nuclear start-up aids in reducing growth
5
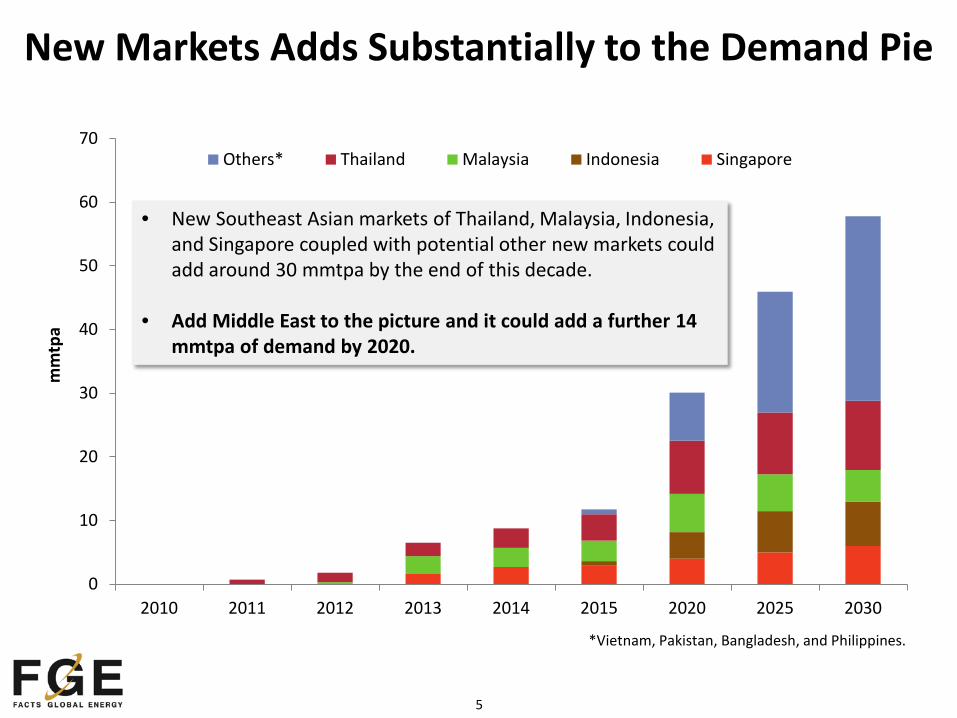
New Markets Adds Substantially to the Demand Pie
0
10
20
30
40
50
60
70
2010 2011 2012 2013 2014 2015 2020 2025 2030
mm
tpa
Others* Thailand Malaysia Indonesia Singapore
*Vietnam, Pakistan, Bangladesh, and Philippines.
• New Southeast Asian markets of Thailand, Malaysia, Indonesia, and Singapore coupled with potential other new markets could add around 30 mmtpa by the end of this decade.
• Add Middle East to the picture and it could add a further 14
mmtpa of demand by 2020.
6
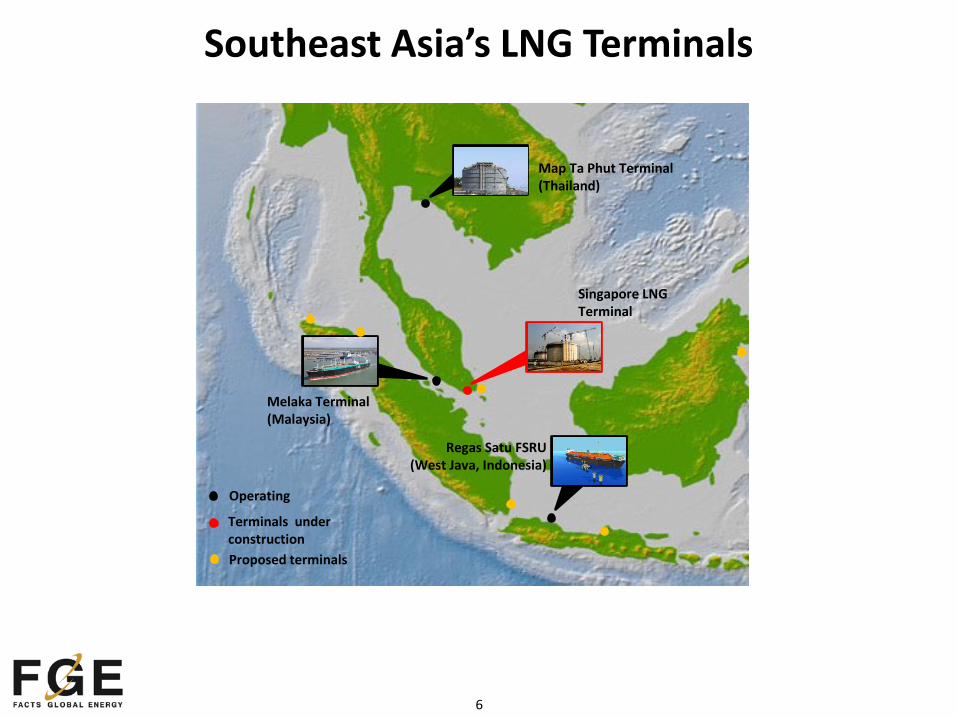
Southeast Asia’s LNG Terminals
Map Ta Phut Terminal (Thailand)
Melaka Terminal (Malaysia)
Singapore LNG Terminal
Regas Satu FSRU (West Java, Indonesia)
Terminals under construction Proposed terminals
Operating
7
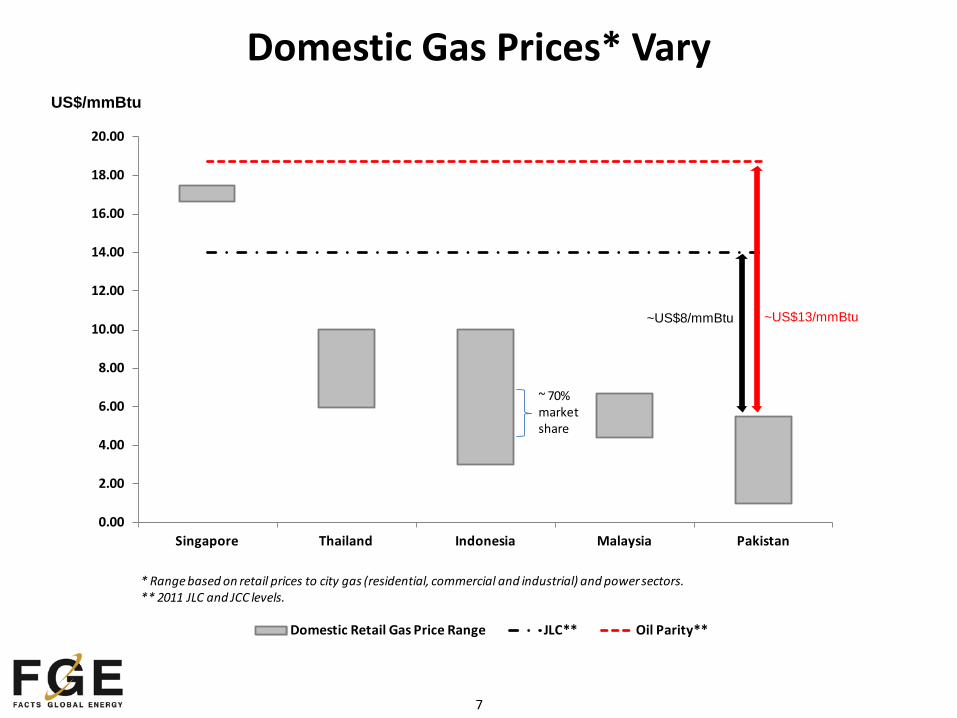
0.00
2.00
4.00
6.00
8.00
10.00
12.00
14.00
16.00
18.00
20.00
Singapore Thailand Indonesia Malaysia Pakistan
Domestic Retail Gas Price Range JLC** Oil Parity**
* Range based on retail prices to city gas (residential, commercial and industrial) and power sectors.** 2011 JLC and JCC levels.
$/mmBtu$/mmBtu
~ 70% market share
~US$8/mmBtu ~US$13/mmBtu
Domestic Gas Prices* Vary US$/mmBtu
8
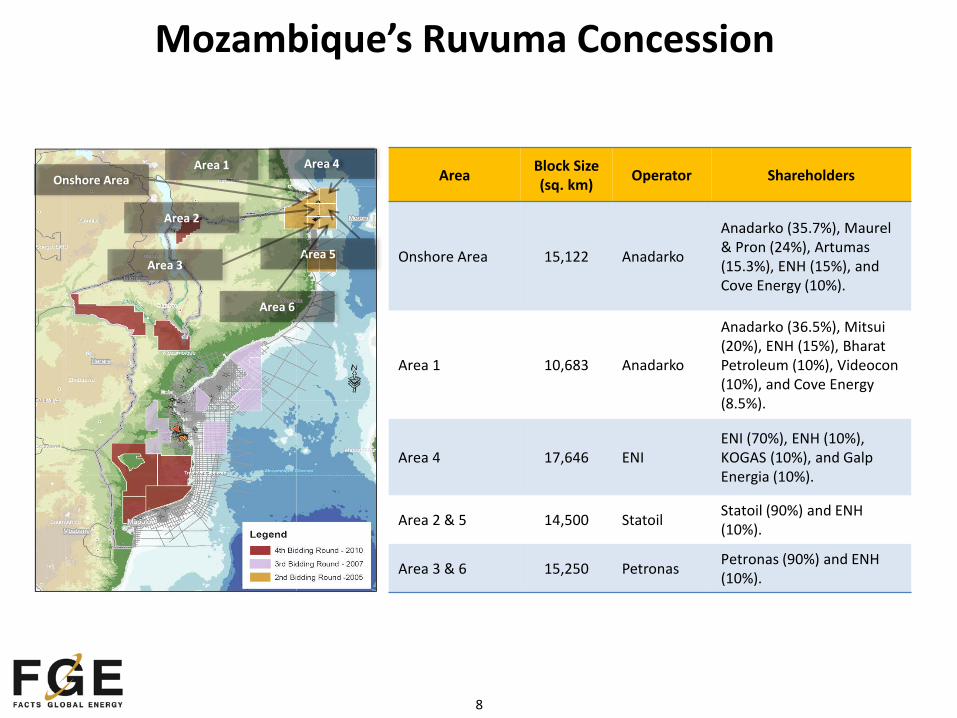
Mozambique’s Ruvuma Concession
Area Block Size (sq. km) Operator Shareholders
Onshore Area 15,122 Anadarko
Anadarko (35.7%), Maurel & Pron (24%), Artumas (15.3%), ENH (15%), and Cove Energy (10%).
Area 1 10,683 Anadarko
Anadarko (36.5%), Mitsui (20%), ENH (15%), Bharat Petroleum (10%), Videocon (10%), and Cove Energy (8.5%).
Area 4 17,646 ENI ENI (70%), ENH (10%), KOGAS (10%), and Galp Energia (10%).
Area 2 & 5 14,500 Statoil Statoil (90%) and ENH (10%).
Area 3 & 6 15,250 Petronas Petronas (90%) and ENH (10%).
Onshore Area Area 4
Area 5
Area 2
Area 3
Area 6
Area 1
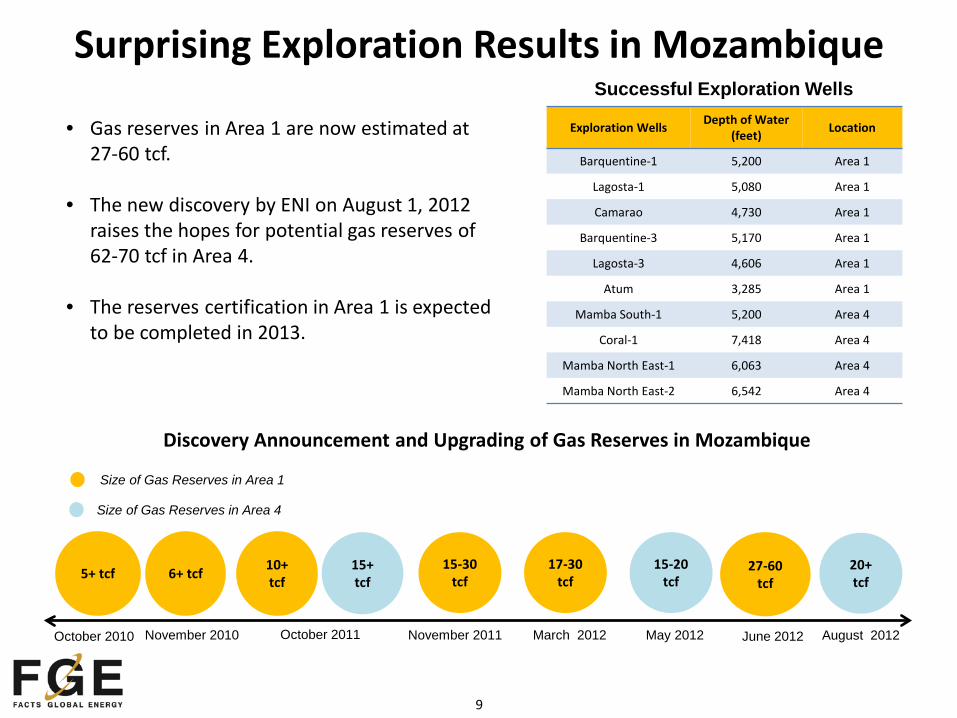
9
6+ tcf
October 2010 November 2010 October 2011 November 2011 March 2012 May 2012
Exploration Wells Depth of Water (feet) Location
Barquentine-1 5,200 Area 1
Lagosta-1 5,080 Area 1
Camarao 4,730 Area 1
Barquentine-3 5,170 Area 1
Lagosta-3 4,606 Area 1
Atum 3,285 Area 1
Mamba South-1 5,200 Area 4
Coral-1 7,418 Area 4
Mamba North East-1 6,063 Area 4
Mamba North East-2 6,542 Area 4
Successful Exploration Wells
Size of Gas Reserves in Area 1
Size of Gas Reserves in Area 4
5+ tcf 10+ tcf
15+ tcf
15-30 tcf
17-30 tcf
15-20 tcf
Discovery Announcement and Upgrading of Gas Reserves in Mozambique
• Gas reserves in Area 1 are now estimated at 27-60 tcf.
• The new discovery by ENI on August 1, 2012 raises the hopes for potential gas reserves of 62-70 tcf in Area 4.
• The reserves certification in Area 1 is expected to be completed in 2013.
Surprising Exploration Results in Mozambique
June 2012
27-60 tcf
August 2012
20+ tcf
10
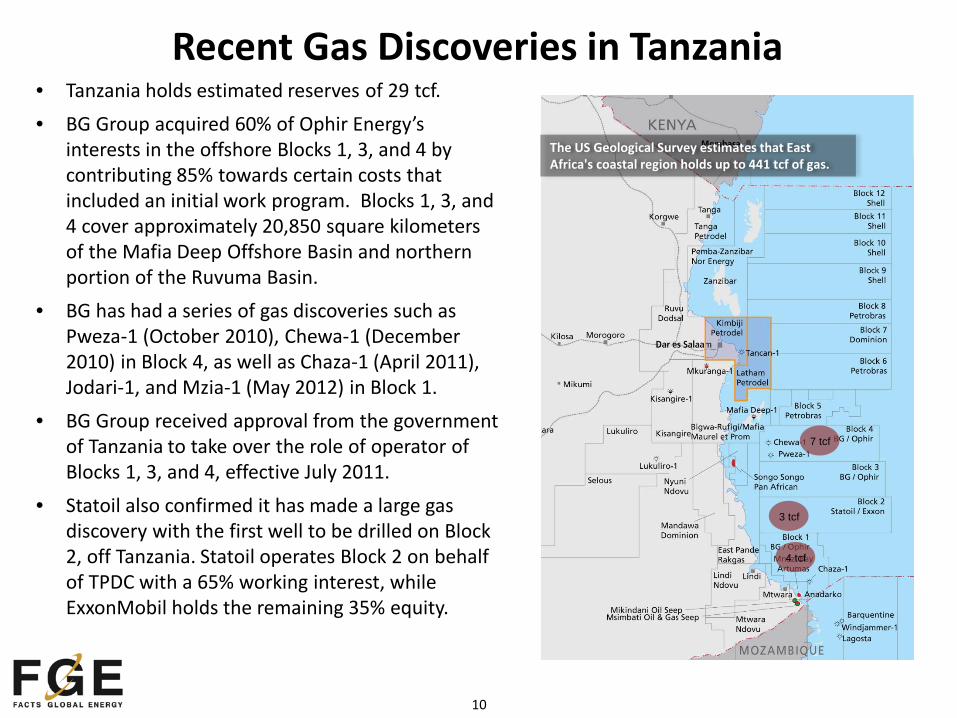
Recent Gas Discoveries in Tanzania • Tanzania holds estimated reserves of 29 tcf. • BG Group acquired 60% of Ophir Energy’s
interests in the offshore Blocks 1, 3, and 4 by contributing 85% towards certain costs that included an initial work program. Blocks 1, 3, and 4 cover approximately 20,850 square kilometers of the Mafia Deep Offshore Basin and northern portion of the Ruvuma Basin.
• BG has had a series of gas discoveries such as Pweza-1 (October 2010), Chewa-1 (December 2010) in Block 4, as well as Chaza-1 (April 2011), Jodari-1, and Mzia-1 (May 2012) in Block 1.
• BG Group received approval from the government of Tanzania to take over the role of operator of Blocks 1, 3, and 4, effective July 2011.
• Statoil also confirmed it has made a large gas discovery with the first well to be drilled on Block 2, off Tanzania. Statoil operates Block 2 on behalf of TPDC with a 65% working interest, while ExxonMobil holds the remaining 35% equity.
3 tcf
7 tcf
4 tcf
The US Geological Survey estimates that East Africa's coastal region holds up to 441 tcf of gas.
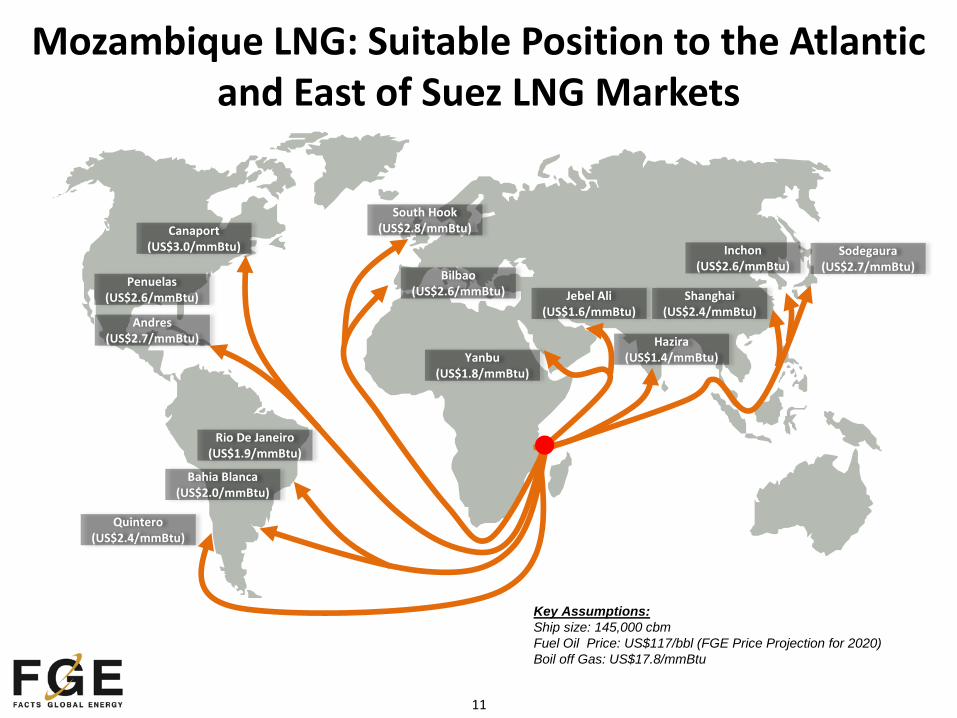
11
South Hook (US$2.8/mmBtu)
Bilbao (US$2.6/mmBtu)
Yanbu (US$1.8/mmBtu)
Jebel Ali (US$1.6/mmBtu)
Hazira (US$1.4/mmBtu)
Shanghai (US$2.4/mmBtu)
Sodegaura (US$2.7/mmBtu)
Inchon (US$2.6/mmBtu)
Key Assumptions: Ship size: 145,000 cbm Fuel Oil Price: US$117/bbl (FGE Price Projection for 2020) Boil off Gas: US$17.8/mmBtu
Mozambique LNG: Suitable Position to the Atlantic and East of Suez LNG Markets
Penuelas (US$2.6/mmBtu)
Andres (US$2.7/mmBtu)
Quintero (US$2.4/mmBtu)
Bahia Blanca (US$2.0/mmBtu)
Rio De Janeiro (US$1.9/mmBtu)
Canaport (US$3.0/mmBtu)
12
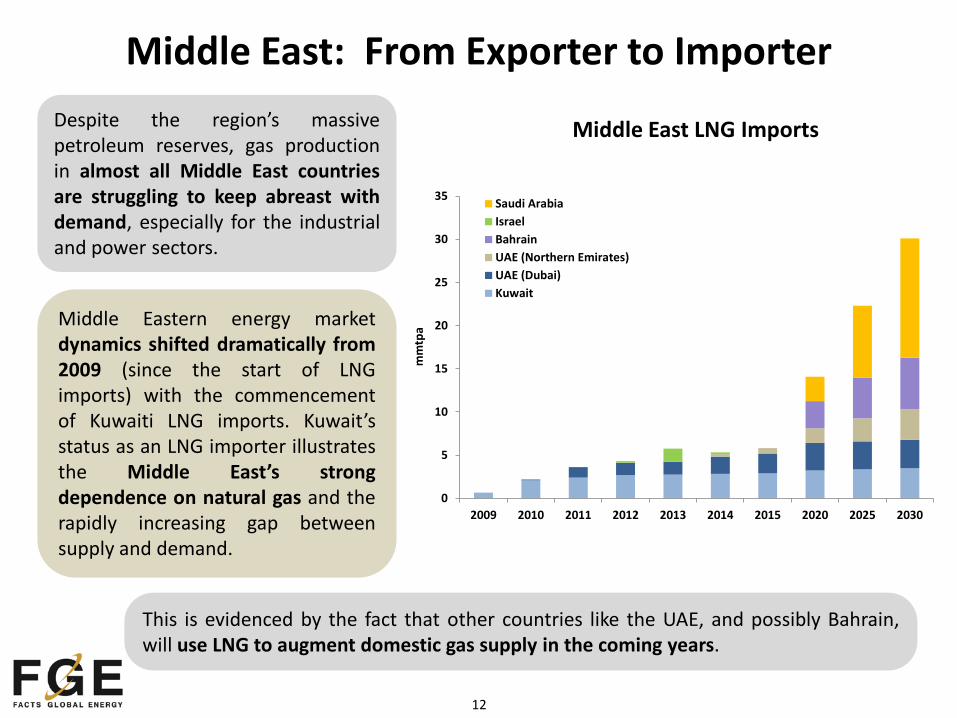
Middle East: From Exporter to Importer Despite the region’s massive petroleum reserves, gas production in almost all Middle East countries are struggling to keep abreast with demand, especially for the industrial and power sectors.
Middle East LNG Imports
Middle Eastern energy market dynamics shifted dramatically from 2009 (since the start of LNG imports) with the commencement of Kuwaiti LNG imports. Kuwait’s status as an LNG importer illustrates the Middle East’s strong dependence on natural gas and the rapidly increasing gap between supply and demand.
This is evidenced by the fact that other countries like the UAE, and possibly Bahrain, will use LNG to augment domestic gas supply in the coming years.
0
5
10
15
20
25
30
35
2009 2010 2011 2012 2013 2014 2015 2020 2025 2030
mm
tpa
Saudi ArabiaIsraelBahrainUAE (Northern Emirates)UAE (Dubai)Kuwait

13
US LNG: A Cost Effective Alternative?
More cost effective than other LNG import options.
More supply flexibility.
Benefits for Middle East Seasonal Buyers:
Potential US LNG Costs for the Middle East
14
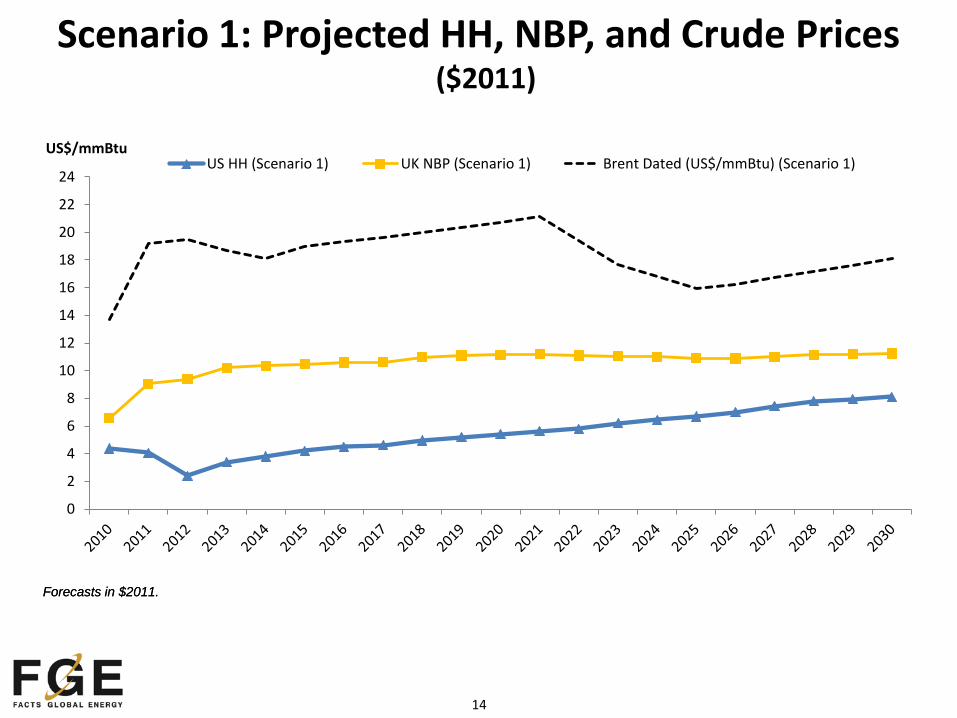
Scenario 1: Projected HH, NBP, and Crude Prices ($2011)
0
2
4
6
8
10
12
14
16
18
20
22
24
US$/mmBtu US HH (Scenario 1) UK NBP (Scenario 1) Brent Dated (US$/mmBtu) (Scenario 1)
Forecasts in $2011. Forecasts in $2011.

15
• Used by Qataris and others with global portfolios • Buyers need mid-term volumes until next rush of supply • Sellers want to lock away long-term demand • Tranche pricing
Buy Long-Term Higher, Get Mid-Term Lower
Now 2016
2016 ------- 2035
Mid-term = lower price
Long-term = higher price

16
Asian Contracts Evolution
0
5
10
15
20
25
10 20 30 40 50 60 70 80 90 100 110 120 130 140 150
US$
/mm
Btu
US$/bbl
2002: NWS to Guangdong 2008: Qatargas to PetroChina 2009: PNG LNG to TEPCO
2011 Pre-Disaster Negotiations 2011 Post-Disaster Negotiations
17
Soft Market Expected to Emerge Later This Decade Through 2030 (Potential Pressure Points?)
100
150
200
250
300
350
400
2012 2013 2014 2015 2016 2017 2018 2019 2020 2025 2030
mm
tpa
Potential Canada Exports to Asia
Potential US Exports to Asia
East of Suez Supply Capacity Targeting Asia Pacific (up to Planned Projects)
Demand*
*Base-case scenarios (JKTIC + new markets)
18
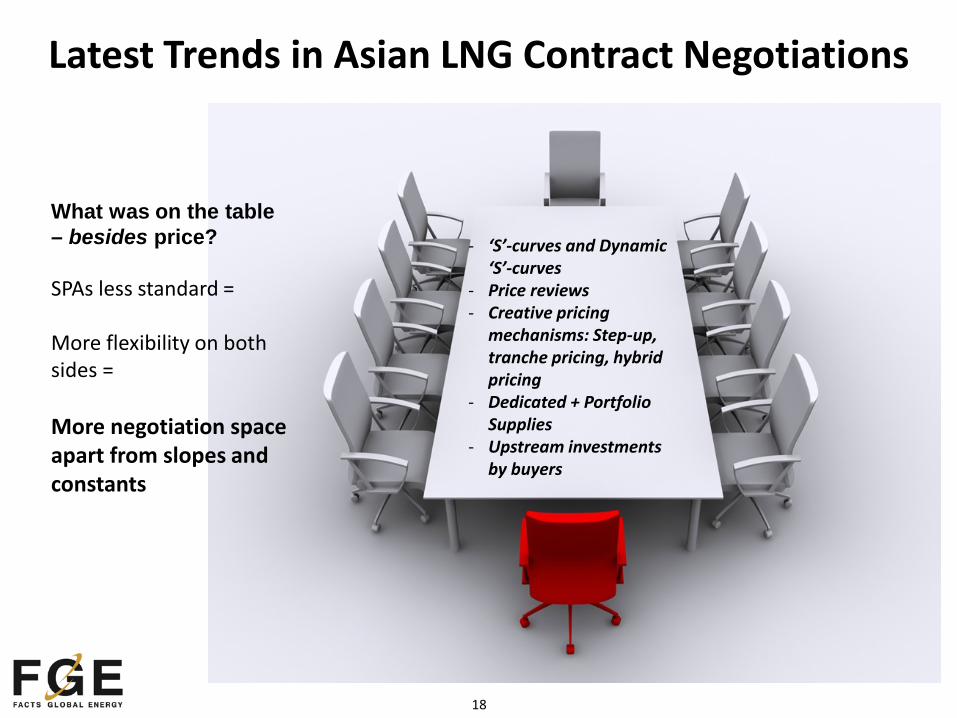
Latest Trends in Asian LNG Contract Negotiations
What was on the table – besides price? SPAs less standard = More flexibility on both sides = More negotiation space apart from slopes and constants
- ‘S’-curves and Dynamic ‘S’-curves
- Price reviews - Creative pricing
mechanisms: Step-up, tranche pricing, hybrid pricing
- Dedicated + Portfolio Supplies
- Upstream investments by buyers

19
Thank You