Embed Size (px)
Citation preview

Load Characterization
Rigid Pavement Design
Course
Traffic Load Considerations
Load Groups
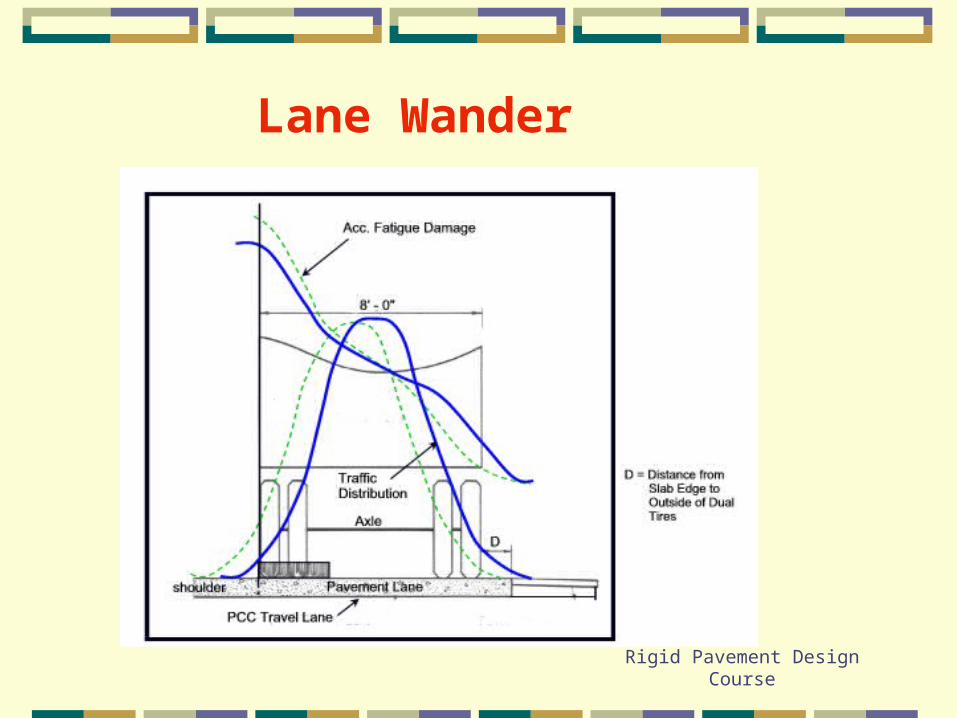
Lane Wander
Load Configuration
Rigid Pavement Design
Course
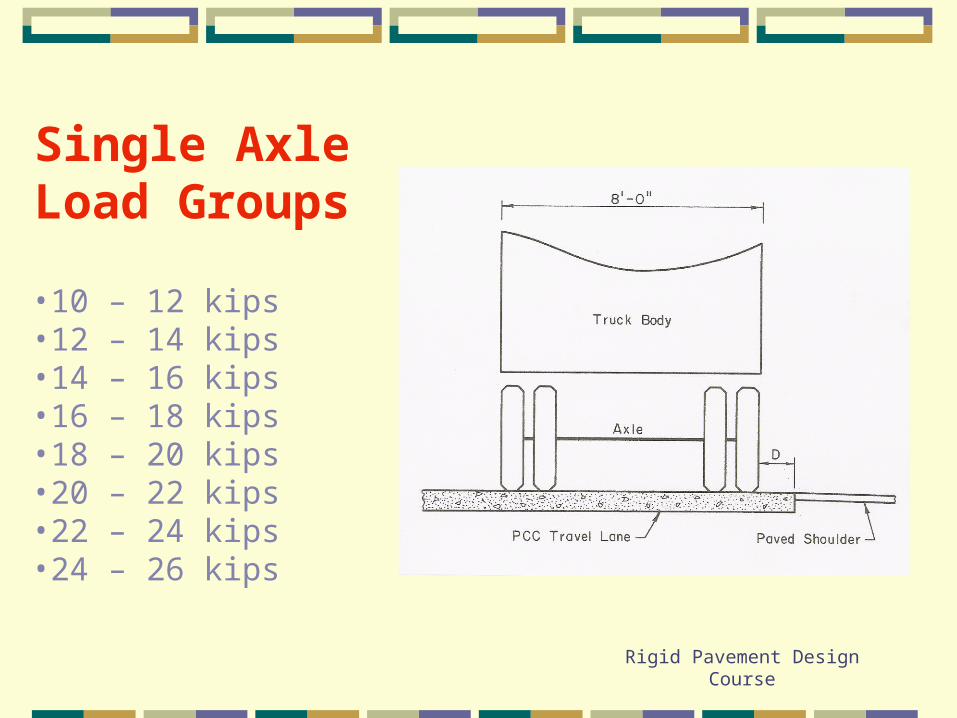
Single AxleLoad Groups
•10 – 12 kips•12 – 14 kips•14 – 16 kips•16 – 18 kips•18 – 20 kips•20 – 22 kips•22 – 24 kips•24 – 26 kips
Rigid Pavement Design
Course
25
20
15
10
5
0-24 -18 -12 -6 0 6 12 18 24 30 36 42 48 54 60
10-4
10-5
10-6
10-7
10-8
Pavement Edge
Accumulation Fatigue Damage Distribution
Traffic Distribution
Design Load Position
D=12"
D=18"
t=10”k=100pci
Bituminous Shoulder P.C.C. Pavement
Acc
umul
ate
Fat
igue
Dam
age
Tra
ffic
Dis
trib
utio
n (%
)
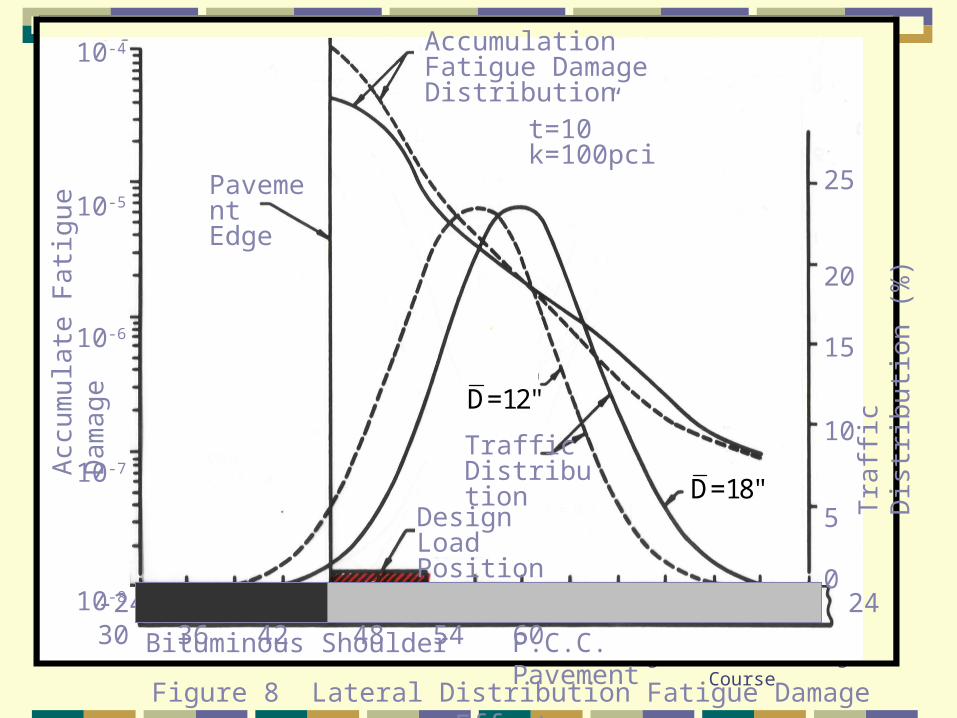
Figure 8 Lateral Distribution Fatigue Damage Effects
Rigid Pavement Design
Course
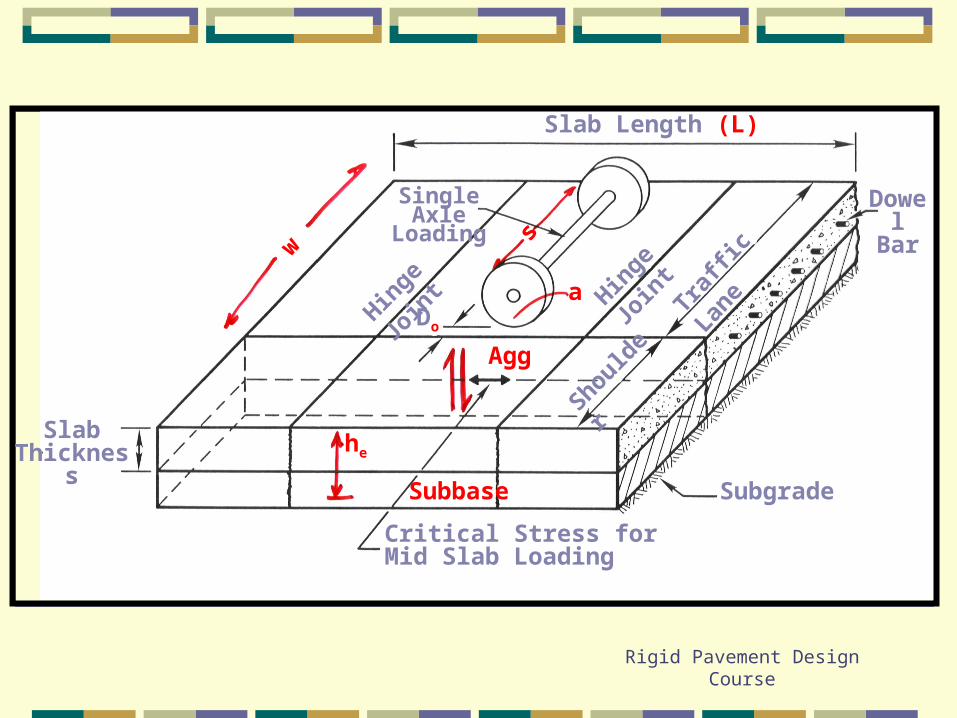
DowelBar
Subgrade
Critical Stress forMid Slab Loading
SlabThickness
Slab Length (L)
Single Axle Loading
Agg
Subbase
he
w
s
a
Traffi
c Lan
e
Should
erH
inge
Join
t
Hin
ge Jo
int
Do
Rigid Pavement Design
Course
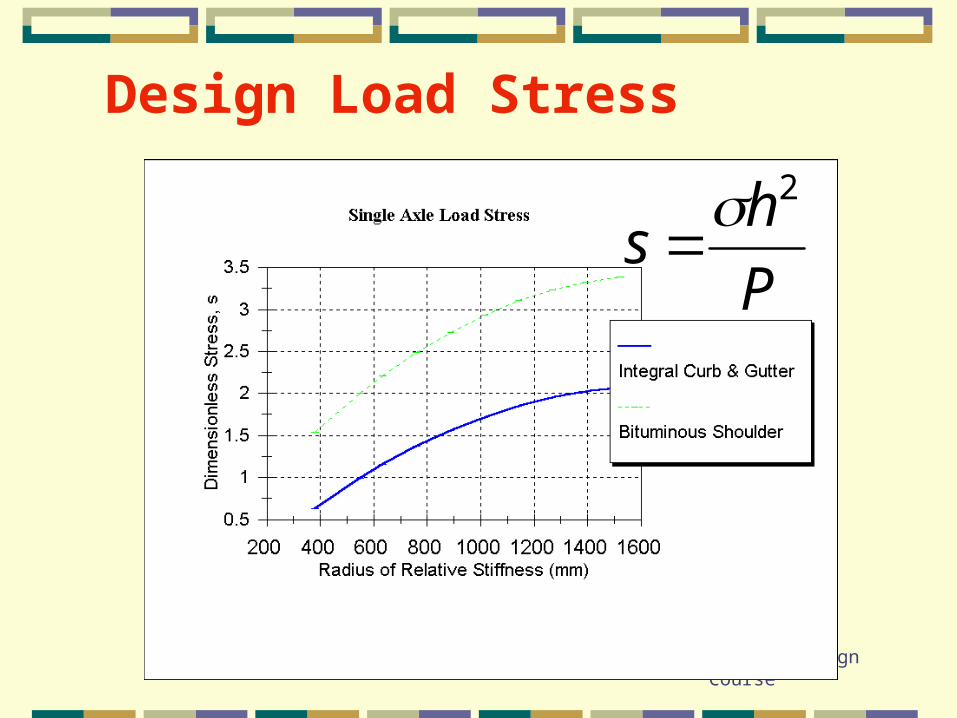
Design Load Stress
P
hs
2
Rigid Pavement Design
Course
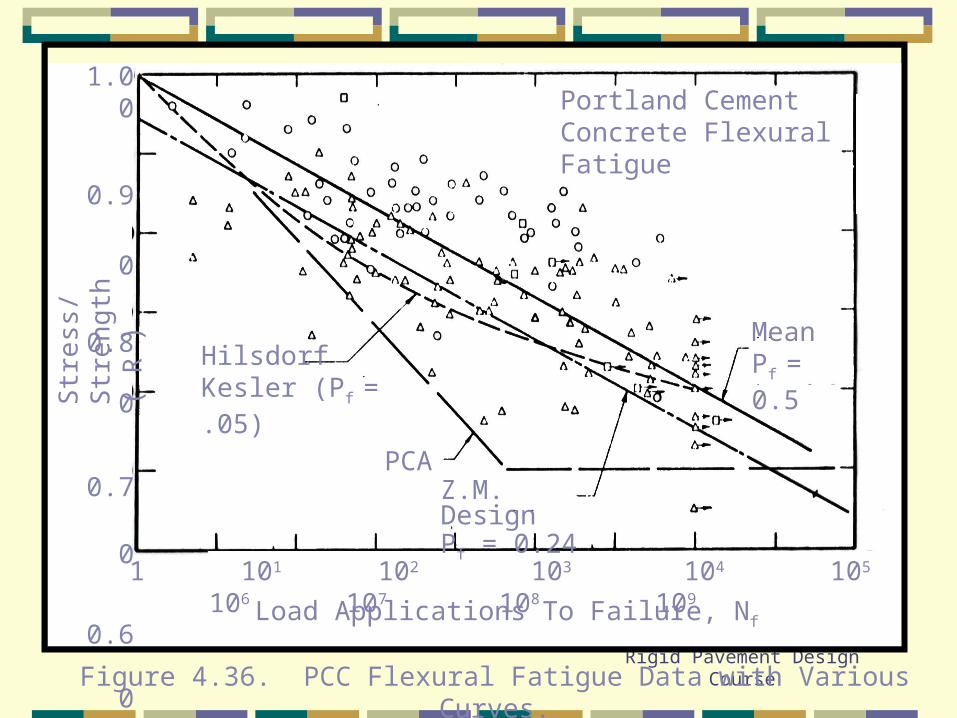
1 101 102 103 104 105 106 107 108 109
Load Applications To Failure, Nf
1.00
0.90
0.80
0.70
0.60
0.50
0.40
Str
ess/
Str
eng t
h (
R )
MeanPf = 0.5
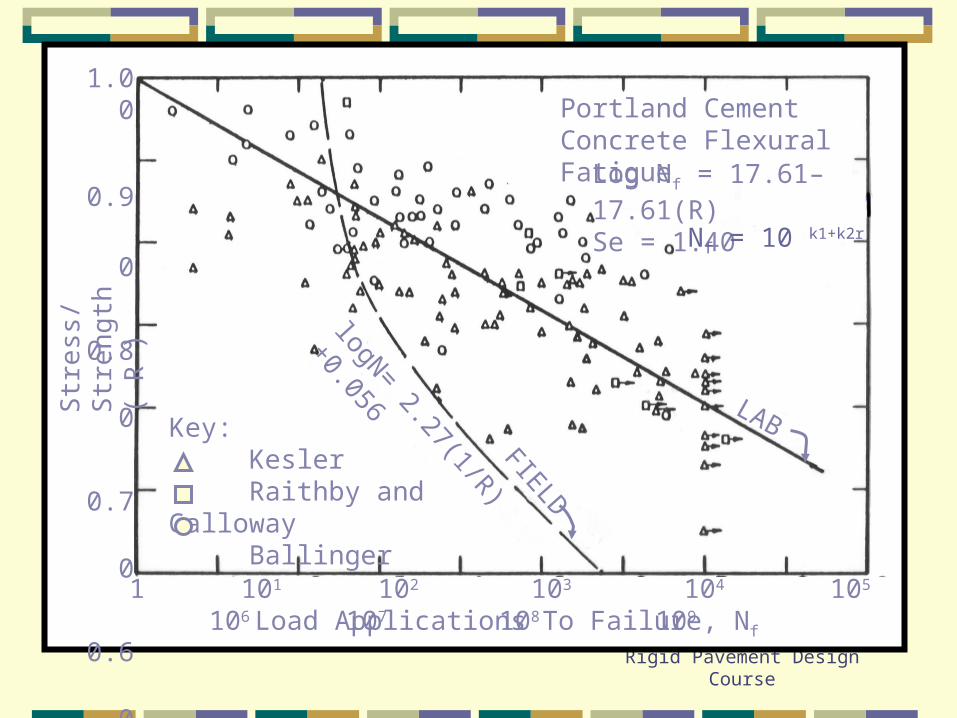
Portland Cement Concrete Flexural Fatigue
HilsdorfKesler (Pf = .05)
PCAZ.M. Design Pf = 0.24
Figure 4.36. PCC Flexural Fatigue Data with Various Curves.
Rigid Pavement Design
Course
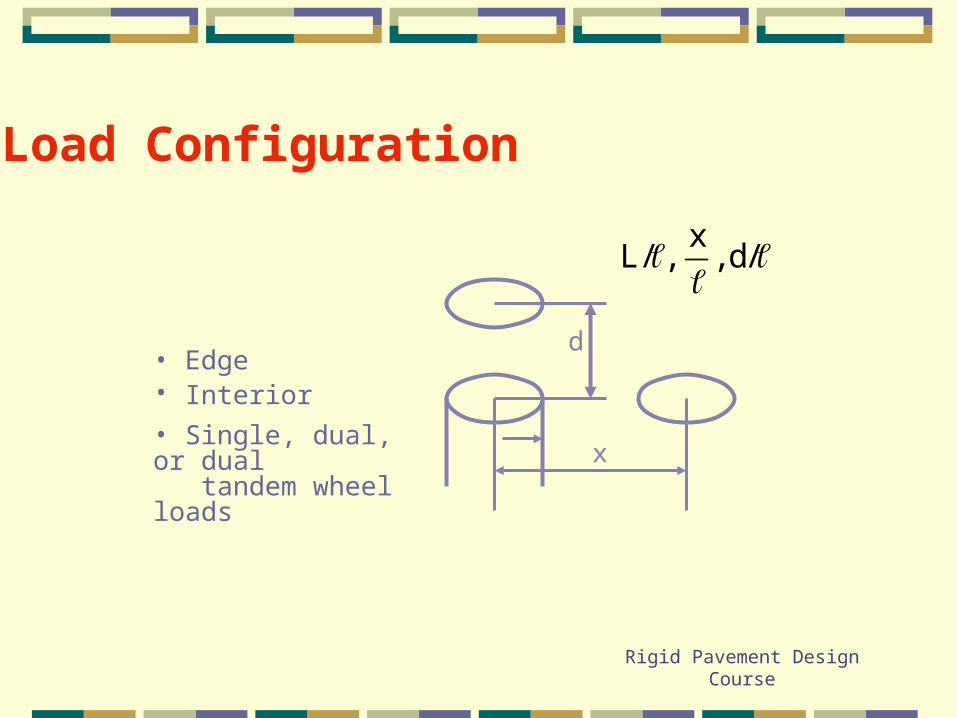
d
x
xL/ , , d/
• Edge• Interior
• Single, dual, or dual tandem wheel loads
Load Configuration
Rigid Pavement Design
Course
unbo
nded
or
bond
ed
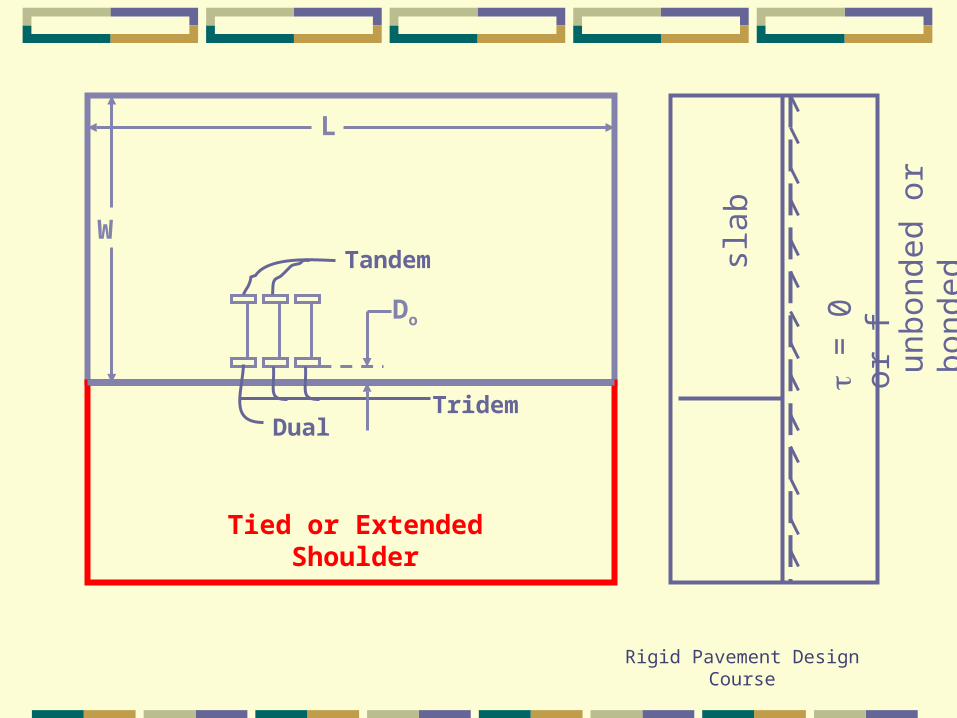
Tandem
DualTridem
Tied or ExtendedShoulder
Do
W
L
slab
=
0 o
r f
Rigid Pavement Design
Course
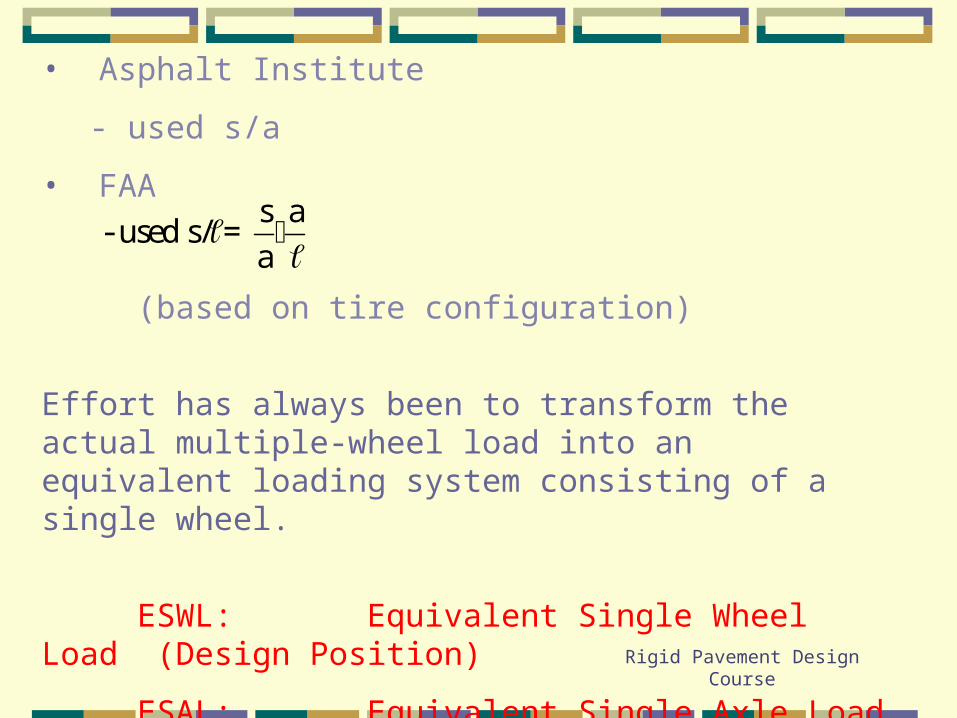
• Asphalt Institute
- used s/a
• FAA
(based on tire configuration)
Effort has always been to transform the actual multiple-wheel load into an equivalent loading system consisting of a single wheel.
ESWL: Equivalent Single Wheel Load (Design Position)
ESAL: Equivalent Single Axle Load
ESAR: Equivalent Single Axle Radius (Design Position)
s a- used s/ =
a
Rigid Pavement Design
Course
Lane Wander
Rigid Pavement Design
Course
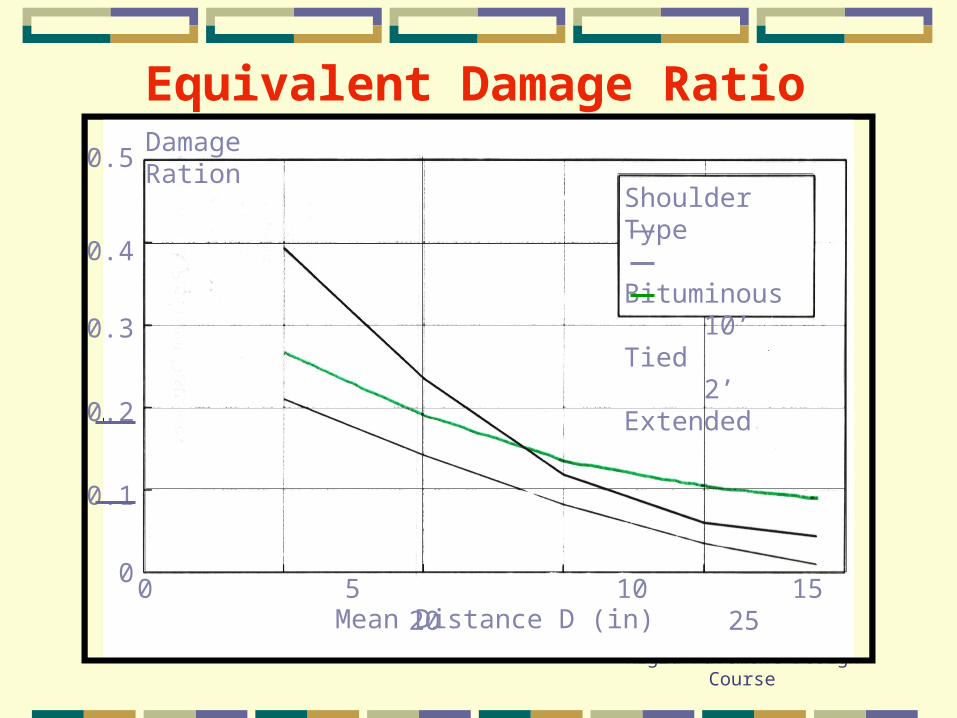
Equivalent Damage Ratio (EDR)
0 5 10 15 20 25
0.5
0.4
0.3
0.2
0.1
0
Damage Ration
Shoulder Type Bituminous 10’ Tied 2’ Extended
Mean Distance D (in)
Rigid Pavement Design
Course
1 101 102 103 104 105 106 107 108 109
1.00
0.90
0.80
0.70
0.60
0.50
0.40
Portland Cement Concrete Flexural Fatigue
LABKey: Kesler Raithby and Galloway Ballinger
Load Applications To Failure, Nf
Str
e ss /
Str
eng t
h (
R )
Log Nf = 17.61–17.61(R)Se = 1.40
Nf = 10 k1+k2r
FIELD
logN= 2.27(1/R)+0.056
Rigid Pavement Design
Course
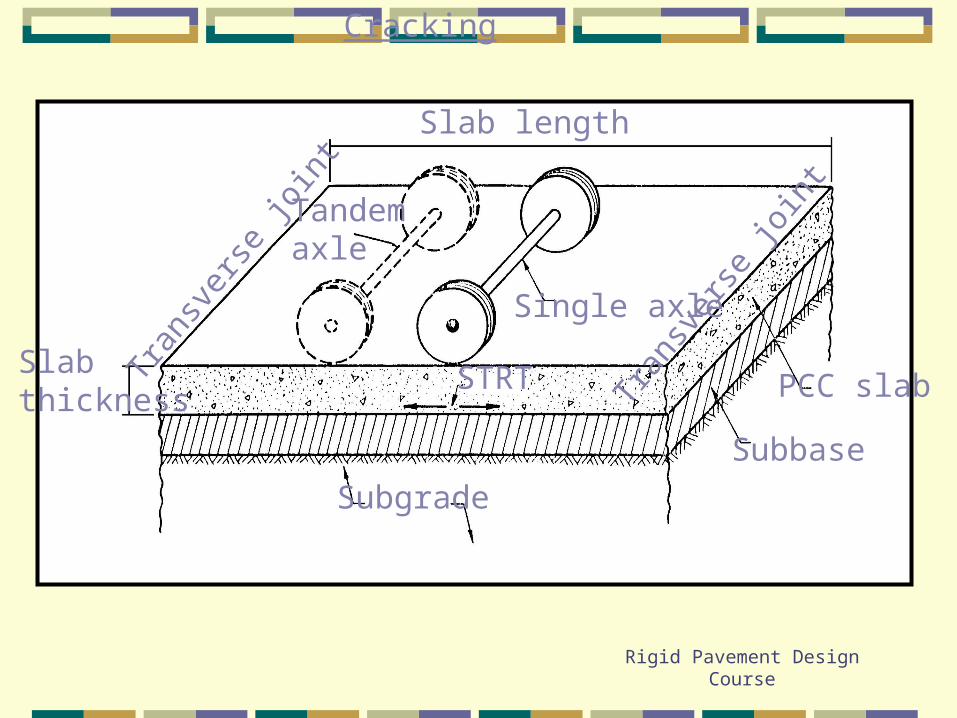
Cracking
Slabthickness
Subgrade
Subbase
PCC slab
Slab length
Single axle
Tandemaxle
STRT Tran
sver
se jo
int
Tran
sver
se jo
int
Rigid Pavement Design
Course
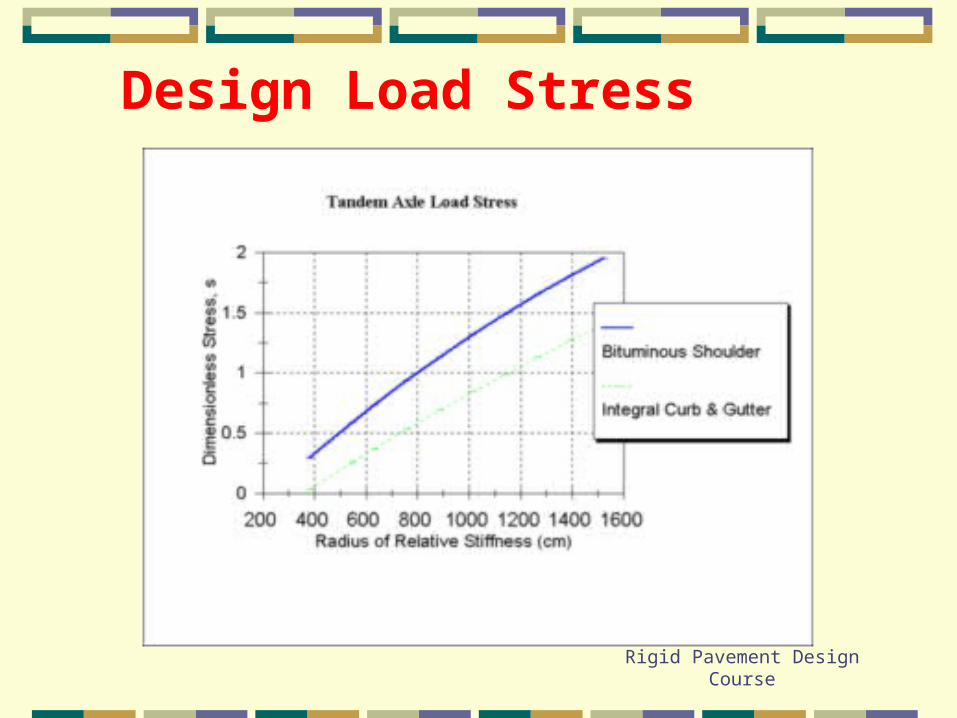
Design Load Stress
Rigid Pavement Design
Course
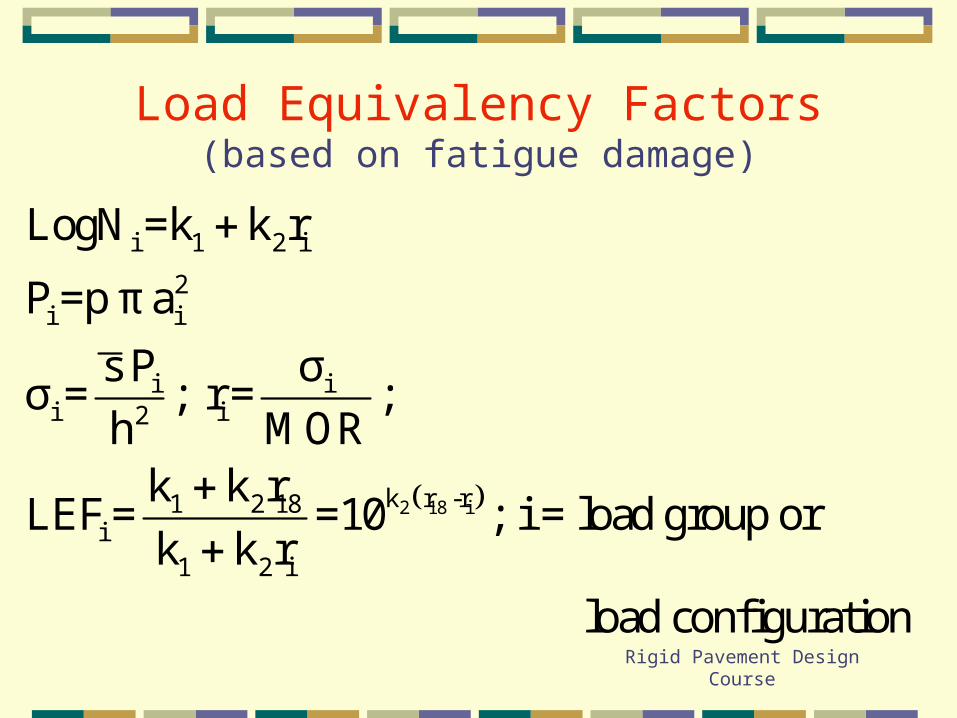
Load Equivalency Factors(based on fatigue damage)
2 18 i
i 1 2 i
2i i
i ii i2
k r -r1 2 18i
1 2 i
LogN =k k r
P =p π a
s P σσ = ; r = ;
h MORk k r
LEF = =10 ; i = load group ork k r
load configuration
Rigid Pavement Design
Course
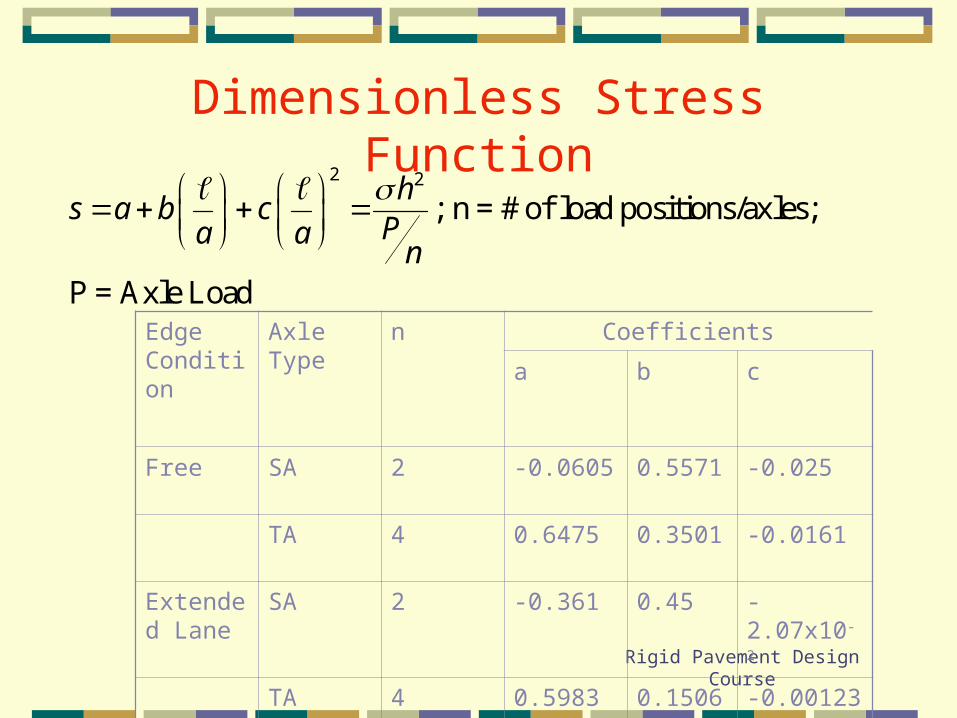
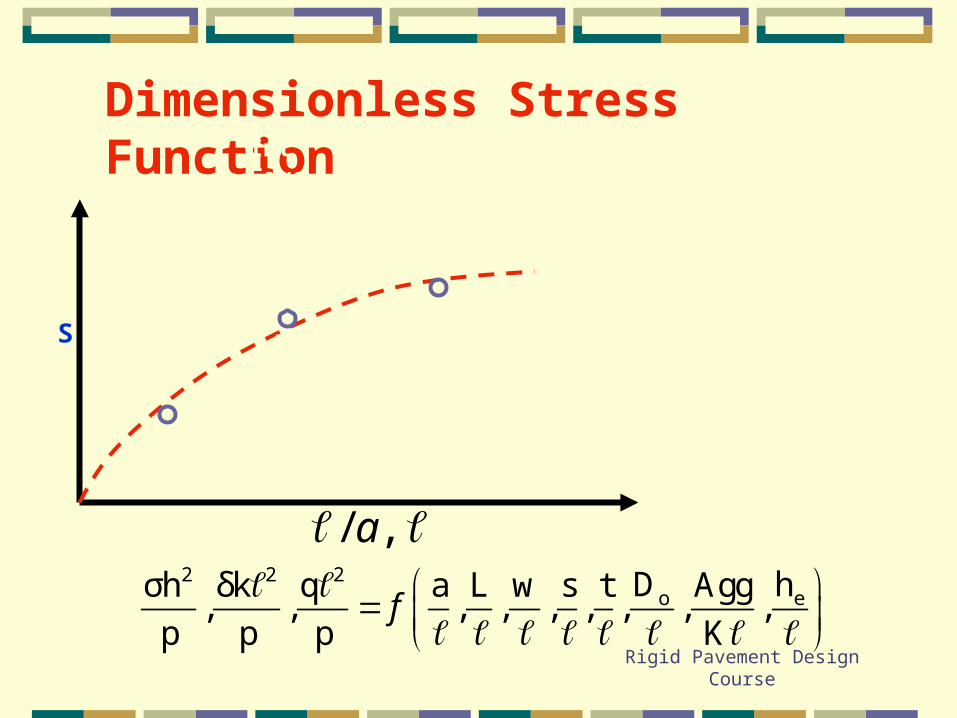
Dimensionless Stress Function
Edge Condition
Axle Type
n Coefficients
a b c
Free SA 2 -0.0605 0.5571 -0.025
TA 4 0.6475 0.3501 -0.0161
Extended Lane
SA 2 -0.361 0.45 -2.07x10⁻²
TA 4 0.5983 0.1506 -0.00123
2 2
; n = # of load positions/axles;
P = Axle Load
hs a b c
Pa an
Rigid Pavement Design
Course
Dimensionless Stress FunctionInt 8.0 3.5Edge 8.0 5.0Corner 5.0 4.0
a+bx+cx2S
/ , a 2 2 2
o eD hσh δk q a L w s t Agg, , , , , , , , ,
p p p Kf
Rigid Pavement Design
Course
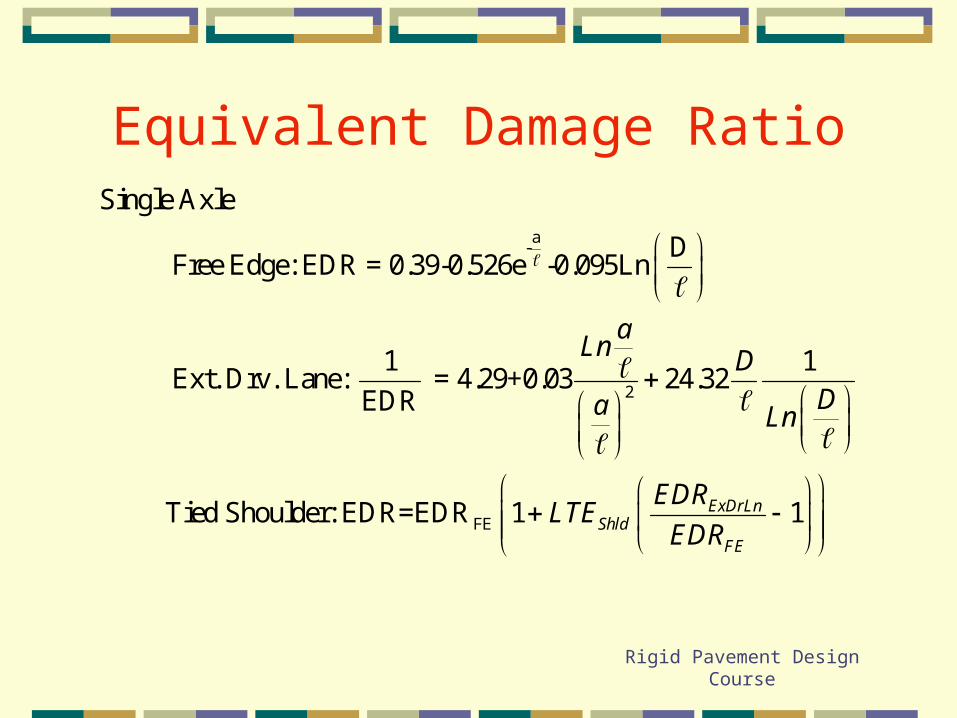
Equivalent Damage Ratio
a-
2
FE
Single Axle
D Free Edge: EDR = 0.39-0.526e -0.095Ln
1 1 Ext. Drv. Lane: = 4.29+0.03 24.32
EDR
Tied Shoulder: EDR=EDR 1 ExDrLnShld
FE
aLn D
Da Ln
EDRLTE
EDR
1
Rigid Pavement Design
Course
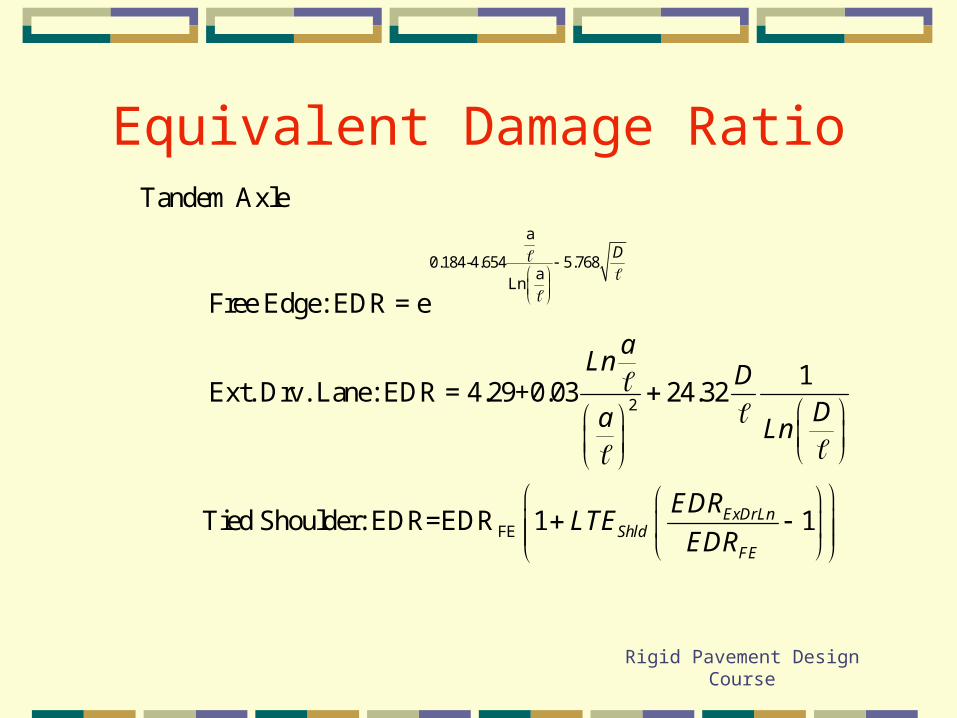
Equivalent Damage Ratio
a
0.184-4.654 5.768a
Ln
2
FE
Tandem Axle
Free Edge: EDR = e
1 Ext. Drv. Lane: EDR = 4.29+0.03 24.32
Tied Shoulder: EDR=EDR 1
D
ExDrLnShld
FE
aLn D
Da Ln
EDRLTE
EDR
1
Rigid Pavement Design
Course
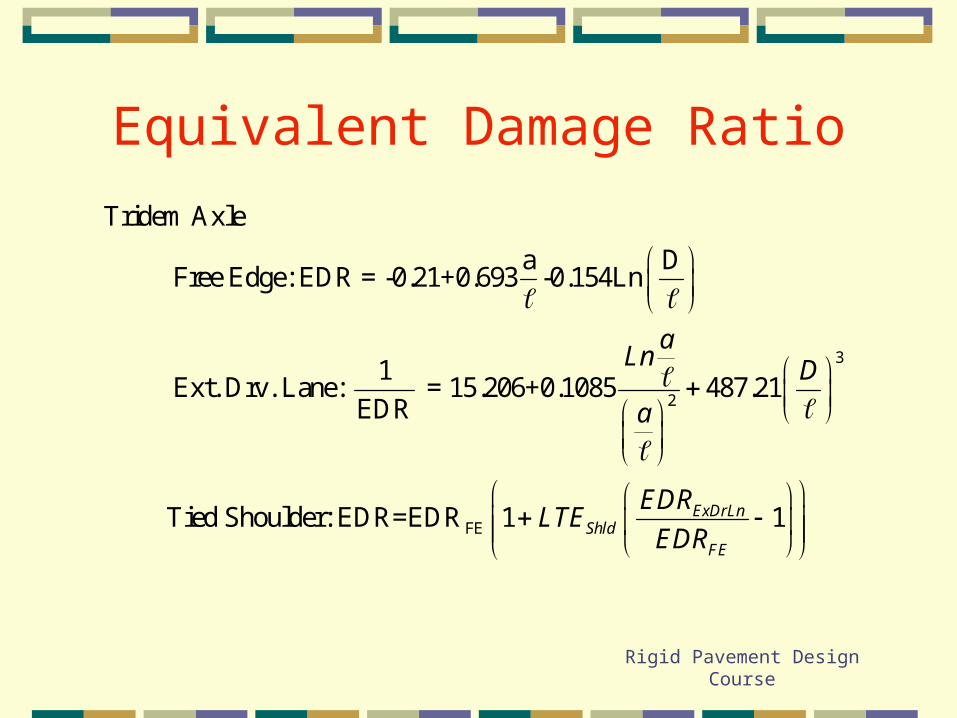
Equivalent Damage Ratio
3
2
FE
Tridem Axle
a D Free Edge: EDR = -0.21+0.693 -0.154Ln
1 Ext. Drv. Lane: = 15.206+0.1085 487.21
EDR
Tied Shoulder: EDR=EDR 1 ExDrLnShld
FE
aLn D
a
EDRLTE
EDR
1
Rigid Pavement Design
Course
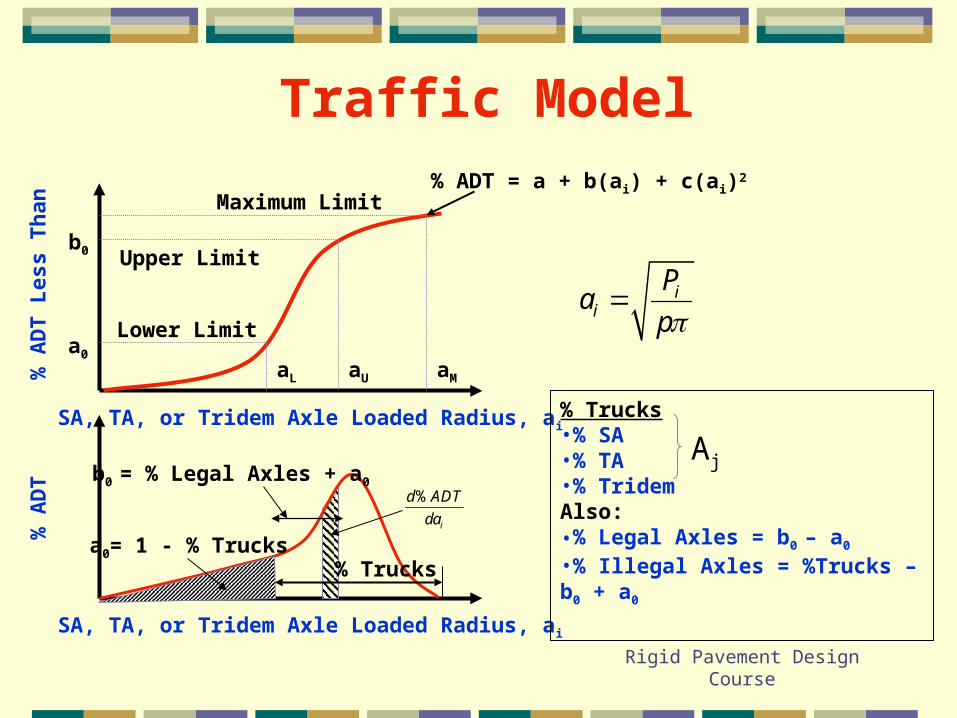
SA, TA, or Tridem Axle Loaded Radius, ai
SA, TA, or Tridem Axle Loaded Radius, ai
% A
DT
Les
s T
han
a0= 1 - % Trucks
b0 = % Legal Axles + a0
a0
b0
Maximum Limit
Lower Limit
Upper Limit
aL aU aM
% A
DT
%
i
d ADT
da
% Trucks•% SA•% TA•% TridemAlso:•% Legal Axles = b0 – a0
•% Illegal Axles = %Trucks – b0 + a0
ii
Pa
p
% Trucks
% ADT = a + b(ai) + c(ai)2
Aj
Traffic Model
Rigid Pavement Design
Course
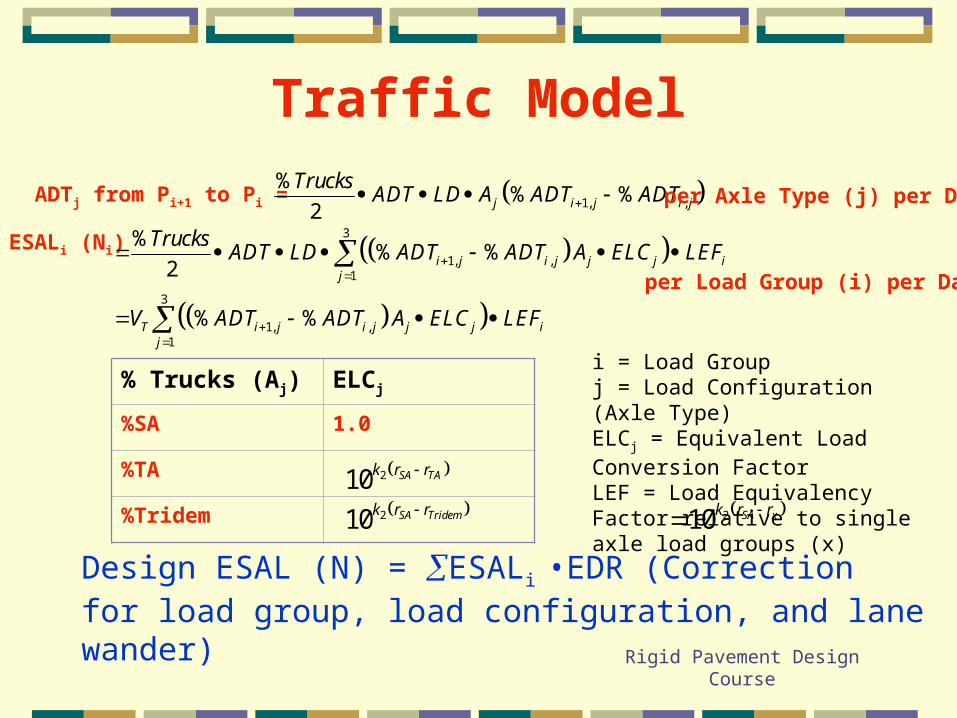
ADTj from Pi+1 to Pi = 1, ,
%% %
2 j i j i j
TrucksADT LD A ADT ADT per Axle Type (j) per Day
ESALi (Ni)
3
1, ,1
3
1, ,1
%% %
2
% %
i j i j j j ij
T i j i j j j ij
TrucksADT LD ADT ADT A ELC LEF
V ADT ADT A ELC LEF
per Load Group (i) per Day
% Trucks (Aj) ELCj
%SA 1.0
%TA
%Tridem
210 SA TAk r r
210 SA Tridemk r r
i = Load Groupj = Load Configuration (Axle Type)ELCj = Equivalent Load Conversion FactorLEF = Load Equivalency Factor relative to single axle load groups (x)
Design ESAL (N) = ESALi •EDR (Correction for load group, load configuration, and lane wander)
Traffic Model
210 SA xk r r
Rigid Pavement Design
Course
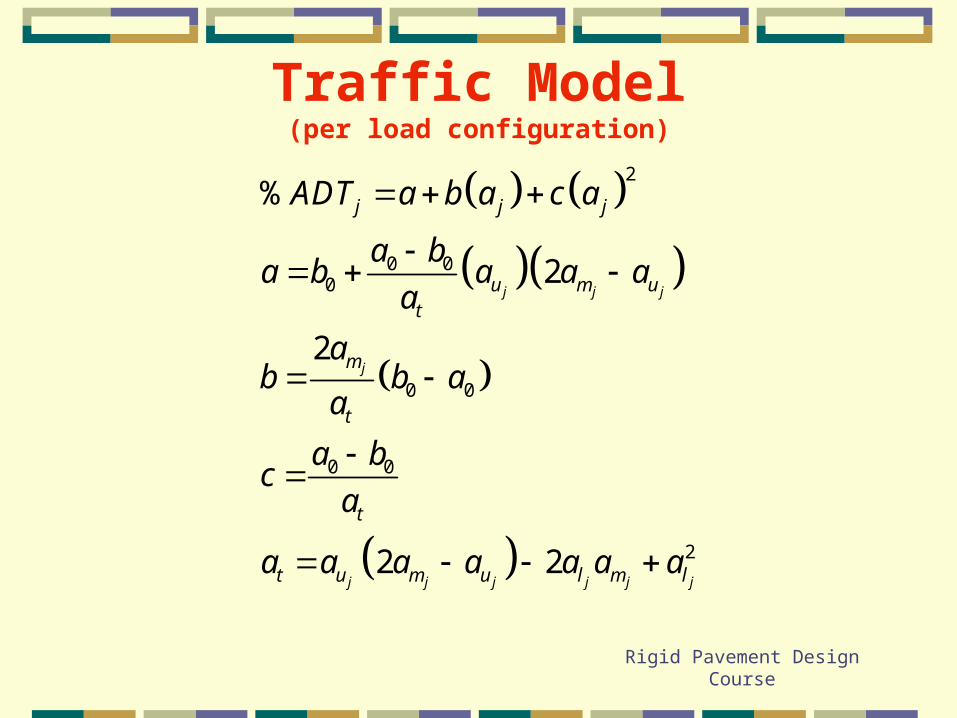
Traffic Model(per load configuration)
2
0 00
0 0
0 0
2
%
2
2
2 2
j j j
j
j j j j j j
j j j
u m ut
m
t
t
t u m u l m l
ADT a b a c a
a ba b a a a
a
ab b a
a
a bc
a
a a a a a a a