Embed Size (px)
Citation preview
1Emmanuel Ighodalo Okhueleigbe & 2Andrew Osemare Okhueleigbe | 53
International Journal of Engineering and Emerging Scientific Discovery
ISSN: 2536-7250 (Print): 2536-7269 (Online)
Volume 3, Number 1, March 2018
http://www.casirmediapublishing.com
Load Flow Analysis of 15MVA, 33/11kV Injection Substation
1Emmanuel Ighodalo Okhueleigbe & 2Andrew Osemare Okhueleigbe
1Department of Electrical/Electronics, Federal University of Petroleum Resources Efferun, Delta state 2Techenical Department (Supply Chain), Nigeria Breweries PLC, Nigeria
Email: [email protected], [email protected]
ABSTRACT
This study presents the load flow analysis of Ughelli- 15, 15MVA, 33/11kV injection substation, Delta
State, Nigeria. It is very essential for a load flow study to be carried out in a power system in other to
enable one carry out an effective planning, design, implementation, configuration and control of the
system so as to obtain maximal, effective and more reliable system. With load flow analysis the state of
power distribution (load )is related or evaluated with generation. The paper presents a computer aided
load flow analysis of an existing Ughelli- 15, 15MVA, 33/11kV injection substation using ETAP 12.6
software. From the result of the analysis out of (63) load feeders, (4) feeders were out of service, during
peak period and off-peak period voltage violation occurred on (58) feeders, with (1) load feeder within
acceptable voltage range at both peak period and off-peak period.
Keywords: injection Substation, feeders, power, voltage, frequency
INTRODUCTION
In recent times the Nigeria Government
in a view to address the challenges of
power supply used the Ministry of
Power through an agent of the
Ministry known as the Electric Power
Sub-sector (EPS), this was aimed at the
reform of the power sector in Nigeria
which has a population size of over 150
million people, as a result of Nigeria
size the EPS finds it very difficult in
achieving its core goal and mandate
given to the Ministry of Power to
actualize the agenda of the Nigerian
Government after a national crisis and
embarrassment which took place in its
power sector the year 2000, when the
country was faced with power
generating capacity which was bellow
2000MW. From the very onset of the
institution of a democratically elected
government in Nigeria various elected
President such Olusegun Obasanjo and
Musa Yar’Adua made different effort in
addressing the epileptic power system
bedeviling Nigeria including President
Goodluck Jonathan during his
inaugural speech on 29th May, 2011 he
placed the power sector in his
transformation agenda. As reliable
electricity is the bed rock for
technological revolution and
development of any nation or country,
as the previous democratic government
has not been able to address the
challenges and provide power to the
Nigeria citizenry for not more seventy
two hours (Okolobah and
Ismail, 2013; www.nercng.org; www.m
arketresearch.com; Odueme, 2001;www
.nigeriatoday.com; Okhueleigbe, 2016).
1Emmanuel Ighodalo Okhueleigbe & 2Andrew Osemare Okhueleigbe | 54
Load Flow Analysis of 15MVA, 33/11kV Injection Substation
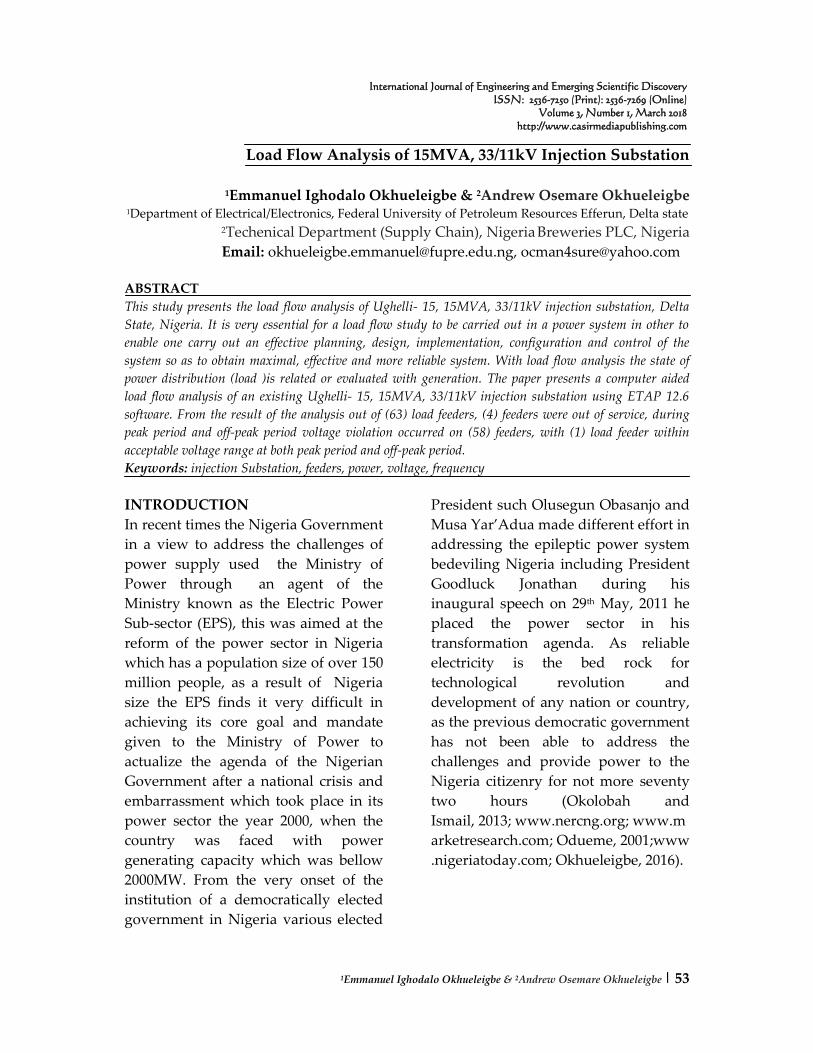
LOAD MODEL FOR POWER
DISTRIBUTION SYSTEM
Loads in electrical power system are
modeled as constant impedance (Z),
current (I) and power (P). It could be a
combination of the three, for each value
the real power and reactive power are
specified ( + ).
Then constant power will be = +
(1)
At normal voltage in 1.0 per unit real
power and reactive power will be
written as
Complex power load(s) could be
derived as (2)
=
(3)
(4)
The system load becomes a linear
function of the voltage magnitude
=│ (5)
The specified represent the load
voltage of 1.0 per unit, from the
complex power equation we have
=
*=
=
(6)
=
(7)
The load becomes a quadratic function
of voltage magnitude
=│ (8)
Generator Model
Generators are model as source of real
and reactive power (MW, Mvar) output
generator has some control features
which are
i. Automatic voltage regulator
(AVR) – This are used in the
control of reactive power output
(Q) in other to maintain a
specified voltage level of the
regulated Bus.
ii. Automatic generation Control
(AGC) – This is used in the
modification of real power
output (P).
The Power Flow Equation
Load flow or Power flow study is the
study of interconnected power system
with the use of simplified notation such
as per unit and one line diagram in the
analysis of various alternating current
parameters such as voltage, voltage
angle, real power and reactive power.
This study is very essential in power
system so as to be able to understand
the particular network and carry out
formed decision making as regarding a
particular network.
Linear programming is used in
software in resolving some problems
associated with power system which
include short circuit, stability analysis
(transient and steady state) in other to
arrive at the lowest cost of kilowatt
hour. A system with multiple load flow
centers load flow activity is very crucial
in other determine if the main feeder is
able to supply adequate power to the
various load center and also determine
the losses between load centers and its
main source.
Carrying out load flow study you are
able to identify a system’s capability

1Emmanuel Ighodalo Okhueleigbe & 2Andrew Osemare Okhueleigbe | 55
International Journal of Engineering and Emerging Scientific Discovery
Volume 3, Number 1, March 2018
and control
settings in other to obtain maximum ou
tput from a particular system.(https://e
n.wikipedia.org/wiki/Power-
flow_study)visited 15th August, 2015).
Reason for Power Flow Equation
Model
This are model used in power system in
analyzing the power flow which are
non-linear system, this method is used
in describing the energy flow through
the various transmission lines. The
problem associated with non-linearity
is because the power flows into the
load impedances is a function of the
square of the applied voltage thus the
non-linearity in large network using
AC is often not flexible and less
accurate, hence the use of DC power
flow model is deployed. Analysis in a
three phase system is often assumed to
be balanced loading of all three phase
to the load generation changes, with
the frequency also assumed to be
constant, thus the use of per-unit
system and one line diagram is used for
simplicity so as to be able to develop a
mathematical model of the generators
load buses and transmission lines of a
system being worked upon including
their electrical impedance and ratings.
(https://en.wikipedia.org/wiki/Power-
flow_study)visited 15th August, 2015).
Deriving the Power Flow Equations
The use of Y-bus, and applying
Kirchhoff’s current law at each bus
using matrix equation we have
YV- (9)
S = = [ ] ( +
= 0 (10)
[ ] ( + = 0
(11)
The above are known as N-1 complex
number equations (where N = the
number of buses in the power system)
N-1 complex number equations can be
written as 2* (N-1) real number
equations as
(12)
Represents Transmission lines,
Transformers and Capacitors.
Power Generated.
Power Consumed by Load.
(13)
Represents Transmission lines,
Transformers and Capacitors.
Represents Generators.
Represents Load
Represents Element s of
the Y-Bus
Thus it should be noted that
are variables of the real
and imaginary parts of the Y-Bus.
or
There are four parameters used in
describing the bus in power flow
equation.
1Emmanuel Ighodalo Okhueleigbe & 2Andrew Osemare Okhueleigbe | 56
Load Flow Analysis of 15MVA, 33/11kV Injection Substation
1. Voltage magnitude (v)
2. Voltage angle ( )
3. Real power
4. Reactive power
The main objective of the power flow
algorithm is to determine the four
values listed above. In any power flow
situation two of the values at each bus
are known and then we solve for the
other two values. In a power flow there
are generally three buses they are
shown on Table 1.
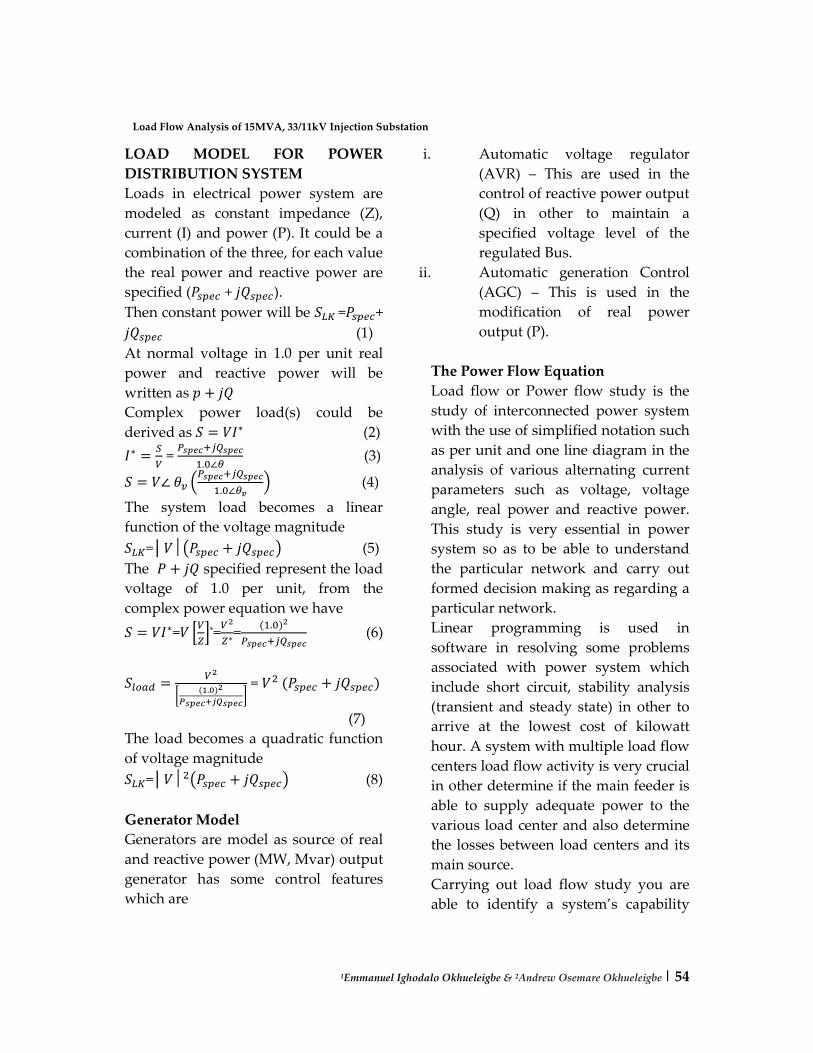
Table 1 Types of Buses
Type of Bus Voltage
Magnitude
Voltage Angle
Power Injection
Reactive Power
Injection
Slack Bus ( )
(only one of these)
Known Known Unknown Unknown
( )
(generator on AVR
control)
Known Unknown Known Unknown
( ) (load
or generator not on
AVR control)
Unknown Unknown Known Known
Source: Power World Corporation 2014
Non- Linear Equations
Power flow equations are represented
with and
which makes such equations non-
linear, by this finding a direct solution
in resolving non- linear equation is
impossible, thus the use of iterative
numerical schemes are deployed in
determining their solution, hence in
power flow equation the use of
Newton’s method is found to be the
technique used in resolving such
problems.
A simple scalar equation can be
written in “Taylor Series” as
(14)
Approximating scalar functions
in Taylor Series is by ignoring all
but the first two terms
(15)
At this point we are trying to find
where , the power flow
equation s sums up to be zero.
Thus
(16)
Newton-Rhapson Convergence
Characteristics
The general convergence characteristics of
the Newton-Rhapson (N-R) algorithm are
not easy to be characterized, Newton-
Rhapson algorithm often converges quite

1Emmanuel Ighodalo Okhueleigbe & 2Andrew Osemare Okhueleigbe | 57
International Journal of Engineering and Emerging Scientific Discovery
Volume 3, Number 1, March 2018
quickly provided the initial guess is close
enough to the solution, however Newton-
Rhapson algorithm does not always
converges to the closest solution hence
some initial guess plain bad.
Extending Scalar to Vectors and Matrices
Newton’s method can also be used
when trying to find a solution where
multiple functions are equal to zero, if
be a n-dimensional function and
let be an n-dimensional vector
(17)
The Newton-step is still defined
as
(18)
But
is now a matrix, called the
Jacobian
(19)
Power flow Solutions Varying with
Respect to load Changes
The power flow equation could be used in
calculating a series of power flow solutions
at various load levels, first determine the
following
(20)
(21)
For every load level, iterate from
an initial guess to a point where
the solution converges
(22)
UGHELLI- 15 (U-15), 15MVA, 33/11kV
Injection SubstationNetwork
Overview
Ughelli- 15, 15MVA, 33/11kV injection
substation, also known as (U-15) as its
nomeclature name is located beside
Transcorp Power Generating Station,
KM 20 Ughelli – Patani Express Road,
Ughelli, Delta State, Nigeria. It gets its
supply from the 33kV transmission line
via Transcorp generating Power
Limited, which generates at 16kV and it
is stepped up to132kV and fed into a 30
MVA, 132/33kV transformer, which in
turn feeds the Ughelli-15, 15 MVA, and
33/11kV Injection Substation. The
Injection Substation and generating
station have common boundary and are
both connected with multi-core
overhead conductor of 150mm² cross
sectional
area, while that from Ughelli 15, 15MV
A, 33/11kV injection substation to vario
us distribution substations which are co
nnected also with 150mm² multi-
core overhead conductor.
1Emmanuel Ighodalo Okhueleigbe & 2Andrew Osemare Okhueleigbe | 58
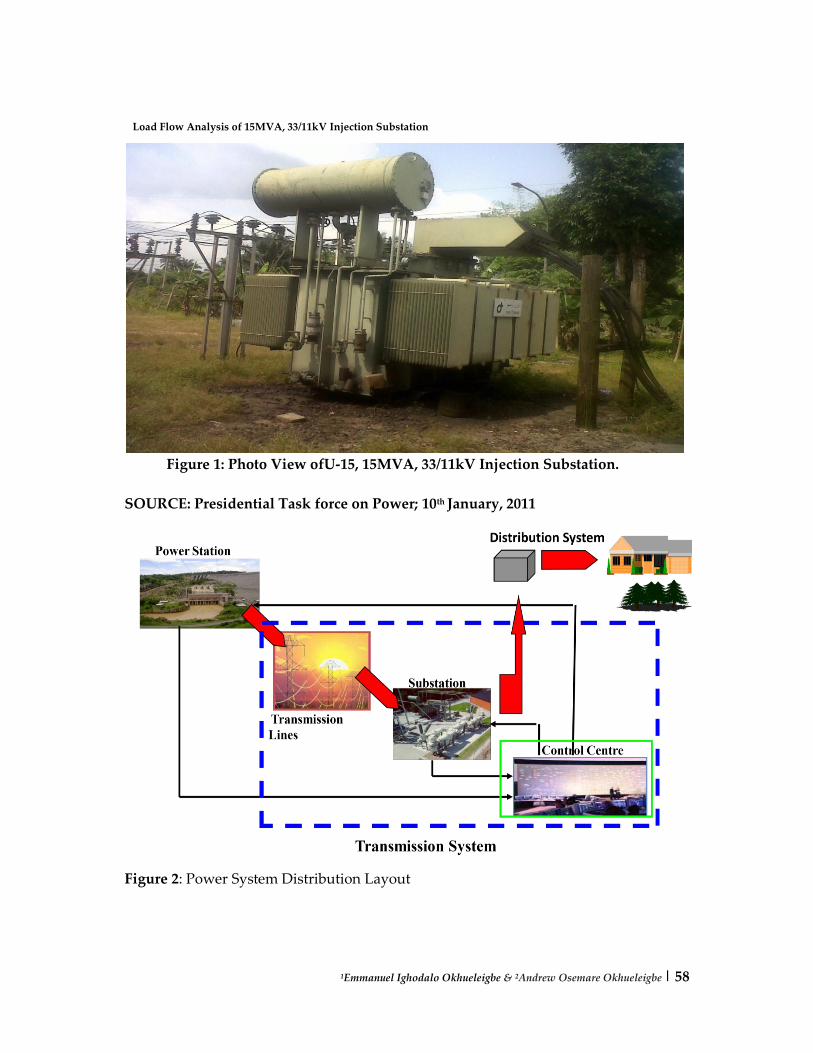
Load Flow Analysis of 15MVA, 33/11kV Injection Substation
Figure 1: Photo View ofU-15, 15MVA, 33/11kV Injection Substation.
SOURCE: Presidential Task force on Power; 10th January, 2011
Figure 2: Power System Distribution Layout

1Emmanuel Ighodalo Okhueleigbe & 2Andrew Osemare Okhueleigbe | 59
International Journal of Engineering and Emerging Scientific Discovery
Volume 3, Number 1, March 2018
Figure 3: One line Diagram Showing Power Source for Injection Substation.
SIMULATION RESULT AND ANALYSIS
Some of the simulation of the network is presented in table 2. The load flow method
used was in Newton-Rephson and it converged at less than 99 iterations.
11/0.415kV
Substation
Load
Load Load Load Load Load Load
ECN Road
Feeder
BETA Glass
Feeder
OLD Road
Feeder
11/0.415kV
Substation
11/0.415kV
Substation
15MVA
33/11kV
0.45km
30MVA
132/33kV

1Emmanuel Ighodalo Okhueleigbe & 2Andrew Osemare Okhueleigbe | 60
Load Flow Analysis of 15MVA, 33/11kV Injection Substation
Figure 4: Simulation (RUN) Mode of U-15 Network on ETAP 12.6

1Emmanuel Ighodalo Okhueleigbe & 2Andrew Osemare Okhueleigbe | 61
International Journal of Engineering and Emerging Scientific Discovery
Volume 3, Number 1, March 2018
Table 2: Load flow Report for entire Network showing Nominal kV, voltage, voltage in per
unit, Percentage Voltage Drop for each bus during peak period. (Peak Period Result
Summary of U-15)
S/N BUS ID Nominal
kV
Voltage Voltage
Pu
%Voltage
Drop
Remark
1 AIRTEL 1
FEEDER
0.415 87.45 0.8745 12.55 Voltage Drop Outside
Acceptable limit
2 AIRTEL 2
FEEDER
0.415 84.91 0.8491 15.09 Voltage Drop Outside
Acceptable limit
3 AIRTEL O-
FEEDER
0.415 84.01 0.8401 15.99 Voltage Drop Outside
Acceptable limit
4 AKREVWE S/S
FEEDER
0.415 81.71 0.8171 18.29 Voltage Drop Outside
Acceptable limit
5 AROWORO S/S
FEEDER
0.415 83.11 0.8311 16.89 Voltage Drop Outside
Acceptable limit
6 ARUMALA
S/S FEEDER
0.415 78.82 0.7882 21.18 Voltage Drop Outside
Acceptable limit
7 ARUMALA II
S/S FEEDER
0.415 79.47 0.7947 20.53 Voltage Drop Outside
Acceptable limit
8 ATAVERHE
FEEDER
0.415 79.37 0.7937 20.63 Voltage Drop
Outside Acceptable
limit
9 AWHINAWHI
S/S FEEDER
0.415 78.11 0.7811 21.89 Voltage Drop
Outside Acceptable
limit
10 BALAGBA S/S
FEEDER
0.415 86.72 0.8672 13.28 Voltage Drop
Outside Acceptable
limit
11 BETA GLASS
1 FEEDER
0.415 87.3 0.873 12.7 Voltage Drop
Outside Acceptable
limit
12 BETA GLASS
II S/S FEEDER
0.415 86.28 0.8628 13.72 Voltage Drop
Outside Acceptable
limit
13 BetaG-load
FEEDER
0.415 96.26 0.9626 3.74 Voltage Drop Within
Acceptable limit
14 ECO BANK
FEEDER
0.415 79.63 0.7963 20.37 Voltage Drop
Outside Acceptable
limit
15 EGOR S/S
FEEDER
0.415 80.09 0.8009 19.91 Voltage Drop
Outside Acceptable
limit

1Emmanuel Ighodalo Okhueleigbe & 2Andrew Osemare Okhueleigbe | 62
Load Flow Analysis of 15MVA, 33/11kV Injection Substation
Table 3: Load flow Report for entire Network showing Nominal kV, voltage, voltage in per
unit, Percentage Voltage Drop for each bus during Off-Peak period. (Off-Peak Period Result
Summary of U-15)
S/N BUS ID Nominal
kV
Voltage Voltage pu %
Voltage
Drop
Remark
1 AIRTEL 1 FEEDER 0.415 92.98 0.9298 7.02
Voltage Drop
Outside
Acceptable limit
2 AIRTEL 2 FEEDER 0.415 91.6 0.916 8.4 Voltage Drop
Outside
Acceptable limit
3 AIRTEL O-R FEEDER 0.415 90.68 0.9068 9.32 Voltage Drop
Outside
Acceptable limit
4 AKREVWE S/S FEEDER 0.415 89.64 0.8964 10.36 Voltage Drop
Outside
Acceptable limit
5 AROWORO S/S FEEDER 0.415 90.74 0.9074 9.26 Voltage Drop
Outside
Acceptable limit
6 ARUMALA S/S FEEDER 0.415 87.68 0.8768 12.32 Voltage Drop
Outside
Acceptable limit
7 ARUMALA II S/S FEEDER 0.415 88.03 0.8803 11.97 Voltage Drop
Outside
Acceptable limit
8 ATAVERHE FEEDER 0.415 87.15 0.8715 12.85 Voltage Drop
Outside
Acceptable limit
9 AWHINAWHI S/S
FEEDER
0.415 86.82 0.8682 13.18 Voltage Drop
Outside
Acceptable
limit
10 BALAGBA S/S FEEDER 0.415 92.4 0.924 7.6 Voltage Drop
Outside
Acceptable
limit
11 BETA GLASS 1
FEEDER
0.415 93.14 0.9314 6.86 Voltage Drop
Outside
Acceptable
limit
1Emmanuel Ighodalo Okhueleigbe & 2Andrew Osemare Okhueleigbe | 63
International Journal of Engineering and Emerging Scientific Discovery
Volume 3, Number 1, March 2018
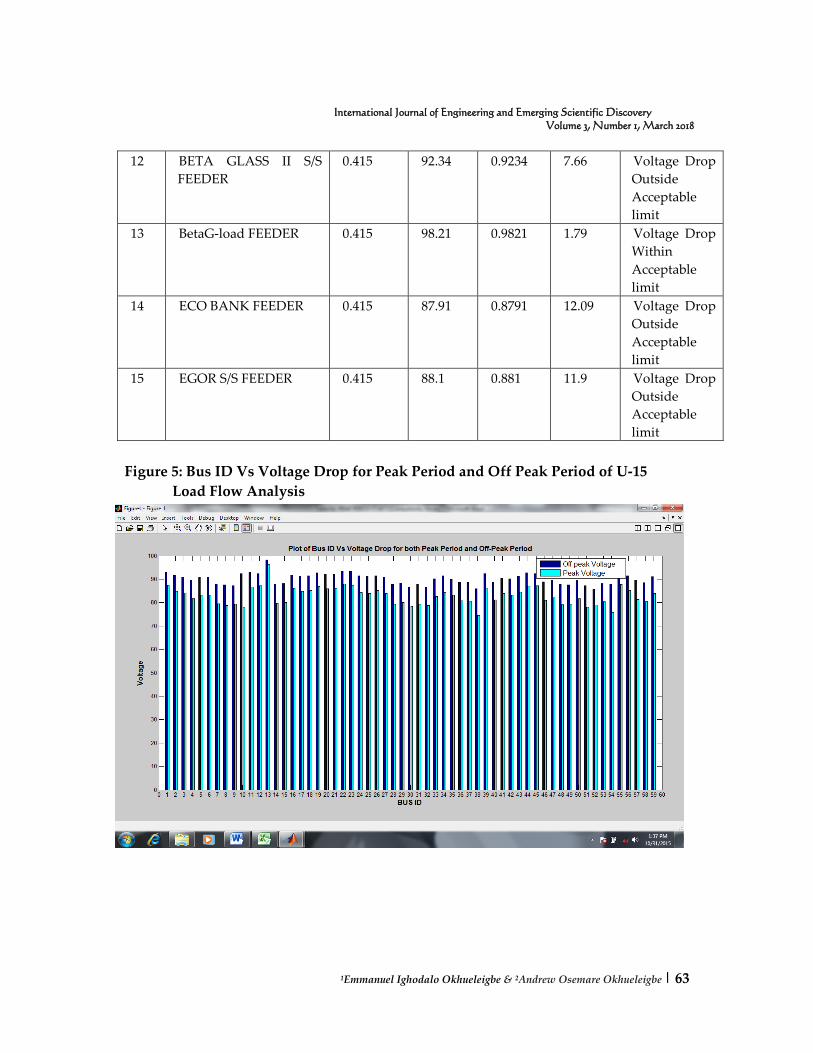
Figure 5: Bus ID Vs Voltage Drop for Peak Period and Off Peak Period of U-15
Load Flow Analysis
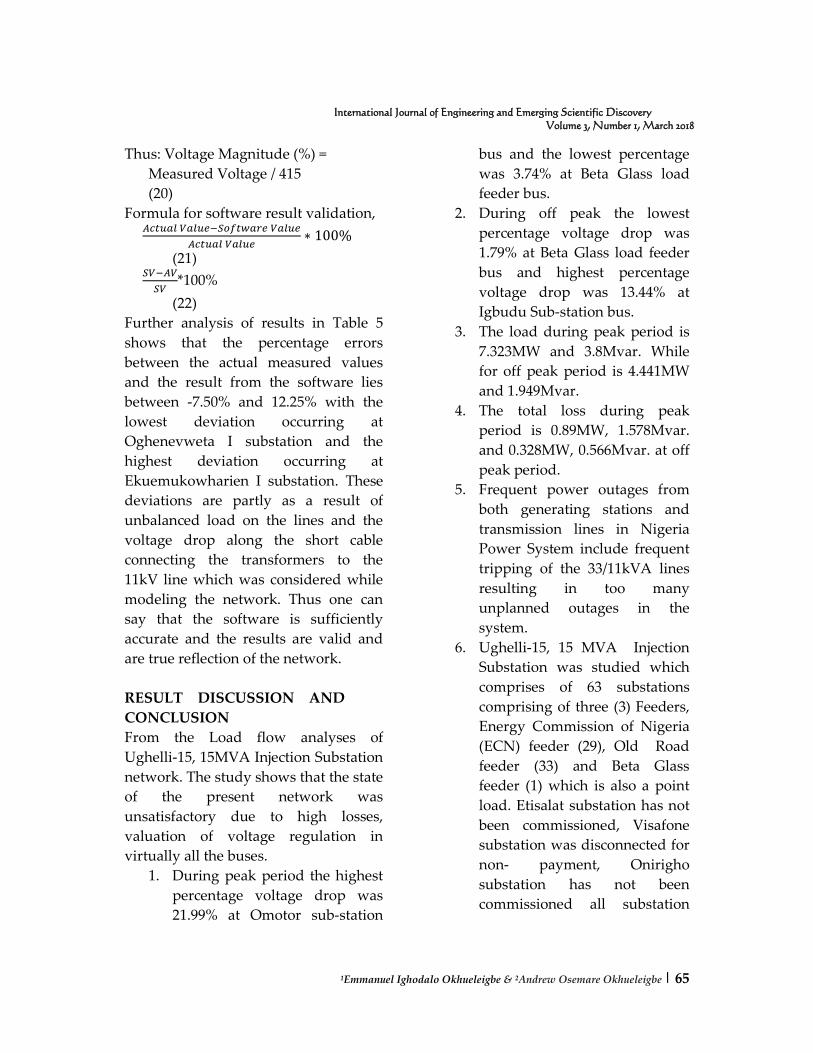
12 BETA GLASS II S/S
FEEDER
0.415 92.34 0.9234 7.66 Voltage Drop
Outside
Acceptable
limit
13 BetaG-load FEEDER 0.415 98.21 0.9821 1.79 Voltage Drop
Within
Acceptable
limit
14 ECO BANK FEEDER 0.415 87.91 0.8791 12.09 Voltage Drop
Outside
Acceptable
limit
15 EGOR S/S FEEDER 0.415 88.1 0.881 11.9 Voltage Drop
Outside
Acceptable
limit
1Emmanuel Ighodalo Okhueleigbe & 2Andrew Osemare Okhueleigbe | 64
Load Flow Analysis of 15MVA, 33/11kV Injection Substation
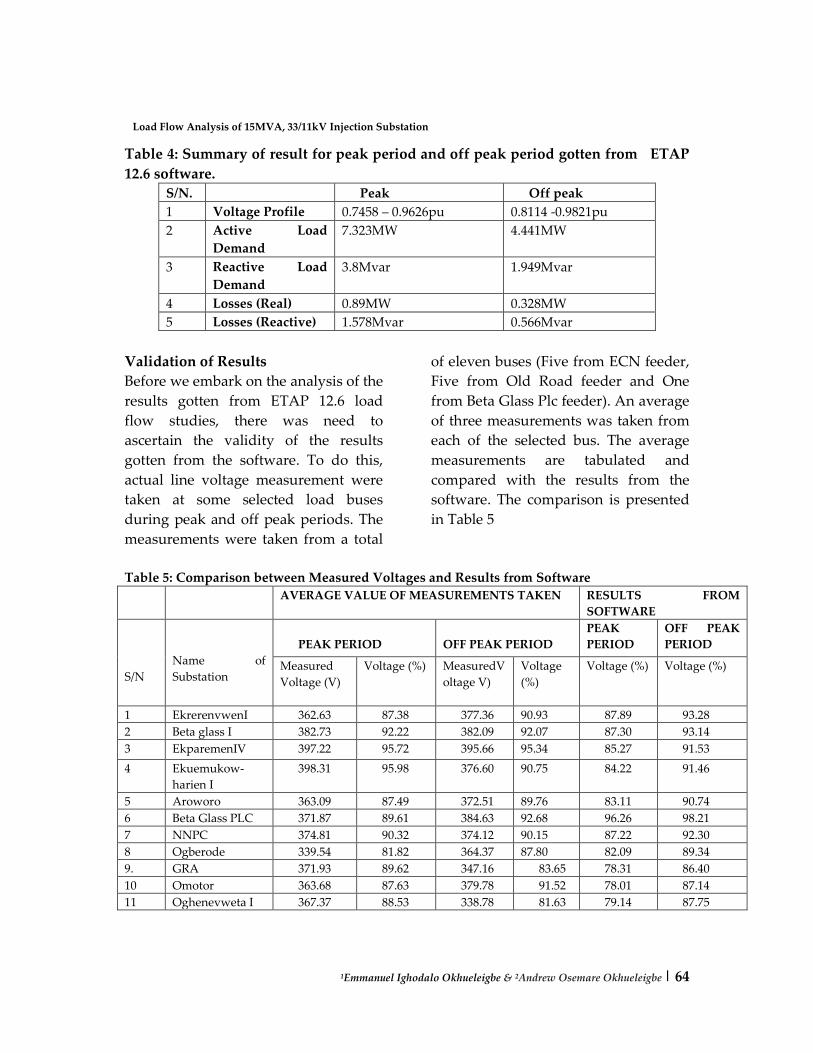
Table 4: Summary of result for peak period and off peak period gotten from ETAP
12.6 software.
S/N. Peak Off peak
1 Voltage Profile 0.7458 – 0.9626pu 0.8114 -0.9821pu
2 Active Load
Demand
7.323MW 4.441MW
3 Reactive Load
Demand
3.8Mvar 1.949Mvar
4 Losses (Real) 0.89MW 0.328MW
5 Losses (Reactive) 1.578Mvar 0.566Mvar
Validation of Results
Before we embark on the analysis of the
results gotten from ETAP 12.6 load
flow studies, there was need to
ascertain the validity of the results
gotten from the software. To do this,
actual line voltage measurement were
taken at some selected load buses
during peak and off peak periods. The
measurements were taken from a total
of eleven buses (Five from ECN feeder,
Five from Old Road feeder and One
from Beta Glass Plc feeder). An average
of three measurements was taken from
each of the selected bus. The average
measurements are tabulated and
compared with the results from the
software. The comparison is presented
in Table 5
Table 5: Comparison between Measured Voltages and Results from Software
AVERAGE VALUE OF MEASUREMENTS TAKEN RESULTS FROM
SOFTWARE
S/N
Name of
Substation
PEAK PERIOD
OFF PEAK PERIOD
PEAK
PERIOD
OFF PEAK
PERIOD
Measured
Voltage (V)
Voltage (%) MeasuredV
oltage V)
Voltage
(%)
Voltage (%)
Voltage (%)
1 EkrerenvwenI 362.63 87.38 377.36 90.93 87.89 93.28
2 Beta glass I 382.73 92.22 382.09 92.07 87.30 93.14
3 EkparemenIV 397.22 95.72 395.66 95.34 85.27 91.53
4 Ekuemukow-
harien I
398.31 95.98 376.60 90.75 84.22 91.46
5 Aroworo 363.09 87.49 372.51 89.76 83.11 90.74
6 Beta Glass PLC 371.87 89.61 384.63 92.68 96.26 98.21
7 NNPC 374.81 90.32 374.12 90.15 87.22 92.30
8 Ogberode 339.54 81.82 364.37 87.80 82.09 89.34
9. GRA 371.93 89.62 347.16 83.65 78.31 86.40
10 Omotor 363.68 87.63 379.78 91.52 78.01 87.14
11 Oghenevweta I 367.37 88.53 338.78 81.63 79.14 87.75
1Emmanuel Ighodalo Okhueleigbe & 2Andrew Osemare Okhueleigbe | 65
International Journal of Engineering and Emerging Scientific Discovery
Volume 3, Number 1, March 2018
Thus: Voltage Magnitude (%) =
Measured Voltage / 415
(20)
Formula for software result validation,
(21)
*100%
(22)
Further analysis of results in Table 5
shows that the percentage errors
between the actual measured values
and the result from the software lies
between -7.50% and 12.25% with the
lowest deviation occurring at
Oghenevweta I substation and the
highest deviation occurring at
Ekuemukowharien I substation. These
deviations are partly as a result of
unbalanced load on the lines and the
voltage drop along the short cable
connecting the transformers to the
11kV line which was considered while
modeling the network. Thus one can
say that the software is sufficiently
accurate and the results are valid and
are true reflection of the network.
RESULT DISCUSSION AND
CONCLUSION
From the Load flow analyses of
Ughelli-15, 15MVA Injection Substation
network. The study shows that the state
of the present network was
unsatisfactory due to high losses,
valuation of voltage regulation in
virtually all the buses.
1. During peak period the highest
percentage voltage drop was
21.99% at Omotor sub-station
bus and the lowest percentage
was 3.74% at Beta Glass load
feeder bus.
2. During off peak the lowest
percentage voltage drop was
1.79% at Beta Glass load feeder
bus and highest percentage
voltage drop was 13.44% at
Igbudu Sub-station bus.
3. The load during peak period is
7.323MW and 3.8Mvar. While
for off peak period is 4.441MW
and 1.949Mvar.
4. The total loss during peak
period is 0.89MW, 1.578Mvar.
and 0.328MW, 0.566Mvar. at off
peak period.
5. Frequent power outages from
both generating stations and
transmission lines in Nigeria
Power System include frequent
tripping of the 33/11kVA lines
resulting in too many
unplanned outages in the
system.
6. Ughelli-15, 15 MVA Injection
Substation was studied which
comprises of 63 substations
comprising of three (3) Feeders,
Energy Commission of Nigeria
(ECN) feeder (29), Old Road
feeder (33) and Beta Glass
feeder (1) which is also a point
load. Etisalat substation has not
been commissioned, Visafone
substation was disconnected for
non- payment, Onirigho
substation has not been
commissioned all substation

1Emmanuel Ighodalo Okhueleigbe & 2Andrew Osemare Okhueleigbe | 66
Load Flow Analysis of 15MVA, 33/11kV Injection Substation
mentioned above are connected
to Old Road feeder, Ekparemre
III substation was out of service
as a result of bunted coils the
said transformer is connected to
ECN feeder, the above
information given was as at the
time of data collection.
REFERENCE
Okolobah V., Ismail Z. (2013). “On the
issues, challenges and Prospects
of Electrical Power Sector in
Nigeria ” International Journal
of Economy, Management and
Social
Science. www.nercng.org/index
.php?
option=com_content&task=view
&id=69&Itemid=8; visited
27/9/2011 www.marketresearch.
com.
Odueme, S. (2001). In
www.independentngonline.co
m; visited
16/11/2011.www.nigeriatoday.
com/basic_facts_about_nigeria.
htm; visited 16/11/2011.
E.I. Okhueleigbe (2016). Enhancing
Power Distribution Network
using Distributed Flexible
Alternating Current
Transmission System (D-
FACTS) Devices, P.hD Thesis
University of Benin, Benin City,
Edo State, Nigeria.
(https://en.wikipedia.org/wiki/P
ower-flow_study) visited 15th
August, 2015). Presidential Task
force on Power; 10th January,
2011.