Embed Size (px)
Citation preview
ww
ww
.rea
ch-e
nerg
y.eu
LOCAL ACTION PLAN ON ENERGY POVERTY
Zasavje, SLOVENIA
Аuthor: Tomislav TKALEC
December 2014
ww
ww
.rea
ch-e
nerg
y.eu
2
This document is product of the activities under the second work package(WP2) of the project REACH (Reduce Energy Consumption andChange Habits), co-funded by the Intelligent Energy Europe Program ofthe European Union.
ww
ww
.rea
ch-e
nerg
y.eu
3
CONTENTS
1. INTRODUCTION...................................................................................................4
1.1 AIM OF THE ACTION PLAN.................................................................................5
2. DATA ABOUT ENERGY POVERTY IN POMURJE......................................................5
3. STAKEHOLDERS RELATED TO ENERGY POVERTY...............................................11
4. TARGET GROUPS..............................................................................................12
5. ACTION PLAN....................................................................................................13
ww
ww
.rea
ch-e
nerg
y.eu
4
1. INTRODUCTION
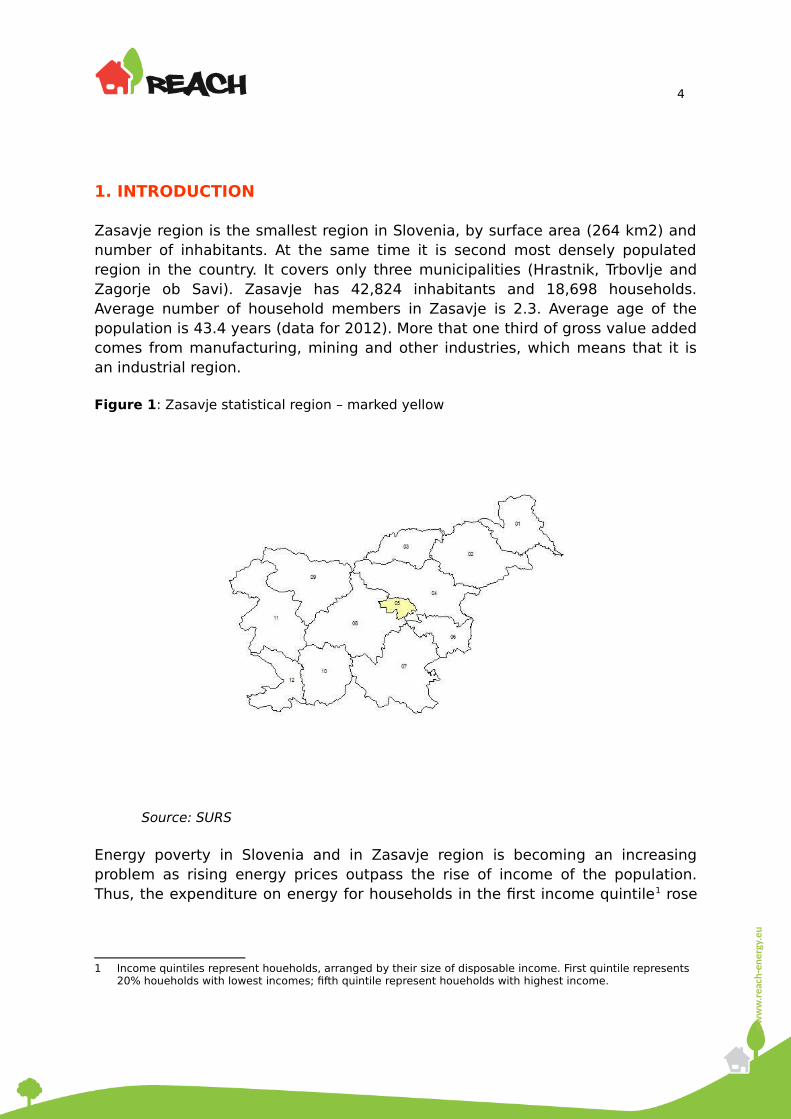
Zasavje region is the smallest region in Slovenia, by surface area (264 km2) andnumber of inhabitants. At the same time it is second most densely populatedregion in the country. It covers only three municipalities (Hrastnik, Trbovlje andZagorje ob Savi). Zasavje has 42,824 inhabitants and 18,698 households.Average number of household members in Zasavje is 2.3. Average age of thepopulation is 43.4 years (data for 2012). More that one third of gross value addedcomes from manufacturing, mining and other industries, which means that it isan industrial region.
Figure 1: Zasavje statistical region – marked yellow
Source: SURS
Energy poverty in Slovenia and in Zasavje region is becoming an increasingproblem as rising energy prices outpass the rise of income of the population.Thus, the expenditure on energy for households in the first income quintile1 rose
1 Income quintiles represent houeholds, arranged by their size of disposable income. First quintile represents 20% houeholds with lowest incomes; fifth quintile represent houeholds with highest income.
ww
ww
.rea
ch-e
nerg
y.eu
5
sharply in the couple of last years and in 2010 represented 17.4% of all availableresources of individual households (in 2000: 13.1%)2.
1.1 AIM OF THE ACTION PLAN
The aim of this document is to define stakeholders, target groups and type ofactivities, that will be implemented in the Zasavje area. Action plan includes atimetable in order to make those actions more effective.
Furthermore this local action plan includes some of the relevant statistical dataabout the region, in particular social, economic and energy indicators, related tothe issue of energy poverty.
2. DATA ABOUT ENERGY POVERTY IN POMURJE
Social, economic and energy indicators in the Zasavje area, that affect the issueof fuel poverty, are presented in this part of the document. Information and dataabout energy poverty on the national level is presented in the document ''Reporton national situation in the field of energy poverty''3. In the absence of adequatedata on energy poverty for the regional level, only available indicators that showthe regional picture are presented in this document. For creating a broaderpicture about the state of energy poverty issue in Slovenia and in Zasavje region,it is advisable to read the above-mentioned report as well.
Extent of the housing stock
In 2011, according to Statistical Office of Republic of Slovenia (SURS)4, there are844,656 apartments in Slovenia. In Zasavje region there are 17,974 apartments5,the lowest number from all the regions.
Average size of dwellings
Average floor space of dwellings is 79.6 m2 (SURS, data for 2011). In Zasavjeaverage size of dwellings is slightly smaller (70.3 m2), mainly because there aremore multi-apartment buildings in rural areas, built for miners, who moved to theregion.
2 SURS: http://www.stat.si/novica_prikazi.aspx?id=51643 REACH, 2014: Report on national situation in the field of energy poverty. Available at: http://reach-
energy.eu/wordpress/wp-content/uploads/2014/12/D2.2-Focus_EN.pdf4 SURS: http://www.stat.si/novica_prikazi.aspx?id=47715 SURS: http://www.stat.si/PrikaziDatoteko.aspx?id=5930
ww
ww
.rea
ch-e
nerg
y.eu
6
Table 1: Size of dwellings (in %), data for 2002Up to 20 m2 21-40 m2 41-60 m2 61-80 m2 81-100 m2 Above 101 m2
Slovenia 1.4 13.4 25.8 27.2 17.5 14.6
Zasavje 0.6 16.4 34.3 28.7 12.9 7.2
Source: SURS
GDP per capita
Since 2008, the decline of GDP per capita is noted in Slovenia, which coincideswith the start of the financial crisis. Zasavje has lowest GDP per capita from allregions in Slovenia. The gap when compared to the Central-Slovenian region isespecially apparent, because the latter's GDP per capita was 24,170 EUR in 2012.
Table 2: GDP per capita (in EUR)
2008 2009 2010 2011 2012
Slovenia 18,420 17,349 17,320 17,610 17,172
Zasavje 12,291 11,570 11,697 11,794 11,022
Source: SURS
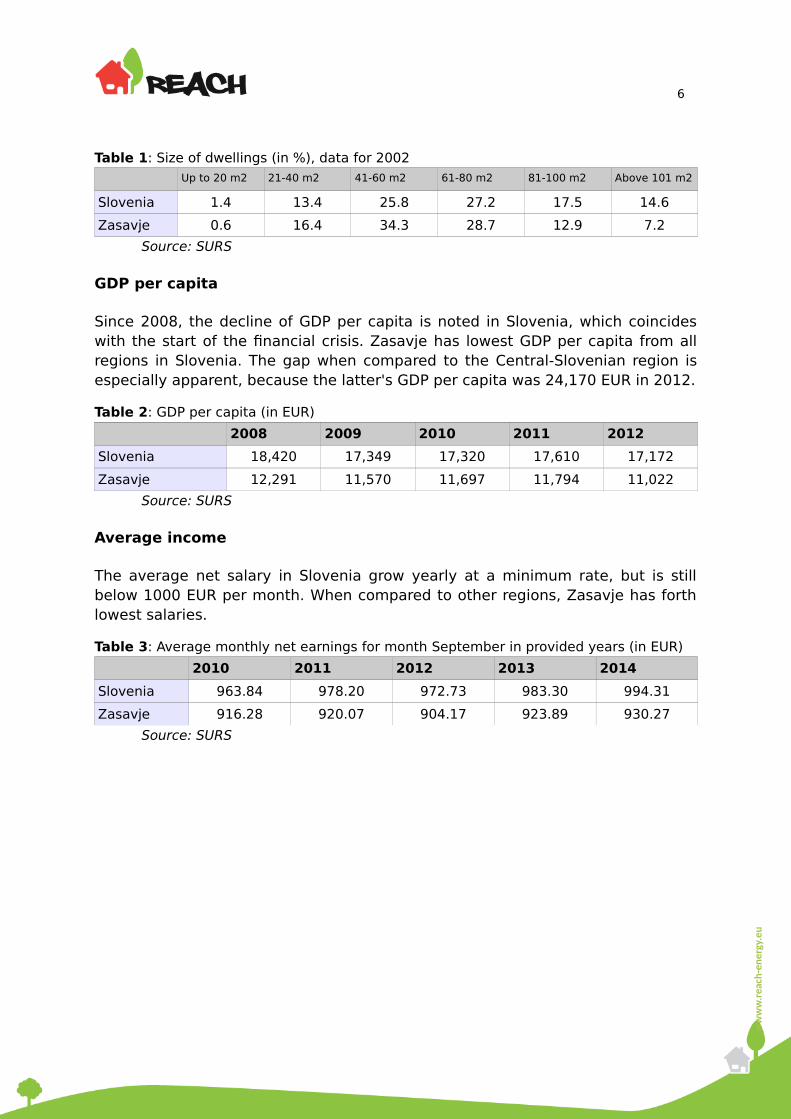
Average income
The average net salary in Slovenia grow yearly at a minimum rate, but is stillbelow 1000 EUR per month. When compared to other regions, Zasavje has forthlowest salaries.
Table 3: Average monthly net earnings for month September in provided years (in EUR)
2010 2011 2012 2013 2014
Slovenia 963.84 978.20 972.73 983.30 994.31
Zasavje 916.28 920.07 904.17 923.89 930.27
Source: SURS
ww
ww
.rea
ch-e
nerg
y.eu
7
Figure 2: Average monthly earnings for September 2014, in regions,, Zasavje is no. 5
Source: SURS
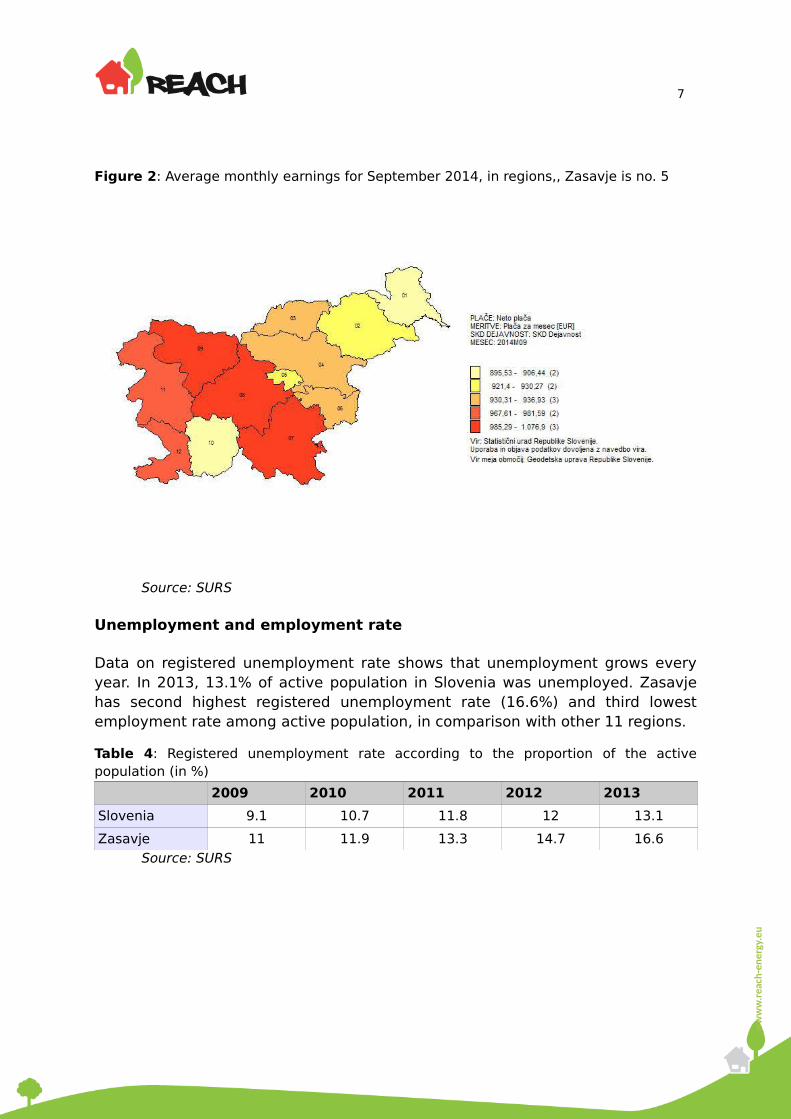
Unemployment and employment rate
Data on registered unemployment rate shows that unemployment grows everyyear. In 2013, 13.1% of active population in Slovenia was unemployed. Zasavjehas second highest registered unemployment rate (16.6%) and third lowestemployment rate among active population, in comparison with other 11 regions.
Table 4: Registered unemployment rate according to the proportion of the activepopulation (in %)
2009 2010 2011 2012 2013
Slovenia 9.1 10.7 11.8 12 13.1
Zasavje 11 11.9 13.3 14.7 16.6Source: SURS
ww
ww
.rea
ch-e
nerg
y.eu
8
Figure 3: Registered unemployment rate, for 2013, Zasavje is no. 5
Source: SURS
Table 5: Employment rate among active population (in %)
2009 2010 2011 2012 2013
Slovenia 60.5 58.8 58.1 57.4 -
Zasavje 57.8 56.2 55.2 54.8 -
Source: SURS
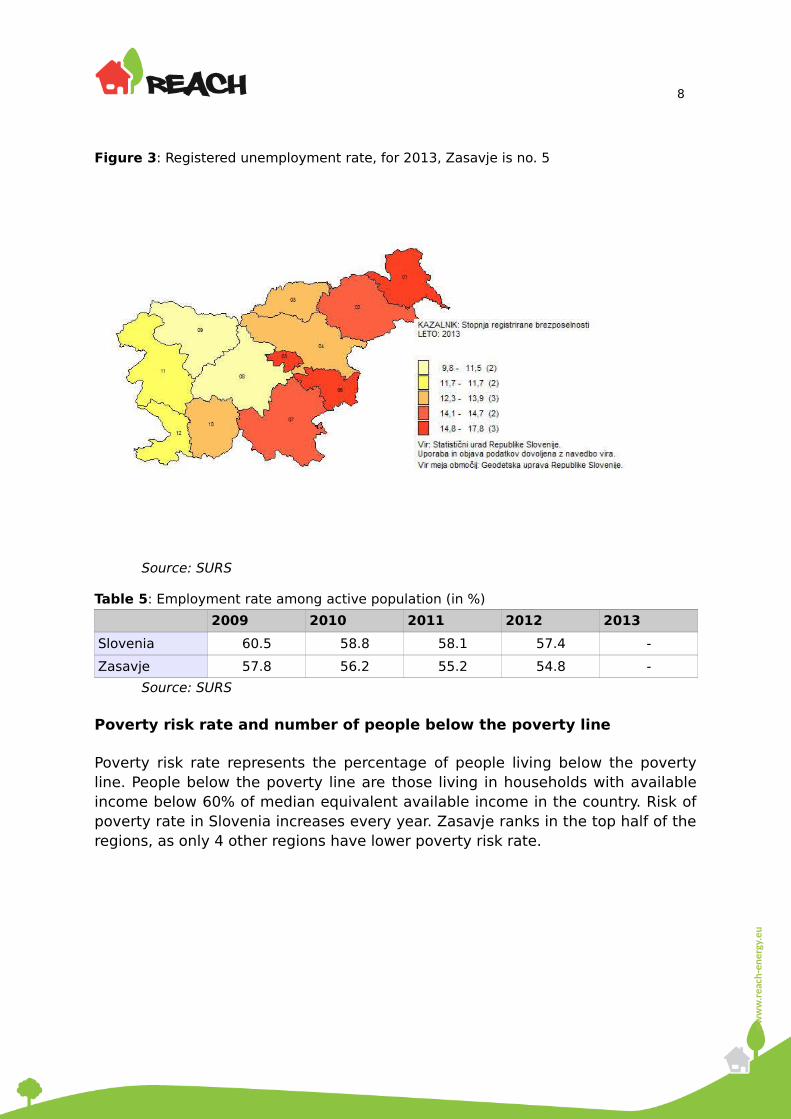
Poverty risk rate and number of people below the poverty line
Poverty risk rate represents the percentage of people living below the povertyline. People below the poverty line are those living in households with availableincome below 60% of median equivalent available income in the country. Risk ofpoverty rate in Slovenia increases every year. Zasavje ranks in the top half of theregions, as only 4 other regions have lower poverty risk rate.
ww
ww
.rea
ch-e
nerg
y.eu
9
Table 6: Poverty risk rate and number of people below poverty line
2009 2010 2011 2012 2013
Poverty risk rate (% of people)
Slovenia 11.3 12.7 13.6 13.5 14.5
Zasavje 11.1 10.6 12.6 13.2 14.0
Number of people below poverty line
Slovenia 223,000 254,000 273,000 271,000 291,000
Zasavje 6,000 5,000 6,000 7,000 6,000
Source: SURS
Figure 4: Poverty risk rate, Zasavje is no. 5
Source: SURS
Recipients of social support
Social support is given to those individuals, who cannot provide means for theirminimum survival needs, due to the circumstances, which they cannot control.The average value of state support in 2013 was 253.29 EUR6. There is nocomprehensive statistics in this area. Data on the number of different recipientsof social support are available for 2010 (94,000 recipients7) and 2011 (86,000
6 MDDSZ: http://www.mddsz.gov.si/si/uveljavljanje_pravic/statistika/denarna_socialna_pomoc/7 SURS: http://www.stat.si/obcinevstevilkah/Vsebina.aspx?leto=2012&ClanekNaslov=SocialnaDenarnaPomoc
ww
ww
.rea
ch-e
nerg
y.eu
10
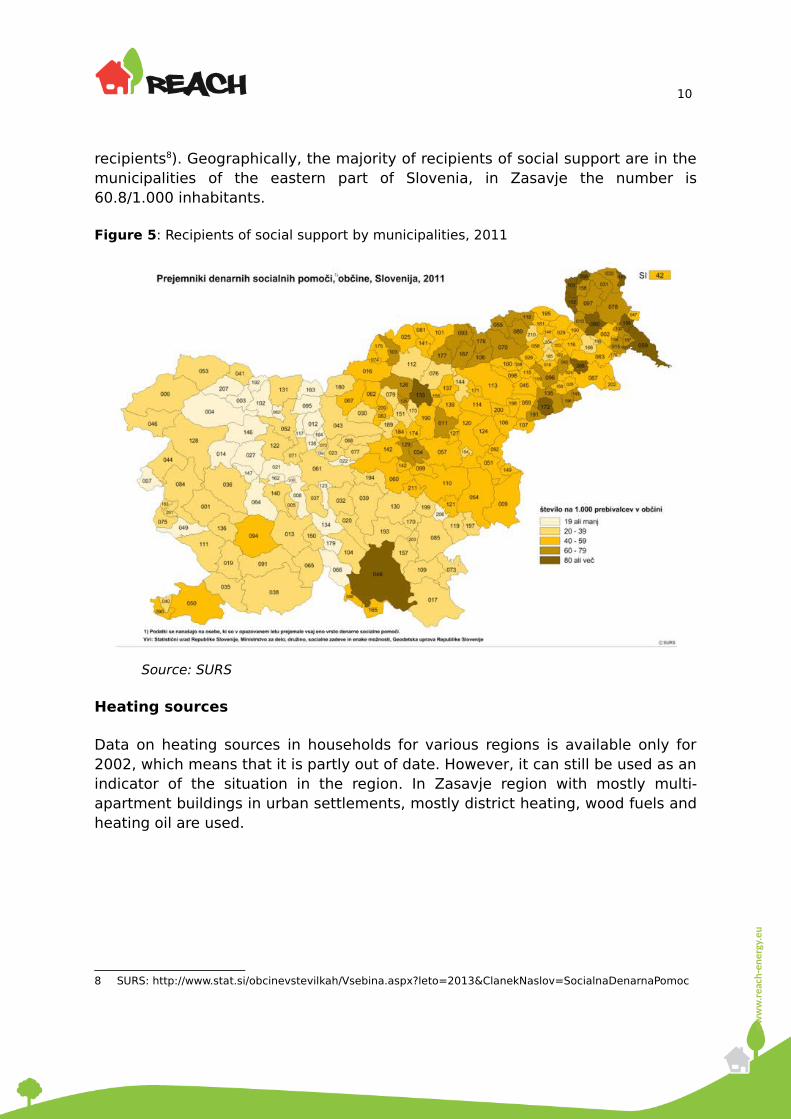
recipients8). Geographically, the majority of recipients of social support are in themunicipalities of the eastern part of Slovenia, in Zasavje the number is60.8/1.000 inhabitants.
Figure 5: Recipients of social support by municipalities, 2011
Source: SURS
Heating sources
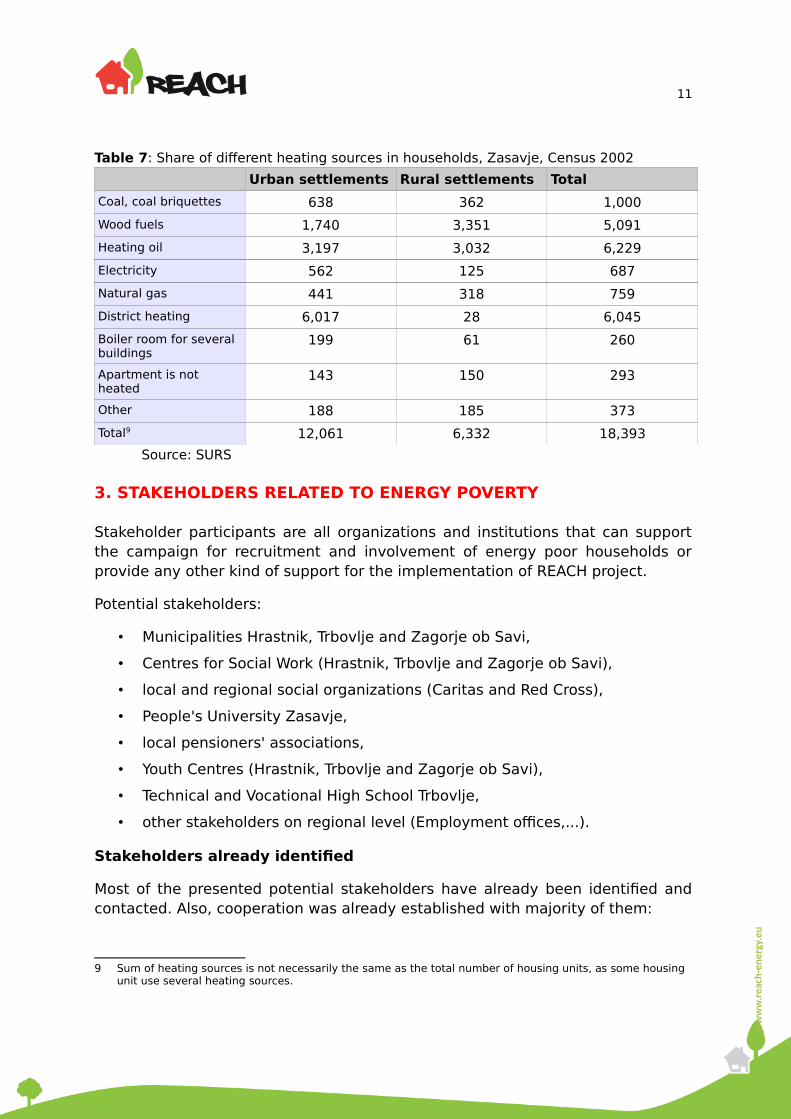
Data on heating sources in households for various regions is available only for2002, which means that it is partly out of date. However, it can still be used as anindicator of the situation in the region. In Zasavje region with mostly multi-apartment buildings in urban settlements, mostly district heating, wood fuels andheating oil are used.
8 SURS: http://www.stat.si/obcinevstevilkah/Vsebina.aspx?leto=2013&ClanekNaslov=SocialnaDenarnaPomoc
ww
ww
.rea
ch-e
nerg
y.eu
11
Table 7: Share of different heating sources in households, Zasavje, Census 2002
Urban settlements Rural settlements Total
Coal, coal briquettes 638 362 1,000
Wood fuels 1,740 3,351 5,091
Heating oil 3,197 3,032 6,229
Electricity 562 125 687
Natural gas 441 318 759
District heating 6,017 28 6,045
Boiler room for several buildings
199 61 260
Apartment is not heated
143 150 293
Other 188 185 373
Total9 12,061 6,332 18,393
Source: SURS
3. STAKEHOLDERS RELATED TO ENERGY POVERTY
Stakeholder participants are all organizations and institutions that can supportthe campaign for recruitment and involvement of energy poor households orprovide any other kind of support for the implementation of REACH project.
Potential stakeholders:
• Municipalities Hrastnik, Trbovlje and Zagorje ob Savi,
• Centres for Social Work (Hrastnik, Trbovlje and Zagorje ob Savi),
• local and regional social organizations (Caritas and Red Cross),
• People's University Zasavje,
• local pensioners' associations,
• Youth Centres (Hrastnik, Trbovlje and Zagorje ob Savi),
• Technical and Vocational High School Trbovlje,
• other stakeholders on regional level (Employment offices,...).
Stakeholders already identified
Most of the presented potential stakeholders have already been identified andcontacted. Also, cooperation was already established with majority of them:
9 Sum of heating sources is not necessarily the same as the total number of housing units, as some housing unit use several heating sources.
ww
ww
.rea
ch-e
nerg
y.eu
12
• Municipalities Hrastnik, Trbovlje and Zagorje ob Savi (interested in projectand its results; involved in prectise for students),
• Centres for Social Work (Hrastnik, Trbovlje and Zagorje ob Savi) (arecontacting and taking care of applications of households),
• local and regional social organizations (Caritas and Red Cross in Zagorjeare aware of the project; Caritas Trbovlje is contacting and taking care ofapplications of households),
• People's University Zasavje (aware of the project),
• Youth Centres (Hrastnik, Trbovlje and Zagorje ob Savi) (helping withimplementation of visits – devices for households are stored in theirpremises),
• Technical and Vocational High School Trbovlje (involved in training andpractice of students).
4. TARGET GROUPS
Given the objectives of REACH project, there are two target groups:
• households at risk of energy poverty,
• high schools, teachers and students.
Households at risk of energy poverty are the main target group of this project, aswithin its duration 200 visits are going to be implemented in Zasavje. Thespecific aim of the visits is to analyse energy and water consumption, giveadvice in order to achieve savings, and provide a set of saving devices, with theaim of reducing energy costs.
High schools, teachers and students are the next group to be targeted. Thepurpose of communication and cooperation with them is to build a partnership inexecution of activities of the project.
ww
ww
.rea
ch-e
nerg
y.eu
13
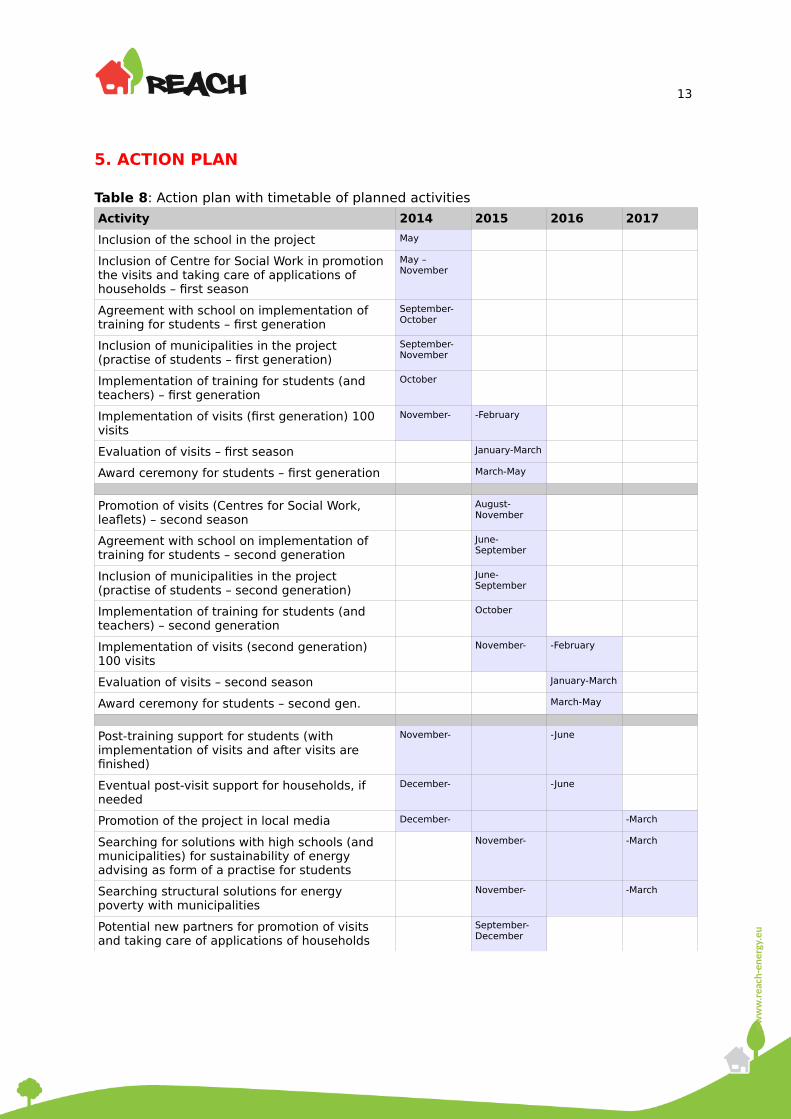
5. ACTION PLAN
Table 8: Action plan with timetable of planned activities
Activity 2014 2015 2016 2017
Inclusion of the school in the project May
Inclusion of Centre for Social Work in promotion the visits and taking care of applications of households – first season
May – November
Agreement with school on implementation of training for students – first generation
September-October
Inclusion of municipalities in the project (practise of students – first generation)
September-November
Implementation of training for students (and teachers) – first generation
October
Implementation of visits (first generation) 100 visits
November- -February
Evaluation of visits – first season January-March
Award ceremony for students – first generation March-May
Promotion of visits (Centres for Social Work, leaflets) – second season
August-November
Agreement with school on implementation of training for students – second generation
June-September
Inclusion of municipalities in the project (practise of students – second generation)
June-September
Implementation of training for students (and teachers) – second generation
October
Implementation of visits (second generation) 100 visits
November- -February
Evaluation of visits – second season January-March
Award ceremony for students – second gen. March-May
Post-training support for students (with implementation of visits and after visits are finished)
November- -June
Eventual post-visit support for households, if needed
December- -June
Promotion of the project in local media December- -March
Searching for solutions with high schools (and municipalities) for sustainability of energy advising as form of a practise for students
November- -March
Searching structural solutions for energy poverty with municipalities
November- -March
Potential new partners for promotion of visits and taking care of applications of households
September-December
ww
ww
.rea
ch-e
nerg
y.eu
14
Partners
Focus – Association for sustainable development, Slovenja
www.focus.si
DOOR – Society for Sustainable Development Design, Croatia
www.door.hr
EAP – Energy Agency of Plovdiv, Bulgaria
www.eap-save.eu
MACEF – Мacedonian Centre for Energy efficiency, Macedonia
www.macef.org.mk
Co-funded by
Co-funded by the Intelligent Energy Europe Programme of the European Union
The sole responsibility for the content of this document lies withthe authors. It does not necessarily reflect the opinion of theEuropean Union. Neither the EACI nor the European Commissionare responsible for any use that may be made of the informationcontained therein.
For more information about EU: www.ec.europa.eu