Embed Size (px)
Citation preview

Local Transport Plan 3 Joint Strategy for South Hampshire

Contents
Introduction to South Hampshire ..................................................................................... 1
How this Joint LTP3 Strategy was developed ............................................................. 2
Policy Background ............................................................................................................. 4
Transport Vision for South Hampshire ........................................................................... 6
Challenges facing South Hampshire .............................................................................. 7
Transport Outcomes .......................................................................................................... 9
Transport Policies............................................................................................................... 9
Glossary ............................................................................................................................29
For a copy of this publication in another language or format (e.g. large print or audio) please contact 0845 603 5633 or [email protected]
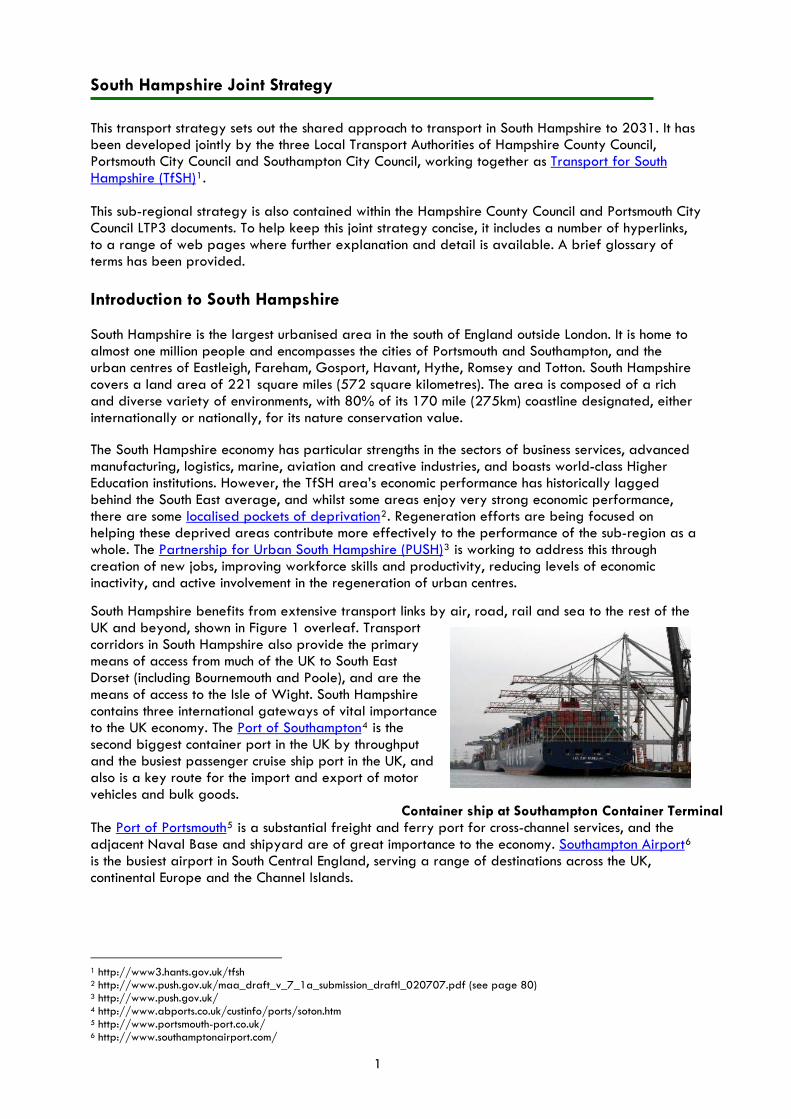
South Hampshire Joint Strategy
This transport strategy sets out the shared approach to transport in South Hampshire to 2031. It has been developed jointly by the three Local Transport Authorities of Hampshire County Council, Portsmouth City Council and Southampton City Council, working together as Transport for South Hampshire (TfSH)1. This sub-regional strategy is also contained within the Hampshire County Council and Portsmouth City Council LTP3 documents. To help keep this joint strategy concise, it includes a number of hyperlinks, to a range of web pages where further explanation and detail is available. A brief glossary of terms has been provided. Introduction to South Hampshire South Hampshire is the largest urbanised area in the south of England outside London. It is home to almost one million people and encompasses the cities of Portsmouth and Southampton, and the urban centres of Eastleigh, Fareham, Gosport, Havant, Hythe, Romsey and Totton. South Hampshire covers a land area of 221 square miles (572 square kilometres). The area is composed of a rich and diverse variety of environments, with 80% of its 170 mile (275km) coastline designated, either internationally or nationally, for its nature conservation value. The South Hampshire economy has particular strengths in the sectors of business services, advanced manufacturing, logistics, marine, aviation and creative industries, and boasts world-class Higher Education institutions. However, the TfSH area’s economic performance has historically lagged behind the South East average, and whilst some areas enjoy very strong economic performance, there are some localised pockets of deprivation2. Regeneration efforts are being focused on helping these deprived areas contribute more effectively to the performance of the sub-region as a whole. The Partnership for Urban South Hampshire (PUSH)3 is working to address this through creation of new jobs, improving workforce skills and productivity, reducing levels of economic inactivity, and active involvement in the regeneration of urban centres. South Hampshire benefits from extensive transport links by air, road, rail and sea to the rest of the UK and beyond, shown in Figure 1 overleaf. Transport corridors in South Hampshire also provide the primary means of access from much of the UK to South East Dorset (including Bournemouth and Poole), and are the means of access to the Isle of Wight. South Hampshire contains three international gateways of vital ito the UK economy. The
mportance Port of Southampton4 is the
second biggest container port in the UK by throughput and the busiest passenger cruise ship port in the UK, andalso is a key route for the import and export of motor vehicles and bulk goods.
Container ship at Southampton Container Terminal The Port of Portsmouth5 is a substantial freight and ferry port for cross-channel services, and the adjacent Naval Base and shipyard are of great importance to the economy. Southampton Airport6 is the busiest airport in South Central England, serving a range of destinations across the UK, continental Europe and the Channel Islands.
1 http://www3.hants.gov.uk/tfsh 2 http://www.push.gov.uk/maa_draft_v_7_1a_submission_draftl_020707.pdf (see page 80) 3 http://www.push.gov.uk/ 4 http://www.abports.co.uk/custinfo/ports/soton.htm 5 http://www.portsmouth-port.co.uk/ 6 http://www.southamptonairport.com/
1
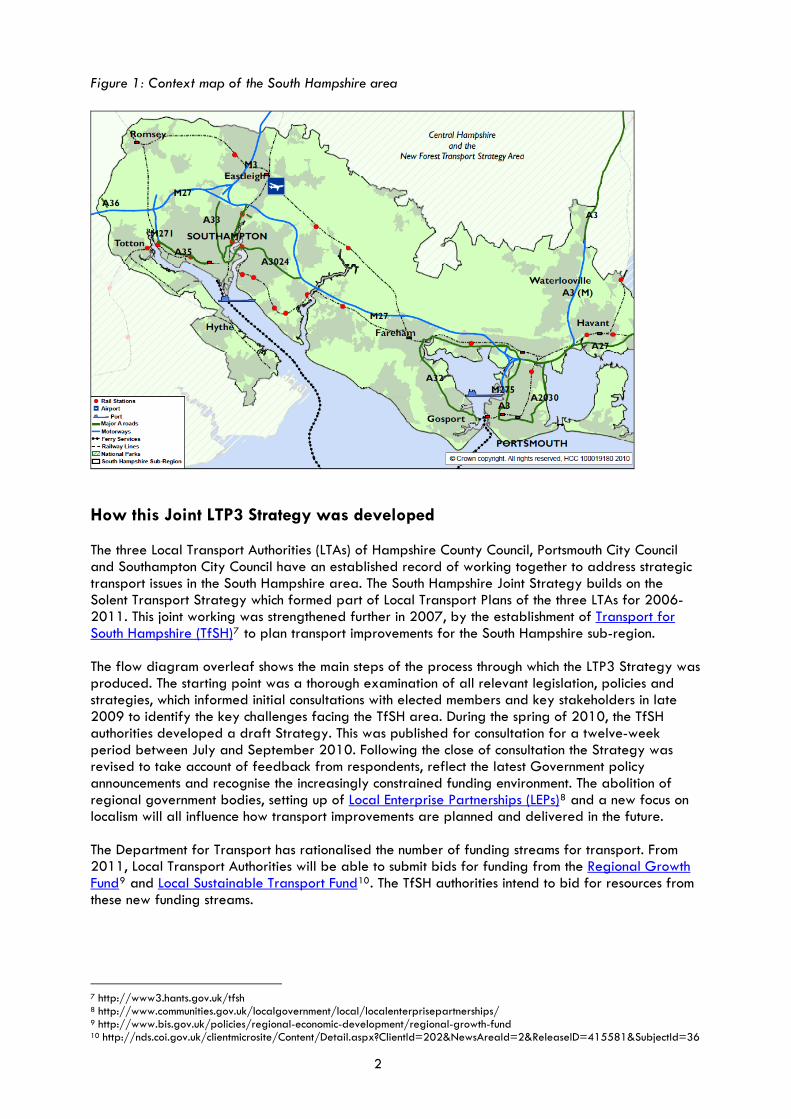
Figure 1: Context map of the South Hampshire area
How this Joint LTP3 Strategy was developed The three Local Transport Authorities (LTAs) of Hampshire County Council, Portsmouth City Council and Southampton City Council have an established record of working together to address strategic transport issues in the South Hampshire area. The South Hampshire Joint Strategy builds on the Solent Transport Strategy which formed part of Local Transport Plans of the three LTAs for 2006-2011. This joint working was strengthened further in 2007, by the establishment of Transport for South Hampshire (TfSH)7 to plan transport improvements for the South Hampshire sub-region. The flow diagram overleaf shows the main steps of the process through which the LTP3 Strategy was produced. The starting point was a thorough examination of all relevant legislation, policies and strategies, which informed initial consultations with elected members and key stakeholders in late 2009 to identify the key challenges facing the TfSH area. During the spring of 2010, the TfSH authorities developed a draft Strategy. This was published for consultation for a twelve-week period between July and September 2010. Following the close of consultation the Strategy was revised to take account of feedback from respondents, reflect the latest Government policy announcements and recognise the increasingly constrained funding environment. The abolition of regional government bodies, setting up of Local Enterprise Partnerships (LEPs)8 and a new focus on localism will all influence how transport improvements are planned and delivered in the future. The Department for Transport has rationalised the number of funding streams for transport. From 2011, Local Transport Authorities will be able to submit bids for funding from the Regional Growth Fund9 and Local Sustainable Transport Fund10. The TfSH authorities intend to bid for resources from these new funding streams.
7 http://www3.hants.gov.uk/tfsh 8 http://www.communities.gov.uk/localgovernment/local/localenterprisepartnerships/ 9 http://www.bis.gov.uk/policies/regional-economic-development/regional-growth-fund 10 http://nds.coi.gov.uk/clientmicrosite/Content/Detail.aspx?ClientId=202&NewsAreaId=2&ReleaseID=415581&SubjectId=36
2

Joint LTP3 South Hampshire Strategy Development Process
Consideration of
policy context & guidance
National
Legislation Policy Guidance
Sub-regional
Policy Strategy
Local
Plans Policy Strategy
LTP3 Strategy, Policy &
Intervention Development
Initial consultations on challenges (Nov
09-Feb 10) Transport Vision for
South Hampshire
Draft Joint Strategy
Transport Challenges for South Hampshire
12 Week Public Consultation (Jul 10-
Sept 10)
Toolkit of delivery options
Outcomes
Policies
Final Joint Strategy
PCC Implementation
Plan
SCC Implementation Plan
HCC Implementation
Plan
South H nts share
interven ons
adti
Implementation Plan
Development
3
Policy Background The TfSH authorities are each required to have a current Local Transport Plan as a statutory requirement of the Local Transport Act (2008)11. The Joint Strategy has been informed by a framework of national, “sub-regional” and local policy.
The transport strategy for South Hampshire has taken into account national legislation, policy and guidance and a number of key sub-regional and local level plans and strategies, as outlined in Table 2, below. The flow diagram on the previous page illustrates how legislation and policies have informed the production of the Joint Strategy.
Table 2 – The National, sub-regional and local policy context
Level Legislation, plan, strategy or guidanceNational legislation, policy and guidance
The Stern review on the Economics of Climate Change12 (October 2006); The Eddington Transport Study13 (December 2006); The Local Transport Act 200814; The Climate Change Act 200815; Delivering a Sustainable Transport System16, (November 2008); A Safer Way: Consultation on Making Britain's Roads the safest in the world17 (April 2009); Guidance on Local Transport Plans18 (July 2009); Low Carbon Transport: A Greener Future19 (July 2009); The Coalition: Our programme for government20 (May 2010); Local Growth: realising every place’s potential21 (October 2010); Healthy lives, healthy people: our strategy for public health in England22 (November 2010); Decentralisation and Localisation Bill23 (December 2010).
Sub-regional policies and strategies
Towards Delivery: The Transport for South Hampshire statement24 (April 2008) Transport for South Hampshire Freight Strategy25 (June 2009) Transport for South Hampshire Reduce26 and Manage Strategies (consultation drafts); The South Hampshire Agreement - Multi-Area Agreement (MAA)27 (March 2010).
Local plans, policies and strategies
Local Development Frameworks (LDFs) of local planning authorities 28;
11 http://www.opsi.gov.uk/acts/acts2008/pdf/ukpga_20080026_en.pdf 12 http://www.hm-treasury.gov.uk/sternreview_index.htm 13 http://www.dft.gov.uk/about/strategy/transportstrategy/eddingtonstudy/ 10 http://www.opsi.gov.uk/acts/acts2008/ukpga_20080026_en_1 15 http://www.opsi.gov.uk/acts/acts2008/ukpga_20080027_en_1 16 http://www.dft.gov.uk/about/strategy/transportstrategy/dasts/ 17 http://www.dft.gov.uk/consultations/closed/roadsafetyconsultation/roadsafetyconsultation.pdf 18 http://www.dft.gov.uk/adobepdf/165237/ltp-guidance.pdf 19 http://webarchive.nationalarchives.gov.uk/+/http:/www.dft.gov.uk/pgr/sustainable/carbonreduction/low-carbon.pdf 20 http://www.cabinetoffice.gov.uk/media/409088/pfg_coalition.pdf 21 http://www.bis.gov.uk/assets/biscore/regional/docs/l/cm7961-local-growth-white-paper.pdf 22 http://www.dh.gov.uk/en/Publicationsandstatistics/Publications/PublicationsPolicyAndGuidance/DH_121941 23 http://www.communities.gov.uk/localgovernment/decentralisation/localismbill/ 24 http://www3.hants.gov.uk/tfsh-towards-delivery-april-2008.pdf 25 http://www3.hants.gov.uk/tfsh/tfsh-freight-strategy.htm 26 http://www3.hants.gov.uk/tfsh/tfsh-what-tfsh-does/tfsh-reduce.htm 27 http://www.push.gov.uk/priorities/multi_area_agreement.htm 28 - Southampton LDF: http://www.southampton.gov.uk/s-environment/policy/developmentframework/
- Portsmouth LDF: http://www.portsmouth.gov.uk/living/3850.html - Havant LDF: http://www.havant.gov.uk/havant-4302 - Fareham LDF: http://www.fareham.gov.uk/council/departments/planning/ldf/ - Eastleigh LDF: http://www.eastleigh.gov.uk/planning--building-control/planning-policy-and-design/planning-
policies-and-design/local-development-framework.aspx - Gosport LDF: http://www.gosport.gov.uk/sections/your-council/council-services/planning-section/local-
development-framework/ - East Hampshire LDF: http://www.easthants.gov.uk/ehdc/planningpolicy.nsf/webpages/LDF - New Forest LDF: http://www.newforest.gov.uk/index.cfm?articleid=6142 - Test Valley LDF: http://www.testvalley.gov.uk/default.aspx?page=4683 - Winchester City Council LDF: http://www.winchester.gov.uk/Business/Planning/LocalDevelopmentFramework/
4
Level Legislation, plan, strategy or guidanceLocal plans, policies and strategies(cont)
Hampshire County Council's Draft Economic Assessment29 (final version due April 2011); Existing and emerging Local Authority Economic Development Strategies for PUSH30, Hampshire, Portsmouth & SouthamptonThe Sustainable Community Strategies of Hampshire31, Portsmouth32 and Southampton33; Corporate strategy of Hampshire34, and Corporate Plans of Portsmouth35 and Southampton36; Children and Young Peoples Plans of Hampshire37, Portsmouth38 and Southampton39.
Infrastructure-related plans
Port of Southampton Master Plan40
Southampton Airport Master Plan41
South West Main Line Route Utilisation Strategy (RUS)42
Freight Route Utilisation Strategy (RUS)43
Strategic Freight Network(Network Rail/ DfT)44
No reference has been made in the policy table to the regional level, as this tier of planning has been abolished by the coalition government and is set to be replaced by a National Planning Framework. An increased focus on decentralisation and localism will mean more powers are devolved to a more local level. Regional Development Agencies are set to be replaced by Local Enterprise Partnerships (LEPs)45. A Solent LEP46 covering the PUSH area and the Isle of Wight was announced in October 2010 as being one of twenty four LEP proposals across England that met the requirements of the Government, and was given the go-ahead to be formally established.
29 http://www3.hants.gov.uk/business/economic_data/economicassessment.htm 30 http://www.push.gov.uk/ed_strategy.pdf 31 http://www3.hants.gov.uk/73496_sustain_communities_2.pdf 32 http://www.portsmouth.gov.uk/media/CPT_Strategy_Vision_-_aspirations.pdf 33 http://www.southampton-partnership.com/images/City%20of%20Southampton%20Strat_tcm23-196707_tcm23-249613.pdf 34 http://www3.hants.gov.uk/corporatestrategy 35http://www.portsmouth.gov.uk/media/Corporate_Plan_2008_Final_30_July_08_(low_res)_web.pdf 36 http://www.southampton.gov.uk/modernGov/mgConvert2PDF.aspx?ID=2461 37 http://www3.hants.gov.uk/cypp-forweb.pdf 38 http://www.portsmouth-learning.net/pln/custom/files_uploaded/uploaded_resources/2617/PORTSMOUTH_CYPP_2009-2011.pdf 39 https://www.southampton.gov.uk/Images/3%2009%2021309%20CYPP%20FINAL%20PRINT_tcm46-233296.pdf 40 http://www.southamptonvts.co.uk/portconsultation/files/SMP.pdf 41http://www.southamptonairport.com/assets/Internet/Southampton/Southampton%20downloads/Static%20Files/Southampton_masterplan_final.pdf 42http://www.networkrail.co.uk/browse%20documents/rus%20documents/route%20utilisation%20strategies/south%20west%20main%20line/37299%20swml%20rus.pdf 43http://www.networkrail.co.uk/browse%20documents/rus%20documents/route%20utilisation%20strategies/freight/freight%20rus.pdf 44 http://www.dft.gov.uk/pgr/rail/strategyfinance/strategy/freightnetwork/strategicfreightnetwork.pdf 45 http://www.communities.gov.uk/localgovernment/local/localenterprisepartnerships/ 46http://www.push.gov.uk/news?id=9044&stdate=&pagetitle=Solent%20Local%20Enterprise%20Partnership%20gets%20go-ahead
5
Transport Vision for South Hampshire
Transport is an enabler of activity, allowing people to access a wealth of opportunities for work, education and leisure. The movement of people and goods in efficient and sustainable ways helps to support the South Hampshire economy. It protects, preserves and enhances the environment, can reduce greenhouse gas emissions, and contributes to a sense of place. In addition, this also delivers against a wider range of local and national objectives, delivering improvements in health, quality of life, equality of opportunity, safety and security. The vision of the TfSH authorities is to create:
"A resilient, cost effective, fully-integrated sub-regional transport network, enabling economic growth whilst protecting and enhancing health, quality of life and environment" This vision will be delivered through the set of fourteen transport policies detailed within this document. To successfully deliver the TfSH authorities’ vision for transport in South Hampshire, there are seven key challenges that need to be tackled.
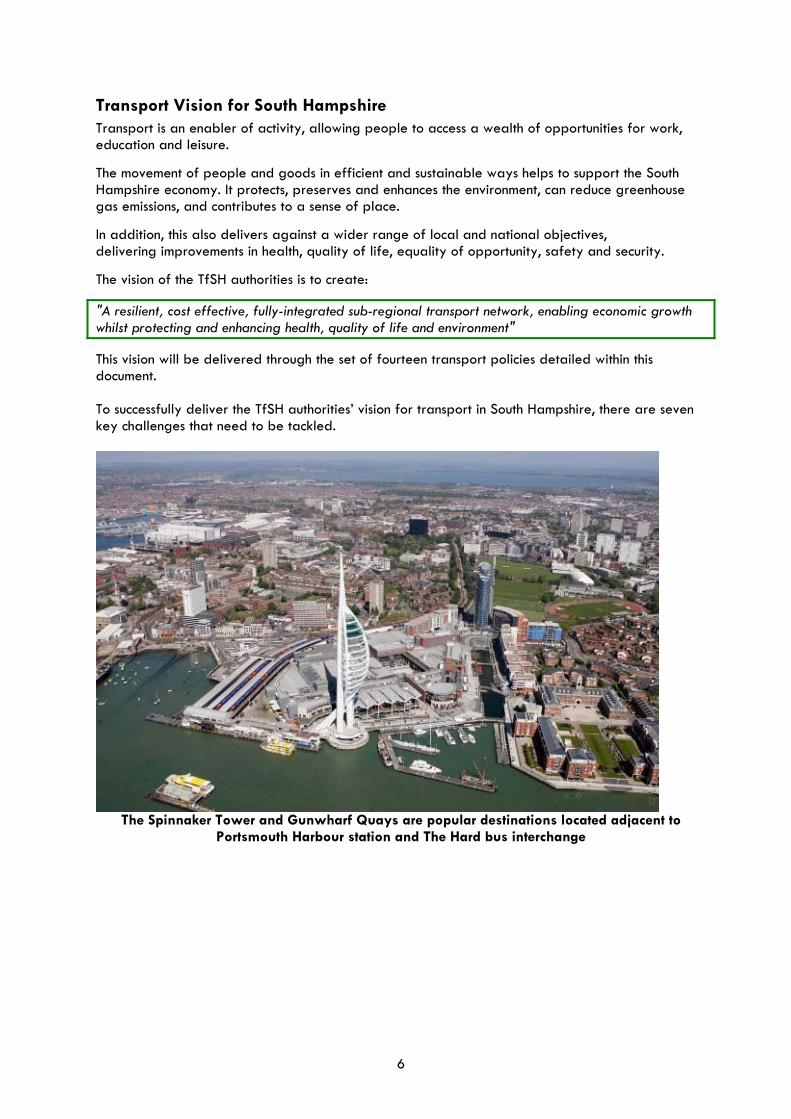
The Spinnaker Tower and Gunwharf Quays are popular destinations located adjacent to
Portsmouth Harbour station and The Hard bus interchange
6
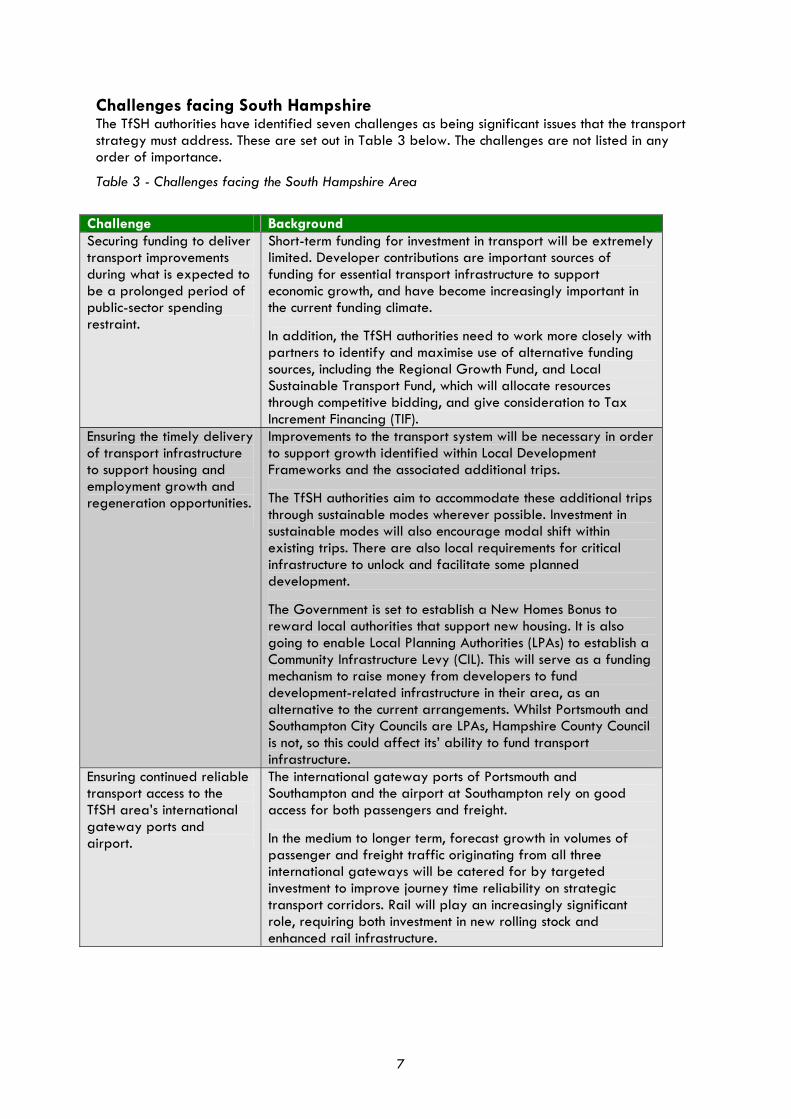
Challenges facing South Hampshire The TfSH authorities have identified seven challenges as being significant issues that the transport strategy must address. These are set out in Table 3 below. The challenges are not listed in any order of importance.
Table 3 - Challenges facing the South Hampshire Area
Challenge Background Securing funding to deliver transport improvements during what is expected to be a prolonged period of public-sector spending restraint.
Short-term funding for investment in transport will be extremely limited. Developer contributions are important sources of funding for essential transport infrastructure to support economic growth, and have become increasingly important in the current funding climate. In addition, the TfSH authorities need to work more closely with partners to identify and maximise use of alternative funding sources, including the Regional Growth Fund, and Local Sustainable Transport Fund, which will allocate resources through competitive bidding, and give consideration to Tax Increment Financing (TIF).
Ensuring the timely delivery of transport infrastructure to support housing and employment growth and regeneration opportunities.
Improvements to the transport system will be necessary in order to support growth identified within Local Development Frameworks and the associated additional trips. The TfSH authorities aim to accommodate these additional trips through sustainable modes wherever possible. Investment in sustainable modes will also encourage modal shift within existing trips. There are also local requirements for critical infrastructure to unlock and facilitate some planned development. The Government is set to establish a New Homes Bonus to reward local authorities that support new housing. It is also going to enable Local Planning Authorities (LPAs) to establish a Community Infrastructure Levy (CIL). This will serve as a funding mechanism to raise money from developers to fund development-related infrastructure in their area, as an alternative to the current arrangements. Whilst Portsmouth and Southampton City Councils are LPAs, Hampshire County Council is not, so this could affect its’ ability to fund transport infrastructure.
Ensuring continued reliable transport access to the TfSH area’s international gateway ports and airport.
The international gateway ports of Portsmouth and Southampton and the airport at Southampton rely on good access for both passengers and freight. In the medium to longer term, forecast growth in volumes of passenger and freight traffic originating from all three international gateways will be catered for by targeted investment to improve journey time reliability on strategic transport corridors. Rail will play an increasingly significant role, requiring both investment in new rolling stock and enhanced rail infrastructure.
7

Challenge Background Maintaining the existing transport network and its resilience to the effects of extreme weather events.
Climate change is expected to result in more unpredictable weather patterns including warmer, wetter winters and hotter, drier summers and more severe weather events. This will require changes in approaches to highway design, maintenance and assessment.
The physical highway infrastructure deteriorates with age and use. Regular maintenance is required to ensure that it meets the needs of users of the highway network and enables the safe movement of people and goods by road.
In a challenging funding climate, there is a need to ensure that value for money is maximised from investment in maintenance.
Widening travel choice to offer people reasonable alternatives to the private car for everyday journeys, and reducing the need to travel, moving towards a low-carbon economy.
The complex nature of journey patterns and travel to work across the sub-region has resulted in heavy reliance on the private car. To reduce this, there needs to be significant improvements in quality and affordability of public transport networks that are controlled by private operators.
Walking and cycling must be encouraged as a more viable option for shorter journeys. The promotion of travel planning, flexible working and car sharing will be further developed. Car ownership levels tend to be lower in deprived areas and so these communities are more reliant upon public transport to access jobs and services. In rural areas it is often not possible to run bus services on a commercial basis, so lower-cost alternatives such as shared taxis need to be considered.
Managing the existing transport network to ensure that journey time reliability is maintained and improved to help support economic competiveness, regeneration, and growth.
Traffic levels are forecast to grow due to background increases in car journeys and trips generated by new developments.
There will be a need to mitigate the impact of this forecast growth in travel, to ensure that the sub-region continues to be an attractive place to live and work, and to support the economy by safeguarding reliable access to the international gateways and employment sites.
Mitigating the adverse impacts of transport activity on people, communities and habitats.
Whilst transport is an essential enabler of activity, the movement of people and goods can result in adverse effects on the environment and communities. Transport activity is a major contributor to emissions of carbon dioxide and other greenhouse gases. Climate change is expected to result in more unpredictable weather patterns and increased risk of coastal flooding. Air quality and noise from transport are harmful to the health and wellbeing of communities. Transport corridors can also cause severance of communities and habitats. The South Hampshire sub-region contains a number of sites of high environmental value and importance.
8
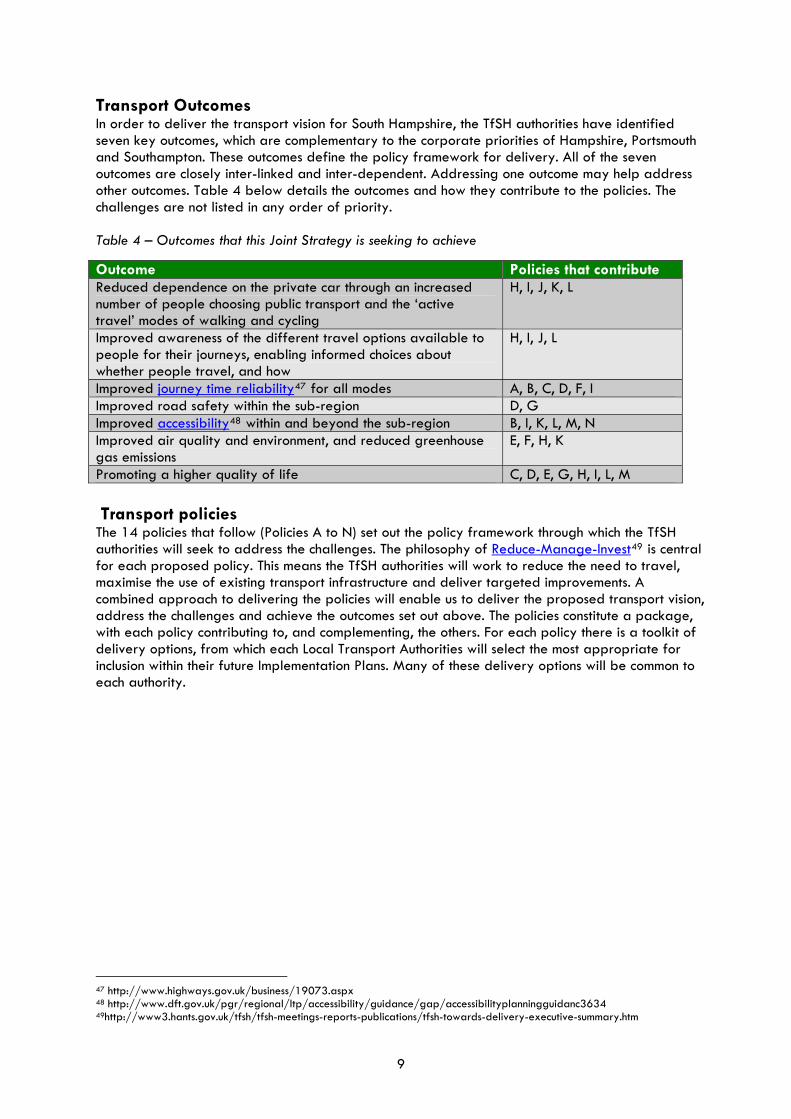
Transport Outcomes In order to deliver the transport vision for South Hampshire, the TfSH authorities have identified seven key outcomes, which are complementary to the corporate priorities of Hampshire, Portsmouth and Southampton. These outcomes define the policy framework for delivery. All of the seven outcomes are closely inter-linked and inter-dependent. Addressing one outcome may help address other outcomes. Table 4 below details the outcomes and how they contribute to the policies. The challenges are not listed in any order of priority. Table 4 – Outcomes that this Joint Strategy is seeking to achieve
Outcome Policies that contribute Reduced dependence on the private car through an increased number of people choosing public transport and the ‘active travel’ modes of walking and cycling
H, I, J, K, L
Improved awareness of the different travel options available to people for their journeys, enabling informed choices about whether people travel, and how
H, I, J, L
Improved journey time reliability47 for all modes A, B, C, D, F, I Improved road safety within the sub-region D, G Improved accessibility48 within and beyond the sub-region B, I, K, L, M, N Improved air quality and environment, and reduced greenhouse gas emissions
E, F, H, K
Promoting a higher quality of life C, D, E, G, H, I, L, M Transport policies The 14 policies that follow (Policies A to N) set out the policy framework through which the TfSH authorities will seek to address the challenges. The philosophy of Reduce-Manage-Invest49 is central for each proposed policy. This means the TfSH authorities will work to reduce the need to travel, maximise the use of existing transport infrastructure and deliver targeted improvements. A combined approach to delivering the policies will enable us to deliver the proposed transport vision, address the challenges and achieve the outcomes set out above. The policies constitute a package, with each policy contributing to, and complementing, the others. For each policy there is a toolkit of delivery options, from which each Local Transport Authorities will select the most appropriate for inclusion within their future Implementation Plans. Many of these delivery options will be common to each authority.
47 http://www.highways.gov.uk/business/19073.aspx 48 http://www.dft.gov.uk/pgr/regional/ltp/accessibility/guidance/gap/accessibilityplanningguidanc3634 49http://www3.hants.gov.uk/tfsh/tfsh-meetings-reports-publications/tfsh-towards-delivery-executive-summary.htm
9

Policy A: To develop transport improvements that support sustainable economic growth and development within South Hampshire
Why?
The transport network plays a vital role in supporting the economic prosperity of South Hampshire by ensuring people can go about their day to day activities of journeys to work, training, shopping, leisure and recreation. A well-functioning transport system enables people and goods to be moved sustainably, efficiently and reliably. Unpredictability of journey times and congestion increases costs to businesses and results in wasted time (and therefore money). New development brings with it additional demand for travel. It is essential that transport infrastructure in the vicinity of development sites is improved where necessary to support sustainable access to and from new developments.
How?
The TfSH authorities will develop closer partnerships and dialogue with businesses to ensure that transport improvements are geared towards improving economic prosperity and helping to unlock planned development sites. Part of this dialogue will involve encouraging businesses to contribute through match funding towards the cost of innovative transport improvements and solutions that would benefit them.
Delivery options
• Engage closely with the Solent Local Enterprise Partnership (LEP) and business on transport issues;
• Explore the potential of Tax Increment Financing (TIF) to help fund transport improvements;
• Work with business sector to explore opportunities for sponsorship and match funding by commercial partners for schemes.
Outcomes This policy will contribute to the following outcomes: • Improved journey time reliability50 for all modes
Rail plays an important role in the onward movement of deep Provision of offices in accessible Sea containers to and from the Port of Southampton, helping locations helps to encourage to reduce the number of lorry movements access by sustainable travel modes
50 http://www.highways.gov.uk/business/19073.aspx
10

Policy B: Work with the Highways Agency, Network Rail, ports and airports to ensure reliable access to and from South Hampshire’s three international gateways for people and freight
Why?
The three international gateways serve a large hinterland. Making sure that people and goods can flow easily and reliably to and from these gateways will maximise their contribution to the wealth and health of the wider UK economy. The economic success of South Hampshire depends on maintaining or improving levels of journey time reliability on strategic road and rail corridors. Cross-Solent ferry services from both gateway ports provide vital access to the Isle of Wight.
How?
Decisions regarding investment in strategic transport corridors are taken by central Government using national budgets. The TfSH authorities will seek to influence investment decisions at national level, to ensure timely investment that will enable the best use to be made of existing transport infrastructure, and deliver new infrastructure or capacity where most needed to improve journey time reliability. The TfSH authorities will work to encourage a greater share of onward movement of container freight traffic is catered for by rail.
Delivery options
• Investigate the potential for Hard shoulder running51 and variable speed limits52 on the busiest sections of motorway;
• Traffic lights at the busiest motorway onslips53 to improve traffic flow; • Work towards a joint traffic control and information centre54 and other
partnership measures; • Improvements to quality and availability of travel information; • Continued develop of initiatives by South Hampshire Freight Quality
Partnership; • Encourage port operators to develop Port Traffic Management Plans; • Ensure that appropriate infrastructure is considered to facilitate reliable
access to and from Southampton International Airport; • Support measures to enable movement of more freight by rail.
Outcomes This policy will contribute to the following outcomes: • Improved journey time reliability for all modes; and • Improved accessibility within and beyond the sub-region.
ortsmouth is an important cross-channel ferry port Southampton Airport serves a range
Pwith a large Naval Base and ferries to the Isle of Wight of international destinations
51 http://www.highways.gov.uk/roads/projects/22988.aspx 52 http://www.highways.gov.uk/news/25754.aspx 53 http://www.highways.gov.uk/knowledge/17308.aspx 54 http://www.romanse.org.uk/theteam.htm
11
Policy C: To optimise the capacity of the highway network and improve journey time reliability for all modes
Increasing levels of congestion affect both the operation of strategic linkages Why? which are often already at capacity, and journey time reliability, impacting on
economic productivity across the sub-region. The TfSH authorities will work to better manage the existing highway network to ensure that existing capacity is optimised and used efficiently. This policy will
maximise the throughput of the highway network for all users and modes. This will entail using traffic signal control and other highway technologies, helping to How? improve network management, and greater priority for buses. This will help to improve journey time reliability for all forms of travel and contribute to modal shift. Real-time traffic and travel information will be gathered and disseminated through a variety of sources and systems in a timely, efficient manner to enable people to make informed decisions about their travel choices.
• Upgrading and enhancing Urban Traffic Control systems55 enabling bus priority and Real Time Passenger Information provision; • Improved road network monitoring and operation (for example junction
Delivery improvements and re-allocation of road space); options • Pre- and in-journey travel Information (using static56 and mobile57 media);
• Improvements to Information Systems on the local highway network (e.g. Variable Message Signing);
• Car Park Guidance Systems; • High Occupancy Vehicle58 (HOV) Lanes; and • Investigating the removal of traffic lights at specific locations where evidence
suggests that this would improve journey time reliability. Outcomes This policy will contribute to the following outcomes:
• Improved journey time reliability for all modes; and • Promoting a higher quality of life.
Traffic on the A3(M) towards Portsmouth
55 http://utmc.uk.com/index.php 56 http://www.romanse.org.uk/technologies/VMS.htm 57 http://www.romanse.org.uk/technologies/mobiledevices.htm 58 http://www.konsult.leeds.ac.uk/private/level2/instruments/instrument029/l2_029summ.htm
12
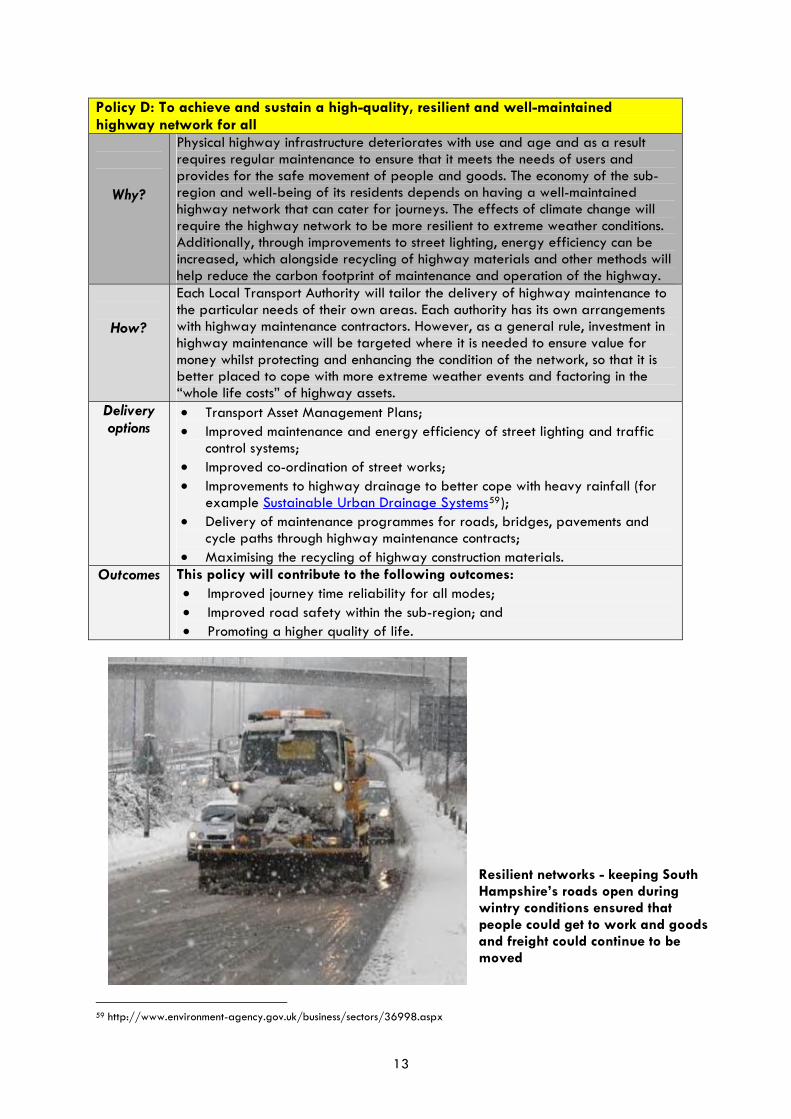
Policy D: To achieve and sustain a high-quality, resilient and well-maintained highway network for all
Physical highway infrastructure deteriorates with use and age and as a result requires regular maintenance to ensure that it meets the needs of users and provides for the safe movement of people and goods. The economy of the sub-region and well-being of its residents depends on having a well-maintained highway network that can cater for journeys. The effects of climate change wi
Why?
ll require the highway network to be more resilient to extreme weather conditions. Additionally, through improvements to street lighting, energy efficiency can be increased, which alongside recycling of highway materials and other methods will help reduce the carbon footprint of maintenance and operation of the highway.
Each Local Transport Authority will tailor the delivery of highway maintenance to the particular needs of their own areas. Each authority has its own arrangements with highway maintenance contractors. However, as a general
rule, investment in How?
hig way maintenance will be targeted where it is needed to ensure value for hmon twork, so that it is ey whilst protecting and enhancing the condition of the nebet er placed to cope with more extreme weather events and factoring in thet “whole life costs” of highway assets.
Delivery • Transport Asset Management Plans; • Improved maintenance and energy efficiency of street lighting and traffioptions c
control systems; • Improved co-ordination of street works; • Improvements to highway drainage to better cope with heavy rainfall (for
example Sustainable Urban Drainage Systems59); • Delivery of maintenance programmes for roads, bridges, pavements and
cycle paths through highway maintenance contracts; • Maximising the recycling of highway construction materials.
Outcomes T shi policy will contribute to the following outcomes: • Improved journey time reliability for all modes; • Improved road safety within the sub-region; and • Promoting a higher quality of life.
Resilient networks - keeping South Hampshire’s rowintry conditiopeople could get to work and goods and freight could continue to be moved
ads open during ns ensured that
59 http://www.environment-agency.gov.uk/business/sectors/36998.aspx
13
Policy E: To deliver improvements in air quality Congestion creates higher levels of air pollution as queuing traffic, especially in
more restricted or confined spaces, generates higher concentrations of vehicle emissions. Poor air quality can create or exacerbate health and respiratory problems, for example asthma. Air Quality Management Areas (AQMAs) are places where pollutant levels exceed government thresholds. Twenty Air Qua
Why?
lity Management Areas (AQMAs) have been identified within urban areas across the sub-region. The recent white paper on Public Health60 indicates that by April 2013, unitary authorities and county councils will be given funding and responsibility for improving public health.
How?
The TfSH authorities will work with key partners, environmental health professionals and transport operators to mitigate the impacts of traffic on air quality. The principal causes of poor air quality will be addressed by implementing a strategic area-wide approach within each urban centre to minimise the cumulative effect of road transport emissions. This can be achieved through measures promoting modal shift towards public transport modes, walking and cycling, reducing single occupancy car journeys. Tackling congestion at hotspots can also improve air quality.
• Air Quality Management Areas61 and Air Quality Action Plans; • Promotion of cleaner, greener vehicle technologies e.g. alternative fuels; Delivery
options • Car Share Schemes62; • Support for Car clubs63 and similar schemes;
Outcomes This policy will contribute to the following outcomes: • Improved air quality and environment, and reduced greenhouse gas
emissions; and • Promoting a higher quality of life.
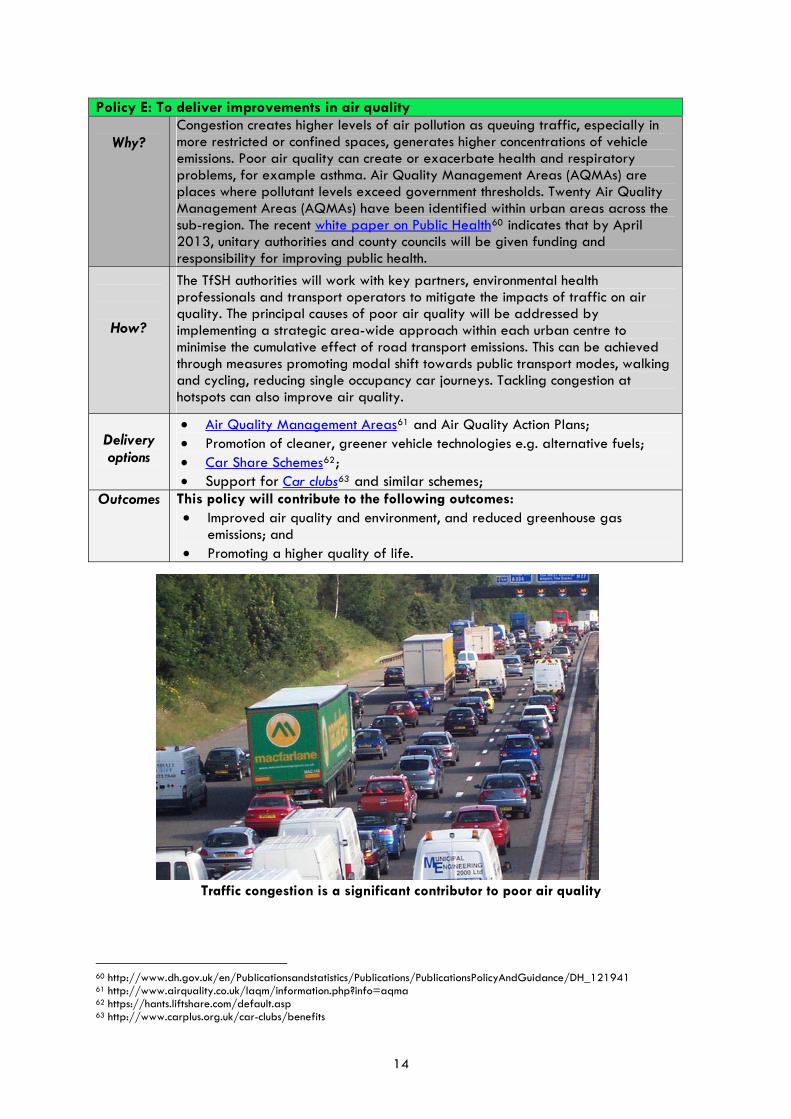
o
r to poor air quality Traffic congestion is a significant contribut
60 http://www.dh.gov.uk/en/Publicationsandstatistics/Publications/PublicationsPolicyAndGuidance/DH_121941 61 http://www.airquality.co.uk/laqm/information.php?info=aqma 62 https://hants.liftshare.com/default.asp 63 http://www.carplus.org.uk/car-clubs/benefits
14

Policy F: To develop strategic sub-regional approaches to management of parking to support sustainable travel and promote economic development
The cost and availability of parking has considerable influence on travel choices and if not managed in a co-ordinated manner can act as a barrier to efforts to widen travel choice. If insufficient parking is provided or if prices are considere
d
high, then parking can be displaced into residential areas further out from town centres. Provision of free staff workplace parking makes it less likely for people to choose to use alternative travel methods.
Why?
The TfSH authorities will encourage better co-ordination between local authorities with responsibilities for car parking to improve the way existing parking is used and priced. Discounts can be offered to encourage car sharing, low-em
ission
vehicles, mopeds and motorcycles. Park and ride sites offering lower cost parki ng
than in urban centres can help reduce congestion and address poor air quality in the centres. It is important that parking management measures are implemen
How? ted
alongside improvements to sustainable travel modes to help increase the attractiveness and viability of these alternatives over private car trips, to support widening travel choice.
• Develop complementary policy approaches to parking;
• Controlled Parking Zones; • Improved management and supply of residential parking; • Extended ‘park and ride’ network (both bus and rail based systems); • Improved parking at well-used commuter railw
Delivery options ay stations;
• Car park management and guidance systems; • Workplace travel planning64; • Appropriate consideration of the needs of blue badge holders; • Ensure appropriate parking provision for motorcycles and mopeds • Enable and manage deliveries to and servicing of shops, offices and
industrial units; • Investigation into appropriate parking provision for commercial vehicles • Introduce and develop car clubs65; • Provision of electric vehicle charging points within car parks.
Outcomes This policy will contribute to the following outcomes: • Improved journey time reliability for all modes; and • Improved air quality and environment, and reduced greenhouse gas
emissions.
64 http://www.dft.gov.uk/pgr/sustainable/travelplans 65 http://www.carplus.org.uk/car-clubs/benefits
15
Policy G: To improve road safety across the sub-region Road traffic collisions, as well as causing death, injury and distress to those involved, also
result in wider costs to society in terms of the cost of providing healthcare treatment to t
Why? hose i s njured, and loss of productivity. Road traffic incidents create tailbacks and delaythat adversely affect journey time reliability within the sub-region.
Work ser to date has been effective at reducing incidences of speeding and unsafe road-uHow? behav nd iour through education, engineering measures at sites with high casualty records a
enforc its and crossing improvements within ement of speed limits. Reductions in speed limbuilt up areas have further improved the safety of vulnerable road users.
Delivery • Speed Management66 measures; options • Actively consider wider implementation of 20mph speed limits/ zones within
residential areas; • Traffic Management measures; • Safer Routes to schools67 schemes; • Road Safety education and training to improve road user behaviour.
Outcomes This policy will contribute to the following outcomes: • Improved road safety within the sub-region; and • Pr o . om ting a higher quality of life
Policy H mo a re : To pro te ctive travel modes and develop supporting infrastructu Encouragin alk or cycle for everyday g and making it easier for people to choose to w journeys hel utines, improving health and ps people to build physica cl a tivity into their ro
general well-being. Increasing the number of jo travel modes urneys undertaken by activeWhy? will hel op t tackle obesity, reduce congestion and improve air quality.
How? The TfS health H authorities will work with health and activity partners, including publicteams, d strians to evelop a network of high-quality, direct, safe routes targeted at pedeand cyclists routes and secure cycle parking can be partly delivered . Well-designedthrough e ally th planning system. Pro-active marketing and participative events will radicincrease the enefits of active travel. profile and understanding of the b
• A i ity information for Leg ble South Hampshire project to provide integrated, high-qualpublic transport, walking and cycling;
Delivery • De r ich could form part of a live y of comprehensive walking and cycling networks (whoptions pro spo ed ‘Green Grid’ – refer to glossary for more detail);
• Deliver g and cycling measures identified within Town Access Plans and y of walkinDistrict Statements;
• Crossing improvements for pedestrians and cyclists; • Cycle hire scheme for urban centres; • nations; and Delivery of improved secure cycle parking facilities at key desti• Way Improvement Support for the delivery of measures contained within Rights of
Plans (ROWIPS). Outcomes This policy will contribute to the following outcomes:
• d number of people Reduced dependence on the private car through an increasechoosing public transport and the ‘active travel’ modes of walking and cycling;
• o people for their Improved awareness of the different travel options available tjourneys, enabling informed choices about whether people travel, and how;
• gas emissions; and Improved air quality and environment, and reduced greenhouse • Promoting a higher quality of life.
66 http://www.roadsafe.com/programmes/speed.aspx 67 http://www.portsmouth.gov.uk/living/649.html
16
P community transport solutions, and olicy I: To encourage private investment in bus, taxi and where practical, better infrastructure and services
I tive mproving the quality of public transport will widen travel choice, giving a viable alterna to the private car for certain everyday journeys such as those to work, shops, education,
h d taxis are often the ealth and leisure facilities. For those without access to a car, buses an only realistic travel option for journeys to access goods and services. The large majority of bus services in South Hampshire are provided on a commercial basis by privately-owned Why? operators. This means that the TfSH authorities must work with these operators in order to e eople will wish to ncourage provision of better bus services. As new jobs are created, more pa s nd Portsmouth and it is essential that a good quality cce s the city centres of Southampton ab e reducing us s rvice is provided along main corridors. This will accommodate growth whilst the ov ty erall carbon footprint of transport, and prevent deterioration of journey time reliabilio an m in routes into urban centres.
Th commercial bus operators to help them plan and e TfSH authorities will work closely with d e key corridors. eliv a Bus Rapid Transit on a number of r service improvements nd develop
T them a more h wis ill help improve the reliability and attractiveness of bus services, makingHow? v -to-date information on how iable alternative to the private car, with accurate and upse c icketing technology such as rvi es are running. Taking advantage of advances in tsm t some bus operators across their networks) will ar cards (already being introduced by improve the affordability, convenience and attractiveness of buses. Management of taxi operators, and support for the voluntary sector in their provision of community transport services helps to meet transport needs that cannot easily be met by bus services.
• Development of a Bus Rapid Transit (BRT) network68 and other innovative public transport solutions between main centres;
• Bus Priority measures; • Development of a comprehensive premium urban bus network offer
ing high frequency
services using high-quality vehicles; • Improved strategic interchanges and high quality bus stop Infrastructure; • Delivery of public transport measures identified within Town Access Plans and Distr
Delivery options
ict Statements;
• Park and ride network; • I mproved travel information in user-friendly formats; • M s suitably located taxi ranks; easures to support taxi services such a• I s; mproved ticketing solutions, including smartcards and ticket purchase via mobile phone• S upport for Community Transport services.
Outcomes Th pis olicy will contribute to the following outcomes: • R creased number of people educed dependence on the private car through an in
c s of walking and cycling; hoosing public transport and the ‘active travel’ mode• I eir avel options available to people for thmproved awareness of the different tr
journeys, enabling informed choices about whether people travel, and how; • I mproved journey time reliability for all modes; • Improved accessibility within and beyond the sub-region; and • P romoting a higher quality of life.
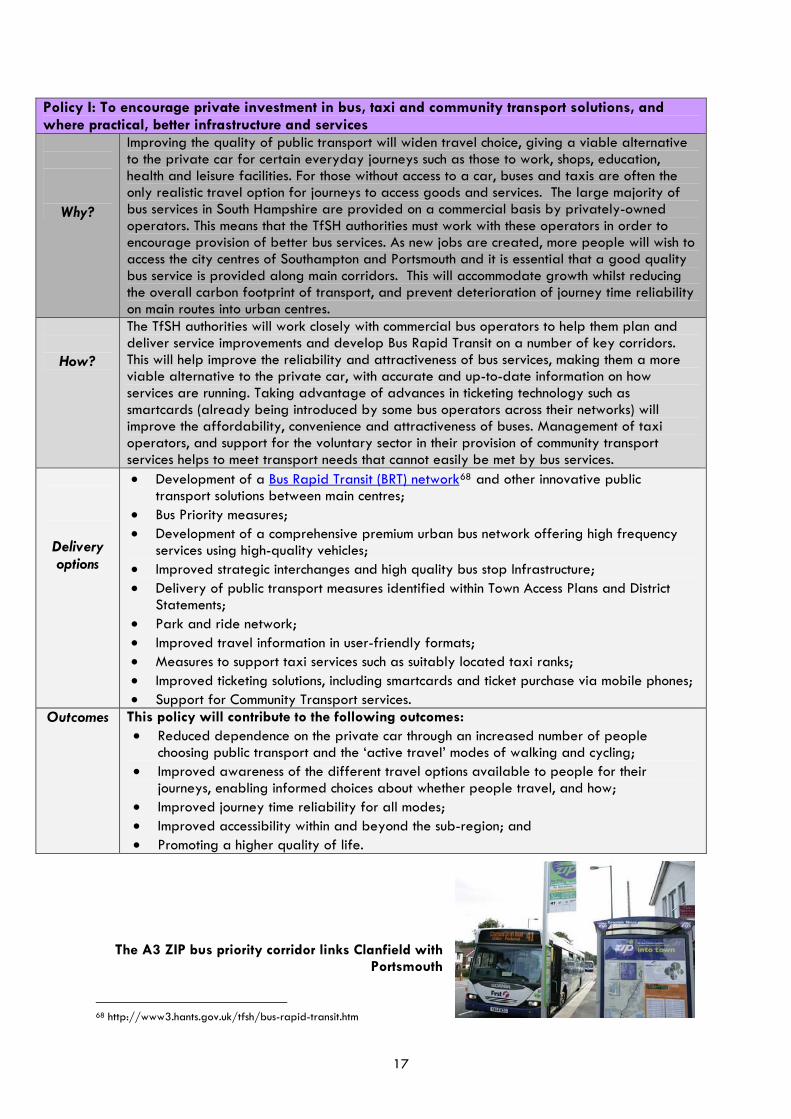
The field with Portsmouth
A3 ZIP bus priority corridor links Clan
68 http://www3.hants.gov.uk/tfsh/bus-rapid-transit.htm
17

Policy J: To further develop the role of water-borne transport within the TfSH area and across the Solent
Why?
The TfSH area already has a good network of ferry services, connecting coastal settlements. In addition, cross-Solent ferry services from both gateway ports provide vital access to the Isle of Wight for passengers and freight. Enhancing the integration between water-borne transport and other sustainable travel modes through improved interchanges will help widen travel choice and reduce peak hour congestion.
ow?
The TfSH authorities will work to improve the quality of bus, taxi and cycle interchange facilities and information at ferry terminals, particularly at Town Quay in Southampton, The Hard in Portsmouth and Gosport.
H
Delivery options
• Development of improved transport interchange facilities for buses and taxis at ferry terminals;
• Improved ticketing solutions, including smartcards and ticket purchase via mobile phones;
• Ongoing dialogue with ferry operators to encourage delivery of passenger improvements;
• Provision of secure cycle parking in the vicinity of ferry terminals; • Support for port operators in their aspirations to increase freight moved
by short-sea shipping.
Outcomes This policy will contribute to the following outcomes: • Reduced dependence on the private car through an increased numb
Cross-Solent and local ferry services play an important rol s of
the South Ha
er of people choosing public transport and the ‘active travel’ modes of walking and cycling; and
• Improved awareness of the different travel options available to people for their journeys, enabling informed choices about whether people travel, and how.
e in meeting travel needs in coastal areampshire area
18
Policy K: To work with rail operators to deliver improvements to station facilities and, where practical, better infrastructure and services for people and freight
The rail network in South Hampshire is of strategic importance for both passengers and freight. There is potential to grow the modal share of rail for
passenger and freight movements both within and beyond the TfSH area. This policy will seek to bring about a greater role for rail for local journeys within the Why? area. Targeted improvements to rail can help this mode provide an attractive al r commuter journeys to major employment ternative to the car for peak houareas.
The TfSH authorities will work with the rail industry to encourage investment in im in rail stations , proved station facilities, enhanced interchange facilities at ma
and rail infrastructure such as track capacity, to make rail a more attractive option. n services is also needed. The TfSH Rail Further investment in traiHow? Co umm nications Protocol will be used to take forward improvements to the South Hamps ensuring that more passengers and freight are carried by hire rail network,rai nl, a d to improve rail service frequencies.
• Pr enable more freight to be moved by rail; omote measures which will • e line Re-opening freight-only lines for passenger use (such as the Watersid between Totton and Hythe);
Delivery • Im uthampton Airport from the east and west; proving rail access to Sooptions • reham; Increasing capacity on the rail route between Eastleigh and Fa
• Im opr ved station and key city centre interchange facilities; • Improved cycle and car parking at well-used commuter railway stations; • Invest park and ride using railway stations; igation of opportunities for• W kor ing with train operators to deliver station travel plans; • Further development of Community Rail Partnerships69 (CRPs); • Impro cycles, wheelchairs and pushchairs on trains; ved capacity for • Use of rolling stock suitable for the type of route across the network; • Exploring the feasibility of options for light rail in South Hampshire.
Outcomes This policy will contribute to the following outcomes: • Reduced dependence on the private car through an increased number of
people choosing public transport and the ‘active travel’ modes of walking and cycling;
• Improved accessibility within and beyond the sub-region; and • Improved air quality and environment, and reduced greenhouse gas
emissions.
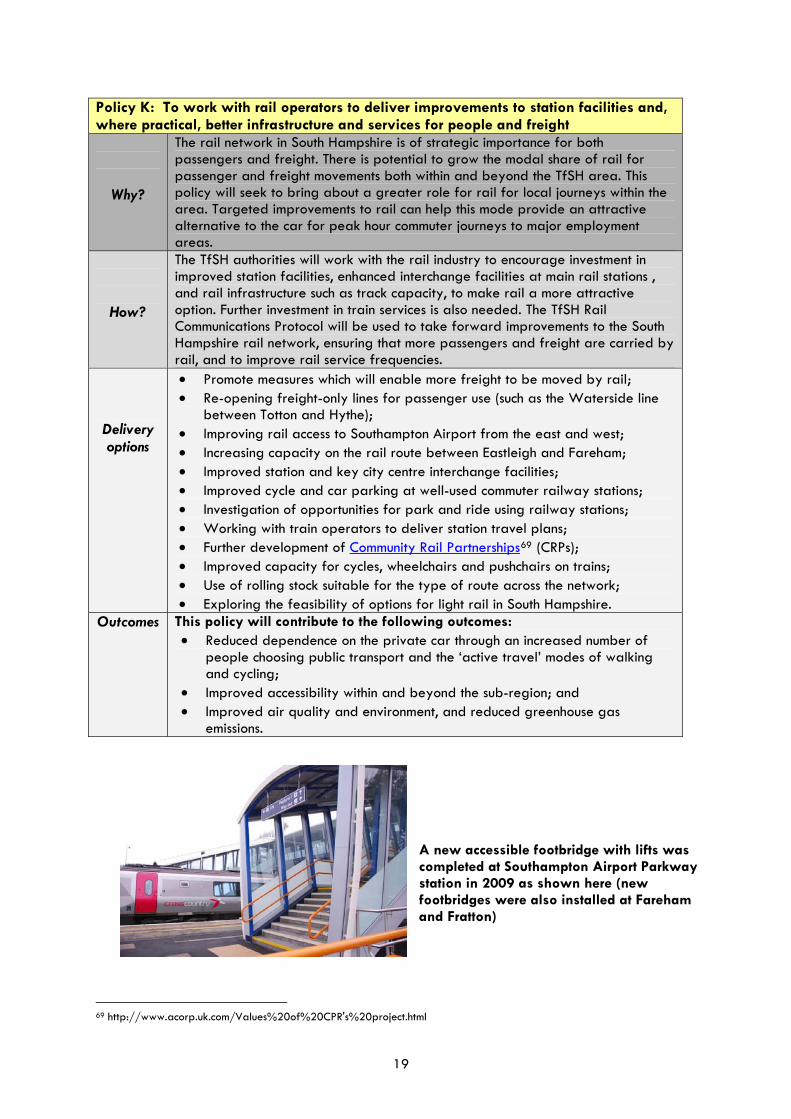
A new accessible footbridge with lifts was completed at Southampton Airport Parkway station in 2009 as shown here (new
footbridges were also installed at Fareham and Fratton)
69 http://www.acorp.uk.com/Values%20of%20CPR's%20project.html
19
Policy L: To work with Local Planning Authorities to integrate planning and transport The location, scale, density and design of new development and the mix of land uses has a sig brownfield nificant influence on the demand for travel. Encouraging development on
sites close to existing shops and services, and supporting higher-density, mixed-use Why? deve ke it lopment, helps to reduce the need to travel and the length of journeys, and maeasier for people to walk, cycle or use public transport.
The TfSH authorities will work with Local Planning Authorities across the area to enco rban urage higher density and mixed-use developments to be located within main u
centres, in locations that are easily accessible by a range of travel methods. Planning How? auth orities will be encouraged to locate new housing and employment developmentwith of in close proximity. This will help reduce the need to travel and encourage the usesusta . inable travel modes, thereby improving health and reducing carbon emissionsGoo ovided d design of residential developments will ensure that key services are prlocally and that neighbourhoods are walkable, with good cycle and public transport links to nearby urban centres. Residential and workplace travel planning will be used to effectively manage the journeys created with development.
• T he current and emerging Local Planning Authorities’ Local Development F mra eworks (LDF) infrastructure delivery plans will be developed alongside the
Delivery Im lp ementation Plan sections of the Hampshire, Portsmouth and Southampton Local options T nra sport Plans;
• S k ct of ee ing developer contributions from new development to mitigate the impan ew development on existing transport networks;
• R ides ential and workplace travel planning70; Outcomes This ipol cy will contribute to the following outcomes:
• ople Reduced dependence on the private car through an increased number of pecho sing public transport and the ‘active travel’ modes of walkingo and cycling;
• r ople for their Imp oved awareness of the different travel options available to pejou neys, enabling informed choices about whether people travel, and hor w;
• rImp oved accessibility within and beyond the sub-region; and • mPro oting a higher quality of life.
Policy M: To develop and deliver high-quality public realm improvements The quali e can have a big influence on the vibrancy of a place and the ty of streetscap way peop ‘Naked Streets’ le use streets. Place-making initiatives and the development of
will p i -friendly rov de a better setting for people friendly activity, providing a more userWhy? public rea estrians, vulnerable road users and cyclists. Public Realm lm for pedimprovements using high-quality materials, where affordable and practical, will add to the character, feel and ownership of local places.
Within cities, town and district centres, the TfSH authorities will reduce street clutter and How? make streetscape improvements using high-quality materials and street furniture to
enhance the public realm and its accessibility. • Reducing street clutter (such as pedestri railing); an guard
Delivery • Streetscape enhancements (including lighting, paving, planting, and street furniture); options • Delivering improvements that follow the design principles set out in current design
guidance and informed by examples of best practice. Outcomes This policy will contribute to the following outcomes:
• Improved accessibility within and beyond the sub-region; and • Promoting a higher quality of life.
70 http://www.dft.gov.uk/pgr/sustainable/travelplans/work/
20

Policy N: To safeguard and enable the future delivery of transport improvements within the TfSH area
Why?
A limited number of targeted highway and rail improvements have been identified which would serve to address problems of localised congestion, unlock development sites with highway access problems and tackle adverse impacts of traffic on quality of life in communities.
How? Delivery of major schemes for highway improvements is dependent on funding decisions by Government and external contributors. The TfSH authorities will safeguard the routes of proposed highway improvements and continue to work with these agencies to secure funding for these schemes.
Delivery s
• Safeguarding of proposed strategic routes, such as the Botley Bypass and Western Access to Gosport, where heavy volumes of traffic through local communities cause problems of severance, noise and poor air quality;
• Safeguarding land to enable developer-led access solutions to unlock Dunsbury Hill Farm and Eastleigh River Side for new employment uses;
• Enabling developer-led road improvements to faciloption
itate access to planned major development areas (such as North Whiteley);
• Safeguarding land for developing a new motorway junction on the M275 serving Tipner, Portsmouth;
• Investigating feasibility for provision of a bridge link from Tipner to Horsea Island (for all modes); and
• Safeguarding land for new railway stations at certain locations, for example Farlington.
Outcomes This policy will contribute to the following outcomes: • Improved accessibility within and beyond the sub-region.
rge e c
La ar as of planned development may require investment in new highway and publitransport infrastructure to unlock sites
21
Glossary of Terms
Acronym/ Full Title Explanation Common
Term
AO hat has Natural NB
Area of An Area of Outstanding Natural Beauty (AONB) is an area of
Outstanding Natural Beauty
countryside considered to have significant landscape value tbeen specially designated by the Countryside Agency (nowEngland) on behalf of the Government.
AQMA ollutant levels breach national Air Quality An identified area where various air pManagement
Area limits, requiring action to deal with poor air quality.
Active Trav ple, walking el Modes of travel which require physical activity, for examand cycling.
Big So ty
seeks to s, o tackle d to
an ion of a
cie problems affecting them and their communities. This is intendereplace the act of turning to officials, local authorities or central
Is an idea supported by the Coalition Government which encourage and enable people, in their everyday lives, homeneighbourhoods, and workplaces to group together in order t
government for answers to these problems. In transport terms, example would be the voluntary and community sector operatvillage minibus to meet local needs.
BRT B
igh ure to provide a bus-based
able of supporting high s of passengers.
us Rapid Transit quality "stations" and other infrastructversion of light rail rapid transit, cap
Provision of dedicated, segregated bus lanes, junction priority, h
frequency services and moving large volume
Car Club members via an online or telephone booking system.infrequent car users to access a car when they needcost or parking difficulties associated with car owne
Organisations providing cars based in key locations for hire to Car clubs allow it, without the high rship.
Communpaid staff. Community transport
cost of travelling by voluntary car
ity Transport
Transport provided by voluntary and community sector organisations, using a combination of volunteers and can include taxi-card schemes that subsidise thetaxi, Dial-A-Ride services, community minibuses and schemes, moped and mobility scooter hire.
Concessiona
onary Fares)
Local Transport Authorities are responsible for providing the Concessionary Travel Scheme for older people and people with disabilities within their administrative areas. This scheme provides free off-peak bus travel from 9am or 9:30am (depending on the LTA) to 11pm, Monday to Friday, and at any time at the weekend and on public holid s. It is intended for older people (who are of eligible age), and disabled users who live in each LTA area. In some cases, LTAs allow those who meet the criteria for a disabled person’s pass to also have the option, as an alternative to the pass, to have vouchers (to the value of £32 per annum) for use on defined community
and
ry Travel Scheme ay
(Concessi
transport schemes such as Dial-a-Ride and voluntary car schemes taxis.
Core Strategy
This sets out the long term spatial vision for the local planning authority area, as well as the spatial objectives and the strategic policies to deliver that vision. The core strategy has the status of a development plan document.
22
Acronym/ Full Title Explanation Common
Term
CPGS Car Park Guidance System
System which combines monit ark capacity and occupancy with Variable Message Signing (see “VMS”) to route car
es a
oring of car p
drivers to car parks with available parking spaces. This promotreduction in the number of vehicles circulating and searching for spaces at busy times and reduces traffic congestion.
CPZ ally a requirement to display Controlled Parking Zone
An area where parking restrictions (typica valid ticket or permit) are in force.
CRP ity Rail rship
f rail services on
te and recruiting volunteers to
CommunPartne
Community Rail Partnerships encourage greater use orail routes away from main-line corridors by raising their profile in the community. This can be achieved by publicity, developing links with local communities served by the rail rouhelp ‘adopt’ stations.
Green Infrastructure (The Green Grid)
een
of
Green Infrastructure is the physical environment within and betwcities, towns and villages, specifically the network of open space, waterways, woodlands, green corridors and open countryside.
These areas can be connected by a Green Grid. This is a networkinterlinked footpaths, bridleways and cycle paths that connect town centres, public transport nodes, the countryside in the urban fringe, and major employment and residential areas.
HA Highways Agency Government agency responsible for managing the trunk road and motorway network. Lanes dedicated for use by buses and cars carrying multiple occupants. Intended to encourage car-sharing by rewarding car-sharers with faster, less congested journeys.
HOV Lanes High Occupancy Vehicle Lanes
HRA Habitats
Regulations Assessment
of
HRA assesses the likely impacts of the possible effects of a plan’s policies on the integrity of internationally important nature sites. These internationally important nature sites include Special AreasConservation (SAC) which have important habitat features, Special Protection Areas (SPAs) which relate to bird populations and Ramsar sites which are internationally important wetlands. These are often referred to as Natura 2000 sites.
Journey time reliability
journey that the length of
It is important for people making a regular time taken between their origin and destination is reasonablypredicable, and does not fluctuate excessively from day to day. Unpredictability adds to costs of business and results in wasted time.
LDF Local
Development Framework
l
nd
or supplementary development documents (SDDs), which set
r
The local development framework (LDF) is a collection of local development documents produced by the local planning authority (usually either a unitary authority or a district council in two-tier locaauthority areas) which collectively form the spatial planning strategy for its area. A key component of the LDF is the Core Strategy. Each LDF includes one or more statutory development plan documents, which are used by planning authorities to control development adetermine planning applications. These can include area action plans (AAPs)more detailed planning requirements. The LDF as a whole is thespatial expression of the Sustainable Community Strategy (SCS) fothe area.
23

Acronym/ Common Term
Full Title Explanation
Legible Cities/ Legible South Ham
on
Hampshire.
pshire
The Legible Cities concept involves the development of directisignage and maps to enable pedestrians and cyclists to navigate around the city with greater ease and confidence. A Legible South Hampshire project would involve deployment of a common brand of Legible Cities signage in urban locations across South
LEP Lo e Partnership
010.
cal Enterpris
The Government is enabling the establishment of a number of regional / sub-regional organisations to act as catalysts for economic growth, known as LEPs to replace Regional Development Agencies (RDAs). LEPs will provide the strategic leadership in their areas to set out local economic priorities and will feature more private sector representationthan RDAs. LEPs will address such areas as planning, housing, local transport and infrastructure, employment, and inward investment. TheLEP for South Hampshire is the Solent LEP. More information on LEPs is contained in the White Paper ‘Local Growth: realising every place’s potential’, published in October 2
Localism vel. This entails giving o
t how to best meet local needs.
This agenda, promoted by the Coalition Government seeks to pass down powers, control and responsibility for budgets and delivering services from high levels down to a more local lelocal councils and communities at all levels much greater freedoms tmake decisions abou
Local Tran
ables on
he requirements for sport Act
The Local Transport Act (2008) is an act of Parliament that enlocal authorities to better manage bus services, consider introductiof road charging schemes, and also outlines tdelivery of Local Transport Plans.
Local Transport
ke to
e
of sustainable modes of transport
White Paper
Is a Government policy document, published in January 2011, which sets out the approach that Local Transport Authorities should taensure that local transport can support economic growth and reducecarbon emissions. This should primarily be achieved by investing in lowcost high impact schemes that deliver good value for money improvtravel choice and promote the use (public transport , walking and cycling)
LSTF Local Sustainable Transport Fund
nd
ed
Funding made available for Local Transport Authorities in Englaoutside London to bid for, to support packages of transport interventions that support local economic growth and reduce carbon emissions in their communities as well as delivering cleaner environments and improved air quality, enhanced safety and reduccongestion.
LTA Local Transport Authority
A Local Authority responsible for the operation, management and development of the highway network (excluding trunk roads and motorways, which are the responsibility of the Highways Agency) within its area. LTAs are also generally responsible for subsidy of certain bus routes and maintenance and improvement of transport infrastructure (excluding infrastructure under control of the Highways Agency, Network Rail, and private operators).
LTP Local Transport Plan
A Local Transport Plan outlines the transport policies, strategy and implementation plans for Local Transport Authorities.
Modal Share rtion of journeys made by a mode (i.e. type) of transport.
For example, a modal share of 70% for cars means 70% of journeys are made by car.
The propo
24
Acronym/ Common Term
Full Title Explanation
Naked Streets
Streets with none (or very little) of the usual street furniture such atraffic lights, signs, kerbs, railings, white lines and other road markings. In certain locations, studies have found that “naked streetsreduce traffic speeds and improve safety for users compared to moretraditional street layouts, markings and furniture.
s
”
National Park
National Parks are protected areas because of their beautiful
countryside, wildlife and cultural heritage. Hampshire contains two national parks, the New Forest National Park was established in 2005and the South Downs National Park in 2010.
Network Rail
Network Rail is the owner and operator of the national rail infrastructure (track, signalling, stations, car parks and land). It must ensure safe and effective management and development of that infrastructure. A powered two-wheel vehicle, for example, a motorbike, motor scooter, or electric scooter. Powered Two-Wheeler
A partnership between Local Authorities in South Hampshire which aims to deliver sustainable, economic growth and regeneration to create a more prosperous, attractive and sustainable South Hampshire.
PUSH Partnership for Urban South Hampshire
QBP Quality Bus Partnership ,
A partnership between various stakeholders which can include county councils, local district councils, bus operators and sometimes other parties. The local authority improves bus stop access and informationand the bus company improves vehicles and timetables.
RGF Regional Growth Fund
r
Government funding initiative to encourage private sector enterprise,create sustainable private sector jobs and help places currently reliant upon the public sector make the transition to sustainable private sectogrowth. Transport initiatives are eligible to receive funding.
RoWIP Rights of Way n Improvement Pla
A plan which considers how best to manage and develop the Public Rights of Way network (including bridleways and public footpaths).
RTI Real Time Information
System providing live updates on expected arrival times of buses at each stop, and often also accessible online or via text message.
RUS Route Utilisation Strategy
rail infrastructure strategies d
RUS are geographically based long-termproduced by Network Rail, setting out ‘gaps’ in railway capacity anpriorities for investment.
SEA Strategic
Environmental Assessment
SEA is an established tool to help decision-makers consider the environmental impacts of proposed policies, plans and programs.
Smarter
ices are techniques for influencing people's travel
ce ices me
Choices
Smarter chobehaviour, and encouraging them to make greater use of more sustainable travel options. Such techniques include school, workplaand individualised travel planning, promoting public transport servthrough as travel awareness campaigns, setting up websites for carshare schemes, supporting car clubs and encouraging working at hoand video-conferencing.
SUDS Sustainable Urban Draina
mpact of water
more slowly ge System
Urban drainage system designed to reduce the irunoff from urban developments. SUDS generally use systems of collection, storage, cleaning, and controlled release torelease cleaner drainage water back into the environment. These systems are less prone to flooding than conventional drainage.
25

Acronym/ Common Term
Full Title Explanation
SCS able
unity Strategy
h they,
ella for all other
SustainComm
The Sustainable Community Strategy (SCS) is prepared by local strategic partnerships (LSPs) as a set of goals and actions whicin representing the residential, business, statutory and voluntary interests of an area, wish to promote. The SCS should inform the local development framework (LDF) and act as an umbrstrategies devised for the area.
TAMP t Asset Management Plan sport assets maintained
TransporA Transport Asset Management Plan aims to bring together the management processes associated with the maintenance of the transport network with information on the tranby a local authority in one document.
T lan
able transport modes to offer an alternative to the t AP Town Access P
A local plan containing a package of complementary measures for atown or city that seeks to improve accessibility, reduce congestion, improve sustainprivate car and raise awareness of travel options. TAPs were firsproposed within the second Hampshire Local Transport Plan (2006-2011), and since then a number have been produced or are in the process of being produced. Draft TAPs are subject to local public consultation.
TfSH Transport for uth HampshirSo e
in 2007 Transport for South Hampshire is a delivery agency formed for the South Hampshire sub-region, bringing together local transport authorities, transport operators, business interests and government agencies to deliver change. The organisation is a partnership made up of the Local Highway Authorities of Hampshire, Southampton and Portsmouth, together with transport providers and other agencies
TIF Tax Increment nancinFi g
The Coalition government in autumn 2010 announced new powers for Local Authorities to be able to borrow against future estimated local tax receipts. This mechanism could be used to help deliver local transport improvements.
Produced by Transport for © Transport for South HamDesigned by Transport for Photography by:
ampsrtsmo
Southampton City Council ABP Southampton DP World Southampton
South Hampshire pshire March 2011 South Hampshire
HPo
hire County Council uth City Council
26