Embed Size (px)
Citation preview
0 / 61
Location Analysis of 3D Printer Manufacturing Industry
A Thesis Presented to the Faculty of Architecture and Planning
COLUMBIA UNIVERSITY
In Partial Fulfillment
of the Requirements for the Degree
Master of Science in Urban Planning
by
Shichen Zhang
May 2014
1 / 61
Introduction
Advanced manufacturing has been well addressed in American policies, especially since 2010 when
the States wanted to revitalize the economy and create jobs by taking advantage of its competitive
sectors. Manufacturing industries benefit the economy by providing well-paid jobs, improving
competitiveness in international trade and triggering innovation for sustainable economic growth
(Tassey, 2010). Reindustrialization policies that are aimed at promoting manufacturing industries
have aroused wide discussion on the perspective of American manufacturing. The Economist even
started an online debate ‘Offshoring & Outsourcing’1. Scholars discussed on whether these policies
could effectively rejuvenate American manufacturing industries and solve the problem of
unemployment. Although some scholars claimed that the restored manufacturing sector would not
be able to bring all the lost jobs back at least in short term, it is commonly believed that
manufacturing would be a catalyst of American economic recovery.2 According to a report issued by
U.S. Department of Commerce, the manufacturing sector accounted for 12 percent of GDP in 2011
and contributed to more than 25 percent of GDP growth between 2009 and 2011 (Bond, 2013). It
also led to 68 percent of American private investment in research and development (R&D) (2009)
and 60 percent of exports (2010). Its effect on job creation should by no means be underestimated
after all. Advanced Manufacturing Portal demonstrates that around 500,000 domestic manufacturing
jobs have been added since 2010, and moreover, it has significant multiplier effect on employment in
service industries. On average, one more manufacturing job would generate 1.6 service jobs.3
Technology-based industries in particular have much greater multiplier effect because they require
investment in human capital and relevant services along the supply chains. Typically, one high-tech
manufacturing job would create as many as 5 service jobs4. The development of advanced
manufacturing is based on great technology intensity, highly skilled labor and the incentives for
innovation. The U.S. has attached more importance to reconsolidate these factors in order to
strengthen the global competitiveness 5 . The great potential of America in technology-based
manufacturing industries can be demonstrated by the growth of domestic manufacturing investment
and the on-shoring of a series of advanced manufacturing firms6. This phenomenon shows that it
could be a good approach for the U.S. to stimulate the economy by promoting advanced
manufacturing.
Additive manufacturing, widely known as 3D printing, is a typical example of advanced
manufacturing that is high value added, driven by technological innovation, highly skilled labor,
cutting edge materials and production process, and the U.S. has shown a clear advantage in
developing this technology (Krabeepetcharat, 2012). 3D printing technology quickly converts “design”
to physical products and reduces the costs of producing complex industrial components. Compared
with conventional “subtractive” processes, environmental impacts of 3D printing are minimal and
1 Economist Debates: Offshoring & Outsourcing, (January, 2013). The Economist.
2 Capturing Domestic Competitive Advantage in Advanced Manufacturing. (July, 2012) Executive Office of the President
and President’s Council of Advisors on Science and Technology. 3 U . S Manufacturing In Context (2012). Advanced Manufacturing Portal
4 U . S Manufacturing In Context (2012). Advanced Manufacturing Portal
5 Capturing Domestic Competitive Advantage in Advanced Manufacturing. (July, 2012) Executive Office of the President
and President’s Council of Advisors on Science and Technology. 6 Reshoring manufacturing: Coming home (January, 2013) The Economist.
2 / 61
shipping costs can be cut down. Given the merits of manufacturing digitalization, it is regarded as
“the third industrial revolution.” The first 3D printer was created in 1984. During recent decade, 3D
printers have now become more popular owe to the improvement in functions and lower prices.
They have been applied to diverse fields such as lightweight aerospace, structures and custom
biomedical implants. 3D printer manufacturing industry, as a critical player in the 3D printing
development, is a growing technology-based industry with great potential to be further developed.
The U.S. has played a leading role in 3D printer production and ownership. Approximately 40.8% of
all 3D systems installed worldwide are in the United States, 28.2% are in Europe and 26.9% are in the
Asia/Pacific region (Krabeepetcharat, 2012). More 3D printer manufacturers are based in the United
States (and US owned) than any other region because of the United States' comparative advantage in
developing cutting-edge technology and industries (Krabeepetcharat, 2012). US-manufactured 3D
printers are becoming more popular abroad. Some top 3D printing companies and also the industry
leaders such as 3D Systems Corp. and Stratasys Ltd. are based in the United States. As 3D printing
technology is becoming more and more popular worldwide, 3D printer manufacturing has been in
full swing, taking advantage of the increasing demand. This typical high-tech manufacturing is likely
to be one of the new engines of innovation and exports for the U.S. (Krabeepetcharat, 2012).
The production of 3D printers demonstrates a nationwide presence in the U.S. Usually, high-tech
industries are considered to be concentrated in innovation clusters such as Silicon Valley and Route
128 (Hulsink, Manuel and Bouwman, 2007). 3D printer manufacturing industry also shows a higher
density of industrial establishments in California which is the origin of this technology and also a
leading industrial state. Nevertheless, the distribution of 3D printer companies is not bound within
California, but has spread out to the Southeast, Mid-Atlantic and Great Lakes. Despite the reliance of
cutting edge technology, the establishment of 3D printer production has a significant presence in
traditional industrial states such as Texas, Illinois, Minnesota, New York, Pennsylvania and Ohio. Its
development in South Carolina and Florida is also outstanding.
Today, many noted 3D printer manufacturers are located in the States other than California. For
example, 3D Systems Corp. is based in South Carolina, MakerBot Industries in New York, Stratasys Ltd.
in Minnesota, and Z Corp. in Massachusetts. The locations of some of 3D printer producers are based
on strategic consideration. Take 3D Systems Corp. for instance. It was established in 1986 and is
currently one of the leading 3D printer manufacturing firms that produce both industrial and home
3D printers. In 2006, it moved headquarter, operations and R&D from Valencia, California to Rock Hill,
South Carolina. In October 2013, it announced to expand its manufacturing facility in Rock Hill.
Another example of non-Californian 3D printer manufacturer is MakerBot, a representative of new
firms specializing in personal 3D printer production (acquired by Stratasys Ltd. but continue to
operate as a distinct brand). This company has been developed in Brooklyn, New York City since its
establishment in 2009. Its production has been increasing over the past years. In June 2013, it
opened a large new factory in Brooklyn as an expansion of its investment in this high density area.
It is an interesting phenomenon that some 3D printer companies would like to locate their
production in the cities that are not new technology clusters and even may not be competitive in
rental and labor costs. To understand this phenomenon, I will look into two questions: What are the
location factors of 3D printer manufacturing industry? Why can some cities that are not noted for
high-tech clusters successfully attract 3D printer manufacturers? My thesis will focus on the 3D
3 / 61
printing manufacturing in the U.S. Answers to the two questions are expected to suggest some
strategies for cities that are not high-tech cluster to attract innovative manufacturing industries.
Literature Review
Neoclassical Location Theory
Early studies on the location decision of industries were rooted in neoclassical assumption that
manufacturing firms place highest priority to minimizing cost and maximizing profits when making
location decisions (Weber, 1929). According to neoclassical location theory, the location decision of
firms is based on the “least cost” approach that addresses factors on the supply side, such as
transport cost, labor cost and agglomeration economies (Hayter, 1997; Maggioni, 2002). Despite a
lack of analysis from the demand side and firms’ strategic decision-making, this early model has
merits of providing “market area” and “locational interdependence” approaches. It shows that
clustering to maximize market power may occur through strategic locational decisions, even if the
agglomeration economies are not available. Firms were believed to concentrate as a response to
regional economic conditions (Galbraith and Rodriguez, 2008; Kilvits, 2012). The primary
assumptions are increasing returns to scale and the economies of scale for industrial development at
a region.
Krugman emphasizes the importance of positive externalities such as labor force pool and localized
sources of specialized suppliers (Krugman, 1995; Maggioni, 2002). He explains the firm location from
four aspects (Kilvits, 2012). First, social physics help construct economic relationships. For example,
high market potential that attracts firms could be calculated in a way similar to the gravity model,
dividing market access by distance. Secondly, this new economic geography explains location
decisions of firms through a dynamic analytical framework with the interaction of an initial historical
accident and a cumulative process (Maggioni, 2002). This cumulative causation indicates “a circular
relationship whereby a region attracts firms whose presence attracts other firms, who attract still
other firms, and so on” (Kilvits, 2012). It also explains the relationship between innovation and the
emergence of industrial cluster. Third, concentration of production results from positive local
externalities which would also provide insights into optimum city size. Finally, according to the land
rent theory of von Thünen, there is a gradient of decreasing land values as the distance from an
urban center increases. It could shed light upon “centrifugal” forces but could not effectively explain
the existence of economic centers (Krugman, 1995).
Knowledge Network
Krugman’s location explanation covers a wide range of industries, including high-tech industries. He
considered pure technological externalities and knowledge spillovers as agglomerating factors.
However, he is skeptical on the effectiveness of knowledge spillovers in determining the formation of
cluster (Maggioni, 2002). He places the lowest priority to pure technological externalities among
location factors because he found many of the clustering industries in the U.S. were not high-tech
sectors (Krugman, 1991). Moreover, he prefers to focus on the externalities that could be modeled,
rather than be explained based on assumption. He thinks knowledge flows are invisible without any
paper trail to be measured and tracked (Krugman, 1991).
4 / 61
Although Krugman does not provide sufficient analysis of the knowledge network for high-tech
industries, many other scholars have addressed this crucial factor. Especially as the first-generation of
high-tech clusters came into being at Silicon Valley and New England, more research interest have
been attracted to analyze the agglomeration tendencies influenced by the influences of human
capital resources, social and venture capital networks (Calbraith and Rodriguez, 2008; Alcacer and
Chung 2007; Drejer 2005). The technological infrastructure approach is a very pragmatic way to look
into the spatial distribution of innovations in terms of the availability of well-developed technological
infrastructure (Feldman, 1994, 1995; Maggioni, 2002). Based on empirical evidences, he defined four
indicators of agglomeration: networks of firms in related industries, university R&D, industrial R&D,
and business-service firms (Feldman, 1994). His technological infrastructure approach is aimed at
testing the relevance of externalities and agglomerative forces empirically. He measures the
influences of knowledge spillover through the size of R&D outlays and the number of innovations
produced and/or patents awarded. Feldman’s works are dedicated to analyze the geography of
innovation instead of the location of innovative firms. The location of firms is only regarded as a
dependent variable to partially explain the spatial distribution of product innovation (Maggioni,
2002). Nevertheless, he still contributes to the location theory for high-tech industries by recognizing
the importance of spatial aspects in innovative process and the applying data, variables, proxies and
empirical test to examine hypothesis (Maggioni, 2002).
The Importance of Work and Living Environment
While previous location theories focus on cost minimization and knowledge spillover, current
research studies have started investigating the influences of soft factors such as “quality of life”,
“image” of places or personal reasons (Kilvits, 2012). High-tech companies need to attract and
maintain intelligent and creative workers. These workers are seeking good living conditions and they
are willing to work and live in places where there is good housing, environment, infrastructure and
public services (Kilvits, 2012). The demand of talented workers has been integrated into the location
criteria of high-tech companies. The factors related to quality of life are regarded as behavioral
factors in firm location decision (Fernandes, Ferreira, & Marques, 2010). They can be categorized into
eight types (Fernandes, Ferreira, & Marques, 2010): (1) Founder decides to live in that locality; (2)
Employees wish to live in that locality, (3) Good (high-quality affordable) housing conditions (prices,
size, etc.); (4) Recreational and leisure opportunities; (5) Climate in the region; (6) Cost of the land; (7)
Quality of air and water; and (8) Good educational system and all infrastructure.
An Active Role of Industries
As neoclassical location approach indicates that firms play a more or less passive role in selecting
location and benefiting from the available endowments, another approach called industrial
geography approach assume that industries are able to “generate their own conditions of growth in
place” (Storper and Walker, 1989). This approach stresses the causal relationship between internal
dynamics of a capitalistic economy and the territorial pattern of industrialization (Kilvits, 2012).
Industrial distribution is formed through endogenous factors such as technological and economic
progress rather than simply through a process of efficient allocation of factories across “a static
economic landscape” (Storper and Walker, 1989). Industries play an active role by “making factors of
production come to them or causing factors supplies to come into being where they did not exist
5 / 61
before” or rather “creating their own geography” (Storper, 1997; Storper and Walker, 1989). Firms
can negotiate with various sectors in the production process, for example, governments at local or
regional level, deliverers and suppliers, labor unions, other institutions, etc. to decide specific prices,
wages, taxes, subsidies and infrastructure for their production (McCann, 2002). Locational behavior
can be regarded as the outcome of negotiations (Kilvits, 2012). However, the implication is limited to
the geography of large enterprises that have more bargaining power and capable of fundamental
influences on local circumstances, whereas small firms tend to accept the restrictions and constraints
embedded in government policies and real-estate market (Kilvits, 2012).
Life Cycle
Krugman and Brezis (1993) put forward the notion of “technology and life cycle of cities” that can be
applied to the analysis of high-tech clusters. During the time of major technological change, learning
by doing is localized in some leading cities and contributes to upstart metropolitan areas (Brezis and
Krugman, 1993; Maggioni, 2002). They analyze the emergence of new centers from the prospect of
technological innovation. “When a new technology for which the accumulated experience is
irrelevant is introduced, older centers prefer to stay with a technology in which they are more
efficient. New centers, however, turn to new technology, and are competitive despite the raw state
of that technology because of their lower land rents and wages. Over time, as the new technology
matures, the established cities are overtaken (Brezis and Krugman, 1993). They further argue that
successful commercialization of innovation facilitates the birth and development of new high-tech
clusters but usually at the expenses of older centers. The works of Krugman and Brezis suggest that
traditional and common economic reasons may explain the geographic pattern of high-tech firms.
But the analysis of some characters of spatial economics is not explicitly demonstrated in their work.
For example, they have not addressed congestion and agglomeration diseconomies that may put a
check on the development of many promising industrial clusters.
The notion of life cycle introduced by Krugman and Brezis was reexamined by many other scholars
but from the perspective of industries. Their studies are not limited to the invention of new
technologies but also the diffusion process of innovation. The diffusion theory explains why a new
phenomenon or innovation takes time to reach the entire population. The life cycle of an industry
begins with a product’s design, followed by its entry into the market, expansion, export and finally
foreign investment (Federal Planning Bureau, 2000; Kilvits, 2012). The special distribution of
technology-based industries is regarded as a process of diffusion. The spatial dynamics of industry
growth usually contrain four phases (Maggioni, 2002): (1) localization (a new fast growing industry
creates its own location conditions due to its factor-creating and factor-attracting power); (2)
clustering (internal and external dynamic economies of productions lead to spatial concentration); (3)
dispersal (new plants move further away from established industry centers, both as a response to
increasing congestion and as a growth strategy through “expansive periphery”); and (4) shifting
center (the crisis of established sites in the long-run shifts in the centers of industrial activity)
(Maggioni, 2002). When firms are in the early stages of a new industry, they face less limitation to
the choice of location. They can settle on any of a wide variety of places and even escape from
existing industrial agglomerations “because they profit from dynamic economies of production,
accelerated investment flows and labor influx that are not necessarily dependent on the activities of
firms in other (older) sectors” (Maggioni, 2002; Storper and Walker, 1989). High tech activities that
6 / 61
start from the origin of innovation are transferred to other locations with lower labor cost when a
product is at the stage of standardization. Location factors of an industry may also differ depending
on its life cycle and the product’s maturity (Kilvits, 2012). A cost structure adopted at the early stages
of a product’s life cycle may not effectively sustain its development when it matures (Cohen, 2000).
Kilvits (2012) points out companies at the research and development phase may be less sensitive to
real estate costs but greatly rely on the availability of sophisticated labor markets and qualified
human capital. Later businesses that are more cost sensitive are likely to be attracted by the cost
advantages provided by low-cost regions at the periphery or even oversea (Kilvits, 2012).
As summarized by Maggioni, spatial expansion is a common phenomenon in an industry’s growth. In
the phases of dispersal and shifting center, firms may relocate establishments while maintaining or
closing the existing ones in order to achieve specific development goals. Firm relocation is not the
same as location decision because it explicitly considers the substitution of one place for another
(Kilvits, 2012). The history of a firm is likely to affect the location criteria and process. The locational
outcome is therefore conditional on its previous operating experience. McCann (2002) separate the
relocation process into two sequential steps, namely the decision to move and the relocation choice
conditional upon a move. The two steps can be understood as push and pull factors of migration
(Kilvits, 2012). Push factors are unfavorable characters or regional comparative disadvantages of an
area that result in firm motives to leave their locality (Ženka & Cadil, 2009; Pen, 1999). Pull factors on
the other hand are comparative advantages of a relocation destination. It is possible to summarize
the prevailing motives of companies’ displacement into three categories: “cost-oriented (most often
driven by labor cost reduction), market-oriented (capturing new markets), and resource-oriented
(qualified labor force, suppliers, mineral resources, etc.)” (Kilvits, 2012). In addition to the obvious
push and pull factors, the keep factor is raised in the delocalization of manufacturing industries
(Ženka & Cadil, 2009; van Dijk & Pellenberg, 1999). The keep factor ensures the continuance of a firm
in the new location. It refers to financial and organizational intensity, relations with supplier, etc
(Kilvits, 2012).
Summary of Location Factors
Previous scholars summarize the location factors for innovative industries based on different systems.
For example, Hayter (1997) explains the location of economic activities through three approaches:
the neoclassical approach that focuses on cost minimization; the institutional approach that specifies
firms’ interaction with clients, suppliers, government and institutions; and the behavioral approach
that is dealing with uncertain situations and firms’ ability of utilizing limited information. Another
example is based on the influences on R&D process (Ouwersloot and Rietveld, 2000) because R&D
process usually accounts for the technological innovation that is a driving force of high-tech
industries’ development. Four major external factors that may influences firms’ location decisions
are labor offer, knowledge infrastructures, physical infrastructures and agglomeration effects.
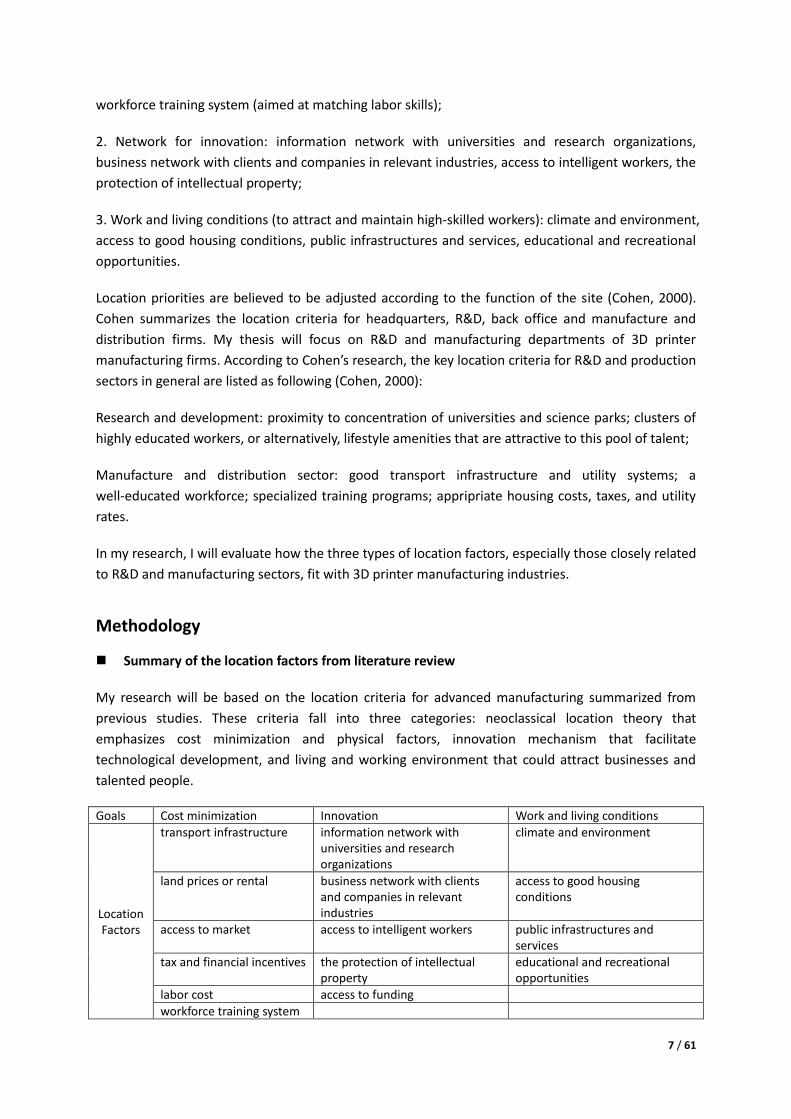
Based on the existing systems of location factors, I will summarize these factors into three categories
according to the goals of high-tech companies:
1. Cost minimization (based on neoclassical location theory): transport/ communication
infrastructure, land and utility prices, access to market, tax and financial incentives, labor cost,
7 / 61
workforce training system (aimed at matching labor skills);
2. Network for innovation: information network with universities and research organizations,
business network with clients and companies in relevant industries, access to intelligent workers, the
protection of intellectual property;
3. Work and living conditions (to attract and maintain high-skilled workers): climate and environment,
access to good housing conditions, public infrastructures and services, educational and recreational
opportunities.
Location priorities are believed to be adjusted according to the function of the site (Cohen, 2000).
Cohen summarizes the location criteria for headquarters, R&D, back office and manufacture and
distribution firms. My thesis will focus on R&D and manufacturing departments of 3D printer
manufacturing firms. According to Cohen’s research, the key location criteria for R&D and production
sectors in general are listed as following (Cohen, 2000):
Research and development: proximity to concentration of universities and science parks; clusters of
highly educated workers, or alternatively, lifestyle amenities that are attractive to this pool of talent;
Manufacture and distribution sector: good transport infrastructure and utility systems; a
well-educated workforce; specialized training programs; appripriate housing costs, taxes, and utility
rates.
In my research, I will evaluate how the three types of location factors, especially those closely related
to R&D and manufacturing sectors, fit with 3D printer manufacturing industries.
Methodology
Summary of the location factors from literature review
My research will be based on the location criteria for advanced manufacturing summarized from
previous studies. These criteria fall into three categories: neoclassical location theory that
emphasizes cost minimization and physical factors, innovation mechanism that facilitate
technological development, and living and working environment that could attract businesses and
talented people.
Goals Cost minimization Innovation Work and living conditions
Location Factors
transport infrastructure information network with universities and research organizations
climate and environment
land prices or rental business network with clients and companies in relevant industries
access to good housing conditions
access to market access to intelligent workers public infrastructures and services
tax and financial incentives the protection of intellectual property
educational and recreational opportunities
labor cost access to funding
workforce training system
8 / 61
Industry analysis
Some of these location factors are supposed to be especially important for 3D printer manufacturing. I
will find out them through industry analysis. To better understand this industry, I will start with the
evolution of 3D printing technologies. In this first section, I will introduce and compare the major
technologies adopted in 3D printing, including their origin, application, merits and drawbacks as well as
the open-source of 3D printing. It can illustrate where this innovative manufacturing emerged in the early
steps and how the technological evolution has shaped business activities.
It will be followed by the analysis of supply chain of 3D printer manufacturing, i.e. supply industries,
products and services of 3D printer manufacturers, demand industries and market drivers. This section
will emphasize on the industries that are applying 3D printing, which are also the clients of 3D printer
companies. I will look into the interaction between 3D printer producers and their clients, in order to
discover to what extent their location decisions would be bound up with the locations of their clients. The
maps to be presented include nationwide distribution of 3D printer manufacturing establishments, the
distribution of key selling industries (suppliers for 3D printer production) and key buying industries. I will
compare the maps and examine whether the 3D printer manufacturing industry is expanding to states
with competitiveness on either supply or demand side.
The third section will demonstrate the industry scale and market performance in America. By referring to
IBISWorld industry report and Wohlers reports, I will present business growth, cost structure, competition
among firms and public support for technology development. These analyses would capture the current
development and trend of this industry. They would disclose some success factors for 3D printer
manufacturing companies. My study will distinguish the dynamics of producing industrial 3D printers and
personal 3D printers. Since industrial 3D printer producers are generally big firms with a long history while
personal 3D printer producers are the opposite, their development paths and requirements would also
diverge.
Case studies
In order to explain how these location considerations are integrated into a company’s development
strategy and what influences it would have on local economy, I interviewed two American 3D printer
companies on their location decisions. The two case studies will be presented in this section.
The first one is the relocation of 3D Systems Corp, one of the earliest 3D printer producers. The case will
start with the introduction of this company’s development history, a snapshot of Valencia, CA the original
location and the new office at Rock Hill so as to understand the context of relocation and its purpose. As
3D Systems had identified four states as candidates for their relocation destinations, I will make a general
comparison of them based on cost of doing business, industrial specialization and educational and
research facilities. The comparison will shed light upon some of South Carolina’s advantages on a region
level. After that, analysis will zoom in to the City of Rock Hill, SC and Waterford Business Park where the
new headquarter and production are established, and examine how this new site fit into 3D Systems’
location considerations, from the aspects of proximity to related industries, infrastructure, training
facilities and financial incentives. Finally, I will investigate the benefits of relocation for the firm, the City
and the community.
9 / 61
The second case is the development of MakerBot Industries, a famous producer of personal 3D printers. It
was founded in Brooklyn, New York. The firm expanded twice during their first five years and all of their
R&D and production maintained in Brooklyn. Similar as the first case, I will first review the development
of this company. Since it is highly committed to Brooklyn, the analysis will take a detailed look at the
endowments of Brooklyn and New York City in general. The analysis will highlight some key location
factors such as infrastructure, knowledge network, well-educated workers, demand for personal 3D
printers, funding supports and incentive policies. New York City is becoming a cluster of 3D printing
industries. The establishment of small 3D printer companies like MakerBot is expected to influence local
employment.
Industry Analysis
Evolution of additive manufacturing technologies
Additive manufacturing (AM) is defined by the ASTM International Committee F42 as “the process of
joining materials to make objectives from 3D model data, usually layer upon layer, as opposed to
subtractive manufacturing methodologies” (Wohlers, 2011). As this industry grows, many synonyms
of AM have emerged and “3D printing” is the most popular one among them. Committee F42
defines it as “the fabrication of objects through the deposition of a material using a print head,
nozzle, or another printer technology” (Wohlers, 2011). 3D printing is generally considered as
synonymous with AM; in particular, it denotes the technology and machinery at low end regarding
relative price and/or overall capacity (Wohlers, 2011). Today, many mainstream press, research
organizations, investment communities and CAD industries are using “3D printing” and “additive
manufacturing” interchangeably when referring to this industry. In my thesis, I will use “3D printing”
as a synonym of AM industry.
The attempt of using laser and photopolymers to create solid objects dated back to the late 1960s.
During the 1970s and the early 1980s, research institutes and technology companies in the U.S.,
Denmark, France, Japan, etc. obtained a series of patent entitled apparatus for producing solid
models taking laser curing approaches. However, none of these institutes or firms aimed at selling
AM systems. They either could not fulfill the requirements of working AM systems or only tried to
commercialize this technique on a service basis (Wohlers & Gornet, 2013).
In 1984, Chuck Hull filed a U.S. patent for an apparatus that produced 3D objects by
stereolithography (SL) and the patent was granted two years later. SL is “a process that solidifies thin
layers of ultraviolet (UV) light-sensitive liquid polymer using a laser” (Wohlers & Gornet, 2013). Hull
invented this process while working as a vice president of engineering at UVP, Inc in San Gabriel,
California. After getting this patent, he quit his job and co-founded 3D Systems Corp. (at that time in
Valencia, California) in 1986 (Wohlers & Gornet, 2013). They started their formal sales of
stereolithography apparatus (SLA) in 1988 and became the first company that produced commercial
3D printers. SLA (see Figure 1) uses a UV laser to project cross-sections of a product onto the surface
of a pool of photopolymer resin and cure the resin into solid products. SLA has extreme precision
with layers of several microns thick. Another advantage is the satisfactory speed of making functional
parts. The time of production depends on the size and complexity, from a few hours to more than a
day. SLA is a good choice to make visual prototypes and artistic models, but the material
10 / 61
photopolymer resin is brittle, expensive and difficult to recycle (Drummond, 2013).
Fused Deposition Modelling (FDM) was another crucial 3D printing technology, patented by S. Scott
Crump in 1989. FDM squeezes lines of recyclable molten thermoplastic materials through a fine
nozzle onto a work-surface (Drummond, 2013). Crump who was then a co-founded of IDEA Inc.
commercialized this technology with his wife in 1990 by establishing the company Stratasys Ltd. (at
that time, in Delaware). FDM has now become the most widely used AM technology. FDM apparatus
unwinds a plastic filament that supplies material to an extrusion nozzle. The heated nozzle melts
different materials and turns the flow on and off7. As shown in Figure 2, the nozzle moves a table and
deposits extruded materials which immediately cool to form a thin layer. Support structures can be
easily washed away manually within water solution8. Materials that are available for this process
include ABS, PC-ISO polycarbonate and Ultem-9085, etc9. This process is quite, office-friendly and
fast for small parts of several cubic inches or with tall and thin form-factors. However, it is very slow
for parts with wide cross-sections and has restrictions on the slope of overhang10. FDM can be used
for aerospace and aviation applications and also for prototyping scaffolds for medical tissue
engineering.
Selective Laser Sintering (SLS) is a 3D printing method that uses lasers to sinter and bind powdered
materials to create solid products (see Figure 3). It was patented by two scholars at the University of
Texas at Austin in 1987. They were involved in establishing a company named DTM to produce SLS
machine (acquired by 3D Systems in 2001) (Lou & Grosvenor, 2012). SLS is a less expensive
technology that uses a range of engineering plastics and metals to produce functional parts. The SLS
materials include nylon, glass-filled nylon, polystyrene, ceramics, steel, titanium, aluminum and even
sterling silver. Unlike SLA and FDM, SLS does not need support structures because the object is
surrounded by powder material throughout the production process. However, SLS apparatus is more
intricate than SLA and most other technologies and surface finishes and accuracy cannot achieve the
same precision as SLA. Still, SLS can produce complex geometries with material properties very close
to those of intrinsic materials11. This technology is often applied to the fields of aerospace and
medical services.
A new AM technology, Three Dimensional Printing (3DP) was developed at MIT in 1993 and
commercialized by Z Corporation located in Burlington, Massachusetts (acquired by 3D Systems in
2012) (Wohlers, 2011). 3DP apparatus has an inkjet-like printing head selectively deposit liquid
binding material on a powder bed. When the two dimensional pattern has formed a layer of object,
another layer of powder is spread across the top of the model and the process repeats (see Figure
4)12. Available materials of 3DP include bonded plaster/ plaster composite, elastomeric, investment
and direct casting. 3DP has advantages of speedy fabrication, low materials cost and full color output,
making this method well applied to industrial design, scientific visualization and architectural
modeling applications. Nevertheless, there are limitations on resolution, surface finish and number
of available materials. The produced parts are fragile and have to be infiltrated with an adhesive
7 Castle Island, 2012, “Fused Deposition Modeling”
8 Castle Island, 2012, “Fused Deposition Modeling”
9 Solid Concepts, 2013, “3D Printing Technologies”
10 Castle Island, 2012, “Fused Deposition Modeling”
11 Castle Island, 2012, “Laser Sintering”
12 Castle Island, 2012, “Three Dimensional Printing”
11 / 61
before being safely handled13.
With the growth of AM industry, more new or revised 3D printing methods have emerged, for
example, Inkjet based systems, Direct Metal Laser Sintering (DMLS), Laminated Object
Manufacturing (LOM), Laser Powder Forming (LPF), etc14. The number of patent application and
issuance in the U.S. has been climbing up ever since the economy recovered in 2010 (see Figure 5).
Still, the four technologies namely SLA, FDM, SLS and 3DP remain to be the most commonly used 3D
printing methods and have been improved consistently (Krabeepetcharat, 2012). The four methods
have different strengths and drawbacks and they are all in active application for a variety of AM
products. Their characteristics, application and price levels are compared in Table 4.
In the mid-2000s, open-source of 3D printing technologies came into being. 3D printing methods are
no longer secrets to a small number of high-tech firms. In 2005, the University of Batch in England
launched the RepRap project mainly based on the technique of Fused Filament Fabrication (FFF) (an
equivalent term of FDM to avoid trademark violation). It aims at producing a self-replicating 3D
printer that could make some or all the key components that could be assembled to make an exact
copy of itself (Drummond, 2013). This “Replicating, Rapid-prototyping” project started the
“open-source 3D printer revolution” and generated numerous low-cost 3D printers15. One year later,
Cornell University began another open-source mass-collaboration named Fab@Home, allowing
members to develop personal fabrication at home16. In late 2008, Zach Smith, one of the RepRap
contributors, started an open-source website called Thingiverse, allowing people to upload digital
designs for others to print. Before the emergence of open-source systems, 3D printers are usually
very expensive and only for industrial uses. The open-source projects like RepRap and Fab@Home
established online communities where engineers, inventors, artists, students and hobbyist can
interact and produce their own machine. Open-source effectively reduced the technological
threshold and cost of 3D printer manufacturing and encouraged the production of 3D printers for
personal uses. A series of personal 3D printer manufacturers, for example MakerBot Industries,
started their businesses from open-source projects (Drummond, 2013).
In the 2010s, a striking issue in evolution of 3D printing technology is not the invention of new 3D
printing methods, but the expiration of many existing patents. The expiration of FDM patent in 2008
triggered a new generation of desktop 3D printer brands such as MakerBot, Bits from Bytes and
some other commercial versions of RepRap systems, and the prices fell significantly to $10,000-$300
(Miguel, 2013; Mims, 2013). On January 28, 2014 SLS patent expired, which means this high
resolution will be better applied to 3D printers and they will be much more affordable to users.
Between 2014 and 2016, several 3D printing patents will expire. Although people debate on whether
their influenced on market will be immediate or more gradual, there is a clear trend that the removal
of intellectual property barrier will increase competition and cut down prices (3ders.org, 2014).
Mergers and acquisitions have never stopped even since the debut of 3D printer manufacturing.
When new 3D printer companies appear with improved technologies at lower costs, existing big
13
Castle Island, 2012, “Three Dimensional Printing” 14
Castle Island, 2012, “Important Commercial RP Technologies at a Glance” 15
RepRap Organization, 2014, http://reprap.org/wiki/RepRap 16
Fab@Home Project, 2014, http://www.fabathome.org/index.php?q=node/2
12 / 61
firms such as 3D Systems and Stratasys tend to acquire them. While early big firms usually produce
expensive industrial systems, the new firms mainly focus on providing the most cost-effective 3D
printers. Through acquisition, big companies can thus absorb cutting-edge technologies, and more
importantly, they will get access to low-end market, promoting a variety of their 3D printers and
expanding their market share (Wohlers, 2011). Those small new companies are likely to maintain
their original brand and operate as a separate subsidiary, for example MakerBot under Stratasys.
Meanwhile, they could make their products better known to more consumers and enhance financial
stability (Stratasys, 2013). Similar win-win games are also seen among big firms’ merger, for example
3D Systems and Z Corp, and Stratasys and Objet, aimed at capitalizing on each other’s technological
advantages and obtaining entry to nationwide and even worldwide market. Some 3D printer
manufacturers are extending their businesses to 3D printing services. For example, 3D Systems have
purchased many medium-sized service bureaus and software and design companies. Their purpose
was to make their latest technologies quickly widespread to customers. They hope the increased
demand of improved components and services will catalyze more demand for their 3D printers17.
The evolution of 3D printing technology demonstrates that the commercialization of new techniques
often started from universities, research centers or noted technology firms. As shown in Figure 6, 3D
printer manufacturing business establishments18 are predominantly located in California and the
Northeast because they are the regions where 3D printing technologies were first invented and
commercialized. The two regions are both noted for high cluster specialization in education and
knowledge creation and they also demonstrate active patenting performances (see Figure 7). With
the development of this technology, new start-up firms have emerged, making the distribution of 3D
printer businesses spread out. Especially since 2005, open-source programs and the expiration of
patents have significantly lowered the technical threshold and made the location of 3D printer firms
more dispersed. However, their debuts were often followed by acquisition or merger. Manufacturing
sites may remain at the original locations of these firms. Sometimes, big firms would choose to
relocate based on considerations such as cost minimization and customer relationship, other than
proximity to universities and research institutes. It is because the acquisition could already provide
them with access to inventions, making them less bound to top universities and research institutes.
Supply chain of 3D printer manufacturing
Market drivers
A major market trend that leads to the increasing demand for additive manufacturing is the so-called
“mass-customization” which requires the manufacture of low-volume or individualized parts and
products. 3D printing technology manages to enhance companies’ performance in customization and
augments their profits by lowering or even eliminating the tooling costs. Compared with traditional
manufacturing, 3D printing significantly reduces time for production of low-volume and shortens
product life cycles. Also the economic recovery has led to an augment in Research and development
17
Castle Island, 2013, “The Rapid Prototyping Industry Competition Overview”
18 As defined by the Standard Industrial Classification Manual 1987, “establishment” is ". . . an economic unit, generally at
a single physical location, where business is conducted or where services or industrial operations are performed."
http://www.eia.gov/emeu/efficiency/mecs_glossary.htm
13 / 61
(R&D) expenditure (Krabeepetcharat, 2012). It influences demand for 3D printers because they are
often used to create quick prototypes when developing new products. As 3D CAD application and
other computer programs have been introduced at lower costs, network communication on product
designs have been gradually developed. Especially for global operation, 3D printing can facilitate the
communication and cooperation between geographically-remote teams by easily converting designs
into models and examining them based on different markets. 3D printing technologies enable
producers to reorganize along cross-functional production lines and improve the efficiency in product
introduction process (Grenda, 2007).
Supply industries
Copier and optical machinery manufacturing industry supplies optical machinery and parts to
industry operators; design, editing and rendering software publishing industry designs 3D printer
software; plastic and resin manufacturing is the major industry that provides 3D printing materials to
build solid objects (Krabeepetcharat, 2012). According to IBISWorld industry report, purchase of raw
materials has a higher component in total costs than the other two input factors (to be further
discussed in the next section Industry Performance). Despite the wide variety of 3D printing
materials, thermoplastics (solid form) and photopolymers make up a dominating proportion of the
raw materials (see Figure 8) (Wendy Kneissl, 2013) and they are both the products of plastic and
resin manufacturing.
Figure 9 shows national clusters that produces plastic materials and resins. Great Lakes region,
Southeast region and Texas have specialization in the plastic industry. 3D printer manufacturing
shows a significant presence in the three regions (see Figure 6), benefiting from the proximity to raw
material suppliers. Meanwhile, some big 3D printer manufacturers (e.g. 3D Systems, Stratasys) have
also incorporated sale of materials into their businesses.
Products and services of 3D printer manufacturers
Revenues of 3D printer manufacturing mainly come from three sources: sale of build materials, 3D
printers and maintenance services. The proportion of revenue contributed by each segment is shown
in Figure 11.
Build materials: According to IBISWorld industry report, build materials account for the majority of
revenue for the 3D printer manufacturing industry. Sale of materials generated 39.5% of total
revenue in 2012, slightly higher than that of system sale (35.5%). Since the sale of materials recurs
after the installation of a 3D printer, it is expected to make up an increasing share of revenue as more
3D systems are being installed. Different 3D printers usually require different materials, varying in
colors and properties. These materials have also become more and more specialized for diverse
markets and product types (Krabeepetcharat, 2012). Some 3D printer companies have become noted
for their characteristic materials.
3D printers: The 3D printers sold on market are of two categories, industrial systems (office/
professional uses and production uses) and personal systems. They help industries or individual
consumers make prototypes and final parts. 3D printer prices range from more than a thousand
dollar to hundreds of thousands of dollars. The prices of personal systems are among the lowest,
14 / 61
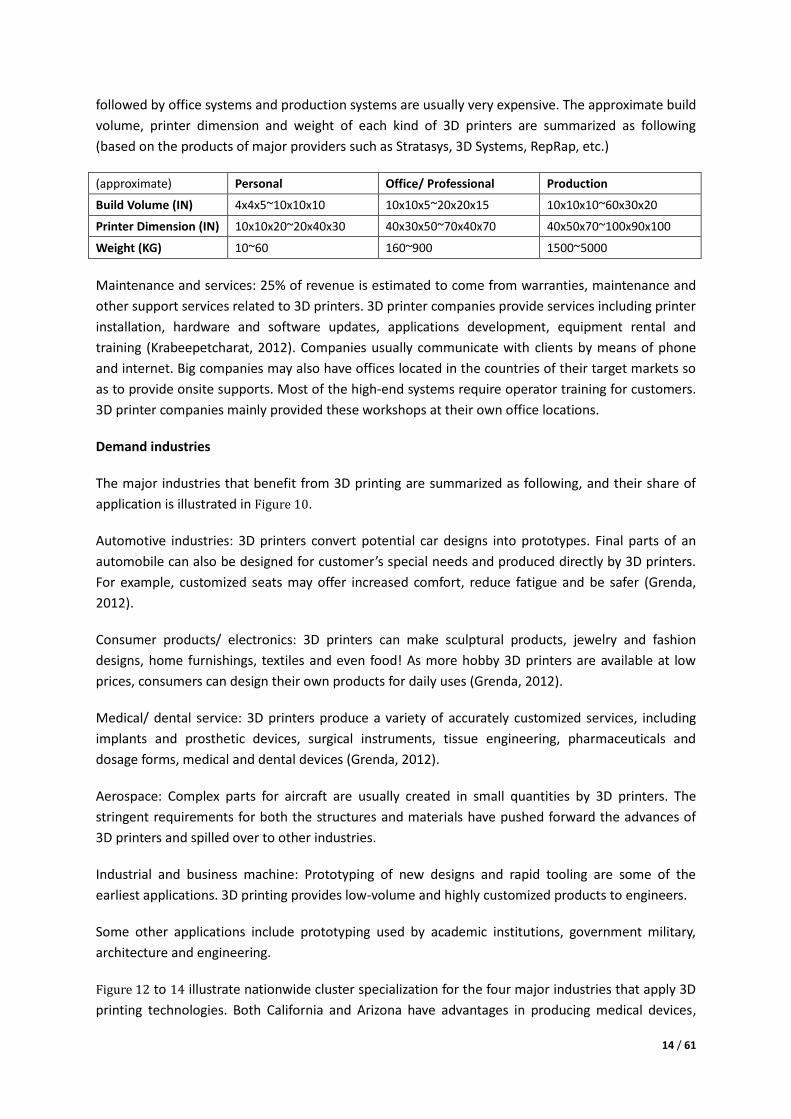
followed by office systems and production systems are usually very expensive. The approximate build
volume, printer dimension and weight of each kind of 3D printers are summarized as following
(based on the products of major providers such as Stratasys, 3D Systems, RepRap, etc.)
(approximate) Personal Office/ Professional Production
Build Volume (IN) 4x4x5~10x10x10 10x10x5~20x20x15 10x10x10~60x30x20
Printer Dimension (IN) 10x10x20~20x40x30 40x30x50~70x40x70 40x50x70~100x90x100
Weight (KG) 10~60 160~900 1500~5000
Maintenance and services: 25% of revenue is estimated to come from warranties, maintenance and
other support services related to 3D printers. 3D printer companies provide services including printer
installation, hardware and software updates, applications development, equipment rental and
training (Krabeepetcharat, 2012). Companies usually communicate with clients by means of phone
and internet. Big companies may also have offices located in the countries of their target markets so
as to provide onsite supports. Most of the high-end systems require operator training for customers.
3D printer companies mainly provided these workshops at their own office locations.
Demand industries
The major industries that benefit from 3D printing are summarized as following, and their share of
application is illustrated in Figure 10.
Automotive industries: 3D printers convert potential car designs into prototypes. Final parts of an
automobile can also be designed for customer’s special needs and produced directly by 3D printers.
For example, customized seats may offer increased comfort, reduce fatigue and be safer (Grenda,
2012).
Consumer products/ electronics: 3D printers can make sculptural products, jewelry and fashion
designs, home furnishings, textiles and even food! As more hobby 3D printers are available at low
prices, consumers can design their own products for daily uses (Grenda, 2012).
Medical/ dental service: 3D printers produce a variety of accurately customized services, including
implants and prosthetic devices, surgical instruments, tissue engineering, pharmaceuticals and
dosage forms, medical and dental devices (Grenda, 2012).
Aerospace: Complex parts for aircraft are usually created in small quantities by 3D printers. The
stringent requirements for both the structures and materials have pushed forward the advances of
3D printers and spilled over to other industries.
Industrial and business machine: Prototyping of new designs and rapid tooling are some of the
earliest applications. 3D printing provides low-volume and highly customized products to engineers.
Some other applications include prototyping used by academic institutions, government military,
architecture and engineering.
Figure 12 to 14 illustrate nationwide cluster specialization for the four major industries that apply 3D
printing technologies. Both California and Arizona have advantages in producing medical devices,
15 / 61
aerospace vehicle and defense and communication equipment. This could be an important reason to
explain why 3D printer production was spread to Arizona. It has not only the location advantage of
being adjacent to the origin of 3D printing but also manufacturing industries that create demand for
products. Similarly, other states that are doing well in 3D printer manufacturing have strengths in the
industries that would support the market for 3D printers. Since these industries require advanced
uses of AM systems, they could possibly provide feedbacks to set high standards for 3D printers.
Valuable information from market tend to stimulate the innovation of 3D printer manufacturing
(Wohlers, 2011; Krabeepetcharat, 2012).
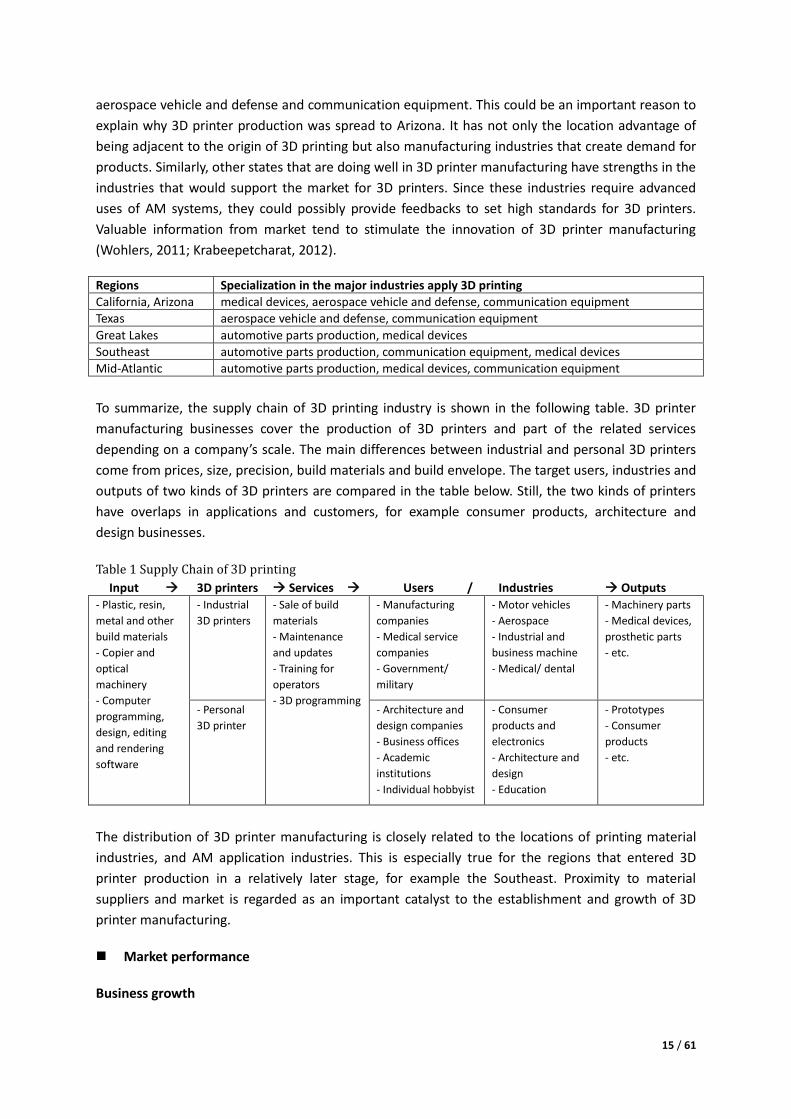
Regions Specialization in the major industries apply 3D printing
California, Arizona medical devices, aerospace vehicle and defense, communication equipment
Texas aerospace vehicle and defense, communication equipment
Great Lakes automotive parts production, medical devices
Southeast automotive parts production, communication equipment, medical devices
Mid-Atlantic automotive parts production, medical devices, communication equipment
To summarize, the supply chain of 3D printing industry is shown in the following table. 3D printer
manufacturing businesses cover the production of 3D printers and part of the related services
depending on a company’s scale. The main differences between industrial and personal 3D printers
come from prices, size, precision, build materials and build envelope. The target users, industries and
outputs of two kinds of 3D printers are compared in the table below. Still, the two kinds of printers
have overlaps in applications and customers, for example consumer products, architecture and
design businesses.
Table 1 Supply Chain of 3D printing
Input 3D printers Services Users / Industries Outputs
- Plastic, resin,
metal and other
build materials
- Copier and
optical
machinery
- Computer
programming,
design, editing
and rendering
software
- Industrial
3D printers
- Sale of build
materials
- Maintenance
and updates
- Training for
operators
- 3D programming
- Manufacturing
companies
- Medical service
companies
- Government/
military
- Motor vehicles
- Aerospace
- Industrial and
business machine
- Medical/ dental
- Machinery parts
- Medical devices,
prosthetic parts
- etc.
- Personal
3D printer
- Architecture and
design companies
- Business offices
- Academic
institutions
- Individual hobbyist
- Consumer
products and
electronics
- Architecture and
design
- Education
- Prototypes
- Consumer
products
- etc.
The distribution of 3D printer manufacturing is closely related to the locations of printing material
industries, and AM application industries. This is especially true for the regions that entered 3D
printer production in a relatively later stage, for example the Southeast. Proximity to material
suppliers and market is regarded as an important catalyst to the establishment and growth of 3D
printer manufacturing.
Market performance
Business growth
16 / 61
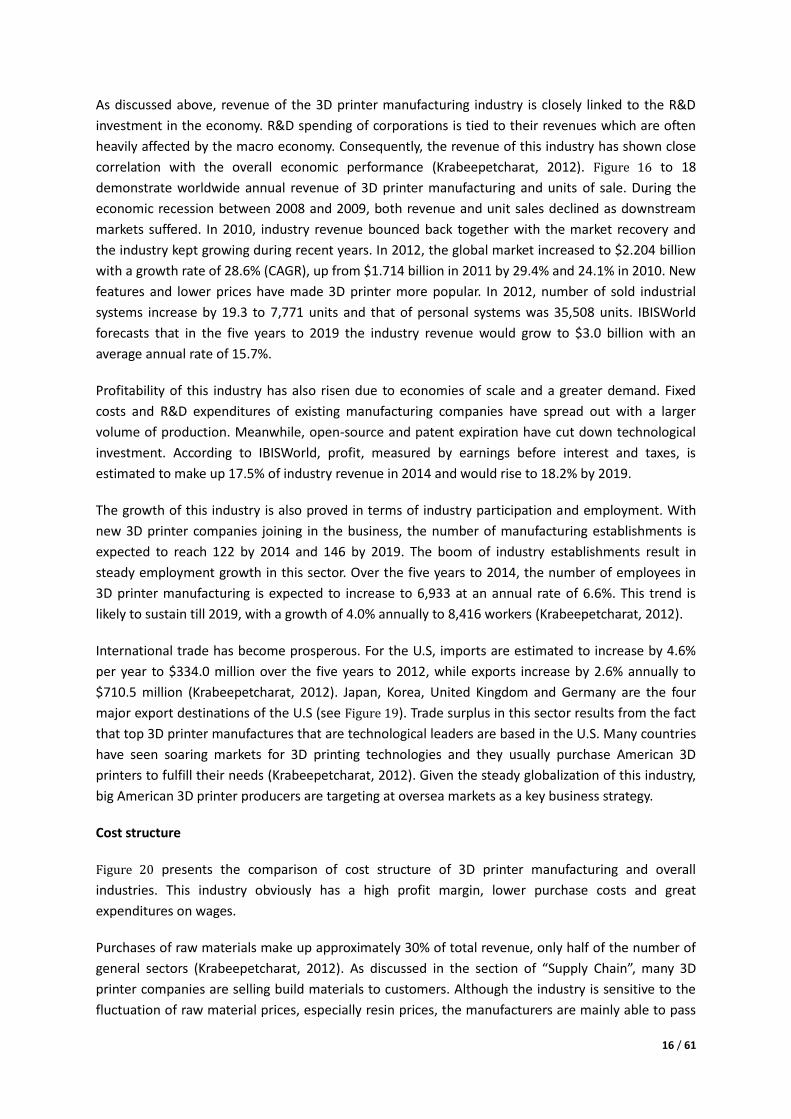
As discussed above, revenue of the 3D printer manufacturing industry is closely linked to the R&D
investment in the economy. R&D spending of corporations is tied to their revenues which are often
heavily affected by the macro economy. Consequently, the revenue of this industry has shown close
correlation with the overall economic performance (Krabeepetcharat, 2012). Figure 16 to 18
demonstrate worldwide annual revenue of 3D printer manufacturing and units of sale. During the
economic recession between 2008 and 2009, both revenue and unit sales declined as downstream
markets suffered. In 2010, industry revenue bounced back together with the market recovery and
the industry kept growing during recent years. In 2012, the global market increased to $2.204 billion
with a growth rate of 28.6% (CAGR), up from $1.714 billion in 2011 by 29.4% and 24.1% in 2010. New
features and lower prices have made 3D printer more popular. In 2012, number of sold industrial
systems increase by 19.3 to 7,771 units and that of personal systems was 35,508 units. IBISWorld
forecasts that in the five years to 2019 the industry revenue would grow to $3.0 billion with an
average annual rate of 15.7%.
Profitability of this industry has also risen due to economies of scale and a greater demand. Fixed
costs and R&D expenditures of existing manufacturing companies have spread out with a larger
volume of production. Meanwhile, open-source and patent expiration have cut down technological
investment. According to IBISWorld, profit, measured by earnings before interest and taxes, is
estimated to make up 17.5% of industry revenue in 2014 and would rise to 18.2% by 2019.
The growth of this industry is also proved in terms of industry participation and employment. With
new 3D printer companies joining in the business, the number of manufacturing establishments is
expected to reach 122 by 2014 and 146 by 2019. The boom of industry establishments result in
steady employment growth in this sector. Over the five years to 2014, the number of employees in
3D printer manufacturing is expected to increase to 6,933 at an annual rate of 6.6%. This trend is
likely to sustain till 2019, with a growth of 4.0% annually to 8,416 workers (Krabeepetcharat, 2012).
International trade has become prosperous. For the U.S, imports are estimated to increase by 4.6%
per year to $334.0 million over the five years to 2012, while exports increase by 2.6% annually to
$710.5 million (Krabeepetcharat, 2012). Japan, Korea, United Kingdom and Germany are the four
major export destinations of the U.S (see Figure 19). Trade surplus in this sector results from the fact
that top 3D printer manufactures that are technological leaders are based in the U.S. Many countries
have seen soaring markets for 3D printing technologies and they usually purchase American 3D
printers to fulfill their needs (Krabeepetcharat, 2012). Given the steady globalization of this industry,
big American 3D printer producers are targeting at oversea markets as a key business strategy.
Cost structure
Figure 20 presents the comparison of cost structure of 3D printer manufacturing and overall
industries. This industry obviously has a high profit margin, lower purchase costs and great
expenditures on wages.
Purchases of raw materials make up approximately 30% of total revenue, only half of the number of
general sectors (Krabeepetcharat, 2012). As discussed in the section of “Supply Chain”, many 3D
printer companies are selling build materials to customers. Although the industry is sensitive to the
fluctuation of raw material prices, especially resin prices, the manufacturers are mainly able to pass
17 / 61
off costs to their customers.
Labor cost is a dominant factor in the cost structure of this industry, making this industry labor
intensive. It accounts for 31.1% about three times the number of overall industries (Krabeepetcharat,
2012). The average wage in this industry has been growing in recent years. IBISWorld estimates that
it would rise from $54,324 in 2009 to $64,171 in 2014. The high wages is driven up by the industry’s
requirement for highly skilled engineers for R&D (Krabeepetcharat, 2012). On the other hand, capital
investment in plant and equipment is moderate (see Figure 21). Although the production process
requires advanced machinery, it is still heavily dependent on handcrafting (Krabeepetcharat, 2012).
Also, this industry needs to retain qualified employees for administration, sales and services
technicians. Nevertheless, IBISWorld predicts that as the growth of revenue is expected to outpace
that of wages, the share of labor costs is likely to decline in the future (Krabeepetcharat, 2012).
Unsurprisingly, R&D investment is an important component in firms’ expenditure. In order to stay
relevant in this fast-moving industry, companies need to frequently update their equipment and
technologies. They also need to generate technological or process innovation so as to maintain their
foothold in the market.
Competition among firms
Concentration in this industry is low. In 2012, the two major players, 3D Systems and Stratasys,
collectively account for 32.3% of the total industry revenue (according to companies’ financial report,
3D Systems has a revenue of $353.6 million with a market share of 16%; Stratasys has a revenue of
$359.0 million with a market share of 16.3%). A surge of small 3D printer companies have started to
join the competition and this trend is expected to continue (Krabeepetcharat, 2012). They gained
their shares by technological specialization and taking advantage of open-source programs. They aim
at providing cost-effective systems to serve the niche markets such as home use, medical device or
aerospace industries. Meanwhile, some traditional 2D printer companies are joining in this industry.
The most well-known example is Hewlett-Packard Development Company (HP). They are selling 3D
printers in a partnership with Stratasys. However, the industry concentration is likely to increase over
the coming years because big firms always attempt to merge and acquire some small start-up
companies (Krabeepetcharat, 2012).
Companies’ competitiveness is more based on features instead of simply on prices. Internal R&D
help firms upgrade the performance of 3D printers, extend applied uses and enhance the
differentiation of their products. Quality services such as reliable delivery time and customized
services can also enforce firms’ strengths. Some companies have secure demand from specific
high-end market such as medical devices or aerospace, and thus manage to obtain stable high profit
margins (Krabeepetcharat, 2012).
On a global scale, though American firms still own a dominant share in this industry, they are facing
the competitions from Asian countries, especially China and Japan (Krabeepetcharat, 2012). Chinese
companies import 3D printers at lower prices due to cheap labor, government incentives and lower
transportation costs, while Japan has cutting-edge technologies as a leader in printer production
throughout the history.
18 / 61
Support for R&D from the public sector
Colleges, universities and research institutions have long been supporting the development and
commercialization of AM technologies. In addition, federal agencies have greatly backed up the
development of 3D printer technologies in recent years. The National Center for Defense launched
the National Additive Manufacturing Innovation Institute (NAMII) in 2012, aimed at establishing a
national network among companies, research institutes, universities, community colleges and other
non-profit organizations for the benefit of 3D printing technology development. Other federal
agencies are encouraging specific application of AM technologies. For example, the National
Institutes of Health (NIH) support AM-based biomedical research, and the Office of Naval Research,
Army Research Laboratories and Air Force Research Laboratories fund basic and applied research
related to AM (Wohlers, 2011). Universities are still playing a leading role in developing basic and
applicable AM technologies. Meanwhile, they frequently provide space for conversations among
companies and scholars to exchange ideas (Lester, 2006). For example, universities often hold
conferences and forums for sharing technological information, business strategies and market
opportunities.
Success factors
Technology capacity: This industry requires significant investment in R&D. Companies have to
frequently upgrade their existing products and innovate new products. It could not only help retain
their positions in the industry, but also reduce costs related to purchasing patent and licenses. For
many companies, information network with universities and research organizations is a major asset.
Access to niche markets: Secured demand supports the long term development of a company.
Especially for 3D printer producers, they require reliable market outlet that could generate revenues
to sustain their investment and operation. Moreover, business network with clients from related
industries and groups could facilitate innovation. Feedback from customers and relevant industries
provide important information for them to adjust performances and applications of their products.
Access to highly skilled labor: As discussed, this industry is highly labor intensive. Skilled employees
in technology development, handcrafting, marketing, etc. are crucial to a company’s productivity. It is
the qualified workforce that would push forward technology and process innovation and thus
advance the technology capacity of a firm.
Transport infrastructure and access to land: As the price is still an important determinant of a
company’s market share, cost management is crucial. Well established transportation infrastructure
and appropriate land prices or rental could lower the costs of doing business.
Findings of industry analysis
The established and emerging clusters of 3D printer manufacturing are generally located near
research centers, the clusters of material suppliers and industries that apply 3D printing. This pattern
indicates that the growth of 3D printer manufacturing is driven by technological progress, application
and commercialization. Companies are trying to lower their operating expenditures to make their
products cost competitive. Highly skilled workforce is an indispensable component in every
19 / 61
company’s development strategy. In addition, good networks for knowledge sharing and business
interactions are also important.
Location considerations of industrial 3D printers manufacturing
Providers of industrial 3D printer are usually big companies. Large industrial companies are the main
consumers of their expensive and sophisticated systems. As they produce on a large scale,
transportation infrastructure, land prices, access to market, tax and financial incentives are
important considerations for them. The three factors are typical location factors for traditional
manufacturing industries while they are still making a difference in the businesses of large industrial
3D printer companies. Since they tend to expand and benefit from economies of scale, cost
minimization is an indispensable strategy for them.
These firms have excellent R&D departments and tend to acquire cutting-edge techniques through
acquisition of new companies. As a result, they may be less dependent on research agencies than
before or compared with small firms. Nevertheless, universities and research institutes are likely to
provide a platform for companies to exchange strategies and opportunities. To gain access to
intelligent workers is another winning strategy. Big firms are competing with each other in attracting
skilled employees.
In particular, training system and business network are two factors specific to this industry and often
have pushing effects on the development of these companies. They pay attention to training
programs, not only for their own employees but also for their clients. Their clients are likely to place
orders of high value and large volumes. Before purchases, clients might visit the firm for a better
understanding of the product. A good business network will enable these 3D printer producers
promote their products to potential customers and improve the functions of printers to better meet
the demands of customers, for example special build materials and precision. Meanwhile, large
enterprises are expanding their businesses to overseas markets and their major approaches to
communication with clients are internet and phone calls. Given this fact, they may include the factor
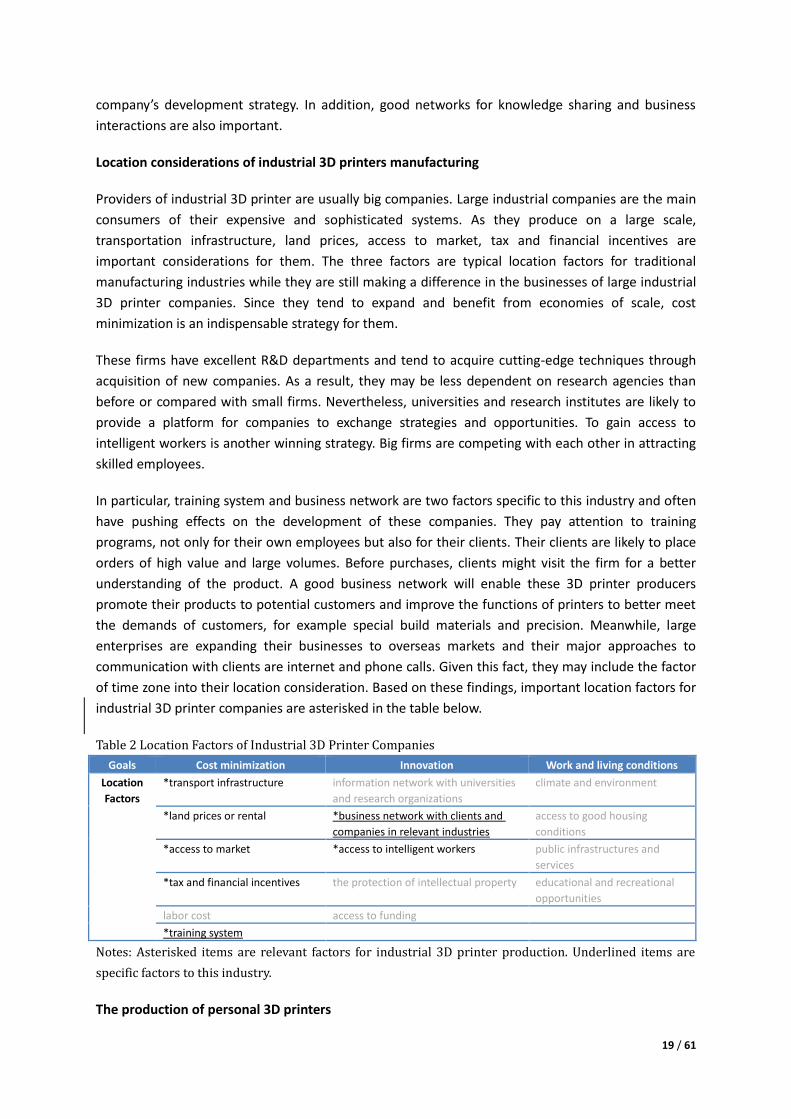
of time zone into their location consideration. Based on these findings, important location factors for
industrial 3D printer companies are asterisked in the table below.
Table 2 Location Factors of Industrial 3D Printer Companies
Goals Cost minimization Innovation Work and living conditions
Location
Factors
*transport infrastructure information network with universities
and research organizations
climate and environment
*land prices or rental *business network with clients and
companies in relevant industries
access to good housing
conditions
*access to market *access to intelligent workers public infrastructures and
services
*tax and financial incentives the protection of intellectual property educational and recreational
opportunities
labor cost access to funding
*training system
Notes: Asterisked items are relevant factors for industrial 3D printer production. Underlined items are
specific factors to this industry.
The production of personal 3D printers
20 / 61
Personal 3D printers are mainly provided by small firms originated from open-source projects. With
the development of open-source communities and the expiration of early patents, the technological
barriers will be greatly reduced and their distribution is expected to be further dispersed. Although
some big industrial 3D printer companies started to acquire them in recent years to augment their
own markets, small firms are still the dominant players with their distinguished brands in producing
personal systems. Unlike industrial 3D printer companies, personal system producers gain revenue
through numerous sales of smaller volume. As personal 3D printers are less expensive and easy to
use, buyers usually will not visit the company before their purchase. Proximity to other personal 3D
printer producers is not an obvious location consideration. Instead, company would want to locate
the business near clients so as to reduce freight costs and improve customer services. They sell
products to hobbyists, artists, engineers and educational institutions. The major advantages of their
products are low cost and specialization to niche market.
Location factors for the production of personal 3D printers are similar as those for industrial ones.
While traditional manufacturing location factors still matter in their development, other factors for
high-tech firms such as access to well-educated labor and funding, information and business network
should be addressed. In order to effectively manage costs related to R&D, start-up firms usually
capitalize on their network with universities and research organization in order to obtain information
channels and intelligent alumni who are potential partners, employees and clients.
Access to market, business network and intelligent workers are factors specific for small 3D printer
firms. Startups are usually providing complementary or distinguishing products to cater for the
underemphasized market. Therefore, the business network and access to market help them maintain
competitiveness in producing innovative products. Although low cost contributes to the
competitiveness of these small firms, labor cost is not a concern. Instead, they value skills the most
as big firms do. Many small firms start with several employees that can do almost everything, from
computer programming to marketing. Although their businesses grow, they still remain on a
relatively small scale, and they keep looking for workers from the best. They also care about
workforce training because they will benefit from a pool of skilled labor. In addition, good public
infrastructures and services not only attract excellent workers to a city, but also lay a foundation for
service businesses related to 3D printing. Individual small firms may not have the bargaining power
as strong as large firms when negotiating with the City on incentive policies. Cities with pro-business
regulations and access to venture capital are more likely to incubate these high-tech start-ups.
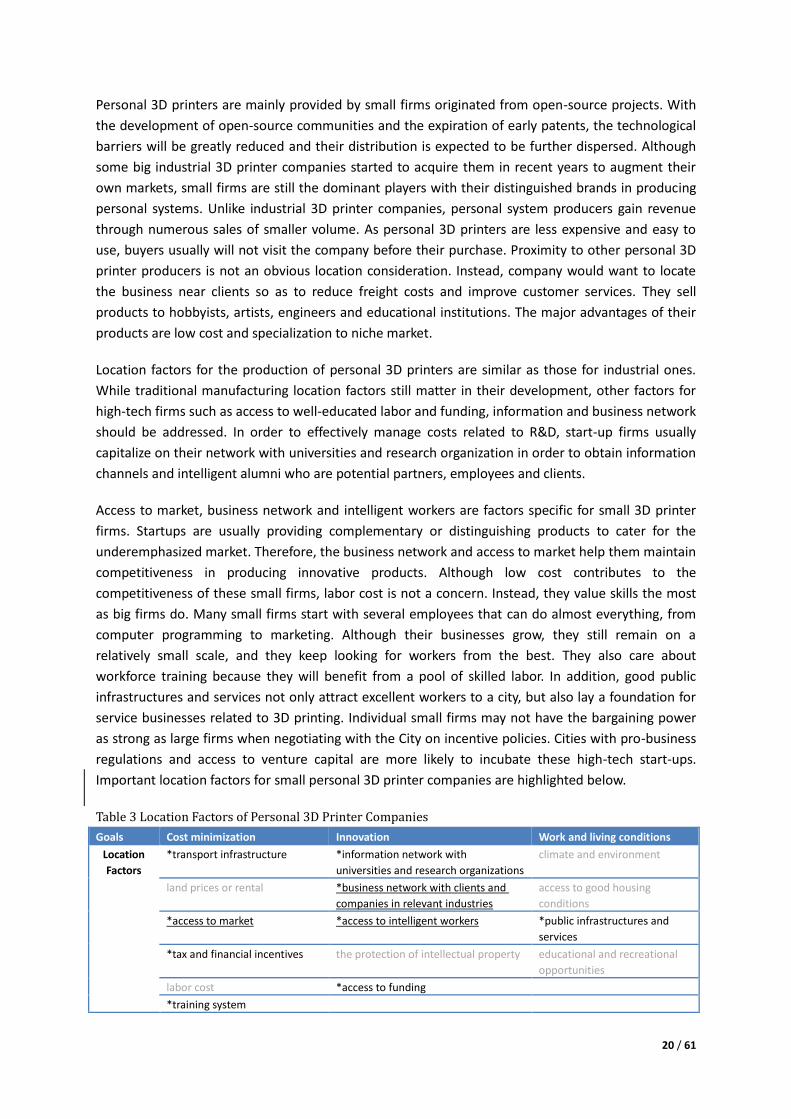
Important location factors for small personal 3D printer companies are highlighted below.
Table 3 Location Factors of Personal 3D Printer Companies
Goals Cost minimization Innovation Work and living conditions
Location
Factors
*transport infrastructure *information network with
universities and research organizations
climate and environment
land prices or rental *business network with clients and
companies in relevant industries
access to good housing
conditions
*access to market *access to intelligent workers *public infrastructures and
services
*tax and financial incentives the protection of intellectual property educational and recreational
opportunities
labor cost *access to funding
*training system
21 / 61
Notes: Asterisked items are relevant factors for industrial 3D printer production. Underlined items are
specific factors to this industry.
Case Study 1: 3D Systems Relocated to Rock Hill, South Carolina
Development of 3D Systems Corp.
In 1986, Charles Hull obtained the patent of stereolithography (SLA) apparatus and co-founded 3D
Systems with Raymond Freed in Valencia, California. Within two years, it became the first firm that
had formal sales of 3D printing systems. It went public (DDD) on the NASDAQ in 1990 (3DSystems,
2011). In the 1990s, some non-SL and low-cost systems were introduced to the market by other
competitors for example Stratasys, DTM and Z Corp. Responding to the early competitions, 3D
Systems developed less expensive versions of its SLA systems and innovated SLS applications.
Meanwhile, it started mergers and acquisitions over years. The acquired companies included both its
competitor 3D printer producers and build material providers. By this means, 3D Systems acquired a
variety of technologies and strengthened tis market stance. To integrate the new components into its
original entity was not easy. 3D Systems experienced losses for years in the early 2000s but it kept on
innovating and publishing new products (Grenda, 2013).
In November 2005, the firm announced the plan to relocate headquarter, R&D center and part of
production to Rock Hill, South Carolina. The new office site was opened one year later. After the
relocation, while 3D Systems still focused on application-specific industry systems, it started to
develop technologies for producing low-cost 3D printers (Grenda, 2013). However, this low-end
market was dominated by start-up companies based on open-source programs. Actually, after the
profitable 2005, the firm had losses for the following three years. This turbulence resulted from the
increased competition, cost of office relocation, decrease in service-product mix, increasing R&D
expenses, costs and difficulties in the acquisition and operational integration (Grenda, 2013). During
economic recession, though its sale declined, the firm gained profits in both 2009 and 2010 which
was regarded as a favorable recovery for itself. Since 2009, 3D Systems kept on targeting at the
market of personal 3D printers by buying successful start-ups (e.g. Bits From Bytes, UK) so as to get
access to a wide variety of consumers. In addition, it expanded businesses in services and software
also through acquisition. On the one hand, these acquisitions boosted the revenue. More
importantly, these businesses built up a platform enabling 3D Systems to promote its latest
technologies to customers and thus augment the demand for its machine (Grenda, 2013). In 2011, it
made a vital acquisition of Z Corp, the third largest 3D printer companies in the U.S. at that time. Z
Corp’s product line was complementary to that of 3D Systems. By enhancing the production and
technologies, 3D Systems managed to enlarge its domestic market and won over oversea business
opportunities. It has developed global establishments (see Figure 24) to serve customers in Europe
and Asia-Pacific. Up till now, the American market has been dominated by two large firms, 3D
Systems and Stratasys. Figure 22 shows 3D Systems’ historical stock prices. After 2009, the firm has
demonstrated continuously increasing stock price. It also has a robust total revenue growth and
rising sales of printer products and services (see Figure 23). The firm’s fast value increase is not
simply a result of mergers and acquisitions but due to a steady organic growth at an annual rate of
20% to 30% since 2010 (“3D Systems Annual Reports” 2004-2009).
22 / 61
The businesses of 3D Systems include the sale of 3D printers, build materials, training, solution and
maintenance services. The majority of 3D printer sales are high-end industrial systems that would
bring revenues in large volumes. Revenues from foreign market account for approximately half of the
consolidated revenue between 2010 and 201219. Investors and prospective customers are invited to
the company to get an understanding of their various products and innovative technologies.
Meanwhile, the firm frequently holds tradeshows to promote new products and applications.
Basically, the relocation of company site is supposed to accommodate not only administration and
R&D but also the increasing interaction with global customers.
By analyzing the development trajectory of 3D Systems, I found that its major strategy after 2005
was to expand businesses including industrial and personal 3D printer production as well as related
services. As its production and operation got matured and solidified, its target market was not
limited to domestic demands but also global customers. The goal of its relocation was to achieve
business growth and expansion. Rock Hill, South Carolina supported its expansion with larger sites
with well-established infrastructure, favorable policies, training facilities and easy access to European
customers.
Original location and candidate states for 3D Systems’ relocation
The original headquarter was located at Valencia Community, the City of Santa Clarita, California
(location map: Figure 25). Although Santa Clarita was ranked as low cost compared with many cities
in Los Angeles County in 2005, its cost of living and doing business was still higher than the national
level, especially in housing20. Businesses in Santa Clarita were mainly of small scales and almost half
of them were in the service sector (see Figure 26). 59% of the companies had less than 5 employees,
while only 5% employed more than 50 workers (see Figure 27). Space occupied by each enterprise
was relatively small, as more than 80% of them were located at a site smaller than 10,000 square
feet (see Figure 28). It was very uncommon to see business on a site larger than 40,000 square feet.
The limitations of pricing and appropriate land for industrial uses made it difficult for 3D Systems to
expand the scale of business and production. The firm was looking for a place that could provide
proximity to suppliers, customers and partnership at an appropriate level of operating costs. The
relocation should also enhance its technological capacity and labor productivity.
During my interview, 3D Systems identified four states when considering the region for its relocation,
namely Tennessee, Virginia, North Carolina and South Carolina. The firm chose candidates located in
the east of America due to the concern of time zone. Since they were planning to expand to overseas
market especially in Europe, it required a suitable place to match with working hours of its global
clients.
According to Milken Institute “Cost-of-Doing Business Index” (2007)21, South Carolina was ranked as
the lowest-cost among the candidate states and its costs of doing business was 17% lower than the
national average. In particular, it was favorable to manufacturing firms regarding wage cost,
19
3D Systems Annual Report 2012. http://www.3dsystems.com/files/downloads/DDD-2012-Form-10-K.pdf 20
South California Commercial, 2007 “City of Santa Clarita Annual Economic Indicators and Demographics”. Kosmont-Rose
Institute, 2005 Cost of Doing Business. Sperlings, Cost of Living Comparison. 21
The Cost-of-Doing-Business Index indicates each state’s comparative advantages or disadvantages in attracting and
retaining businesses.
23 / 61
electricity cost and industrial rent cost (see Table 5). Tax structure of South Carolina is stable with no
tax on real or personal property, inventories or intangibles. Property taxes can be negotiated from a
10.5% down to a 6% assessment or a 43% reduction.22. In addition, South Carolina has a much
less-unionized workforce (see Table 6) but a top 10 rated workforce-training system in the U.S (Scott,
2012).
South Carolina was highly specialized in the industries of plastic materials and resins production
(supply industry) and communications equipment (demand industry). It was also competitive in
other industries that may adopt 3D printing techniques compared with the other three candidates.
However, South Carolina did not show an advantage in education and knowledge creation. As
discussed in the firm’s development history, 3D Systems had solid technological and financial
capabilities than other small 3D printer producers so that it was often able to generate innovation
through its own R&D department and acquisition. As a result, their location decision was less
constrained to the availability of top class research centers. In order to further analyze the reasons
why Rock Hill, SC was suitable for 3D Systems relocation, we will take a detailed look at the functions
of its new campus and the business environment in the City of Rock Hill. This information will reveal
how Rock Hill supported its development requirements.
Rock Hill, the destination of relocation
The new business site
Its new campus is located at the Waterford Business Park in the City of Rock Hill. Rock Hill is the largest
city in York County, South Carolina and the fifth-largest city in the state. It belongs to the Charlotte
metropolitan area as the fourth-largest city behind Charlotte, Concord, and Gastonia (all located in
North Carolina). It is approximately 25 miles south of Charlotte and approximately 70 miles north of
Columbia (see location map: Figure 29).
The 80,000-square-foot campus includes a global headquarter, R&D center, state-of-the-art Rapid
Manufacturing Center and large open work spaces23. It is a build-to-suit site leased to 3D Systems. It
serves as a venue for product exhibitions and business conferences. The large site makes the firm open to
a large number of domestic and foreign clients and partners and facilitates its business network.
A 17,000-square-foot training center named “3D Systems University” is located adjacent to the campus
and is operated through partnership between 3D Systems and York Technical College (YTC). It allows the
firm to provide training to its existing and potential customers, and more importantly the workforce. The
University offers an accredited two-year Rapid Prototyping and Manufacturing associate degree to the
trainees who would become competitive skilled labor in the AM industry.
Infrastructures in Waterford Business Park
The 250-acre Waterford Park located along I-77 interstate corridor is one of the business parks in York
County (see location Figure 30). It is 28 miles (30-minute drive) from Charlotte Douglas International
Airport and 8 miles (15-minute drive) from Bryant Field Municipal Airport (see Figure 31). Bryant Field, as
22
York County Economic Development Corporation, South Carolina, 2014. “Taxes” http://ycedb.com/business/taxes 23
3DSystems, 2006, "3D Systems Corporate Headquarters at Waterford Business Park Rock Hill, SC"
24 / 61
the local business and industrial airport, provides passenger and air freight service on demand. Two major
railroads run through this area supporting rail freight of both large and small 3D printers. The Port of
Charleston is within a 3-hour drive distance from the park.
In addition to the good transportation connectivity, Waterford provides amenities for business operations.
The park has well established fiber optic communication lines and utilities supplies, as well as pleasant
landscapes. Hotels, restaurants, shopping, entertainment and medical facilities are available and
residential blocks are near the business park24. More than 120 businesses are landed in Rock Hill and
most of them are high-tech companies specializing in machinery production and medical services25.
Financial incentives
York County Council offered 3D Systems a fee-in-lieu-of tax agreement that capped its tax rate at 6
percent, reducing its property tax bill by 43% for 30 years (Worthington, 2013). The firm is also
qualified for Job Tax Credit, which enables it to rebate employees' state income tax on the base
credit of $1,500 per job. This agreement requires 3D Systems to invest at least $10 million by the end
of 200626. Some other financial incentives include Property Tax Abatements for companies that
invest more than $50,000 and create at least 75 jobs, and Sales Tax Abatements that exempt taxes on
purchase of machinery, raw materials, electricity and other aspects of operations in the
manufacturing process27.
Tax reduction is usually a rule of thumb for cities to land desired businesses. Although it is not
specific to 3D printer production, it is a straightforward and effective incentive for the company to
establish business in this city. Lower costs of doing business make Rock Hill a competitive and
attractive candidate among other places, especially when a main goal of 3D Systems’ relocation is to
expand at lower costs. Nevertheless, low cost alone cannot be enough to establish and retain a
high-tech industry. Other factors are required to support its specific business development.
Training facilities
Training facilities and services are the city’s advantages especially for landing 3D printer production
businesses. According to an article on this relocation published by Swamp Fox Community, “Rock Hill was
a dark horse in the race to land the 3D Systems headquarters. It was not initially considered.” York
Technical College (YTC) Institute for Manufacturing Productivity is the key contributor that managed to
draw 3D Systems’ attention (Warner, 2006). YTC is a partnership between the college and small
businesses in labor training and manufacturing process improvement. YTC emphasizes “pre-employment
training for new and expanding industry in York County and a comprehensive Continuing Education
program where citizens can continually upgrade their skills”28. It trains hundreds of workers across
24
Rock Hill Economic Development Corporation, 2014, “Waterford Business Park”
http://www.rockhillusa.com/properties/parks/1376/waterford-business-park 25
York County Economic Development Corporation, South Carolina, 2014, “York County Industrial Directory” 26
L.A. BIZ, 2005, “3D Systems moving HQ to South Carolina” 27
York County Economic Development Corporation, South Carolina, 2014. “Incentives”
http://ycedb.com/business/businessIncentives 28
York County Economic Development Corporation, South Carolina, 2014, “South Carolina’s Workforce Training Program”
http://ycedb.com/workforceTraining
25 / 61
nationwide every year. In 2004, it was awarded as the Community Economic Development Best Practice29.
This partnership is very attractive to 3D printer manufacturers because they need training programs not
only to enlarge the pool of labor with perfectly matched skills but also to teach customers to operate their
purchased machine. In addition, by initiating this training program, 3D Systems is promoting its own
technologies to the future technicians who will operate 3D printers or other AM systems. As these
workers have gained know-how on 3D Systems machine, there would be a higher probability that their
employers might purchase 3D Systems’ products for better skill matching. Therefore, by providing training
programs with YTC, the firm could not only gains short-term benefit of lower training costs, highly skilled
labor, better customer services, but also enhance its long-term advantage in market competition.
Benefits of 3D Systems’ relocation
From the company’s perspective, it has achieved the goal of growth and expansion at a sustainable
cost level. The new site improves the network between 3D Systems and its suppliers, partners and
customers, especially the overseas demands. More importantly, by cooperating with YTC, it managed
to implement training programs for potential workers, resellers and customers and possibly captured
the future market through technicians’ know-how.
The City and community have also benefited from 3D Systems’ establishment. By 2013, the firm has
created 162 jobs in Rock Hill30, while it totally has more than 1000 employees at 25 worldwide
locations31. South Carolinian can get cutting-edge training and become competitive workers in AM
industries. It would also enhance South Carolina’s interaction with global automotive, aerospace and
high-tech companies who are 3D Systems clients. The firms’ relocation from California will solidify
South Carolina’s foundation for high-quality and high-paying jobs. It might make high-tech
manufacturing firms start to consider it as a potential site for business expansion.
As a proof of the successful cooperation with YTC, the City of Rock Hill and York County Economic
Development Corporation, 3D Systems announced an expansion of its facility in 2013. It will invest
$10 million and generate 145 new jobs32.
This case study demonstrates that large 3D printer manufactures are likely to choose a site that
allows its expansion. Since these companies mainly gain revenue through high end professional
systems in large volume, the business site should facilitate their production and marketing on a large
scale. While many cities could establish satisfactory network among domestic and global businesses
and customers, some of them have the core competitiveness of improving workforce skills through
niche training programs. This could make a difference in attracting 3D printer producers and other
advanced manufacturing companies.
Case Study 2: MakerBot keeps growing in Brooklyn, New York City
Development of MakerBot Industries
29
York County Economic Development Corporation, South Carolina, 2014, “South Carolina’s Workforce Training Program” 30
York County Economic Development Corporation, South Carolina, 2014, “York County Industrial Directory” 31
Prezi, 2013, “3D Systems - business expansion” http://prezi.com/oylktgv80mrh/3d-systems-business-expansion/ 32
MidlanBis, 2013, “3D Systems Corporation Expanding Operations In York County”
http://midlandsbiz.com/articles/15302/
26 / 61
MakerBot Industries was founded at Brooklyn, New York City in January 2009 by Bre Pettis, Adam Mayer
and Zach Smith. It is one of the earliest desktop 3D printer producers. Their earliest 3D printers were
developed based on RepRap projects at “NYC Resistor”. NYC Resistor is a hacker collective located in
Brooklyn co-founded by Pettis, Smith and other “hackers” in 2007. It is a place where members “meet
regularly to share knowledge, hack on projects together, and build community”33. Smith was also one of
the founding members of the RepRap Foundation for early research in open-source 3D printers. He
started an online community named “Thingiverse” for sharing user-created digital design files and open
source hardware. This website was an important asset of MakerBot. As the source files of devices
production were uploaded to Thingiverse, consumers provided suggestions for improvements through the
online-community34. This website kept providing technological support to engineers for 3D printer
innovation, until 2012 when the firm stopped sharing the design of its new product. While the CEO Pettis
stated they had to start patenting their technologies for long term sustainable growth, Smith who had
quitted the firm criticized this departure (Smith, 2012; Torrone, 2013).
The firm’s 3D printers are sold as DIY kits, only requiring very basic skills of soldering. Their customers
include crafters, DIY hobbyists, and design professionals, schools, etc. Their first generation of products is
Cupcake CNC. When they launched the first 20 Cupcakes to market in March 2009, they quickly sold out
within two weeks35. Their later products such as Thing-O-Matic, Replicator, Replicator 2, Replicator 2X,
Digitizer Desktop 3D Scanner, etc are also popular among hobbyists. They got improvements in build
envelope, platform, precision, speed and also prices.
MakerBot has been increasing revenue through a large number of sales at affordable prices. The prices of
their 3D printers vary from $1,375 to $6,499 depending on their functions and performances, and 3D
scanner costs only $79936. By June 2013, the company has sold more than 22,000 3D printers since 2009.
Its market share was estimated to be more than 20% in personal 3D printer sales in 2011 and even got
expanded in 2012. During 2012 MakerBot’s sales revenue was $15.7 million, while during the first quarter
of 2013 it was as high as $11.5 million.37
The seed funding for MakerBot was $75,000, provided by Jake Lodwick (a friend of the founders), Adrian
Bowyer (the creator of the RepRap project) and his wife (Pettis, 2011). In 2011, Foundry Group and other
venture investors provided $10 million to MakerBot, which demonstrated investors’ strong confidence in
MakerBot. In June 2013, it was acquired by Stratasys, the largest industrial 3D printer manufacturer in the
world, in a stock deal worth $403 million. It was regarded as an important step of Stratasys’ strategy to
enter the consumer and small business space (Sharma, 2013). After the acquisition, MakerBot still
maintain its distinct brand and operate as a subsidiary of Stratasys.
As the production and sales kept growing, MakerBot achieved physical expansion with a dedication to
Brooklyn (see Figure 32). When they produced at NYC Resistor, they used a corner of their friend’s office
as warehouse. In 2009, the founders moved to their first formal office site, Botcave, at Boerum Hill.
33
NYCResistor, 2013 “About » NYC Resistor” http://www.nycresistor.com/about/ 34
Thingiverse, 2009, "CupCake CNC" http://www.thingiverse.com/thing:457 35
MakerBot TV S02E01 - “History of MakerBot”, 2012
http://blip.tv/makerbot/makerbot-tv-s02e01-history-of-makerbot-6002805 36
MakerBot Products, 2013 http://store.makerbot.com/ 37
3der, 2013, “Stratasys, Makerbot CEOs explain the $604 Milion deal”
http://www.3ders.org/articles/20130621-ceos-explain-the-$604-milion-stratasys-and-makerbot-deal.html
27 / 61
Starting from 5,000 square feet, the firm gradually leased more offices in this neighborhood and hired 85
employees by 201138. In May 2012, as the number of employees quickly grew to 125, the firm expanded
to a 31,250-square-foot office at One Metro Tech Center, which was a business and academic complex in
downtown Brooklyn. While the majority of staff moved to the new office, a small number maintained
operation at Botcave (Bilton, 2012). Again, one year later, another move was motivated by personnel
growth. In June 2013, they opened a new 55,000-square-foot factory in Sunset Park. By that time, the
number of staff more than doubled to 267. In addition to the expansion of production, the firm has
established more stores to directly promote 3D printers to customers. The three stores (by 2013) are
located in Manhattan, Greenwich and Boston.
MakerBot regards itself as “made with Brooklyn Pride” throughout its development (Millstein, 2013).
“Staying in Brooklyn and manufacturing in the U.S” is an important value to them (Howard, 2013).
During my interview with Jenifer Howard, Director of PR, she told me that one of the main reasons of
expanding their manufacturing within Brooklyn is the proximity to their R&D, engineering and
software teams. She said, “We looked at several different sites, but determined that manufacturing is
more adaptive, innovative and iterative when in close proximity to those that are developing the
products.” Therefore, they have been committed to Brooklyn where talented workers and venture
capital and marketing opportunities are easily available.
Brooklyn, New York City as an incubator of personal 3D printer manufacturing
The City has proposed or designated around 20 Industrial Business Zones (IBZs) and many of them
are located in Brooklyn (Figure 33). Manufacturing companies can enjoy benefits from clustering by
sharing freight infrastructure, intermediate goods, access to customers and a big labor pool.
Transportation infrastructure
New York City is a metropolis noted for its sophisticated transportation infrastructure. As shown in
Figure 34, airports, ports, truck routes and railways are well established for freight and commuting.
Companies in Brooklyn can transport goods to JFK airport and LaGuardia airport in 30 minutes
through several major highways. Red Hook Port Terminal is another asset of Brooklyn where over
300 ships dock every year39. There are 3,000 wholesale operations providing warehouse facilities and
a variety of manufacturing sites from one-story buildings to multi-story lofts40.
Knowledge network and well-educated labor
New York State is outstanding in education and knowledge creation and its specialization in
sub-clusters of research organizations, educational facilities and institutions is ranked top three in the
U.S(Porter & Richard Bryden, 2014). The City of New York has developed technology industries by
leveraging its rich educational resource, which includes a large number of public colleges in the City
and State system and world famous private universities. Universities with strengths in research, for
38
MakerBot TV S02E01 - “History of MakerBot”, 2012,
http://blip.tv/makerbot/makerbot-tv-s02e01-history-of-makerbot-6002805 39
Brooklyn Chamber of Commerce, 2014, “Industrial/Manufacturing Districts”
http://www.ibrooklyn.com/go_brooklyn/Industrial_Manufacturing_Districts.aspx 40
Brooklyn Chamber of Commerce, 2014, “Industrial/Manufacturing Districts”
28 / 61
example Columbia University, Cornell University and New York University, contribute to technological
innovation. New York City Economic Development Corporation (NYCEDC) reports that R&D
expenditures at New York City’s academic institutions have been boosted by 45.0% between 2003
and 2012 and the share of national R&D spending increased from 3.3% in 2004 to 4.0% in 201241.
The research and innovation generated from universities and research institutes are transferred to
the industry through well-educated individuals which is a driving force for developing 3D printing in
New York City (Bryant, 2013). As Jenifer Howard articulated, access to talent people is the most
important factor in MakerBot’s location decision. Workers with excellent knowledge in R&D and
marketing were highly demanded. Technology professionals and students meet up in this city for
conferences and technology fairs that are held by private companies, universities or public institutes.
Opportunities generated from the knowledge network attract young IT experts and encourage the
establishment of NYC Resistor where new businesses get started. In addition, as all the MakerBot 3D
printers are hand-assembled (Larson, 2013), they also require highly skilled labor in the production
process. Some other schools, research collectives and membership facilities are also advocating 3D
printing technologies through courses and industrial projects. For example, New York City’s
ecosystems of resources launched the New Lab in the Brooklyn Navy Yard aimed at developing the
City’s expertise in 3D printing and enlarging the pool of skilled labor (Bryant, 2013).
Increasing demand for personal 3D printers
The expansion of this industry in New York City is supported by an increasing demand for desktop 3D
printers. New York is becoming a hub of 3D printer users. According to the report “3D Printing Trends
February 2014” produced by 3D Hubs, New York has the largest community of personal 3D printers
and ranks No.7 in the world (Figure 35). According to NYCEDC, more than 20 local private companies,
research facilities and collectives are using 3D printers directly in their supply chain or design process
(Bryant, 2013). As shown in Figure 36, these users are densely distributed in Manhattan and West
Brooklyn. By locating the business in Brooklyn, a 3D printer producer can maximize the proximity to
partners and customers.
One of the reasons for the increasing demand is due to a cluster of design industry which is a major
application of 3D printing technology. Although 3D printers are not widely installed in ordinary
households, they are popular tools among engineers and designers (Bryant, 2013). For architecture
and design companies, 3D printing is an efficient and economical way of prototyping and customizing
their products. In 2011, New York City ranked No.1 as home to 3,969 firms in applied design and
architecture; with 33% more firms than Los Angeles as the second (Giles & Maldonado, 2011). In
Brooklyn, especially, the number of design firms increased by 68% from 2001 to 2011 and that of
architecture firms doubled during this period (Giles & Maldonado, 2011). In addition to these firms,
design institutes are purchasing more 3D printing systems. As personal 3D printers of high quality
have become more affordable, all of the top design institutions in New York have labs with 3D
printing capability and most of them have become consumers of 3D printers (Bryant, 2013).
The growing group of 3D printing hobbyists in New York City is another reason of the increasing
demand. The fact is not simply a result from a high income level of New Yorkers. More importantly,
41
NYCEDC, 2013 “Innovation Index” http://www.nycedc.com/economic-data/innovation-index
29 / 61
many online 3D printing communities have been formed to make 3D printing easier for people
without an expertise in computer aided design. Website such as Shapeways and 3D NYC Lab provide
members with a long list of 3D designs for DIY or directly convert customers’ ideas into objects.
While 3D printer producers are making desktop systems more affordable, these online resources are
making 3D printing more practical to individual users.
Funding supports and incentive policies
Access to venture capital (VC) is another key to success for startups. In 2013, the New York metro
area had over 400 VC deals in technology industries and funding amounted to $2.4 billion. Start-ups
in New York metro area has an increasing share of national VC funding from 7.6% in 2003 to 8.8% in
201242. At the state level, New York had an estimated 93 technology deals worth $630 million in Q3
2013. Both numbers were higher than those of Massachusetts from Q2 2012 to Q3 201343. For New
York City, according to NYCEDC, approximately 58 businesses received $23.1 million
(inflation-adjusted, moving average) as grants of Small Business Innovation Research (SBIR) and Small
Business Technology Transfer (STTR) in 201244. 3D printing industry has also received considerable VC
funding. During the past four years, MakerBot and a 3D printing online marketplace and service
company named Shapeways have received more than $57 million VC funding. The abundant VC
sources have proved investors’ confidence in a promising prospect of New York’s 3D printing
industries.
New York City has implemented incentive policies for high-tech companies like 3D printer producers.
NYCEDC assist startups to find affordable incubators, wet lab spaces and shared workspaces45.
Qualified Emerging Technology Companies (QETCs) are granted three types of tax credits: “an
Employment Credit for job creation; a Facilities, Operations, and Training Credit for certain facilities,
operations, and employee training; and a Capital Tax Credit for investors in QETCs”46. In addition, the
City has launched a $22 million New York City Entrepreneurial Fund (NYCEF) to provide promising
NYC-based technology startups with early-stage capital. Qualified companies can receive up to
$750,000 for the first round of investment. The City started this fund by learning from Silicon Valley.
It encourages entrepreneurs to establish companies in New York and to enhance the technology
capacity of this city.
Influence on local employment
Currently, there are three major 3D printing companies in New York City, namely MakerBot,
Solidoodle and Shapeways. Solidoodle is another Brooklyn-based desktop 3D printer producer. It was
founded in 2011 and has gained approximately $5 million by selling over 6,000 printers (Field, 2013).
Shapeways is a Dutch company founded in 2007, providing online marketplace and services. In 2012,
it moved headquarter to Manhattan and opened a factory in the Long Island City in Queens, New
York (see Figure 37). By October 2013, the numbers of local jobs created by MakerBot, Solidoodle
42
NYCEDC, 2013, “Innovation Index” http://www.nycedc.com/economic-data/innovation-index 43
NYCEDC, January 2014, “Tech Trends & Insights - Analysis of the Tech Sector in New York, Q1-Q3 2013 Analysis” 44
NYCEDC, 2013, “Innovation Index” http://www.nycedc.com/economic-data/innovation-index 45
NYCEDC, 2014, “Incubators & Workspaces” https://www.nycedc.com/service/incubators-workspaces 46
NYCEDC, 2014, “Qualified Emerging Technology Company Incentives”
https://www.nycedc.com/program/qualified-emerging-technology-company-incentives
30 / 61
and Shapeways are 360, 50 and 100. Most of these jobs require at least a bachelor ’s degree or
equivalent advanced knowledge of computer programing languages (Field, 2013).
Although 3D printer manufacturing may not create a large number of jobs by itself, it is likely to
encourage employment in relevant industries such as design, customization services and online 3D
printing support services. As 3D printers keep improving and specializing, they would become more
available to niche markets. Designers and consumer product producers tend to further increase the
purchase. An increasing number of 3D printer users are expected to be served by more professionals
in 3D printing technologies and computer aided design programs. Services of customizing products
could also be stimulated, which will create a demand for workers in marketing and customer service.
The case of MakerBot suggests small personal 3D printer manufacturers tend to be located close to a
pool of highly skilled labor and good knowledge and business networks. The production has very
high labor intensity due to the requirement of R&D, hand-assembling and marketing. A good system
of educational and research institutions will benefit small firms by providing well-trained and
innovative workers and facilitating communication among scholars, businesses and customers.
Design firms in New York have created an important demand for small scale 3D printers. In addition
to the cluster of design industries, good access to venture capital and financial incentives have
effectively supported 3D printer manufacturing startups.
Policy Implications
The development of 3D printer manufacturing industry is based on cutting-edge technologies and
highly skilled labor. The establishment of this industry is likely to enhance local high-tech business
foundation and create high-quality jobs. As the industry is still at the early stage of life cycle and is
expected to keep growing the coming decades, public agencies may consider to land and support 3D
printer manufacturers so as to trigger economic growth and innovation. Policies that could support
development of this industry could be implemented at local and state/federal levels.
Policies at local levels
Improvement in labor skills should be placed at the top priority. 3D printer manufacturing is highly
labor intensive and almost all companies regard access to skilled labor as the most influencing factor
in their location decisions. In order to match the skills of local labor to the requirement of companies,
the government and other public organizations could adopt two approaches. First, they could build
up partnership between local training facilities (e.g. community college) and enterprises to provide
specialized workforce training. As demonstrated in the case of 3D Systems, this partnership is
attractive enough to make companies consider landing their business to the city. More importantly,
the training could upgrade the qualification of local labor. The other approach is to encourage local
schools to offer courses and workshops of 3D printing. For example, most universities and design
schools in New York City have integrated 3D printing technologies into their curricula. They are
cultivating talent workers for 3D printing R&D and printer production, as well as generating
consumers for 3D printers. Meanwhile, the schools themselves have supported the sales of 3D
printers.
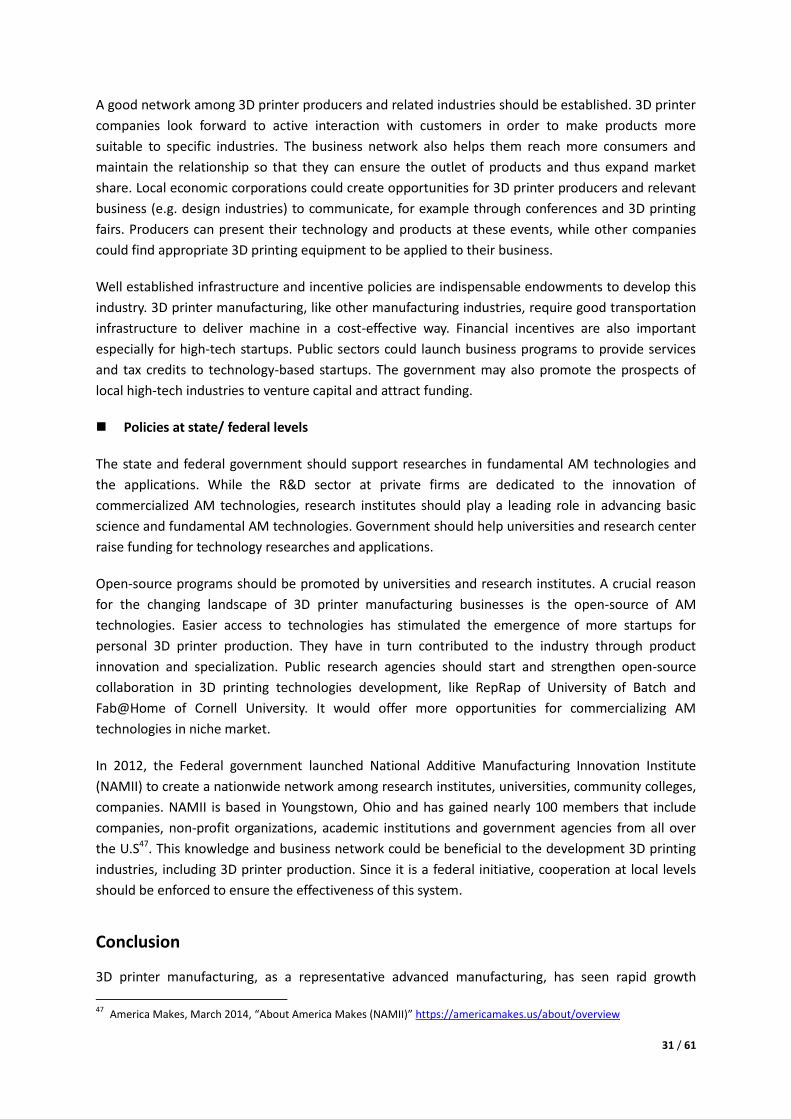
31 / 61
A good network among 3D printer producers and related industries should be established. 3D printer
companies look forward to active interaction with customers in order to make products more
suitable to specific industries. The business network also helps them reach more consumers and
maintain the relationship so that they can ensure the outlet of products and thus expand market
share. Local economic corporations could create opportunities for 3D printer producers and relevant
business (e.g. design industries) to communicate, for example through conferences and 3D printing
fairs. Producers can present their technology and products at these events, while other companies
could find appropriate 3D printing equipment to be applied to their business.
Well established infrastructure and incentive policies are indispensable endowments to develop this
industry. 3D printer manufacturing, like other manufacturing industries, require good transportation
infrastructure to deliver machine in a cost-effective way. Financial incentives are also important
especially for high-tech startups. Public sectors could launch business programs to provide services
and tax credits to technology-based startups. The government may also promote the prospects of
local high-tech industries to venture capital and attract funding.
Policies at state/ federal levels
The state and federal government should support researches in fundamental AM technologies and
the applications. While the R&D sector at private firms are dedicated to the innovation of
commercialized AM technologies, research institutes should play a leading role in advancing basic
science and fundamental AM technologies. Government should help universities and research center
raise funding for technology researches and applications.
Open-source programs should be promoted by universities and research institutes. A crucial reason
for the changing landscape of 3D printer manufacturing businesses is the open-source of AM
technologies. Easier access to technologies has stimulated the emergence of more startups for
personal 3D printer production. They have in turn contributed to the industry through product
innovation and specialization. Public research agencies should start and strengthen open-source
collaboration in 3D printing technologies development, like RepRap of University of Batch and
Fab@Home of Cornell University. It would offer more opportunities for commercializing AM
technologies in niche market.
In 2012, the Federal government launched National Additive Manufacturing Innovation Institute
(NAMII) to create a nationwide network among research institutes, universities, community colleges,
companies. NAMII is based in Youngstown, Ohio and has gained nearly 100 members that include
companies, non-profit organizations, academic institutions and government agencies from all over
the U.S47. This knowledge and business network could be beneficial to the development 3D printing
industries, including 3D printer production. Since it is a federal initiative, cooperation at local levels
should be enforced to ensure the effectiveness of this system.
Conclusion
3D printer manufacturing, as a representative advanced manufacturing, has seen rapid growth
47
America Makes, March 2014, “About America Makes (NAMII)” https://americamakes.us/about/overview
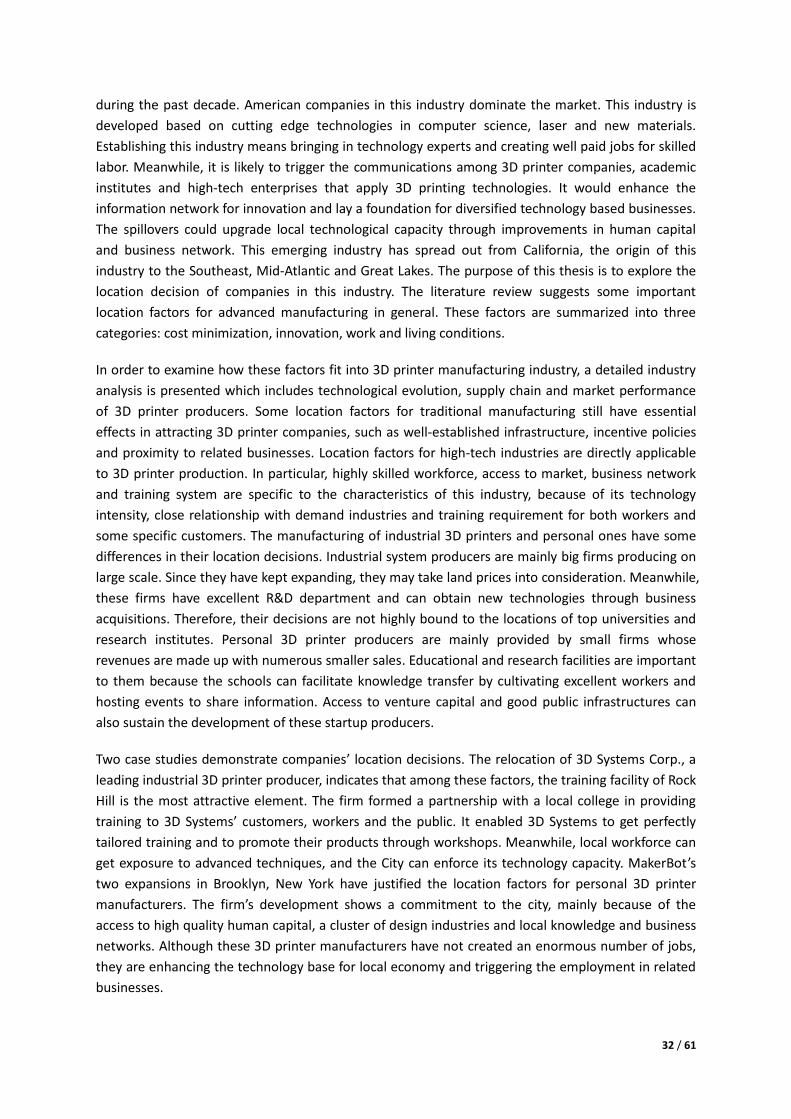
32 / 61
during the past decade. American companies in this industry dominate the market. This industry is
developed based on cutting edge technologies in computer science, laser and new materials.
Establishing this industry means bringing in technology experts and creating well paid jobs for skilled
labor. Meanwhile, it is likely to trigger the communications among 3D printer companies, academic
institutes and high-tech enterprises that apply 3D printing technologies. It would enhance the
information network for innovation and lay a foundation for diversified technology based businesses.
The spillovers could upgrade local technological capacity through improvements in human capital
and business network. This emerging industry has spread out from California, the origin of this
industry to the Southeast, Mid-Atlantic and Great Lakes. The purpose of this thesis is to explore the
location decision of companies in this industry. The literature review suggests some important
location factors for advanced manufacturing in general. These factors are summarized into three
categories: cost minimization, innovation, work and living conditions.
In order to examine how these factors fit into 3D printer manufacturing industry, a detailed industry
analysis is presented which includes technological evolution, supply chain and market performance
of 3D printer producers. Some location factors for traditional manufacturing still have essential
effects in attracting 3D printer companies, such as well-established infrastructure, incentive policies
and proximity to related businesses. Location factors for high-tech industries are directly applicable
to 3D printer production. In particular, highly skilled workforce, access to market, business network
and training system are specific to the characteristics of this industry, because of its technology
intensity, close relationship with demand industries and training requirement for both workers and
some specific customers. The manufacturing of industrial 3D printers and personal ones have some
differences in their location decisions. Industrial system producers are mainly big firms producing on
large scale. Since they have kept expanding, they may take land prices into consideration. Meanwhile,
these firms have excellent R&D department and can obtain new technologies through business
acquisitions. Therefore, their decisions are not highly bound to the locations of top universities and
research institutes. Personal 3D printer producers are mainly provided by small firms whose
revenues are made up with numerous smaller sales. Educational and research facilities are important
to them because the schools can facilitate knowledge transfer by cultivating excellent workers and
hosting events to share information. Access to venture capital and good public infrastructures can
also sustain the development of these startup producers.
Two case studies demonstrate companies’ location decisions. The relocation of 3D Systems Corp., a
leading industrial 3D printer producer, indicates that among these factors, the training facility of Rock
Hill is the most attractive element. The firm formed a partnership with a local college in providing
training to 3D Systems’ customers, workers and the public. It enabled 3D Systems to get perfectly
tailored training and to promote their products through workshops. Meanwhile, local workforce can
get exposure to advanced techniques, and the City can enforce its technology capacity. MakerBot’s
two expansions in Brooklyn, New York have justified the location factors for personal 3D printer
manufacturers. The firm’s development shows a commitment to the city, mainly because of the
access to high quality human capital, a cluster of design industries and local knowledge and business
networks. Although these 3D printer manufacturers have not created an enormous number of jobs,
they are enhancing the technology base for local economy and triggering the employment in related
businesses.
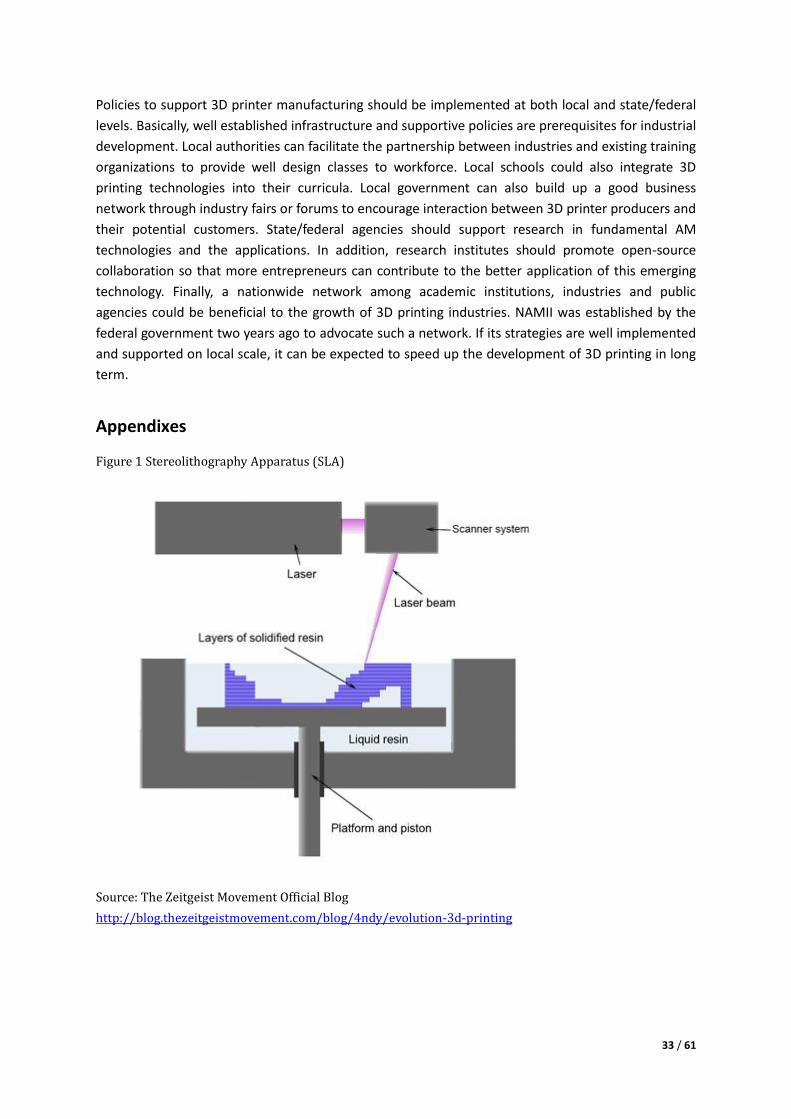
33 / 61
Policies to support 3D printer manufacturing should be implemented at both local and state/federal
levels. Basically, well established infrastructure and supportive policies are prerequisites for industrial
development. Local authorities can facilitate the partnership between industries and existing training
organizations to provide well design classes to workforce. Local schools could also integrate 3D
printing technologies into their curricula. Local government can also build up a good business
network through industry fairs or forums to encourage interaction between 3D printer producers and
their potential customers. State/federal agencies should support research in fundamental AM
technologies and the applications. In addition, research institutes should promote open-source
collaboration so that more entrepreneurs can contribute to the better application of this emerging
technology. Finally, a nationwide network among academic institutions, industries and public
agencies could be beneficial to the growth of 3D printing industries. NAMII was established by the
federal government two years ago to advocate such a network. If its strategies are well implemented
and supported on local scale, it can be expected to speed up the development of 3D printing in long
term.
Appendixes
Figure 1 Stereolithography Apparatus (SLA)
Source: The Zeitgeist Movement Official Blog
http://blog.thezeitgeistmovement.com/blog/4ndy/evolution-3d-printing
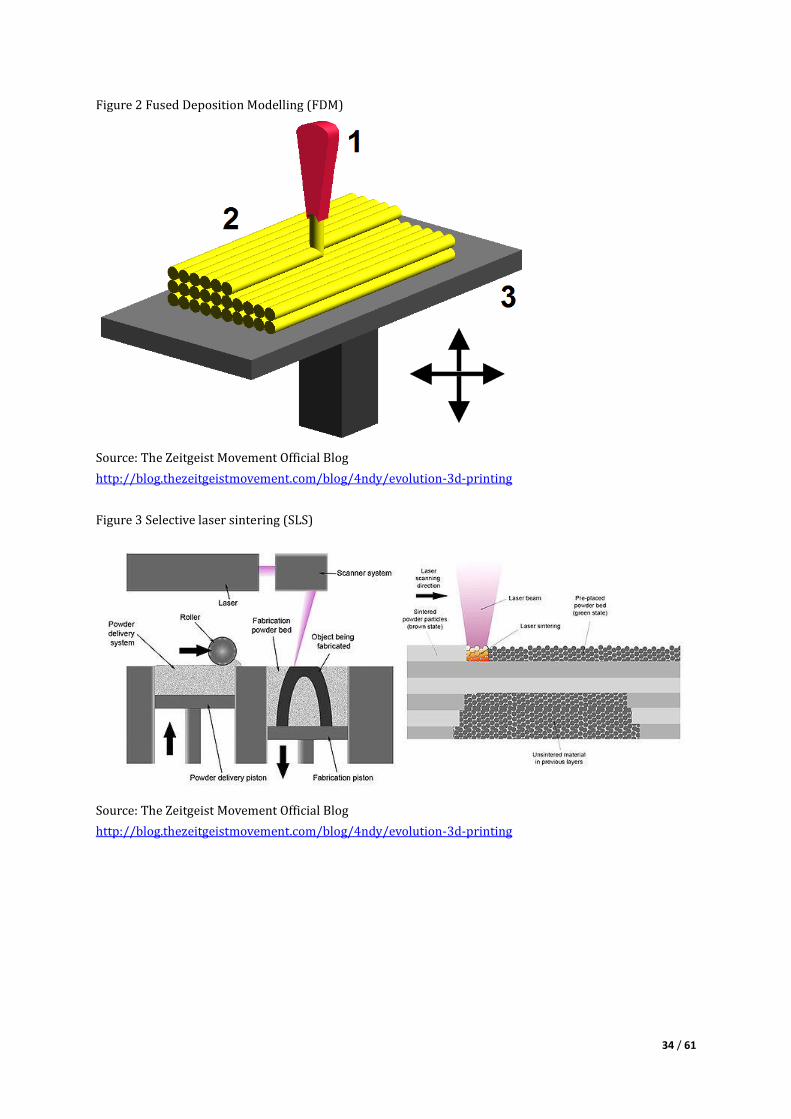
34 / 61
Figure 2 Fused Deposition Modelling (FDM)
Source: The Zeitgeist Movement Official Blog
http://blog.thezeitgeistmovement.com/blog/4ndy/evolution-3d-printing
Figure 3 Selective laser sintering (SLS)
Source: The Zeitgeist Movement Official Blog
http://blog.thezeitgeistmovement.com/blog/4ndy/evolution-3d-printing
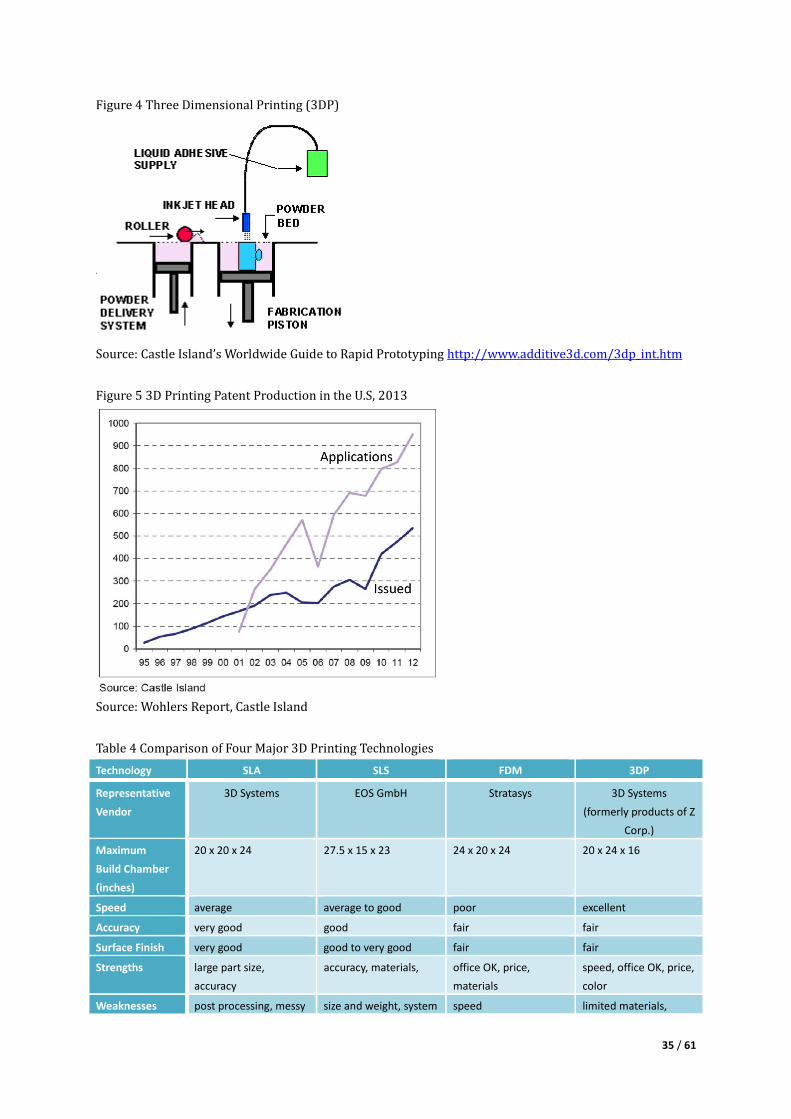
35 / 61
Figure 4 Three Dimensional Printing (3DP)
Source: Castle Island’s Worldwide Guide to Rapid Prototyping http://www.additive3d.com/3dp_int.htm
Figure 5 3D Printing Patent Production in the U.S, 2013
Source: Wohlers Report, Castle Island
Table 4 Comparison of Four Major 3D Printing Technologies
Technology SLA SLS FDM 3DP
Representative
Vendor
3D Systems EOS GmbH Stratasys 3D Systems
(formerly products of Z
Corp.)
Maximum
Build Chamber
(inches)
20 x 20 x 24 27.5 x 15 x 23 24 x 20 x 24 20 x 24 x 16
Speed average average to good poor excellent
Accuracy very good good fair fair
Surface Finish very good good to very good fair fair
Strengths large part size,
accuracy
accuracy, materials, office OK, price,
materials
speed, office OK, price,
color
Weaknesses post processing, messy size and weight, system speed limited materials,
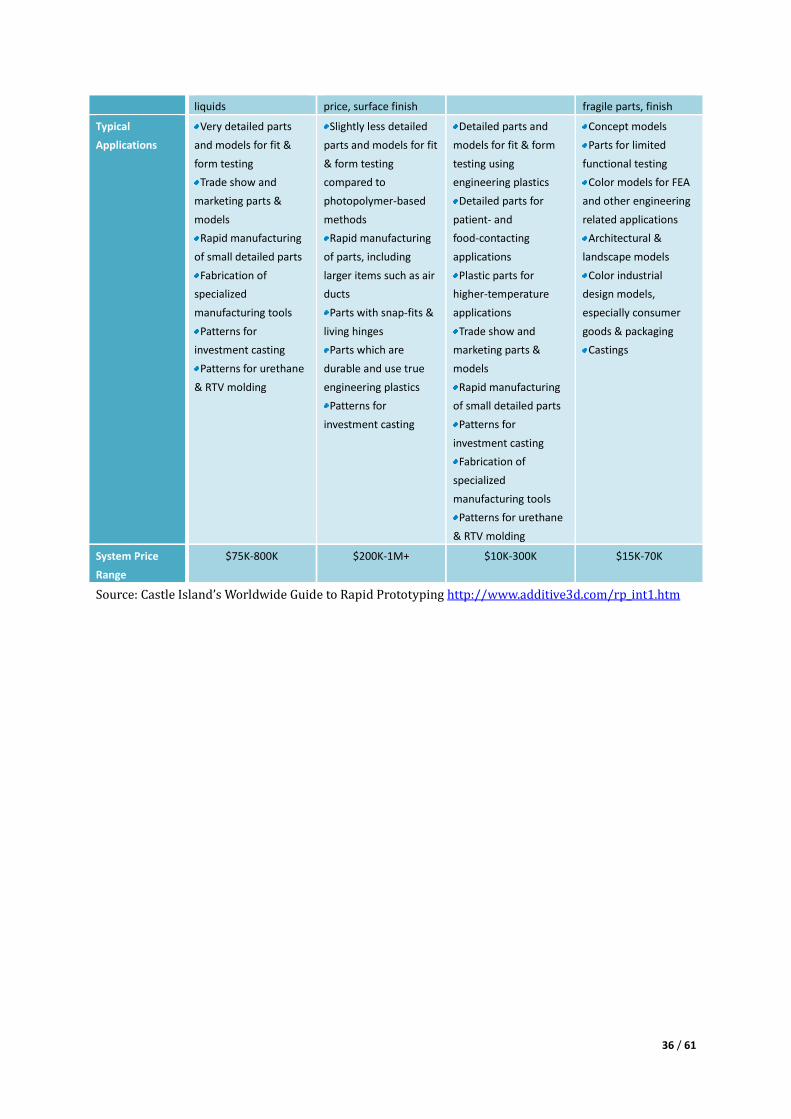
36 / 61
liquids price, surface finish fragile parts, finish
Typical
Applications
Very detailed parts
and models for fit &
form testing
Trade show and
marketing parts &
models
Rapid manufacturing
of small detailed parts
Fabrication of
specialized
manufacturing tools
Patterns for
investment casting
Patterns for urethane
& RTV molding
Slightly less detailed
parts and models for fit
& form testing
compared to
photopolymer-based
methods
Rapid manufacturing
of parts, including
larger items such as air
ducts
Parts with snap-fits &
living hinges
Parts which are
durable and use true
engineering plastics
Patterns for
investment casting
Detailed parts and
models for fit & form
testing using
engineering plastics
Detailed parts for
patient- and
food-contacting
applications
Plastic parts for
higher-temperature
applications
Trade show and
marketing parts &
models
Rapid manufacturing
of small detailed parts
Patterns for
investment casting
Fabrication of
specialized
manufacturing tools
Patterns for urethane
& RTV molding
Concept models
Parts for limited
functional testing
Color models for FEA
and other engineering
related applications
Architectural &
landscape models
Color industrial
design models,
especially consumer
goods & packaging
Castings
System Price
Range
$75K-800K $200K-1M+ $10K-300K $15K-70K
Source: Castle Island’s Worldwide Guide to Rapid Prototyping http://www.additive3d.com/rp_int1.htm
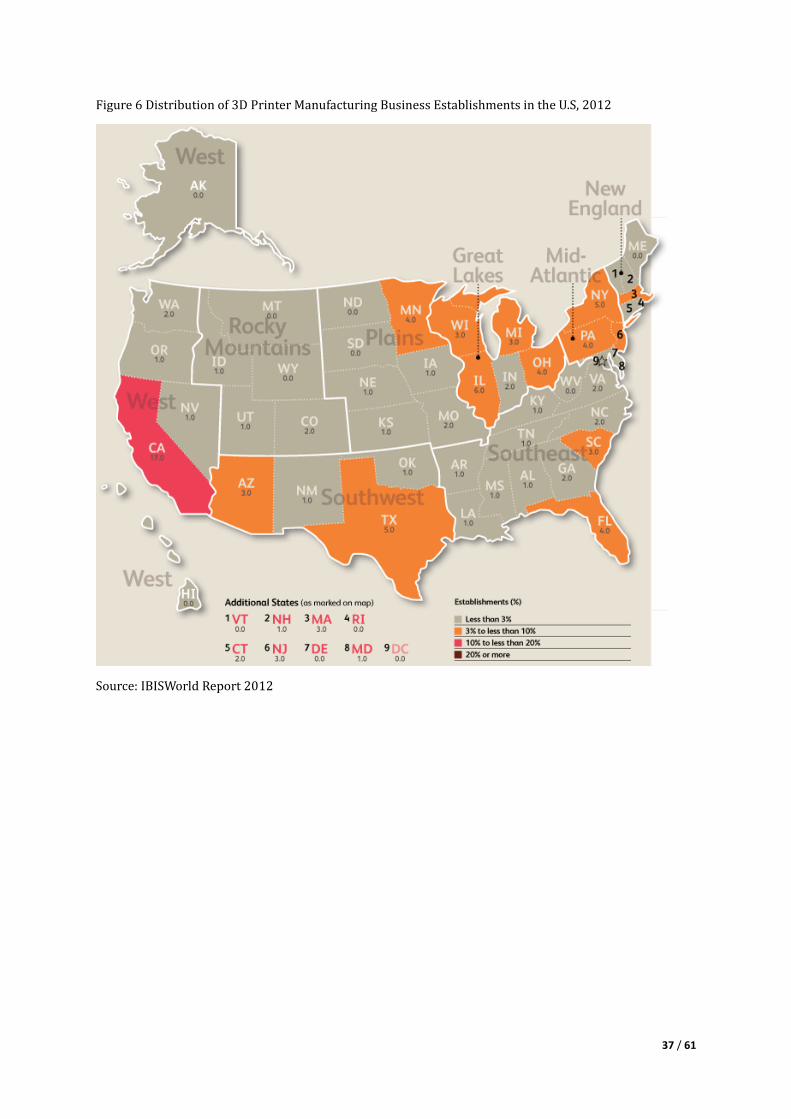
37 / 61
Figure 6 Distribution of 3D Printer Manufacturing Business Establishments in the U.S, 2012
Source: IBISWorld Report 2012
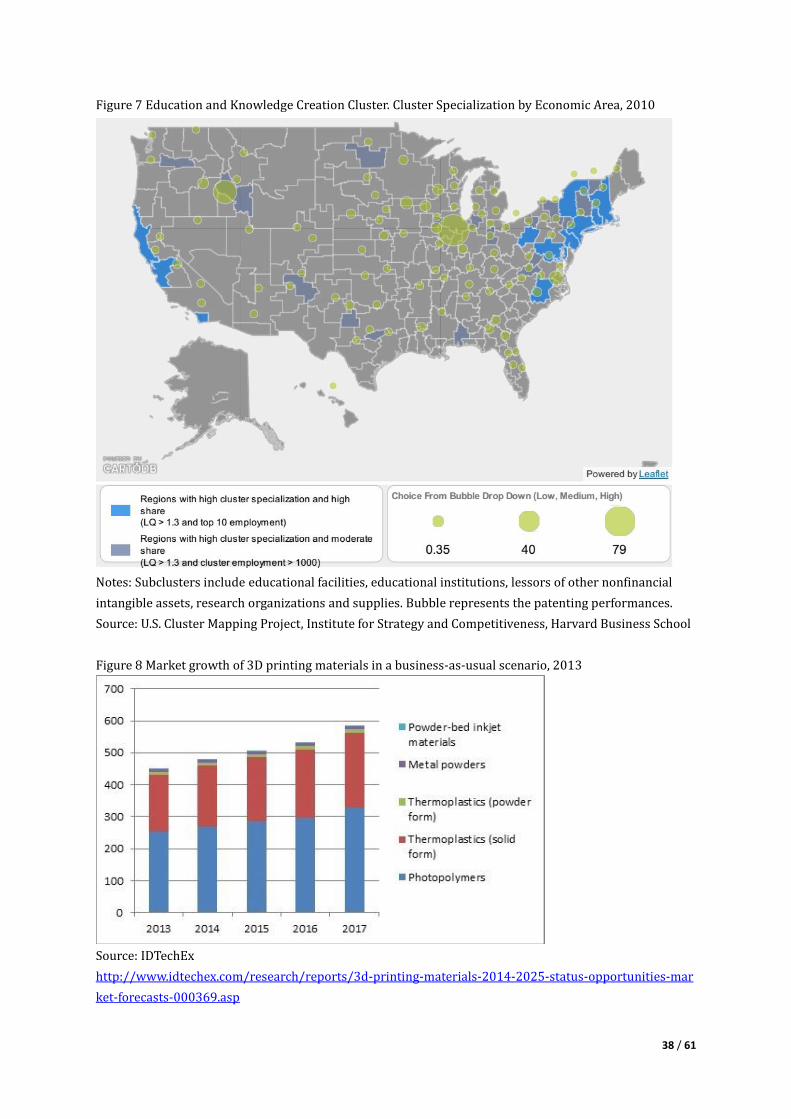
38 / 61
Figure 7 Education and Knowledge Creation Cluster. Cluster Specialization by Economic Area, 2010
Notes: Subclusters include educational facilities, educational institutions, lessors of other nonfinancial
intangible assets, research organizations and supplies. Bubble represents the patenting performances.
Source: U.S. Cluster Mapping Project, Institute for Strategy and Competitiveness, Harvard Business School
Figure 8 Market growth of 3D printing materials in a business-as-usual scenario, 2013
Source: IDTechEx
http://www.idtechex.com/research/reports/3d-printing-materials-2014-2025-status-opportunities-mar
ket-forecasts-000369.asp
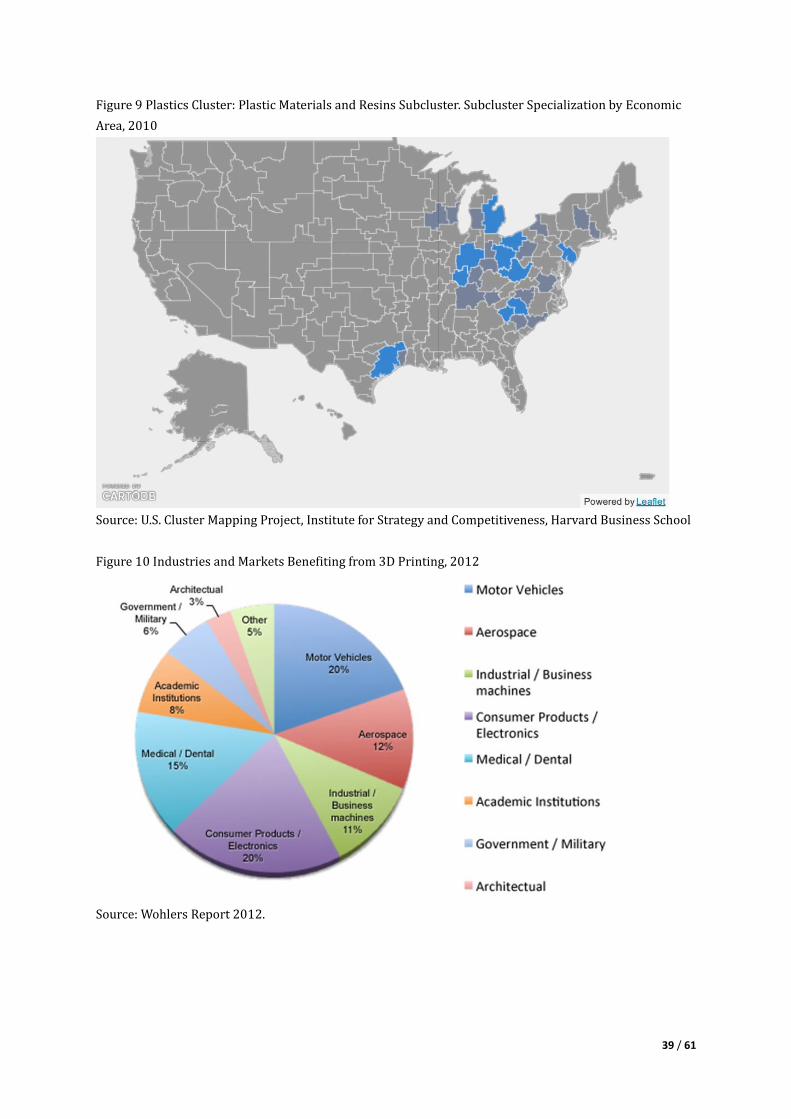
39 / 61
Figure 9 Plastics Cluster: Plastic Materials and Resins Subcluster. Subcluster Specialization by Economic
Area, 2010
Source: U.S. Cluster Mapping Project, Institute for Strategy and Competitiveness, Harvard Business School
Figure 10 Industries and Markets Benefiting from 3D Printing, 2012
Source: Wohlers Report 2012.
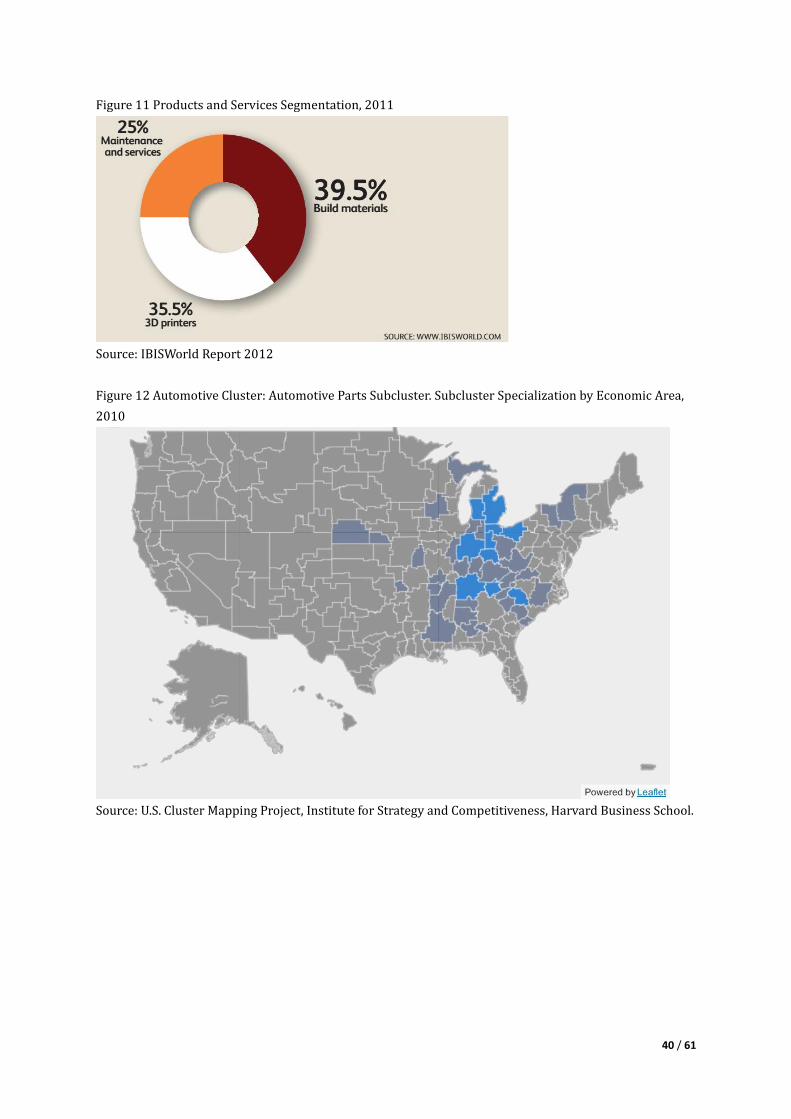
40 / 61
Figure 11 Products and Services Segmentation, 2011
Source: IBISWorld Report 2012
Figure 12 Automotive Cluster: Automotive Parts Subcluster. Subcluster Specialization by Economic Area,
2010
Source: U.S. Cluster Mapping Project, Institute for Strategy and Competitiveness, Harvard Business School.
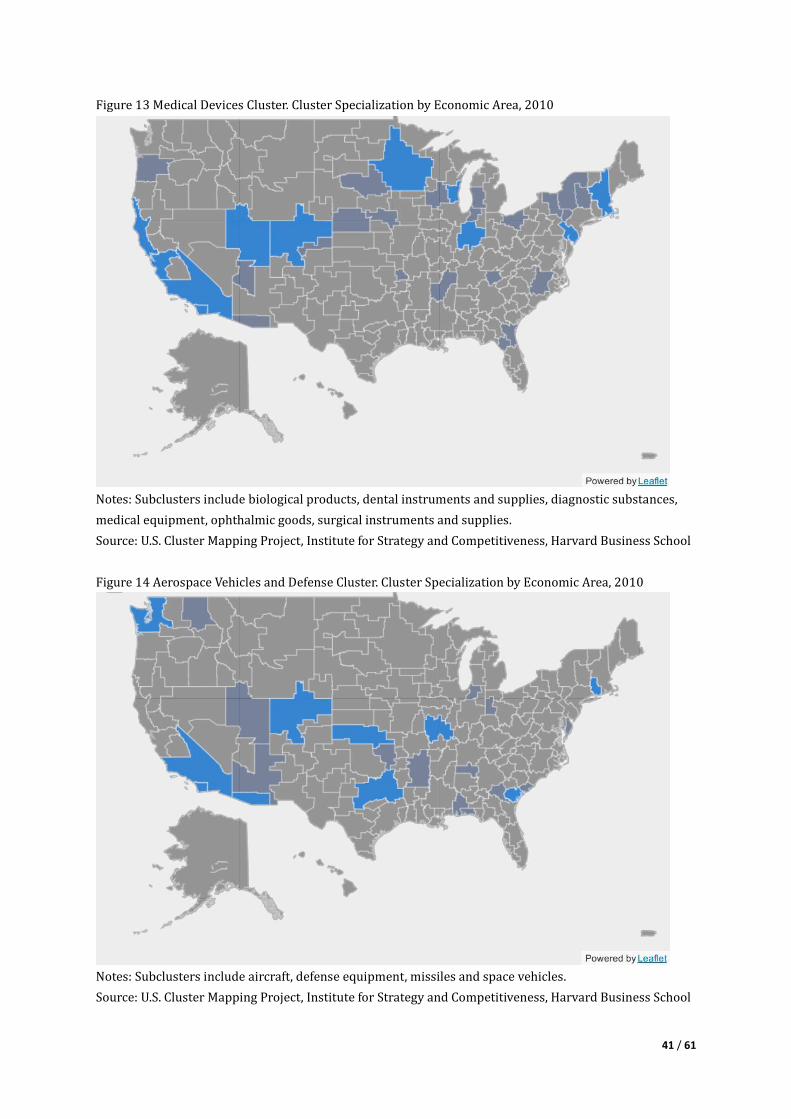
41 / 61
Figure 13 Medical Devices Cluster. Cluster Specialization by Economic Area, 2010
Notes: Subclusters include biological products, dental instruments and supplies, diagnostic substances,
medical equipment, ophthalmic goods, surgical instruments and supplies.
Source: U.S. Cluster Mapping Project, Institute for Strategy and Competitiveness, Harvard Business School
Figure 14 Aerospace Vehicles and Defense Cluster. Cluster Specialization by Economic Area, 2010
Notes: Subclusters include aircraft, defense equipment, missiles and space vehicles.
Source: U.S. Cluster Mapping Project, Institute for Strategy and Competitiveness, Harvard Business School
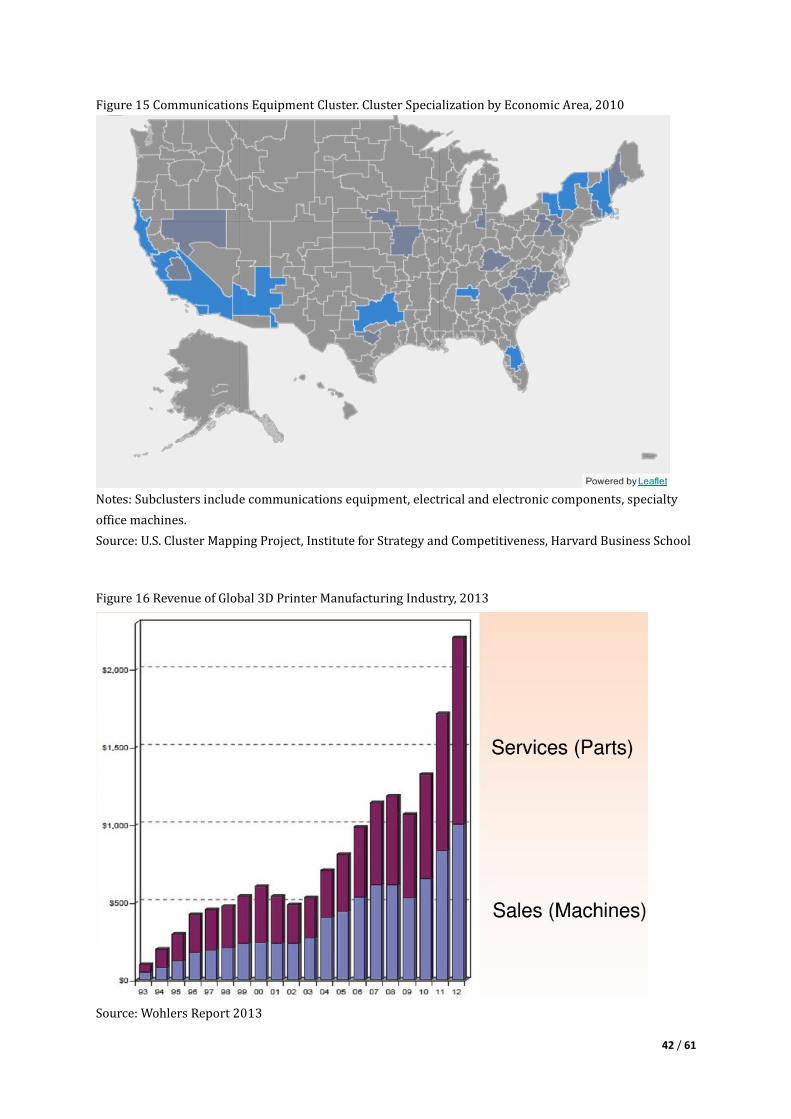
42 / 61
Figure 15 Communications Equipment Cluster. Cluster Specialization by Economic Area, 2010
Notes: Subclusters include communications equipment, electrical and electronic components, specialty
office machines.
Source: U.S. Cluster Mapping Project, Institute for Strategy and Competitiveness, Harvard Business School
Figure 16 Revenue of Global 3D Printer Manufacturing Industry, 2013
Source: Wohlers Report 2013
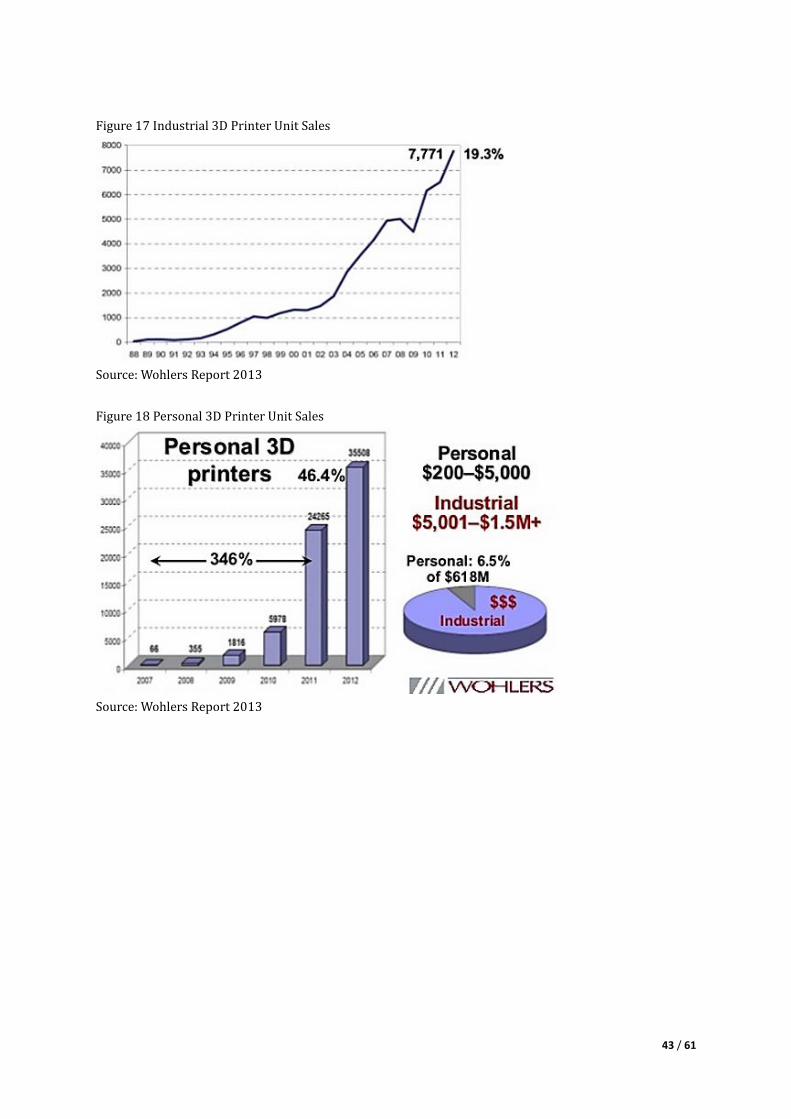
43 / 61
Figure 17 Industrial 3D Printer Unit Sales
Source: Wohlers Report 2013
Figure 18 Personal 3D Printer Unit Sales
Source: Wohlers Report 2013
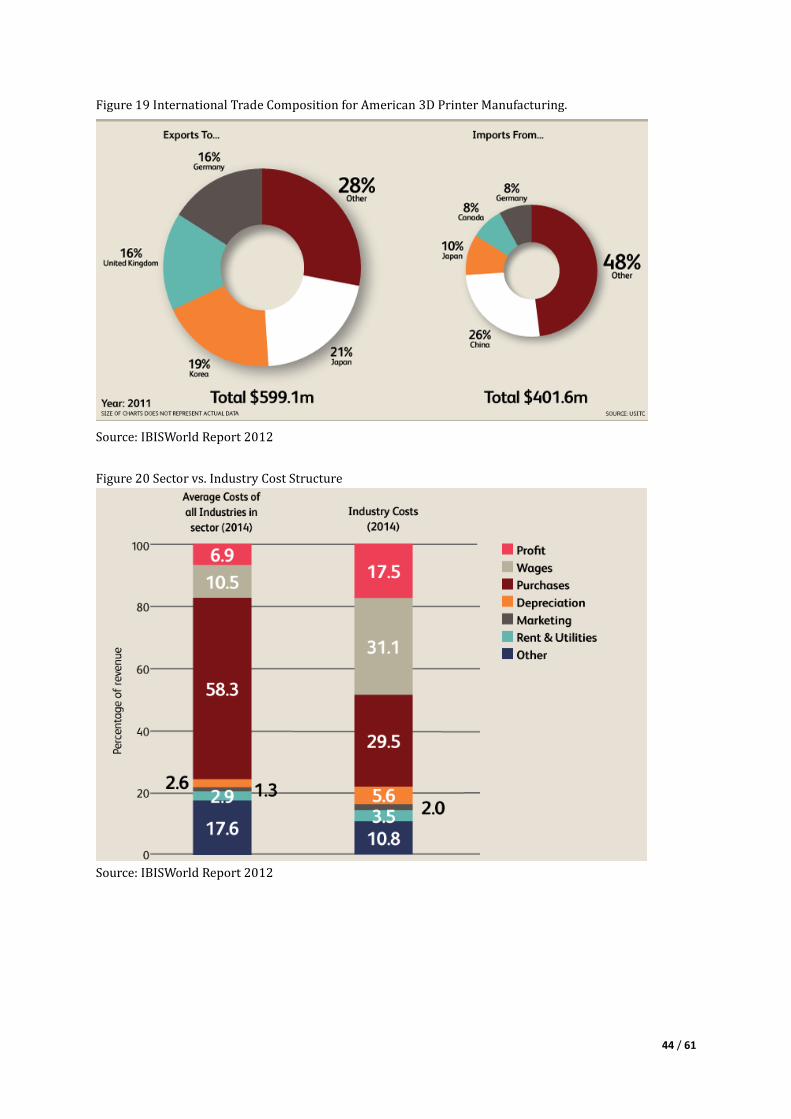
44 / 61
Figure 19 International Trade Composition for American 3D Printer Manufacturing.
Source: IBISWorld Report 2012
Figure 20 Sector vs. Industry Cost Structure
Source: IBISWorld Report 2012
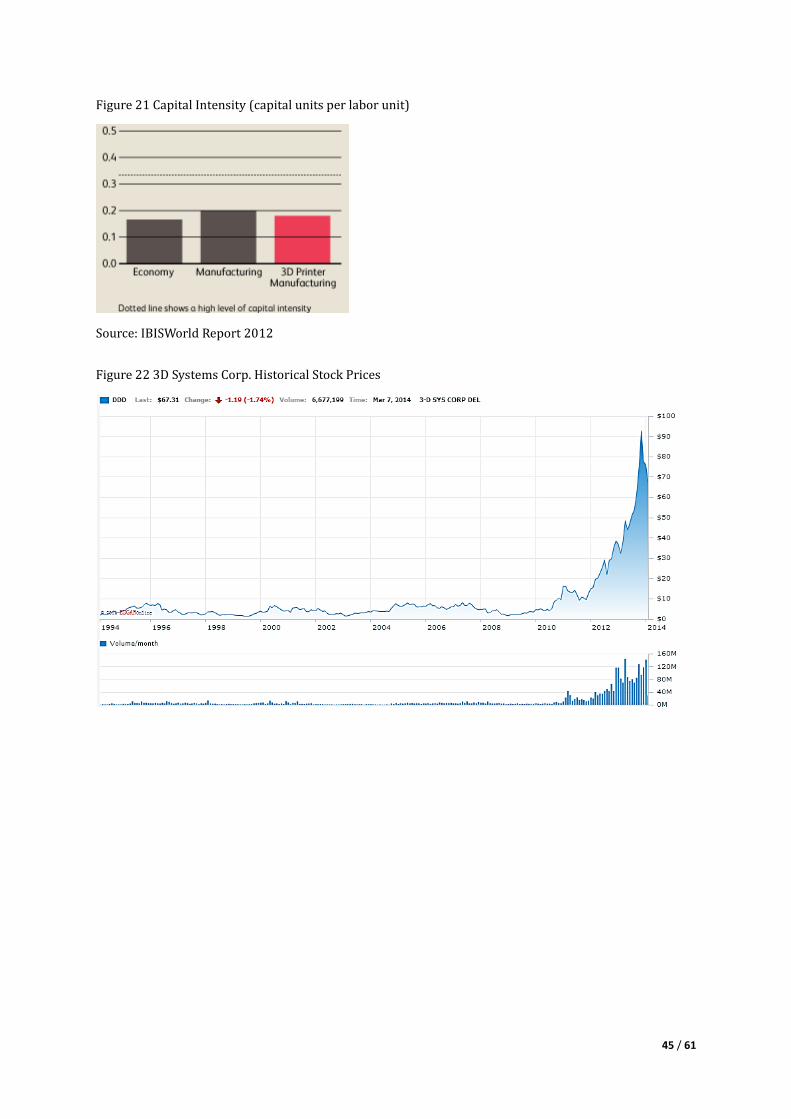
45 / 61
Figure 21 Capital Intensity (capital units per labor unit)
Source: IBISWorld Report 2012
Figure 22 3D Systems Corp. Historical Stock Prices
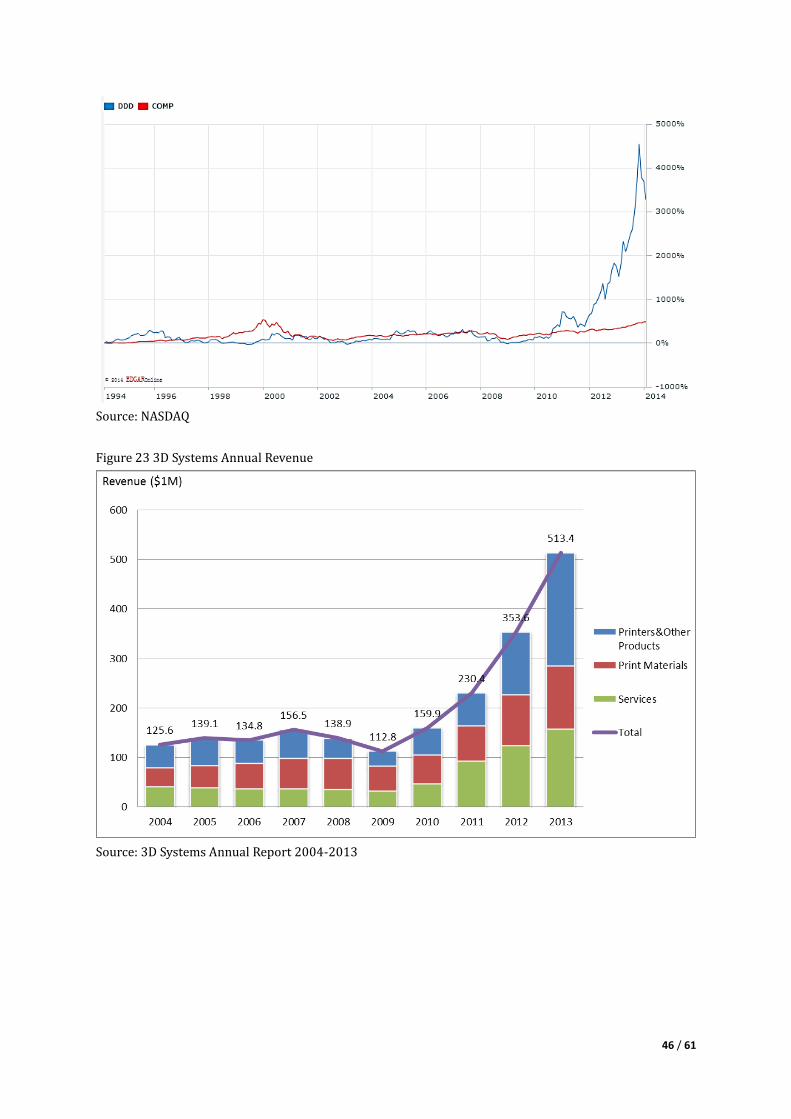
46 / 61
Source: NASDAQ
Figure 23 3D Systems Annual Revenue
Source: 3D Systems Annual Report 2004-2013
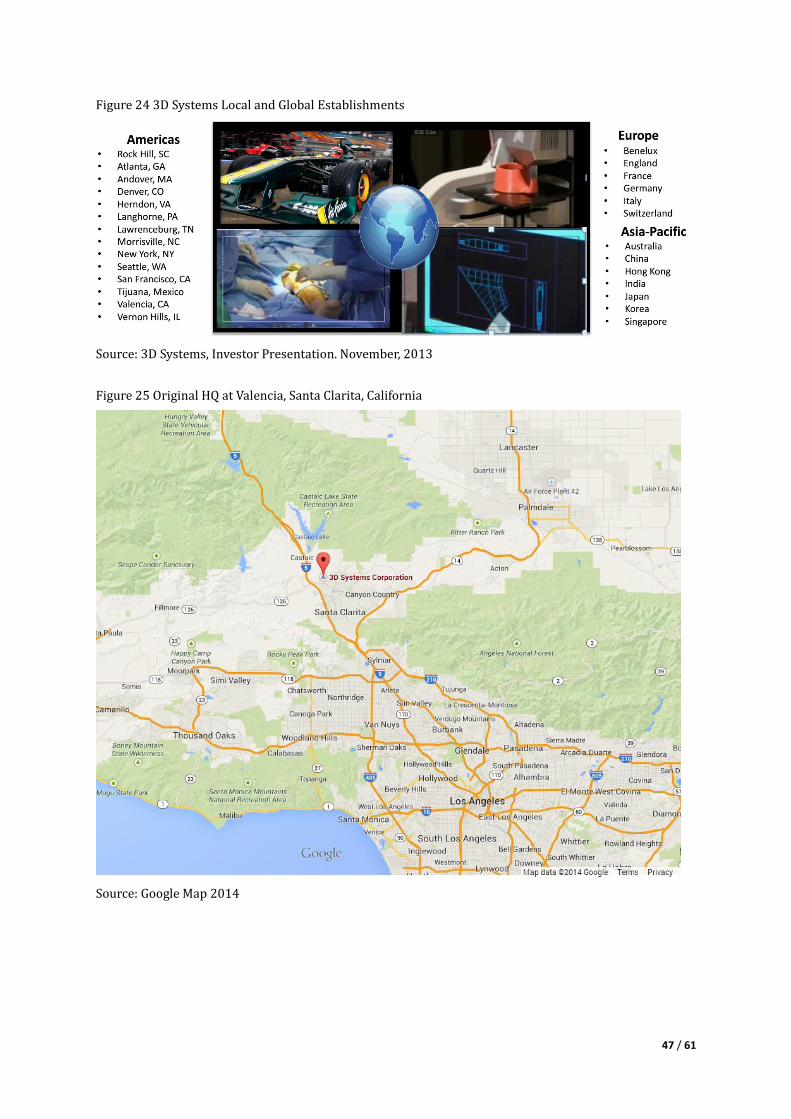
47 / 61
Figure 24 3D Systems Local and Global Establishments
Source: 3D Systems, Investor Presentation. November, 2013
Figure 25 Original HQ at Valencia, Santa Clarita, California
Source: Google Map 2014
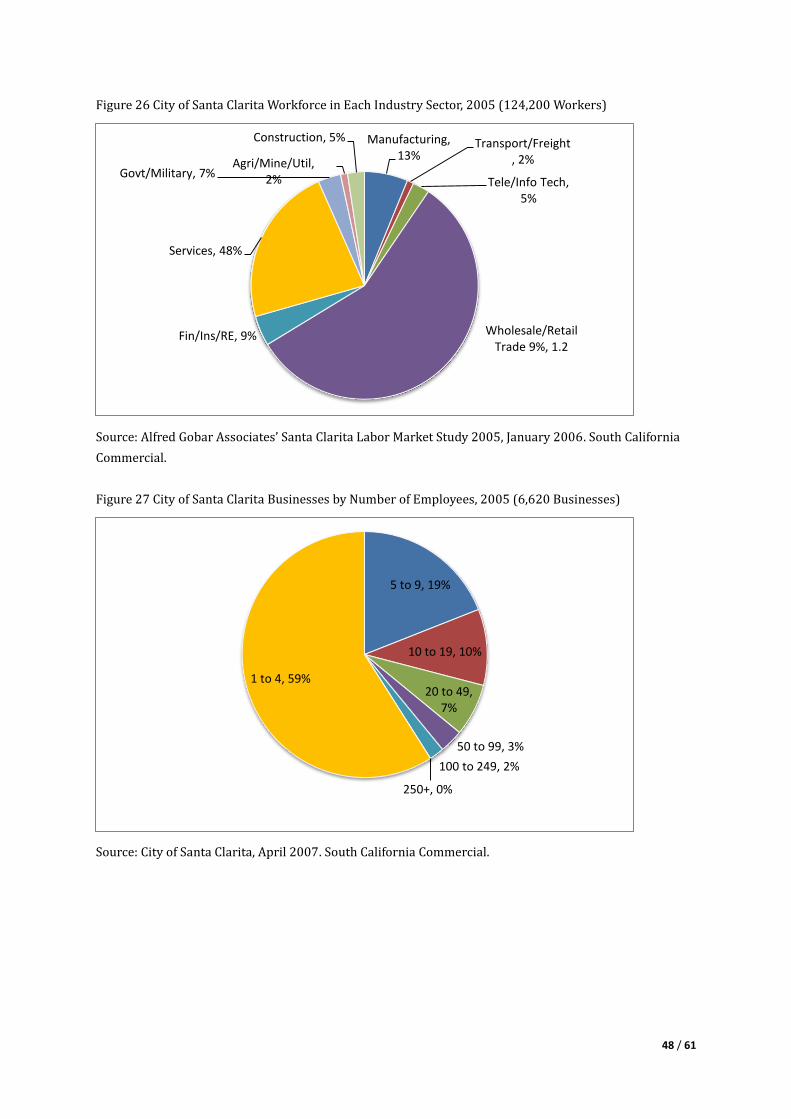
48 / 61
Figure 26 City of Santa Clarita Workforce in Each Industry Sector, 2005 (124,200 Workers)
Source: Alfred Gobar Associates’ Santa Clarita Labor Market Study 2005, January 2006. South California
Commercial.
Figure 27 City of Santa Clarita Businesses by Number of Employees, 2005 (6,620 Businesses)
Source: City of Santa Clarita, April 2007. South California Commercial.
Manufacturing, 13%
Transport/Freight, 2%
Tele/Info Tech, 5%
Wholesale/Retail Trade 9%, 1.2
Fin/Ins/RE, 9%
Services, 48%
Govt/Military, 7% Agri/Mine/Util,
2%
Construction, 5%
5 to 9, 19%
10 to 19, 10%
20 to 49, 7%
50 to 99, 3%
100 to 249, 2%
250+, 0%
1 to 4, 59%
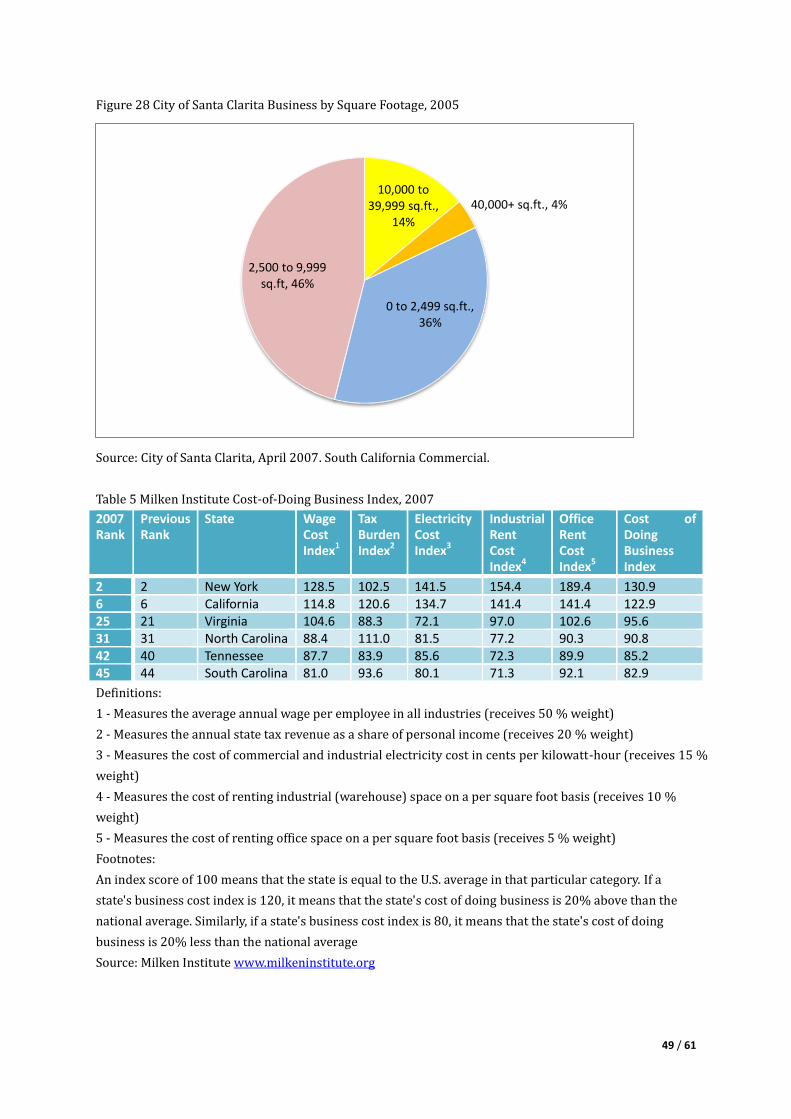
49 / 61
Figure 28 City of Santa Clarita Business by Square Footage, 2005
Source: City of Santa Clarita, April 2007. South California Commercial.
Table 5 Milken Institute Cost-of-Doing Business Index, 2007
2007 Rank
Previous Rank
State Wage Cost Index1
Tax Burden Index2
Electricity Cost Index3
Industrial Rent Cost Index4
Office Rent Cost Index5
Cost of Doing Business Index
2 2 New York 128.5 102.5 141.5 154.4 189.4 130.9 6 6 California 114.8 120.6 134.7 141.4 141.4 122.9 25 21 Virginia 104.6 88.3 72.1 97.0 102.6 95.6 31 31 North Carolina 88.4 111.0 81.5 77.2 90.3 90.8 42 40 Tennessee 87.7 83.9 85.6 72.3 89.9 85.2 45 44 South Carolina 81.0 93.6 80.1 71.3 92.1 82.9
Definitions:
1 - Measures the average annual wage per employee in all industries (receives 50 % weight)
2 - Measures the annual state tax revenue as a share of personal income (receives 20 % weight)
3 - Measures the cost of commercial and industrial electricity cost in cents per kilowatt-hour (receives 15 %
weight)
4 - Measures the cost of renting industrial (warehouse) space on a per square foot basis (receives 10 %
weight)
5 - Measures the cost of renting office space on a per square foot basis (receives 5 % weight)
Footnotes:
An index score of 100 means that the state is equal to the U.S. average in that particular category. If a
state's business cost index is 120, it means that the state's cost of doing business is 20% above than the
national average. Similarly, if a state's business cost index is 80, it means that the state's cost of doing
business is 20% less than the national average
Source: Milken Institute www.milkeninstitute.org
10,000 to 39,999 sq.ft.,
14%
40,000+ sq.ft., 4%
0 to 2,499 sq.ft., 36%
2,500 to 9,999 sq.ft, 46%
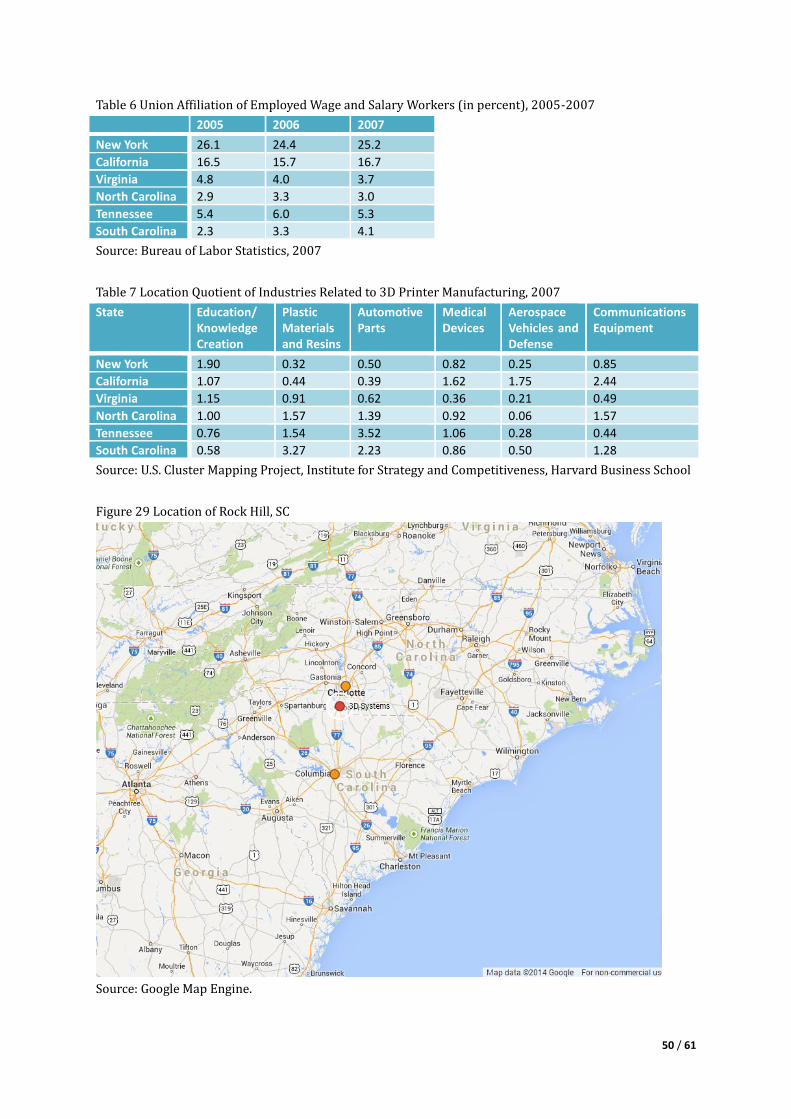
50 / 61
Table 6 Union Affiliation of Employed Wage and Salary Workers (in percent), 2005-2007
2005 2006 2007
New York 26.1 24.4 25.2
California 16.5 15.7 16.7
Virginia 4.8 4.0 3.7
North Carolina 2.9 3.3 3.0
Tennessee 5.4 6.0 5.3
South Carolina 2.3 3.3 4.1
Source: Bureau of Labor Statistics, 2007
Table 7 Location Quotient of Industries Related to 3D Printer Manufacturing, 2007
State Education/ Knowledge Creation
Plastic Materials and Resins
Automotive Parts
Medical Devices
Aerospace Vehicles and Defense
Communications Equipment
New York 1.90 0.32 0.50 0.82 0.25 0.85
California 1.07 0.44 0.39 1.62 1.75 2.44
Virginia 1.15 0.91 0.62 0.36 0.21 0.49
North Carolina 1.00 1.57 1.39 0.92 0.06 1.57
Tennessee 0.76 1.54 3.52 1.06 0.28 0.44
South Carolina 0.58 3.27 2.23 0.86 0.50 1.28
Source: U.S. Cluster Mapping Project, Institute for Strategy and Competitiveness, Harvard Business School
Figure 29 Location of Rock Hill, SC
Source: Google Map Engine.
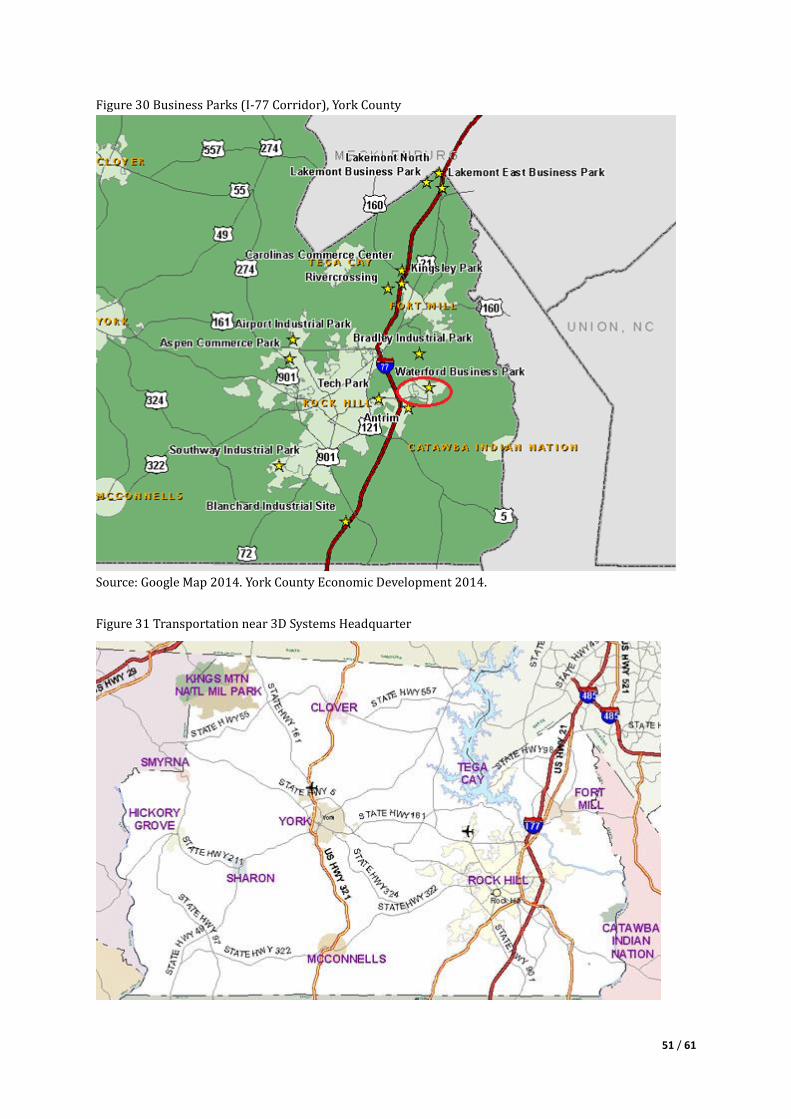
51 / 61
Figure 30 Business Parks (I-77 Corridor), York County
Source: Google Map 2014. York County Economic Development 2014.
Figure 31 Transportation near 3D Systems Headquarter
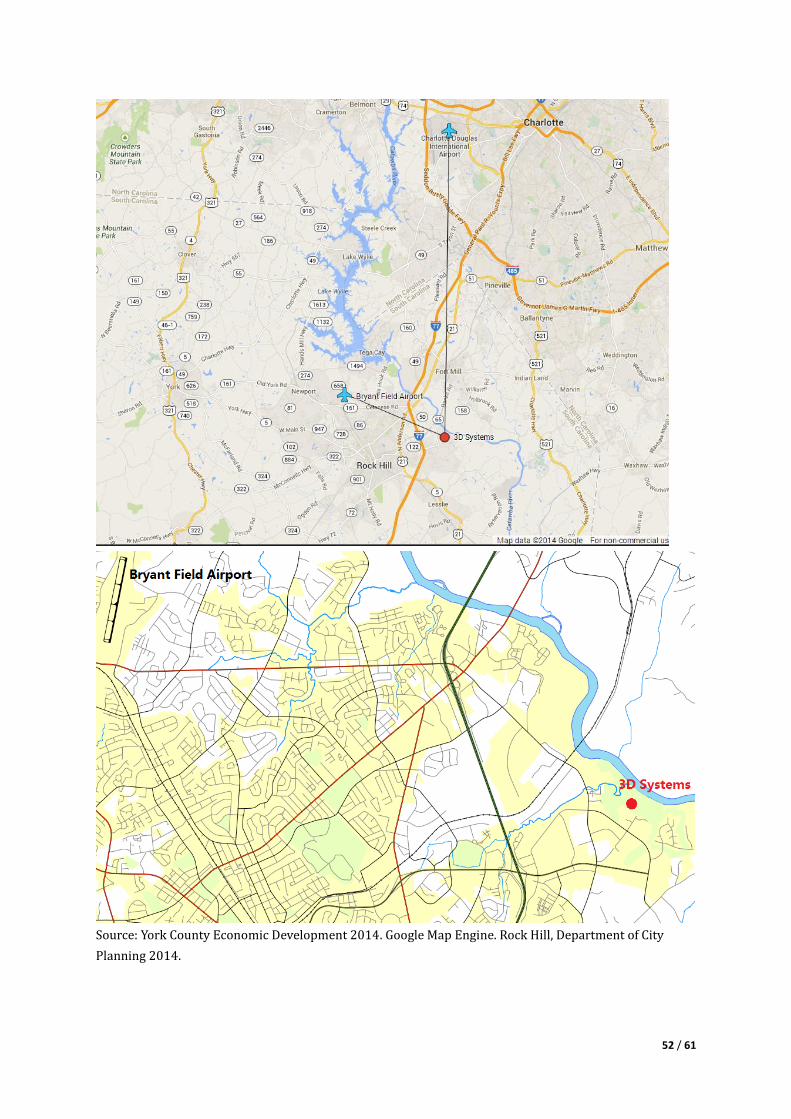
52 / 61
Source: York County Economic Development 2014. Google Map Engine. Rock Hill, Department of City
Planning 2014.
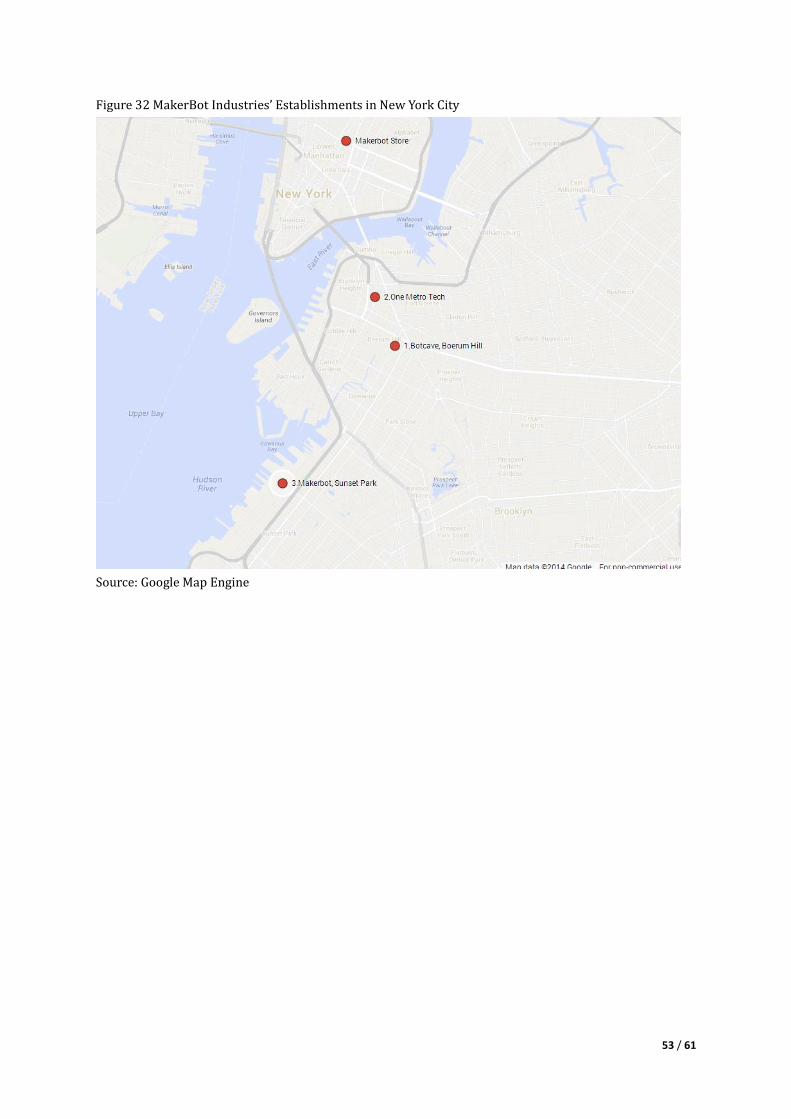
53 / 61
Figure 32 MakerBot Industries’ Establishments in New York City
Source: Google Map Engine
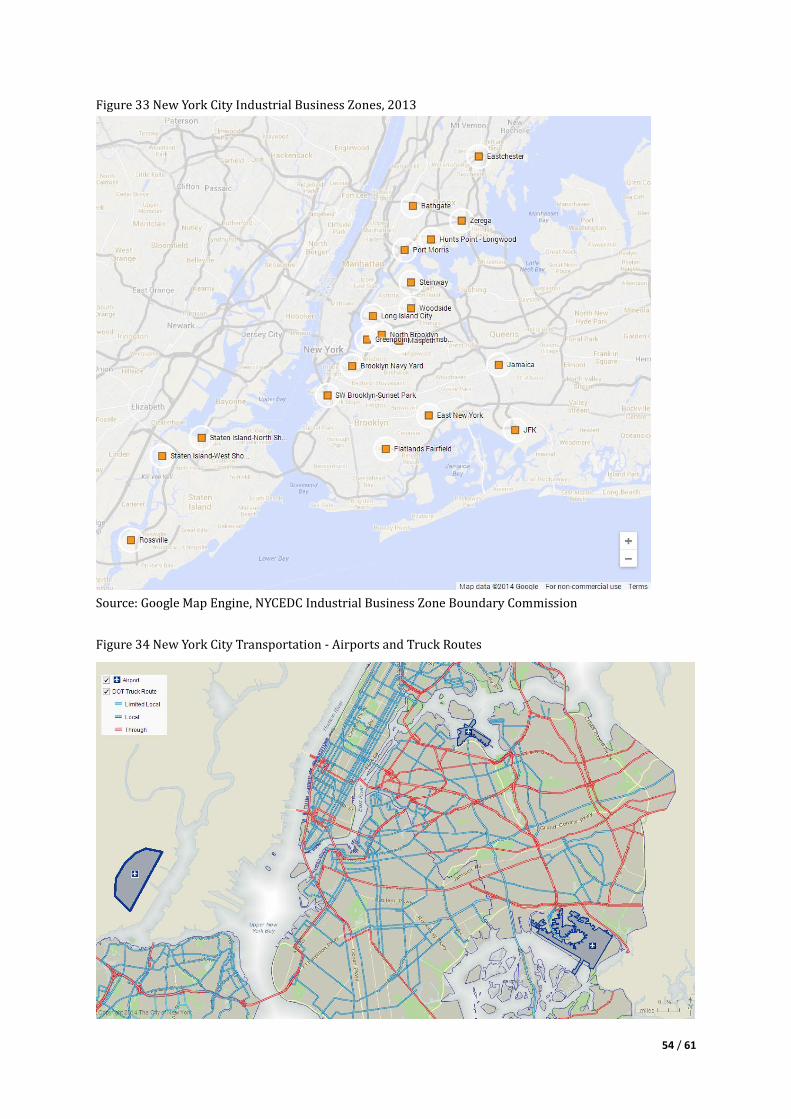
54 / 61
Figure 33 New York City Industrial Business Zones, 2013
Source: Google Map Engine, NYCEDC Industrial Business Zone Boundary Commission
Figure 34 New York City Transportation - Airports and Truck Routes
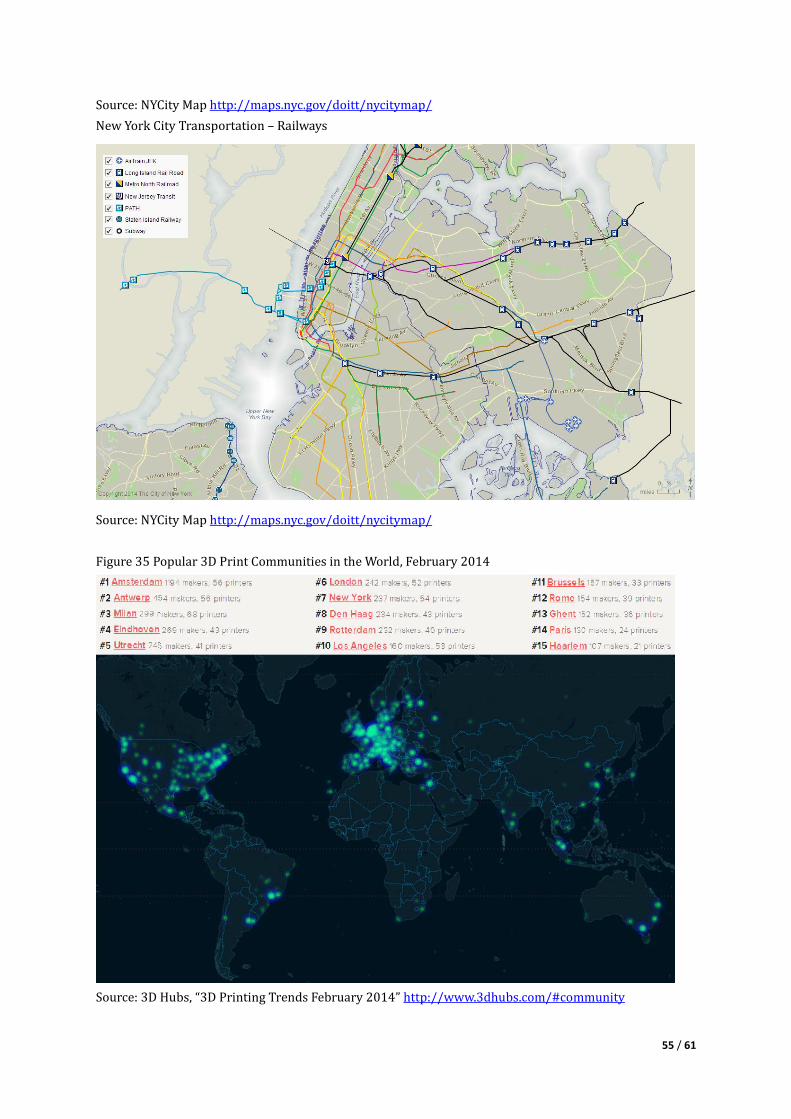
55 / 61
Source: NYCity Map http://maps.nyc.gov/doitt/nycitymap/
New York City Transportation – Railways
Source: NYCity Map http://maps.nyc.gov/doitt/nycitymap/
Figure 35 Popular 3D Print Communities in the World, February 2014
Source: 3D Hubs, “3D Printing Trends February 2014” http://www.3dhubs.com/#community
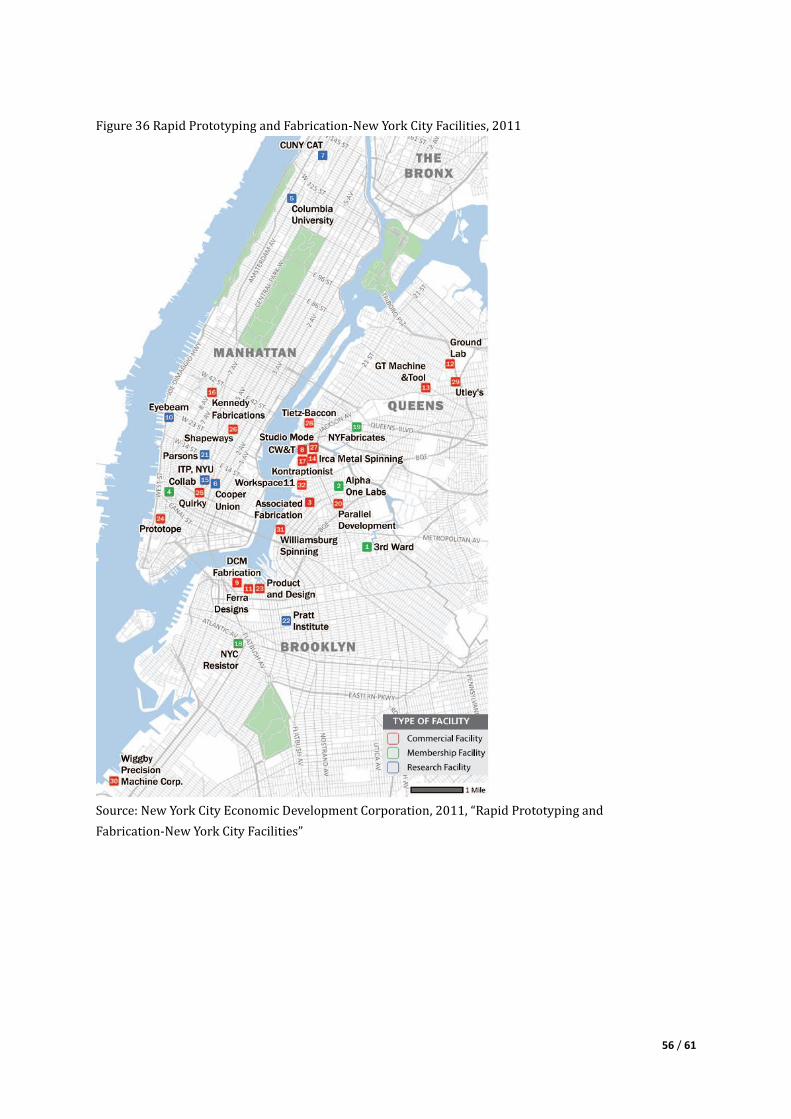
56 / 61
Figure 36 Rapid Prototyping and Fabrication-New York City Facilities, 2011
Source: New York City Economic Development Corporation, 2011, “Rapid Prototyping and
Fabrication-New York City Facilities”
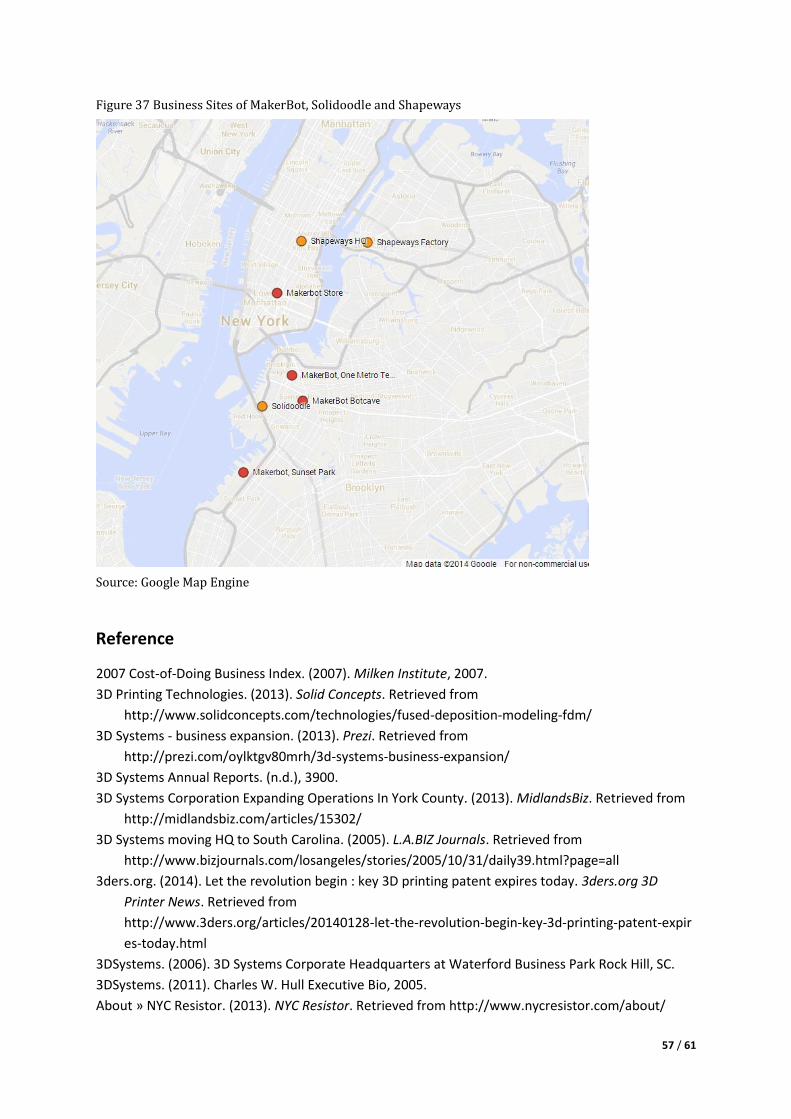
57 / 61
Figure 37 Business Sites of MakerBot, Solidoodle and Shapeways
Source: Google Map Engine
Reference
2007 Cost-of-Doing Business Index. (2007). Milken Institute, 2007.
3D Printing Technologies. (2013). Solid Concepts. Retrieved from
http://www.solidconcepts.com/technologies/fused-deposition-modeling-fdm/
3D Systems - business expansion. (2013). Prezi. Retrieved from
http://prezi.com/oylktgv80mrh/3d-systems-business-expansion/
3D Systems Annual Reports. (n.d.), 3900.
3D Systems Corporation Expanding Operations In York County. (2013). MidlandsBiz. Retrieved from
http://midlandsbiz.com/articles/15302/
3D Systems moving HQ to South Carolina. (2005). L.A.BIZ Journals. Retrieved from
http://www.bizjournals.com/losangeles/stories/2005/10/31/daily39.html?page=all
3ders.org. (2014). Let the revolution begin : key 3D printing patent expires today. 3ders.org 3D
Printer News. Retrieved from
http://www.3ders.org/articles/20140128-let-the-revolution-begin-key-3d-printing-patent-expir
es-today.html
3DSystems. (2006). 3D Systems Corporate Headquarters at Waterford Business Park Rock Hill, SC.
3DSystems. (2011). Charles W. Hull Executive Bio, 2005.
About » NYC Resistor. (2013). NYC Resistor. Retrieved from http://www.nycresistor.com/about/
58 / 61
About America Makes (NAMII). (2014). America Makes (NAMII). Retrieved from
https://americamakes.us/about/overview
Bilton, R. (2012, March). MakerBot makes a big move to Brookyln’s MetroTech Center. Venture Beat.
Retrieved from venturebeat.com/2012/05/08/makerbot-moves-brooklyn-metrotech/
Bond, B. M. (2013). The Geographic Concentration of Manufacturing Across the United States
Arkansas. U.S. Department of Commerce, Economics and Statistics Administration, (January), 1–
24. Retrieved from
http://www.esa.doc.gov/sites/default/files/reports/documents/finalthegeographicconcentratio
nofmanufacturingacrosstheunitedstates.pdf
Bryant, J. (2013). Industry Trends & Insights - 3D Printing on the Rise in New York City. NYCEDC
Economic Research & Analysis, (July).
Capturing Domestic Competitive Advantage in Advanced Manufacturing. (2012). Executive Office of
the President and President’s Council of Advisors on Science and Technology.
City of Santa Clarita Annual Economic Indicators and Demographics. (2007). South California
Commercial, (October 2006), 1–9.
Drummond, A. (2013). Evolution of 3D Printing. The Zeitgeist Movement Official Blog. Retrieved from
http://blog.thezeitgeistmovement.com/blog/4ndy/evolution-3d-printing
Economist Debates: Offshoring & Outsourcing. (2013). The Economist. Retrieved from
http://www.economist.com/debate/overview/245
Fab@Home Project. (2014). Retrieved from http://www.fabathome.org/index.php?q=node/2
Field, E. (2013). 3D Printing Jobs Hype. NYC Biz News. Retrieved from
http://nycbiznews.journalism.cuny.edu/2013/10/3d-printing-jobs-hype/
Fused Deposition Modeling. (2012). Castle Island’s Worldwide Guide to Rapid Prototyping. Retrieved
from www.additive3d.com/fdm_int.htm
Giles, D., & Maldonado, C. (2011). Growth by Design. Center for an Urban Future, (June). Retrieved
from http://www.ibrooklyn.com/go_brooklyn/Industrial_Manufacturing_Districts.aspx
Grenda, E. (2012). Additive Manufacturing: What RP will be when it grows up. Castle Island Co.
Retrieved from www.additive3d.com/rm_c.htm
Grenda, E. (2013). The Rapid Prototyping Industry- Competition Overview. Castle Island’s Worldwide
Guide to Rapid Prototyping. Retrieved from http://www.additive3d.com/ind_20.htm
Howard, J. (2013). MakerBot Opens New Manufacturing Facility in Brooklyn. MakerBot Blog.
Retrieved from
http://files.shareholder.com/downloads/AMDA-FNA1K/2941168631x0x684558/f93bcb01-7eb7
-48b9-a339-f095bbd1f662/Rls_MakerBotFactory_060713_0f.pdf
Important Commercial RP Technologies at a Glance. (2012). Castle Island’s Worldwide Guide to Rapid
Prototyping. Retrieved from http://www.additive3d.com/rp_int1.htm
Incentives. (2014). York County Economic Developmennt Corporation, South Carolina. Retrieved from
http://ycedb.com/business/businessIncentives
Industrial/Manufacturing Districts. (2014). Brooklyn Chamber of Commerce. Retrieved from
http://www.ibrooklyn.com/go_brooklyn/Industrial_Manufacturing_Districts.aspx
Innovation Index. (2013). NYCEDC Economic Research & Analysis. Retrieved from
http://www.nycedc.com/economic-data/innovation-index
Krabeepetcharat, A. (2012). 3D Printer Manufacturing in the US. IBISWorld Industry Report,
(December), 1–33.
59 / 61
Larson, E. (2013). MakerBot Opens Large New Factory in Brooklyn. Mashable. Retrieved from
mashable.com/2013/06/07/makerbot-factory-brooklyn
Laser Sintering. (2012). Castle Island’s Worldwide Guide to Rapid Prototyping. Retrieved from
www.additive3d.com/sls_int.htm
Lester, R. K. (2006). Universities, Innovation, and the Competitiveness of Local Economies: A
Summary Report from the Local Innovation Systems Project—Phase I. Industrial Performance
Center Massachusetts Institute of Technology.
Lou, A., & Grosvenor, C. (2012). Selective Laser Sintering , Birth of an Industry. the University of
Texas at Austin, Department of Mechanical Engineering 100 Years. Retrieved from
www.me.utexas.edu/news/2012/0712_sls_history.php#ch4
MakerBot TV S02E01 - History of MakerBot. (2012). MakerBot Industries. Retrieved from
http://blip.tv/makerbot/makerbot-tv-s02e01-history-of-makerbot-6002805
Miguel. (2013). Patents on 3D printing. Fablogica. Retrieved from
http://fablogica.com/patents-on-3d-printing/
Millstein, B. (2013). A New Home In Brooklyn. MakerBot Blog. Retrieved from
http://www.makerbot.com/blog/2013/06/07/a-new-home-in-brooklyn/
Mims, C. (2013). Get Ready : 3D Printing Will Explode Next Year , When Key Patents Expire. The
Atlantic, 3–5. Retrieved from
http://www.theatlantic.com/technology/archive/2013/07/get-ready-3d-printing-will-explode-n
ext-year-when-key-patents-expire/278008/
Pettis, B. (2011). All-Star Lineup Invests in MakerBot. MakerBot Blog. Retrieved from
http://www.makerbot.com/blog/2011/08/23/all-star-lineup-invests-in-makerbot/
Porter, M. E., & Richard Bryden. (2014). State of New York Education and Knowledge Creation
Cluster Subcluster Size and National Rank, 2011. Cluster Mapping Project, Institute for Strategy
and Competitiveness, Harvard Business School. Retrieved from
http://mvp.clustermapping.us/home/
Rapid Prototyping and Fabrication-New York City Facilities. (2011). New York City Economic
Development Corporation.
RepRap Organization. (2014). Retrieved from http://reprap.org/wiki/RepRap
Reshoring manufacturing: Coming home. (2013). The Economist. Retrieved from
http://www.economist.com/news/special-report/21569570-growing-number-american-compa
nies-are-moving-their-manufacturing-back-united
Scott, D. (2012). Southern States Have Become Job-Training Leaders. Governing.
Sharma, R. (2013). The Real Reason Stratasys Bought MakerBot. Forbes. Retrieved from
http://www.forbes.com/sites/rakeshsharma/2013/09/24/stratasys-bold-moves-a-conversation-
with-company-chairman-scott-crump/
Smith, Z. (2012). MakerBot vs . Open Source – A Founder Perspective. Hoektronics. Retrieved from
http://www.hoektronics.com/2012/09/21/makerbot-and-open-source-a-founder-perspective/
South Carolina’s Workforce Training Program. (2014). York County Economic Developmennt
Corporation, South Carolina. Retrieved from http://ycedb.com/workforceTraining
Stratasys. (2013). Stratasys and MakerBot Complete Merger. Business Wire. Retrieved from
http://www.businesswire.com/news/home/20130815006088/en/Stratasys-MakerBot-Complet
e-Merger#.UwyytPRDuX0
Stratasys, Makerbot CEOs explain the $604 Milion deal. (2013). 3der. org.
60 / 61
Tassey, G. (2010). Rationales and mechanisms for revitalizing US manufacturing R&D strategies. The
Journal of Technology Transfer (Vol. 35, pp. 283–333). doi:10.1007/s10961-009-9150-2
Taxes. (2014). York County Economic Developmennt Corporation, South Carolina. Retrieved from
http://ycedb.com/business/taxes
Tech Trends & Insights - Analysis of the Tech Sector in New York, Q1-Q3 2013 Analysis. (2014).
NYCEDC Economic Research & Analysis, (January).
Three Dimensional Printing. (2012). Castle Island’s Worldwide Guide to Rapid Prototyping. Retrieved
from http://www.additive3d.com/3dp_int.htm
Torrone, P. (2013). Stratasys Lawsuit, Patents and More: An Interview with MakerBot’s Bre Pettis.
Makezine. Retrieved from
http://makezine.com/2013/12/03/stratasys-lawsuit-patents-and-more-an-interview-with-make
rbots-bre-pettis/
U . S Manufacturing In Context. (2012). Advanced Manufacturing Portal. Retrieved from
http://www.manufacturing.gov/mfg_in_context.html#_ftn3
Warner, J. (2006). 3D Systems Relocates Headquarters , Operations , R & D in South Carolina. Swamp
Fox Community.
Waterford Business Park. (2014). Rock Hill Economic Development Corporation. Retrieved from
http://www.rockhillusa.com/properties/parks/1376/waterford-business-park
Wendy Kneissl. (2013). 3D Printing Materials 2014-2025: Status, Opportunities, Market Forecasts.
Wohlers, T. (2011). Wohlers Report 2011: Additive Manufacturing and 3D Printing, State of the
Industry.
Wohlers, T. (2013). Wohlers Report 2013: Additive Manufacturing and 3D Printing, State of the
Industry.
Wohlers, T., & Gornet, T. (2013). History of additive manufacturing. Wohlers Report 2013, 1–29.
Worthington, D. (2013). 3D Systems plans $10.9 million, Rock Hill expansion. HeraldOnline. Retrieved
from
http://www.heraldonline.com/2013/10/04/5275019/3d-systems-plans-109-million-rock.html
York County Industrial Directory. (2014). York County Economic Developmennt Corporation, South
Carolina. Retrieved from http://ycedb.com/industry
Alcacer, J., W. Chung (2007). “Location Strategies and Knowledge Spillovers,” Management Science
53(5), 760–776.
Brezis E.S., Krugman P. (1993), Technology and the Life Cycle of Cities, NBER Working Paper Series,
4561, NBER, Cambridge (Mass.).
Cohen, N. (2000). Business location decisions-making and the cities: Bringing companies back.
Washington, D.C. The Brookings Institution.
Drejer, I. (2005). “Location and Collaboration: Manufacturing Firms' Use of Knowledge Intensive
Services in Product Innovation,”European Planning Studies 13(6), 879–898.
Executive Office of the President and President’s Council of Advisors on Science and Technology. (July,
2012) Capturing Domestic Competitive Advantage in Advanced Manufacturing.
Feldman M.P. (1994), The University and Economic Development: The Case of Johns Hopkins
University and Baltimore, Economic Development Quarterly, 8 (1), pp. 67-76.
Feldman M.P. (1995), The Geography of Innovation, Kluwer, Dordrecht.
Fernandes, C., Ferreira, J., & Marques, C. (2010). Location Theories Influence on Technology-based
Entrepreneurs: A Multidimensional Approach. In AGSE 2010 Conference Proceedings. Australian
61 / 61
Graduate School of Entrepreneurship, Swinburne University of Technology.
Galbraith, C. S., Rodriguez, C. L., & Denoble, A. F. (2008). High-Technology Manufacturing. Journal of
Small Business Management, 46(2), 183–202.
Hayter, R. (1997). The dynamics of industrial location: the factory, the firm and the production
system. New York: Wiley.
Hulsink, Manuel, Bouwman (2007) Clustering in ICT:From Route 128 to Silicon Valley , from DEC to
Google, from Hardware to Content. ERIM Report Series Reference No. ERS-2007-064-ORG
Kilvits, K. (2012). Living Environment as Location Decision Factor for Manufacturing Enterprises.
China-USA Business Review, 11(2), 217–224.
Maggioni, M. (2002). The location of high-tech firms and the development of innovative industrial
cluster: A survey of the literature. Economia Politica.
Krugman P. (1991), Geography and Trade, MIT Press, Cambridge (Mass.).
Krugman, P. (1995). Development, geography, and economic theory. Cambridge, M.A.: The MIT Press.
McCann, P. (Ed.). (2002). Industrial location economics. Edward Elgar. Cheltenham, UK; Northampton,
M.A., USA.
Ouwersloot, H., Rietveld, P. (2000). The geography of R&D: tobit analysis and a Bayesian approach to
mapping R&D activities in the Netherlands. Environment and Planning, 32: 1673 – 1688.
Pen, C. J. (1999). Improving behavioral location theory: Preliminary results of a written questionnaire
decision making of firm relocations. Presented at the European Regional Science Association
Congress, Dublin.
Reshoring Manufacturing Coming Home. Jan 19th 2013. Economist Special Report: Outsourcing and
Offshoring. Federal Planning Bureau. (2000). Relocation, an element of industrial dynamics.
Synthesis Report. Brussels.
Storper M., Walker R. (1989), The Capitalist Imperative. Territory, Technology and Industrial Growth,
Basil Blackwell, New York.
Storper M. (1997), The Regional Word: Territorial Development in a Global Economy, Guilford Press,
New York.
Weber, A. (1929). Theory of the Location of Industries. Trans. C. Friedrich. Chicago, IL: University of
Chicago Press.
Ženka, J., Cadil, V. (2009). Regional distribution of technology intensive manufacturing industries in
the Czech Republic with an accent on risk of delocalization. Prague Economic Paper, 1, 61-77.