Embed Size (px)
Citation preview
LOGAN WATER ALLIANCE
LOGAN SOUTH WATER SUPPLY PRESSURE MANAGEMENT - DETAILED PLANNING
TASK NUMBER: 90-12-76
DECEMBER 2014
Logan South Water Supply Pressure Management - Detailed Planning
Document Number: 7600-000-P-REP-PL-8230
Approval Register
Date
Project Manager Submitted 11/11/2014
Planning & Project Management Team Review 12/11/2014
Program Review 17/11/2014
Controlled Document – Change Register
Revision Section Changed Change Description Initial Date
A Prepare draft report JT 10/11/2014
B Format Draft report SS 11/11/2011
C Incorporate Program review comments JT 01/12/2014
1 Final report format SS 04/12/2014
90-12-76 Date issued: 05/12/2014 Page 2 of 62 Rev: 1
Logan South Water Supply Pressure Management - Detailed Planning
Document Number: 7600-000-P-REP-PL-8230
TABLE OF CONTENTS
EXECUTIVE SUMMARY ................................................................................................................................. 8
1. INTRODUCTION ............................................................................................................................... 10
1.1 Objectives ...................................................................................................................................... 10
1.2 Scope ............................................................................................................................................. 10
1.3 Business Drivers ............................................................................................................................ 10
1.4 Stakeholder Consultation ............................................................................................................... 11
2. PLANNING CONTEXT ...................................................................................................................... 12
2.1 Background .................................................................................................................................... 12
2.2 Study Area ..................................................................................................................................... 12
2.3 Existing Situation ........................................................................................................................... 13
2.4 Previous Studies ............................................................................................................................ 13
3. METHODOLOGY .............................................................................................................................. 14
3.1 Assumptions .................................................................................................................................. 14
3.1.1 Infrastructure Cost Rates ........................................................................................................... 14
3.1.2 Bulk Water Costs ....................................................................................................................... 14
3.1.3 DMA vs PMA .............................................................................................................................. 14
3.2 Key DSS Criteria ............................................................................................................................ 15
4. NETWORK HYDRAULIC ANALYSIS ............................................................................................... 16
4.1 Munruben PMA .............................................................................................................................. 16
4.2 Jimboomba East PMA ................................................................................................................... 19
4.3 Jimboomba West PMA .................................................................................................................. 23
4.4 Cedar Vale PMA ............................................................................................................................ 26
4.5 Flagstone PMA .............................................................................................................................. 29
4.6 New Beith....................................................................................................................................... 32
4.7 Tall Timber PMA ............................................................................................................................ 35
4.7.1 Scenario 1 .................................................................................................................................. 37
4.7.2 Scenario 2 .................................................................................................................................. 40
4.7.3 Additional Scenarios .................................................................................................................. 43
4.8 Pressure Management Summary .................................................................................................. 44
4.9 Infrastructure Cost Summary ......................................................................................................... 44
5. COST BENEFIT ANALYSIS ............................................................................................................. 45
6. CAPITAL WORKS PROGRAM IMPLICATIONS .............................................................................. 47
7. CONCLUSIONS ................................................................................................................................ 48
8. RECOMMENDATIONS ..................................................................................................................... 49
9. REFERENCES .................................................................................................................................. 50
90-12-76 Date issued: 05/12/2014 Page 3 of 62 Rev: 1
Logan South Water Supply Pressure Management - Detailed Planning
Document Number: 7600-000-P-REP-PL-8230
FIGURES
Figure 2-1: Study Area ............................................................................................................................... 12 Figure 4-1: Munruben PMA existing maximum pressures ......................................................................... 16 Figure 4-2: Munruben PMA maximum pressure following pressure management .................................... 17 Figure 4-3: Munruben PMA critical point pressure versus flow.................................................................. 18 Figure 4-4: Jimboomba East PMA existing maximum pressures .............................................................. 20 Figure 4-5: Jimboomba East PMA maximum pressure following pressure management ......................... 21 Figure 4-6: Jimboomba East PMA critical point pressure versus flow ....................................................... 21 Figure 4-7: Jimboomba West PMA existing maximum pressures ............................................................. 23 Figure 4-8: Jimboomba West PMA maximum pressure following pressure management ........................ 24 Figure 4-9: Jimboomba West PMA critical point pressure versus flow ...................................................... 25 Figure 4-10: Cedar Vale PMA existing maximum pressures ....................................................................... 26 Figure 4-11: Cedar Vale PMA maximum pressure following pressure management .................................. 27 Figure 4-12: Cedar Vale PMA critical point pressure versus flow ................................................................ 28 Figure 4-13: Flagstone PMA existing maximum pressures ......................................................................... 29 Figure 4-14: Flagstone PMA maximum pressure following pressure management .................................... 30 Figure 4-15: Flagstone PMA critical point pressure versus flow .................................................................. 30 Figure 4-16: New Beith PMA existing maximum pressures ......................................................................... 32 Figure 4-17: New Beith PMA maximum pressure following pressure management.................................... 33 Figure 4-18: New Beith PMA critical point pressure versus flow ................................................................. 33 Figure 4-19: Schematic of Tall Timber PMA arrangement (Scenario 1) ...................................................... 35 Figure 4-20: Tall Timber Area PMA existing maximum pressures............................................................... 36 Figure 4-21: Tall Timber PMA maximum pressure following pressure management (Scenario 1) ............. 37 Figure 4-22: Tall Timber 1.1 PMA critical point pressure versus flow (Scenario 1) ..................................... 38 Figure 4-23: Tall Timber 1.2 PMA critical point pressure versus flow (Scenario 1) ..................................... 38 Figure 4-24: Tall Timber 1.3 PMA critical point pressure versus flow (Scenario 1) ..................................... 39 Figure 4-25: Schematic of Tall Timber PMA arrangement (Scenario 2) ...................................................... 40 Figure 4-26: Tall Timber PMA maximum pressure following pressure management (Scenario 2) ............. 41 Figure 4-27: Tall Timber 2.1 PMA critical point pressure versus flow .......................................................... 42 Figure 4-28: Tall Timber 2.2 PMA critical point pressure versus flow .......................................................... 42
90-12-76 Date issued: 05/12/2014 Page 4 of 62 Rev: 1
Logan South Water Supply Pressure Management - Detailed Planning
Document Number: 7600-000-P-REP-PL-8230
TABLES
Table 1-1: Stakeholder consultation ......................................................................................................... 11 Table 3-1: Key DSS criteria....................................................................................................................... 15 Table 4-1: Munruben PMA key statistics .................................................................................................. 16 Table 4-2: Munruben PMA average pressure ........................................................................................... 18 Table 4-3: Munruben PMA recommended PRV settings .......................................................................... 19 Table 4-4: Jimboomba East PMA key statistics ........................................................................................ 19 Table 4-5: Jimboomba East PMA average pressure ................................................................................ 22 Table 4-6: Jimboomba East PMA recommended PRV settings ............................................................... 22 Table 4-7: Jimboomba West PMA key statistics ....................................................................................... 23 Table 4-8: Jimboomba West PMA average pressure ............................................................................... 25 Table 4-9: Jimboomba West PMA recommended PRV settings .............................................................. 25 Table 4-10: Cedar Vale PMA key statistics ................................................................................................. 26 Table 4-11: Cedar Vale PMA average pressure ......................................................................................... 28 Table 4-12: Cedar Vale PMA recommended PRV settings ........................................................................ 28 Table 4-13: Flagstone PMA key statistics ................................................................................................... 29 Table 4-14: Flagstone PMA Average Pressure .......................................................................................... 31 Table 4-15: Flagstone PMA recommended PRV settings .......................................................................... 31 Table 4-16: New Beith PMA key statistics .................................................................................................. 32 Table 4-17: New Beith PMA average pressure........................................................................................... 34 Table 4-18: New Beith PMA recommended PRV settings .......................................................................... 34 Table 4-19: Tall Timber PMA key statistics ................................................................................................. 36 Table 4-20: Tall Timber PMAs/PMA average pressure - Scenario 1 .......................................................... 39 Table 4-21: Tall Timber PMA recommended PRV settings ........................................................................ 40 Table 4-22: Tall Timber PMAs average pressure Scenario 2 ..................................................................... 43 Table 4-23: Tall Timber PMA recommended PRV settings ........................................................................ 43 Table 4-24: Summary of PMA maximum pressures ................................................................................... 44 Table 4-25: Summary of infrastructure costs .............................................................................................. 44 Table 5-1: Summary of average pressures ............................................................................................... 45 Table 5-2: Summary of cost benefit analysis ............................................................................................ 45 Table 6-1: Capital Works for Logan South pressure management .......................................................... 47
APPENDICES
Appendix A Figures Appendix B Desired Standards of Service
90-12-76 Date issued: 05/12/2014 Page 5 of 62 Rev: 1
Logan South Water Supply Pressure Management - Detailed Planning
Document Number: 7600-000-P-REP-PL-8230
ABBREVIATIONS
AD Average Day
AHD Australian Height Datum
AZP Average zone pressure
CP Critical point
Council Logan City Council
DMA District metered area
DSS Desired standards of service
DTMR Department of Transport and Main Roads
EP Equivalent Person
FF Fire Flow
GIS Geographic Information System
IDM Infrastructure Demand Model
ILI Infrastructure Leakage Index
HGL Hydraulic Grade Line
LAPMET Leakage and Pressure Management Evaluation and Targeting
LWA Logan Water Alliance
MOL Minimum operating level
PH Peak Hour
PLMP Pressure and Leakage Management Program
PM Pressure management
PMA Pressure Managed Area
PRV Pressure reducing valve
PRI Primary inlet
PS Pump station
QFRS Queensland Fire and Rescue Services
SCADA Supervisory Control and Data Acquisition
SEC Secondary inlet
90-12-76 Date issued: 05/12/2014 Page 6 of 62 Rev: 1
Logan South Water Supply Pressure Management - Detailed Planning
Document Number: 7600-000-P-REP-PL-8230
SEQ South East Queensland
SRWP Southern Regional Water Pipeline
TWL Top water level
UARL Unavoidable Average Real Loss
WDS Water development services (team)
WSZ Water supply zone
WSA Water supply area
90-12-76 Date issued: 05/12/2014 Page 7 of 62 Rev: 1
Logan South Water Supply Pressure Management - Detailed Planning
Document Number: 7600-000-P-REP-PL-8230
EXECUTIVE SUMMARY
The benefits of pressure and leakage management are well documented and have historically provided cost
effective outcomes to managing maximum pressures in a water supply zone. These benefits include:
• reduced water loss
• reduced mains bursts
• operational cost savings
Recent planning has identified that significant areas of the Logan South network currently experience
pressures in excess of DSS maximum (80m) and target pressures (55m).
The objective of this Task was to undertake detailed planning investigations to identify cost effective
opportunities to implement pressure reduction and leakage management in the Logan South water supply
district which would provide a net benefit to Council.
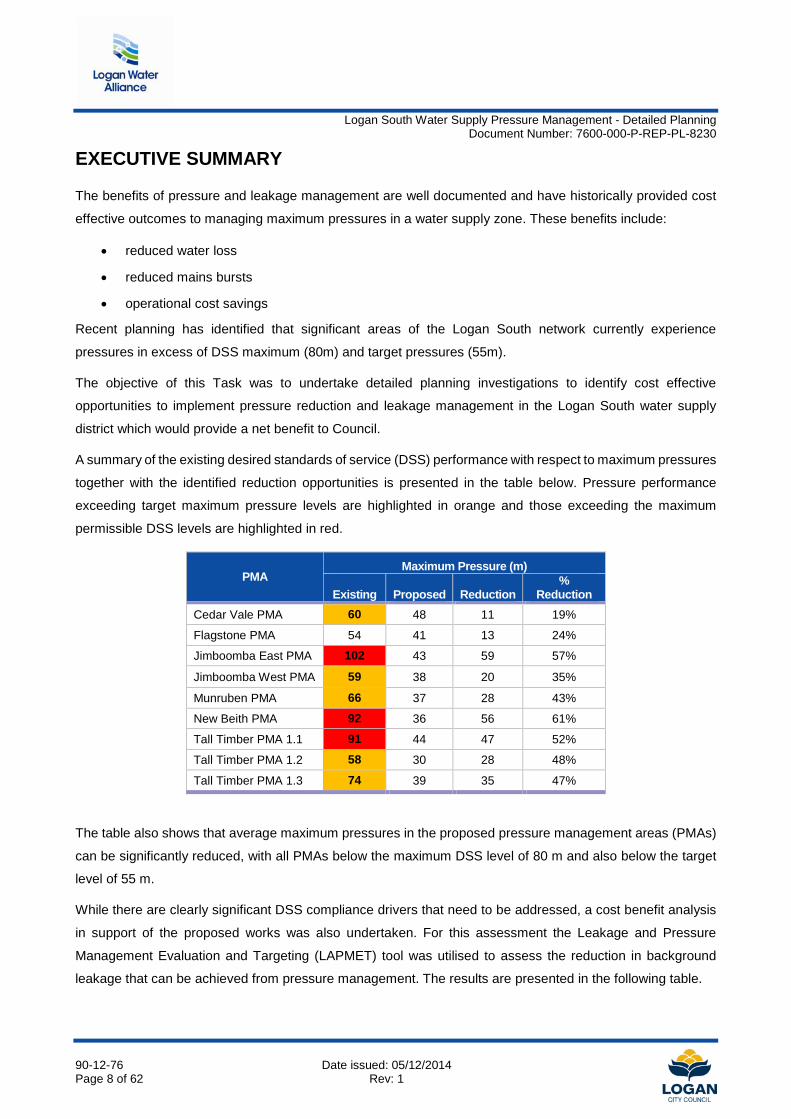
A summary of the existing desired standards of service (DSS) performance with respect to maximum pressures
together with the identified reduction opportunities is presented in the table below. Pressure performance
exceeding target maximum pressure levels are highlighted in orange and those exceeding the maximum
permissible DSS levels are highlighted in red.
PMA Maximum Pressure (m)
Existing Proposed Reduction %
Reduction Cedar Vale PMA 60 48 11 19%
Flagstone PMA 54 41 13 24%
Jimboomba East PMA 102 43 59 57%
Jimboomba West PMA 59 38 20 35%
Munruben PMA 66 37 28 43%
New Beith PMA 92 36 56 61%
Tall Timber PMA 1.1 91 44 47 52%
Tall Timber PMA 1.2 58 30 28 48%
Tall Timber PMA 1.3 74 39 35 47%
The table also shows that average maximum pressures in the proposed pressure management areas (PMAs)
can be significantly reduced, with all PMAs below the maximum DSS level of 80 m and also below the target
level of 55 m.
While there are clearly significant DSS compliance drivers that need to be addressed, a cost benefit analysis
in support of the proposed works was also undertaken. For this assessment the Leakage and Pressure
Management Evaluation and Targeting (LAPMET) tool was utilised to assess the reduction in background
leakage that can be achieved from pressure management. The results are presented in the following table.
90-12-76 Date issued: 05/12/2014 Page 8 of 62 Rev: 1
Logan South Water Supply Pressure Management - Detailed Planning
Document Number: 7600-000-P-REP-PL-8230
PMA Cost ($2014) Existing Av. Pressure (m)
Reduction (m)
Annual Savings ($)
Payback Period (yrs)
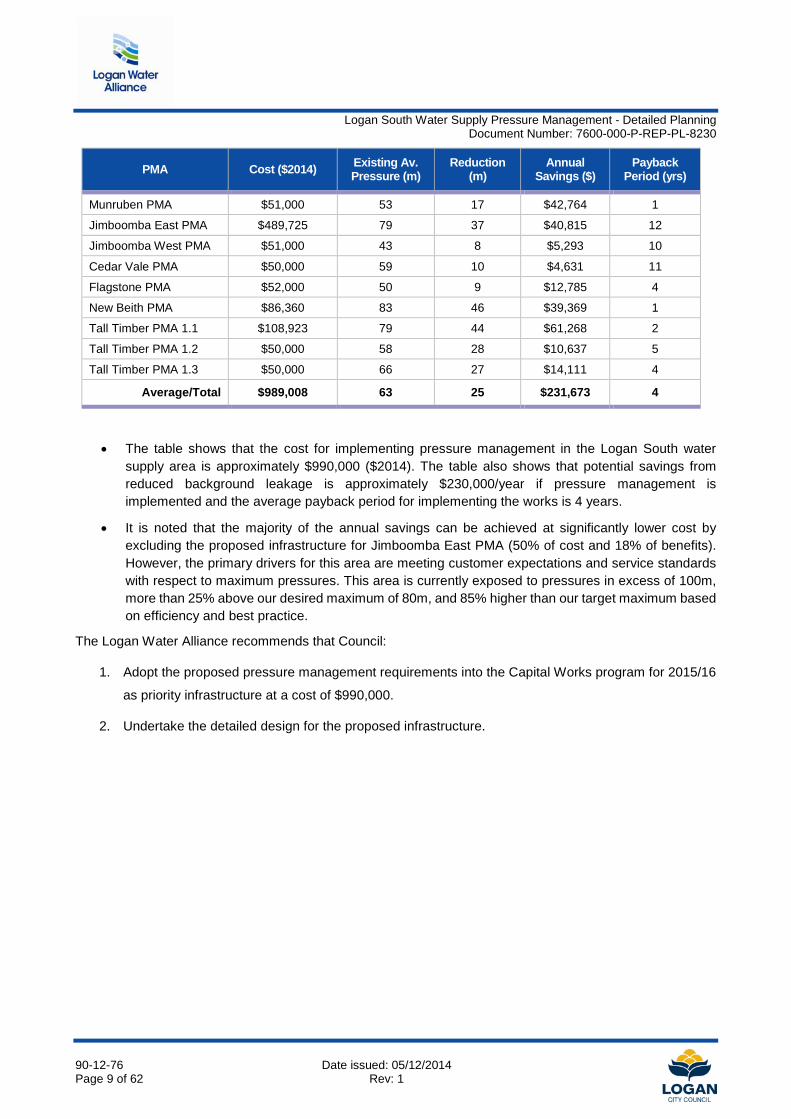
Munruben PMA $51,000 53 17 $42,764 1
Jimboomba East PMA $489,725 79 37 $40,815 12
Jimboomba West PMA $51,000 43 8 $5,293 10
Cedar Vale PMA $50,000 59 10 $4,631 11
Flagstone PMA $52,000 50 9 $12,785 4
New Beith PMA $86,360 83 46 $39,369 1
Tall Timber PMA 1.1 $108,923 79 44 $61,268 2
Tall Timber PMA 1.2 $50,000 58 28 $10,637 5
Tall Timber PMA 1.3 $50,000 66 27 $14,111 4
Average/Total $989,008 63 25 $231,673 4
• The table shows that the cost for implementing pressure management in the Logan South water supply area is approximately $990,000 ($2014). The table also shows that potential savings from reduced background leakage is approximately $230,000/year if pressure management is implemented and the average payback period for implementing the works is 4 years.
• It is noted that the majority of the annual savings can be achieved at significantly lower cost by excluding the proposed infrastructure for Jimboomba East PMA (50% of cost and 18% of benefits). However, the primary drivers for this area are meeting customer expectations and service standards with respect to maximum pressures. This area is currently exposed to pressures in excess of 100m, more than 25% above our desired maximum of 80m, and 85% higher than our target maximum based on efficiency and best practice.
The Logan Water Alliance recommends that Council:
1. Adopt the proposed pressure management requirements into the Capital Works program for 2015/16
as priority infrastructure at a cost of $990,000.
2. Undertake the detailed design for the proposed infrastructure.
90-12-76 Date issued: 05/12/2014 Page 9 of 62 Rev: 1
Logan South Water Supply Pressure Management - Detailed Planning
Document Number: 7600-000-P-REP-PL-8230
1. INTRODUCTION
1.1 Objectives The objective of this Task was to undertake detailed planning investigations to identify opportunities to
implement pressure reduction and leakage management in the Logan South water supply district.
1.2 Scope The scope of this technical investigation included the following:
• a verification of model inputs against latest operational data
• a review of current system performance against desired standards of service (DSS)
• consideration of future network growth in the catchment
• assessment of pressure management opportunities
• cost benefit assessment including Leakage and Pressure Management Evaluation and Targeting (LAPMET) analysis
1.3 Business Drivers The principal business drivers for this study are:
• Compliance. Based on hydraulic modelling outputs the percentage of Logan South customers exposed to pressures in excess of maximum DSS levels are:
o 22% above maximum DSS pressures (80m)
• Improvement. Excessive system pressures can be directly linked to high burst frequencies and increased water loss through leakage. Proactive pressure management will reduce:
o bulk water costs from leakage savings
o operational expenditure on leakage management
• Improvement. Based on hydraulic modelling outputs the percentage of Logan South customers exposed to pressures in excess of target DSS levels are:
o 46% above target (55m) and below maximum DSS pressures (80m)
90-12-76 Date issued: 05/12/2014 Page 10 of 62 Rev: 1
Logan South Water Supply Pressure Management - Detailed Planning
Document Number: 7600-000-P-REP-PL-8230
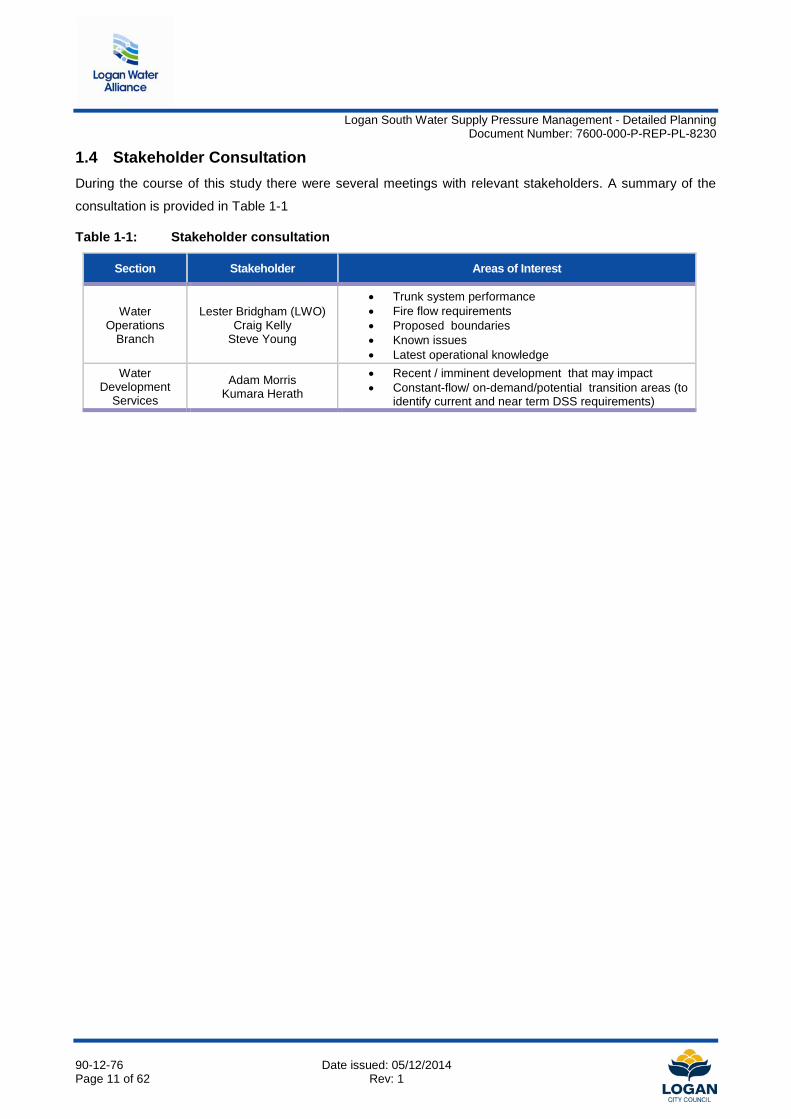
1.4 Stakeholder Consultation During the course of this study there were several meetings with relevant stakeholders. A summary of the
consultation is provided in Table 1-1
Table 1-1: Stakeholder consultation
Section Stakeholder Areas of Interest
Water Operations
Branch
Lester Bridgham (LWO) Craig Kelly
Steve Young
• Trunk system performance • Fire flow requirements • Proposed boundaries • Known issues • Latest operational knowledge
Water Development
Services
Adam Morris Kumara Herath
• Recent / imminent development that may impact • Constant-flow/ on-demand/potential transition areas (to
identify current and near term DSS requirements)
90-12-76 Date issued: 05/12/2014 Page 11 of 62 Rev: 1
Logan South Water Supply Pressure Management - Detailed Planning
Document Number: 7600-000-P-REP-PL-8230
2. PLANNING CONTEXT
2.1 Background Logan's existing pressure and leakage management program (PLMP) was substantially implemented across
the Logan North water supply zone (WSZ) between 2008 and 2011. Following on from this, pressure and
leakage management is scheduled to be implemented across the Logan East WSZ in 2014.
The benefits of pressure and leakage management are well documented and have historically provided cost
effective outcomes to managing maximum pressures in a water supply zone. These benefits include:
• reduced water loss
• reduced mains bursts
• operational cost savings
Recent planning has identified that significant areas of the Logan South network currently experience
pressures in excess of DSS maximum (80m) and target pressures (55m).
It was therefore prudent to investigate the potential for pressure reduction measures to be implemented in
these high pressure areas in order to realise the benefits of pressure and leakage management in the Logan
South network and improve network performance against DSS.
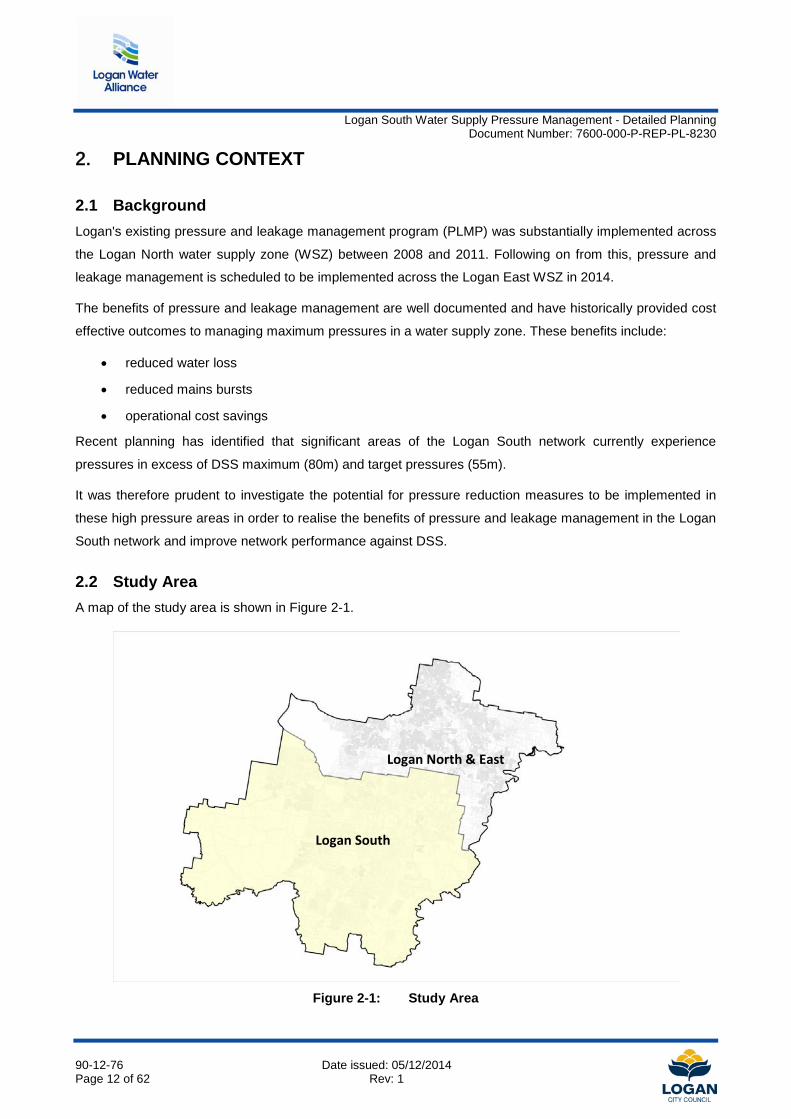
2.2 Study Area A map of the study area is shown in Figure 2-1.
Figure 2-1: Study Area
Logan South
Logan North & East
90-12-76 Date issued: 05/12/2014 Page 12 of 62 Rev: 1
Logan South Water Supply Pressure Management - Detailed Planning
Document Number: 7600-000-P-REP-PL-8230
2.3 Existing Situation The primary source of supply to the Logan South water supply network is currently provided by the Southern
Regional Water Pipeline (SRWP) Teviot Road offtake (located in Greenbank), with support provided as
required through a pressure controlled connection from the Logan North water supply network at the site of
the disused Granger Road pump station. Water is supplied from the SRWP Teviot Road offtake to the Pub
Lane reservoir via a 300 mm trunk main, and to the rest of the southern Logan South network South Maclean
pump station. This site is currently undergoing a pump upgrade and pipework rationalisation exercise managed
by Council's Water Operations Branch and supported by the Logan Water Alliance. The support work
undertaken includes a surge analysis of the trunk network upstream and downstream of the South Maclean
Pump Station which has identified potential for significant surge pressures impacting on the network and
customers. The potential impact on system pressures and any mitigating works required has not been included
in the scope of this Task.
While the Round Mountain reservoir was until recently filled via the SRWP Teviot Road offtake and New Beith
375 mm trunk main, a new dedicated 600 mm trunk main and SRWP connection at Pub Lane was
commissioned in late November 2014. As further network connections are commissioned the Pub Lane SRWP
connection and Round mountain reservoir will support the entire Logan South network and the Teviot Road
connection will be taken offline.
The Spring Mountain and New Beith water supply areas are currently supplied from the Spring Mountain
reservoir, which is in turn supplied from the Round Mountain reservoir via the Pub Lane and Lyndale pump
stations. The Pub Lane pump station is also planned to be upgraded in late 2014. This will consolidate the
pumping currently undertaken by the existing Pub Lane and Lyndale pumps and also mitigate the need for
additional pumping at Tall Timber Road.
Over 60% of the connected properties in Logan South are provided with a constant flow or restricted service.
The remaining properties have a full on-demand service. All future connection excepting some minor infill are
anticipated to be on-demand.
2.4 Previous Studies The following planning studies have been used to inform this task:
• Logan East Water Supply DMA Management & Fire Flow Augmentations Detailed Planning (LWA, Sep.2013). Task No.90-11-92
o The objective of this task was to undertake detailed planning of the proposed infrastructure required to implement and manage District Metered Areas (DMAs) and pressure management in Logan East while maintaining adequate levels of fire flow protection
• Logan South Flow Monitoring, Project Development & Detailed Planning (LWA, Sep.2013). Task No.90-12-05
o The objective of this task was to improve flow monitoring in Logan South water supply network by installing flow meters at strategic locations on the trunk main network to create DMAs and bulk metered zones. This monitoring would then facilitate demand and leakage management.
90-12-76 Date issued: 05/12/2014 Page 13 of 62 Rev: 1
Logan South Water Supply Pressure Management - Detailed Planning
Document Number: 7600-000-P-REP-PL-8230
3. METHODOLOGY The methodology adopted for this project focussed on the following four key areas:
• Model Verification
o The hydraulic model was checked against the latest GIS data. This was to ensure that all updates and corrections to the GIS data had been incorporated into the model
o The demand category at each node in the model was checked against the GIS data to ensure that the correct fire flows had been allocated
o The latest DSS was also adopted into the model
• Hydraulic performance was verified against ClearSCADA data (where available)
• Identification of pressure management opportunities
o An initial outline of proposed pressure management boundaries was prepared for discussion with Council's Water Operations and Water Development Services (WDS) teams
o The proposed pressure management areas (PMAs) and pipeline augmentations were presented and discussed. The feedback obtained from the meetings was recorded and used to finalise planned works
o The proposed boundaries and pressure reduction valve (PRV) locations were also reviewed by considering various options to minimise pipeline augmentations required to achieve DSS. Dual inlets were considered to provide fire flow requirements or redundant supplies that meet peak hour demands where appropriate.
• The GIS information was used to identify suitable locations for the proposed infrastructure in a road verge or council park area. Locations that fell within Department of Transport and Main Roads (DTMR) road corridors were avoided.
3.1 Assumptions 3.1.1 Infrastructure Cost Rates Unit rates were used to determine the costs of pipeline augmentations and boundary valves. PRV/telemetry
costs were based on market rates obtained for the current delivery of the Logan East PLMP by the Logan
Water Alliance (Work Package No. 7638).
3.1.2 Bulk Water Costs For the purposes of the cost benefit analysis the 2015-16 bulk water cost of $3.062/kL was assumed for the
LAPMAT analysis.
3.1.3 DMA vs PMA For clarity in this report all the new pressure managed areas are designated as PMAs only, however based on
the Logan East PLMP and the outcomes for similar small pressure management only sites, a metered
arrangement with a dual pilot PRV allowing moderate flow modulation is likely. This would allow all
appropriately sized PMAs to be monitored as DMAs.
It is anticipated that the larger areas and those with dual feeds may be upgraded to full flow modulation DMA
status in consultation with Ops as part of the preliminary design process.
90-12-76 Date issued: 05/12/2014 Page 14 of 62 Rev: 1
Logan South Water Supply Pressure Management - Detailed Planning
Document Number: 7600-000-P-REP-PL-8230
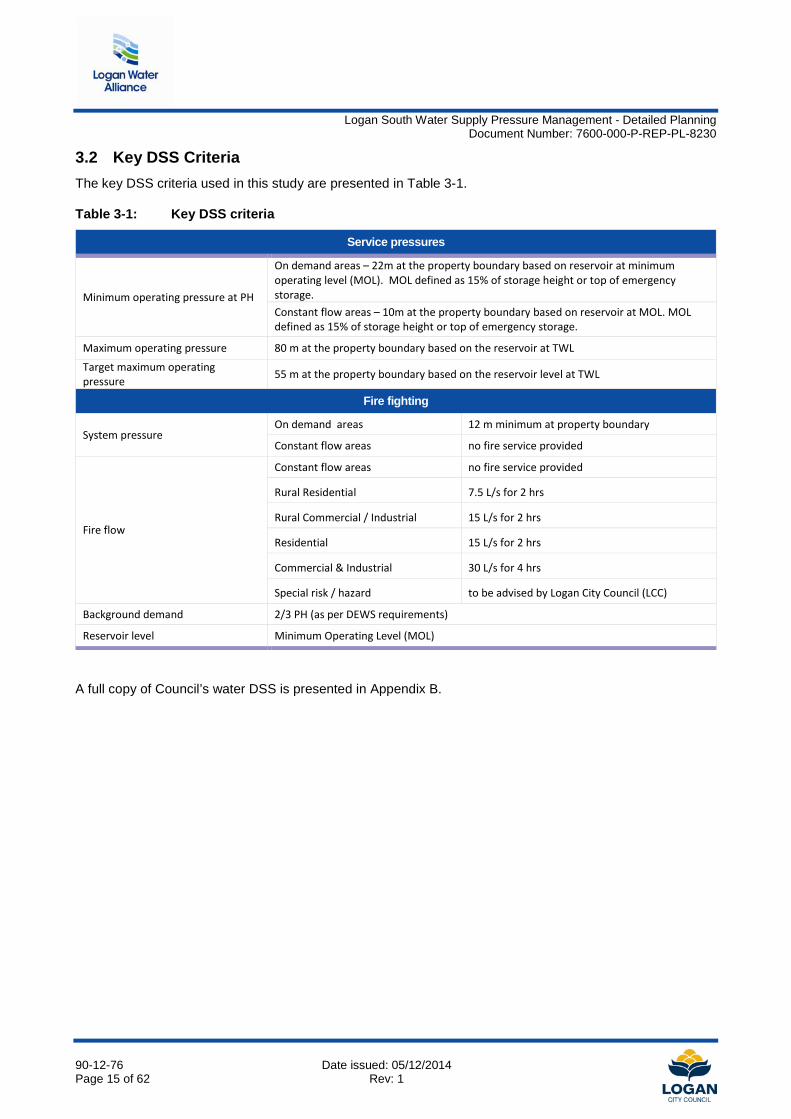
3.2 Key DSS Criteria The key DSS criteria used in this study are presented in Table 3-1.
Table 3-1: Key DSS criteria
Service pressures
Minimum operating pressure at PH
On demand areas – 22m at the property boundary based on reservoir at minimum operating level (MOL). MOL defined as 15% of storage height or top of emergency storage. Constant flow areas – 10m at the property boundary based on reservoir at MOL. MOL defined as 15% of storage height or top of emergency storage.
Maximum operating pressure 80 m at the property boundary based on the reservoir at TWL
Target maximum operating pressure 55 m at the property boundary based on the reservoir level at TWL
Fire fighting
System pressure On demand areas 12 m minimum at property boundary
Constant flow areas no fire service provided
Fire flow
Constant flow areas no fire service provided
Rural Residential 7.5 L/s for 2 hrs
Rural Commercial / Industrial 15 L/s for 2 hrs
Residential 15 L/s for 2 hrs
Commercial & Industrial 30 L/s for 4 hrs
Special risk / hazard to be advised by Logan City Council (LCC)
Background demand 2/3 PH (as per DEWS requirements)
Reservoir level Minimum Operating Level (MOL)
A full copy of Council’s water DSS is presented in Appendix B.
90-12-76 Date issued: 05/12/2014 Page 15 of 62 Rev: 1
Logan South Water Supply Pressure Management - Detailed Planning
Document Number: 7600-000-P-REP-PL-8230
4. NETWORK HYDRAULIC ANALYSIS This chapter will document the detailed assessment undertaken for each of the network areas currently failing
DSS target or maximum pressure criteria that have significant potential for pressure management.
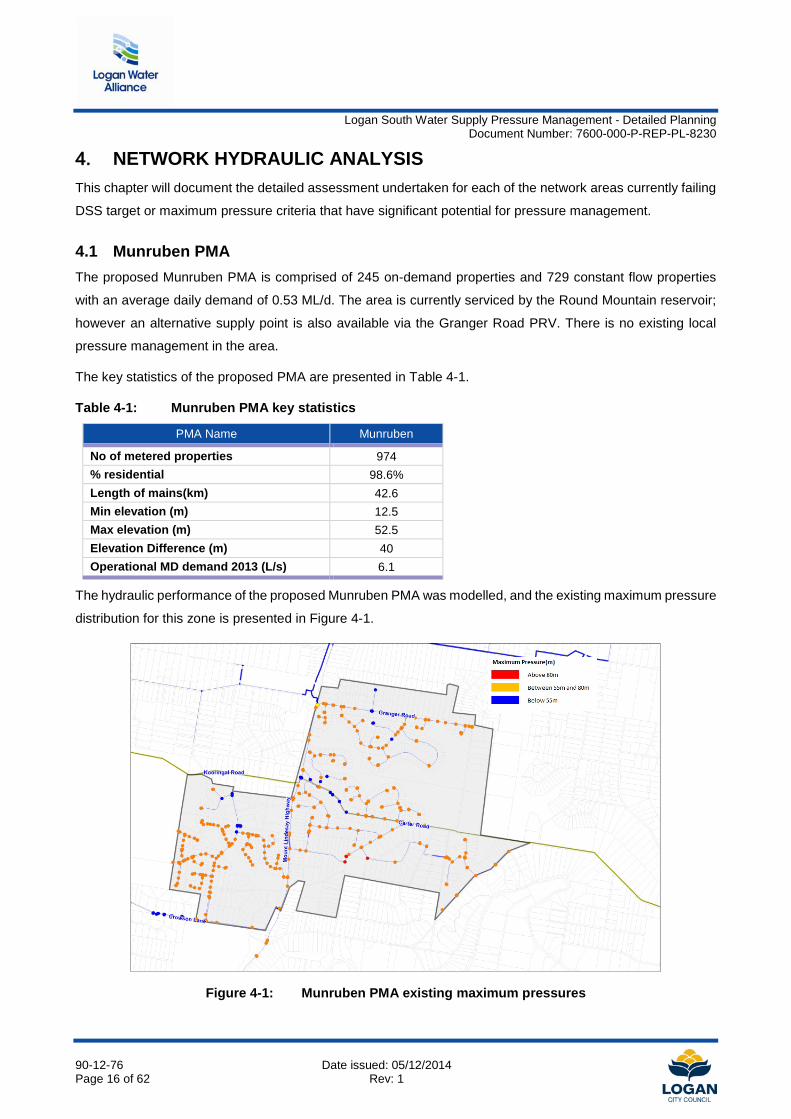
4.1 Munruben PMA The proposed Munruben PMA is comprised of 245 on-demand properties and 729 constant flow properties
with an average daily demand of 0.53 ML/d. The area is currently serviced by the Round Mountain reservoir;
however an alternative supply point is also available via the Granger Road PRV. There is no existing local
pressure management in the area.
The key statistics of the proposed PMA are presented in Table 4-1.
Table 4-1: Munruben PMA key statistics
PMA Name Munruben
No of metered properties 974 % residential 98.6% Length of mains(km) 42.6 Min elevation (m) 12.5 Max elevation (m) 52.5 Elevation Difference (m) 40 Operational MD demand 2013 (L/s) 6.1
The hydraulic performance of the proposed Munruben PMA was modelled, and the existing maximum pressure
distribution for this zone is presented in Figure 4-1.
Figure 4-1: Munruben PMA existing maximum pressures
90-12-76 Date issued: 05/12/2014 Page 16 of 62 Rev: 1
Logan South Water Supply Pressure Management - Detailed Planning
Document Number: 7600-000-P-REP-PL-8230
Figure 4-1 indicates significant areas of Munruben experience pressures above the target maximum of 55m,
and a small number above the maximum DSS allowance of 80m. This provides a significant opportunity for
pressure management.
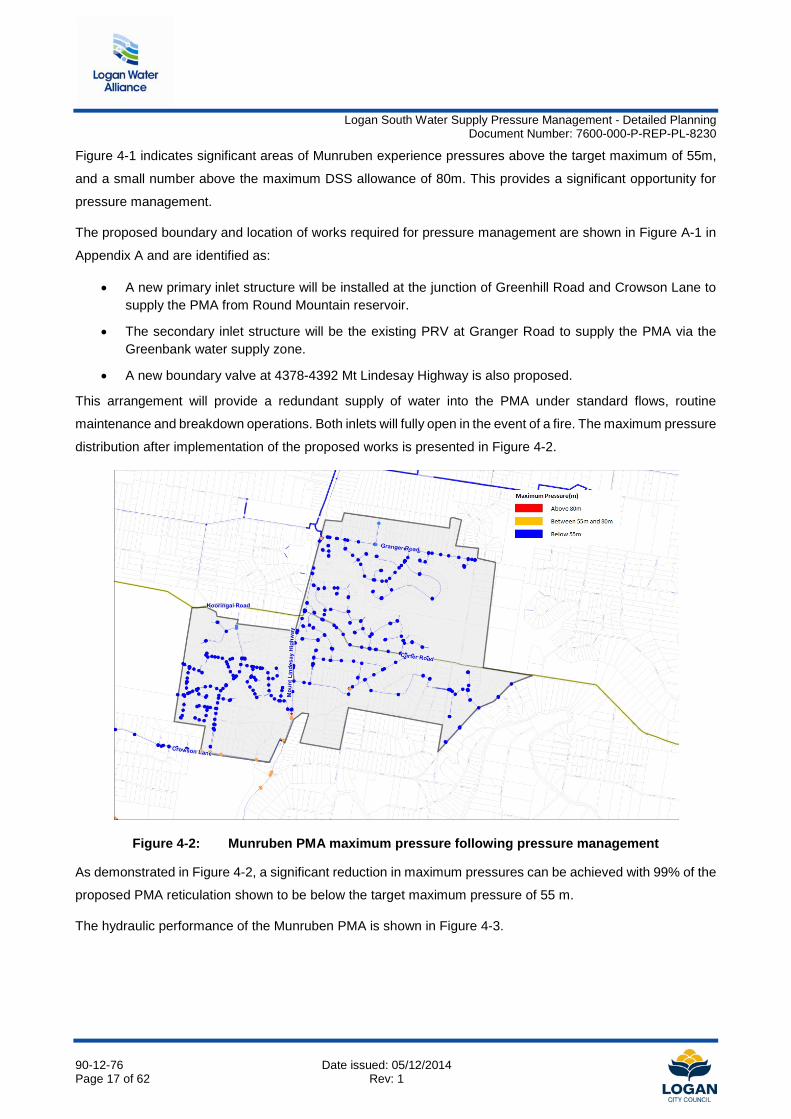
The proposed boundary and location of works required for pressure management are shown in Figure A-1 in
Appendix A and are identified as:
• A new primary inlet structure will be installed at the junction of Greenhill Road and Crowson Lane to supply the PMA from Round Mountain reservoir.
• The secondary inlet structure will be the existing PRV at Granger Road to supply the PMA via the Greenbank water supply zone.
• A new boundary valve at 4378-4392 Mt Lindesay Highway is also proposed.
This arrangement will provide a redundant supply of water into the PMA under standard flows, routine
maintenance and breakdown operations. Both inlets will fully open in the event of a fire. The maximum pressure
distribution after implementation of the proposed works is presented in Figure 4-2.
Figure 4-2: Munruben PMA maximum pressure following pressure management
As demonstrated in Figure 4-2, a significant reduction in maximum pressures can be achieved with 99% of the
proposed PMA reticulation shown to be below the target maximum pressure of 55 m.
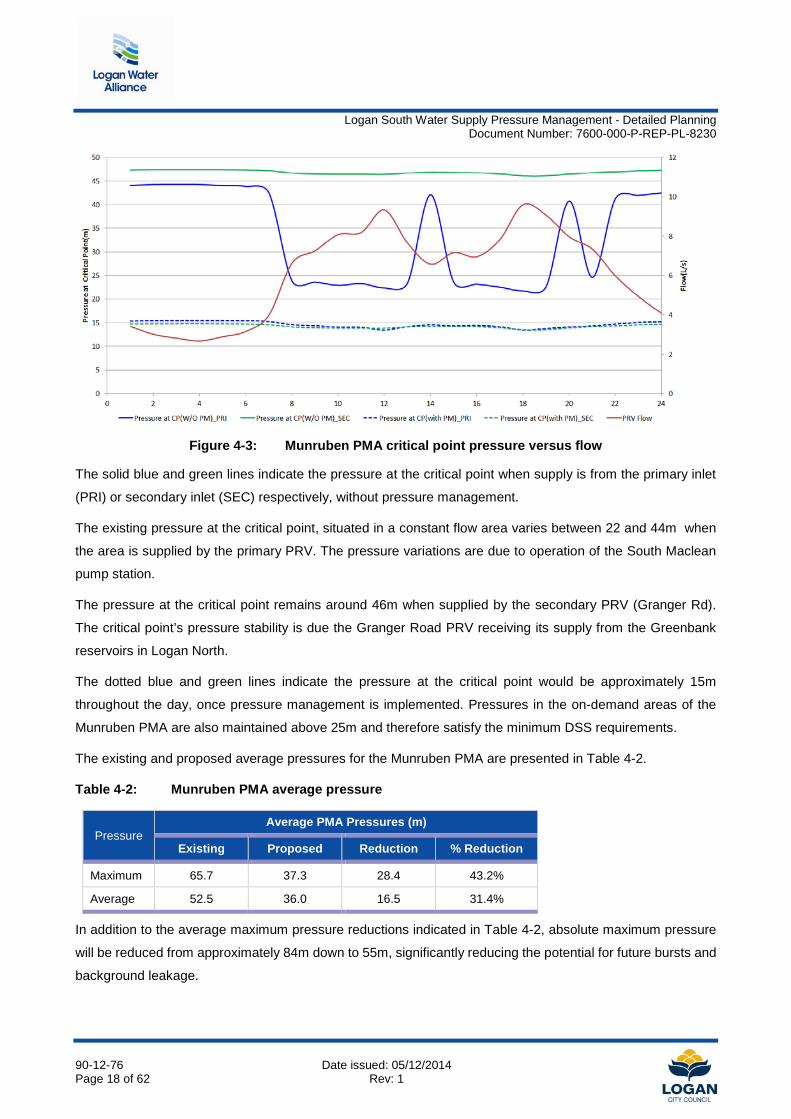
The hydraulic performance of the Munruben PMA is shown in Figure 4-3.
90-12-76 Date issued: 05/12/2014 Page 17 of 62 Rev: 1
Logan South Water Supply Pressure Management - Detailed Planning
Document Number: 7600-000-P-REP-PL-8230
Figure 4-3: Munruben PMA critical point pressure versus flow
The solid blue and green lines indicate the pressure at the critical point when supply is from the primary inlet
(PRI) or secondary inlet (SEC) respectively, without pressure management.
The existing pressure at the critical point, situated in a constant flow area varies between 22 and 44m when
the area is supplied by the primary PRV. The pressure variations are due to operation of the South Maclean
pump station.
The pressure at the critical point remains around 46m when supplied by the secondary PRV (Granger Rd).
The critical point’s pressure stability is due the Granger Road PRV receiving its supply from the Greenbank
reservoirs in Logan North.
The dotted blue and green lines indicate the pressure at the critical point would be approximately 15m
throughout the day, once pressure management is implemented. Pressures in the on-demand areas of the
Munruben PMA are also maintained above 25m and therefore satisfy the minimum DSS requirements.
The existing and proposed average pressures for the Munruben PMA are presented in Table 4-2.
Table 4-2: Munruben PMA average pressure
Pressure Average PMA Pressures (m)
Existing Proposed Reduction % Reduction
Maximum 65.7 37.3 28.4 43.2%
Average 52.5 36.0 16.5 31.4%
In addition to the average maximum pressure reductions indicated in Table 4-2, absolute maximum pressure
will be reduced from approximately 84m down to 55m, significantly reducing the potential for future bursts and
background leakage.
90-12-76 Date issued: 05/12/2014 Page 18 of 62 Rev: 1
Logan South Water Supply Pressure Management - Detailed Planning
Document Number: 7600-000-P-REP-PL-8230
The recommended pressure management settings for the primary and secondary PRVs are displayed in Table
4-3.
Table 4-3: Munruben PMA recommended PRV settings
Flow step (%) Flow rate (L/s)
PRV setting at Primary (m)
PRV setting at Secondary (m)
Maximum Standard flow 9.6 36 65
Fire flow applied 15 Fully open Fully open
4.2 Jimboomba East PMA The proposed Jimboomba East PMA is comprised of 361 on-demand and 88 constant flow properties with an
average daily demand of 0.74 ML/d. There is also a standpipe located at Cerina Circuit for water carrier use.
The available flow rate at this standpipe has been limited via an orifice plate to 15 L/s. The area can be supplied
directly off a 200 mm trunk main from Round Mountain reservoir via St Jude Court pump station. This area
can also be supplied via the South Maclean pump station/Travis Road reservoir system, which is as the worst
case for maximum pressures, is the modelled scenario. The proposed PMA can be supplied via either
arrangement without the need for any additional infrastructure. There is no existing pressure management in
the area.
The key statistics for the proposed PMA are presented in Table 4-4.
Table 4-4: Jimboomba East PMA key statistics
PMA Name Jimboomba East
No of metered properties 449 % residential 53% Length of mains(km) 16.6 Min elevation (m) 22.5 Max elevation (m) 47.9 Elevation Difference (m) 25.4 Operational MD demand 2013 (L/s) 8.5
The hydraulic performance of the proposed Jimboomba East PMA was modelled, and the existing maximum
pressure distribution for this zone is presented in Figure 4-4.
90-12-76 Date issued: 05/12/2014 Page 19 of 62 Rev: 1
Logan South Water Supply Pressure Management - Detailed Planning
Document Number: 7600-000-P-REP-PL-8230
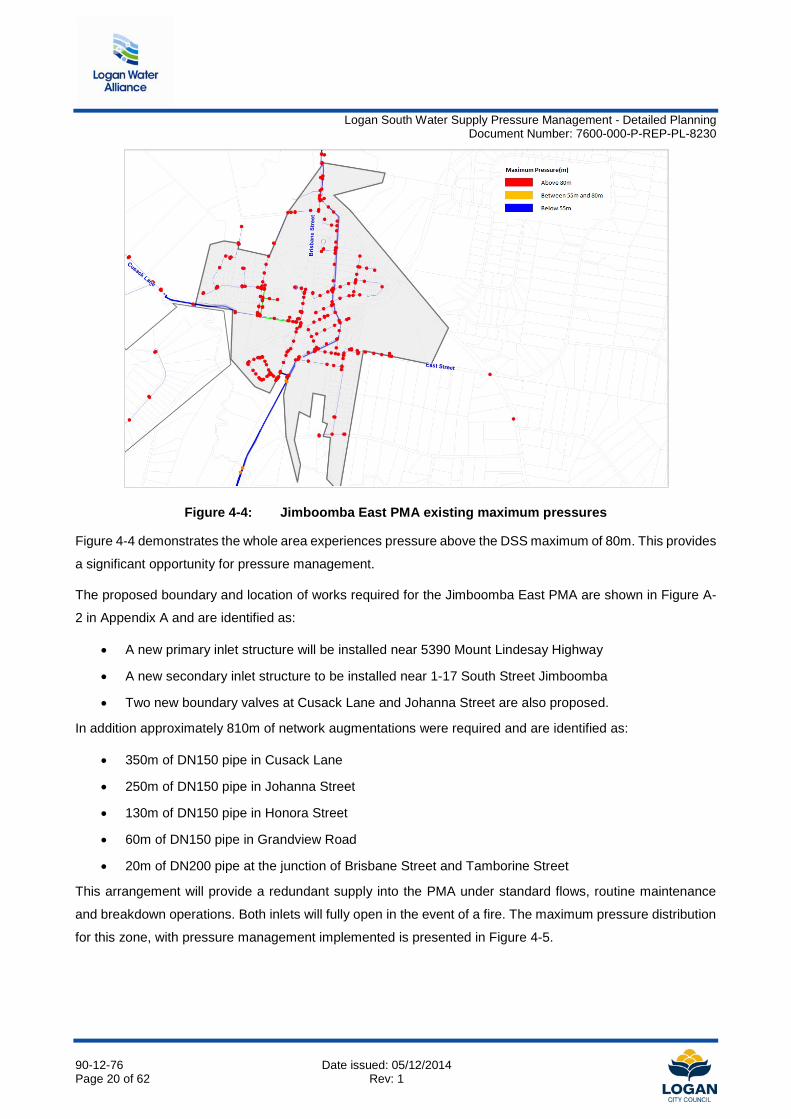
Figure 4-4: Jimboomba East PMA existing maximum pressures
Figure 4-4 demonstrates the whole area experiences pressure above the DSS maximum of 80m. This provides
a significant opportunity for pressure management.
The proposed boundary and location of works required for the Jimboomba East PMA are shown in Figure A-
2 in Appendix A and are identified as:
• A new primary inlet structure will be installed near 5390 Mount Lindesay Highway
• A new secondary inlet structure to be installed near 1-17 South Street Jimboomba
• Two new boundary valves at Cusack Lane and Johanna Street are also proposed.
In addition approximately 810m of network augmentations were required and are identified as:
• 350m of DN150 pipe in Cusack Lane
• 250m of DN150 pipe in Johanna Street
• 130m of DN150 pipe in Honora Street
• 60m of DN150 pipe in Grandview Road
• 20m of DN200 pipe at the junction of Brisbane Street and Tamborine Street
This arrangement will provide a redundant supply into the PMA under standard flows, routine maintenance
and breakdown operations. Both inlets will fully open in the event of a fire. The maximum pressure distribution
for this zone, with pressure management implemented is presented in Figure 4-5.
90-12-76 Date issued: 05/12/2014 Page 20 of 62 Rev: 1
Logan South Water Supply Pressure Management - Detailed Planning
Document Number: 7600-000-P-REP-PL-8230
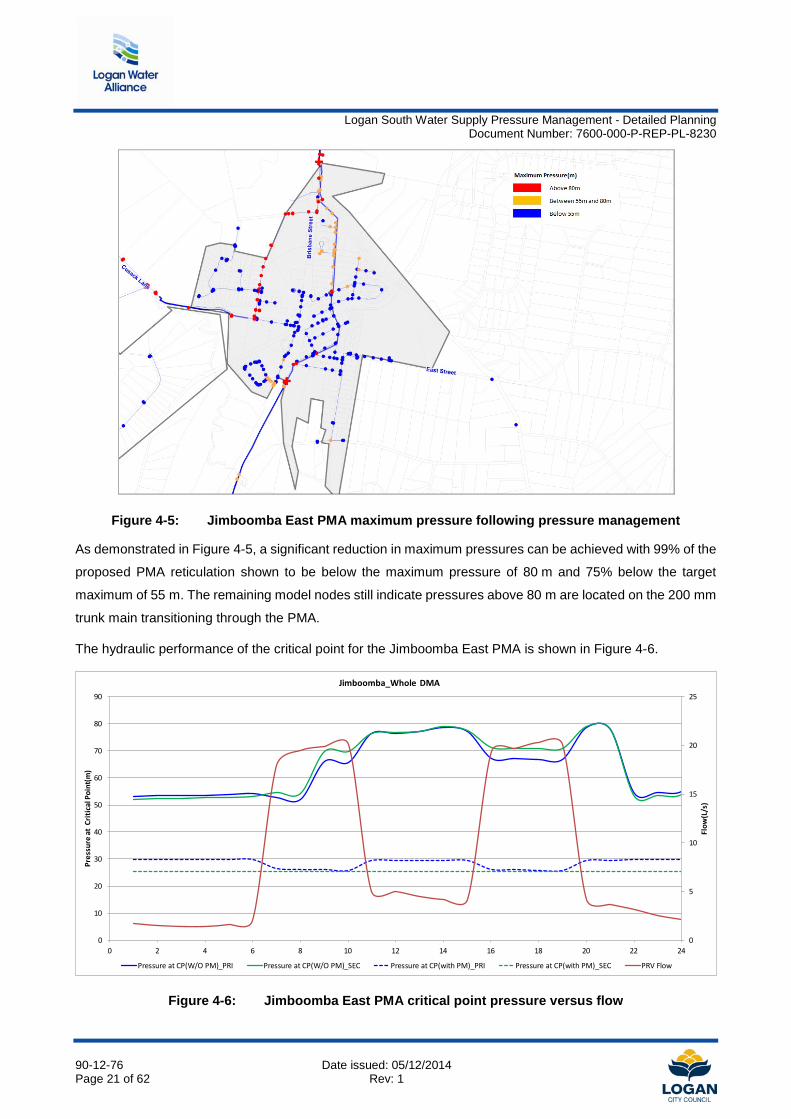
Figure 4-5: Jimboomba East PMA maximum pressure following pressure management
As demonstrated in Figure 4-5, a significant reduction in maximum pressures can be achieved with 99% of the
proposed PMA reticulation shown to be below the maximum pressure of 80 m and 75% below the target
maximum of 55 m. The remaining model nodes still indicate pressures above 80 m are located on the 200 mm
trunk main transitioning through the PMA.
The hydraulic performance of the critical point for the Jimboomba East PMA is shown in Figure 4-6.
Figure 4-6: Jimboomba East PMA critical point pressure versus flow
0
5
10
15
20
25
0
10
20
30
40
50
60
70
80
90
0 2 4 6 8 10 12 14 16 18 20 22 24
Flow
(L/s
)
Pres
sure
at
Criti
cal P
oint
(m)
Jimboomba_Whole DMA
Pressure at CP(W/O PM)_PRI Pressure at CP(W/O PM)_SEC Pressure at CP(with PM)_PRI Pressure at CP(with PM)_SEC PRV Flow
90-12-76 Date issued: 05/12/2014 Page 21 of 62 Rev: 1
Logan South Water Supply Pressure Management - Detailed Planning
Document Number: 7600-000-P-REP-PL-8230
The solid blue and green lines indicate the pressure at the critical point when supply is from the primary inlet
(PRI) or secondary inlet (SEC) respectively, without pressure management.
The existing pressure at the critical point, situated in an on-demand area, varies between 74m during low flow
periods, to 46 m during peak demand periods when the PMA is supplied by either PRV. The pressure variations
are due to operation of the South Maclean pump station.
The dotted blue and green lines indicate that the pressure at the critical point would be stabilised at
approximately 25m throughout the day, once pressure management is implemented and therefore satisfies
the minimum pressure DSS requirements.
The existing and proposed average pressures for the Jimboomba East PMA are presented in Table 4-5.
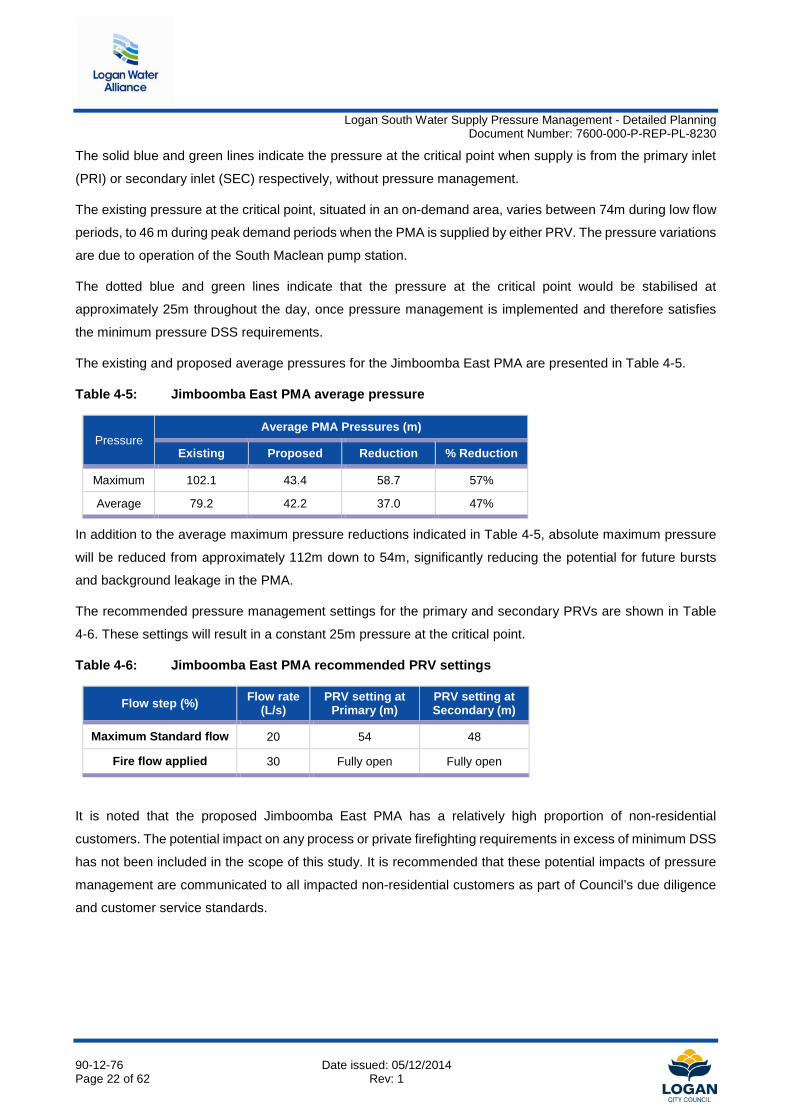
Table 4-5: Jimboomba East PMA average pressure
Pressure Average PMA Pressures (m)
Existing Proposed Reduction % Reduction
Maximum 102.1 43.4 58.7 57%
Average 79.2 42.2 37.0 47%
In addition to the average maximum pressure reductions indicated in Table 4-5, absolute maximum pressure
will be reduced from approximately 112m down to 54m, significantly reducing the potential for future bursts
and background leakage in the PMA.
The recommended pressure management settings for the primary and secondary PRVs are shown in Table
4-6. These settings will result in a constant 25m pressure at the critical point.
Table 4-6: Jimboomba East PMA recommended PRV settings
Flow step (%) Flow rate (L/s)
PRV setting at Primary (m)
PRV setting at Secondary (m)
Maximum Standard flow 20 54 48
Fire flow applied 30 Fully open Fully open
It is noted that the proposed Jimboomba East PMA has a relatively high proportion of non-residential
customers. The potential impact on any process or private firefighting requirements in excess of minimum DSS
has not been included in the scope of this study. It is recommended that these potential impacts of pressure
management are communicated to all impacted non-residential customers as part of Council’s due diligence
and customer service standards.
90-12-76 Date issued: 05/12/2014 Page 22 of 62 Rev: 1
Logan South Water Supply Pressure Management - Detailed Planning
Document Number: 7600-000-P-REP-PL-8230
4.3 Jimboomba West PMA The proposed Jimboomba West area is comprised of 353 constant flow properties with an average daily
demand of 0.09 ML/d. There are no on-demand properties within the proposed PMA boundary. The area is
currently supplied directly off a 200 mm trunk main from Round Mountain reservoir. There is no existing
pressure management in the area.
The key statistics for the proposed PMA are presented in Table 4-7.
Table 4-7: Jimboomba West PMA key statistics
PMA Name Jimboomba West
No of metered properties 353 % residential 100% Length of mains(km) 11.3 Min elevation (m) 26.1 Max elevation (m) 50.5 Elevation Difference (m) 24.4 Operational MD demand 2013 (L/s) 1
The hydraulic performance of the proposed Jimboomba West PMA was modelled, and the existing maximum
pressure distribution for this zone is presented in Figure 4-7.
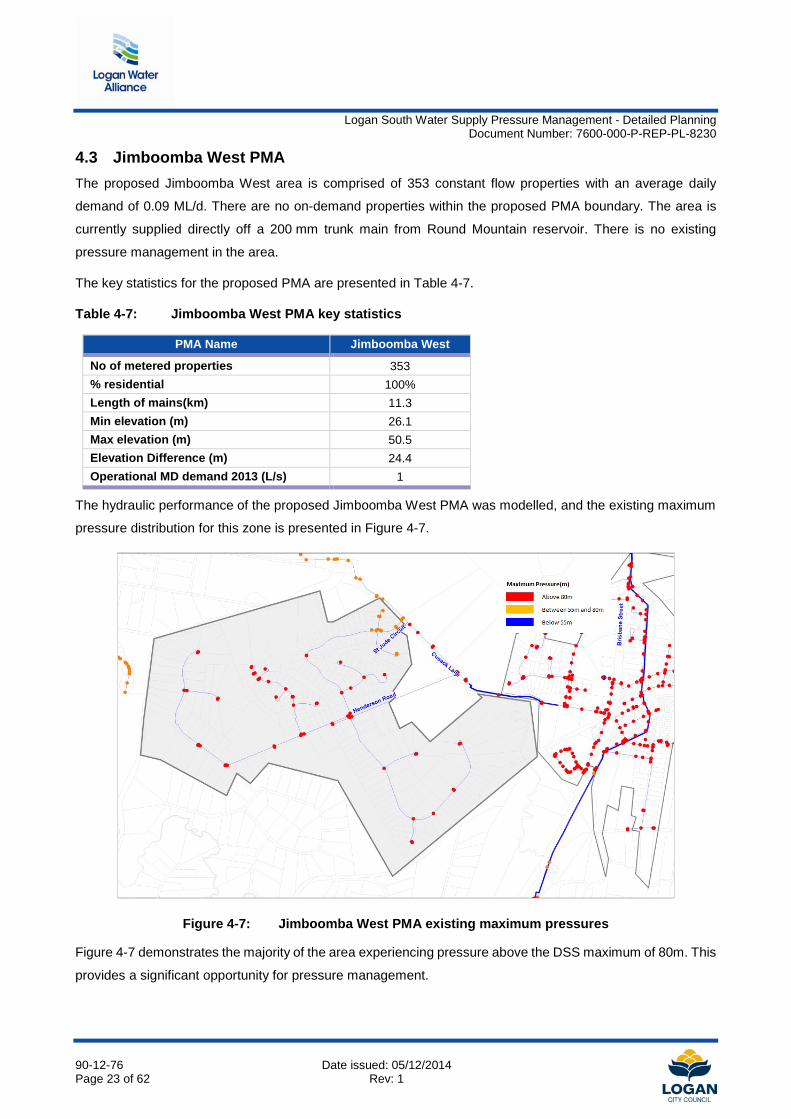
Figure 4-7: Jimboomba West PMA existing maximum pressures
Figure 4-7 demonstrates the majority of the area experiencing pressure above the DSS maximum of 80m. This
provides a significant opportunity for pressure management.
90-12-76 Date issued: 05/12/2014 Page 23 of 62 Rev: 1
Logan South Water Supply Pressure Management - Detailed Planning
Document Number: 7600-000-P-REP-PL-8230
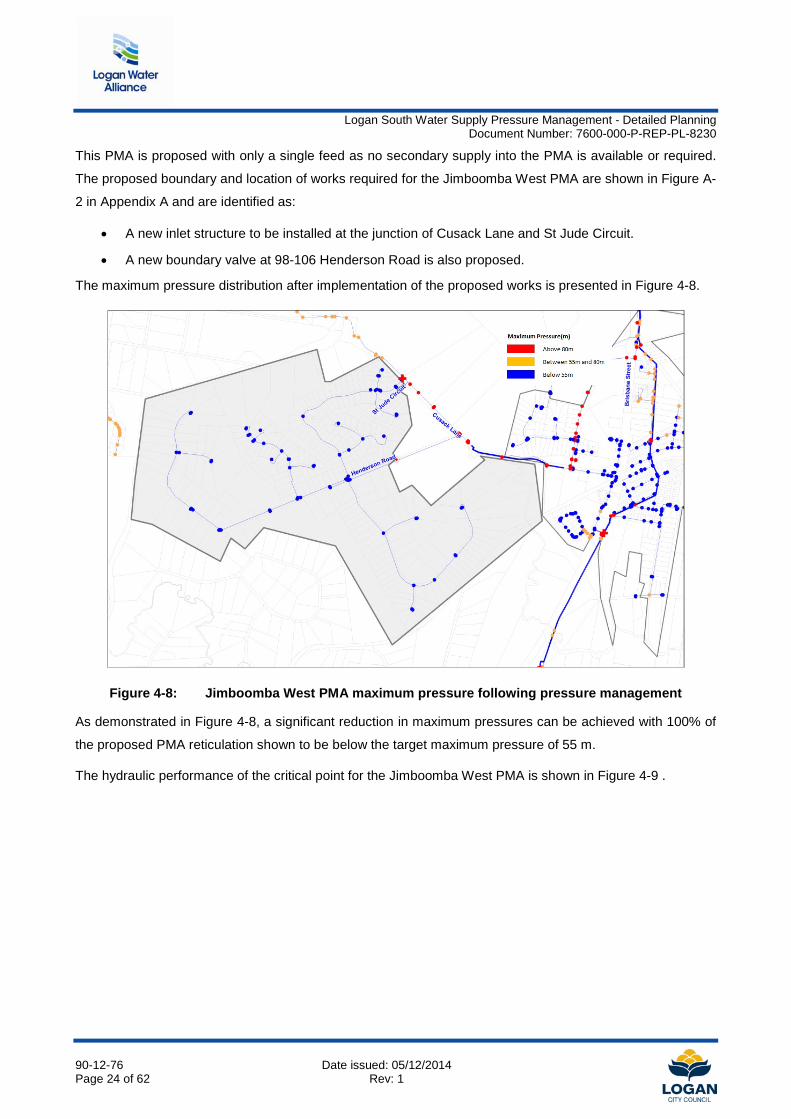
This PMA is proposed with only a single feed as no secondary supply into the PMA is available or required.
The proposed boundary and location of works required for the Jimboomba West PMA are shown in Figure A-
2 in Appendix A and are identified as:
• A new inlet structure to be installed at the junction of Cusack Lane and St Jude Circuit.
• A new boundary valve at 98-106 Henderson Road is also proposed.
The maximum pressure distribution after implementation of the proposed works is presented in Figure 4-8.
Figure 4-8: Jimboomba West PMA maximum pressure following pressure management
As demonstrated in Figure 4-8, a significant reduction in maximum pressures can be achieved with 100% of
the proposed PMA reticulation shown to be below the target maximum pressure of 55 m.
The hydraulic performance of the critical point for the Jimboomba West PMA is shown in Figure 4-9 .
90-12-76 Date issued: 05/12/2014 Page 24 of 62 Rev: 1
Logan South Water Supply Pressure Management - Detailed Planning
Document Number: 7600-000-P-REP-PL-8230
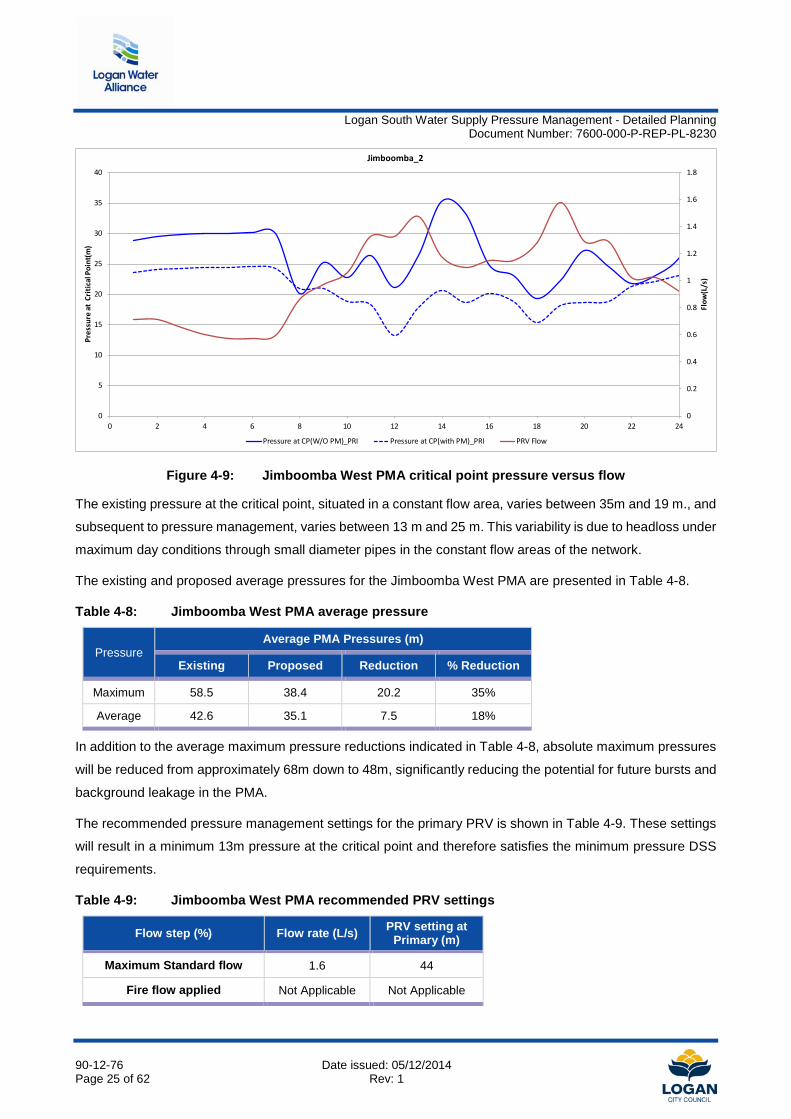
Figure 4-9: Jimboomba West PMA critical point pressure versus flow
The existing pressure at the critical point, situated in a constant flow area, varies between 35m and 19 m., and
subsequent to pressure management, varies between 13 m and 25 m. This variability is due to headloss under
maximum day conditions through small diameter pipes in the constant flow areas of the network.
The existing and proposed average pressures for the Jimboomba West PMA are presented in Table 4-8.
Table 4-8: Jimboomba West PMA average pressure
Pressure Average PMA Pressures (m)
Existing Proposed Reduction % Reduction
Maximum 58.5 38.4 20.2 35%
Average 42.6 35.1 7.5 18%
In addition to the average maximum pressure reductions indicated in Table 4-8, absolute maximum pressures
will be reduced from approximately 68m down to 48m, significantly reducing the potential for future bursts and
background leakage in the PMA.
The recommended pressure management settings for the primary PRV is shown in Table 4-9. These settings
will result in a minimum 13m pressure at the critical point and therefore satisfies the minimum pressure DSS
requirements.
Table 4-9: Jimboomba West PMA recommended PRV settings
Flow step (%) Flow rate (L/s) PRV setting at Primary (m)
Maximum Standard flow 1.6 44
Fire flow applied Not Applicable Not Applicable
0
0.2
0.4
0.6
0.8
1
1.2
1.4
1.6
1.8
0
5
10
15
20
25
30
35
40
0 2 4 6 8 10 12 14 16 18 20 22 24
Flow
(L/s
)
Pres
sure
at
Criti
cal P
oint
(m)
Jimboomba_2
Pressure at CP(W/O PM)_PRI Pressure at CP(with PM)_PRI PRV Flow
90-12-76 Date issued: 05/12/2014 Page 25 of 62 Rev: 1
Logan South Water Supply Pressure Management - Detailed Planning
Document Number: 7600-000-P-REP-PL-8230
4.4 Cedar Vale PMA The proposed Cedar Vale PMA is comprised of 159 on-demand and 20 constant flow properties with an
average daily demand of 0.14 ML/d. The area is currently supplied via the Woodhill reservoir. There is no
existing pressure management in the area.
The key statistics of the proposed PMA are presented in Table 4-10.
Table 4-10: Cedar Vale PMA key statistics
PMA Name Cedar Vale No of metered properties 179 % residential 99% Length of mains(km) 7.09 Min elevation (m) 26.6 Max elevation (m) 62.2 Elevation Difference (m) 35.6 Operational MD demand 2013 (L/s) 1.7
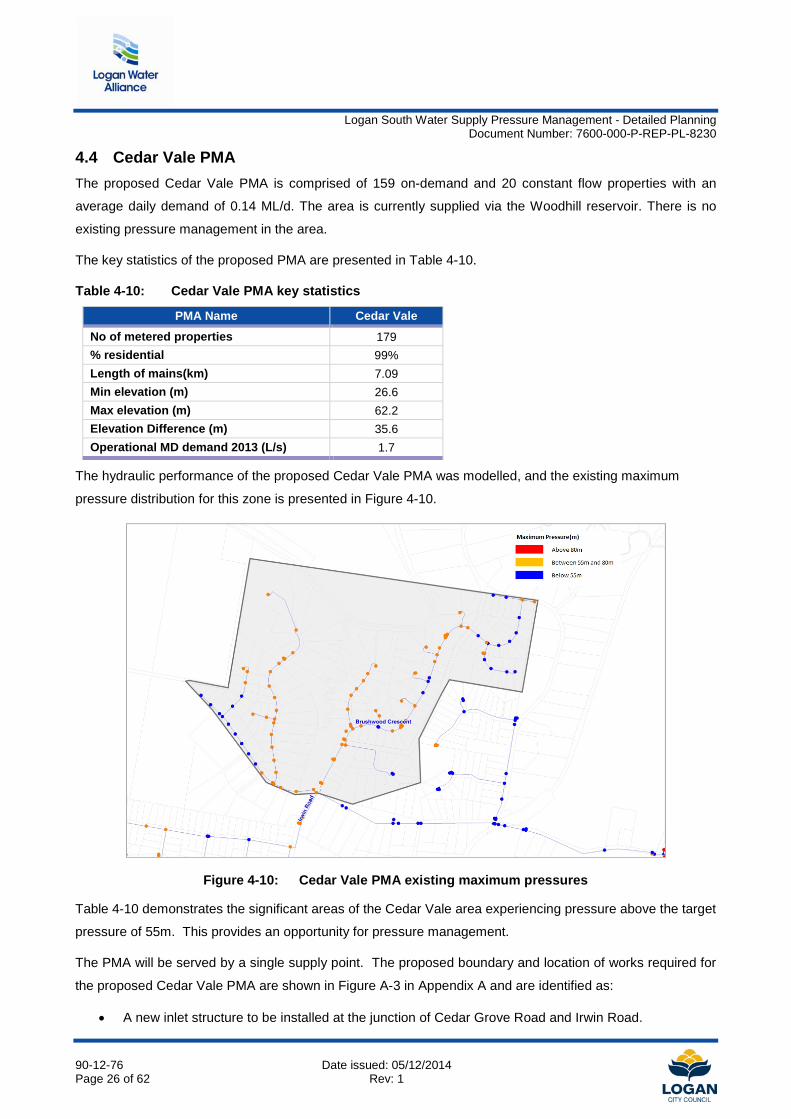
The hydraulic performance of the proposed Cedar Vale PMA was modelled, and the existing maximum
pressure distribution for this zone is presented in Figure 4-10.
Figure 4-10: Cedar Vale PMA existing maximum pressures
Table 4-10 demonstrates the significant areas of the Cedar Vale area experiencing pressure above the target
pressure of 55m. This provides an opportunity for pressure management.
The PMA will be served by a single supply point. The proposed boundary and location of works required for
the proposed Cedar Vale PMA are shown in Figure A-3 in Appendix A and are identified as:
• A new inlet structure to be installed at the junction of Cedar Grove Road and Irwin Road.
90-12-76 Date issued: 05/12/2014 Page 26 of 62 Rev: 1
Logan South Water Supply Pressure Management - Detailed Planning
Document Number: 7600-000-P-REP-PL-8230
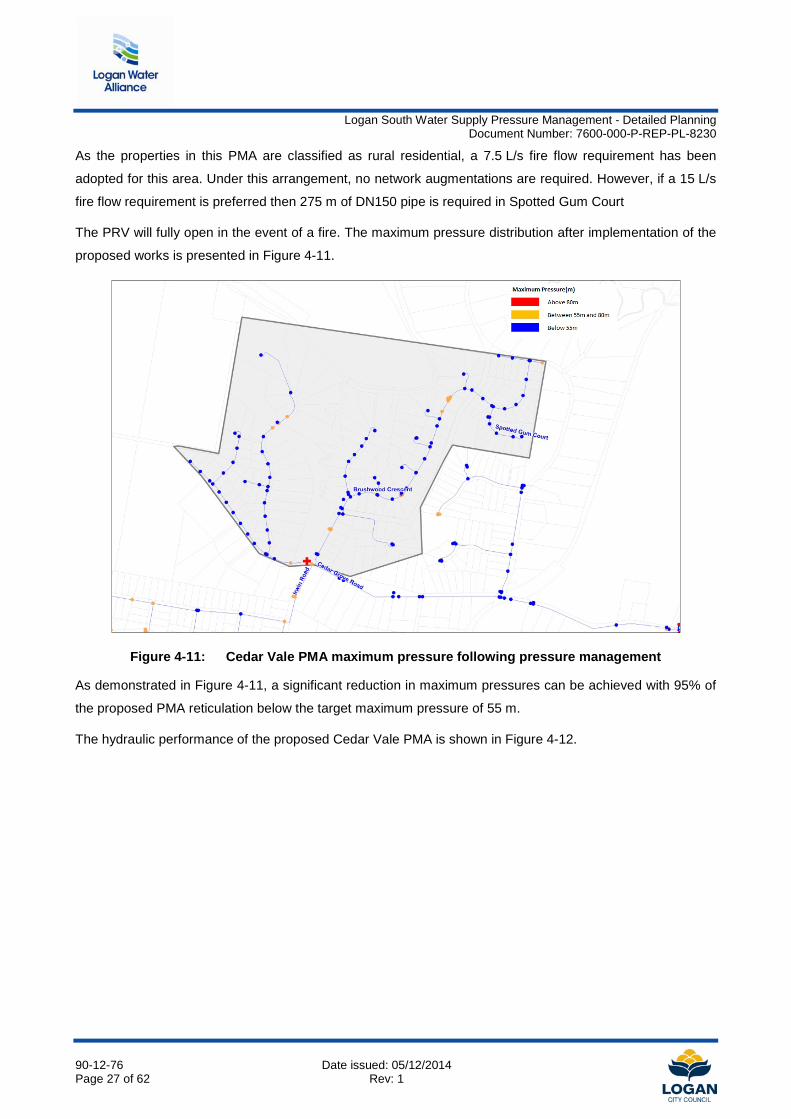
As the properties in this PMA are classified as rural residential, a 7.5 L/s fire flow requirement has been
adopted for this area. Under this arrangement, no network augmentations are required. However, if a 15 L/s
fire flow requirement is preferred then 275 m of DN150 pipe is required in Spotted Gum Court
The PRV will fully open in the event of a fire. The maximum pressure distribution after implementation of the
proposed works is presented in Figure 4-11.
Figure 4-11: Cedar Vale PMA maximum pressure following pressure management
As demonstrated in Figure 4-11, a significant reduction in maximum pressures can be achieved with 95% of
the proposed PMA reticulation below the target maximum pressure of 55 m.
The hydraulic performance of the proposed Cedar Vale PMA is shown in Figure 4-12.
90-12-76 Date issued: 05/12/2014 Page 27 of 62 Rev: 1
Logan South Water Supply Pressure Management - Detailed Planning
Document Number: 7600-000-P-REP-PL-8230
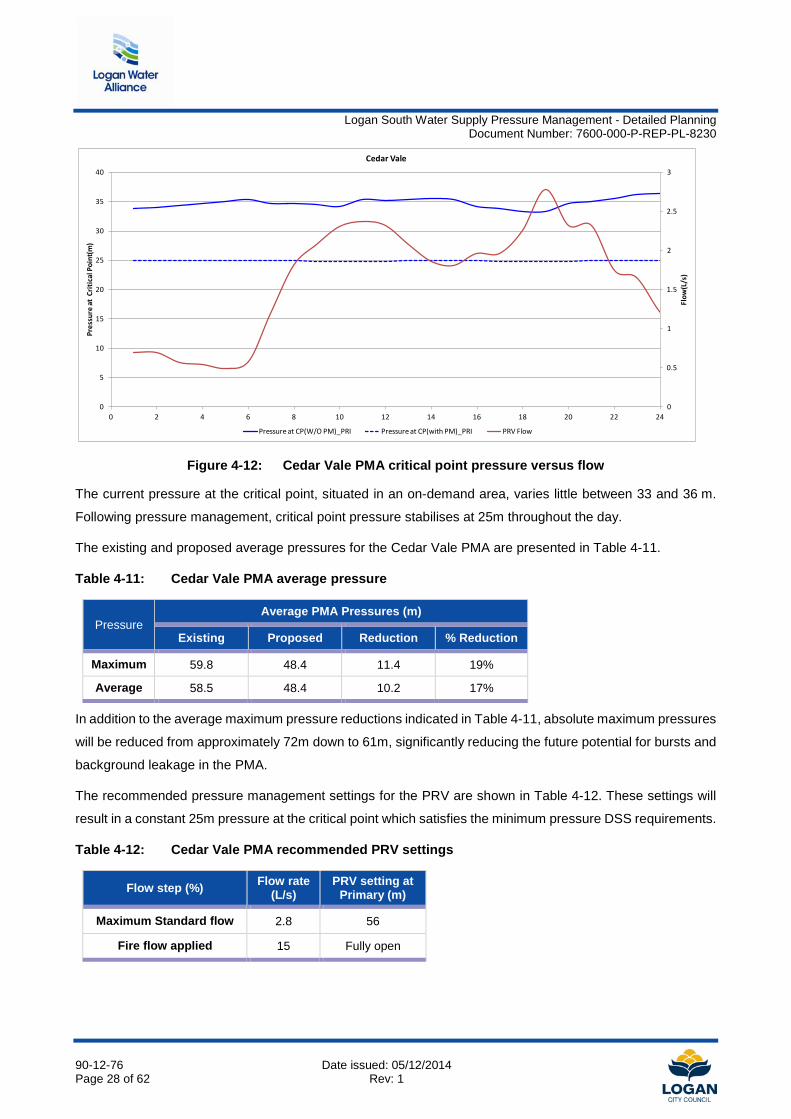
Figure 4-12: Cedar Vale PMA critical point pressure versus flow
The current pressure at the critical point, situated in an on-demand area, varies little between 33 and 36 m.
Following pressure management, critical point pressure stabilises at 25m throughout the day.
The existing and proposed average pressures for the Cedar Vale PMA are presented in Table 4-11.
Table 4-11: Cedar Vale PMA average pressure
Pressure Average PMA Pressures (m)
Existing Proposed Reduction % Reduction
Maximum 59.8 48.4 11.4 19%
Average 58.5 48.4 10.2 17%
In addition to the average maximum pressure reductions indicated in Table 4-11, absolute maximum pressures
will be reduced from approximately 72m down to 61m, significantly reducing the future potential for bursts and
background leakage in the PMA.
The recommended pressure management settings for the PRV are shown in Table 4-12. These settings will
result in a constant 25m pressure at the critical point which satisfies the minimum pressure DSS requirements.
Table 4-12: Cedar Vale PMA recommended PRV settings
Flow step (%) Flow rate (L/s)
PRV setting at Primary (m)
Maximum Standard flow 2.8 56
Fire flow applied 15 Fully open
0
0.5
1
1.5
2
2.5
3
0
5
10
15
20
25
30
35
40
0 2 4 6 8 10 12 14 16 18 20 22 24
Flow
(L/s
)
Pres
sure
at
Criti
cal P
oint
(m)
Cedar Vale
Pressure at CP(W/O PM)_PRI Pressure at CP(with PM)_PRI PRV Flow
90-12-76 Date issued: 05/12/2014 Page 28 of 62 Rev: 1
Logan South Water Supply Pressure Management - Detailed Planning
Document Number: 7600-000-P-REP-PL-8230
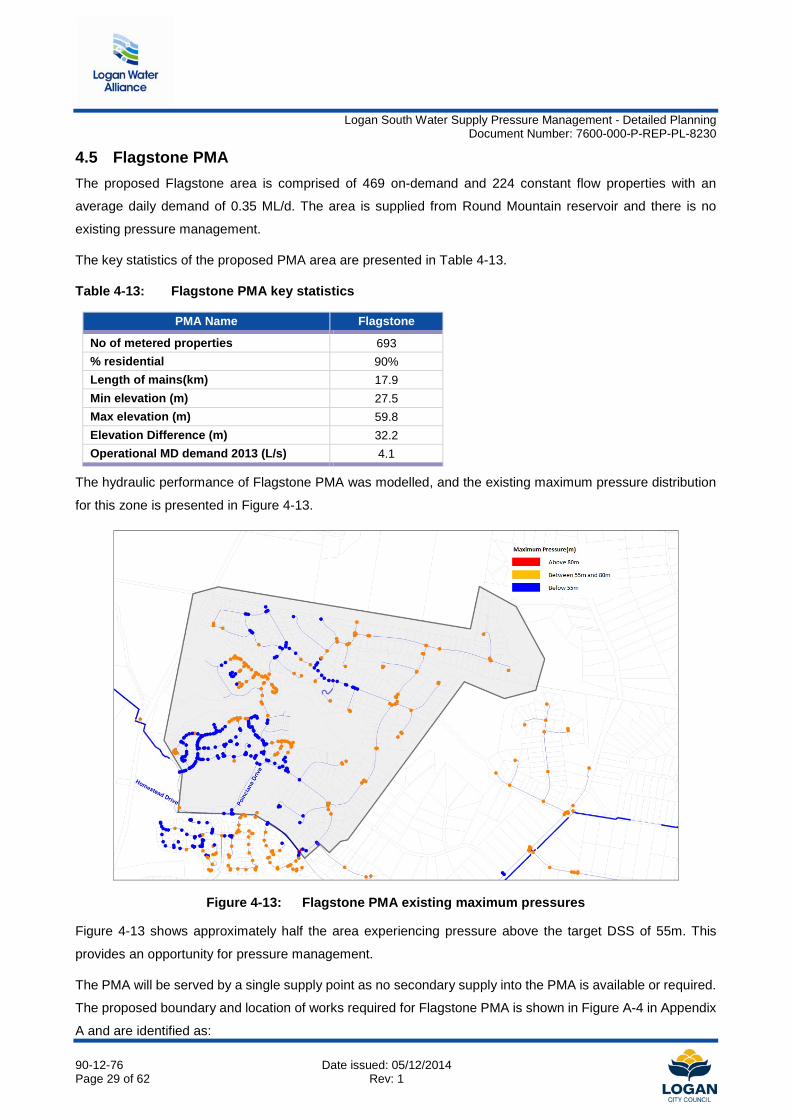
4.5 Flagstone PMA The proposed Flagstone area is comprised of 469 on-demand and 224 constant flow properties with an
average daily demand of 0.35 ML/d. The area is supplied from Round Mountain reservoir and there is no
existing pressure management.
The key statistics of the proposed PMA area are presented in Table 4-13.
Table 4-13: Flagstone PMA key statistics
PMA Name Flagstone
No of metered properties 693 % residential 90% Length of mains(km) 17.9 Min elevation (m) 27.5 Max elevation (m) 59.8 Elevation Difference (m) 32.2 Operational MD demand 2013 (L/s) 4.1
The hydraulic performance of Flagstone PMA was modelled, and the existing maximum pressure distribution
for this zone is presented in Figure 4-13.
Figure 4-13: Flagstone PMA existing maximum pressures
Figure 4-13 shows approximately half the area experiencing pressure above the target DSS of 55m. This
provides an opportunity for pressure management.
The PMA will be served by a single supply point as no secondary supply into the PMA is available or required.
The proposed boundary and location of works required for Flagstone PMA is shown in Figure A-4 in Appendix
A and are identified as: 90-12-76 Date issued: 05/12/2014 Page 29 of 62 Rev: 1
Logan South Water Supply Pressure Management - Detailed Planning
Document Number: 7600-000-P-REP-PL-8230
• A new inlet structure to be installed at the junction of Homestead Drive and Poinciana Drive
• Two new boundary valves at Sugar Gum Close and Coachwood Drive are also proposed
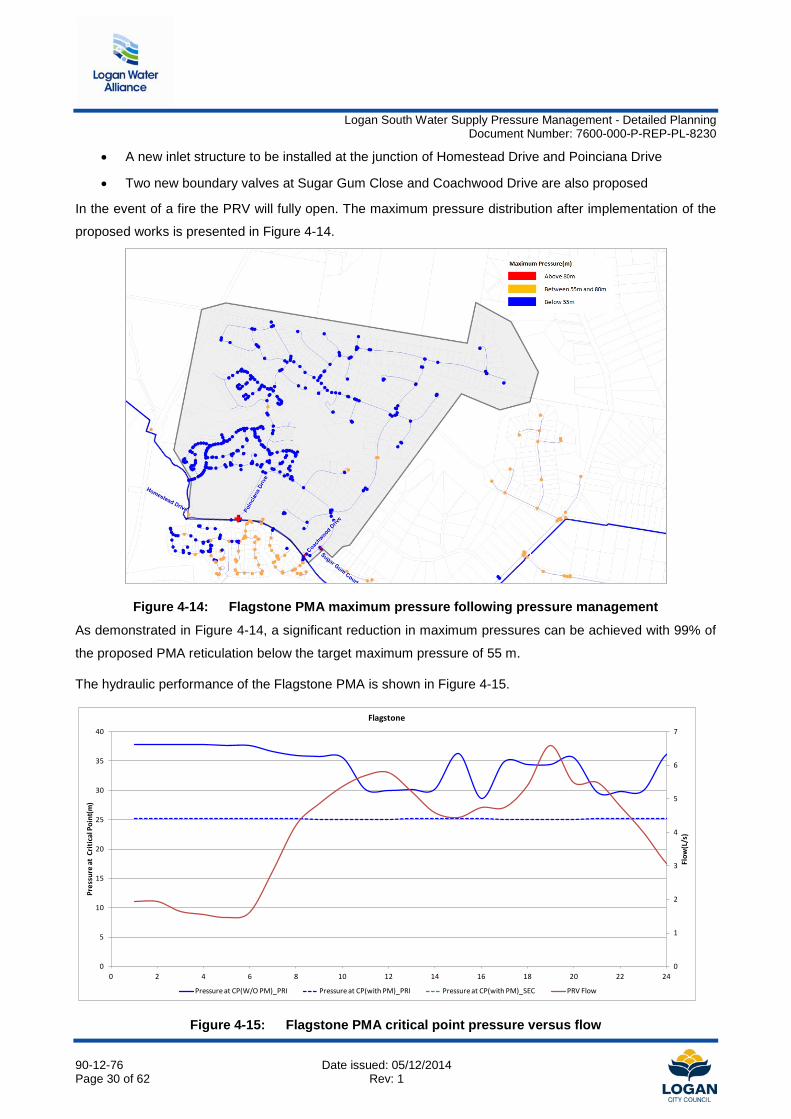
In the event of a fire the PRV will fully open. The maximum pressure distribution after implementation of the
proposed works is presented in Figure 4-14.
Figure 4-14: Flagstone PMA maximum pressure following pressure management
As demonstrated in Figure 4-14, a significant reduction in maximum pressures can be achieved with 99% of
the proposed PMA reticulation below the target maximum pressure of 55 m.
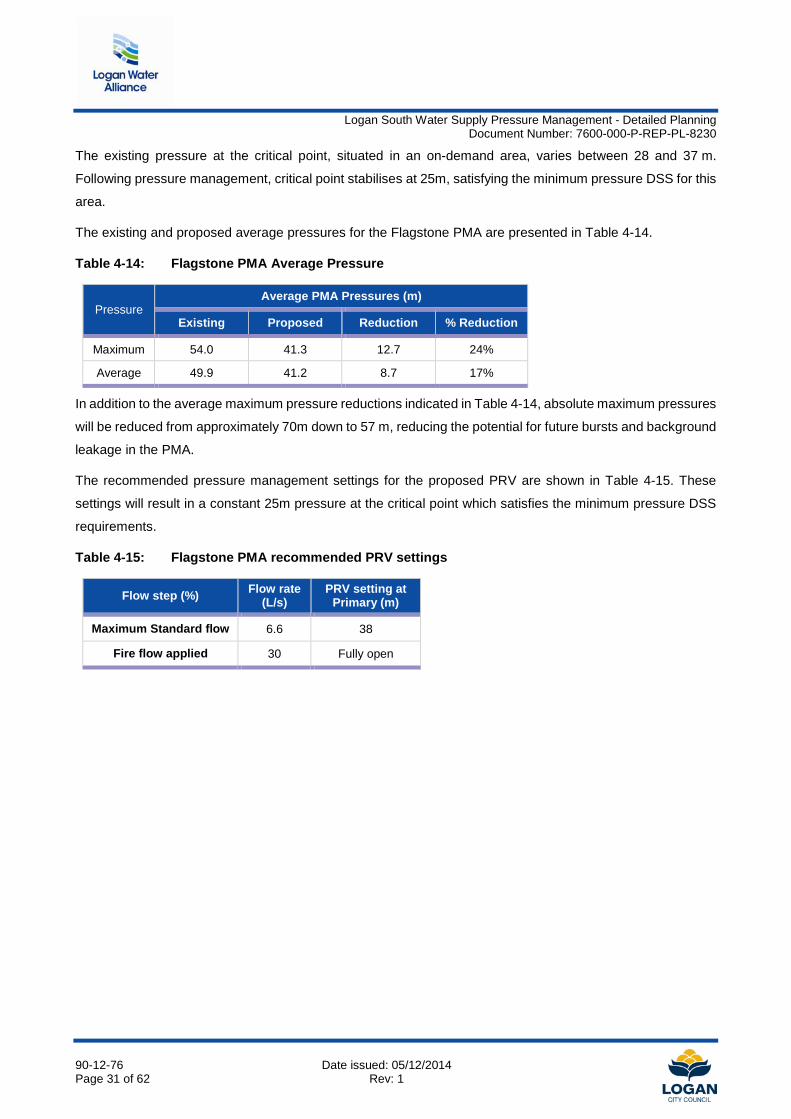
The hydraulic performance of the Flagstone PMA is shown in Figure 4-15.
Figure 4-15: Flagstone PMA critical point pressure versus flow
0
1
2
3
4
5
6
7
0
5
10
15
20
25
30
35
40
0 2 4 6 8 10 12 14 16 18 20 22 24
Flow
(L/s
)
Pres
sure
at
Criti
cal P
oint
(m)
Flagstone
Pressure at CP(W/O PM)_PRI Pressure at CP(with PM)_PRI Pressure at CP(with PM)_SEC PRV Flow
90-12-76 Date issued: 05/12/2014 Page 30 of 62 Rev: 1
Logan South Water Supply Pressure Management - Detailed Planning
Document Number: 7600-000-P-REP-PL-8230
The existing pressure at the critical point, situated in an on-demand area, varies between 28 and 37 m.
Following pressure management, critical point stabilises at 25m, satisfying the minimum pressure DSS for this
area.
The existing and proposed average pressures for the Flagstone PMA are presented in Table 4-14.
Table 4-14: Flagstone PMA Average Pressure
Pressure Average PMA Pressures (m)
Existing Proposed Reduction % Reduction
Maximum 54.0 41.3 12.7 24%
Average 49.9 41.2 8.7 17%
In addition to the average maximum pressure reductions indicated in Table 4-14, absolute maximum pressures
will be reduced from approximately 70m down to 57 m, reducing the potential for future bursts and background
leakage in the PMA.
The recommended pressure management settings for the proposed PRV are shown in Table 4-15. These
settings will result in a constant 25m pressure at the critical point which satisfies the minimum pressure DSS
requirements.
Table 4-15: Flagstone PMA recommended PRV settings
Flow step (%) Flow rate (L/s)
PRV setting at Primary (m)
Maximum Standard flow 6.6 38
Fire flow applied 30 Fully open
90-12-76 Date issued: 05/12/2014 Page 31 of 62 Rev: 1
Logan South Water Supply Pressure Management - Detailed Planning
Document Number: 7600-000-P-REP-PL-8230
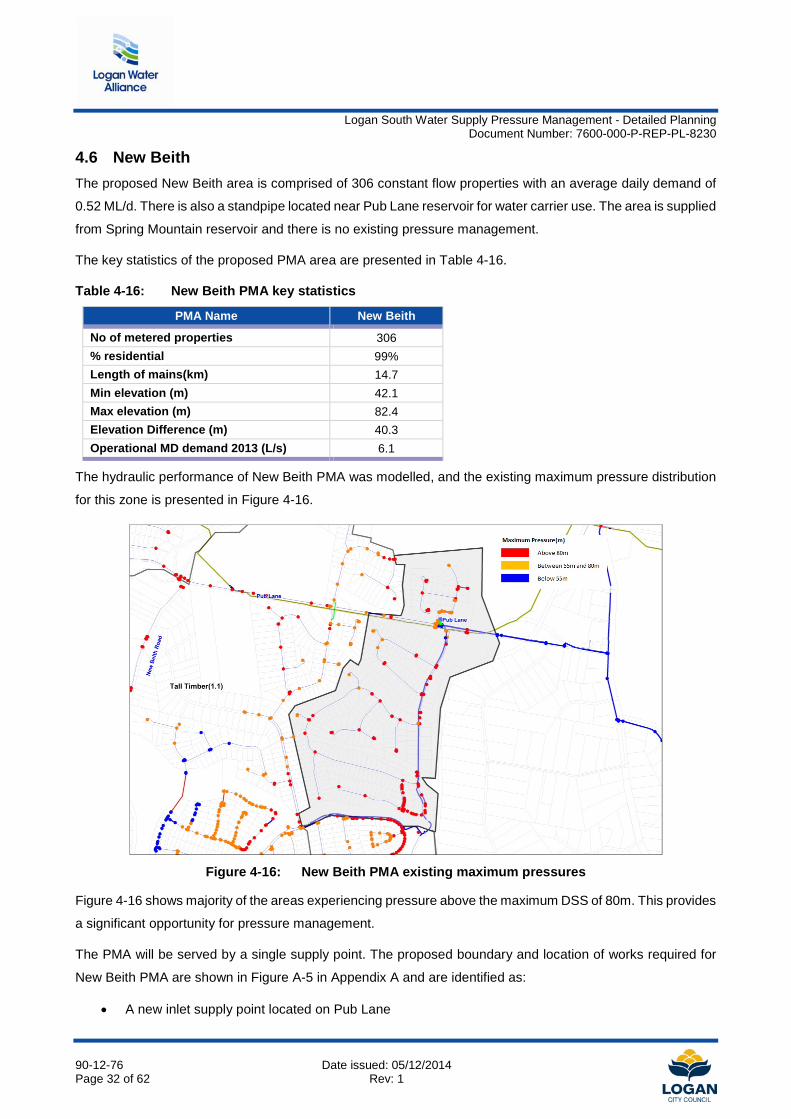
4.6 New Beith The proposed New Beith area is comprised of 306 constant flow properties with an average daily demand of
0.52 ML/d. There is also a standpipe located near Pub Lane reservoir for water carrier use. The area is supplied
from Spring Mountain reservoir and there is no existing pressure management.
The key statistics of the proposed PMA area are presented in Table 4-16.
Table 4-16: New Beith PMA key statistics
PMA Name New Beith
No of metered properties 306 % residential 99% Length of mains(km) 14.7 Min elevation (m) 42.1 Max elevation (m) 82.4 Elevation Difference (m) 40.3 Operational MD demand 2013 (L/s) 6.1
The hydraulic performance of New Beith PMA was modelled, and the existing maximum pressure distribution
for this zone is presented in Figure 4-16.
Figure 4-16: New Beith PMA existing maximum pressures
Figure 4-16 shows majority of the areas experiencing pressure above the maximum DSS of 80m. This provides
a significant opportunity for pressure management.
The PMA will be served by a single supply point. The proposed boundary and location of works required for
New Beith PMA are shown in Figure A-5 in Appendix A and are identified as:
• A new inlet supply point located on Pub Lane
90-12-76 Date issued: 05/12/2014 Page 32 of 62 Rev: 1
Logan South Water Supply Pressure Management - Detailed Planning
Document Number: 7600-000-P-REP-PL-8230
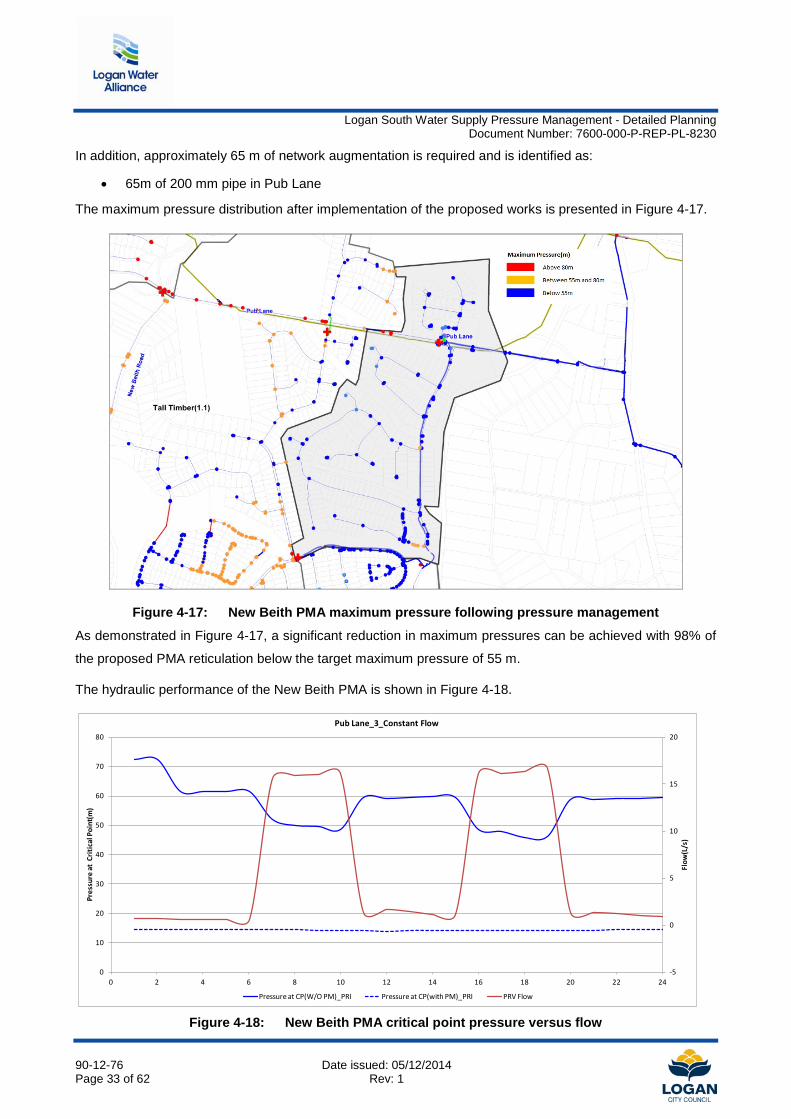
In addition, approximately 65 m of network augmentation is required and is identified as:
• 65m of 200 mm pipe in Pub Lane
The maximum pressure distribution after implementation of the proposed works is presented in Figure 4-17.
Figure 4-17: New Beith PMA maximum pressure following pressure management
As demonstrated in Figure 4-17, a significant reduction in maximum pressures can be achieved with 98% of
the proposed PMA reticulation below the target maximum pressure of 55 m.
The hydraulic performance of the New Beith PMA is shown in Figure 4-18.
Figure 4-18: New Beith PMA critical point pressure versus flow
-5
0
5
10
15
20
0
10
20
30
40
50
60
70
80
0 2 4 6 8 10 12 14 16 18 20 22 24
Flow
(L/s
)
Pres
sure
at
Criti
cal P
oint
(m)
Pub Lane_3_Constant Flow
Pressure at CP(W/O PM)_PRI Pressure at CP(with PM)_PRI PRV Flow
90-12-76 Date issued: 05/12/2014 Page 33 of 62 Rev: 1
Logan South Water Supply Pressure Management - Detailed Planning
Document Number: 7600-000-P-REP-PL-8230
As demonstrated in Figure 4-18, at the critical point which is situated in a constant flow area, pressure varies
between 46 and 72 m. Following pressure management, the critical point pressure stabilises at approximately
13m.
The existing and proposed average pressures for the New Beith PMA are presented in Table 4-17.
Table 4-17: New Beith PMA average pressure
Pressure Average PMA Pressures (m)
Existing Proposed Reduction % Reduction
Maximum 92.0 35.7 56.3 61%
Average 83.3 37.2 46.1 55%
In addition to the average maximum pressure reductions indicated in Table 4-17, absolute maximum pressures
will be reduced from approximately 110m down to 56 m, significantly reducing the potential for future bursts
and background leakage in the PMA.
The recommended pressure management settings for the primary PRV are shown in Table 4-18. These
settings will result in a constant 13m pressure at the critical point which satisfies the minimum pressure DSS
requirements.
Table 4-18: New Beith PMA recommended PRV settings
Flow step Flow rate (L/s) PRV setting at Primary (m)
Maximum Standard flow 16.6 22
Fire flow applied Not applicable Not applicable
90-12-76 Date issued: 05/12/2014 Page 34 of 62 Rev: 1
Logan South Water Supply Pressure Management - Detailed Planning
Document Number: 7600-000-P-REP-PL-8230
4.7 Tall Timber PMA The Tall Timber area currently has 1,017 constant flow properties with average daily demand of 0.22 ML/d.
The area is currently supplied from a combination of Spring Mountain reservoir and pumps at Pub Lane and
Lyndale stations, there is no existing pressure management. Lyndale pump station is due to be
decommissioned in 2015 with pumping requirements consolidated through an upgrade at Pub Lane pump
station. A pressure managed contingency connection is also available from the recently commissioned Pub
Lane SRWP connection. This area is considered a transition zone as new on-demand developments are
creating opportunities to upgrade the existing constant flow network to on-demand.
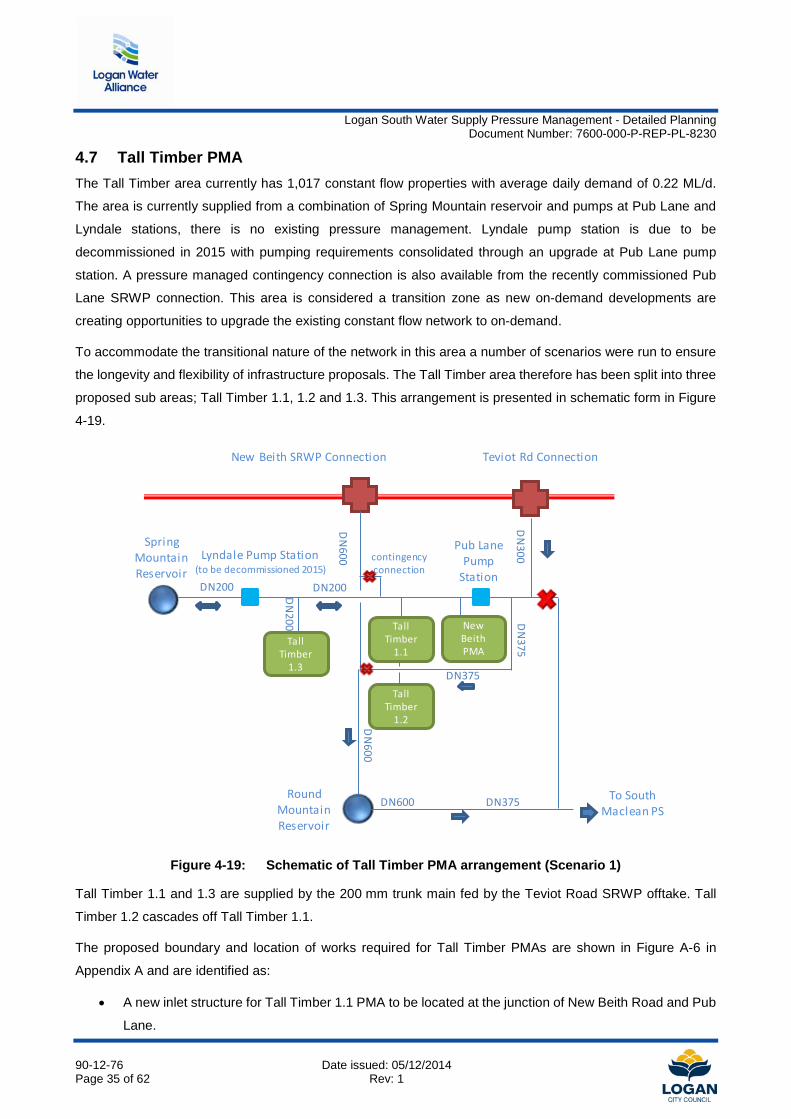
To accommodate the transitional nature of the network in this area a number of scenarios were run to ensure
the longevity and flexibility of infrastructure proposals. The Tall Timber area therefore has been split into three
proposed sub areas; Tall Timber 1.1, 1.2 and 1.3. This arrangement is presented in schematic form in Figure
4-19.
Figure 4-19: Schematic of Tall Timber PMA arrangement (Scenario 1)
Tall Timber 1.1 and 1.3 are supplied by the 200 mm trunk main fed by the Teviot Road SRWP offtake. Tall
Timber 1.2 cascades off Tall Timber 1.1.
The proposed boundary and location of works required for Tall Timber PMAs are shown in Figure A-6 in
Appendix A and are identified as:
• A new inlet structure for Tall Timber 1.1 PMA to be located at the junction of New Beith Road and Pub
Lane.
New Beith SRWP Connection Teviot Rd Connection
Spring Mountain Reservoir
Round Mountain Reservoir
Tall Timber
1.1
Pub Lane Pump
Station
Lyndale Pump Station (to be decommissioned 2015)
DN
300
DN200 DN200
DN
600
DN375
DN
375
DN
200
Tall Timber
1.2
Tall Timber
1.3
New Beith PMA
DN
600 contingency connection
To South Maclean PS
DN375DN600
90-12-76 Date issued: 05/12/2014 Page 35 of 62 Rev: 1
Logan South Water Supply Pressure Management - Detailed Planning
Document Number: 7600-000-P-REP-PL-8230
• A new inlet structure for Tall Timber 1.2 PMA to be located at the junction of Red Gum Road and Lyon
Drive
• A new inlet for Tall Timber 1.3 PMA to be installed at Dungaree Drive
In addition approximately 160 m of network augmentations were required and are identified as:
• 160m of 100 mm pipe at Pub Lane
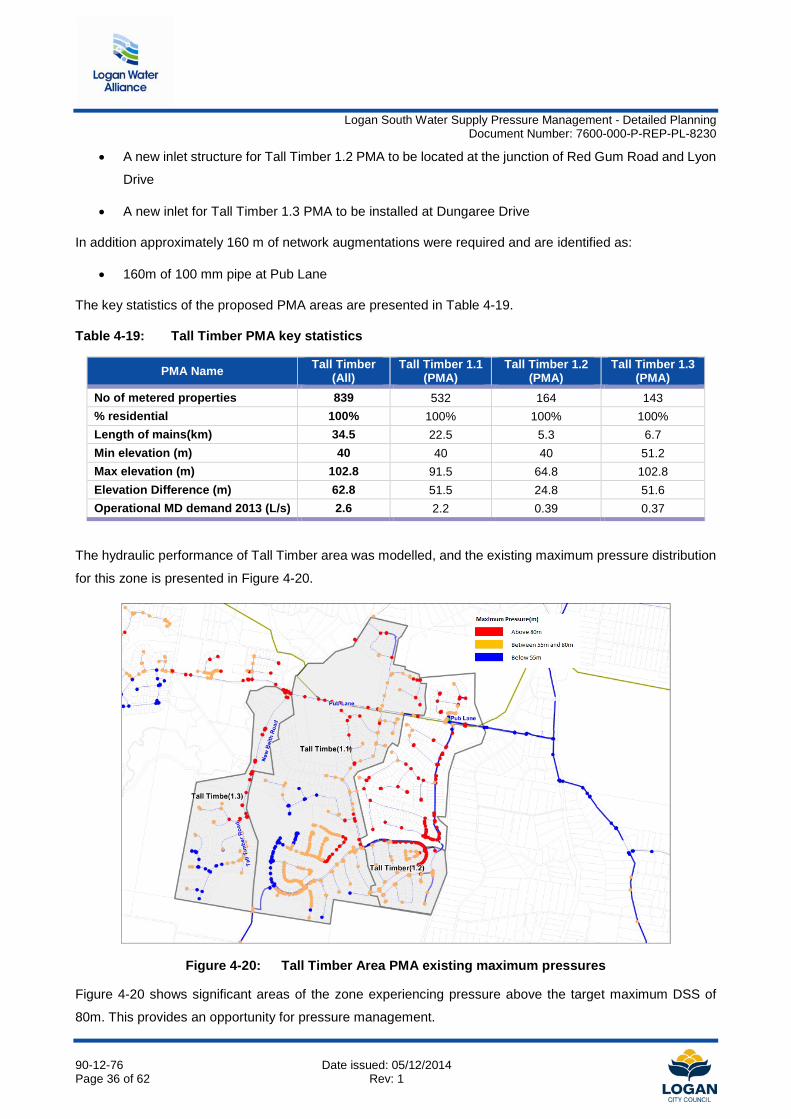
The key statistics of the proposed PMA areas are presented in Table 4-19.
Table 4-19: Tall Timber PMA key statistics
PMA Name Tall Timber (All)
Tall Timber 1.1 (PMA)
Tall Timber 1.2 (PMA)
Tall Timber 1.3 (PMA)
No of metered properties 839 532 164 143 % residential 100% 100% 100% 100% Length of mains(km) 34.5 22.5 5.3 6.7 Min elevation (m) 40 40 40 51.2 Max elevation (m) 102.8 91.5 64.8 102.8 Elevation Difference (m) 62.8 51.5 24.8 51.6 Operational MD demand 2013 (L/s) 2.6 2.2 0.39 0.37
The hydraulic performance of Tall Timber area was modelled, and the existing maximum pressure distribution
for this zone is presented in Figure 4-20.
Figure 4-20: Tall Timber Area PMA existing maximum pressures
Figure 4-20 shows significant areas of the zone experiencing pressure above the target maximum DSS of
80m. This provides an opportunity for pressure management.
90-12-76 Date issued: 05/12/2014 Page 36 of 62 Rev: 1
Logan South Water Supply Pressure Management - Detailed Planning
Document Number: 7600-000-P-REP-PL-8230
Two main scenarios were analysed for the Tall Timber area:
• Scenario 1: Existing situation and reticulation
• Scenario 2: Existing network with all known short term development
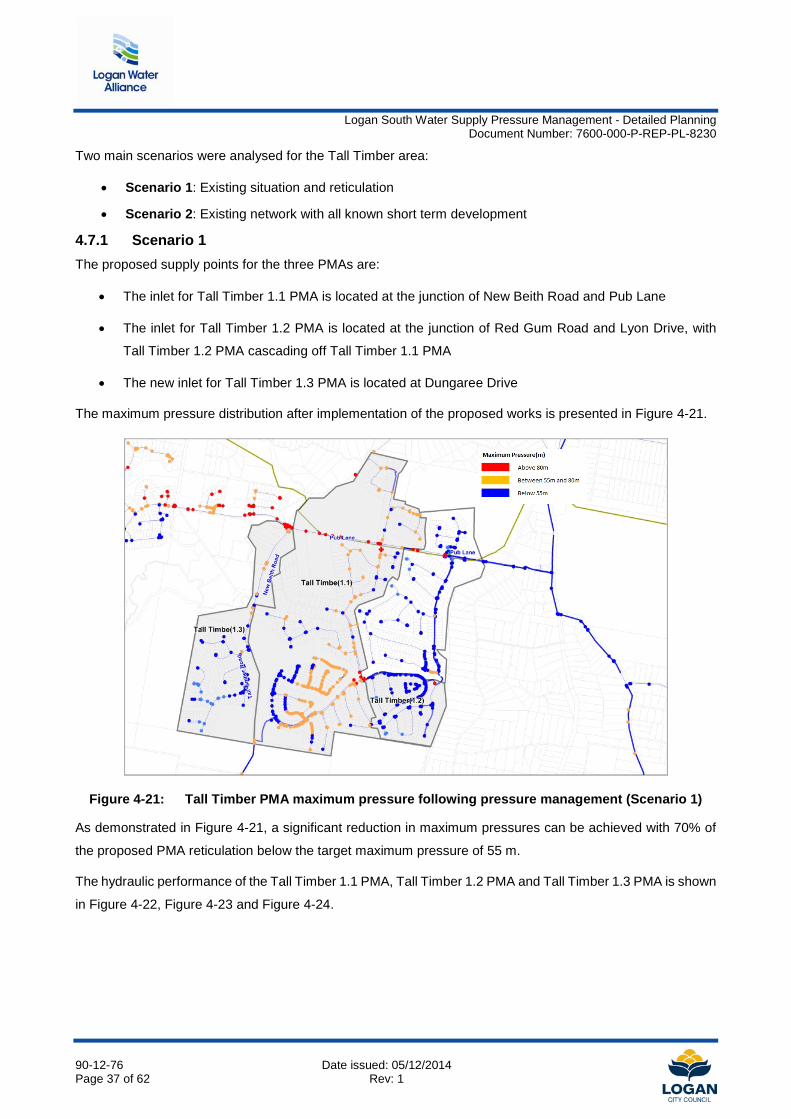
4.7.1 Scenario 1 The proposed supply points for the three PMAs are:
• The inlet for Tall Timber 1.1 PMA is located at the junction of New Beith Road and Pub Lane
• The inlet for Tall Timber 1.2 PMA is located at the junction of Red Gum Road and Lyon Drive, with
Tall Timber 1.2 PMA cascading off Tall Timber 1.1 PMA
• The new inlet for Tall Timber 1.3 PMA is located at Dungaree Drive
The maximum pressure distribution after implementation of the proposed works is presented in Figure 4-21.
Figure 4-21: Tall Timber PMA maximum pressure following pressure management (Scenario 1)
As demonstrated in Figure 4-21, a significant reduction in maximum pressures can be achieved with 70% of
the proposed PMA reticulation below the target maximum pressure of 55 m.
The hydraulic performance of the Tall Timber 1.1 PMA, Tall Timber 1.2 PMA and Tall Timber 1.3 PMA is shown
in Figure 4-22, Figure 4-23 and Figure 4-24.
90-12-76 Date issued: 05/12/2014 Page 37 of 62 Rev: 1
Logan South Water Supply Pressure Management - Detailed Planning
Document Number: 7600-000-P-REP-PL-8230
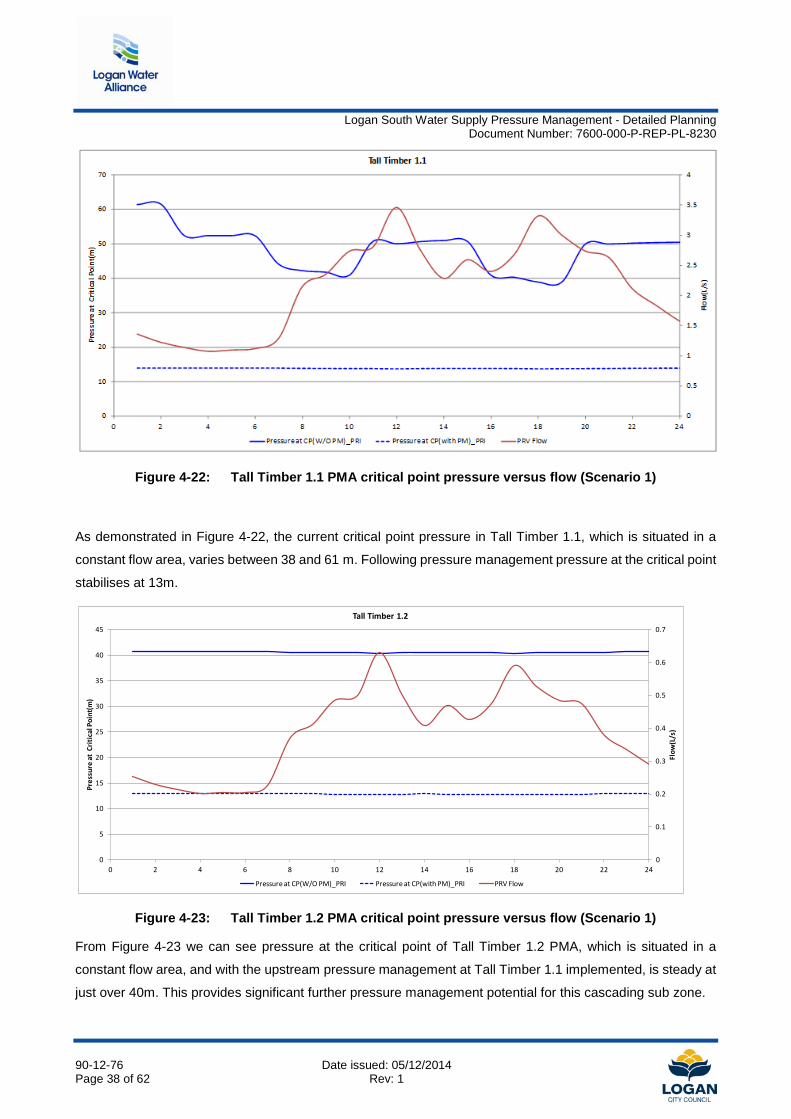
Figure 4-22: Tall Timber 1.1 PMA critical point pressure versus flow (Scenario 1)
As demonstrated in Figure 4-22, the current critical point pressure in Tall Timber 1.1, which is situated in a
constant flow area, varies between 38 and 61 m. Following pressure management pressure at the critical point
stabilises at 13m.
Figure 4-23: Tall Timber 1.2 PMA critical point pressure versus flow (Scenario 1)
From Figure 4-23 we can see pressure at the critical point of Tall Timber 1.2 PMA, which is situated in a
constant flow area, and with the upstream pressure management at Tall Timber 1.1 implemented, is steady at
just over 40m. This provides significant further pressure management potential for this cascading sub zone.
0
0.1
0.2
0.3
0.4
0.5
0.6
0.7
0
5
10
15
20
25
30
35
40
45
0 2 4 6 8 10 12 14 16 18 20 22 24
Flow
(L/s
)
Pres
sure
at
Criti
cal P
oint
(m)
Tall Timber 1.2
Pressure at CP(W/O PM)_PRI Pressure at CP(with PM)_PRI PRV Flow
90-12-76 Date issued: 05/12/2014 Page 38 of 62 Rev: 1
Logan South Water Supply Pressure Management - Detailed Planning
Document Number: 7600-000-P-REP-PL-8230
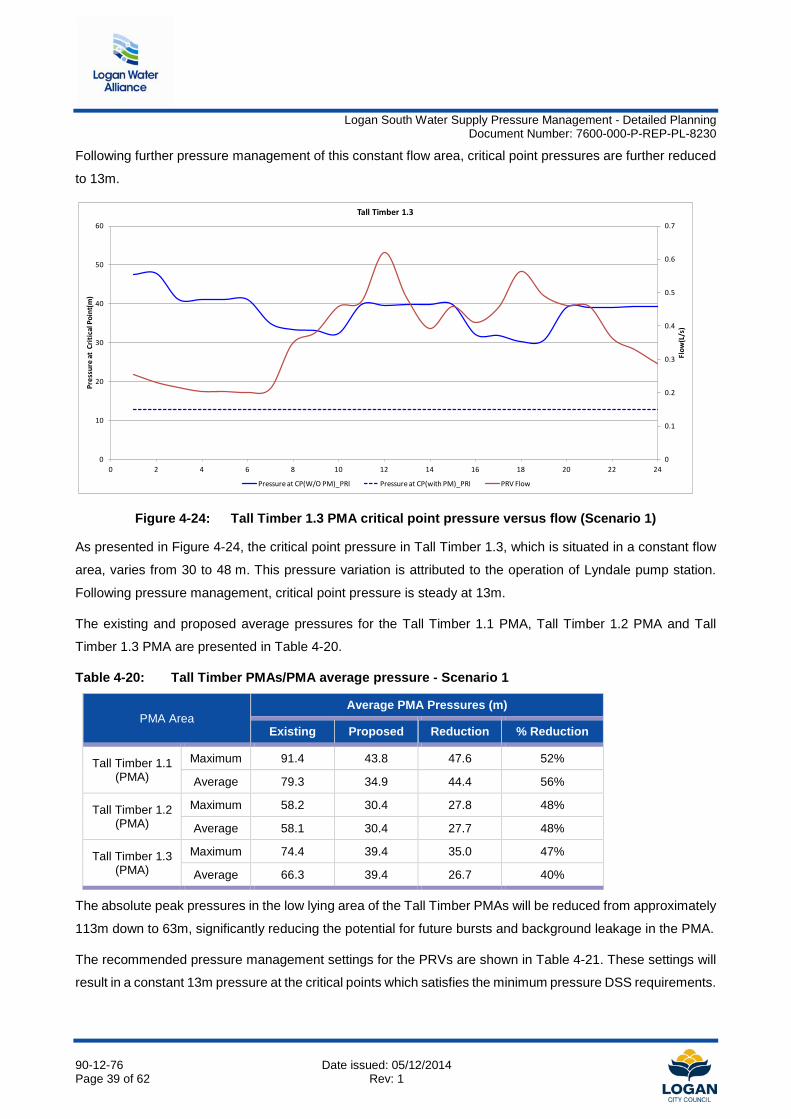
Following further pressure management of this constant flow area, critical point pressures are further reduced
to 13m.
Figure 4-24: Tall Timber 1.3 PMA critical point pressure versus flow (Scenario 1)
As presented in Figure 4-24, the critical point pressure in Tall Timber 1.3, which is situated in a constant flow
area, varies from 30 to 48 m. This pressure variation is attributed to the operation of Lyndale pump station.
Following pressure management, critical point pressure is steady at 13m.
The existing and proposed average pressures for the Tall Timber 1.1 PMA, Tall Timber 1.2 PMA and Tall
Timber 1.3 PMA are presented in Table 4-20.
Table 4-20: Tall Timber PMAs/PMA average pressure - Scenario 1
PMA Area Average PMA Pressures (m)
Existing Proposed Reduction % Reduction
Tall Timber 1.1 (PMA)
Maximum 91.4 43.8 47.6 52%
Average 79.3 34.9 44.4 56%
Tall Timber 1.2 (PMA)
Maximum 58.2 30.4 27.8 48%
Average 58.1 30.4 27.7 48%
Tall Timber 1.3 (PMA)
Maximum 74.4 39.4 35.0 47%
Average 66.3 39.4 26.7 40%
The absolute peak pressures in the low lying area of the Tall Timber PMAs will be reduced from approximately
113m down to 63m, significantly reducing the potential for future bursts and background leakage in the PMA.
The recommended pressure management settings for the PRVs are shown in Table 4-21. These settings will
result in a constant 13m pressure at the critical points which satisfies the minimum pressure DSS requirements.
0
0.1
0.2
0.3
0.4
0.5
0.6
0.7
0
10
20
30
40
50
60
0 2 4 6 8 10 12 14 16 18 20 22 24
Flow
(L/s
)
Pres
sure
at
Criti
cal P
oint
(m)
Tall Timber 1.3
Pressure at CP(W/O PM)_PRI Pressure at CP(with PM)_PRI PRV Flow
90-12-76 Date issued: 05/12/2014 Page 39 of 62 Rev: 1
Logan South Water Supply Pressure Management - Detailed Planning
Document Number: 7600-000-P-REP-PL-8230
Table 4-21: Tall Timber PMA recommended PRV settings
PMA/PMA Area Flow step (%) Flow rate (L/s) PRV setting at Primary (m)
Tall Timber 1.1 (PMA)
Maximum Standard flow 3.5 33
Fire flow applied Not applicable Not applicable
Tall Timber 1.2 (PMA)
Maximum Standard flow 0.6 28
Fire flow applied Not applicable Not applicable
Tall Timber1.3 (PMA)
Maximum Standard flow 0.6 61
Fire flow applied Not applicable Not applicable
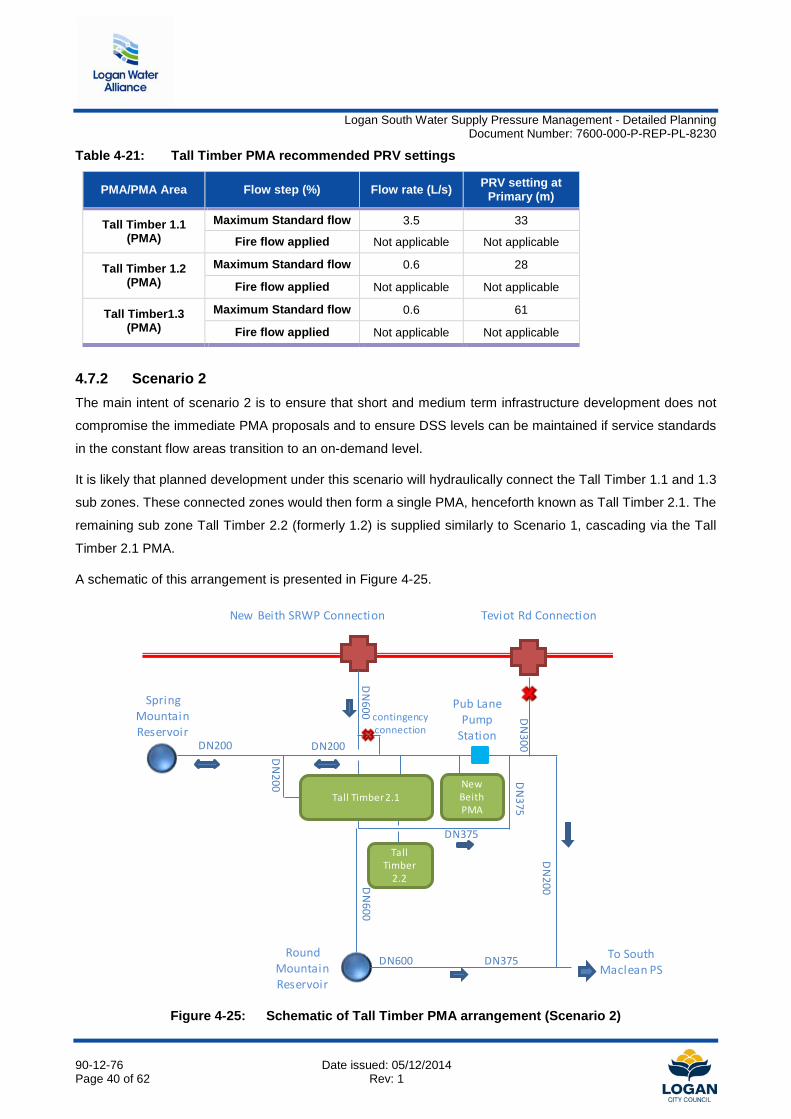
4.7.2 Scenario 2 The main intent of scenario 2 is to ensure that short and medium term infrastructure development does not
compromise the immediate PMA proposals and to ensure DSS levels can be maintained if service standards
in the constant flow areas transition to an on-demand level.
It is likely that planned development under this scenario will hydraulically connect the Tall Timber 1.1 and 1.3
sub zones. These connected zones would then form a single PMA, henceforth known as Tall Timber 2.1. The
remaining sub zone Tall Timber 2.2 (formerly 1.2) is supplied similarly to Scenario 1, cascading via the Tall
Timber 2.1 PMA.
A schematic of this arrangement is presented in Figure 4-25.
Figure 4-25: Schematic of Tall Timber PMA arrangement (Scenario 2)
New Beith SRWP Connection Teviot Rd Connection
Spring Mountain Reservoir
Round Mountain Reservoir
Pub Lane Pump
Station
DN
300DN200 DN200
DN
600
DN375
DN
375
DN
200
Tall Timber
2.2
New Beith PMA
Tall Timber 2.1
DN
600
DN375DN600 To South Maclean PS
DN
200
contingency connection
90-12-76 Date issued: 05/12/2014 Page 40 of 62 Rev: 1
Logan South Water Supply Pressure Management - Detailed Planning
Document Number: 7600-000-P-REP-PL-8230
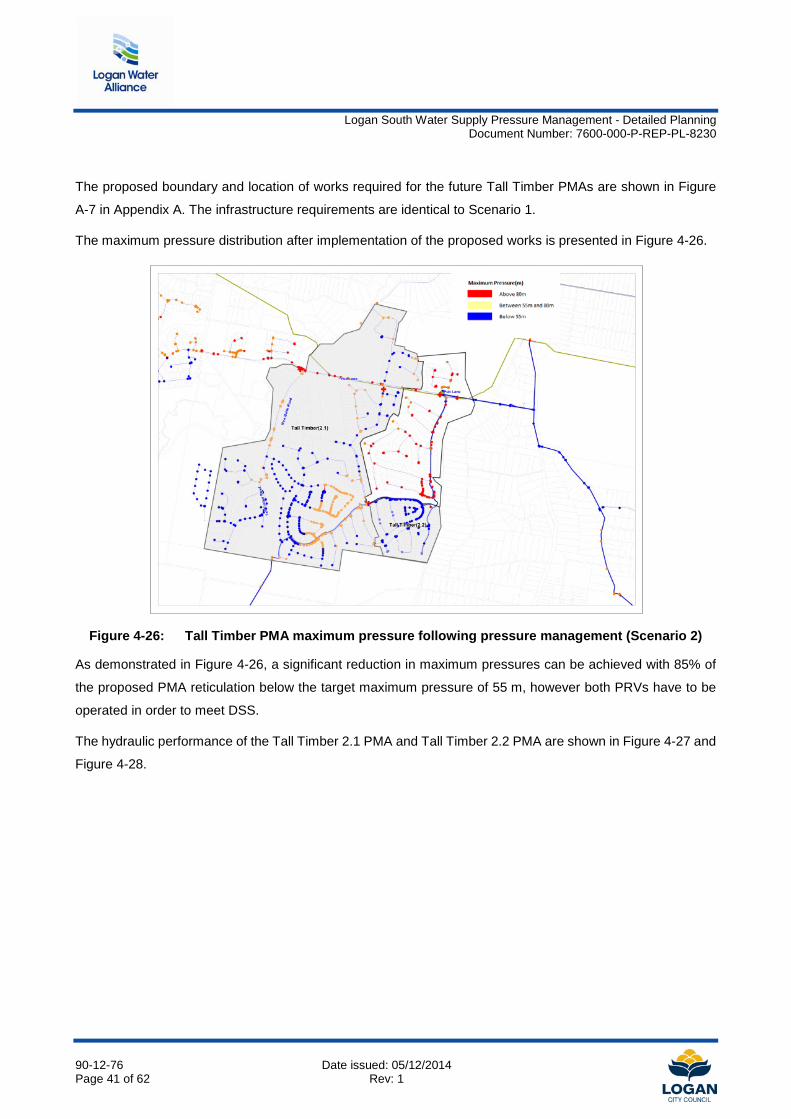
The proposed boundary and location of works required for the future Tall Timber PMAs are shown in Figure
A-7 in Appendix A. The infrastructure requirements are identical to Scenario 1.
The maximum pressure distribution after implementation of the proposed works is presented in Figure 4-26.
Figure 4-26: Tall Timber PMA maximum pressure following pressure management (Scenario 2)
As demonstrated in Figure 4-26, a significant reduction in maximum pressures can be achieved with 85% of
the proposed PMA reticulation below the target maximum pressure of 55 m, however both PRVs have to be
operated in order to meet DSS.
The hydraulic performance of the Tall Timber 2.1 PMA and Tall Timber 2.2 PMA are shown in Figure 4-27 and
Figure 4-28.
90-12-76 Date issued: 05/12/2014 Page 41 of 62 Rev: 1
Logan South Water Supply Pressure Management - Detailed Planning
Document Number: 7600-000-P-REP-PL-8230
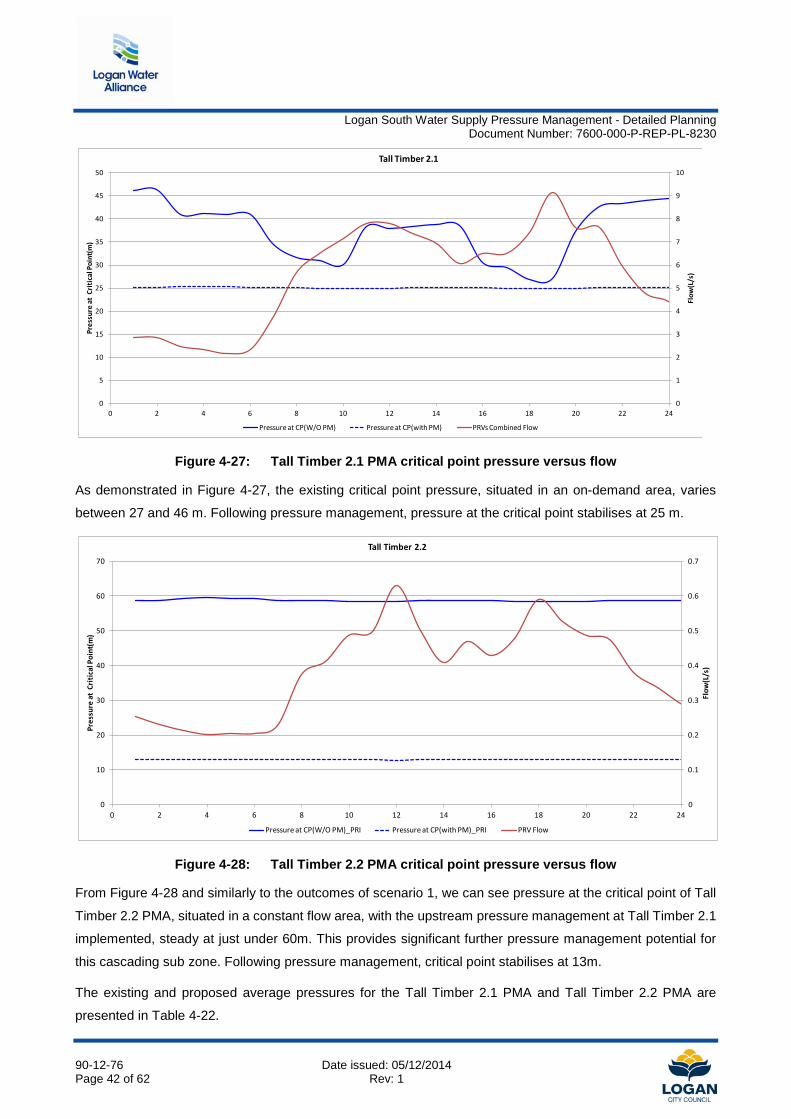
Figure 4-27: Tall Timber 2.1 PMA critical point pressure versus flow
As demonstrated in Figure 4-27, the existing critical point pressure, situated in an on-demand area, varies
between 27 and 46 m. Following pressure management, pressure at the critical point stabilises at 25 m.
Figure 4-28: Tall Timber 2.2 PMA critical point pressure versus flow
From Figure 4-28 and similarly to the outcomes of scenario 1, we can see pressure at the critical point of Tall
Timber 2.2 PMA, situated in a constant flow area, with the upstream pressure management at Tall Timber 2.1
implemented, steady at just under 60m. This provides significant further pressure management potential for
this cascading sub zone. Following pressure management, critical point stabilises at 13m.
The existing and proposed average pressures for the Tall Timber 2.1 PMA and Tall Timber 2.2 PMA are
presented in Table 4-22.
0
1
2
3
4
5
6
7
8
9
10
0
5
10
15
20
25
30
35
40
45
50
0 2 4 6 8 10 12 14 16 18 20 22 24
Flow
(L/s
)
Pres
sure
at
Criti
cal P
oint
(m)
Tall Timber 2.1
Pressure at CP(W/O PM) Pressure at CP(with PM) PRVs Combined Flow
0
0.1
0.2
0.3
0.4
0.5
0.6
0.7
0
10
20
30
40
50
60
70
0 2 4 6 8 10 12 14 16 18 20 22 24
Flow
(L/s
)
Pres
sure
at
Criti
cal P
oint
(m)
Tall Timber 2.2
Pressure at CP(W/O PM)_PRI Pressure at CP(with PM)_PRI PRV Flow
90-12-76 Date issued: 05/12/2014 Page 42 of 62 Rev: 1
Logan South Water Supply Pressure Management - Detailed Planning
Document Number: 7600-000-P-REP-PL-8230
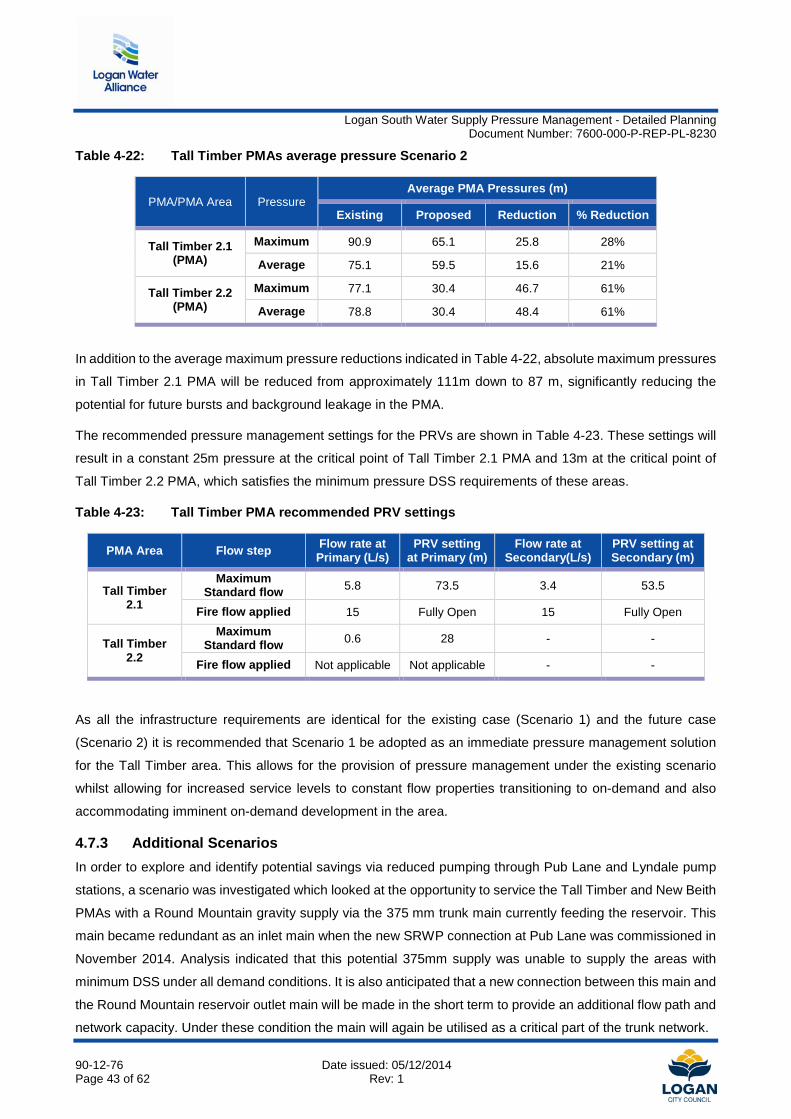
Table 4-22: Tall Timber PMAs average pressure Scenario 2
PMA/PMA Area Pressure Average PMA Pressures (m)
Existing Proposed Reduction % Reduction
Tall Timber 2.1 (PMA)
Maximum 90.9 65.1 25.8 28%
Average 75.1 59.5 15.6 21%
Tall Timber 2.2 (PMA)
Maximum 77.1 30.4 46.7 61%
Average 78.8 30.4 48.4 61%
In addition to the average maximum pressure reductions indicated in Table 4-22, absolute maximum pressures
in Tall Timber 2.1 PMA will be reduced from approximately 111m down to 87 m, significantly reducing the
potential for future bursts and background leakage in the PMA.
The recommended pressure management settings for the PRVs are shown in Table 4-23. These settings will
result in a constant 25m pressure at the critical point of Tall Timber 2.1 PMA and 13m at the critical point of
Tall Timber 2.2 PMA, which satisfies the minimum pressure DSS requirements of these areas.
Table 4-23: Tall Timber PMA recommended PRV settings
PMA Area Flow step Flow rate at Primary (L/s)
PRV setting at Primary (m)
Flow rate at Secondary(L/s)
PRV setting at Secondary (m)
Tall Timber 2.1
Maximum Standard flow 5.8 73.5 3.4 53.5
Fire flow applied 15 Fully Open 15 Fully Open
Tall Timber 2.2
Maximum Standard flow 0.6 28 - -
Fire flow applied Not applicable Not applicable - -
As all the infrastructure requirements are identical for the existing case (Scenario 1) and the future case
(Scenario 2) it is recommended that Scenario 1 be adopted as an immediate pressure management solution
for the Tall Timber area. This allows for the provision of pressure management under the existing scenario
whilst allowing for increased service levels to constant flow properties transitioning to on-demand and also
accommodating imminent on-demand development in the area.
4.7.3 Additional Scenarios In order to explore and identify potential savings via reduced pumping through Pub Lane and Lyndale pump
stations, a scenario was investigated which looked at the opportunity to service the Tall Timber and New Beith
PMAs with a Round Mountain gravity supply via the 375 mm trunk main currently feeding the reservoir. This
main became redundant as an inlet main when the new SRWP connection at Pub Lane was commissioned in
November 2014. Analysis indicated that this potential 375mm supply was unable to supply the areas with
minimum DSS under all demand conditions. It is also anticipated that a new connection between this main and
the Round Mountain reservoir outlet main will be made in the short term to provide an additional flow path and
network capacity. Under these condition the main will again be utilised as a critical part of the trunk network. 90-12-76 Date issued: 05/12/2014 Page 43 of 62 Rev: 1
Logan South Water Supply Pressure Management - Detailed Planning
Document Number: 7600-000-P-REP-PL-8230
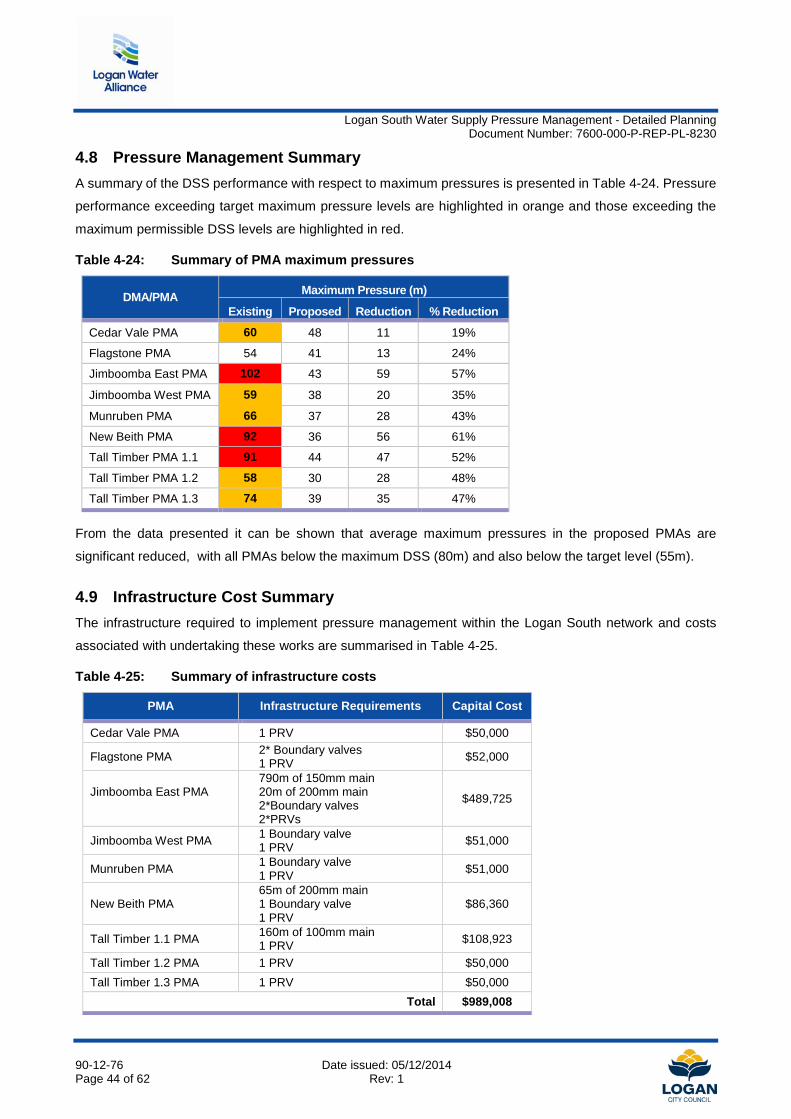
4.8 Pressure Management Summary A summary of the DSS performance with respect to maximum pressures is presented in Table 4-24. Pressure
performance exceeding target maximum pressure levels are highlighted in orange and those exceeding the
maximum permissible DSS levels are highlighted in red.
Table 4-24: Summary of PMA maximum pressures
DMA/PMA Maximum Pressure (m)
Existing Proposed Reduction % Reduction
Cedar Vale PMA 60 48 11 19%
Flagstone PMA 54 41 13 24%
Jimboomba East PMA 102 43 59 57%
Jimboomba West PMA 59 38 20 35%
Munruben PMA 66 37 28 43%
New Beith PMA 92 36 56 61%
Tall Timber PMA 1.1 91 44 47 52%
Tall Timber PMA 1.2 58 30 28 48%
Tall Timber PMA 1.3 74 39 35 47%
From the data presented it can be shown that average maximum pressures in the proposed PMAs are
significant reduced, with all PMAs below the maximum DSS (80m) and also below the target level (55m).
4.9 Infrastructure Cost Summary The infrastructure required to implement pressure management within the Logan South network and costs
associated with undertaking these works are summarised in Table 4-25.
Table 4-25: Summary of infrastructure costs
PMA Infrastructure Requirements Capital Cost
Cedar Vale PMA 1 PRV $50,000
Flagstone PMA 2* Boundary valves 1 PRV $52,000
Jimboomba East PMA
790m of 150mm main 20m of 200mm main 2*Boundary valves 2*PRVs
$489,725
Jimboomba West PMA 1 Boundary valve 1 PRV $51,000
Munruben PMA 1 Boundary valve 1 PRV $51,000
New Beith PMA 65m of 200mm main 1 Boundary valve 1 PRV
$86,360
Tall Timber 1.1 PMA 160m of 100mm main 1 PRV $108,923
Tall Timber 1.2 PMA 1 PRV $50,000 Tall Timber 1.3 PMA 1 PRV $50,000
Total $989,008
90-12-76 Date issued: 05/12/2014 Page 44 of 62 Rev: 1
Logan South Water Supply Pressure Management - Detailed Planning
Document Number: 7600-000-P-REP-PL-8230
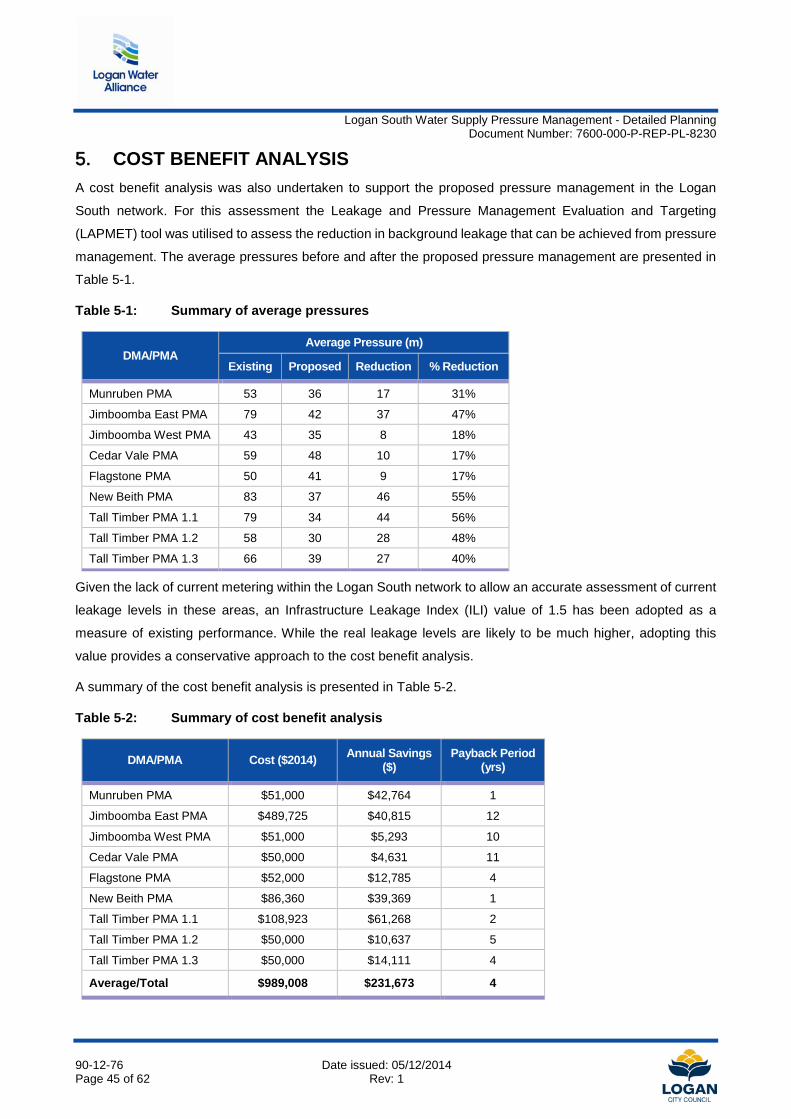
5. COST BENEFIT ANALYSIS A cost benefit analysis was also undertaken to support the proposed pressure management in the Logan
South network. For this assessment the Leakage and Pressure Management Evaluation and Targeting
(LAPMET) tool was utilised to assess the reduction in background leakage that can be achieved from pressure
management. The average pressures before and after the proposed pressure management are presented in
Table 5-1.
Table 5-1: Summary of average pressures
DMA/PMA Average Pressure (m)
Existing Proposed Reduction % Reduction
Munruben PMA 53 36 17 31%
Jimboomba East PMA 79 42 37 47%
Jimboomba West PMA 43 35 8 18%
Cedar Vale PMA 59 48 10 17%
Flagstone PMA 50 41 9 17%
New Beith PMA 83 37 46 55%
Tall Timber PMA 1.1 79 34 44 56%
Tall Timber PMA 1.2 58 30 28 48%
Tall Timber PMA 1.3 66 39 27 40%
Given the lack of current metering within the Logan South network to allow an accurate assessment of current
leakage levels in these areas, an Infrastructure Leakage Index (ILI) value of 1.5 has been adopted as a
measure of existing performance. While the real leakage levels are likely to be much higher, adopting this
value provides a conservative approach to the cost benefit analysis.
A summary of the cost benefit analysis is presented in Table 5-2.
Table 5-2: Summary of cost benefit analysis
DMA/PMA Cost ($2014) Annual Savings ($)
Payback Period (yrs)
Munruben PMA $51,000 $42,764 1
Jimboomba East PMA $489,725 $40,815 12
Jimboomba West PMA $51,000 $5,293 10
Cedar Vale PMA $50,000 $4,631 11
Flagstone PMA $52,000 $12,785 4
New Beith PMA $86,360 $39,369 1
Tall Timber PMA 1.1 $108,923 $61,268 2
Tall Timber PMA 1.2 $50,000 $10,637 5
Tall Timber PMA 1.3 $50,000 $14,111 4
Average/Total $989,008 $231,673 4
90-12-76 Date issued: 05/12/2014 Page 45 of 62 Rev: 1
Logan South Water Supply Pressure Management - Detailed Planning
Document Number: 7600-000-P-REP-PL-8230
From the analysis presented in Table 5-2 and based on the overall savings provided compared to the total
proposed scheme costs, a payback period of 4 years has been calculated for undertaking pressure
management in the Logan South network. This assessment is based purely on the reduction in background
leakage. When also considering a significant reduction in mains bursts and the increasing bulk water costs
this payback period will reduce further.
90-12-76 Date issued: 05/12/2014 Page 46 of 62 Rev: 1
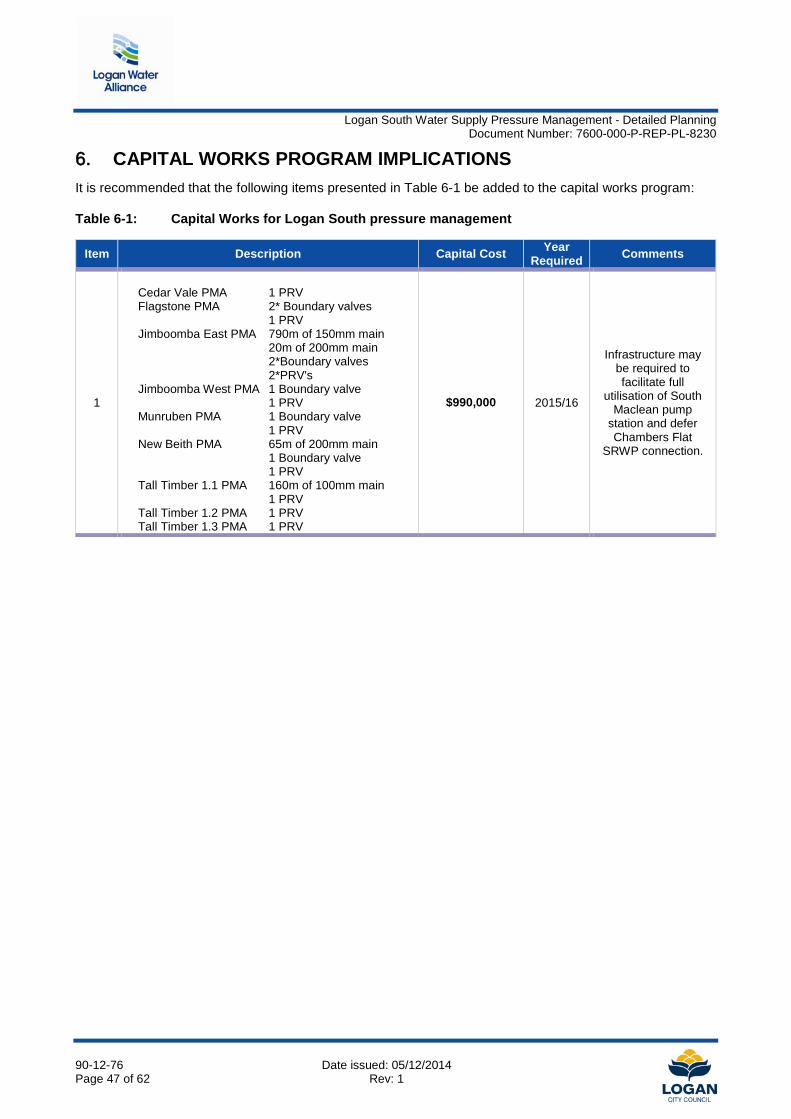
Logan South Water Supply Pressure Management - Detailed Planning
Document Number: 7600-000-P-REP-PL-8230
6. CAPITAL WORKS PROGRAM IMPLICATIONS It is recommended that the following items presented in Table 6-1 be added to the capital works program:
Table 6-1: Capital Works for Logan South pressure management
Item Description Capital Cost Year Required Comments
1
Cedar Vale PMA 1 PRV Flagstone PMA 2* Boundary valves 1 PRV Jimboomba East PMA 790m of 150mm main 20m of 200mm main 2*Boundary valves 2*PRV's Jimboomba West PMA 1 Boundary valve 1 PRV Munruben PMA 1 Boundary valve 1 PRV New Beith PMA 65m of 200mm main 1 Boundary valve 1 PRV Tall Timber 1.1 PMA 160m of 100mm main 1 PRV Tall Timber 1.2 PMA 1 PRV Tall Timber 1.3 PMA 1 PRV
$990,000 2015/16
Infrastructure may be required to facilitate full
utilisation of South Maclean pump
station and defer Chambers Flat
SRWP connection.
90-12-76 Date issued: 05/12/2014 Page 47 of 62 Rev: 1
Logan South Water Supply Pressure Management - Detailed Planning
Document Number: 7600-000-P-REP-PL-8230
7. CONCLUSIONS The following conclusions are drawn from this study:
• The percentage of Logan South customers currently exposed to pressures in excess of DSS levels are:
o 46% above target (55m) and below maximum DSS pressures (80m)
o 22% above maximum DSS pressures (80m)
• Proposed works by Council to upgrade the South Maclean Pump Station in 2014/15 will only increase pressures in the Logan South network and exacerbate maximum pressure related issues.
• Following pressure management the statistics are:
o 27% above target (55m) and below maximum DSS pressures (80m)
o 2% above maximum DSS pressures (80m)
• The proposed Tall Timber PMAs and associated infrastructure can accommodate both the planned development and a potential shift in service standards from constant flow to on-demand
• The cost for implementing the proposed pressure management in the Logan South water supply area is $990,000 ($2014)
• Potential savings from reduced background leakage is approximately $230,000/year if pressure management is implemented
• The average payback period for implementing the works is 4 years.
90-12-76 Date issued: 05/12/2014 Page 48 of 62 Rev: 1

Logan South Water Supply Pressure Management - Detailed Planning
Document Number: 7600-000-P-REP-PL-8230
8. RECOMMENDATIONS The Logan Water Alliance recommends that Council:
1. Adopt the proposed pressure management requirements into the Capital Works program for 2015/16
as priority infrastructure at a cost of $990,000.
2. Undertake the detailed design for the proposed infrastructure.
3. Consider delivery in 2014/15 to mitigate the potential infrastructure risks from further pressure
increases as a result of the South Maclean pump station upgrades.
90-12-76 Date issued: 05/12/2014 Page 49 of 62 Rev: B
Logan South Water Supply Pressure Management - Detailed Planning
Document Number: 7600-000-P-REP-PL-8230
9. REFERENCES
Logan Water Alliance 2013, Logan East Water Supply DMA Management & Fire Flow Augmentations Detailed Planning (Task No.90-11-92).
Logan Water Alliance 2013, Logan South Flow Monitoring, Project Development & Detailed Planning (Task No.90-12-05).
ILMSS Ltd 2011, Leakage and Pressure Management Evaluation &Targeting Software LAPMET. Distributed by Water Services Association Australia.
Logan Water Alliance 2014, Master Planning Review - Review of Desired Standards of Service (Task 90-12-43)
90-12-76 Date issued: 05/12/2014 Page 50 of 62 Rev: B

Logan South Water Supply Pressure Management - Detailed Planning
Document Number: 7600-000-P-REP-PL-8230
Appendix A Figures
90-12-76 Date issued: 05/12/2014 Rev: 1
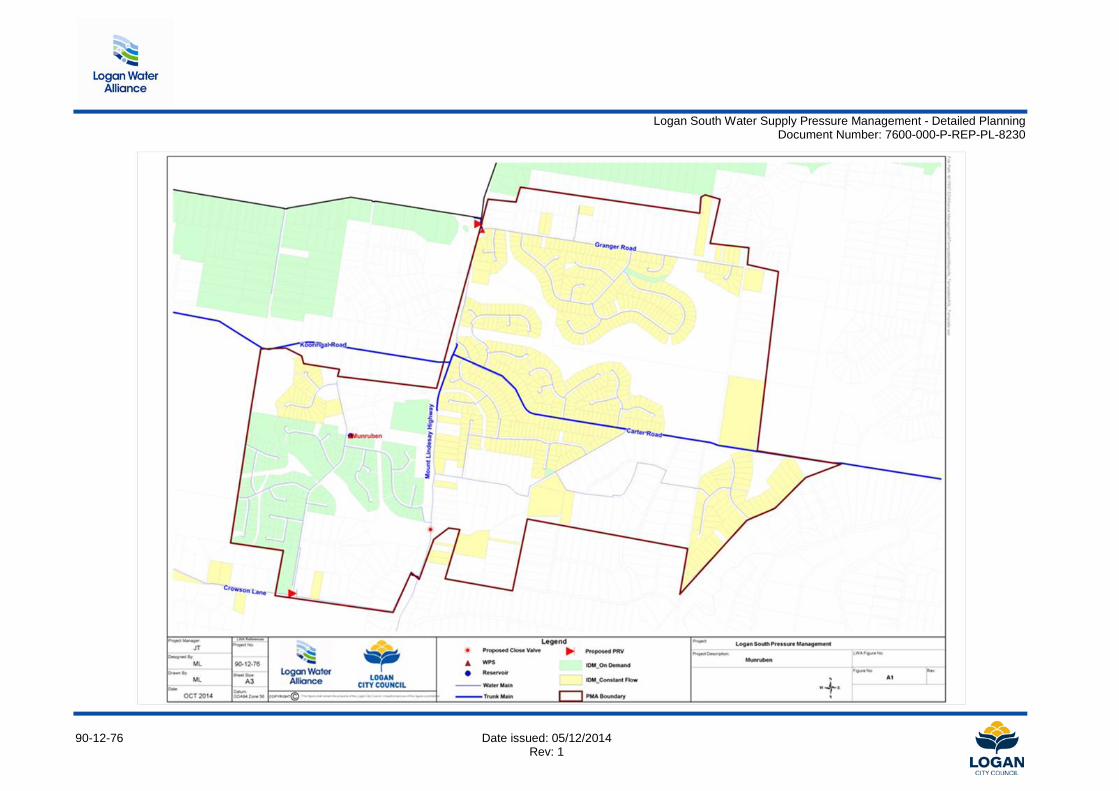
Logan South Water Supply Pressure Management - Detailed Planning
Document Number: 7600-000-P-REP-PL-8230
90-12-76 Date issued: 05/12/2014 Rev: 1
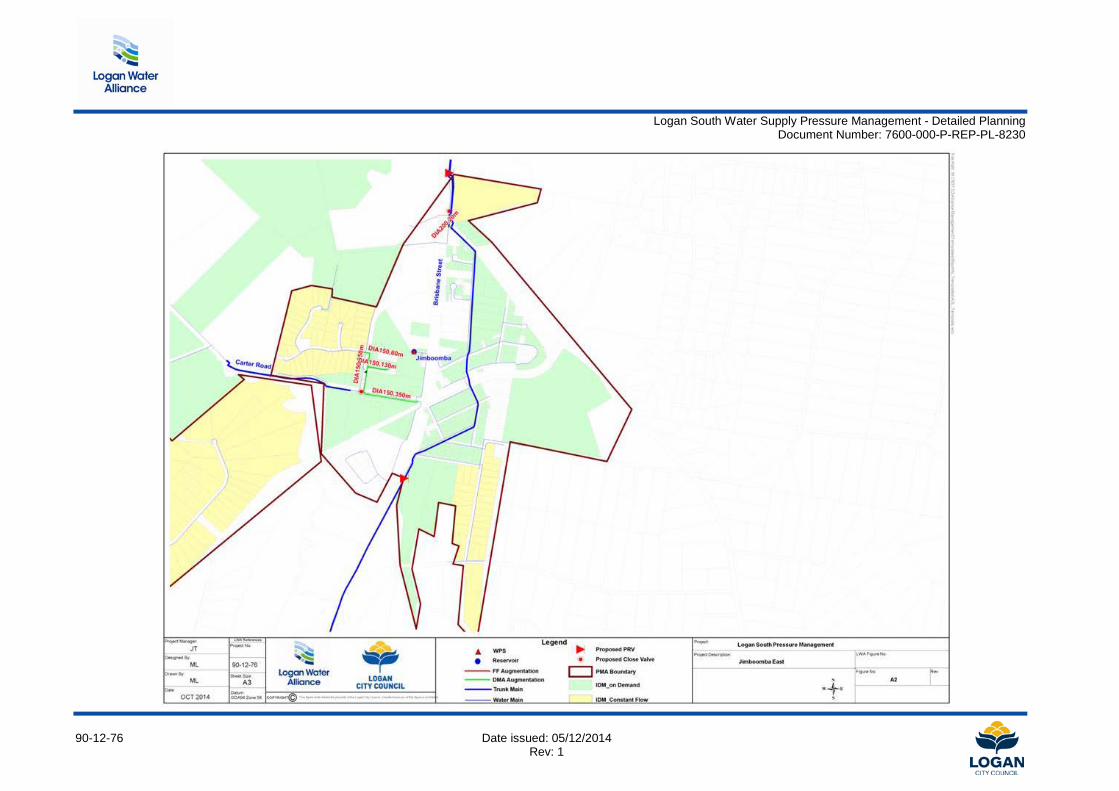
Logan South Water Supply Pressure Management - Detailed Planning
Document Number: 7600-000-P-REP-PL-8230
90-12-76 Date issued: 05/12/2014 Rev: 1
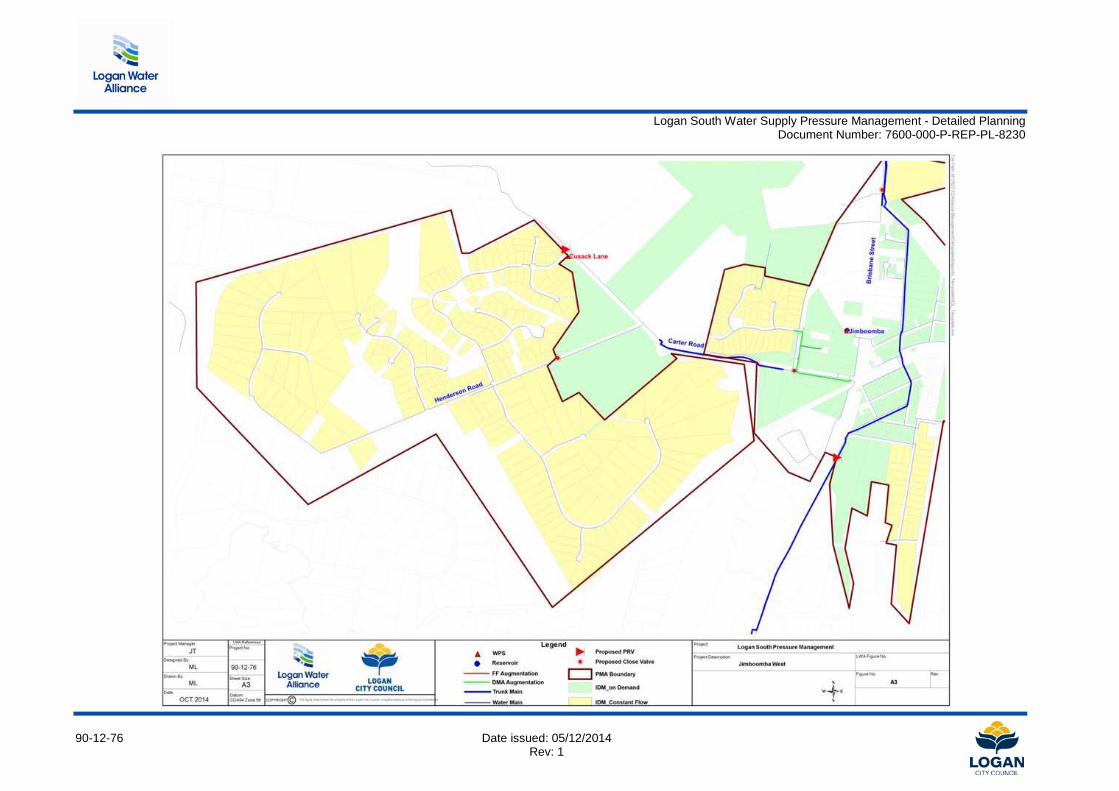
Logan South Water Supply Pressure Management - Detailed Planning
Document Number: 7600-000-P-REP-PL-8230
90-12-76 Date issued: 05/12/2014 Rev: 1

Logan South Water Supply Pressure Management - Detailed Planning
Document Number: 7600-000-P-REP-PL-8230
90-12-76 Date issued: 05/12/2014 Rev: 1
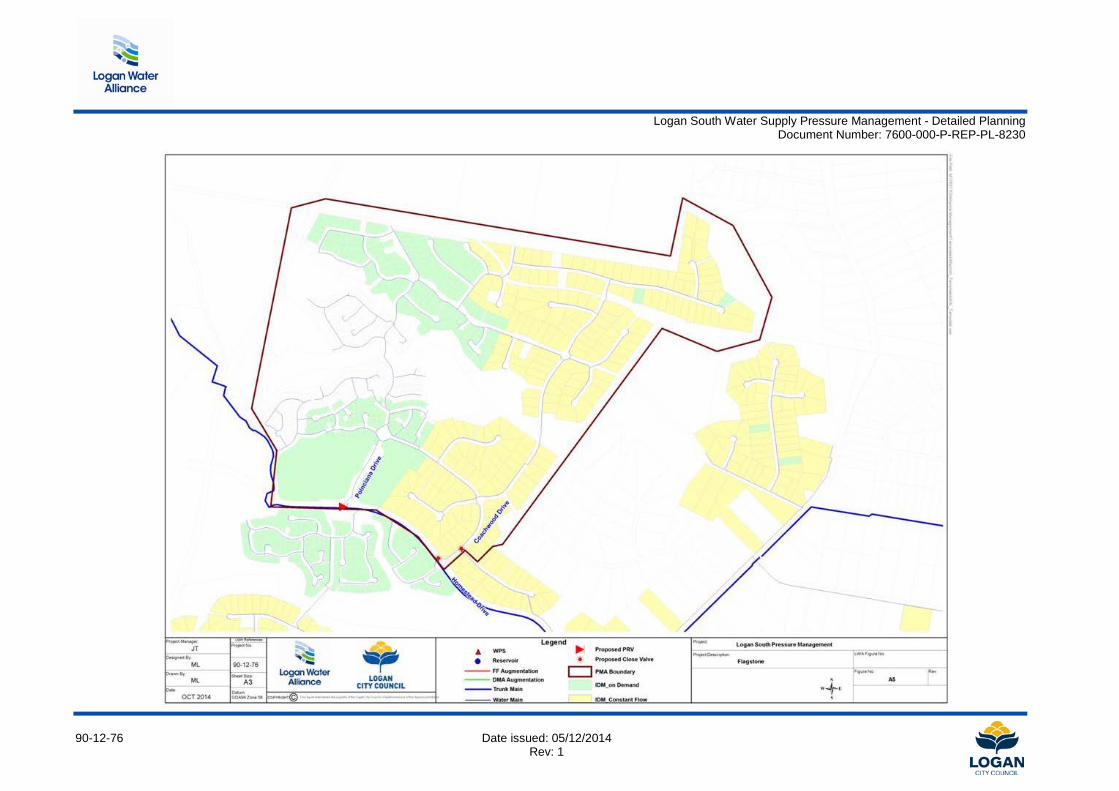
Logan South Water Supply Pressure Management - Detailed Planning
Document Number: 7600-000-P-REP-PL-8230
90-12-76 Date issued: 05/12/2014 Rev: 1
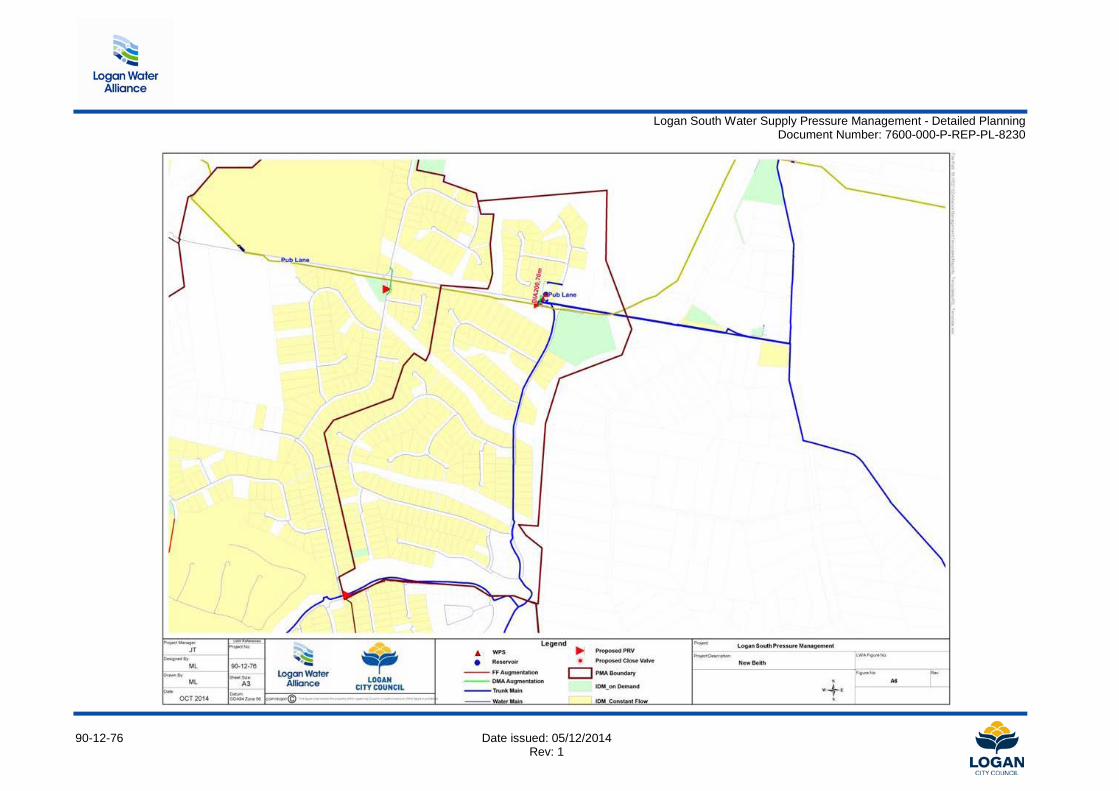
Logan South Water Supply Pressure Management - Detailed Planning
Document Number: 7600-000-P-REP-PL-8230
90-12-76 Date issued: 05/12/2014 Rev: 1
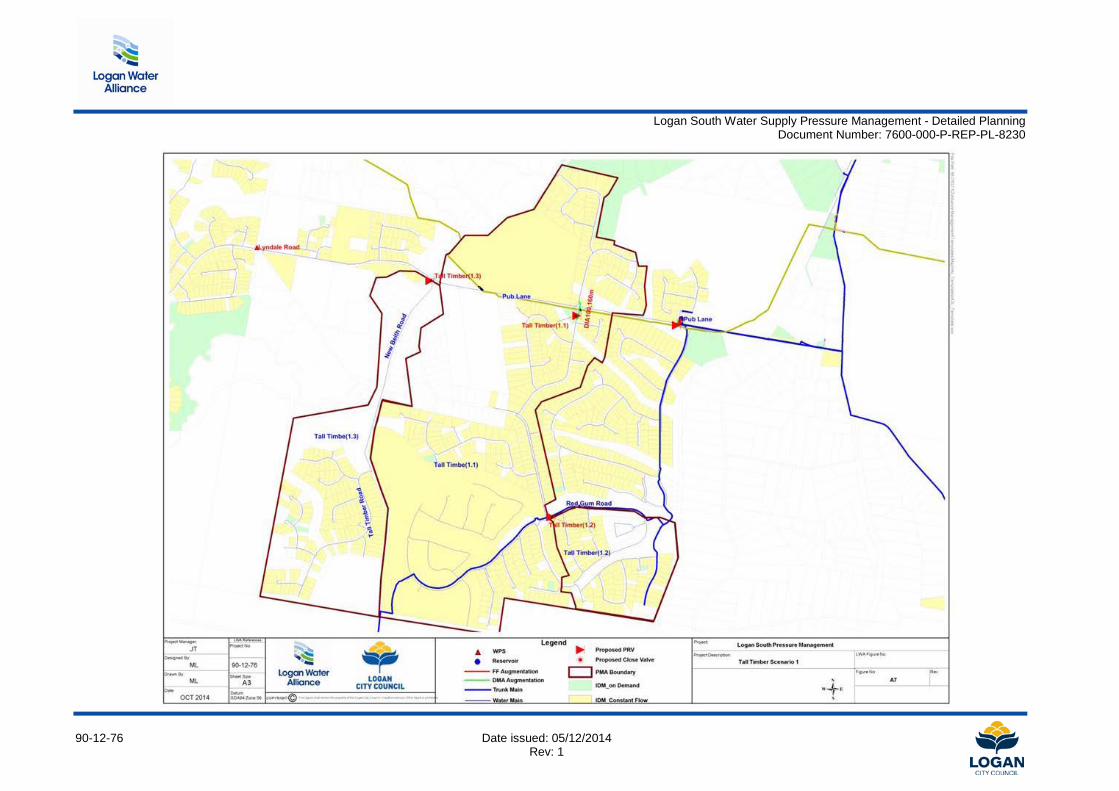
Logan South Water Supply Pressure Management - Detailed Planning
Document Number: 7600-000-P-REP-PL-8230
90-12-76 Date issued: 05/12/2014 Rev: 1
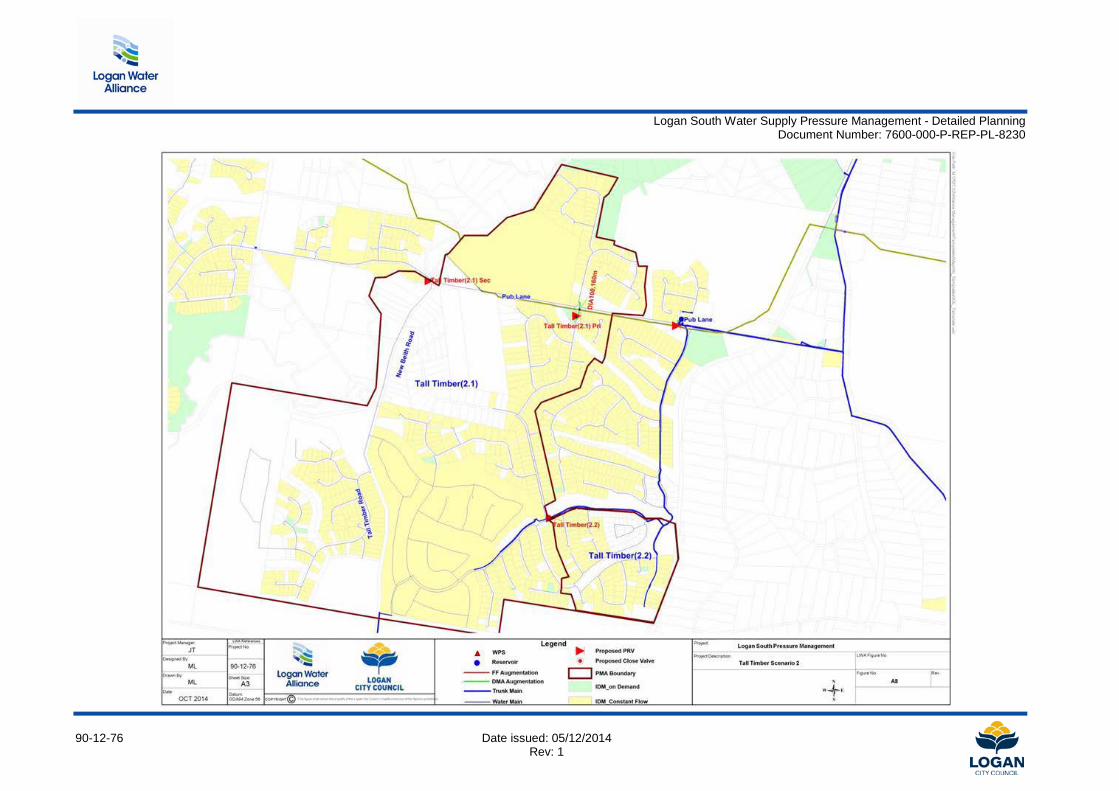
Logan South Water Supply Pressure Management - Detailed Planning
Document Number: 7600-000-P-REP-PL-8230
90-12-76 Date issued: 05/12/2014 Rev: 1
Logan South Water Supply Pressure Management - Detailed Planning
Document Number: 7600-000-P-REP-PL-8230
Appendix B Desired Standards of Service
90-12-76 Date issued: 05/12/2014 Rev: 1
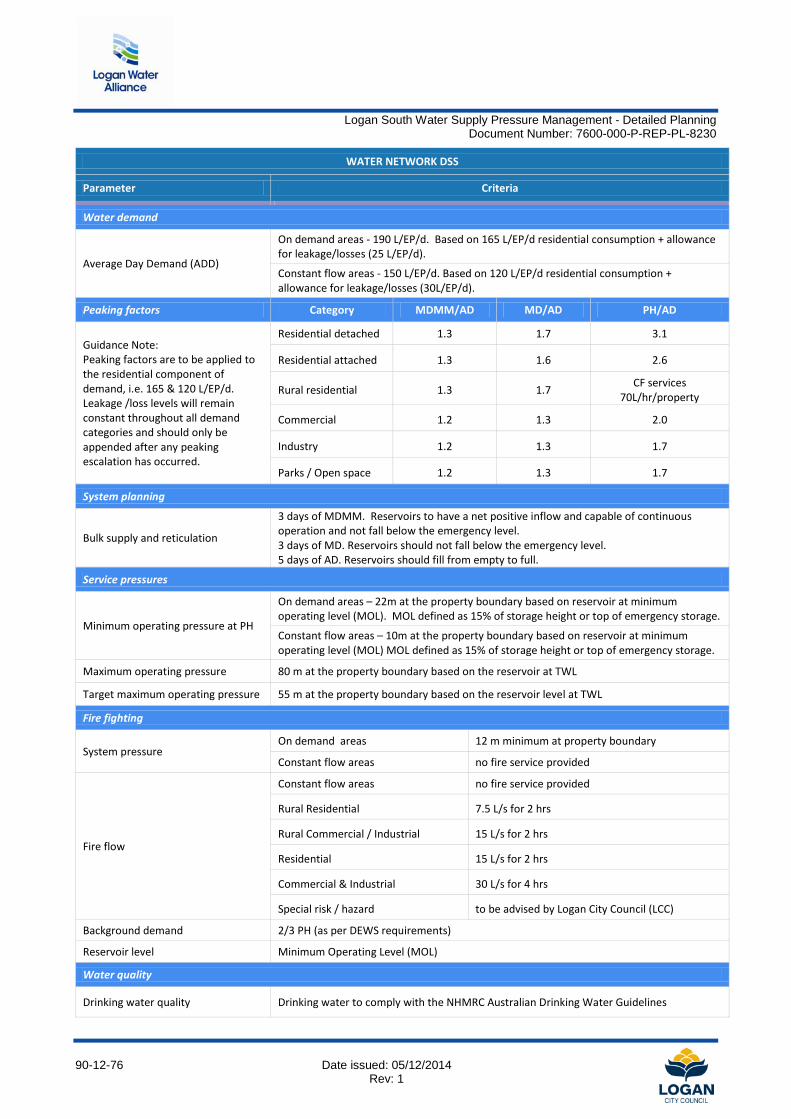
Logan South Water Supply Pressure Management - Detailed Planning
Document Number: 7600-000-P-REP-PL-8230
WATER NETWORK DSS
Parameter Criteria
Water demand
Average Day Demand (ADD)
On demand areas - 190 L/EP/d. Based on 165 L/EP/d residential consumption + allowance for leakage/losses (25 L/EP/d).
Constant flow areas - 150 L/EP/d. Based on 120 L/EP/d residential consumption + allowance for leakage/losses (30L/EP/d).
Peaking factors Category MDMM/AD MD/AD PH/AD
Guidance Note: Peaking factors are to be applied to the residential component of demand, i.e. 165 & 120 L/EP/d. Leakage /loss levels will remain constant throughout all demand categories and should only be appended after any peaking escalation has occurred.
Residential detached 1.3 1.7 3.1
Residential attached 1.3 1.6 2.6
Rural residential 1.3 1.7 CF services 70L/hr/property
Commercial 1.2 1.3 2.0
Industry 1.2 1.3 1.7
Parks / Open space 1.2 1.3 1.7
System planning
Bulk supply and reticulation
3 days of MDMM. Reservoirs to have a net positive inflow and capable of continuous operation and not fall below the emergency level. 3 days of MD. Reservoirs should not fall below the emergency level. 5 days of AD. Reservoirs should fill from empty to full.
Service pressures
Minimum operating pressure at PH
On demand areas – 22m at the property boundary based on reservoir at minimum operating level (MOL). MOL defined as 15% of storage height or top of emergency storage.
Constant flow areas – 10m at the property boundary based on reservoir at minimum operating level (MOL) MOL defined as 15% of storage height or top of emergency storage.
Maximum operating pressure 80 m at the property boundary based on the reservoir at TWL
Target maximum operating pressure 55 m at the property boundary based on the reservoir level at TWL
Fire fighting
System pressure On demand areas 12 m minimum at property boundary
Constant flow areas no fire service provided
Fire flow
Constant flow areas no fire service provided
Rural Residential 7.5 L/s for 2 hrs
Rural Commercial / Industrial 15 L/s for 2 hrs
Residential 15 L/s for 2 hrs
Commercial & Industrial 30 L/s for 4 hrs
Special risk / hazard to be advised by Logan City Council (LCC)
Background demand 2/3 PH (as per DEWS requirements)
Reservoir level Minimum Operating Level (MOL)
Water quality
Drinking water quality Drinking water to comply with the NHMRC Australian Drinking Water Guidelines
90-12-76 Date issued: 05/12/2014 Rev: 1
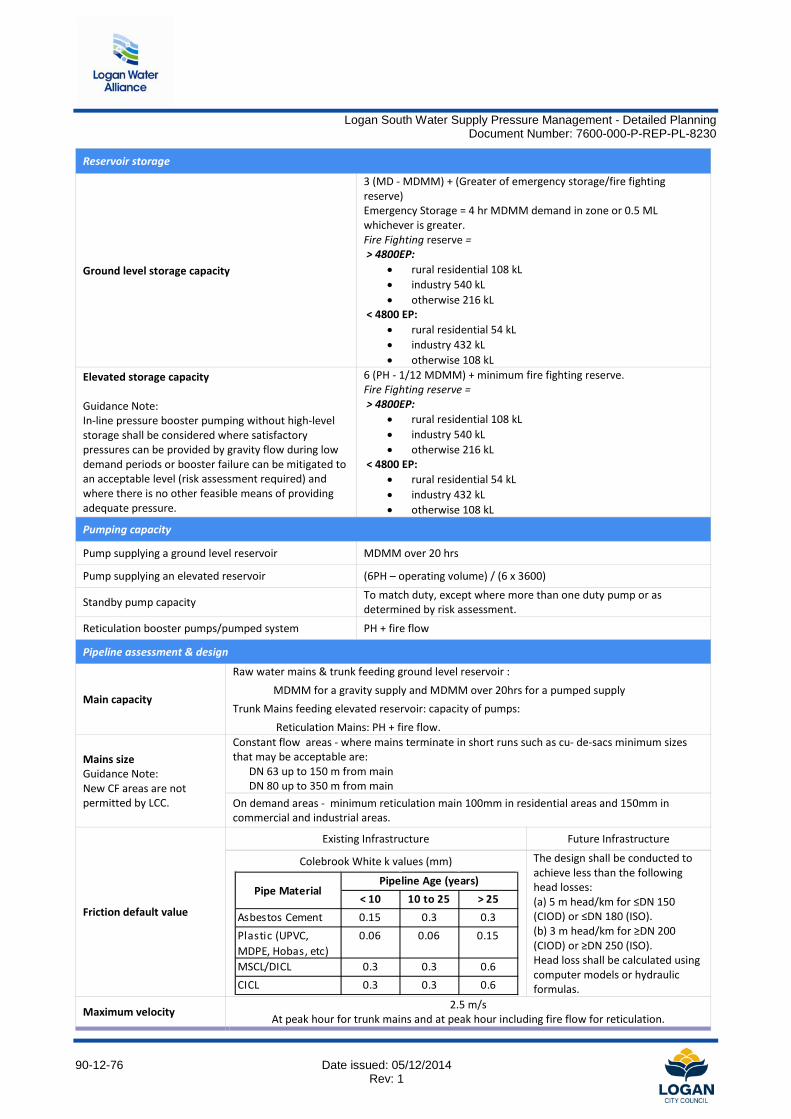
Logan South Water Supply Pressure Management - Detailed Planning
Document Number: 7600-000-P-REP-PL-8230
Reservoir storage
Ground level storage capacity
3 (MD - MDMM) + (Greater of emergency storage/fire fighting reserve) Emergency Storage = 4 hr MDMM demand in zone or 0.5 ML whichever is greater. Fire Fighting reserve = > 4800EP:
• rural residential 108 kL • industry 540 kL • otherwise 216 kL
< 4800 EP: • rural residential 54 kL • industry 432 kL • otherwise 108 kL
Elevated storage capacity Guidance Note: In-line pressure booster pumping without high-level storage shall be considered where satisfactory pressures can be provided by gravity flow during low demand periods or booster failure can be mitigated to an acceptable level (risk assessment required) and where there is no other feasible means of providing adequate pressure.
6 (PH - 1/12 MDMM) + minimum fire fighting reserve. Fire Fighting reserve = > 4800EP:
• rural residential 108 kL • industry 540 kL • otherwise 216 kL
< 4800 EP: • rural residential 54 kL • industry 432 kL • otherwise 108 kL
Pumping capacity
Pump supplying a ground level reservoir MDMM over 20 hrs
Pump supplying an elevated reservoir (6PH – operating volume) / (6 x 3600)
Standby pump capacity To match duty, except where more than one duty pump or as determined by risk assessment.
Reticulation booster pumps/pumped system PH + fire flow
Pipeline assessment & design
Main capacity
Raw water mains & trunk feeding ground level reservoir : MDMM for a gravity supply and MDMM over 20hrs for a pumped supply Trunk Mains feeding elevated reservoir: capacity of pumps: Reticulation Mains: PH + fire flow.
Mains size Guidance Note: New CF areas are not permitted by LCC.
Constant flow areas - where mains terminate in short runs such as cu- de-sacs minimum sizes that may be acceptable are: DN 63 up to 150 m from main DN 80 up to 350 m from main On demand areas - minimum reticulation main 100mm in residential areas and 150mm in commercial and industrial areas.
Friction default value
Existing Infrastructure Future Infrastructure
Colebrook White k values (mm)
The design shall be conducted to achieve less than the following head losses: (a) 5 m head/km for ≤DN 150 (CIOD) or ≤DN 180 (ISO). (b) 3 m head/km for ≥DN 200 (CIOD) or ≥DN 250 (ISO). Head loss shall be calculated using computer models or hydraulic formulas.
Maximum velocity 2.5 m/s At peak hour for trunk mains and at peak hour including fire flow for reticulation.
< 10 10 to 25 > 25 Asbestos Cement 0.15 0.3 0.3Plastic (UPVC, MDPE, Hobas, etc)
0.06 0.06 0.15
MSCL/DICL 0.3 0.3 0.6CICL 0.3 0.3 0.6
Pipeline Age (years)Pipe Material
90-12-76 Date issued: 05/12/2014 Rev: 1


![Water Plan (Logan Basin) 2007queenslandwaterbrokers.com/.../2016/12/WatResLBP07.pdf · [s 1] Water Plan (Logan Basin) 2007 Part 1 Preliminary Current as at 6 December 2016 Page 5](https://img.pdfslide.net/doc/110x75/5b627ae67f8b9a4f488d9730/water-plan-logan-basin-2007qu-s-1-water-plan-logan-basin-2007-part-1-preliminary.jpg)