Embed Size (px)
Citation preview
1
LOGISTICS INTEGRATION PROCESSES
IN THE FOOD INDUSTRY
CRISTINA GIMÉNEZT
GREL-IET; Universitat Pompeu Fabra*
Abstract
This paper analyses the integration process that firms follow to implement Supply Chain Management (SCM). This study has been inspired in the integration model proposed by Stevens (1989). He suggests that companies internally integrate first and then extend integration to other supply chain members, such as customers and suppliers. To analyse the integration process a survey was conducted among Spanish food manufacturers. The results show that there are companies in three different integration stages. In stage I, companies are not integrated. In stage II, companies have a medium-high level of internal integration in the Logistics-Production interface, a low level of internal integration in the Logistics-Marketing interface, and a medium level of external integration. And, in stage III, companies have high levels of integration in both internal interfaces and in some of their supply chain relationships.
Key words
Supply Chain Management, Food industry, Logistics integration process.
JEL codes
L290, L660, M100, M110
T The author thanks the members of GREL-IET for their comments and suggestions.
* Cristina Giménez Thomsen. Departament d’Economia I Empresa. UPF. Ramon Trias Fargas, 25-27. 08005 Barcelona, Spain. Phone: 34-935422901. Fax: 34-935421746. E-mail: [email protected].
brought to you by COREView metadata, citation and similar papers at core.ac.uk
provided by Research Papers in Economics

2
1. Introduction
The process industries cover a wide range of businesses and realize a considerable
portion of GDP in many countries. However, few Operations Management research
has paid attention to this type of industries. The aim of this paper is to analyse the
Supply Chain Management (SCM) implementation model in a particular process
industry: the food manufacturing.
Integration along the supply chain is a topic of interest and importance among logistics
managers and researchers because it has been considered a source of better supply
chain performance (Shapiro, 1984; Scott & Westbrook, 1991; Byrne & Javad, 1992;
Gustin, Stank & Daugherty, 1994; The Global Research Team at Michigan State
University, 1995; Christopher, 1998; Cooper, 1993; Ellram & Cooper, 1993; and
Christiansee & Kumar, 2000) and competitive advantage (Christopher, 1998).
However, few empirical studies analyse the integration process (Stank, Keller &
Daugherty, 2001; and Gimenez & Ventura, 2003).
During the 1990’s some companies initiated an integration process through the
implementation of the SCM approach. SCM is “the integration of key business
processes from end user through original suppliers that provides products, services,
and information that add value for customers and other stakeholders” (Lambert,
Cooper & Pagh, 1998). This integrative philosophy involves internal and external
integration. Internal integration refers to the coordination, collaboration and integration
of Logistics with other functional areas, while external integration refers to the
integration of a firm’s logistics activities with those of their customers and suppliers
(Stock, Greis & Kasarda, 1998).
Stevens (1989) suggests that companies integrate internally first, and then, extend
integration to other supply chain members. Companies usually follow an integration
3
process that goes through three different stages. In stage I, there is no integration. In
stage II companies are internally integrated: their logistics activities are integrated with
the activities of other functional units, such as Purchasing, Production and Marketing.
And, in stage III, the internal integration achieved in stage II is extended to other supply
chain members, such as customers and suppliers.
The objectives of this paper are: (1) to analyse the integration process (internal –
external integration); (2) to compare the integration in the Logistics-Production interface
with the integration in the Logistics-Marketing interface, and (3) to explore the
integration stage of Spanish food manufacturers.
Our contribution to the existing body of knowledge on integration topics is to obtain an
in depth knowledge of the integration process, comparing two levels of internal
integration (Logistics-Marketing and Logistics-Production) and analysing the
relationship between these internal integration levels and the level of external
integration. We will describe the integration model that Spanish food manufacturers are
following.
The remainder of the paper is structured as follows. Section two briefly examines the
literature on logistics’ integration topics; section three describes the research
methodology; section four presents the research results and section five draws the
conclusions and managerial implications from this work.
2. Literature review
2.1. Previous logistics’ integration research
Many studies consider internal or external integration from the logistics’ point of view
(Daugherty, Sabath, & Rogers, 1992; Larson, 1994; Daugherty, Ellinger & Rogers,
1995; Groves & Valsamakis, 1998; Stank, Crum & Arango, 1999; Stank, Daugherty &
4
Autry, 1999; Ellinger, Daugherty & Keller, 2000; Ellinger, Taylor & Daugherty, 2000;
Scannell, Vickery. & Dröge, 2000; and Stank, Daugherty & Ellinger, 2000), but very few
consider both integration levels simultaneously (Stank, Keller & Daugherty, 2001;
Gimenez & Ventura, 2003 and 2003b).
The studies of Stank, Keller & Daugherty (2001) and Gimenez & Ventura (2003 and
2003b) share a common aim: to analyse the impact of internal and external integration
on performance. The integration-performance models of these authors included also a
relationship between the levels of internal and external integration. All of them found
that these levels of integration are positively correlated. This suggests that they
positively influence each other.
Our study follows a similar framework to the one used by Stank, Keller & Daugherty
(2001) and Gimenez & Ventura (2003 and 2003b), but it differs from them in some
points:
• Stank, Keller and Daugherty (2001) conducted a multi-industry analysis to study
the relationship between integration and performance, while we consider the
integration process of companies that belong to the same industry. Other
differences between this study and ours are: first, they consider a unique level
of internal integration, while we compare the integration achieved in two internal
interfaces (Logistics-Marketing and Logistics-Production). And, second, they
consider a unique level of external integration for each firm, while we consider
that the level of external integration has to be related to a particular relationship
(of the firm) and not to the firm itself.
• Gimenez & Ventura (2003 and 2003b) conducted a survey in the Spanish
grocery sector to analyse the integration-performance relationship. While the
first paper (Gimenez & Ventura, 2003) only considers internal integration in the
5
Logistics-Production interface, the second one (Gimenez & Ventura, 2003b)
considers two internal interfaces (Logistics-Production and Logistics-Marketing),
as we do in this study. Regarding the level of external integration, we share
their approach: to relate the level of external integration to particular
relationships and not to the firm itself. The main difference between the works
of Gimenez & Ventura (2003 and 2003b) and this paper is that they analyse if
there is any relationship between the level of internal and external integration
without studying the integration process itself, while we focus on the integration
process.
2.2. The integration model
This paper considers internal and external integration. Internal integration refers to the
coordination, collaboration and integration of Logistics with other functional areas
(Stock, Greis & Kasarda, 1998). This paper considers internal integration in two
different interfaces: Logistics-Marketing and Logistics-Production. We consider these
interfaces for two reasons: first, the coordination between these areas is vital to
produce and serve what customers demand, how and when they want. And, second,
Logistics is an organizational function which shares responsibilities with Marketing and
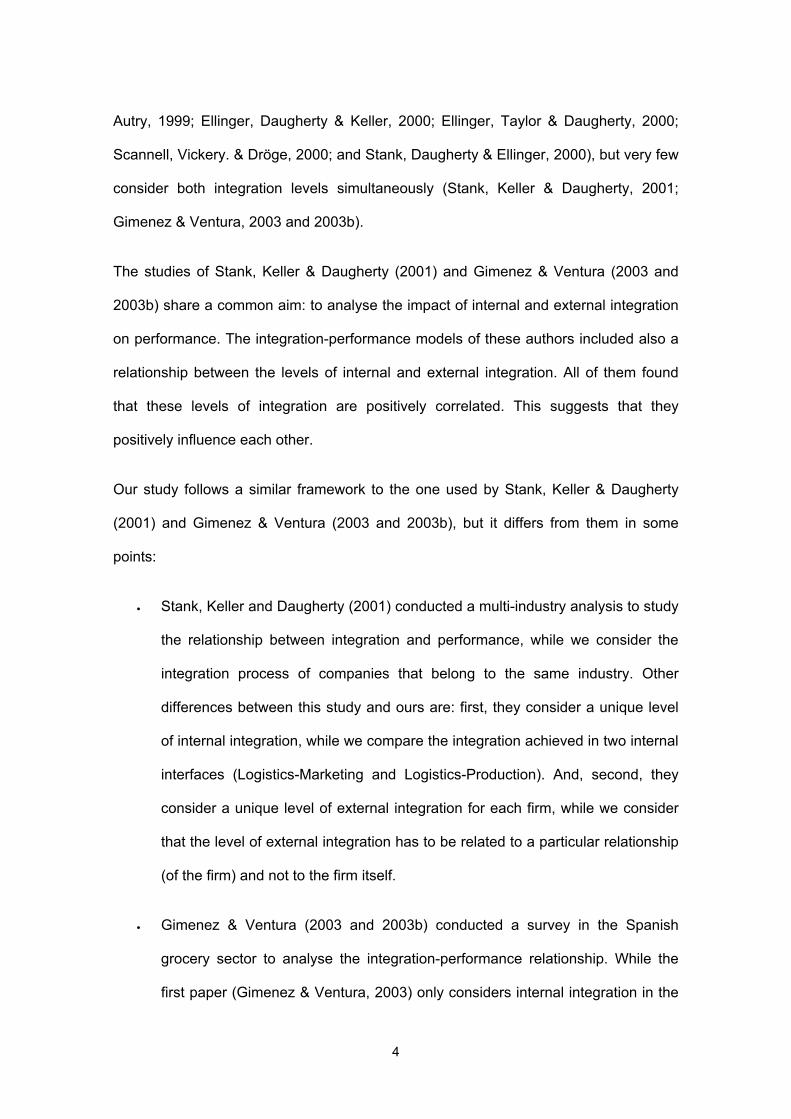
Production (Casanovas & Cuatrecasas, 2001). The combination of the integration
levels achieved in these two interfaces are shown in figure 1. At one extreme is a
strategy of little or no integration (Option 1). At the other end of the continuum is a
strategy with high levels of integration in both internal interfaces: Logistics-Marketing
and Logistics-Production (Option 4). And, in between these polar extremes are
companies whose strategies involve integration in the Logistics-Marketing interface
(Option 3) or the Logistics-Production interface (Option 2).
6
Figure 1. Internal integration
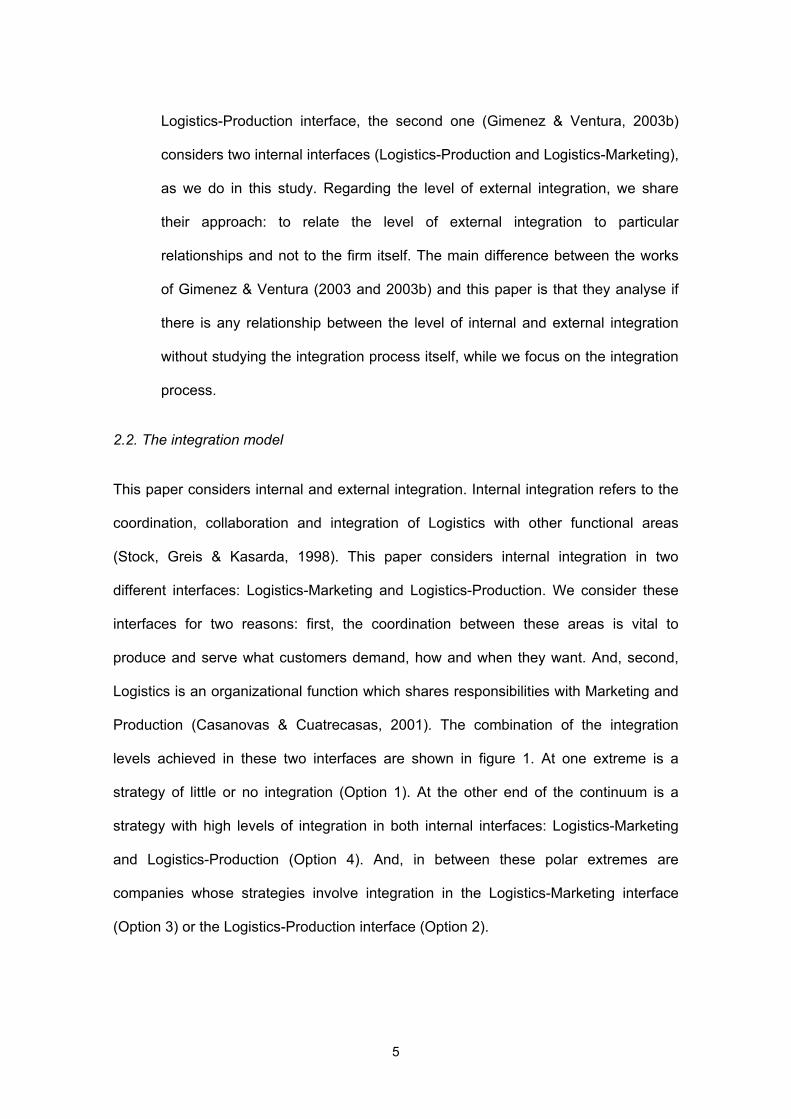
External integration refers to the integration of a firm’s logistics activities with those of
their customers and suppliers (Stock, Greis & Kasarda, 1998). When external
integration is considered, the model shown in figure 1 is transformed into the model
shown in figure 2, where the height represents the level of external integration.
Figure 2. Internal and external integration
Option 4
Option 3
Option 2
Option 1
LM
LP
low high
low
high
LM
Option 1
LP
low high
low
high
Option 4
Option 2
EI
low
high
Option 3
7
The first set of hypotheses relates to the interrelationship of internal and external
collaboration. The literature suggests that firms must achieve a relatively high degree
of collaboration among internal processes before initiating supply chain arrangements
(Stevens, 1989). The inability to integrate fully within the firm’s logistics operations is a
leading cause of strategic alliance failure. Breakdowns in internal collaboration inhibit
delivery of promised performance levels (The Global Logistics Team at Michigan State
University, 1995).
Hypothesis H1a. Firms must achieve a relatively high degree of collaboration among
internal processes before initiating external integration.
However, interviews we conducted in preparation for this research raised concerns
regarding this relationship. One leading FMCG (Fast Moving Consumer Good)
manufacturer had initiated an external integration arrangement with one grocery retailer
without being internally integrated. This case leads us to the following hypothesis:
Hypothesis H1b. Firms must achieve a relatively high degree of external integration
before initiating internal integration.
Stevens (1989) suggests that external integration is an extension of the internal
integration achieved in a previous stage. Accordingly, companies with a low internal
integration strategy (Option 1) should present a low level of external integration and
companies implementing the full internal integration strategy (Option 4) should have
the highest levels of external integration. And, given the partial nature of the internal
integration achieved by companies implementing Options 2 and 3, the level of external
integration of these companies should logically fall between the low internal integration
(Option 1) and full internal integration (Option 4) approaches. These arguments lead to
the following set of hypotheses:
8
Hypothesis H2a. Companies adopting a full internal integration strategy (Option 4) will
have the highest levels of external integration.
Hypothesis H2b. Companies adopting either a Logistics-Production (Option 2) or a
Logistics-Marketing (Option 3) integration strategy will have medium levels of external
integration.
Hypothesis H2c. Companies adopting a low internal integration strategy (Option 1) will
have the lowest levels of external integration.
3. Methodology
3.1. Data collection
The survey was developed in two stages. First, we identified relevant measures of
internal and external integration. And, then, we held a series of meetings with logistics
professors and logistics managers to gauge the content and face validity of the survey.
Data were collected from a sample of Spanish manufacturers of the food sector. These
companies were selected from the Spanish data base “Fomento de la Producción
25.000 empresas”. We restricted ourselves to the food manufacturers and chose those
companies with a sales figure in 1999 equal to or higher than 30 million euros. The
resulting sample had 172 companies. By sampling an entire country, the research
controlled for many confounding factors like telecommunications infrastructure, costs
and the overall economy. And, by focusing only on one industry we controlled for other
confounding factors, such as the level of implementation of SCM in the industry (there
are industries, such as the automotive, where SCM has been implemented for years),
the level of competence and the industry’s environment.
9
The data collection was conducted during the spring-summer of year 2001. Given the
strategic focus of the research, it was decided to mail the questionnaire to the Logistics
or Supply Chain executive of each firm. The industry breakdown of the sample is
shown in Table 1. As early notification of prospective respondents is believed to
increase response rates (Fox, Crask & Kim, 1988), we decided to telephone each firm
and ask for their participation in the study. From the 172 companies, only one company
refused to participate in the study. The total number of complete questionnaires was
51, which represents a 29,82% response rate. Potential participants were asked to
provide sensitive and confidential data, so the response rate of 29,82% is considered
very satisfactory, especially when compared to the response rate of other studies. For
example, Groves & Valsamakis (1998) used data from a survey with a response rate of
15%; Stank, Daugherty & Autry (1999) worked with a 20,2% response rate, and Stank,
Keller & Daugherty (2001) worked with a 11,5% response rate.
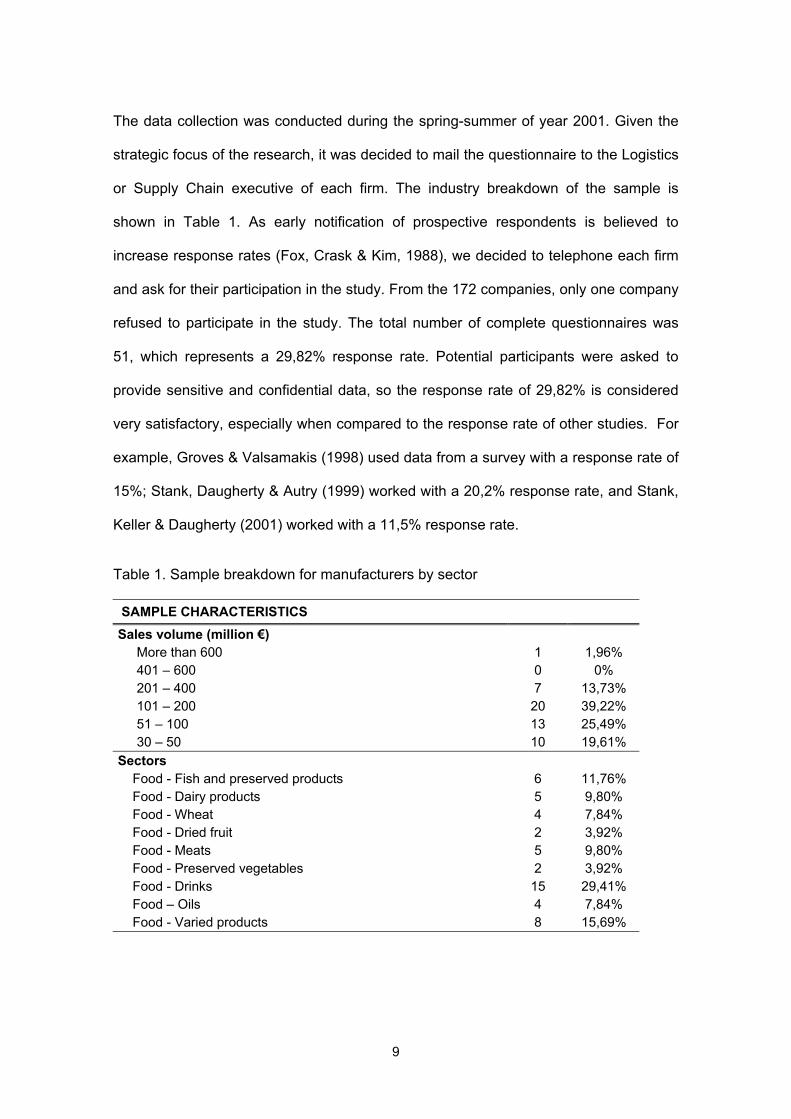
Table 1. Sample breakdown for manufacturers by sector
SAMPLE CHARACTERISTICS Sales volume (million €)
More than 600 1 1,96% 401 – 600 0 0% 201 – 400 7 13,73% 101 – 200 20 39,22% 51 – 100 13 25,49% 30 – 50 10 19,61%
Sectors Food - Fish and preserved products 6 11,76% Food - Dairy products 5 9,80% Food - Wheat 4 7,84% Food - Dried fruit 2 3,92% Food - Meats 5 9,80% Food - Preserved vegetables 2 3,92% Food - Drinks 15 29,41% Food – Oils 4 7,84% Food - Varied products 8 15,69%
10
We conducted an analysis of non-response bias based on the procedure described in
Armstrong and Overton (1977) and Lambert and Harrington (1990). We numbered the
responses sequentially, in the order they were received, and compared late responses
with early responses. No noticeable pattern among the variables could be detected to
indicate the existence of a non-response bias. Accordingly, non-response bias is
unlikely to be an issue in interpreting the results of this study.
3.2. Scale development
Respondents were asked to rate on multi-item scales their degree of internal
integration in the Logistics-Production and Logistics-Marketing interfaces, and their
level of external integration in two supply chain relationships. Internal integration was
considered in these two interfaces because, as stated before, the coordination between
them is vital to produce and serve what customers demand, how and when they want.
And, external integration was analysed for particular relationships because we consider
that companies usually strategically segment their relationships (Kraljic, 1983;
Copacino, 1990; Anderson and Narus, 1991; Cooper and Gardner, 1993, Dyer, Cho
and Chu, 1998; Tang, 1999, Masella and Rangone, 2000) and establish high
collaborating relationships with some supply chain members and arm’s length
relationships with others. Therefore, each firm was asked to think about two
manufacturer-retailer relationships. The first relationship was supposed to be the most
collaborating one, and the second the least collaborating relationship.
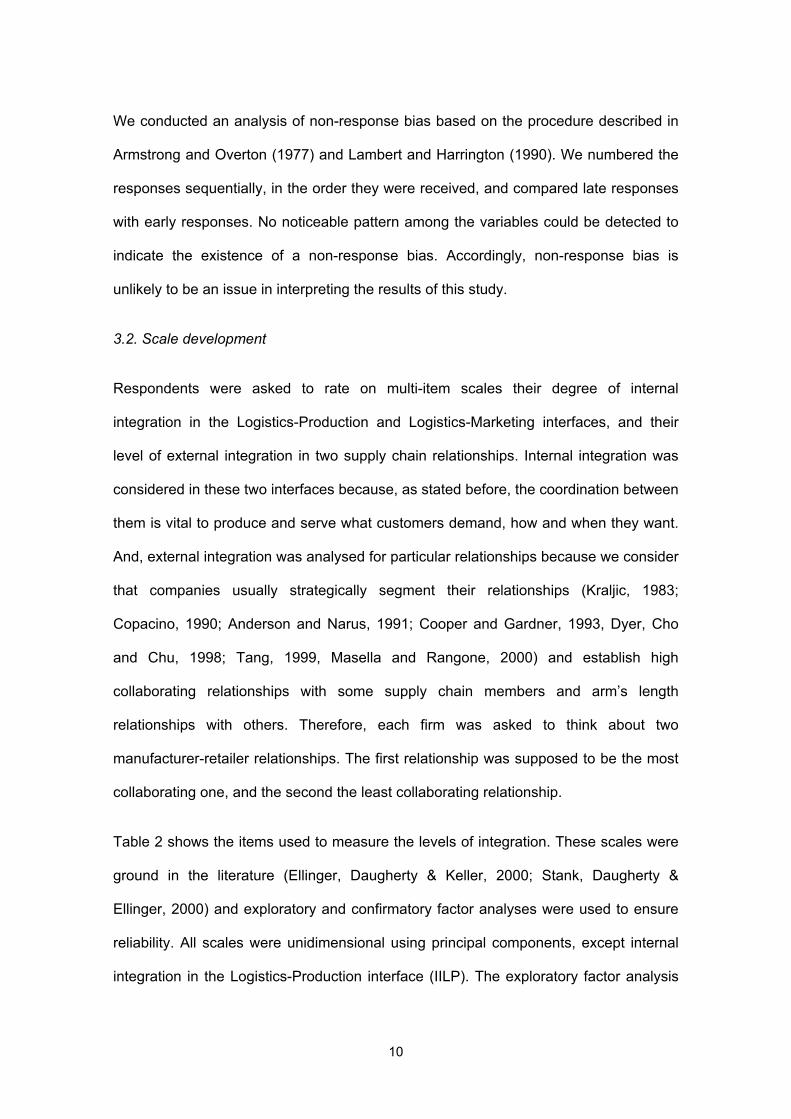
Table 2 shows the items used to measure the levels of integration. These scales were
ground in the literature (Ellinger, Daugherty & Keller, 2000; Stank, Daugherty &
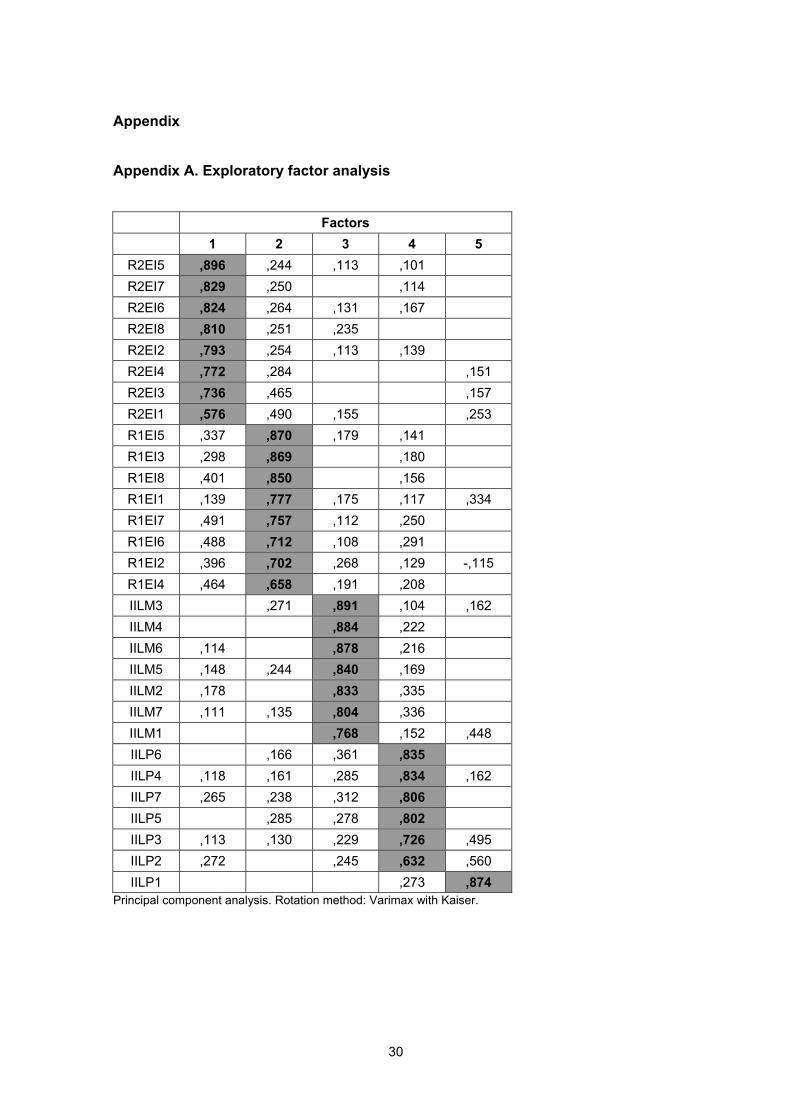
Ellinger, 2000) and exploratory and confirmatory factor analyses were used to ensure
reliability. All scales were unidimensional using principal components, except internal
integration in the Logistics-Production interface (IILP). The exploratory factor analysis
11
(shown in Appendix A) showed that IILP1 was related with a different factor. As a
result, the first proposed measure for internal integration in the Logistics-Production
interface (IILP1) was discarded. The scales were summed averages of the
measurement items and reliability (see Cronbach’s α in Table 3) was very satisfactory.
Table 3 also shows the measures’ Pearson correlation.
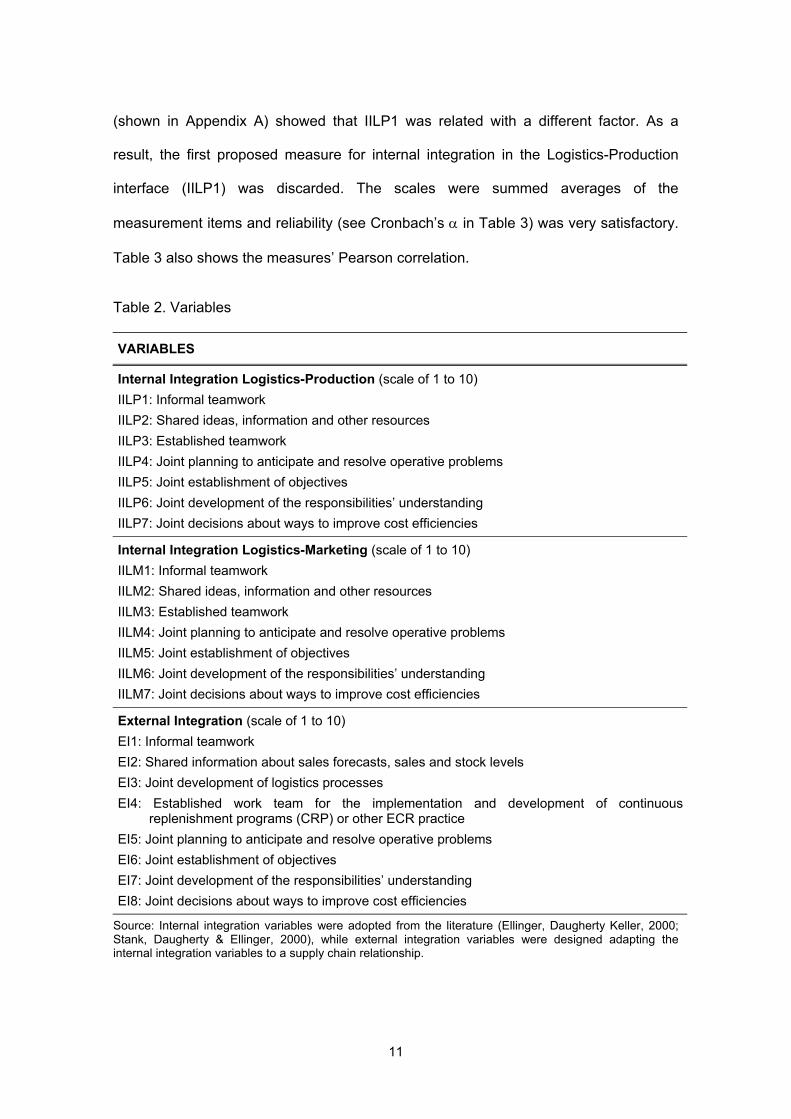
Table 2. Variables
VARIABLES
Internal Integration Logistics-Production (scale of 1 to 10) IILP1: Informal teamwork IILP2: Shared ideas, information and other resources IILP3: Established teamwork IILP4: Joint planning to anticipate and resolve operative problems IILP5: Joint establishment of objectives IILP6: Joint development of the responsibilities’ understanding IILP7: Joint decisions about ways to improve cost efficiencies
Internal Integration Logistics-Marketing (scale of 1 to 10) IILM1: Informal teamwork IILM2: Shared ideas, information and other resources IILM3: Established teamwork IILM4: Joint planning to anticipate and resolve operative problems IILM5: Joint establishment of objectives IILM6: Joint development of the responsibilities’ understanding IILM7: Joint decisions about ways to improve cost efficiencies
External Integration (scale of 1 to 10) EI1: Informal teamwork EI2: Shared information about sales forecasts, sales and stock levels EI3: Joint development of logistics processes EI4: Established work team for the implementation and development of continuous
replenishment programs (CRP) or other ECR practice EI5: Joint planning to anticipate and resolve operative problems EI6: Joint establishment of objectives EI7: Joint development of the responsibilities’ understanding EI8: Joint decisions about ways to improve cost efficiencies
Source: Internal integration variables were adopted from the literature (Ellinger, Daugherty Keller, 2000; Stank, Daugherty & Ellinger, 2000), while external integration variables were designed adapting the internal integration variables to a supply chain relationship.
12
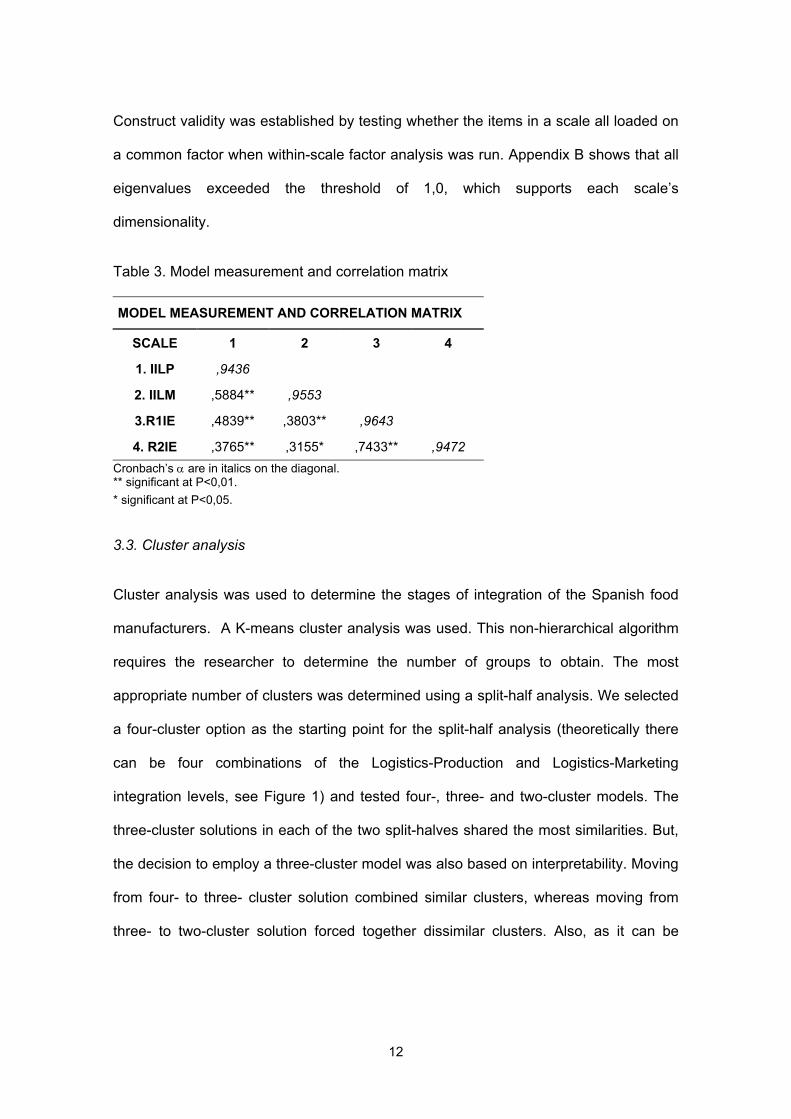
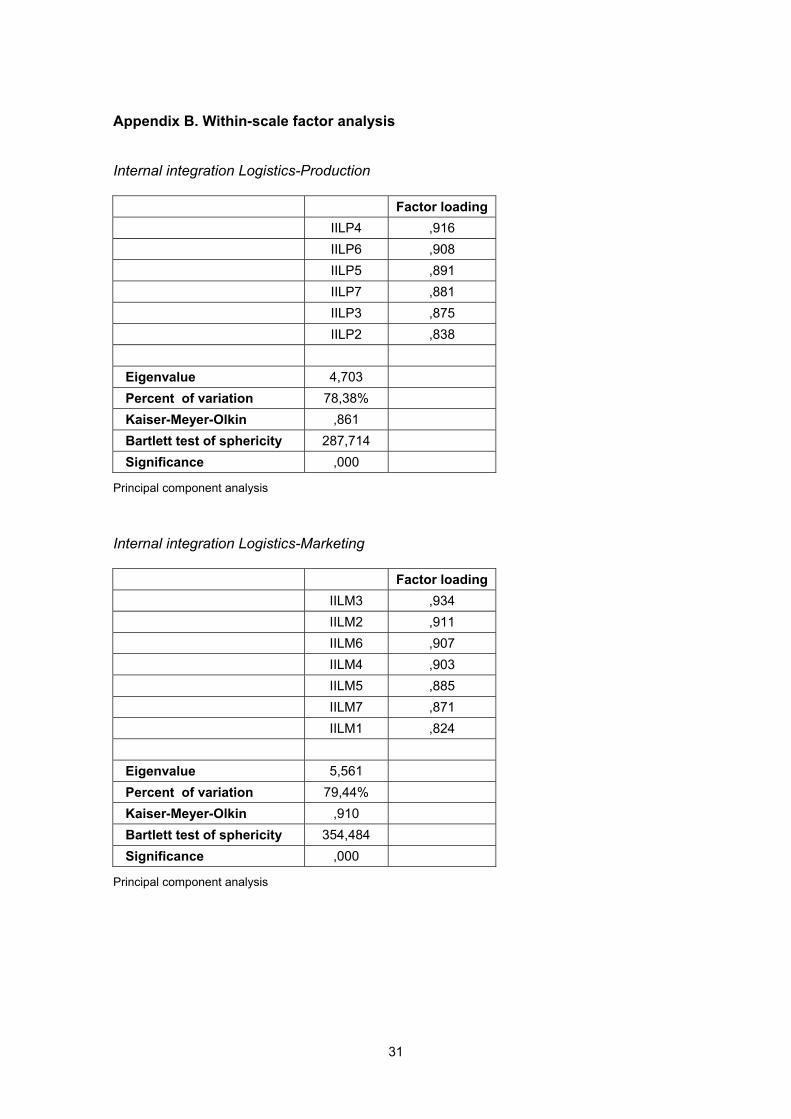
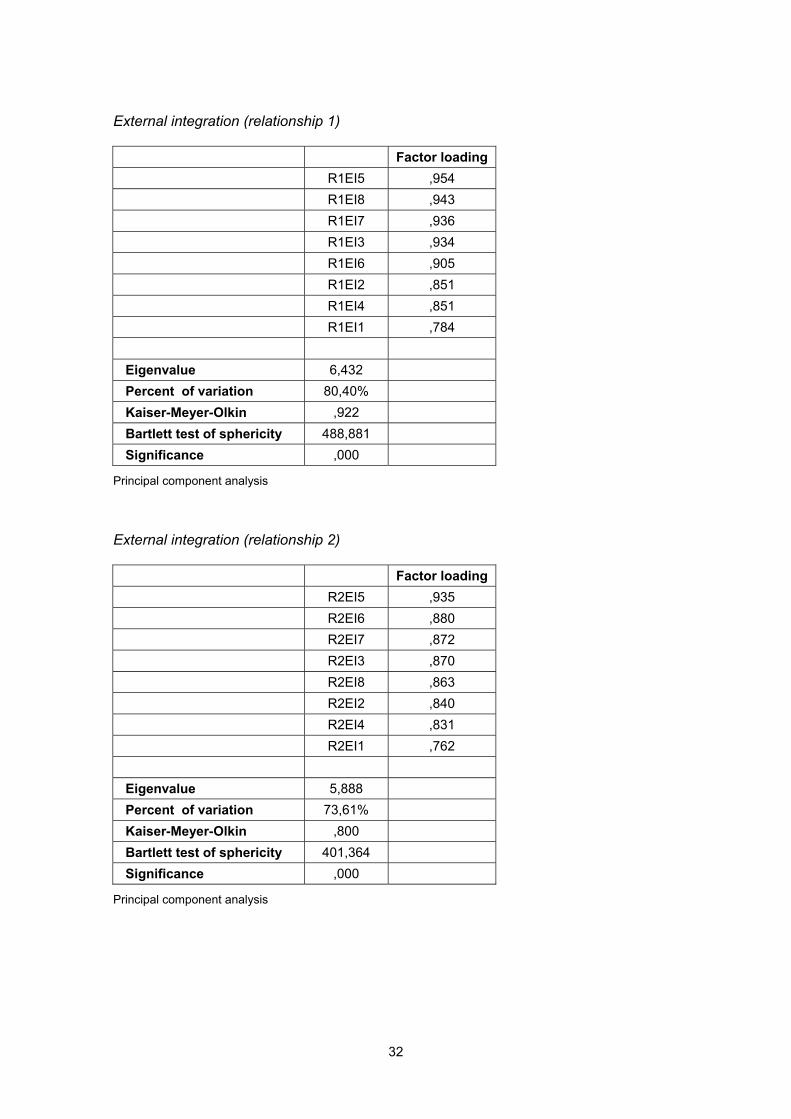
Construct validity was established by testing whether the items in a scale all loaded on
a common factor when within-scale factor analysis was run. Appendix B shows that all
eigenvalues exceeded the threshold of 1,0, which supports each scale’s
dimensionality.
Table 3. Model measurement and correlation matrix
MODEL MEASUREMENT AND CORRELATION MATRIX
SCALE 1 2 3 4
1. IILP ,9436
2. IILM ,5884** ,9553
3.R1IE ,4839** ,3803** ,9643
4. R2IE ,3765** ,3155* ,7433** ,9472 Cronbach’s α are in italics on the diagonal. ** significant at P<0,01. * significant at P<0,05.
3.3. Cluster analysis
Cluster analysis was used to determine the stages of integration of the Spanish food
manufacturers. A K-means cluster analysis was used. This non-hierarchical algorithm
requires the researcher to determine the number of groups to obtain. The most
appropriate number of clusters was determined using a split-half analysis. We selected
a four-cluster option as the starting point for the split-half analysis (theoretically there
can be four combinations of the Logistics-Production and Logistics-Marketing
integration levels, see Figure 1) and tested four-, three- and two-cluster models. The
three-cluster solutions in each of the two split-halves shared the most similarities. But,
the decision to employ a three-cluster model was also based on interpretability. Moving
from four- to three- cluster solution combined similar clusters, whereas moving from
three- to two-cluster solution forced together dissimilar clusters. Also, as it can be
13
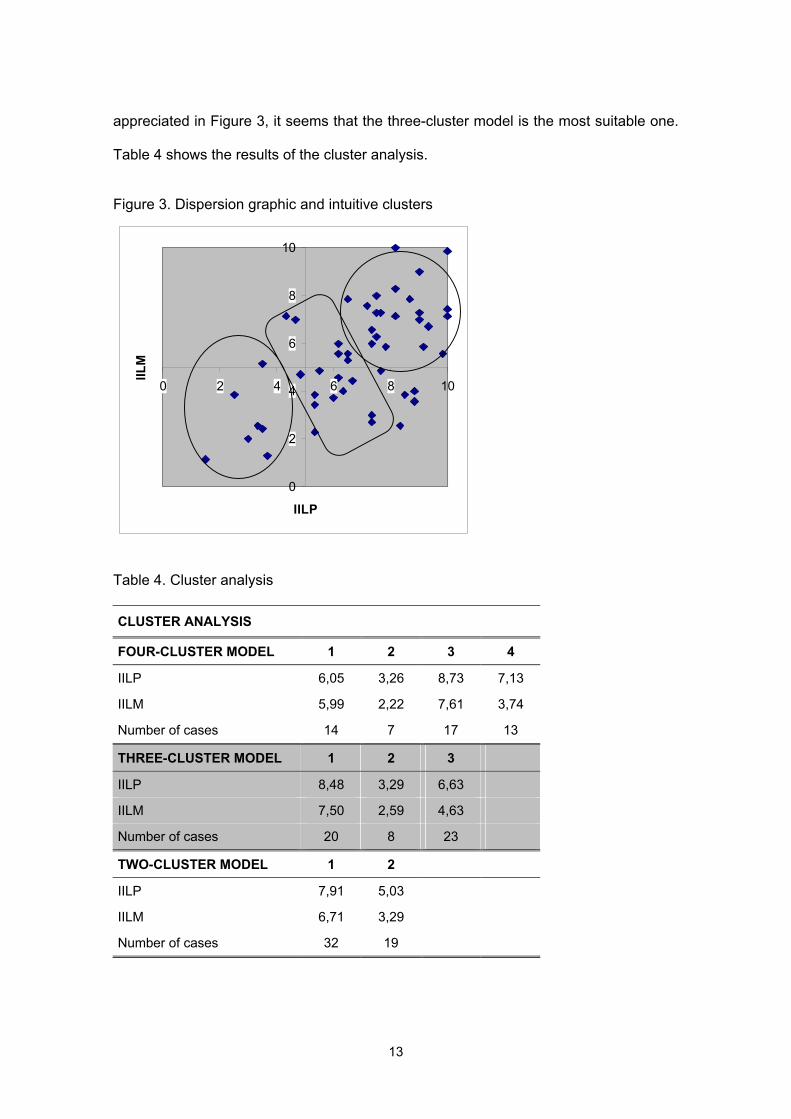
appreciated in Figure 3, it seems that the three-cluster model is the most suitable one.
Table 4 shows the results of the cluster analysis.
Figure 3. Dispersion graphic and intuitive clusters
0
2
4
6
8
10
0 2 4 6 8 10
IILP
IILM
Table 4. Cluster analysis
CLUSTER ANALYSIS
FOUR-CLUSTER MODEL 1 2 3 4
IILP 6,05 3,26 8,73 7,13
IILM 5,99 2,22 7,61 3,74
Number of cases 14 7 17 13
THREE-CLUSTER MODEL 1 2 3
IILP 8,48 3,29 6,63
IILM 7,50 2,59 4,63
Number of cases 20 8 23
TWO-CLUSTER MODEL 1 2
IILP 7,91 5,03
IILM 6,71 3,29
Number of cases 32 19
14
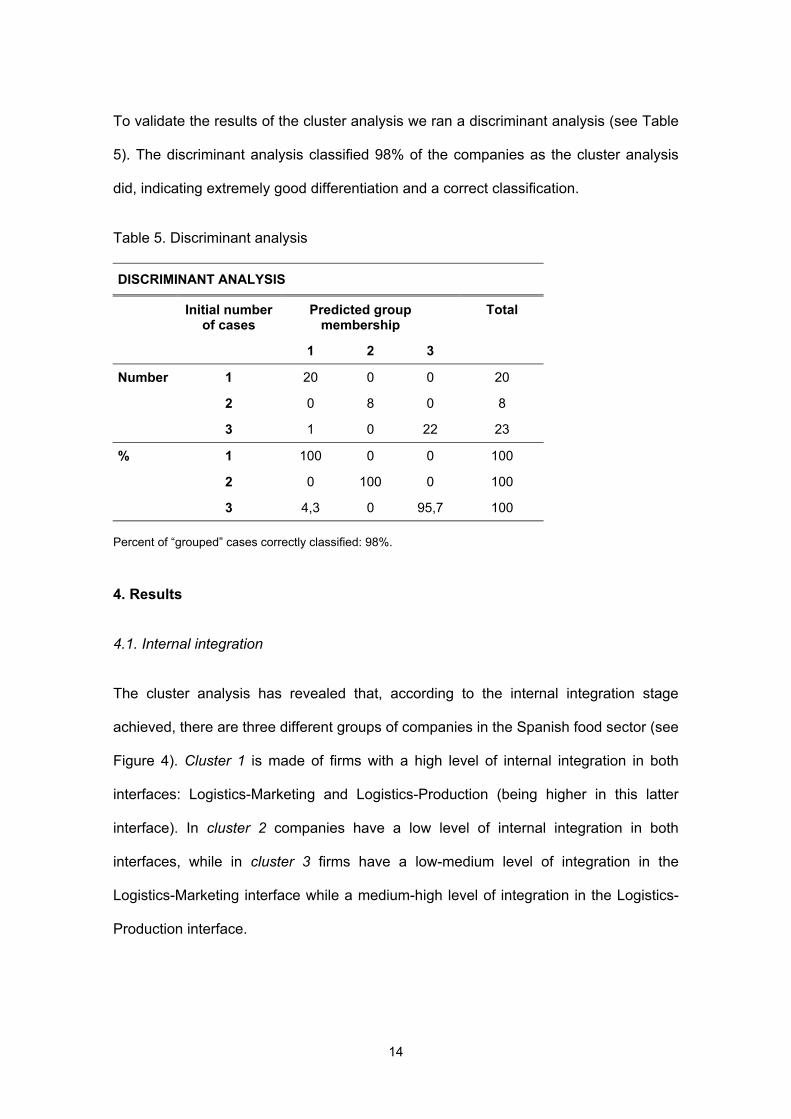
To validate the results of the cluster analysis we ran a discriminant analysis (see Table
5). The discriminant analysis classified 98% of the companies as the cluster analysis
did, indicating extremely good differentiation and a correct classification.
Table 5. Discriminant analysis
Percent of “grouped” cases correctly classified: 98%. 4. Results
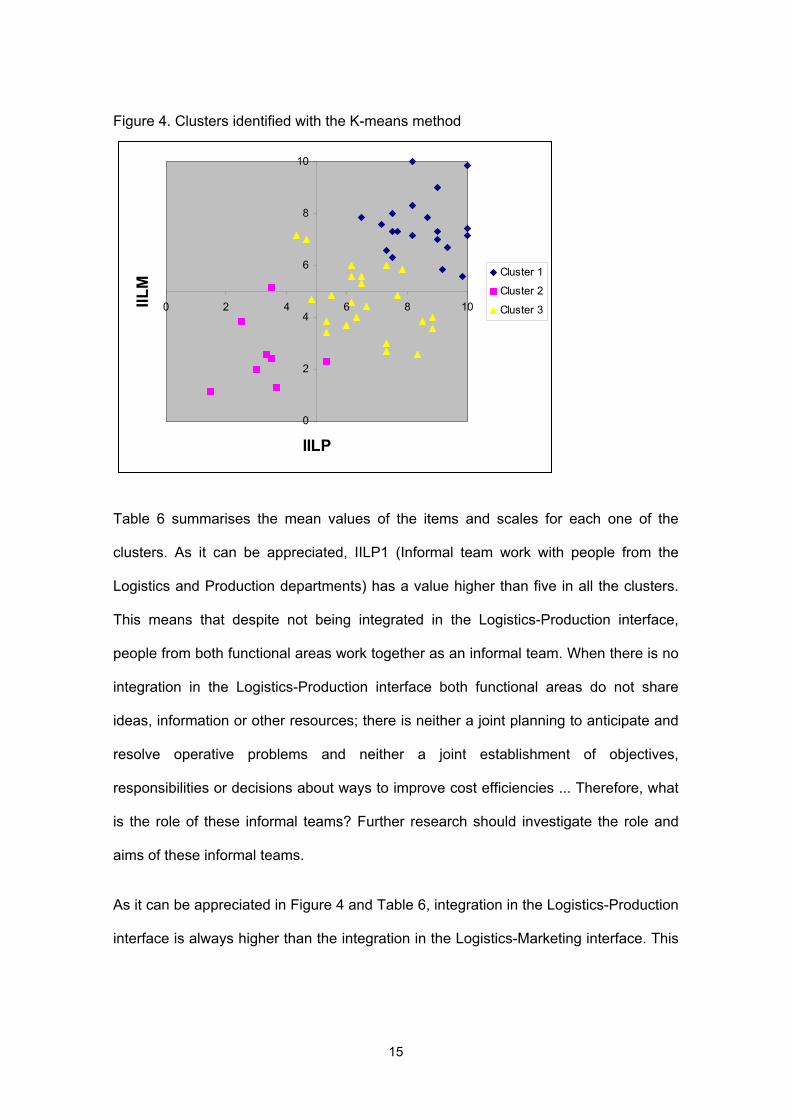
4.1. Internal integration
The cluster analysis has revealed that, according to the internal integration stage
achieved, there are three different groups of companies in the Spanish food sector (see
Figure 4). Cluster 1 is made of firms with a high level of internal integration in both
interfaces: Logistics-Marketing and Logistics-Production (being higher in this latter
interface). In cluster 2 companies have a low level of internal integration in both
interfaces, while in cluster 3 firms have a low-medium level of integration in the
Logistics-Marketing interface while a medium-high level of integration in the Logistics-
Production interface.
DISCRIMINANT ANALYSIS
Initial number of cases
Predicted group membership
Total
1 2 3
Number 1 20 0 0 20
2 0 8 0 8
3 1 0 22 23
% 1 100 0 0 100
2 0 100 0 100
3 4,3 0 95,7 100
15
Figure 4. Clusters identified with the K-means method
0
2
4
6
8
10
0 2 4 6 8 10
IILP
IILM
Cluster 1
Cluster 2
Cluster 3
Table 6 summarises the mean values of the items and scales for each one of the
clusters. As it can be appreciated, IILP1 (Informal team work with people from the
Logistics and Production departments) has a value higher than five in all the clusters.
This means that despite not being integrated in the Logistics-Production interface,
people from both functional areas work together as an informal team. When there is no
integration in the Logistics-Production interface both functional areas do not share
ideas, information or other resources; there is neither a joint planning to anticipate and
resolve operative problems and neither a joint establishment of objectives,
responsibilities or decisions about ways to improve cost efficiencies ... Therefore, what
is the role of these informal teams? Further research should investigate the role and
aims of these informal teams.
As it can be appreciated in Figure 4 and Table 6, integration in the Logistics-Production
interface is always higher than the integration in the Logistics-Marketing interface. This
16
could be due to the fact that in Spain Logistics has traditionally been considered an
area within the Operations domain.
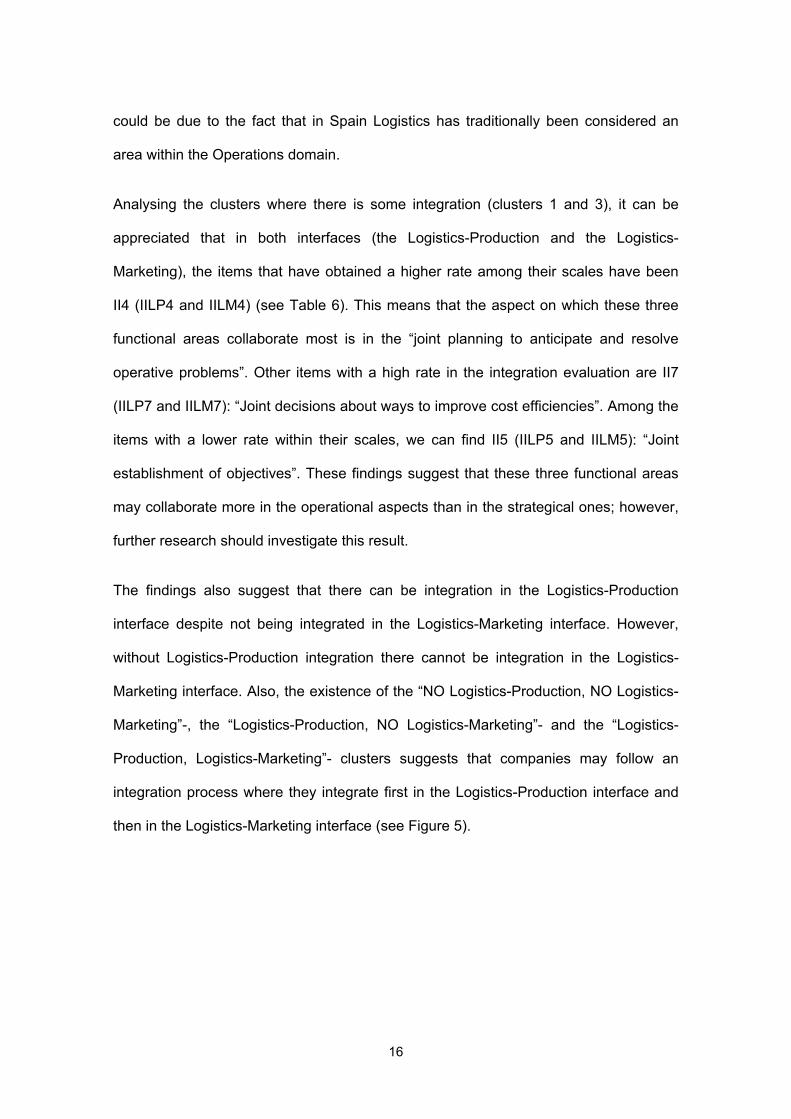
Analysing the clusters where there is some integration (clusters 1 and 3), it can be
appreciated that in both interfaces (the Logistics-Production and the Logistics-
Marketing), the items that have obtained a higher rate among their scales have been
II4 (IILP4 and IILM4) (see Table 6). This means that the aspect on which these three
functional areas collaborate most is in the “joint planning to anticipate and resolve
operative problems”. Other items with a high rate in the integration evaluation are II7
(IILP7 and IILM7): “Joint decisions about ways to improve cost efficiencies”. Among the
items with a lower rate within their scales, we can find II5 (IILP5 and IILM5): “Joint
establishment of objectives”. These findings suggest that these three functional areas
may collaborate more in the operational aspects than in the strategical ones; however,
further research should investigate this result.
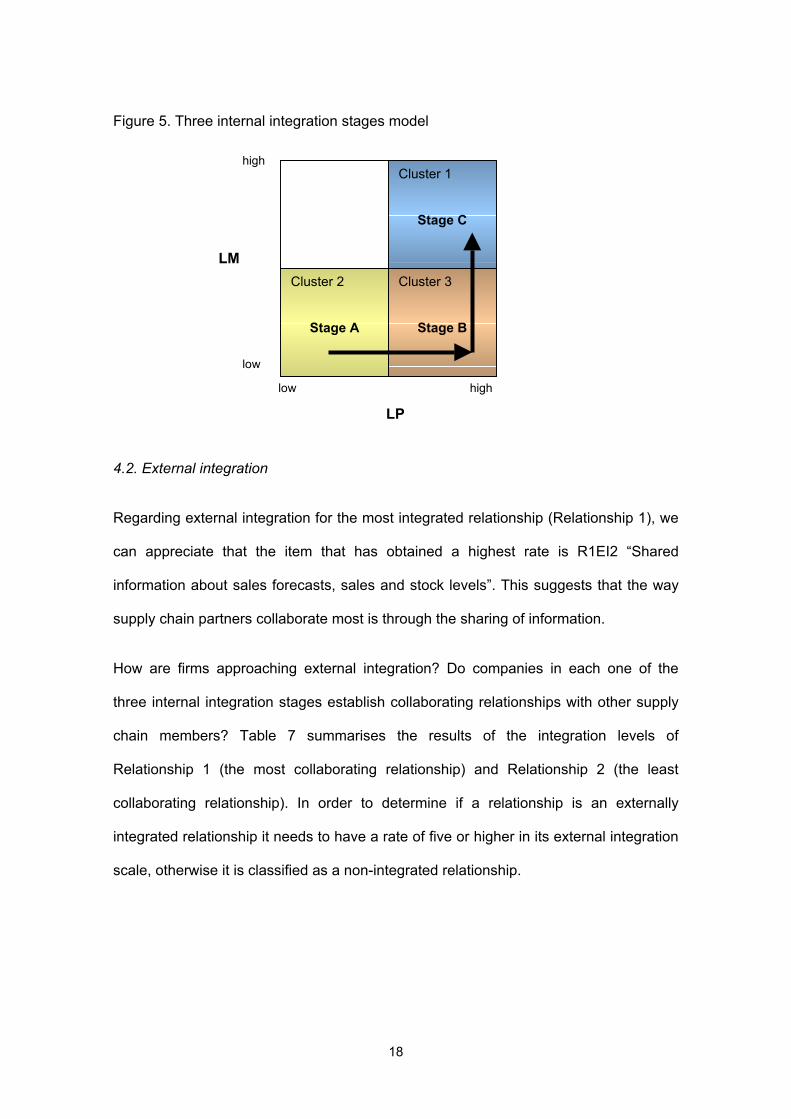
The findings also suggest that there can be integration in the Logistics-Production
interface despite not being integrated in the Logistics-Marketing interface. However,
without Logistics-Production integration there cannot be integration in the Logistics-
Marketing interface. Also, the existence of the “NO Logistics-Production, NO Logistics-
Marketing”-, the “Logistics-Production, NO Logistics-Marketing”- and the “Logistics-
Production, Logistics-Marketing”- clusters suggests that companies may follow an
integration process where they integrate first in the Logistics-Production interface and
then in the Logistics-Marketing interface (see Figure 5).
17
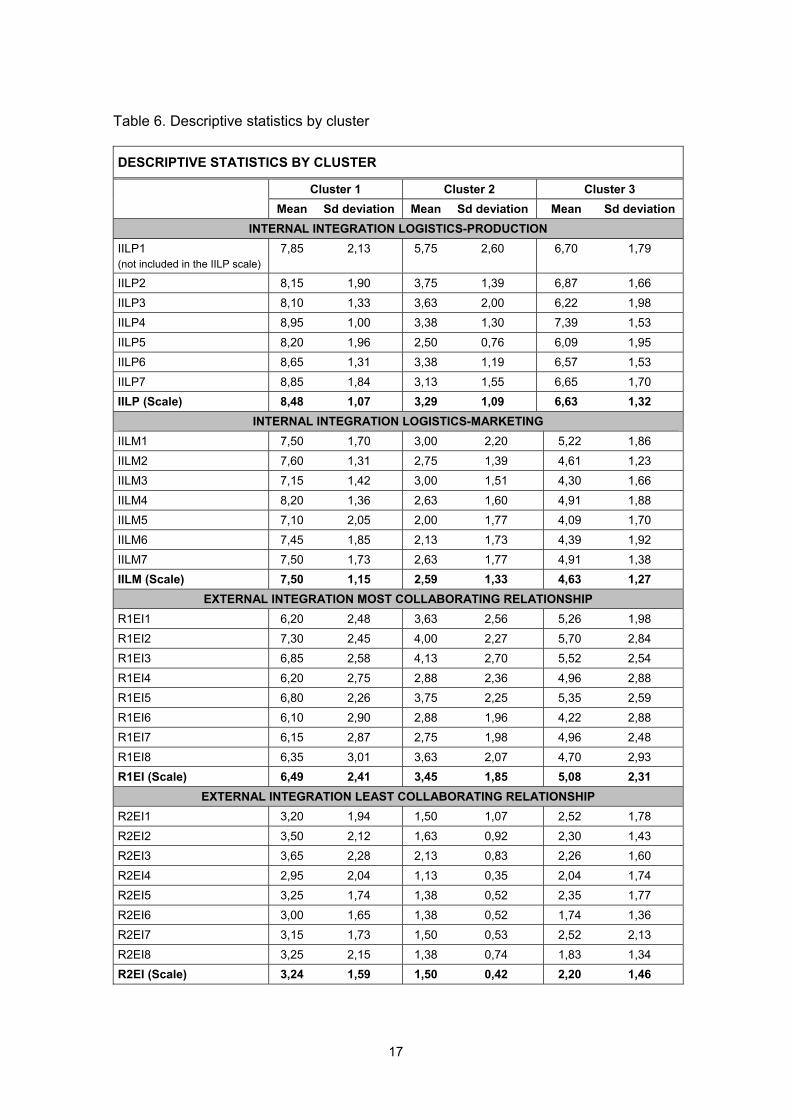
Table 6. Descriptive statistics by cluster
DESCRIPTIVE STATISTICS BY CLUSTER
Cluster 1 Cluster 2 Cluster 3 Mean Sd deviation Mean Sd deviation Mean Sd deviation
INTERNAL INTEGRATION LOGISTICS-PRODUCTION IILP1 (not included in the IILP scale)
7,85 2,13 5,75 2,60 6,70 1,79
IILP2 8,15 1,90 3,75 1,39 6,87 1,66 IILP3 8,10 1,33 3,63 2,00 6,22 1,98 IILP4 8,95 1,00 3,38 1,30 7,39 1,53 IILP5 8,20 1,96 2,50 0,76 6,09 1,95 IILP6 8,65 1,31 3,38 1,19 6,57 1,53 IILP7 8,85 1,84 3,13 1,55 6,65 1,70 IILP (Scale) 8,48 1,07 3,29 1,09 6,63 1,32
INTERNAL INTEGRATION LOGISTICS-MARKETING IILM1 7,50 1,70 3,00 2,20 5,22 1,86 IILM2 7,60 1,31 2,75 1,39 4,61 1,23 IILM3 7,15 1,42 3,00 1,51 4,30 1,66 IILM4 8,20 1,36 2,63 1,60 4,91 1,88 IILM5 7,10 2,05 2,00 1,77 4,09 1,70 IILM6 7,45 1,85 2,13 1,73 4,39 1,92 IILM7 7,50 1,73 2,63 1,77 4,91 1,38 IILM (Scale) 7,50 1,15 2,59 1,33 4,63 1,27
EXTERNAL INTEGRATION MOST COLLABORATING RELATIONSHIP R1EI1 6,20 2,48 3,63 2,56 5,26 1,98 R1EI2 7,30 2,45 4,00 2,27 5,70 2,84 R1EI3 6,85 2,58 4,13 2,70 5,52 2,54 R1EI4 6,20 2,75 2,88 2,36 4,96 2,88 R1EI5 6,80 2,26 3,75 2,25 5,35 2,59 R1EI6 6,10 2,90 2,88 1,96 4,22 2,88 R1EI7 6,15 2,87 2,75 1,98 4,96 2,48 R1EI8 6,35 3,01 3,63 2,07 4,70 2,93 R1EI (Scale) 6,49 2,41 3,45 1,85 5,08 2,31
EXTERNAL INTEGRATION LEAST COLLABORATING RELATIONSHIP R2EI1 3,20 1,94 1,50 1,07 2,52 1,78 R2EI2 3,50 2,12 1,63 0,92 2,30 1,43 R2EI3 3,65 2,28 2,13 0,83 2,26 1,60 R2EI4 2,95 2,04 1,13 0,35 2,04 1,74 R2EI5 3,25 1,74 1,38 0,52 2,35 1,77 R2EI6 3,00 1,65 1,38 0,52 1,74 1,36 R2EI7 3,15 1,73 1,50 0,53 2,52 2,13 R2EI8 3,25 2,15 1,38 0,74 1,83 1,34 R2EI (Scale) 3,24 1,59 1,50 0,42 2,20 1,46
18
Figure 5. Three internal integration stages model
4.2. External integration
Regarding external integration for the most integrated relationship (Relationship 1), we
can appreciate that the item that has obtained a highest rate is R1EI2 “Shared
information about sales forecasts, sales and stock levels”. This suggests that the way
supply chain partners collaborate most is through the sharing of information.
How are firms approaching external integration? Do companies in each one of the
three internal integration stages establish collaborating relationships with other supply
chain members? Table 7 summarises the results of the integration levels of
Relationship 1 (the most collaborating relationship) and Relationship 2 (the least
collaborating relationship). In order to determine if a relationship is an externally
integrated relationship it needs to have a rate of five or higher in its external integration
scale, otherwise it is classified as a non-integrated relationship.
Cluster 1
Stage C
Cluster 3
Stage B
Cluster 2
Stage A
LM
LP
low high
low
high

19
Table 7. Supply chain relationships by cluster
SUPPLY CHAIN RELATIONSHIPS BY CLUSTER
Integrated relationships Non-integrated relationships
Cluster 1 (IILP, IILM)
R1 15 (75%) 5 (25%)
R2 4 (20%) 16 (80%)
Cluster 2 (NO IILP, NO IILM)
R1 1 (12,5%) 7 (87,5%)
R2 0 (0%) 8 (100%)
Cluster 3 (IILP, NO IILM)
R1 10 (43,48%) 13 (56,52%)
R2 2 (8,70%) 21 (91,3%)
Table 7 shows that in cluster 1, fifteen companies had an externally integrated
relationship in their most collaborating relationship (R1), and among these companies,
four had also an integrated relationship in their least collaborating relationship (R2). In
cluster 2, only one company had an integrated relationship and it was in its most
collaborating relationship (R1). And finally, in cluster 3, ten firms had an externally
integrated relationship in their most collaborating relationship (R1), and among these
ten companies only two had also an externally integrated relationship in their least
collaborating relationship (R2). These findings and the values of the scales R1EI and
R2EI in Table 6 suggest:
1. Companies in cluster 1 (fully internally integrated) have a higher level of
external integration than companies in clusters 2 and 3 (see the values of the
scales R1EI and R2EI in Table 6, and the percentages of integrated
relationships in R1 and R2 in Table 7). Companies fully internally integrated
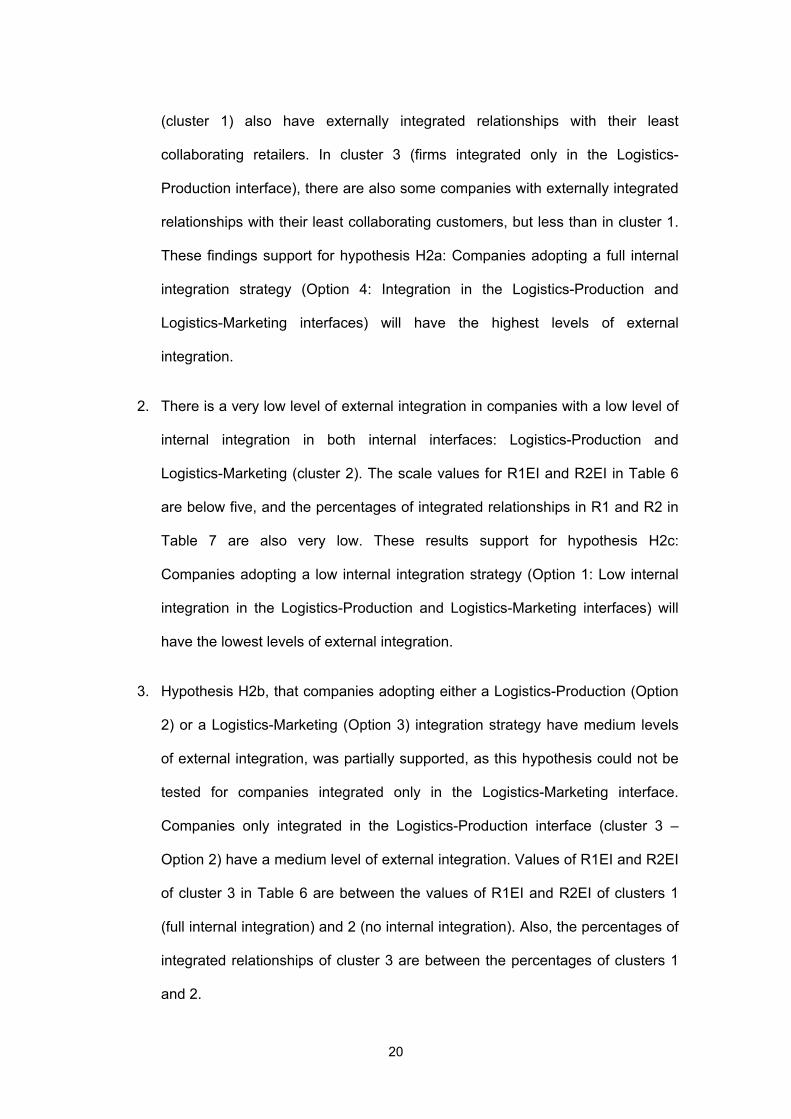
20
(cluster 1) also have externally integrated relationships with their least
collaborating retailers. In cluster 3 (firms integrated only in the Logistics-
Production interface), there are also some companies with externally integrated
relationships with their least collaborating customers, but less than in cluster 1.
These findings support for hypothesis H2a: Companies adopting a full internal
integration strategy (Option 4: Integration in the Logistics-Production and
Logistics-Marketing interfaces) will have the highest levels of external
integration.
2. There is a very low level of external integration in companies with a low level of
internal integration in both internal interfaces: Logistics-Production and
Logistics-Marketing (cluster 2). The scale values for R1EI and R2EI in Table 6
are below five, and the percentages of integrated relationships in R1 and R2 in
Table 7 are also very low. These results support for hypothesis H2c:
Companies adopting a low internal integration strategy (Option 1: Low internal
integration in the Logistics-Production and Logistics-Marketing interfaces) will
have the lowest levels of external integration.
3. Hypothesis H2b, that companies adopting either a Logistics-Production (Option
2) or a Logistics-Marketing (Option 3) integration strategy have medium levels
of external integration, was partially supported, as this hypothesis could not be
tested for companies integrated only in the Logistics-Marketing interface.
Companies only integrated in the Logistics-Production interface (cluster 3 –
Option 2) have a medium level of external integration. Values of R1EI and R2EI
of cluster 3 in Table 6 are between the values of R1EI and R2EI of clusters 1
(full internal integration) and 2 (no internal integration). Also, the percentages of
integrated relationships of cluster 3 are between the percentages of clusters 1
and 2.
21
4. The positive correlations between internal and external integration (see Table 3)
imply that they influence each other. Internal collaboration may influence
external collaboration and vice versa. The influence of external collaboration on
internal collaboration has to be understood as an incentive to internal
integration: if firms want to collaborate with external customers and suppliers,
they need to enhance internal integration. The low level of external integration
of non-internally integrated companies, and the fact that the higher the level of
internal integration the higher the level of external integration, suggest that firms
first internally integrate and then extend the collaboration to other supply chain
members. This supports H1a and rejects H1b.
Figure 6 summarises these findings. It shows that the integration process that Spanish
food manufacturers are following consists of three sequential stages. First, is stage A,
where there is no integration. Second, is stage B where there is a medium-high level of
integration in the Logistics-Production interface, a low-medium level of internal
integration in the Logistics-Marketing interface and a medium level of external
integration. And finally, is stage C, where companies increase their level of internal
integration in both internal interfaces (Logistics-Production and Logistics-Marketing)
and increase also their level of external integration.

22
Figure 6. Three integration stages model
5. Conclusions and managerial implications
Only 30% of the companies in the sample have implemented SCM (there are only
fifteen companies in cluster 1 which have externally integrated relationships). However,
there are many companies in their way to implement it. Firms have realised that
enhanced competitiveness requires that companies ceaselessly integrate within a
network of organizations – firms ignoring this challenge are destined to fall behind their
rivals.
As their future survival lies on integration, a good understanding of the integration
process is a key aspect. And, in this area, our study has a main implication for
managers pursuing integration: in the integration process, firms must achieve a
relatively high level of collaboration among internal functions before initiating any
external integration. A prerequisite for successful SCM is internal integration (Lambert,
Cooper & Pagh, 1998). Internal integration refers to the collaboration and coordination
of Logistics with other functional areas, such as Production and Marketing. Such
LM
Cluster 2
Stage A
LP
low high
low
high Cluster 1
Stage C
Cluster 3
Stage B
EI
low
high
23
collaboration and coordination means that these functional areas must have formal
teamwork and share ideas, information and other resources. Integration also means
that there is a joint planning to anticipate and resolve operative problems, a joint
establishment of objectives, a joint development of the responsibilities’ understanding
and a joint establishment of decisions about ways to improve cost efficiencies.
Managers pursuing integration have to take actions to promote this sharing of
information and joint planning. These actions cover a wide range of aspects: first, there
is the need to change the organisational structure, including (1) the establishment of
the key business processes to be managed by formal cross-functional workteams and
(2) the modification of the criteria on which functional managers are evaluated. One
way to coordinate activities within the firm is to identify the key business processes and
manage them using cross-functional teams. Cooper, Lambert & Pagh (1997)
extensively describe the key business processes that could be linked across the firm
and the supply chain. Another way to promote integration is to change the criteria on
which managers are evaluated. Gimenez (2003) describes some examples where a
wrong manager evaluation system led to cost-inefficient purchasing decisions (in terms
of total cost of ownership).
Second, there is the need to train people on the benefits that integration can bring.
Change management and people training play a key role in an integration process, as
they are crucial to minimise the barriers to implementing SCM.
Our study suggests that Spanish food manufacturers seem to initiate integration by
coordinating Logistics and Production. As stated before, this might be due to the fact
that, in Spain, Logistics has been considered an area under the Operations and
Production domain. This finding does not imply that companies have to implement
SCM by integrating first in this interface. Firms should initiate integration in the interface
24
where it is easier and where integration benefits can be obtained early. This will
encourage further integration efforts.
The results also show that the highest levels of external integration are associated to
companies with the highest levels of integration in the Logistics-Production and
Logistics-Marketing interfaces. This implies that although integration has been started
only in the Logistics-Production interface, when higher levels of external integration are
pursued, there is the need to integrate also in the Logistics-Marketing interface.
Therefore, managers pursuing supply chain integration need to pay attention to all
internal interfaces.
Another implication for managers is how to approach external integration. The results
have shown that sharing of information (about sales, sales forecasts and stocks) and
joint planning and development of logistics processes play again a key role in the
integration process. This implies that there is the need to move from an arm’s length
type of relationships to a more partnership approach, where trust and sharing of
information are vital.
Our study has contributed to the existing knowledge by providing a description of how
Spanish food manufacturers are approaching integration. However, our paper has
some limitations: first, in the analysis of external integration, it has only considered one
side of the manufacturer-retailer relationship. And, second, due to the reduced number
of cases in each cluster, a statistical comparison of means to analyse the integration
differences has not been possible.
Further research should investigate the integration processes in other industries and
countries. It should also consider other internal interfaces, such as Logistics-
Purchasing and Production-Purchasing, and investigate the business processes that
are critical and/or beneficial to integrate and manage within and between firms.
25
References
Anderson, J. & Narus, J., 1991. “Partnering as a focused market strategy”, California
Management Review, Spring, pp. 95-113.
Armstrong, J.S. & Overton, T.S., 1977. “Estimating non-response bias in mail surveys”,
Journal of Marketing Research, Vol.14 No.3, pp. 396- 402.
Byrne, S.M. & Javad, S., 1992. “Integrated Logistics Information Systems (ILIS):
Competitive advantage or increased cost”, Council of Logistics Management Annual
Conference Proceedings, Oak Brook, Illinois, pp. 55-73.
Casanovas, A. & Cuatrecasas, Ll., 2001. Logística Empresarial, Ed. Gestion 2000,
Barcelona.
Christiansee, E. & Kumar, K., 2000. “ICT-enabled coordination of dynamic supply
webs”, International Journal of Physical Distribution and Logistics Management, Vol.30
No.3/4, pp. 268-285.
Christopher, M., 1998. Logistics and Supply Chain Management: Strategies for
reducing cost and improving service, Financial Times Pitman Publishing, London.
Cooper, M.C. & Gardner, J., 1993. “Building good business relationships – More than
just partnering or strategic alliances”, International Journal of Physical Distribution and
Logistics Management, Vol 23 No 6, pp. 14-26.
Cooper, M.C., 1993. “International Supply Chain Management: Implications for the
bottom line”, Proceedings of the Society of Logistics Engineers, Society of Logistics
Engineers, Hyattsville.
26
Cooper, M.C., Lambert, D.M. & Pagh, J.D., 1997. “Supply Chain Management: More
than a new name for Logistics”, The International Journal of Logistics Management, Vol
8 No 1, pp. 1-13.
Copacino, W.C., 1990. “Purchasing strategy for the 90’s”, Traffic Management, Vol 29
No 10, pp. 67.
Daugherty, P.J., Ellinger, A.E. & Rogers, D., 1995. “Information accessibility: Customer
responsiveness and enhanced performance”, International Journal of Physical
Distribution and Logistics Management, Vol.25 No.1, pp. 4-17.
Daugherty, P.J., Sabath, R.E. & Rogers, D.S., 1992. “Competitive advantage through
customer responsiveness”, Logistics and Transportation Review, Vol.28 No.3, pp. 257-
271.
Dyer, J.; Cho, D. & Chu, W., 1998. “Strategic supplier segmentation: The next best
practice in supply chain management”, California Management Review, Vol 40 No 2,
pp. 57-78.
Ellinger, A.E., Daugherty, P.J. & Keller, S., 2000. “The relationship between marketing/
logistics interdepartmental integration and performance in U.S. manufacturing firms: An
empirical study”, Journal of Business Logistics, Vol.21 No.1, pp. 1-22.
Ellinger, A.E., Taylor, J.C. & Daugherty, P.J., 2000. “Programas de reposición
automática y niveles de involucramiento: Su impacto en la performance”, The
International Journal of Logistics Management, Vol.10 No.1, pp. 29-40.
Ellram, L.M. & Cooper, M.C., 1993. “The relationship between supply chain
management and Keiretsu”, The International Journal of Logistics Management, Vol.4
No.1, pp. 1-12.
27
Fox, R.J., Crask, M. & Kim, J., 1988. “Mail survey response rate: A Metaanalysis of
selected techniques for inducing response”, Public Opinion Quarterly 52 No.1, pp. 467-
491.
Gimenez, C. & Ventura, E., 2003. “Supply Chain Management as a competitive
advantage in the Spanish grocery sector”, The International Journal of Logistics
Management, Vol.14 No.1.
Gimenez, C. & Ventura, E., 2003b. “Logistics-Production, Logistics-Marketing and
external integration: Their impact on performance”. UPF Working Paper # 657.
Gimenez, C., 2003. “Supply Chain Management Implementation in the Spanish
Grocery Sector: An Exploratory Study”. UPF Working Paper # 668.
Groves, G. & Valsamakis, V., 1998. “Supplier-customer relationships and company
performance”. The International Journal of Logistics Management, Vol.9 No.2, pp. 51-
63.
Gustin, C.M.; Stank, T.P. & Daugherty, P.J., 1994. “Computerization: Supporting
integration”, The International Journal of Physical Distribution and Logistics
Management, Vol.24 No.1, pp. 11-16.
Kraljic, P., 1983. “Purchasing must become supply management”, Harvard Business
Review, Vol 61, pp. 109-117.
Lambert, D.M. & Harrington, T.C., 1990. “Measuring nonresponse in customer service
mail surveys”, Journal of Business Logistics, Vol.11 No.2, pp. 5-25.
Lambert, D.M., Cooper, M.C. & Pagh, J.D., 1998. “Supply Chain Management:
Implementation issues and research opportunities”, The International Journal of
Logistics Management, Vol.9 No.2, pp. 1-19.
28
Larson, P.D., 1994. “An empirical study of inter-organizational functional integration
and total costs”, Journal of Business Logistics, Vol.15 No.1, pp. 153-169.
Masella, C. & Rangone, A., 2000. “A contingent approach to the design of vendor
selection systems for different types of cooperative customer/supplier”, International
Journal of Operations and Production Management, Vol 20 No 1, pp. 70-84.
Scannell, T.V., Vickery, S.K. & Dröge, C.L., 2000. “Upstream supply chain
management and competitive performance in the automotive supply industry”, Journal
of Business Logistics, Vol.21 No.1, pp. 23-48.
Scott, C. & Westbrook, R., 1991. “New strategic tools for supply chain management”,
International Journal of Physical Distribution and Materials Management, Vol.21 No.1,
pp. 23-33.
Shapiro, R.D., 1984. “Get leverage from logistics”, Harvard Business Review, Vol.62
no.3, pp. 119-126.
Stank, T.P., Crum, M. & Arango, M., 1999. “Benefits of inter-firm coordination in food
industry supply chains”, Journal of Business Logistics, Vol.20 No.2, pp. 21-41.
Stank, T.P., Daugherty, P.J. & Autry, C.W., 1999. “Collaborative planning: Supporting
automatic replenishment programs”. Supply Chain Management, Vol.4 No.2, pp. 75-85.
Stank, T.P., Daugherty, P.J. & Ellinger, A.E., 2000. “Integración Marketing/Logística y
performance de la empresa”, The International Journal of Logistics Management,
Vol.10 No.1, pp 13-27.
Stank, T.P., Keller, S. & Daugherty, P.J., 2001. “Supply chain collaboration & logistical
service performance”, Journal of Business Logistics, Vol.22 No.1, pp. 29-48.
29
Stevens, G.C., 1989. “Integrating the supply chain”, International Journal of Physical
Distribution and Materials Management, Vol.19 No.8, pp. 3-8.
Stock, G.N., Greis, N.P. & Kasarda, J.D., 1998. “Logistics, strategy and structure: A
conceptual framework”, International Journal of Operations and Production
Management, Vol.18 No.1, pp. 37-52.
Tang, C.S., 1999. “Supplier relationship map”, International Journal of Logistics:
Research and Applications, Vol 2 No 1, pp. 39-56.
The Global Logistics Team at Michigan State University, 1995. World Class Logistics:
The challenge of managing continuous change, Council of Logistics Management, Oak
Brook, Illinois.
30
Appendix
Appendix A. Exploratory factor analysis
Factors 1 2 3 4 5
R2EI5 ,896 ,244 ,113 ,101 R2EI7 ,829 ,250 ,114 R2EI6 ,824 ,264 ,131 ,167 R2EI8 ,810 ,251 ,235 R2EI2 ,793 ,254 ,113 ,139 R2EI4 ,772 ,284 ,151 R2EI3 ,736 ,465 ,157 R2EI1 ,576 ,490 ,155 ,253 R1EI5 ,337 ,870 ,179 ,141 R1EI3 ,298 ,869 ,180 R1EI8 ,401 ,850 ,156 R1EI1 ,139 ,777 ,175 ,117 ,334 R1EI7 ,491 ,757 ,112 ,250 R1EI6 ,488 ,712 ,108 ,291 R1EI2 ,396 ,702 ,268 ,129 -,115 R1EI4 ,464 ,658 ,191 ,208 IILM3 ,271 ,891 ,104 ,162 IILM4 ,884 ,222 IILM6 ,114 ,878 ,216 IILM5 ,148 ,244 ,840 ,169 IILM2 ,178 ,833 ,335 IILM7 ,111 ,135 ,804 ,336 IILM1 ,768 ,152 ,448 IILP6 ,166 ,361 ,835 IILP4 ,118 ,161 ,285 ,834 ,162 IILP7 ,265 ,238 ,312 ,806 IILP5 ,285 ,278 ,802 IILP3 ,113 ,130 ,229 ,726 ,495 IILP2 ,272 ,245 ,632 ,560 IILP1 ,273 ,874
Principal component analysis. Rotation method: Varimax with Kaiser.
31
Appendix B. Within-scale factor analysis
Internal integration Logistics-Production
Factor loading IILP4 ,916 IILP6 ,908 IILP5 ,891 IILP7 ,881 IILP3 ,875 IILP2 ,838
Eigenvalue 4,703 Percent of variation 78,38% Kaiser-Meyer-Olkin ,861 Bartlett test of sphericity 287,714 Significance ,000
Principal component analysis
Internal integration Logistics-Marketing
Factor loading IILM3 ,934 IILM2 ,911 IILM6 ,907 IILM4 ,903 IILM5 ,885 IILM7 ,871 IILM1 ,824
Eigenvalue 5,561 Percent of variation 79,44% Kaiser-Meyer-Olkin ,910 Bartlett test of sphericity 354,484 Significance ,000
Principal component analysis
32
External integration (relationship 1)
Factor loading R1EI5 ,954 R1EI8 ,943 R1EI7 ,936 R1EI3 ,934 R1EI6 ,905 R1EI2 ,851 R1EI4 ,851 R1EI1 ,784
Eigenvalue 6,432 Percent of variation 80,40% Kaiser-Meyer-Olkin ,922 Bartlett test of sphericity 488,881 Significance ,000
Principal component analysis
External integration (relationship 2)
Factor loading R2EI5 ,935 R2EI6 ,880 R2EI7 ,872 R2EI3 ,870 R2EI8 ,863 R2EI2 ,840 R2EI4 ,831 R2EI1 ,762
Eigenvalue 5,888 Percent of variation 73,61% Kaiser-Meyer-Olkin ,800 Bartlett test of sphericity 401,364 Significance ,000
Principal component analysis