Embed Size (px)
Citation preview
10-19 475 MEDIUM- AND LONG-IIAVELEMGTH INFRARED EMISSION FROM A /LASER-PRODUCED OXYGEN PLASNA(U) AIR FORCE GEOPHYSICSLAB HANSCOM AF MR J LURIE ET AL. 31 DEC 85
UNCLRSSIFIED RFOL-TR-6341 F/O 20/9 NL
llllllllmmllllllllllllllIson
% 4k ,% ,. 'I.. i -i - -. .. -
1. ...
Illi- .'
111112.2
I1 III":11111125
.1.
... A A
% o P V.' V.
, . . .o,
N.:..::
,°....-:.-...--: . ,-. .. -. ,. . :..: .. . .....-. , • , : . -. : :. . : - . : -. . - . .:. . ,.-o;. .. .-....-..
:.'-." .-'.-'..'..',''.- .'-.-- ,-.. -..- '.-'.-'."--'."-.-.S ." .-,.-' .- , .. '.-.-. " :-. :-,,. . .- .-... " ----. ,--.-.--,--.--.;- --".-',-'-- ',.',:.'-',",,-,',,' ,- "- ', "-"., .", -,. ". .'.- -, .,. .- " -- " . - .-,....''., ".- .,.'
AFGL-TR-85-0341ENVIRONMENTAL RESEARCH PAPERS, NO. 942
I*-% Medium- and Long-Wavelength Infrared Emission"I From a Laser-Produced Oxygen Plasma
0)
JONATHAN B. LURIEI JAMES C. BAIRD
31 December 1985
Approved for public release; distribution unlimited.
DTC_:: CTE" ,.:.
~ :LI1986 AA
Boo --
INFRARED TECHNOLOGY DIVISION PROJECT 2310
AIR FORCE GEOPHYSICS LABORATORY wHANSCOM AFB, MA 01731
t ra 7 1 066'
This technical report has been reviewed and is approved for publication
-, --.--
LAILA DZELZKL W. BLUMBERG, Acti ief
IHWt' Scietist Infrared DynamioBranch
FOR THE CGMMANDER
This report has been reviewed by the ESD Public Affairs Office (PA) and isreleasable to the National Technical Information Service (NTIS).
Qualified requestors may obtain additional copies from the Defense TechnicalInformation Center. All others should apply to the National TechnicalInformation Service.
If your address has changed, or if you wish to be removed from the mailinglist, or if the addressee is no longer employed by your organization, pleasenotify AFGL/DAA, Hanscom AFB, MA 01731. This will assist us in maintaining
a current mailing list.
Do not return copies of this report unless contractual obligations or noticeson a specific document requires that it be returned.
L': a
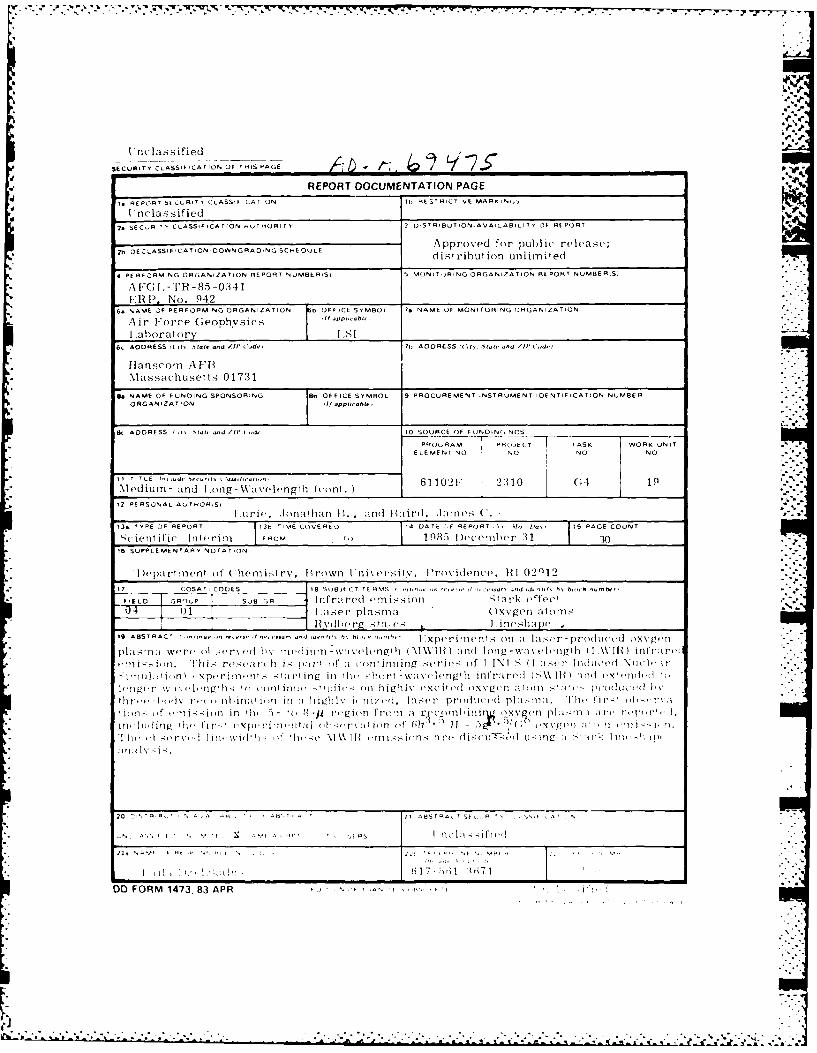
nclassified -S[CUAITV CLASS'F CATION OF T-lS PAGE -7 /A
REPORT DOCUMENTATION PAGEI@ EPORT Sk:FIRTI C:LASSIF GAIION It, IIESTRICTIVE MARKIN,,S
T.SCR CSIC INIoT~R 3 0 STRORUTONY,AVAILABILITY OF RP~
0O~ORAIN SCTEOLEA pproved for public- release;b DECASSIFICATION OONRDNSIEUEdistribution unlimited
4 PfRFO2RMING ORGANIZATION REPORT NUMBERiSi 5 MJNIT-,FRNG ORGANI7A (ION RLPORT NUMBE R(S)
A F(;1 -'I'R -8 5 -03 41* LRP.~~-:11 No. 942 ____________________
64 NAME OF PERFORMING ORGAIA O OF FICE SYMBOL 7a NAME OF MONITORING ORGANIZATION
Air F'orce (;eophyiclaborat ory I sI _____________________
6c ADDRESS (.t% State and /I/' ('I,' 1, ADDRESS 1,1S , -1d /1)1,,)-1-
Hanscom AI-13Mlassachusetts 01731
BNAME OF FUNOING SPONSORING BE OFFICE STMBOL 9 PROCUREMENT INSTRUMENT iOENTIFICATION NUM13ER
ORGANIZATION d1/ a.PPI,,OEIPI
j& ADDRESS Ne 'al, ond /11- 1 ,del 10 SOURCE OF F UNGING, NOS
PROGRAM PRWE C-T TASK WORK U NITELEMENT NO NO NO NO
* ~ ~ 1 l T TLE 1-11It.,r I- l nd111n
- Mediur-n- and I (og -Wavvlengtb (coot.
- 12 PERSONAL AUT017IS,
Sc (ielt ifi(' Interim FRO )m 1 9 8 5T j) ceber 31 30*1 lSUPPLEMENTARY NUTATION
*~~ 17 COSATi CODES 18 S;UHI E C T TFlM E H ~ ~ I.II*I' NIS.IOll l ,d n 1,7 ,Ih bI It mbpI'
FI-E L GROUP SUB OR Infrared Imnission Stark effecl04 1 ~e plasmia ()xv gen atonis
- ~~19 ABSTRACT -JI,.,III'I' h,'OO' hl- ..Il ... .. h- Ixperilent I- oo a laser -produced I1x\,gtO
pla-nOi werd (I -s(r% Id lIv m-dlitim -waivelctigill IM',IR :inll Iog-waV~lf-nlt (I.WII( infi;rlI
- >IIIIIIL~iII .- xplrimflnls Iiriinpf in ill( -bllrt '%ai(,cI'glh ot'c: rdl S:\\IH 11 1 e\'IIlilI
* 1111i8 U lII1Il~llo mC 1111111-11(1s11igblY (xciled oxvgcn ar~m prm' (luli(d lv
lb II (Ik llhin1101 iiw in :I hiVl1Iv illnlizod, laslde-prmhllIe'1 pIlIc-na. !hil
ion- ,fmI 01 in 'hI -)- '(, 8-1 r 1'lIiwl fronl a rec'i~~lhirnill X~~ p m It' !'1
ill
rl~I - 61- 11 1 1,
0D FORM 1473,83 APR I3 IN I.I-
Acknowledge me nfs
The authors gratefully acknowledge the support of the Air Force Office of
Scientific- Research and the Defense NuIclear Agency.
S Q' 'A(,TY
DTICSEL ECTEJ UL 1 1986
BA
3.~~p REUT
!''a
4. DISCUSSION 4
4. 1 Linewidth 6
4. 2 Stark Line shape Theory 8
REFERENCES 23
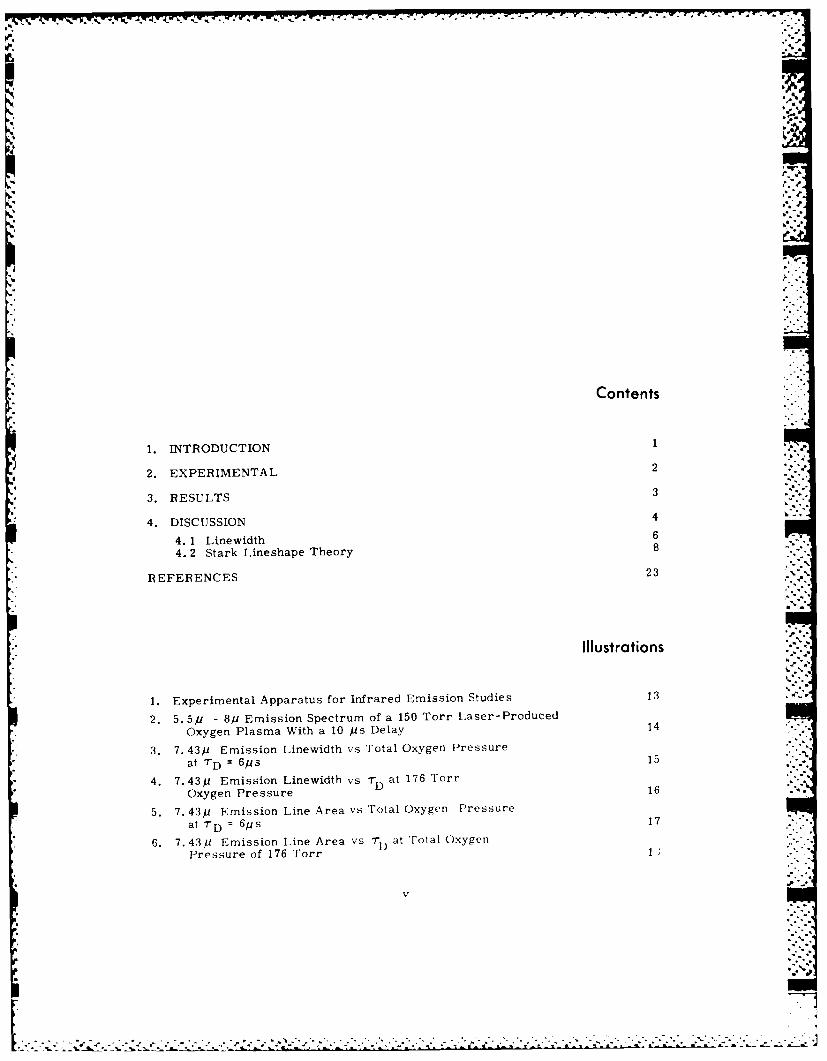
Illustrations
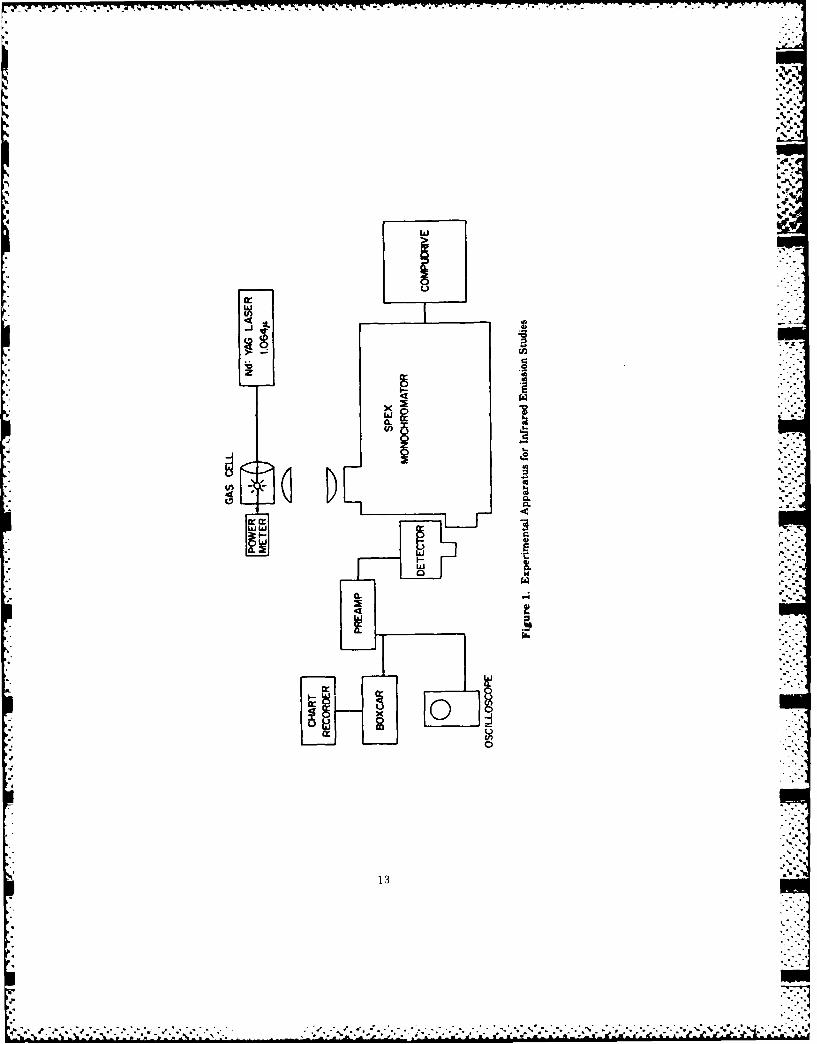
1. Experimental Apparatus for Infrared Emission Studies 13
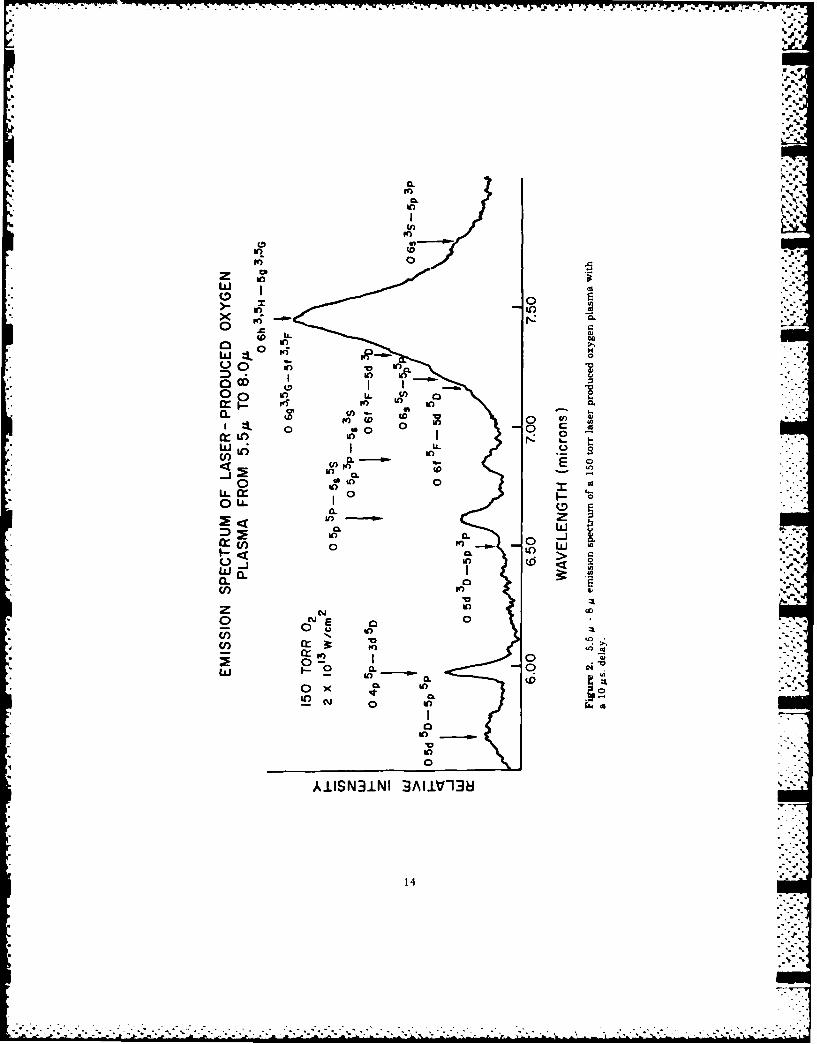
2. 5. 5,u - 8,u Emission Spectrum of a 150 Torr Laser-ProducedOxygen Plasma With a 10 us Delay 14
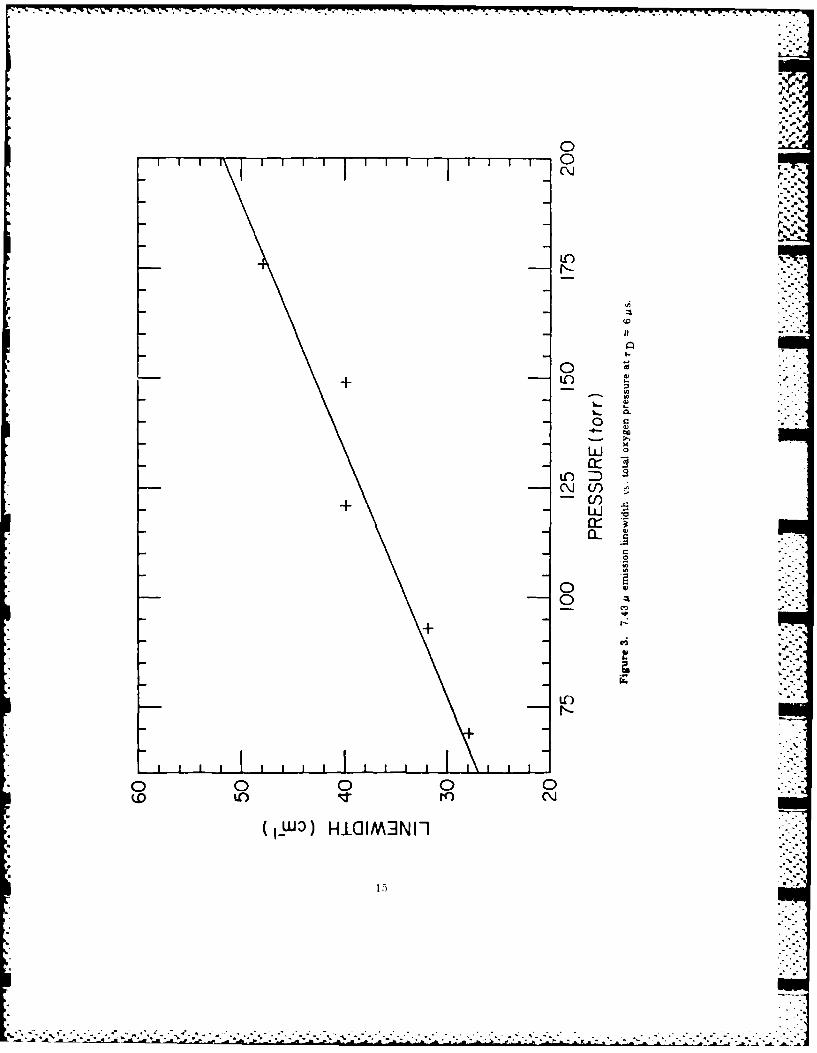
3. 7. 43/u Emission Linewidth vs Total Oxygen Pressure
at 7D = 6,us 15
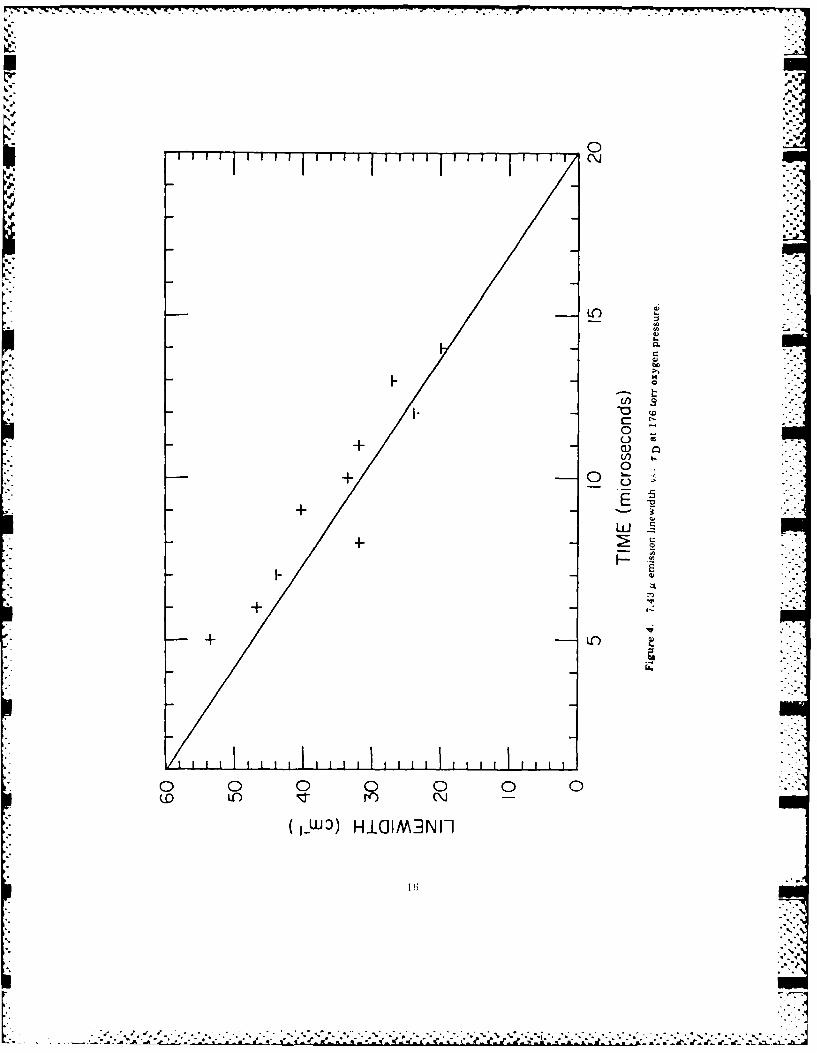
4. 7. 43,U Emission Linewidth vs -rD at 176 Torr
Oxygen Pressure 16
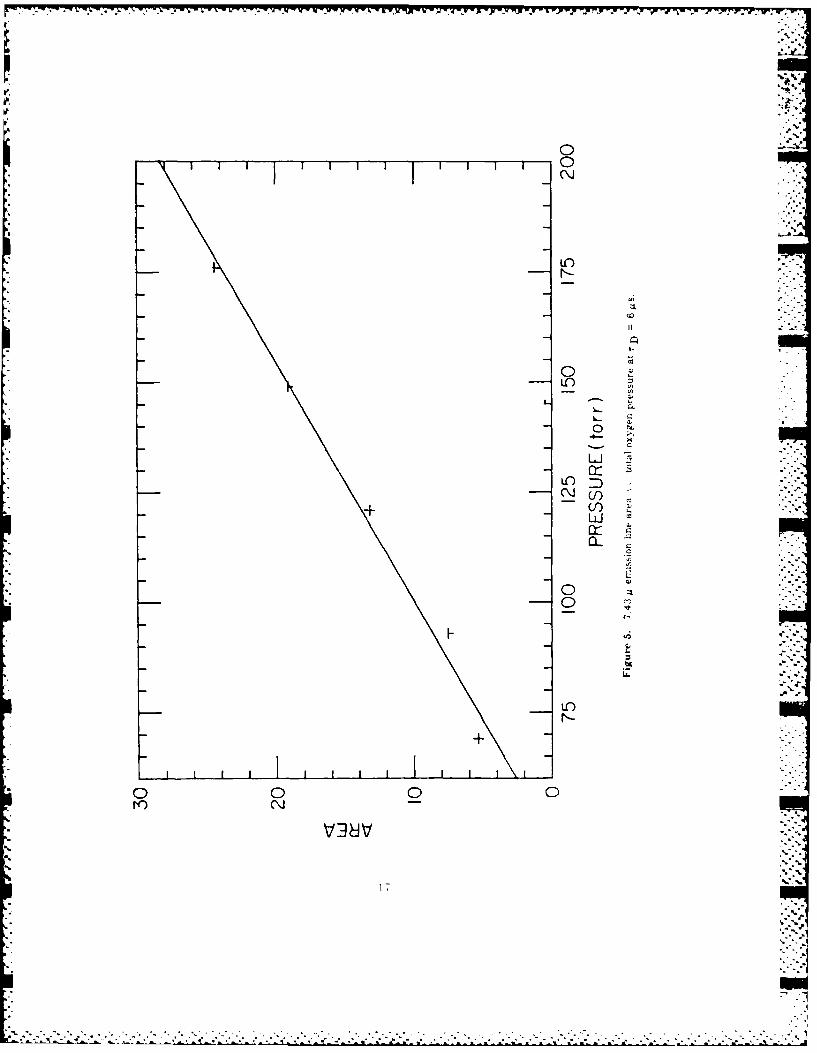
5. 7. 43ju Emission Line Area vs Total Oxygen Pressure
at TD 6,us 17
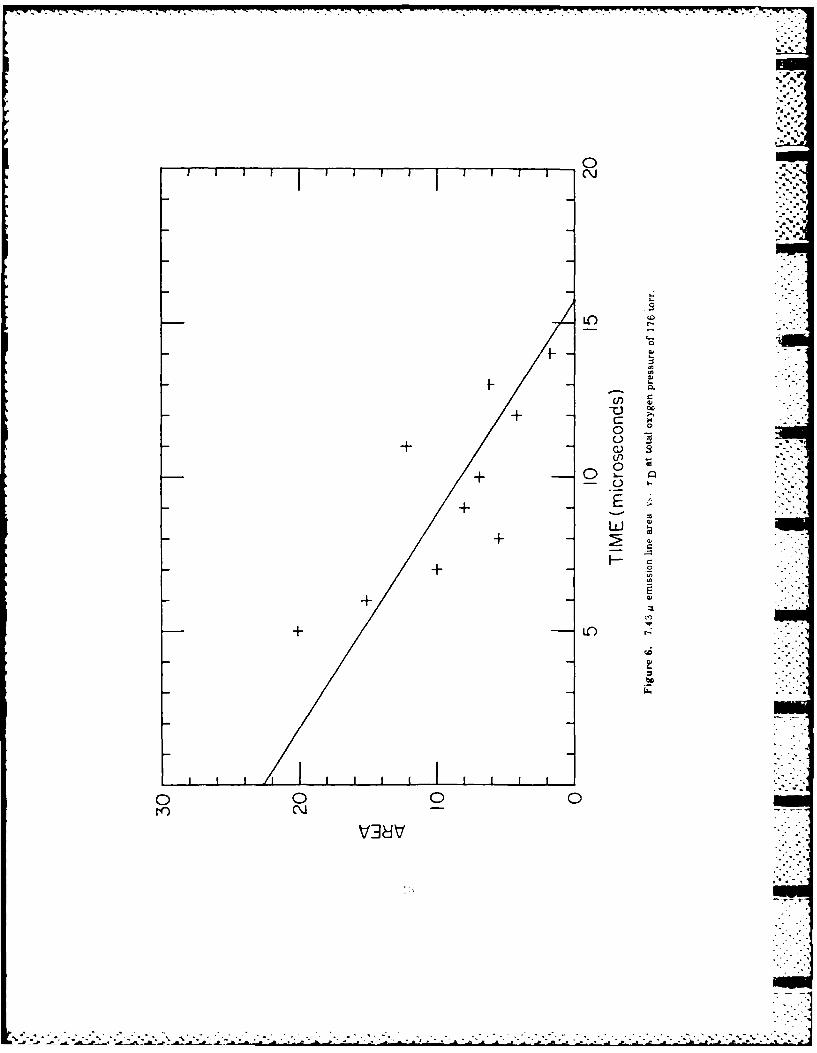
6. 7. 43,U Emission Line Area vs 7 D at Total Oxygen
Pressure of 176 Torr
V
. - ,8- -
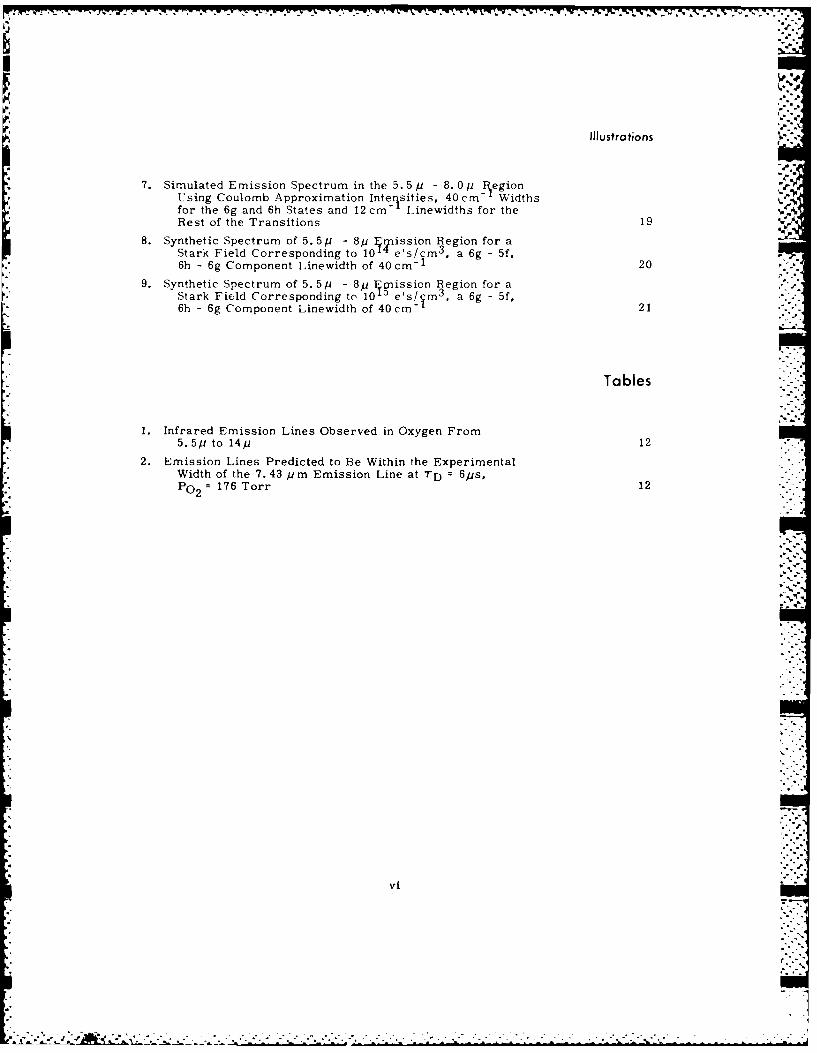
illustrations
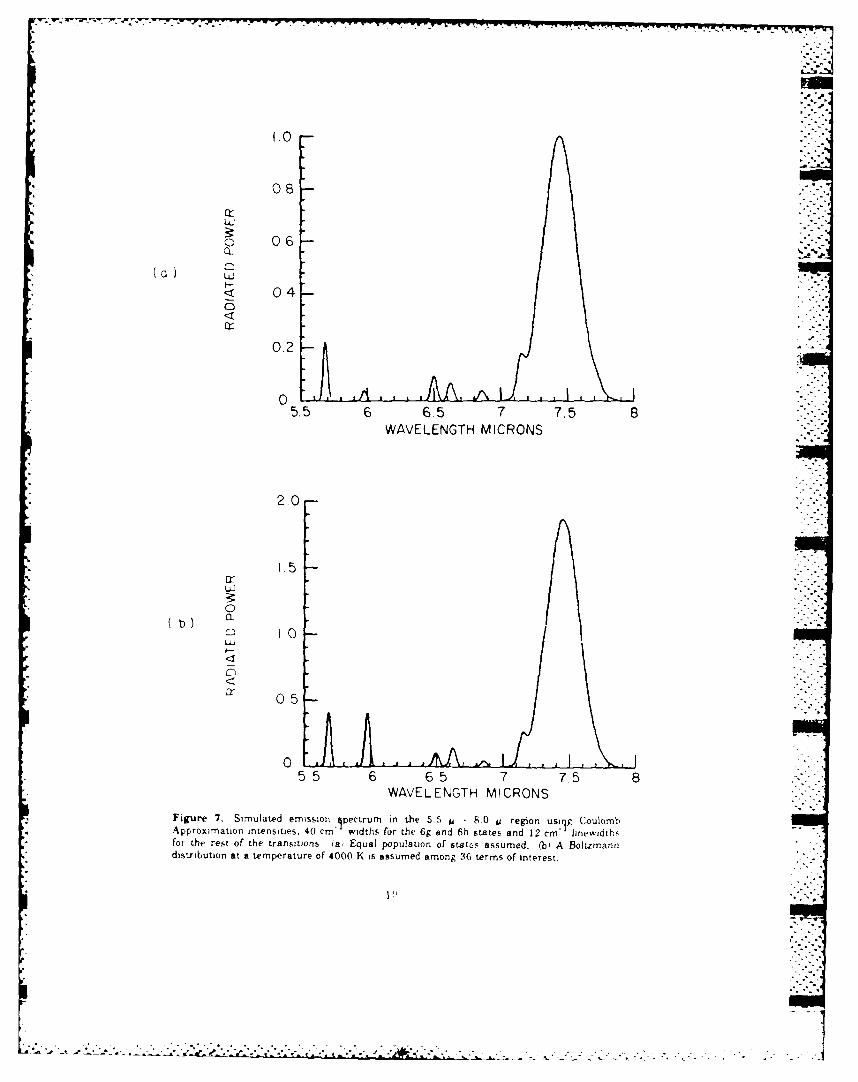
7. Simulated Emission Spectrum in the 5.5 p -8. 0 p E egionUsing Coulomb Approximation Interqsities, 40 cm- Widthsfor the 6g and 6h States and 12 cm Linewidths for the ..Rest of the Transitions 19
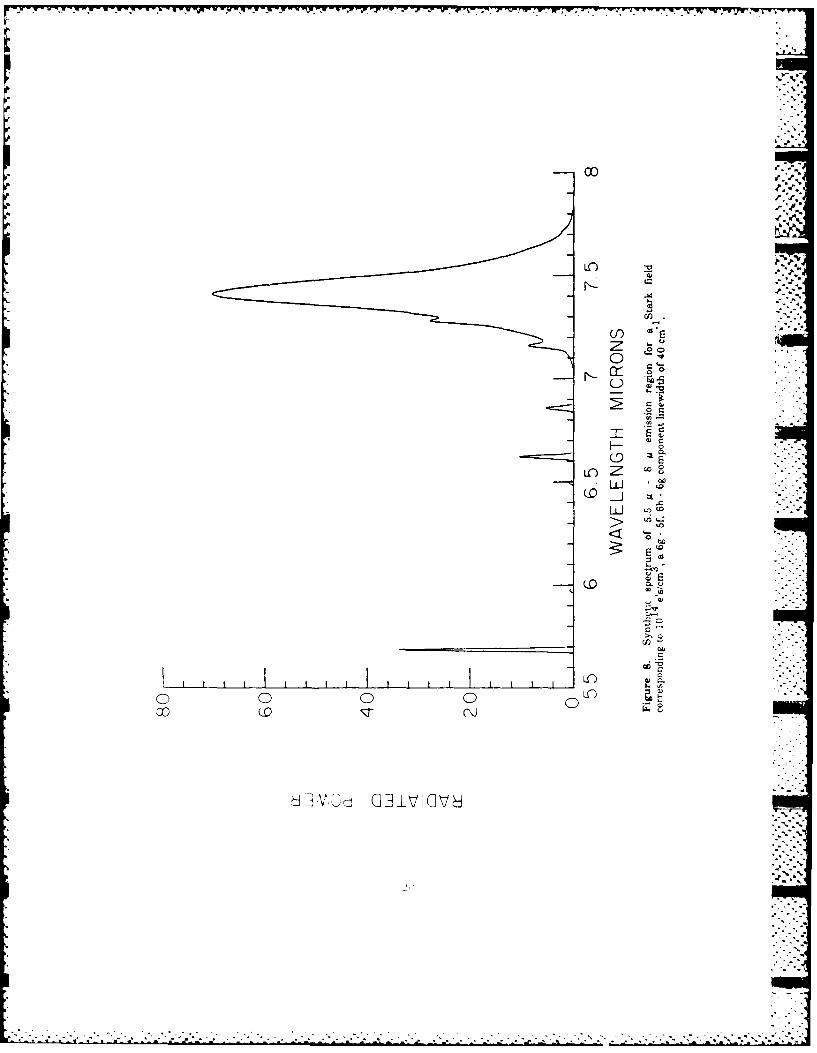
8. Synthetic Spectrum of 5. 5p - 8p Enission Region for aStark Field Corresponding to 1l0es/cm 3. a 6g - 5f,
6h - 6g Component Linewidth of 40cm - 20
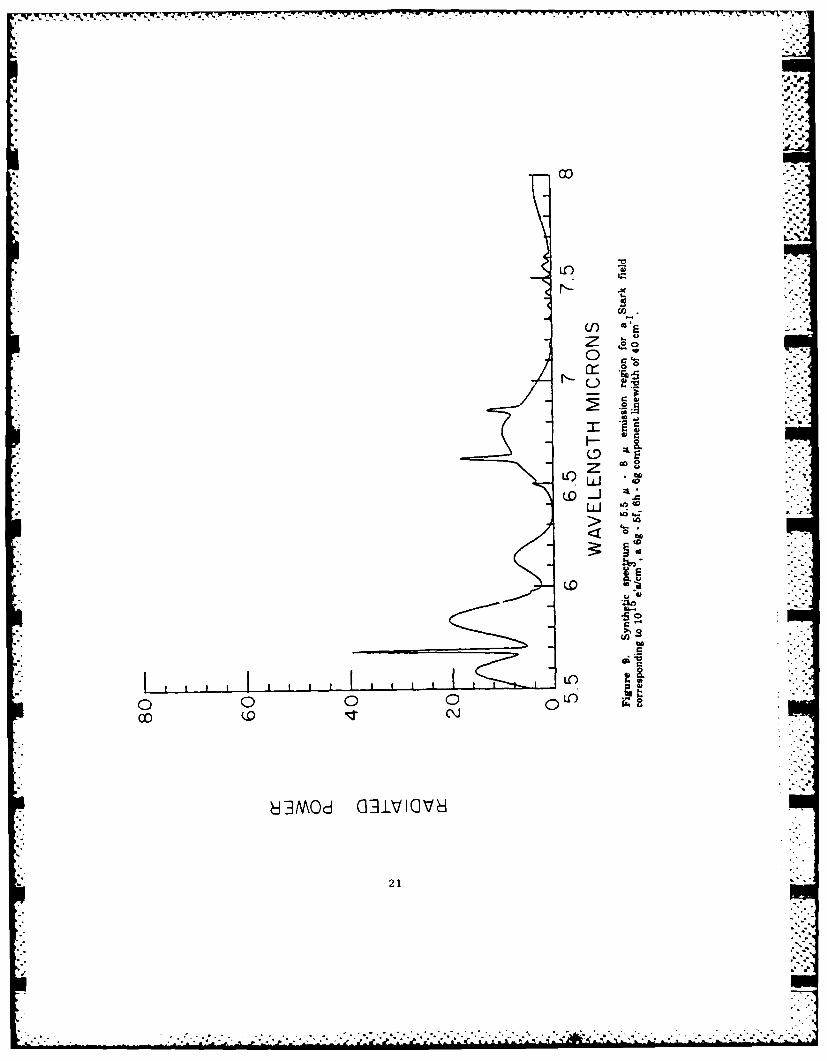
9. Synthetic Spectrum of 5. 5, - 8pu Eigssion Region for aStark Field Corresponding to 10 e's/i 3
, a 6g - 5f,6h - 6g Component Linewidth of 40cm- 21
Tables
1. Infrared Emission Lines Observed in Oxygen From5.5pu to 14pu 12
2. Emission Lines Predicted to Be Within the ExperimentalWidth of the 7.43 p m Emission Line at TD 6.ls,
176 Torr 12'02
vi* "
1. INTRODUCTION
Oxygen atom short wavelength infrared (SWIR) transitions observed in previous Laser-
Induced Nuclear Simulation (LINUS) studies I originate in states which lie more than
6800 cm below the ionization limit at 109837.02 cm 1 . These states are produced by
collisional deactivation of higher-lying atomic states produced by three-body recombination of
0 +( 4 S) with electrons. For several reasons, spectroscopic observation of these higher-
lying atomic states in a high-electron density, high-temperature plasma presents a
formidable experimental challenge. Insofar as the plasma may be described by a time
dependent temperature of some kind, the atomic state population will decrease as the
principal quantum number n increases for a given orbital and spin angular momentum
configuration. Since the energy separation between states decreases as n increases,
collisional deactivation processes will be more efficient for higher-lying states than for lower-
lying states. Even without the small separations in energy, higher-n states might have a
larger cross-section for deactivation than lower states, due to -the increasingly extended
nature of their electronic wave functions. Infrared emission lines between 0-atom states
where n > 4 are expected to lie at progressively longer wavelengths, occurring in regions
where detector technology is less well-developed than for the SWIR. The sum of these
considerations has resulted in the lack of observations of any 0-atom emission lines at
wavelengths longer than 5 ju in either plasmas or discharges. Although line positions and
oscillator strengths have been calculated for 0-atom infrared transitions based on
experimentally and theoretically determined energy levels, an experimental comparison
with these calculations is a matter of considerable importance for the understanding of the
infrared radiation processes which might occur in the disturbed upper atmosphere. We
report here the first time-resolved observations of transitions in the MWIR and LWIR in the
5 I - 14 ju region from a recombining oxygen plasma. Assignments have been made for thedo
Received for publication 27 Dec 1985
I.
-~~~ ~~~ . . .- .,- .- . .= . . .- .- *
2,3,4,5,6,7transitions using experimental and calculated energy levels from the literature.
The strongest of the observed emission features occurs at 7.43 u. This feature has been
studied as a function of background gas pressure and delay time, r D. The longest-
wavelength infrared line transitions identified positively are 6h 3 ' 5 H - 5g 3 ,5GO and 63'5GO
- 5f 3 '5 F calculated to be at 7.450 ji and 7.426 M respectively. The oscillator strengths
calculated by Biemont and Grevesse2 , and Sappenfield 8 employing the Coulomb
Approximation (CA) and our own hydrogenic calculations, are considered for a qualitative
discussion of the relative intensities of the these emission lines. The observed 7.43 u
emission feature occurs at the calculated position within experimental resolution. The
observation of the 6g and 6h states suggests that lower-lying states which are predicted to
give rise to LWIR emission are also populated, although we have not yet observed these
lines for technical reasons.
2. EXPERIMEN'TAl.
Figure 1 illustrates the experimental apparatus used for the MWIR emission studies. A
Quanta-Ray Nd:YAG laser (model DCR 1A, X = 1.064 A, 10 ns FWHM multilongitudinal
pulse, 10 Hz repetition rate) was focussed with a 56 mm f.l. biconvex lens into a gas cell
containing pressures of 50 to 250 torr 02. The laser was propagated parallel to the
monochromator entrance slit. A typical average laser power of 4 W created an estimated
13 2intensity of 2 x 10 W cm in the focal region.
The radiation from the laser-produced plasma was collected at 900 to the axis of the
laser beam and collimated and focused on the spectrometer entrance slit using two 100 mm
f.l. ZnSe lenses. In order to block all radiation except the wavelengths of interest from
reaching the detector, a Corion Industries filter transmitting the wavelengths 5.3 - 9.0 M
2,.%2%
b• . . . .
was placed just inside the entrance slit. The Spex 1870 spectrometer (0.5 m f.l.) was fitted
with a 150 grooves/mm grating blazed at 6.0 #. Use of this grating with 3 mm slit widths
yielded an overall resolution of 0.04 1A. The detector was a Santa Barbara Research Center
(SBRC) HgCdTe photoconductive chip mounted in a side-looking dewar cooled to 77 K, used
in conjunction with a SBRC Al10 preamplifier providing gain of 80 db. The system time
response was 0.5 us. Signal processing was done with a PAR 162-165 boxcar averager
using a 1.5 Us gate. The output of the boxcar was recorded on a strip chart recorder.
The wavelength accuracy of the spectrometer was checked by collecting 1.064 laser
radiation scattered in 5 th and higher orders. An additional check of MWIR line positions
was carried out by replacing the MWIR bandpass filter with a germanium window which
transmitted wavelengths > 1.8 u. This made possible the simultaneous viewing of SWIR
lines in 2 nd order along with the (much weaker) MWIR lines. The spectrum was calibratedth
using the line at 5.97 11 and the 7 th order of the 1.0642 j laser radiation with the 7.45 j,
line. LWIR scans were carried out using a 75 grooves/mm grating blazed at 10 jA and a
LWIR pass filter. The optical path was flushed with dry nitrogen or helium when spectra
are taken in regions where water absorption is considered a problem. A search for emission
lines using pure nitrogen gas in the same spectral region and under the same experimental
conditions showed only continuum radiation. This negative result helps to confirm the origin
of the oxygen plasma emission features as due to oxygen atoms and not artifacts of the gas
handling system.
3. HESI'IT,,
Figure 2 illustrates the 5.5 M - 8 A emission spectrum of a 150 torr laser-produced
oxygen plasma with a 10 us delay, uncorrected for the spectral response of the system, with
0.04 p resolution. In spite of the relatively slow time response of the detector, the setting of'S. r %'
the 1.5 us boxcar gate at 10 As after the laser pulse proved to be sufficient to gate out th.
:3
early-time continuum emission. All observed lines originate in the O-atom levels with n
4,5,6. The plasma temperature was estimated using the relative populations calculated
from the intensity ratio of the 6.62 k and 5.97 u lines and found to be 4,000 ± 1,000 K. This
estimate of a "temperature" is the only one available to us from our limited data. No line
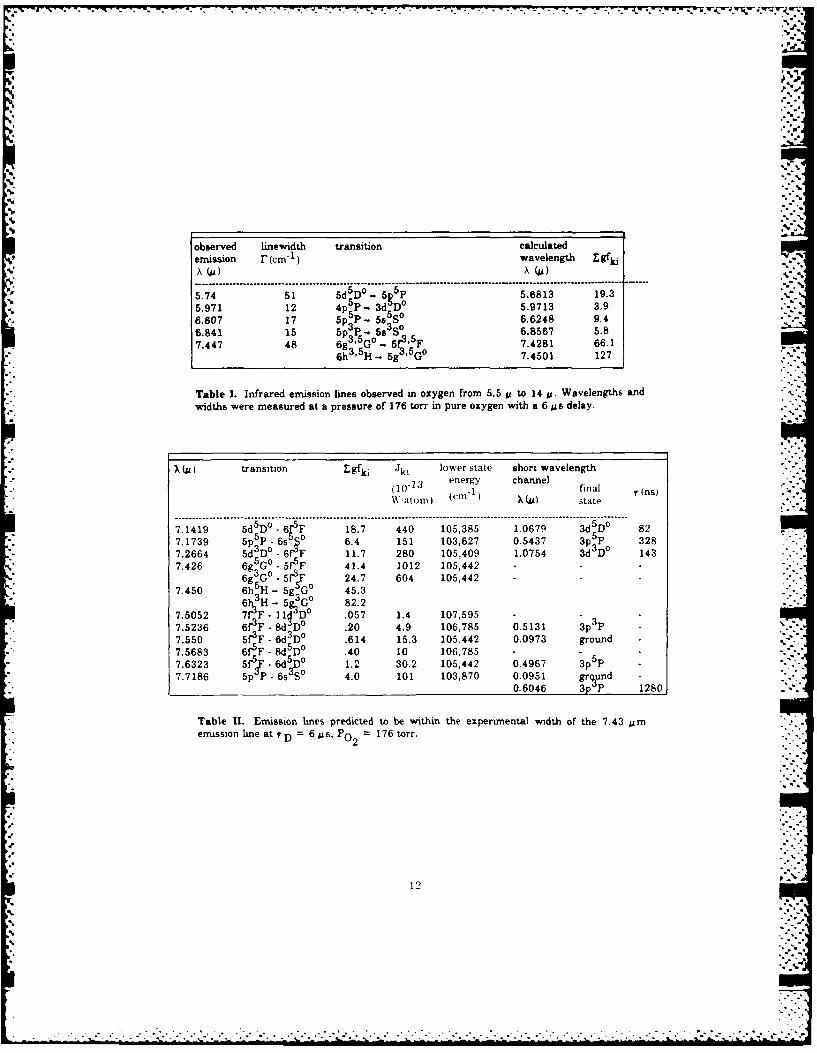
emission was detected above 7.45 M. Table I lists the observed infrared emissions along
with observed linewidths, Zgf factors and line assignments.
Measurements were made on the 7.-43 ji emission as a function of delay after the"-.
plasma initiation and as a function of pressure. The linewidth (full width at half maximum,
FWHM,, obeys the following empirical relationship:
r(t,P - 0.177P~torr) - 3.31 rDQMs) + 36.20 cm1
with a standard deviation a = 1.39 cm -1 , where r(tP) is the linewidth in cm 1, P is the
pressure in torr. and r D is the observation delay time in us, and where 50. < P(torr) <
200, 4 < rD(s < 20. The linewidth data as a function of pressure and delay time are
summarized in Fig. 3 and Fig. 4 for the 7.43 j transition.I~~~ .' ,IC'SO
These results constitute the first MWIR observations of line emission in a recombining
oxygen plasma and the first observation of the 6h' 5 H - 5g 3 "5Go emission. Several
general conclusions may be drawn from the experimental observations:
1. The observed lines may be assigned exclusively to transitions between high-lying O-atom -,
states. No emission attributable to 0 2 or ionic oxygen is observed. Infrared emission
between vibrational levels of ground states 02 is electric dipole-forbidden. The plasma
temperature is apparently sufficiently low so that very high-lying states of 0+ which might
give rise to MWIR emission are not populated at our observation times. The ozone emission
with origin at 9.5 j is absent. Emission is not observed from O-atom states with an 0+
4
~ . . N
2 DO) core configuration.
2. The positions of the lines at 5.97 ju, 6.61 A, 6.84 1A, and 7.43 ju correspond to calculated
values to well within experimental resolution. The 5.74 u line center is slightly displaced
from the calculated value of the 5d Do -. 5p 5 P transition (5.68 u). The line center position
is not reproducible from spectrum to spectrum because of poor signal-to-noise.
3. All of the observed lines are predicted to be strong by the CA calculations. No lines are
observed which have low CA oscillator strengths. In addition, we might expect CA
calculations to be even more justified for MWIR lines originating in n = 5,6 than for SWIR
lines originating in n = 4. Therefore, we believe that CA calculations used in conjunction
with tabulated energy levels differentiate accurately between strong and weak MWIR lines.
The preliminary nature of these data precludes addressing accurately the quality of the
CA calculations for each of the individually observed lines. However, some qualitative
discussion of the results along with some speculation may be offered. The "temperature"
calculated from the 6.61 1/5.97 u intensity ratio gives a temperature of about 4,000 K.
These lines were chosen for the temperature estimation since their upper states are subject
to no known perturbations, allowing more reliance on the CA oscillator strengths. However,
the np 3 P states are known to be perturbed by close-lying levels. 2 The 5p3P and 5p5p
states are separated in energy by 244 cm 1 , with the triplet state at higher energy, and
would be expected to contain nearly equal populations under these temperature conditions.
Since the 5p3P state is observed to contain a lower population than the 5p5P state by a
factor of 0.6, we believe the true oscillator strength for the 5p 3 p - 5s3SO transition at 6.84
u ought to be lower than the calculated CA oscillator strength. Additional evidence for
perturbation of the 5p 3 P state is obtained by the lack of observation of the 5d 3 DO - 5p 3 p
transition at 6.49 u. This transition gf = 13.1) ought to be observed nearly as strongly
as the 5d5D ° - 5p 5 P transition at 5.68 g. in the absence of perturbations, yet is apparently
missing. These data suggest that further attention taking account of detailed state-to-state
5
perturbations should be devoted to the calculation of all infrared oscillator strengths for lines
which either originate or terminate in a np 3P state.
The broad emission feature centered at 7.43 IA is assigned predominantly to the
6g 3 ,5Go - 5f 3 ' 5 F and 6h 3'5 1 _ 5g 3 '5 G transitions. The calculated oscillator strengths for
these transitions are extremely high Egf = 66.1 and 127 respectively) and the transitions
are expected to appear quite strongly in spite of the high energy of the 6g 3 , 5GO and 6h 3 '5 H
states. These transitions are cxpected to be particularly sensitive to Stark broadening
effects, due to the high n,l values of the states involved, the nearness of perturbing levels
and the large polarizabilities of the states.
The position of the 6h 3 "5 H term can be estimated using polarization theory. 9 The
result is 106,788.515 cm" 1 or about 0.6 cm " 1 above the 6g3 5GG state. We may check this
estimate by computing the position of the 5g 3 SGo term, at 105,445.962 cm 1 previously
assigned by Saum and Benesch 4 Our estimate is 105,446.259 cm "1. Using this calculated
value for the term energy of the 6h 3 ,5 H state the 6h 3 ,5 H - 5g 3 ,SGo transition is predicted
to lie at 7.450 1, well within the envelope of the experimentally observed emission feature.
1.1 ILine" idth,
The range of observed linewidths for the emission lines is from 12 cm' to 51 cm 1 at a
pressure of 176 torr and a delay time of 6 us. The emissions at 5.97 AA and 6.61 u are
assigned as the single transitions 5p5p - 5s5S ° (17 cm "1) and 5p 3P - 5s3S ° (15 cm')
while the emission line at 7.43 u is assigned as an envelope of a number of transitions
dominated by the 6g 35Go - 5f 3 '5 F and 6h 3 ' 5 H - 5g3 '5 Go transitions. These widths are
well outside the spectrometer resolution of about 2 to 4 cm'n. The major contribution to the
hnewidth is expected to be due to interactions between the neutral atom and the electron
density of the plasma. Therefore, a study and understanding of linewidths and shapes
should lead to estimates of the elect-on number density in the plasma. Contributions to the %
6
observed lnewidths will be discussed in this section. First, a synopsis of line broadening will
be given to establish notation.
4. 1. 1. HOMOGENEOUS BROADENING
The natural width of a particular transition is given in terms of the oscillator strength
and wavelength by rki(cm = fkiI /450 (ki2U), where k> represents the upper state
and Ii> the lower state of the atom. fk1 represents the emission oscillator strength and is
related to the absorption oscillator strength by fki = "(gi/gk)fik and to the transition matrix
element by I<ilrlk>12 = -10.97 Xki(u)fki a.u. The gi and gk are lower state and upper
state degeneracies respectively. The line strength is Sik(a.u.) = 32.92 gifik X (1) and its6 S g 3
relation to the Einstein coefficient is Aki(s' 2.03 x 10⁶Sik/gk3) where Sik is in
atomic units. The intensity in watts/atom-steradian is defined as Jki = (3.013 l-.
10"1 3 14(j.&))<ijr(a.u.)Ik>I 2 . The sum of all the allowed transitions between the 6g 5 G-
and the 5f 5 F j, states gives fkiI = 4.705 yielding a width r = 0.002 cm "1 , a lifetime -r 0
176 ns and a halflife r 1/2 122 ns.
We may estimate the cross-section necessary to account for lifetime broadening due to
non-radiative processes using estimated properties of a typical plasma system. For
velocities corresponding to temperatures of 2500 K to 4500 K, ne = 10 electrons/cm and
a linewidth of 12 cm 1 the cross-section would have to be approximately 10"1 cm2 .
4. 1. 2. INHOMOGENEOT'S 13RO.AD,-NIN(;
Within the observed line profile of the 7.13 p emission there are a number of possible
transitions so that we might consider the emission profile as an electron broadened
composite of these. Table H lists these transitions. Figure 7 shows a simulation of the lines
from 5.5 p to 8.0 u using CA intensities, an instrument solution of 4 cn<" , a linewidth of
12 cin1 for all lines exc.ept the ih-5g ;mtd (44 -d tr,w~ii-ii xhw ut\rt, asigned a -10
cm 1 width.
7. . _
"o,'
4.2 Stark Lineshape Theory
In order to gain further understanding of the broadness of the 7.45 )A feature, we have ,
synthetically constructed an emission profile based on computed oscillator strengths and a
simple non-degenerate Stark broadening theory. The matrix elements computed in this
theory may be used later in a more extensive theory of line broadening. We assume that the
emitting atom experiences an average electric field which is computed using the electron
density as a parameter. For simplicity we ignore the Holtsmark distribution function. This
average field splits the J-sublevels of a given term to second order in the Stark effect.
The Stark shift AEnJLS is given in second order by
I< n'J'L'SIR(1)InJLS > 12
AEnJLS = n'J'L'
E (o) E(o)n'J'L'S - nJLS
where a sum over spatial orientation has already been performed and a sum over 17 terms
for each multiplicity has been taken. The matrix elements,
I<n'J'L'SIR(1)lnJLS>I 2 = ((2J+ 1)(2J' + 1)(2L+ 1)(2L' + 1))
xI <(n'L)IIR( 1)I(nL) > 12 j' 1 (L L 2
where <(n'L')IIR(1)II(nL)> represents the integration over the radial wave function of the
10atom and the usual notation for 3j and 6j symbols is used. These matrix elements are
calculated using hydrogenic wave functions and agree reasonably with the CA results. The
width, r, and shift, A, of each J-component in each term is assumed to be due to electron
collision processes. We may scale the temperature and electron number density dependence
of this width 11 using
8
- -r"
a.. *. ."
r = (1+ 1. 7 5a(ne)(1 - 0.75R(ne)))r o
a = (Ao/Fo + 2.Oa(ne)(1 - 0. 7 5 R(ne)))ro
where a(ne) = the quasi static ion broadening parameter, R(ne) = the Debye shielding
parameter, and where a scales as ne 1/4 and A and r scale as ne. Altraively, a width
parameter set by the observed width of a single, isolated transition may be introduced. The
energies of the perturbing levels are taken from Bashkin 3 , Saum and Benesch,4 Erickson
and Isberg,6 Isberg7 and Russell-Saunders coupling is assumed. It should be noted that the
6g 3 5G ° state is only 0.6 cm 1 below the 6h 3 '5 H level and 2.8 cm "1 above 6f 3 '5 F. We also
assume that the effective electric fields have no preferred direction in space. The second-
order Stark effect connects levels by way of dipole matrix elements. These have been
calculated using hydrogenic wave functions and the matrix elements compared with
previous calculations. 2 ' 1 2 '8 ' 1 3 The Stark calculation estimates the perturbation of each J-
sublevel in a given term and computes the wavelengths and energies for transitions between
terms. The relative intensities for each J-component are used to make up the line profile
and the line shift comes about from the shift in the center of gravity of the resulting
transitions. In this model, the 7.43 u emission feature is composed of the Stark splitting of
each of the lines listed in Table II using the electron density as a parameter. Synthetic
spectra are composed of Gaussian lineshapes having a width as previously described. An
obvious feature of the synthetic spectra is the sensitivity on electric field strength. This is
due to the presence of nearby perturbing levels. Results for electron densities of 1014 and
1015 in" are presented in Figures 8 and 9. Clearly, the line positions of the calculated
transitions are strongly influenced by the presence of an electric field. Since we observe no
shift of line position from the zero-field predictions we conclude that either the electric field
strength at the site of the emitting atoms is negligible, or that there is significant mixing of
states so that a degenerate broadening theory should be used. The observed broadness of
the 7.43 u feature must be due to a process essentially unrelated to the Stark J-level
9
o-9.° . .
splitting approach used for our spectral simulations.
Lifetime broadening could conceivably account for much of the observed width of the
7.43 A feature. A width of 50 cm " corresponds to a lifetime of 10" 3 s.. This implies the
existence of an extremely efficient electron-emitter collision process. The decrease in
linewidth with increasing time delay and decreasing pressure are consistent with this
441
suggestion. Since the 6f, 6g and 6h states lie within an extremely narrow (3 cm 1 ) energy
range, the cross-section for collisional transfer between these states might be expected to be
several orders of magnitude greater than gas-kinetic. Although it is difficult to assess the
*" form of the potential which might be responsible for such rapid collisional state scrambling,
it might prove significant that the hydrogenic matrix elements <61rl6g> and <6glrl6h>
are extremely large. In a sense, electron broadening is such a collision process. We are
therefore applying a more rigorous lineshape theory to the near degenerate state situation
found in the upper levels of atomic oxygen.
We have searched for O-atom line emission in the 8 j - 12 u region, with negative
results. The CA oscillator strengths predict transitions in the 10.4 J and 11.7 JA regions
with oscillator strengths similar to the transitions observed in this experiment. These
"' transitions originate in the levels 6d5 D, 5p 3 P and 6d3 D. Since we observe 6g - 5f
- transitions in the MWIR, lower populations of levels giving rise to LWIR transitions should
not be the cause of the failure to observe these lines, since the 6g levels lie higher in energy
than the other levels. Rough calculations taking into account the lower energy of the LWIR
transitions and the increase toward longer wavelengths of 300K background radiation
,* viewed by the detector indicate that an increase in signal-to-noise ratio of at least a factor of
10 might be necessary for the laboratory observation of these LWIR emission lines. Several
experimental parameters might be altered in order to obtain this signal-to-noise "4..
improvement. These include trading off detector time response for greater quantum
10
.4 4.. **.. *....** . 4. ... 4. . *.-
-~..
*4. J.* .5p
*54
efficiency, increasing the laser repetition rate, lengthening the time width of the boxcar gate
and performing slower spectrometer scans.
4. ~
J4
4.
4.
4,
11
5.. - -.............. I
observed linewidth transition calculatedemission r(CM-1 wavelength LgfkiA (U) (U)--------------------------------- --- . . . - . -.--------- -- ----------- . . . . -- -- -I----
5.74 51 5dSDo -55 5.6813 19.35.971 12 4p P - 3d Do 5.9713 3.96.607 17 5p P - 58s 6.6248 9A46.841 15 5p 3 P - 56 3S0 6.8567 5.87.447 48 6g 3 ,GO - 5fj3 '5 F 7.4281 66.1
6h3 '5 H 5g3 SGo 7.4501 127
Table 1. Infrared emnission lines observed in oxygen from 5.5 ju to 14 jA. Wavelengths and
widths were measured at a pressure of 176 torr in pure oxygen with a 6 jus delay.
)~ (u transition ~ ~ i~ i lower state short wavelength
energy channelSatom) (cm )du) state ns
7.1419 5d5DO -6 F 18.7 440 105,385 1.0679 3d5DO 827.1739 Sp P 6s~ 6.4 151 103,627 0.5437 3p P 3287.2664 5d Do - PfF 11.7 280 105,409 1.0754 3d Do 1437.426 6g5 G0.- 5f 5F 41.4 1012 105,442
6g Go- 5f ~ 24.7 604 105,4427.450 6h H - 5g Go 45.3
- 3 5 o 82.27.5052 7"F- Ild D .057 1.4 107,5957.5236 6t F-8D .20 4. 1675 05131 37.550 5i 3 F. rd 3 DO .614 15.3 105,442 0.0973 ground7.5683 f5 F - 8d5DO .40 10 106,7857.6323 5fI-F - 6d5Do 1.2 30.2 105,442 0.4967 3p5 P
7.58 p P- 6s SO 4.0 101 103,870 0.095 1 grc ud0.6046 3p P 12801
Table II. Emission lInes predicted to be within the experimental width of the 7.43 Mumemiassion line at r 6 jus, P0 176 torr.
12
C C C . ~ - - . . . . .
-C.'.
-V.fl--CI.J.-C
- -a -a.
-C..
4.4.
4
ICC)
4C-i
C,
0z I4
Ci
0
/1
'ii jj
(I 0.0.I CI
0
0. -
4
0!0
J
13
7C - - .- ~C..(: -. - C.---.
CL
k).
(IIn
00-)w
o 0 0
0 1.
0 LL
Ln ----
~Lt) it)
(I) K) )
00
AIIN3N -A -13
0 ~1 0
C\j U
Co)
LOI
LO CI-
iluD HAI3NIo15,
UI.'
j 0C~J
I"
I,'
~ III
I.-
*1.
In4)S..
4)
540
U) 3I. -o
0~+ C-)a.) ~(I)0
+
+4)
LI-i~ C+ 0
1- 4)
C-,
+ C-.
+ IC)
IllIllIt liii lilt! 1111111111 It
0 0 0 0 0 0 0IC) r() C\J -
.5.
CMj
LC)
C~C
LO
C~C
IT-
('4
LC)
00
C~C
Vo -V
R - 1..1 - -K- "
06
06
LuJo 06 -''-'
,< 04-
0.2
05.5 6 6.5 7 7.5 8
WAVELENGTH MICRONS
20
1.5uJ
05a 05
0 -55 6 65 7 75 8
WAVELENGTH MICRONS
Figure 7 Simulated emission -pectrum in the 5.5 ; - 8.0 u region usilg CoulombApproximation intensities, 40 cm widths for the 6g and 6h states and 12 cm inewidthsfor the rest of the transitions a' Equal population of states assumed. (b A Boltzmanndistribution at a temperature of 4000 K is assumed among 36 terms of interest.
LA--)
f ') "E
oO
0
0 00 j0
Q00
211
CA)
Cr) 'Ez 0
0 0
0'
o0 0 0
8BMOd (QiLVlGV8
21
Ref erences
1. J. Lurie, S. Miller, K. Armstrong, Technical Report AFGL.TR-84-0161, (1984), AD A147528.
2. E. Biemont and N. Grevesse, Atomic Data and Nuclear Data Tables 12, 217, (1973).
3. S. Bashkin and J.O. Stoner, Atomic Energy Level- and Grotian Diagrams, Vol. I,North Holland Publishing Co., N.Y. 1975 ...
* 4. K. A. Saum and W. M. Benesch, Applied Optics 9, 1419 (1970)
* 5. C. E. Moore, Atomic Energy Levels, Vol. I, NBS 467, (1949).
* 6. K. B. S. Eriksson and H. B. S. Isberg, Arkiv F~r Fysik 24, 549 (1963)
7. B. Isberg, Arkiv Fb;r Fysik 35, 495 (1967)
8. D. Sappenfield, private communication
9. B. Edein, Hancbuch der Physik, 27 sec. 20, (1964).
*10. A. R. Edmonds, Group Theory and Quantum Mechanics, Princeton University Press1972.
* 11. H. R. Griem, Plasma Spectroscopy, McGraw Hill, N.Y. 1964: H1. R. Griem, Spectral
Line Broadening by Plasmas, Academic Press, N.Y.
12. A. K. Pradham and H.G. Saraph, J. Phys. B: Atom. Molec. Phys. 10, 3365, (1977)
13. H.B. Schulman, F. A. Sharpton, S. Chung, C. C. Lin, and L. W. Anderson, to bepublished.
23
- . -* -~ .- ~---~ -~ - ~ -~ - -
1.'.I.
5~
a ~ .~.
~
~
J
1%.