Embed Size (px)
Citation preview

Ecological Applications, 22(7), 2012, pp. 1949–1961� 2012 by the Ecological Society of America
Long-term changes in community assembly, resistance,and resilience following experimental floods
CHRISTOPHER T. ROBINSON1
Department of Aquatic Ecology, Eawag, 8600 Duebendorf, Switzerland and Institute of Integrative Biology,ETH-Zurich, Zurich, Switzerland
Abstract. This study examined the long-term changes in community assembly, resistance,and resilience of macroinvertebrates following 10 years of experimental floods in a flowregulated river. Physico-chemistry, macroinvertebrates, and periphyton biomass weremonitored before and sequentially after each of 22 floods, and drift/seston was collectedduring six separate floods over the study period. The floods reduced the density and taxonrichness of macroinvertebrates, and a nonmetric dimensional scaling (NMDS) analysisdistinguished temporal shifts in community assembly. Resistance (measured as the relativelack of loss in density) to floods varied among taxa, and the abundance of resistant taxa wasrelated to the temporal changes in community assembly. Community resistance was inverselyrelated to flood magnitude with all larger floods (.25 m3/s, .16-fold over baseflow) reducingdensities by .75% regardless of flood year, whereas smaller floods (,20 m3/s) reduced taxonrichness approximately twofold less than larger floods. No relationship was found betweenflood magnitude and the relative loss in periphyton biomass. Resilience was defined as therecovery slope (positive slope of a parameter with time following each flood) and wasunrelated to shifts in community assembly or resistance. Macroinvertebrate drift and sestondemonstrated hysteresis (i.e., a temporal response in parameter quantity with change indischarge) during each flood, although larger floods typically had two peaks in bothparameters. The first peak was a response to the initial increases in flow, whereas the secondpeak was associated with streambed disturbance (substrate mobility) and side-slope failurecausing increased scour. Drift density was 3–9 times greater and that of seston 3–30 timesgreater during larger floods than smaller floods. These results demonstrate temporal shifts inmacroinvertebrate community assembly toward a pre-dam assemblage following sequentialfloods in this flow regulated river, thus confirming the ecological role of habitat filtering inorganism distribution and abundance. Community resistance and resilience were unrelated toshifts in community assembly, suggesting that they are mostly evolutionary properties ofecosystems as populations adapt to changing environmental (disturbance regimes) and biotic(novel colonists) conditions. As these systems show behaviors similar to dispersal-limitedecosystems, a long-term perspective is required for management actions targeted towardregulated and fragmented rivers.
Key words: flow regime; large dams; macroinvertebrates; periphyton; regulated river; temporal.
INTRODUCTION
Most large rivers globally have been regulated to
some degree with .45 000 large dams currently in place
for water storage, hydropower production, navigation,
and flow regulation (Nilsson et al. 2005). The ecological
consequences of these large dams are many, including
fragmentation in river connectivity (Ward and Stanford
1979, 1995), isolation of riverine flora and fauna
(Mueller 1995), alterations in the physical habitat
template below dams (Graf 2006), and changes in biotic
interactions and aquatic food webs (Power et al. 1996,
Cardinale et al. 2005, Cross et al. 2011). Many of these
ecological changes have been conceptualized earlier in
the serial discontinuity concept that places rivers and
their inhabitants in a holistic, landscape perspective that
integrates the multidimensionality of intact rivers (Ward
and Stanford 1983). A holistic, landscape perspective is
imperative if ecologists and resource managers are to
better understand and predict the effects of mitigation
measures, e.g., adaptive management programs, on
long-term processes acting on river ecosystems. For
instance, fragmentation in the river continuum by large
dams constrains the dispersal of many aquatic organ-
isms, ranging from seed dispersal of riparian plants
(Merritt and Wohl 2006, Bejarano et al. 2011), overland
dispersal of aquatic insects during the adult winged stage
(Monaghan et al. 2002), to instream movement of
migratory shrimps, fishes, and mammals (Dudgeon
2000), with important implications regarding population
sustainability and persistence. Indeed, dispersal limita-
tion may be a major constraint in mitigation measures
Manuscript received 28 June 2011; revised 20 April 2012;accepted 24 April 2012. Corresponding Editor: A. K. Ward.
1 E-mail: [email protected]
1949

contingent on the successful recolonization of rivers by
organisms outside the system (Palmer et al. 1996), or
even facilitate the biological invasion of the system
(Johnson et al. 2008).
Floods and flow pulses are features of the natural flow
regime of most unregulated rivers (Junk et al. 1989, Poff
et al. 1997), and the natural flow regime has been
highlighted as an important factor for inclusion in the
management of flow regulated rivers (Poff et al. 1997,
Arthington et al. 2006). Concomitantly with flow, the
temperature regime also has been long-recognized as a
driving force in the habitat template of river ecosystems
(Vannote et al. 1980, Vannote and Sweeney 1980), and
both flow (Robinson and Uehlinger 2008, Cross et al.
2011, Melis 2011) and temperature (Olden and Naiman
2010) have been used in the management of regulated
rivers with varying success. Floods, in particular, are
important disturbance events influencing the eco-evolu-
tionary adaptations of freshwater organisms, being an
inherent force dictating life histories and affecting biotic
interactions within rivers (Robinson et al. 1992, 2002,
Lytle and Poff 2004). Consequently, the perception of
floods in adaptive management programs must be
placed within the framework of disturbance ecology
and its theoretical underpinnings (Pickett and White
1985, Poff et al. 1997), especially as experimental floods
also affect other habitat features of river ecosystems that
are linked with the structure and function of biotic
assemblages (Robinson and Uehlinger 2008, Melis
2011). In the most basic sense, experimental floods must
be considered in respect to magnitude, duration, and
frequency (Lake 2000), and each specific to individual
river systems and the landscapes through which they
flow.
Disturbance, and flood disturbance in particular,
directly influences the population biology, community
assembly, and various emergent properties of ecosys-
tems (Connell 1978, Huston 1979). Two related ecosys-
tem properties that emerge at both the population and
community level in relation to disturbance include
resistance (here measured as the relative lack of loss in
a specified parameter to floods) and resilience (here
measured as the positive slope in a specified parameter
vs. time following a flood) (after Webster and Patten
1979). It has been inferred that species populations and
community assemblages that have evolved in ecosystems
with an inherent disturbance regime would demonstrate
greater resistance and resilience to future disturbances
than species populations and assemblages adapted to
more stable environmental conditions (sensu Connell
1978). This inference is a primary premise behind the
observed biotic changes that occur in regulated rivers
below dams (Ward and Stanford 1983) and the expected
biotic response of these systems to experimental floods
(sensu Collie et al. 2004). For instance, biotic assem-
blages should shift in species composition in response to
the change imposed on the habitat template from the
flood disturbance (Robinson and Uehlinger 2008).
Although strongly based on disturbance theory, little is
known regarding the spatial and temporal dimensions in
response patterns of biotic assemblages (species and
communities) to a novel disturbance regime, especially
in river systems fragmented by large dams. For example,
Robinson and Uehlinger (2008) document multiple
shifts in community assembly in a regulated river in
response to a multiyear flood disturbance regime, and
this particular system is further examined in the present
paper.
A recent development in the use of experimental
floods to improve ecological conditions below dams is to
view them as large-scale ecosystem experiments (Konrad
et al. 2011). Large-scale experiments in running waters
are few and obviously complex in design as they are
typically implemented under the constraints of individ-
ual adaptive management programs, mechanical limits
of dam operations, and human-related issues of
hydropower and reservoir use (Kondolf and Wilcock
1996, Schmidt et al. 2001). A further current aspect is the
interaction of these above constraints with changes in
climate and water availability (Konrad et al. 2011).
Regardless, many important eco-evolutionary insights
will be gained as the number of these large-scale
experiments become implemented and monitored. The
information gained will certainly influence future
mitigation and management efforts to improve the
ecological integrity of running waters in conjunction
with using these systems for human needs, and is a
growing area of research. Large-scale flow experiments,
such as used in this paper, are often an integral
component of adaptive management programs, al-
though the goals of such programs vary and may be
somewhat removed from attaining a natural flow regime
for a particular river system (see Konrad et al. 2011).
The primary objective of this paper was to examine
changes in benthic (macroinvertebrate and periphyton)
assemblages in response to sequential experimental
floods designed to improve trout habitat conditions in
the river over a 10-year period. A second objective was
to examine temporal changes in response patterns in
macroinvertebrate drift and transported organic matter
(seston) during individual experimental floods. This
paper builds on the results of Robinson and Uehlinger
(2008) who summarize population and community level
responses to the floods (also see Robinson et al. 2003).
Hypotheses tested with the long-term data set included:
(1) macroinvertebrate community assembly would shift
over time in response to changes in the habitat template
caused by experimental floods; (2) the abundance of
relatively flood-resistant invertebrate taxa would in-
crease in the river over the study period, whereas those
taxa less resistant to floods would decrease; and (3)
concomitant with shifts in community assembly,
macroinvertebrate community resistance and resilience
to individual floods would increase over the study
period. The hypotheses tested with data from the
second objective were that: (1) response patterns in
CHRISTOPHER T. ROBINSON1950 Ecological ApplicationsVol. 22, No. 7

drift and seston would be related to flood magnitude,
and (2) response patterns to floods of similar magni-
tude would differ between early floods and later floods
in concert with changes in macroinvertebrate commu-
nity assembly.
METHODS
Site description
The study was conducted on the Spol River down-
stream of Livigno reservoir on the Swiss–Italian border
(1081102200 E, 4683603800 N). This area is situated within
the central part of the inner Alps. The climate is
continental, having relatively low precipitation but high
seasonal variation in temperature (Barry 1992). Upland
vegetation is dominated by coniferous forest (Picea
excelsa and Pinus mugo), while alder (Alnus incana) is a
common riparian tree along the river margin. The river
below Livigno dam (Punt dal Gall) flows through a
canyon-confined valley within the Swiss National Park
for ;5.7 km before entering the lower Ova Spin
reservoir. Elevation at the study reach located ;2.3
km downstream of Punt dal Gall is 1660 m above sea
level (a.s.l.). The dam is used for water storage with
much of the stored water diverted for hydropower
production down-valley (see Scheurer and Molinari
2003). The Spol merges with the Inn River at the town
of Zernez, Switzerland, and the Inn is a major tributary
of the Danube. Before regulation, the Spol had a typical
snow-melt/glacial-melt flow regime with high flows in
summer and low flows in winter (Fig. 1). Periodic peak
flows or floods from heavy rainfall mostly occurred
during summer into early autumn and ranged between
20 and 60 m3/s.
The Spol is part of a complex hydroelectric scheme
(see Scheurer and Molinari 2003). Punt dal Gall dam
became operational in 1970 and flow regulation
decreased the annual average discharge in the river
from 8.6 to 1.0 m3/s. Two post-regulation floods
occurred prior to the experimental flood program
beginning in 2000, one in 1979 at 42 m3/s from heavy
rains and another in 1990 at 33 m3/s for dam
maintenance (Scheurer and Molinari 2003). Regulated
residual flows typically average 0.55 m3/s in winter and
2.5 m3/s in summer using hypolimnetic water from the
reservoir (Fig. 1). This residual flow lacked the power to
entrain and transport coarse sediments that allowed the
riverbed to be clogged with fine sediments (Ortlepp and
Murle 2003), and caused the formation of large pools
upstream of lateral debris fans (Murle et al. 2003). The
reduced and stable flows also resulted in dense algal
mats, extensive moss beds, and an invertebrate commu-
nity dominated by Gammarus fossarum (Robinson et al.
2003). Population densities of this crustacean before the
experimental floods ranged from 8000 to 15 000
individuals/m2 at the study reach (Robinson and
Uehlinger 2008) and it was an important food source
for the trout fishery (Ortlepp and Murle 2003).
The Engadine power company, the Swiss National
Park, and state authorities agreed in 1996 to use
experimental floods to improve habitat conditions in
the river for trout (Scheurer and Molinari 2003). The
floods were cost neutral because of the network of
reservoirs, aqueducts, and power houses that allowed
reallocation of water for power production while
maintaining residual flows in the Spol. Residual flows
were further reduced (0.55 m3/s winter, 1.45 m3/s
summer) beginning in 1999 to compensate for water
released during each flood (Uehlinger et al. 2003). The
experimental flood program began in summer 2000 and
based on the ecological results to date has been adopted
FIG. 1. The flow regime of the Spol River downstream of Livigno Reservoir on the Swiss–Italian border, showing tworepresentative years before the dam became operational in 1970, the regulated flow in 1999 without floods, and the experimentalflood program after 2000 comprising 22 separate floods.
October 2012 1951EXPERIMENTAL FLOOD DISTURBANCE
in the regulatory framework of the reservoir (T.
Scheurer, personal communication).
Twenty-two separate floods were released between
2000 and the end of 2010 following an adaptive
management strategy (Fig. 1). The flood program began
with three floods each in 2000 and 2001, then alternating
between two floods and a single flood per year from
2002 to 2005. The three floods in 2000 and 2001
consisted of two smaller flows between 12 and 16 m3/s
in June and August that bounded a higher flow (42 and
55 m3/s, respectively) in July. One unplanned flood in
October 2000 resulted from heavy precipitation that
filled the reservoir above storage capacity and caused a
3-d release of surplus water that peaked at 28 m3/s. After
2002, the June flood was eliminated, and in years of two
floods, a high flow occurred in July (.30 m3/s) with a
smaller flow in late August/early September (15–25 m3/s;
see Fig.1). A 4-d flushing flow was released from 19 to 22
June 2009 that reached a peak flow of 41 m3/s, and
single floods were implemented in 2003 (41.5 m3/s), 2005
(11.2 m3/s), and 2010 (37 m3/s). Except for the June 2009
flood, each flood lasted between 6 and 8 hours with the
step-like rising and falling limb being constrained by the
physical mechanics of the release valve. The falling limb
was designed to be relatively gradual to minimize
stranding of fish. Although shorter than most natural
floods, the floods were effective in mobilizing bed
sediments and reducing algal levels without causing
high mortality of fish (see Ortlepp and Murle 2003,
Uehlinger et al. 2003).
Long-term monitoring
A 200-m long reach ;2.3 km downstream of the dam
was used during the 12 years of study. The study reach
was accessed via a national park trail. Discharge was
recorded at the gauging station at Livigno Dam by the
Federal Office of Hydrology and Geology (Bern,
Switzerland). A temperature logger (Minilog; Vemco,
Nova Scotia, Canada) was installed at the study site and
recorded temperature at 1-h intervals. Temperature spot
recordings were made on each visit as well using the
temperature sensor in the field conductivity meter
(WTW LF340; Wissenschaftlich-Technische Werkstat-
ten, Weilheim, Germany). The study reach was visited
101 times between 1999 and the end of 2010 for
collection of samples. Samples were intentionally
collected 1–3 days before and 1–2 days after a particular
flood, whereas other collections were made every 3–4
weeks when accessible for long-term monitoring pur-
poses. The overall sampling frequency varied between
years, depending on time availability and specific needs
of the study.
On each sampling visit, a 1-L water sample was
collected from the thalweg in a polypropylene bottle for
analysis of nitrate-nitrogen (NO3-N), soluble reactive
phosphorus (PO4-P), dissolved organic carbon (DOC),
and particulate organic carbon (POC) following meth-
ods detailed in Tockner et al. (1997). In the field,
turbidity (nephelometric turbidity units; NTU) (Cos-
mos, Zullig AG, Switzerland), conductivity (lS/cm at
208C) (WTW LF340, Weilheim, Germany), and pH
(WTW pH3110, Weilheim, Germany) were also mea-
sured using portable meters.
Periphyton was measured by randomly collecting 10
rocks (cobble-size) within the study reach on each visit.
The rocks were placed in plastic bags, returned to the
laboratory, frozen at�208C, and processed within three
weeks after collection. Periphyton was removed from
each rock by scrubbing with a wire brush into a bucket
with water, and the a-, b-, and c-axis of each rock were
measured with a caliper (after Uehlinger 1991). An
aliquot of the periphyton suspension was filtered
through a glass fiber filter (Whatman GF/F, pre-ashed
at 4508C) for determination of ash-free dry mass
(AFDM). The AFDM of each sample was determined
by drying the filter at 608C, weighing, burning the filter
at 5008C for 4 h, and then reweighing.
Benthic macroinvertebrates were collected from riffle/
run habitats on each visit using a Hess sampler (0.045
m2, 250-lm mesh, n¼ 3 samples). Benthic samples were
taken to a standard depth of 20 cm and all large rocks
scrubbed by hand to remove invertebrates before
processing. Riffle/run habitats are the most common
habitat types in the river because it flows through a
canyon-confined valley. Samples were stored in plastic
bottles and preserved in the field with 70% ethanol. In
the laboratory, macroinvertebrates were handpicked
from each sample using a dissecting microscope at
103, identified to lowest practical taxonomic unit
(usually genus), and counted.
Measures collected during floods
Intensive sampling for invertebrate drift and organic
matter in transport (seston) was conducted just before,
during, and immediately after six different floods,
including three floods in 2001, and single floods in
2002, 2009, and 2010. Flood peaks ranged from ;12 m3/
s (two small floods in 2001) to ;50 m3/s. Individual
samples were collected using a 400-um mesh nylon net
attached to a 15 3 30 cm frame at 10- to 30-min
intervals, resulting in 20–30 samples being collected for
each flood. Due to hysteresis, the more frequent samples
were collected during the rising limb into the beginning
of the falling limb of each flood, whereas the less
frequent samples were collected later in the falling limb.
In general, hysteresis is the temporal diminution of a
response during a disturbance (sensu Scheffer et al.
2001). Similarly, hysteresis here refers to the increase
then falling off of a parameter, e.g., density, in response
to changes in discharge over time (i.e., during a flood).
Sampling times ranged from 15 s to 3 min depending on
the amount of material in transport at the time of
sampling. Velocity was measured at the net aperture
using a MiniAir2 velocity meter (Schiltknecht Ag,
Gossau, Switzerland) and results are expressed by
volume of water filtered. In the laboratory, invertebrates
CHRISTOPHER T. ROBINSON1952 Ecological ApplicationsVol. 22, No. 7

were handpicked from each sample (103 magnification)
and counted. Drift density values (number per cubic
meter) were used in the present paper. The remaining
material was used to determine seston as AFDM. Seston
AFDM was determined as for periphyton biomass,
except that subsamples (quarter or half ) were used for
large samples. These samples were used to test for
changes in the response patterns (e.g., response onset,
concentration differences) of drift and organic matter to
different floods (magnitude) over time (early vs. late).
Data analysis
Physico-chemical monitoring.—Physical and chemical
measures were assessed for temporal changes over the
course of the study using simple descriptive statistics. No
dramatic changes were expected as the experimental
protocol only included short increases in discharge, and
the water released for each flood was hypolimnetic from
the reservoir. These data were used primarily to provide
background information on ionic potential, nutrient
status for periphyton development, and the overall
temperature regime during the study.
Resistance and resilience.—Significant temporal shifts
in assemblage structure were tested using nonmetric
dimensional scaling (NMDS) using both taxa densities
and taxa relative abundances from the 101 sampling
visits over the course of the study. Resistance of
periphyton and macroinvertebrates was assessed by
comparing the percentage lack of reduction in periph-
yton biomass (as AFDM), invertebrate density, and
macroinvertebrate richness before and after each flood.
These data were tested for differences among floods
using simple regression (i.e., plots of resistance vs. flood
magnitude). Differences in the resistance of individual
taxa were tested using ANOVA with data generated
from each flood as replicates. Here, resistance was
measured as the percentage lack of reduction in density
of a taxon before and after each flood. These data were
transformed using the asin(sqrt) function prior to
running the ANOVA (Zar 1984).
Resilience was assessed by calculating the recovery
slope in periphyton biomass and macroinvertebrate
density following each flood. Data for calculation of
individual recovery slopes encompassed three to four
sampling events following each flood and covered a
maximum of 70 post-flood days. Only data that met
these criteria were used to calculate recovery slopes and
included 15 individual floods. Individual slopes were
generated from the regression results of density against
time. The steeper the slope, the faster the recovery and
the higher the resilience. These recovery slopes then were
plotted against the percentage loss in periphyton
biomass or macroinvertebrate density (i.e., resistance)
and against flood year (as a test of changes in resilience
between early and later floods).
Measures collected during floods.—Drift and seston
concentrations were plotted against discharge and time
of day. Plots of drift and seston against discharge
revealed the different hysteresis patterns between early
and later floods, and between floods of differentmagnitude. Plots of drift and seston against time of
day revealed temporal concentration patterns in relationto flood timing between early and later floods, and
between floods of different magnitude. Measures of driftand seston during floods also allowed comparison ofresponse patterns of living organisms to that of
nonliving organic particles from floods.
RESULTS
Physico-chemical monitoring
As expected, the water physico-chemistry remained
fairly stable during the study period due to thehypolimnetic release of water from the reservoir (see
Robinson and Uehlinger 2008). Water pH was neutraland averaged 7.5 6 0.4 (mean 6 SD), conductivity was
255 6 47lS/cm (mean 6 SD), nitrate-N was 258 6 47lg/L (mean 6 SD), and soluble reactive phosphorus was1.0 6 1.5 lg/L (mean 6 SD). Mean temperature was
7.68C and ranged from 18 to 28C in winter to 108 to 128Cin summer. Dissolved organic carbon averaged 0.9 6 0.5
mg/L (mean 6 SD) and particulate organic carbon was0.7 6 1.2 mg/L (mean 6 SD).
Community assembly
In general, the floods reduced the density and taxonrichness from pre-flood (1999) values (Fig. 2). Average
densities decreased from an average 21 143 individuals/m2 in 1999 to 12 657 individuals/m2 in the period 2000–
2003, and to 6975 individuals/m2 after 2007. Taxonrichness averaged 12.4 in 1999, decreasing to 7.8 from
2000–2003, and to 7.9 after 2007. Evident in richness isan increase between floods to ;12 taxa after 2007,
suggesting new taxa have started colonizing the system(Fig. 2).
The NMDS analysis based on taxon densities andtaxon relative abundances revealed significant temporal
shifts in community assembly (Fig. 3). Based on taxondensities, assemblage composition was similar in 1999and 2000, then a shift occurred in 2001 with assemblages
being grouped from 2002 to 2006. Another shiftoccurred in 2007 with assemblages grouping together
from 2007 to 2010 (Fig. 3A; stress¼ 13.6). NMDS fromthe relative abundance data showed a similar pattern
with assemblages grouped in 1999–2000, 2001–2002,2003–2006, and 2007–2010 (Fig. 3B; stress ¼ 11.5).
These data indicate an early period of transition incommunity assembly between 2001 and 2003 and a later
shift between 2006 and 2007.
Resistance and resilience
Common taxa in the system showed significantly
different degrees of resistance to flood disturbances(ANOVA, P , 0.05; Fig. 4). Gammarids and chiron-omids were the least resistant to flood disturbance with
densities on average decreasing by .70%. In contrast,trichopterans showed the most resistance with densities
October 2012 1953EXPERIMENTAL FLOOD DISTURBANCE

increasing on average ;10% following floods. The other
common taxa typically showed losses in abundance with
densities on average decreasing 20–60% following
floods. These latter taxa included baetid mayflies,
protonemourid stoneflies, simuliid blackflies, turbellar-
ians, and other dipterans (mostly Dicranota sp. and
empedids).
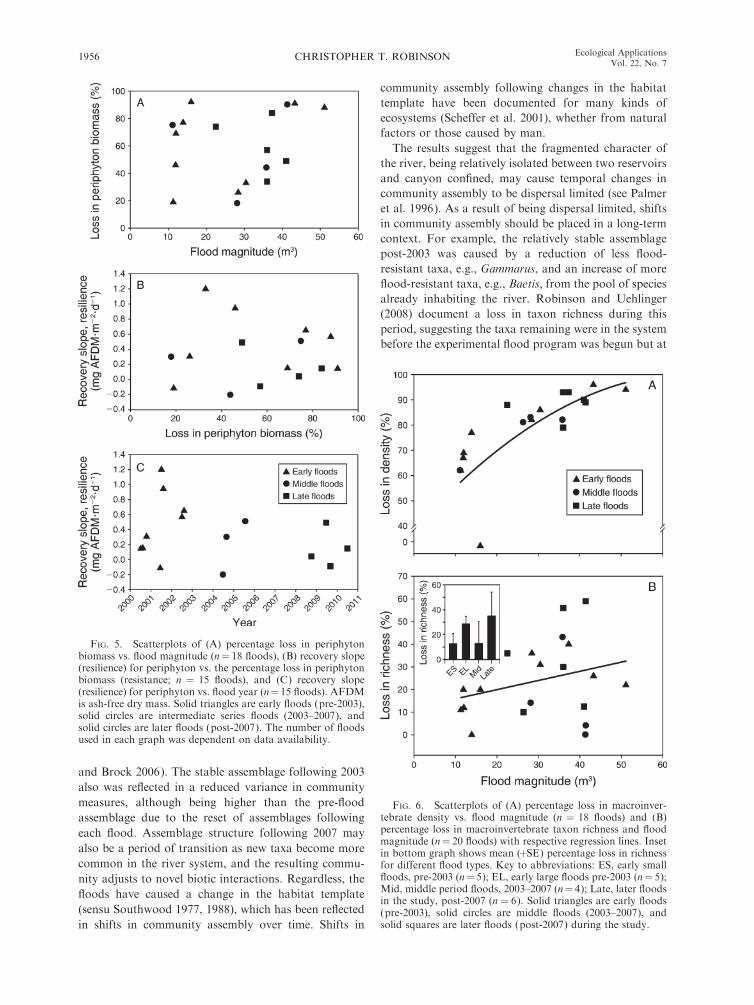
The relative loss in periphyton biomass following
floods ranged from ;20% to .90% with no clear
relationship with flood magnitude (Fig. 5A). Both low
and extreme losses in periphyton biomass were evident
for both smaller (10–15 m3/s) and larger (.25 m3/s)
floods, although most small floods occurred early in the
study period. There also was no relationship between the
recovery slope in periphyton biomass (resilience) and the
relative loss in biomass (Fig. 5B) or the year when the
floods occurred (Fig. 5C); i.e., there was no difference in
resistance (lack of relative loss) or resilience (recovery
slopes) in terms of periphyton AFDM between early and
later floods.
The relative loss in macroinvertebrate density in-
creased with flood magnitude, indicating that resistance
was greater for smaller floods (,20 m3/s) than for larger
floods (.25 m3/s; Fig. 6A). Floods above 25 m3/s
showed similar values in the relative loss in density with
values typically .75%, whereas losses ranged from 60%
to 70% for the smaller floods. Notably, the very first
flood in the experiment showed no loss in density. The
relative loss in taxon richness showed a nonsignificant (P
. 0.05) increase with flood magnitude (Fig. 6B). When
floods were grouped, however, smaller early floods had
on average lower relative loss in richness (13%) than
early large floods (29%), and the middle floods had on
FIG. 3. Nonmetric dimensional scaling (NMDS) plotsbased on (A) taxon densities and (B) taxon relative abundancesusing all long-term data (101 sampling events) collected duringthe study. Labeled years in each plot represent the mean 6 SEfor the samples collected in that particular year. Circles weredrawn by eye to better illustrate assemblage shifts over the timeperiod of the study.
FIG. 2. Plots of average macroinvertebrate density (mean 6 SE) and taxon richness from benthic samples collected during thelong-term flood study. The dashed line represents the average density or richness in the year before the flood program (samplescollected in 1999). The triangles on the x-axis indicate when a flood occurred.
CHRISTOPHER T. ROBINSON1954 Ecological ApplicationsVol. 22, No. 7

average lower relative loss in richness (13%) than later
floods (35%; Fig. 6B inset).
Recovery slopes in macroinvertebrate density (resil-
ience, individuals per square meter per day) tended to
increase with the relative loss in density (r2 ¼ 0.11; Fig.
7A). However, recovery slopes ranged widely among
those floods causing relative density losses .75%,
indicating a wide range in assemblage resilience to
different floods. Recovery slopes in macroinvertebrate
density, excluding smaller floods ,20 m3/s, decreased
with the year of the experiment (r2 ¼ 0.60; Fig. 7B).
There was one outlier to this pattern with a flood in 2008
showing a much higher recovery slope than other floods,
and with a corresponding large relative loss in density
(90%).
Responses during floods
Macroinvertebrates (drift) and organic matter (ses-
ton) in transport showed mostly similar response
patterns during individual floods (Fig. 8). Both drift
and seston responded rapidly to increases in flow with
both parameters then decreasing as each flood proceed-
ed, demonstrating the expected hysteresis curve (Fig. 8,
left panels). Another common pattern was the occur-
rence of two drift or seston pulses during a flood. This
pattern occurred in the four large floods measured (.30
m3/s), whereas the two small floods (,15 m3/s) showed
only the single response pulse (Fig. 8, right panels).
These data suggest an initial response in seston and drift
to the increase in flow (flow disturbance responses) and a
later response from riverbed movement or enhanced
scouring effects as slide-slopes collapse into the river
(bed mobility or sediment scour response). The flood in
2009 showed a third pattern of a delayed response in
drift and seston, which may be a system reaction to the
large three-day flood earlier that same year in late June.
The density of drifting invertebrates and concentra-
tion of seston also varied between floods. Peak drift
densities ranged from .300 individuals/m3 to .2000
individuals/m3 (Fig. 8), although being unrelated to
flood magnitude. The drift pulse was more distinct for
the small floods (,15 m3/s) than the large floods (.30
m3/s), mostly because of the second pulse that occurred
during large floods. As a consequence, the total number
of invertebrates in the drift during each flood was three
to nine times greater during large floods (117–304
million invertebrates) than small floods (32–40 million
invertebrates), except for the large 2009 flood with 47
million invertebrates being transported downriver. Peak
seston concentrations were five to six times greater
during large floods (.30 g AFDM/m3) than small floods
(;6 g AFDM/m3), except for the large flood in 2002 in
which lower concentrations were observed (;5 g
AFDM/m3), but these low concentrations occurred
during most of the flood period (Fig. 8). The total
amount of seston during each flood was three to 30
times more during large floods (9899 kg AFDM in 2001
large flood) than small floods (292 kg AFDM in 2001
small flood). The total amount of seston during large
floods was greatest in 2001 at 9899 kg AFDM,
decreasing to 2045 kg AFDM in 2009 and 2584 kg
AFDM in 2010. An estimated 1263 kg AFDM of seston
was transported in the large 2002 flood.
DISCUSSION
Shifts in community assembly
The data support the first hypothesis that community
assembly would shift over time in response to the floods.
Both the density and richness of macroinvertebrates
were significantly affected by the floods, showing
reductions in both parameters. The NMDS analysis
revealed four groups of years in which assemblages
within a group were similar. These groups included the
pre-flood assemblage (1999–2001), an assemblage in
transition from 2001 to 2003, a relatively stable
assemblage from 2004 to 2007, and fourth group post-
2007. Robinson and Uehlinger (2008) suggested that the
initial post-flood group was a transition assemblage
between alternate community states as inferred from an
increase in variance in measured parameters (Carpenter
FIG. 4. Taxon-specific resistance based on thepercentage loss in density before and afterindividual floods during the study period (n ¼21 floods). Bars represent means þ SE. Abbre-viations are: TURB, Turbellaria; GAMM, Gam-marus fossarum; BAET, Baetis spp.; PROT,Protonemoura sp.; DIPT, Diptera excludingchironomids and simuliids; TRIC, Trichoptera;CHIR, Chironomidae; and SIMU, Simuliidae.
October 2012 1955EXPERIMENTAL FLOOD DISTURBANCE
and Brock 2006). The stable assemblage following 2003
also was reflected in a reduced variance in community
measures, although being higher than the pre-flood
assemblage due to the reset of assemblages following
each flood. Assemblage structure following 2007 may
also be a period of transition as new taxa become more
common in the river system, and the resulting commu-
nity adjusts to novel biotic interactions. Regardless, the
floods have caused a change in the habitat template
(sensu Southwood 1977, 1988), which has been reflected
in shifts in community assembly over time. Shifts in
community assembly following changes in the habitat
template have been documented for many kinds of
ecosystems (Scheffer et al. 2001), whether from natural
factors or those caused by man.
The results suggest that the fragmented character of
the river, being relatively isolated between two reservoirs
and canyon confined, may cause temporal changes in
community assembly to be dispersal limited (see Palmer
et al. 1996). As a result of being dispersal limited, shifts
in community assembly should be placed in a long-term
context. For example, the relatively stable assemblage
post-2003 was caused by a reduction of less flood-
resistant taxa, e.g., Gammarus, and an increase of more
flood-resistant taxa, e.g., Baetis, from the pool of species
already inhabiting the river. Robinson and Uehlinger
(2008) document a loss in taxon richness during this
period, suggesting the taxa remaining were in the system
before the experimental flood program was begun but at
FIG. 5. Scatterplots of (A) percentage loss in periphytonbiomass vs. flood magnitude (n¼ 18 floods), (B) recovery slope(resilience) for periphyton vs. the percentage loss in periphytonbiomass (resistance; n ¼ 15 floods), and (C) recovery slope(resilience) for periphyton vs. flood year (n¼ 15 floods). AFDMis ash-free dry mass. Solid triangles are early floods (pre-2003),solid circles are intermediate series floods (2003–2007), andsolid circles are later floods (post-2007). The number of floodsused in each graph was dependent on data availability.
FIG. 6. Scatterplots of (A) percentage loss in macroinver-tebrate density vs. flood magnitude (n ¼ 18 floods) and (B)percentage loss in macroinvertebrate taxon richness and floodmagnitude (n¼ 20 floods) with respective regression lines. Insetin bottom graph shows mean (þSE) percentage loss in richnessfor different flood types. Key to abbreviations: ES, early smallfloods, pre-2003 (n¼ 5); EL, early large floods pre-2003 (n¼ 5);Mid, middle period floods, 2003–2007 (n¼ 4); Late, later floodsin the study, post-2007 (n ¼ 6). Solid triangles are early floods(pre-2003), solid circles are middle floods (2003–2007), andsolid squares are later floods (post-2007) during the study.
CHRISTOPHER T. ROBINSON1956 Ecological ApplicationsVol. 22, No. 7

much lower densities. Gammarus was the dominant
invertebrate in the river before the floods, with densities
reaching 8000–15 000 individuals/m2. Taxon richness
began to increase in the river after 2007 (see Fig. 2),
indicating potentially new taxa are now colonizing the
river. For instance, the abundances of simuliid blackflies
and leuctrid stoneflies have been increasing substantially
in the river since 2007 (C. T. Robinson, unpublished
data). Whether these taxa colonized from local scattered
refugia, e.g., tributaries, or from regional species pools
outside the immediate catchment have yet to be
determined. Regardless of source, novel taxa still
required a relatively long period of time to colonize
and inhabit the river with reproducing populations.
Based on invasive species biology (e.g., Sakia et al.
2001), it probably requires multiple colonization at-
tempts before a new species will have a sustainable
population in the river (see With 2002).
Community resistance and resilience
There were clear shifts in community assembly that
were associated with proportional increases in taxa such
as baetid mayflies and simuliid blackflies, known to be
more disturbance resistant (Robinson and Minshall
1986), than taxa such as the flatworm Crenobia alpina or
crustacean Gammarus that decreased in abundance
during the study. These changes in community assembly
suggest that community resistance to flood disturbance
should be increasing over time. The results, however,
suggest that community resistance was more a function
of flood magnitude than to the community present
before each flood. Plausible explanations include that
the larger floods, relative to the system, were cata-
strophic disturbances to stream macroinvertebrates
regardless of species-specific disturbance-related traits;
i.e., larger floods are physical forcing events that
mobilize bed sediments, scour channels, and alter
channel morphology and thereby reduce the densities
of all macroinvertebrate taxa in the system (Resh et al.
1988). Catastrophic disturbances are thought to be
important reset mechanisms in most ecosystems (Huston
1979, Pickett and White 1985).
Another explanation could be that experimental flood
disturbances, although attempting to simulate natural
floods, are still outside the realm of the natural flow
regime of flood prone rivers in which biota have adapted
their life histories to the more predictable flow distur-
bances (Lytle and Poff 2004). For example, many
stream invertebrates have evolved life histories to take
into account predictable floods resulting from spring
snowmelt (Robinson et al. 1992) or even those systems
that appear more flashy in character such as some desert
streams (Lytle 2002). A third explanation is that the
channel itself may be to a large extent still in physical
disequilibrium with the experimental floods, and this
causes biotic assemblages to remain in some stage of
nonequilibrium as instream habitats continue to change.
All three explanations highlight and emphasize the long-
term nature of using experimental floods in regulated
rivers, especially as upstream dams mitigate other
physical properties of these rivers. Also, these large-
scale experiments encompass various goals from an
adaptive management perspective, and these must be
taken into account when assessing such studies (see
Konrad et al. 2011). Importantly here, the results
strongly suggest that a long-term perspective is needed
because of the time of colonization for species from
outside the system and the time needed for these species
to adapt to the novel flow regime.
In contrast, smaller floods above a certain threshold,
respective of the system, showed that the macroinverte-
brate community was more resistant to the flow
disturbance than those affected by large floods. Densi-
ties were reduced following the smaller floods, but much
less so than following the large catastrophic floods.
These smaller floods still had the capacity to reduce
periphyton biomass in the river, a desired management
FIG. 7. Scatterplots of (A) recovery slopes (resilience) inmacroinvertebrate density vs. percentage lack of loss in density(resistance; n¼19 floods), and (B) recovery slopes (resilience) inmacroinvertebrate density for large floods .20 m3/s vs. timeperiod of study (n ¼ 14 floods). AFDM is ash-free dry mass.Solid triangles are early floods (pre-2003), solid circles aremiddle period floods (2003–2007), and solid squares are laterfloods (post-2007).
October 2012 1957EXPERIMENTAL FLOOD DISTURBANCE

objective to improve habitat conditions for the trout
fishery (Ortlepp and Murle 2003). These results empha-
size the importance of an adaptive management
program that takes into account changes in management
objectives as flood effects are monitored over time.
Larger floods were used initially in the Spol to
restructure channel morphology, scour large sediment
deposits from adjacent scree slopes, and improve bed
conditions for redd development by brown trout
(Scheurer and Molinari 2003). This essentially means a
change in the habitat template of the river to that of a
more natural system (sensu Poff et al. 1997). After a
number of successful large flood events, these manage-
ment objectives were essentially met, and a new flood
regime is currently being adopted to maintain those
ecological benefits to the river. The new flood program is
testing the use of smaller floods that still mobilize bed
sediments without flushing fines and reduce periphyton
biomass but have less impact on macroinvertebrate
communities and the fishery in general.
Community resilience was quite variable, although
showing a general decrease with later floods. Resilience
was also poorly related to community resistance in this
system (r2 ¼ 0.11; Fig. 7A). The variability in resilience
may be related to the seasonal timing of floods, but this
was not examined in the current study. For example,
seasonal changes in macroinvertebrate abundances or
the presence of aerial adults in the catchment during a
flood may affect the measured resilience of the
community. Aerial adults may reproduce and lay eggs
in the system following flood disturbance and thereby
enhance overall system resilience (Winterbourn 1997).
The decrease in community resilience with later floods
suggests that the larger floods are indeed acting as a
catastrophic event in this regulated river. These large
floods had a large effect on reducing macroinvertebrate
densities in the river with a concomitant influence on
community resilience. Even though the community
assembly itself consists mostly of disturbance resistant
taxa, once these taxa are reduced beyond a certain
density threshold, the resilience of the community is
FIG. 8. Line graphs of macroinvertebrate drift and seston concentrations plotted against discharge (left panels), showinghysteresis patterns during each flood, and time of day (right panels), showing temporal response patterns for six different floodsduring the study period. Floods encompassed four early floods (2001–2002) and two late floods (2009–2010). Two of the earlyfloods were small floods ;12 m3/s, and the others were all large floods .30 m3/s. (Note that the figure continues on the next page.)
CHRISTOPHER T. ROBINSON1958 Ecological ApplicationsVol. 22, No. 7

constrained. These results strongly argue for an adaptive
management program that alters the experimental flood
regime to take into account long-term abiotic and biotic
changes in the river.
Drift and seston patterns during floods
Drift and seston showed a variety of response patterns
to the different floods that were related to flood
magnitude and flood year. Both drift and seston
typically responded quite rapidly by increasing in
concentration during the rising limb of each flood.
Imbert and Perry (2000) observed a similar drift
response to floods. The similar pattern between drift
and seston suggests that the response was probably a
passive function with increases in flow. Drift and seston
peaked once during the two examined smaller floods,
but usually showed at least two peaks during the larger
floods. The initial peak in drift and seston was likely
organisms and organic particles associated with surface
sediments, whereas secondary peaks during the larger
floods were related to mobilization of bed sediments or
bank failures from erosion that increased the scouring of
bed sediments (see Robinson et al. 2004). Bank failures
also provided inputs of organic matter into the river that
were reflected in higher seston concentrations. The
timing of these secondary peaks differed between the
larger floods and may constitute an additional unpre-
dictable disturbance to organisms during floods. The
results highlight significant differences in response
dynamics between floods of different magnitude that is
reflected in the degree of disturbance caused by different
floods.
The floods transported large numbers of organisms
and quantities of organic matter. The number of drifting
macroinvertebrates ranged from 32 to .300 million
individuals during a flood, whereas the amount of seston
ranged from 300 to ;10 000 kg dry mass (see Robinson
et al. 2004). Larger floods clearly transported greater
numbers of organisms and amounts of seston than the
smaller floods. Among the larger floods, the 2001 flood
transported three to seven times more organisms and
four to eight times more seston than the later floods. The
large 2001 flood was a long-duration, high-magnitude
flood, whereas the other large floods were lesser
magnitude, shorter duration floods (2009, 2010) or a
short-duration, high-magnitude flood (2002). These
FIG. 8. Continued.
October 2012 1959EXPERIMENTAL FLOOD DISTURBANCE

results confirm that flood magnitude and duration are
important disturbance components when implementing
an experimental flood program (Konrad et al. 2011).Both parameters must be considered when implementing
experimental floods from an adaptive management
perspective. The flood strategy for the Spol River now
comprises floods of lesser magnitude (;25–30 m3/s) andsimilar duration (approximately two-hour peak flow,
total duration approximately eight hours) as the floods
in 2009 and 2010 (T. Scheurer, personal communication).These new experimental floods are designed to reduce
periphyton biomass in the river, while minimizing the
amount of fines in transport that are important for the
development of redds by trout. Furthermore, thesefloods will likely reduce the loss in invertebrates, i.e.,
increase resistance, and also increase the resilience of the
macroinvertebrate assemblage in the river.
ACKNOWLEDGMENTS
This project was initiated in collaboration with U. Uehlinger,T. Scheurer, and M. T. Monaghan. Field and laboratoryassistance over the years was provided especially by C. Jolidonand S. Blaser as well as numerous undergraduate and graduatestudents and research visitors. Analysis of water samples wascompleted by R. Illi, Analytical Lab, Eawag. Logistical supportfor conducting research in the Swiss National Park wasprovided by F. Filli, SNP; P. Molinari, Engadiner Kraftwerk;and T. Scheurer, SCNAT. Partial funding of the project wasprovided by the Swiss National Park and Department of Gameand Fish, Graubunden. The paper is a contribution of theAlpWaterScarce project (www.alpwaterscarce.eu), a member ofthe Alpine Space Program. The author especially thanks twoanonymous reviewers for constructive comments that improvedthe paper.
LITERATURE CITED
Arthington, A. H., S. E. Bunn, N. L. Poff, and R. J. Naiman.2006. The challenge of providing environmental flow rules tosustain river ecosystems. Ecological Applications 16:1311–1318.
Barry, R. C. 1992. Mountain weather and climate. Routledge,London, UK.
Bejarano, M. D., C. Nilsson, M. Gonzalez del Tanago, and M.Marchamalo. 2011. Responses of riparian trees and shrubs toflow regulation along a boreal stream in northern Sweden.Freshwater Biology 56:853–866.
Cardinale, S. R., M. A. Palmer, A. R. Ives, and S. S. Brooks.2005. Diversity–productivity relationships in streams vary asa function of the natural disturbance regime. Ecology86:716–726.
Carpenter, S. R., and W. A. Brock. 2006. Rising variance: aleading indicator of ecological transition. Ecology Letters86:716–726.
Collie, J. S., K. Richardson, and J. H. Steele. 2004. Regimeshifts: Can ecological theory illuminate the mechanisms?Progress in Oceanography 60:281–302.
Connell, J. H. 1978. Diversity in tropical rain forests and coralreefs. Science 199:1302–1310.
Cross, W. F., C. V. Baxter, K. C. Donner, E. J. Rosi-Marshall,T. A. Kennedy, R. O. Hall, Jr., H. A. Wellard Kelly, and R.Scott Rogers. 2011. Ecosystem ecology meets adaptivemanagement: food web response to a controlled flood onthe Colorado River, Glen Canyon. Ecological Applications21:2016–2033.
Dudgeon, D. 2000. Large-scale hydrological changes in tropicalAsia: prospects for riverine biodiversity. BioScience 50:793–806.
Graf, W. L. 2006. Downstream hydrologic and geomorphiceffects of large dams on American rivers. Geomorphology79:336–360.
Huston, M. 1979. A general hypothesis of species diversity.American Naturalist 113:81–101.
Imbert, J. B., and J. A. Perry. 2000. Drift and benthicinvertebrate responses to stepwise and abrupt increases innon-scouring flow. Hydrobiologia 436:191–208.
Johnson, P. T. J., J. D. Olden, and M. J. Vander Zanden. 2008.Dam invaders: impoundments facilitate biological invasionsinto freshwaters. Frontiers in Ecology and Environment6:357–363.
Junk, W. J., P. B. Bayley, and R. E. Sparks. 1989. The floodpulse concept in river–floodplain systems. Pages 110–127 inD. P. Dodge, editor. Proceedings of the Large RiverSymposium Canadian Special Publication in Fisheries andAquatic Sciences 106.
Kondolf, G. M., and P. R. Wilcock. 1996. The flushing flowproblem: defining and evaluating objectives. Water Resourc-es Research 32:2589–2599.
Konrad, C., et al. 2011. Large-scale flow experiments inmanaging water resources. BioScience 61:948–959.
Lake, P. S. 2000. Disturbance, patchiness, and diversity instreams. Journal of the North American BenthologicalSociety 19:573–592.
Lytle, D. A. 2002. Flash floods and aquatic insect life-historyevolution: evaluation of multiple models. Ecology 83:370–385.
Lytle, D. A., and N. L. Poff. 2004. Adaptation to natural flowregimes. Trends in Ecology and Evolution 19:94–100.
Melis, T. S., editor. 2011. Effects of three high-flow experimentson the Colorado River ecosystem downstream from GlenCanyon Dam, Arizona. U.S. Geological Survey Circular1366.
Merritt, D. M., and E. E. Wohl. 2006. Plant dispersal alongrivers fragmented by dams. River Research and Applications22:1–26.
Monaghan, M. T., P. Spaak, C. T. Robinson, and J. V. Ward.2002. Population genetic structure of 3 alpine stream insects:influences of gene flow, demographics, and habitat fragmen-tation. Journal of the North American Benthological Society21:114–131.
Mueller, N. 1995. River dynamics and floodplain vegetationand their alterations due to human impact. Archiv furHydrobiologie 101:477–512.
Murle, U., J. Ortlepp, and M. Zahner. 2003. Use ofexperimental flooding to enhance river integrity below alarge dam: sediment processes and changes in geomorphol-ogy, habitat structure and riparian vegetation. AquaticSciences 65:191–198.
Nilsson, C., C. A. Reidy, M. Dynesius, and C. Revenga. 2005.Fragmentation and flow regulation of the world’s large riversystems. Science 308:405–408.
Olden, J. D., and R. J. Naiman. 2010. Incorporating thermalregimes into environmental flows assessments: modifyingdam operations to restore freshwater ecosystem integrity.Freshwater Biology 55:86–107.
Ortlepp, J., and U. Murle. 2003. Effects of experimentalflooding on brown trout (Salmo trutta fario L.): the SpolRiver, Swiss National Park. Aquatic Sciences 65:232–238.
Palmer, M. A., J. D. Allan, and C. A. Butman. 1996. Dispersalas a regional process affecting the local dynamics of marineand stream benthic invertebrates. Trends in Ecology andEvolution 11:322–326.
Pickett, S. T. A., and P. S. White. 1985. The ecology of naturaldisturbance and patch dynamics. Academic Press, NewYork, New York, USA.
Poff, N. L., J. D. Allan, M. B. Bain, J. R. Karr, K. L.Prestegaard, B. D. Richter, R. E. Sparks, and J. C.Stromberg. 1997. The natural flow regime. BioScience47:769–784.
CHRISTOPHER T. ROBINSON1960 Ecological ApplicationsVol. 22, No. 7

Power, M. E., W. E. Dietrich, and J. C. Finlay. 1996. Dams anddownstream aquatic biodiversity: potential food web conse-quences of hydrologic and geomorphic change. Environmen-tal Management 20:887–895.
Resh, V. H., A. V. Brown, A. P. Covich, M. E. Gurtz, H. W. Li,G. W. Minshall, S. R. Reice, A. L. Sheldon, J. B. Wallace,and R. C. Wissmar. 1988. The role of disturbance in streamecology. Journal of the North American BenthologicalSociety 7:433–455.
Robinson, C. T., S. Aebischer, and U. Uehlinger. 2004.Immediate and habitat-specific responses of macroinverte-brates to sequential experimental floods. Journal of theNorth American Benthological Society 23:853–867.
Robinson, C. T., and G. W. Minshall. 1986. Effects ofdisturbance frequency on stream benthic community struc-ture in relation to canopy cover and season. Journal of theNorth American Benthological Society 5:237–248.
Robinson, C. T., L. R. Reed, and G. W. Minshall. 1992.Influence of flow regime on life history, production, andgenetic structure of Baetis bicaudatus (Ephemeroptera) andHesperoperla pacifica (Plecoptera). Journal of the NorthAmerican Benthological Society 11:278–289.
Robinson, C. T., K. Tockner, and J. V. Ward. 2002. The faunaof dynamic riverine landscapes. Freshwater Biology 47:661–677.
Robinson, C. T., and U. Uehlinger. 2008. Experimental floodscause ecosystem regime shift in a regulated river. EcologicalApplications 18:511–526.
Robinson, C. T., U. Uehlinger, and M. T. Monaghan. 2003.Effects of a multi-year experimental flood regime onmacroinvertebrates downstream of a reservoir. AquaticSciences 65:210–222.
Sakia, A. K., et al. 2001. The population biology of invasivespecies. Annual Review of Ecology and Systematics 32:305–332.
Scheffer, M., S. Carpenter, J. A. Foley, C. Folke, and B.Walker. 2001. Catastrophic shifts in ecosystems. Nature4113:591–596.
Scheurer, T., and P. Molinari. 2003. Experimental floods in theRiver Spol (Swiss National Park): framework, objectives anddesign. Aquatic Sciences 65:183–190.
Schmidt, J. C., R. A. Parnell, P. E. Grams, J. E. Hazel, M. A.Kaplinski, L. E. Stevens, and T. L. Hoffnagle. 2001. The1996 controlled flood in Grand Canyon: flow, sedimenttransport, and geomorphic change. Ecological Applications11:657–671.
Southwood, T. R. E. 1977. Habitat, the templet for ecologicalstrategies. Journal of Animal Ecology 46:337–365.
Southwood, T. R. E. 1988. Tactics, strategies, and templets.Oikos 52:3–18.
Tockner, K., F. Malard, P. Burgherr, C. T. Robinson, U.Uehlinger, R. Zah, and J. V. Ward. 1997. Physico-chemicalcharacterization of channel types in a glacial floodplainecosystem (Val Roseg, Switzerland). Archiv fur Hydro-biologie 140:433–463.
Uehlinger, U. 1991. Spatial temporal variability of theperiphyton biomass in a prealpine river (Necker, Switzer-land). Archiv fur Hydrobiologie 123:219–237.
Uehlinger, U., B. Kawecka, and C. T. Robinson. 2003. Effectsof experimental floods on periphyton and stream metabolismbelow a high dam in the Swiss Alps (River Spol). AquaticSciences 65:199–209.
Vannote, R. L., G. W. Minshall, K. W. Cummins, J. R. Sedell,and C. E. Cushing. 1980. The river continuum concept.Canadian Journal of Fisheries and Aquatic Sciences 37:130–137.
Vannote, R. L., and B. W. Sweeney. 1980. Geographic analysisof thermal equilibria: a conceptual model for evaluating theeffect of natural and modified thermal regimes on aquaticinsect communities. American Naturalist 115:667–695.
Ward, J. V., and J. A. Stanford. 1979. The ecology of regulatedstreams. Plenum Press, New York, New York, USA.
Ward, J. V., and J. A. Stanford. 1983. The serial discontinuityconcept of lotic ecosystems. Pages 29–42 in T. D. Fontaineand S. M. Bartell, editors. Dynamics of lotic ecosystems. AnnArbor Science, Ann Arbor, Michigan, USA.
Ward, J. V., and J. A. Stanford. 1995. The serial discontinuityconcept: extending the model to floodplain rivers. RegulatedRivers: Research and Management 10:159–168.
Webster, J. R., and B. C. Patten. 1979. Effects of watershedperturbation on stream potassium and calcium dynamics.Ecological Monographs 49:51–72.
Winterbourn, M. J. 1997. New Zealand mountain streamcommunities: stable yet disturbed. Pages 31–54 in B. Streit, T.Stadler, and C. M. Lively, editors. Evolutionary ecology offreshwater animals. Birkhauser, Berlin, Germany.
With, K. A. 2002. The landscape ecology of invasive spread.Conservation Biology 16:1192–1203.
Zar, J. H. 1984. Biostatistical analysis. Second edition. Prentice-Hall, Englewood Cliffs, New Jersey, USA.
October 2012 1961EXPERIMENTAL FLOOD DISTURBANCE