Embed Size (px)
Citation preview
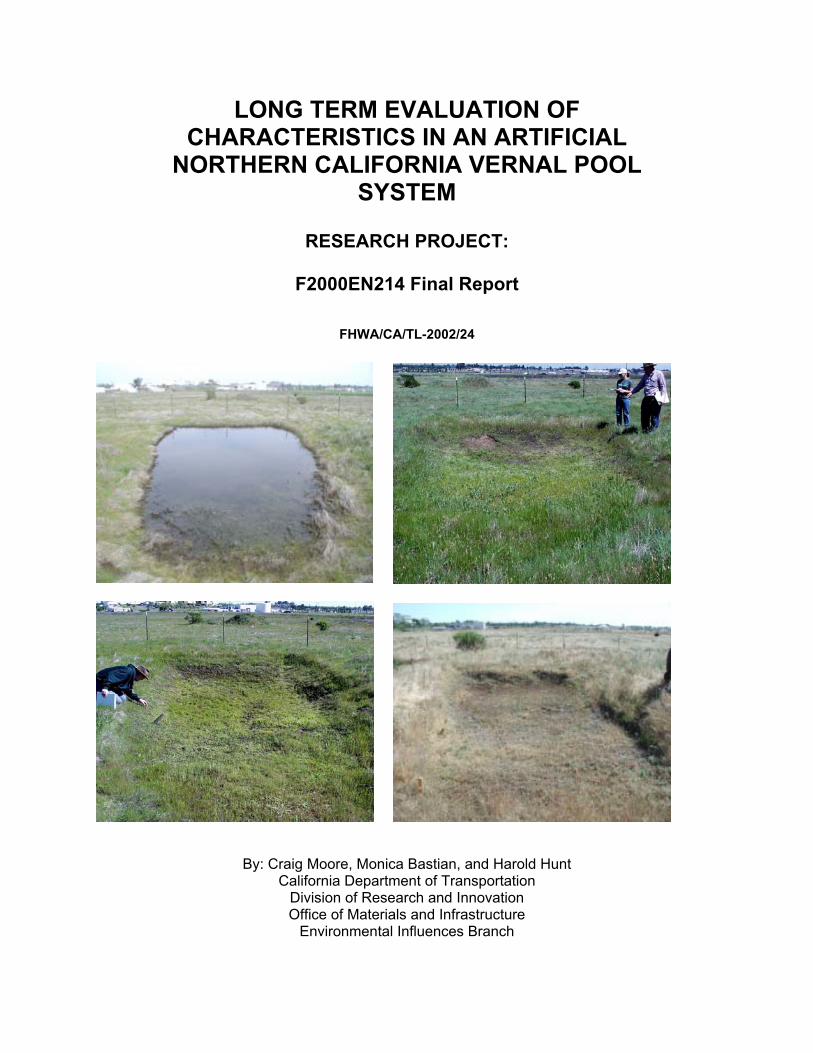
LONG TERM EVALUATION OF CHARACTERISTICS IN AN ARTIFICIAL
NORTHERN CALIFORNIA VERNAL POOL SYSTEM
RESEARCH PROJECT:
F2000EN214 Final Report
FHWA/CA/TL-2002/24
By: Craig Moore, Monica Bastian, and Harold Hunt California Department of Transportation
Division of Research and Innovation Office of Materials and Infrastructure
Environmental Influences Branch

1. REPORT NO. 2. GOVERNMENT ACCESSION NO. 3. RECIPIENT'S CATALOG NO.
4. TITLE AND SUBTITLE
Long Term Evaluation of Characteristics in an Artificial Northern California Vernal Pool System
5. REPORT DATE
April 2003
6. PERFORMING ORGANIZATION CODE
7. AUTHOR(S)
Craig Moore, Monica Bastian, and Harold Hunt
8. PERFORMING ORGANIZATION REPORT NO.
FHWA/CA/TL-2002/24
9. PERFORMING ORGANIZATION NAME AND ADDRESS
California Department of Transportation New Technology & Innovation, MS#83 P.O. Box 942873 Sacramento, CA. 94273-0001
10. WORK UNIT NO.
11. CONTRACT OR GRANT NO.
12. SPONSORING AGENCY NAME AND ADDRESS California Department of Transportation Sacramento CA. 95819
13. TYPE OF REPORT & PERIOD COVERED
Final Report/Interim Rep rt o Winter 2000-Spring 2001 14. SPONSORING AGENCY CODE
15. SUPPLEMENTARY NOTES
This project was performed in cooperation with the US Department of Transportation, Federal Highway Administration, under the research project titled, “Long Term Vegetation and Faunal Succession in an Artificial Northern California Vernal Pool System.”
16. ABSTRACT
This report (Phase II) completes an evaluation of 3 sets of 5 artificial vernal pools located on Travis AFB in Solano County CA. The research was done to determine if artificial vernal pools constructed on Travis AFB in 1993 maintained vernal pool characteristics and to determine if any of the five treatments used to develop the artificial pools are useful for mitigating vernal pool impacts. Phase II consisted of collecting data during the spring of 2002 from artificial pools and the source pools (TR1-TR5) to determine the vegetative success of the vernal pools over time. The artificial vernal pools support a diverse plant population, but lack the vegetative diversity of natural pools. The artificial pools exhibited zonation of plant species correlating with the length of inundation. The greater depth of the artificial pools allowed longer inundation periods than occurred in the nearby natural pools. Plant species associated with longer inundation periods (Plagiobothrys stipitatus, Eryngium aristulatum) are benefiting from the design of the artificial pools. By collecting data during Phase II, and comparing that data with previously collected data we determined that plant species vary from year to year in artificial and natural vernal pools at Travis AFB. Navarretia intertexta, Epilobium pygmaeum, and Lythrum hyssopifolium were present in 2002, but absent in last year’s data (2001).
17. KEY WORDS
Vernal pool, seasonal wetlands, endangered species, rare plants, wetland creation
18. DISTRIBUTION STATEMENT
No Restrictions. This document is available through the National Technical Information Service, Springfield, VA 22161
19. SECURITY CLASSIF. (OF THIS REPORT)
UNCLASSIFIED
20. SECURITY CLASSIF. (OF THIS PAGE)
UNCLASSIFIED
21. NO. OF PAGES
76
22.PRICE
ii

DISCLAIMER STATEMENT The contents of this report reflect the views of the authors who are responsible for the facts and the accuracy of the data presented herein. The contents do not necessarily reflect the official views or policies of the STATE of CALIFORNIA, Department of Transportation or the FEDERAL HIGHWAY ADMINISTRATION (FHWA). This report does not constitute a standard, specification, or regulation.
iii

ACKNOWLEDGEMENTS We are deeply indebted to many people who provided ideas, technical information and many other kinds of help. Karen Horner and Robert Holmes assisted with maintaining our licensing agreement with Travis AFB to continue with our long-term study of the vernal pool system.
iv

LONG TERM VEGETATION AND FAUNAL SUCCESSION IN AN ARTIFICIAL NORTHERN
CALIFORNIA VERNAL POOL SYSTEM
CONTENTS EXECUTIVE SUMMARY .......................................................................................................................S-1 INTRODUCTION
PURPOSE OF THE REPORT ................................................................................................................... 1 DEFINITION OF VERNAL POOLS......................................................................................................... 1 IMPORTANCE OF VERNAL POOLS ..................................................................................................... 1 LOCATION OF THE STUDY SITE ......................................................................................................... 2 SUMMARY OF SONOMA STATE STUDY............................................................................................ 2 THE CSU FRESNO STUDY..................................................................................................................... 3 THE CURRENT STUDY .......................................................................................................................... 4
VEGETATION METHODS
PURPOSE OF THE VEGETATIVE STUDY............................................................................................ 5 USE OF THE DIGITAL CAMERA .......................................................................................................... 5 DESCRIPTION OF VEGETATION SAMPLING METHODS DURING 2001....................................... 5 DESCRIPTION OF VEGETATION SAMPLING METHODS DURING 2002....................................... 6 DATA ANALYSIS .................................................................................................................................... 7 NATURAL SOURCE POOL TR17........................................................................................................... 9
VEGETATION RESULTS
2001 RESULTS........................................................................................................................................ 10 Inoculation Techniques......................................................................................................................... 10 Inoculation Techniques vs. Natural Pools............................................................................................ 17
2002 RESULTS........................................................................................................................................ 20 Inoculation Techniques......................................................................................................................... 20 Inoculation Techniques vs. Natural Pools............................................................................................ 28 Artificial Pools vs. Source Pools .......................................................................................................... 31
DATA COMPARISON 2001 VS. 2002................................................................................................... 37 VEGETATION CONCLUSIONS............................................................................................................. 40 VEGETATION DISCUSSION.................................................................................................................. 43 HYDROLOGY
METHODS............................................................................................................................................... 47 RESULTS................................................................................................................................................. 47 CONCLUSIONS ...................................................................................................................................... 51 DISCUSSION .......................................................................................................................................... 52
SOIL ............................................................................................................................................................ 53 LITERATURE CITED .............................................................................................................................. 55 APPENDICIES
A. RAW DATA & CONSTANCY TABLES............................................................................... A-2 B. SUPPORTING PHOTOS OF THE NATURAL & ARTIFICIAL VERNAL - AVAILABLE
UPON REQUEST C. BIBLIOGRAPHY - AVAILABLE UPON REQUEST
v
Tables, Figures & Photos
TABLE 1. BRAUN-BLANQUET COVER-ABUNDANCE SCALE ....................................................... 8 TABLE 2. SPECIES CONSTANCY IN SHALLOW ZONE 04/26/01 ................................................. 10 TABLE 3. SPECIES CONSTANCY IN MIDDLE ZONE 04/26/01 ....................................................... 10 TABLE 4. SPECIES CONSTANCY IN DEEP ZONE 04/26/01............................................................. 11 TABLE 5. AVERAGE SPECIES COVERAGE IN ALL ZONES 04/26/01 ........................................... 11 TABLE 6. SPECIES CONSTANCY IN SHALLOW ZONE 05/03/01 ................................................. 12 TABLE 7. SPECIES CONSTANCY IN MIDDLE ZONE 05/03/01 ....................................................... 13 TABLE 8. SPECIES CONSTANCY IN DEEP ZONE 05/03/01............................................................. 13 TABLE 9. AVERAGE SPECIES COVERAGE IN ALL ZONES 05/03/01 ........................................... 14 TABLE 10. SPECIES CONSTANCY IN SHALLOW ZONE 06/08/01 ................................................. 15 TABLE 11. SPECIES CONSTANCY IN MIDDLE ZONE 06/08/01 ..................................................... 15 TABLE 12. SPECIES CONSTANCY IN DEEP ZONE 06/08/01........................................................... 16 TABLE 13. AVERAGE SPECIES COVERAGE IN ALL ZONES 06/08/01 ......................................... 16 TABLE 14. NATIVE VS. NON-NATIVE SPECIES 04/26/01 ............................................................... 17 TABLE 15. NATIVE VS. NON-NATIVE SPECIES 05/03/01 ............................................................... 18 TABLE 16. NATIVE VS. NON-NATIVE SPECIES 06/08/01 ............................................................... 19 TABLE 17. SPECIES CONSTANCY IN SHALLOW ZONE 04/19/02 ................................................. 20 TABLE 18. SPECIES CONSTANCY IN MIDDLE ZONE 04/19/02 .................................................... 21 TABLE 19. SPECIES CONSTANCY IN DEEP ZONE 04/19/02.......................................................... 21 TABLE 20. AVERAGE SPECIES COVERAGE IN ALL ZONES 04/19/02 ......................................... 22 TABLE 21. SPECIES CONSTANCY IN SHALLOW ZONE 05/01/02 ................................................. 23 TABLE 22. SPECIES CONSTANCY IN MIDDLE ZONE 05/01/02 ..................................................... 23 TABLE 23. SPECIES CONSTANCY IN DEEP ZONE 05/01/02........................................................... 24 TABLE 24. AVERAGE SPECIES COVERAGE IN ALL ZONES 05/01/02 ......................................... 24 TABLE 25. SPECIES CONSTANCY IN SHALLOW ZONE 06/05/02 ................................................. 25 TABLE 26. SPECIES CONSTANCY IN MIDDLE ZONE 06/05/02 ..................................................... 26 TABLE 27. SPECIES CONSTANCY IN DEEP ZONE 06/05/02........................................................... 26 TABLE 28. AVERAGE SPECIES COVERAGE IN ALL ZONES 06/05/02 ......................................... 27 TABLE 29. NATIVE VS. NON-NATIVE SPECIES 04/19/02 ............................................................... 28 TABLE 30. NATIVE VS. NON-NATIVE SPECIES 05/01/02 ............................................................... 29 TABLE 31. NATIVE VS. NON-NATIVE SPECIES 06/05/02 ............................................................... 30 TABLE 32. NATIVE VS. NON-NATIVE SPECIES IN TR1-TR4 VS. C1-C5 04/19/02....................... 31 TABLE 33. NATIVE VS. NON-NATIVE SPECIES IN TR1-TR4 VS. C1-C5 05/01/02....................... 32 TABLE 34. NATIVE VS. NON-NATIVE SPECIES IN TR1-TR4 VS. C1-C5 06/05/02....................... 33 TABLE 35. NATIVE VS. NON-NATIVE SPECIES IN TR5 VS. A1-A5 04/19/02............................... 34 TABLE 36. NATIVE VS. NON-NATIVE SPECIES IN TR5 VS. A1-A5 05/01/02............................... 35 TABLE 37. NATIVE VS. NON-NATIVE SPECIES IN TR5 VS. A1-A5 06/05/02............................... 36 TABLE 38. DATA COMPARISON 04/26/01 VS. 04/19/02................................................................... 37 TABLE 39. DATA COMPARISON 05/03/01 VS. 05/01/02................................................................... 38 TABLE 40. DATA COMPARISON 06/08/01 VS. 06/05/02................................................................... 39 TABLE 41. SURFACE WATER IN VERNAL POOLS 1993/1994 RAINY SEASON ......................... 48 TABLE 42. SURFACE WATER IN VERNAL POOLS 1994/1995 RAINY SEASON ......................... 48 TABLE 43. SURFACE WATER IN VERNAL POOLS 1995/1996 RAINY SEASON ......................... 49 TABLE 44. SURFACE WATER IN VERNAL POOLS 2000/2001 RAINY SEASON ......................... 49 TABLE 45. SURFACE WATER IN VERNAL POOLS 2001/2002 RAINY SEASON ......................... 50 TABLE 46. MONTHLY RAINFALL FOR FAIRFIELD , CA ............................................................... 51 TABLE 47. TR5 SOIL SAMPLES .......................................................................................................... 53 TABLE 48. TR1-TR4 SOIL SAMPLES.................................................................................................. 53 TABLE 49. SOIL SAMPLES FROM TR5 AND A1-A5......................................................................... 54 TABLE 50. SOIL SAMPLES FROM TR1-TR4 AND C1-C5................................................................. 54
vi

FIGURE 1. RELATIVE COVER 04/26/01.............................................................................................. 12 FIGURE 2. RELATIVE COVER 05/03/01.............................................................................................. 14 FIGURE 3. RELATIVE COVER 06/08/01.............................................................................................. 17 FIGURE 4. NATIVE VS. NON-NATIVE RELATIVE COVER 04/26/01 ............................................. 18 FIGURE 5. NATIVE VS. NOON-NATIVE RELATIVE COVER 05/03/01 .......................................... 19 FIGURE 6. NATIVE VS. NOON-NATIVE RELATIVE COVER 06/08/01 .......................................... 20 FIGURE 7. RELATIVE COVER 04/19/02.............................................................................................. 22 FIGURE 8. RELATIVE COVER 05/03/02.............................................................................................. 25 FIGURE 9. RELATIVE COVER 06/05/02.............................................................................................. 27 FIGURE 10. NATIVE VS. NON-NATIVE RELATIVE COVER 04/19/02 ........................................... 28 FIGURE 11. NATIVE VS. NON-NATIVE RELATIVE COVER 05/01/02 ........................................... 29 FIGURE 12. NATIVE VS. NON-NATIVE RELATIVE COVER 06/05/02 ........................................... 30 FIGURE 13. NATIVE VS. NON-NATIVE RELATIVE COVER TR1-TR4 & C1-C5 04/19/02 ........... 31 FIGURE 14. NATIVE VS. NON-NATIVE RELATIVE COVER TR1-TR4 & C1-C5 05/01/02 ........... 32 FIGURE 15. NATIVE VS. NON-NATIVE RELATIVE COVER TR1-TR4 & C1-C5 06/05/02 ........... 33 FIGURE 16. NATIVE VS. NON-NATIVE RELATIVE COVER TR5 & A1-A5 04/19/02 ................... 34 FIGURE 17. NATIVE VS. NON-NATIVE RELATIVE COVER TR5 & A1-A5 05/01/02 ................... 35 FIGURE 18. NATIVE VS. NON-NATIVE RELATIVE COVER TR5 & A1-A5 06/05/02 ................... 36 FIGURE 19. RELATIVE COVER 04/26/01 VS. 04/19/02 ..................................................................... 37 FIGURE 20. RELATIVE COVER 05/03/01 VS. 05/01/02 ..................................................................... 38 FIGURE 21. RELATIVE COVER 06/08/01 VS. 06/05/02 ..................................................................... 39 PHOTO 1. ARTIFICIAL POOL B1 (DEEP, MIDDLE & SHALLOW ZONES) ..................................... 6 PHOTO 2. CLOSE UP IMAGE OF QUADRAT....................................................................................... 7 PHOTO 3. SOURCE POOL TR17 IN 1994 .............................................................................................. 9 PHOTO 4. SOURCE POOL TR17 IN 2002 .............................................................................................. 9 PHOTO 5. ARTIFICIAL POOL B4 ON 04/26/01................................................................................... 40 PHOTO 6. ARTIFICIAL POOL B4 ON 04/19/02................................................................................... 41 PHOTO 7. ARTIFICIAL POOL A4 ON 04/10/01 (ARROWS INDICATING LIMITED GROWTH).. 42 PHOTO 8. CLOSEUP OF B2 DEEP ZONE ON 04/26/01 ...................................................................... 43 PHOTO 9. SOURCE POOL TR5 IN 1994 .............................................................................................. 44 PHOTO 10. SOURCE POOL TR5 IN 2002 ............................................................................................ 44 PHOTO 11. OUTSIDE OF FENCED SOURCE POOL TR5 IN 2002 .................................................... 45
vii
Executive Summary
This summarizes the final report for California Department of Transportation’s (Caltrans) research project F 2000 EN 214 Long Term Vegetation and Invertebrate Succession in an Artificial Northern California Vernal Pool System Phase II. The main objectives of this project are:
• To determine if artificial vernal pools constructed at Travis AFB in 1993 maintained vernal pool characteristics
• To determine if plant species vary from year to year in vernal pool systems • To determine if any of the five treatments used to develop the artificial pools
are useful for mitigating vernal pool impacts Several aquatic invertebrates and plants that are listed as threatened or endangered under the federal Endangered Species Act, are restricted to vernal pools. Because of the presence of these listed species and uniqueness of the biota, vernal pool impacts from transportation projects may require mitigation. The future development and maintenance of the transportation system will require a better understanding of how highway facilities impact nearby vernal pools and how to preserve the vernal pool habitat. The report briefly summarizes Sonoma State University’s work at Travis for the Department that took place from 1993-1996. Additionally, this report presents the results of Caltrans in-house work performed by the authors at the research site during 2001 and 2002. The current research was developed to determine how the vernal pool habitat characteristics in the artificial vernal pools at the Travis AFB study area fared over the course of time. In 2001 and 2002, data was collected and evaluated on three sets of five artificial vernal pools. In 2001 and 2002, the data collected included vegetation, hydrology, and soil samples to determine the status of these artificial pools.
Each artificial pool was divided into three zones and a quadrat was used in each zone at random to collect the data. The quadrats were then marked with stakes to insure that it would be placed in the same location on each visit. A digital camera was used to rapidly gather high quality images of the vegetation for analysis. The series of electronic images provided an accurate record of the conditions within the pools during the study. The following conclusions are based on the observations made in Spring 2001 and Spring 2002.
1. The artificial pools are generally deeper than the natural pools. Inundation
periods tend to be longer in the deeper artificial pools than in the shallower natural pools. Plagiobothrys stipitatus dominates the deeper zones in most of the artificial pools, but is absent in the shallower natural pools TR16 and SP1. De Weese (1998) observed a shift in species cover in artificial vernal pools starting in the third year after construction, or sometimes sooner. Species preferring longer inundation periods expanded their cover in artificial pools that she surveyed.
S-1

2. Species varied from year to year in the artificial and source pools. There were species present in 2002 that were absent in 2001. New species observed in 2002 were Navarretia squarrosa, Epilobium pygmaeum, Lythrum hyssopifolium, and Navarretia intertexta.
3. Although the artificial and source pool have similar species. Both the source and
the artificial pools appear to be losing diversity over time. The fencing of the source and artificial pools is interfering with a disturbance regime that is needed for the self-sustainability of the pools. The artificial pools appear to have lost plant species since 1996. From 1993 – 1996 Northen, Holve-Hensill and Eakins concluded that out of twenty-four native wetland plants, sixteen showed good to high coverage in the artificial pools (Northen, Holve-Hensill and Eakins, 1998). In 2001, we observed fourteen native species in the artificial pools with seven native species having good coverage.
4. There was a shift in the vegetation zones in the artificial pools from 2001 – 2002.
The deep zone species of 2001 shifted to the middle zone in 2002 due to the higher rainfall and longer inundation periods. In the deep zones of some of the artificial pools the longer inundation periods in 2002 created a bare soil zone in the bottom of the pools. Concentric rings of vegetation grew around the outer edges of the bare zones. Species producing distinct rings included Downingia concolor, Plagiobothrys stipitatus, Lasthenia glaberrima, and Psilocarphus brevissimus.
5. Vac2 out performed the other inoculation treatments in terms of native versus
non-native relative cover. The Blocks, Soil, and Control treatments had greater amounts of non-native species compared to Vac2. In Northen, Holve-Hensill and Eakins report, the Soil treatment out performed Vac2 and Blocks (Northen, Holve-Hensill and Eakins, 1998).
6. After eight years, vegetation spread is limited in the Blocks treatment. The
Blocks treatment appears to be the least desirable inoculation treatment. Long-term studies are needed to collect sufficient data to fully determine the vegetative success of the vernal pools. For example, in the two years of our study we observed some different species in the vernal pools on Travis AFB. Several years of sampling may be necessary to truly characterize a pool. In determining if an area contains vernal pool plants, a single visit during any given year may not be sufficient to identify all species. There is a shift from early blooming species to late blooming species in the Travis AFB vernal pools. Downingia concolor and Lasthenia glaberrima were apparent early in the season and absent later in the season. In contrast Hemizonia fitchii and Eremocarpus setigerus, grew significantly in the late season. It may not be appropriate to visit a vernal pool system only in the later months of the year to determine its vegetative classification. The amount of rainfall in a season can play a role in the apparent vegetation during an individual year in a vernal pool system. In the first year (2001) of our study, there was a lower amount of rainfall producing shorter inundation periods than in 2002. In 2002 the pools had a higher amount of relative cover and fewer invasive grasses than in 2001. Vegetation in a drought season can be different than a season with sufficient rainfall.
S-2

INTRODUCTION Purpose of the Report
This is the final report for California Department of Transportation’s (Caltrans) research project F 2000 EN 214 Long Term Vegetation and Invertebrate Succession in an Artificial Northern California Vernal Pool System Phase II. The objectives of this project are:
• to determine if artificial vernal pools constructed at Travis AFB in 1993
maintained vernal pool characteristics, • to determine if plant species vary from year to year in vernal pool systems, • to determine if any of the five treatments used to develop the artificial pools are
useful for mitigating vernal pool impacts.
The report briefly summarizes Sonoma State Universities work at Travis for the Department that took place from 1993 to 1996 and CSU Fresno’s work in Madera County for the Department that took place from 1993 to 1996. Additionally, this report presents the results of Caltrans in-house work performed by the authors at the research site during 2001 and 2002. Definition of Vernal Pools Vernal pools are seasonal wetlands that form in shallow depressions underlain by a shallow substrate that restricts water percolation. The pools fill during the winter rainy season and dry out during the spring (Sawyer and Keeler-Wolf, 1995). Vernal pools have unique vegetation communities that often exhibit showy displays of springtime wildflowers. The wet season inundation periods of vernal pools vary greatly from a few days to several months. An individual pool may undergo several cycles of inundation and drying during one winter, but the soil in a pool usually remains saturated until spring. Although inundation occurs during the winter, in most years the temperatures in lowland California are high enough for plant growth to occur when pools contain water. The pools finally dry out during the spring or early summer and remain desiccated until the rains of the following wet season. When completely dry the soil moisture in the pool is the same as the soil moisture of the adjacent uplands. The seasonal variation between inundation and complete desiccation limits the flora that can occupy vernal pool habitat. Most upland plants are precluded by the presence of freestanding water and saturated soil for extended periods during the rainy season, while most wetland plants are precluded by the complete desiccation of the pool soils during the summer. Only a few species tolerate the alternately extreme conditions of inundation and drought. Importance of Pools and Vernal Pool Studies
Several species of shrimp and plants that are restricted to vernal pools are listed as threatened or endangered under the federal Endangered Species Act. Because of the presence of these listed species and the uniqueness of the biota, vernal pool impacts from transportation projects may require mitigation. Yet there is significant controversy
1
concerning the use of habitat creation and restoration to mitigate vernal pool losses (Sutter and Francisco 1998). Attempts at creating vernal pools for mitigation have only been partially successful (Barbour 1998, De Weese 1998). Both direct and indirect impacts will result from the expansion and operations of the state highway system. These impacts will require appropriate mitigation. The future development of and maintenance of the transportation system will require a better understanding of how highway facilities impact nearby vernal pools and how to preserve vernal pool habitat. For habitat mitigation to be successful one must not only show that the habitat can be initially created, but also that the habitat can be maintained over time. De Weese noted that in her experience, constructed vernal pools appear to have comparable plant diversity to natural source pools for the first two years (De Weese 1998). However, later species that prefer longer inundation periods begin to become more dominant. The major question in this current study is whether or not the constructed vernal pools at Travis AFB continue to maintain the hydrological, faunal, and floral characteristics of vernal pools. Location of the Study Site The study site is located on Travis AFB in Solano County CA southwest of the David Grant USAF Medical Center and near the western boundary of the base. A complete description of the study site including maps and aerial photographs is found in Northen, Holve-Hensill and Eakins (1998). The location of natural pools TR1-TR5 is southwest of the artificial vernal pools located on Travis AFB. Summary of Sonoma State Study This study is the continuation of the work done from the autumn of 1993 to the summer of 1996 at the Travis AFB study site by Sonoma State University. In November 1993, fifteen 3m x 10m rectangular artificial vernal pools were constructed to determine if then current methods of artificial vernal pool restoration could be successful in the southern Sacramento Valley. The deep end of each pool was excavated to a depth of 80 cm on the downhill side. The pool was then excavated to form a plane that merged with the soil surface at the uphill end of the pool. Side slopes were graded to approximately 30 degrees. The pools were constructed in this way to facilitate statistical comparisons among the treatments. The artificial vernal pools at Travis AFB were developed to compare four different planting techniques:
• scraping and vacuuming source materials from the soil surface of natural pools and placing the collected materials on the natural soil surface of artificial pools,
• cutting blocks of soil from the bottom of source pools and placing these blocks in shallow trenches in artificial pools,
• spreading crushed vernal pool soil on the bottom of artificial pools, • letting artificial pools lie fallow.
Vegetation, hydrology, and invertebrates were monitored during 1993, 1994, 1995 and 1996. This work was performed for the Department by Sonoma State University under contract 65T343. The final report for the original project is: Northen, Philip T., Susan Holve-Hensill and Doug Eakins. April 15, 1998. Techniques for Mitigating Loss of Vernal
2

Pools: an Experimental Approach. California Department of Transportation. Sacramento CA. The Sonoma State team reached the following major conclusions:
1. All artificial pools behaved as functional vernal pools during the 2-3 year period of observation.
2. Waiting through one wet season before inoculating a vacuum/scrape pools did not improve success.
3. Inoculating artificial pools with pulverized soil is superior to vacuum/scrape pools and block methods in creating successful vernal pools.
4. The source pools in the study lost plant diversity rapidly over the four years of observation and began developing thatch. Central valley vernal pools may require regular disturbance to maintain high diversity and other wetland values.
The propagule removal methods differed in how they affected the source pools. Creating shallow, unfilled depressions by removing soil had no adverse effects, and is the preferred method for removing inoculum. The CSU Fresno Study The Department sponsored another vernal pool creation study in the San Joaquin Valley in Madera County. A research team from CSU Fresno performed the research. The objective of this study was to develop methods for: • enhancing existing degraded vernal pools, • creating artificial pools with the characteristics of natural vernal pools in the San
Joaquin Valley.
The final report for the CSU Fresno study is Stebins, John C., James R Brownwell and William Traylor. September 1, 1996. Effective Mitigation Techniques for Central Valley Vernal Pools.
The research team observed and recorded the physical and botanical aspects of vernal pools in Madera and Fresno Counties. Specific vascular plant species were matched to vernal pool features such as depth, slope, overall dimensions and soil type. Using the collected data the research team supervised construction of 17 pools and swales at a site adjacent to the Madera Equalization Reservoir during September 1993. Specific sites were selected based primarily on slope, soil characteristics, vegetation present and proximity to natural vernal pools. Unlike the Travis AFB site, the artificial pools at the Madera site were not constructed to provide replicates for statistical analysis. Two basic types were constructed, swale-like and bowl-like. The swale-like pools were between 8 to 12 inches deep. These pools were sloped with the deep side at one end. Bowl-like pools were deeper 12 to 18 inches and had the deepest portion at the center. Four pools were bowl-liked, eleven pools were swale-like and two pools were intermediate. In some instances bentonite was used to reduce soil permeability. The pools were planted with propagules collected from local pools during the spring and summer of 1993. Vegetation data were collected along a permanent transect bisecting each pool which passed through the deepest site in each pool. Data were collected from within a 10 cm X
3

10 cm frame at 20 cm intervals along the transect. Vigor and success of sensitive species were determined via field observations and professional judgment. Among the findings of the CSU Fresno team:
• Bowl-like and deeper swale-like pools held water sooner and for longer periods than shallow swale like pools, all created pools containing bentonite held water earlier and longer than nearby natural pools;
• absolute cover measurements suggested that many of the created pools were similar to natural pools, however a large portion of the cover was of weedy species;
• absolute cover was not a good measure for success; • in most pools Hordeum murinum was dominant; In the third season some pools
were dominated by hydrophytic species, while others were dominated by weedy species;
• bowl-like and deeper pools appeared to be the most suitable for establishment of obligate wetland species;
• cover values vary for each species from year to year, when the same species retains dominance over time those species are good indicators of a pool’s character;
• Hordeum murinum is often associated with the moist disturbed edges of central valley vernal pools;
• bowl-like pools with moderate depth and intermediate type pools demonstrated greater stability in water holding capacity and seem to be a more appropriate design for many plant species;
• many of the swale-like pools became infested by invasive grasses which produced a heavy thatch which prevented the growth of more desirable species;
• deep bowl-like pools developed centers without vegetation probably due to the long inundation periods;
• shallower bow-like and intermediate pools seemed to provide more vernal pool vegetation habitat.
There appears to be significant variability in relative cover for vernal pool species in the same pool from year to year. The Current Study The research project F 2000 EN 214 Long Term Evaluation of Characteristics in an Artificial Northern California Vernal Pool System Phase II is the second phase of a study developed to determine how the vernal pool habitat characteristics in the artificial vernal pools at the Travis AFB study area fared over the course of time. Consequently, the research site was revisited in 2001 and 2002. During these visits data was collected on vegetation, hydrology, and soils to determine the status of the artificial pools and make observations on the methods used by Sonoma State to develop the artificial vernal pools. Originally the project envisioned a study of the fauna of the artificial pools and samples were collected during the spring of 2002. However, due to the time required for analyzing the vegetation data the faunal aspect was dropped from the project. The objectives of this project are:
• to determine if artificial vernal pools constructed at Travis AFB in 1993 maintained vernal pool characteristics,
4
• to determine if plant species vary from 2001 to 2002 in vernal pool systems, • to determine if any of the five treatments used to develop the artificial pools are
useful for mitigating vernal pool impacts. • to determine if artificial vernal pools sustained source pool characteristics
VEGETATION METHODS Purpose of the Vegetation Study The purpose of the vegetation study was to describe and analyze the vegetation in the artificial vernal pools and the source pools to determine:
• if the artificial vernal pools contained vernal pool plant communities, • how the vegetation in the artificial vernal pools compared to the vegetation in the
source pools, • how the vegetation currently in the source pools compared to the vegetation in
the source pools in 1994. Use of the digital Camera to gather data
The vernal pool blooming season, when plants can be best identified, and cover abundance observed occurs during a relatively short period in the spring. During the spring, the vegetation apparent in the vernal pools changes rapidly as temperatures rise and the soil becomes dry. It was not practical to use only manual methods to develop the needed quantities of data in the limited time available. Therefore, we used an Olympus 2500 digital camera to rapidly gather high quality images of the vegetation for analysis. The high color fidelity and sharpness of the images produced the digital camera allow proper identification of plant species, estimates of percent cover and analysis of other vegetation characteristics. The series of electronic images provides an accurate record of the conditions within the pools over the course of the study. Digital images can be compared within a season and from year to year. Description of Vegetation Sampling Methods During 2001
We visited the research site on: 01/17/01, 02/01/01, 03/01/01, 03/22/01, 03/29/01, 04/10/01, 04/26/01, 05/03/01, and 06/08/01 to gather vegetation data. On each visit wide angle and close up images were taken of each artificial and natural pool. One wide-angle image of each entire pool was taken from the pools shallow end. Natural vernal pools often exhibit vegetation zonation due to differing lengths of inundation in the deeper versus the shallower portions of pools. Different vernal pool plant species form rings at different elevations around the perimeter of a pool because each species is adapted to growing in soil inundated for a particular period of time. Species adapted to longer inundation periods tend to grow lower in pools than species adapted to shorter inundation periods. The design of the artificial pools with a deep end sloping to a shallow end led to such vegetation zonation. We decided to stratify the pools into deep, middle, and shallow zone. Close ups were taken of the deep, middle, and shallow zone of each artificial pool as defined by pool depth. The close up images were of representative homogenous areas of the strata in the pools. Plant species in each artificial and natural pool were identified
5

on site. If we were not able to identify the plant on site a close up image or sample of the plant in question was collected for identification. Species identifications are according to the corrected third printing of The Jepson Manual: Higher Plants of California (Hickman ed., 1996). Description of Vegetation Sampling Methods During 2002 We visited the site on several dates: 03/08/02, 03/21/02, 04/02/02, 04/08/02, 04/12/02, 04/19/02, 04/22/02, 05/01/02, 06/05/02, 06/14/02, and 06/21/02. On each date field notes were taken on the condition of the pools. If a pool was filled with water, muddy, or had plants too small to be identified, it was not possible to collect vegetation data. We selected 04/19/02, 05/01/02, and 06/05/02 for vegetation data analysis. These dates were selected, because we had complete vegetation data and they were very close to data analysis dates in 2001 thus enhancing year-to-year comparison. The rest of the data collected is in the appendix. On each visit wide angle and close up images were taken of each artificial and natural pool. One wide-angle image of each entire pool was taken from the pools shallow end. Close ups of plots were taken of the deep, middle, and shallow zone of each artificial pool as defined by pool depth (Photo 1). All the data was collected by Craig Moore and Monica Bastian.
Based on the observations of 2001 the pools were stratified into deep, middle, and shallow zones. Data collection points were randomly selected at random within each stratum in each pool. To sample the vegetation in the pools, we used quadrats of (1864.5 cm2). The quadrants were delineated by a frame with the dimensions of 43.18 centimeters, constructed from PVC pipe (Photo 2). Plant species in each quadrat were identified on site (photo 1). In addition, field notes were taken on the plant species in each zone.
Photo 1. Wide-angle image of Artificial Pool B1 with lines indicating deep, middle, and shallowzones.
6
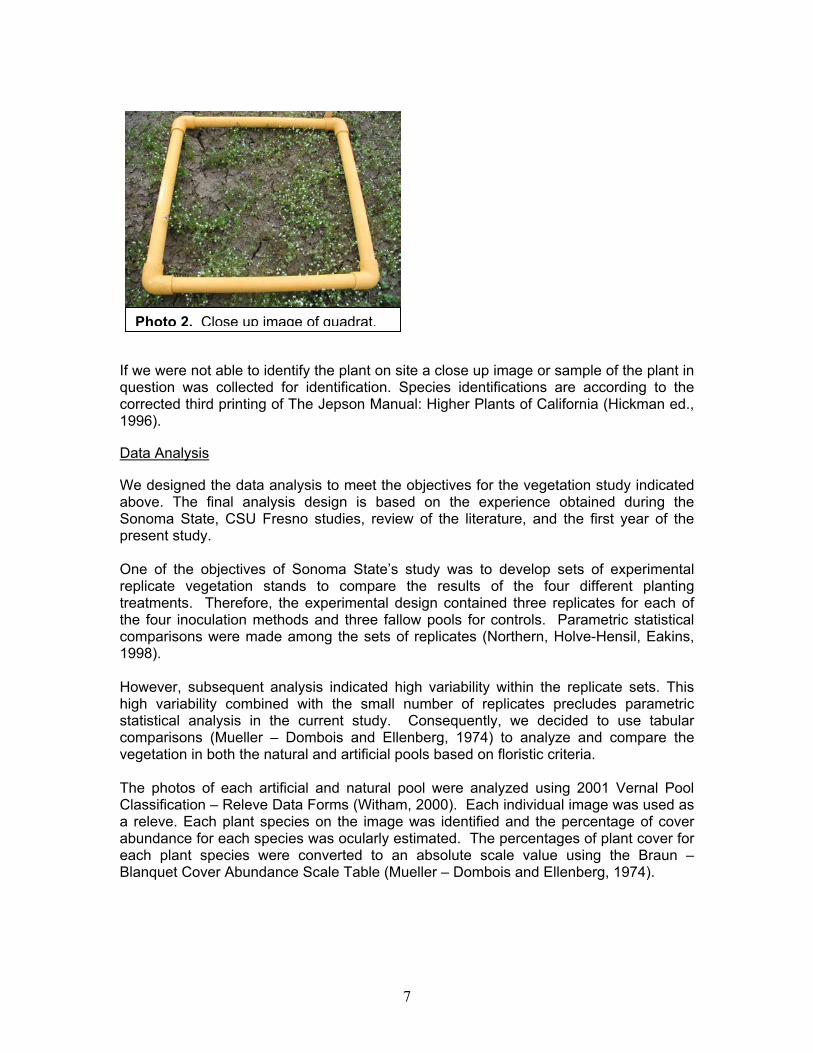
Photo 2. Close up image of quadrat.
If we were not able to identify the plant on site a close up image or sample of the plant in question was collected for identification. Species identifications are according to the corrected third printing of The Jepson Manual: Higher Plants of California (Hickman ed., 1996). Data Analysis We designed the data analysis to meet the objectives for the vegetation study indicated above. The final analysis design is based on the experience obtained during the Sonoma State, CSU Fresno studies, review of the literature, and the first year of the present study. One of the objectives of Sonoma State’s study was to develop sets of experimental replicate vegetation stands to compare the results of the four different planting treatments. Therefore, the experimental design contained three replicates for each of the four inoculation methods and three fallow pools for controls. Parametric statistical comparisons were made among the sets of replicates (Northern, Holve-Hensil, Eakins, 1998). However, subsequent analysis indicated high variability within the replicate sets. This high variability combined with the small number of replicates precludes parametric statistical analysis in the current study. Consequently, we decided to use tabular comparisons (Mueller – Dombois and Ellenberg, 1974) to analyze and compare the vegetation in both the natural and artificial pools based on floristic criteria. The photos of each artificial and natural pool were analyzed using 2001 Vernal Pool Classification – Releve Data Forms (Witham, 2000). Each individual image was used as a releve. Each plant species on the image was identified and the percentage of cover abundance for each species was ocularly estimated. The percentages of plant cover for each plant species were converted to an absolute scale value using the Braun – Blanquet Cover Abundance Scale Table (Mueller – Dombois and Ellenberg, 1974).
7
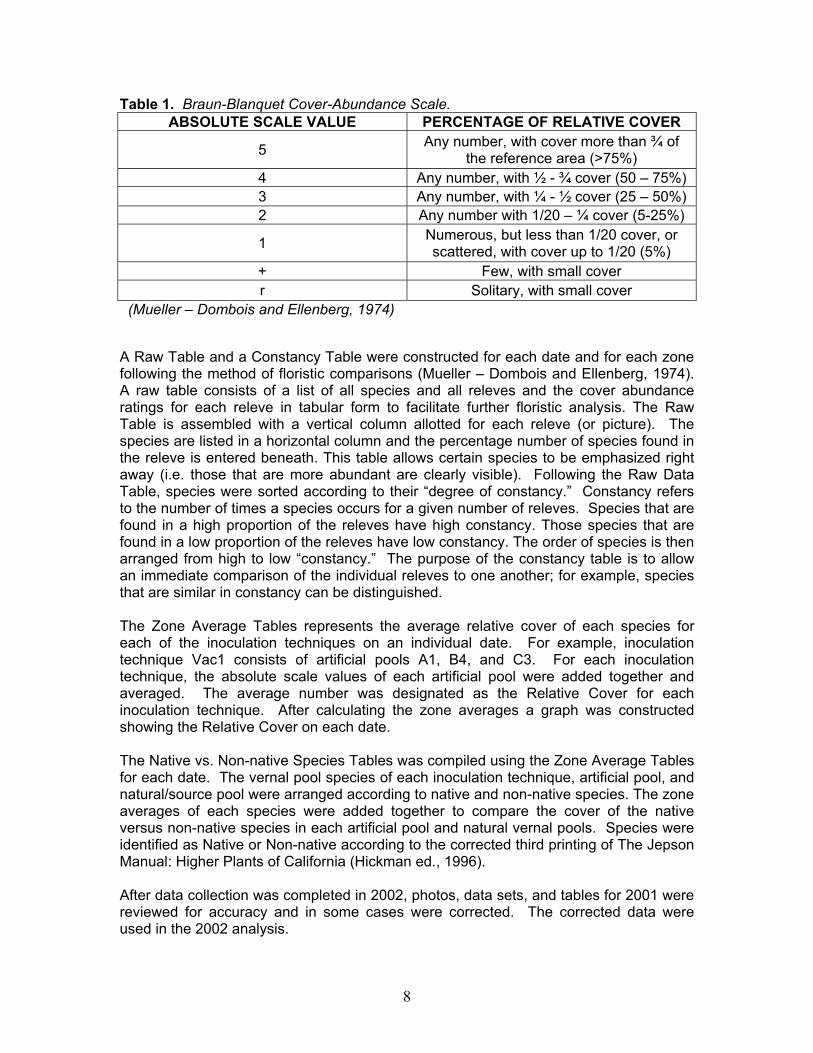
Table 1. Braun-Blanquet Cover-Abundance Scale. ABSOLUTE SCALE VALUE PERCENTAGE OF RELATIVE COVER
5 Any number, with cover more than ¾ of the reference area (>75%)
4 Any number, with ½ - ¾ cover (50 – 75%) 3 Any number, with ¼ - ½ cover (25 – 50%) 2 Any number with 1/20 – ¼ cover (5-25%)
1 Numerous, but less than 1/20 cover, or scattered, with cover up to 1/20 (5%)
+ Few, with small cover r Solitary, with small cover
(Mueller – Dombois and Ellenberg, 1974) A Raw Table and a Constancy Table were constructed for each date and for each zone following the method of floristic comparisons (Mueller – Dombois and Ellenberg, 1974). A raw table consists of a list of all species and all releves and the cover abundance ratings for each releve in tabular form to facilitate further floristic analysis. The Raw Table is assembled with a vertical column allotted for each releve (or picture). The species are listed in a horizontal column and the percentage number of species found in the releve is entered beneath. This table allows certain species to be emphasized right away (i.e. those that are more abundant are clearly visible). Following the Raw Data Table, species were sorted according to their “degree of constancy.” Constancy refers to the number of times a species occurs for a given number of releves. Species that are found in a high proportion of the releves have high constancy. Those species that are found in a low proportion of the releves have low constancy. The order of species is then arranged from high to low “constancy.” The purpose of the constancy table is to allow an immediate comparison of the individual releves to one another; for example, species that are similar in constancy can be distinguished. The Zone Average Tables represents the average relative cover of each species for each of the inoculation techniques on an individual date. For example, inoculation technique Vac1 consists of artificial pools A1, B4, and C3. For each inoculation technique, the absolute scale values of each artificial pool were added together and averaged. The average number was designated as the Relative Cover for each inoculation technique. After calculating the zone averages a graph was constructed showing the Relative Cover on each date.
The Native vs. Non-native Species Tables was compiled using the Zone Average Tables for each date. The vernal pool species of each inoculation technique, artificial pool, and natural/source pool were arranged according to native and non-native species. The zone averages of each species were added together to compare the cover of the native versus non-native species in each artificial pool and natural vernal pools. Species were identified as Native or Non-native according to the corrected third printing of The Jepson Manual: Higher Plants of California (Hickman ed., 1996). After data collection was completed in 2002, photos, data sets, and tables for 2001 were reviewed for accuracy and in some cases were corrected. The corrected data were used in the 2002 analysis.
8

Natural Source Pool TR17 After observing the condition of source pool TR17, it was decided to exclude it from our analysis because the vegetative composition of the pool was considerably different from its composition in 1994. Non-native plants now dominate the pool. Any comparison would lead to TR17 failing to resemble the artificial pools it had inoculated. TR17 was the source pool for the B series artificial pools. Northern, Holve-Hensill, and Eakins (1998) stated that the source pools lost plant diversity rapidly over the four-year study and begin developing thatch. Photos 3 and 4 compare TR17 as pictured in 1994 and again in 2002. In 1994, TR17 appeared to have fewer amounts of invasive species and higher amounts of native species. In 2002, our study shows that TR17 developed many invasive species and thatch. TR17 is fenced in which prevents grazing and other disturbances.
Photo 3. Source Pool TR17 in 1994 (Northern, Holve-Hensil, Eakins 1998).
Photo 4. Source Pool TR17 in 2002.
9
VEGETATION RESULTS FOR 2001 Species Constancy in the Shallow, Middle and Deep Zones on 04/26/01
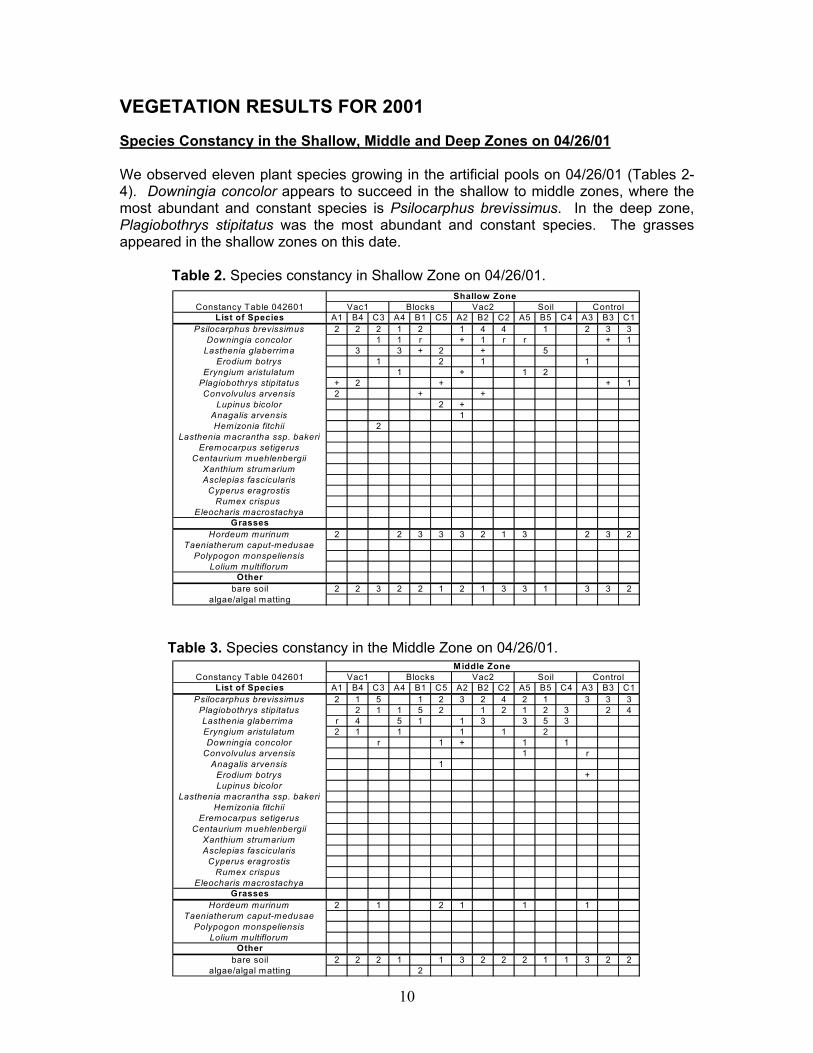
We observed eleven plant species growing in the artificial pools on 04/26/01 (Tables 2-4). Downingia concolor appears to succeed in the shallow to middle zones, where the most abundant and constant species is Psilocarphus brevissimus. In the deep zone, Plagiobothrys stipitatus was the most abundant and constant species. The grasses appeared in the shallow zones on this date.
Table 2. Species constancy in Shallow Zone on 04/26/01.
Shallow Zone Constancy Table 042601 Vac1 Blocks Vac2 Soil Control
List of Species A1 B4 C3 A4 B1 C5 A2 B2 C2 A5 B5 C4 A3 B3 C1Psilocarphus brevissimus 2 2 2 1 2 1 4 4 1 2 3 3
Downingia concolor 1 1 r + 1 r r + 1Lasthenia glaberrima 3 3 + 2 + 5
Erodium botrys 1 2 1 1Eryngium aristulatum 1 + 1 2
Plagiobothrys stipitatus + 2 + + 1Convolvulus arvensis 2 + +
Lupinus bicolor 2 +Anagalis arvensis 1Hemizonia fitchii 2
Lasthenia macrantha ssp. bakeriEremocarpus setigerus
Centaurium muehlenbergiiXanthium strumariumAsclepias fascicularis
Cyperus eragrostisRumex crispus
Eleocharis macrostachyaGrasses
Hordeum murinum 2 2 3 3 3 2 1 3 2 3 2Taeniatherum caput-medusae
Polypogon monspeliensisLolium multiflorum
Otherbare soil 2 2 3 2 2 1 2 1 3 3 1 3 3 2
algae/algal matting
Table 3. Species constancy in the Middle Zone on 04/26/01.
Middle Zone Constancy Table 042601 Vac1 Blocks Vac2 Soil Control
List of Species A1 B4 C3 A4 B1 C5 A2 B2 C2 A5 B5 C4 A3 B3 C1Psilocarphus brevissimus 2 1 5 1 2 3 2 4 2 1 3 3 3
Plagiobothrys stipitatus 2 1 1 5 2 1 2 1 2 3 2 4Lasthenia glaberrima r 4 5 1 1 3 3 5 3Eryngium aristulatum 2 1 1 1 1 2Downingia concolor r 1 + 1 1
Convolvulus arvensis 1 rAnagalis arvensis 1
Erodium botrys +Lupinus bicolor
Lasthenia macrantha ssp. bakeriHemizonia fitchii
Eremocarpus setigerusCentaurium muehlenbergii
Xanthium strumariumAsclepias fascicularis
Cyperus eragrostisRumex crispus
Eleocharis macrostachyaGrasses
Hordeum murinum 2 1 2 1 1 1Taeniatherum caput-medusae
Polypogon monspeliensisLolium multiflorum
Otherbare soil 2 2 2 1 1 3 2 2 2 1 1 3 2 2
algae/algal matting 2
10

Table 4. Species constancy in the Deep Zone on 04/26/01. Deep Zone
Constancy Table 042601 Vac1 Blocks Vac2 Soil ControlList of Species A1 B4 C3 A4 B1 C5 A2 B2 C2 A5 B5 C4 A3 B3 C1
Plagiobothrys stipitatus 4 5 4 5 5 5 3 3 4 3 5 5 3 5Psilocarphus brevissimus 1 2 3 2 1 3 2 2
Eryngium aristulatum 1 1 1 2 1 + 1Lasthenia glaberrima 1 2 2 3 1Convolvulus arvensis 1 +
Anagalis arvensisDowningia concolor
Erodium botrysLupinus bicolor
Lasthenia macrantha ssp. bakeriHemizonia fitchii
Eremocarpus setigerusCentaurium muehlenbergii
Xanthium strumariumAsclepias fascicularis
Cyperus eragrostisRumex crispus
Eleocharis macrostachyaGrasses
Hordeum murinum 2 1 1Taeniatherum caput-medusae
Polypogon monspeliensisLolium multiflorum
Otherbare soil 2 2 3 1 1 1 2 2 2 1 3 2
algae/algal m atting 2 2 2 2
Plagiobothrys stipitatus had the highest average cover among species present on 04/26/01. Among the inoculation treatment, Vac2, had the highest relative cover (7.02). The relative cover ranged from 5.69 to 7.02 (Table 5 and Figure 1).
Table 5. Average cover of species present in all zones in each inoculation treatment on 04/26/01.
Z o n e A v e ra g e s 0 4 2 6 0 1 In o c u la t io n T r e a tm e n tsL is t o f S p e c ie s V a c 1 B lo c k s V a c 2 S o il C o n tro l
P la g io b o th ry s s t ip ita tu s 2 .0 1 2 .5 6 1 .4 4 2 .1 1 1 .6 7P s ilo c a rp h u s b re v is s im u s 1 .8 9 0 .6 7 2 .5 6 0 .5 6 2 .6 7
E ry n g iu m a r is tu la tu m 0 .5 6 0 .3 3 0 .4 5 0 .6 7 0 .1 1D o w n in g ia c o n c o lo r 0 .1 1 0 .2 2 0 .1 2 0 .2 2 0 .1 2
L a s th e n ia g la b e r r im a 0 .7 8 1 .3 4 0 .8 9 2 .2 2E ro d iu m b o try s 0 .1 1 0 .2 2 0 .1 1 0 .1 2
C o n v o lv u lu s a rv e n s is 0 .2 2 0 .0 0 6 0 .1 2 0 .1 2A n a g a lis fa s c ic u la r is 0 .1 1 0 .1 1
L u p in u s b ic o lo r 0 .1 1 0 .1 1H e m izo n ia f i tc h i i 0 .1 1
E re m o c a rp u s s e t ig e ru sC e n ta u r iu m m u e h le n b e rg ii
X a n th iu m s tru m a r iu mA s c le p ia s a s p e ru laC y p e ru s e ra g ro s t is
L a s th e n ia m a c ra n th a s s p . b a k e r iR u m e x c r is p u s
E le o c h a r is m a c ro s ta c h y aG ra s s e s
H o rd e u m m u r in u m 0 .5 6 1 .1 1 1 .1 1 0 .4 4 1L o liu m m u lt i f lo ru m
T a e n ia th e ru m c a p u t-m e d u s a eP o ly p o g o n m o n s p e lie n s is
O th e rb a re s o il 2 .2 2 1 1 .8 9 1 .2 2 2 .2 2
a lg a e /a lg a l m a tt in g 0 .6 7 0 .2 2 0 .2 2R e la t iv e C o v e r (a v e ra g e ) 6 .2 4 6 .7 9 7 .0 2 6 .3 4 5 .6 9
11

5.696.246.34
6.797.02
0
1
2
3
4
5
6
7
8
Vac2 Blocks Soil Vac1 Control
Inoculation Technique
Rel
ativ
e co
ver
Figure 1. Relative Cover on 04/26/01.
Species Constancy in the Shallow, Middle, and Deep Zones on 05/03/01 There were ten plant species observed in the artificial pools on 05/03/01 (Tables 6-8). In the shallow zone, Downingia concolor was the most constant species, but Psilocarphus brevissimus had a greater amount of relative cover. In the middle zones, Psilocarphus brevissimus was the most constant and abundant species. Lasthenia glaberrima grew in all zones, but had higher relative cover in the middle zones. In the deep zone, Plagiobothrys stipitatus was the most abundant and constant species. The amount of grasses increased compared to 04/26/01.
Table 6. Species constancy in the Shallow Zone on 05/03/01.
Shallow Zone Constancy Table 050301 Vac1 Blocks Vac2 Soil Control
List of Species A1 B4 C3 A4 B1 C5 A2 B2 C2 A5 B5 C4 A3 B3 C1Downingia concolor + + 1 1 1 + + + 1 r 1 1
Psilocarphus brevissimus 2 3 4 2 4 2 3 4 3 2 3 4Eryngium aristulatum 2 2 1 2 1 1 1 2 1Lasthenia glaberrima + 1 2 1 1 1 + + 1
Plagiobothrys stipitatus + 2 1 +Erodium botrys 1 + 1
Anagalis arvensis 1 1Convolvulus arvensis +
Hemizonia fitchiiLasthenia macrantha ssp. bakeri
Lupinus bicolorEremocarpus setigerus
Centaurium muehlenbergiiXanthium strumariumAsclepias fascicularisCyperus eragrostis
Rumex crispus Eleocharis macrostachya
GrassesHordeum murinum 2 2 3 4 2 3 1 4 2 4 3 3 1Lolium multiflorum 1 1
Taeniatherum caput-medusaePolypogon monspeliensis
Otherbare soil 3 3 2 2 2 2 1 3 2 2 1 1 3 3 3
algae/algal matting
+
12

Table 7. Species constancy in the Middle Zone on 05/03/01. Middle Zone
Constancy Table 050301 Vac1 Blocks Vac2 Soil ControlList of Species A1 B4 C3 A4 B1 C5 A2 B2 C2 A5 B5 C4 A3 B3 C1
Psilocarphus brevissimus 2 2 3 1 2 3 3 3 4 2 2 1 3 2 4Plagiobothrys stipitatus 1 1 + 4 + + + 1 1 1 2 2
Lasthenia glaberrima + 2 3 1 + 1 2 4 1Eryngium aristulatum 2 1 2 1 1 2 2 2Downingia concolor 1 2 + 1 1 1
Convolvulus arvensis + 1 + +Hemizonia fitchii 2
Asclepias fascicularisErodium botrys
Lasthenia macrantha ssp. bakeriLupinus bicolor
Eremocarpus setigerusCentaurium muehlenbergii
Xanthium strumariumAsclepias asperulaCyperus eragrostis
Rumex crispus Eleocharis macrostachya
GrassesHordeum murinum 2 2 1 1Lolium multiflorum 1
Taeniatherum caput-medusaePolypogon monspeliensis
Otherbare soil 3 2 3 3 1 + 3 2 3 3 1 + 3 3 3
algae/algal matting 2
1
Table 8. Species constancy in the Deep Zone on 05/03/01. Deep Zone
Constancy Table 050301 Vac1 Blocks Vac2 Soil ControlList of Species A1 B4 C3 A4 B1 C5 A2 B2 C2 A5 B5 C4 A3 B3 C1
Plagiobothrys stipitatus 2 4 r 3 4 + + 3 r 4 2 3 3Psilocarphus brevissimus 1 2 1 1 3 2 1 1 2 2
Eryngium aristulatum 1 2 2 2 + 2 2 1 1Lasthenia glaberrima 1 2 1 2 + +Convolvulus arvensis 1 1Downingia concolor 1 1 1Anagalis arvensisErodium botrysLupinus bicolorHemizonia fitchii
Lasthenia macrantha ssp. bakeriEremocarpus setigerus
Centaurium muehlenbergiiXanthium strumariumAsclepias fascicularisCyperus eragrostis
Rumex crispus Eleocharis macrostachya
GrassesHordeum murinum 1 2 2 2 3 + 2Lolium multiflorum
Taeniatherum caput-medusaePolypogon monspeliensis
Otherbare soil 4 2 3 3 1 2 4 3 3 3 2 4 3
algae/algal matting 3 3
1
13

Psilocarphus brevissimus had the highest average cover on 05/03/01 (Table 9). Plagiobothrys stipitatus dominated the deep zone early in the season and declined over time. Inoculation treatment, Vac2, had the highest relative cover (6.92). Relative Cover on 05/03/01 ranged from 5.69 to 6.92 (Figure 2).
Table 9. Average cover of species present in all zones in each inoculation treatments on 05/03/01.
Z o n e A v e r a g e s 0 5 0 3 0 1 I n o c u l a t i o n T e c h n i q u eL i s t o f S p e c i e s V a c 1 B lo c k s V a c 2 S o i l C o n t r o l
P s i lo c a r p h u s b r e v is s im u s 2 . 2 2 1 . 4 4 2 . 7 8 1 2 . 4 4P la g io b o t h r y s s t ip i t a t u s 0 . 8 9 1 . 5 7 0 . 3 6 1 1 . 1 2
E r y n g iu m a r i s t u la t u m 1 . 1 1 0 . 5 6 1 . 3 4 0 . 8 9 0 . 4 4L a s t h e n ia g la b e r r im a 0 . 4 6 1 . 1 1 0 . 3 5 1 . 1 2 0 . 0 0 6D o w n in g ia c o n c o lo r 0 . 1 2 0 . 7 8 0 . 3 5 0 . 5 6 0 . 2 2
C o n v o lv u lu s a r v e n s is 0 . 1 2 0 . 1 1 0 . 1 1 0 . 0 0 6 0 . 1 2A s c le p ia s f a s c ic u la r is 0 . 1 1 0 . 0 0 6 0 . 1 1
E r o d iu m b o t r y s 0 . 1 1 0 . 1 1H e m iz o n ia f i t c h i i 0 . 1 1
L a s t h e n ia m a c r a n t h a s s p . b a k e r iL u p in u s b ic o lo r
E r e m o c a r p u s s e t ig e r u sC e n t a u r iu m m u e h le n b e r g i i
X a n t h iu m s t r u m a r iu mA s c le p ia s a s p e r u laC y p e r u s e r a g r o s t is
R u m e x c r i s p u sE le o c h a r is m a c r o s t a c h y a
G r a s s e sH o r d e u m m u r in u m 0 . 7 8 1 1 . 4 1 . 4 1 . 2 3L o l iu m m u l t i f l o r u m 0 . 1 1 0 . 1 1 0 . 1 1
T a e n ia t h e r u m c a p u t - m e d u s a eP o ly p o g o n m o n s p e l ie n s is
O t h e rb a r e s o i l 2 . 7 8 2 . 1 1 2 . 5 6 1 . 7 8 1 . 2 3
a lg a e / a lg a l m a t t in g 0 . 5 6 0 . 3 3R e l a t i v e C o v e r ( a v e r a g e ) 5 . 9 2 6 . 6 8 6 . 9 2 6 . 2 5 . 6 9
Figure 2. Relative Cover on 05/03/01.
5.695.926.206.68
6.92
0
1
2
3
4
5
6
7
8
Vac2 Blocks Soil Vac1 Control
Inoculation Technique
Rel
ativ
e co
ver
14
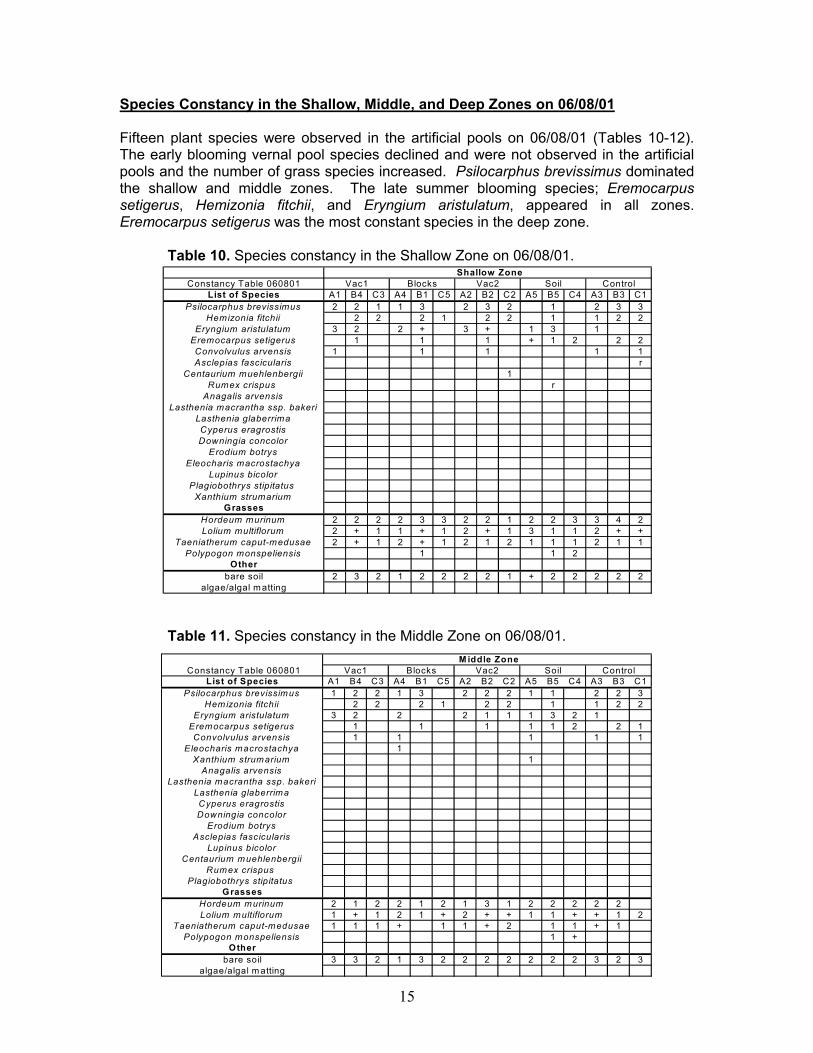
Species Constancy in the Shallow, Middle, and Deep Zones on 06/08/01 Fifteen plant species were observed in the artificial pools on 06/08/01 (Tables 10-12). The early blooming vernal pool species declined and were not observed in the artificial pools and the number of grass species increased. Psilocarphus brevissimus dominated the shallow and middle zones. The late summer blooming species; Eremocarpus setigerus, Hemizonia fitchii, and Eryngium aristulatum, appeared in all zones. Eremocarpus setigerus was the most constant species in the deep zone.
Table 10. Species constancy in the Shallow Zone on 06/08/01. Shallow Zone
Constancy Table 060801 Vac1 Blocks Vac2 Soil ControlList of Species A1 B4 C3 A4 B1 C5 A2 B2 C2 A5 B5 C4 A3 B3 C1
Psilocarphus brevissimus 2 2 1 1 3 2 3 2 1 2 3 3Hemizonia fitchii 2 2 2 1 2 2 1 1 2 2
Eryngium aristulatum 3 2 2 + 3 + 1 3 1Eremocarpus setigerus 1 1 1 + 1 2 2Convolvulus arvensis 1 1 1 1Asclepias fascicularis r
Centaurium muehlenbergii 1Rumex crispus r
Anagalis arvensisLasthenia macrantha ssp. bakeri
Lasthenia glaberrimaCyperus eragrostisDowningia concolor
Erodium botrysEleocharis macrostachya
Lupinus bicolorPlagiobothrys stipitatus
Xanthium strumariumGrasses
Hordeum murinum 2 2 2 2 3 3 2 2 1 2 2 3 3 4 2Lolium multiflorum 2 + 1 1 + 1 2 + 1 3 1 1 2 + +
Taeniatherum caput-medusae 2 + 1 2 + 1 2 1 2 1 1 1 2 1 1Polypogon monspeliensis 1 1 2
Otherbare soil 2 3 2 1 2 2 2 2 1 + 2 2 2 2 2
algae/algal m atting
21
Table 11. Species constancy in the Middle Zone on 06/08/01.
M iddle Zone Constancy Table 060801 Vac1 Blocks Vac2 Soil Control
List of Species A1 B4 C3 A4 B1 C5 A2 B2 C2 A5 B5 C4 A3 B3 C1Psilocarphus brevissimus 1 2 2 1 3 2 2 2 1 1 2 2 3
Hemizonia fitchii 2 2 2 1 2 2 1 1 2 2Eryngium aristulatum 3 2 2 2 1 1 1 3 2 1
Eremocarpus setigerus 1 1 1 1 1 2 2Convolvulus arvensis 1 1 1 1
Eleocharis macrostachya 1Xanthium strumarium 1
Anagalis arvensisLasthenia macrantha ssp. bakeri
Lasthenia glaberrimaCyperus eragrostisDowningia concolor
Erodium botrysAsclepias fascicularis
Lupinus bicolorCentaurium muehlenbergii
Rumex crispus Plagiobothrys stipitatus
GrassesHordeum murinum 2 1 2 2 1 2 1 3 1 2 2 2 2 2Lolium multiflorum 1 + 1 2 1 + 2 + + 1 1 + + 1 2
Taeniatherum caput-medusae 1 1 1 + 1 1 + 2 1 1 + 1Polypogon monspeliensis 1 +
Otherbare soil 3 3 2 1 3 2 2 2 2 2 2 2 3 2 3
algae/algal m atting
11
15

Table 12. Species constancy in the Deep Zone on 06/08/01. Deep Zone
Constancy Table 060801 Vac1 Blocks Vac2 Soil ControlList of Species A1 B4 C3 A4 B1 C5 A2 B2 C2 A5 B5 C4 A3 B3 C1
Eremocarpus setigerus + r 1 1 2 + 2 2 2 2Eryngium aristulatum 2 2 2 1 2 1 1 3 2 1
Psilocarphus brevissimus 1 1 2 2 1 + 2 1 1 2Hemizonia fitchii 1 2 1 2 2 1 1 + 2
Convolvulus arvensis 2 1 1 1 + +Cyperus eragrostis r
Eleocharis macrostachya 1Xanthium strumarium 1
Anagalis arvensisLasthenia macrantha ssp. bakeri
Lasthenia glaberrimaDowningia concolor
Erodium botrysAsclepias fascicularis
Lupinus bicolorCentaurium muehlenbergii
Rumex crispus Plagiobothrys stipitatus
GrassesTaeniatherum caput-medusae 1 1 + + 1 1 1 + 2 + 1 1 2 1 1
Hordeum murinum 1 1 + 2 1 1 1 2 1 1 + 2 +Lolium multiflorum 1 1 1 1 1 + 2 + + 1 1 1 1
Polypogon monspeliensis 1 2 1Other
bare soil 4 3 3 2 4 2 2 3 3 2 3 3 4 2 3algae/algal matting
On 06/08/01, Psilocarphus brevissimus had the highest average cover throughout the artificial pools (Table 13). The control had the highest relative cover (9.15) compared to the other artificial pools. Relative cover ranged from 7.02 to 9.15 on 06/08/01 (Figure 3).
Table 13. Average cover of species present in all zones in each inoculation treatments on 06/08/01.
Z o n e A v e r a g e s 0 6 0 8 0 1 A r t i f i c i a l P o o lsL is t o f S p e c i e s V a c 1 B lo c k s V a c 2 S o i l C o n t r o l
P s i lo c a r p h u s b r e v is s im u s 1 . 5 6 1 . 1 1 1 . 6 7 0 . 7 8 2 . 1 1H e m iz o n ia f i t c h i i 1 . 2 2 0 . 7 8 1 . 3 3 0 . 3 3 1 . 4 5
E r y n g iu m a r is t u la t u m 1 . 5 6 0 . 7 8 1 . 2 3 1 . 6 7 0 . 3 3E r e m o c a r p u s s e t ig e r u s 0 . 2 3 0 . 4 4 0 . 4 4 1 . 2 3 1 . 2 2
C o n v o lv u lu s a r v e n s is 0 . 4 4 0 . 4 4 0 . 2 2 0 . 1 2 0 . 4 5X a n t h iu m s t r u m a r iu m 0 . 1 1
C e n t a u r iu m m u e h le n b e r g i i 0 . 1 1E le o c h a r is m a c r o s t a c h y a 0 . 2 2
A n a g a l is a r v e n s isL a s t h e n ia m a c r a n t h a s s p . b a k e r i
L a s t h e n ia g la b e r r im aC y p e r u s e r a g r o s t is D o w n in g ia c o n c o lo r
E r o d iu m b o t r y sR u m e x c r is p u sL u p in u s b ic o lo r
P la g io b o t h r y s s t ip i t a t u s A s c le p ia s f a s c ic u la r is
G r a s s e sH o r d e u m m u r in u m 1 . 4 4 1 . 6 7 1 . 4 4 1 . 8 9 1 . 6 8L o l iu m m u l t i f lo r u m 0 . 9 0 . 7 9 0 . 8 1 1 . 0 1 0 . 7 9
T a e n ia t h e r u m c a p u t - m e d u s a e 0 . 9 0 . 6 8 1 . 2 3 0 . 7 8 1 . 0 1P o ly p o g o n m o n s p e l ie n s is 0 . 1 1 0 . 7 8 0 . 1 1
O t h e rb a r e s o i l 2 . 7 8 2 . 1 1 2 . 1 1 2 . 0 1 2 . 5 6
a lg a e /a lg a l m a t t in gR e l a t i v e C o v e r ( a v e r a g e ) 8 . 2 5 7 . 0 2 8 . 4 8 8 . 7 9 . 1 5
16

Figure 3. Relative Cover on 06/08/01.
7.028.258.488.70
9.15
0123456789
10
Control Soil Vac2 Vac1 BlocksInoculation Technique
Rel
ativ
e co
ver
Native vs. Non-Native Species in each Inoculation Technique and Natural Pools
On 04/26/01, there were more native plant species than non-native in each pool. We observed six native species in the artificial pools and six native species in the natural pools (Table 14). The six species are constant with the exception of Hemizonia fitchii and Lasthenia macrantha ssp. bakeri. Hemizonia fitchii was present only in the artificial pools, while Lasthenia macrantha ssp. bakeri was present in the natural pools. Five non-native species were present in the artificial pools and three non-native species were present in the natural pools. Among the non-native species, Erodium botrys, Anagalis arvensis and Lupinus bicolor were only present in the artificial pools. Lolium multiflorum was present in SP1 and absent in all the other pools (Figure 14).
Table 14. Native vs. Non-Native species on 04/26/01.
Native vs. Non-native spp. 042601 Inoculation Technique Natural PoolsNative Species Vac1 Blocks Vac2 Soil Control TR16 SP1 SP2
Eryngium aristulatum 0.56 0.33 0.45 0.67 0.11 2.00 2.00 2.00Psilocarphus brevissimus 1.89 0.67 2.56 0.56 2.67 2.00 2.00
Lasthenia glaberrima 0.78 1.12 0.89 2.22 2.00 3.00Plagiobothrys stipitatus 2.01 2.56 1.44 2.11 1.67 3.00
Downingia concolor 0.11 0.22 0.12 0.22 0.12 2.00Lasthenia macrantha ssp. bakeri 2.00 1.00
Hemizonia fitchii 0.11 Eleocharis macrostachyaEremocarpus setigerus
Cyperus eragrostis Xanthium strumarium
Relative Cover (Native Species) 5.35 5.01 5.46 5.78 4.57 10.00 5.00 8.00Non-Native Species
Hordeum murinum 0.56 1.11 1.11 0.44 1.00 1.00 1.00 1.00Convolvulus arvensis 0.22 0.01 0.12 0.12 1.00
Erodium botrys 0.11 0.22 0.11 0.12Anagalis arvensis 0.11 0.11Lupinus bicolor 0.11 0.11
Lolium multiflorum 1.00Asclepias asperula
Centaurium muehlenbergiiRumex crispus
Taeniatherum caput-medusaePolypogon monspeliensis
Relative Cover (Non-Native Species) 0.89 1.56 1.56 0.56 1.12 2.00 2.00 1.00Other
bare soil 2.22 1.00 1.89 1.22 2.22 1.00 2.00 1.00algae/algal matting 0.67 0.22 0.22
17
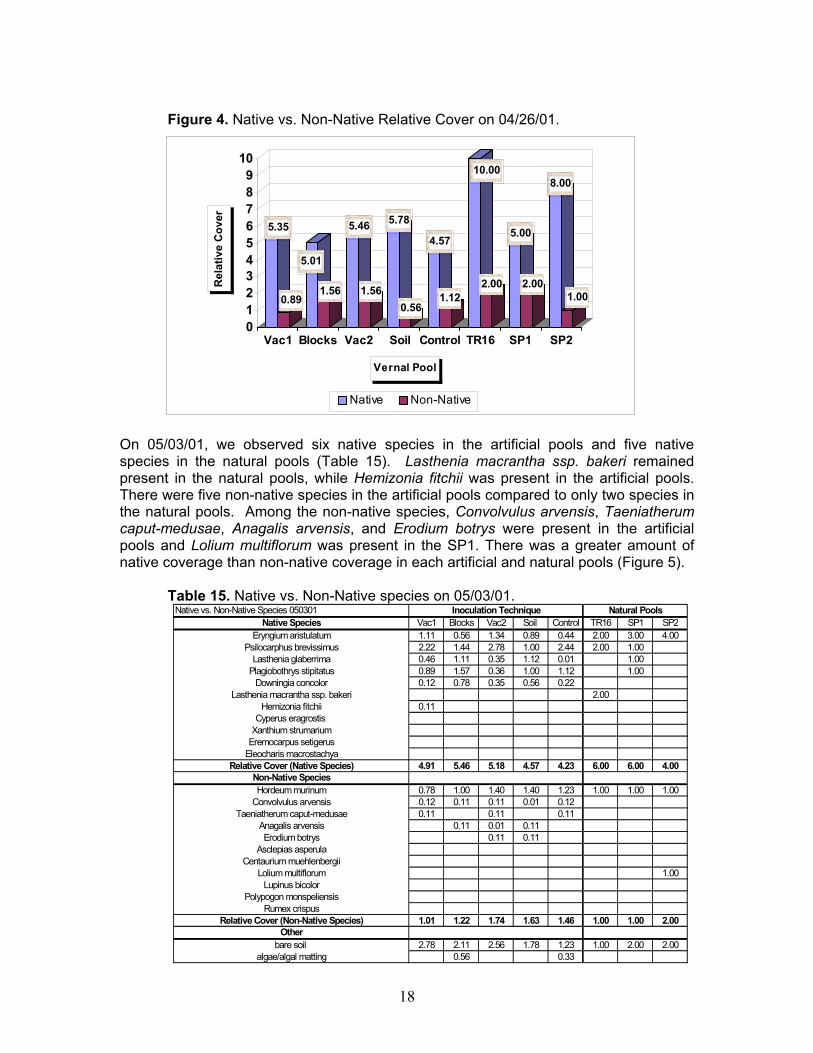
Figure 4. Native vs. Non-Native Relative Cover on 04/26/01.
5.35
0.89
5.01
1.56
5.46
1.56
5.78
0.56
4.57
1.12
10.00
2.00
5.00
2.00
8.00
1.00
0123456789
10
Rel
ativ
e C
over
Vac1 Blocks Vac2 Soil Control TR16 SP1 SP2
Vernal Pool
Native Non-Native
On 05/03/01, we observed six native species in the artificial pools and five native species in the natural pools (Table 15). Lasthenia macrantha ssp. bakeri remained present in the natural pools, while Hemizonia fitchii was present in the artificial pools. There were five non-native species in the artificial pools compared to only two species in the natural pools. Among the non-native species, Convolvulus arvensis, Taeniatherum caput-medusae, Anagalis arvensis, and Erodium botrys were present in the artificial pools and Lolium multiflorum was present in the SP1. There was a greater amount of native coverage than non-native coverage in each artificial and natural pools (Figure 5).
Table 15. Native vs. Non-Native species on 05/03/01.
Native vs. Non-Native Species 050301 Inoculation Technique Natural PoolsNative Species Vac1 Blocks Vac2 Soil Control TR16 SP1 SP2
Eryngium aristulatum 1.11 0.56 1.34 0.89 0.44 2.00 3.00 4.00Psilocarphus brevissimus 2.22 1.44 2.78 1.00 2.44 2.00 1.00
Lasthenia glaberrima 0.46 1.11 0.35 1.12 0.01 1.00Plagiobothrys stipitatus 0.89 1.57 0.36 1.00 1.12 1.00
Downingia concolor 0.12 0.78 0.35 0.56 0.22Lasthenia macrantha ssp. bakeri 2.00
Hemizonia fitchii 0.11Cyperus eragrostis
Xanthium strumariumEremocarpus setigerus
Eleocharis macrostachyaRelative Cover (Native Species) 4.91 5.46 5.18 4.57 4.23 6.00 6.00 4.00
Non-Native SpeciesHordeum murinum 0.78 1.00 1.40 1.40 1.23 1.00 1.00 1.00
Convolvulus arvensis 0.12 0.11 0.11 0.01 0.12Taeniatherum caput-medusae 0.11 0.11 0.11
Anagalis arvensis 0.11 0.01 0.11Erodium botrys 0.11 0.11
Asclepias asperulaCentaurium muehlenbergii
Lolium multiflorum 1.00Lupinus bicolor
Polypogon monspeliensisRumex crispus
Relative Cover (Non-Native Species) 1.01 1.22 1.74 1.63 1.46 1.00 1.00 2.00Other
bare soil 2.78 2.11 2.56 1.78 1.23 1.00 2.00 2.00algae/algal matting 0.56 0.33
18

Figure 5. Native vs. Non-Native Relative Cover on 05/03/01.
4.91
1.01
5.46
1.22
5.18
1.74
4.57
1.63
4.23
1.46
6.00
1.00
6.00
1.00
4.00
2.00
0
1
2
3
4
5
6
Rel
ativ
e C
over
Vac1 Blocks Vac2 Soil Control TR16 SP1 SP2
Vernal Pool
Native Non-Native
On 06/08/01, Vac1, Vac2, Control, TR16, and SP2 all had a greater amount of native versus non-native species (Table 16). The Blocks and Soil treatments had a greater amount of non-native species. SP1 had equal amounts of native and non-native relative cover. We observed six native species in the artificial pools and four native species in the natural pools. Xanthium strumarium and Eleocharis macrostachya were present in the artificial pools and absent in the natural pools. There were six non-native species in the artificial pools and four in the natural pools. Among the non-native species, Convolvulus arvensis, Taeniatherum caput-medusae, Polypogon monspeliensis, and Centaurium muehlenbergii were present in the artificial pools, but were absent in the natural pools. A small coverage of Asclepias fascicularis was in TR16 only. Rumex crispus was present in the natural pools, but absent in the artificial pools (Figure 6).
Table 16. Native vs. Non-Native species on 06/08/01.
Native vs. Non-Native Species 060801 Inoculation Technique Natural PoolsNative Species Vac1 Blocks Vac2 Soil Control TR16 SP1 SP2
Eryngium aristulatum 1.56 0.78 1.23 1.67 0.33 2.00 3.00 2.00Hemizonia fitchii 1.22 0.78 1.33 0.33 1.45 1.00 2.00
Eremocarpus setigerus 0.23 0.44 0.44 1.23 1.22 3.00 2.00Psilocarphus brevissimus 1.56 1.11 1.67 0.78 2.11 2.00 1.00
Xanthium strumarium 0.11Eleocharis macrostachya 0.22
Lasthenia glaberrimaLasthenia macrantha ssp. bakeri
Cyperus eragrostis Spergularia arvensisDowningia concolor
Relative Cover (Native Species) 4.57 3.33 4.67 4.12 5.11 8.00 4.00 6.00Non-Native SpeciesHordeum murinum 1.44 1.67 1.44 1.89 1.68 1.00 2.00 2.00Lolium multiflorum 0.90 0.79 0.81 1.01 0.79 2.00
Convolvulus arvensis 0.44 0.44 0.22 0.12 0.45Taeniatherum caput-medusae 0.90 0.68 1.23 0.78 1.01
Polypogon monspeliensis 0.11 0.78 0.11Rumex crispus 1.00
Asclepias asperula rCentaurium muehlenbergii 0.11
Anagalis arvensisErodium botrysLupinus bicolor
Relative Cover (Non-Native Species) 3.68 3.69 3.81 4.58 4.04 2.00 4.00 2.00Other
bare soil 2.78 2.11 2.11 2.01 2.56 1.00 2.00 2.00algae/algal matting
19
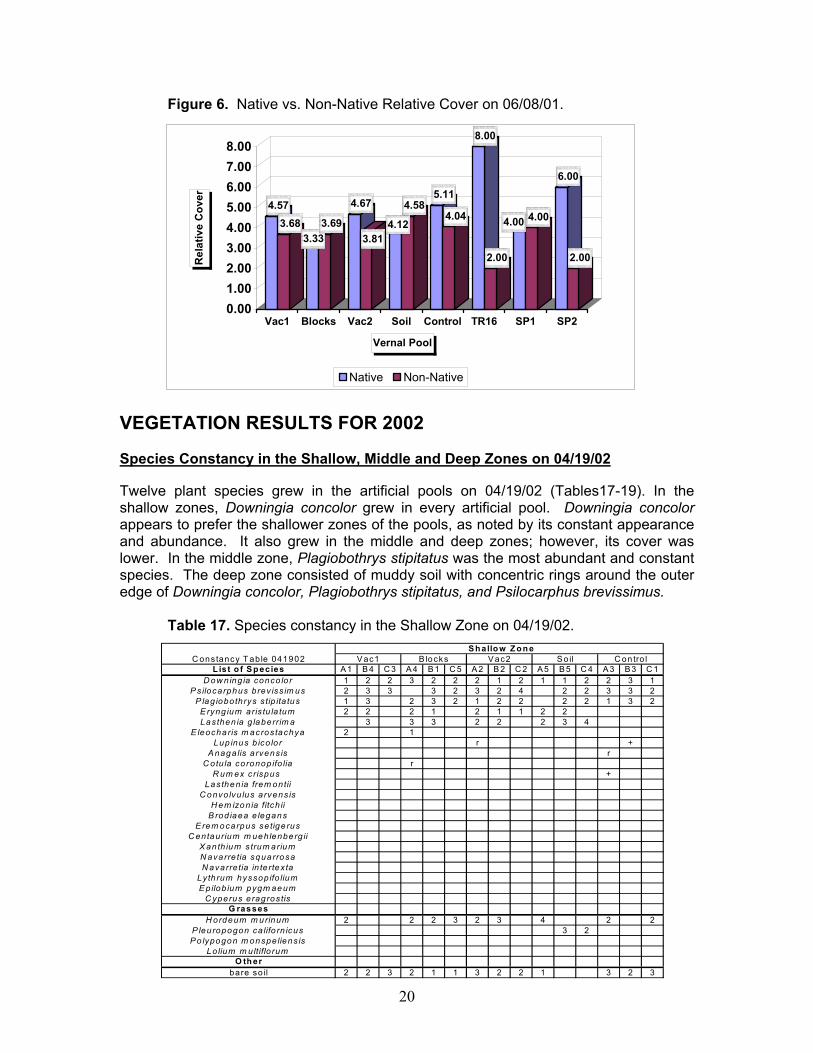
Figure 6. Native vs. Non-Native Relative Cover on 06/08/01.
4.573.68
3.333.69
4.67
3.814.12
4.585.11
4.04
8.00
2.00
4.00 4.00
6.00
2.00
0.001.002.003.004.005.006.007.008.00
Rel
ativ
e C
over
Vac1 Blocks Vac2 Soil Control TR16 SP1 SP2
Vernal Pool
Native Non-Native
VEGETATION RESULTS FOR 2002
Species Constancy in the Shallow, Middle and Deep Zones on 04/19/02 Twelve plant species grew in the artificial pools on 04/19/02 (Tables17-19). In the shallow zones, Downingia concolor grew in every artificial pool. Downingia concolor appears to prefer the shallower zones of the pools, as noted by its constant appearance and abundance. It also grew in the middle and deep zones; however, its cover was lower. In the middle zone, Plagiobothrys stipitatus was the most abundant and constant species. The deep zone consisted of muddy soil with concentric rings around the outer edge of Downingia concolor, Plagiobothrys stipitatus, and Psilocarphus brevissimus.
Table 17. Species constancy in the Shallow Zone on 04/19/02. S h allo w Z o n e
C onstancy T ab le 041902 V ac1 B locks V ac2 S o il C on tro lL ist o f S p ecies A 1 B 4 C 3 A 4 B 1 C 5 A 2 B 2 C 2 A 5 B 5 C 4 A 3 B 3 C 1
D ow ning ia conco lo r 1 2 2 3 2 2 2 1 2 1 1 2 2 3 1P silocarphus brev iss im us 2 3 3 3 2 3 2 4 2 2 3 3 2
P lag iobothrys s tip ita tus 1 3 2 3 2 1 2 2 2 2 1 3 2E ryng ium aris tu la tum 2 2 2 1 2 1 1 2 2Lasthen ia g laberrim a 3 3 3 2 2 2 3 4
E leocharis m acros tachya 2 1Lup inus b ico lo r r +
A naga lis a rvens is rC otu la coronop ifo lia r
R um ex c rispus +Lasthen ia frem ontii
C onvo lvu lus arvens isH em izon ia fitch ii
B rod iaea e legansE rem ocarpus se tige rus
C entaurium m ueh lenberg iiX an th ium s trum ariumN avarre tia squarrosaN avarre tia in te rtex ta
Ly th rum hyssop ifo liumE pilob ium pygm aeum
C yperus eragros tisG rasses
H ordeum m urinum 2 2 2 3 2 3 4 2 2P leu ropogon ca lifo rn icus 3 2P o lypogon m onspe liens is
Lo lium m ultiflo rumO th er
bare so il 2 2 3 2 1 1 3 2 2 1 3 2 3
20
Table 18. Species constancy in the Middle Zone on 04/19/02. Middle Zone
Constancy Table 041902 Vac1 Blocks Vac2 Soil ControlList of Species A1 B4 C3 A4 B1 C5 A2 B2 C2 A5 B5 C4 A3 B3 C1
Plagiobothrys stipitatus 2 2 3 3 3 3 2 2 3 2 3 3 2 2 3Psilocarphus brevissimus 3 3 3 3 3 2 2 3 2 2 2 2 2
Downingia concolor 1 2 2 2 2 2 2 2 2 2 2Lasthenia glaberrima 1 2 3 3 3 2 3 2Eryngium aristulatum 2 2 2 2 1 2 2 2
Eleocharis macrostachya 2 2 3 2 2Lasthenia fremontii 3
Rumex crispus rLupinus bicolor
Anagalis arvensisCotula coronopifolia
Convolvulus arvensisHemizonia fitchiiBrodiaea elegans
Eremocarpus setigerusCentaurium muehlenbergii
Xanthium strumariumNavarretia squarrosaNavarretia intertexta
Lythrum hyssopifoliumEpilobium pygmaeum
Cyperus eragrostisGrasses
Pleuropogon californicus 1 2 2 2Hordeum murinum 2
Polypogon monspeliensisLolium multiflorum
Otherbare soil 2 3 3 2 2 2 3 2 1 1 3 2 2
2
3
Table 19. Species constancy in the Deep Zone on 04/19/02. Deep Zone
Constancy Table 041902 Vac1 Blocks Vac2 Soil ControlList of Species A1 B4 C3 A4 B1 C5 A2 B2 C2 A5 B5 C4 A3 B3 C1
Plagiobothrys stipitatus 3 3 3 2 3 3 2 2 3 3 3 2 2Psilocarphus brevissimus 3 3 2 2 3 3 2 2 2 2 2 2
Downingia concolor 1 2 2 2 2 2 2 2 2 1 2 2Eryngium aristulatum 2 3 2 3 2 2
Eleocharis macrostachya 2 2 2 1Lasthenia glaberrima 3 4 3Lasthenia fremontii
Rumex crispus Lupinus bicolor
Anagalis arvensisCotula coronopifolia
Convolvulus arvensisHemizonia fitchiiBrodiaea elegans
Eremocarpus setigerusCentaurium muehlenbergii
Xanthium strumariumNavarretia squarrosaNavarretia intertexta
Lythrum hyssopifoliumEpilobium pygmaeumCyperus eragrostis
GrassesPleuropogon californicus
Hordeum murinumPolypogon monspeliensis
Lolium multiflorumOther
bare soil 2 4 3 2 2 2 2 2 2 2 4 3 3 5 3
21
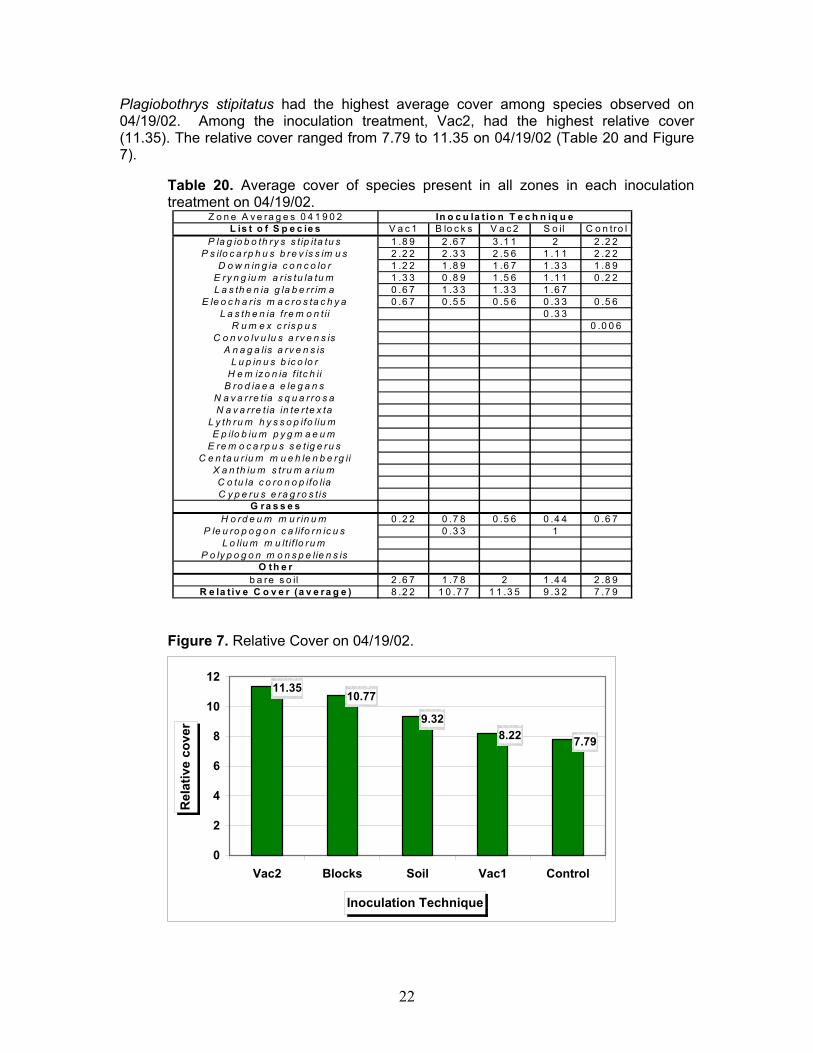
Plagiobothrys stipitatus had the highest average cover among species observed on 04/19/02. Among the inoculation treatment, Vac2, had the highest relative cover (11.35). The relative cover ranged from 7.79 to 11.35 on 04/19/02 (Table 20 and Figure 7).
Table 20. Average cover of species present in all zones in each inoculation treatment on 04/19/02.
Z o n e A v e ra g e s 0 4 1 9 0 2 In o c u la t io n T e c h n iq u eL is t o f S p e c ie s V a c 1 B lo c k s V a c 2 S o il C o n tro l
P la g io b o th ry s s t ip ita tu s 1 .8 9 2 .6 7 3 .1 1 2 2 .2 2P s ilo c a rp h u s b re v is s im u s 2 .2 2 2 .3 3 2 .5 6 1 .1 1 2 .2 2
D o w n in g ia c o n c o lo r 1 .2 2 1 .8 9 1 .6 7 1 .3 3 1 .8 9E ry n g iu m a r is tu la tu m 1 .3 3 0 .8 9 1 .5 6 1 .1 1 0 .2 2L a s th e n ia g la b e r r im a 0 .6 7 1 .3 3 1 .3 3 1 .6 7
E le o c h a r is m a c ro s ta c h y a 0 .6 7 0 .5 5 0 .5 6 0 .3 3 0 .5 6L a s th e n ia f re m o n tii 0 .3 3
R u m e x c r is p u s 0 .0 0 6C o n v o lv u lu s a rv e n s is
A n a g a lis a rv e n s isL u p in u s b ic o lo r
H e m iz o n ia f itc h iiB ro d ia e a e le g a n s
N a v a r re t ia s q u a r ro s aN a v a r re t ia in te r te x ta
L y th ru m h y s s o p ifo liu m E p ilo b iu m p y g m a e u m
E re m o c a rp u s s e t ig e ru sC e n ta u r iu m m u e h le n b e rg ii
X a n th iu m s tru m a r iu mC o tu la c o ro n o p ifo liaC y p e ru s e ra g ro s t is
G ra s s e sH o rd e u m m u r in u m 0 .2 2 0 .7 8 0 .5 6 0 .4 4 0 .6 7
P le u ro p o g o n c a lifo rn ic u s 0 .3 3 1L o liu m m u lt if lo ru m
P o ly p o g o n m o n s p e lie n s isO th e r
b a re s o il 2 .6 7 1 .7 8 2 1 .4 4 2 .8 9R e la t iv e C o v e r (a v e ra g e ) 8 .2 2 1 0 .7 7 1 1 .3 5 9 .3 2 7 .7 9
Figure 7. Relative Cover on 04/19/02.
7.798.229.32
10.7711.35
0
2
4
6
8
10
12
Vac2 Blocks Soil Vac1 Control
Inoculation Technique
Rel
ativ
e co
ver
22

Species Constancy in the Shallow, Middle, and Deep Zones on 05/01/02
There were fourteen plant species observed in the artificial pools on 05/01/02 (Tables 21-23). Downingia concolor, Psilocarphus brevissimus, and Plagiobothrys stipitatus were the most constant species in all the zones. In the shallow, middle, and deep zones, Psilocarphus brevissimus, Plagiobothrys stipitatus, and Downingia concolor had the greatest amount of relative cover. Plagiobothrys stipitatus grew in the middle zones of all the artificial pools. Lasthenia glaberrima grew in all zones, but was more successful in the middle zone. In the deep zone, there were areas of bare soil with concentric rings around the outer edge of Downingia concolor, Plagiobothrys stipitatus, and Psilocarphus brevissimus.
Table 21. Species constancy in the Shallow Zone on 05/01/02.
S h a llo w Z o n e C on s tan cy T a b le 0 50 10 2 V a c1 B lock s V ac2 S o il C on tro l
L is t o f S p e c ies A 1 B 4 C 3 A 4 B 1 C 5 A 2 B 2 C 2 A 5 B 5 C 4 A 3 B 3 C 1D o w n in g ia con co lo r 1 2 3 2 1 2 1 2 1 1 2 2 3 1
P lag iob o th rys s tip ita tus 1 2 2 2 3 t 1 2 2 2 1 3 2P s ilo ca rp hu s b rev iss im u s 2 3 2 3 1 3 2 4 2 2 3 3 2
E ryn g iu m a ris tu la tu m 1 2 2 1 2 2 2 1 1L as th en ia g la be rr im a 2 3 3 1 2 3 1
E leo ch a ris m ac ro s tach ya t 1 2 tR um ex c r isp us t 1Lu p in us b ico lo r r
C o tu la co ro no p ifo lia rH em izo n ia fitch ii 3
N ava rre tia in te rte x ta 3La s the n ia frem o n tiiA n a ga lis a rve ns is
C o nvo lvu lus a rve ns isB ro d ia ea e leg an s
E rem oca rp us se tige ru sC e n tau riu m m u eh le nb erg ii
X an th ium s trum ariumN avarre tia squ a rro sa
Ly th ru m hysso p ifo liu mE p ilob ium p yg m ae um
C ype ru s e rag ro s tisG ra ss es
H orde um m u rin um 2 2 2 3 2 3 4 2P le u rop og on ca lifo rn icus 3 3
Lo lium m u ltiflo rum 2P o lyp og on m on sp e lie ns is
O th erb are so il 2 2 2 2 2 2 2 2 2 1 1 3 2 2
Table 22. Species constancy in the Middle Zone on 05/01/02.
M id d le Z o n e C onstancy T ab le 050102 V ac1 B locks V ac2 S o il C on tro l
L is t o f S p ec ies A 1 B 4 C 3 A 4 B 1 C 5 A 2 B 2 C 2 A 5 B 5 C 4 A 3 B 3 C 1P lag iobo th rys s tip ita tus 2 3 3 3 3 2 2 3 3 2 3 4 2 2 3
P s iloca rphus b rev iss im us 3 1 2 2 3 3 2 3 3 2 1 2 2 3D ow n ing ia conco lo r 1 3 2 2 3 2 2 1 2 2 2 2 2
E ryng ium a ris tu la tum 2 2 2 2 1 2 2 2 1 2Las then ia g labe rr im a 1 3 3 3 3 3 3
E leocharis m acros tachya 2 2 2 1 2R um ex c rispus rH em izon ia fitch ii 3Lup inus b ico lo r
C o tu la co ronop ifo liaN ava rre tia in te rtex taLas then ia frem ontiiA naga lis a rvens is
C onvo lvu lus a rvens isB rod iaea e legans
E rem oca rpus se tige rusC entau rium m ueh lenberg ii
X an th ium s trum ariumN avarre tia squarrosa
Ly th rum hyssop ifo liumE p ilob ium pygm aeum
C ype rus e rag ros tisG rasses
P leuropogon ca lifo rn icus 1 2 2H ordeum m urinum t 2Lo lium m u ltiflo rum
P o lypogon m onspe liens isO th er
bare so il 2 3 2 2 2 2 3 2 2 2 1 2 3 2 2
3
23
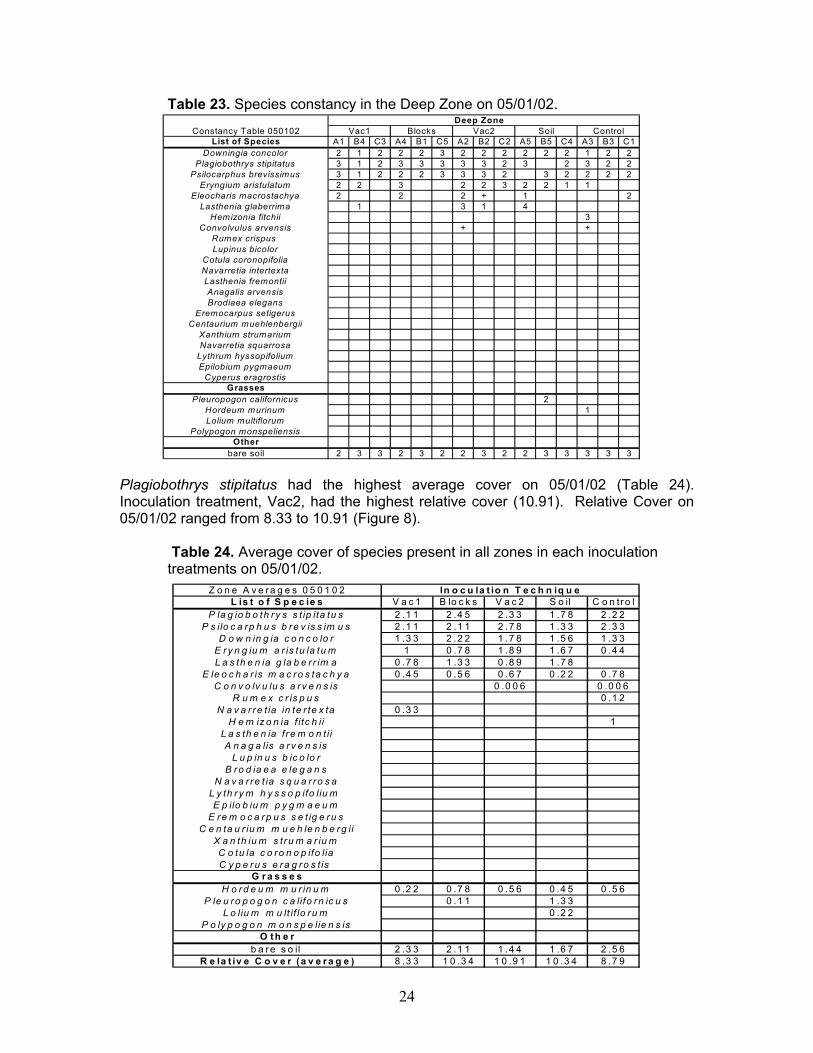
Table 23. Species constancy in the Deep Zone on 05/01/02. Deep Zone
Constancy Table 050102 Vac1 Blocks Vac2 Soil ControlList of Species A1 B4 C3 A4 B1 C5 A2 B2 C2 A5 B5 C4 A3 B3 C1
Downingia concolor 2 1 2 2 2 3 2 2 2 2 2 2 1 2 2Plagiobothrys stipitatus 3 1 2 3 3 3 3 3 2 3 2 3 2 2
Psilocarphus brevissimus 3 1 2 2 2 3 3 3 2 3 2 2 2 2Eryngium aristulatum 2 2 3 2 2 3 2 2 1 1
Eleocharis macrostachya 2 2 2 + 1Lasthenia glaberrima 1 3 1 4
Hemizonia fitchii 3Convolvulus arvensis + +
Rumex crispus Lupinus bicolor
Cotula coronopifoliaNavarretia intertextaLasthenia fremontiiAnagalis arvensisBrodiaea elegans
Eremocarpus setigerusCentaurium muehlenbergii
Xanthium strumariumNavarretia squarrosa
Lythrum hyssopifoliumEpilobium pygmaeum
Cyperus eragrostisGrasses
Pleuropogon californicus 2Hordeum murinum 1Lolium multiflorum
Polypogon monspeliensisOther
bare soil 2 3 3 2 3 2 2 3 2 2 3 3 3 3 3
2
Plagiobothrys stipitatus had the highest average cover on 05/01/02 (Table 24). Inoculation treatment, Vac2, had the highest relative cover (10.91). Relative Cover on 05/01/02 ranged from 8.33 to 10.91 (Figure 8).
Table 24. Average cover of species present in all zones in each inoculation treatments on 05/01/02.
Z o n e A v e ra g e s 0 5 0 1 0 2 In o c u la t io n T e c h n iq u eL is t o f S p e c ie s V a c 1 B lo c k s V a c 2 S o il C o n tro l
P la g io b o th ry s s t ip ita tu s 2 .1 1 2 .4 5 2 .3 3 1 .7 8 2 .2 2P s ilo c a rp h u s b re v is s im u s 2 .1 1 2 .1 1 2 .7 8 1 .3 3 2 .3 3
D o w n in g ia c o n c o lo r 1 .3 3 2 .2 2 1 .7 8 1 .5 6 1 .3 3E ry n g iu m a r is tu la tu m 1 0 .7 8 1 .8 9 1 .6 7 0 .4 4L a s th e n ia g la b e r r im a 0 .7 8 1 .3 3 0 .8 9 1 .7 8
E le o c h a r is m a c ro s ta c h y a 0 .4 5 0 .5 6 0 .6 7 0 .2 2 0 .7 8C o n v o lv u lu s a rv e n s is 0 .0 0 6 0 .0 0 6
R u m e x c r is p u s 0 .1 2N a v a r re t ia in te r te x ta 0 .3 3
H e m iz o n ia f itc h ii 1L a s th e n ia f r e m o n t iiA n a g a lis a r v e n s is
L u p in u s b ic o lo rB r o d ia e a e le g a n s
N a v a r re t ia s q u a r r o s aL y th r y m h y s s o p ifo liu m E p ilo b iu m p y g m a e u m
E re m o c a r p u s s e t ig e ru sC e n ta u r iu m m u e h le n b e r g ii
X a n th iu m s tru m a r iu mC o tu la c o ro n o p ifo liaC y p e ru s e ra g ro s t is
G r a s s e sH o rd e u m m u r in u m 0 .2 2 0 .7 8 0 .5 6 0 .4 5 0 .5 6
P le u ro p o g o n c a lifo rn ic u s 0 .1 1 1 .3 3L o liu m m u lt if lo ru m 0 .2 2
P o ly p o g o n m o n s p e lie n s isO th e r
b a re s o il 2 .3 3 2 .1 1 1 .4 4 1 .6 7 2 .5 6R e la t iv e C o v e r (a v e r a g e ) 8 .3 3 1 0 .3 4 1 0 .9 1 1 0 .3 4 8 .7 9
24

Figure 8. Relative Cover on 05/01/02.
8.338.79
10.3410.3410.91
0
2
4
6
8
10
12
Vac2 Blocks Soil Control Vac1
Inoculation Technique
Rel
ativ
e co
ver
Species Constancy in the Shallow, Middle, and Deep Zones on 06/05/02 We observed seventeen plant species in the artificial pools on 06/05/02 (Tables 25-27). The early blooming vernal pool species or flowering plants; Downingia concolor, Plagiobothrys stipitatus, and Lasthenia glaberrima, were no longer dominant in the artificial pools and the number of non-native grass species increased. The summer blooming species; Eremocarpus setigerus, Hemizonia fitchii, and Eryngium aristulatum increased in cover abundance in each zone. In the shallow and middle zones, the most constant species observed were Hemizonia fitchii and Psilocarphus brevissimus. In the deep zone, Psilocarphus brevissimus and Eryngium aristulatum had the highest constancy.
Table 25. Species constancy in the Shallow Zone on 06/05/02.
Shallow Zone Constancy Table 060502 Vac1 Blocks Vac2 Soil Control
List of Species A1 B4 C3 A4 B1 C5 A2 B2 C2 A5 B5 C4 A3 B3 C1Hemizonia fitchii 2 3 3 3 3 2 3 3 3 3
Psilocarphus brevissimus 2 2 2 2 2 t 2 2 1Eryngium aristulatum 3 2 3 2 2 3
Eremocarpus setigerus 2 1 2 2 2 2Convolvulus arvensis t t r 1 t t
Rumex crispus t t t t 1Epilobium pygmaeum 2 2 2
Centaurium muehlenbergii 2 tNavarretia intertexta 4
Eleocharis macrostachya 2Lythrum hyssopifolium 2
Cyperus eragrostis 1Navarretia squarrosa 1
Brodiaea elegans tDowningia concolor
Plagiobothrys stipitatusLasthenia glaberrima
Lupinus bicolorCotula coronopifoliaLasthenia fremontiiAnagalis arvensis
Xanthium strumariumGrasses
Hordeum murinum 3 3 2 3 3 2 3 3 3 3 2 3Pleuropogon californicus 3
Lolium multiflorum 2Polypogon monspeliensis
Otherbare soil 1 2 1 2 t 1 1 t 1 2 2 1 3 1 2
2
2
25

Table 26. Species constancy in the Middle Zone on 06/05/02. Middle Zone
Constancy Table 060502 Vac1 Blocks Vac2 Soil ControlList of Species A1 B4 C3 A4 B1 C5 A2 B2 C2 A5 B5 C4 A3 B3 C1
Psilocarphus brevissimus 2 2 1 2 3 2 2 2 1 1 t 1 2Hemizonia fitchii 2 3 3 1 3 3 2 3 4 1 2
Eryngium aristulatum 3 3 2 3 2 3 2 3 1Eremocarpus setigerus 2 3 3 2 2 3 3 2Epilobium pygmaeum 2 3 2 3 2 2 3 3
Eleocharis macrostachya 2 3 3 1 2 3Convolvulus arvensis t t 1 t t tLythrum hyssopifolium 1 2Plagiobothrys stipitatus 2
Rumex crispus tCyperus eragrostis 1
Centaurium muehlenbergiiNavarretia intertextaNavarretia squarrosa
Brodiaea elegansDowningia concolor
Lasthenia glaberrimaLupinus bicolor
Cotula coronopifoliaLasthenia fremontiiAnagalis arvensis
Xanthium strumariumGrasses
Hordeum murinum t 2Pleuropogon californicus 2
Lolium multiflorumPolypogon monspeliensis
Otherbare soil 2 3 3 3 2 2 2 1 2 3 2 1 2 2 2
3
Table 27. Species constancy in the Deep Zone on 06/05/02.
Deep Zone Constancy Table 060502 Vac1 Blocks Vac2 Soil Control
List of Species A1 B4 C3 A4 B1 C5 A2 B2 C2 A5 B5 C4 A3 B3 C1Psilocarphus brevissimus 1 2 2 2 3 2 2 1 2 1 2 1 1
Eryngium aristulatum 3 3 3 3 2 4 3 3 2 2Eremocarpus setigerus 2 2 2 3 3 2 3 3 2
Hemizonia fitchii 2 3 2 2 2 2 3 3Convolvulus arvensis t t t t 1 t t t
Plagiobothrys stipitatus 1 1 1 2 2 1Epilobium pygmaeum 2 2 2 3
Eleocharis macrostachya 2 2 3Cyperus eragrostis 1
Xanthium strumarium 1Lythrum hyssopifolium
Rumex crispus Centaurium muehlenbergii
Navarretia intertextaNavarretia squarrosa
Brodiaea elegansDowningia concolor
Lasthenia glaberrimaLupinus bicolor
Cotula coronopifoliaLasthenia fremontiiAnagalis arvensis
GrassesHordeum murinum 2
Pleuropogon californicusLolium multiflorum
Polypogon monspeliensisOther
bare soil 3 2 3 2 3 2 2 3 2 2 2 3 3 3 2
2
26
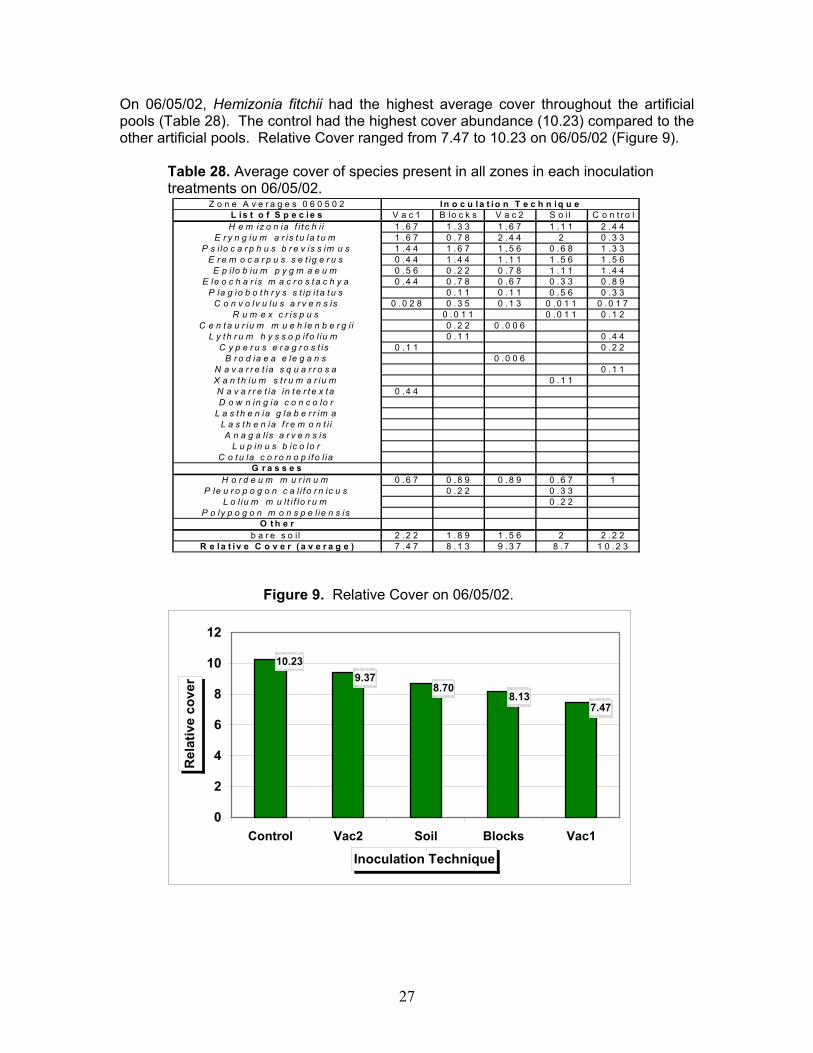
On 06/05/02, Hemizonia fitchii had the highest average cover throughout the artificial pools (Table 28). The control had the highest cover abundance (10.23) compared to the other artificial pools. Relative Cover ranged from 7.47 to 10.23 on 06/05/02 (Figure 9).
Table 28. Average cover of species present in all zones in each inoculation treatments on 06/05/02.
Z o n e A v e r a g e s 0 6 0 5 0 2 I n o c u la t io n T e c h n iq u eL is t o f S p e c ie s V a c 1 B lo c k s V a c 2 S o i l C o n t r o lH e m iz o n ia f i t c h i i 1 .6 7 1 .3 3 1 .6 7 1 .1 1 2 .4 4
E r y n g iu m a r is t u la tu m 1 .6 7 0 .7 8 2 .4 4 2 0 .3 3P s i lo c a r p h u s b r e v is s im u s 1 .4 4 1 .6 7 1 .5 6 0 .6 8 1 .3 3
E r e m o c a r p u s s e t ig e r u s 0 .4 4 1 .4 4 1 .1 1 1 .5 6 1 .5 6E p i lo b iu m p y g m a e u m 0 .5 6 0 .2 2 0 .7 8 1 .1 1 1 .4 4
E le o c h a r is m a c r o s t a c h y a 0 .4 4 0 .7 8 0 .6 7 0 .3 3 0 .8 9P la g io b o t h r y s s t ip i t a t u s 0 .1 1 0 .1 1 0 .5 6 0 .3 3
C o n v o lv u lu s a r v e n s is 0 .0 2 8 0 .3 5 0 .1 3 0 .0 1 1 0 .0 1 7R u m e x c r is p u s 0 .0 1 1 0 .0 1 1 0 .1 2
C e n ta u r iu m m u e h le n b e r g i i 0 .2 2 0 .0 0 6L y th r u m h y s s o p i f o l iu m 0 .1 1 0 .4 4
C y p e r u s e r a g r o s t is 0 .1 1 0 .2 2B r o d ia e a e le g a n s 0 .0 0 6
N a v a r r e t ia s q u a r r o s a 0 .1 1X a n th iu m s t r u m a r iu m 0 .1 1N a v a r r e t ia in t e r t e x ta 0 .4 4D o w n in g ia c o n c o lo r
L a s t h e n ia g la b e r r im aL a s th e n ia f r e m o n t i iA n a g a l is a r v e n s is
L u p in u s b ic o lo rC o t u la c o r o n o p i f o l ia
G r a s s e sH o r d e u m m u r in u m 0 .6 7 0 .8 9 0 .8 9 0 .6 7 1
P le u r o p o g o n c a l i f o r n ic u s 0 .2 2 0 .3 3L o l iu m m u lt i f lo r u m 0 .2 2
P o ly p o g o n m o n s p e l ie n s isO t h e r
b a r e s o i l 2 . 2 2 1 .8 9 1 .5 6 2 2 .2 2R e la t i v e C o v e r ( a v e r a g e ) 7 .4 7 8 .1 3 9 .3 7 8 .7 1 0 .2 3
Figure 9. Relative Cover on 06/05/02.
7.478.13
8.709.37
10.23
0
2
4
6
8
10
12
Control Vac2 Soil Blocks Vac1
Inoculation Technique
Rel
ativ
e co
ver
27
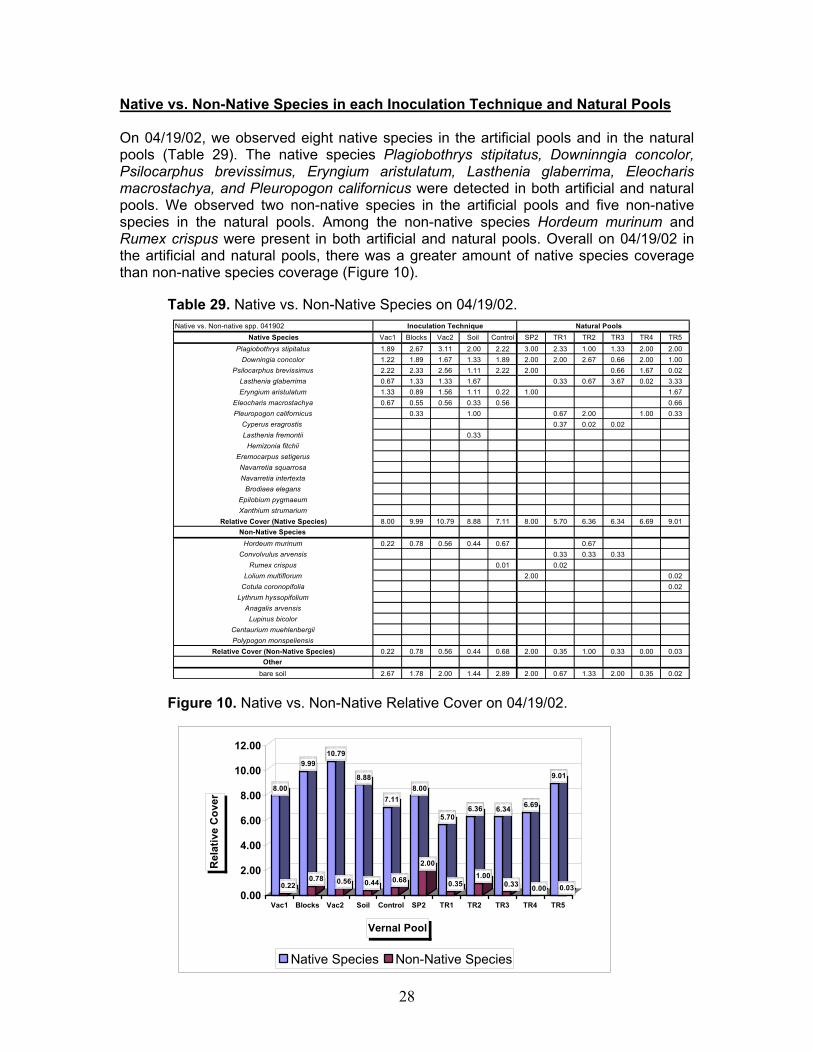
Native vs. Non-Native Species in each Inoculation Technique and Natural Pools On 04/19/02, we observed eight native species in the artificial pools and in the natural pools (Table 29). The native species Plagiobothrys stipitatus, Downinngia concolor, Psilocarphus brevissimus, Eryngium aristulatum, Lasthenia glaberrima, Eleocharis macrostachya, and Pleuropogon californicus were detected in both artificial and natural pools. We observed two non-native species in the artificial pools and five non-native species in the natural pools. Among the non-native species Hordeum murinum and Rumex crispus were present in both artificial and natural pools. Overall on 04/19/02 in the artificial and natural pools, there was a greater amount of native species coverage than non-native species coverage (Figure 10).
Table 29. Native vs. Non-Native Species on 04/19/02. Native vs. Non-native spp. 041902 Inoculation Technique Natural Pools
Native Species Vac1 Blocks Vac2 Soil Control SP2 TR1 TR2 TR3 TR4 TR5Plagiobothrys stipitatus 1.89 2.67 3.11 2.00 2.22 3.00 2.33 1.00 1.33 2.00 2.00
Downingia concolor 1.22 1.89 1.67 1.33 1.89 2.00 2.00 2.67 0.66 2.00 1.00Psilocarphus brevissimus 2.22 2.33 2.56 1.11 2.22 2.00 0.66 1.67 0.02
Lasthenia glaberrima 0.67 1.33 1.33 1.67 0.33 0.67 3.67 0.02 3.33Eryngium aristulatum 1.33 0.89 1.56 1.11 0.22 1.00 1.67
Eleocharis macrostachya 0.67 0.55 0.56 0.33 0.56 0.66Pleuropogon californicus 0.33 1.00 0.67 2.00 1.00 0.33
Cyperus eragrostis 0.37 0.02 0.02Lasthenia fremontii 0.33
Hemizonia fitchiiEremocarpus setigerusNavarretia squarrosaNavarretia intertexta
Brodiaea elegansEpilobium pygmaeumXanthium strumarium
Relative Cover (Native Species) 8.00 9.99 10.79 8.88 7.11 8.00 5.70 6.36 6.34 6.69 9.01Non-Native Species
Hordeum murinum 0.22 0.78 0.56 0.44 0.67 0.67Convolvulus arvensis 0.33 0.33 0.33
Rumex crispus 0.01 0.02Lolium multiflorum 2.00 0.02
Cotula coronopifolia 0.02Lythrum hyssopifolium
Anagalis arvensisLupinus bicolor
Centaurium muehlenbergiiPolypogon monspeliensis
Relative Cover (Non-Native Species) 0.22 0.78 0.56 0.44 0.68 2.00 0.35 1.00 0.33 0.00 0.03Other
bare soil 2.67 1.78 2.00 1.44 2.89 2.00 0.67 1.33 2.00 0.35 0.02
Figure 10. Native vs. Non-Native Relative Cover on 04/19/02.
8.00
0.22
9.99
0.78
10.79
0.56
8.88
0.44
7.11
0.68
8.00
2.00
5.70
0.35
6.36
1.00
6.34
0.33
6.69
0.00
9.01
0.030.00
2.00
4.00
6.00
8.00
10.00
12.00
Rel
ativ
e C
over
Vac1 Blocks Vac2 Soil Control SP2 TR1 TR2 TR3 TR4 TR5
Vernal Pool
Native Species Non-Native Species
28

On 05/01/02, we observed nine native species in the artificial pools and in the natural pools (Table 30). The native species Plagiobothrys stipitatus, Downinngia concolor, Psilocarphus brevissimus, Eryngium aristulatum, Lasthenia glaberrima, Eleocharis macrostachya, Navarretia intertexta, and Pleuropogon californicus, were detected in both artificial and natural pools. We observed four non-native species in the artificial pools and the same amount in the natural pools. Among the non-native species Hordeum murinum, Convolvulus arvensis, Rumex crispus, Lolium multiflorum were present in both artificial and natural pools. Overall on 05/01/02 in the artificial and natural pools, there was a greater amount of native species coverage than non-native species coverage (Figure 11).
Table 30. Native vs. Non-Native Species on 05/01/02.
Native vs . N on-native spp. 050102 Inoculation Technique Natural P oolsNative Species V ac1 B locks V ac2 S oil C ontrol SP2 TR1 TR2 TR3 TR 4 TR5
Plagiobothrys stipitatus 2.11 2.45 2.33 1.78 2.22 3.00 2.33 0.67 1.67 1.33 1.67D ow ningia concolor 1.33 2.22 1.78 1.56 1.33 2.00 2.00 3.00 2.00 0.67 1.33
Psilocarphus brev issim us 2.11 2.11 2.78 1.33 2.33 2.00 0.67 1.33Eryngium aris tu la tum 1.00 0.78 0.89 1.67 0.44 2.00 0.02 1.00Lasthenia glaberrim a 0.78 1.33 1.89 1.78 2.00 2.33 1.00
E leocharis m acrostachya 0.45 0.56 0.67 0.22 0.78 1.00Pleuropogon ca lifornicus 0.11 1.33 0.67 2.67 1.00 0.67
Cyperus eragrostis 0.33Navarretia in tertex ta 0.33 0.33
Hem izonia fitch ii 1.00Lasthenia frem ontii
E rem ocarpus setigerusNavarretia squarrosa
B rodiaea elegansEpilob ium pygm aeumXanthium strum arium
Relative C over (N ative Species) 8.11 9.56 10.34 9.67 8.10 9.00 7.33 6.67 6.67 4.35 6.67N on-Native S pecies
H ordeum m urinum 0.22 0.78 0.56 0.45 0.56 1.33 2.00 1.33 0.67Convolvu lus arvens is 0.01 0.01 0.02 0.05 0.03 0.03 0.02
R um ex crispus 0.12 0.02 0.02Cotu la coronopifolia 0.02 0.02Lolium m ultiflorum 0.22
Lythrum hyssopifolium 0.67A nagalis arvensis
Lupinus b ico lorCentaurium m uehlenberg iiPolypogon m onspeliens is
Relative C over (Non-N ative Species) 0.22 0.78 0.57 0.67 0.69 0.00 1.38 2.74 1.36 0.70 0.03O ther
bare soil 2 .33 2.11 1.44 1.67 2.56 2.00 1.00 1.33 2.00 1.33 0.03
Figure 11. Native vs. Non-Native Relative Cover on 05/01/02.
8.11
0.22
9.56
0.78
10.34
0.57
9.67
0.67
8.10
0.69
9.00
0.00
7.33
1.38
6.67
2.74
6.67
1.36
4.35
0.70
6.67
0.030.00
2.00
4.00
6.00
8.00
10.00
12.00
Rel
ativ
e C
over
Vac1 Blocks Vac2 Soil Control SP2 TR1 TR2 TR3 TR4 TR5
Vernal Pool
Native Species Non-Native Species
29
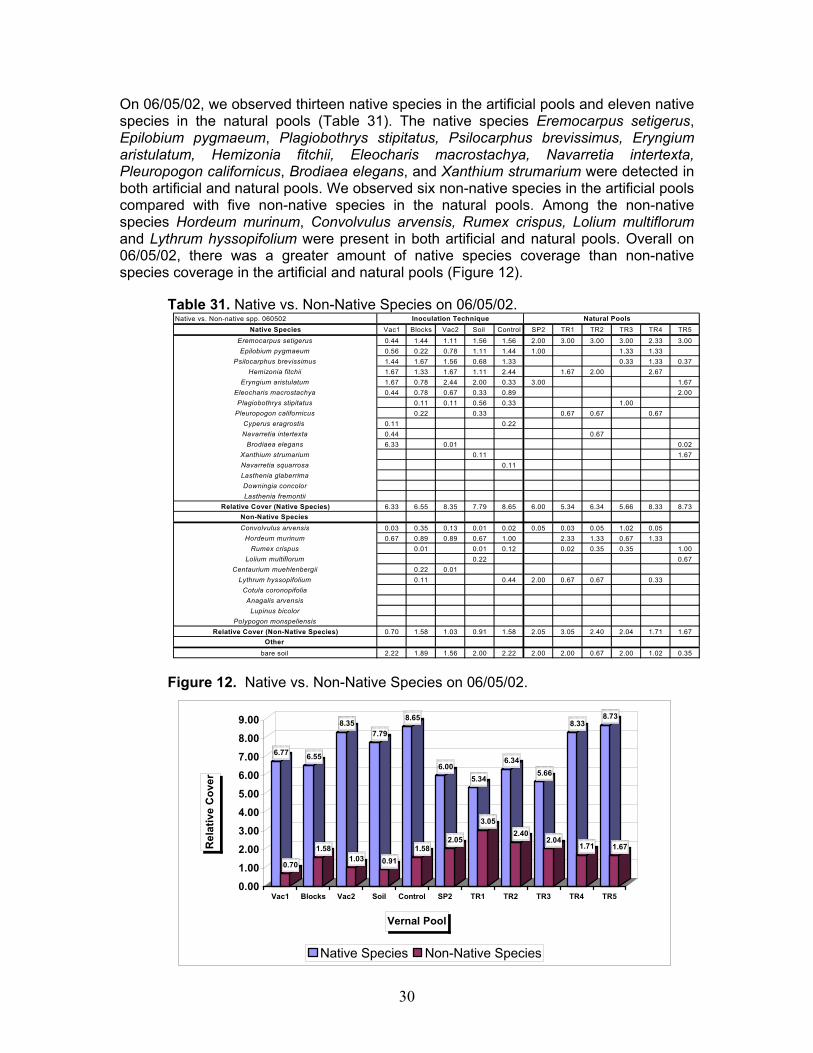
On 06/05/02, we observed thirteen native species in the artificial pools and eleven native species in the natural pools (Table 31). The native species Eremocarpus setigerus, Epilobium pygmaeum, Plagiobothrys stipitatus, Psilocarphus brevissimus, Eryngium aristulatum, Hemizonia fitchii, Eleocharis macrostachya, Navarretia intertexta, Pleuropogon californicus, Brodiaea elegans, and Xanthium strumarium were detected in both artificial and natural pools. We observed six non-native species in the artificial pools compared with five non-native species in the natural pools. Among the non-native species Hordeum murinum, Convolvulus arvensis, Rumex crispus, Lolium multiflorum and Lythrum hyssopifolium were present in both artificial and natural pools. Overall on 06/05/02, there was a greater amount of native species coverage than non-native species coverage in the artificial and natural pools (Figure 12). Table 31. Native vs. Non-Native Species on 06/05/02.
Native vs. Non-native spp. 060502 Inoculation Technique Natural PoolsNative Species Vac1 Blocks Vac2 Soil Control SP2 TR1 TR2 TR3 TR4 TR5
Eremocarpus setigerus 0.44 1.44 1.11 1.56 1.56 2.00 3.00 3.00 3.00 2.33 3.00Epilobium pygmaeum 0.56 0.22 0.78 1.11 1.44 1.00 1.33 1.33
Psilocarphus brevissimus 1.44 1.67 1.56 0.68 1.33 0.33 1.33 0.37Hemizonia fitchii 1.67 1.33 1.67 1.11 2.44 1.67 2.00 2.67
Eryngium aristulatum 1.67 0.78 2.44 2.00 0.33 3.00 1.67Eleocharis macrostachya 0.44 0.78 0.67 0.33 0.89 2.00Plagiobothrys stipitatus 0.11 0.11 0.56 0.33 1.00
Pleuropogon californicus 0.22 0.33 0.67 0.67 0.67Cyperus eragrostis 0.11 0.22Navarretia intertexta 0.44 0.67
Brodiaea elegans 6.33 0.01 0.02Xanthium strumarium 0.11 1.67Navarretia squarrosa 0.11Lasthenia glaberrimaDowningia concolorLasthenia fremontii
Relative Cover (Native Species) 6.33 6.55 8.35 7.79 8.65 6.00 5.34 6.34 5.66 8.33 8.73Non-Native Species Convolvulus arvensis 0.03 0.35 0.13 0.01 0.02 0.05 0.03 0.05 1.02 0.05
Hordeum murinum 0.67 0.89 0.89 0.67 1.00 2.33 1.33 0.67 1.33Rumex crispus 0.01 0.01 0.12 0.02 0.35 0.35 1.00
Lolium multiflorum 0.22 0.67Centaurium muehlenbergii 0.22 0.01
Lythrum hyssopifolium 0.11 0.44 2.00 0.67 0.67 0.33Cotula coronopifoliaAnagalis arvensis
Lupinus bicolorPolypogon monspeliensis
Relative Cover (Non-Native Species) 0.70 1.58 1.03 0.91 1.58 2.05 3.05 2.40 2.04 1.71 1.67Other
bare soil 2.22 1.89 1.56 2.00 2.22 2.00 2.00 0.67 2.00 1.02 0.35
Figure 12. Native vs. Non-Native Species on 06/05/02.
6.77
0.70
6.55
1.58
8.35
1.03
7.79
0.91
8.65
1.58
6.00
2.05
5.34
3.05
6.34
2.40
5.66
2.04
8.33
1.71
8.73
1.67
0.001.002.003.004.005.006.007.008.009.00
Rel
ativ
e C
over
Vac1 Blocks Vac2 Soil Control SP2 TR1 TR2 TR3 TR4 TR5
Vernal Pool
Native Species Non-Native Species
30

Native vs. Non-Native Species in the Source Pools vs. Artificial Pools On 04/19/02, we observed seven native species in the source pools and the same amount of native species in the artificial pools (Table 32). The native species Plagiobothrys stipitatus, Downinngia concolor, Psilocarphus brevissimus, Eryngium aristulatum, Lasthenia glaberrima, and Pleuropogon californicus were detected in both source and artificial pools. We observed three non-native species in the source pools and one non-native species in the artificial pools. Among the non-native species Hordeum murinum was observed in both artificial and source pools. Overall on 04/19/02 in the artificial and source pools, there was a greater amount of native species coverage than non-native species coverage (Figure 13).
Table 32. Native vs. Non-Native species in TR1-TR4 vs. C1-C5 on 04/19/02.
4/19/2002Native Species TR1 TR2 TR3 TR4 C1 C2 C3 C4 C5
Plagiobothrys stipitatus 2.33 1.00 1.33 2.00 2.33 2.33 2.00 2.67 2.67Downingia concolor 2.00 2.67 0.66 2.00 1.67 1.33 2.00 2.00 1.33
Psilocarphus brevissimus 0.66 1.67 2.00 3.00 3.00 2.00 2.67Pleuropogon californicus 0.67 2.00 1.00 0.67 0.67
Lasthenia glaberrima 0.33 0.67 3.67 0.02 3.00Eryngium aristulatum 0.02 2.00
Eleocharis macrostachya 1.00Cyperus eragrostis 0.37 0.02
Hemizonia fitchiiBrodiaea elegans
Eremocarpus setigerusNavarretia squarrosaXanthium strumarium
Lasthenia fremontiiNavarretia intertexta
Epilobium pygmaeumRelative Cover (Native Species) 5.70 6.36 6.34 6.69 7.00 8.66 7.00 10.34 7.34
Non-Native SpeciesHordeum murinum 0.67 0.67 1.00
Convolvulus arvensis 0.33 0.33 0.33Rumex crispus 0.02
Lolium multiflorumLythrum hyssopifolium
Cotula coronopifoliaAnagalis arvensis
Lupinus bicolorCentaurium muehlenbergiiPolypogon monspeliensis
Relative Cover (Non-Native Species) 0.35 1.00 0.33 0.00 0.67 0.00 0.00 0.00 1.00Other
bare soil 0.67 2.00 2.00 0.35 2.67 2.00 3.00 1.00 1.67Total Relative Cover 6.05 7.36 6.67 6.69 7.67 8.66 7.00 10.34 8.34
Figure 13. Native vs. Non-Native Relative Cover in TR1-TR4 and C1-C5 04/19/02.
5 . 7 0
0 . 3 5
6 . 3 6
1. 0 0
6 . 3 4
0 . 3 3
6 . 6 9
0 . 0 0
7 . 0 0
0 . 6 7
8 . 6 6
0 . 0 0
7 . 0 0
0 . 0 0
10 . 3 4
0 . 0 0
7 . 3 4
1. 0 0
0.00
2.00
4.00
6.00
8.00
10.00
12.00
Rel
ativ
e C
over
TR1 TR2 TR3 TR4 C1 C2 C3 C4 C5
Vernal Pool
Native Species Non-Native Species
31

On 05/01/02, we observed eight native species in the source pools and the same amount in the artificial pools (Table 33). The native species Plagiobothrys stipitatus, Downinngia concolor, Psilocarphus brevissimus, Eryngium aristulatum, Lasthenia glaberrima, Navarretia intertexta, and Pleuropogon californicus, were observed in both artificial and source pools. We observed five non-native species in the source pools compared with two non-native species in the artificial pools. Among the non-native species Hordeum and Rumex crispus were present in both artificial and source pools. Overall on 05/01/02 in the source and artificial pools, there was a greater amount of native species cover than non-native species cover (Figure 14).
Table 33. Native vs. Non-Native species in TR1-TR4 vs. C1-C5 on 05/01/02.
5/1/2002Native Species TR1 TR2 TR3 TR4 C1 C2 C3 C4 C5
Plagiobothrys stipitatus 2.33 0.67 1.67 1.33 2.33 2.33 2.33 2.00 1.68Downingia concolor 2.00 3.00 2.00 0.67 1.67 1.67 1.67 2.00 2.33
Psilocarphus brevissimus 0.67 1.33 2.33 3.00 2.00 1.67 2.33Pleuropogon californicus 0.67 2.67 1.00 1.00
Eryngium aristulatum 0.02 0.33 2.33 1.00Lasthenia glaberrima 2.00 2.33 0.33Navarretia intertexta 0.33 1.00
Eleocharis macrostachya 1.67Cyperus eragrostis 0.33
Hemizonia fitchiiBrodiaea elegans
Eremocarpus setigerusNavarretia squarrosaXanthium strumarium
Lasthenia fremontiiEpilobium pygmaeum
Relative Cover (Native Species) 7.33 6.67 6.67 4.35 8.33 9.33 7.00 8.00 6.34Non-Native SpeciesHordeum murinum 1.33 2.00 1.33 0.67 0.02 1.00
Convolvulus arvensis 0.02 0.05 0.03 0.03Rumex crispus 0.02 0.33
Cotula coronopifolia 0.02 0.02Lythrum hyssopifolium 0.67
Lolium multiflorumAnagalis arvensis
Lupinus bicolorCentaurium muehlenbergiiPolypogon monspeliensis
Relative Cover (Non-Native Species) 1.39 2.74 1.36 0.70 0.33 0.00 0.00 0.02 1.00Other
bare soil 1.00 1.33 2.00 1.33 2.33 2.00 2.33 2.00 2.00Total Relative Cover 8.72 9.41 8.03 5.05 8.66 9.33 7.00 8.02 7.34
Figure 14. Native vs. Non-Native Relative Cover in TR1-TR4 and C1-C5 05/01/02.
7.33
1.39
6.67
2.74
6.67
1.36
4.35
0.70
8.33
0.33
9.33
0.00
7.00
0.00
8.00
0.02
6.34
1.00
0.001.002.003.004.005.006.007.008.009.00
10.00
Rel
ativ
e C
over
TR1 TR2 TR3 TR4 C1 C2 C3 C4 C5
Vernal Pool
Native Species Non-Native Species
32
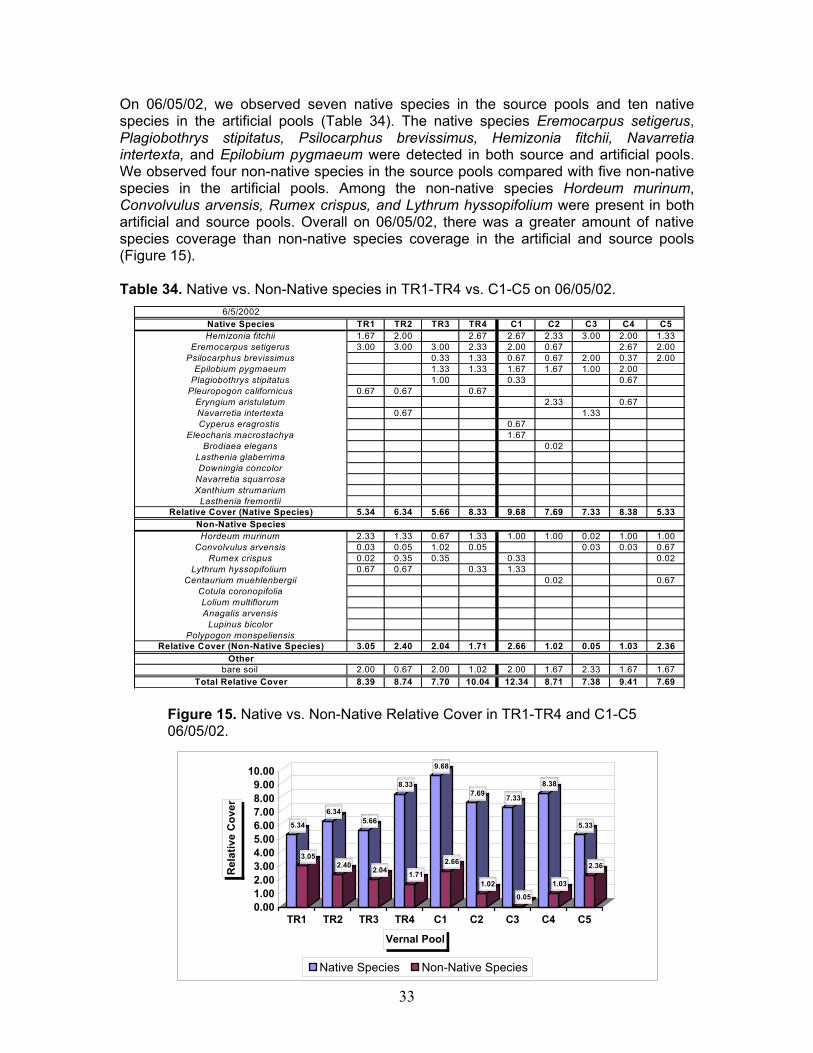
On 06/05/02, we observed seven native species in the source pools and ten native species in the artificial pools (Table 34). The native species Eremocarpus setigerus, Plagiobothrys stipitatus, Psilocarphus brevissimus, Hemizonia fitchii, Navarretia intertexta, and Epilobium pygmaeum were detected in both source and artificial pools. We observed four non-native species in the source pools compared with five non-native species in the artificial pools. Among the non-native species Hordeum murinum, Convolvulus arvensis, Rumex crispus, and Lythrum hyssopifolium were present in both artificial and source pools. Overall on 06/05/02, there was a greater amount of native species coverage than non-native species coverage in the artificial and source pools (Figure 15).
Table 34. Native vs. Non-Native species in TR1-TR4 vs. C1-C5 on 06/05/02.
6/5/2002Native Species TR1 TR2 TR3 TR4 C1 C2 C3 C4 C5Hemizonia fitchii 1.67 2.00 2.67 2.67 2.33 3.00 2.00 1.33
Eremocarpus setigerus 3.00 3.00 3.00 2.33 2.00 0.67 2.67 2.00Psilocarphus brevissimus 0.33 1.33 0.67 0.67 2.00 0.37 2.00
Epilobium pygmaeum 1.33 1.33 1.67 1.67 1.00 2.00Plagiobothrys stipitatus 1.00 0.33 0.67
Pleuropogon californicus 0.67 0.67 0.67Eryngium aristulatum 2.33 0.67Navarretia intertexta 0.67 1.33Cyperus eragrostis 0.67
Eleocharis macrostachya 1.67Brodiaea elegans 0.02
Lasthenia glaberrimaDowningia concolor
Navarretia squarrosaXanthium strumarium
Lasthenia fremontiiRelative Cover (Native Species) 5.34 6.34 5.66 8.33 9.68 7.69 7.33 8.38 5.33
Non-Native SpeciesHordeum murinum 2.33 1.33 0.67 1.33 1.00 1.00 0.02 1.00 1.00
Convolvulus arvensis 0.03 0.05 1.02 0.05 0.03 0.03 0.67Rumex crispus 0.02 0.35 0.35 0.33 0.02
Lythrum hyssopifolium 0.67 0.67 0.33 1.33Centaurium muehlenbergii 0.02 0.67
Cotula coronopifoliaLolium multiflorumAnagalis arvensis
Lupinus bicolorPolypogon monspeliensis
Relative Cover (Non-Native Species) 3.05 2.40 2.04 1.71 2.66 1.02 0.05 1.03 2.36Other
bare soil 2.00 0.67 2.00 1.02 2.00 1.67 2.33 1.67 1.67Total Relative Cover 8.39 8.74 7.70 10.04 12.34 8.71 7.38 9.41 7.69
Figure 15. Native vs. Non-Native Relative Cover in TR1-TR4 and C1-C5 06/05/02.
5.34
3.05
6.34
2.40
5.66
2.04
8.33
1.71
9.68
2.66
7.69
1.02
7.33
0.05
8.38
1.03
5.33
2.36
0.001.002.003.004.005.006.007.008.009.00
10.00
Rel
ativ
e C
over
TR1 TR2 TR3 TR4 C1 C2 C3 C4 C5
Vernal Pool
Native Species Non-Native Species
33

On 04/19/02, we observed seven native species in the source pool TR5 compared with eight native species in the artificial pools A1-A5 (Table 35). The native species Plagiobothrys stipitatus, Downinngia concolor, Psilocarphus brevissimus, Eryngium aristulatum, Lasthenia glaberrima, Pleuropogon californicus, and Eleocharis macrostachya were detected in both source and artificial pools. There was a greater amount of native species coverage than non-native species coverage in TR5 and A1-A5 (Figure 16).
Table 35. Native vs. Non-Native species in TR5 vs. A1-A5 on 04/19/02.
4 /1 9 /2 0 0 2 V e rn a l P o o lN a tiv e S p e c ie s T R 5 A 1 A 2 A 3 A 4 A 5
P la g io b o th ry s s tip ita tu s 2 .0 0 2 .0 0 2 .0 0 2 .0 0 2 .6 7 1 .6 7E ry n g iu m a r is tu la tu m 1 .6 7 2 .0 0 2 .0 0 0 .6 7 2 .3 3 2 .0 0D o w n in g ia c o n c o lo r 1 .0 0 3 .0 0 2 .0 0 1 .6 7 2 .3 3 1 .6 7
P s ilo c a rp h u s b re v is s im u s 0 .0 2 2 .6 7 2 .6 7 2 .3 3 1 .6 7L a s th e n ia g la b e rr im a 3 .3 3 0 .3 3 2 .6 7 2 .0 0 2 .0 0
E le o c h a r is m a c ro s ta c h y a 0 .6 7 2 .0 0 1 .6 7 1 .6 7 1 .0 0P le u ro p o g o n c a lifo rn ic u s 0 .3 3 0 .6 7
L a s th e n ia fre m o n tii 1 .0 0H e m izo n ia f itc h ii
B ro d ia e a e le g a n sN a v a rre tia s q u a rro s aN a v a rre tia in te r te x ta
E p ilo b iu m p y g m a e u mE re m o c a rp u s s e tig e ru sX a n th iu m s tru m a r iu mC y p e ru s e ra g ro s tis
R e la t iv e C o v e r (N a tiv e S p e c ie s ) 9 .0 2 1 2 .0 0 1 3 .0 1 6 .6 7 1 2 .6 7 1 0 .0 1N o n -N a t iv e S p e c ie s
H o rd e u m m u r in u m 0 .6 7 0 .6 7 1 .3 3 0 .6 7 1 .3 3R u m e x c r is p u s 0 .0 2
C o n v o lv u lu s a rv e n s isL y th ru m h y s s o p ifo liu m
C o tu la c o ro n o p ifo liaA n a g a lis a rv e n s is
L u p in u s b ic o lo rC e n ta u r iu m m u e h le n b e rg ii
L o liu m m u lt if lo ru mP o ly p o g o n m o n s p e lie n s is
R e la t iv e C o v e r (N o n -N a t iv e S p e c ie s ) 0 .0 0 0 .6 7 0 .6 7 1 .3 5 0 .6 7 1 .3 3O th e r
b a re s o il 0 .0 2 2 .0 0 2 .6 7 3 .0 0 2 .0 0 1 .3 3T o ta l R e la t iv e C o v e r 9 .0 2 1 2 .6 7 1 3 .6 8 8 .0 2 1 3 .3 4 1 1 .3 4
Figure 16. Native vs. Non-Native Relative Cover in TR5 and A1-A5 04/19/02.
9.02
0.00
12.00
0.67
13.01
0.67
6.67
1.35
12.67
0.67
10.01
1.33
0.00
2.00
4.00
6.00
8.00
10.00
12.00
14.00
Rel
ativ
e C
over
TR5 A1 A2 A3 A4 A5
Vernal Pool
Native Species Non-Native Species
34

On 05/01/02, we observed six native species in the source pool TR5 and eight native species in the artificial pools A1-A5 (Table 36). The native species Plagiobothrys stipitatus, Downinngia concolor, Eryngium aristulatum, Lasthenia glaberrima, Eleocharis macrostachya, and Pleuropogon californicus were observed in both artificial and source pools. We observed two non-native species in the source pools compared with four non-native species in the artificial pools. Among the non-native species Convolvulus arvensis and Rumex crispus were present in both artificial and source pools. Overall on 05/01/02 in the source and artificial pools, there was a greater amount of native species coverage than non-native species coverage (Figure 17).
Table 36. Native vs. Non-Native species in TR5 vs. A1-A5 on 05/01/02.
5 /1 /2 0 0 2 V e r n a l P o o lN a t iv e S p e c ie s T R 5 A 1 A 2 A 3 A 4 A 5
P la g io b o th ry s s t ip ita tu s 1 .6 7 2 .0 0 2 .0 0 2 .0 0 2 .6 7 1 .6 7E ry n g iu m a r is tu la tu m 1 .0 0 1 .3 3 2 .0 0 1 .0 0 2 .3 3 2 .0 0D o w n in g ia c o n c o lo r 1 .3 3 1 .3 3 2 .0 0 1 .6 7 2 .3 3 1 .6 7
L a s th e n ia g la b e r r im a 1 .0 0 0 .3 3 2 .0 0 2 .0 0 3 .0 0E le o c h a r is m a c ro s ta c h y a 1 .0 0 1 .3 5 2 .0 0 1 .6 7 0 .6 7P s ilo c a rp h u s b re v is s im u s 2 .6 7 2 .6 7 2 .3 3 1 .3 3P le u ro p o g o n c a lifo rn ic u s 0 .6 7 0 .6 7
H e m iz o n ia f itc h ii 3 .0 0L a s th e n ia f re m o n t iiB ro d ia e a e le g a n s
N a v a r re t ia s q u a r ro s aN a v a r re t ia in te r te x ta
E p ilo b iu m p y g m a e u mE re m o c a rp u s s e t ig e ru s
X a n th iu m s tru m a r iu mC y p e ru s e ra g ro s t is
R e la t iv e C o v e r (N a t iv e S p e c ie s ) 6 .6 7 9 .0 1 1 2 .6 7 1 0 .0 0 1 2 .3 3 9 .6 8N o n -N a t iv e S p e c ie s
H o rd e u m m u r in u m 0 .6 7 0 .6 7 2 .0 0 0 .6 7 1 .3 3C o n v o lv u lu s a rv e n s is 0 .0 2 0 .0 2 0 .0 2
R u m e x c r is p u s 0 .0 2 0 .0 2L o liu m m u lt if lo ru m 0 .6 7
L y th ru m h y s s o p ifo liu m C o tu la c o ro n o p ifo lia
A n a g a lis a rv e n s isL u p in u s b ic o lo r
C e n ta u r iu m m u e h le n b e rg iiP o ly p o g o n m o n s p e lie n s is
R e la t iv e C o v e r (N o n -N a t iv e S p e c ie s ) 0 .0 4 0 .6 7 0 .6 9 2 .0 4 0 .6 7 2 .0 0O th e r
b a re s o il 0 .0 3 2 .0 0 2 .3 3 3 .0 0 2 .0 0 1 .6 7T o ta l R e la t iv e C o v e r 6 .7 1 9 .6 8 1 3 .3 6 1 2 .0 4 1 3 .0 0 1 1 .6 8
Figure 17. Native vs. Non-Native Relative Cover in TR5 and A1-A5 05/01/02.
6 .6 7
0 .0 4
9 .0 1
0 .6 7
12 .6 7
0 .6 9
10 .0 0
2 .0 4
12 .3 3
0 .6 7
9 .6 8
2 .0 0
0.00
2.00
4.00
6.00
8.00
10.00
12.00
14.00
Rel
ativ
e C
over
TR5 A1 A2 A3 A4 A5
Vernal Pool
Native Species Non-Nat ive Species
35

On 06/05/02, we observed six native species in the source pool TR5, and eight native species in the artificial pools A1-A5 (Table 37). The native species Psilocarphus brevissimus, Eryngium aristulatum, Eleocharis macrostachya, Xanthium strumarium were detected in both source and artificial pools. We observed two non-native species in the source pools compared with four non-native species in the artificial pools. Among the non-native species Rumex crispus and Lolium multiflorum were present in both artificial and natural pools. Overall on 06/05/02, there was a greater amount of native species coverage than non-native species coverage in the artificial and source pools (Figure 18).
Table 37. Native vs. Non-Native species in TR5 vs. A1-A5 on 06/05/02.
6 /5 /2 0 0 2 V e r n a l P o o lN a t iv e S p e c ie s T R 5 A 1 A 2 A 3 A 4 A 5
E ry n g iu m a r is tu la tu m 1 .6 7 3 .0 0 3 .0 0 1 .0 0 2 .3 3 2 .3 3P s ilo c a rp h u s b re v is s im u s 0 .3 7 2 .0 0 2 .0 0 1 .6 7 1 .0 0 0 .6 7E le o c h a r is m a c ro s ta c h y a 2 .0 0 1 .3 3 2 .0 0 2 .3 3 0 .3 3
X a n th iu m s tr u m a r iu m 1 .6 7 0 .3 3D o w n in g ia c o n c o lo r 0 .6 7 0 .6 7
H e m iz o n ia f itc h ii 3 .3 3P la g io b o th ry s s t ip ita tu s 0 .3 3
B ro d ia e a e le g a n s 0 .0 2E re m o c a rp u s s e t ig e ru s 3 .0 0
C y p e ru s e ra g ro s t is 0 .3 3N a v a r re t ia s q u a r ro s a
P le u ro p o g o n c a lifo rn ic u sL a s th e n ia f re m o n t ii
N a v a r re t ia in te r te x taE p ilo b iu m p y g m a e u mL a s th e n ia g la b e r r im a
R e la t iv e C o v e r (N a t iv e S p e c ie s ) 8 .7 3 6 .6 6 7 .0 0 6 .0 0 6 .3 3 4 .6 6N o n -N a t iv e S p e c ie s
H o rd e u m m u r in u m 3 .0 0 0 .6 7 2 .0 0 0 .6 7 1 .0 0C o n v o lv u lu s a rv e n s is 0 .0 3 0 .3 7 0 .0 3 0 .0 3
R u m e x c r is p u s 1 .0 0 0 .0 2L o liu m m u lt if lo ru m 0 .6 7 0 .6 7
L y th ru m h y s s o p ifo liu m C o tu la c o ro n o p ifo lia
A n a g a lis a rv e n s isL u p in u s b ic o lo r
C e n ta u r iu m m u e h le n b e rg iiP o ly p o g o n m o n s p e lie n s is
R e la t iv e C o v e r (N o n -N a t iv e S p e c ie s ) 1 .6 7 3 .0 3 1 .0 4 2 .0 5 0 .7 0 1 .6 7O th e r
b a re s o il 0 .3 5 2 .0 0 1 .6 7 2 .6 7 2 .3 3 2 .3 3T o ta l R e la t iv e C o v e r 1 0 .4 0 9 .6 9 8 .0 4 8 .0 5 7 .0 3 6 .3 3
Figure 18. Native vs. Non-Native Relative Cover in TR5 and A1-A5 06/05/02.
8.73
1.67
6.66
3.03
7.00
1.04
6.00
2.05
6.33
0.70
4.66
1.67
0.001.002.003.004.005.006.007.008.009.00
Rel
ativ
e C
over
TR5 A1 A2 A3 A4 A5
Vernal Pool
Native Species Non-Native Species
36

Data Comparison 2001 vs. 2002
Plagiobothrys stipitatus, Downinngia concolor, Psilocarphus brevissimus, Eryngium aristulatum, Lasthenia glaberrima, and Hordeum murinum were detected in 04/26/01 and 04/19/02 (Table 38). Eleocharis macrostachya was observed in 2002, but absent in 2001. It appears that there was a larger group of non-native species like; Convolvulus arvensis, Anagalis arvensis, Lupinus bicolor, and Erodium botrys in 2001, which did not appear in 2002. Overall the month of April displayed greater amounts of relative cover in both years. The inoculation technique Vac2 had the highest relative cover in both 2001 and 2002 (Figure 19).
Table 38. 04/26/01 vs. 04/19/02.
Zone Averages 042601 vs. 041902List of Species Vac1 Blocks Vac2 Soil Control Vac1 Blocks Vac2 Soil Control
Plagiobothrys stipitatus 2.01 2.56 1.44 2.11 1.67 1.89 2.67 3.11 2.00 2.22Psilocarphus brevissimus 1.89 0.67 2.56 0.56 2.67 2.22 2.33 2.56 1.11 2.22
Eryngium aristulatum 0.56 0.33 0.45 0.67 0.11 1.33 0.89 1.56 1.11 0.22Downingia concolor 0.11 0.22 0.12 0.22 0.12 1.22 1.89 1.67 1.33 1.89
Lasthenia glaberrima 0.78 1.34 0.89 2.22 0.67 1.33 1.33 1.67Eleocharis macrostachya 0.67 0.55 0.56 0.33 0.56
Erodium botrys 0.11 0.22 0.11 0.12Convolvulus arvensis 0.22 0.01 0.12 0.12
Anagalis arvensis 0.11 0.11Lupinus bicolor 0.11 0.11
Lasthenia fremontii 0.33Rumex crispus 0.01
Hemizonia fitchii 0.11Brodiaea elegans
Navarretia squarrosaNavarretia intertexta
Lythrum hyssopifoliumEpilobium pygmaeum
Eremocarpus setigerusCentaurium muehlenbergii
Xanthium strumariumCotula coronopifoliaCyperus eragrostis
GrassesHordeum murinum 0.56 1.11 1.11 0.44 1.00 0.22 0.78 0.56 0.44 0.67
Pleuropogon californicus 0.33 1.00Lolium multiflorum
Polypogon monspeliensisOther
bare soil 2.22 1.00 1.89 1.22 2.22 2.67 1.78 2.00 1.44 2.89Relative Cover (average) 6.24 6.79 7.02 6.34 5.69 8.22 10.77 11.35 9.32 7.79
2001 Inoculation Techniques 2002 Inoculation Techniques
Figure 19. Relative Cover of each inoculation technique 04/26/01 vs. 04/19/02.
7.02
11.35
6.79
10.77
6.34
9.32
6.24
8.22
5.69
7.79
0
2
4
6
8
10
12
Rel
ativ
e C
over
Vac2 Blocks Soil Vac1 Control
Inoculation Techniques
4/26/2001 4/19/2002
37
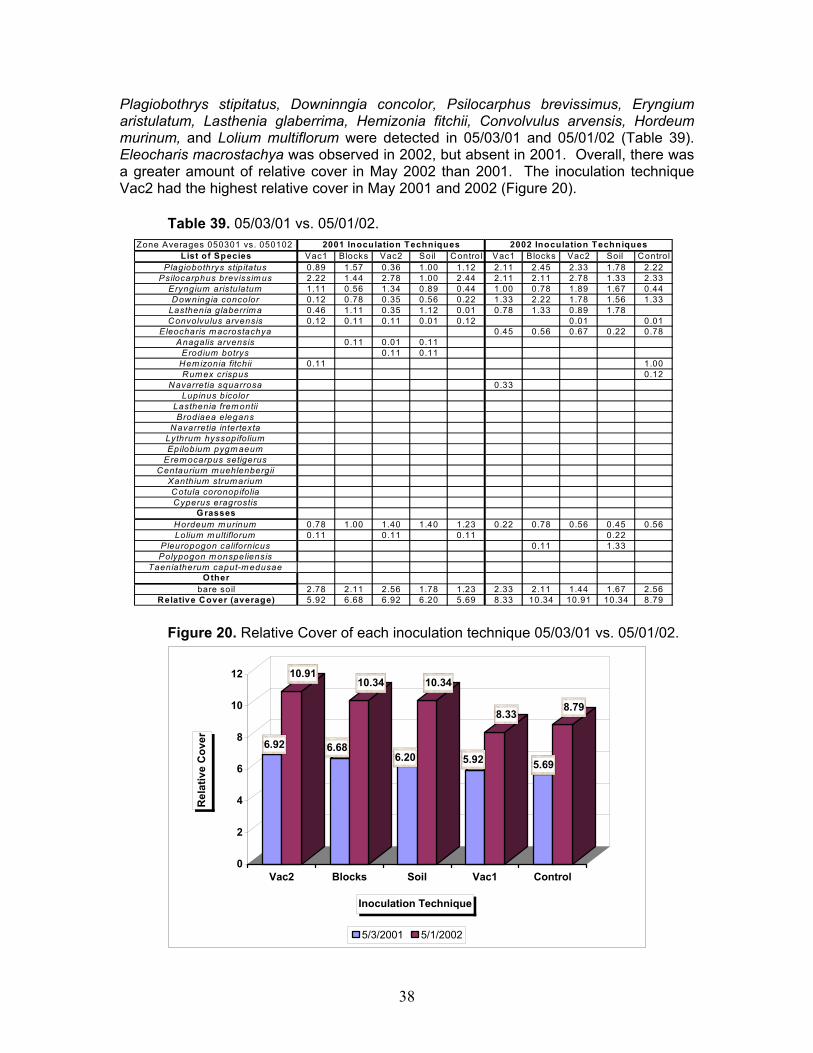
Plagiobothrys stipitatus, Downinngia concolor, Psilocarphus brevissimus, Eryngium aristulatum, Lasthenia glaberrima, Hemizonia fitchii, Convolvulus arvensis, Hordeum murinum, and Lolium multiflorum were detected in 05/03/01 and 05/01/02 (Table 39). Eleocharis macrostachya was observed in 2002, but absent in 2001. Overall, there was a greater amount of relative cover in May 2002 than 2001. The inoculation technique Vac2 had the highest relative cover in May 2001 and 2002 (Figure 20).
Table 39. 05/03/01 vs. 05/01/02.
Zone Averages 050301 vs. 050102List of Species Vac1 Blocks Vac2 Soil Control Vac1 Blocks Vac2 Soil Control
Plagiobothrys stipitatus 0.89 1.57 0.36 1.00 1.12 2.11 2.45 2.33 1.78 2.22Psilocarphus brevissim us 2.22 1.44 2.78 1.00 2.44 2.11 2.11 2.78 1.33 2.33
Eryngium aristulatum 1.11 0.56 1.34 0.89 0.44 1.00 0.78 1.89 1.67 0.44Downingia concolor 0.12 0.78 0.35 0.56 0.22 1.33 2.22 1.78 1.56 1.33
Lasthenia glaberrim a 0.46 1.11 0.35 1.12 0.01 0.78 1.33 0.89 1.78Convolvulus arvensis 0.12 0.11 0.11 0.01 0.12 0.01 0.01
Eleocharis m acrostachya 0.45 0.56 0.67 0.22 0.78Anagalis arvensis 0.11 0.01 0.11
Erodium botrys 0.11 0.11Hem izonia fitchii 0.11 1.00Rum ex crispus 0.12
Navarretia squarrosa 0.33Lupinus bicolor
Lasthenia frem ontiiBrodiaea elegans
Navarretia intertextaLythrum hyssopifoliumEpilobium pygm aeum
Erem ocarpus setigerusCentaurium m uehlenbergii
Xanthium strum ariumCotula coronopifoliaCyperus eragrostis
G rassesHordeum m urinum 0.78 1.00 1.40 1.40 1.23 0.22 0.78 0.56 0.45 0.56Lolium m ultiflorum 0.11 0.11 0.11 0.22
Pleuropogon californicus 0.11 1.33Polypogon m onspeliensis
Taeniatherum caput-m edusaeO ther
bare soil 2.78 2.11 2.56 1.78 1.23 2.33 2.11 1.44 1.67 2.56Relative Cover (average) 5.92 6.68 6.92 6.20 5.69 8.33 10.34 10.91 10.34 8.79
2001 Inoculation Techniques 2002 Inoculation Techniques
Figure 20. Relative Cover of each inoculation technique 05/03/01 vs. 05/01/02.
6.92
10.91
6.68
10.34
6.20
10.34
5.92
8.33
5.69
8.79
0
2
4
6
8
10
12
Rel
ativ
e C
over
Vac2 Blocks Soil Vac1 Control
Inoculation Technique
5/3/2001 5/1/2002
38
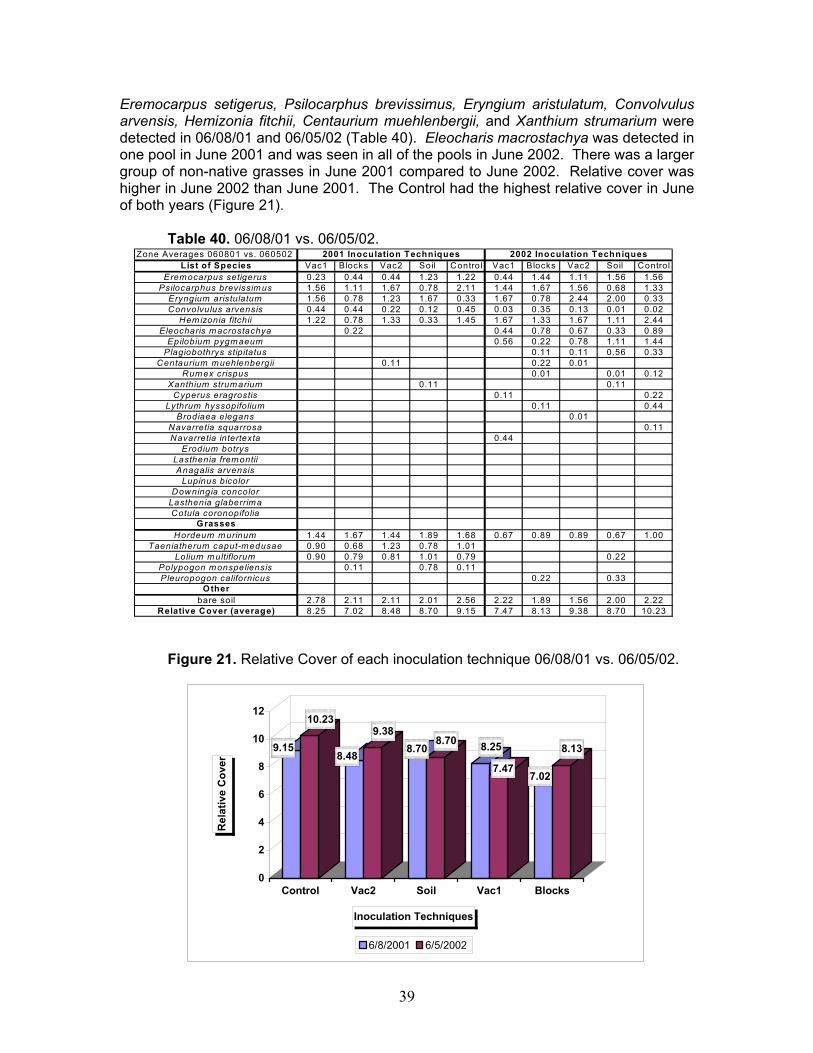
Eremocarpus setigerus, Psilocarphus brevissimus, Eryngium aristulatum, Convolvulus arvensis, Hemizonia fitchii, Centaurium muehlenbergii, and Xanthium strumarium were detected in 06/08/01 and 06/05/02 (Table 40). Eleocharis macrostachya was detected in one pool in June 2001 and was seen in all of the pools in June 2002. There was a larger group of non-native grasses in June 2001 compared to June 2002. Relative cover was higher in June 2002 than June 2001. The Control had the highest relative cover in June of both years (Figure 21).
Table 40. 06/08/01 vs. 06/05/02.
Zone Averages 060801 vs. 060502List of Species Vac1 Blocks Vac2 Soil Control Vac1 Blocks Vac2 Soil Control
Eremocarpus setigerus 0.23 0.44 0.44 1.23 1.22 0.44 1.44 1.11 1.56 1.56Psilocarphus brevissimus 1.56 1.11 1.67 0.78 2.11 1.44 1.67 1.56 0.68 1.33
Eryngium aristulatum 1.56 0.78 1.23 1.67 0.33 1.67 0.78 2.44 2.00 0.33Convolvulus arvensis 0.44 0.44 0.22 0.12 0.45 0.03 0.35 0.13 0.01 0.02
Hemizonia fitchii 1.22 0.78 1.33 0.33 1.45 1.67 1.33 1.67 1.11 2.44Eleocharis macrostachya 0.22 0.44 0.78 0.67 0.33 0.89
Epilobium pygmaeum 0.56 0.22 0.78 1.11 1.44Plagiobothrys stipitatus 0.11 0.11 0.56 0.33
Centaurium muehlenbergii 0.11 0.22 0.01Rumex crispus 0.01 0.01 0.12
Xanthium strumarium 0.11 0.11Cyperus eragrostis 0.11 0.22
Lythrum hyssopifolium 0.11 0.44Brodiaea elegans 0.01
Navarretia squarrosa 0.11Navarretia intertexta 0.44
Erodium botrysLasthenia fremontiiAnagalis arvensis
Lupinus bicolorDowningia concolor
Lasthenia glaberrimaCotula coronopifolia
GrassesHordeum murinum 1.44 1.67 1.44 1.89 1.68 0.67 0.89 0.89 0.67 1.00
Taeniatherum caput-medusae 0.90 0.68 1.23 0.78 1.01Lolium multiflorum 0.90 0.79 0.81 1.01 0.79 0.22
Polypogon monspeliensis 0.11 0.78 0.11Pleuropogon californicus 0.22 0.33
Otherbare soil 2.78 2.11 2.11 2.01 2.56 2.22 1.89 1.56 2.00 2.22
Relative Cover (average) 8.25 7.02 8.48 8.70 9.15 7.47 8.13 9.38 8.70 10.23
2001 Inoculation Techniques 2002 Inoculation Techniques
Figure 21. Relative Cover of each inoculation technique 06/08/01 vs. 06/05/02.
9.15
10.23
8.48
9.388.70
8.70 8.25
7.477.02
8.13
0
2
4
6
8
10
12
Rel
ativ
e C
over
Control Vac2 Soil Vac1 Blocks
Inoculation Techniques
6/8/2001 6/5/2002
39

VEGETATION CONCLUSIONS The following conclusions are based on the observations made in Spring 2001 and Spring 2002. The 2001 season had low rainfall than the 2002 season producing short inundation periods in both artificial and natural pools.
1. The overall pattern of vegetation growth in the artificial pools is strongly influenced by the pools’ design. The artificial pools were constructed with a downhill slope, a deep end of 80 cm and side slopes graded to 30 degrees. This design resulted in a lack of vegetation on the side slopes. Artificial pools have been designed with gentle slopes that are more likely to have vegetated slopes (De Weese, 1998).
2. The artificial pools are generally deeper than the natural pools. Inundation
periods tend to be longer in the deeper artificial pools than in the shallower natural pools. Plagiobothrys stipitatus dominates the deeper zones in most of the artificial pools, but is absent in the shallower natural pools TR16 and SP1. De Weese (1998) observed a shift in species cover in artificial vernal pools starting in the third year after construction, or sometimes sooner. Species preferring longer inundation periods expanded their cover in artificial pools that she surveyed.
3. There was a shift in the vegetation zones in the artificial pools from 2001 – 2002.
The deep zone species of 2001 shifted to the middle zone in 2002 due to the higher rainfall and longer inundation periods. In the deep zones of some of the artificial pools the longer inundation periods in 2002 created a bare soil zone in the bottom of the pools. Concentric rings of vegetation grew around the outer edges of the bare zones. Species producing distinct rings included Downingia concolor, Plagiobothrys stipitatus, Lasthenia glaberrima, and Psilocarphus brevissimus, (photo 3 and photo 4)
Photo 5. Artificial Pool B4 on 04/26/01.
40

Photo 6. Artificial Pool B4 on 04/19/02. 4. Species varied from year to year in the artificial and source pools. There were
species present in 2002 that were absent in 2001. New species observed in 2002 Navarretia squarrosa, Epilobium pygmaeum, Lythrum hyssopifolium, Navarretia intertexta. This year to year variation was also apparent in Northen, Holve-Hensill and Eakins, 1998.
5. In 2001, the non-native grass species grew in greater cover abundance in the
artificial pools than in the natural pools. Hordeum murinum, Lolium multiflorum, and Taeniatherum caput-medusae successfully invaded the shallow to middle zones of all the artificial pools.
6. In 2002, invasive species such as Hordeum murinum, Convolvulus arvensis, and
Anagalis arvensis, in the artificial pools had lower amounts of relative cover than in 2001. The higher rainfall and longer inundation periods in 2002 appear to have limited the invasive species and benefited the native species that are present in the artificial pools.
7. Psilocarphus brevissimus grew best in areas with little competition from other
species. In some of our artificial pools Psilocarphus brevissimus dominated the deeper zones in the absence of Plagiobothrys stipitatus. This is evident by Plagiobothrys stipitatus growing significantly higher in the deep zones where little or no amounts of Psilocarphus brevissimus were apparent.
41

8. Vac2 out performed the other inoculation treatments in terms of native versus non-native relative cover. The Blocks, Soil, and Control treatments had greater amounts of non-native species compared to Vac2. In Northen, Holve-Hensill and Eakins report, the Soil treatment out performed Vac2 and Blocks (Northen, Holve-Hensill and Eakins, 1998).
9. After eight years, vegetation spread is limited in the Blocks treatment. The
Blocks treatment appears to be the least desirable inoculation treatment.
Photo 7. Artificial Pool A4 on 04/10/01with arrows indicating limited growth.
10. Although the artificial and source pool have similar species. Both the source and the artificial pools appear to be losing diversity over time. The fencing of the source and artificial pools is interfering with a disturbance regime that is needed for the self-sustainability of the pools. The artificial pools appear to have lost plant species since 1996. From 1993 – 1996 Northen, Holve-Hensill and Eakins concluded that out of twenty-four native wetland plants, sixteen showed good to high coverage in the artificial pools (Northen, Holve-Hensill and Eakins, 1998). In 2001, we observed fourteen native species in the artificial pools with seven native species having good coverage.
11. A group of native species Plagiobothrys stipitatus, Lasthenia glaberrima,
Downingia concolor, Psilocarphus brevissimus, and Eryngium aristulatum dominated the deep and middle zones of the artificial pools. At this point in time these species appear to form a vernal pool community type for the research site at Travis AFB.
12. During each individual year there is a shift from early appearing species to late
appearing species. For instance, Downingia concolor and Lasthenia glaberrima were apparent early in the season (April, May) and disappeared later in the season (June, July). Compared to Hemizonia fitchii and Eremocarpus setigerus, which grew significantly in the late season (June through August). Therefore, it is useful to make several visits during an individual year to the same pool to gather vegetation data to help to insure that all plant species in a pool are identified.
42

VEGETATION DISCUSSION Artificial Pool Design During our study, we concluded that the vegetation present in artificial pools appears to be, in part, dependent upon the design of the pool. The increased depth of the artificial pools at Travis AFB led to longer inundation periods when compared to the natural pools, which have shallower depths and shorter inundation periods. Plagiobothrys stipitatus dominated the deeper zones in most of the artificial pools, but is absent in the shallower natural pools TR16 and SP1 (Photo 6). De Weese (1996) observed that starting in the third year and sometimes sooner, there is a shift in species cover, with species preferring longer inundation periods becoming more dominant. The artificial pools were constructed with a downhill slope, a deep end of 80 cm and side slopes graded to 30 degrees. This design resulted in a lack of vegetation on the side slopes. In recent years artificial pools have been designed with gentle slopes that are more likely to have vegetated slopes (De Weese, 1998). We recommend that the construction of artificial pools should mimic natural pools being generally round and having gentle slopes inward to the center. Originally, the plan at Travis AFB was to flatten the side slopes after the research was completed. In the CSU Fresno study, there were two types of artificial pool designs, swale-like and bowl-like. The swale-like pools were relatively shallow, 8-12 inches deep, and were constructed so that water collected against a levee and backed up with additional precipitation (Stebbins, Brownell, Trayler 1996). Bowl-like pools were deeper, 12-18 inches and as the name implies sloped towards the center of the pool rather than towards a single side (Stebbins, Brownell, Trayler 1996). The CSU Fresno study also found that pool design influenced the success of specific vernal pool plants. Bowl-like pools of moderate depth and intermediate type pools that fill earlier and hold water longer seem to be a more appropriate for many plant species, including Orcuttia species than shallower pools(Stebbins, Brownell, Trayler 1996).
Photo 8. Closeup of B2 deep zone on 04/26/01.
43
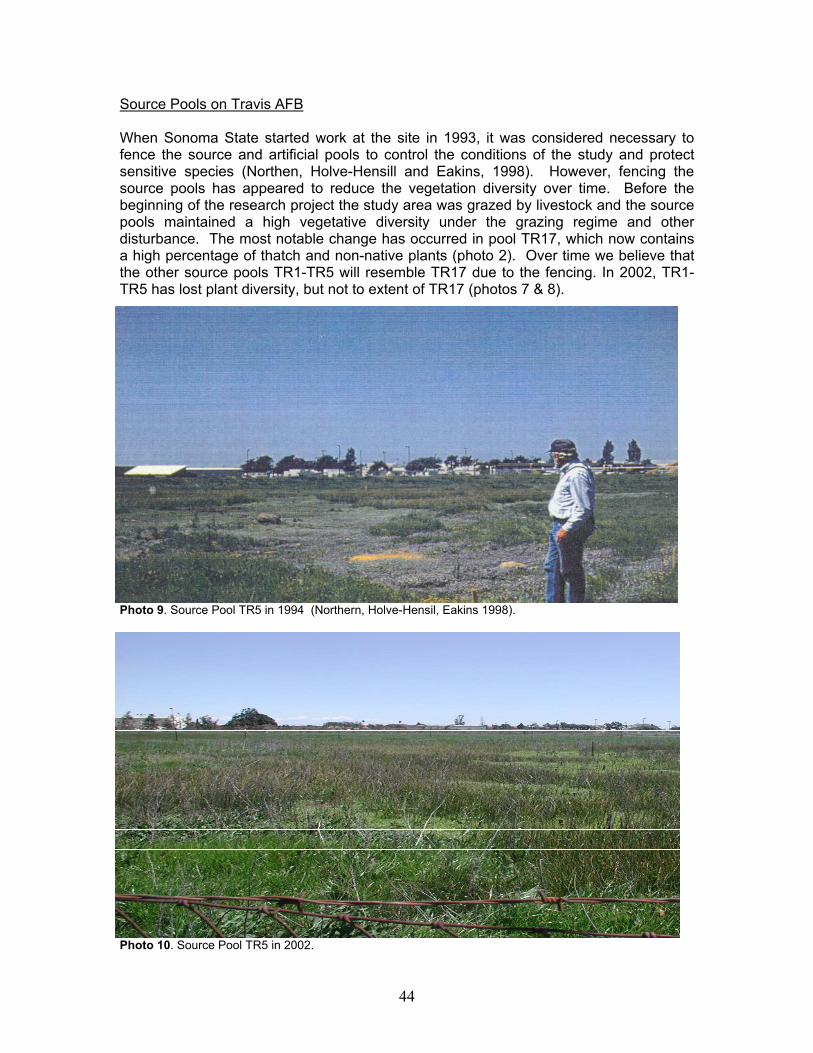
Source Pools on Travis AFB When Sonoma State started work at the site in 1993, it was considered necessary to fence the source and artificial pools to control the conditions of the study and protect sensitive species (Northen, Holve-Hensill and Eakins, 1998). However, fencing the source pools has appeared to reduce the vegetation diversity over time. Before the beginning of the research project the study area was grazed by livestock and the source pools maintained a high vegetative diversity under the grazing regime and other disturbance. The most notable change has occurred in pool TR17, which now contains a high percentage of thatch and non-native plants (photo 2). Over time we believe that the other source pools TR1-TR5 will resemble TR17 due to the fencing. In 2002, TR1-TR5 has lost plant diversity, but not to extent of TR17 (photos 7 & 8).
Photo 9. Source Pool TR5 in 1994 (Northern, Holve-Hensil, Eakins 1998).
Photo 10. Source Pool TR5 in 2002.
44
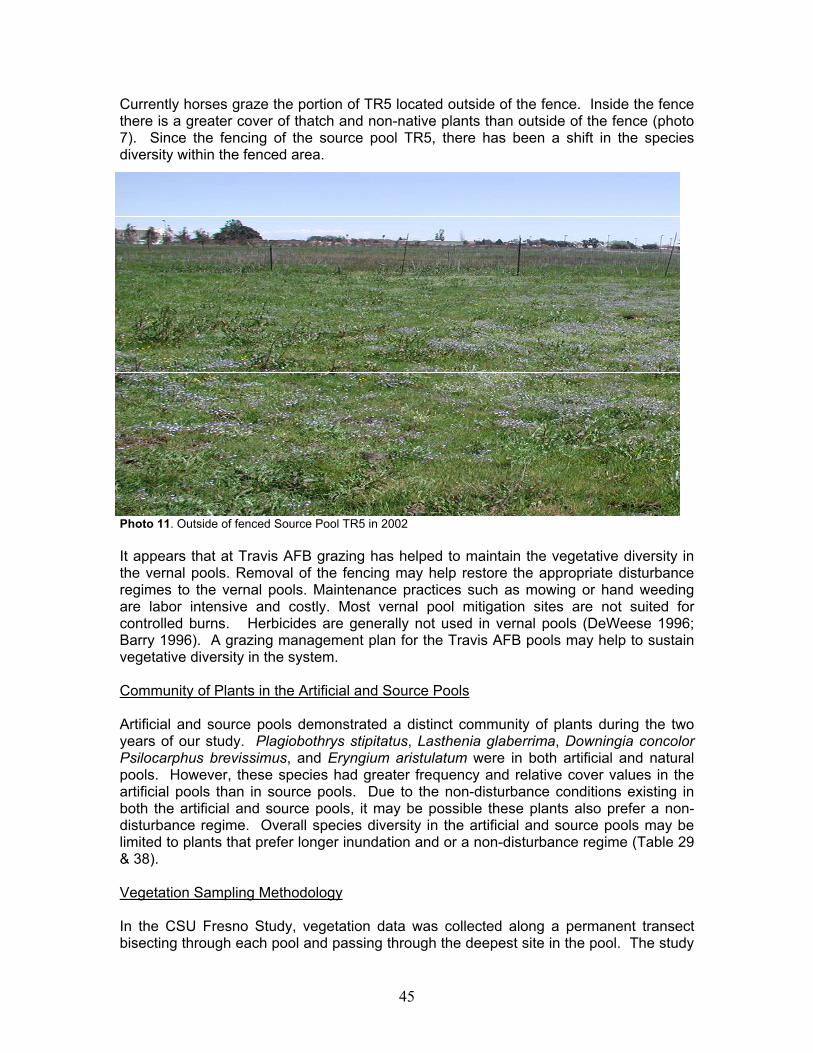
Currently horses graze the portion of TR5 located outside of the fence. Inside the fence there is a greater cover of thatch and non-native plants than outside of the fence (photo 7). Since the fencing of the source pool TR5, there has been a shift in the species diversity within the fenced area.
Photo 11. Outside of fenced Source Pool TR5 in 2002 It appears that at Travis AFB grazing has helped to maintain the vegetative diversity in the vernal pools. Removal of the fencing may help restore the appropriate disturbance regimes to the vernal pools. Maintenance practices such as mowing or hand weeding are labor intensive and costly. Most vernal pool mitigation sites are not suited for controlled burns. Herbicides are generally not used in vernal pools (DeWeese 1996; Barry 1996). A grazing management plan for the Travis AFB pools may help to sustain vegetative diversity in the system. Community of Plants in the Artificial and Source Pools Artificial and source pools demonstrated a distinct community of plants during the two years of our study. Plagiobothrys stipitatus, Lasthenia glaberrima, Downingia concolor Psilocarphus brevissimus, and Eryngium aristulatum were in both artificial and natural pools. However, these species had greater frequency and relative cover values in the artificial pools than in source pools. Due to the non-disturbance conditions existing in both the artificial and source pools, it may be possible these plants also prefer a non-disturbance regime. Overall species diversity in the artificial and source pools may be limited to plants that prefer longer inundation and or a non-disturbance regime (Table 29 & 38). Vegetation Sampling Methodology In the CSU Fresno Study, vegetation data was collected along a permanent transect bisecting through each pool and passing through the deepest site in the pool. The study
45

concluded two distinct problems with this type of sampling method. First, during the collection of data along the transect soil and vegetation were disturbed. Secondly, the permanent transects through the deepest part of the pool limited the sampling method by excluding the zonation of vernal pool plants. In many cases data collection along the transect did not include species that were present in high numbers but were limited in distribution or present in broken rings (Stebbins, Brownell, Trayler 1996). To help avoid the second shortcoming during our study, we divided the artificial pool into deep, middle, and shallow zones. During data collection each artificial pool had a deep, middle, and shallow zone data plot. The data collected in the three plots produced a view of the characteristics of the artificial pools without neglecting the zonation of our artificial pools. Long-term studies are needed to collect sufficient data to conclude the vegetative success of the vernal pools. For example, in the two years of our study we observed some different species in the vernal pools on Travis AFB. Several years of sampling may be necessary to truly characterize a pool. In determining if an area contains vernal pool plants, a single visit during any given year may not be sufficient to identify all species. There is a shift from early blooming species to late blooming species in the Travis AFB vernal pools. Downingia concolor and Lasthenia glaberrima were apparent early in the season and absent later in the season. In contrast Hemizonia fitchii and Eremocarpus setigerus, grew significantly in the late season. It may not be appropriate to visit a vernal pool system in the later part of the season to determine its vegetative classification. The amount of rainfall in a season can play a role in the apparent vegetation during an individual year in a vernal pool system. In the first year (2001) of our study, there was a lower amount of rainfall producing shorter inundation periods than in 2002. In 2002 the pools had a higher amount of relative cover and fewer invasive grasses than in 2001. Vegetation in a drought season can be different than a season with sufficient rainfall. A digital camera can provide a series of electronic images allowing proper identification of plant species, estimates of percent cover, and analysis of other vegetation characteristics. Although the series of electronic images provides an accurate record, researchers must be cautious when identifying individual plant species. Close-ups, samples and careful analysis must be used to remove any potential errors when identifying individual plant species.
46

HYDROLOGY Vernal pools are seasonal wetlands occurring in shallow depressions over a substrate that limits water percolation. During the winter rainy season water accumulates in the pools and remains present for a variable period of time depending on such factors as: rainfall, evaporation, volume of the pool and permeability of the underlying layer. Pools remain inundated for periods ranging from a few days to several months. It is this seasonal inundation and drying that creates the physical habitat conditions in which the vernal pool biota lives. Therefore, to restore or replicate vernal pool conditions to a site, seasonal inundation must be developed and maintained. The Travis AFB vernal pool study is primarily a vegetation study. In the original design only limited consideration was given to hydrology. The Sonoma State team used water depth measurements to determine zones for vegetation analysis. They measured the water depth in the artificial pools at each meter point from a sampling baseline at approximately two-week intervals during the 1995/1996 rainy season. Additionally, invertebrate collectors noted the presence or absence of surface water during collections in all years of the original study (Northen, Holve-Hensill and Eakins, 1998). Hydrology Methods
For the present study we visited the natural and artificial pools at Travis AFB in February 15, 2000, January 2001 through July 2001 and January 2002 through July 2002. On each visit we recorded electronic images of each pool to document the presence or absence of surface water. Surface water presence or absence data from Northen, Holve-Hensill and Eakins for the 1993/1994, 1994/1995 and 1995/1996 rainy seasons was compared to the 2000/2001 and 2001/2002 data. Hydrology Results Tables 41-43 summarize the inundation data derived from Northen, Holve-Hensill and Eakins. Table 44 summarizes the inundation data from the rainy season of 2000/2001. Table 45 summarizes the inundation data from the rainy season of 2001/2002. Table 46 summarizes the rainfall in the nearby city of Fairfield from 1993/1994 to 2001/2002. On tables 41-45; Yes indicates standing water was present, while No indicates the absence of standing water in the pool on the date.
On 02/15/2000 all of the pools, both natural and artificial, contained surface water. On 02/01/2001 none of the pools contained surface water. On 03/01/2001 all of the pools, both natural and artificial, contained surface water. No pools contained surface water on or after 04/26/01. The smaller natural pools SP1, SP2, TR14 and TR15 contained no surface water by 03/22/01. The large pool TR17 contained surface water through 03/22/01, but was dry by 03/29/01. TR16 contained no surface water by 04/01/01.
47

Table 41. Presence of Surface Water in Travis Pools for the 1993/1994 Rainy Season.
Yes = standing water was present in the pool on the date indicated. No = no standing water was present in the pool on the date indicated.
Table 42. Presence of Surface Water in Travis Pools for the 1994/1995 Rainy Season.
Yes = standing water was present in the pool on the date indicated. No = no standing water was present in the pool on the date indicated.
Date 12/17 12/29 1/16 1/30 2/13 2/25 3/11 3/26 4/8 4/21 5/7
Yes Yes Yes Yes Yes Yes Yes Yes Yes Yes Yes A-2 Yes Yes Yes Yes Yes Yes Yes Yes Yes Yes Yes A-3 Yes Yes Yes Yes Yes No Yes Yes Yes No No A-4 Yes Yes Yes Yes Yes Yes Yes Yes Yes Yes Yes A-5 Yes Yes Yes Yes Yes Yes Yes Yes Yes No No B-1 Yes Yes Yes Yes Yes Yes Yes Yes Yes Yes Yes B-2 Yes Yes Yes Yes Yes Yes Yes Yes Yes Yes Yes B-3 Yes Yes Yes Yes Yes Yes Yes Yes Yes Yes Yes B-4 Yes Yes Yes Yes Yes Yes Yes Yes Yes Yes No B-5 Yes Yes Yes Yes Yes Yes Yes Yes Yes Yes Yes C-1 Yes Yes Yes Yes Yes Yes Yes Yes Yes Yes Yes C-2 Yes Yes Yes Yes Yes Yes Yes Yes Yes Yes No C-3 Yes Yes Yes Yes Yes Yes Yes Yes Yes Yes No C-4 Yes Yes Yes Yes Yes Yes Yes Yes Yes Yes No C-5 Yes Yes Yes Yes Yes Yes Yes Yes Yes Yes Yes TR17 Yes Yes Yes Yes Yes Yes Yes Yes Yes No No
Pool A-1
Pool A-1
Date 2/4 2/18 3/4 3/18 4/1 4/15 4/22 4/30 5/14
Yes Yes Yes Yes Yes Yes Yes Yes Yes A-2 Yes Yes Yes Yes Yes Yes Yes Yes Yes A-3 Yes Yes Yes No No No No No No A-4 Yes Yes Yes Yes Yes Yes Yes Yes Yes A-5 Yes Yes Yes Yes Yes Yes Yes Yes Yes B-1 Yes Yes Yes Yes Yes Yes Yes Yes Yes B-2 Yes Yes Yes Yes Yes Yes Yes Yes Yes B-3 Yes Yes Yes Yes Yes Yes Yes Yes Yes B-4 Yes Yes Yes Yes No No No No No B-5 Yes Yes Yes Yes Yes Yes Yes Yes Yes C-1 Yes Yes Yes Yes Yes Yes Yes Yes Yes C-2 Yes Yes Yes Yes Yes Yes Yes Yes No C-3 Yes Yes Yes Yes Yes Yes Yes Yes Yes C-4 Yes Yes Yes Yes Yes Yes Yes Yes Yes C-5 Yes Yes Yes Yes Yes Yes Yes Yes Yes TR17 No Yes Yes No No No No No No
48

Table 43. Presence of Surface Water in Travis Pools for the 1995/1996 Rainy Season.
Date 12/16 12/30 1/14 1/28 2/11 2/25 3/10 3/24 4/6 4/21
Yes Yes Yes Yes Yes Yes Yes Yes Yes Yes A-2 Yes Yes Yes Yes Yes Yes Yes Yes Yes Yes A-3 Yes Yes Yes Yes Yes Yes Yes Yes Yes No A-4 Yes Yes Yes Yes Yes Yes Yes Yes Yes Yes A-5 Yes Yes Yes Yes Yes Yes Yes Yes Yes No B-1 Yes Yes Yes Yes Yes Yes Yes Yes Yes Yes B-2 Yes Yes Yes Yes Yes Yes Yes Yes Yes Yes B-3 Yes Yes Yes Yes Yes Yes Yes Yes Yes Yes B-4 Yes Yes Yes Yes Yes Yes Yes Yes Yes Yes B-5 Yes Yes Yes Yes Yes Yes Yes Yes Yes Yes C-1 Yes Yes Yes Yes Yes Yes Yes Yes Yes Yes C-2 Yes Yes Yes Yes Yes Yes Yes Yes Yes Yes C-3 Yes Yes Yes Yes Yes Yes Yes Yes Yes Yes C-4 Yes Yes Yes Yes Yes Yes Yes Yes Yes Yes C-5 Yes Yes Yes Yes Yes Yes Yes Yes Yes Yes
TR17 Yes Yes Yes Yes Yes Yes Yes Yes Yes No
Yes = standing water was present in the pool on the date indicated. No = no standing water was present in the pool on the date indicated. Table 44. Presence of Surface Water in Travis Pools for the 2000/2001 Rainy Season.
Pool A-1
Pool A-1 No
Date 2/1/01 3/1/01 3/22/01 3/29/01 4/10/01 4/26/01
Yes Yes Yes No No A-2 No Yes Yes Yes No No A-3 No Yes Yes No No No A-4 No Yes Yes Yes No No A-5 No Yes Yes No No No B-1 No Yes Yes Yes Yes No B-2 No Yes Yes Yes No No B-3 No Yes Yes Yes Yes No B-4 No Yes Yes Yes No No B-5 No Yes Yes Yes Yes No C-1 No Yes Yes Yes Yes No C-2 No Yes Yes Yes Yes No C-3 No Yes Yes Yes Yes No C-4 No Yes Yes Yes No No C-5 No Yes Yes Yes No No SP1 No Yes No No No No SP2 No Yes No No No No
TR14 No Yes No No No No TR15 No Yes No No No No TR16 No Yes Yes No No No TR17 No Yes Yes No No No
Yes = standing water was present in the pool on the date indicated. No = no standing water was present in the pool on the date indicated.
49

Table 45. Presence of Surface Water in Travis pools for the 2001/2002 Rainy Season.
Date 1/17/02 2/22/02 3/4/02 3/8/02 3/21/02 4/2/02 4/8/02 4/19/02 5/22/02 6/5/02 Pool A1 Yes Yes Yes Yes No No No No No No A2 Yes Yes No No No No No No No No A3 Yes Yes Yes No No No No No No No A4 Yes Yes Yes Yes Yes No No No No No A5 Yes Yes Yes No No No No No No No B1 Yes Yes Yes Yes Yes Yes Yes No No No B2 Yes Yes Yes Yes Yes Yes No No No No B3 Yes Yes Yes Yes Yes Yes Yes No No No B4 Yes Yes Yes Yes Yes Yes Yes No No No B5 Yes Yes Yes Yes Yes Yes Yes No No No C1 Yes Yes Yes Yes Yes Yes Yes No No No C2 Yes Yes Yes Yes Yes Yes Yes No No No C3 Yes Yes Yes Yes Yes Yes Yes No No No C4 Yes Yes Yes Yes Yes No No No No No C5 Yes Yes Yes Yes Yes No No No No No
SP1 Yes Yes No No No No No No No No SP2 Yes Yes No No No No No No No No TR1 Yes Yes Yes Yes Yes No No No No No TR2 Yes Yes No No No No No No No No TR3 Yes Yes Yes Yes Yes No No No No No TR4 Yes Yes No No No No No No No No TR5 Yes Yes Yes Yes No No No No No No
TR14 Yes Yes No No No No No No No No TR15 Yes Yes No No No No No No No No TR16 Yes Yes Yes Yes No No No No No No TR17 Yes Yes Yes Yes No No No No No No
The winter of 2000/2001 was dry and the periods of inundation tended to be shorter than those of any of the previous years. TR17 however contained surface water longer than it did in 1993/1994 when it was dry by March 18. Most of the artificial vernal pools contained surface water longer than did the smaller natural pools SP1, SP2, TR14 and TR15. A3 and A5 the artificial pools that dried out most quickly held water for about as long as the natural pools TR16 and TR17. The other artificial pools contained surface water longer than any natural pool in the immediate vicinity. The artificial vernal pools generally contained surface water longer than TR17 during the Sonoma State study (Northen, Holve-Hensill and Eakins, 1998). On 01/17/2002 all of the pools held surface water. By 04/19/2002, none of the natural or artificial pools held any surface water. Some of the artificial pools contained surface water through 4/08/02, but were dry by 04/19/02. In 2002 many of the artificial pools held surface water for a longer period than the natural pools. The smaller natural pools SP1, SP2, TR14 and TR15 contained no surface water by 02/22/02. The larger natural pools TR17 and TR16 contained surface water through 03/8/02, but were dry by 03/21/02. The winter of 2001/2002 was dry and the periods of inundation tended to be shorter than 1993/1994, 1994/1995 and 1995/1996. However, the winter of 2001/2002 was wetter and had longer periods of inundation than 2000/2001. In 2000/2001 some of the natural and artificial pools contained surface water from March until Mid-April. While in 2001/2002, some of the natural and artificial pools contained surface water from January until Mid-April.
50

During the observations it became clear that pools constructed in close proximity to one another with the same design do not necessarily have the same inundation period. Pools A3 and A5 were dry by 3/29/01, while pools B1, B3, B5, C1, C2 and C3 still contained surface water on 4/10/01. In 2001/2002, Pool A3 and A5 were dry by 3/08/02. Pools B1, B2, B3, B5, C1, C2, and C3 were still holding surface water on 4/08/02. A3 also had a shorter inundation period than most of the other artificial pools in 1993/1994, 1994/1995 and 1995/1996. A5 had a shorter inundation period than most of the other artificial pools in 1994/1995 and 1995/1996.
Table 46. Monthly Rainfall for Fairfield CA. Month Oct Nov Dec Jan Feb Mar Apr May Jun Jul Aug Sep
Year
93/94 0.59 2.65 2.39 2.71 4.31 0.14 1.19 1.26 0.00 0.00 0.00 0.02
94/95 0.28 5.30 4.49 12.47 0.14 9.21 0.88 1.21 1.83 0.00 0.00 0.00
95/96 0.0 0.08 10.02 8.65 8.34 2.32 2.18 3.03 0.0 0.00 0.00 0.00
96/97 1.61 3.58 11.67 11.07 0.28 0.52 0.20 0.47 0.27 0.00 0.41 0.00
97/98 0.81 6.73 2.30 8.95 14.71 2.35 2.30 3.29 0.00 0.00 0.00 0.34
98/99 0.71 4.29 1.57 2.11 6.97 2.85 1.73 0.03 0.00 0.00 0.00 0.04
99/00 0.56 2.91 0.52 5.98 11.25 2.87 1.29 0.98 0.17 0.00 0.00 0.08
00/01 2.54 1.16 1.13 3.36 6.35 1.37 0.62 0.00 0.08 0.00 0.00 0.00
01/02 0.33 3.78 7.34 2.30 1.16 1.77 0.8 1.6 0.00 0.00 0.00 0.00
Local Mean 1.25 2.88 3.79 5.11 3.96 3.12 1.33 0.51 0.18 0.02 0.07 0.28
Hydrology Conclusions
1. The 2000/2001 rainy season was drier than the average season. Inundation periods for the artificial pools were shorter than the inundation periods for previously measured years.
2. The 2001/2002 rainy season produced more rainfall than the 2000/2001 season.
Inundation periods in the 2001/2002 artificial pools were generally longer than 2000/2001.
3. The artificial pools generally had longer inundation periods during the 2000/2001
and 2001/2002 seasons than the nearby natural pools.
4. The inundation periods for the artificial pools exhibit significant variability limiting the use of parametric statistics for comparisons among pools.
51

5. The design of the artificial pools is probably a major factor in the type of vegetative community that will ultimately develop in those pools. Plant species associated with longer inundation periods are likely to be benefited by the design of the artificial pools at Travis AFB.
Hydrology Discussion The artificial vernal pools were designed to provide statistically oriented data to evaluate four inoculation treatments for vernal pool plants and invertebrates. The small rectangular design with a sloping plane from ground level to 80 cm in depth may in itself be a significant determinant of the type of plant community that can ultimately become established in each individual pool. De Weese observed that the lack of microhabitat variation along with increased inundation time due to increased depth may ultimately develop habitat that favors the dominance of species such as Eleocharis macrostachya, whose abundance is correlated with longer inundation periods (De Weese, 1998). In both years of the study most artificial pools at Travis were inundated for a longer period of time than the natural pools. The rainy season 2000/2001 was drier than normal. The composition of vegetation in the pools this year may, at least in part, be a reflection of the low rainfall. The increased number of species in the pools during the second year may reflect the longer inundation periods.
52

SOIL Soil Methods For the present study we visited the natural and artificial pools at Travis AFB on June 26, 2002. On the visit we collected soil samples using a small trowel. The soil samples were taken a few inches deep to reflect the soil surface composition of the pools. Electronic images were taken to document the collection of the soil samples. Soil Results Tables 47-50 summarize the soil data derived from our soil sample. Table 47-48 summarizes the soil data showing structural form, mottles, and color. Table 49-50 summarizes the soil data indicating texture of soil.
The surface soil in source pool TR5 had a higher percentage of coarse sand and a smaller percentage of fine sand than the pools of the A series. The other texture categories are roughly similar. Table 47. Soil samples taken from source pool TR5 and its corresponding artificial pools A1-A5, showing structural form, mottles and color.
Source/Artificial Pool Structural Form Mottles ColorTR5 angular blocky yes 10YR 3/2A1 angular blocky yes 5YR 5/8A2 angular blocky yes 5YR 5/6A3 angular blocky yes 7.5YR 5/8A4 angular blocky yes 7.5YR 5/4A5 angular blocky yes 10YR 5/4
Table 48. Soil samples taken from source pools TR1-TR4 and its corresponding artificial pools C1-C5, showing structural form, mottles and color.
Source/Artificial Pool Structural Form Mottles ColorTR1 angular blocky yes 2.5Y 4/2TR2 angular blocky yes 2.5Y 5/4TR3 angular blocky yes 2.5Y 5/2TR4 angular blocky yes 2.5Y 5/2C1 angular blocky yes 7.5YR 6/8C2 angular blocky yes 7.5YR 5/8C3 angular blocky yes 7.5YR 5/8C4 angular blocky yes 10YR 4/4C5 angular blocky yes 10YR 4/4
53
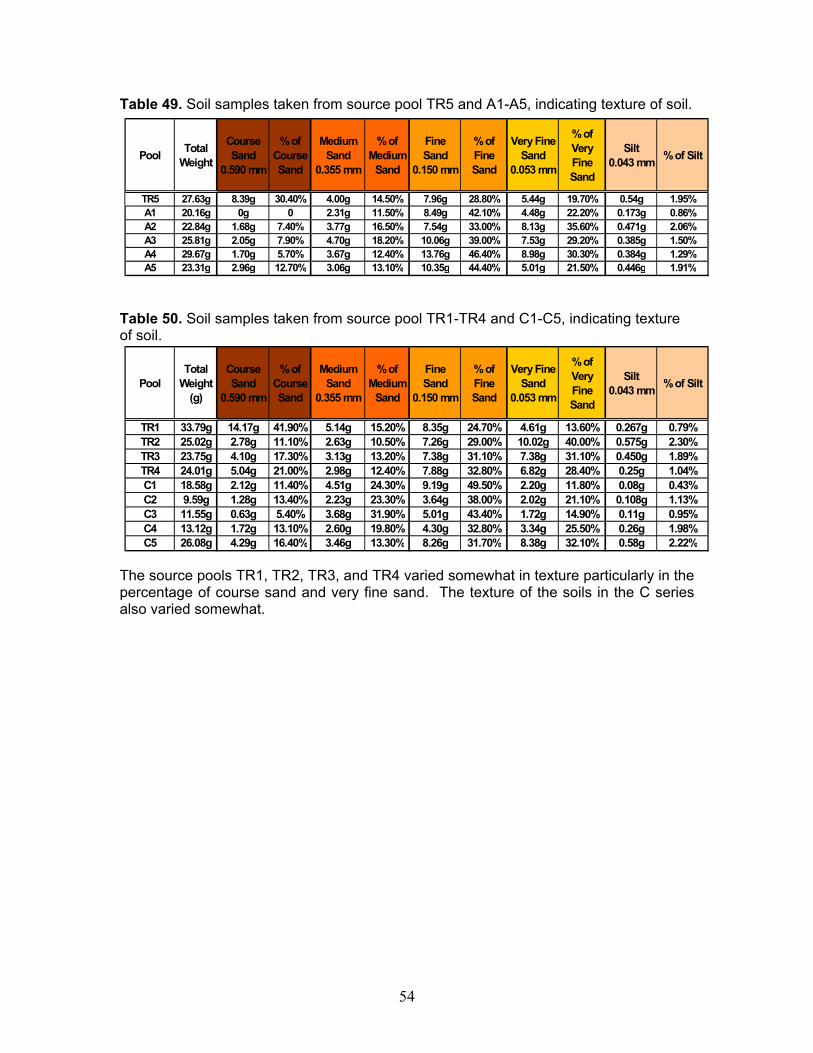
Table 49. Soil samples taken from source pool TR5 and A1-A5, indicating texture of soil.
Pool Total Weight
Course Sand
0.590 mm
% of Course Sand
Medium Sand
0.355 mm
% of Medium
Sand
Fine Sand
0.150 mm
% of Fine Sand
Very Fine Sand
0.053 mm
% of Very Fine Sand
Silt 0.043 mm % of Silt
TR5 27.63g 8.39g 30.40% 4.00g 14.50% 7.96g 28.80% 5.44g 19.70% 0.54g 1.95%A1 20.16g 0g 0 2.31g 11.50% 8.49g 42.10% 4.48g 22.20% 0.173g 0.86%A2 22.84g 1.68g 7.40% 3.77g 16.50% 7.54g 33.00% 8.13g 35.60% 0.471g 2.06%A3 25.81g 2.05g 7.90% 4.70g 18.20% 10.06g 39.00% 7.53g 29.20% 0.385g 1.50%A4 29.67g 1.70g 5.70% 3.67g 12.40% 13.76g 46.40% 8.98g 30.30% 0.384g 1.29%A5 23.31g 2.96g 12.70% 3.06g 13.10% 10.35g 44.40% 5.01g 21.50% 0.446g 1.91%
Table 50. Soil samples taken from source pool TR1-TR4 and C1-C5, indicating texture of soil.
PoolTotal
Weight (g)
Course Sand
0.590 mm
% of Course Sand
Medium Sand
0.355 mm
% of Medium
Sand
Fine Sand
0.150 mm
% of Fine Sand
Very Fine Sand
0.053 mm
% of Very Fine Sand
Silt 0.043 mm % of Silt
TR1 33.79g 14.17g 41.90% 5.14g 15.20% 8.35g 24.70% 4.61g 13.60% 0.267g 0.79%TR2 25.02g 2.78g 11.10% 2.63g 10.50% 7.26g 29.00% 10.02g 40.00% 0.575g 2.30%TR3 23.75g 4.10g 17.30% 3.13g 13.20% 7.38g 31.10% 7.38g 31.10% 0.450g 1.89%TR4 24.01g 5.04g 21.00% 2.98g 12.40% 7.88g 32.80% 6.82g 28.40% 0.25g 1.04%C1 18.58g 2.12g 11.40% 4.51g 24.30% 9.19g 49.50% 2.20g 11.80% 0.08g 0.43%C2 9.59g 1.28g 13.40% 2.23g 23.30% 3.64g 38.00% 2.02g 21.10% 0.108g 1.13%C3 11.55g 0.63g 5.40% 3.68g 31.90% 5.01g 43.40% 1.72g 14.90% 0.11g 0.95%C4 13.12g 1.72g 13.10% 2.60g 19.80% 4.30g 32.80% 3.34g 25.50% 0.26g 1.98%C5 26.08g 4.29g 16.40% 3.46g 13.30% 8.26g 31.70% 8.38g 32.10% 0.58g 2.22%
The source pools TR1, TR2, TR3, and TR4 varied somewhat in texture particularly in the percentage of course sand and very fine sand. The texture of the soils in the C series also varied somewhat.
54
LITERATURE CITED DeWeese, J. 1998. Vernal pool construction monitoring methods and habitat replacement values. Pp. 217-223, In, C.W. Witham, E.T. Bauder, D.Belk, W.R. Ferren Jr., and R. Ornduff, eds. Ecology, Conservation, and Management of Vernal Pool Ecosystems. California Native Plant Society, Sacramento, CA. Hickman, J. C. 1993. The Jepson Manual. Higher Plants of California. University of California Press, Berkeley, California. Mueller-Dombois, D. and Heinz Ellenberg. 1974. Aims and Methods of Vegetation Ecology. New York; John Wiley & Sons, Inc. Northen, Philip T., Susan Holve-Hensill and Doug Eakins. April 15, 1998. Techniques for Mitigating Loss of Vernal Pools: an Experimental Approach. California Department of Transportation. Sacramento CA. Stebbins, J.C., James R. Brownell, and William Trayler. September 1, 1996. Effective Mitigation Techniques for Central Valley Vernal Pools. California State University, Fresno. Sutter, G. and R. Francisco. 1998.Vernal pool creation in the Sacramento Valley: a review of the issues surrounding its role as a conservation tool. Pp. 190-194, In, C.W. Witham, E. Bauder, D. Belk, W. Ferren and R. Ornduff, eds. Ecology, Conservation and Management of Vernal Pool Ecosystems. California Native Plant Society, Sacramento, California. Witham, C. 2001. Prototype Releve Data Form. UC Davis. 21 Sept. 2001 http://www.vernalpools.org/barbour/documents.htm
55

Appendix A-
Raw Data & Constancy Tables
Tables A – Raw Tables A1. Species present in each zone of the listed artificial pools on 04/26/01. A2. Species present in each zone of the listed artificial pools on 05/03/01. A3. Species present in each zone of the listed artificial pools on 06/08/01. A4. Species present in TR16 on each date listed. A5. Species present in SP1 on each date listed. A6. Species present in SP2 on each date listed. A7. Species present in each zone of the listed artificial pools on 04/19/02. A8. Species present in each zone of the listed artificial pools on 05/01/02. A9. Species present in each zone of the listed artificial pools on 06/05/02. A10. Species present in each plot of the listed natural pools on 04/19/02. A11. Species present in each plot of the listed natural pools on 05/01/02. A12. Species present in each plot of the listed natural pools on 06/05/02. Tables B – Constancy Tables B1. Most common species present in the artificial pools on 04/26/01. B2. Most common species present in the artificial pools on 05/03/01. B3. Most common species present in the artificial pools on 06/08/01. B4. Most common species present in the artificial pools on 04/19/02. B5. Most common species present in the artificial pools on 05/01/02. B6. Most common species present in the artificial pools on 06/05/02. B7. Most common species present in the natural pools on 04/19/02. B8. Most common species present in the natural pools on 05/01/02. B9. Most common species present in the natural pools on 06/05/02.

Tables A Table A1. Raw Data Table indicating species present in each zone of the artificial pools on 04/26/01.
Raw Data 042601 Shallow Zone Middle Zone Deep Zone
List of Species A1 A2 A3 A4 A5 B1 B2 B3 B4 B5 C1 C2 C3 C4 C5 A1 A2 A3 A4 A5 B1 B2 B3 B4 B5 C1 C2 C3 C4 C5 A1 A2 A3 A4 A5 B1 B2 B3 B4 B5 C1 C2 C3 C4 C5
Erodium botrys + 1 1 1 2 +
Eryngium aristulatum 2 + 1 1 2 2 1 1 1 2 1 1 1 1 1 1 + 2
Psilocarphus brevissimus 2 1 2 1 2 4 3 2 1 3 4 2 2 3 3 2 1 2 3 1 1 3 4 5 2 1 3 3 2 2 2 2 1
Anagalis arvensis 1 1
Downingia concolor + 1 r r 1 + 1 r 1 + 1 r 1 1
Lupinus bicolor + 2
Lasthenia glaberrima 3 + + 3 5 2 r 1 5 3 1 3 4 5 3 2 1 3 2 1
Convolvulus arvensis + + r 1 1 +
Plagiobothrys stipitatus + 2 1 + 1 1 5 1 2 2 2 4 2 1 3 2 4 3 5 3 5 3 3 5 5 5 4 4 5 5
Hemizonia fitchii 2
Lasthenia macrantha ssp. bakeri
Eremocarpus setigerus
Centaurium muehlenbergii
Xanthium strumarium
Asclepias asperula
Cyperus eragrostis
Rumex crispus
Eleocharis macrostachya
Grasses
Hordeum murinum 2 3 2 2 3 3 2 3 2 1 3 2 1 1 1 1 2 2 1 1
Taeniatherum caput-medusae
Polypogon monspeliensis
Lolium multiflorum
Other
algae/algal matting 2 2 2 2
bare soil 2 3 3 2 3 2 1 3 2 1 2 3 3 1 2 3 3 1 2 2 2 2 1 2 2 2 1 1 2 1 3 2 1 2 2 2 2 3 1 1
2
Table A2. Raw Data Table indicating species present in each zone of the artificial pools on 05/03/01.
Raw Data 050301 Shallow Zone Middle Zone Deep Zone
List of Species A1 A2 A3 A4 A5 B1 B2 B3 B4 B5 C1 C2 C3 C4 C5 A1 A2 A3 A4 A5 B1 B2 B3 B4 B5 C1 C2 C3 C4 C5 A1 A2 A3 A4 A5 B1 B2 B3 B4 B5 C1 C2 C3 C4 C5
Erodium botrys + 1 1
Eryngium aristulatum 2 2 1 1 1 1 2 2 1 2 1 2 2 1 1 2 2 1 2 1 2 2 + 2 1 2
Psilocarphus brevissimus 2 2 2 2 4 3 3 3 3 4 4 4 2 3 3 1 2 2 3 2 2 2 4 4 3 1 3 1 3 2 1 2 2 2 1 1 1
Anagalis arvensis 1 1
Downingia concolor + + 1 1 1 + 1 r + + 1 1 + 1 1 1 1 2 r 1 r
Lupinus bicolor
Lasthenia glaberrima + 1 2 1 + 1 1 + 1 + + 3 2 1 1 2 4 1 1 2 2 + 1 +
Convolvulus arvensis + + + 1 + + 1 1 1
Plagiobothrys stipitatus 2 + + + 1 + 1 4 + 2 1 1 2 + 1 1 + + r r 3 + 3 2 4 3 3 4 2 4
Hemizonia fitchii + 2
Eremocarpus setigerus
Centaurium muehlenbergii
Xanthium strumarium
Asclepias asperula
Lasthenia macrantha ssp. bakeri
Cyperus eragrostis
Rumex crispus
Eleocharis macrostachya
Grasses
Hordeum murinum 2 2 3 3 4 3 2 2 1 1 4 4 2 2 1 1 1 4 2 1 2 + 2 2 2 3 2
Taeniatherum caput-medusae
Polypogon monospeliensis
Lolium multiflorum 1 1 1
Other
algae/algal matting 2 3 3
bare soil 3 1 3 2 2 2 3 2 3 1 3 2 2 1 2 3 3 3 3 3 1 2 3 2 1 3 3 3 + + 4 2 4 3 2 4 2 3 3 3 3 2 1
A- 2

Table A3. Raw Data Table indicating species present in each zone of the artificial pools on 06/08/01.
Raw Data 060801 Shallow Zone Middle Zone Deep Zone
List of Species A1 A2 A3 A4 A5 B1 B2 B3 B4 B5 C1 C2 C3 C4 C5 A1 A2 A3 A4 A5 B1 B2 B3 B4 B5 C1 C2 C3 C4 C5 A1 A2 A3 A4 A5 B1 B2 B3 B4 B5 C1 C2 C3 C4 C5
Erodium botrys
Eryngium aristulatum 3 3 1 2 1 + + 2 3 3 2 1 2 1 1 2 3 1 2 2 2 1 2 3 1 1 2 2 1
Psilocarphus brevissimus 2 2 2 1 3 3 3 2 1 3 2 1 1 2 2 1 1 3 2 2 2 1 3 2 2 1 1 1 2 + 1 2 2 2 1
Anagalis arvensis
Downingia concolor
Lasthenia macrantha ssp. bakeri
Lupinus bicolor
Lasthenia glaberrima
Convolvulus arvensis 1 1 1 1 1 1 1 1 1 1 1 + 1 + 1 2
Plagiobothrys stipitatus
Hemizonia fitchii 1 2 2 2 2 1 2 2 2 1 2 2 2 2 1 1 2 2 2 2 1 1 1 2 + 1 1 2 2 2
Eremocarpus setigerus + 1 1 2 1 1 2 2 1 1 1 2 1 1 1 2 r + 1 2 2 + 2 2 2 1
Centaurium muehlenbergii 1
Xanthium strumarium 1 1
Asclepias asperula r
Cyperus eragrostis r
Rumex crispus r
Eleocharis macrostachya 1 1
Grasses
Hordeum murinum 2 2 3 2 2 3 2 4 2 2 2 1 2 3 3 2 1 2 2 2 1 3 2 1 2 1 2 2 2 1 1 + 2 + 1 2 1 + 1 1 1 2
Taeniatherum caput-medusae 2 2 2 2 1 + 1 1 + 1 1 2 1 1 1 1 1 + + + 1 1 1 2 1 1 1 1 1 2 + + 1 + 1 1 1 1 2 + 1 1
Polypogon monospeliensis 1 1 2 1 + 1 1 2
Lolium multiflorum 2 2 2 1 3 + + + + 1 + 1 1 1 1 1 2 + 2 1 1 + 1 + 1 2 + 1 + + 1 2 1 1 1 1 + 1 1 + 1 1 +
Other
algae/algal matting
bare soil 2 2 2 1 + 2 2 2 3 2 2 1 2 2 2 3 2 3 1 2 3 2 2 3 2 3 2 2 2 2 4 2 4 2 2 4 3 2 3 3 3 3 3 3 2
Table A4. Raw Data Table indicating species present in TR16 on each date.
R a w D a ta T a b le T R 1 6L is t o f S p e c ie s 4 /2 6 /2 0 0 1 5 /3 /2 0 0 1 6 /8 /2 0 0 1
L a s th e n ia m a c ra n th a s s p . b a k e r i 2 2E ryn g iu m a r is tu la tu m 2 2 2
P s ilo c a rp h u s b re v is s im u s 2 2 2D o w n in g ia c o n c o lo r 2
L a s th e n ia g la b e r r im a 2H e m iz o n ia f itc h ii 1
E re m o c a rp u s s e t ig e ru s 3A s c le p ia s a s p e ru la r
C o n v o lv u lu s a rv e n s is 1P la g io b o th rys s t ip ita tu s
L u p in u s b ic o lo rA n a g a lis a rv e n s is
C e n ta u r iu m m u e h le n b e rg iiX a n th iu m s tru m a r iu m
E ro d iu m b o trysC yp e ru s e ra g ro s t is
R u m e x c r is p u s 1E le o c h a r is m a c ro s ta c h ya
G ra s s e sH o rd e u m m u r in u m 1 1 1
T a e n ia th e ru m c a p u t-m e d u s a eP o lyp o g o n m o n o s p e lie n s is
L o liu m m u lt if lo ru mO th e r
b a re s o il 1 1 1a lg a e /a lg a l m a tt in g
A- 3

Table A5. Raw Data Table indicating species present in SP1 on each date. Raw Data Table Sm all Pool 1 (SP1)
List of Species 4/26/2001 5/3/2001 6/8/2001Lasthenia m acrantha ssp. bakeri 1
Eryngium aristulatum 2 4 3Psilocarphus brevissim us 2 1 1
Downingia concolorLasthenia glaberrim a
Hem izonia fitchiiErem ocarpus setigerus
Asclepias asperulaConvolvulus arvensis
Plagiobothrys stipitatusLupinus bicolor
Anagalis arvensisCentaurium m uehlenbergii
Xanthium strum ariumErodium botrys
Cyperus eragrostisRum ex crispus
Eleocharis m acrostachyaGrasses
Hordeum m urinum 1 1 2Taeniatherum caput-m edusae
Polypogon m onospeliensisLolium m ultiflorum 1 1 2
Otherbare soil 2 2 2
algae/algal m atting Table A5. Raw Data Table indicating species present in SP2 on each date.
Raw Data Table Small Pool 2 (SP2)List of Species 4/26/2001 5/3/2001 6/8/2001
Lasthenia m acrantha ssp. bakeriEryngium aristulatum 2 3 2
Psilocarphus brevissim usDowningia concolor
Lasthenia glaberrim a 3 1Hem izonia fitchii 2
Erem ocarpus setigerus 2Asclepias asperula
Convolvulus arvensisPlagiobothrys stipitatus 3 1
Lupinus bicolorAnagalis arvensis
Centaurium m uehlenbergiiXanthium strum arium
Erodium botrysCyperus eragrostis
Rum ex crispusEleocharis m acrostachya
GrassesHordeum m urinum 1 1 2
Taeniatherum caput-m edusaePolypogon m onospeliensis
Lolium m ultiflorumOther
bare soil 1 2 2algae/algal m atting
A- 4
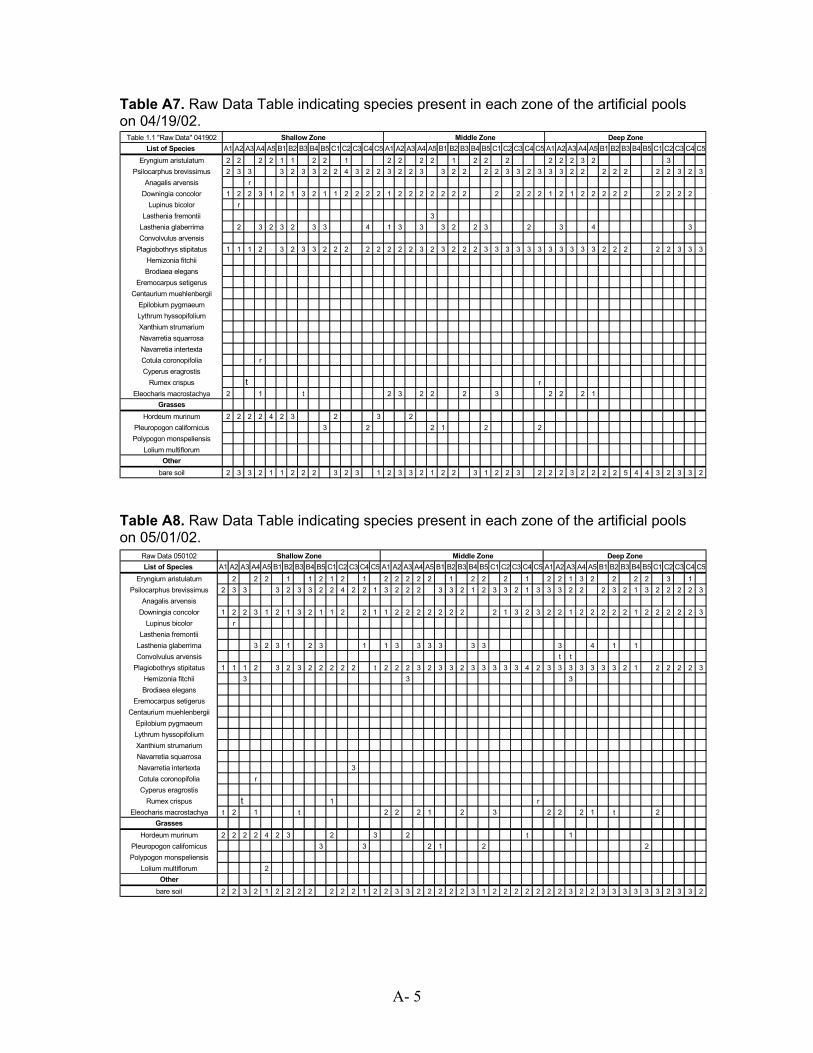
Table A7. Raw Data Table indicating species present in each zone of the artificial pools on 04/19/02.
Table 1.1 "Raw Data" 041902 Shallow Zone Middle Zone Deep ZoneList of Species A1 A2 A3 A4 A5 B1 B2 B3 B4 B5 C1 C2 C3 C4 C5 A1 A2 A3 A4 A5 B1 B2 B3 B4 B5 C1 C2 C3 C4 C5 A1 A2 A3 A4 A5 B1 B2 B3 B4 B5 C1 C2 C3 C4 C5
Eryngium aristulatum 2 2 2 2 1 1 2 2 1 2 2 2 2 1 2 2 2 2 2 2 3 2 3Psilocarphus brevissimus 2 3 3 3 2 3 3 2 2 4 3 2 2 3 2 2 3 3 2 2 2 2 3 3 2 3 3 3 2 2 2 2 2 2 2 3 2 3
Anagalis arvensis rDowningia concolor 1 2 2 3 1 2 1 3 2 1 1 2 2 2 2 1 2 2 2 2 2 2 2 2 2 2 2 1 2 1 2 2 2 2 2 2 2 2 2
Lupinus bicolor rLasthenia fremontii 3
Lasthenia glaberrima 2 3 2 3 2 3 3 4 1 3 3 3 2 2 3 2 3 4 3Convolvulus arvensis
Plagiobothrys stipitatus 1 1 1 2 3 2 3 3 2 2 2 2 2 2 2 2 3 2 3 2 2 2 3 3 3 3 3 3 3 3 3 3 3 2 2 2 2 2 3 3 3Hemizonia fitchiiBrodiaea elegans
Eremocarpus setigerusCentaurium muehlenbergii
Epilobium pygmaeumLythrum hyssopifoliumXanthium strumariumNavarretia squarrosaNavarretia intertextaCotula coronopifolia rCyperus eragrostis
Rumex crispus t rEleocharis macrostachya 2 1 t 2 3 2 2 2 3 2 2 2 1
GrassesHordeum murinum 2 2 2 2 4 2 3 2 3 2
Pleuropogon californicus 3 2 2 1 2 2Polypogon monspeliensis
Lolium multiflorumOther
bare soil 2 3 3 2 1 1 2 2 2 3 2 3 1 2 3 3 2 1 2 2 3 1 2 2 3 2 2 2 3 2 2 2 2 5 4 4 3 2 3 3 2
Table A8. Raw Data Table indicating species present in each zone of the artificial pools on 05/01/02.
Raw Data 050102 Shallow Zone Middle Zone Deep ZoneList of Species A1 A2 A3 A4 A5 B1 B2 B3 B4 B5 C1 C2 C3 C4 C5 A1 A2 A3 A4 A5 B1 B2 B3 B4 B5 C1 C2 C3 C4 C5 A1 A2 A3 A4 A5 B1 B2 B3 B4 B5 C1 C2 C3 C4 C5
Eryngium aristulatum 2 2 2 1 1 2 1 2 1 2 2 2 2 2 1 2 2 2 1 2 2 1 3 2 2 2 2 3 1Psilocarphus brevissimus 2 3 3 3 2 3 3 2 2 4 2 2 1 3 2 2 2 3 3 2 1 2 3 3 2 1 3 3 3 2 2 2 3 2 1 3 2 2 2 2 3
Anagalis arvensisDowningia concolor 1 2 2 3 1 2 1 3 2 1 1 2 2 1 1 2 2 2 2 2 2 2 2 1 3 2 3 2 2 1 2 2 2 2 2 1 2 2 2 2 2 3
Lupinus bicolor rLasthenia fremontii
Lasthenia glaberrima 3 2 3 1 2 3 1 1 3 3 3 3 3 3 3 4 1 1Convolvulus arvensis t t
Plagiobothrys stipitatus 1 1 1 2 3 2 3 2 2 2 2 2 t 2 2 2 3 2 3 3 2 3 3 3 3 3 4 2 3 3 3 3 3 3 3 2 1 2 2 2 2 3Hemizonia fitchii 3 3 3Brodiaea elegans
Eremocarpus setigerusCentaurium muehlenbergii
Epilobium pygmaeumLythrum hyssopifoliumXanthium strumariumNavarretia squarrosaNavarretia intertexta 3Cotula coronopifolia rCyperus eragrostis
Rumex crispus t 1 rEleocharis macrostachya t 2 1 t 2 2 2 1 2 3 2 2 2 1 t 2
GrassesHordeum murinum 2 2 2 2 4 2 3 2 3 2 t 1
Pleuropogon californicus 3 3 2 1 2 2Polypogon monspeliensis
Lolium multiflorum 2Other
bare soil 2 2 3 2 1 2 2 2 2 2 2 2 1 2 2 3 3 2 2 2 2 2 3 1 2 2 2 2 2 2 2 3 2 2 3 3 3 3 3 3 2 3 3 2
A- 5

Table A9. Raw Data Table indicating species present in each zone of the artificial pools on 06/05/02.
Raw Data 060502 Shallow Zone Middle Zone Deep ZoneList of Species A1 A2 A3 A4 A5 B1 B2 B3 B4 B5 C1 C2 C3 C4 C5 A1 A2 A3 A4 A5 B1 B2 B3 B4 B5 C1 C2 C3 C4 C5 A1 A2 A3 A4 A5 B1 B2 B3 B4 B5 C1 C2 C3 C4 C5
Eryngium aristulatum 3 3 2 2 2 3 3 3 1 2 2 2 3 3 3 3 3 2 3 3 2 3 3 4 2Psilocarphus brevissimus 2 2 2 2 2 2 1 2 t 2 2 1 1 1 2 2 2 1 2 2 t 3 1 2 2 2 1 2 2 1 2 1 2 1 3
Anagalis arvensisDowningia concolor
Lupinus bicolorLasthenia fremontii
Lasthenia glaberrimaConvolvulus arvensis 1 r t t t t t t t t t 1 t t t t t t t 1
Plagiobothrys stipitatus 2 1 1 1 2 2 1Hemizonia fitchii 3 3 3 3 2 3 2 3 3 3 4 3 3 1 2 2 2 3 3 3 1 3 2 2 2 2 3 2 3Brodiaea elegans t
Eremocarpus setigerus 1 2 2 2 2 2 2 2 2 3 3 2 2 3 3 2 2 3 3 2 2 2 3 3Centaurium muehlenbergii t 2
Epilobium pygmaeum 2 2 2 2 2 3 2 2 3 3 3 2 2 3 2 2Lythrum hyssopifolium 2 1 2Xanthium strumarium 1Navarretia squarrosa 1Navarretia intertexta 4Cotula coronopifoliaCyperus eragrostis 1 1 1
Rumex crispus t t t 1 t tEleocharis macrostachya 2 2 3 3 1 3 2 3 2 3 2 2
GrassesHordeum murinum 3 2 2 2 3 3 3 3 3 3 3 3 2 t 2
Pleuropogon californicus 3 2Polypogon monspeliensis
Lolium multiflorum 2Other
bare soil 1 1 3 2 2 t t 1 2 2 2 1 1 1 1 2 2 2 3 3 2 1 2 3 2 2 2 3 1 2 3 2 3 2 2 3 3 3 2 2 2 2 3 3 2
Table A10. Raw Data Table indicating species present in each plot of the natural pools on 04/19/02.
Raw Data 041902 Plot 1 Plot 2 Plot 3List of Species SP2 TR1 TR2 TR3 TR4 TR5 TR1 TR2 TR3 TR4 TR5 TR1 TR2 TR3 TR4 TR5
Eryngium aristulatum 1 2 3Psilocarphus brevissimus 2 2 4 t 1
Anagalis arvensisDowningia concolor 2 2 3 3 3 2 2 2 2 2 3 1
Lupinus bicolorLasthenia fremontii
Lasthenia glaberrima 4 4 3 4 2 4 t 4 2 3 3Convolvulus arvensis t t t t t r t
Plagiobothrys stipitatus 3 3 2 2 2 1 1 2 1 2 2 1 4 3Hemizonia fitchiiBrodiaea elegans
Eremocarpus setigerusCentaurium muehlenbergii
Epilobium pygmaeumLythrum hyssopifoliumXanthium strumariumNavarretia squarrosaNavarretia intertextaCotula coronopifolia r t t t tCyperus eragrostis 1 t
Rumex crispus r tEleocharis macrostachya 2
GrassesHordeum murinum 2
Pleuropogon californicus 3 3 2 2 2 1 1Polypogon monspeliensis
Lolium multiflorum 2 tOther
bare soil 2 1 2 2 1 r r 1 1 r 1 1 3 t t
A- 6

Table A11. Raw Data Table indicating species present in each plot of the natural pools on 05/01/02.
Raw Data 050102 Plot 1 Plot 2 Plot 3List of Species SP2 TR1 TR2 TR3 TR4 TR5 TR1 TR2 TR3 TR4 TR5 TR1 TR2 TR3 TR4 TR5
Eryngium aristulatum 2 2 1 tPsilocarphus brevissimus 2 2 3 1
Anagalis arvensisDowningia concolor 2 2 3 2 2 4 2 2 2 2 2 4 2
Lupinus bicolorLasthenia fremontii
Lasthenia glaberrima 4 4 4 1 4 1 4 2 3 3Convolvulus arvensis t t t t t t t t t
Plagiobothrys stipitatus 3 3 2 2 2 1 1 2 2 1 2 2 3Hemizonia fitchiiBrodiaea elegans
Eremocarpus setigerusCentaurium muehlenbergii
Epilobium pygmaeumLythrum hyssopifolium 2Xanthium strumariumNavarretia squarrosaNavarretia intertexta 1Cotula coronopifolia r t tCyperus eragrostis 1
Rumex crispus r t tEleocharis macrostachya 2 1
GrassesHordeum murinum 2 2 2 2 2 2 2 2
Pleuropogon californicus 3 3 1 2 2 2 2Polypogon monspeliensis
Lolium multiflorumOther
bare soil 2 1 2 2 2 r 1 1 t t 2 1 3 1 t
Table A12. Raw Data Table indicating species present in each plot of the natural pools on 06/05/02.
Raw Data 060502 Plot 1 Plot 2 Plot 3List of Species SP2 TR1 TR2 TR3 TR4 TR5 TR1 TR2 TR3 TR4 TR5 TR1 TR2 TR3 TR4 TR5
Eryngium aristulatum 3 2 3Psilocarphus brevissimus 1 3 1
Anagalis arvensisDowningia concolor
Lupinus bicolorLasthenia fremontii
Lasthenia glaberrimaConvolvulus arvensis t t t 1 t 1 t t 2 1 t t t t t
Plagiobothrys stipitatus 1 1 1Hemizonia fitchii 3 3 2 2 3 3 3Brodiaea elegans t
Eremocarpus setigerus 2 3 3 3 2 3 3 3 3 2 3 3 3 3 3 3Centaurium muehlenbergii
Epilobium pygmaeum 1 2 2 2 2Lythrum hyssopifolium 2 2 2 1Xanthium strumarium 2 1 2Navarretia squarrosaNavarretia intertexta 2Cotula coronopifoliaCyperus eragrostis
Rumex crispus r 1 1 2 t t 1 tEleocharis macrostachya 3 2 1
GrassesHordeum murinum 3 2 2 2 2 2 2 2
Pleuropogon californicus 2 1 2 1Polypogon monspeliensis
Lolium multiflorum 2Other
bare soil 2 2 1 2 1 2 2 t t 2 1 2 2 1
A- 7
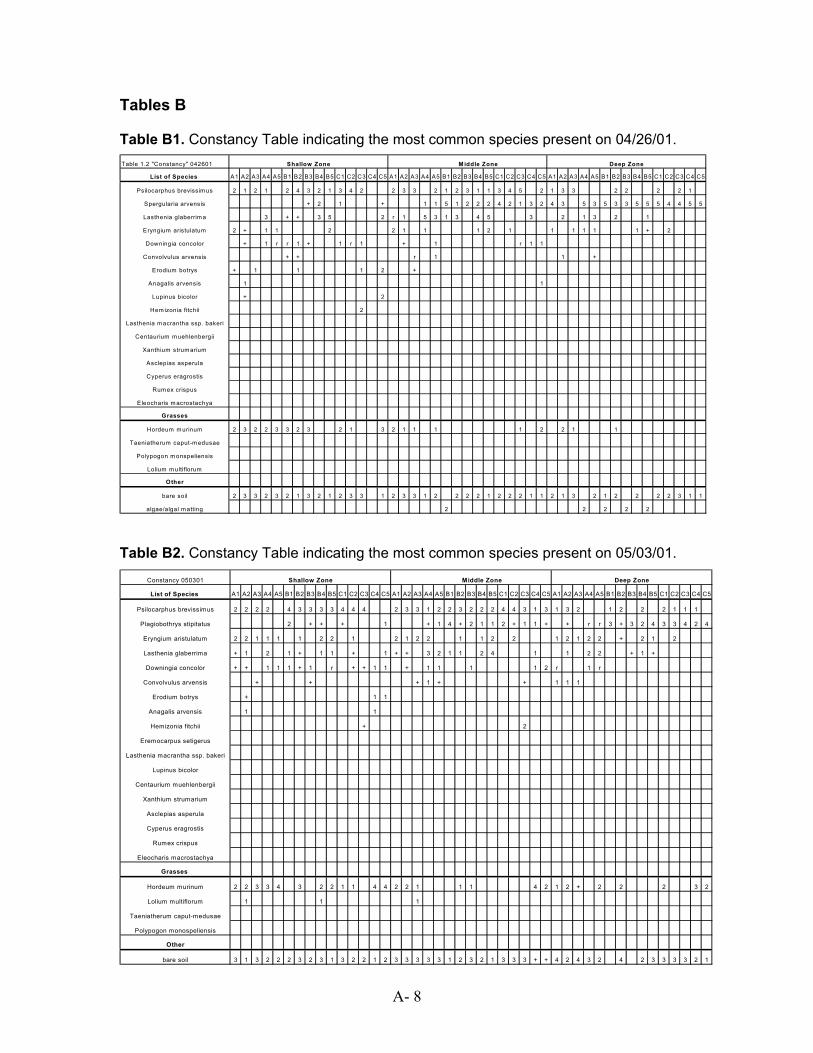
Tables B Table B1. Constancy Table indicating the most common species present on 04/26/01.
Table 1.2 "Constancy" 042601 Shallow Zone M iddle Zone Deep Zone
List of Species A1 A2 A3 A4 A5 B1 B2 B3 B4 B5 C1 C2 C3 C4 C5 A1 A2 A3 A4 A5 B1 B2 B3 B4 B5 C1 C2 C3 C4 C5 A1 A2 A3 A4 A5 B1 B2 B3 B4 B5 C1 C2 C3 C4 C5
Psilocarphus brevissim us 2 1 2 1 2 4 3 2 1 3 4 2 2 3 3 2 1 2 3 1 1 3 4 5 2 1 3 3 2 2 2 2 1
Spergularia arvensis + 2 1 + 1 1 5 1 2 2 2 4 2 1 3 2 4 3 5 3 5 3 3 5 5 5 4 4 5 5
Lasthenia glaberrim a 3 + + 3 5 2 r 1 5 3 1 3 4 5 3 2 1 3 2 1
Eryngium aristulatum 2 + 1 1 2 2 1 1 1 2 1 1 1 1 1 1 + 2
Downingia concolor + 1 r r 1 + 1 r 1 + 1 r 1 1
Convolvulus arvensis + + r 1 1 +
Erodium botrys + 1 1 1 2 +
Anagalis arvensis 1 1
Lupinus bicolor + 2
Hem izonia fitchii 2
Lasthenia m acrantha ssp. bakeri
Centaurium m uehlenbergii
Xanthium strum arium
Asclepias asperula
Cyperus eragrostis
Rum ex crispus
Eleocharis m acrostachya
Grasses
Hordeum m urinum 2 3 2 2 3 3 2 3 2 1 3 2 1 1 1 1 2 2 1 1
Taeniatherum caput-m edusae
Polypogon m onspeliensis
Lolium m ultiflorum
Other
bare soil 2 3 3 2 3 2 1 3 2 1 2 3 3 1 2 3 3 1 2 2 2 2 1 2 2 2 1 1 2 1 3 2 1 2 2 2 2 3 1 1
algae/algal m atting 2 2 2 2 2
Table B2. Constancy Table indicating the most common species present on 05/03/01.
Constancy 050301 Shallow Zone Middle Zone Deep Zone
List of Species A1 A2 A3 A4 A5 B1 B2 B3 B4 B5 C1 C2 C3 C4 C5 A1 A2 A3 A4 A5 B1 B2 B3 B4 B5 C1 C2 C3 C4 C5 A1 A2 A3 A4 A5 B1 B2 B3 B4 B5 C1 C2 C3 C4 C5
Psilocarphus brevissimus 2 2 2 2 4 3 3 3 3 4 4 4 2 3 3 1 2 2 3 2 2 2 4 4 3 1 3 1 3 2 1 2 2 2 1 1 1
Plagiobothrys stipitatus 2 + + + 1 + 1 4 + 2 1 1 2 + 1 1 + + r r 3 + 3 2 4 3 3 4 2 4
Eryngium aristulatum 2 2 1 1 1 1 2 2 1 2 1 2 2 1 1 2 2 1 2 1 2 2 + 2 1 2
Lasthenia glaberrima + 1 2 1 + 1 1 + 1 + + 3 2 1 1 2 4 1 1 2 2 + 1 +
Downingia concolor + + 1 1 1 + 1 r + + 1 1 + 1 1 1 1 2 r 1 r
Convolvulus arvensis + + + 1 + + 1 1 1
Erodium botrys + 1 1
Anagalis arvensis 1 1
Hemizonia fitchii + 2
Eremocarpus setigerus
Lasthenia macrantha ssp. bakeri
Lupinus bicolor
Centaurium muehlenbergii
Xanthium strumarium
Asclepias asperula
Cyperus eragrostis
Rumex crispus
Eleocharis macrostachya
Grasses
Hordeum murinum 2 2 3 3 4 3 2 2 1 1 4 4 2 2 1 1 1 4 2 1 2 + 2 2 2 3 2
Lolium multiflorum 1 1 1
Taeniatherum caput-medusae
Polypogon monospeliensis
Other
bare soil 3 1 3 2 2 2 3 2 3 1 3 2 2 1 2 3 3 3 3 3 1 2 3 2 1 3 3 3 + + 4 2 4 3 2 4 2 3 3 3 3 2 1
A- 8

Table B3. Constancy Table indicating the most common species present on 06/08/01. Constancy 060801 Shallow Zone Middle Zone Deep Zone
List of Species A1 A2 A3 A4 A5 B1 B2 B3 B4 B5 C1 C2 C3 C4 C5 A1 A2 A3 A4 A5 B1 B2 B3 B4 B5 C1 C2 C3 C4 C5 A1 A2 A3 A4 A5 B1 B2 B3 B4 B5 C1 C2 C3 C4 C5
Psilocarphus brevissimus 2 2 2 1 3 3 3 2 1 3 2 1 1 2 2 1 1 3 2 2 2 1 3 2 2 1 1 1 2 + 1 2 2 2 1
Hemizonia fitchii 1 2 2 2 2 1 2 2 2 1 2 2 2 2 1 1 2 2 2 2 1 1 1 2 + 1 1 2 2 2
Eryngium aristulatum 3 3 1 2 1 + + 2 3 3 2 1 2 1 1 2 3 1 2 2 2 1 2 3 1 1 2 2 1
Eremocarpus setigerus + 1 1 2 1 1 2 2 1 1 1 2 1 1 1 2 r + 1 2 2 + 2 2 2 1
Convolvulus arvensis 1 1 1 1 1 1 1 1 1 1 1 + 1 + 1 2
Xanthium strumarium 1 1
Cyperus eragrostis r
Asclepias asperula r
Eleocharis macrostachya 1 1
Centaurium muehlenbergii 1
Rumex crispus r
Anagalis arvensis
Lasthenia glaberrima
Downingia concolor
Erodium botrys
Lasthenia macrantha ssp. bakeri
Lupinus bicolor
Plagiobothrys stipitatus
Grasses
Lolium multiflorum 2 2 2 1 3 + + + + 1 + 1 1 1 1 1 2 + 2 1 1 + 1 + 1 2 + 1 + + 1 2 1 1 1 1 + 1 1 + 1 1 +
Hordeum murinum 2 2 3 2 2 3 2 4 2 2 2 1 2 3 3 2 1 2 2 2 1 3 2 1 2 1 2 2 2 1 1 + 2 + 1 2 1 + 1 1 1 2
Taeniatherum caput-medusae 2 2 2 2 1 + 1 1 + 1 1 2 1 1 1 1 1 + + + 1 1 1 2 1 1 1 1 1 2 + + 1 + 1 1 1 1 2 + 1 1
Polypogon monospeliensis 1 1 2 1 + 1 1 2
Other
bare soil 2 2 2 1 + 2 2 2 3 2 2 1 2 2 2 3 2 3 1 2 3 2 2 3 2 3 2 2 2 2 4 2 4 2 2 4 3 2 3 3 3 3 3 3 2
algae/algal matting
Table B4. Constancy Table indicating the most common species present on 04/19/02.
Constancy 041902 Shallow Zone Middle Zone Deep ZoneList of Species A1 A2 A3 A4 A5 B1 B2 B3 B4 B5 C1 C2 C3 C4 C5 A1 A2 A3 A4 A5 B1 B2 B3 B4 B5 C1 C2 C3 C4 C5 A1 A2 A3 A4 A5 B1 B2 B3 B4 B5 C1 C2 C3 C4 C5
Plagiobothrys stipitatus 1 1 1 2 3 2 3 3 2 2 2 2 2 2 2 2 3 2 3 2 2 2 3 3 3 3 3 3 3 3 3 3 3 2 2 2 2 2 3 3 3Downingia concolor 1 2 2 3 1 2 1 3 2 1 1 2 2 2 2 1 2 2 2 2 2 2 2 2 2 2 2 1 2 1 2 2 2 2 2 2 2 2 2
Psilocarphus brevissimus 2 3 3 3 2 3 3 2 2 4 3 2 2 3 2 2 3 3 2 2 2 2 3 3 2 3 3 3 2 2 2 2 2 2 2 3 2 3Eryngium aristulatum 2 2 2 2 1 1 2 2 1 2 2 2 2 1 2 2 2 2 2 2 3 2 3Lasthenia glaberrima 2 3 2 3 2 3 3 4 1 3 3 3 2 2 3 2 3 4 3
Eleocharis macrostachya 2 1 t 2 3 2 2 2 3 2 2 2 1Anagalis arvensis rLupinus bicolor r
Lasthenia fremontii 3Cotula coronopifolia r
Rumex crispus t rConvolvulus arvensis
Hemizonia fitchiiBrodiaea elegans
Eremocarpus setigerusCentaurium muehlenbergii
Epilobium pygmaeumLythrum hyssopifoliumXanthium strumariumNavarretia squarrosaNavarretia intertextaCyperus eragrostis
GrassesHordeum murinum 2 2 2 2 4 2 3 2 3 2
Pleuropogon californicus 3 2 2 1 2 2Polypogon monspeliensis
Lolium multiflorumOther
bare soil 2 3 3 2 1 1 2 2 2 3 2 3 1 2 3 3 2 1 2 2 3 1 2 2 3 2 2 2 3 2 2 2 2 5 4 4 3 2 3 3 2
A- 9
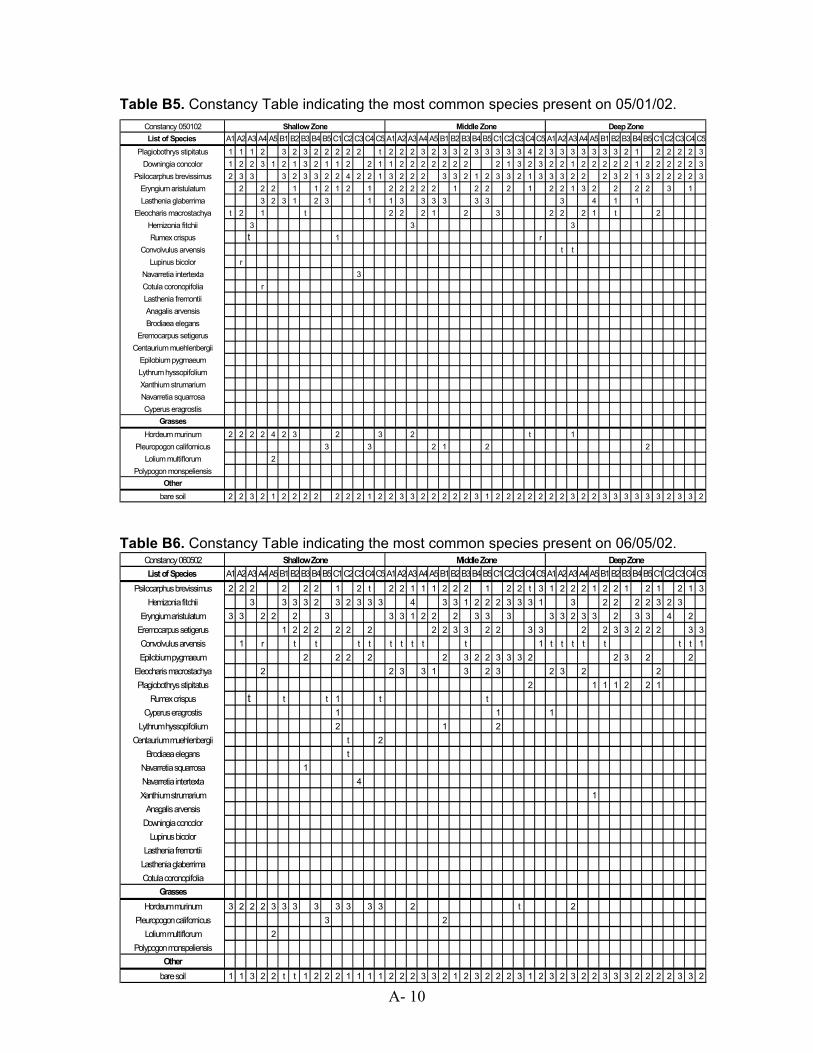
Table B5. Constancy Table indicating the most common species present on 05/01/02. Constancy 050102 Shallow Zone Middle Zone Deep ZoneList of Species A1 A2 A3 A4 A5 B1 B2 B3 B4 B5 C1 C2 C3 C4 C5 A1 A2 A3 A4 A5 B1 B2 B3 B4 B5 C1 C2 C3 C4 C5 A1 A2 A3 A4 A5 B1 B2 B3 B4 B5 C1 C2 C3 C4 C5
Plagiobothrys stipitatus 1 1 1 2 3 2 3 2 2 2 2 2 t 2 2 2 3 2 3 3 2 3 3 3 3 3 4 2 3 3 3 3 3 3 3 2 1 2 2 2 2 3Downingia concolor 1 2 2 3 1 2 1 3 2 1 1 2 2 1 1 2 2 2 2 2 2 2 2 1 3 2 3 2 2 1 2 2 2 2 2 1 2 2 2 2 2 3
Psilocarphus brevissimus 2 3 3 3 2 3 3 2 2 4 2 2 1 3 2 2 2 3 3 2 1 2 3 3 2 1 3 3 3 2 2 2 3 2 1 3 2 2 2 2 3Eryngium aristulatum 2 2 2 1 1 2 1 2 1 2 2 2 2 2 1 2 2 2 1 2 2 1 3 2 2 2 2 3 1Lasthenia glaberrima 3 2 3 1 2 3 1 1 3 3 3 3 3 3 3 4 1 1
Eleocharis macrostachya t 2 1 t 2 2 2 1 2 3 2 2 2 1 t 2Hemizonia fitchii 3 3 3Rumex crispus t 1 r
Convolvulus arvensis t tLupinus bicolor r
Navarretia intertexta 3Cotula coronopifolia rLasthenia fremontiiAnagalis arvensisBrodiaea elegans
Eremocarpus setigerusCentaurium muehlenbergii
Epilobium pygmaeumLythrum hyssopifoliumXanthium strumariumNavarretia squarrosaCyperus eragrostis
GrassesHordeum murinum 2 2 2 2 4 2 3 2 3 2 t 1
Pleuropogon californicus 3 3 2 1 2 2Lolium multiflorum 2
Polypogon monspeliensisOther
bare soil 2 2 3 2 1 2 2 2 2 2 2 2 1 2 2 3 3 2 2 2 2 2 3 1 2 2 2 2 2 2 2 3 2 2 3 3 3 3 3 3 2 3 3 2
Table B6. Constancy Table indicating the most common species present on 06/05/02.
Constancy 060502 Shallow Zone Middle Zone Deep ZoneList of Species A1A2A3A4A5B1B2B3B4B5C1C2C3C4C5A1A2A3A4A5B1B2B3B4B5C1C2C3C4C5A1A2A3A4A5B1B2B3B4B5C1C2C3C4C5
Psilocarphus brevissimus 2 2 2 2 2 2 1 2 t 2 2 1 1 1 2 2 2 1 2 2 t 3 1 2 2 2 1 2 2 1 2 1 2 1 3Hemizonia fitchii 3 3 3 3 2 3 2 3 3 3 4 3 3 1 2 2 2 3 3 3 1 3 2 2 2 2 3 2 3
Eryngium aristulatum 3 3 2 2 2 3 3 3 1 2 2 2 3 3 3 3 3 2 3 3 2 3 3 4 2Eremocarpus setigerus 1 2 2 2 2 2 2 2 2 3 3 2 2 3 3 2 2 3 3 2 2 2 3 3Convolvulus arvensis 1 r t t t t t t t t t 1 t t t t t t t 1Epilobium pygmaeum 2 2 2 2 2 3 2 2 3 3 3 2 2 3 2 2
Eleocharis macrostachya 2 2 3 3 1 3 2 3 2 3 2 2Plagiobothrys stipitatus 2 1 1 1 2 2 1
Rumex crispus t t t 1 t tCyperus eragrostis 1 1 1
Lythrum hyssopifolium 2 1 2Centaurium muehlenbergii t 2
Brodiaea elegans tNavarretia squarrosa 1Navarretia intertexta 4Xanthium strumarium 1
Anagalis arvensisDowningia concolor
Lupinus bicolorLasthenia fremontii
Lasthenia glaberrimaCotula coronopifolia
GrassesHordeum murinum 3 2 2 2 3 3 3 3 3 3 3 3 2 t 2
Pleuropogon californicus 3 2Lolium multiflorum 2
Polypogon monspeliensisOther
bare soil 1 1 3 2 2 t t 1 2 2 2 1 1 1 1 2 2 2 3 3 2 1 2 3 2 2 2 3 1 2 3 2 3 2 2 3 3 3 2 2 2 2 3 3 2
A- 10
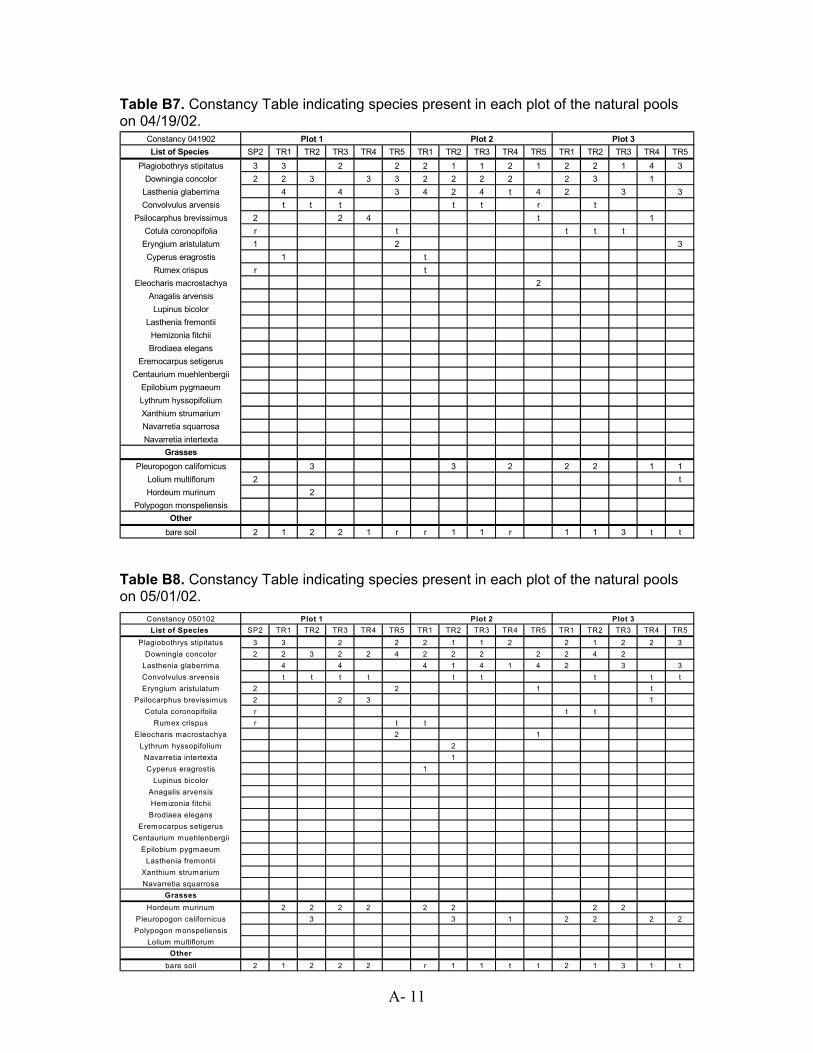
Table B7. Constancy Table indicating species present in each plot of the natural pools on 04/19/02.
Constancy 041902 Plot 1 Plot 2 Plot 3List of Species SP2 TR1 TR2 TR3 TR4 TR5 TR1 TR2 TR3 TR4 TR5 TR1 TR2 TR3 TR4 TR5
Plagiobothrys stipitatus 3 3 2 2 2 1 1 2 1 2 2 1 4 3Downingia concolor 2 2 3 3 3 2 2 2 2 2 3 1
Lasthenia glaberrima 4 4 3 4 2 4 t 4 2 3 3Convolvulus arvensis t t t t t r t
Psilocarphus brevissimus 2 2 4 t 1Cotula coronopifolia r t t t t
Eryngium aristulatum 1 2 3Cyperus eragrostis 1 t
Rumex crispus r tEleocharis macrostachya 2
Anagalis arvensisLupinus bicolor
Lasthenia fremontiiHemizonia fitchiiBrodiaea elegans
Eremocarpus setigerusCentaurium muehlenbergii
Epilobium pygmaeumLythrum hyssopifoliumXanthium strumariumNavarretia squarrosaNavarretia intertexta
GrassesPleuropogon californicus 3 3 2 2 2 1 1
Lolium multiflorum 2 tHordeum murinum 2
Polypogon monspeliensisOther
bare soil 2 1 2 2 1 r r 1 1 r 1 1 3 t t
Table B8. Constancy Table indicating species present in each plot of the natural pools on 05/01/02.
Constancy 050102 Plot 1 Plot 2 Plot 3List of Species SP2 TR1 TR2 TR3 TR4 TR5 TR1 TR2 TR3 TR4 TR5 TR1 TR2 TR3 TR4 TR5
Plagiobothrys stipitatus 3 3 2 2 2 1 1 2 2 1 2 2 3Downingia concolor 2 2 3 2 2 4 2 2 2 2 2 4 2
Lasthenia glaberrima 4 4 4 1 4 1 4 2 3 3Convolvulus arvensis t t t t t t t t tEryngium aristulatum 2 2 1 t
Psilocarphus brevissimus 2 2 3 1Cotula coronopifolia r t t
Rumex crispus r t tEleocharis macrostachya 2 1
Lythrum hyssopifolium 2Navarretia intertexta 1Cyperus eragrostis 1
Lupinus bicolorAnagalis arvensisHemizonia fitchiiBrodiaea elegans
Eremocarpus setigerusCentaurium muehlenbergii
Epilobium pygmaeumLasthenia fremontii
Xanthium strumariumNavarretia squarrosa
GrassesHordeum murinum 2 2 2 2 2 2 2 2
Pleuropogon californicus 3 3 1 2 2 2 2Polypogon monspeliensis
Lolium multiflorumOther
bare soil 2 1 2 2 2 r 1 1 t t 2 1 3 1 t
A- 11
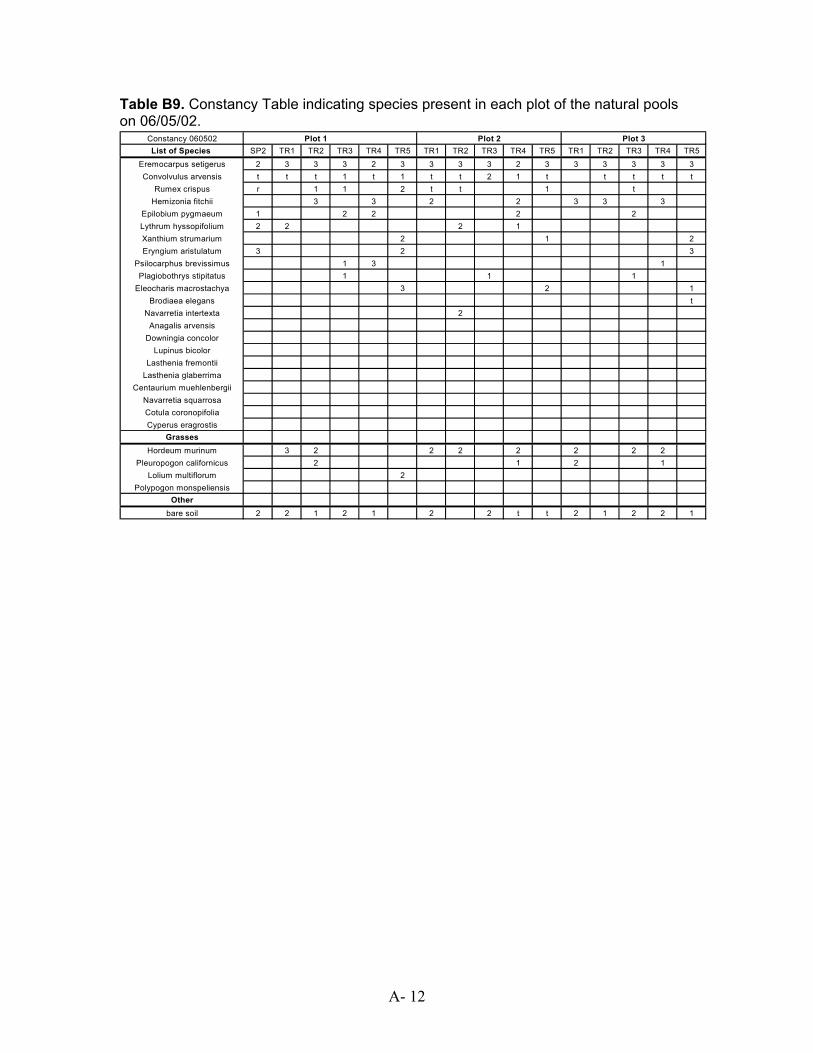
Table B9. Constancy Table indicating species present in each plot of the natural pools on 06/05/02.
Constancy 060502 Plot 1 Plot 2 Plot 3List of Species SP2 TR1 TR2 TR3 TR4 TR5 TR1 TR2 TR3 TR4 TR5 TR1 TR2 TR3 TR4 TR5
Eremocarpus setigerus 2 3 3 3 2 3 3 3 3 2 3 3 3 3 3 3Convolvulus arvensis t t t 1 t 1 t t 2 1 t t t t t
Rumex crispus r 1 1 2 t t 1 tHemizonia fitchii 3 3 2 2 3 3 3
Epilobium pygmaeum 1 2 2 2 2Lythrum hyssopifolium 2 2 2 1Xanthium strumarium 2 1 2Eryngium aristulatum 3 2 3
Psilocarphus brevissimus 1 3 1Plagiobothrys stipitatus 1 1 1
Eleocharis macrostachya 3 2 1Brodiaea elegans t
Navarretia intertexta 2Anagalis arvensis
Downingia concolorLupinus bicolor
Lasthenia fremontiiLasthenia glaberrima
Centaurium muehlenbergiiNavarretia squarrosaCotula coronopifoliaCyperus eragrostis
GrassesHordeum murinum 3 2 2 2 2 2 2 2
Pleuropogon californicus 2 1 2 1Lolium multiflorum 2
Polypogon monspeliensisOther
bare soil 2 2 1 2 1 2 2 t t 2 1 2 2 1
A- 12