Embed Size (px)
Citation preview
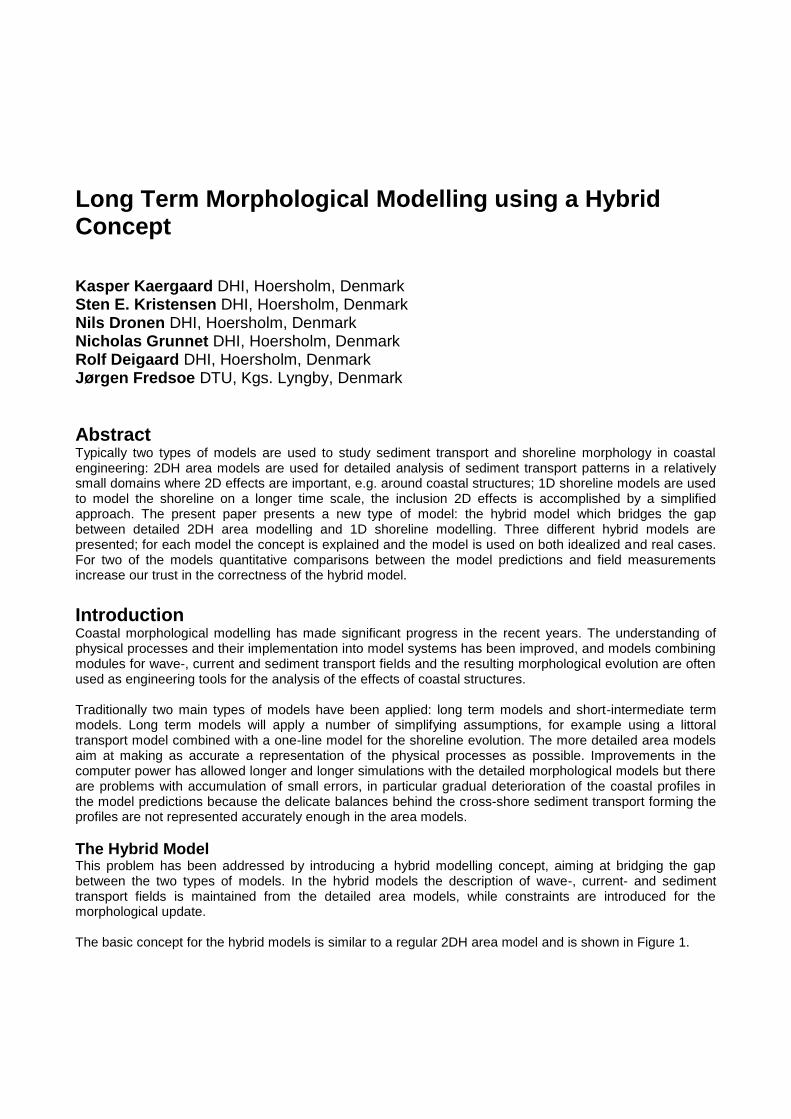
Long Term Morphological Modelling using a Hybrid Concept Kasper Kaergaard DHI, Hoersholm, Denmark Sten E. Kristensen DHI, Hoersholm, Denmark Nils Dronen DHI, Hoersholm, Denmark Nicholas Grunnet DHI, Hoersholm, Denmark Rolf Deigaard DHI, Hoersholm, Denmark Jørgen Fredsoe DTU, Kgs. Lyngby, Denmark
Abstract Typically two types of models are used to study sediment transport and shoreline morphology in coastal engineering: 2DH area models are used for detailed analysis of sediment transport patterns in a relatively small domains where 2D effects are important, e.g. around coastal structures; 1D shoreline models are used to model the shoreline on a longer time scale, the inclusion 2D effects is accomplished by a simplified approach. The present paper presents a new type of model: the hybrid model which bridges the gap between detailed 2DH area modelling and 1D shoreline modelling. Three different hybrid models are presented; for each model the concept is explained and the model is used on both idealized and real cases. For two of the models quantitative comparisons between the model predictions and field measurements increase our trust in the correctness of the hybrid model.
Introduction Coastal morphological modelling has made significant progress in the recent years. The understanding of physical processes and their implementation into model systems has been improved, and models combining modules for wave-, current and sediment transport fields and the resulting morphological evolution are often used as engineering tools for the analysis of the effects of coastal structures. Traditionally two main types of models have been applied: long term models and short-intermediate term models. Long term models will apply a number of simplifying assumptions, for example using a littoral transport model combined with a one-line model for the shoreline evolution. The more detailed area models aim at making as accurate a representation of the physical processes as possible. Improvements in the computer power has allowed longer and longer simulations with the detailed morphological models but there are problems with accumulation of small errors, in particular gradual deterioration of the coastal profiles in the model predictions because the delicate balances behind the cross-shore sediment transport forming the profiles are not represented accurately enough in the area models.
The Hybrid Model This problem has been addressed by introducing a hybrid modelling concept, aiming at bridging the gap between the two types of models. In the hybrid models the description of wave-, current- and sediment transport fields is maintained from the detailed area models, while constraints are introduced for the morphological update. The basic concept for the hybrid models is similar to a regular 2DH area model and is shown in Figure 1.
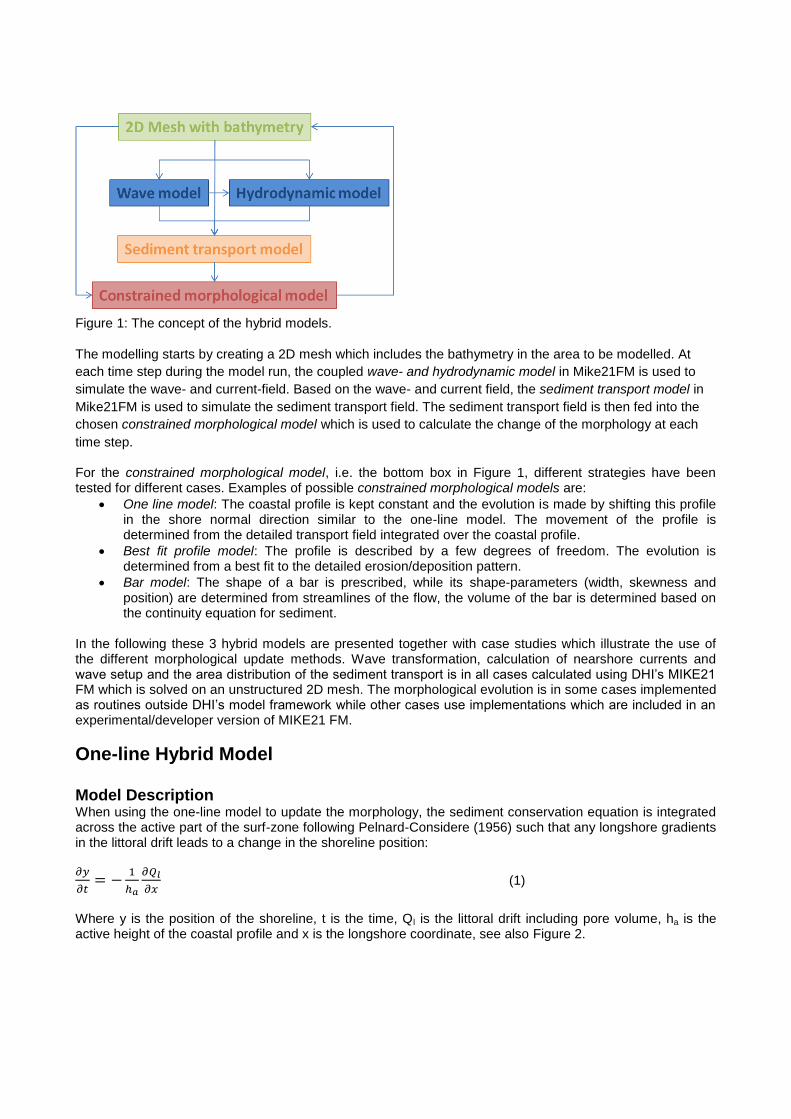
Figure 1: The concept of the hybrid models.
The modelling starts by creating a 2D mesh which includes the bathymetry in the area to be modelled. At
each time step during the model run, the coupled wave- and hydrodynamic model in Mike21FM is used to
simulate the wave- and current-field. Based on the wave- and current field, the sediment transport model in
Mike21FM is used to simulate the sediment transport field. The sediment transport field is then fed into the
chosen constrained morphological model which is used to calculate the change of the morphology at each
time step.
For the constrained morphological model, i.e. the bottom box in Figure 1, different strategies have been tested for different cases. Examples of possible constrained morphological models are:
One line model: The coastal profile is kept constant and the evolution is made by shifting this profile in the shore normal direction similar to the one-line model. The movement of the profile is determined from the detailed transport field integrated over the coastal profile.
Best fit profile model: The profile is described by a few degrees of freedom. The evolution is determined from a best fit to the detailed erosion/deposition pattern.
Bar model: The shape of a bar is prescribed, while its shape-parameters (width, skewness and position) are determined from streamlines of the flow, the volume of the bar is determined based on the continuity equation for sediment.
In the following these 3 hybrid models are presented together with case studies which illustrate the use of the different morphological update methods. Wave transformation, calculation of nearshore currents and wave setup and the area distribution of the sediment transport is in all cases calculated using DHI’s MIKE21 FM which is solved on an unstructured 2D mesh. The morphological evolution is in some cases implemented as routines outside DHI’s model framework while other cases use implementations which are included in an experimental/developer version of MIKE21 FM.
One-line Hybrid Model Model Description When using the one-line model to update the morphology, the sediment conservation equation is integrated across the active part of the surf-zone following Pelnard-Considere (1956) such that any longshore gradients in the littoral drift leads to a change in the shoreline position:
(1)
Where y is the position of the shoreline, t is the time, Ql is the littoral drift including pore volume, ha is the active height of the coastal profile and x is the longshore coordinate, see also Figure 2.
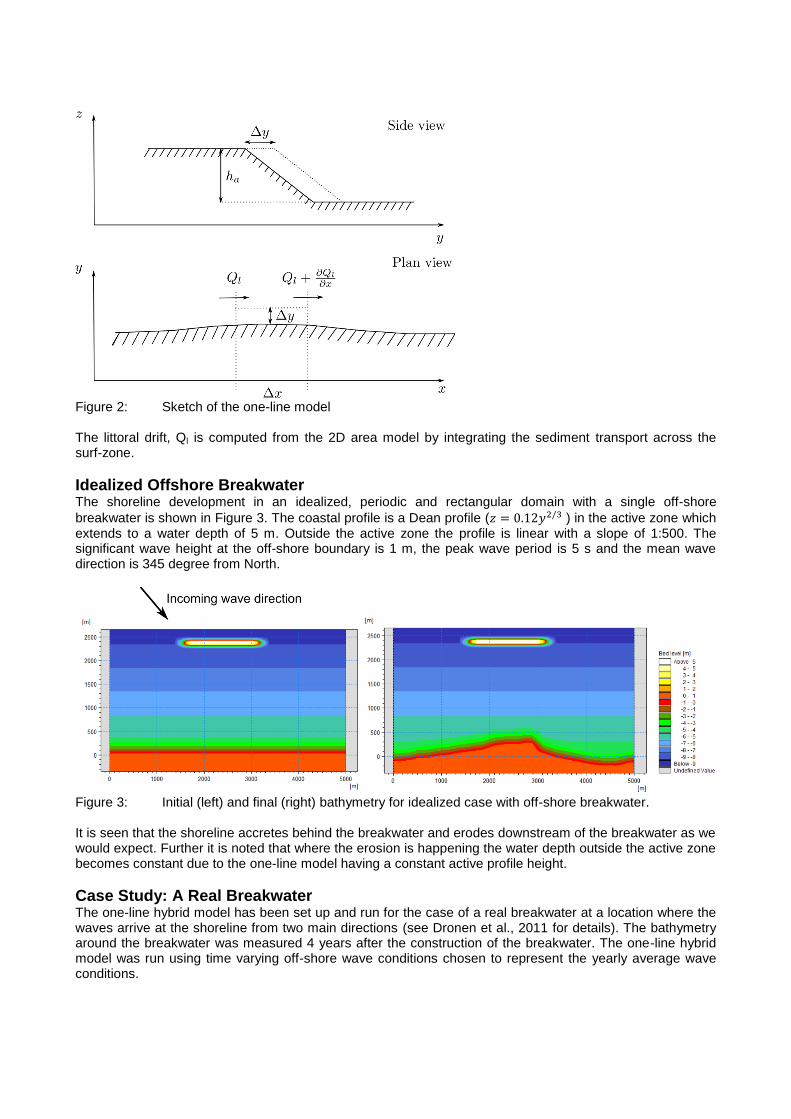
Figure 2: Sketch of the one-line model
The littoral drift, Ql is computed from the 2D area model by integrating the sediment transport across the surf-zone.
Idealized Offshore Breakwater The shoreline development in an idealized, periodic and rectangular domain with a single off-shore
breakwater is shown in Figure 3. The coastal profile is a Dean profile ( ) in the active zone which extends to a water depth of 5 m. Outside the active zone the profile is linear with a slope of 1:500. The significant wave height at the off-shore boundary is 1 m, the peak wave period is 5 s and the mean wave direction is 345 degree from North.
Figure 3: Initial (left) and final (right) bathymetry for idealized case with off-shore breakwater.
It is seen that the shoreline accretes behind the breakwater and erodes downstream of the breakwater as we would expect. Further it is noted that where the erosion is happening the water depth outside the active zone becomes constant due to the one-line model having a constant active profile height.
Case Study: A Real Breakwater The one-line hybrid model has been set up and run for the case of a real breakwater at a location where the waves arrive at the shoreline from two main directions (see Dronen et al., 2011 for details). The bathymetry around the breakwater was measured 4 years after the construction of the breakwater. The one-line hybrid model was run using time varying off-shore wave conditions chosen to represent the yearly average wave conditions.
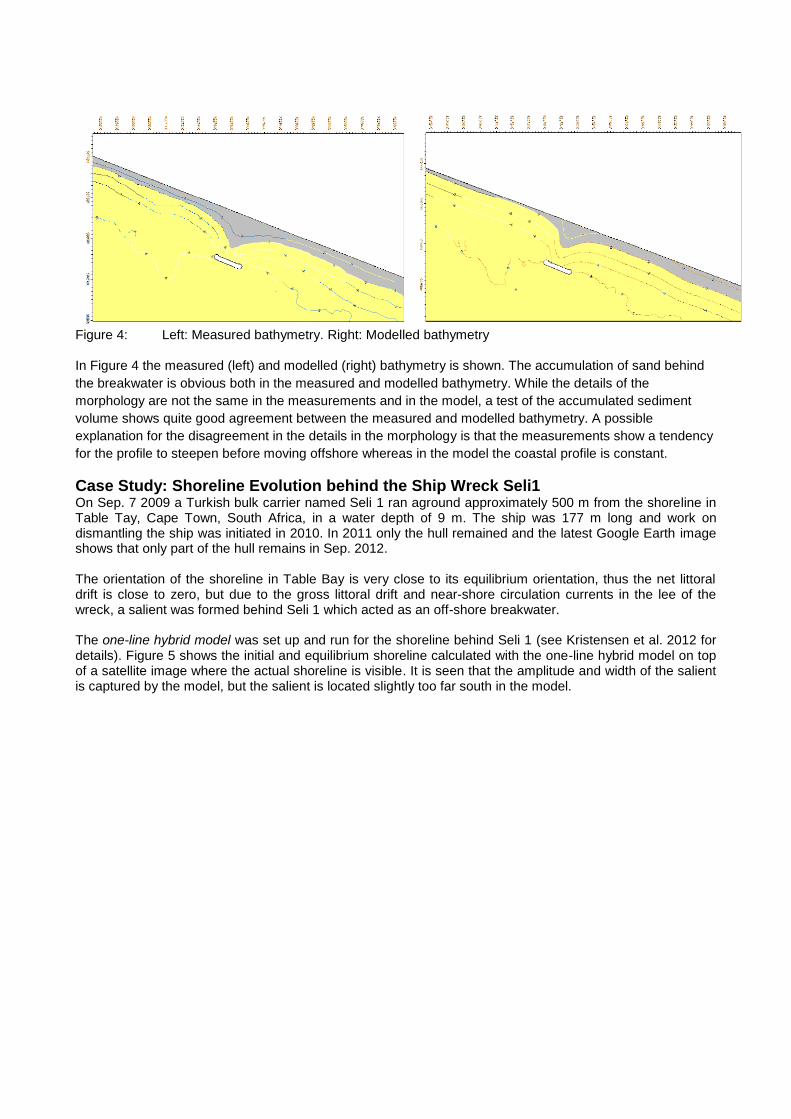
Figure 4: Left: Measured bathymetry. Right: Modelled bathymetry In Figure 4 the measured (left) and modelled (right) bathymetry is shown. The accumulation of sand behind
the breakwater is obvious both in the measured and modelled bathymetry. While the details of the
morphology are not the same in the measurements and in the model, a test of the accumulated sediment
volume shows quite good agreement between the measured and modelled bathymetry. A possible
explanation for the disagreement in the details in the morphology is that the measurements show a tendency
for the profile to steepen before moving offshore whereas in the model the coastal profile is constant.
Case Study: Shoreline Evolution behind the Ship Wreck Seli1 On Sep. 7 2009 a Turkish bulk carrier named Seli 1 ran aground approximately 500 m from the shoreline in Table Tay, Cape Town, South Africa, in a water depth of 9 m. The ship was 177 m long and work on dismantling the ship was initiated in 2010. In 2011 only the hull remained and the latest Google Earth image shows that only part of the hull remains in Sep. 2012. The orientation of the shoreline in Table Bay is very close to its equilibrium orientation, thus the net littoral drift is close to zero, but due to the gross littoral drift and near-shore circulation currents in the lee of the wreck, a salient was formed behind Seli 1 which acted as an off-shore breakwater. The one-line hybrid model was set up and run for the shoreline behind Seli 1 (see Kristensen et al. 2012 for details). Figure 5 shows the initial and equilibrium shoreline calculated with the one-line hybrid model on top of a satellite image where the actual shoreline is visible. It is seen that the amplitude and width of the salient is captured by the model, but the salient is located slightly too far south in the model.
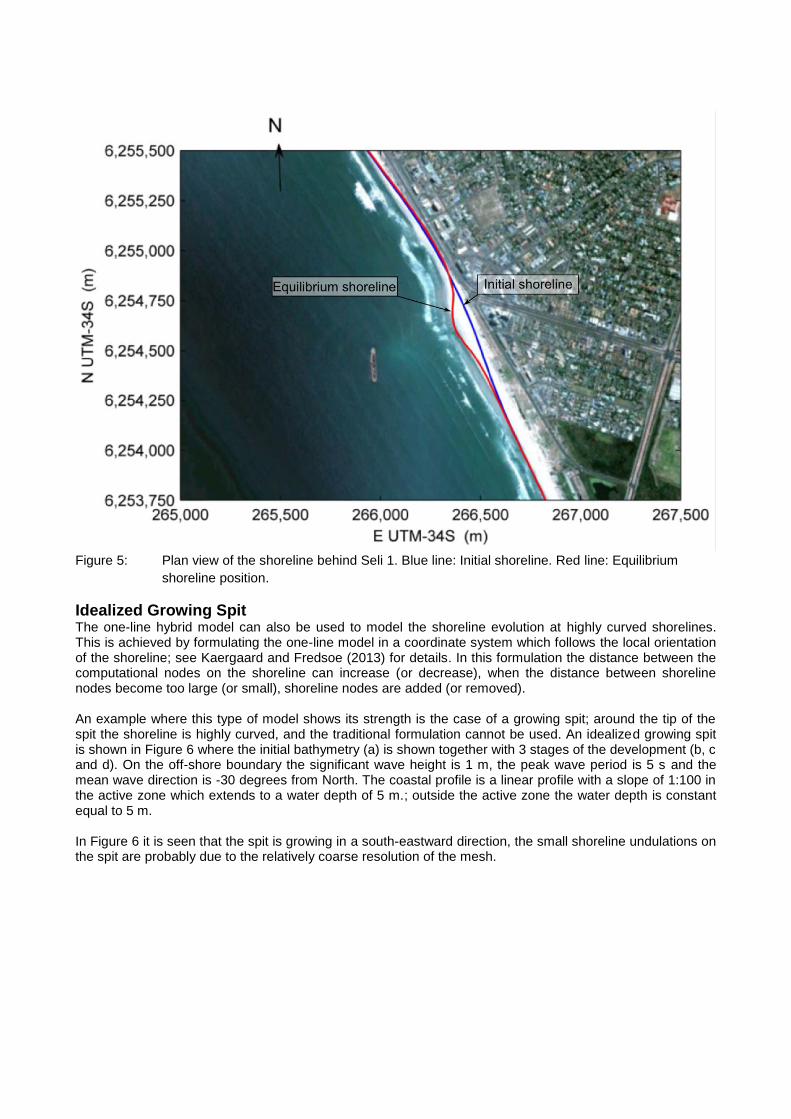
Figure 5: Plan view of the shoreline behind Seli 1. Blue line: Initial shoreline. Red line: Equilibrium
shoreline position.
Idealized Growing Spit The one-line hybrid model can also be used to model the shoreline evolution at highly curved shorelines. This is achieved by formulating the one-line model in a coordinate system which follows the local orientation of the shoreline; see Kaergaard and Fredsoe (2013) for details. In this formulation the distance between the computational nodes on the shoreline can increase (or decrease), when the distance between shoreline nodes become too large (or small), shoreline nodes are added (or removed). An example where this type of model shows its strength is the case of a growing spit; around the tip of the spit the shoreline is highly curved, and the traditional formulation cannot be used. An idealized growing spit is shown in Figure 6 where the initial bathymetry (a) is shown together with 3 stages of the development (b, c and d). On the off-shore boundary the significant wave height is 1 m, the peak wave period is 5 s and the mean wave direction is -30 degrees from North. The coastal profile is a linear profile with a slope of 1:100 in the active zone which extends to a water depth of 5 m.; outside the active zone the water depth is constant equal to 5 m. In Figure 6 it is seen that the spit is growing in a south-eastward direction, the small shoreline undulations on the spit are probably due to the relatively coarse resolution of the mesh.
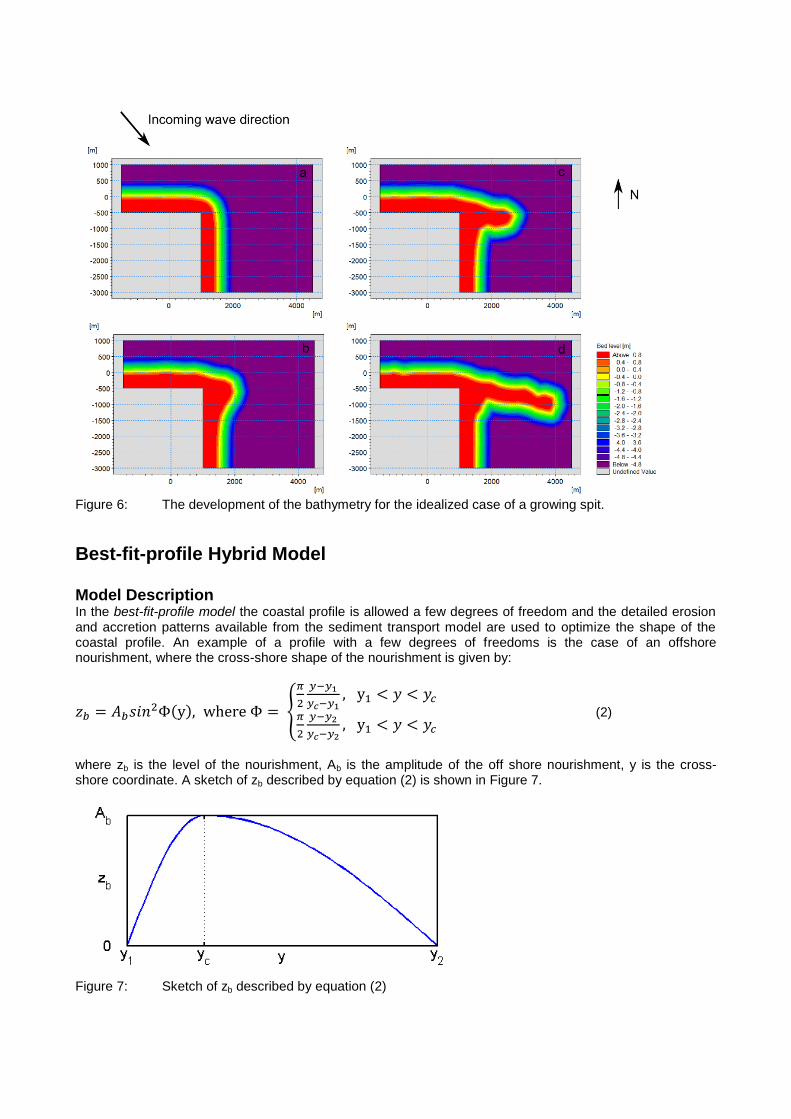
Figure 6: The development of the bathymetry for the idealized case of a growing spit.
Best-fit-profile Hybrid Model Model Description In the best-fit-profile model the coastal profile is allowed a few degrees of freedom and the detailed erosion and accretion patterns available from the sediment transport model are used to optimize the shape of the coastal profile. An example of a profile with a few degrees of freedoms is the case of an offshore nourishment, where the cross-shore shape of the nourishment is given by:
( ) {
(2)
where zb is the level of the nourishment, Ab is the amplitude of the off shore nourishment, y is the cross-shore coordinate. A sketch of zb described by equation (2) is shown in Figure 7.
Figure 7: Sketch of zb described by equation (2)
The width and the position of the nourishment on the cross-shore profile are optimized based on the erosion and accretion pattern on each profile, whereas the height of the nourishment is determined from the continuity equation.
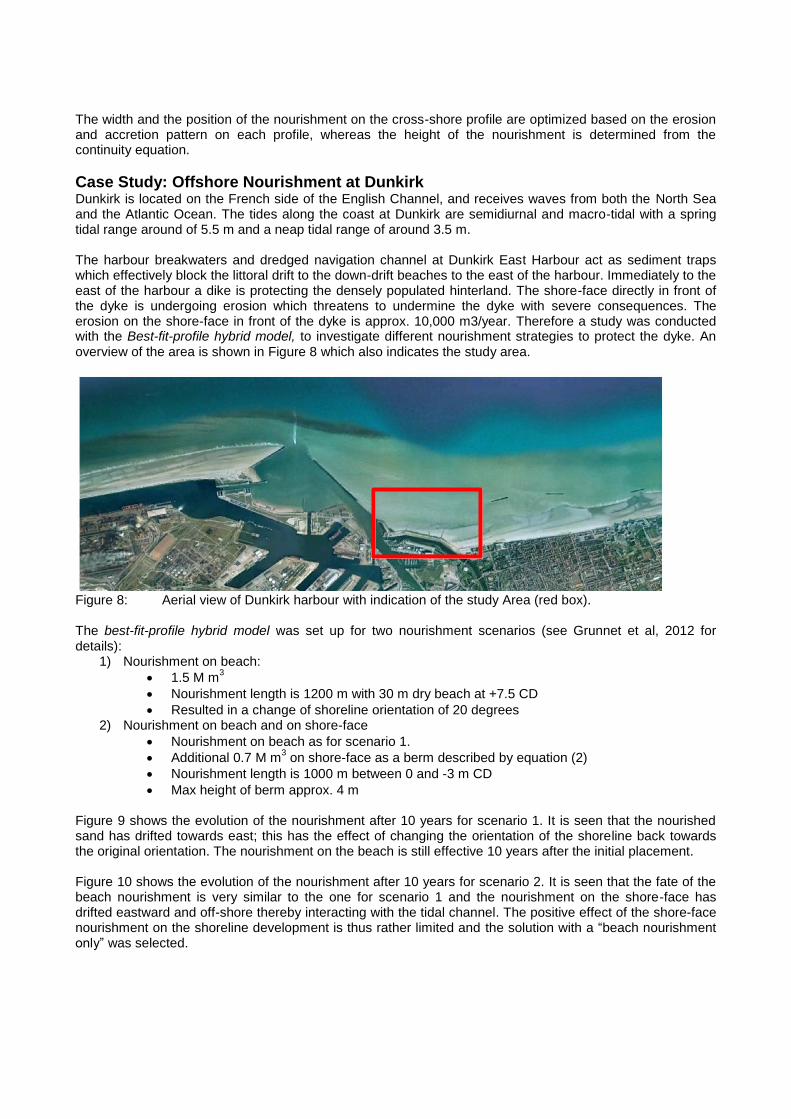
Case Study: Offshore Nourishment at Dunkirk Dunkirk is located on the French side of the English Channel, and receives waves from both the North Sea and the Atlantic Ocean. The tides along the coast at Dunkirk are semidiurnal and macro-tidal with a spring tidal range around of 5.5 m and a neap tidal range of around 3.5 m. The harbour breakwaters and dredged navigation channel at Dunkirk East Harbour act as sediment traps which effectively block the littoral drift to the down-drift beaches to the east of the harbour. Immediately to the east of the harbour a dike is protecting the densely populated hinterland. The shore-face directly in front of the dyke is undergoing erosion which threatens to undermine the dyke with severe consequences. The erosion on the shore-face in front of the dyke is approx. 10,000 m3/year. Therefore a study was conducted with the Best-fit-profile hybrid model, to investigate different nourishment strategies to protect the dyke. An overview of the area is shown in Figure 8 which also indicates the study area.
Figure 8: Aerial view of Dunkirk harbour with indication of the study Area (red box).
The best-fit-profile hybrid model was set up for two nourishment scenarios (see Grunnet et al, 2012 for details):
1) Nourishment on beach:
1.5 M m3
Nourishment length is 1200 m with 30 m dry beach at +7.5 CD
Resulted in a change of shoreline orientation of 20 degrees 2) Nourishment on beach and on shore-face
Nourishment on beach as for scenario 1.
Additional 0.7 M m3 on shore-face as a berm described by equation (2)
Nourishment length is 1000 m between 0 and -3 m CD
Max height of berm approx. 4 m Figure 9 shows the evolution of the nourishment after 10 years for scenario 1. It is seen that the nourished sand has drifted towards east; this has the effect of changing the orientation of the shoreline back towards the original orientation. The nourishment on the beach is still effective 10 years after the initial placement. Figure 10 shows the evolution of the nourishment after 10 years for scenario 2. It is seen that the fate of the beach nourishment is very similar to the one for scenario 1 and the nourishment on the shore-face has drifted eastward and off-shore thereby interacting with the tidal channel. The positive effect of the shore-face nourishment on the shoreline development is thus rather limited and the solution with a “beach nourishment only” was selected.
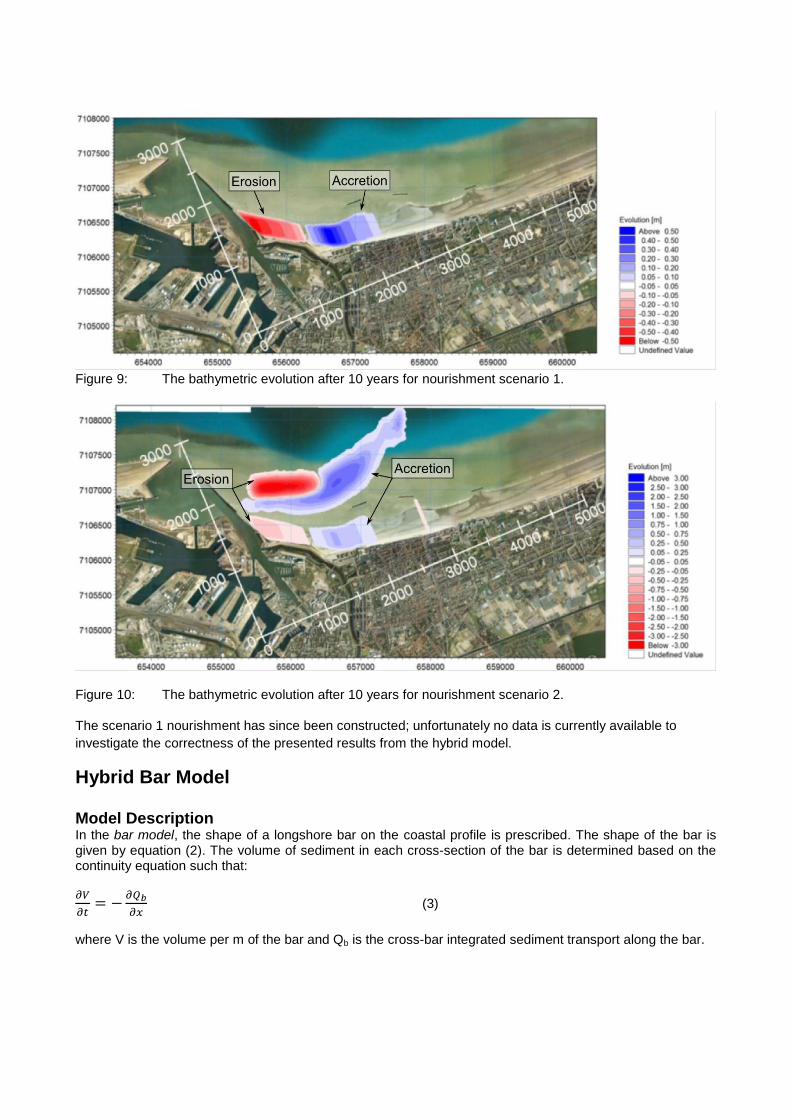
Figure 9: The bathymetric evolution after 10 years for nourishment scenario 1.
Figure 10: The bathymetric evolution after 10 years for nourishment scenario 2.
The scenario 1 nourishment has since been constructed; unfortunately no data is currently available to
investigate the correctness of the presented results from the hybrid model.
Hybrid Bar Model Model Description In the bar model, the shape of a longshore bar on the coastal profile is prescribed. The shape of the bar is given by equation (2). The volume of sediment in each cross-section of the bar is determined based on the continuity equation such that:
(3)
where V is the volume per m of the bar and Qb is the cross-bar integrated sediment transport along the bar.
The position, width and skewness of the bar are determined based on the streamlines of the flow at the crest of the bar (at yc in Figure 7) and at both sides of the bar (at y1 and y2 in Figure 7) using a response function given by:
( )
where T governs the time scale of the response. T is a function of the sediment volume of the bar such that T is small when V is small. yc,stream is the location of the streamline at the crest of the bar. For y1 and y2 similar response functions are used.
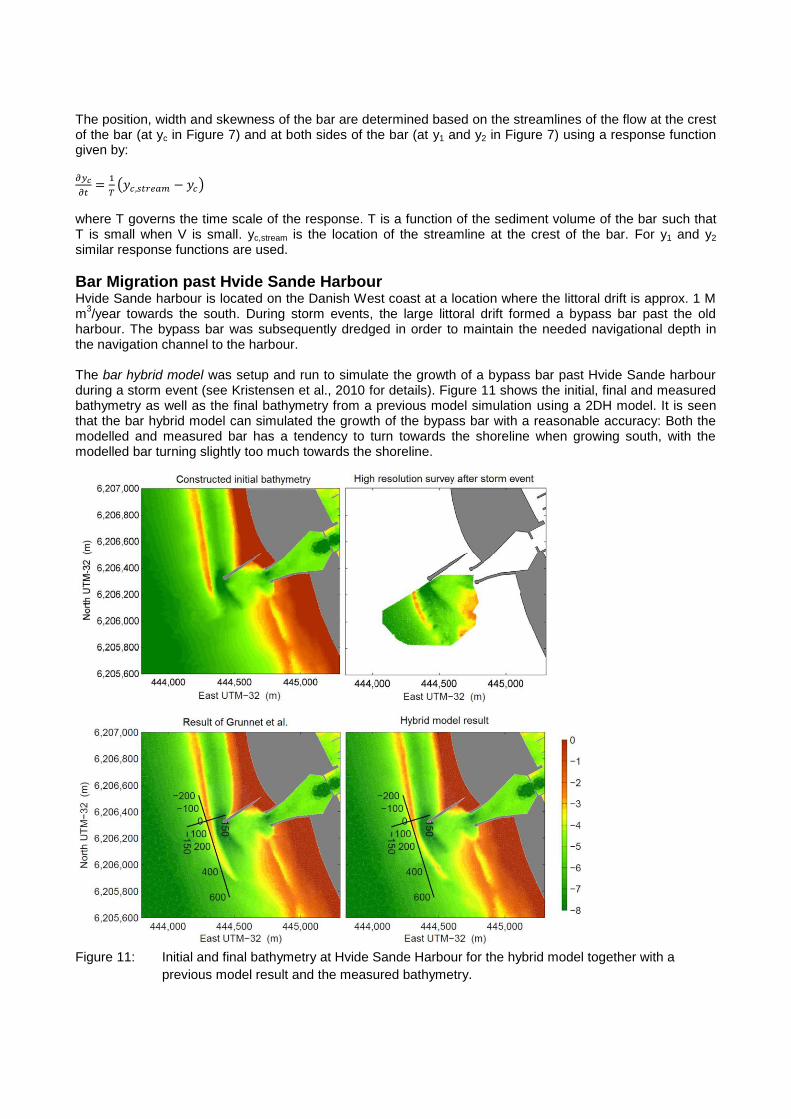
Bar Migration past Hvide Sande Harbour Hvide Sande harbour is located on the Danish West coast at a location where the littoral drift is approx. 1 M m
3/year towards the south. During storm events, the large littoral drift formed a bypass bar past the old
harbour. The bypass bar was subsequently dredged in order to maintain the needed navigational depth in the navigation channel to the harbour. The bar hybrid model was setup and run to simulate the growth of a bypass bar past Hvide Sande harbour during a storm event (see Kristensen et al., 2010 for details). Figure 11 shows the initial, final and measured bathymetry as well as the final bathymetry from a previous model simulation using a 2DH model. It is seen that the bar hybrid model can simulated the growth of the bypass bar with a reasonable accuracy: Both the modelled and measured bar has a tendency to turn towards the shoreline when growing south, with the modelled bar turning slightly too much towards the shoreline.
Figure 11: Initial and final bathymetry at Hvide Sande Harbour for the hybrid model together with a
previous model result and the measured bathymetry.
Discussion and Conclusion The idealized and real examples presented in the present paper show that the hybrid modelling concept can be used to aid in the solution of different types of problems facing the modern coastal engineer; from shoreline development around shore protection structures and the shoreline development of highly curved shorelines, to the evolution of beach nourishments placed either on the shoreline or on the shore-face, and the development of a bypass-bar past a harbour entrance. The advantage of using the hybrid model concept compared to regular one-line models is that only the coastal profile is explicitly prescribed in the hybrid model, the rest of the model components are process based. In regular one-line models 2D effects such an off-shore breakwater must also be explicitly prescribed using some type of equation for the alongshore variation in the littoral drift due to the 2D phenomenon, e.g. the breakwater. The equation may be based on theoretical or empirical formulations which work quite well in simple cases, but which will usually not work so well in more complicated situations. This is not the case with the hybrid model: the process based description of the sediment transport and morphology ensures that the model can cope with simple as well as complex cases using the same formulation and most 2D processes are inherently included in the model. The improved capabilities of the hybrid model compared with previous shoreline models, does come at a cost: Much longer simulation times. Where it is computation-wise quite easy to simulate 30 years of shoreline evolution using e.g. LITLINE or GENESIS, it is much more computationally expensive to do so with a hybrid model. While the increase in computational capabilities with supercomputers somewhat off-sets the increase; intelligently selecting the representative simulation period is crucial to correctly predicting the morphological behaviour. The advantage of the hybrid models compared with traditional 2D area models is mainly that specifying the coastal profile ensures that long periods can be simulated without the degeneration of the coastal profile. In traditional 2DH area models, degeneration of the coastal profile happens in long simulations due to the accumulation of small errors in the cross-shore sediment transport description. A second advantage is that the integrated description of the morphology makes larger morphological time steps possible; this reduces computation time with hybrid models compared with traditional 2DH models. Even though we are still a long way from a morphological model giving all the answers, hybrid models used wisely can be a strong tool for modern coastal engineers.
Acknowledgements This work has been partly supported by the Danish Council for Strategic Research (DSF) under the project: Danish Coasts and Climate Adaptation – Flooding risk and coastal protection (COADAPT), project no. 09-066869.
References Dronen, N, Kristensen, S.E., Taaning, M, Elfrink, B, Deigaard, R, 2011. Long term modelling of shoreline response to coastal structures. In Proceeding of Coastal Sediments 2011, pp. 965-978. Grunnet, N., Brøker, I., Clausen, E. and Sørensen, P., 2009, Improving bypass and increasing navigation depth: A vision for Hvide Sande harbour, Denmark, In Proceedings of Coastal Dynamics 2009, vol. 6. Grunnet, N., Kristensen, S. E., Drønen, N., Deigaard, R., Tessier, C. and Forain, N., 2012, Evaluation of nourishment schemes based on long-term morphological modeling, in Proceedings of the 33
rd ICCE,
Santander, Spain Kaergaard, K and Fredsoe, F, 2013. A numerical model for shorelines with large curvature. Coastal Engineering, vol. 74, pp. 19-32. Kristensen, S.E., Deigaard, R., Taaning, M., Fredsøe, J., Drønen, N. and Jensen, J. H. (2010), Long-term morphological modelling, Proceedings of the 32
nd ICCE, Shanghai, China, ISSN 2156-1028
Kristensen, S. E., Deigaard, R., Drønen, N., Fredsoe, J. and Luger, S., 2012, Morphological modelling of the response to a shipwreck - a case study at Cape Town, in Proceedings of the 33
rd ICCE, Santander, Spain.
Pelnard-Considere, R., 1956. Essai de theorie de l'evolutio des form de rivage en plage de sable et de galets. 4th Journees de l'Hydaulique, Les Energies de la Mer, Question III, No. 1, pp. 289–298.