Embed Size (px)
Citation preview

Cop] rrgh/ Q Munkhgucird 1998 __________ ~~
ECOLOGY OF FRESHWATER FISH
ISSN 0906-6691
Long-term patterns of microhabitat use by fish in a southern Atmalachian stream from I I
1983 to 1992: effects of hydrologic period, season and fish length
Grossman GD, Ratajczak, R E Jr. Long-term patterns of microhabitat use by fish in a southern Appalachian stream from 1983 to 1992: effects of hydrologic period, season and fish length. Ecology of Freshwater Fish 1998: 7: 108-131. 0 Munksgaard, 1998
Abstract ~ We quantified microhabitat use by members of a southern Appalachian stream fish assemblage over a ten-year period that included both floods and droughts. Our study site (37 m in length) encompassed riffle, run and pool habitats. Previous research indicated that species be- longed to either benthic or water-column microhabitat guilds. Most spe- cies exhibited non-random microhabitat use in all seasons, and benthic and water column species generally were ovcr-represented in the deeper portions of the site. In addition, water column species generally were over- represented in microhabitats with lower average velocities. The majority of seasonal shifts in microhabitat use were passive (i.e. correlated with changes in microhabitat availability), whereas. most shifts associated with hydrological periods appeared to be active responses to changing en- vironmental conditions. Most species exhibited length-related shifts in microhabitat use. which were strongly affected by hydrologic period for four of ten species. Microhabitat use patterns of assemblage members appeared to be a consequence of species-specific responses to changing environmental conditions. The highly flexible patterns of microhabitat use exhibited by these species necessitate that decisions regarding their manage- ment be based on data covering a range of environmental conditions.
Un resumen en espaiiol se incluye detras del texto principal de este articulo.
G. 0. Grossman, R. E. Ratajczak Jr. Warnell School of Forest Resources, University of Georgia, Athens, USA
Key words: assemblage structure; spatial resource use; hydrologic variability; drought; stream fishes; coexistence
G. 0. Grossman. Warnell School of Forest Resources, University of Georgia, Athens, GA,
Accepted for publication January 9, 1998
30602-2152, USA
Introduction
Most fish have complex life histories that require that an individual pass through multiple develop- mental stages before reaching maturity (Moyle & Cech 1988). The ecological requirements of these stages may vary tremendously, as individuals typic- ally progress from low-motility larva to free-swim- ming young-of-the-year, and finally enter the adult life history stage. It is possible that the high level of ecological flexibility required by complex on- togenies also has contributed to the ability of many adult fishes to utilize a wide range of ecological resources. For example, not only do many temper- ate fresh-water fish species (e.g. most members of
the Salmonidae. Cyprinidae, Centrarchidae. Perci- dae) occupy multiple habitat types such as streams and lakes (Moyle & Cech 1988, Wooton 1992); even within a given habitat type, individuals some- times shift their use of spatial and trophic re- sources in response to seasonal, annual, and dis- turbance-related changes in resource availability (Angermeier 1987, Moyle & Cech 1988, Grossman & Sostoa 1994a, b, Wood & Bain 1995).
The substantial variation in resource use ex- hibited by many fishes presents a special challenge for researchers in both fish ecology and fisheries management. For example, given that fishes com- monly occupy both multiple habitat types and trophic levels during their life span, rigorous tests
108
Microhabitat use in a southern Appalachian stream
water levels affect microhabitat use by assemblage members.
The Coweeta Creek fish assemblage is domi- nated by species that are broadly distributed across North America, i.e., mottled sculpin (Cottus bair- di), longnose dace (Rhinichthys cataractae), stoneroller (Campostoma anomalum), greenside darter (Etheostoma blennioides), northern hogs- ucker (Hypentelium nigricans), creek chub (Semot- ilus atromaculatus), rock bass (Ambloplites ru- pestris) and rainbow trout (Oncorhynchus mykiss) (Lee et al. 1980, Grossman et al. in press). This assemblage also contains several species whose dis- tributions are more restricted (e.g. rosyside dace - Clinostomus funduloides, river chub - Nocomis micropogon, and warpaint shiner - Luxilus coccog- enis (Lee et al. 1980). Hence, this database should be of use to researchers and managers working on both regional and broader geographic scales. The specific questions we addressed were as follows. First, do species exhibit stable long-term patterns of nonrandom microhabitat use or does environ- mental variation in the form of seasonal or hydrol- ogically related changes in microhabitat availabil- ity have a strong impact on these patterns? Second, what effect does environmental variation have on length-related patterns of microhabitat use?
of resource-based ecological models (e.g. limiting similarity, optimal foraging, food web regulation) will require: 1) resource use data for multiple life history stages of the species being examined, and 2) quantification of how variations in resource availability affect resource use Werner & Gilliam 1984). Similar data requirements also affect our ability to develop, test, and utilize models for the conservation and management of fish populations. For example, resource use-based management models such as the Instream Flow Incremental Methodology (Bovee 1982), Habitat Suitability Index (Pajak & Neves 1987), and Index of Biotic Integrity (Fausch et al. 1990) require characteriza- tion of the ecological requirements of fish species or assemblages over the range of environmental conditions that they are likely to experience during their life span (Orth 1987). Curiously, despite the importance of resource use data to both fish ecol- ogists and fisheries managers, there are almost no long-term (i.e. 2 5 years) studies of resource use within fish assemblages (but see Ross et al. 1987). In fact, it is possible that the lack of such data has limited the ability of fish ecologists and fisheries managers to predict the effects of environmental change (e.g. climatic cycles) or perturbations (e.g. impoundments, acid precipitation) on fish assem- blages.
Given the paucity of long-term studies of re- source use by fish, we decided to quantify the use of spatial resources over a ten year-period within an assemblage of stream fishes occupying Coweeta Creek, North Carolina, USA. Most temperate streams exhibit substantial environmental vari- ation, which makes accurate quantification of the inhabitant’s ecological requirements particularly important for tests of theory or scientific manage- ment. In fact, environmental variation in Coweeta Creek was substantial during our study, and this drainage experienced near record values for both high and low annualized mean daily flows over the course of our research (Grossman et al. 1995a). Hence, these data should yield useful information on how extensive fluctuations in flow rates and
Methods
This study augments earlier work by Grossman & Freeman (1987), which presented data from the first two years (1983-1984) of this study, and comple- ments a companion paper which focuses on how en- vironmental variation affects assemblage structure, and potential competitive and predatory interac- tions among these fishes (Grossman et al. in press). Hence, many of our methods have been described elsewhere and will be reiterated only briefly.
The study site
We observed fishes in a 37-m section of Coweeta Creek. This site encompassed the home ranges of
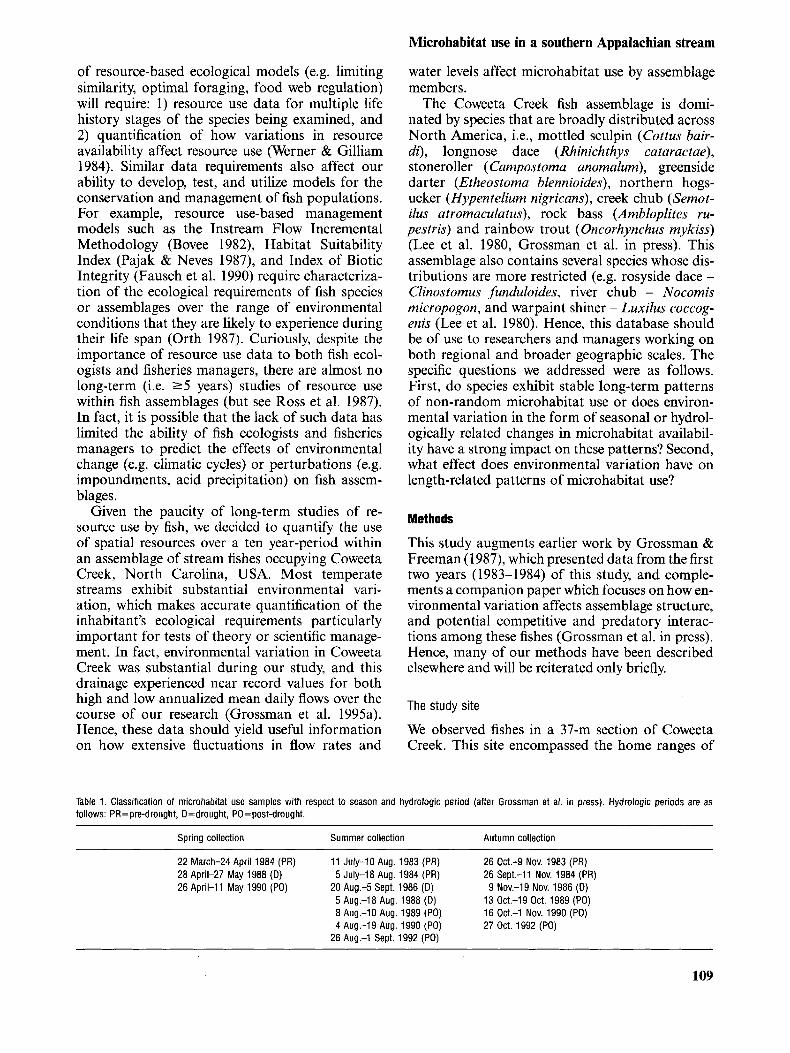
Table 1. Classification of microhabitat use samples with respect to season and hydrologic period (after Grossman et al. in press). Hydrologic periods are as follows: PR=pre-drought, D=drought, PO=post-drought.
Spring collection Summer collection Autumn collection
22 March-24 April 1984 (PR)
26 April-11 May 1990 (PO)
11 July-10 Aug. 1983 (PR)
20 Aug.4 Sept. 1986 (D) 5 A~g . - l 8 Aug. 1988 (D) 8 Aug.-lO AUg. 1989 (PO)
26 Oct.-9 NOW 1983 (PR)
9 Nov.-l9 Nov. 1986 (D) 13 0ct.-19 Oct. 1989 (PO) 16 0ct.-1 NOV. 1990 (PO)
28 April-27 May 1988 (D) 5 July-18 AUg. 1984 (PR) 26 Sept.-11 Nov. 1984 (PR)
4 Aug.-l9 Aug. 1990 (PO) 26 Aug.-1 Sept. 1992 (PO)
27 Oct. 1992 (PO)
109

Grossman & Ratajczak
Seasonal samples
Comoonent 1
* spring a
0 summerb . autumn *
-0.4 -0.2 0 0.2 0.4 0.6
%Silt 4.71 % Debris -0.53 % Sand -0.44
Component 4
Ave. velocity 0.85 % Cobble 0.51 %Gravel 0.41
% Boulder -0.51 Depth 0.44
Fig. 1. Principle components that exhibited significant seasonal differences in microhabitat availability analysis. We have only presented variables with loadings >10.401 on a given compo- nent. Sample abbreviations indicate the season (i.e., Sp=spring, S=summer, and A=autumn) followed by the last two digits of the year. Seasonal means with the same letter did not differ significantly using Kruskal-Wallis tests coupled with Tukey- Kramer a posteriori tests on mean component scores. These data are after Grossman et al. (in press).
many of the resident species in this assemblage (Hill & Grossman 1987, Freeman et al. 1988). The site was located in a fifth order section of Coweeta Creek and consisted of riffle-run-pool habitat. Streams with visually similar physico-chemical and biological characteristics are found throughout the southern Appalachian region.
Microhabitat availability
We defined and quantified microhabitat availabil- ity using the methods of Grossman & Freeman (1987) and the sampling regime (Table 1) of Grossman et al. (in press). In brief, availability data were collected by measuring depth (by straightedge, nearest cm), average velocity (elec- tronic velocity meter20.1 c d s , criteria of Bovee & Milhous 1978), and the percentage contribution (visual estimate) of the following materials (bed- rock, boulder, cobble, gravel, sand, silt, and debris) to the substratum in randomly located 20x20 cm quadrats (Grossman & Freeman 1987). Between 30 and 50 quadrats were examined per sample (see Grossman & Freeman 1987). We categorized sub- strata other than debris on the basis of maximum
particle dimensions (bedrock [embedded to the surface] & boulders [unembedded particles] > 30 cm, cobble 1 3 0 and >2.5 cm, gravel 52.5 cm and >0.2 cm, sand 50.2 cm, and silt - material that was capable of suspension in the water column, Grossman & Freeman 1987). Debris was not sep- arated into size classes (Grossman & Freeman 1987). We collected microhabitat availability data either during, or just after, a several day to several week period of fish microhabitat use observations. Microhabitat availability and fish microhabitat use measurements always were made on separate days. Microhabitat availability data for the autumn 1986 sample were strongly affected by a storm, hence, these data were not used for analyses of: 1) non- random microhabitat use, and 2) seasonal or hy- drologically related shifts in microhabitat use. Water temperature data indicate that the drought only produced slight, albeit inconsistent, increases in this parameter in the site (Grossman et al. in press), and as a consequence, will not be rede- scribed.
Between 1985 and 1988, the southeastcrn United States experienced a severe drought, which resulted in low mean daily flows in Cowee- ta Creek (Grossman et al. 1995a). Consequently, we also classified samples on the basis of their temporal relationship to the drought [i.e. pre- drought, drought, or post-drought, Table 11.
Hydrologic periods
Component 1
0 predrought ' *drought'
post drought
sea SPM s84 s83 A84, I S @ / A 8 3 A92 S90 s89 S92 A89 Sp90 Sp84 A90 ,L, *.', , ,m, , , .. , , I , , w , . , , 0. , , -0.4 -0.2 0 0.2 0.4 0.6
% Silt -0.71 X Debris -0.53 %Sand -0.44
Component 2
Ave. velocity 0 85 % Cobble 0.51 %Gravel 0.41
0 predrought a * droughtb post drought
96 Cobble -0.63 % Gravel -0.56
% Bedrock 0.60 % Boulder 0.58
Fig. 2. Principle component analyses for microhabitat availabil- ity data from different hydrologic periods. See Fig. 1 for further information. These data are after Grossman et al. (in press).
110

Microhabitat use in a southern Appalachian stream
Mean annaualized daily flows for these three periods averaged: 1) pre-drought - 0.33m3/s, 2) drought - 0.17m3/s, and 3) post-drought -
0.35m3/s (Grossman et al. 1985). We tested for significant differences in microhabitat availability by classifying samples on the basis of either sea- son or hydrologic period (i.e. pre-drought, drought or post-drought), and then subjected them to the principle component method of Grossman & Freeman (1987) (see statistical analysis - seasonal differences in microhabitat use). Substratum estimates that differed by less than 2% were considered within the range of ob- server error and hence equal. Although we have tried to- minimize redundancies, microhabitat availability data also were required, and hence presented, for the analysis of Grossman et al. (in press).
Fish microhabitat use
We conducted fish observations by entering the site from its downstream border and snorkeling in an upstream direction. We then recording the posi- tions of undisturbed specimens and obtained the following measurements: focal point velocity (i.e. at the fishes’ position, electronic velocity meterk0.1 cm/s), distance from substratum (straightedge, nearest cm), distance from shelter (straightedge, nearest cm), average velocity (elec- tronic velocity meterk0.l a d s , criteria of Bovee & Milhous 1978), depth (straightedge, nearest cm), and substratum composition (see microhabitat availability). Shelter was defined as any object cap- able of concealing at least 50% of the fish’s body. All techniques are described in detail in Grossman & Freeman (1987) and Grossman et al. (in press). Our observations were restricted to day light hours because these fishes appeared to be relatively quiescent, or occurred in similar micro- habitats, at night in Coweeta Creek (J. Hill, J. Bar- rett, A. Thompson, and G. Grossman, personal observations). Similar techniques have been used to quantify microhabitat use by stream fishes in both Europe and the United States (Baltz & Moyle 1985; Grossman & Freeman 1987; Greenberg 1991; Grossman & De Sostoa 1994a, b). Previous work indicated that species could be classified as members of either benthic or water column micro- habitat guilds (Grossman & Freeman 1987; Grossman et al. in press) and we have followed that convention here (benthic guild: Ca. anomalum, Co. bairdi, E. blennioides, H. nigricans, R. catar- actae; water column guilds: A. rupestris, CI. fundu- loides, L. coccogenis, N. micropogon, 0. mykiss, S. atromaculatus). In Grossman & Freeman (1987) Ca. anomalum was misidentified as Ca. oligolepis.
Statistical analysis
We quantified non-random microhabitat use using the methods of Grossman & Freeman (1987). First we subjected the microhabitat availability data for a given season to a principle component analysis using the correlation matrix. We only interpreted components that had eigenvalues >1.0 and eluci- dated ecologically meaningful patterns of vari- ation. The microhabitat use data for each species (minimum n= 5) were then multiplied by the scor- ing coefficient matrix of the availability data prin- ciple component analysis. This yielded a score for all components for each specimen, and these data were summed to provide score distributions for each species on each component. We then com- pared the score distributions for each species to those of the availability data, using a chi-square statistic (P=0.05). If a significant result was ob- tained, we partitioned the analysis to identify the significant classes within the distribution (Zar 1984). In all cases where data were tested repeat- edly, the Dunn-Sidak procedure (Ury 1976) was used to control alpha at 0.05. These techniques en- abled us to depict microhabitat use by fishes within a multidimensional habitat gradient scaled by availability. In addition, the partitioned chi-square analysis allowed us to specifically identify the sub- set of the gradient upon which species were over- or under-represented. These methods have proved useful in elucidating non-random microhabitat use in both descriptive and experimental studies of stream fishes (Grossman & Freeman 1987, Free- man et al. 1990, Grossman & Boule 1991, Grossman et al. 1995b).
We identified seasonal, hydrologic, and length- related differences in microhabitat use, by again subjecting fish microhabitat data to a principal component analysis. We used these data to test for significant differences in mean component scores with respect to the parameter of interest (i.e. season, hydrologic period or length class). Significant differences in principal component analysis scores were assessed using Kruskal-Wallis tests and Tukey-Kramer a posteriori tests. We also examined results for potential biases caused by covariation among parameters (e.g. were sea- sonal differences in microhabitat use affected by seasonal changes in mean fish length). Length classes were arbitrarily chosen to maximize the number of classes examined while ensuring that the number of specimens per length class was still sufficient for statistical testing (i.e. n 25). For length-related analyses, we first tested for signifi- cant differences in mean fish length across sea- sonal samples and hydrologic periods. Because most species exhibited such differences, we con-
111

Grossman & Ratajczak
ducted analyses on two data sets: one which in- cluded specimens from all samples pooled, and the second consisted of separate data sets for each seasonal sample. Two analyses were war- ranted because data from individual seasons fre- quently yielded non-significant results. Examin- ation of these data, however, suggested that this was a consequence of the small sample sizes pro- duced when data for a given species from a single seasonal sample were then separated into differ- ent size groups.
Results Effects of seasonal and hydrologic variation on microhabitat availability
A majority (68%) of the variance in the micro- habitat availability data set was explained by the significant components from the PCA. Three eco- logically interpretable components were extracted from availability data, although only two of these exhibited significant differences among either sea- sonal or hydrologic periods (Fig. l , 2). In sea- sonal analysis, component one indicated that spring samples had the highest water velocities, greatest quantities of cobble and gravel and low- est amounts of depositional substrata. In con- trast, summer samples had the lowest water velo- cities, lowest amounts of gravel and cobble and greatest amounts of depositional substrata (Fig. 1). Autumn samples had intermediate character- istics and were not statistically distinguishable from either spring or summer samples. The re- sults for component four demonstrated that sum- mer samples had shallower depths with greater quantities of boulders than autumn samples. Our seasonal microhabitat availability analyses prob- ably were influenced by unequal sampling effort (e.g. autumn data lacked drought samples).
Hydrologic analysis demonstrated that post- drought samples had the highest water velocities, greatest quantities of erosional substrata, and low- est amounts of depositional substrata (Fig. 2). In contrast, samples from the drought had the lowest water velocities, lowest amounts of erosional sub- strata and greatest quantities of depositional sub- strata. Samples from pre-drought were intermedi- ate between post-drought and drought samples, al- though they did not differ from drought on component 1. The analysis of availability data by hydrologic period yielded a greater level of statisti- cal separation among samples than seasonal analy- ses (Fig. 2), which suggests that the drought had a stronger effect on microhabitat availability than seasonal variation.
Non-random microhabitat use
The principal component analysis of microhabitat availability data from individual seasonal samples extracted significant components that explained between 75 and 80% of the variance present in the availability data sets. All principal component analysis from individual samples extracted be- tween three and four significant components, al- though species generally did not display non-ran- dom microhabitat use on all components (Table 2). The primary microhabitat gradient elucidated by the principal component analysis (Table 2) separ- ated high-velocity areas with a substratum domi- nated by erosional materials from low-velocity microhabitats with a substratum consisting mostly of depositional materials (Table 2). In four of ten samples, depth was positively correlated with water velocity, and regardless of velocity, depth generally was positively correlated with increasing quantities of erosional substrata and frequently correlated with decreasing quantities of depositional sub- strata (Table 2). These results indicate that the site contained elements of a riffle-run-pool continuum; however, the presence of deep high velocity areas dominated by erosional substrata suggests that such a characterization is overly simplistic for this site.
Most benthic species were over-represented in deeper areas of the site over erosional substrata (Table 2). Benthic guild members occasionally did not exhibit non-random use (Table 2) although this generally only involved either Co. bairdi (6 of 10 seasons) or H. nigricans (3 of 6 seasons) and did not appear to be related to sample size (Table 2). With respect to species-specific responses (in order of numerical abundance), Co. bairdi was found over a heterogeneous substratum whose compo- sition changed seasonally (Table 2). Rhinichthys cataractae was over-represented in both deeper areas with erosional substrata as well as shallow locations with depositional substrata. This result was produced by the fact that seasonal samples contained varying numbers of large and small R. cataractae, which have distinct patterns of non- random microhabitat use (see length-related differ- ences in microhabitat use). Campostoma anomalum typically occupied deep microhabitats with boul- der or cobble substrata, although in some seasons (e.g. spring 1988, autum 1989) boulders also were avoided (Table 2). In the three seasons during which H. nigricans exhibited non-random use, it was over-represented in deep locations that typic- ally possessed little bedrock or cobble and high amounts of boulder. In summer 1986, E. blennioid- es occupied deep microhabitats with bedrock sub- stratum (Table 2).
112

Table
2. M
eans
of
micr
ohab
itat u
se d
ata
for
PCA
cate
gorie
s in
whi
ch s
pecie
s we
re s
igni
fican
tly o
ver-
or u
nder
-repr
esen
ted.
Also
pre
sent
ed a
re m
eans
and
var
iabl
e lo
adin
gs (i
n pa
rent
hese
s) fo
r m
icmha
bita
t ava
ilabi
lity
mea
sure
men
ts. W
e on
ly pr
esen
t dat
a fo
r var
iables
with
com
pone
nt lo
adin
gs >
10.40
1. No. e
xhib
iting
Over
(R)-
Aver
age
Scor
e ca
tego
ry
Sign
ifican
t no
n-ra
ndom
or
und
er
velo
city
Dept
h %
%
%
%
%
%
%
n
Com
pone
nt
rang
e ca
tego
ries
use
(U)-r
epre
sent
ed
(cm
/s)
(cm
) be
droc
k bo
ulde
r co
bble
gr
avel
sa
nd
silt
debr
is
Sum
mer
198
6 Av
aila
bility
dat
a 50
18
23
2
20
41
11
14
7 6
1 -2
.00
to 3
.00
(-0.6
9)
(-0.6
2)
(-0.6
7)
(0.7
9)
(0.6
9)
2 -3
.00
to 1
.50
(0.5
2)
(-0.9
1)
(0.4
7)
(0.5
4)
4 -3
.50
to 2
.50
(0.5
9)
(0.5
6)
(-0.5
1)
Ci. f
undu
loid
es
36
2 -
1.00
to 2
.00
0.50
to 2
.00
32
R 43
1
15
32
Co. b
aird
i 32
No
sig
nific
ant c
ateg
orie
s E.
blen
nioi
des
64
0.
00 to
4.0
0 1 .
OO to
4.0
0 5
R 37
16
2
N. m
icrop
ogon
22
No
sig
nific
ant c
ateg
orie
s 0.
myk
iss
5 No
sig
nific
ant c
ateg
orie
s R.
cat
anct
ae
10
2 -1
.50
to 0
.50
-0.5
0 to
0.0
0 4
R 22
4
6 3
S. at
rom
acul
atus
12
1
-1.5
0 to
3.50
1 .
OO t
o 3.
50
6 R
1 7
1 47
19
2
0.00
to 2
.00
1 .oo t
o 2.
00
11
R 52
0
12
26
Sprin
g 19
88
Avai
labi
lity d
ata
30
22
31
4 5
48
12
15
12
5 1
- 1.5
0 to
2.0
0 (-0
.85)
(-0
.64)
(0
.81)
(0
.82)
(0
.44)
2
-3.0
0 to
2.5
0 (0
.65)
(-0
.44)
(0
.56)
(-0
.55)
(0
.48)
4
-3.5
0 to
2.5
0 (-0
.56)
(0
.56)
(0
.44)
Ca
. ano
mal
um
17
1 -1
.00
to 0
.50
-0.5
0 to
0.0
0 9
R 23
69
13
4
1
4 -2
.50
to 1
.00
-2.5
0 to
-1.
50
7 R
5 1
1 Ci
. fun
dulo
ides
45
1
-1.0
0 to
2.5
0 -1
.50
to -
1.00
0’
U 45
71
3
1 3
Go. b
aird
i 27
No
sig
nific
ant c
ateg
orie
s W
L.
cocc
ogen
is 24
1
--1.5
0 to
1.0
0 -0
.50
to 0
.00
11
R 18
54
8
5 2
B M.
micr
opog
on
25
No s
igni
fican
t cat
egor
ies
5’
0. m
ykiss
20
1
-1.5
0 to
2.0
0 -0
.50
to 0
.00
7 R
10
51
13
4 1
No s
igni
fican
t cat
egor
ies
R. c
atar
acta
e 9
Su
mm
1988
$ 5
3 -2
.00
to 3
.00
(0.4
0)
(0.5
2)
(0.6
7)
(-0.5
8)
s
Ca. a
nom
alum
17
3
0.00
to 2
.50
-0.5
0 to
0.0
0 0’
U 14
19
0
6 2
4 -0
.50
to 3
.50
1.50
to 3
.50
7 R
28
3 4
e GI
. fun
dulo
ides
35
1
-1.0
0 to
3.0
0 -1
.50
to -
1.00
0’
U 19
48
2
0 0
c)
3 -1
.50
tO 2
.50
-0.5
0 to
0.0
0 4
U 13
40
0
20
4 -2
.00
to 2
.50
0.00
to 0
.50
2 U
0 1
0 er
2 -1
.OO
to 2
.50
1.50
to 2
.00
6 R
63
0 89
0
1 F5
1 -1
.00
to 2
.50
-0.5
0 to
0.0
0 16
R
18
38
6 6
2 g a 0 r
P
CT
CD
0 w
Avai
labi
lity d
ata
30
12
20
8 3
53
15
8 11
2
1 -2
.00
to 2
.00
(-0.6
8)
(-0.6
8)
(0.4
0)
(0.8
0)
(0.6
7)
4 --2
.50
to 3.
00
(0.5
3)
(-0.4
1)
(0.4
2)
+ s

CI c
Table
2. (
cont
inue
d)
A
v) E
No. e
xhib
iting
Over
(R)-
Aver
age
Scor
e ca
tego
ry
Sign
ifican
t no
n-ra
ndom
or
und
er
velo
city
Dept
h %
%
%
%
Yo
Yo
%
fp
R
n Co
mpo
nent
ra
nge
cate
gorie
s us
e (U
)-rep
rese
nted
(c
m/s
) (c
m)
bedr
ock
boul
der
cobb
le
grav
el sa
nd
silt
debr
is
Go. b
aird
i 26
4 4 4
N. m
icrop
ogon
25
1 3 4 4
0. m
ykiss
21
4
R. c
afar
acfa
e 19
3 4
S. af
rom
acul
afus
22
1 3
H. n
igric
ans
a3
L. co
ccog
enis
16
1
-0.5
0 to
3.0
0 -1
.00
to 3
.00
0.00
to 3
.50
0.00
to 4
.00
-0.5
0 to
2.5
0
-0.5
0 to
2.5
0 -1
.00
to 3
.50
-0.5
0 to
4.0
0 -0
.50
to 4
.00
-1.0
0 to
2.0
0 -1
.50
to 3
.00
-0.5
0 to
4.5
0 -0
.50
to 3
.00
-1 .O
O to
3.0
0
0.50
to 1
.OO
10
1 .OO
to 3
.00
4 1 .O
O to
3.5
0 5
0.50
to 1
.OO
7 0.
50 t
o 4.
00
14
-1.5
0 to
-1.
00
0’ -0
.50
to 0
.00
0’ -1
.00
to -
0.50
0’
0.00
to 0
.50
1 1.
50 to
2.0
0 6
1.50
to 4
.50
9 1.
50 to
3.0
0 6
1.50
to 2
.00
4
1 .OO
to 3
.00
a
R R 10
75
R R
6 R U
19
U 14
19
U U R R
22
35
R R 2
R 9
61
0 32
22 9 0 0 0 2 31
29
19
7 4
7 4
4 19
33
5
4 5
2 48
2
0 0
10
0 4
0 5
7
2 6
1 3
23
11
6 6 1
Sum
mer
198
9 Av
ailab
ility
data
GI. fu
ndul
oide
s
Go. b
aird
i H.
nig
rican
s L.
cocc
ogen
is N. m
icrop
ogon
0. m
ykiss
S. af
rom
acul
afus
35
1 -2
.50
to 2
.00
2 -2
.50
to 1
.50
3 -2
.00
to 3
.00
4 -3
.00
to 2
.00
35
1 -0
.50
to 2
.00
3 -1
.oo t
o 2.
00
19
1 -0
.50
to 2
.00
5 84
0.
00 to
2.5
0 11
1
-0.5
0 to
1 .OO
2
-0.5
0 to
0.5
0 4
-1.0
0 to
2.5
0 21
4
-2.0
0 to
2.5
0 11
1
-0.5
0 to
1 .O
O 2
-3.0
0 to
0.5
0 3
0.00
to 2
.00
-1.0
0 to
-0.
50
-1.5
0 to
-1.
00
-0.5
0 to
0.0
0
1 .OO
to 2
.50
0.00
to 0
.50
0.00
to 0
.50
1 .OO
to 1
.50
1.50
to 2
.50
-0.5
0 to
0.0
0 -3
.00
to -
1.50
0.
50 to
2.0
0
0’ 0’ 8
U U R
31
32
(0.4
9)
(0.6
1)
(0.7
1)
(0.5
6)
11
27
26
16
40
No s
igni
fican
t cat
egor
ies
23
79
27 8
60
2 64
13
16
43
(0.5
4)
(0.4
9)
(-0.4
2)
(-0.6
3)
(0.5
7)
(0.5
0)
(-0.5
4)
(0.7
2)
4 0
53
0 5
48
0 76
2
9 65
0
10
73
10
68
0 0
32
0 8
16
0 88
7 (-0
.46)
(-0.6
8)
2 21
11
4
17
(-0.7
4)
(0.4
3)
35 4 22
15
31
34
2 2
(0.4
7)
(-0.
65)
(-0.4
7)
3 3 2
16
19
18
Autu
mn
1989
Av
ailab
ility
data
34
35
30
6
6 55
12
10
3
8 1
-2.5
0 to
1.5
0 (0
.87)
(0
.56)
(0
.72)
(0
.49)
(-0
.53)
(-
0.48
) (-0
.56)
2
-3.0
0 to
3.5
0 (0
.41)
(-0
.57)
(0
.72)
(-
0.51
) 3
-2.0
0 to
2.0
0 (0
.43)
(0
.58)
(0
.55)
(-0
.43)
4
-2.5
0 to
1.5
0 (-0
.53)
(0
.42)
(-
0.66
) A.
rupe
stris
5
1 -2
.50
to -0
.50
-2.5
0 to
-0.
50
5 R
4 68
27
6
28
13
25
2 0.
00 to
1.5
0 0.
50 to
1.5
0 4
R 68
0
25
14

Table
2. (
cont
inue
d)
No. e
xhib
iting
Ov
er (R
)- Av
erag
e Sc
ore
cate
gory
Si
gnific
ant
non-
rand
om
or u
nder
ve
locit
y De
pth
%
%
%
%
%
%
%
Ca. a
nom
alum
22
3
0.00
to 4
.50
0.00
to 0
.50
13
R 67
0
0 4
0.00
to 4
.50
1.50
to 4
.50
6 R
67
9 79
0
4 -1
.00
to 2
.50
1.50
to 2
.50
14
R 4
82
0 CI
. fun
dulo
ides
31
1
-2.5
0 to
1.5
0 -1
.50
to -
0.50
19
R
11
53
34
3 21
11
5
3 -0
.50
to 4
.50
-2.0
0 to
-0.
50
0' U
21
0 1
11
4 -3
.00
to 2
.00
-3.0
0 to
0.5
0 1
U 9
4a
16
n Co
mpo
nent
ra
nge
cate
gorie
s us
e (U
)-rep
rese
nted
(c
m/s
) (c
m)
bedr
ock
boul
der
cobb
le
grav
el
sand
si
lt de
bris
Co. b
aird
i 22
No
sig
nific
ant c
ateg
orie
s H.
nig
rican
s 7
No s
igni
fican
t cat
egor
ies
L. co
ccog
enis
21
1 -2
.00
to 1
.00
-1.5
0 to
-1.
00
6 R
11
65
19
2 31
6
17
3 -0
.50
to 3
.00
-1.0
0 to
-0.
50
0' U
25
0 1
5 4
-1.0
0 to
2.5
0 1.
50 to
2.5
0 4
R 0
70
0 N.
micr
opog
on
63
0.
00 to
3.5
0 1.
50 to
3.5
0 4
R 85
0
46
12
4 0.
50 to
2.0
0 1.
00 to
2.0
0 5
R 0
35
3 0.
myk
iss
27
3 0.
00 to
5.0
0 -1
.OO
to 0
.00
0' U
30
0 1
7 4
-3.0
0 to
3.0
0 2.
00 to
3.0
0 5
R 0
a7
0 R.
cat
arac
tae
12
1 -3
.00
to 0
.00
-3.0
0 tO
-0.5
0 11
R
6 17
25
6
27
31
9 S. atr
omac
ulat
us
8 1
-2.5
0 to
-0.
50
-2.5
0 to
-0.
50
8 R
4 69
44
1
24
14
15
3 -0
.50
to 1
.OO
0.00
to 0
.50
4 R
69
0 0
9 0.
50 t
o 2.
00
1.00
to 2
.00
7 R
0 46
1
s Sp
ring
1990
Av
aila
bility
dat
e 35
34
35
6
15
55
11
4 7
3 (0
.89)
(0
.54)
(0
.55)
(-0
.86)
(-0
.47)
8
4 -2
.50
to 2
.50
(-0.
61)
(0.6
7)
(0.5
0)
5 1
-4.0
0 to
1.5
0 2
-2.0
0 to
2.5
0 (0
.82)
(0
.62)
(0
.41)
(-0
.63)
z %
R 2
-2.0
0 to
3.0
0 -2
.00
to -
1.00
0'
U 16
0
1 76
CD
5 5'
Co
. bai
rdi
20
No s
igni
fican
t cat
egor
ies
D
4 0.
50 to
3.0
0 0.
50 to
3.0
0 4
R 0
20
3 L.
coc
coge
nis
15
1 -1
50
to 1
.50
0.50
to 1
.50
0' U
61
58
19
0 0
2 -1
.00
to 4
.00
-1.0
0 to
0.0
0 0'
U 2a
0
11
56
N. m
icrop
ogon
12
2
-0.5
0 to
3.0
0 0.
50 to
1 .O
O 5
R 76
0
5 60
Ca. a
nom
alum
8
No s
igni
fican
t cat
egor
ies
CI. f
undu
loid
es
37
1 -2
.00
to 1
.00
-1.0
0 to
0.0
0 27
R
14
51
3 8
6
4 -2
.50
to 4
.00
1 .OO
to 2
.00
18
R 0
14
H. n
igric
ans
52
0.
50 to
3.0
0 1.
00 to
3.0
0 3
R 84
0
53
15
3
4 0.
00 to
3.5
0 1.
50 to
3.5
0 5
R 0
16
20
g
S. at
rom
acul
atus
7
2
0.00
to
1.50
0.
50 to
1 .OO
3
R 65
0
0 44
c
4 1 .O
O to
3.5
0 1.
50 to
3.5
0 6
R 0
21
17
R 3 0.
myk
iss
14
2 -0
.50
to 3
.50
0.50
to 1
.00
6 R
86
0 5
72
a
3
c
3 D a C
I 01

L
a
*
Table
2. (
cont
inue
d)
9 3 E: Sc
ore
cate
gory
Si
gnific
ant
non-
rand
om
or u
nder
ve
locit
y De
pth
%
YO
YO
%
Oh
YO
YO
m R.
Sum
mer
199
0 w
Avail
abilit
y da
ta
35
20
33
15
15
40
8 16
5
1 %
3 -3
.00
to 2
.00
(0.8
4)
(0.6
4)
(-0.4
7)
P?
Cl. f
undu
loid
es
30
2 -1
.50
to 1
.DO
0.00
to
0.50
13
R
25
4 34
7
15
3 -1
.00
to 2.00
-0.50
to 0.00
1 U
30
30
8 Co
. bai
rdi
21
1 -0
.50
to 1
.50
-2.5
0 to
-1.
00
0’
U 45
64
17
0
0 H.
nig
rican
s 6
1 -0
.50
to 1
.00
-0.5
0 to
0.0
0 5
R 17
3
33
5 0
3 -0
.50
to 1
.50
0.50
to
1.50
5
R 78
40
11
0.
myk
iss
13
1 -0
.50
to 1
.00
0.00
to 0
.50
8 R
13
0 53
7
0 R. ca
tara
ctae
9
No s
igni
fican
t cat
egor
ies
S. at
rom
acul
atus
11
1
-0.5
0 to
1.5
0 0.
00 to
0.5
0 8
R 18
0
36
15
0
No. e
xhib
iting
Over
(R)-
Aver
age
n Co
mpo
nent
ra
nge
cate
gorie
s us
e (U
)-rep
rese
nted
(c
rnk)
(c
m)
bedr
ock
boul
der
cobb
le
grav
el
sand
sil
t de
bris
1 -2
.50
to 2
.00
(-0.
59)
(-0.7
4)
(0.4
7)
(0.7
7)
(0.5
7)
g-
N
0
2 -3
.00
to 2
.00
(0.5
6)
(-0.4
1)
(0.4
3)
(0.5
6)
(-0.7
8)
Autu
mn
1990
Av
ailab
ility
data
35
1 2 3 4
10
4 41
1 4
22
1 2 4
17
1 3 4 6
3
4 22
1 4
12
1 2 4
5
42
42
(-0.7
7)
(0.4
0)
(0.4
9)
81
24
32
33
22
57
No s
igni
fican
t cat
egor
ies
6
12
12
(0.5
0)
(-0.6
1)
(-0.5
7)
(0.4
6)
(0.5
5)
0 47
0 21
0 0 0 0
0
56
(0.5
7)
(-0.6
3)
(-0.
41)
8 7
(0.5
8)
(0.6
8)
(0.5
3)
(-0.4
0)
2 3
(0.5
7)
(0.4
6)
(0.5
9)
(0.4
8)
9 0
0 1 0
2 8
41
-1.5
0 to
2.5
0 -2
.50
to 3
.00
-2.5
0 to
3.0
0 -2
.50
to 2
.00
0.50
to 3
.50
0.00
to 3
.50
-1 .O
O to
3.5
0
-0.5
0 to
4.0
0 -2
.00
to 3
.00
-2.5
0 tO
3.5
0
Ca. a
nom
alum
GI
. fun
dulo
ides
1 .
OO to
3.5
0 -1
.50
to -
0.50
-2
.50
to 0
.00
-1.0
0 to
-0.
50
1 .OO
to 1
.50
2.00
to
3.50
0 0
Co. b
aird
i 69
52
2
18
H. n
igric
ans
1. co
ccog
enis
-1 .O
O to
2.5
0 -1
.50
to 3
.50
0.50
to 3
.50
-0.5
0 to
2.0
0 -0
.50
to 2
.50
-1 .o
o to
2.00
-2
.50
to 2
.50
0.00
to 4
.00
-2.0
0 to
2.0
0 -0
.50
to 5
.00
0.50
to 1
.OO
2.00
to 3
.50
1 .OO
to 3
.50
1 .OO
to 3
.00
1 .OO
to 2
.50
1.50
to 2
.50
1.50
to 4
.00
1 .OO
to 1
.50
1.00
to 1
.50
-1.0
0 to
-0.
50
6 8 16 4 5 1 7 8 5 5
R R R R R U R R R R
31
0 8
3 4
0 90
0
57
40
0 32
0 0
54
0 0 0 19
3 4
86
4 N.
micr
opog
on
0. m
ykiss
R. c
atar
acta
e
18
23
19
78
86
33
40
41 3
1 0
0 5 31
22
24
10
0 0
18
35
23
5

Table
2. (
cont
inued
)
No. e
xhib
iting
Ov
er (R
)-
Aver
age
Scor
e ca
tego
ry
Sign
ifica
nt
non-
rand
om
or u
nder
ve
locity
De
pth
%
%
Yo
%
Yo %
%
si
lt de
bris
n Co
mpo
nent
ra
nge
cate
gorie
s us
e (U
)-rep
rese
nted
(c
m/s)
(c
m)
bedr
ock
boul
der
cobb
le gr
avel
sand
Sum
mer
199
2 Av
ailab
ility
data
Cl. fu
ndulo
ides
Co. b
aird
i L.
coc
coge
nis
0. m
ykiss
R. ca
tara
ctae
S. at
rom
acula
tus
35
1 2 3 33
1 3
19
20
1 19
13
91
2
-3.0
0 to
1.5
0 -2
.00
to 2
.00
-2.0
0 to
2.5
0 -1
.00
to 1
.50
-1 .o
o to
2.00
-3
.00
to -
1.50
-2
.00
to -1
.oo
-1 S
O to
1 SO
-0
.50
to 0
.00
-1.5
0 to
1.0
0 -1
.OO
to 0
.50
-1.5
0 to
-0.
50
-1 .O
O to
-0.
50
36
36
(0.8
7)
(0.7
2)
0' U
7 14
0'
U No
signi
fican
t cat
egor
ies
No s
igni
fican
t cat
egor
ies
No s
igni
fican
t cat
egor
ies
11
R 12
76
5 R
10
68
3 R
9 21
(-0.5
4)
(-0.
43)
(0.5
2)
(0.4
8)
1 0 20 6
0 25
36
10
13
8 3
(-0.
88)
(-0.5
5)
(0.8
0)
(0.8
2)
(0.7
2)
40
33
16
7 2
10
0 18
3
Autu
mn
1992
Av
ailab
ility
data
35
26
33
9
14
49
8 4
7 9
1 -2
.50
to 1
.50
(0.8
3)
(0.6
7)
(0.7
1)
(-0.
66)
(-0.5
8)
3 -2
.00
tO 3
.00
(0.8
7)
(-0.
44)
(-0.
80)
CI. fu
ndulo
ides
14
No s
igni
fican
t cat
egor
ies
Co. b
aird
i 10
No
sig
nific
ant c
ateg
ories
L.
coc
coge
nis
10
1 -1
.50
tO 1
.00
-1.5
0 to
-0.
50
4 R
4 41
0
13
lo
s 0.
myk
iss
9 No
sig
nific
ant c
ateg
ories
a
3 -1
.50
to 0
.50
-2.0
0 tO
-1.
00
7 R
0 32
9
er
P
'If n
umbe
r of f
ish
is 0
(und
er-re
pres
ente
d), m
icroh
abita
t use
dat
a we
re ta
ken
from
micr
ohab
itat a
vaila
blity
data
for t
he s
igni
fican
t cat
egor
ies.
E
5'
P * c z a
a P
n
P 3
cn

Grossman & Ratajczak
The majority of water column species exhibited non-random microhabitat use in every season in which they were present at sample sizes greater than six (Table 2). The sole exception to this find- ing was N . micropogon, which failed to display non-random use in both summer 1986 and spring 1988 despite relatively large sample sizes (Le. 22 and 25 respectively). Water column species gener- ally occupied deeper portions of the study site, however, these species shared few other microhabi- tat characteristics. Intraspecific analyses indicated that CI. funduloides avoided shallow microhabitats with high amounts of gravel and little bedrock and boulder (Table 2). This species tended to be both over-represented in areas with lower average velo- cities and under- represented in locations with high average velocities (Table 2). On occasion, however, it also was under-represented in low velocity microhabitats. Responses to other substrata were inconsistent, with a given substratum type being over-represented in some seasons and under-repre- sented in others (Table 2). In general, CI. funduloid- es exhibited highly variable patterns of microhabi- tat use.
The remaining water column species displayed a variety of microhabitat use patterns. Oncorhynchus rnykiss occupied microhabitats with large quan- tities of cobble and little bedrock. In addition, this species occasionally was over-represented in either deep microhabitats or those with lower average velocities (Table 2). Luxilus coccogenis also was over-represented in deeper, lower velocity micro- habitats with high amounts of boulder and little gravel (Table 2). Nucvmis micropogon was over- represented in deep microhabitats with high amounts of debris and little bedrock or gravel. Se- riiotilus atrornaculatus occupied deep, lower velo- city microhabitats with low amounts of erosional substrata and high quantities of depositional sub- strata (Table 2). Sample sizes for A. rupestris only were sufficient for microhabitat analysis in autumn 1989. During this season, A . rupestris was over- represented in deep, low-velocity locations, domi- nated by depositional substrata, with lower than average amounts of cobble and gravel.
Seasonal and hydrologic period differences in microhabitat use
Many seasonal changes in microhabitat use were unambiguously correlated with changes in micro- habitat availability (e.g. species occupied deeper microhabitats with higher focal point velocities during seasons in which mean depth and average velocity were significantly grcater, Fig. 1, Table 3). For brevity, these results are not extensively de- scribed. Significant components from seasonal
analyses extracted lower amounts of variance from the microhabitat use data sets than principal com- ponent analysis for hydrologic analyses [mean and (range) of variance extracted for benthic species: seasonal= 22Y0 (9%52), hydrologic period=40%, (1 5-54), water column species: seasonal=38% (23- 56): hydrologic period=43% (3-60)]. This differ- ence was more pronounced for benthic than water column species, and members of the latter guild had more flexible patterns of microhabitat use than benthic guild members.
Benthic guild members
The members of the benthic guild (i.e. Ca. arnoma- lum, Co. bairdi, E. blennioides, H. nigricans, R. cat- aractae) did not display similar patterns of sea- sonal or hydrologically linked shifts in microhabi- tat use. Instead, these species appeared to be responding to environmental variation in a species- specific manner.
The two numerically dominant benthic species, Co. buirdi and R. cataractae both displayed sig- nificant seasonal and hydrologic shifts in micro- habitat use. The significant seasonal differences ex- hibited by Co. bairdi were attributable to seasonal changes in habitat availability (Fig. 1, Table 3). In hydrologic analyses, however, Co. hairdi occupied deeper microhabitats with higher average velo- cities, greater quantities of erosional substrata and lower amounts of depositional substrata during the pre-drought period than in drought or post- drought samples (Table 4). The seasonal and hy- drologic microhabitat shifts displayed by R. catar- actae probably were produced by the significant differences in mean length displayed by this species in both seasonal and hydrologic analyses (Tables 3-4). This conclusion is warranted because sea- sonal and hydrologic microhabitat shifts were vir- tually identical to those elucidated by length-re- lated analyses.
We observed significant seasonal differences in microhabitat use by Ca. anomalum that were at- tributable to seasonal changes in microhabitat availability (Fig. 1 , Table 3). In contrast, hydrolog- ic analyses demonstrated that Ca. anomalum occu- pied deeper microhabitats farther from shelter dur- ing the post-drought period, than in either pre- drought or drought samples (Table 4). In addition, this species occurred in deeper locations, farther from the substratum and shelter, over more cobble during the drought than in the pre-drought period. Finally, during the drought, Ca. anomalum was over-represented in microhabitats with more bed- rock and gravel and less cobble and debris than in post-drought samples.
Hypentelium nigricans and E. blennioides dis-
118

Microhabitat use in a southern Appalachian stream
Table 3. Seasonal differences in microhabitat use by Coweeta Creek fishes. Seasonal samples with less than 5 individuals were deleted from the analysis. Mean length samples with the same letter are not significantly different. Significant differences were detected using Kruskal-Wallis tests on seasonal PCA scores followed by Tukey-Kramer tests. We only present variables with component loadings d0.401.
Mean length (cm) Significant component (% variance
Species ( n) ( 4 ( n) explained) Spring (Sp) Summer (S) Autumn (A)
Benthic guild Ca. anomalum 9.3a
(43) Co. bairdi 5.3a
(1 03) E. blennioides
H. nigricans 11 .4a (5)
R. cataractae 4.7ab (15)
Significant Component loadings differences
% bedrock (0.85) S>A, Sp
% cobble (-0.69, % gravel (-0.57), average velocity s>sp
A>S
Sp, S>A
A S P , S
(-0.79), % sand (0.49), % silt (0.74), % debris (0.65) % boulder (-0.48), % silt (-0.42) % cobble (0.55), distance from shelter (0.54), % sand (0.44) % cobble (-0.63), % sand (0.57), % gravel (0.45), distance from shelter (0.43) average velocity (-0.79), % cobble (-0.59), % gravel (-0.46) % silt (0.86), distance from substratum (0.74) distance from shelter (0.61), % sand (0.51), % debris (0.45) % cobble (-0.62), % boulder (0.72), depth (0.51), focal point velocity (0.42) '10 boulder (-0.48), % bedrock (0.72), % gravel (0.43)
S>A
S>A
Water column guild CI. funduloides 5.aa
(1 50)
L. coccogenis 7.5a (47)
N. micropogon 7.P (37)
0. mykiss 9.2ab (44)
S. afromaculatus 10.0a (7)
5.6a (244)
7.3a (44)
7.aa (58) 7.4a (94) 9.4a (79)
% silt (-0.66), % debris (-0.67), focal point velocity (0.76), average velocity (0.83) % bedrock (-0.49), depth (0.61), distance from substratum (0.70), distance from shelter (0.46) % cobble (-0.69), % sand (0.47), distance from shelter (0.60) % bedrock (0.54), % boulder (-0.64) average velocity (0.76), distance from substratum (0.50), % sand (-0.48), focal point velocity (0.85) % cobble (0.70), % boulder (-0.75), depth (-0.57), % gravel (0.59) % boulder (-0.48), % bedrock (0.61)
S>A
No significant pairs
No significant pairs
S S p , A Sp>A
S, SP>A
A>S
% silt (-0.58), ah sand (-0.50) % debris (-0.43), depth (0.64), average velocity (0.76), focal point velocity (0.74) % bedrock (-0.64), depth (0.79), distance from substratum (0.57), % cobble (0.54) % sand (-0.78), % boulder (0.64)
A S P , S
SP, A S
S>A
played either seasonal or both seasonal and hy- drologic shifts in microhabitat use. In spring and summer, H. nigricans occupied locations that were farther from shelter over greater quantities of gravel and sand and lower amounts of cobble than during autumn (Table 3). During the pre-drought period, we found this species at faster focal point velocities, farther from shelter, over more cobble and sand and less bedrock or boulder than during the drought (Table 4). The differences in focal point velocity and distance from shelter may have been influenced by differences in microhabitat availability, because pre-drought samples tended to have higher average velocities than drought samples even though this difference was not statis- tically significant (Fig. 2). In autumn, we found E. blennioides farther from shelter over more rubble and sand and less boulder and silt than during summer (Table 4).
Water column guild members
As with benthic species, there were few similarities in the seasonal and hydrologically-related shifts in microhabitat use exhibited by water column guild members (Tables 3, 4). We detected both seasonal and hydrologic shifts in microhabitat use by C1. funduloides. This species occupied microhabitats with higher average and focal-point velocities and less silt and debris during summer than in autumn (Table 3). In addition, during summer we found Cl. funduloides over greater amounts of bedrock and less boulder than in either spring or autumn. With respect to hydrological shifts, many signifi- cant differences were attributable to changes in habitat availability. Nonetheless, during the post- drought Cl. funduloides occurred in deeper micro- habitats farther from the substratum at higher focal-point velocities over more boulder and less
119

Grossman & Ratajczak
Table 4. Hydrologic period differences in microhabitat use by Coweeta Creek fishes. Hydrologic periods are abbreviated as follows: pre-drought (S83-A84)-PR, drought (S86488) - D, post drought (S89-A92) - PO. Seasons with less than 5 individuals were deleted from the analysis. Mean length samples with the same superscript are not significantly different. Significant differences were detected using Kruskal-Wallis tests on PCA scores for hydrologic period data followed by Tukey-Kramer a posterior tests. We only used variables with component loadings ?10.401.
Mean length (cm) Significant components
PR D PO (% variance Significant Species ( f l ) ( f l ) ( f l ) explained) Component loadings differences
Benthic guild Ca. anomalum 9 .P 9.4a 9Aa
(60) (51) (40)
Co. bairdi 5.0a 5.2a 5.gb (196) (109) (133)
E. blennioides 7.1a 6.aa (29) (6)
H. nigricans 16.7a 14.0a 14.8a (7) (8) (28)
R. cataractae 5.5a 5.5a 3.6b (65) (38) (46)
% boulder (-0.61), % cobble (0.45), % sand (0.41), % debris (0.52), depth (0.45), distance from substratum (0.77), distance from shelter (0.46) % gravel (-0.50) depth (0.47), focal point velocity (0.63), distance from shelter (0.65) % cobble (-0.41), % gravel (0.63), % sand (0.55), % debris
% bedrock (0.86), % boulder (-0.40) average velocity (-0.79), % cobble (0.69), % gravel (-0.57), %silt (0.74), % debris (0.65). % sand (0.49) depth (0.54), % bedrock (0.53), distance from substratum (0.48), distance from shelter (0.45) % bedrock (-0.63), depth (0.53), % boulder (-0.42), distance from substratum (0.41)
(-0.42)
% boulder (-0.63), % bedrock (-0.46), % cobble (0.58), focal point velocity (0.48), distance from shelter (0.48),% sand (0.45) average velocity (-0.79), % cobble (-0.59), % gravel (-0.46), % silt (0.86), distance from substratum (0.74), distance from shelter (0.61), % sand (0.50), debris (0.45) % bedrock (-0.48), focal point velocity (0.61), % sand (0.58) % boulder (-0.48), % bedrock (0.72). % gravel (0.43)
D>PR
PO>PR. D
D>PO
D>PO PO>PR
PR>D, PO
PO, PR>D
PR>D
PO>PR, D
PO>PR P b P O
Water column guild CI. fundoloides 5.9b
(216)
L. coccogenis 8.1a (34)
N. micropogon
0. mykiss 9.7a (45)
S. atromaculatus 8.4a (1 9)
5.58 (1 49)
7.2b (53)
7.38 (85)
6.1 (54)
9.0b (34)
% silt (-0.66), % debris (-0.67), focal point velocity (0.76) average velocity (0.83) % boulder (0.69), % cobble (-0.45), ‘h gravel (-0.50), % sand (-0.59), depth (0.46) % bedrock (- 0.49), depth (0.61), distance from substratum (0.70), distance from shelter (0.46) % bedrock (0.54), % boulder (-0.64) % sand (-0.48), distance from substratum (0.50), focal point velocity (0.85). average velocity (0.76) % boulder (-0.75), depth (-0.57), % cobble (0.70), % gravel (0.59) % bedrock (-0.51), % silt (0.44), % debris (0.66) % debris (-0.60), % silt (-0.56) average velocity (0.86), focal point velocity (0.56) % gravel (-0.58), % bedrock (-0.44), % sand (-0.40), depth (0.50), % cobble (0.44), distance from substratum (0.42) % silt (-0.58), % sand (-0.50), % debris (-0.43), average velocity (0.76), focal point velocity (0.74), depth (0.64) % gravel (-0.55), % cobble (-0.52), % boulder (0.57), distance from substratum (0.51), % silt (0.41) % bedrock (-0.55), % gravel (-0.41), % cobble (0.77) % bedrock (-0.64), depth (0.79), distance from substratum (0.57), % cobble (0.54) % cobble (-0.70) % boulder (0.56), % sand (0.53) % sand (-0.78), % boulder (0.64)
PO>PR
PO>PR>D
PO>PR, D
D, P O i P R PO>D, PR
D>PR, PO
PO>D PO>D
PO>D
PO>PR>D
PO>PR, D
PO>D PO>PR, D
PO>D O>PO
gravel than in either the pre-drought or drought in pre-drought or drought. Finally, this species oc- (Table 4, Fig. 1) Focal point velocities may have cupied microhabitats with less bedrock during been affected by the fact that average velocities in post-drought and pre-drought than in the drought. the habitat were higher during post-drought than Luxilis coccogenis also exhibited both seasonal
120

Microhabitat use in a southern Appalachian stream
and hydrologic shifts in microhabitat use. In spring, this species occurred farther from the sub- stratum, at higher average and focal-point velo- cities, over lower quantities of sand than in autumn (Table 3). These results probably were influenced by shifts in microhabitat availability, because spring samples tended to have higher average velo- cities than autumn samples, despite the lack of statistically significant differences in principal component analysis scores for the two seasons (Fig. 1). During spring and summer, we also found L. coccogenis in shallower areas with more cobble and gravel and less boulder than in autumn. How- ever, L. coccogenis also were significantly larger in autumn than in either summer or spring and larger specimens occupy deeper microhabitats (Tables 3, 5). Finally, in autumn this species occupied loca- tions with more bedrock than in summer. Hy- drologic analyses indicated that, during the post- drought period, L. coccogenis occurred farther from the substratum, at faster average and focal- point velocities, over less sand than during the pre- drought period (Table 4). Because average velo- cities were higher during post-drought than pre- drought (and the percentage of sand lower), it is likely that these findings are related to changes in microhabitat availability (Fig. 2). Finally, during the post-drought period we observed this species over more debris and silt and less bedrock than in drought samples.
Like most water column species, S. atromaculatus displayed both seasonal and hydrologic shifts in microhabitat use. In spring and autumn, we found S. atrornaculatus in deeper areas farther from the substratum over less bedrock than in summer (Table 3). Distance from substratum may have been affected by shifts in microhabitat availability, how- ever, because the site was deeper in spring and au- tumn than in summer (Fig. 1). Nonetheless, during summer this species occupied areas with more boul- der and less sand than in autumn. Hydrologic period data indicated that S. atromaculatus could be found in deeper microhabitats, farther from the substratum, over more cobble and less bedrock in post-drought than during drought or pre-drought periods (Table 4). Average velocities were faster dur- ing post-drought than in pre-drought or drought, which may have affected these results (Fig. 2). Sem- otilus atromaculatus also occupied microhabitats with more sand and cobble in post-drought samples than during the drought (Table 4). Some of these differences may be attributable to length-related variation in microhabitat use because this species was significantly larger in post-drought samples than in either drought or pre-drought samples (Tables 4, 5).
The seasonal or hydrologic shifts in microhabi-
tat use exhibited by both N. micropogon and 0. mykiss were attributable to either changes in microhabitat availability (N. micropogon) or sig- nificant differences in the mean length of speci- mens during both seasons and hydrologic periods (0. mykiss, Tables 3, 5).
In summary, most significant differences in sea- sonal microhabitat analyses appeared to be passive responses to shifts in microhabitat availability rather than actual differences in non-random use. The one exception to this generalization involved species for which young-of-the-year constituted a substantial proportion of the total number of indi- viduals measured in seasonal samples (i.e. 0. my- kiss, and R. cataractae). The seasonal shifts ex- hibited by these species appeared to have been pro- duced either by the recruitment of large numbers of small individuals into the population (i.e. R. cat- aractae in autumn) or by length-related shifts in microhabitat use produced as individuals grew in length between spring to autumn (i.e. 0. mykiss) (Tables 3, 6). The results for hydrologic analyses were similar to those for seasonal analyses (i.e. many significant differences due to changes in microhabitat availability or mean length); however, most species also displayed real shifts in micro- habitat use among hydrologic periods. There were few communalities in these responses among spe- cies, however, suggesting that the use of spatial re- sources within this assemblage was based on indi- vidualistic responses to changing environmental conditions rather than the reaction of a strongly co-evolved unit. Nonetheless, we did observe sev- eral similar responses; for example, Ca. anomalum, CI, funduloides, L. coccogenis and S. atromaculatus all occurred either farther from shelter or the sub- stratum during post-drought than in at least one other hydrologic period. In addition, CI. funduloid- es, L. coccogenis and S. atromaculatus all occupied microhabitats with less bedrock during post- drought than in either drought or both pre- drought and drought. Finally both Ca. anomalum and S. atromaculatus occupied deeper microhabi- tats in the post-drought than in pre-drought or drought.
Length-related differences in microhabitat use
Length-related analyses of data from pooled samples yielded significant results for three of five benthic species and five of five water column spe- cies (Table 5). Length-related differences in micro- habitat use generally were restricted to one or two components, and the mean amount of variance ex- tracted for both benthic and water column species was identical (%YO), although the ranges differed substantially (benthic species 942%, water col-
121
Grossman & Ratajczak
umn species 16-34%). Length-related analyses were affected by the unequal distribution of sizes across seasons and hydrologic periods (Tables 3, 4). Consequently, we did not report results that were clearly attributable to seasonal or hydrologic changes in habitat availability.
Principle component analysis of length-related microhabitat data from individuals observed within a given seasonal sample also extracted one to two significant components for each species (Table 6). The mean amount of variance extracted by these components was slightly higher for ben- thic species (mean= 33%, range 848%) than for water column species (mean=25%, range=9-44%), although the ranges were similar (Table 6). When differences existed between analyses based on pooled data and those for individual seasons, we presented results for both analyses.
Of the five benthic species examined, only E. blennioides, and H. nigricans did not display sig- nificant length-based microhabitat shifts (Tables 5 , 6). Of the remaining species, pooled data for Co. bairdi indicated that large ( 2 7 cm) and intermedi- ate (5-6 cm) specimens occupied deeper micro- habitats, closer to shelter, over more boulder and less bedrock, gravel and sand then small ( 5 4 cm) members of this species (Table 5). Nonetheless, Co. bairdi were significantly larger during post-drought than in either pre-drought or drought. and some of these differences (e.g. substratum) may have been produced by shifts in habitat availability during this period. Data for Co. bairdi from individual seasonal samples indicated that during summer 1986, larger specimens ( 2 6 cm) occupied deeper microhabitats farther from shelter, with lower av- erage and focal-point velocities, over greater amounts of depositional substrata and lower quan- tities of erosional substrata than smaller ( 5 5 cm) Co. bairdi (Table 6). Similarly, in summer 1988, larger ( 2 6 cm) Co. bairdi were found in deeper areas with lower average and focal-point velocities over more debris and silt and less gravel than smaller ( 5 5 cm) Co. bairdi (Table 6). In autumn 1989, larger ( 2 6 cm) Co. bairdi occupied locations closer to shelter, with higher average velocities and greater quantities of cobble and gravel, and lower quantities of depositional substrata, than smaller ( 5 4 cm) specimens of this species. Similarly, in summer 1992, larger ( 2 6 cm) sculpins occupied locations with higher average and focal-point velo- cities, more cobble and gravel, and less sand, silt, and debris than small (‘5 cm) Co. hairdi. Length- related shifts in microhabitat use by C. bairdi ap- peared to be strongly affected by hydrologic period (i.e. compare drought data with post-drought data).
Both R. caturactae and Cu. anomalum displayed
significant length-related shifts in microhabitat xie. Analyses of pooled data indicated that large ( 2 7 cm) R. cataractae occupied microhabitats that were closer to both shelter and the substratum, with higher average velocities, over greater amounts of erosional substrata and lower quan- tities of depositional substrata. than either inter- mediate (5-6 cm) or small ( 5 4 cm) specimens (Table 5). The same relationship was present be- tween intermediate and small ( 5 4 cm) R. catar- actae. In addition, intermediate (5-6 cm) R. catar- actae occupied deeper microhabitats with higher focal point velocities, greater quantities of boulder and less cobble than either large or small members of this species. Seasonal analyses yielded similar results when significant differences were detected (Table 6). In analyses of pooled data, large (210 cm) Ca. anomalum were found over less bedrock than intermediate (8-10 cm) and small ( 5 7 cm) Ca. anomalum. Seasonal data displayed a some- what different pattern, however, and in autumn 1986 small ( 1 9 cm) Ca. anomalum occupied shal- lower microhabitats closer to shelter, with higher average velocities, over more cobble and less sand gravel and boulder than large (2 10 cm) specimens (Table 6). In addition, during autumn 1989, we found large (29 cm) members of this species over more debris and less bedrock than small ( 5 8 cm) Ca. anomalum.
All members of the water-column guild, with the exception of A . rupestris (insufficient numbers), ex- hibited length-related changes in microhabitat use. Pooled analysis indicated that large ( 2 7 cm) CZ. funduloides occurred closer to shelter, at higher av- erage and focal-point velocities, over more cobble and lower quantities of depositional substrata than intermediate (5-6 cm) and small (14 cm) CZ. fund- uloides (Table 5) . Seasonal analyses displayed a greater level of variation in length-based micro- habitat shifts for Cl. funduloides (Table 6). During spring 1988, we found large ( 2 7 cm) C1. funduloid- es closer to both shelter and the substratum, at lower focal-point velocities over more cobble and gravel and less bedrock than smaller (‘5 cm) members of this species (Table 6). In summer 1989, large and intermediate-sized (26 cm) individuals occurred closer to shelter over more cobble, sand and debris and less boulder than small (54 cm) C1. ,funduZoides. Similarly, in summer 1990 large ( 1 7 cm) CZ. funduloides were found closer to the sub- stratum at higher average and focal point velocities over more bedrock and less cobble, sand and silt than small and intermediate-sized specimens ( 5 6 cm). Finally, in autumn 1990, large ( 2 7 cm) Cl. funduloides occupied deeper microhabitats farther from shelter, at lower focal-point velocities, over less boulder than small ( 1 4 cm) and intermediate-
122

Microhabitat use in a southern Appalachian stream
Table 5. Results of principal componant analysis on length-related shifts in microhabitat use (pooled data). Data were tested using Mann-Whitney (2 size groups) or Kurskal-Wallis tests ( 2 3 size groups) with Turkey-Kramer a posterior tests. We only present variables with loadings 210.401.
Size Significant component Significant Species classes n (Oh variance explained) Component loadings differences
Benthic guild Ca. anomalum 5 7
8-1 0 >10
Co. bairdi 5 4 5-6 2 7
E. blennioides
H. nigricans
R. cafaracfae
<6 7-8 >8 511
12-1 5 16-1 8 2 1 9 5 4 5-6 2 7
22 90 48
115 234
89
19 17 9
12 24 13 14 68 56 34
5 (9)
3 (11)
5 (9)
None significant
None significant
1 (29)
2 (13)
% bedrock (0.91) (57 ) (8-1 0)>(>10)
% sand (0.57), distance from shelter (0.53), Yo gravel (0.40), % boulder (-0.43)
(5-6) (27)<(54)
depth (0.53), % boulder (0.42), distance from substratum (0.41), % bedrock (-0.63)
(27 ) (5-6)>(~4)
Yo silt (0.86), distance from substratum (0.74), distance from shelter (0.62), YO sand (0.48), % debris (0.46), average velocity (-0.79), % cobble (-0.59), % gravel (-0.46) YO boulder (0.67), depth (0.51), focal point velocity (0.49), % cobble (-0.59)
(27)<(5-6)<(54)
(5-6)>(54)(27)
Water column guild CI. funduloides <4 66
5-6 389 2 7 131
L. coccogenis 5 6 38 7-9 107 2 1 0 37
N. micropogen 5 6 32 7-9 66 21 0 26
0. mykiss 5 5 50 6-8 87
2 1 3 59 9-12 34
S. atromaculafus 5 8 50 9-12 33 13-14 13 2 1 5 9
3 (12)
average velocity (0.83), focal point velocity (0.76). % debris (-0.67), % silt (-0.66)
distance from shelter (0.60), % sand (0.47), % cobble (-0.69) Yo boulder (0.77), depth (0.62), o/o cobble (-0.65), Yo gravel (-0.61)
Yo cobble (0.50), depth (0.45), Yo gravel (-0.61), % sand (-0.50). Yo bedrock (-0.44)
average velocity (0.83), focal point velocity (0.56), % silt (-0.56), % debris (-0.60) average velocity (0.76), focal point velocity (0.75), a/o depth (0.63), distance from shelter (0.43), Yo silt (-0.59), Yo sand (-0.47), Yo debris (-0.46)
% sand (0.55), distance from substratum (0.54), YO bedrock
depth (0.76), % cobble (0.56), distance from substratum (0.56), % bedrock (-0.65)
(-0.50)
(27)>(5-6)(54)
(27)<(54)(5-6) (7-9) >( 5 6 )
(7-9) (2 1 0) > (56 )
(2 10) >( 5 6 )
(6-8) (9-12)
(2 1 3) >(6-8) (2 13) >( 55)
( 2 1 3)>(6-8)
(215) (13-14) (9-1 2)>( 4)
sized specimens ( 5 6 cm). Analyses from individual seasonal samples revealed that larger CI. .funddoid- es tended to occur closer to both the substratum and shelter over increasing amounts of cobble and gravel and less boulder, although seasonal analysis did not exhibit the consistent positive relationship between size and velocity observed in pooled analysis.
Analyses of pooled data for Luxilus coccogenis indicated that intermediate (7-9 cm) L. coccogenis occurred in deeper locations with greater amounts of boulder and less cobble and gravel than small ( 5 6 cm) members of this species (Table 5). Al-
though the depth effect may have been influenced by the fact that larger L. coccogenis were more common during hydrologic periods in which the site was deeper (Table 4), we observed both con- cordant and dissimilar results in seasonal length- related analyses (compare summer 1992 and au- tumn 1989). Tn fact, this species displayed highly variable patterns of length-related microhabitat use in seasonal samples (Table 6). In autumn 1986, larger ( 1 9 cm) L. coccogenis occurred farther from both the substratum and shelter, at faster average and focal-point velocities, over less debris than smaller L. coccogenis (Table 6). During autumn
123
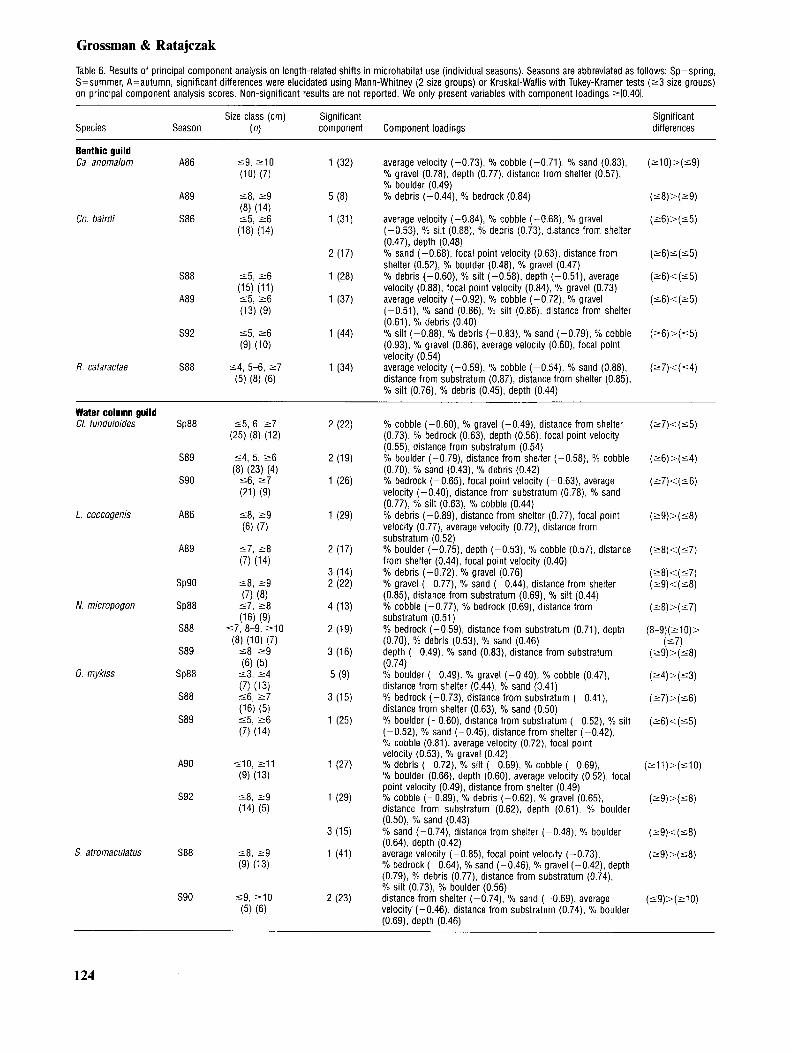
Grossman & Ratajczak Table 6. Results of principal component analysis on length-related shifts in microhabitat use (individual seasons). Seasons are abbreviated as follows: Sp=spring, S=summer, A=autumn, significant differences were elucidated using Mann-Whitney (2 size groups) or Kruskal-Wallis with Tukey-Kramer tests ( 2 3 size groups) on principal component analysis scores. Non-significant results are not reported. We only present variables with component loadings 210.401.
Size class (cm) Significant Species Season ( n) component Component loadings
Significant differences
Benthic guild Ca. anomalum A86
Go. bairdi
A89
S86
SEE
A89
s92
R cataractae S88
average velocity (-0.73) % cobble (-0.71), ‘/o sand (0.83), % gravel (0.78), depth (0.77), distance from shelter (0.57), % boulder (0.49) % debris (-0.44). % bedrock (0.84)
average velocity (-0.84), % cobble (-0.68), % gravel (-0.53), % silt (0.88), % debris (0.73), distance from shelter (0.47), depth (0.48) % sand (-0.68), focal point velocity (0.63), distance from shelter (0.52), % boulder (0.48). % gravel (0.47) % debris (-0.60), % silt (-0.58). depth (-0.51), average velocity (0.88), focal point velocity (0.84), % gravel (0.73) average velocity (-0.92), % cobble (-0.72), % gravel (-0.51), % sand (0.86). % silt (0.86), distance from shelter (0.61), % debris (0.40) % silt (-0.88), % debris (-0.83), % sand (-0.79), % cobble (0.93). % gravel (0.86), average velocity (0.60), focal point velocity (0.54) average velocity (-0.59), % cobble (-0.54), % sand (0.88), distance from substratum (0.87), distance from shelter (0.85), % silt (0.76), % debris (0.45), depth (0.44)
(2 1 0) >( 5 9 )
(58)>(29)
(26)>(55)
(26 ) 5 (55 )
(26)< (5 5)
(56 ) < (3 5)
(>6)>(55)
(27)<(54)
Water column guild CI fundoloides Sp88
589
,590
L coccogenis
N. micropogon
0. mykiss
A86
A89
Sp90
Sp88
SEE
S89
Sp88
SEE
S89
A90
592
S. atromaculatus sa8
s90
% cobble (-0.60), % gravel (-0.49), distance from shelter (0.73), % bedrock (0.63), depth (0.56), focal point velocity (0.55), distance from substratum (0.54) % boulder (-0.79), distance from shelter (-0.58), % cobble (0.70), % sand (0.43), % debris (0.42) % bedrock (-0.65), focal point velocity (-0.63), average velocity (-0.40), distance from substratum (0.78), % sand (0.77), % silt (0.63), % cobble (0.44) % debris (-0.89), distance from shelter (0.77), focal point velocity (0.77), average velocity (0.72), distance from substratum (0.52) % boulder (-0.75), depth (-0.53) % cobble (0.57), distance from shelter (0.44), focal point velocity (0.40) % debris (-0.72), % gravel (0.76) % gravel (-0.77), % sand (-0.44) distance from shelter (0.85), distance from substratum (0.69), % silt (0.44) % cobble (-0.77), % bedrock (0.69), distance from substratum (0.51) % bedrock (-0.59), distance from substratum (0.71), depth (0.70), % debris (0.53), % sand (0.46) depth (-0.49), % sand (0.83), distance from substratum (0.74) % boulder (-0.49). % gravel (-0.40). % cobble (0.47), distance from shelter (0.44). Yo sand (0.41) % bedrock (-0.73), distance from substratum (-0.41), distance from shelter (0.63), % sand (0.50) % boulder (-0.60). distance from substratum (-0.52), % silt (-0.52), % sand (-0.45), distance from shelter (-0.42), % cobble (0.81). average velocity (0.72), focal point velocity (0.53), % gravel (0.42) % debris (-0.72), % silt (-0.69), % cobble (-0.69), YO boulder (0.66), depth (0.60), average velocity (0.52), focal point velocity (0.49), distance from shelter (0.49) % cobble (-0.89), % debris (-0.62), % gravel (0.65), distance from substratum (0.62), depth (0.61), % boulder ( O S O ) , % sand (0.43) % sand (-0.74), distance from shelter (-0.48), % boulder (0.64), depth (0.42) average velocity (-0.85). focal point velocity (-0.73), YO bedrock (-0.64), %sand (-0.46), Yo gravel (-0.42), depth (0.79), % debris (0.77), distance from substratum (0.74), % silt (0.73), % boulder (0.56) distance from shelter (-0.74) % sand ( 0.69), average velocity (-0.46), distance from substratum (0.74), % boulder (0.69), depth (0.46)
(27)< ( 5 5 )
(26)>(54)
( 2 7 ) 1 ( 5 6 )
( 2 9 ) > ( ~ 8 )
( 2 8 ) <( 5 7 )
(2 8) < (57 ) ( 2 9 ) i ( 5 8 )
( 2 8) >( 5 7 )
(8-9)( 2 10) > (57 )
( 2 9) > ( 5 8 )
(24)>(53)
(27)>(56)
(26 ) < (55 )
( 2 1 1 )> (5 10)
( ~ 9 ) > ( ~ 8 )
(29 ) i (58)
(?9)>(58)
(59)>( 2 1 0)
124
Microhabitat use in a southern Appalachian stream
erage and focal point velocities, farther from the substratum and shelter, over lower amounts of de- positional substrata, than small (15 cm) 0. mykiss (Table 5). Identical results were obtained between large (213 cm) individuals of this species (deeper, faster, etc.) and intermediate (6-8 cm) 0. mykiss. Seasonal data showed that 0. mykiss ( 2 7 cm) tended to occur farther from both shelter and the substratum and over more boulder substrata and less cobble and gravel than smaller ( 5 6 cm) 0. mykiss (Table 6). Larger members of this species also occasionally occupied deeper microhabitats than smaller 0. mykiss (autumn 1990 and summer 1992) although in summer 1992 some small (58 cm) 0. mykiss also occurred in deeper microhabi- tats than larger (29 cm) specimens (component 3, Table 6). Pooled and seasonal analyses yielded similar results with the exception of velocity and depth data.
Pooled analyses for S. atromaculatus indicated that larger specimens (i.e. 2 9 cm) occupied deeper locations, farther from the substratum, with more cobble and less bedrock than small ( 5 8 cm) S. atrornaculatus (Table 5). Seasonal analysis display- ed little consistency among length-related micro- habitat shifts (Table 6). In summer 1988, we found larger ( 1 9 cm) S. atromaculatus in deeper micro- habitats with lower average and focal point velo- cities, more boulder, silt and debris, and less bed- rock, gravel and sand than smaller ( 9 3 cm) mem- bers of this species (Table 6). Conversely, in summer 1990, smaller ((-9 cm) S. atromaculatus occupied deeper locations, with lower average velo- cities, farther from the substratum, closer to shel- ter, over more boulder and less sand than larger (210 cm) S. atromaculatus (Table 6). The lack of concordance between pooled and seasonal analy- ses is probably due to several sources including: 1) responses to differing hydrologic conditions among hydrological periods, 2) differences in sample size, and 3) differences in length classes (Table 4).
There were several general patterns present in either pooled or seasonal length-related microhabi- tat analyses. Among benthic species, larger R. cat- aractae occurred closer to shelter, at higher aver- age and focal-point velocities than smaller R. cat- aractae; a pattern that also was recorded for Co. bairdi during the post-drought period (but not drought). As with R. cataractae, larger Cu. anoma- lum also occupied microhabitats with faster focal point velocities than smaller members of this spe- cies. Within the water-column guild, larger speci- mens tended to occupy deeper microhabitats (L. coccogenis, N. micropogon, 0. mykiss, and S. atro- maculatus), farther from the substratum (L. coccogenis, 0. mykiss, and S. atromaculatus), over
1989, however, we found smaller ( 5 7 cm) L. coccogenis in shallower microhabitats farther from shelter, at faster focal-point velocities over less boulder than larger ( 2 8 cm) members of this spe- cies. Smaller L. coccogenis also occurred over more gravel and less debris than larger L. coccogenis. Finally in spring 1990, smaller (18 cm) L. coccog- enis also occupied microhabitats farther from shel- ter and the substratum over more silt and less gravel and sand than L. coccogenis 9 cm in length or greater. Like several other species, larger L. coccogenis exhibited one set of responses during drought (i.e. higher focal-point velocity and far- ther from shelter) and a different set during post- drought (i.e. lower focal-point velocity and closer to shelter).
Pooled length-related data for N . micropogon showed that large (210 cm) and intermediate (7-9 cm) specimens occupied deeper microhabitats, with more cobble and less gravel, sand, and bed- rock, than small ((-6 cm) N . micropogon (Table 5) . Although larger N. micropogon were more abun- dant during the deeper post-drought period, larger specimens also occupied significantly deeper loca- tions during the drought (summer 1988, Table 6). This species also exhibited significant length-re- lated differences in microhabitat use in three of six seasons (Table 6). In spring 1988 larger ( 2 8 cm) N. micropogon occurred farther from the sub- stratum over more bedrock and less cobble than smaller ( 5 7 cm) members of this species. During summer 1988 larger (28 cm) N. micropogon also occupied deeper microhabitats farther from the substratum, over more debris and sand, and less bedrock than smaller (57 cm) N. micropogon (Table 6) . Finally, in summer 1989, we found larger (19 cm) N. micropogon in shallow microhabitats, farther from the substratum over more sand than smaller (IS cm) N. micropogon. It is unclear why pooled data did not display the significant differ- ences in distance from substratum between large and small N. micropogon observed in the three sig- nificant seasonal analyses. In general, seasonal analyses demonstrated that larger N . micropogon occurred farther from the substratum than smaller members of this species; a distinct result from those obtained through pooled analyses. Finally, N. micropogon displayed different length-related shifts in microhabitat use between drought and post-drought samples. During the former period larger N. micropogon occupied deeper microhabi- tats whereas in post-drought larger members of this species were found in shallower microhabitats (Table 6).
Analyses of pooled data for 0. mykiss indicated that large and intermediate-sized members of this species occurred in deeper locations, at higher av-
125

Grossman & Ratajczak
lower quantities of depositional substrata (Cl. fun- duloides, N. micropogon, and 0. mykiss) than smaller specimens. It is worth noting, however, that these responses were not always observed in both pooled and seasonal analyses for a given spe- cies (Tables 5 , 6). In fact, the patterns of length- related microhabitat use exhibited by individual species (e.g. Ca. anomalum, Co. bairdi, L. coccog- enis, 0. mykiss, S. atromaculatus) frequently dif- fered among hydrologic periods even when differ- ential microhabitat availability was accounted for.
Discussion
The members of the Coweeta Creek fish assem- blage exhibited non-random microhabitat use (sen- su Grossman & Freeman 1987) in a majority of samples, as well as substantial seasonal, hydrolog- ic, and length-related shifts in the utilization of spatial resources. These results suggest that the microhabitat requirements of assemblage members are relatively flexible. Our quantification of this flexibility should aid in the design and implemen- tation of future management plans or tests of theory involving members of the Coweeta Creek fish assemblage.
Despite their rather general microhabitat use patterns, most species displayed non-random microhabitat use in all samples, with the exception of two benthic (Co. hairdi and H. nigricans) and one water column species (N. micropogon) species. Even these fishes generally exhibited selection with respect to distance from the substratum (i.e. Co. bairdi always occurred on the substratum, whereas N. micropogon always occupied the water column) although it was difficult to test distance from the substratum measurements against a comparable aspect of microhabitat availability (e.g. the random position of an object in the water column) without rendering the comparison trivial. We did observe several general trends in microhabitat use among assemblage members, the most prominent being the over-representation of most benthic and water column guild members in the deeper portions of the site (Table 2). Within the benthic guild, all spe- cies except C. bairdi and small R. cataructae also were over-represented in locations with greater than average amounts of erosional substrata. Water column guild members generally were over- represented in locations with lower average velo- cities, with the exceptions being N. micropogon and 0. mykiss (four of six seasons). In addition, water column species exhibited highly variable patterns of substratum use.
Although most species shifted microhabitat use in response to seasonal and hydrologic variations in microhabitat availability, analyses based on the
relationship of a given sample to the drought (i.e. hydrologic period) produced greater statistical sep- aration of samples in both microhabitat availabil- ity and fish microhabitat use data sets. These re- sults indicate that the effects of the drought, and subsequent high-water years, on the physical characteristics of the site were substantially strong- er than those experienced through seasonal vari- ation both within and among years. This is not unexpected, given that the study period included some of the lowest and highest mean daily flows recorded in the last 55 years (Grossman et al. 1995a). In contrast, the responses of most fishes to seasonal variations in microhabitat availability appeared to be passive (i.e. shifts to deeper micro- habitats when average depth of the site increased), whereas differences in microhabitat use among hy- drologic periods contained a higher proportion of responses that were not strongly correlated with changes in microhabitat availability. There were some communalities among species in these re- sponses, although they only involved a maximum of three out of a total of ten possible species [e.g. L. coccogenis, S. atromaculatus, and Ca. anomal- um, occupied positions farther from either the sub- stratum or shelter (these parameters were corre- lated for most species), during the post-drought than in either the pre-drought or drought]. How- ever, given that a majority of species exhibited dis- tinct hydrologic shifts in microhabitat use, it ap- pears that assemblage members are responding to changes in microhabitat availability in a species- specific manner, rather than as part of a strongly interacting guild. Finally, our results also demon- strate the need for quantifying resource use pat- terns of fishes over time scales which encompass the range of environmental variations likely to be experienced by these species during planned man- agement activities (e.g. 10 years, 20 years, etc.). This may be particularly important for species with small populations, given that unpredictable disturbances such as floods and droughts may cause substantial mortality in stream fishes (Seegr- ist & Gard 1972; Schlosser 1985; Erman et al. 1988; Harvey 1987).
We elucidated length-related differences in microhabitat use using two different data sets: 1) all specimens pooled across all samples and 2) sep- arate data sets for each seasonal sample). We con- ducted analyses on two data sets because: 1) within pooled data sets, there was an unequal distribution of length classes across seasons and hydrologic periods, coupled with significant differences in microhabitat availability among these periods, and 2) within individual seasonal samples, the numeri- cal abundances of length classes frequently ap- peared to be insufficient to characterize the length-
126

Microhabitat use in a southern Appalachian stream
habitat availability, rather than shifts in microhabi- tat selection (Baltz & Moyle 1984, Grossman & Freeman 1987, Heggenes & Saltveit 1990, Rin- con & Lobon-Cervia 1993). Nonetheless, other in- vestigators have observed significant seasonal shifts in microhabitat use that were not correlated with changes in microhabitat availability (Baltz et al. 1991). One unusual finding of our study was that annual variations in flow (i.e. drought vs high flows) elicited much stronger microhabitat shifts by assemblage members than seasonal changes in microhabitat availability. Although we are unaware of other studies that support this result, it should be noted that multi-year studies of microhabitat use in stream fishes are uncommon.
It is not unusual for stream fishes to be over- represented in the deeper portions of streams (Angermeier & Karr 1984, Power 1984, Grossman & De Sostoa 1994a, b), and this result has been interpreted as an avoidance response of avian and terrestrial predators (Power 1984, Harv- ey & Stewart 1991). A similar explanation has been proposed for the observation that larger individ- uals of a given species also frequently occupy deeper locations than smaller specimens (Ander- son 1985, Schlosser 1987, Harvey & Stewart 1991), a finding also observed among most water column guild members at Coweeta. We have examined the effects of potential predators on microhabitat use by assemblage members and found little evidence that piscine predators [i.e. A. rupestris (215 cm), S. atromaculatus (215 cm) and 0. mykiss (220 cm)] produced microhabitat shifts in these species (Grossman & Freeman 1987, Grossman et al. 1995b, in press). In amtion, avian and terrestrial predators are uncommon in this system (Grossman & Freeman 1987, Grossman et al. per- sonal observation). Hence, it is unlikely that pred- ators have produced the depth-distribution pat- terns observed in this assemblage. Harvey & Ste- wart (1 99 1) also have suggested that predator- mediated shifts to deeper microhabitats are less common in high velocity systems like Coweeta Creek, than they are in streams with lower mean velocities.
If predation has little effect on microhabitat use by assemblage members, perhaps fishes are choos- ing microhabitats on the basis of maximization of their net energy gain (Hill & Grossman 1993). This process could have produced the results we ob- tained because these optima probably differ both among species and among size classes within a spe- cies (Hill & Grossman 1993). In fact, Hill & Grossman (1 993) demonstrated that larger Cl. fun- duloides and 0. mykiss maximized their net energy gain by occupying faster focal-point velocities in Coweeta Creek than those utilized by smaller indi-
related differences in microhabitat use manifested by most species. Despite the shortcomings of each data set, we obtained similar results from both analyses for three water column and one benthic species. Nonetheless, the remaining four species (two benthic and two water column) exhibited a lack of concordance between data from pooled and individual seasonal analyses. It is possible that most of these discrepancies are related to differ- ences in: 1) microhabitat availability, 2) the distri- bution of length classes, or 3) sample sizes, be- tween these two data sets. In addition, analyses based on individual seasons indicated that four species (Co. bairdi, L. coccogenis, N . micropogon, and S. atromaculatus) displayed distinct patterns of length-related shifts in microhabitat use in dif- ferent hydrologic periods (e.g. L. coccogenis - larger specimens were found farther from shelter and the substratum during the drought whereas the opposite response was observed in the post- drought). These findings demonstrate that vari- ations in microhabitat availability have a strong ef- fect on the length-related shifts in microhabitat use exhibited by Coweeta fishes, and also re-emphasize the need for accurate quantification of microhabi- tat use patterns of fish if resource-based manage- ment models are to have predictive value.
Length-related microhabitat analyses did yield similar results for several species. For example, larger individuals of two benthic species (Ca. ano- malum and R. cataractae) both occupied locations with faster average velocities than those utilized by smaller individuals. This pattern also was ex- hibited by Co. bairdi during the post-drought, however the opposite result was observed during the drought (i.e. larger specimens found at lower average velocities). Finally, four of five water col- umn species exhibited a pattern where larger speci- mens occurred in deeper microhabitats than smaller members of these species.
Some of our findings are similar to those re- ported by other researchers who have studied microhabitat use in stream fishes. For example, stream fishes frequently exhibit substantial vari- ability in their use of spatial resources (Angermeier 1987, McNeeley 1987, Ross et al. 1987, Bart 1989, Freeman & Grossman 1987, Brown & Moyle 199 1, Grossman & De Sostoa 1994a, b, Brown et al. 1995, Wood & Bain 1995). In fact, several re- searchers were unable to correctly classify a ma- jority of specimens to species based on discrim- inant function analyses of microhabitat use data (McNeeley 1987, Ross et al. 1987), a result ob- tained for both benthic and water column fishes. In addition, it is not uncommon for stream fishes to exhibit seasonal shifts in microhabitat use that appear to be passive responses to changes in micro-
127

Grossman & Ratajczak
viduals. Faster focal-point velocities yielded greater rates of energy gain for larger specimens, because there was a positive relationship between prey availability and velocity, and larger fishes were better able to maintain position and capture prey at higher velocities than smaller individuals. Our pooled data confirmed this fish length - focal- point velocity relationship for both species; how- ever, principal component analysis from individual seasonal samples indicated that larger CI. fundulo- ides did not always occupy faster focal-point velo- cities than smaller CI. funduloides. We obtained a similar result for 0. mykiss. There are several poss- ible explanations for these discrepancies. First, our sample sizes were much smaller than those of Hill & Grossman (1993). Second, our analyses also included size classes beyond the range studied by Hill & Grossman (1993). Third, Hill & Grossman (1993) conducted their study during the drought, and the current study showed that both of these species shifted their patterns of length-related microhabitat use after the drought. Finally, when we examined mean focal point velocities (rather than the principal component analysis) using size classes similar to those of Hill & Grossman (1993), we found that larger specimens did occupy faster focal point velocities during seven of eight seasons in which comparisons could be made (Cl. fundul- oides - five seasons, 0. mykiss - three seasons). Nonetheless, this difference frequently was small (i.e. 1-2 cm/s) and could not be tested statistically due to small sample sizes.
Energy maximization mechanisms also may play a role in microhabitat use by benthic species in Co- weeta Creek. Facey & Grossman (1992) have shown that energetic constraints apparently do not affect microhabitat use by Co. bairdi in Coweeta Creek, and Petty & Grossman (1996) demon- strated that prey abundance was a better predictor of patch choice by this species in the Coweeta drainage than physical factors alone. Given the lack of energetic constraints on microhabitat use by Co. bairdi, Petty & Grossman (1996) suggested that the strong correlation between high prey abundance and occupancy of a given patch by this species also represented an energy maximization strategy.
It is also possible that some of the length-related variation observed among Coweeta fishes is a consequence of intraspecific competition. Free- man & Stouder (1989) demonstrated that this pro- ccss influenced the depth distribution of Co. bairdi in Coweeta Creek during the drought (i.e., larger specimens deeper). Although the size classes used in the two studies differed slightly, our data suggest that depth selection by large and small Co. bairdi may be strongly affected by hydrologic period (i.e.
microhabitat availability). Although our pooled analyses indicated that larger Co. bairdi occupied deeper microhabitats than smaller members of this species, individual seasonal analyses only detected this result in two of eleven possible seasons (in- cludes seasons with nonsignificant results), both of which occurred during the drought. Consequently, if intraspecific competition affected the differential depth distributions of large and small sculpins, it may have been most important in seasons when microhabitat availability was highly constrained (i.e. summer 1986 and 1988). Little is known about intraspecific competitive relationships within the remaining species, hence, the effect of this process on microhabitat shifts by these species is unknown. In addition, concurrent studies also suggest that interspecific competition had little effect on micro- habitat use by assemblage members (Barrett 1989, Stouder 1990, Grossman & Boule 1991, Free- man & Grossman 1992, Grossman et al. in press, Rincon & Grossman 1997). Tn conclusion, we sus- pect that the patterns of non-random microhabitat use observed within this assemblage are a result of differential species-specific responses to changing environmental conditions, rather than interspecific interactions such as predation or interspecific com- petition.
Our data, although long term, come from a single site on one stream. Given that some species exhibit distinct patterns of microhabitat use in dif- ferent systems (Angermeier 1987, Wood & Bain 1995), it is worthwhile to compare our results to those of other investigators working in different systems. Although few of these researchers em- ployed under-water observational techniques, their findings possess both similarities and differences when compared to our results. For example, many investigators have found that R. cataractae exhibit length-related shifts in microhabitat use with larger specimens occupying high velocity areas with ero- sional substrata, whereas smaller individual are found in low-velocity microhabitats (Gee & Northcote 1963, Gibbons & Gee 1972, Kelsch 1994, Mullen & Burton 1995), a pattern also ob- served in Coweeta Creek. In addition, Culp (1989) demonstrated that in Alberta prairie streams, R. cataractae frequently is found under cobbles dur- ing the day, and is active only during the night. In Coweeta Creek, however, we have regularly ob- served active R. cataractae during daylight hours (G. Grossman & A. Thompson, unpublished data), and a die1 feeding study of this species indi- cated that R. cataractae foraged throughout the day (A. Thompson, G. Grossman, and S. Floyd, unpublished data). Coweeta Creek is a very differ- ent habitat (i.e. a forested mountain stream) from the Canadian prairic streams studied by Culp
128
Microhabitat use in a southern Appalachian stream
crecidas) parecieron ser respuestas activas a las condiciones am- bientales cambiantes. 4. La mayoria de las especies mostraron diferencias en el us0 del microhabitat entre ejemplares de diferentes tamaiios y &stas estuvieron fuertemente influenciadas por el periodo hidrologico en cuatro de diez especies. 5. Los patrones de us0 del microhabitat de 10s miembros de esta comunidad mostraron ser consecuencia de respuestas pro- pias de cada especie a las condiciones ambientales cambiantes. Dado que dichos patrones son bastante flexibles, las decisiones relativas a la gestion de estas especies deberia basarse en datos que cubran una amplia varieddd de circunstancias ambientales.
(1989), and this probably contributes to our dis- parate results.
With respect to the remaining species, several authors have shown that S. atrarnaculatus is over- represented in deep, low velocity locations (Minck- ley 1963, Moshenko & Gee 1973, Hubert & Rahel 1989) although there appears to be geographic variation in this response (see Angermeier 1987). Our findings for 0. mykiss also appear to be simi- lar to those observed by Baltz & Moyle (1984), Moyle and Baltz (1985) and Baltz et al. (1991). In addition, Angermeier (1987) recorded Ca. anomal- urn from low-velocity habitats which sometimes were of greater than average depth, a result which is in partial agreement (i.e. deeper) with our obser- vations from Coweeta Creek. Finally, both Fahy (1954) and Winn (1958) found E. blennioides in high-velocity riffles with cobble substrata, whereas in our study this species occupied deeper locations with boulder substrata.
In conclusion, our results demonstrate that members of the Coweeta fish assemblage consist- ently occupied a subset of the available habitat, and that microhabitat use by these species was strongly affected by environmental variation in the form of droughts and floods. In addition, many species exhibited strong length-related shifts in microhabitat use, some of which varied substan- tially with changes in water levels (i.e. hydrologic period). These findings demonstrate that Coweeta fishes have very flexible microhabitat requirements, and also indicate that inferences about assemblage members should be limited to the range of environ- mental conditions under which a given set of re- sults are obtained. If similar patterns exist within other stream fish assemblages, it is likely that con- siderable data will have to be gathered before re- source-based management models can be effec- tively used to manage these assemblages or predict their responses to environmental change.
Resumen 1. Hemos registrado el us0 del microhabitat por parte de 10s miembros de una comunidad de peces fluviales del sur de 10s Apalaches (USA) a lo largo de diez afios, periodo que incluye tanto sequias como crecidas. La localidad de estudio (de 37 m de longitud) cornprendib pozas, tablas y chorreras. 2. Investigaciones preliminares indicaron que las especies se dis- tribuian en dos grupos: especies bentonicas y de columna de agua. La mayoria de las especies mostraron un us0 no-aleatorio del microhabitat en todas las estaciones del aiio y las especies de ambos grupos fueron mas comunes de lo que cabia esperar en las zonas mas profundas de la localidad. Ademas, las espe- cies de la columna de agua fueron mas numerosas de lo espera- do en las zonas de baja velocidad media del agua. 3. La mayoria de 10s cambios estacionales en el us0 de microha- bitat fueron pasivos (es decir, relacionados con cambios en la disponibilidad de 10s microhabitats), mientras que las variacio- nes observadas en distintos periodos hidrologicos (sequias y
Acknowledgements We would like to thank the many students, colleagues and friends who aided in various aspects of this research. Those warranting special mention are: J. Barrett, D. Erickson, D. Fa- c e ~ , M. Flood, S. Floyd, J. Freilich, B. Freeman, M. Freeman, A. Grossman, B. Grossman, R. Grossman, J. Hightower, J. Hill, B. Ratajczak, D. Stouder, and our many smiling student helpers. Completion of this project also would not have been possible without the help of Wayne Swank, Lloyd Swift, Brian Cunningham, and the staff of the U.S.D.A. Forest Service Co- weeta Hydrologic Laboratory. We are grateful for constructive reviews of the manuscript by M. Bain, M. Farr, J. Little, K. McDaniel, T. Petty, l? Rincon, and A. Thompson, and the sec- retarial assistance of A. Nelms and L. McDonald. Stimulation and moral support was provided by the staff of Jittery Joe’s. This research was supported by grants from the U.S. Depart- ment of Agriculture McIntire-Stennis program (grants GEO- MS-0035 and GEO-MS-0042) and the National Science Found- ation (BSR-9011661). The Daniel B. Warnell School of Forest Resources provided additional funding for this project.
Anderson, C.S. 1985. The structure of sculpin populations along a stream gradient. Environmental Biology of Fishes
Angermeier, F!L. 1987. Spatiotemporal variation in habitat selection by fishes in small Illinois streams. In: Matthews, W.J. & Heins, D.C., ed. Community and evolutionary ecology of North American stream fishes. Norman: University of Ok- lahoma Press pp. 5240.
Angermeier, PL. & Karr, J.R. 1984. Relationships between woody debris and fish habitat in a small warmwater stream. Transactions of the American Fisheries Society 113: 716-726.
Baltz, D.M. & Moyle, P.B. 1984. Segregation by species and size classes of rainbow trout, Salmo gairdneri, and Sacramento sucker, Castostomus occidentalis, in three California streams. Environmental Biology of Fishes 10: 101-1 10.
Baltz, D.M., Vondracek, B., Brown, L.R. & Moyle, PB. 1991. Seasonal changes in microhabitat selection by rainbow trout in a small stream. Transactions of the American Fisheries Society 120: 166-176.
Barrett, J.C. 1989. The effects of competition and resource availability on the behavior, microhabitat use and diet of the mottled sculpin (Cuttus bairdi). Doctoral dissertation. Uni- versity of Georgia, Athens.
Bart, H.L. 1989. Fish habitat associations in an Ozark stream. Environmental Biology of Fishes 24: 173-186.
Bovee, K.D. 1982. A guide to stream habitat analysis using the instream flow incremental methodology. U.S. Fish Wildlife Service Biological Services Program FWS/OBS-82/26.
Bovee, K.D. & Milhous, R.T. 1978. Hydraulic simulation in instream flow studies: theory and technique. US. Fish Wild- life Service Biological Services Program FWS/OBS - 78/33.
13: 93-102.
129

Grossman & Ratajczak
Brown, L.R., Matern, S.A. & Moyle, P.B. 1995. Comparative ecology of prickly sculpin, Cottus asper, and coastrange scul- pin, C. aleuticus, in the Eel River, California. Environmental Biology of Fishes 42: 329-343.
Brown, L.R. & Moyle, PB. 1991. Changes in habitat and micro- habitat partitioning within an assemblage of stream fishes in response to predation by Sacramento squawfish (Prycholch- eilus grmdis). Canadian Journal of Fisheries and Aquatic Sciences 48: 849-856.
Culp, J.M. 1989. Nocturnally constrained foraging of a loctic minnow (Rhinichthys cataructae). Canadian Journal of Zo-
Erman, D.C., Andrews, E.D. & Yoder-Williams, M. 1988. Ef- fects of winter floods on fishes in the Sierra Nevada. Canad- ian Journal of Fisheries and Aquatic Sciences 45: 2195- 2200.
Facey, D.E. & Grossman, G.D. 1990. A comparative study of oxygen consumption by four stream fishes: the effects of sea- son and velocity. Physiological Zoology 63: 757-776.
Facey, D.E. & Grossman, G.D. 1992. The relationship between water velocity, energetic costs and microhabitat use in four North American stream fishes. Hydrobiologia 239: 1-6.
Fahy, W.E. 1954. The life history of the Northern greenside darter, Etheostoma blennioides Rafinesque. Journal of the Eli- sha Mitchell Scientific Society 70: 139-205.
Fausch, K.D., Lyon, S.J., Karr, J.R. & Angermeier, PL. 1990. Fish communities as indicators of environmental degrada- tion. American Fisheries Society Symposium 8: 123-144.
Freeman, M.C. & Grossman, G.D. 1992. Group foraging by a stream minnow: shoals or aggregations? Animal Behavior 44: 393403.
Freeman, M.C. & Stouder, D.J. 1989. Intraspecific interactions influence size specific depth distribution in Cottus bairdi. En- vironmental Biology of Fish. 24: 231-236.
Freeman, M.C., Vinolas, D., Grossman, G.D. & De Sosta, A. 1990. Microhabitat use by BlenniusJuviatilis in the Rio Mat- arrafia, Spain. Freshwater Biology 24: 335-345.
Freeman, M.C., Crawford, M.K., Barrett, J.C., Facey, D.E., Flood, M.G., Hill, J., Stouder, D.J. & Grossman, G.D. 1988. Fish assemblage stability in a southern Appalachian stream. Canadian Journal of Fisheries and Aquatic Sciences 45: 1949-1 958.
Gee, J.H. & Nortcote, T.G. 1963. Comparative ecology of two sympatric species of dace (Rhinichthys) in the Fraser River system, British Columbia. Journal of the Fisheries Research Board of Canada 29: 105-1 18.
Gibbons, J.R.H. & Gee, J.H. 1972. Ecological segregation be- tween longnose and blacknose dace (genus Rhinichthys) in the Mink River, Manitoba. Journal of the Fisheries Research Board Canada 29: 1245-1252.
Greenberg, L.A. 1991. Habitat use and feeding behavior of thir- teen species of benthic stream fishes. Environmental Biology of Fishes 31: 389401.
Grossman, G.D. & Boule, V. 1991. An experimental study of competition for space between rainbow trout (Oncorhynchus mykiss) and rosyside dace (Clinostomus funduloides). Canad- ian Journal of Fisheries and Aquatic Sciences 48: 1235-1243.
Grossman, G.D. & Freeman, M.C. 1987. Microhabitat use in a stream fish assemblage. Journal of Zoology (London) 212: 151-176.
Grossman, G.D. & De Sostoa, A. 1994a. Microhabitat use by fish in the lower Rio Matarrana. Spain, 1984-1987. Ecology of Freshwater Fish 1994: 123-136.
Grossman, G.D. & De Sostoa, A. 1994b. Microhabitat use by fish in the upper Rio Matarrana, Spain, 19841987. Ecology of Freshwater Fish 1994: 141-152.
Grossman, G.D., Hill, J. & Petty, J.T. 1995a. Observations on habitat structure, population regulation, and habitat use with respect to evolutionarily significant units: a landscape per-
ology 67: 2008-2012.
spective for lotic systems. American Fisheries Society Sym- posium 17: 381-391.
Grossman, G.D., Ratajczak, Jr., R.E. & Crawford, M.K. 1995b. Do rock bass (Ambloplites rupestris) induce micro- habitat shifts in mottled sculpin? Copeia 1995: 343-353.
Grossman, G.D., Ratajczak, Jr., R.E., Crawford, M. & Free- man, M.C. In press. Effects of environmental variation and interspecific interactions on assemblage organization and microhabitat use by stream fishes. Ecological Monographs.
Harvey, B.C. 1987. Susceptibility of young-of-the-year fishes to downstream displacement by flooding. Transactions of the American Fisheries Society 116: 851 -855.
Harvey, B.C. & Stewart, A.J. 1991. Fish size and habitat depth relationships in headwater streams. Oecologia 87: 33G342.
Heggenes, J. & Saltveit, S.J. 1990. Seasonal and spatial micro- habitat selection and segregation in young Atlantic salmon, Salmo salar L., and brown trout, Sulmo truttu L., in a Nor- wegian river. Journal of Fish Biology 36: 707-720.
Hill; J. & Grossman, G.D. 1987. Home range estimates for three North American stream fishes. Copeia 1987: 376-380.
Hill, J. & Grossman, G.D. 1993. An energetic model of micro- habitat use for rainbow trout and rosyside dace. Ecology 74: 685-69 8.
Hubert, W.A. & Rahel, EJ. 1989. Relations of physical habitat to abundance of four nongame fishes in high-plaines streams: a test of habitat suitability index models. North American Journal of Fisheries Management 9: 332-340.
Kelsch, S.W. 1994. Lotic fish community structure following transition from severe drought to high discharge. Journal of Freshwater Ecology 9: 331-341.
Lee, D.S., Gilbert, C.R., Hocutt, D.H., Jenkins, R.E., Mcallis- ter, D.E. & Stauffer, J.R. Jr, 1980. Atlas of North American freshwater fishes. Raleigh, North Carolina. North Carolina State Museum Natural History.
McNeeley, D.L. 1987. Niche relations within an Ozark stream cyprinid assemblage. Environmental Biology of Fishes 18: 195-208.
Minickley, WL. 1963. The ecology of a spring stream Doe Run, Meade County, Kentucky. Wildlife Monographs 1 1 : 3-1 24.
Moshenko. R.W. & Gee, J.H. 1973. Diet, time and place of spawning and environments occupied by creek chub (Semot- ilus atromaculutus) in the Mink River, Manitoba. Journal of the Fisheries Research Board Canada 30: 357-362.
Moyle, PB. & Baltz, D.M. 1985. Microhabitat use by an assem- blage of California stream fishes: developing criteria for in- stream flow determinations. Transactions of the American Fisheries Society 114: 695-704.
Moyle, FIB. & Cech, J.J. 1988. Fishes: an introduction to Ich- thyology. Englewood Cliffs, NJ: Prentice Hall. 559 pp.
Mullen, D.M. & Burton, T.M. 1995. Size-related habitat use by longnose dace (Rhinichrhys catnructue). American Midland Naturalist 133: 177-1 85.
Orth, D.J. 1987. Ecological considerations in the development and application of instream flow-habitat models. Regulated Rivers Research and Management 1: 171-181.
Pajak, I? & Neves, R.J. 1987. Habitat suitability and fish pro- duction: a model evaluation for rock bass in two Virginia streams. Transactions of the American Fisheries Society 116:
Petty, J.T. & Grossman, G.D. 1996. Patch selection by mottled sculpin (Pisces: cottidae) in a southcrn Appalachian stream. Freshwater Biology 35: 261-276.
Power, M.E. 1984. Depth distributions of armored catfish: pred- ator induced resource avoidance? Ecology 65: 523-528.
Rincon, PA. & Grossman, G.D. 1998. The effects of rainbow trout (Oncorhynchus mykiss) on the use of spatial resources and behavior of rosyside dace (Clinostomus funduloides). Ar- chiv fur Hydrobiologia (in press).
Rincon, PA. & Lobon-Cervia. J. 1993. Microhabitat use by
839-850.

stream-resident brown trout: bioenergetic consequence. Transactions of the American Fisheries Society 122: 575-587.
Ross, S.T., Baker, J.A. & Clark, K.E. 1987. Microhabitat par- titioning of southeastern stream fishes: temporal and spatial predictability. In: Matthews, W.J. & Heins, D.C., ed. Com- munity and evolutionary ecology of North American stream fishes. Norman: University of Oklahoma Press pp. 42-51.
Schlosser, I.J. 1985. Flow regime, juvenile abundance, and the assemblage structure of stream fishes. Ecology 66: 1 4 8 4 1490.
Schlosser, I.J. 1987. A conceptual framework for fish com- munties in small warmwater streams. In: Matthews, W.J. & Heins, D.C., ed. Community and evolutionary ecology of North American stream fishes. Norman: University of Okla- homa Press pp. 17-24.
Seegrist, D.W. & Gard, R. 1972. Effects of floods on trout in Sagehen Creek, California. Transactions of the American Fisheries Society 101: 478482.
Stouder, D.J. 1990. Dietary fluctuations in stream fishes and
Microhabitat use in a southern Appalachian stream
the effects of benthic species interactions. Dissertation. Uni- versity of Georgia, Athens, Georgia, USA.
Ury, H.K. 1976. A comparison of four procedures for multiple comparisons among means (pairwise contrasts) for arbitrary sample sizes. Technometrics 18: 89-97.
Werner, E.E. & Gilliam, J.F. 1984. The ontogenetic niche and species interactions in size-structured populations. Annual Review of Ecology and Systematics 15: 393425.
Winn, H.E. 1958. Comparative reproductive behavior and ecol- ogy of fourteen species of darters (Pisces : Percidae). Ecologi- cal Monographs 28: 155-191.
Wood, B.M. & Bain, M.B. 1995. Morphology and microhabitat use in stream fish. Canadian Journal of Fisheries and Aquatic Sciences 52: 1487-1498.
Wootton, R.J. 1992. Ecology of teleost fishes. New York: Chap- man and Hall. 404 pp.
Zar, J.H. 1984. Biostatistical analysis. 2nd edn. Englewood Cliffs, NJ: Prentice-Hall. 620 pp.
131