Embed Size (px)
Citation preview

Long Term Planning Process: Long Distance Market StudyOctober 2013

What’s inside this document
Foreword 03
Executive Summary 04
01. Background 09
02. Long Distance Passenger Market description 14
03. Study approach 17
04. Literature review 18
05. Strategic goals 21
06. Long Term Scenarios 25
07. Long term conditional outputs - aspirations for 2043 45
08. Consultation 68
Appendix A: Methodology for selecting locations for consideration in the Long Distance Market Study
71
Appendix B: Methodology for developing connectivity based conditional outputs
72
Appendix C: Summary of demand forecasting methodology
80
Network Rail Long Distance Market Study 02October 2013
Network Rail Long Distance Market Study 03October 2013Foreword
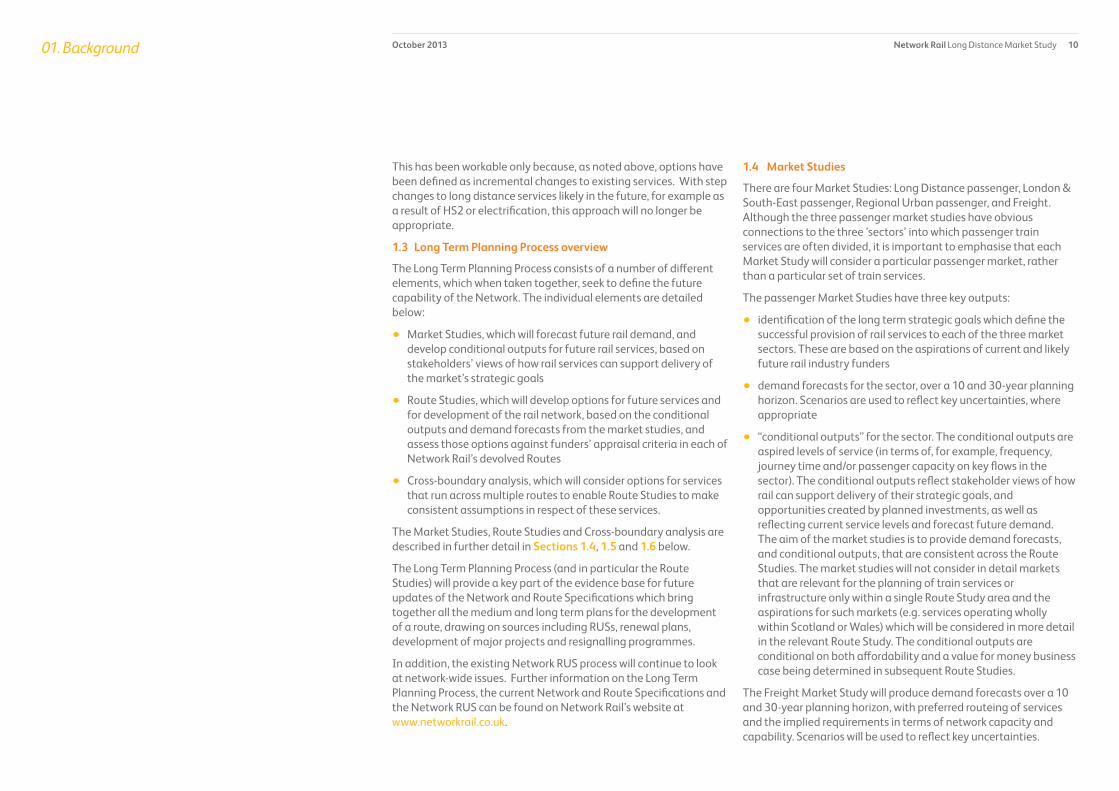
I am pleased to introduce the completed Long Distance Passenger Market Study. This follows the Long Distance Market Study Draft for Consultation which was published in March 2013.
This Market Study is one of four. Together, the Long Distance Passenger, Regional Urban Passenger, London & South East Passenger and Freight Market Studies set out how demand is expected to change in each of these rail markets in Great Britain over the next 30 years.
Demand for long distance rail travel has increased at an average rate of three per cent per annum since 1994. Even during the recent recession, demand has remained strong and continues to grow. By contrast, rail’s immediate competitor, the private car, has seen a levelling off in demand partly through the impacts of increasing costs of motoring and partly through greater road congestion. The increase in rail patronage demonstrates the strengths of the sector with its ability to move large numbers of people across significant distances, reducing journey times for passengers between the major towns and cities of Great Britain.
In publishing this Market Study, the rail industry sets out a new approach to developing plans for the future. It demonstrates rail’s impact on the economic life of the country, and enables strategic change, such as the development of High Speed 2, to be effectively considered in industry planning.
By looking at the long term strategic goals of stakeholders, this study demonstrates how the railway is best placed to deliver the ‘conditional outputs’ that would meet current and potential future funders’ strategic goals for the Long Distance passenger market sector. These include how the development of services can support economic growth, reduce the transport sector’s environmental impact, improve the quality of life for communities and individuals and meet outputs in an affordable way.
The document has been strengthened as a result of the responses to the Draft for Consultation and engagement with the Rail Delivery Group’s Planning Oversight Group and the Rail Industry Planning Group. For example further consideration has been given to long distance travel to and from the South East region, and to the role that rail can play in competing with the domestic air market.
Network Rail has collaborated closely with industry partners and wider stakeholders to develop this Market Study, including passenger and freight operators, the Passenger Transport Executives, Local Authorities, Local Enterprise Partnerships, the Department for Transport, Welsh Government and Transport Scotland. I would like to thank all those parties and those organisations and individuals who have both responded to the Draft for Consultation and contributed to the development of this Long Distance Market Study.
The next stage the development of a series of Route Studies, which will develop options to deliver the conditional outputs, across the four markets, in each of Network Rail’s devolved routes, and to test them against funders’ appraisal criteria. . The output will be a series of choices for our funders to consider.
I look forward to continuing to work with the rail industry and wider stakeholders on the next steps of the Long Term Planning Process.
Paul Plummer
Group Strategy Director

Network Rail Long Distance Market Study 04October 2013Executive Summary
The rail industry has changed the way it approaches long term planning. The new ‘Long Term Planning Process’ (LTPP) is designed to enable the industry to take account, and advantage of long term strategic investment being made in Great Britain’s rail network.This document, the ‘Long Distance Market Study’ is a key element of this work. When established, this and the other Market Studies will form a key input to route planning and investment decision making over the next 30 years.
Scope and Context
Increasingly, long term strategic investments are being made in the rail network. These include plans for the development of a high speed line between London, Birmingham, Leeds and Manchester, implementation of modern signalling systems, Crossrail and electrification of significant parts of the network.
The balance of funders objectives has changed, both in the light of the tighter fiscal environment brought on by economic uncertainty and as a result of the ‘Rail Value for Money Report’ (McNulty report), published in May 2011. This has led to an increasing focus on making best use of the rail network, and Governments are increasingly recognising the role for rail in supporting economic activity.
The LTPP has been designed to take these changes into account, building on work completed in the preceding Route Utilisation Strategy process, and will enable an informed view to be taken of the role of rail in the economic life of Great Britain. Planning over 30 years clearly involves uncertainties, however, the approach is designed to take into account potential structural changes in the economy, and Great Britain’s approach to social and environmental responsibility, so that the rail industry can respond to change over the long term life of the assets used to operate the rail network.
There are three key elements to the LTPP:
• Market Studies. These will articulate strategic goals for each particular market sector, forecast future rail demand, and develop conditional outputs
• Cross-boundary analysis, which will consider options for services that run across multiple routes
• Route Studies, which will develop options for future services and for development of the rail network.
The LTPP will provide a key part of the evidence base for future investment in the rail network.
Four Market Studies will be published:
• Long Distance passenger
• London & South East passenger
• Regional Urban passenger and
• Freight.
It is important to emphasise that each Passenger Market Study will consider a particular market, rather than a particular set of train services. Market Studies will have three key outputs:
• identification of the long term strategic goals which define the successful provision of rail services in the three passenger market sectors
• demand forecasts for the sector, over a 10 and 30 year horizon
• conditional outputs for the sector in terms of, for example, frequency, journey time and/or passenger capacity on key flows.
Markets that are relevant for the planning of train services or infrastructure within a single Route Study area, e.g. services operating wholly within Scotland or Wales, will be considered in more detail in the relevant Route Study. The outputs from the market studies are conditional on both affordability and a value for money business case being determined.
The Freight Market Study will produce demand forecasts over a 10 and 30 year planning horizon, with preferred routeing of services and the implied requirements in terms of network capacity and capability.
Further information on the Long Term Planning Process can be found on Network Rail’s website at www.networkrail.co.uk.

Network Rail Long Distance Market Study 05October 2013Executive Summary
Long Distance Passenger Market
The majority of long distance travel is typically made for the purposes of business on behalf of an employer, and leisure. Although long distance commuting is increasingly popular it still accounts for a small proportion of the total number of long distance journeys. Long distance services have therefore, over time, been tailored to suit the needs of business and leisure passengers, and for the purposes of this study the long distance passenger market sector has been defined as a combination of distance and journey purpose, namely:
• the market for rail travel over distances of greater than 50 miles, excluding journeys which are predominately for commuting purposes and are made entirely within one of the other Market Study areas. This means that journeys made for business or leisure purposes despite being entirely within one of the other Market Study areas, (e.g. Brighton to Oxford), are also considered in this Market Study and
• the market for rail travel between large towns and cities of at least 30 miles apart, again excluding journeys made entirely within one of the City Regions considered in the other Market Study areas (e.g. Preston - Manchester which is considered in the Regional Urban Market Study).
This definition is intended to attach a geographic construction to the types of travel by journey purpose which comprise the majority of the long distance sector, namely business travel and leisure travel. It is recognised that this is a simplification of the role performed currently by rail services particularly where long distance services also facilitate commuting. The corresponding geographic definitions of the London and South East and Regional Urban Market Studies/sectors are therefore intended to capture the majority of longer distance commuting.
Since 1994 passenger demand in the long distance sector has grown robustly at an average rate of over three per cent per year. This growth was strongest in the years immediately preceding the recession when passenger kilometres travelled by rail grew by 25 per cent between 2004/05 and 2007/08.
Since then, demand has continued to grow, albeit at a lower rate, before returning to a higher rate of growth in 2010/11 with a 6 per cent increase in demand.
At present around 150 million long distance journeys are made by rail annually. This suggests a 10 per cent rail mode share overall, although rail dominates the market for travel between many large cities.
Study approach
The approach taken to produce this study was threefold:
• a review of the published literature relating to rail industry funders’, stakeholders’ and passengers’ requirements for the long distance passenger market
• an extensive and ongoing dialogue with stakeholders, including a three month public consultation on the Draft for Consultation published on 27th March 2013
• primary research into the impact of improvements to rail services on the wellbeing of Great Britain, building on previous work undertaken by the rail industry, Governments, and academic institutions.
The work to produce this study has been overseen by a Working Group comprising train operators, funders and central Governments, the Association of Train Operating Companies and the Office of Rail Regulation. The group has supported the development of the strategic goals and has provided guidance and a review of the work to produce the demand forecasts and conditional outputs.
The Working Group has been aided by a series of smaller locally devolved groups who have provided location specific spatial and economic context for the study.
The three month consultation period on the Draft for Consultation document has provided a wide range of organisations and individuals with the opportunity to review the concepts and ideas set out in that document, and to provide a considered response. These responses have been used to inform and complete this final version of the Long Distance Market Study. Network Rail, and the industry working group, wish to thank those organisations and

Network Rail Long Distance Market Study 06October 2013Executive Summary
Long term demand scenarios
Identifying the appropriate role of rail in the context of these long term strategic goals requires extension of Network Rail’s current demand projections to a 30 year time horizon as typical major railway infrastructure components, such as track systems, have an asset life of around 30 years.
Ten year projections are also required to provide a snapshot of the likely situation at the start of Control Period 6 in 2019. This is the next rail industry planning period where investment priorities have yet to be established.
A three stage approach has been used to develop the long term demand projections:
• a review of the factors which influence the demand for travel by rail
• development of four alternative futures for Great Britain’s economy and social and environmental planning, to examine how the factors which influence the demand for travel by rail could change
• production of a projected range of future passenger demand based on these four scenarios
Continued growth in the market for long distance rail travel is dependant on a number of factors, of which the most important are the location of economic activity in towns and large urban areas, maintaining and improving rail’s competitive advantage over other modes, and a return to long term national income growth.
The maximum potential for growth over the 30 year period considered is higher1 than experienced over the previous 10-15 years as many, but not all, of the factors which support rail demand growth have occurred at once.
1 Excluding the impact of large scale service improvements such as the introduction of the West Coast Main Line Very High Frequency Timetable in 2008.
individuals that have taken the time to respond to the Long Distance Market Study Draft for Consultation.
Strategic goals
The Long Distance Market Study identifies the role of the long distance passenger market in achieving the key priorities of current and potential future national and regional funders over the long term. These statements of priorities are the strategic goals that the long distance market should aim to meet over this period. Strategic goals have been developed in collaboration with industry partners, stakeholders and through a review of literature.
The strategic goals are split by the overall goals for transport (in bold) and the subsequent goals for long distance rail (in italics):
Enabling economic growth
- by providing sufficient capacity for people travelling to take part in economically productive activities
- by improving business to business connectivity
- by improving connectivity to/from the retail, tourism and leisure sectors of the economy.
Reducing carbon and the transport sectors impact on the environment
- by directly reducing the environmental impact of rail
- by reducing the use of less carbon efficient modes of transport.
Improving the quality of life for communities and individuals
- by connecting communities
- by providing access to social infrastructure such as educational establishments and major leisure venues
- by reducing road congestion.
Improving affordability (to funders) and value for money
- by meeting other outputs in an affordable way
- by directly reducing whole industry subsidy.

Network Rail Long Distance Market Study 07October 2013Executive Summary
Furthermore, it is unlikely that all of the factors which are currently in rail’s favour will change materially in the short term, and annual passenger demand growth to 2023 is expected to be similar to the level experienced recently.
Over 30 years, growth in the number of long distance passenger journeys could vary significantly, although the lower end of the range of projections is based on sizable changes in a number of economic and spatial trends which would take a significant period of time to occur. On this basis the long term projections for the amount of future capacity required is based on the high end of the demand forecast range.
Long term conditional outputs – aspirations for 2043
The requirement to look to the long term has changed the emphasis of industry planning, from consideration of ‘what can be achieved given existing constraints’, to ‘what should be achieved to deliver the desired outcome’.
The conditional outputs for the long distance passenger market are a statement of the long term aspirations for the level of service provided and are required to inform future investment decisions. They are therefore the key deliverable of the Market Study and form the basis for the rest of the LTPP for this market. They are not constrained by considerations of cost and deliverability, which will be considered in subsequent stages of the LTPP.
The conditional outputs have been developed using an assessment of how to deliver three of the four strategic goals:
• enabling economic growth
• reducing carbon and the transport sector’s impact on the environment
• improving the quality of life for communities and individuals.
An assessment of the fourth goal has not been considered, although supporting commentary is provided where appropriate:
• improving affordability and value for money.
This goal will be considered in the remainder of the LTPP.
The conditional outputs are therefore conditional on a subsequent favourable assessment of value for money and affordability for current and potential future rail industry funders.
They should be viewed as aspirations for the future rather than recommended investment decisions.
It is important to emphasise that improvements to rail services are only one of the conditions required to generate funders’ desired outcomes, and the conditional outputs should be viewed as a statement of rail’s role in a wider policy context.
It is also important to state that the conditional outputs shown are conditional on both affordability, fundability, and a value for money business case being made for any interventions that subsequent Route Studies in the LTPP may consider as a way to deliver them. Equally the conditional outputs will need to be deliverable both technologically, operationally and physically. Lastly the long distance market is one of the markets present on much of the railway and the nature of a mixed traffic (or market) network means that Route Studies will need to examine the trade offs between potentially differing conditional outputs when considering how they can be accommodated. In this context the following conclusions were reached in developing a series of quantitative, service level conditional outputs:
• the rail industry can help create the conditions to improve economic growth, the environment, and the quality of life for communities and individuals by improving the long distance services between over 60 of the pairs of the principal regional centres in Great Britain. (As discussed previously, these objectives are the strategic goals for the long distance market sector, and a statement of funders’ requirements)
• the largest improvements against these goals are likely to be generated by providing very fast services between London and the other principal regional centres, and between some of the other principal regional centres of around 100 miles in separation such as Birmingham and Leeds
• very large improvements against these goals are also likely to be generated by providing high frequency interurban services between a number of the principal regional centres in the north

Network Rail Long Distance Market Study 08October 2013Executive Summary
Other, qualitative, conditional outputs have been developed relating to factors which could enable a successful outcome from the quantitative conditional outputs. These relate to:
• access to long distance strategic rail interchanges
• access to airports and ports
• better connectivity for the weekend leisure market
• access to higher education establishments and other key social infrastructure
• passenger satisfaction
• access to the rail network.
The trade offs between improved affordability and the other strategic goals in the context of ticket pricing have also been highlighted.
of England, the Midlands, West of England, Wales and Scotland
• service improvements between other regional centres and principal regional centres in other regions will also be of benefit against the strategic goals. Improving connectivity to and from London is particularly beneficial
• provision of improved opportunities to travel between a number of locations that are not currently directly served would be beneficial against the strategic goals
• significant additional capacity is likely to be required over the next 30 years to accommodate the growth in economically productive travel. This capacity requirement is likely to be greatest between the principal regional centres in Great Britain such as London and Manchester.

Network Rail Long Distance Market Study 09October 201301. Background
The geographic RUS programme led by Network Rail commenced in late 2004 and a suite of strategies have been produced covering the whole of the country, culminating in the establishment of the West Coast Main Line RUS in August 2011. As the network licence requires the maintenance of RUSs, the completion of the initial programme of geographic RUSs gave the opportunity to review how best to discharge this requirement in the future.
1.1 Background to the development of the Long Term Planning Process
In June 2005 the Office of Rail Regulation (ORR) modified Network Rail’s network licence to require the establishment and maintenance of Route Utilisation Strategies (RUSs), for the use and development of the network consistent with the funding that is, or is likely to become, available.
This modification to the Network Rail network licence followed the Rail Review in 2004 and the Railways Act 2005.
The geographic RUS programme led by Network Rail commenced in late 2004 and a suite of strategies have been produced covering the whole of the country, culminating in the establishment of the West Coast Main Line RUS in August 2011. As the network licence requires the maintenance of RUSs, the completion of the initial programme of geographic RUSs gave the opportunity to review how best to discharge this requirement in the future. Since summer 2011, Network Rail and the industry have worked to develop a revised methodology to the RUS process to continue to develop the long term strategic direction of the rail network. This successor programme, the Long Term Planning Process, was endorsed by the ORR in April 2012.
1.2 Changes of context
Since the start of the RUS programme in 2004 there have been changes in administrations in England, Wales and Scotland and there have been very significant changes in planning policy context.
Long term strategic investments are being made in the rail network rather than tactical solutions to individual problems – examples include the development of a high speed line between London and Birmingham and beyond to Leeds and Manchester (HS2), electrification of significant route mileage, Crossrail, changes to signalling technology through deployment of the European Rail Traffic Management System (ERTMS) and progression of the Network Rail Operating Strategy.
Therefore, there is a need for the industry to consider network-wide long term infrastructure development rather than ‘as now plus isolated enhancements’ to the rail network.
This will also need to inform maintenance and renewal strategies in both the short and medium term.
The balance of funders’ objectives has also changed in the light of a significantly tighter fiscal environment and the conclusions from the ‘Rail Value for Money’ report published by Sir Roy McNulty in May 2011. There is a clear policy shift towards revenue generation and making best use of the existing railway. Indeed, the Rail Value for Money report explicitly recommends that rail planning should place more emphasis on making best use of the existing network, before considering further infrastructure investment. Franchises are becoming less prescriptive in England and Wales and shorter term train service options in the future are expected to be driven more by franchises. All administrations see greater emphasis on the role of transport in supporting the economy, for example by widening access to labour markets and by improving connectivity between businesses.
Network Rail has recently restructured to become more accountable to its customers with the creation of ten devolved Routes to enable greater local decision making.
In the context of these changes, the RUS process to date has a number of limitations. The key challenge is that RUSs have developed options as incremental changes to existing services. This is unlikely to be appropriate in the future – at least as the only or main approach to option development – because many of the changes described above imply a need to consider step changes to services. In the future, making best use of the network may require looking beyond existing service patterns. Stakeholder aspirations for services to support economic growth, for example by connecting residential areas to labour markets, may involve entirely new services. Investments such as HS2 and electrification also give opportunities for step changes in train service, not only on the parts of the network directly affected, but well beyond1.
Another limitation of the process to date is in the way that it has dealt with services that run across several RUS areas. Such services have generally been considered by each geographic RUS in isolation, each RUS looking at changes within its area but not considering the service as a whole.
1 However, this study is not the vehicle to investigate locations which are not covered by rail per se, rather the study supports the need of the market.
Network Rail Long Distance Market Study 10October 201301. Background
1.4 Market Studies
There are four Market Studies: Long Distance passenger, London & South-East passenger, Regional Urban passenger, and Freight. Although the three passenger market studies have obvious connections to the three ’sectors’ into which passenger train services are often divided, it is important to emphasise that each Market Study will consider a particular passenger market, rather than a particular set of train services.
The passenger Market Studies have three key outputs:
• identification of the long term strategic goals which define the successful provision of rail services to each of the three market sectors. These are based on the aspirations of current and likely future rail industry funders
• demand forecasts for the sector, over a 10 and 30-year planning horizon. Scenarios are used to reflect key uncertainties, where appropriate
• “conditional outputs” for the sector. The conditional outputs are aspired levels of service (in terms of, for example, frequency, journey time and/or passenger capacity on key flows in the sector). The conditional outputs reflect stakeholder views of how rail can support delivery of their strategic goals, and opportunities created by planned investments, as well as reflecting current service levels and forecast future demand. The aim of the market studies is to provide demand forecasts, and conditional outputs, that are consistent across the Route Studies. The market studies will not consider in detail markets that are relevant for the planning of train services or infrastructure only within a single Route Study area and the aspirations for such markets (e.g. services operating wholly within Scotland or Wales) which will be considered in more detail in the relevant Route Study. The conditional outputs are conditional on both affordability and a value for money business case being determined in subsequent Route Studies.
The Freight Market Study will produce demand forecasts over a 10 and 30-year planning horizon, with preferred routeing of services and the implied requirements in terms of network capacity and capability. Scenarios will be used to reflect key uncertainties.
This has been workable only because, as noted above, options have been defined as incremental changes to existing services. With step changes to long distance services likely in the future, for example as a result of HS2 or electrification, this approach will no longer be appropriate.
1.3 Long Term Planning Process overview
The Long Term Planning Process consists of a number of different elements, which when taken together, seek to define the future capability of the Network. The individual elements are detailed below:
• Market Studies, which will forecast future rail demand, and develop conditional outputs for future rail services, based on stakeholders’ views of how rail services can support delivery of the market’s strategic goals
• Route Studies, which will develop options for future services and for development of the rail network, based on the conditional outputs and demand forecasts from the market studies, and assess those options against funders’ appraisal criteria in each of Network Rail’s devolved Routes
• Cross-boundary analysis, which will consider options for services that run across multiple routes to enable Route Studies to make consistent assumptions in respect of these services.
The Market Studies, Route Studies and Cross-boundary analysis are described in further detail in Sections 1.4, 1.5 and 1.6 below.
The Long Term Planning Process (and in particular the Route Studies) will provide a key part of the evidence base for future updates of the Network and Route Specifications which bring together all the medium and long term plans for the development of a route, drawing on sources including RUSs, renewal plans, development of major projects and resignalling programmes.
In addition, the existing Network RUS process will continue to look at network-wide issues. Further information on the Long Term Planning Process, the current Network and Route Specifications and the Network RUS can be found on Network Rail’s website at www.networkrail.co.uk.

Network Rail Long Distance Market Study 11October 201301. Background
1.6 Cross-boundary analysis
Services that run across more than one Route Study area will be considered in a separate “cross-boundary” workstream. This workstream will develop and assess options for cross-boundary services (passenger and freight), in a similar way to the Route Studies. The output from this workstream will be a set of common assumptions that Route Studies should adopt regarding cross-boundary services. Assumptions might include the frequency and calling patterns of passenger services, and the frequency and operating characteristics (e.g. gauge, speed, tonnage) of freight services.
The workstream may also specify options for cross-boundary services to be examined in more detail in Route Studies, in order to better understand the trade offs between cross-boundary and other services. The assumptions regarding cross-boundary services may be revised from time to time based on the analysis in Route Studies.
1.7 Long Term Planning Process outputs
The Long Term Planning Process occupies a particular place in the planning activity of the rail industry. The choices presented and the evidence of relationships and dependencies revealed in the work across all elements of the process form an input into decisions made by industry funders and suppliers on issues such as franchise specifications and investment plans. In particular, the Long Term Planning Process will form an essential evidence base for the development of the High Level Output Specification for Control Period 6 (2019-2024).
All of the Market Studies draw on existing work where appropriate, for example work done in RUSs, development of the Strategic Freight Network and Local Authority multi-modal studies.
1.5 Route Studies
There will generally be one Route Study for each of Network Rail’s devolved routes. In a few cases a devolved Route may be covered by more than one Route Study, where part of the Route is largely self-contained. Equally where the likely service pattern to address a particular market need covers more than one Route to a significant degree a Route Study may consider those services as a whole, irrespective of Route boundaries.
A Route Study will develop and assess options for the long term use and development of the network. Its starting point will be to determine whether the conditional outputs from the relevant Market Studies can be accommodated on the existing network, with committed enhancements. It will then develop train service options, corresponding to different uses of the network (and hence to different trade offs between stakeholders’ strategic goals). A Route Study will first look at options for making use of the existing network, and only then at options involving infrastructure investment. Options will be assessed against funders’ decision making criteria. This will include quantitative appraisal as in the previous RUS process. It will also, where appropriate, include a wider assessment against factors such as strategic fit, wider economic impacts and affordability.
The output from a Route Study will be evidence based choices which will be available to Network Rail and industry funders to determine the long term use, and development, of the network.

Network Rail Long Distance Market Study 12October 201301. Background
1.8 Long Term Planning Process governance arrangements
The Long Term Planning Process is designed to be as inclusive as possible with contributions encouraged both from the rail industry and wider stakeholders. Overall governance responsibility for the process lies with the Rail Industry Planning Group (RIPG) which meets quarterly and whose membership comprises:-
• Association of Train Operating Companies (ATOC)
• Department for Transport
• Freight Operators
• London Travel Watch
• Network Rail
• Office of Rail Regulation
• Passenger Focus
• Passenger Transport Executive Group (PTEG)
• Rail Freight Group
• Railway Industry Association
• Rail Freight Operators Association
• Rolling Stock Leasing Companies
• Transport for London
• Transport Scotland
• Welsh Government
A two tier structure for stakeholder dialogue has been established to oversee and help produce this Long Distance Market Study.
First, a Working Group provides high level support for developing the three key output deliverables detailed in Section 1.4, a mandate to discuss these deliverables on behalf of the rail industry with other stakeholders, and a review of the ongoing work to develop them.
The working group comprises central Government(s), the Passenger Transport Executives Group (PTEG), all the current train operating companies (TOCs) who operate in the sector, ATOC, a freight industry representative nominated by the Strategic Freight Network
steering group, Network Rail, and the Office of Rail Regulation (ORR) as an observer.
Second, a series of smaller locally devolved groups provide location specific spatial and economic context and evidence of planned and existing studies to enable the production of study output deliverables that are appropriate for both local circumstances and the national rail market sectors.
These groups typically comprise Local Enterprise Partnerships (LEPs), unitary and larger metropolitan local authorities, Passenger Transport Executives or equivalent, the Department for Transport, the current train operating companies which serve both the passenger market and locality in question, Welsh Government and the Regional Transport consortia in Wales and Network Rail.
The Long Distance Market Study groups are termed Regional Groups and are based around the principal locally devolved regions in England and Wales. The meeting groupings are as follows:-
• East Midlands
• North East & Teesside
• North West
• South West
• Wales
• West Midlands
• Yorkshire & Humber
Transport Scotland has assisted the Long Distance Market Study in consideration of Anglo Scottish connectivity.
Additionally a number of one to one meetings have been held with stakeholders.
Network Rail Long Distance Market Study 13October 201301. Background
1.9 Document Structure
This study has been developed based on input from a wide range of stakeholders and comprehensive appraisal and analysis work:
• Chapter 2 provides a description of the Long Distance passenger market sector in terms of its characteristics, total demand, passenger kilometres and revenue. It identifies the typical passenger journey purpose before considering those circumstances and flows where rail is most competitive
• Chapter 3 summarises the way in which the study has been approached. It details how and what evidence has been collected, the primary economic research, the consultation undertaken and sets the goals forecasts and outputs
• Chapter 4 details the literature review that has been undertaken to assist the study
• Chapter 5 sets out the strategic goals for the long distance market sector in terms of how they have been developed and what they are
• Chapter 6 looks at the long term demand scenarios and details how the scenarios have been developed, the methodology used and the consequent forecasts themselves
• Chapter 7 identifies the long term conditional outputs for the Long Distance Market Sector. It shows how the outputs were developed before summarising what they are, as well as setting out a number of case studies.
• Chapter 8 describes the consultation process and the responses that have been received following the publication of the Long Distance Market Study Draft for Consultation in March 2013, before detailing the next steps.
This document has been published exclusively on Network Rail’s website. If you would like a paper copy please write to or email the following address to arrange for a copy to be sent to you:
RUS PlannerKings Place90 York WayLondonN1 [email protected]
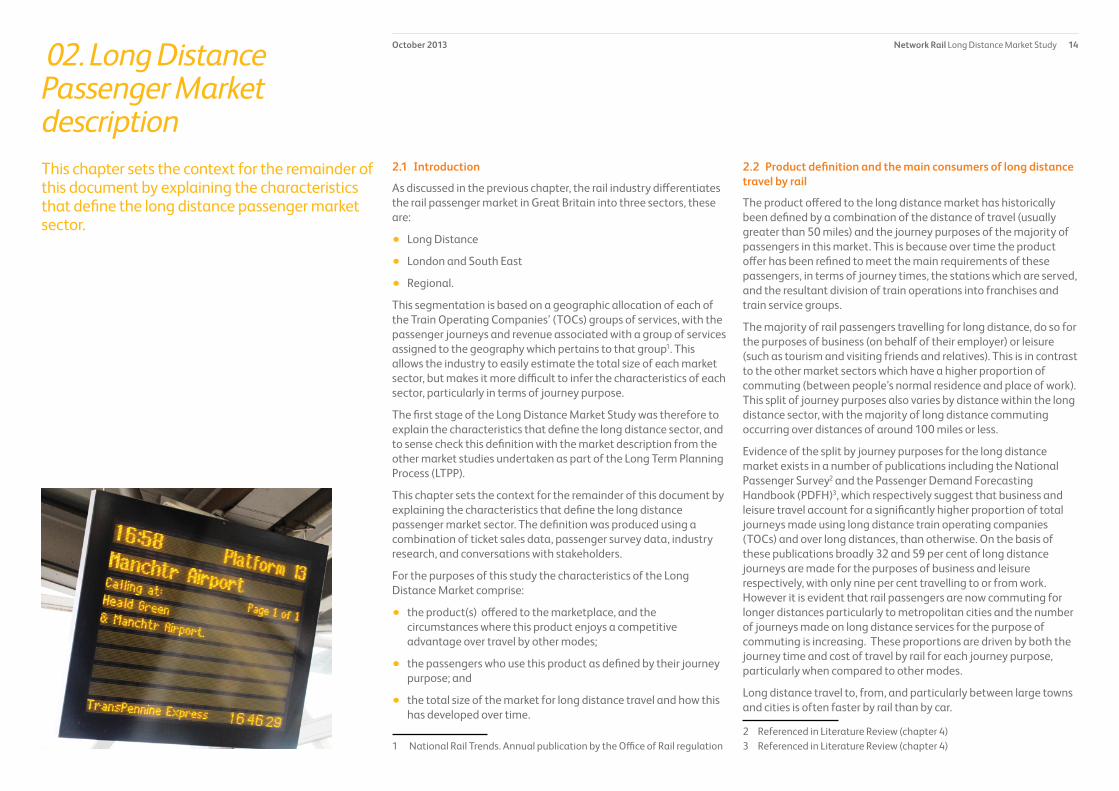
Network Rail Long Distance Market Study 14October 2013 02. Long Distance Passenger Market descriptionThis chapter sets the context for the remainder of this document by explaining the characteristics that define the long distance passenger market sector.
2.1 Introduction
As discussed in the previous chapter, the rail industry differentiates the rail passenger market in Great Britain into three sectors, these are:
• Long Distance
• London and South East
• Regional.
This segmentation is based on a geographic allocation of each of the Train Operating Companies’ (TOCs) groups of services, with the passenger journeys and revenue associated with a group of services assigned to the geography which pertains to that group1. This allows the industry to easily estimate the total size of each market sector, but makes it more difficult to infer the characteristics of each sector, particularly in terms of journey purpose.
The first stage of the Long Distance Market Study was therefore to explain the characteristics that define the long distance sector, and to sense check this definition with the market description from the other market studies undertaken as part of the Long Term Planning Process (LTPP).
This chapter sets the context for the remainder of this document by explaining the characteristics that define the long distance passenger market sector. The definition was produced using a combination of ticket sales data, passenger survey data, industry research, and conversations with stakeholders.
For the purposes of this study the characteristics of the Long Distance Market comprise:
• the product(s) offered to the marketplace, and the circumstances where this product enjoys a competitive advantage over travel by other modes;
• the passengers who use this product as defined by their journey purpose; and
• the total size of the market for long distance travel and how this has developed over time.
1 National Rail Trends. Annual publication by the Office of Rail regulation
2.2 Product definition and the main consumers of long distance travel by rail
The product offered to the long distance market has historically been defined by a combination of the distance of travel (usually greater than 50 miles) and the journey purposes of the majority of passengers in this market. This is because over time the product offer has been refined to meet the main requirements of these passengers, in terms of journey times, the stations which are served, and the resultant division of train operations into franchises and train service groups.
The majority of rail passengers travelling for long distance, do so for the purposes of business (on behalf of their employer) or leisure (such as tourism and visiting friends and relatives). This is in contrast to the other market sectors which have a higher proportion of commuting (between people’s normal residence and place of work). This split of journey purposes also varies by distance within the long distance sector, with the majority of long distance commuting occurring over distances of around 100 miles or less.
Evidence of the split by journey purposes for the long distance market exists in a number of publications including the National Passenger Survey2 and the Passenger Demand Forecasting Handbook (PDFH)3, which respectively suggest that business and leisure travel account for a significantly higher proportion of total journeys made using long distance train operating companies (TOCs) and over long distances, than otherwise. On the basis of these publications broadly 32 and 59 per cent of long distance journeys are made for the purposes of business and leisure respectively, with only nine per cent travelling to or from work. However it is evident that rail passengers are now commuting for longer distances particularly to metropolitan cities and the number of journeys made on long distance services for the purpose of commuting is increasing. These proportions are driven by both the journey time and cost of travel by rail for each journey purpose, particularly when compared to other modes.
Long distance travel to, from, and particularly between large towns and cities is often faster by rail than by car.
2 Referenced in Literature Review (chapter 4)3 Referenced in Literature Review (chapter 4)
Network Rail Long Distance Market Study 15October 2013 02. Long Distance Passenger Market description
The average journey speed by rail for journeys of this nature typically ranges between 80mph (e.g. Leeds – London) and 100mph (e.g. Warrington – London), which even accounting for the time taken to access/egress a station compares very favourably with the highway network, particularly given city centre traffic congestion and car parking limitations. The economic geography of Great Britain also means that long distance travel is often faster by rail than by air, with the exception of cities in Scotland to/from the south of England.
The comparative journey time advantage that rail provides is attractive to potential business passengers, particularly given the significant level of business activity that occurs within large urban areas. Rail has the added benefit that it presents the opportunity to work whilst on the train. As a consequence, sizeable numbers of business and leisure passengers travel by rail between large towns and cities, of between 30 and 50 miles apart.
Long distance business passengers typically need to travel during the morning peak and value the flexibility of a choice of trains on their return journey. Considerations around time and flexibility therefore tend to outweigh those of cost for these passengers, although cost has become an increasingly important consideration in recent years.
Long distance travel by rail can be relatively inexpensive for passengers who are able to travel on discounted tickets which are available for use predominantly during the off-peak period.
Leisure passengers who purchase their tickets in advance are often able to tailor their journey arrangements to take advantage of these discounted tickets, thereby making long distance travel by rail an attractive proposition under some circumstances.
Weekends are particularly busy for leisure travel with National Passenger Survey data suggesting that 35 per cent of all leisure travel is undertaken on Saturdays and Sundays and a large number of the first legs of these journeys are made on Fridays. Over 80 per cent of weekend travel is for the purpose of leisure.
Above a level of around two to three trains per hour the frequency of services is less important to business and leisure passengers than speed, as these groups respectively tend to target specific trains to
coincide with the time of a meeting and to take advantage of discounted tickets.
Despite these comparative advantages of speed and in some instances price, most long distance journeys can involve a significant outlay in terms of time and cost. The annual frequency of journeys made per commuter make relatively long distance commuting an unattractive proposition for most people, although some sizeable commuter flows occur where time and cost considerations are outweighed by other economic factors.
Many long distance train service groups are also used by passengers from the other market sectors. This particularly occurs where long distance services call at a large urban area close to a regional or national economic centre, and attract sizeable numbers of commuters. Examples of this include regular calls at Reading in Cardiff Central and Bristol Temple Meads to London Paddington services.
2.3 The total Long Distance Passenger Market
Rail industry data suggests that approximately 150 million long distance journeys are made by rail annually. Based on National Travel Survey data this implies a 10 per cent rail mode share in the market for long distance travel, although as alluded to above, rail dominates the market for travel between many large cities (e.g. Leeds - London).
Since 1994 passenger demand in the long distance sector has grown robustly at an average rate of over three per cent per year. This growth was particularly strong between 2004/05 and 2007/08, during which time passenger kilometres grew by 25 per cent. Demand in the market continued to grow throughout the first recent recession (2008), albeit at a lower rate, before returning to higher rates of growth in 2010/11 with a 6 per cent increase in demand. Travel for all purposes has grown strongly over this period with weekend leisure travel performing particularly strongly. Many train operators believe that this is evidence of significant latent demand since engineering activities, hence service restrictions, are often scheduled for weekends to avoid the weekday commuter and business peaks.
Network Rail Long Distance Market Study 16October 2013 02. Long Distance Passenger Market description
This definition is intended to attach a geographic construction to the types of travel by journey purpose which comprise the majority of the long distance sector, namely business travel and leisure travel. It is recognised that this is a simplification of the role performed currently by rail services particularly where long distance services also facilitate commuting. The corresponding geographic definitions of the London and South East and Regional Urban Market Studies/sectors are therefore intended to capture the majority of longer distance commuting, and this study has considered separately the market for travel over less than and greater than 100 miles to address the majority of long distance commuting that occurs exclusively within the geographical scope of this study.
Ultimately, the outputs of the three passenger Market Studies and the Freight Market study will be combined to form the starting point for a holistic and comprehensive Long Term Planning Process.
Development of the long distance rail service offer has followed spatial trends and the historical structural development of the economy from a manufacturing base, to a tertiary, knowledge-based economy concentrated in central urban areas.
Over time long distance services have increasingly been tailored to the requirements of city-to-city business and leisure travellers with industry funders preferring to invest in improvements to journey times, rather than additional station calls or train frequencies in excess of two to three per hour.
2.4 Long Distance Passenger Market definition
The long distance passenger market sector is therefore defined for the purposes of this study as:
• the market for rail travel over distances of greater than 50 miles, excluding journeys which are predominately for commuting purposes and are made entirely within one of the other Market Study areas. Journeys made for business or leisure purposes despite being entirely within one of the other Market Study areas, (e.g. Brighton to Oxford) are also considered in this Market Study, and
• the market for rail travel between large towns and cities of at least 30 miles apart, again excluding journeys made entirely within one of the City Regions considered in the other Market Study areas (e.g. Preston - Manchester which is considered in the Regional Urban Market Study).

Network Rail Long Distance Market Study 17October 201303. Study approach
The first stage in the process was to conduct a review of the published literature relating to rail industry funders’, stakeholders’ and passengers’ requirements for the long distance passenger market. This provided the starting point for the development of the strategic goals for the market, and was used to help understand how improvements to the train services received by the long distance market sector can help to achieve these goals.
3.1 Background
The Market Study approach has been designed to produce the three key deliverables outlined in Chapter 1, namely:
• identification of the long term strategic goals for the market sector, based on the aspirations of current and likely future rail industry funders
• production of long term demand scenarios for the market sector
• identification of conditional outputs for the specification of train services in the long term which will achieve the strategic goals for each market sector, given future circumstances identified in the demand scenarios.
These outputs are conditional upon subsequent value for money and affordability assessments.
The resultant study approach is outlined below.
3.2 Study approach
3.2.1 Literature review
The first stage in the process was to conduct a review of the published literature relating to rail industry funders’, stakeholders’ and passengers’ requirements for the long distance passenger market. This provided the starting point for the development of the strategic goals for the market, and was used to help understand how improvements to the train services received by the long distance market sector can help to achieve these goals.
This literature review is summarised in Chapter 4.
3.2.2 Stakeholder dialogue
An extensive and ongoing dialogue with stakeholders has been undertaken using meetings of the Working Group and Regional Groups outlined in Chapter 1 as forums for this discussion.
Meetings of these groups were timed to coincide with the completion of each of the Market Study deliverables, whereby the Working Group was asked to help develop and articulate strategic goals across Great Britain, demand scenarios and conditional outputs, and the Regional Groups were asked to confirm whether these deliverables were appropriate in the circumstances that apply to the areas they represent.
3.2.3 Primary research
Research into the impact of improvements to rail services on the wellbeing of Great Britain was undertaken to provide a thorough evidence base for development of the conditional outputs. This research sought to establish statistical relationships between the quality of transport opportunities and indicators of national and local wellbeing. This involved the collection of a significant body of new data on travel patterns, and social, demographic and economic trends, as well as estimating a series of statistical relationships between this data. This work is detailed in Chapter 7.
Research was also conducted to provide new long term passenger demand projections. This is explained in detail in Chapter 6.
Both pieces of research are built on existing work undertaken by Network Rail and other industry organisations such as the 2009 Network RUS Scenarios and Long Distance Forecasts and Prioritising Investment to Support our Economy, Network Rail 2010.
3.2.4 Consultation
In March 2013 the Long Distance Market Study Draft for Consultation was published by Network Rail on behalf of the Working Group. It set out the conditional outputs for the Long Distance Market and received a significant number of responses. These responses have been collated, reviewed, and have informed the production of this document. Details of the key themes emerging from the consultation are articulated in Chapter 8.

Network Rail Long Distance Market Study 18October 201304. Literature review
This chapter presents a review of the published literature relating to rail industry funders’, stakeholders’ and passengers’ requirements for the long distance passenger market.
4.1 Introduction
This chapter presents a review of the published literature relating to rail industry funders’, stakeholders’ and passengers’ requirements for the long distance passenger market. This provided the starting point for the development of the strategic goals, long term demand scenarios and conditional outputs. The review considered three types of documents:
• Central Government(s) policy as evidenced by recent investment decisions, and the rail industry’s activities to deliver this policy
• stakeholders’ rail and transport strategies
• research on the demand for travel by rail.
4.2 Government(s) policy
The Department for Transport (DfT) and Transport Scotland (TS) are the principal public funding authorities for the rail industry. These Government departments published their investment priorities for 2014-2019 (Network Rail Control Period 5, CP5) in the 2012 High Level Output Specifications (HLOS) for England & Wales and for Scotland, respectively.
These documents outline Government(s) commitment to improvements to the capability of the rail network and the services which use it with a combined value of over £11 billion.
Both documents indicate that the priorities for this investment are:
• supporting business and economic growth
• an improved environmental outcome
• supporting and connecting people and communities
• maintaining and improving the value for money and financial sustainability of the rail industry.
A number of the specified schemes and ring-fenced investment funds in these documents target improvements to long distance rail services and infrastructure as a means to achieving these priorities. These include:
• further electrification of the network – electrification of a number of route sections between the south, the Midlands and
South Yorkshire, in order to support economic development and improve national and regional connectivity. Elements of this scheme have previously been demonstrated by Network Rail to result in a long term reduction in rail industry costs and a greener environmental outcome
• the Northern Hub. A series of schemes, to improve capacity, journey times and service frequencies between regional centres in the north of England, enabling a greater level of economic activity than currently
• East Coast Main Line Connectivity. Namely, a ringfenced fund to improve capacity and reduce journey times between key destinations on the East Coast Main Line.
The DfT is also supporting the development of the High Speed 2 project to connect London, the West Midlands and the north of England with a new high speed railway line, and is currently preparing a bill which is to be presented before Parliament for the first phase of this line. If implemented, this unprecedented investment would provide a step change in the capacity provided for business passengers and commuters, and significantly reduce the journey times between Britain’s largest clusters of economic activity.
The rail industry received broadly £4.5bn support from the taxpayer in 2011/12. This demonstrates the value that funders’ attach to the role of rail in a successful outcome for Great Britain, but also highlights that the overall affordability of the rail industry is a key challenge.
The industry is taking responsibility for this challenge through the Rail Delivery Group (RDG), which brings together senior leaders of the rail industry. RDG has initiated a number of working groups to examine opportunities to deliver efficiencies across the industry including asset, programme and supply chain management, contractual and regulatory reform, train utilisation, and technology, innovation and working practices. A workstream to examine the opportunities to reduce the costs of major projects through greater industry engagement in the development and delivery of enhancement schemes has also recently been started.
Network Rail Long Distance Market Study 19October 201304. Literature review
The rail industry is in agreement that efficiencies can be achieved over the forthcoming Control Periods.
An implication of this is that some market sectors and sub-sectors could achieve a financial break even in the future, ergo placing a greater emphasis on private sector funding.
4.3 Stakeholders’ rail/transport strategy
Most stakeholder organisations have a strategy for future rail services intended to deliver their desired outcome for the areas they represent. The most detailed of these strategy documents have been produced by Passenger Transport Executives (PTEs) on behalf of the Integrated Transport Authorities (ITAs) which they represent. A number of these strategies cover more than one PTE’s area, in recognition that the functioning economic areas transcend geographical and political boundaries.
The following documents have been reviewed in development of the strategic goals presented in Chapter 5. Whilst the details of these strategies are location specific, the themes of supporting economic growth, a greener environment, connecting communities, and financial efficiency are common to most:
• Manchester Hub Conditional Output Statement. The Northern Way. April 2009
• Manchester Hub Rail Study. Network Rail. February 2010
• Yorkshire Rail Network Study Conditional Output Statement. Steer Davies Gleave on behalf of Metro, South Yorkshire Passenger Transport Executive (SYPTE) and Leeds City Region. March 2012
• A World Class Rail Network for the West Midlands, Draft Summary Document. West Midlands Regional Rail Forum. October 2012
• Great Western Conditional Outputs Statement. Great Western Partnership. March 2012
• Route Utilisation Strategies (RUS). Network Rail. 2006 to current.
• Network RUSs. Network Rail. 2009 to current
• Industry Strategic Business Plans for Control Period 5, and associated documents. Network Rail, Association of Train Operating Companies (ATOC), Rail Industry Association (RIA), Rail Freight Operators Association (RFOA). 2013.
• Strategic Business Plans for Control Period 5, and associated documents. Network Rail. 2013
• Planning ahead 2010, the long term planning framework. Network Rail, ATOC and RFOA. August 2010
• The Eddington Transport Study. Sir Rod Eddington. December 2006
• Delivering a Sustainable Transport System: Main report. Department for Transport. November 2008
• Economic Case for HS2. Department for Transport. February 2011
• Prioritising investment to support our economy. Network Rail. September 2010
• Local Transport Plans
• Local Economic Development strategies
• Airport Surface Access Strategies
• Enterprise Zone Submissions
• High speed rail: investing in Britain’s future phase two – the route to Leeds, Manchester and beyond, Department for Transport January 2013.
• Rail Value for Money Report. Sir Roy McNulty. May 2011.
• GB Rail Industry Financial Information 2011-12, Office of Rail Regulation 2013.

Network Rail Long Distance Market Study 20October 201304. Literature review
4.4 Research into the demand for travel by rail in Great Britain
The final section of this chapter references the research that has been used to develop the long term demand scenarios and projections.
An extensive body of research exists into the factors which influence the demand for travel by rail. Since 1986, the Passenger Demand Forecasting Handbook (PDFH) has formed the rail industry’s main source of reference for this research, detailing summaries of the most pertinent studies, and providing advice on the practical applications of this work.
The Passenger Demand Forecasting Council (PDFC) is the rail industry association responsible for commissioning new research, and it periodically updates the PDFH when significant advancements in this research have been made.
Full members of the scheme include:
• ATOC
• all Train Operating Companies (TOCs)
• DfT
• Transport Scotland (TS)
• all PTEs
• the Office of Rail Regulation (ORR), and
• Network Rail.
Associate members of the scheme include a number of consultancy firms which specialise in transport economics as well as some universities.
The PDFH/PDFC has provided the majority of the evidence used to develop the long term demand scenarios. The most recent synopsis of this research is provided in PDFH version 5.
This Market Study has also used research that has not been commissioned by the PDFC (although some of this work has been undertaken by PDFC members).
Publications include:
• The portfolio of established Route Utilisation Strategies, Network Rail 2006 - 2012
• On the Move. Making sense of car and train travel trends in Britain, ORR, Independent Transport Commission (ITC), TS, RAC Foundation, 2012
• The Billion Passenger Railway. Lessons from the Past: Prospects for the Future, ATOC 2008
• Robust Foundations. Econometric Analysis of Long Time Series Rail Passenger Demand Aggregates Report to the Department for Transport, MVA 2008
• National Passenger Survey, Passenger Focus, (annually).

Network Rail Long Distance Market Study 21October 201305. Strategic goals
This chapter presents a statement of the outcomes that current and likely future funders of the rail industry require from the provision of rail services for the long distance passenger market. These outcomes are termed “strategic goals”.
5.1 Introduction
This chapter presents a statement of the outcomes that current and likely future funders of the rail industry require from the provision of rail services for the long distance passenger market. These outcomes are termed “strategic goals”.
Government organisations are currently the principal funders of the rail industry with around 38 per cent1 of industry funding coming from public subsidy, having fallen from a peak of almost 50 per cent in the financial year 2006/07.
Public funding for the long distance passenger market is largely allocated by the Department for Transport (DfT), which is the franchising authority for all long distance passenger franchises and the funder of changes to the capability of the infrastructure used by long distance rail services.
Depending on the treatment of fixed infrastructure costs, a number of long distance franchises currently generate an operating surplus. The cost of the rail industry per passenger km is expected to reduce over time, which could enable a greater level of investment from the private sector, should governments’ policies favour it.
Chapter 7 presents the characteristics of long distance rail services that would be required to achieve the strategic goals. These characteristics are termed “conditional outputs” and will be used in later stages of the Long Term Planning Process (LTPP) to produce future service and infrastructure specifications for consideration in the Route Studies. The strategic goals are therefore a key building block in the LTPP.
5.2 Identification of strategic goals
The process to identify the strategic goals was threefold:
1. A review of central government(s)’ policy objectives and recent funding decisions (as summarised in Chapter 4). This resulted in an initial list of strategic goals.
1 GB Rail Industry Financial Information 2011-12, Office of Rail Regulation 2013
2. Discussion at meetings of the Long Distance Market Study Working Group, outlined in Chapter 1, which included representatives of all the principal industry funders and several likely future funders. These discussions were supplemented with additional one to one discussions between Network Rail and individual members of the Working Group. The result of these collective discussions was an agreement of the strategic goals for transport and an initial list of how long distance rail could contribute specifically to these.
3. The agreed strategic goals for transport, and the draft list of how long distance rail could contribute to them were presented at each of the study Regional Groups, outlined in Chapter 1. This was followed by a discussion within each group of whether this list was appropriate, and how the contribution of long distance rail to the achievement of funders’ desired outcomes varies from a local perspective. This dialogue resulted in a refined list of strategic goals for long distance rail, which was then sense checked by the Working Group.
Network Rail also discussed with the Working Group whether it is appropriate to rank the goals in order of priority to funders, or in favour of particular parts of Great Britain (e.g. actively addressing distributional issues between different parts of the UK). The conclusion of these discussions was that a prioritisation of this nature was not appropriate as all of the goals were equally important, and that the outcomes articulated by them were equally important in all parts of Great Britain.
The resultant strategic goals are summarised below and explained in more detail in the following section. They are split by the overall goals for transport (in bold) and the subsequent goals for long distance rail (in italics):
• Enabling economic growth
– by providing sufficient capacity for people travelling to take part in economically productive activities
– by improving business to business connectivity
– by improving connectivity to/from the retail, tourism and leisure sectors of the economy
Network Rail Long Distance Market Study 22October 201305. Strategic goals
• Reducing carbon and the transport sector’s impact on the environment
– by directly reducing the environmental impact of rail
– by reducing the use of less carbon efficient modes of transport.
• Improving the quality of life for communities and individuals
– by connecting communities
– by providing access to social infrastructure such as educational establishments and major leisure venues
– by reducing road congestion.
• Improving affordability and value for money
– by meeting other outputs in a value for money and affordable way
– by directly reducing whole industry subsidy.
5.2.1 Enabling economic growth
Long distance rail plays a key role in supporting economic growth by bringing people and businesses together. It enables people to undertake business transactions on behalf of their employers and supports the retail and leisure economy.
Where centres of population are served by long distance rail services en-route to the major regional centre, long distance services connect workers to employment clusters and allow businesses to gain access to the labour supply.
Leisure travel also supports important sections of the economy such as tourism and retail, and long distance rail has an important role in connecting people with these sectors of the economy, particularly where a centre of populous and/or a major tourist attraction or retail centre can be made easily accessible to the rail network.
The majority of long distance rail passengers therefore travel to undertake economically productive activity and accommodating this travel is important for Great Britain’s economic wellbeing.
A strategic goal for long distance rail is therefore to:
• provide sufficient capacity for people travelling to take part in economically productive activities.
Long distance passengers also value the level of connectivity to and from the places they wish to access. Business travellers in particular value journey time, reliability, frequency and the opportunity to work on the train. Improving rail services, such as by reducing journey times between two cities, can help to increase business efficiency, increase business interactions between cities and support agglomeration of economic activities. Connectivity to London is particularly important for business in most parts of Great Britain given the level of economic activity undertaken there, and providing faster and more frequent access between London and the rest of Great Britain is an important priority for funders. A number of stakeholders view good access to the proposed High Speed 2 Y-shaped network as a key future enabler to this, and similarly view good connectivity with large airports and other international gateways as a means of enabling trade with major foreign markets. A strategic goal for long distance rail is therefore to:
• improve business to business connectivity.
Leisure passengers also require good connectivity for long distance rail to be an attractive means of accessing tourist attractions and retail centres, with journey time, on train facilities, and good access to and from the rail network during popular times for travel all important considerations. Some of these factors coincide with the requirements of business passengers. Others differ, and are often bespoke to the characteristics of a retail centre or tourist attraction. A strategic goal for long distance rail is therefore to:
• improve connectivity to/from the retail, tourism and leisure sectors of the economy.
It is recognised, however, that improved connectivity to retail, tourism and leisure sectors of the economy may be difficult to achieve at a market level, and may be more appropriate to consider in detail in the Route Studies.

Network Rail Long Distance Market Study 23October 201305. Strategic goals
5.2.3 Improving the quality of life for communities and individuals
Long distance rail plays an important role in connecting centres of population in Great Britain, in particular by providing travel opportunities to and from the larger urban conurbations where a combination of geography and city centre traffic congestion makes rail the fastest mode of travel. It provides a key alternative to the motorway and trunk road network which can often suffer from congestion at times of the highest demand for the leisure market such as Friday evenings and Sunday evenings.
Modal shift from road to rail also provides significant benefit to the remaining road users by reducing congestion and the other associated external impacts of road usage.
Long distance rail also connects large numbers of people with Great Britain’s key social infrastructure, such as universities, city centre shopping areas and leisure sites of national importance.
Strategic goals for long distance rail are therefore:
• connecting communities
• providing access to social infrastructure such as educational establishments and major leisure venues
• reducing road congestion.
Some of the strategic goals for long distance rail articulated above also overlap with the overall goal of improving the quality of life for communities and individuals.
5.2.2 Reducing carbon and the transport sector’s impact on the environment
Depending on the mix of power generation electric traction is typically more carbon efficient and environmentally friendly than the diesel equivalent. Electrification of the network, in particular on sections connecting long distance routes which are already electrified, will reduce the transport sector’s harmful impact on the environment. A strategic goal for long distance rail is therefore to:
• directly reduce the environmental impact of rail
It is recognised that this goal could be achieved through service and infrastructure specifications rather than at a market level. Achieving this goal will therefore be considered further during later stages of the LTPP, in particular the Network Route Utilisation Strategy (RUS).
Again, depending on the mix of power generation and fuel type, travel by rail is typically more environmentally friendly than by car and usually than by aeroplane. As a result, the carbon footprint of transport can be reduced by a modal shift from road or air to rail, and a strategic goal for the long distance market is to:
• reduce the use of less carbon efficient modes of transport.
Long distance rail is already competitive with car travel on a number of motorway and trunk routes, particularly between London and other major urban centres. Conversely, car tends to have a dominant market position where rail journey times are slow and/or access to the rail network is poor.
Domestic airlines usually have a high share of the total travel market when journey times by rail significantly exceed three hours, as the faster speed of air travel more than offsets the impact of lengthy airport access times. The busiest routes with these characteristics are locations in the south of England to/from Scotland, in particular London to/from Glasgow/Edinburgh. Mode shift from air to rail can significantly contribute towards meeting the environment strategic goal.
Network Rail Long Distance Market Study 24October 201305. Strategic goals
5.2.4 Improving value for money and affordability (to funders)
Providing value for money is a key criterion, both for governments’ funding decisions as part of a wider transport appraisal framework and for the rail industry’s customers. All rail industry investment proposals need to be justified in terms of an assessment of the likely value generated by the level of public investment sought.
In the context of government funding, the continuing pressure on UK public finances and a significant, albeit reducing, rail industry subsidy requirement per passenger kilometre, means that improving industry affordability is a key priority. The importance of providing excellent value for money has been reinforced through the McNulty Value for Money report, Network Rail’s Strategic Business plans and the Industry Strategic Business Plans.
In broader terms, however, the balance of funding between the public sector and the railway’s direct customers can and will vary, so affordability cannot be viewed from a purely public sector perspective. The 30 year timeframe considered by the LTPP means that affordability has to be considered in the round, considering the contributions that passengers and other customers are likely to make, rather than being conditioned solely by whether the availability of public finances increases or reduces.
Irrespective of the likely balance of future funding, it is important that, where possible, the difference between the rail industry’s costs and revenue is reduced.
In developing the strategic goals for rail, the Market Studies do not provide statements on what the level of fares and pricing policies should be in the long term. However, some of these factors, such as changes in rail fare, are modelled when developing the demand scenarios in Chapter 6.
The strategic goals for rail are therefore to:
• meet all of the strategic goals (from above) in a value for money and affordable way
• directly reduce the whole industry subsidy.
These strategic goals cannot be addressed at a market level without also considering the specification of rail services and infrastructure to meet them. They are therefore more appropriate for detailed consideration in the later stages of the LTPP, however given the importance of these issues to funders they have been published at this stage of the process.
Network Rail Long Distance Market Study 25October 2013 06. Long Term Demand Scenarios
The aim of the Market Studies is to develop an understanding of how rail can best contribute to meeting the key outcomes that current and potential future rail industry funders require, or are likely to require, from the provision of rail services to the long distance market.
6.1 Introduction
As discussed in Chapter 5, the aim of the Market Studies is to develop an understanding of how rail can best contribute to meeting the key outcomes that current and potential future rail industry funders require, or are likely to require, from the provision of rail services to the long distance market. These priorities or strategic goals are economic growth, a reduction in carbon and other adverse environmental impacts, improved quality of life, and improved industry affordability.
Identifying the appropriate role of rail in the context of these long term priorities requires the extension of Network Rail’s current demand projections to a 30 year time horizon. This is because, many major railway infrastructure components, such as track systems, have an asset life of around 30 years. Decisions to change the capability of the network therefore require an understanding of the likely usage of it over this time period to maximise the value and useful life of the investment. Demand forecasting over such a long term period represents a considerable challenge and a three stage approach has been undertaken to develop these long term demand projections:
• first, the extensive body of industry research on rail demand has been reviewed to identify and group the likely factors that determine the number of people who travel by rail
• second, a series of potential alternative economic futures for Great Britain have been developed which would result in differences in these factors. These futures are articulated as four scenarios
• third, these scenarios have been used to define the inputs into long term demand models for each of the passenger market sectors. These models combine existing industry research and techniques, with some primary research undertaken by Network Rail.
The rest of this chapter is structured on the basis of this methodology:
• Section 6.2 explains the factors that influence demand for travel by rail
• Section 6.3 details the long term scenarios, and how they are likely to affect the factors which influence demand
• Section 6.4 explains the demand modelling approach for the study
• Section 6.5 presents the forecasts produced using these scenarios and one modelling approach for the long distance market.
6.2 Factors which influence the demand for travel by rail
6.2.1 Background
A summary of factors which determine the demand for travel by rail is presented below. This summary is based on a review of the extensive body of existing evidence on the subject referenced in Chapter 4, and some primary research carried out by Network Rail.
The existing research considered includes ongoing work by the Passenger Demand Forecasting Council (detailed in Section 4.4) and by some of its member organisations including Network Rail, the Department for Transport (DfT), Train Operating Companies, the Passenger Transport Executives, and academic institutions, and by other organisations such as local authorities, the Independent Transport Commission and the Office for National Statistics.
The ongoing body of existing research into the factors which influence the demand for travel for rail is extensive, dating back to the 1980s. Compiling a summary of this research is therefore a challenging undertaking and there are many, equally valid, ways to categorise and structure it.
Network Rail’s compendium of this research is presented below. This has been discussed in detail with the Working Group, outlined in Chapter 1, and whilst every endeavour has been made to accommodate the consensus of opinions from this group, organisations other than Network Rail may take a different view of some of the evidence that has been summarised. Given the complexity of compiling this summary, the text in Section 6.2 is largely common to all three passenger market studies, with the specific impact on the long distance passenger market discussed in more detail in subsequent sections of this chapter.
Network Rail Long Distance Market Study 26October 2013 06. Long Term Demand Scenarios
The factors which influence the demand for travel have been grouped into five headline categories. These are listed below and then described in more detail:
• Macro economic factors
• Micro economic factors
• Demographics
• Consumer tastes
• The supply of travel opportunities.
A number of the factors presented under this categorisation are interdependent.
6.2.2 Macro economic factors.
These are the factors which influence the demand for travel by rail as a result of economic incentives and pressures that occur outside of the transport sector, and comprise the following:
• National and regional employment levels by type of employment. Total employment levels affect the aggregate number of trips by all modes of transport including rail for the purposes of commuting, and the type of employment affects the proportion of these trips for which rail is a viable option. For example office based employees are more likely to travel by rail than construction workers who may be required to transport heavy apparatus to and from their workplaces. The level and type of employment is driven by the performance and composition of the national and regional economies.
• The distribution of employment between principal regional centres (e.g. London and Manchester) and other areas. In particular this affects the number of people for whom commuting or travelling on employers’ business by rail is more attractive than by other modes. This is because travel by rail into central urban areas at peak times is often faster than via the highway network, as travel by rail is not subject to urban traffic congestion or limitations on the availability of city centre car parking. The distribution of employment between urban and other areas is driven by a number of factors, including the structure of the economy discussed above, the cost and supply of
an appropriately skilled labour force, and public and private investment decisions.
• National and regional income levels. Personal (disposable) income levels affect the number of people who are willing to travel over longer distances by all modes of transport, as longer distance travel is more expensive. This particularly affects the number of people who travel by rail as travel by rail tends to be faster than by other modes over distances between around 50 and 300 miles. Income levels are driven by factors such as the performance of the domestic economy, and wage inflation versus increases in the cost of living.
• The distribution of income across the population of Great Britain. Similarly to the above, the level of domestic income equality affects the number of longer distance rail trips, as only the higher income groups in society tend to have the financial means to travel regularly over longer distances. The level of income inequality can be influenced by a combination of taxation policy, and the ability of supply side innovations to reduce the cost of consumables in Great Britain.
• The distribution of residences across Great Britain and between urban and other areas. The distribution of homes and in particular the relationships between where people live, work, and spend leisure time affects the demand for travel for all purposes and by all modes including rail. For example large numbers of homes on the outskirts of urban areas leads to significant inward commuting and leisure trips, and a dominant regional centre of population leads to large levels of business and leisure travel between the centre and elsewhere.
The distribution of homes is driven by a number of factors including the attractiveness of urban areas as places to live, the distribution of employment opportunities, the availability and prices of residential property (especially in London and the South East), the stability of employment markets and national employment practices, immigration and migration trends, and demographics (see Section 6.2.4).
• The coverage of individuals’ social networks. The geographical coverage of people’s social network affects the number of people who travel to visit friends and relatives by rail.

Network Rail Long Distance Market Study 27October 2013 06. Long Term Demand Scenarios
This is because, as discussed above, travel by rail over longer distances is often faster than by other modes.
A number of factors influence the coverage of the typical social network, including migration patterns (e.g. driven by university admissions), immigration trends, and the extent to which mobile technology, social networking, and internet opportunities help people to maintain long distance relationships.
6.2.3 Micro economic factors
These are the factors which influence the demand for travel through economic incentives and pressures that occur within the transport sector, principally via the cost of travel by the various modes of transport:
• Cost of travel by car and car ownership. Car has a dominant mode share in most markets for travel and in most parts of Great Britain, and a change in the cost of car travel can therefore have a significant proportional impact on the demand for travel by rail. There can often be a time delay before this impact occurs as the decision to travel by car or not can be associated with choices around car ownership.
Several factors influence the cost of travel by car including the price of crude oil, vehicle efficiency, the availability, cost and suitability of cleaner or non-fossil fuels, the cost of car parking, Government taxation policy, the price of new and used cars, the cost of insurance, and the cost and availability of company cars. These factors in turn influence the level of car ownership and usage.
• Cost of domestic travel by air. The cost of travel by air can have a significant effect on the demand for travel by rail on a number of long distance routes where air and rail compete. Similar to travel by car, the factors which drive the cost of domestic air travel are the price of crude oil, vehicle efficiency, and Government taxation policy.
• Cost of travel by rail. The impact of the cost of travel by rail depends on the characteristics on the market which rail serves. Where rail has a dominant market position, e.g. for commuter travel into central London, the impact of a change in cost on rail demand is typically small, whereas in markets where car travel is very competitive, e.g. for off-peak travel between medium sized
towns, a change in cost can significantly affect the number of rail passengers. The price of travel by rail is influenced by a number of factors including the rail industry cost base, rail fares policy and commercial decisions.
• Competition between modes. The cost, and ultimately the commercial viability of service a route by a given mode will depend on the strength of the competition from other modes.

Network Rail Long Distance Market Study 28October 2013 06. Long Term Demand Scenarios
Factors which influence this are journey purpose (passengers are more likely to work during transit if they are commuting or on employers’ business), on-board facilities, and the availability of enabling mobile technology.
• The match between consumer tastes, consumer perceptions and rail travel products. The ability of the rail industry to tailor its products to meet the requirements, tastes and expectations of customers will influence the number of people who travel by rail. Passengers perceptions of the overall rail journey experience compared to the experience of using competitor modes of transport will also affect mode choice.
These factors include the provision of information around rail fares and journey opportunities, ticket booking facilities, ticketing technology, real time journey and product information, and journey comfort. Individuals’ expectations around these factors are partly driven by how well products in other transport and non-transport sectors are tailored to their requirements, and their willingness to accept these elements will vary accordingly.
• Alternatives to travelling. Continuous improvements in information technology have long been cited as influencing the demand for travel by any mode, for example the advent of facilities such as internet shopping and video conferencing. There is a general absence of consensus on the likely impact of better information technology, with some citing it as a threat to individuals’ desire to travel, and others arguing that it strengthens links between people, hence increasing their desire to meet each other. Rail industry research is weak in this area compared to most of the other factors discussed above, and several organisations are working to address this.
6.2.4 Demographics
These are the elements of the composition of Great Britain’s population which affect the demand for travel by rail. Namely:
• The population of Great Britain and its regions. Population affects the demand for travel by all modes including rail. The factors which drive the size of the population are life expectancy, birth rates, immigration, emigration, and domestic migration, and regional/local differences in the cost of living.
• Age of the population. The age of the population affects the number of people who travel by rail regularly such as commuters both directly and indirectly through its impact on the state retirement age and the ability to travel by car. The factors which determine the age of the population are largely the same as for the size of the population.
• Household composition. The structure of a household affects the number of people who travel by rail, particularly for the purposes of commuting and employers’ business. For example, households with multiple occupants in employment generate more travel per person for these purposes than households where one or fewer people are employed. This is partly a result of the proportion of the household which is in employment, and partly as it is more difficult for households with multiple workers to locate in an area close to the employer of all the workers within it. This leads to longer distance commuting which plays to rail’s competitive strengths. A number of inter-dependant factors influence household composition including the cost of living versus incomes, the age of parents when their first child is born and social preferences.
6.2.5 Consumer tastes
These are the factors that influence the demand for travel by rail as a result of the attitudes, preferences, and choices of consumers. Namely:
• Use of travel time. The facilities for people to use time spent travelling in the way they choose can influence the demand for travel by rail, particularly as it is not currently possible to use time spent on driving a car for other purposes.

Network Rail Long Distance Market Study 29October 2013 06. Long Term Demand Scenarios
6.2.6 Supply of travel opportunities
These factors relate to the supply and quality of opportunities to travel by rail and the modes that compete with rail. The impact of these factors on the demand for travel by rail is similar to the micro economic factors described above. The supply and quality of travel opportunities have been categorised as follows:
• Capacity of the rail network. This is influenced by demand for travel at peak times and investment in additional capacity to keep pace with this demand
• Rail (generalised1) journey times and punctuality. This is influenced by investment in schemes to reduce journey times or increase the frequency of direct services between locations, commercial decisions and by the ability of the network to operate punctually
• Capacity of the highway network. This is driven by demand for travel at peak times and investment in additional capacity to keep pace with this demand
• Highway (generalised2) journey times. This is driven by the ability of the road network to maintain/improve journey times given expected future traffic levels, and investment to maintain journey times on the existing network and expand the network to new locations
• The presence of long distance coach/bus competition. Long distance coach/bus travel is typically significantly less expensive and more time consuming than rail travel, and the two modes usually compete for a very small shared market. The presence of long distance coach/bus operators tends to be driven by location of sizeable price-sensitive clusters of population or where rail does not provide a competitive journey time with bus or coach
• Capacity of Britain’s airports. This will be determined by Government policy on future aviation capacity. The Airport Commission, chaired by Sir Howard Davies examines the need for additional UK airport capacity and is due to publish a final report in 2015. Commercial decisions also affect service
1 A measure of the rail service offer that takes account of in vehicle time, service frequency and interchange penalty.2 A measure of the road journeys that takes account of in vehicle time and level of road congestion.
provisions at the airports.
• Domestic air (generalised) journey times. This is driven by aircraft access and egress times, resulting from the level of security risk and the availability of technology to reduce the time taken to mitigate this risk, and by the services that airline operators choose to run and the types of passenger markets that airports choose to specialise in.
6.3 Long term scenarios
Forecasting market demand over a very long period of time such as 30 years is a difficult undertaking despite a strong body of market research of the type summarised above. This is because over long time period structural changes can occur in society which radically alter the factors which have historically influenced demand in a market. Relying exclusively on a continuation of historical relationships is therefore likely to fail given a sufficient time period. For example most forecasts of national rail passengers produced in the late 1980s and based only on an extrapolation of decades of declining and stagnating patronage, would have failed to recognise any likelihood of the approximate doubling of passenger journeys that occurred over the following 20 years.
Network Rail has therefore used an approach called “scenario planning” which is designed to consider the range of societal outcomes that can occur over a long time period, then to estimate how these outcomes would be likely to change the factors which influence demand. This approach is common in other industries with very long term planning horizons and large sunk costs, and Network Rail first undertook scenario based demand forecasting in the June 2009 Network RUS Scenarios & Long Distance Forecasts.
The development of long term demand scenarios for the Market Studies has built on this approach developed in the Network RUS by updating and expanding the factors considered to all of those discussed in the previous section, by considering the Regional Urban and London and South East passenger markets, and by increasing the time horizon to 30 years. The demand scenarios are generic to all passenger market studies and share similar demand factors. The resultant narrative was discussed at meetings of the Working Group and Regional Groups, and refined to reflect the consensus of opinions from these groups.
Network Rail Long Distance Market Study 30October 2013 06. Long Term Demand Scenarios
namely social inequality and carbon emissions, and the extent to which technology enables interventions. British society can either decide to intervene actively to reduce social inequality and carbon emissions, or to take a passive approach. Technological advancements will either provide effective low cost solutions to the negative impacts associated with modern life and globalisation, for example through provision of low cost consumables and alternatives to fossil fuels, or it will provide piecemeal high cost support to some of these problems. This implies four long term outcomes for Great Britain’s social and environmental planning:
– Active, technologically enabled. Great Britain society and Governments actively seek to reduce social inequality and carbon emissions, with technology limiting the requirement for this to be achieved through taxation
– Passive, technologically enabled. Great Britain society and Governments are passive in their approach to social inequality and carbon emissions, although technological advancements allow some problems to be addressed
– Active, technologically limited. Great Britain society and Governments actively seek to reduce social inequality and carbon emissions, although limited assistance from technology requires taxation to achieve this
– Passive, technologically limited. Great Britain society and Governments are passive in their approach to social inequality and carbon emissions, and technology offers little solution to these problems.
This narrative postulates four future scenarios which would be likely to result in large differences in the factors which influence demand described in Section 6.2. These scenarios are intended to produce a range of the likely future demand for rail in 30 years and are not intended to be exhaustive. The scenarios are explained in detail below and summarised in Figure 6.1.
Two headline characteristics have been identified which determine these scenarios, namely:
• The economy. The performance of the Great Britain economy measured against the strength of other national economies and the extent to which the Great Britain economy is integrated with other national economies.
The economy can either remain strong on the global stage maintaining its position within the G20 group of leading economies, or lose ground, perhaps only remaining in the top 50 world economies.
The economy can either be integrated with other national economies, trading regularly across all types of goods and services, or be isolated, producing all or most of its goods and services domestically.
This implies four long term outcomes for the Great Britain’s economy:
– Strong, global. A strong economy on the global stage which prospers from its integration with the rest of the world
– Strong, insular. A strong economy on the global stage which prospers from its self sufficient nature
– Mid-ranking, global. A mid ranking economy on the global stage which suffers from its integration and trading position with other national economies
– Mid-ranking, insular. A mid ranking economy on the global stage which suffers from an absence of trade with other countries.
• Our social and environmental planning. The extent to which Great Britain is willing to intervene to address the negative impacts associated with modern society and globalisation,

Network Rail Long Distance Market Study 31October 2013 06. Long Term Demand Scenarios
These long term outcomes for Britain’s social and environmental planning have been combined with those for the economy in order to articulate four future scenarios which examine the range in the likely factors which influence the demand for travel by rail. It is envisaged that the four scenarios presented represent the four most likely combinations of the economic and social/environmental outcomes, but other future combinations may also be possible.
These scenarios are described below, and their likely impact on the factors which influence rail demand articulated in Section 6.2 is detailed in Figures 6.1 and 6.2. As discussed above the scenarios are not intended to be exhaustive and it is possible that over the next 30 years circumstances could change to reflect more than one scenario, or reflect a combination of scenarios.
Struggling in isolation
Prospering in global stabilityProspering in isolation
Struggling in global turmoil
Prospering
Struggling
Insular Global
Technologically limited
Passive Active
Technologically enabled
Figure 6.1. Long term scenariosKey
GB Economy
GB social and environmental conscience
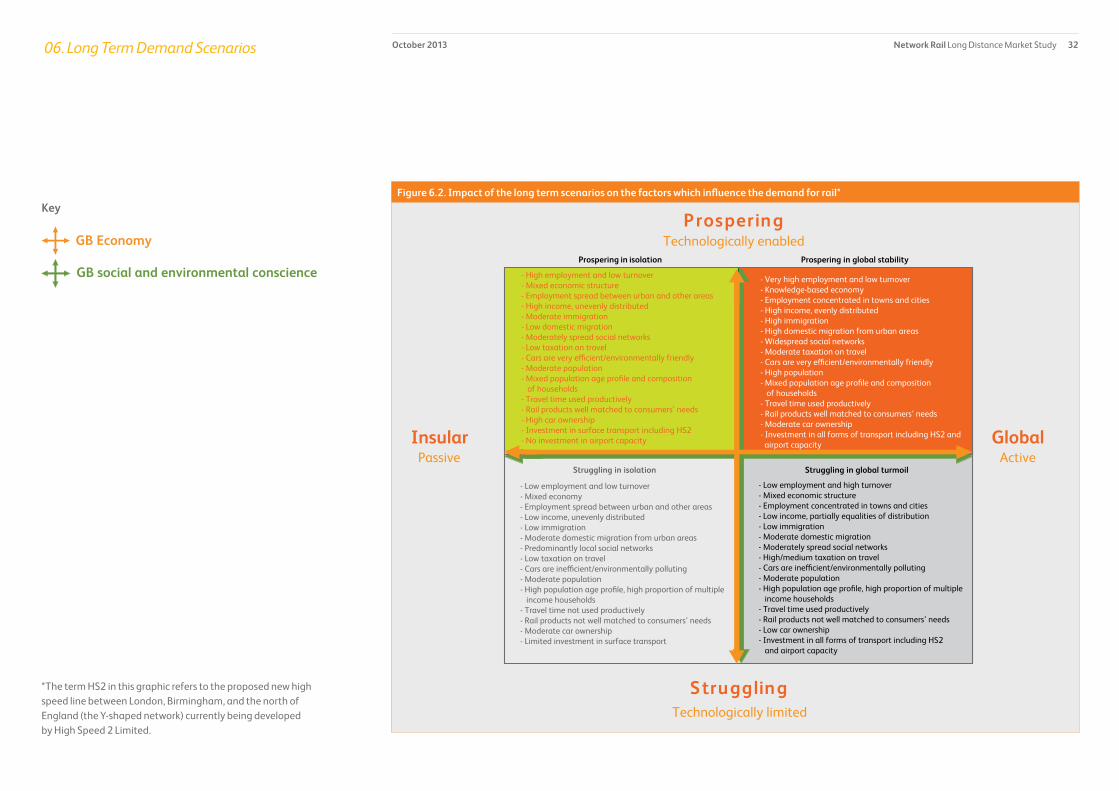
Network Rail Long Distance Market Study 32October 2013 06. Long Term Demand Scenarios
Struggling in isolation
- High employment and low turnover- Mixed economic structure- Employment spread between urban and other areas- High income, unevenly distributed- Moderate immigration- Low domestic migration - Moderately spread social networks- Low taxation on travel- Cars are very e�cient/environmentally friendly- Moderate population- Mixed population age profile and composition of households - Travel time used productively- Rail products well matched to consumers’ needs- High car ownership- Investment in surface transport including HS2- No investment in airport capacity
Struggling in global turmoil
P rospering
Struggling
Insular GlobalPassive Active
Prospering in isolation Prospering in global stability
- Very high employment and low turnover- Knowledge-based economy- Employment concentrated in towns and cities- High income, evenly distributed- High immigration- High domestic migration from urban areas- Widespread social networks- Moderate taxation on travel- Cars are very e�cient/environmentally friendly- High population- Mixed population age profile and composition of households - Travel time used productively- Rail products well matched to consumers’ needs- Moderate car ownership- Investment in all forms of transport including HS2 and airport capacity
- Low employment and low turnover- Mixed economy- Employment spread between urban and other areas- Low income, unevenly distributed- Low immigration- Moderate domestic migration from urban areas- Predominantly local social networks- Low taxation on travel- Cars are ine�cient/environmentally polluting- Moderate population- High population age profile, high proportion of multiple income households - Travel time not used productively- Rail products not well matched to consumers’ needs- Moderate car ownership- Limited investment in surface transport
- Low employment and high turnover- Mixed economic structure- Employment concentrated in towns and cities- Low income, partially equalities of distribution- Low immigration- Moderate domestic migration - Moderately spread social networks- High/medium taxation on travel- Cars are ine�cient/environmentally polluting- Moderate population- High population age profile, high proportion of multiple income households - Travel time used productively- Rail products not well matched to consumers’ needs- Low car ownership- Investment in all forms of transport including HS2 and airport capacity
Technologically limited
Technologically enabled
Figure 6.2. Impact of the long term scenarios on the factors which influence the demand for rail*
GB Economy
GB social and environmental conscience
Key
*The term HS2 in this graphic refers to the proposed new high speed line between London, Birmingham, and the north of England (the Y-shaped network) currently being developed by High Speed 2 Limited.
Network Rail Long Distance Market Study 33October 2013 06. Long Term Demand Scenarios
Prospering in global stability (PGS). The British economy is strong, prospering through its integration with other national economies by exporting high value products and importing low value products. Britain takes an active role in solving social and environmental problems, partly to maintain a stable service industry for its high value activities and a stable supply chain for the imports it requires, and partly because its technological advancement and high national wealth allows this to be done without worsening individuals’ standard of living.
Prospering in isolation (PII). The British economy is strong, prospering by concentrating on domestic production in isolation from global market pressures. Britain takes little interest in solving social and environmental problems. This is partly because it has neither a dependency on stable foreign import markets, nor a stake in global technological innovation, and partly because the mixture in value of domestic economic activities undertaken to maintain self sufficiency prevents redistribution of domestic resources without worsening individuals’ standard of living.
Struggling in global turmoil (SGT). The British economy is performing poorly, struggling to compete in high value export markets as the global supply chain and credit markets are volatile and other countries improve their employee skill levels and resource base. Britain takes an active role in addressing social and environmental problems, partly in an attempt to stabilise global import and credit markets, and partly because global technological innovation allows it to do so without worsening individuals’ standard of living.
Struggling in isolation (SII). The British economy is performing poorly in the absence of both an export market for its high value products and a source of inexpensive imported materials and technological innovation to support domestic production. Britain takes little interest in solving social and environmental problems as it has neither the wealth nor the technology to achieve this without worsening individuals’ standard of living.
6.4 Demand modelling approach
6.4.1 Introduction
The passenger demand forecasts for the long distance market were produced by estimating the level that the factors which influence demand (see Section 6.2) would be likely to reach in each of the four demand scenarios described above. This was the approach used to develop the Network RUS.
An updated version of the Network RUS demand model was used to estimate the impact of these factors on demand. The model categorises these factors according to whether they primarily impact upon:
• market size, i.e. the propensity to undertake long distance trips. Examples include population growth and distribution
• modal choice, for example car availability, and whether people wish to use travel time productively
• both of the above, for example the cost of travel.
6.4.2 How the demand model works
A cross-sectional approach was adopted to forecast demand. This approach, which links the characteristics of the population with its propensity to travel, is ideal for forecasting under different scenarios.
The modelling was done in two parts:
• first, the total market for long distance travel in Great Britain was estimated
• second, the rail share of this market was estimated
This modelling was based on the geographical structure used in the forecasting tool Planet Strategic Model (PSM). This structure divides Great Britain into 235 zones. Densely populated areas such as London are comprised of multiple zones.
Network Rail Long Distance Market Study 34October 2013 06. Long Term Demand Scenarios
Based on this structure the population of Great Britain was segmented by household structure and income band as these elements are the key determinants of the long distance trip rates. The household structure segmentation using census data is as follows:
• 1 adult aged 16 – 64
• 1 adult aged 65+
• 2 adults, Household Representative Person (HRP) aged 16 – 64
• 2 adults, HRP aged 65+
• Single adult, 1 or more children
• 2 adults, 1 child
• 2 adults, 2 or more children
• Other households.
The market was further segmented into five income bands using four years work of data published in Family Spending 2010, produced by the Office for National Statistics (ONS).
The use of such detailed segments in the modelling process enables the model to reflect the impact of income distribution, social trends, and population changes (as defined by the scenarios) on long distance trip rates. The demand forecasts use the 2010 National Travel Survey to define relationships between real income growth, economic development and the propensity to undertake long distance trips. These relationships are defined for each household type and income band and for business and leisure trips in Figure 6.3.

Network Rail Long Distance Market Study 35October 2013 06. Long Term Demand Scenarios
Figure 6.3 - Long distance trips: per person, per annum
Journey Purpose Income Band Other House-holds Single Adult 16-64 Single Adult 65+ Single parent family
Business Bottom 0.8 0.9 0* 0*
Business 2nd 2.5 1.4 0* 0*
Business 3rd 3.6 5.8 0.6 8
Business 4th 5.1 3.6 0* 4.4
Business Top 13.2 18.1 7 0*
Leisure Bottom 7.3 10.3 4.4 5.2
Leisure 2nd 5.8 5.4 8.1 5.7
Leisure 3rd 9.4 12.7 8.3 14.1
Leisure 4th 13.1 14.1 17.3 25.6
Leisure Top 19.4 21.7 12.7 9.9
Journey Purpose Income Band 2 Adults 1 Child 2 Adults 2+ Children 2 Adults, 16-64 2 Adults, 65+
Business Bottom 1.5 0.9 0.8 0*
Business 2nd 0.3 3 1.4 0.1
Business 3rd 1.2 2.8 4.3 0.6
Business 4th 3.6 6.1 7.6 1.4
Business Top 10.6 11.2 19.2 2.4
Leisure Bottom 10.3 2.5 8.1 7.3
Leisure 2nd 6.2 11.6 15.6 8.6
Leisure 3rd 10.2 6.1 13.2 11.3
Leisure 4th 8.1 10.1 18 12.6
Leisure Top 11.3 9.6 25.4 14.5
Source: National Travel Survey 2010 * May be slightly higher than zero, if a larger data sample were collected
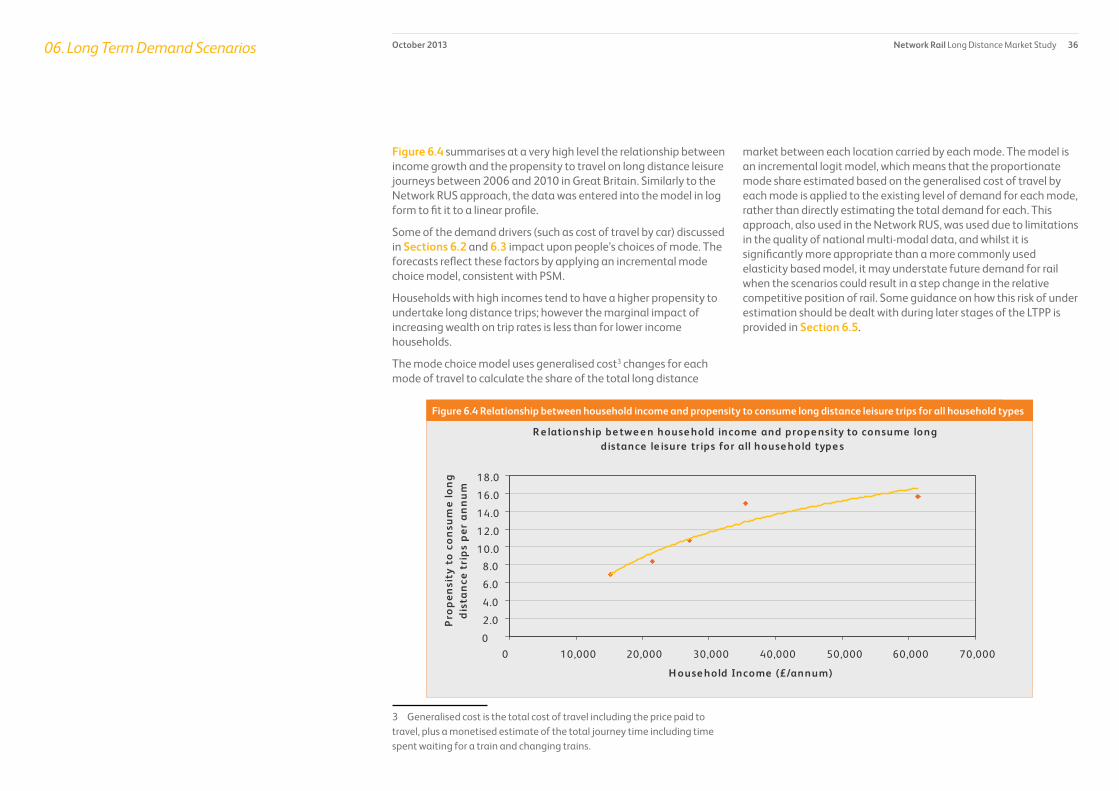
Network Rail Long Distance Market Study 36October 2013 06. Long Term Demand Scenarios
Figure 6.4 summarises at a very high level the relationship between income growth and the propensity to travel on long distance leisure journeys between 2006 and 2010 in Great Britain. Similarly to the Network RUS approach, the data was entered into the model in log form to fit it to a linear profile.
Some of the demand drivers (such as cost of travel by car) discussed in Sections 6.2 and 6.3 impact upon people’s choices of mode. The forecasts reflect these factors by applying an incremental mode choice model, consistent with PSM.
Households with high incomes tend to have a higher propensity to undertake long distance trips; however the marginal impact of increasing wealth on trip rates is less than for lower income households.
The mode choice model uses generalised cost3 changes for each mode of travel to calculate the share of the total long distance
3 Generalised cost is the total cost of travel including the price paid to travel, plus a monetised estimate of the total journey time including time spent waiting for a train and changing trains.
market between each location carried by each mode. The model is an incremental logit model, which means that the proportionate mode share estimated based on the generalised cost of travel by each mode is applied to the existing level of demand for each mode, rather than directly estimating the total demand for each. This approach, also used in the Network RUS, was used due to limitations in the quality of national multi-modal data, and whilst it is significantly more appropriate than a more commonly used elasticity based model, it may understate future demand for rail when the scenarios could result in a step change in the relative competitive position of rail. Some guidance on how this risk of under estimation should be dealt with during later stages of the LTPP is provided in Section 6.5.
R e lationship be twe e n house hold income and prope nsity to consume long distance le isure trips for all house hold type s
0
2.0
4.0
6.0
8.0
10.0
12.0
14.0
16.0
18.0
0 10,000 20,000 30,000 40,000 50,000 60,000 70,000
H ouse hold Income (£/annum)
Pro
pen
sity
to
co
nsu
me
lon
g
dis
tan
ce t
rip
s p
er a
nn
um
Figure 6.4 R e lationship be twe e n house hold income and prope nsity to consume long distance leisure trips for all household types Figure 6.4 Relationship between household income and propensity to consume long distance leisure trips for all household types
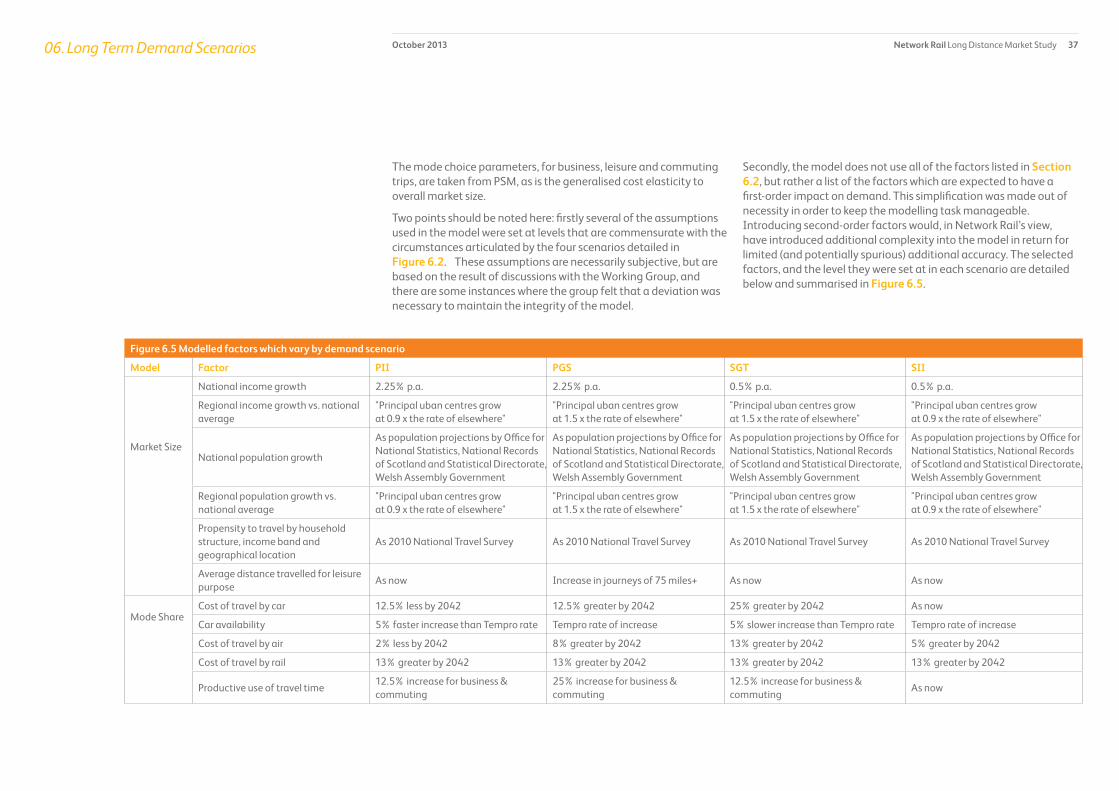
Network Rail Long Distance Market Study 37October 2013 06. Long Term Demand Scenarios
The mode choice parameters, for business, leisure and commuting trips, are taken from PSM, as is the generalised cost elasticity to overall market size.
Two points should be noted here: firstly several of the assumptions used in the model were set at levels that are commensurate with the circumstances articulated by the four scenarios detailed in Figure 6.2. These assumptions are necessarily subjective, but are based on the result of discussions with the Working Group, and there are some instances where the group felt that a deviation was necessary to maintain the integrity of the model.
Secondly, the model does not use all of the factors listed in Section 6.2, but rather a list of the factors which are expected to have a first-order impact on demand. This simplification was made out of necessity in order to keep the modelling task manageable. Introducing second-order factors would, in Network Rail’s view, have introduced additional complexity into the model in return for limited (and potentially spurious) additional accuracy. The selected factors, and the level they were set at in each scenario are detailed below and summarised in Figure 6.5.
Figure 6.5 Modelled factors which vary by demand scenario
Model Factor PII PGS SGT SII
Market Size
National income growth 2.25% p.a. 2.25% p.a. 0.5% p.a. 0.5% p.a.
Regional income growth vs. national average
"Principal uban centres grow at 0.9 x the rate of elsewhere"
"Principal uban centres grow at 1.5 x the rate of elsewhere"
"Principal uban centres grow at 1.5 x the rate of elsewhere"
"Principal uban centres grow at 0.9 x the rate of elsewhere"
National population growth
As population projections by Office for National Statistics, National Records of Scotland and Statistical Directorate, Welsh Assembly Government
As population projections by Office for National Statistics, National Records of Scotland and Statistical Directorate, Welsh Assembly Government
As population projections by Office for National Statistics, National Records of Scotland and Statistical Directorate, Welsh Assembly Government
As population projections by Office for National Statistics, National Records of Scotland and Statistical Directorate, Welsh Assembly Government
Regional population growth vs. national average
"Principal uban centres grow at 0.9 x the rate of elsewhere"
"Principal uban centres grow at 1.5 x the rate of elsewhere"
"Principal uban centres grow at 1.5 x the rate of elsewhere"
"Principal uban centres grow at 0.9 x the rate of elsewhere"
Propensity to travel by household structure, income band and geographical location
As 2010 National Travel Survey As 2010 National Travel Survey As 2010 National Travel Survey As 2010 National Travel Survey
Average distance travelled for leisure purpose
As now Increase in journeys of 75 miles+ As now As now
Mode ShareCost of travel by car 12.5% less by 2042 12.5% greater by 2042 25% greater by 2042 As now
Car availability 5% faster increase than Tempro rate Tempro rate of increase 5% slower increase than Tempro rate Tempro rate of increase
Cost of travel by air 2% less by 2042 8% greater by 2042 13% greater by 2042 5% greater by 2042
Cost of travel by rail 13% greater by 2042 13% greater by 2042 13% greater by 2042 13% greater by 2042
Productive use of travel time12.5% increase for business & commuting
25% increase for business & commuting
12.5% increase for business & commuting
As now

Network Rail Long Distance Market Study 38October 2013 06. Long Term Demand Scenarios
varying in each scenario.
• cost of travel by car is determined by a number of factors including the cost of crude oil, the cost of car parking, the cost of car ownership, vehicle efficiency and taxation on fuel. In the ‘global’ scenarios it is assumed that Government(s) attempt to offset the externalities associated with car usage, such as pollution and traffic congestion, via an increase in fuel costs. In the prospering in global stability scenario it is assumed that this is partially offset by an increase in vehicle efficiency. In the prospering in isolation scenario it is assumed that taxation remains unchanged and that this increase in vehicle efficiency reduces the cost of car usage
• the scenarios also vary the level of car ownership around Government’s projections in the TEMPRO4 database.
• cost of travel by air is determined by similar factors as the cost of travel by car, with the two main non-controllable costs being crude oil prices and Government(s) taxation policy In addition, the relativity between the cost of travel by air and by rail between two locations is often linked by operators who seek to actively compete on price.
It is anticipated that the cost of travel by air will increase more slowly than by rail (using regulated tickets) as historical and likely future low profit margins in the domestic air market will limit the maximum sustainable increase in taxation on air travel. However, it is likely that long distance rail operators would seek to offset this divergence through competitive ticket pricing.
In the “global” scenarios it is assumed that rail operators are able to offset most or all of the difference between rail and air cost inflation. In the “isolation” scenarios it is assumed that the cost of air travel either falls or increases at a significantly lower rate than the cost of travel by rail.
Under the ‘global’ scenarios it is assumed that more business passengers and commuters are able to use travel time on a train productively than is the case currently. It is assumed that this rate of increase is higher in the high-tech prospering in global stability scenario where mobile technology and train interior facilities are likely to be the most advanced.
• the assumed rate of growth in national income is based on the maximum and minimum likely long term growth rates of 2.25 per cent and 0.5 per cent respectively, published in the Network RUS Scenarios and Long Distance Forecasts. The ‘prospering’ scenarios have been assigned the higher rate and the ‘struggling’ scenarios the lower rate
• under the ‘global’ scenarios, regional income growth in large cities is assumed to be higher than the national average; and under ‘isolation’ scenarios, large cities are assumed to have lower income growth than the national average. This is because cities are the natural point of interaction between a service/knowledge based domestic economy and other national economies
• sub-national population projections by the Office for National Statistics (ONS), National Records of Scotland, and Statistical Directorate, Welsh Assembly Government are used to estimate future population in each local authority. It is assumed that population will migrate to areas with more employment opportunities and higher income, therefore under ‘global’ scenarios large cities are assumed to have a regional population growth higher than the population projections and vice versa
• National Travel Survey (NTS) data suggests that over broadly the last 10-15 years the distance travelled per journey for leisure purposes, and in particular to visit friends and relatives, has increased. One explanation for this is an expansion in the geographical spread of social networks caused by a combination of an increase in the number of people living away from home to attend university, and the advent of social media. In the high-tech, wealthy, and socially aware prospering in global stability scenario it is assumed that this increase in distance for leisure purposes continues. In the other scenarios the current distance travelled per journey is assumed to continue
• cost of travel by rail is determined by franchising authorities’ fares policy for regulated tickets, and operators’ commercial pressures and pricing policies for non-regulated fares. Although fares policy for DfT-let franchises is currently under review(at the time of writing), it is expected that the cost of travel by rail will increase over the longer term. As a simplifying assumption the same level of fares increase (13 per cent) has been used for all four scenarios, with the cost of travel by alternative modes
Network Rail Long Distance Market Study 39October 2013 06. Long Term Demand Scenarios
6.5 Long term demand scenarios
6.5.1 Overview
Figure 6.6 below shows the growth forecast under the four scenarios for the principal regional centres. The figures correspond to the level of growth expected by 2043 as a result of the factors considered in the methodology described above, plus the impact of the schemes for which funding has been committed in Control Period 4 (CP4) and Control Period 5 (CP5) (such as the Northern Hub and Electrification of the Great Western Main Line).
The impact of major pieces of investment in rail which are yet to have funding committed are not included in these exogenous projections. An example of this is HS2 as it is the one major piece of investment in long distance rail which requires primary legislation to allow implementation. However, to give an idea of the potential demand impact of further investment a version of the forecasts have been developed which includes an estimate of the demand that could be generated if all of the conditional outputs summarised in Chapter 7 are delivered.
This version assumes that HS2 is funders’ preferred means of delivering some of these outputs.
Where travel between two locations also includes a significant proportion of commuting, the forecasts are a hybrid of the methodology detailed above and the projections from the Regional Urban and London and South East Market studies. Where the current number of journeys between a pair of locations is very low it has not been possible to produce credible demand projections.
The combined set of forecasts from the four market studies will inform the later stages of the LTPP, in particular the Route Studies. It is intended that they should be used as the default set of demand forecasts in each of the Route Studies, and that these studies will combine the forecasts which pertain to the specification of services they develop, and consider whether any of the acknowledged model weaknesses require additional bespoke demand modelling.
6.5.2 The maximum level of growth expected over 30 years
Over the 30 year period considered, in almost all cases the PGS scenario results in the highest level of forecast demand, followed by the PII scenario, the SII scenario and the SGT scenario.
The PGS scenario represents the situation where the majority of factors are heavily in favour of rail, and hence show the maximum likely outcome, in the absence of significant further investment beyond CP5. A number of the differences between the forecasts for travel between the principal urban centres can be explained by how the characteristics of the demand drivers in the PGS scenario would be likely to influence rail’s mode share. – The potential for growth in rail’s share of the total market for travel between two places is limited if a larger step change than is likely in this scenario is required to make rail competitive with other modes.
The forecast maximum compound annual level of growth between London and both Edinburgh and Glasgow is 3.5 and 3.2 per cent respectively. This is because the total demand for travel between these cities is likely to be particularly high under the PGS scenario, and because, under this scenario, rail would have the potential to capture some of the sizable market share currently held by the domestic airlines.
High levels of growth are also projected between other cities where domestic airlines have a sizable presence currently. These include Birmingham – Edinburgh and Birmingham – Glasgow (both 3.1 percent per annum), Manchester – Edinburgh (3.3 percent per annum), and Manchester - Glasgow (3.0 percent per annum).
Some of the next highest rates of growth in this PGS scenario (over three per cent compound per annum) are forecast for demand between London and the principal regional centres in the north of England. These projections are towards the high end of the rates of growth in long distance rail journeys experienced over the last 10-15 years when the impact of major investment programmes such as the introduction in 2008 of the West Coast Main Line Very High Frequency Timetable is excluded.
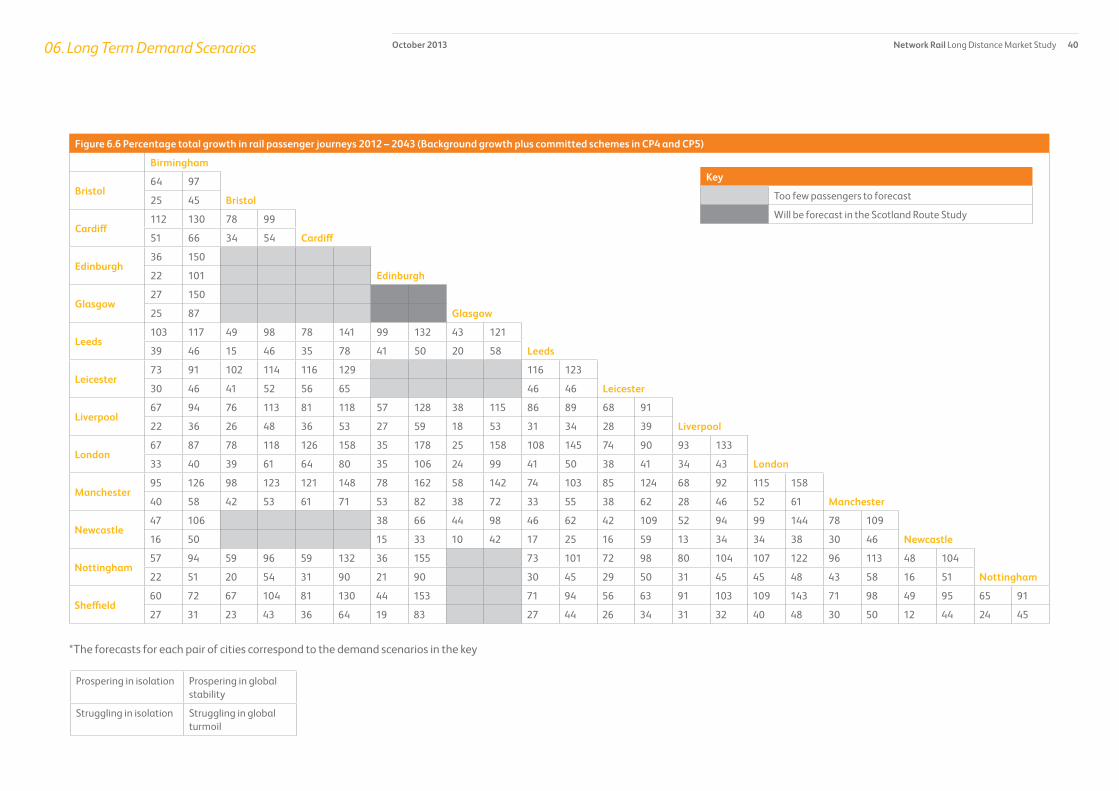
Network Rail Long Distance Market Study 40October 2013 06. Long Term Demand Scenarios
Figure 6.6 Percentage total growth in rail passenger journeys 2012 – 2043 (Background growth plus committed schemes in CP4 and CP5)
Birmingham
Bristol64 97
25 45 Bristol
Cardiff112 130 78 99
51 66 34 54 Cardiff
Edinburgh36 150
22 101 Edinburgh
Glasgow27 150
25 87 Glasgow
Leeds103 117 49 98 78 141 99 132 43 121
39 46 15 46 35 78 41 50 20 58 Leeds
Leicester73 91 102 114 116 129 116 123
30 46 41 52 56 65 46 46 Leicester
Liverpool67 94 76 113 81 118 57 128 38 115 86 89 68 91
22 36 26 48 36 53 27 59 18 53 31 34 28 39 Liverpool
London67 87 78 118 126 158 35 178 25 158 108 145 74 90 93 133
33 40 39 61 64 80 35 106 24 99 41 50 38 41 34 43 London
Manchester95 126 98 123 121 148 78 162 58 142 74 103 85 124 68 92 115 158
40 58 42 53 61 71 53 82 38 72 33 55 38 62 28 46 52 61 Manchester
Newcastle47 106 38 66 44 98 46 62 42 109 52 94 99 144 78 109
16 50 15 33 10 42 17 25 16 59 13 34 34 38 30 46 Newcastle
Nottingham57 94 59 96 59 132 36 155 73 101 72 98 80 104 107 122 96 113 48 104
22 51 20 54 31 90 21 90 30 45 29 50 31 45 45 48 43 58 16 51 Nottingham
Sheffield60 72 67 104 81 130 44 153 71 94 56 63 91 103 109 143 71 98 49 95 65 91
27 31 23 43 36 64 19 83 27 44 26 34 31 32 40 48 30 50 12 44 24 45
*The forecasts for each pair of cities correspond to the demand scenarios in the key
Prospering in isolation Prospering in global stability
Struggling in isolation Struggling in global turmoil
Key
Too few passengers to forecast
Will be forecast in the Scotland Route Study

Network Rail Long Distance Market Study 41October 2013 06. Long Term Demand Scenarios
The removal of this stimulated growth from historical data suggests that in the PGS scenario there is a greater potential for growth than seen previously. This implies that the maximum extent of the conditions that are most favourable for rail have not been experienced over the last 10-15 years, during which passenger growth has been at a 50-year high.
High rates of growth are also forecast for demand between a number of the principal regional centres in the north of England and between some of these cities and Birmingham. This is only partly explained by the impact of committed investment in rail service improvements, and is driven largely by the potential long term strength of the economies of these cities and their proximity to each other falling in a range where rail naturally competes with car.
High rates of growth are also forecast for travel to/from Cardiff. This is partly explained by the Welsh Government projected population growth, which is higher than for most of cities in Great Britain.
The General Register Office for Scotland population growth projection for Edinburgh is significantly higher than for Glasgow. This has led to a discrepency between the projected rates of travel to/from these cities which some stakeholders have questioned. Any future material revisions to these population projections will be considered in the Route Studies.
The maximum level of growth between some of the cities on the north of the East Coast Main Line, such as Newcastle-Leeds and Newcastle-Edinburgh is lower than for elsewhere. This is because long distance services on the East Coast Main Line have a significant journey time advantage versus car travel on the parallel A1 and trunk road network and rail already has a sizable share of the total market for travel, and the potential for further market share is therefore limited compared to some other places.
Relatively nearby pairs of cities with a significant proportion of travel for the purpose of commuting tend to have lower growth projections than elsewhere, as Network Rail expects the long term outlook for the commuting market to be slightly less buoyant than for business and leisure travel.
The demand projections for travel between some of the principal urban centres have not been published when the current level of
demand is very low, for example Nottingham – Glasgow. As discussed in Section 6.4 the chosen modelling approach can underestimate future demand against a low base of this nature. In the majority of instances this is unlikely to cause a problem for subsequent parts of the LTPP as the low current demand can be explained by a prohibitively long journey time by all modes which would not be sufficient improved in the PGS scenario to stimulate a significant increase in the rail market.
For the pairs of places where forecast rail demand growth is lower than expected and a sizeable and dominant car travel market already exists, an alternative forecasting approach should be investigated. Such approaches could include direct demand modelling to compare the market in question with the market for travel between analogous pairs of places, or use of elasticity based models using bespoke parameters.
6.5.3 Alternatives to the maximum demand projection and the shorter-term outlook
The PII and SGT scenarios represent situations where some of the factors which influence the demand for travel are in favour of rail and others are not.
In the PII scenario the location of income and population growth is high outside of large urban areas, there is no increase in the productive use of travel time, the cost of car usage is lower than currently and car availability increases. The impact of this is to reduce the growth projections to between broadly half and three quarters of the PGS scenario. In the SGT scenario national income growth is low but most other factors favour rail demand growth, albeit at a reduced rate versus the PGS scenario. The impact of this is to reduce the growth projections to between broadly one third and two thirds of the PGS scenario.
These results suggest that the demand for long distance rail travel is sensitive to both GB-wide and choice-specific factors.
In the SII scenario all of the factors considered would be likely to suppress the demand for travel by rail. Comparison with the PGS scenario implies a wide range of forecasts, although a number of the factors in this scenario would be required to diverge significantly from the current situation and would therefore only be likely to

Network Rail Long Distance Market Study 42October 2013 06. Long Term Demand Scenarios
materialise gradually. The SII scenario may therefore overstate the likely risk to the long distance rail passenger market. Positive demand growth is predicted even in the SII scenario because positive national income and population growth is assumed albeit at a much lower rate than other scenarios.
Figure 6.7 shows the likely range of demand growth in 10 years’ time. As discussed in Chapter 1, this is to help understand the likely progress towards the projected long term outcomes in the final year of Control Period 6 (2019-2024). (Control Period 6 being the first industry planning period for which major investment decisions are yet to be taken, and is hence a key focus for the Long Term Planning Process).
The 10 year range presented in Figure 6.7 is based on the SGT scenario and the PGS scenario as it is believed that these scenarios are based on circumstances that are the most similar to the existing and recent situation.
On this basis the range of 10-year annual growth projections for the scenarios considered is narrower than for the 30-year equivalents.The differences between the forecasts for the pairs of principal urban centres are similar to those described above for the long term. However, the 10 year projections tend to be slightly lower on a compound annual basis due largely to the assumed level of rail ticket price increases in the shorter term.
6.5.3 The potential to grow rail demand through further improvements to rail services
As discussed previously, the market study demand projections shown in Figures 6.6 to 6.7 only include the impact of rail service improvements and associated changes to the capability of the network where funding has been fully committed. In practice these are the schemes that are being implemented in Control Period 4 (2009-14), schemes which have been specified in the High Level Output Specification(s) for Control Period 5 (2014-19) and a limited number of subsequent funding announcements. The forecasts therefore do not include service improvements and infrastructure changes for Control Period 6 and beyond which emanate from later stages of the LTPP.
All rail service improvements have the potential to increase the demand for rail travel, with enhancements such as the West Coast Main Line (WCML) upgrade and subsequent introduction of the WCML 2008 Very High Frequency Timetable credited with generating significant additional passenger growth. There are two particular situations where rail service improvements could generate large increases in rail passenger numbers, these are:
• Where the improvement to rail services makes rail competitive with a previously dominant alternative mode of transport
• Where the improvement to rail services removes a factor which has previously constrained demand such as a lack of on-train capacity, or poor service reliability.
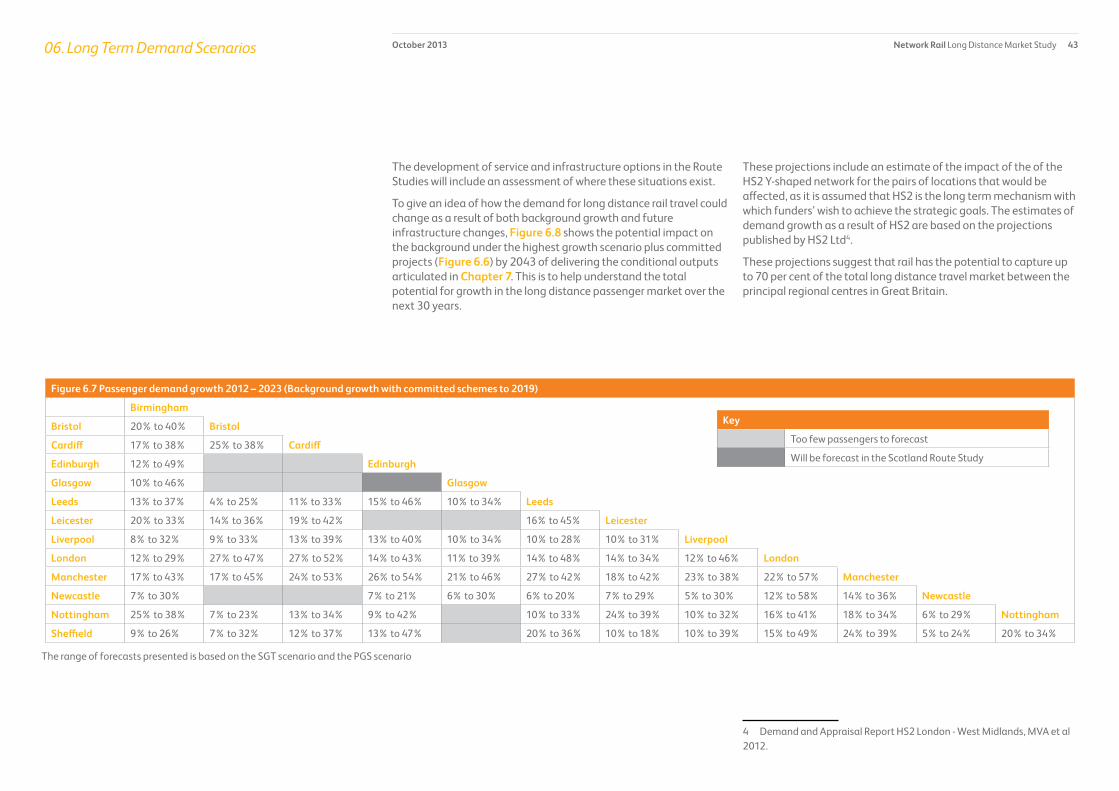
Network Rail Long Distance Market Study 43
These projections include an estimate of the impact of the of the HS2 Y-shaped network for the pairs of locations that would be affected, as it is assumed that HS2 is the long term mechanism with which funders’ wish to achieve the strategic goals. The estimates of demand growth as a result of HS2 are based on the projections published by HS2 Ltd4.
These projections suggest that rail has the potential to capture up to 70 per cent of the total long distance travel market between the principal regional centres in Great Britain.
4 Demand and Appraisal Report HS2 London - West Midlands, MVA et al 2012.
The development of service and infrastructure options in the Route Studies will include an assessment of where these situations exist.
To give an idea of how the demand for long distance rail travel could change as a result of both background growth and future infrastructure changes, Figure 6.8 shows the potential impact on the background under the highest growth scenario plus committed projects (Figure 6.6) by 2043 of delivering the conditional outputs articulated in Chapter 7. This is to help understand the total potential for growth in the long distance passenger market over the next 30 years.
October 2013 06. Long Term Demand Scenarios
Figure 6.7 Passenger demand growth 2012 – 2023 (Background growth with committed schemes to 2019)
Birmingham
Cardiff
Edinburgh
Glasgow
Leeds
Leicester
Liverpool
London
Manchester
Newcastle
Bristol 20% to 40% Bristol
Cardiff 17% to 38% 25% to 38%
Edinburgh 12% to 49%
Glasgow 10% to 46%
Leeds 13% to 37% 4% to 25% 11% to 33% 15% to 46% 10% to 34%
Leicester 20% to 33% 14% to 36% 19% to 42% 16% to 45%
Liverpool 8% to 32% 9% to 33% 13% to 39% 13% to 40% 10% to 34% 10% to 28% 10% to 31%
London 12% to 29% 27% to 47% 27% to 52% 14% to 43% 11% to 39% 14% to 48% 14% to 34% 12% to 46%
Manchester 17% to 43% 17% to 45% 24% to 53% 26% to 54% 21% to 46% 27% to 42% 18% to 42% 23% to 38% 22% to 57%
Newcastle 7% to 30% 7% to 21% 6% to 30% 6% to 20% 7% to 29% 5% to 30% 12% to 58% 14% to 36%
Nottingham 25% to 38% 7% to 23% 13% to 34% 9% to 42% 10% to 33% 24% to 39% 10% to 32% 16% to 41% 18% to 34% 6% to 29% Nottingham
Sheffield 9% to 26% 7% to 32% 12% to 37% 13% to 47% 20% to 36% 10% to 18% 10% to 39% 15% to 49% 24% to 39% 5% to 24% 20% to 34%
The range of forecasts presented is based on the SGT scenario and the PGS scenario
Key
Too few passengers to forecast
Will be forecast in the Scotland Route Study
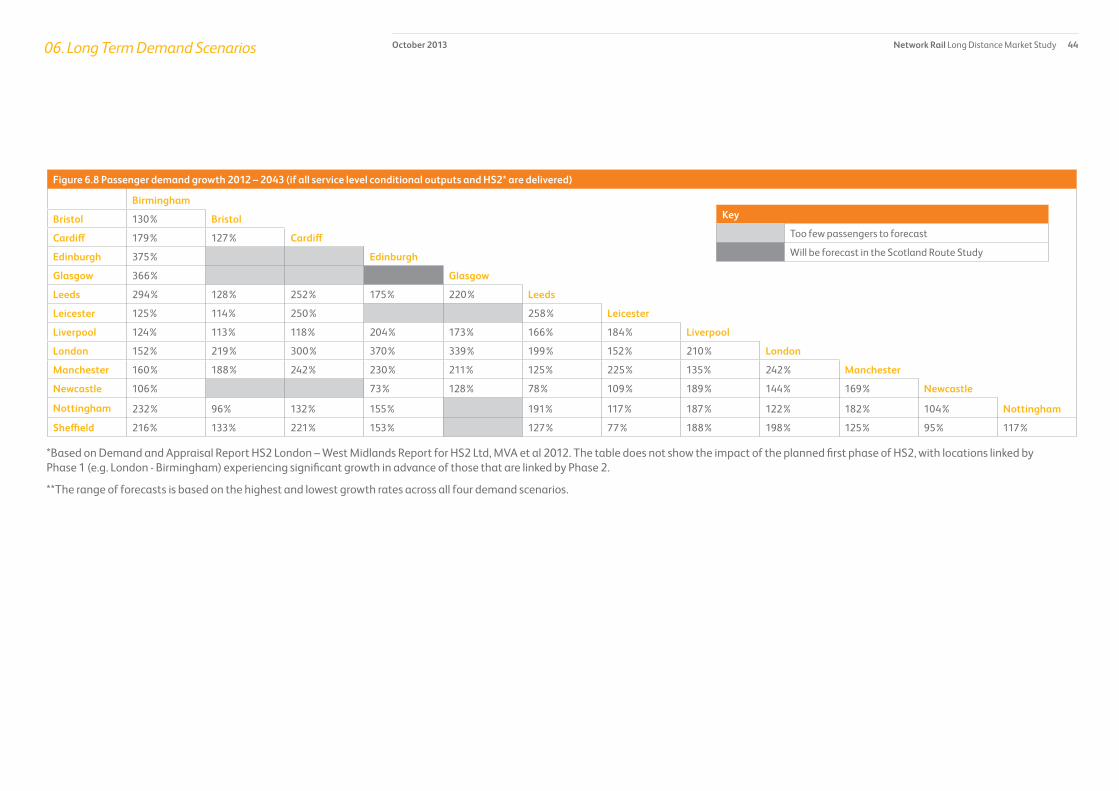
Network Rail Long Distance Market Study 44October 2013 06. Long Term Demand Scenarios
Figure 6.8 Passenger demand growth 2012 – 2043 (if all service level conditional outputs and HS2* are delivered)
Birmingham
Bristol
Cardiff
Edinburgh
Glasgow
Leeds
Leicester
Liverpool
London
Manchester
Newcastle
Nottingham
Bristol 130%
Cardiff 179% 127%
Edinburgh 375%
Glasgow 366%
Leeds 294% 128% 252% 175% 220%
Leicester 125% 114% 250% 258%
Liverpool 124% 113% 118% 204% 173% 166% 184%
London 152% 219% 300% 370% 339% 199% 152% 210%
Manchester 160% 188% 242% 230% 211% 125% 225% 135% 242%
Newcastle 106% 73% 128% 78% 109% 189% 144% 169%
Nottingham 232% 96% 132% 155% 191% 117% 187% 122% 182% 104%
Sheffield 216% 133% 221% 153% 127% 77% 188% 198% 125% 95% 117%
*Based on Demand and Appraisal Report HS2 London – West Midlands Report for HS2 Ltd, MVA et al 2012. The table does not show the impact of the planned first phase of HS2, with locations linked by Phase 1 (e.g. London - Birmingham) experiencing significant growth in advance of those that are linked by Phase 2.
**The range of forecasts is based on the highest and lowest growth rates across all four demand scenarios.
Key
Too few passengers to forecast
Will be forecast in the Scotland Route Study

Network Rail Long Distance Market Study 45October 201307. Long term conditional outputs – aspirations for 2043This chapter presents an assessment and statement of the characteristics for the provision of services for the long distance passenger market, which will be required to meet the long term strategic goals identified in chapter 5. These required service characteristics are termed “conditional outputs”.
7.1 Introduction
This chapter presents an assessment and statement of the characteristics for the provision of services for the long distance passenger market, which will be required to meet the long term strategic goals identified in Chapter 5. These required service characteristics are termed “conditional outputs”.
The conditional outputs published in the three passenger market studies will be used in conjunction with the recommendations from the freight market study to form a statement of the long term aspirations for the remainder of the Long Term Planning Process (LTPP). In this process the Routes Studies, in particular, will:
• consider whether it is possible, given the capability of the current network, to accommodate all of the conditional outputs that relate to the route in question
• where it is not possible to accommodate all of the conditional outputs, identify packages of options to accommodate combinations of these outputs by first making best use of current infrastructure and then with changes to the current infrastructure capability
• assess the value for money of the options identified to deliver all of, or combinations of, the conditional outputs. The long term demand scenarios from Chapter 6 will form an input to these assessments, hence integrating the three deliverables1 of the market studies.
Given that the value for money assessment of options to deliver the conditional outputs will not be undertaken until the Route Studies, and that funders would be unlikely to assess the affordability of these options until funding decisions are required, the conditional outputs from the Market Studies are conditional upon subsequent favourable assessments of value for money and affordability. They are therefore not recommendations for the funding of options to change the specification of services or the capability of the network.
1 The three key deliverables are a statement of the strategic goals, long term demand scenarios and conditional outputs.
The conditional outputs have been developed using an assessment of how to deliver three of the four strategic goals from Chapter 5:
• Enabling economic growth
– by providing sufficient capacity for people travelling to take part in economically productive activities
– by improving business to business connectivity
– by improving connectivity to/from the retail, tourism and leisure sectors of the economy .
• Reducing carbon and the transport sector’s impact on the environment
– by directly reducing the environmental impact of rail
– by reducing the use of less carbon efficient modes of transport.
• Improving the quality of life for communities and individuals
– by connecting communities
– by providing access to social infrastructure such as educational establishments and major leisure venues
– by reducing road congestion.
However, they have not been based on an explicit assessment of the fourth goal (although supporting commentary is provided where appropriate):
• Improving affordability and value for money
– by meeting other outputs in a value for money and affordable way
– by directly reducing whole industry subsidy.
As discussed in Chapter 5, this goal cannot be addressed at a market level without also considering the specification of rail services and infrastructure to meet it. It will be considered in the remainder of the LTPP.
Network Rail Long Distance Market Study 46October 201307. Long term conditional outputs – aspirations for 2043
7.2 A summary of how the conditional outputs were developed
The first stage in the development of conditional outputs was to categorise the elements of future long distance rail services which would be likely to deliver the strategic goals. These categories are:
Connectivity to/from large urban areas, meaning the total journey time to/from a location, including the time spent waiting for a train defined by the number of opportunities to travel per hour. Network Rail has undertaken an assessment of how improving the connectivity between towns and cities in Great Britain can contribute to the strategic goals relating to the economy, environment and quality of life of communities and individuals, specifically by:
• improving business to business connectivity
• improving connectivity to/from the retail and leisure sectors of the economy
• reducing the use of less carbon efficient modes of transport
• connecting communities
• providing access to social infrastructure such as educational establishments and major leisure venues
• reducing road congestion.
The assessment of the contribution of improved connectivity to these goals used primary research undertaken by Network Rail to supplement the literature review and discussions with the Working Group and Regional Groups.
This research is summarised in Sections 7.3.1 – 7.3.3 below.
A list of towns and cities for explicit consideration in this assessment was compiled. This was to keep the exercise manageable, and to focus on the places where improved connectivity would be of most benefit.
The list was put together using the locations identified as the largest functioning economic areas in the Centre for Cities, Cities Factbook 2012, plus other locations which generate at least 1 ¾ million rail journeys per annum. This was to include places that
attract a rail catchment from a geographically dispersed area, often termed as ‘rail heads’ . The resultant list of places is shown in Appendix B, and largely corresponds to the locations served by existing long distance rail services.
The conditional outputs only relate to the market for long distance travel between the places identified in this list. Travel between two economic centres that are both within the London and South East area and journeys made predominately for commuting purposes are covered in the London and South East Market Study and should apply conditional outputs from the London and South East Market Study. This Market Study also considers non-London flows within the London and South East area that are more than 50 miles and predominately made for leisure or business purposes. Furthermore, where travel between two places is predominately for commuting purposes (and is outside the scope of the London and South East Market Study), the conditional outputs have been developed in the Regional Urban Market Study. See Chapter 2 for a more detailed explanation of this.
The rationale detailed below for improving connectivity may also apply to locations which have not been considered explicitly in this exercise. Advice is provided below on the characteristics of these places, which can be used in the Route Studies if required.
Capacity, meaning the number of people travelling to/from a location that can be accommodated by rail services. Network Rail has used long term demand scenarios from Chapter 6 to develop conditional outputs for long term on-train capacity. These outputs are intended specifically to meet the strategic goal relating to the economy by:
• providing sufficient capacity for people travelling to take part in economically productive activities.
However, it is recognised that capacity based outputs could contribute to some of the other strategic goals. These outputs are presented in Section 7.5
Other categories. The categories relating to connectivity and capacity focus largely on the provision of services to/from large urban centres. A final category of outputs has been produced to
Network Rail Long Distance Market Study 47October 201307. Long term conditional outputs – aspirations for 2043
cover elements of the strategic goals which could be addressed by a change in connectivity to/from certain types of locations that are not in large urban areas, and/or by qualitative changes to rail services.
Given the nature of these conditional outputs, quantitative data on the potential impact of the strategic goals is limited. This means that it has not been possible to undertake significant additional primary research, with the conditional outputs developed instead through a combination of the literature review and discussions with stakeholders. The resultant conditional outputs are summarised in Section 7.6 onwards.
7.3 How the conditional outputs for connectivity to/from large urban areas were developed
Sections 7.3.1 – 7.3.3 summarise the primary research that was undertaken to develop the connectivity-based conditional outputs. Appendix B provides a more detailed explanation of this work.
7.3.1 Assessment of the economic impact of rail service levels
Improving business to business connectivity is critical in supporting economic growth. When cities and urban centres are well connected, people are more willing to travel for business purposes. Improved connectivity between economic centres helps to increase economic efficiency. Better connectivity increases competition and reduces costs in the supply chain through agglomeration and encourages trade and investment.
The assessment of the economic impact of improvements to long distance rail services is based on the approach developed from a succession of publications on the subject such as the Eddington Transport Study2, the ongoing Network Rail Northern Hub programme, Prioritising Investment to Support our Economy3, and the Department for Transport’s (DfT) WebTAG appraisal guidance and Transport Scotland’s (TS) STAG appraisal guidance. This approach estimates the relationship between economic output and 2 The Eddington Transport Study. The case for action: Sir Rod Eddington’s advice to Government, December 2006.3 Prioritising investment to support our economy: A new approach to appraisal methodology, Network Rail 2010.
business to business connectivity.
The results of this analysis suggest a statistically significant link between time/cost of travel between businesses and economic output, leading to the following conclusions:
• large urban centres have the highest concentration of businesses
• when the time and cost of travel between businesses is very high (e.g. for journeys of three hours or more) most people do not travel to undertake business interactions. The impact of a small change in journey times on the level of business activity undertaken between urban centres of three or more hours apart is therefore relatively small. This suggests a similarly small impact on economic output as estimated using Network Rail’s approach. Large changes in journey times can, however, be extremely beneficial in terms of the environmental and quality of life goals discussed below
• when the time and cost of travel between businesses is moderate (e.g. for journeys of around 90 minutes) a significant number of people travel to undertake business interactions. In the range of around one to two hours travel time, the impact of a small change in travel time on the level of business travel and hence economic output is relatively large
• when the time and cost of travel between businesses is low (e.g. for journeys of 30 minutes or less) most people travel to undertake business interactions. The impact of a change in journey times on the level of business travel undertaken is therefore relatively low, although given the large numbers of people who travel over shorter distances, journey time savings can offer sizeable benefits against the quality of life goal in particular
• improvements to rail services are therefore likely to result in the greatest increases in economic output where it is possible to provide a step change in journey times between large urban areas with a current journey time of two hours or more, to substantially less than that. Further details of this analysis can be found in Appendix B.

Network Rail Long Distance Market Study 48October 201307. Long term conditional outputs – aspirations for 2043
7.3.3 Assessment of the impact of rail service levels on the quality of life for communities and individuals
Long distance rail plays an important role in connecting centres of population in Great Britain, and connecting people with key social infrastructure.
The assessment of the impact on the quality of life for communities and individuals of improvements to long distance rail services is based on WebTAG and STAG appraisal guidance. This approach estimates the value of time saved by the existing and potential new passengers who would benefit from service improvements.
The conclusion of this analysis is:
• the service improvements which are likely to offer the largest enhancement in quality of life, are those which affect travel between locations where large numbers of journeys are already made, and where existing rail journey times are slow.
Further details of this analysis is detailed in Appendix B.
7.3.2 Assessment of the environmental impact of rail service levels
Rail has a relatively low environmental impact per passenger mile compared to other modes of transport. Improving the attractiveness of rail service offerings between economic centres, such as service frequency, journey times, and quality of rail products encourages modal shift from road and air to rail.
The assessment of the environmental impact of improvements to long distance rail services is twofold:
• an application of the DfT’s WebTAG and Transport Scotland’s STAG appraisal guidance. The approach estimates the modal shift from road to rail generated by an improvement in rail journey times (including time spent waiting for a train)
• a review of industry research into rail/airline competition including the PDFH and an assessment undertaken by Network Rail to support the West Coast Main Line Route Utilisation Strategy.
The results of this work suggested the following:
• the largest environmental benefit is likely to occur where rail has the potential to capture a large share of a large total market for travel
• rail already has a high share of the total market for travel between a number of the main economic centres in Great Britain, particularly on journeys to or from central London
• rail has the greatest potential to increase its market share where:
– rail journey times (including time spent waiting for a train) are currently similar to or longer than by car. These circumstances are bespoke to each of the pairs of locations in Great Britain considered in this study although rail journeys between cities other than London tend to be slower.
– a sizeable air travel market exists and it is possible to reduce rail journey times to a level of around 3 hours or less.
Further details of this analysis is presented in Appendix B.
Network Rail Long Distance Market Study 49October 201307. Long term conditional outputs – aspirations for 2043
The three pieces of analysis described in Sections 7.3.1 – 7.3.3 were used to test the value of providing each of the three levels of services between all of the towns and cities in the list discussed previously. The results of this analysis were ranked in descending order and the places which were shown to derive the greatest benefit from each aspiration were assigned that aspiration as a conditional output. The results of all three pieces of analysis were treated equally and the aspiration was set against the maximum performing indicator. For example, if connecting two cities with the best possible service aspiration was shown to generate a low economic benefit but a high environmental benefit the latter was used to set the aspired level of service.
The cut off between the aspired service levels was based on discussions with both the Working Group and Regional Groups as follows:
• Network Rail presented the estimated value versus each strategic goal of providing the “best possible future” service offer between each of the pairs of locations considered. It then ranked them by order of this value, and suggested a cut off at the point where this value dropped significantly
• attendees were then invited to sense-check the implied relativities in the assessment, and to say whether they believed the cut-off to be appropriate
• Network Rail checked any potential errors and anomalies, and adjusted the cut-off to reflect the consensus of opinions
• the process was then repeated for the other output levels
For services between the pairs of cities where the above aspirations were shown to produce the least value the conditional output is to maintain the existing level of service.
Appendix B shows how the cut off point for each of the categories and their associated values.
7.3.4 How the connectivity based conditional outputs have been expressed as long term service aspirations
The conditional outputs relating to connectivity have been expressed as aspirations for services of differing characteristics. This was done to express the outputs in straightforward language, and to articulate the relative value of improvements to services between the locations considered.
The characteristics that define these service aspirations are the average speed of a journey and the number of opportunities to travel each hour by either direct rail services or by changing trains. The aspirations have been split, with different outputs assigned depending whether the distance between two places is under 50 miles, between 50 and 100 miles (inclusive) or greater than 100 miles. This is based on evidence from the industry standard Passenger Demand Forecasting Handbook (PDFH), which suggests that for journeys of over (approximately) 100 miles passengers’ first priority tends to be journey speed once the service frequency is above a certain level, and vice versa for journeys under (approximately) 50 miles.
At a distance of between 50 and 100 miles, passengers’ relative valuations of journey time and frequency tends to vary based on both location-specific characteristics and the passengers’ journey purposes. The conditional outputs for pairs of places in this distance band have been written in a way which enables the Route Studies to consider whether the improvements to journey time, service frequency, or a combination of both are the best way to meet the strategic goals.
Three aspirations have been defined for each distance category. These are intended to correspond to:
• the best possible service offer likely to be available in the forecast future year (2043)
• the best service offer currently available
• a typical good current level of service.
Again, this categorisation is designed to provide a simple way to illustrate the relative value of service improvements and is not intended to be exhaustive.

Network Rail Long Distance Market Study 50October 201307. Long term conditional outputs – aspirations for 2043
Table 7.1 Long term service aspirations tested in the analysis
Distance Aspiration DescriptionTypical service characteristics
Journey speed (end to end), miles per hour
Opportunities to travel per hour*
> 100 miles Best possible future Very fast 160 3 or 4
Best current Intercity 100 2 or 3
Good current Interurban 80 1 or 2
< 50 miles Best possible future High frequency interurban At least 60 5 or 6
Best current Medium frequency interurban 60 3 or 4
Good current New interurban connection 45 1 or 2
50 - 100 miles
Best possible future
Route Study to determine whether to use outputs related to under 50 miles or over 100 milesBest current
Good current
* Either by direct services or fast, straightforward interchange
Table 7.1 details the speed and service frequency characteristics assigned to the levels of service aspirations detailed above (“best possible future”, “best possible current”, typical good current”) possible, characteristics of the service aspirations tested in the analysis.
For services of 50 miles or greater the aspirations were defined on the following basis:
• the best possible future service is assumed to have the characteristics of services that currently operate on European high speed networks, namely an end to end journey speed of around 160 mph (assuming one or two stops between origin and destination) and a frequency of around three to four opportunities to travel per hour
• the best current services on the national long distance network have an end to end journey speed of around 100 miles per hour, and a frequency of two to three opportunities to travel per hour
• based on discussions with stakeholders, long distance services are typically perceived as good when the end to end journey speed is around 80 miles per hour, and the frequency is one to two opportunities to travel per hour. This is broadly equivalent to the current London King’s Cross – Leeds service.
Opportunities to travel as defined in the above aspirations imply either direct services, or via fast and straightforward interchange.
For services of less than 50 miles the aspirations were defined on the following basis:
• the best possible future service is assumed to have a ‘turn up and go’ style offer of five to six opportunities to travel per hour and an end to end journey speed of at least 60 miles per hour. This is consistent with the aspired level of service between Manchester and Leeds published in the Northern Hub documentation

Network Rail Long Distance Market Study 51October 201307. Long term conditional outputs – aspirations for 2043
• the best current services provide three to four opportunities to travel per hour and an end to end journey speed of around 60 miles per hour
• based on discussions with stakeholders, services of less than 50 miles in the long distance market sector are typically perceived as good when a service is provided between locations with one to two opportunities to travel per hour and an end to end journey speed of 45 miles per hour.
At a distance of between 50 and 100 miles, passengers’ relative valuations of journey time and frequency tends to vary based on both location specific characteristics and the passengers’ journey purposes. The conditional outputs for pairs of places in this distance band have been written in a way which enables the Route Studies to consider whether the improvements to journey time, service frequency, or a combination of both are the best way to meet the strategic goals. When interpreting the conditional outputs, they should be consistent with the aspirations set for less than 50 miles and more than 100 miles.
Opportunities to travel as defined in the above aspirations imply either direct services, or via fast and straightforward interchange.
When used in the Route Studies these characteristics should be treated as a desired “Generalised Speed” which is a means of converting passengers’ valuation of time spent travelling on a train, waiting for a train and changing train in the same unit, using evidence from PDFH. However, members of the Working Group and Regional Groups felt that this concept was too nebulous for subsequent application in the Route Studies without simplifying guidance, and preferred the conditional outputs to articulate separately journey speed and service frequency.
Journey speed should therefore be treated as the end-to-end journey time divided by the distance travelled.
Service frequency (which has been expressed as the number of opportunities to travel per hour) should be treated as the time spent waiting for a train. Where one or more opportunities to travel per hour involve changing trains, the time spent changing trains should be included in the calculation of journey speed (ensuring double-counting does not occur). Any penalty associated with passengers’
aversion to interchange should also be included in this calculation. The “interchange penalties” in PDFH should be used as a starting point for this, however Route Studies should consider whether these penalties are appropriate as over the longer term it may be possible to significantly improve connectivity via reliable interchange connections to/from strategic interchange facilities.
The level at which the journey speed and frequency characteristics were set generated a significant debate amongst members of the Working Group and Regional Groups, and through organisations’ consultation responses generally.
Some organisations were concerned by the absence of an assessment of value for money and affordability to support the more ambitious aspired service levels in particular. Given that the assessment of the costs of delivering these outputs will be undertaken in the Route Studies it is, clearly, possible that some outputs may be either unaffordable or of low value for money when considered. Conversely, other organisations were concerned that some of the outputs lacked ambition, given for example, the potential advances in technology over the 30 year time horizon.
These views illustrate a risk of the LTPP approach which aims to provide an evidence base for the development of future aspirations of the network, before considering options to meet these aspirations. It is therefore important to emphasise the conditional outputs provide the starting point for the LTPP intended to identify the relative benefits, versus funder’s desired long term outcomes, of improvements in the connectivity of locations in Great Britain. The connectivity based outputs should therefore be taken to mean ‘as fast and frequent as operationally possible given value for money and affordability’.
Finally, some organisations have expressed a concern that either the conditional output level for the location they represent is too low, or that a location should have been added to the list of those explicitly considered. The outputs have been developed to articulate the role that improved connectivity can have in meeting the strategic goals given other favourable conditions (e.g. a sizeable highly skilled workforce and a good stock of commercial property). If stakeholders have evidence to suggest these other conditions are likely to occur in a location over the 30 year time horizon, further
Network Rail Long Distance Market Study 52October 201307. Long term conditional outputs – aspirations for 2043
conditional outputs which will have to be made in order to produce an efficient mix of interventions that meet the outputs. For the most part, these trade-offs will be analysed and decisions made as part of the Route Studies and it is in this context the following high level conclusions were reached in developing the conditional outputs:
• the rail industry can help create the conditions to improve economic growth, the environment, and the quality of life for communities and individuals by improving the long distance services between over 60 of the pairs of the principal regional centres in Great Britain. (As discussed previously, these objectives are the strategic goals for the long distance market sector, and a statement of funders’ requirements)
• the largest improvements against these goals are likely to be generated by providing very fast services between London and the other principal regional centres, and between some of the other principal regional centres of around 100 miles in separation such as Birmingham and Leeds. These services also benefit other long distance flows such as Birmingham to Newcastle
• very large improvements against these goals are also likely to be generated by providing high frequency interurban services between a number of the principal regional centres in the north of England, the Midlands, West of England, Wales and Scotland
• service improvements between other regional centres and principal regional centres in other regions will also be of benefit against the strategic goals. Improving connectivity to/from London is particularly beneficial
• provision of improved opportunities to travel between a number of locations that are not directly served would be beneficial against the strategic goals.
consideration should be given in the Route Studies to how the strategic goals can be met effectively. Again, taking the conditional outputs to mean as fast and frequent as operationally possible given value for money and affordability would be appropriate in these circumstances.
7.4 The long term connectivity based conditional outputs
The conditional outputs relating to connectivity discussed in the previous section are detailed below in Tables 7.2 – 7.11. For presentational purposes the outputs are shown firstly as long term aspirations for levels of services between the 13 principal regional centres in Great Britain, and then separately from the perspective of English regions, Scotland and Wales.
This latter perspective includes long term aspirations for all the locations considered in that region or nation where the analysis has indicated that service improvements would be beneficial. Locations have not been shown where the analysis suggests the benefit of improved services is limited. In these instances the conditional output is to maintain the current level of service. Locations which border more than one region are shown in several of the tables.
As discussed above, the journey speeds and service frequencies implied by these descriptions are not intended to be absolute requirements, as it may be possible to provide an equivalent total journey time (time waiting for and on board a train) through a different combination of time and frequency.
Improvements to rail services are only one of the sets of circumstances and wider policy levers required to generate the funders’ desired outcome. It is also important to reiterate that the conditional outputs shown are conditional on both affordability, fundability and a value for money business case being made for any interventions that subsequent Route Studies in the LTPP may consider as a way to deliver them. Equally the conditional outputs will need to be deliverable both technologically and physically so for example some may never be able to be delivered as a result of topography or railway geography.
Finally the Long Distance Market is only one of the markets present on much of the railway network. It is clear that on a mixed traffic (or market) network trade offs between potentially differing

Network Rail Long Distance Market Study 53October 201307. Long term conditional outputs – aspirations for 2043
The above outputs are a guide for the rest of the Long Term Planning Process and should be taken to mean “as fast and frequent as operationally feasible given value for money and affordability..
Birmingham
Birmingham
Bristol
Bristol B/E
Cardi�
Cardi� C E
Edinburgh
Edinburgh
Glasgow
Glasgow
Leeds
Leeds A C C B B
Leicester
Leicester D C
Liverpool
Liverpool B/E
B/E
B/EB/E
B/EB/E
C C
London
London A A A A A A M
anchester Manchester A/D
A/D
A/D D
C/FC/F
D AA
EA
New
castle
Newcastle B B C B B A B
Nottingham
Nottingham
B
C A
B B B
She�eld
She�eld DC C
C
D E
Key
Distance Aspiration DescriptionIllustrative service characteristics
End to end journey speed Opportunities to travel
A > 100 miles Best possible future
Best possible future
160 mph 3 or 4 per hour
B > 100 miles Best current
Best current
Very fast
Intercity 100 mph 2 or 3 per hour
C > 100 miles
Good current
Good current Interurban 80 mph 1 or 2 per hour
D < 50 miles Best possible future High frequency interurban At least 60 mph 5 or 6 per hour
E < 50 miles Best current Medium frequency interurban 60 mph 3 or 4 per hour
F < 50 miles Good current New interurban connection 45 mph 1 or 2 per hour
Any Maintain existing level of service
Outside the scope of this Market Study, will be considered in the Scotland Route Study
A/D
B/E
C/F
Between 50 and 100 miles
Between 50 and 100 miles
Between 50 and 100 miles
C/F
Route Study to determine whether to use outputs related to under 50 miles or over 100 miles
BB
Table 7.2 Long term service level conditional outputs for the principal regional centres in Great Britain – aspirations for 2043
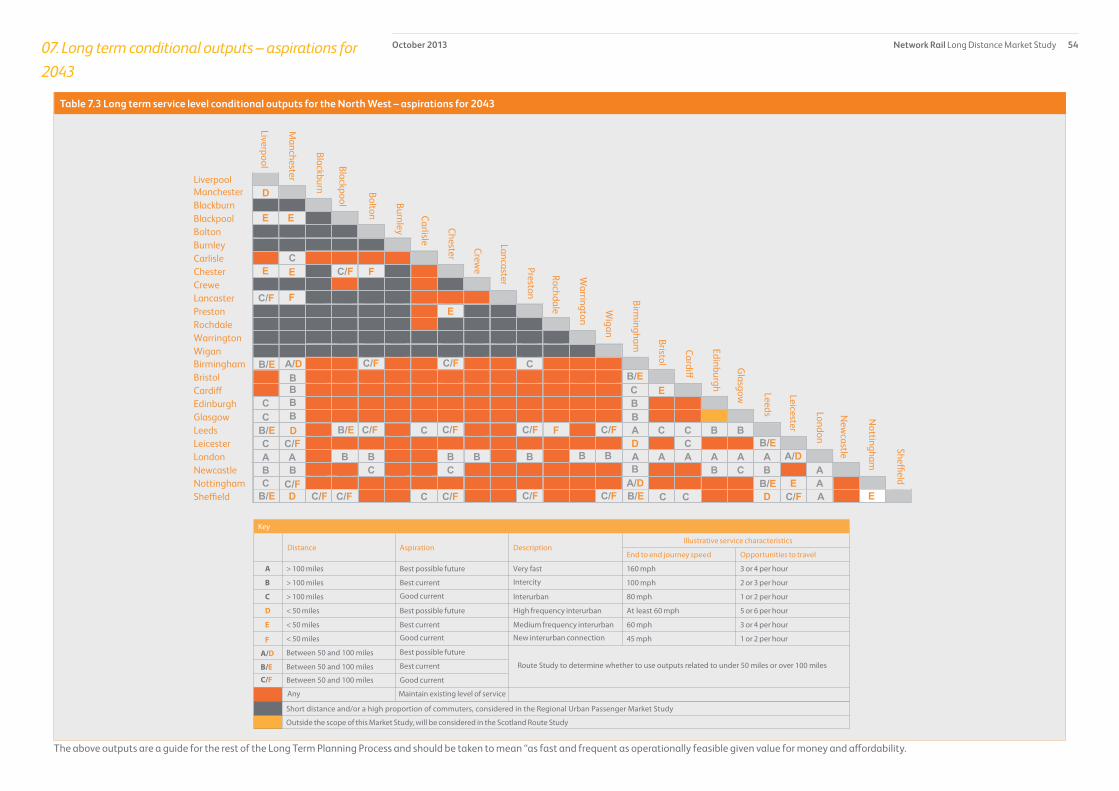
Network Rail Long Distance Market Study 54October 201307. Long term conditional outputs – aspirations for 2043
The above outputs are a guide for the rest of the Long Term Planning Process and should be taken to mean “as fast and frequent as operationally feasible given value for money and affordability.
A C C B B
ManchesterLiverpool
Blackburn
Manchester
Liverpool
Blackburn
Blackpool
Blackpool
Bolton
Bolton
Burnley
Burnley
Carlisle
Carlisle
Chester
Chester F
Crewe
Crewe
Lancaster
Lancaster
Preston
Preston E
Rochdale
Rochdale
Warrington
Warrington
Wigan
Wigan
Birmingham
Birmingham C
Bristol
Bristol
Cardi�
Cardi� EEdinburgh
Edinburgh
Glasgow
Glasgow B
B
C C
C Leeds
Leeds C F
Leicester
Leicester D C
London
London B B B B B A A A A A A
New
castle
Newcastle C C B C B A
Nottingham
Nottingham EE
A
She�eld
She�eld C D A E
Key
Distance Aspiration DescriptionIllustrative service characteristics
End to end journey speed Opportunities to travel
A > 100 miles Best possible future
Best possible future
160 mph 3 or 4 per hour
B > 100 miles Best current
Best current
Very fast
Intercity 100 mph 2 or 3 per hour
C > 100 miles
Good current
Good current Interurban 80 mph 1 or 2 per hour
D < 50 miles Best possible future High frequency interurban At least 60 mph 5 or 6 per hour
E < 50 miles Best current Medium frequency interurban 60 mph 3 or 4 per hour
F < 50 miles Good current New interurban connection 45 mph 1 or 2 per hour
Any Maintain existing level of service
Outside the scope of this Market Study, will be considered in the Scotland Route Study
Short distance and/or a high proportion of commuters, considered in the Regional Urban Passenger Market Study
A/D
B/E
C/F
Between 50 and 100 miles
Between 50 and 100 miles
Between 50 and 100 miles
Route Study to determine whether to use outputs related to under 50 miles or over 100 miles
C/F
C/F
C/F
C/F
C
C
C
C
CA AB B
BBBB
D
D
E E
E
F
E
D
C/FB/E
B/E
B/E
B/E
B/E
B/E
B/E
B/E
C/F
C/F C/F
C/F
C/F
C/F C/F
C/F
A/D
C/F
C/F
C/F
B
B B
A/D
A/D
Table 7.3 Long term service level conditional outputs for the North West – aspirations for 2043

Network Rail Long Distance Market Study 55October 201307. Long term conditional outputs – aspirations for 2043
The above outputs are a guide for the rest of the Long Term Planning Process and should be taken to mean “as fast and frequent as operationally feasible given value for money and affordability.
C
Birmingham
Birmingham
Coventry
Coventry
Milton Keynes
Milton Keynes B/E
B/E
B/E
A/D
A/D
A/DC/F
C/F
C/F
C/FA/DC/F
C/FC/F
B/E
A
C/F
C/F
C/F
B/EB/E
B/E
C
C/F
C/F
C/FC/FB/E
Northam
pton
Northampton
Oxford
Oxford
Shrewsbury
Shrewsbury
Sta�ord
Sta�ord
Stoke-on-Trent
Stoke-on-Trent
Telford
Telford
Walsall
Walsall
Wolverham
pton
Wolverhampton
Worcester
Worcester
Bristol
Bristol
Cardi�
Cardi� C E
Edinburgh
Edinburgh
Glasgow
Glasgow
Leeds
Leeds A C C C C C B B
Leicester
Leicester D F C
Liverpool
Liverpool C
C
C C C
London
London A C C B B B A A A A A
Manchester
Manchester E C B B B B D D A
A
New
castle
Newcastle B B C B B A B
Nottingham
Nottingham C E C A
She�eld
She�eld C C D D E
Key
Distance Aspiration DescriptionIllustrative service characteristics
End to end journey speed Opportunities to travel
> 100 miles Best possible future Very fast 160 mph 3 or 4 per hour
> 100 miles Best current Intercity 100 mph 2 or 3 per hour
> 100 miles Good current Interurban 80 mph 1 or 2 per hour
< 50 miles Best possible future High frequency interurban At least 60 mph 5 or 6 per hour
< 50 miles Best current Medium frequency interurban 60 mph 3 or 4 per hour
< 50 miles Good current New interurban connection 45 mph 1 or 2 per hour
Any Maintain existing level of service
Outside the scope of this Market Study, will be considered in the Scotland Route Study
Short distance and/or a high proportion of commuters, considered in the London and South East Passenger Market Study
A
B
C
D
E
F
Best possible future
Best current
Good current
A/D
B/E
C/F
Between 50 and 100 miles
Between 50 and 100 miles
Between 50 and 100 miles
Route Study to determine whether to use outputs related to under 50 miles or over 100 miles
BB
Short distance and/or a high proportion of commuters, considered in the Regional Urban Passenger Market Study
Table 7.4 Service level conditional outputs for the West Midlands – aspirations for 2043

Network Rail Long Distance Market Study 56October 201307. Long term conditional outputs – aspirations for 2043
The above outputs are a guide for the rest of the Long Term Planning Process and should be taken to mean “as fast and frequent as operationally feasible given value for money and affordability.
Leeds
Leeds
She�eld
She�eld D
Barnsley
Barnsley
Bradford
Bradford
Doncaster
Doncaster
Grim
sby
Grimsby
Huddersfield
Huddersfield
Hull
Hull
Halifax
Halifax
Wakefield
Wakefield
York
York E
Birmingham
Birmingham A C C C C
Bristol
Bristol C C C
Cardi�
Cardi� C C C E
Edinburgh
Edinburgh B C
Glasgow
Glasgow B C
Leicester
Leicester D C
Liverpool
Liverpool C C C
London
London A A C B B C B B B B A A A A A A
Manchester
Manchester D D F E C E F B B B B D AA
New
castle
Newcastle B C B B C B A B
Nottingham
Nottingham E E C A
Key
Distance Aspiration DescriptionIllustrative service characteristics
End to end journey speed Opportunities to travel
A > 100 miles Best possible future
Best possible future
160 mph 3 or 4 per hour
B > 100 miles Best current
Best current
Very fast
Intercity 100 mph 2 or 3 per hour
C > 100 miles
Good current
Good current Interurban 80 mph 1 or 2 per hour
D < 50 miles Best possible future High frequency interurban At least 60 mph 5 or 6 per hour
E < 50 miles Best current Medium frequency interurban 60 mph 3 or 4 per hour
F < 50 miles Good current New interurban connection 45 mph 1 or 2 per hour
Any Maintain existing level of service
Outside the scope of this Market Study, will be considered in the Scotland Route Study
A/D
B/E
C/F
Between 50 and 100 miles
Between 50 and 100 miles
Between 50 and 100 miles
Route Study to determine whether to use outputs related to under 50 miles or over 100 miles
C/F
B/E
B/E B/E
B/E
B/E C/F
C/F
C/F
C/F C/F
C/F C/F
C/F
C/F
C/F
B/E
B/E
B/E A/D
A/D
A/D C/F
C/F
BB
Short distance and/or a high proportion of commuters, considered in the Regional Urban Passenger Market Study
Table 7.5 Long term service level conditional outputs for the Yorkshire and the Humber – aspirations for 2043

Network Rail Long Distance Market Study 57October 201307. Long term conditional outputs – aspirations for 2043
The above outputs are a guide for the rest of the Long Term Planning Process and should be taken to mean “as fast and frequent as operationally feasible given value for money and affordability.D
arlington
Darlington
Durham
Durham
Middlesbrough
Middlesbrough
Sunderland
Sunderland
Birmingham
Birmingham
Bristol
Bristol
Cardi�
Cardi� C E
Edinburgh
Edinburgh
Glasgow
Glasgow
Leeds
Leeds C A C C B B
Leicester
Leicester D C
Liverpool
Liverpool C C London
London B A A A A A A
Manchester
Manchester C B B B B D D AA
New
castle
Newcastle
Newcastle
Nottingham
Nottingham E C A
She�eld
She�eld C C D A D E
Key
Distance Aspiration DescriptionIllustrative service characteristics
End to end journey speed Opportunities to travel
A > 100 miles Best possible future
Best possible future
160 mph 3 or 4 per hour
B > 100 miles Best current
Best current
Very fast
Intercity 100 mph 2 or 3 per hour
C > 100 miles
Good current
Good current Interurban 80 mph 1 or 2 per hour
D < 50 miles Best possible future High frequency interurban At least 60 mph 5 or 6 per hour
E < 50 miles Best current Medium frequency interurban 60 mph 3 or 4 per hour
F < 50 miles Good current New interurban connection 45 mph 1 or 2 per hour
Any Maintain existing level of service
Outside the scope of this Market Study, will be considered in the Scotland Route Study
A/D
B/E
C/F
Between 50 and 100 miles
Between 50 and 100 miles
Between 50 and 100 miles
Route Study to determine whether to use outputs related to under 50 miles or over 100 miles
B/E
B/E
B/E B/E
B/E C
C/F
C/F
C/F C/F
B/E
B/E
A/D A/D
A/D C
B
B
B
BC B
C BAB
BBC
Short distance and/or a high proportion of commuters, considered in the Regional Urban Passenger Market Study
Table 7.6 Long term service level conditional outputs for the North East – aspirations for 2043
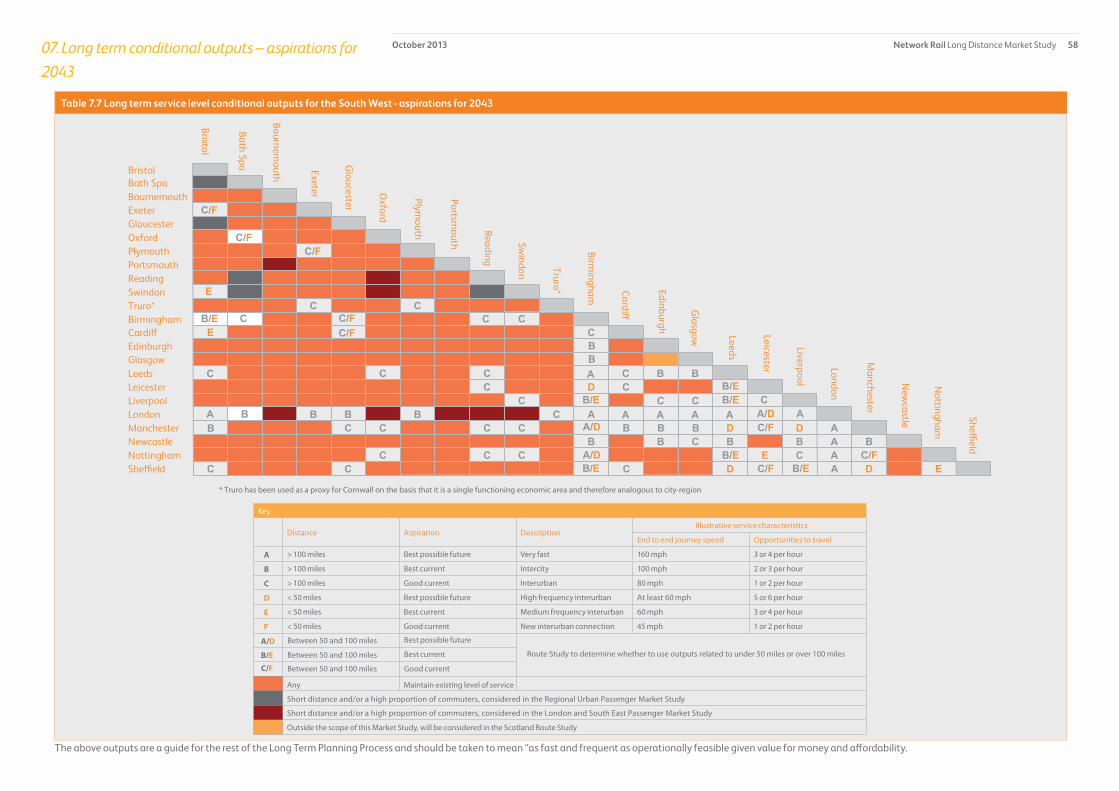
Network Rail Long Distance Market Study 58October 201307. Long term conditional outputs – aspirations for 2043
The above outputs are a guide for the rest of the Long Term Planning Process and should be taken to mean “as fast and frequent as operationally feasible given value for money and affordability.
Key
Distance Aspiration DescriptionIllustrative service characteristics
End to end journey speed Opportunities to travel
> 100 miles Best possible future Very fast 160 mph 3 or 4 per hour
> 100 miles Best current Intercity 100 mph 2 or 3 per hour
> 100 miles Good current Interurban 80 mph 1 or 2 per hour
< 50 miles Best possible future High frequency interurban At least 60 mph 5 or 6 per hour
< 50 miles Best current Medium frequency interurban 60 mph 3 or 4 per hour
< 50 miles Good current New interurban connection 45 mph 1 or 2 per hour
Any Maintain existing level of service
Outside the scope of this Market Study, will be considered in the Scotland Route Study
Short distance and/or a high proportion of commuters, considered in the London and South East Passenger Market Study
* Truro has been used as a proxy for Cornwall on the basis that it is a single functioning economic area and therefore analogous to city-region
A
B
C
D
E
F
Best possible future
Best current
Good current
A/D
B/E
C/F
Between 50 and 100 miles
Between 50 and 100 miles
Between 50 and 100 miles
Route Study to determine whether to use outputs related to under 50 miles or over 100 miles
Short distance and/or a high proportion of commuters, considered in the Regional Urban Passenger Market Study
C C C
Bath Spa
Bournemouth
Bournemouth Bath Spa
Exeter
Exeter
Gloucester
Gloucester
Oxford
Oxford
Plymouth
Plymouth C/F
C/F C/F
C/F
C/F C/F
Portsmouth
Portsmouth
Reading
Reading
Swindon
Swindon
Truro*
Truro* C C
Birmingham
Birmingham
Bristol
B/E
B/E
B/E
B/E
B/E
B/E
Cardi�
Cardi� C C C
Edinburgh
Edinburgh
Glasgow
Glasgow
Leeds Leeds C C C B B
Leicester
Leicester C D
Liverpool
Liverpool C
London
London B B B C A
Manchester
Manchester C C C C B B B D D AAA/D
New
castle
Newcastle B B C B B A B
Nottingham
Nottingham C C C E C A
She�eld
She�eld C C C D A D E
A/D
A/D
C
C
B B
C/F
E
E
Bristol
A
C/F
B/E
BBA
A A A AC
Table 7.7 Long term service level conditional outputs for the South West - aspirations for 2043
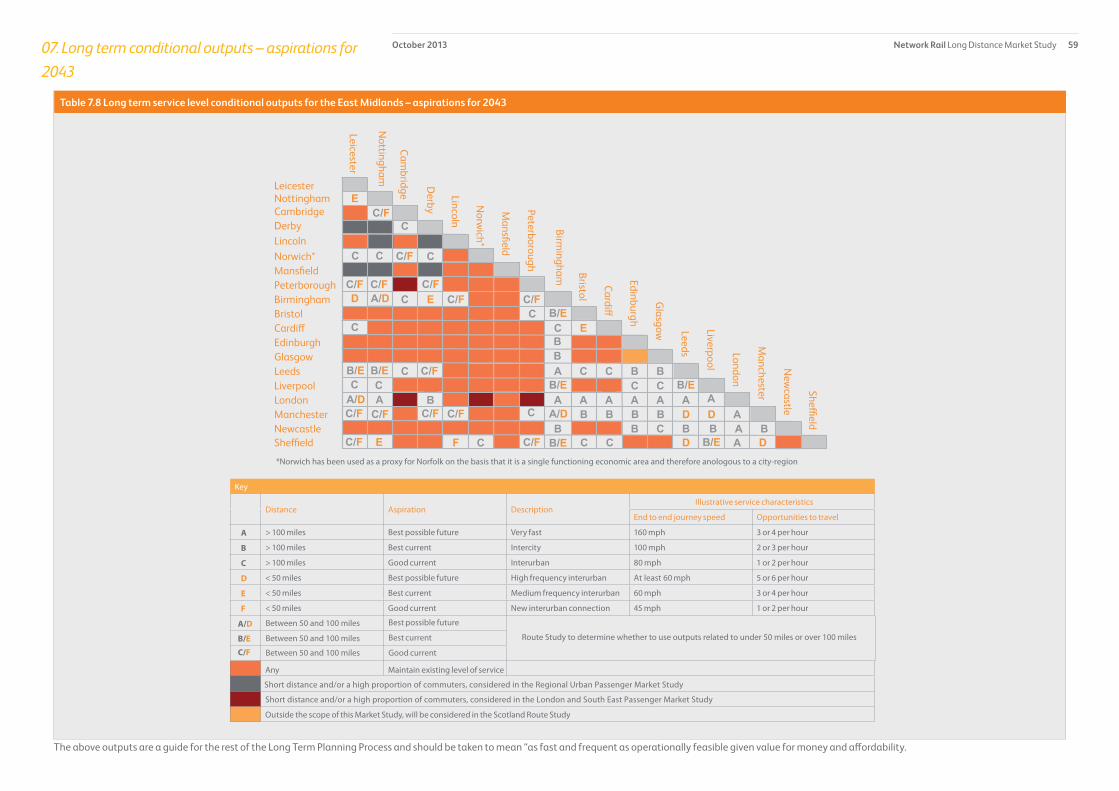
Network Rail Long Distance Market Study 59October 201307. Long term conditional outputs – aspirations for 2043
The above outputs are a guide for the rest of the Long Term Planning Process and should be taken to mean “as fast and frequent as operationally feasible given value for money and affordability.
Cambridge
Cambridge
Derby
Derby Lincoln
C
Norw
ich*
Norwich* C
Mansfield
Mansfield
Peterborough
Peterborough
Birmingham
Birmingham C C/F C/F
C/F
B/E
B/E B/E
A/D
B/E
B/E
B/E
B/E
A/DC/F
C/F
C/F C/FC/F
C/F
C/F
C/F
C/F
C
E
E
E
Bristol
Bristol C
Cardi�
Cardi� C E
Edinburgh
Edinburgh
Glasgow
Glasgow
Leeds
Leeds C C
A C C B B
Leicester
Leicester
CLiverpool
Liverpool C CLondon
London B A A A A A A
Manchester
Manchester B B B B D D A
A
A
New
castle
Newcastle B B C B B A B
Nottingham
Nottingham
F
She�eld
She�eld C C D D
Lincoln
C
C/F C/F
C
D A/D
C
C
A
BB
*Norwich has been used as a proxy for Norfolk on the basis that it is a single functioning economic area and therefore anologous to a city-region
Key
Distance Aspiration DescriptionIllustrative service characteristics
End to end journey speed Opportunities to travel
> 100 miles Best possible future Very fast 160 mph 3 or 4 per hour
> 100 miles Best current Intercity 100 mph 2 or 3 per hour
> 100 miles Good current Interurban 80 mph 1 or 2 per hour
< 50 miles Best possible future High frequency interurban At least 60 mph 5 or 6 per hour
< 50 miles Best current Medium frequency interurban 60 mph 3 or 4 per hour
< 50 miles Good current New interurban connection 45 mph 1 or 2 per hour
Any Maintain existing level of service
Outside the scope of this Market Study, will be considered in the Scotland Route Study
Short distance and/or a high proportion of commuters, considered in the London and South East Passenger Market Study
A
B
C
D
E
F
Best possible future
Best current
Good current
A/D
B/E
C/F
Between 50 and 100 miles
Between 50 and 100 miles
Between 50 and 100 miles
Route Study to determine whether to use outputs related to under 50 miles or over 100 miles
Short distance and/or a high proportion of commuters, considered in the Regional Urban Passenger Market Study
Table 7.8 Long term service level conditional outputs for the East Midlands – aspirations for 2043

Network Rail Long Distance Market Study 60October 201307. Long term conditional outputs – aspirations for 2043
The above outputs are a guide for the rest of the Long Term Planning Process and should be taken to mean “as fast and frequent as operationally feasible given value for money and affordability.
Aldershot
AldershotBournemouth
BrightonCambridge
ChathamCrawley
HastingsIpswich
LutonMilton KeynesNorthampton
NorwichOxford
PeterboroughPortsmouth
ReadingSouthampton
SouthendSwindon
WorthingCC
C
C
CC
BirminghamC
CCBristol
Cardi� C
C
C
C
EE
EdinburghGlasgow
BB
B B B B BB B B B
CC
C
ACC
CCLeedsLeicester C D CLiverpool CC
C
CC
CLondon
CCCManchester D D AAAC
AA A A A A A
NewcastleCCCCNottingham E
She�eld CCCC D A D E
New
castle
Nottingham
She�eld
Manchester
Leeds
Leicester
Liverpool
London
Bristol
Cardi�
Edinburgh
Glasgow
Bournemouth
Brighton
Cambridge Craw
ley
Chatham Hastings
Ipswich
Luton
Milton Keynes
Northam
pton
Norw
ich
Oxford
Peterborough
Worthing
Portsmouth
Reading
Southampton
Southend
Swindon
Birmingham
Key
Distance Aspiration DescriptionIllustrative service characteristics
End to end journey speed Opportunities to travel
A > 100 miles Best possible future
Best possible future
160 mph 3 or 4 per hour
B > 100 miles Best current
Best current
Very fast
Intercity 100 mph 2 or 3 per hour
C > 100 miles
Good current
Good current Interurban 80 mph 1 or 2 per hour
D < 50 miles Best possible future High frequency interurban At least 60 mph 5 or 6 per hour
E < 50 miles Best current Medium frequency interurban 60 mph 3 or 4 per hour
F < 50 miles Good current New interurban connection 45 mph 1 or 2 per hour
A/D
A/D
A/D
A/D
B/E
B/EB/E
B/E
B/EB/E
B/EB/E
B/E
C/F
C/F
C/F
C/F
C/F
C/F C/F
C/F
C/FC/F
C/F
C/F
Between 50 and 100 miles
Between 50 and 100 miles
Between 50 and 100 miles
Route Study to determine whether to use outputs related to under 50 miles or over 100 miles
Any Maintain existing level of service
Outside the scope of this Market Study, will be considered in the Scotland Route Study
Short distance and/or a high proportion of commuters, considered in the London and South East Passenger Market Study
*Norwich has been used as a proxy for Norfolk on the basis that it is a single functioning economic area and therefore anologous to a city-region
BB
Short distance and/or a high proportion of commuters, considered in the �nal Regional Urban Passenger Market Study
Table 7.9 Long term service level conditional outputs for the South East – aspirations for 2043
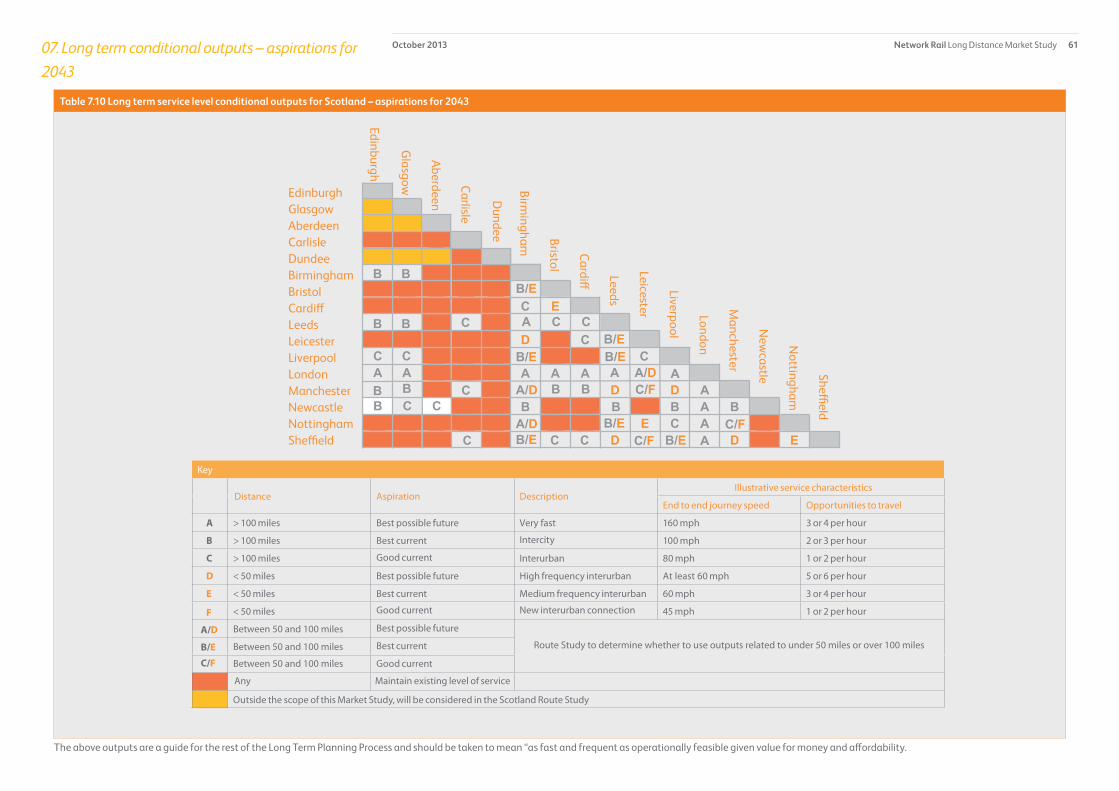
Network Rail Long Distance Market Study 61October 201307. Long term conditional outputs – aspirations for 2043
The above outputs are a guide for the rest of the Long Term Planning Process and should be taken to mean “as fast and frequent as operationally feasible given value for money and affordability.
B/E C/F
C
C/F B B
Aberdeen
Aberdeen GlasgowEdinburgh
Carlisle
Dundee Carlisle
Dundee
Birmingham
Birmingham
Bristol
Bristol
Cardi�
Cardi� C B/E
B/E
B/E
B/E B/E
B/E A/D
A/D A/D
E
Leeds
Leeds A C C
Leicester
Leicester DC
C
C
C
Liverpool
Liverpool
London
London A A A M
anchester Manchester D D A
A
AN
ewcastle
Newcastle B B B A B
Nottingham
Nottingham E C A
She�eld
She�eld C C D D E
C C/F
B/E
Glasgow
C
C
B B
BB
B
Edinburgh
BB
C
Key
Distance Aspiration DescriptionIllustrative service characteristics
End to end journey speed Opportunities to travel
A > 100 miles Best possible future
Best possible future
160 mph 3 or 4 per hour
B > 100 miles Best current
Best current
Very fast
Intercity 100 mph 2 or 3 per hour
C > 100 miles
Good current
Good current Interurban 80 mph 1 or 2 per hour
D < 50 miles Best possible future High frequency interurban At least 60 mph 5 or 6 per hour
E < 50 miles Best current Medium frequency interurban 60 mph 3 or 4 per hour
F < 50 miles Good current New interurban connection 45 mph 1 or 2 per hour
Any Maintain existing level of service
Outside the scope of this Market Study, will be considered in the Scotland Route Study
A/D
B/E
C/F
Between 50 and 100 miles
Between 50 and 100 miles
Between 50 and 100 miles
Route Study to determine whether to use outputs related to under 50 miles or over 100 miles
A A A
Table 7.10 Long term service level conditional outputs for Scotland – aspirations for 2043

Network Rail Long Distance Market Study 62October 201307. Long term conditional outputs – aspirations for 2043
The above outputs are a guide for the rest of the Long Term Planning Process and should be taken to mean “as fast and frequent as operationally feasible given value for money and affordability.
A C B A A B B A A A A
B B
C
B
Cardi�
Cardi�
North Wales Coast*
North W
ales Coast*
Swansea
Swansea
Wrexham
Wrexham
Birmingham C C/F
C/F
C/F
C/F
C/F
B/E
B/E
A/DA/D
A/D
Birmingham
Bristol E
Bristol
Crewe
Crewe
Chester E
Chester
Edinburgh
Edinburgh
Glasgow
Glasgow
Leeds C A C
Leeds
Leicester C D C
Leicester
Liverpool C E C C
Liverpool London
London
Manchester B C E B B D
C
D A
A
Manchester
Newcastle B C B C B B A B
New
castle
Nottingham E A
Nottingham
She�eld C
B
D D E
She�eld
Shrewsbury E C
Shrewsbury
Wolverhampton C B
Wolverham
pton
* North Wales Coast includes the areas of Gwynedd, Denbigh, Isle of Anglesey and Conwy. This is on the basis that it is a single functioning economic area and therefore analogous to a city-region.
Key
Distance Aspiration DescriptionIllustrative service characteristics
End to end journey speed Opportunities to travel
> 100 miles Best possible future Very fast 160 mph 3 or 4 per hour
> 100 miles Best current Intercity 100 mph 2 or 3 per hour
> 100 miles Good current Interurban 80 mph 1 or 2 per hour
< 50 miles Best possible future High frequency interurban At least 60 mph 5 or 6 per hour
< 50 miles Best current Medium frequency interurban 60 mph 3 or 4 per hour
< 50 miles Good current New interurban connection 45 mph 1 or 2 per hour
Any Maintain existing level of service
Outside the scope of this Market Study, will be considered in the Scotland Route Study
Outside the scope of this Market Study, will be considered in the Wales Route Study
A
B
C
D
E
F
Best possible future
Best current
Good current
A/D
B/E
C/F
Between 50 and 100 miles
Between 50 and 100 miles
Between 50 and 100 miles
Route Study to determine whether to use outputs related to under 50 miles or over 100 miles
B/EB/E
B/EC/F
C/F
C/F
C/F C/FC/F
B/E
B/E
C/F
BB
C
Short distance and/or a high proportion of commuters, considered in the Regional Urban Passenger Market Study
Table 7.11 Long term service level conditional outputs for Wales – aspirations for 2043

Network Rail Long Distance Market Study 63October 201307. Long term conditional outputs – aspirations for 2043
7.5 Long term conditional outputs related to capacity
Given the contribution that the provision of services to the long distance passenger market makes to the economy, the environment and the quality of life for communities and individuals, accommodating future passenger demand is an important means of delivering the strategic goals.
The conditional output related to capacity is therefore to plan to accommodate the high end of the range of growth in passenger journeys forecast to occur by 2043 as a result of background factors, and future rail investments which have funding committed and are planned for implementation in CP5. As previously set out these outputs are conditional upon value for money and affordability.
The conditional outputs have been set at this level for two reasons:
• to “plan” to accommodate this level of growth provides latitude for subsequent elements of the LTPP to consider outturn demand growth and the circumstances relating to Britain’s economy and social and environmental planning in the context of the scenarios detailed in Section 6.3. If these circumstances seem an unlikely outcome, future capacity increases can be deferred or accelerated
• failure to plan to accommodate the high end of the growth projections could impose a heavy penalty on Britain’s economic, environmental, and social wellbeing in terms of opportunities forgone.
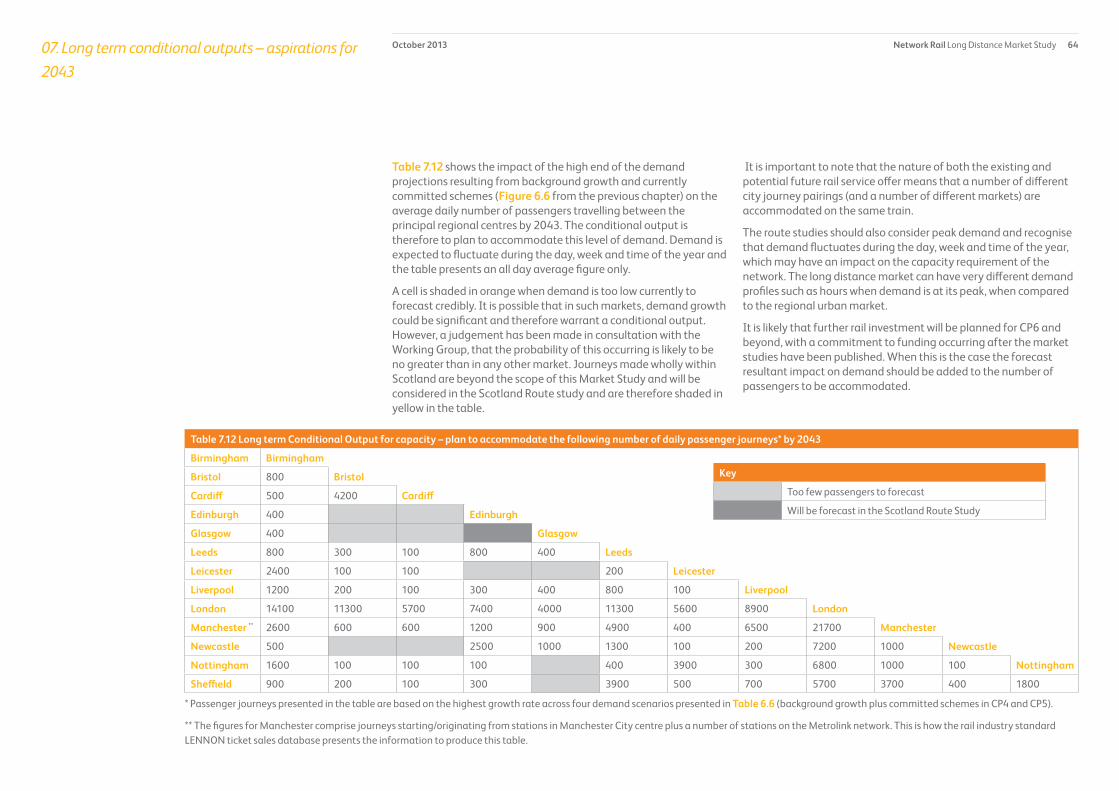
Network Rail Long Distance Market Study 64October 201307. Long term conditional outputs – aspirations for 2043
Table 7.12 shows the impact of the high end of the demand projections resulting from background growth and currently committed schemes (Figure 6.6 from the previous chapter) on the average daily number of passengers travelling between the principal regional centres by 2043. The conditional output is therefore to plan to accommodate this level of demand. Demand is expected to fluctuate during the day, week and time of the year and the table presents an all day average figure only.
A cell is shaded in orange when demand is too low currently to forecast credibly. It is possible that in such markets, demand growth could be significant and therefore warrant a conditional output. However, a judgement has been made in consultation with the Working Group, that the probability of this occurring is likely to be no greater than in any other market. Journeys made wholly within Scotland are beyond the scope of this Market Study and will be considered in the Scotland Route study and are therefore shaded in yellow in the table.
It is important to note that the nature of both the existing and potential future rail service offer means that a number of different city journey pairings (and a number of different markets) are accommodated on the same train.
The route studies should also consider peak demand and recognise that demand fluctuates during the day, week and time of the year, which may have an impact on the capacity requirement of the network. The long distance market can have very different demand profiles such as hours when demand is at its peak, when compared to the regional urban market.
It is likely that further rail investment will be planned for CP6 and beyond, with a commitment to funding occurring after the market studies have been published. When this is the case the forecast resultant impact on demand should be added to the number of passengers to be accommodated.
Table 7.12 Long term Conditional Output for capacity – plan to accommodate the following number of daily passenger journeys* by 2043
Birmingham Birmingham
Bristol
Cardiff
Edinburgh
Glasgow
Leeds
Leicester
Liverpool
London
Manchester
Newcastle
Nottingham
Bristol 800
Cardiff 500 4200
Edinburgh 400
Glasgow 400
Leeds 800 300 100 800 400
Leicester 2400 100 100 200
Liverpool 1200 200 100 300 400 800 100
London 14100 11300 5700 7400 4000 11300 5600 8900
Manchester ** 2600 600 600 1200 900 4900 400 6500 21700
Newcastle 500 2500 1000 1300 100 200 7200 1000
Nottingham 1600 100 100 100 400 3900 300 6800 1000 100
Sheffield 900 200 100 300 3900 500 700 5700 3700 400 1800
Key
Too few passengers to forecast
Will be forecast in the Scotland Route Study
* Passenger journeys presented in the table are based on the highest growth rate across four demand scenarios presented in Table 6.6 (background growth plus committed schemes in CP4 and CP5).
** The figures for Manchester comprise journeys starting/originating from stations in Manchester City centre plus a number of stations on the Metrolink network. This is how the rail industry standard LENNON ticket sales database presents the information to produce this table.

Network Rail Long Distance Market Study 65October 201307. Long term conditional outputs – aspirations for 2043
7.6 Other conditional outputs
As discussed earlier in this chapter, it is not appropriate to quantify all of the conditional outputs as they either do not relate directly to connectivity, or are too bespoke to undertake a numerate analysis. It is however important to articulate these outputs as they will both enable the positive impact of the service level and capacity based outputs detailed above, and contribute to a likely successful outcome against the strategic goals.
7.6.1 Conditional outputs related to improving access to long distance transport gateways
In recognition that not all gateways to long distance travel are located within large urban areas bespoke conditional outputs have been developed in addition to those presented above.
The industry evidence base relating to the impact of improving connectivity to/from these gateways is weaker than for travel to/from large urban areas. As a consequence the conditional outputs are at a relatively higher level than those in Section 6.4, ergo providing a framework for the Route Studies to develop further.
Three types of long distance travel gateway have been considered, namely; long distance strategic rail interchanges, major and large airports and major ports.
Long distance strategic rail interchanges. The analysis presented in Sections 6.2 – 6.4 included consideration of existing stations which attract passenger demand from a significantly greater catchment than the area in which they are located.
However, there are circumstances where improved connectivity between a sizeable and dispersed population and other stations could contribute significantly to the strategic goals. For example:
• provision of good access between the south of England and the main north-south long distance routes from London could avoid the fastest rail journey between the south of England, the north of England and Scotland involving interchange in central or inner London. For example, Old Oak Common, a major interchange station connected by High Speed 2, is likely to be a key interchange connecting the north and south of England, avoiding the need to interchange in central London. Good connections to Old Oak Common can therefore improve connectivity and end to end journey times between key economic and urban centres. In conjunction with the other conditional outputs from Section 6.4 this could result in significantly improved connectivity between these locations, and improve significantly the competitive position of rail versus car and versus the domestic airline competition to/from a number of smaller regional airports
• provision of good access between both the South West and High Speed One may improve the competitive position of rail versus short-haul European air travel. In the context of rail requiring an approximate three hour end-to-end journey time to compete with air travel this may be challenging given the economic geography in Great Britain.

Network Rail Long Distance Market Study 66October 201307. Long term conditional outputs – aspirations for 2043
A conditional output is therefore to consider where improved access to/from the long distance network could significantly strengthen the competitive position of rail versus car and/or air, in conjunction with the other conditional outputs. The conditional outputs in Tables 7.2 – 7.11 should be used to help define the level of access that is required.
Major and large airports. The UK and London are served by one major airport, Heathrow, and several other large airports including Gatwick, Manchester, Stansted, Birmingham and Glasgow. These airports provide connectivity between Britain’s cities and to international business markets, and are an important source of international access to tourist locations in Britain.
Airport policy for London and the UK is currently under review by Government. The Davies Airport Commission, due to make their final report in 2015 will be considered by the government. In particular, it is considering the various options for expanding airport capacity in order to maintain the UK’s position as Europe’s most important aviation hub. Likely scenarios to be considered could potentially include expanding Heathrow or building a new hub airport near the Thames Estuary, together with proposals for additional runway capacity at Gatwick and elsewhere.
Good rail connectivity to major and large airports is important in supporting economic growth, productivity and social mobility. It can play a key role in providing better access to markets, national and international destinations, business and leisure opportunities, and to jobs. New and improved rail services and their integration with other transport modes at major airports are key to providing more sustainable travel opportunities and improving overall connectivity. Rail is a vital ingredient in improving the travel experience and offering for passengers, employees and freight and in helping airports meet current and future travel demand.
Rail service provisions should be able to meet growing demand of accessing the airports by rail and earlier morning and later evening rail services should also be considered. As with other services in this study, key measurables are capacity, frequency, journey time and ease of transfer.
Major ports. Rail access to ports is primarily driven by freight requirements. However, ports are also large employers. Rail is not
usually an attractive mode of access for port workers, as the sheer scale of the sites often requires vehicular access within them.
A number of ports such as Southampton and Harwich port have thriving cruise operations, with passenger volumes at the former of circa 1.5 million per annum. Cruise ship capacities are typically between 2,000 and 4,000 passengers, so even with a small rail modal share, cruise passengers with luggage can present a significant use of capacity on a seasonal basis.
A number of other ports such as Liverpool have expansion plans which could benefit from improved rail passenger connectivity.
Capacity and connectivity for any rail passenger traffic to ports should be considered on a case by case basis where necessary, either within the relevant Route Study or as a standalone scheme.
7.6.2 Better connectivity for the leisure market at weekends
As discussed in Chapter 2 the busiest time for leisure travel is often at weekends, which coincides with significant engineering activities timed to minimise disruption to commuting and business passengers. Given the growing leisure market and the importance of this market to the strategic goals a conditional output is to provide the connectivity detailed in Tables 7.2 – 7.12 during the weekends. Providing sufficient capacity to accommodate demand at the weekend is important to avoid demand suppression and to reduce on-train crowding.
This will involve consideration in the Route Studies of the potential trade offs resulting from alternative engineering regimes, including an assessment of the value for money and affordability implications.

Network Rail Long Distance Market Study 67October 201307. Long term conditional outputs – aspirations for 2043
7.6.6 Conditional outputs related to competitive rail prices compared to other modes and better ticketing
It has not been possible to reach a consensus amongst stakeholders around the role of pricing except to recognise that there is a balance between using pricing to support the other conditional outputs and industry affordability. The split of rail industry funding between passengers and taxpayers is an important consideration for other industry planning activities such as the, recently published, Department for Transport (DfT’s) rail fares and ticketing review.
7.6.3 Conditional outputs related to improved access to higher education establishments and other social infrastructure
Improving accessibility to higher education establishments and social infrastructure is important to achieve the strategic goal of improving quality of life for communities and individuals. In some routes/regions, the demand for travel to these markets is high and the Route Studies will consider places where this market has a significant impact on demand and affect the level of service provision that is required to accommodate demand. Demand scenarios presented in Chapter 6 show that an increase in demand for long distance travel is predicted in some circumstances and more students are willing to travel for longer distances to gain access to education. Rail is increasingly becoming the mode of choice for students.
7.6.4 Conditional outputs related to improved passenger satisfaction
Passengers travel experiences are also important and affect mode choice, and demand for rail. The industry will continue to seek to improve station environments, the quality and consistency of rolling stock, the availability of information to passengers and where appropriate train punctuality. Rolling stock needs to meet the requirements and expectation of passengers and to enable an efficient provision of rail services.
7.6.5 Conditional outputs related to improved local access to the rail network to cater for demand
In many cases, improving access to the rail network is the equivalent of improvements to rail journey times.
Good connectivity and accessibility of rail stations are important in attracting passengers to travel by rail. The number of car park spaces need to be adequate to meet increasing demand. Good integration with local transport such as buses is also required to encourage rail travel.

Network Rail Long Distance Market Study 68October 201308. Consultation
This section outlines the consultation that has been undertaken to inform the development of this Long Distance Market Study.
8.1 Development of the process
The Long Term Planning process has taken an inclusive and consultative approach from the outset. As a new approach to industry planning, it has been important to develop the process so that it allows an opportunity for all interested stakeholders, both within, and outside the rail industry, to contribute if they are interested in influencing the rail industry’s plans for the future.
8.2 Long Distance Market Study – study development
Consultation and guidance of the work during the development of the Long Distance Market Study has been extensive and at a number of levels. There have been three key groups guiding the development of the work:
• Rail Industry Planning Group;
• Long Distance Market Study Working Group
• ‘Regional group’ Meetings
The general role of Rail Industry Planning Group has been set out in Chapter 1 above and in relation to the Long Distance Market Study, it provided strategic overview of the work and a link between the Long Term Planning Process and other industry planning processes. The Rail Industry Planning Group has met on a quarterly basis during the development of the Long Distance Market Study.
The Long Distance Market Study Working Group was established as a group to steer, challenge, and monitor progress of the work, as well as to agree to the publication of the draft and final document. It has met on an as required but broadly bi-monthly basis.
Local Group meetings have been held throughout the development of the Long Distance Market Study to ensure that local stakeholders were aware of the process, could contribute to the formulation of the strategic goals and conditional outputs as they were developed.
In addition, a large number of 1 to 1 meetings with interested parties, both within and outside the rail industry have been held to guide and develop the work.
8.3 Consultation process
The Long Distance Market Study Draft for Consultation was published on the Network Rail website on 27th March 2013. A three month consultation period on the document was held which closed on 28th June 2013.
During the consultation period, the study was discussed at a number of ‘regional’ group meetings held around the country where Local Authority, Local Economic Partnership and other interested stakeholders were briefed on the work, and informal feedback received. These groups were an important opportunity for local stakeholders to raise any queries they may have and inform their own stakeholders within their organisations and assist in focusing the responses received as part of the consultation process.

Network Rail Long Distance Market Study 69October 201308. Consultation
Common themes emerged from the consultation process. These included helpful suggestions and requests for clarification which have been reviewed and addressed within this Long Distance Market Study. Some of these clarification requests concerned the relationship of the Long Distance Market Study with the rest of the Market Studies, and, in turn, how the Market Studies relate to Route studies.
As a result the study has clarified in Chapter 7 how the individual studies relate to each other and how the Conditional Outputs set out will be used later in the process.
8.4 Consultation Responses
In total, 82 responses were received from stakeholders, and these have been categorised as shown in Table 8.1
8.5 Key themes in the consultation responses
The responses which Network Rail received were well considered and, in a number of cases, comprehensive. As a result, it is difficult to provide an individual précis of each one. Instead, some of the recurring items are summarised below.
Table 8.1 – Response categories
Response categories Number of Responses Percentage of Responses in each category
Working Group
Working Group Industry Representatives
8 10%
Department for Transport 1 1%
Scottish Government 1 1%
Welsh Government 1 1%
Transport Industry Responses
Train Operating Company 2 2%
Other Rail Industry Parties 6 7%
Passenger Transport Executives 6 7%
Airports 3 4%
Individual ResponsesMembers of Parliament 2 2%
Members of the Public 5 6%
Local Authorities, National Parks & Local Economic Partnerships
Local Authority 23 28%
Peak District National Park 1 1%
Local Economic Partnership 3 4%
Other Local Authority/Local Economic Group: Combined Response
9 11%
Campaign, User Groups & Community Rail Partnerships
Campaign Groups 2 2%
User Groups 7 9%
Community Rail Partnerships 2 2%
Total Responses 82 100%
Network Rail Long Distance Market Study 70October 201308. Consultation
Somewhat inevitably in a consultation process, it can be the case that consultee suggestions are potentially helpful but can contradict other responses. To aid understanding Network Rail has clarified how the work will be taken forward, and where respondents have supplied detailed supporting information this has been reviewed.
In general, respondents expressed support for the approach being taken by the industry in developing the Long Term Planning Process and understood the rationale for examining the various markets using the approach developed by the rail industry.
In particular, comments were received which indicated that further consideration be given to the Weekend and leisure travel market. Conditional Outputs relating to the leisure market are now detailed in Chapter 7. A number of consultees queried how the long distance market to and from towns and cities in the south east region would be considered. Table 7.9 in Chapter 7 has been included to address this point. A request was made for the study to expressly consider how rail compared to the domestic air market. Analysis on the air market is presented in Chapter 7.
A number of consultees set out a wish or rationale for higher specification Conditional Outputs, or for particular locations which were not presented in the Draft for Consultation to be considered within the Long Distance Market Study. Some of these comments were as a result of a need for further clarity on the relationship between the various market studies and the capabilities of the modelling being used, others were evidence based requests for further locations to be included. Where gaps were identified, such as between locations in the South East and elsewhere, these have been addressed in this study.
The Consultation Responses are being published on the Network Rail website alongside this study at www.networkrail.co.uk. The Long Distance Market Study Working Group wishes to offer thanks to those individuals and organisations which have taken the time to read the Long Distance Market Study Draft for Consultation, and provide considered responses to the ideas.
Next Steps
The Long Distance Market Study will become established 60 days after publication unless the Office of Rail Regulation issues a notice of objection within this period.
Planning for Control Period 6 and beyond
As detailed in Chapter 1 the output from both this and the other Market Studies will be brought together under the auspices of the Route Studies which will present the case for continuing investment in the rail sector to Governments. The Route Studies will inform plans for Control Period 6, the period from 2019 onwards. The outputs will also be used to update the Network and Route specifications published on the Network Rail website.

Network Rail Long Distance Market Study 71October 201309 Appendices
Appendix A: Methodology for selecting locations for consideration in the Long Distance Market Study.
The service level conditional outputs illustrated in Chapter 7 have focused on the largest centres of population and economic activity in Great Britain. A list of towns and cities for consideration was compiled using the locations identified as the largest functioning economic areas in the Centre for Cities, Cities Factbook 2012 , plus other locations which generate at least 1 ¾ million rail journeys per annum. This enabled the inclusion of places that attract a large rail catchment from a geographically dispersed area. The resultant list of places is shown in Table 1.
The conditional outputs for this market study only relate to the market for long distance travel. Travel between two economic centres that are both within the London and the South East area and predominately for commuting purposes are covered in the London and South East Market Study.
Norwich has been used as a proxy for Norfolk in the service level conditional outputs on the basis that it is a single functioning economic area and therefore analogous to a city region.
Conditional outputs for Truro have also been developed and they represent the wider catchment area of Cornwall.
North Wales Coast includes the areas of Gwynedd, Denbighshire, Isle of Anglesey and Conwy and acts as a single economic area, and is therefore analogous to a city region.
Birkenhead was identified in the Centre for Cities, Cities Factbook 2012 but was not presented individually in the service level Conditional Outputs matrix. Birkenhead has been included in the catchment area of Liverpool, due to its proximity.
Table 1: ‘Places’ included within Long Distance Market Study Analysis
Place Place Place
Aberdeen Edinburgh Peterborough
Aldershot Exeter Plymouth
Barnsley Glasgow Portsmouth
Bath Gloucester Preston
Birkenhead Grimsby Reading
Birmingham Halifax Rochdale
Blackburn Hastings Sheffield
Blackpool Huddersfield Shrewsbury
Bolton Hull Southampton
Bournemouth Ipswich Southend
Bournemouth Lancaster Stafford
Bradford Leeds Stoke-on-Trent
Brighton Leicester Sunderland
Bristol Lincoln Swansea
Burnley Liverpool Swindon
Cambridge London Telford
Cardiff Luton Truro
Carlisle Manchester Wakefield
Chatham Mansfield Walsall
Chester Middlesbrough Warrington
Coventry Milton Keynes Wigan
Crawley Newcastle Wolverhampton
Crewe North Wales Coast Worcester
Darlington Northampton Worthing
Doncaster Norwich Wrexham
Dundee Nottingham York
Durham Oxford
Network Rail Long Distance Market Study 72October 201309 Appendices
This approach estimates the relationship between economic output and business to business connectivity. As the cost of travel between locations reduces, businesses are more likely to engage with each other. This increases business opportunities between regions and leads to increased economic activity.
Measuring Connectivity
Connectivity between two locations is measured by the generalised cost of travel by all modes of transport. Generalised cost is the total cost of travel including the price paid to travel, plus a monetised estimate of the total journey time. The Planet Strategic Model1 (PSM) zoning structure has been used to define these places and their monetised cost of travel.
Decay Curve
The starting point for this analysis is the data illustrated in Figure 1 This is the cumulative proportion of travel undertaken in the long distance market for business purposes, as the generalised cost of travel increases. It assumes that people are averse to high cost and journey time and the proportion of travel undertaken decreases as generalised cost increases. This is taken as a proxy for people’s willingness to travel.
The data suggests that when the time and cost of travel between businesses is very high (e.g. for journeys of three hours or more) most people do not travel to undertake business interactions. The demand impact of a small change in journey times on the level of business activity undertaken between urban centres of three or more hours apart is therefore relatively small. Whereas when the time and cost of travel between businesses is moderate (e.g. for journeys of around 90 minutes) a significant number of people travel to undertake business interactions and activities such as business meetings. Finally, when the time and cost of travel between businesses is low (e.g. for journeys of 30 minutes or less) more people are likely to travel to undertake business interactions.
1 Planet Strategic Model is a rail demand forecasting model which contains data on generalised cost of travel and mode share. The model is part of the suite of Planet models which is managed by the Department for Transport.
Appendix B: Methodology for developing connectivity based conditional outputs
In all three passenger market studies, analysis was undertaken to assess the impact of rail services on three identified strategic goals that are common across the three markets:
• enabling economic growth
• reducing carbon and the transport sectors’ impact on the environment
• improving the quality of life for communities and individuals.
The assessment of the fourth strategic goal, affordability and value for money, has not been undertaken as it will be considered in the subsequent Route Studies.
The following sections detail the assessment undertaken for each passenger market study. The approach outlined in this appendix is only one way to quantify the impact of connectivity improvements and there are other ways to develop the conditional outputs. The approach uses data such as mode share information from the Planet Strategic Model that is commonly used by the rail industry and the Department for Transport. The principles and methodology are compliant with the transport appraisal guidance set out by the Department for Transport.
B1 Long Distance Market Study
Analysis of the impact of rail services on strategic goals was undertaken to help to develop the conditional outputs for the Long Distance Market. Sections B1.2 to B1.5 summarise the methodology used.
B1.1 Assessment of the economic impact of rail service levels
The assessment of the economic impact of improvements to long distance rail services is based on the approach developed from a succession of publications on the subject such as the Eddington Transport Study 2006, the ongoing Network Rail Northern Hub programme, Prioritising Investment to Support our Economy, Network Rail 2010, the Department for Transport’s (DfT) WebTAG appraisal guidance and Transport Scotland’s (TS) STAG appraisal guidance.
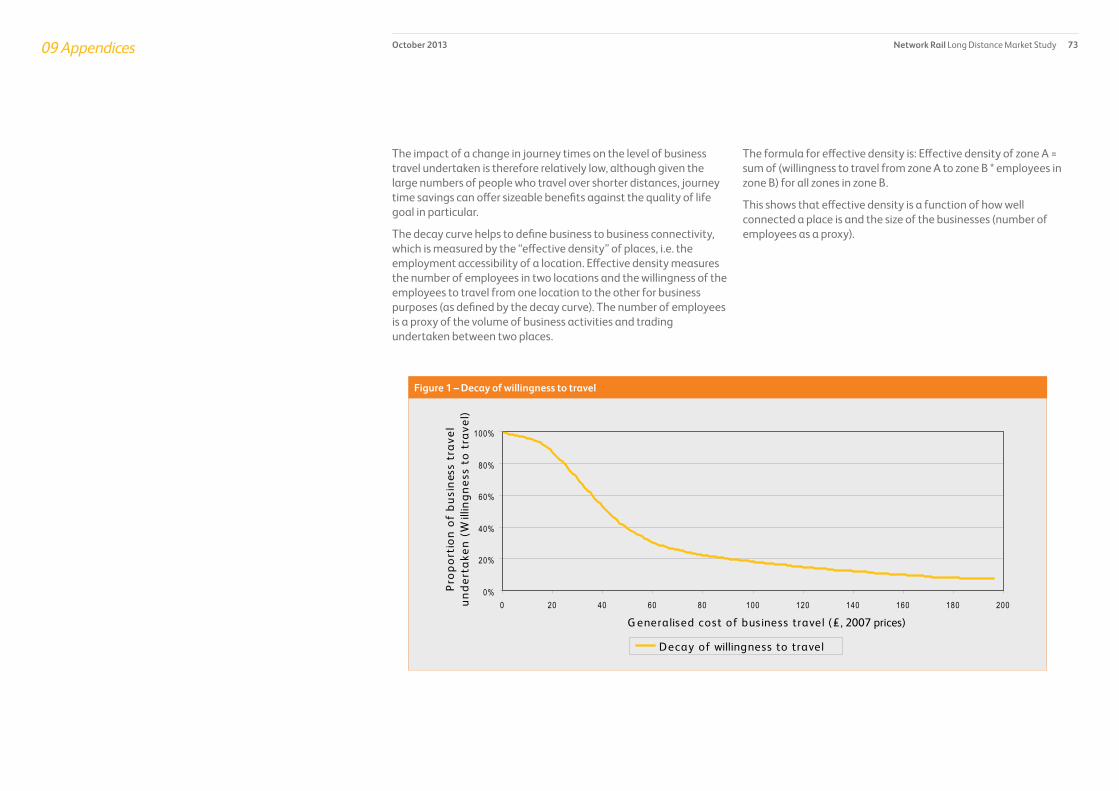
Network Rail Long Distance Market Study 73October 201309 Appendices
The formula for effective density is: Effective density of zone A = sum of (willingness to travel from zone A to zone B * employees in zone B) for all zones in zone B.
This shows that effective density is a function of how well connected a place is and the size of the businesses (number of employees as a proxy).
The impact of a change in journey times on the level of business travel undertaken is therefore relatively low, although given the large numbers of people who travel over shorter distances, journey time savings can offer sizeable benefits against the quality of life goal in particular.
The decay curve helps to define business to business connectivity, which is measured by the “effective density” of places, i.e. the employment accessibility of a location. Effective density measures the number of employees in two locations and the willingness of the employees to travel from one location to the other for business purposes (as defined by the decay curve). The number of employees is a proxy of the volume of business activities and trading undertaken between two places.
0%
20%
40%
60%
80%
100%
0 20 40 60 80 100 120 140 160 180 200
G eneralised cost of business travel (£, 2007 prices)
Pro
po
rtio
n o
f b
usi
nes
s tr
ave
l u
nd
erta
ken
(W
illin
gn
ess
to t
rave
l)
Decay of willingness to travel
Figure 1 – Decay of willingness to travel
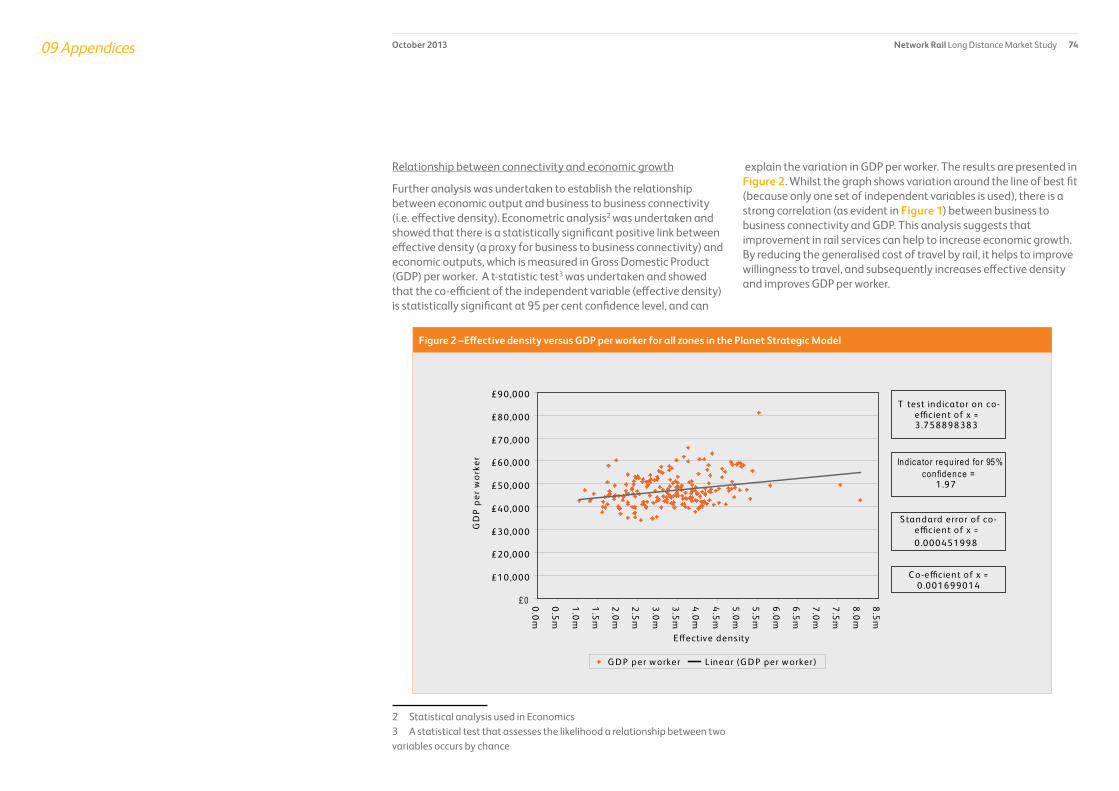
Network Rail Long Distance Market Study 74October 201309 Appendices
explain the variation in GDP per worker. The results are presented in Figure 2. Whilst the graph shows variation around the line of best fit (because only one set of independent variables is used), there is a strong correlation (as evident in Figure 1) between business to business connectivity and GDP. This analysis suggests that improvement in rail services can help to increase economic growth. By reducing the generalised cost of travel by rail, it helps to improve willingness to travel, and subsequently increases effective density and improves GDP per worker.
Relationship between connectivity and economic growth
Further analysis was undertaken to establish the relationship between economic output and business to business connectivity (i.e. effective density). Econometric analysis2 was undertaken and showed that there is a statistically significant positive link between effective density (a proxy for business to business connectivity) and economic outputs, which is measured in Gross Domestic Product (GDP) per worker. A t-statistic test3 was undertaken and showed that the co-efficient of the independent variable (effective density) is statistically significant at 95 per cent confidence level, and can
2 Statistical analysis used in Economics3 A statistical test that assesses the likelihood a relationship between two variables occurs by chance
£0
£10,000
£20,000
£30,000
£40,000
£50,000
£60,000
£70,000
£80,000
£90,000
0.0
m
0.5
m
1.0
m
1.5
m
2.0
m
2.5
m
3.0
m
3.5
m
4.0
m
4.5
m
5.0
m
5.5
m
6.0
m
6.5
m
7.0
m
7.5
m
8.0
m
8.5
m
E �ective density
GD
P p
er w
ork
er
G D P per w orker L inear (G D P per w orker)
T test indicator on co-e�cient of x = 3 .758898383
Ind ica to r requ ired fo r 95% confidence =
1.97
S tandard error of co-e�cient of x =0.000451998
C o-e�cient of x =0.001699014
Figure 2 –Effective density versus GDP per worker for all zones in the Planet Strategic Model

Network Rail Long Distance Market Study 75October 201309 Appendices
The next step is to calculate the change in effective density as a result of the changes in generalised cost. The coefficient estimated from the relationship between GDP and effective density is then applied to calculate the impact of rail improvements on GDP.
Figure 3 shows the flow diagram of how the economic impact is calculated.
Calculation of the impact of rail service improvements on economic growth
To estimate the impact of service improvement on GDP, the new generalised cost of travel is calculated, which takes account of changes in journey time, frequency, interchange penalty and mode share. The proportion of people willing to travel is estimated from the Decay Curve which shows that the proportion of people prepare to travel changes with movement along the decay curve.
Generalised cost foreach pair of “zones” in Planet Strategic Model,
by all modes of transport
Number of trips made Proportion of people willing to travel,
by all modes of transport
Decay curve for commuting
(as shown in Figure 1)
New generalised cost(as a result of rail
service improvement)and new mode share
New willingness to travel (move alongthe Decay curve
in Figure 1)
Change inwillingness to travel
Number of employees New e�ective densityCoe�cient from the relationship
between GDP and e�ective density as shown in Figure 2
Impact of rail improvementon GDP per worker
Figure 3– Method to calculate the impact of rail service levels on economic growth

Network Rail Long Distance Market Study 76October 201309 Appendices
The impact of a rail improvement on modal shift from road or air to rail was also estimated. A modal choice model was calibrated to estimate the size of modal shift of all modes to rail, given the improvement in rail services. It assumed the generalised cost of travel for different modes from the Planet Strategic Model8. A negative relationship between the generalised cost of travel by rail and the market share of rail was established, meaning that as the cost of travel by rail increases, it becomes a less attractive mode to use. The elasticity of rail demand to changes in generalised cost of rail for each level of market share was then calculated to estimate the number of new rail journeys induced by the rail service improvement shown in Table 7.1 in chapter 7. Values of time sourced from Department for Transport’s and Transport Scotland’s Transport Appraisal Guidance were then applied to half9 of the new rail users to represent the quality of life improvement to new passengers. Figure 4 shows the flow diagram for the calculation of value of time improvement to existing and new rail passengers.
8 Planet Strategic Model is a rail demand forecasting model which contains data on generalised cost of travel and mode share. It is managed by the Department for Transport. 9 In accordance with DfT and TS’s webTAG (Transport Appraisal Guidance) which uses the rule of 50% for the calculation of time saving benefit to new rail users
B1.2 Assessment of the impact of rail service levels on the quality of life for communities and individuals
The impact of rail service improvements on quality of life for individuals and communities are assessed to determine the service level conditional outputs. This assessment quantifies the impact of service improvements on the existing and new rail passengers, in terms of value of time spent travelling.
Improvements in the rail service provision are reflected through changes in the generalised cost of travel4 (GC) between economic centres illustrated in Appendix A. The generalised cost includes the price paid to travel and the monetised cost associated with the generalised journey time5 (GJT) which takes into account time spent in a vehicle, service frequency and interchange. The assessment compares the current GC experienced by existing rail passengers with the GC associated with each service level shown in Table 7.1 in Chapter 7.
The number of existing rail journeys between each place and their corresponding GJT is sourced from MOIRA6. The values of time7 for business and leisure workers are then applied to calculate the benefits in time saving, which represents the quality of life improvement to existing rail passengers.
4 Generalised cost is the total cost of travel including the price paid to travel, plus a monetised estimate of the total journey time including time spent waiting for a train and changing trains.5 Generalised journey time (GJT) represents journey time, frequency of service and interchange in a single term and is expressed in equivalent (minutes or hours) of journey time.6 A rail demand forecasting model that contains rail ticket sales data and train timetables.7 Sourced from DfT’s WebTAG (Transport Appraisal Guidance on the web) and Transport Scotland’s (TS) STAG
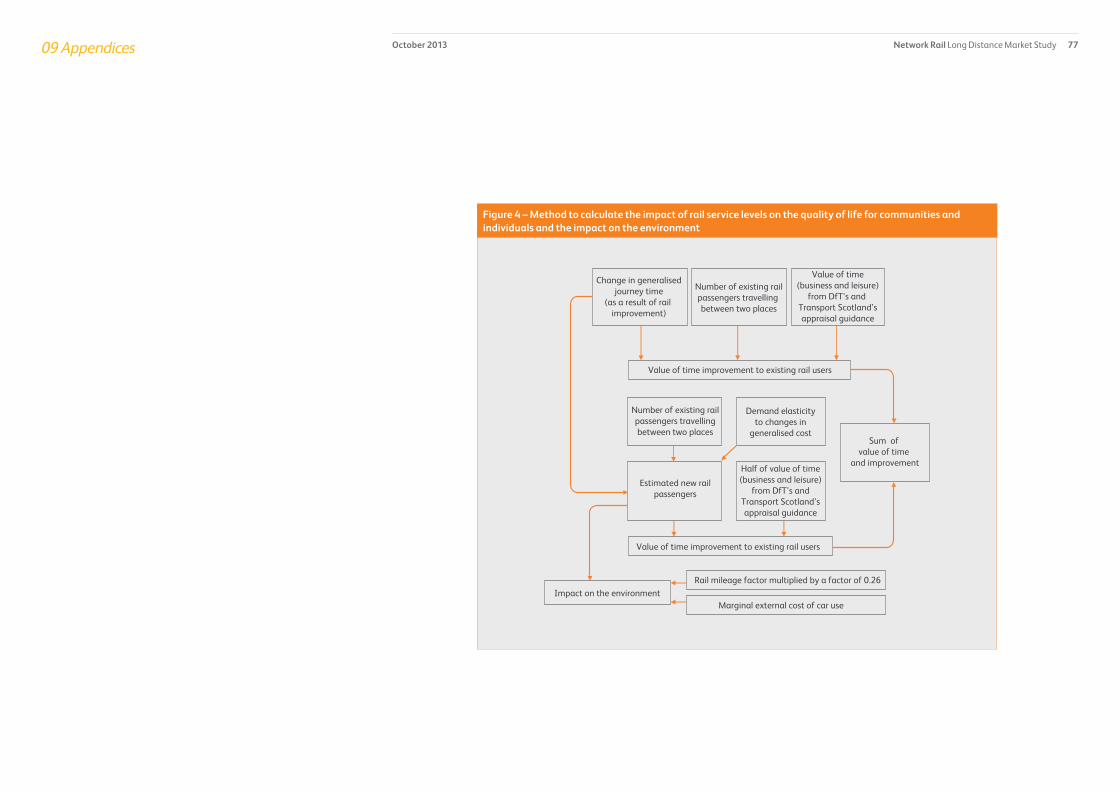
Network Rail Long Distance Market Study 77October 201309 Appendices
Change in generalisedjourney time
(as a result of rail improvement)
Number of existing railpassengers travelling between two places
Value of time(business and leisure)
from DfT’s and Transport Scotland’sappraisal guidance
Value of time improvement to existing rail users
Value of time improvement to existing rail users
Number of existing railpassengers travellingbetween two places
Demand elasticityto changes in
generalised cost
Estimated new railpassengers
Half of value of time(business and leisure)
from DfT’s andTransport Scotland’sappraisal guidance
Sum of value of time
and improvement
Impact on the environmentRail mileage factor multiplied by a factor of 0.26
Marginal external cost of car use
Figure 4 – Method to calculate the impact of rail service levels on the quality of life for communities and individuals and the impact on the environment
Network Rail Long Distance Market Study 78October 201309 Appendices
The benefit from improving rail service from today to “Best Possible Future” against each strategic goal criteria (Sections B1.1 - B1.3) was calculated. In the second iteration, the “Best Current” conditional outputs (i.e. B or E) was assigned to each place and similarly its benefit from improving rail service from today was quantified. This enables the calculation of the marginal impact of improving the service provision from “Best Current” to “Best Possible Future” for each place. They were then ranked in descending order. Places that generate values (or marginal benefits) above the boundary as illustrated in Table A2 were assigned the conditional output of “Best Possible Future”. Places that are below the first boundary will then go through the next iteration of calculating the marginal benefit of improving from “Good Current” to Best Current”. Again places that generate marginal benefit above the second boundary are assigned the “ Best Current”. Those below the boundary will go through the next iteration of estimating the marginal benefit from improving the today’s services to “Good Current”. Table A2 summarises the boundary for each strategic goal assessment. The boundary between the aspired service levels was based on the discussions with both the Working Group and Regional Groups, and the resultant outputs represent the position that stakeholders viewed as most appropriate.
The results of the three quantitative assessments are treated equally and the service aspiration was set against the maximum performing indicator. For example, if connecting two cities with the best possible service aspiration were shown to generate a low economic benefit but a high environmental benefit the latter was used to set the aspired level of service.
B1.3 Assessment of the environmental impact of rail service levels
The impact of improving rail services on the environment is assessed by estimating the volume of modal shift to rail and the associated impact on road de-congestion and the environment.
The assessment of the quality of life impact detailed in Section B1.2 has identified the number of new rail journeys abstracted from road and the associated benefits on value of time saving to new rail users. The abstraction of journeys from road to rail also helps to relieve road congestion and benefit the environment through a reduction in noise and greenhouse gas emissions.
The environmental benefit associated with each service level is monetised by multiplying the amount of road mileage removed (as a result of modal shift) by the marginal external cost10. The amount of road mileage removed is estimated by multiplying the number of new rail journeys by the average mileage of the new trip and by a factor11 of 0.26, which reflects the occupancy rate and distance .
Analysis shows that places that benefit most in terms of environmental impact are likely to be where rail has the potential to capture a large share of a large total market for travel. Rail also has the greatest potential to increase its market share where rail journey times are currently similar or longer than by car.
B1.4 How the connectivity based conditional outputs are determined
A series of iterations were undertaken to estimate the marginal benefits of rail service improvements under each quantitative assessment.
In the first iteration, each place was assigned the “Best Possible Future” conditional output (i.e. Service level of A or D as presented Table 7.1 in Chapter 7).
10 Sourced from DfT’s WebTAG (Transport Appraisal Guidance on the web) and Transport Scotland’s (TS) STAG11 In accordance with DfT’s and TS’s WebTAG
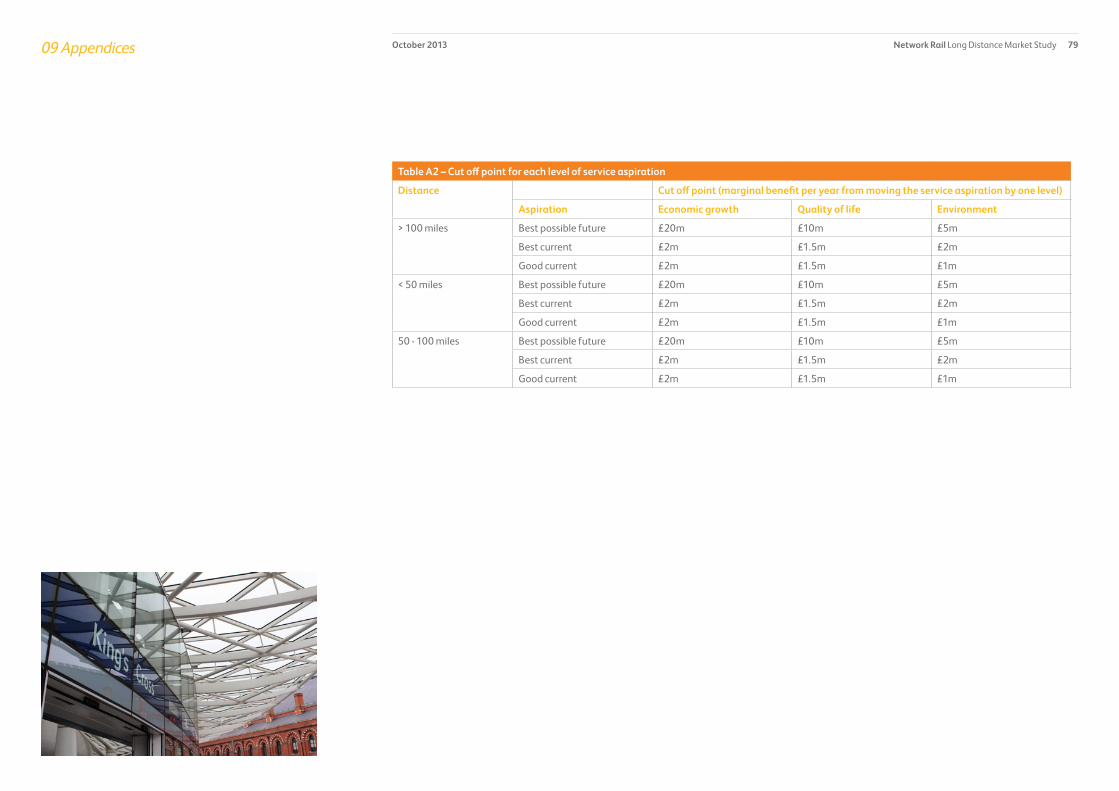
Network Rail Long Distance Market Study 79October 201309 Appendices
Table A2 – Cut off point for each level of service aspiration
Distance Cut off point (marginal benefit per year from moving the service aspiration by one level)
Aspiration Economic growth Quality of life Environment
> 100 miles Best possible future £20m £10m £5m
Best current £2m £1.5m £2m
Good current £2m £1.5m £1m
< 50 miles Best possible future £20m £10m £5m
Best current £2m £1.5m £2m
Good current £2m £1.5m £1m
50 - 100 miles Best possible future £20m £10m £5m
Best current £2m £1.5m £2m
Good current £2m £1.5m £1m
Network Rail Long Distance Market Study 80October 201309 Appendices
• Stage three. A short list of factors from stage one was compiled for each market study, intended to cover the factors which are likely to have a dominant impact on passenger demand in each market. (One of the factors on the London and South East Market Study short list, for example, is the projected future change in central and inner London employment).
The future level of each factor in each shortlist was set at a level that is commensurate with the circumstances articulated by each scenario from stage two. For example, central and inner London employment is highest in the Prospering in Global Stability Scenario, next highest in the Prospering in Isolation, Struggling in Global Turmoil and Struggling in Isolation Scenarios.
The selected levels for each factor under each scenario were discussed with the Working Groups.
A demand model or modelling suite was then developed separately for each market study, as the characteristics of each market, and hence the short list of factors, vary.
The Long Distance Market Study uses two models:
• The first model uses estimates of people’s propensity to travel over long distances given the characteristics of their household (e.g. household income). The number of each type of household in each location (zone1) in the model is varied in accordance with the level of the factors from the shortlist which affect household composition (e.g. National Income). The output of this model is an estimate of the total market for travel between all zones in the model, by all modes of transport
• The second model allocates this demand to the available modes of long distance transport. This mode split is estimated using a number of factors from the shortlist, including the cost of travel by each mode. Again, these factors vary by scenario.
The Regional Urban Market Study also uses a market size model and a market share model as the basis for the long term demand
1 The model comprises 235 zones based around the functioning economic
areas in Great Britain
Appendix C Summary of demand forecasting methodology
Each of the passenger market studies contains a detailed explanation of the forecasting methodology undertaken to produce their respective long term demand scenarios. The purpose of this appendix is therefore to provide a brief summary of the methodologies from all three studies, so that the reader can understand the similarities and differences between them.
The aim of the market studies is to develop an understanding of how rail can make a successful long term contribution to the key priorities of current and potential future rail industry funders. Identifying the appropriate role of rail in the context of these long term priorities requires extension of Network Rail’s previous demand projections to a 30-year time horizon. This is because many common major railway infrastructure components, such as track systems, have an asset life of around 30 years. Decisions to change the capability of the network therefore require an understanding of the likely usage of it over this time period to maximise the value and useful life of the investment, and to capitalise on the significant opportunity for improved outputs available at the point where infrastructure systems fall due for renewal.
Demand forecasting over such a long term period represents a considerable challenge and a three-stage approach has been undertaken to develop these long term demand projections:
• Stage one. The extensive body of industry research on rail demand was reviewed to identify and group the likely factors that determine the number of people who travel by rail. Over 20 sub-categories of factor were identified, (for example the population of Great Britain and its regions, and the cost of travel by rail)
• Stage two. A series of potential alternative futures for Great Britain was postulated which would result in differences in these factors. These futures were articulated as four scenarios, (Prospering in Global Stability, Struggling in Global Turmoil, Prospering in Isolation, Struggling in Isolation).
Stages one and two are common to all three passenger market studies.
Network Rail Long Distance Market Study 81October 201309 Appendices
the end of Control Period 5 (March 2019). These changes are assumed as committed, in that rail industry funders have committed to make the necessary funding available.
The impact of other potential schemes has not been included in the projections, although the Long Distance Market Study presents an assessment of the potential demand impact if all of the conditional outputs were delivered.
Demand forecasts are often a contentious subject, particularly given their impact on a number of high-value industry financial transactions such as passenger franchise agreements, and the forecasts produced in the three market studies have generated significant debate amongst the various study Working Groups, and amongst stakeholders generally.
Every endeavour has been made to achieve a consensus amongst the study Working Groups, but ultimately, the figures presented represent Network Rail’s professional opinion based upon the best available evidence. The Market Study documents are careful to explain the assumptions used where any limitations occur within the available data or selected modelling approach.
The documents also provide guidance as to how the figures should be interpreted, and how they should be used in subsequent stages of the Long Term Planning Process. Since the forecasts do not include the impact of rail service changes which are yet to be committed, they should not be viewed as the maximum potential for growth over the 30 year period considered. Further improvements to service changes will almost certainly result in additional growth in passenger journeys. It is recommended that readers of the market study documents consider this when comparing the demand projections with historic demand growth.
projections. These models, which cover the functioning economic area around Leeds, use a similar approach to the Long Distance modelling, albeit with more disaggregate data and model zoning.Data limitations made it impossible to repeat this modelling exercise for the other city regions covered by the Regional Urban Market Study in the time available. Instead, the range of demand projections from the Leeds model were fitted around the central demand forecasts from the most recent Route Utilisation Strategies (RUSs) for the other city regions. This process was based on both a comparison of the characteristics of these locations with Leeds, and extensive discussions with the stakeholders who represent these places.
The London and South East Market Study used a spreadsheet model to apply the factors from the shortlist to the external factors forecasting framework detailed in the Passenger Demand Forecasting Handbook (PDFH). The resultant, corridor-by-corridor2, demand projections were fitted around the central demand forecasts from the London and South East Route Utilisation Strategy.
This approach was taken as the London and South East RUS projections were produced using the London Transport Study and Railplan transport modelling suite, which includes all forms of public transport, such as the London Underground and Docklands Light Railway, as well as national rail services. This is the most appropriate software to estimate the London-wide impact of major impending service changes such as Thameslink Key Output Two, and Crossrail.
A review and update of the modelling assumptions used in the RUS forecasts was undertaken in preference to a re-run of the LTS/Railplan, as the train service specifications for both projects are still in the planning stage.
The ensuing long term demand projections for the three passenger markets are an estimate of the demand for rail travel as a result of background growth (the factors from stage one) plus the impact of changes to services that are scheduled for implementation before
2 Rail corridors into each central London terminus station
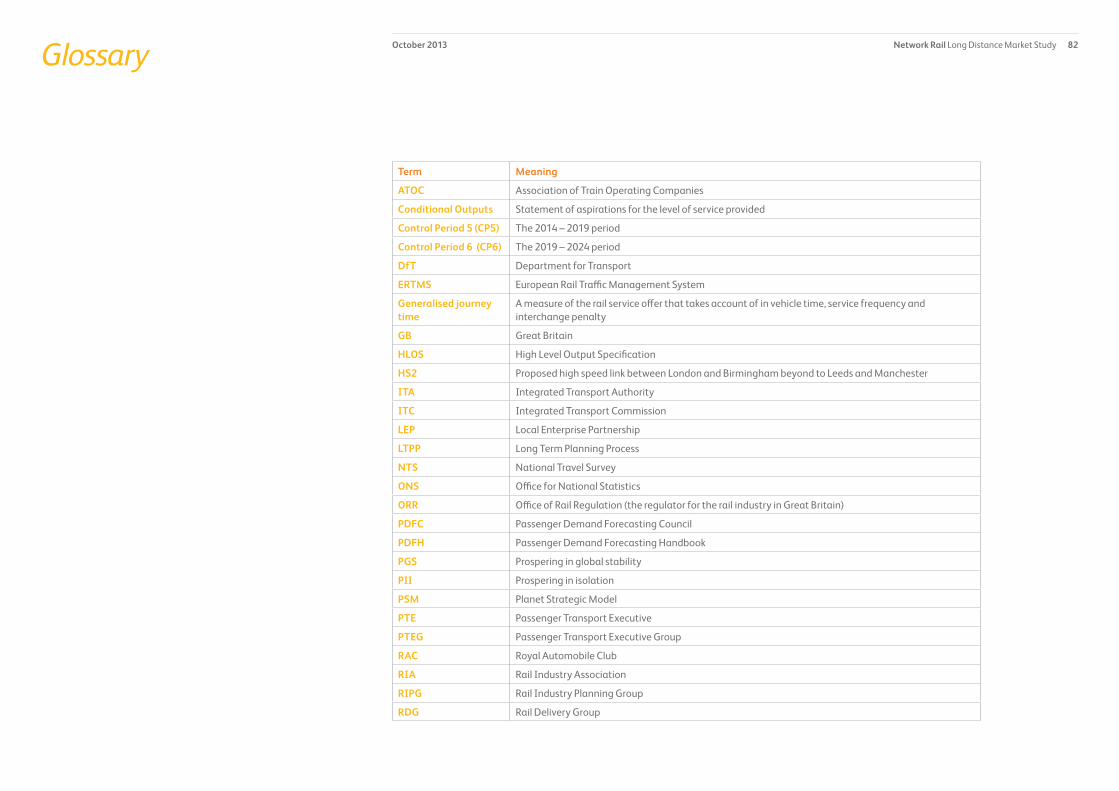
Network Rail Long Distance Market Study 82October 2013Glossary
Term Meaning
ATOC Association of Train Operating Companies
Conditional Outputs Statement of aspirations for the level of service provided
Control Period 5 (CP5) The 2014 – 2019 period
Control Period 6 (CP6) The 2019 – 2024 period
DfT Department for Transport
ERTMS European Rail Traffic Management System
Generalised journey time
A measure of the rail service offer that takes account of in vehicle time, service frequency and interchange penalty
GB Great Britain
HLOS High Level Output Specification
HS2 Proposed high speed link between London and Birmingham beyond to Leeds and Manchester
ITA Integrated Transport Authority
ITC Integrated Transport Commission
LEP Local Enterprise Partnership
LTPP Long Term Planning Process
NTS National Travel Survey
ONS Office for National Statistics
ORR Office of Rail Regulation (the regulator for the rail industry in Great Britain)
PDFC Passenger Demand Forecasting Council
PDFH Passenger Demand Forecasting Handbook
PGS Prospering in global stability
PII Prospering in isolation
PSM Planet Strategic Model
PTE Passenger Transport Executive
PTEG Passenger Transport Executive Group
RAC Royal Automobile Club
RIA Rail Industry Association
RIPG Rail Industry Planning Group
RDG Rail Delivery Group
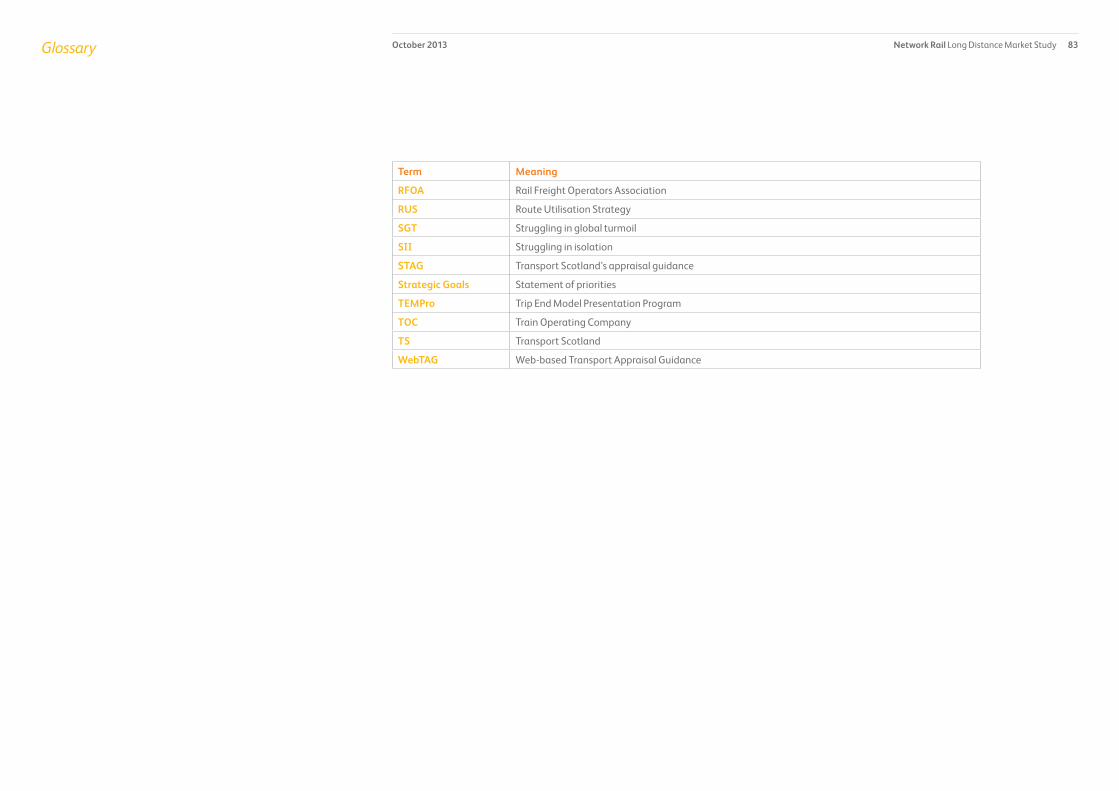
Network Rail Long Distance Market Study 83October 2013Glossary
Term Meaning
RFOA Rail Freight Operators Association
RUS Route Utilisation Strategy
SGT Struggling in global turmoil
SII Struggling in isolation
STAG Transport Scotland’s appraisal guidance
Strategic Goals Statement of priorities
TEMPro Trip End Model Presentation Program
TOC Train Operating Company
TS Transport Scotland
WebTAG Web-based Transport Appraisal Guidance

Network RailKings Place 90 York Way London N1 9AG
www.networkrail.co.uk