Embed Size (px)
Citation preview
1
Long Term Storage Effect of 0.2M Dithiothreitol on Red
Cell Antigen Integrity on Stored Reagent Red Blood Cells
2
ABSTRACT
BACKGROUND: Treating reagent red cells with 0.2M dithiothreitol (DTT) removes drug
interference due to daratumumab and allows for the detection of underlying alloantibodies.
This study aimed to investigate the effect of DTT-treatment on reagent red cell antigen integrity
over a period of time.
STUDY DESIGN AND METHODS: Twelve aliquots of human sourced plasma, each containing an
antibody of a single, known specificity, were tested against untreated and 0.2M DTT-treated
reagent screen cells for a 28 day period. Hemolysis and serological antibody reaction strengths
were observed.
RESULTS: Red cell antigen integrity remained serologically detectable on the DTT-treated cells
throughout the entire 28 day study, despite a greater degree of observed hemolysis.
CONCLUSION: Long term storage of 0.2M DTT-treated reagent red cells does not appear to
compromise antigen integrity. Advanced DTT-treatment and storage of a large aliquot of screen
cells may serve to increase efficiency in the transfusion service.
3
INTRODUCTION
Targeted drug therapy involving the use of monoclonal antibodies to treat malignancies
is becoming increasingly popular; such drugs are highly specific to the intended target cell. One
such drug, daratumumab (DARA), is currently being used to treat patients with refractory or
relapsed multiple myeloma. DARA works by binding to CD38 on plasma cells and inducing
apoptosis—programmed cell death—via a variety of immune mediated mechanisms.1;2-3
Human CD38 contains six disulfide bonds and is strongly expressed on plasma cells.
Additionally, smaller, varying amounts of CD38 are also expressed on red cells; in cancer
patients, this expression is also increased.4 Considering the variation in density expression of
CD38 on red cells, it is believed that anti-CD38 drugs, such as DARA, only bind to those cells
sufficiently expressing surface CD38.5 However, anti-CD38 drugs pose a problem for the
transfusion service in that they may cause a number of drug-induced false positives, including
positive direct antiglobulin tests (DAT) and panreactivity in eluates and in indirect antiglobulin
tests (IAT). Such results can prolong compatibility testing and delay delivery of suitable blood
products for patients requiring transfusion.1-2;4-5
Currently, there are several methods available to resolve this panagglutination. The anti-
CD38 in the patient’s plasma can be neutralized with recombinant human soluble CD38 or
mouse anti-DARA idiotype prior to testing against reagent red cells.4 Alternatively, reagent red
cells can be treated with sulfhydryl reagents, such as 0.2M dithiothreitol (DTT) or 2-
mercaptoethanol (2-ME). These chemicals cleave the disulfide bonds in the CD38 molecule and
denature protein, resulting in complete suppression of CD38 catalytic activity. One side effect
of DTT-treating reagent red cells to remove the CD38 activity is that blood group systems
4
containing disulfide bonds will equally be destroyed. Another option is the use of trypsin, which
also disrupts the extracellular domain of CD38. However, it is less efficient than DTT and also
disrupts more blood group antigens than does DTT.4;6;7 This study focused on DTT treatment of
reagent red cells in order to eliminate panagglutination in the IAT phase of compatibility
testing. Specifically, we wanted to see if long-term storage of DTT-treated reagent red cells
would affect antigen reactivity strength over time.
Currently, our transfusion service’s protocol for patients with a recent history of
receiving DARA and whose plasma demonstrates panagglutination is to treat small quantities of
screen cells with 0.2M DTT immediately prior to use and retest the patient’s plasma against the
DTT-treated screen cells in order to confirm the presence or absence of underlying
alloantibodies. Since each treatment of screen cells requires a 30-45 minute incubation prior to
use for testing, the transfusion service in question would potentially like to DTT treat a larger
batch of screen cells in advance of testing that can be stored for a specified period of time (i.e.
7 days). However, there is currently no documentation regarding the serological detection of
antigens on DTT-treated reagent red cells undergoing extended storage. In order to validate the
use of such cells, it is necessary to demonstrate that the various antigens on reagent red cells
will be serologically detectable at 2+ or greater reactivity using current testing methods for the
proposed extended time frame. Having a previously prepared set of 0.2M DTT-treated screen
cells immediately available to technologists would eliminate the need to DTT-treat small
quantities of cells for each antibody identification, reduce antibody identification turnaround
time by 30-45 minutes, and increase efficiency in the transfusion service.
5
MATERIALS AND METHODS
Study Length
Both DTT treated and untreated cells were tested daily for 28 days.
Plasma specimens
Human sourced plasma was used to test against both untreated and 0.2M DTT-treated
reagent cells. Plasma sources included both donor plasma and hospitalized patients containing
a single antibody specificity. Plasma containing antibodies of single specificities previously
identified and confirmed by serological means were collected and stored at -20°C prior to the
start of the study. For less commonly identified antibodies, plasma from multiple sources,
including both patients and donors, were pooled to ensure an adequate amount of plasma was
available for the duration of the study.
A volume of 12 mL of plasma was required to perform 28 days of daily quality control
and testing against DTT-treated and untreated red cells. A deadline was given for finding
plasmas containing the various antibody specificities. After this deadline, those specificities that
were not located or did not meet the required quantity were eliminated from further
consideration in the study. When pooling plasmas, ABO blood group was ignored since only
group O reagent cells were used for quality control and the study itself. Each plasma specimen
was divided into small, 0.5mL aliquots, appropriately labeled, and stored frozen at -20°C prior
to the start of the study.
Once enough plasma of a single, antibody specificity was collected, positive and
negative controls were performed to confirm that adequate reactivity levels of antibody were
detected in each plasma specimen and no reactivity was detected when that same plasma was
6
tested against a cell negative for the antigen. If an antibody in a plasma specimen was found to
be nonreactive with the positive control, new plasma from a different source of the same
antibody specificity was collected and controls rerun. If a plasma specimen was found to be
reactive with a negative control, antibody identification was performed on it to confirm that it
did not contain another clinically significant antibody to a common antigen. Antibody strength
was initially tested against Immucor reagent cells positive and negative for the specified
antigen. Positive controls consisted of a presumed single dose of the antigen being tested,
while negative controls lacked the antigen specific to the antibody in the plasma. Controls were
performed using a Polyethylene Glycol (PeG) enhancement technique and IAT, since this was
the only method with which the antigen reactivity in the DTT-treated and untreated cells were
to be studied.
Storage of Plasma Specimens
Once a plasma specimen passed this initial control testing, 28 small aliquots were
prepared for frozen storage at -20°C. Each aliquot contained enough plasma (0.5mL) to conduct
one day’s worth of quality control and reagent red cell testing. The purpose of the aliquots was
to avoid daily thawing and freezing of each antibody, which might contribute to antibody
integrity degradation.8
Antigens studied
Plasma containing antibodies produced against antigens from four of the nine classic
independent blood group systems were used for the study: D, C, E, c, e; M, S, s; Fya, Fyb; Jka, Jkb.
No plasma containing antibodies to the Kell blood group system were tested since 0.2M DTT
destroys these antigens.7
7
DTT treatment of reagent RBCs
Panoscreen I, II, and III reagent screen cells (Immucor, Norcross, Georgia, USA) were
used for the study. These cells consisted of R1R1, R2R2, and rr Rh phenotypes as well as
presumed double dose examples of M, N, S, s, Fya, Fyb, Jka, and Jkb. An adequate volume of
0.2M DTT—enough to treat the total volume of reagent red cells that were used for the
duration of the study—was prepared according to methodology described in the AABB
Technical Manual.9 A separate set of screen cells from the same lot of reagent screen cells was
left untreated and tested in parallel with the 0.2M DTT-treated cells. The 0.2M DTT was created
by dissolving 1 gram of DL-1,4-Dithiothreitol, 99% (Acros Organics, Fisher Scientific, Fair Lawn,
New Jersey, USA) into 32mL of phosphate buffered saline (PBS) with a pH of 8.0.
Since a large aliquot of reagent red cells was treated all at once, the volume was split
over several tubes so that the entire volume of cells in each tube could incubate properly in the
heating block. After incubation was complete, cell aliquots were washed one time with PBS,
removing as much of the supernatant as possible without disturbing the cells, and four volumes
of 0.2M DTT were added, mixed, and incubated at 37°C for 45 minutes. After incubation, the
cells were washed at least four times with PBS. All treated aliquots of cells were returned to the
original manufacturer’s bottle from which they came, and prepared as a 2-5% suspension using
Red Blood Cell (RBC) Storage solution (Immucor, Norcross, Georgia, USA) as the diluent.
Monoclonal anti-K (Immucor, Norcross, Georgia, USA) was used to confirm the absence of the K
antigen from K positive DTT-treated cells and thus confirm successful treatment of the reagent
cells.
8
Storage of reagent RBCs
Upon successful treatment with 0.2M DTT, reagent screen cell aliquots were stored as a
2-5% cell suspension in RBC Storage Solution at 2-4°C. The untreated reagent cells were also
stored in the RBC storage solution at 2-4°C for consistency. Hemolysis of treated and untreated
cells was noted prior to daily testing. Daily testing was performed regardless of the degree of
hemolysis present, since the tubes were tested using a PeG enhancement technique and only
read at the IAT phase.
Detection of RBC antigen
For each plasma aliquot, quality control was performed daily prior to testing against the
DTT-treated and untreated reagent cells. Quality control consisted of testing each plasma
specimen against a presumed single dose expression of the antigen corresponding to that
antibody specificity (positive control) as well as testing against a cell negative for the antigen
corresponding to each plasma specificity (negative control). Reactivity strength of 1+ or greater
in the positive control and no reactivity in the negative control was considered acceptable for
the plasma to be used for that day’s testing. Plasma not meeting acceptable quality control
criteria was discontinued from further testing in the study.
Upon acceptable daily quality control results, each plasma specimen was tested against
a presumed double dose of antigen for both the untreated and treated reagent cells using the
PeG IAT method described in the AABB Technical Manual. All cells were incubated for 15
minutes at 37°C and then washed four times prior to adding monoclonal anti-IgG (Immucor,
Norcross, Georgia, USA). Negative reactions were confirmed by the addition of IgG coated red
cells (Immucor, Norcross, Georgia, USA).
9
Detection of Hemolysis
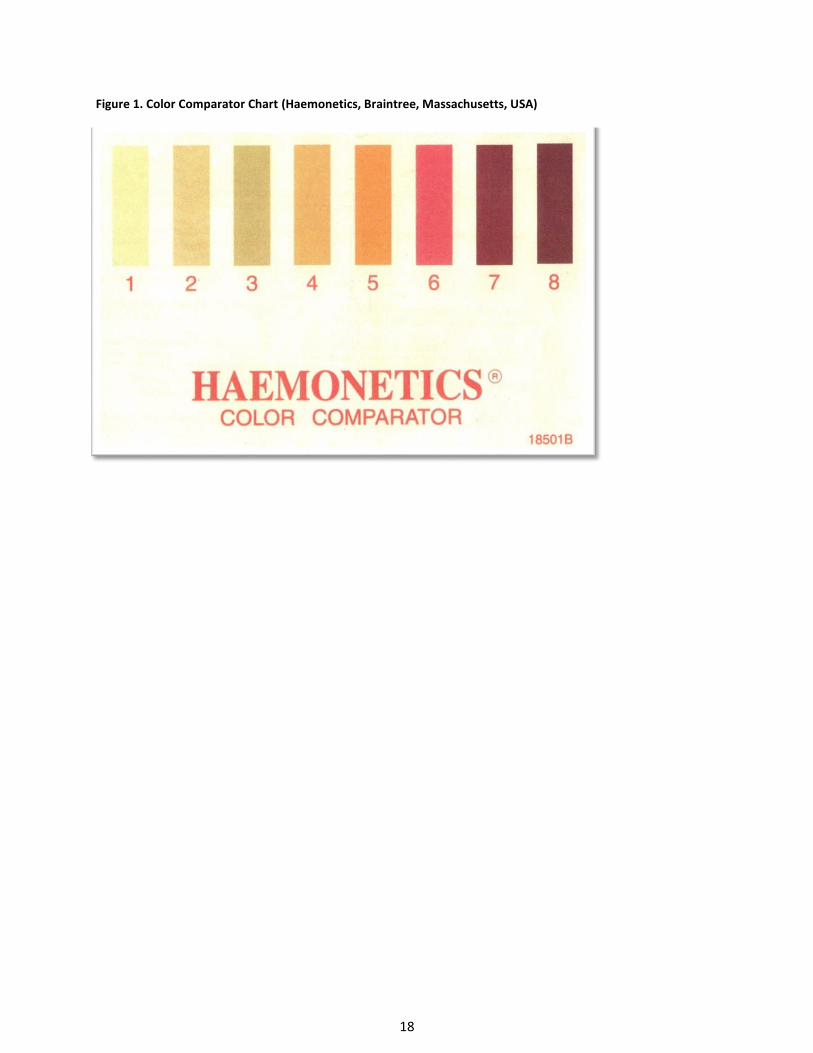
In order to provide a somewhat objective and qualitative measurement of hemolysis
observed, a color comparator chart (Figure 1) was used each day prior to performing quality
control testing to “grade” the degree of hemolysis observed in the diluent of the untreated and
DTT-treated cells. Baseline readings on the first day of testing (day 0) were graded a 4 for both
the untreated and DTT-treated cells as this color on the chart most closely resembled the
diluent color. Considering the untreated cells were never altered from how the manufacturer
produced them and considering the manufacturer has quality standards of its own in place, the
baseline grade of 4 was considered to be the equivalent of no visible hemolysis in the diluent.
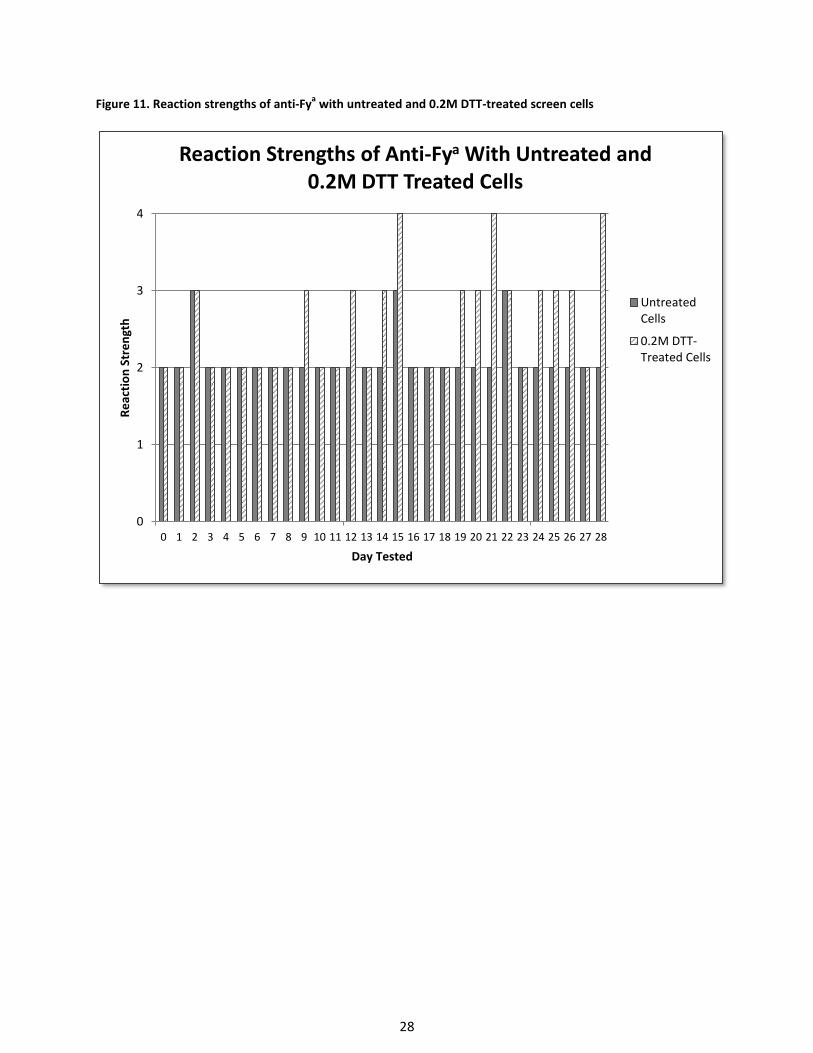
RESULTS
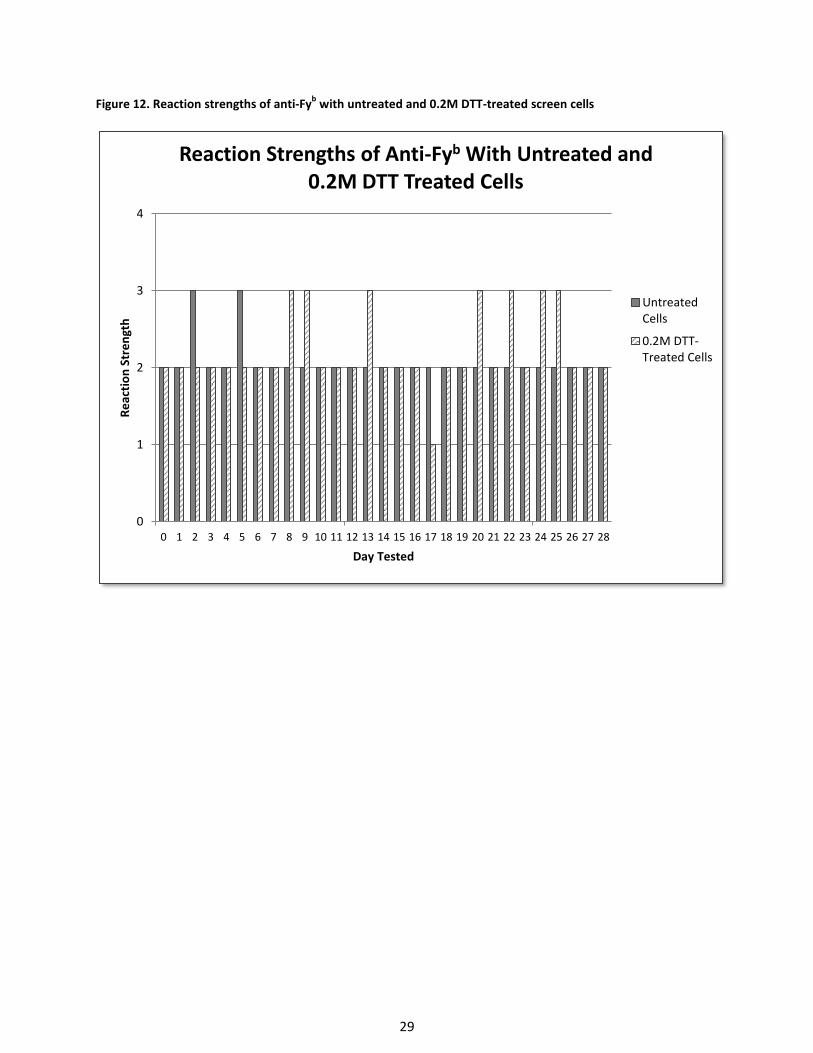
The goal of this study was to assess the surface antigen integrity of various red cell
antigens on red cells treated with 0.2M DTT over a period of time. Twelve different red cell
antigens were evaluated for reactivity strength against untreated and 0.2M DTT-treated red cell
antigens. The general trend among all plasma tested was that antibody reactivity persisted on
DTT-treated cells with all antigens tested for the duration of the study. Additionally, antibody
reactivity with DTT-treated cells demonstrated reactivity strength that was either equal to or
stronger than the reactivity strength of the untreated cells. The results for each plasma
specificity are documented in Figures 3 through 14.
Overall, there was very little difference in reactivity strength between untreated and
DTT-treated cells for antigens not affected by DTT. In most instances, the DTT-treated cells
reacted slightly more strongly. There was noticeably more hemolysis with the DTT-treated cells

10
over time compared to the untreated cells (Table I). None of the antibodies produced reactivity
strengths of less than 1+ with the untreated or DTT-treated cells during the study.
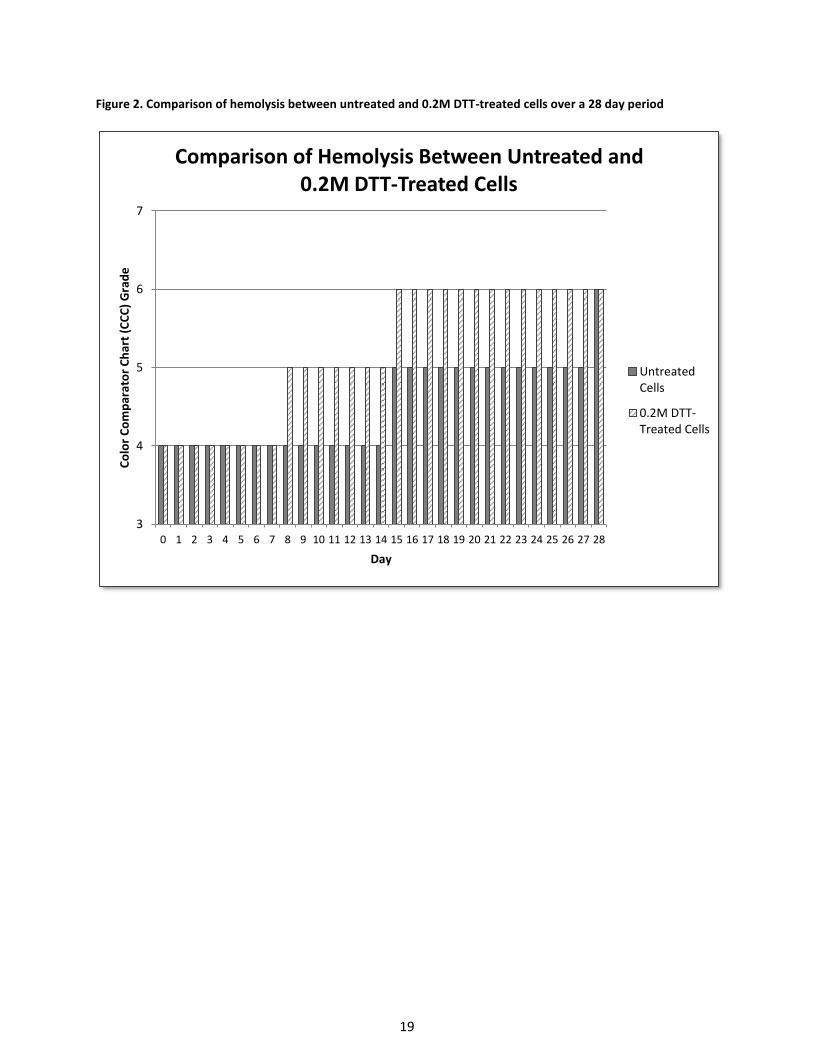
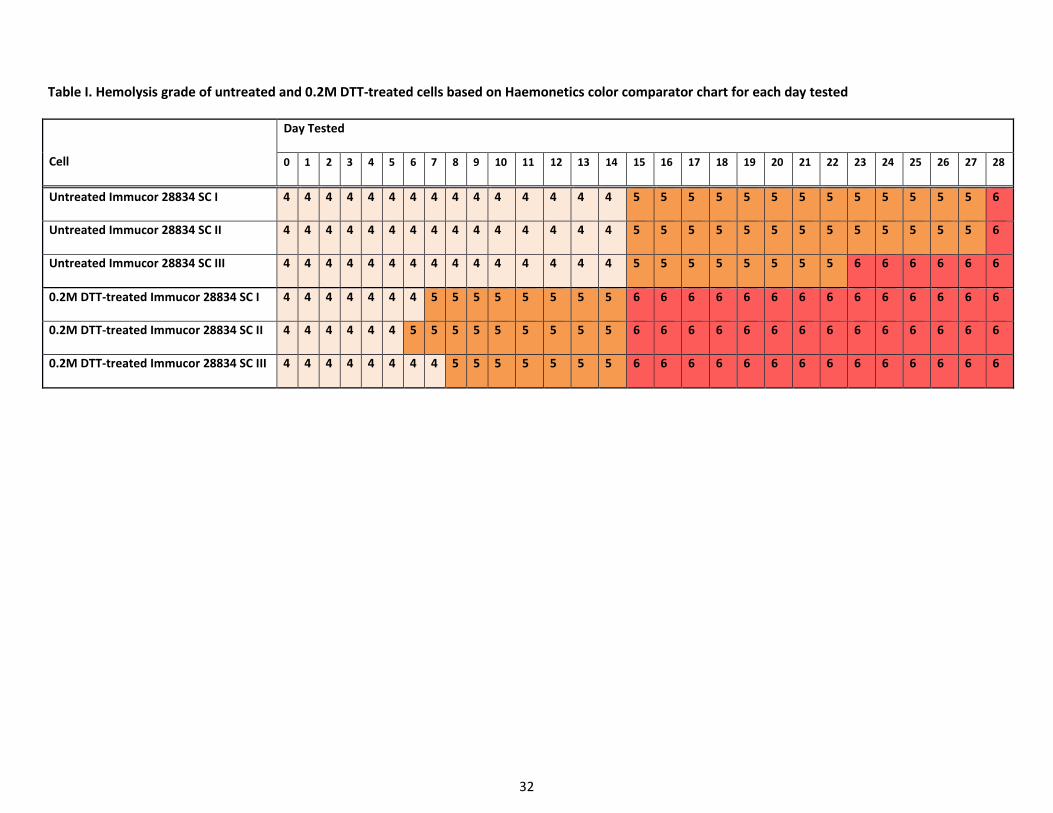
Hemolysis Observed
Both sets of screen cells maintained a grade of 4 (no visible hemolysis) through day 5
(Table I). On day six, very slight hemolysis was observed in DTT-treated screen cell II and this
was given a grade of 5, since the diluent most closely resembled a 5 color shade on the color
comparator chart. DTT-treated screen cells I and III continued to be graded a 4 on this day. For
each day, the average of the three screen cells determined the overall hemolysis grade given
(Figure 2). Up until day six, the averages of the three untreated screen cells and three DTT-
treated screen cells were 4 for both sets. For day six, the average for the untreated screen cells
remained a 4, but the average for the three DTT-treated screen cells was (4+5+4)÷3 = 4.67,
which was rounded up to 5. On day six, both DTT-treated screen cells I and II were given a 5
grade and on day 8, all three DTT-treated screen cells were at 5, making the average a 5 as well.
The untreated screens did not begin to show very slight visible hemolysis (grade 5) until
day 15, 22 days before the manufacturer’s documented expiration date. By this point, the DTT-
treated cells were a grade 6. By day 28, nine days before manufacturer’s documented
expiration date, both the untreated screen cells and the DTT-treated screen cells were a grade
6, which was the equivalent of visual gross hemolysis.
Cell Button Size
Cell button size was, not surprisingly, directly proportional to the degree of hemolysis
observed. A noticeably smaller button size was first observed in the DTT-treated cells on day
eight (grade 5.) By day 11, the button size was obviously smaller. However, since controls
11
continued to perform as expected, the cells continued to be tested using this assumed lighter
suspension. No attempt was made to remove some of the diluent so as to bring the cell
suspension up to 2-4%.
By day 15, there was noticeable red cell stroma surrounding cell buttons, to the point
that the buttons appeared to consist of 50% stroma and 50% intact red cells. At this point, it
was decided to add two drops cell suspension to two drops plasma and two drops PeG. Adding
the second drop of cells caused the cell button to have a cell button size resembling that of the
2-4% suspension that was still being observed in the untreated cells. Daily controls continued to
work as expected despite this addition of a second drop of red cell suspension and no false
negatives were observed.
Plasma Antibody Reactivity Strength in Quality Control Testing
The anti-Jkb plasma reactivity demonstrated a 1+ reaction on the first day of testing (day
0) with the positive control when incubated with PeG for 15 minutes at 37°C against a single
dose of Jkb antigen. When anti-Jkb control testing was performed in this same manner on day 1,
the reaction strength was less than 1+. As a result, incubation time for anti-Jkb was increased
from 15 minutes to 30 minutes at 37°C. The increased incubation time resulted in the positive
control reacting 1+ and was thus acceptable for continued use in the study, so long as the
incubation time for the untreated and DTT-treated cells was also 30 minutes at 37°C.
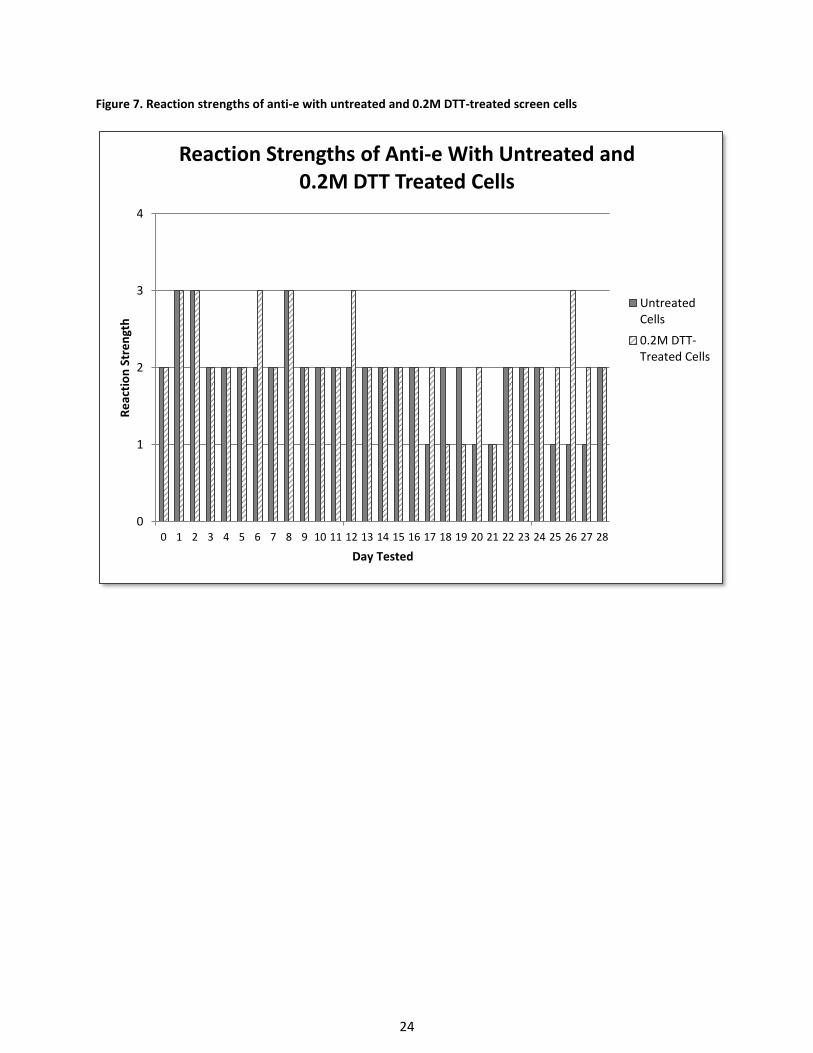
On days 14 and day 15, respectively, the anti-e and anti-M plasma demonstrated
reaction strengths weaker than 1+ with the positive control and the same procedure that was
used with the weak reacting anti-Jkb plasma was used with the weak reacting anti-e and anti-M
plasma. After a 30 minute incubation at 37°C, the reaction strength of the positive control for
12
each plasma at IAT was 1+ and thus the both plasma specimens were acceptable for use with
the test cells.
Plasma Antibody Reactivity with the Study Cells
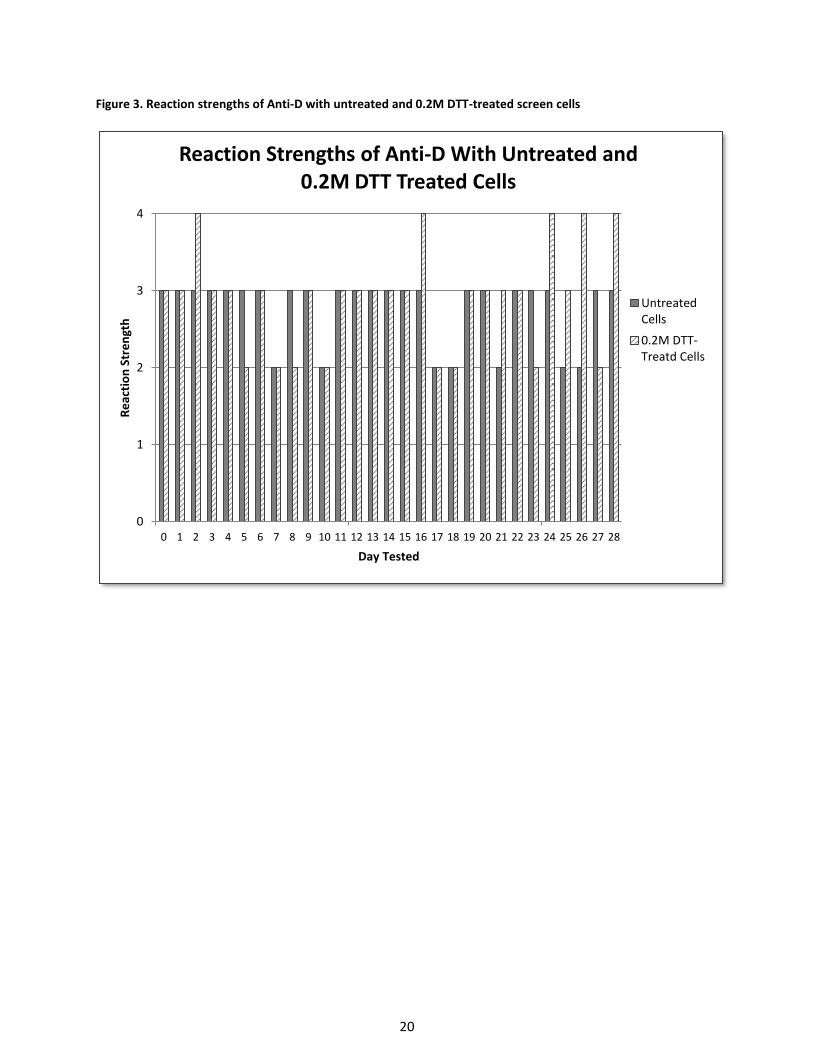
The anti-D plasma reacted consistently with the untreated cells for the duration of the
study with an average reaction strength of 3+ and occasional 2+ reactions (Figure 3). Anti-D
reactivity with the DTT-treated cells also demonstrated a 3+ reactivity strength average with
occasional 2+ reactions, but on five different days, 4+ reactions were observed, with three of
those 4+ reactions occurring during the last five days of the study and thus revealing an upward
trend.
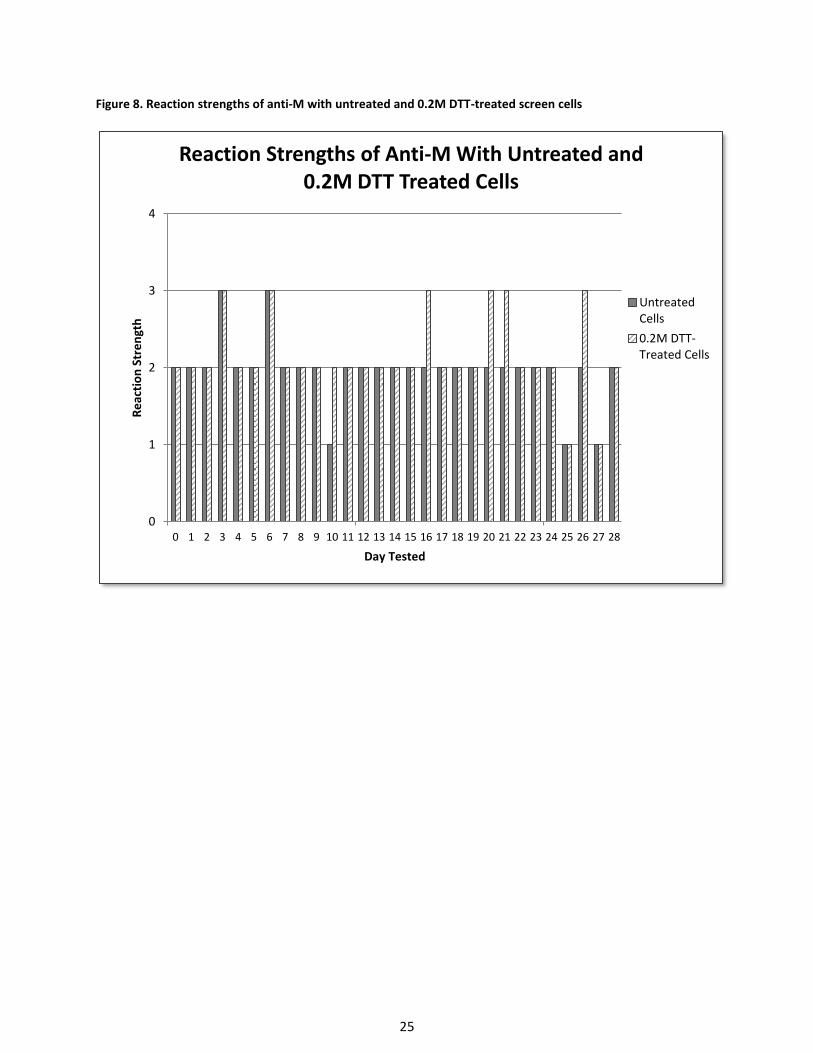
As with the anti-D plasma, the anti-M plasma also reacted consistently with the
untreated cells with an average reactivity strength of 2+ (Figure 8). However, anti-M reactivity
with the DTT-treated cells demonstrated a slightly downward trend. This may be partially due
to a combination of the DTT treatment and the fact that the M antigen can deteriorate in
storage.7
Anti-Jkb was the weakest-reacting antibody out of all the plasma specimens used in the
study. This might be due to a combination of this particular plasma being a weak example of
the antibody and the fact that antibodies to Kidd antigens tend to deteriorate in storage.7;10
Anti-Jkb reactivity with untreated cells never exceeded a 2+ reaction (Figure 14) whereas, anti-
Jkb reactivity with DTT-treated cells occasionally reacted 3+. On days where there was a
difference in the reaction strength with anti-Jkb between the untreated and DTT-treated cells,
the DTT-treated cells always reacted stronger than the untreated cells.
13
DISCUSSION
The treatment of disease using monoclonal antibodies appears to be a promising new
technology for patients with conditions where such a treatment is currently an option.
However, as with the case of drug interference due to DARA, these drugs are still capable of
binding to other cells never intended to be the targeted cell of interest simply because they
contain small amounts of the drug’s targeted cell marker. This drug-cell marker interaction
results in interference with compatibility testing in the transfusion service. Depending on the
cell marker’s biochemical structure, the interference can be removed via chemical manipulation
of the red cells prior to testing with patient plasma. In the case of DARA, treating reagent red
cells with 0.2M DTT destroys the disulfide bonds that make up the CD38 marker, rendering it
nonfunctional and thus not recognizable by anti-CD38, and alleviating interference with
compatibility testing. The long term effects of DTT treatment on red cell antigen integrity,
however, has received little investigation, most likely because red cells are typically tested
immediately following DTT treatment and acceptable quality control testing.
This study demonstrated that long term storage of 0.2M DTT treated reagent red cells
does not compromise antigen red cell integrity. In fact, when a PeG enhancement technique is
used, the antibody reacts more strongly with the DTT-treated red cells than with untreated
cells. However, since DTT-treatment does destroy some blood group antigens (namely Kell
blood group system), this method opens up the possibility of missing an antibody to a clinically
significant high prevalence antigen associated with one of these destroyed blood groups. This
issue can be somewhat resolved by testing the patient’s neat plasma with human umbilical cord
blood that has been confirmed positive (serologically or molecularly) for a high prevalence
14
antigen associated with one of these DTT-destroyed blood groups, such as k (KEL2) or Kpb
(KEL4). Cord blood contains small enough amounts of CD38 that it does not result in
interference with DARA.11 For other, lower incidence antigens within these blood group
systems, such as K (KEL1), antigen negative blood can easily be acquired from the donor
population and be given to those patients who are capable of making the antibody. Ideally, the
patient should be molecularly genotyped prior to beginning DARA treatment.4;11
One aspect that was not taken into consideration for this study was a cost analysis of
treating cells on an “as needed” basis using individually prepared aliquots of 0.2M DTT-treated
cells versus using 0.2M DTT-treated cells that were prepared in advance of testing as part of a
much larger batch and stored appropriately prior to use. For an immunohematology reference
laboratory or a transfusion service in a large hospital setting, preparing DTT-treated cells in
advance and storing them until needed could potentially increase the efficiency of laboratorian
time. DTT treatment of red cells requires a 30-45 minute incubation at 37°C.9;12 Spending 30-45
minutes preparing a fresh batch of DTT-treated screen cells each time they are required versus
spending 30-45 minutes periodically making a large quantity of DTT treated cells that can be
accessed multiple times throughout the week could prove to be more efficient in a transfusion
service that frequently requires such cells.
In conclusion, this study showed that red cell antigens resistant to 0.2M DTT treatment
persisted on the red cell surface for 28 days with little to no weakening when a PeG
enhancement technique was used. Plasma reactivity strength of 2+ or greater with the DTT-
treated cells was achieved for at least 7 days. This finding introduces the possibility of the
transfusion service storing previously prepared DTT-treated reagent screen cells for a defined
15
period of time until needed for antibody identification. Hemolysis was greater in DTT-treated
cells that were the same age as untreated cells, but this aspect is negligible if the cells are
tested using a PeG enhancement technique. Treating a large batch of cells with 0.2M DTT offers
an opportunity to increase the efficiency of antibody identification by reducing time spent
performing special techniques on individual specimens.
16
REFERENCES
1. DARZALEX (daratumumab) Package Insert Darzalex package insert. Horsham, PA: Janssen
Biotech, 2015. [Available at: http://www.darzalex.com/shared/product/darzalex/darzalex-
prescribing-information.pdf (accessed November 27, 2016).]
2. Van de Donk NWCJ, Janmaat ML, Mutis T, et al. Monoclonal antibodies targeting CD38 in
hematological malignancies and beyond. Immunological Reviews. 2016;270(1):95-112.
3. Sanchez L, Wang Y, Siegel DS, Wang ML. Daratumumab: a first-in-class CD38 monoclonal
antibody for the treatment of multiple myeloma. Journal of Hematology & Oncology.
2016;9:51.
4. Chapuy Cl, Nicholson RT, Aguad MD, et al. Resolving the daratumumab interference with
blood compatibility testing. Transfusion. 2016;55(6 Pt 2):1545-1554.
5. Oostendorp M, Lammerts van Bueren Jj, Doshi P, et all. When blood transfusion medicine
becomes complicated due to interference by monoclonal antibody therapy. Transfusion.
2015;55(6 Pt 2):1555-1562.
6. Berthelier V, Laboureau J, Boulla G, et al. Probing ligand-induced conformational changes of
human CD38. European Journal of Biochemistry. 2000;267:3056-64.
7. Reid ME, Lomas-Francis C, Olsson ML. The blood group antigen facts book. 3rd ed. Waltham
(MA): Elsevier, 2013.
8. Brey RL, Cote SA, McGlasson DL, et.al. Effects of repeated freeze-thaw cycles on
anticardiolipin antibody immunoreactivity. American Journal of Clinical Pathology. 1994
Nov;102(5):586-8.
9. Fung MK, Grossman BJ, Hillyer C, et al. Technical manual. 18th ed. Bethesda (MD); American
Association of Blood Banks; 2014: Method 3-18.
17
10. Daniels J. Human blood groups. 3rd ed. Oxford: Wiley-Blackwell, 2013.
11. Schmidt AE, Kirkley S, Patel N, et al. An alternative method to dithiothreitol treatment for
antibody screening in patients receiving daratumumab (abstract). Transfusion.
2015;55(3S):2292-3.
12. Judd JW, Johnson ST, Storry JR. Judd’s methods in immunohematology. 3rd ed. Bethesda,
MD: American Association of Blood Banks, 2008: 273-274.
18
Figure 1. Color Comparator Chart (Haemonetics, Braintree, Massachusetts, USA)
19
Figure 2. Comparison of hemolysis between untreated and 0.2M DTT-treated cells over a 28 day period
3
4
5
6
7
0 1 2 3 4 5 6 7 8 9 10 11 12 13 14 15 16 17 18 19 20 21 22 23 24 25 26 27 28
Co
lor
Co
mp
arat
or
Ch
art
(CC
C)
Gra
de
Day
Comparison of Hemolysis Between Untreated and 0.2M DTT-Treated Cells
UntreatedCells
0.2M DTT-Treated Cells
20
Figure 3. Reaction strengths of Anti-D with untreated and 0.2M DTT-treated screen cells
0
1
2
3
4
0 1 2 3 4 5 6 7 8 9 10 11 12 13 14 15 16 17 18 19 20 21 22 23 24 25 26 27 28
Re
acti
on
Str
en
gth
Day Tested
Reaction Strengths of Anti-D With Untreated and 0.2M DTT Treated Cells
UntreatedCells
0.2M DTT-Treatd Cells
21
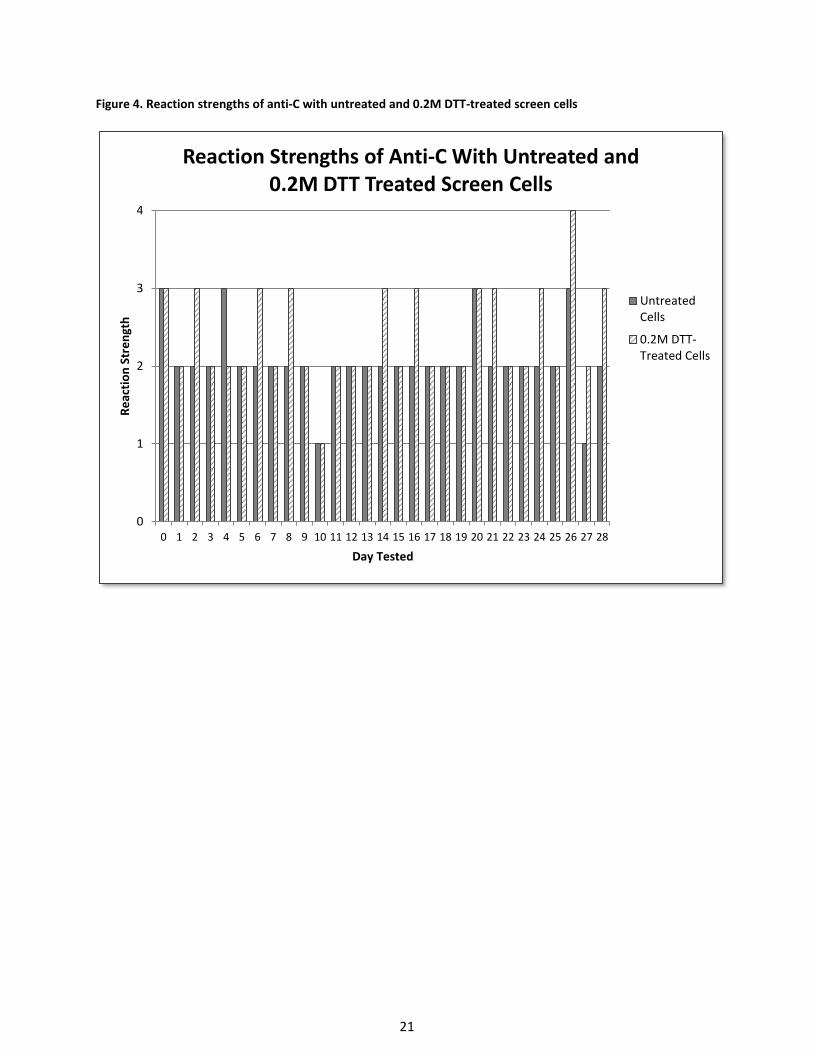
Figure 4. Reaction strengths of anti-C with untreated and 0.2M DTT-treated screen cells
0
1
2
3
4
0 1 2 3 4 5 6 7 8 9 10 11 12 13 14 15 16 17 18 19 20 21 22 23 24 25 26 27 28
Re
acti
on
Str
en
gth
Day Tested
Reaction Strengths of Anti-C With Untreated and 0.2M DTT Treated Screen Cells
UntreatedCells
0.2M DTT-Treated Cells
22
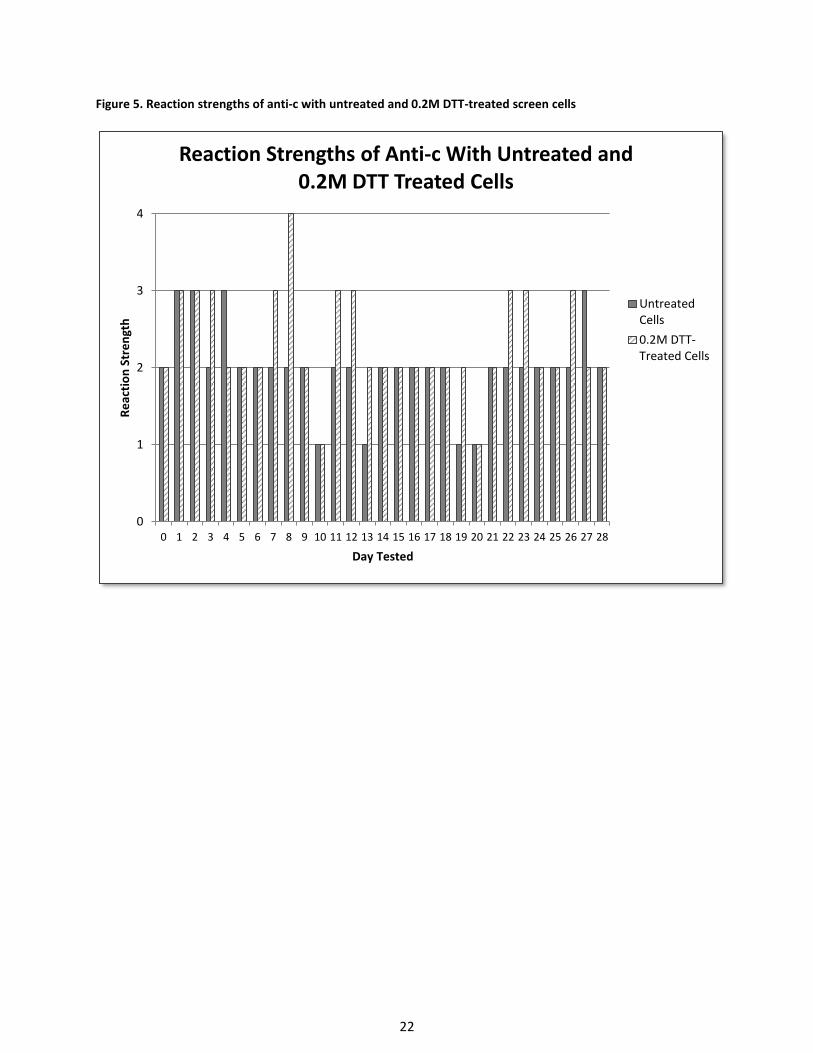
Figure 5. Reaction strengths of anti-c with untreated and 0.2M DTT-treated screen cells
0
1
2
3
4
0 1 2 3 4 5 6 7 8 9 10 11 12 13 14 15 16 17 18 19 20 21 22 23 24 25 26 27 28
Re
acti
on
Str
en
gth
Day Tested
Reaction Strengths of Anti-c With Untreated and 0.2M DTT Treated Cells
UntreatedCells
0.2M DTT-Treated Cells
23
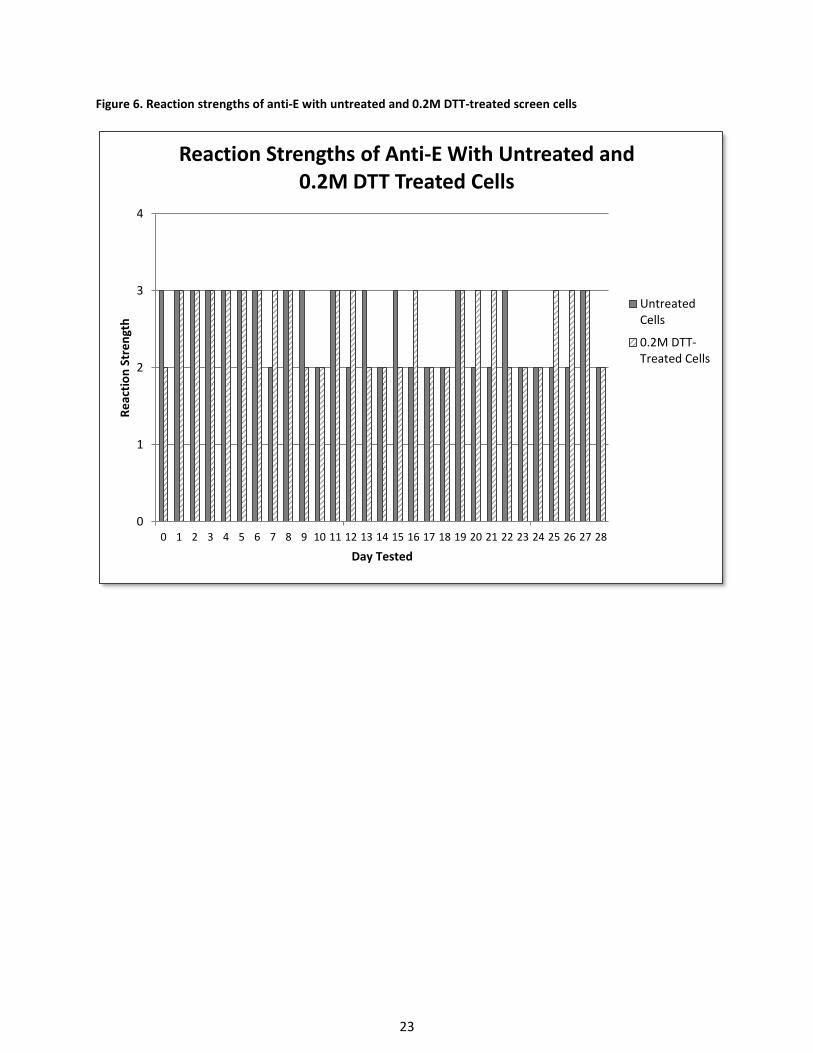
Figure 6. Reaction strengths of anti-E with untreated and 0.2M DTT-treated screen cells
0
1
2
3
4
0 1 2 3 4 5 6 7 8 9 10 11 12 13 14 15 16 17 18 19 20 21 22 23 24 25 26 27 28
Re
acti
on
Str
en
gth
Day Tested
Reaction Strengths of Anti-E With Untreated and 0.2M DTT Treated Cells
UntreatedCells
0.2M DTT-Treated Cells
24
Figure 7. Reaction strengths of anti-e with untreated and 0.2M DTT-treated screen cells
0
1
2
3
4
0 1 2 3 4 5 6 7 8 9 10 11 12 13 14 15 16 17 18 19 20 21 22 23 24 25 26 27 28
Re
acti
on
Str
en
gth
Day Tested
Reaction Strengths of Anti-e With Untreated and 0.2M DTT Treated Cells
UntreatedCells
0.2M DTT-Treated Cells
25
Figure 8. Reaction strengths of anti-M with untreated and 0.2M DTT-treated screen cells
0
1
2
3
4
0 1 2 3 4 5 6 7 8 9 10 11 12 13 14 15 16 17 18 19 20 21 22 23 24 25 26 27 28
Re
acti
on
Str
en
gth
Day Tested
Reaction Strengths of Anti-M With Untreated and 0.2M DTT Treated Cells
UntreatedCells
0.2M DTT-Treated Cells
26
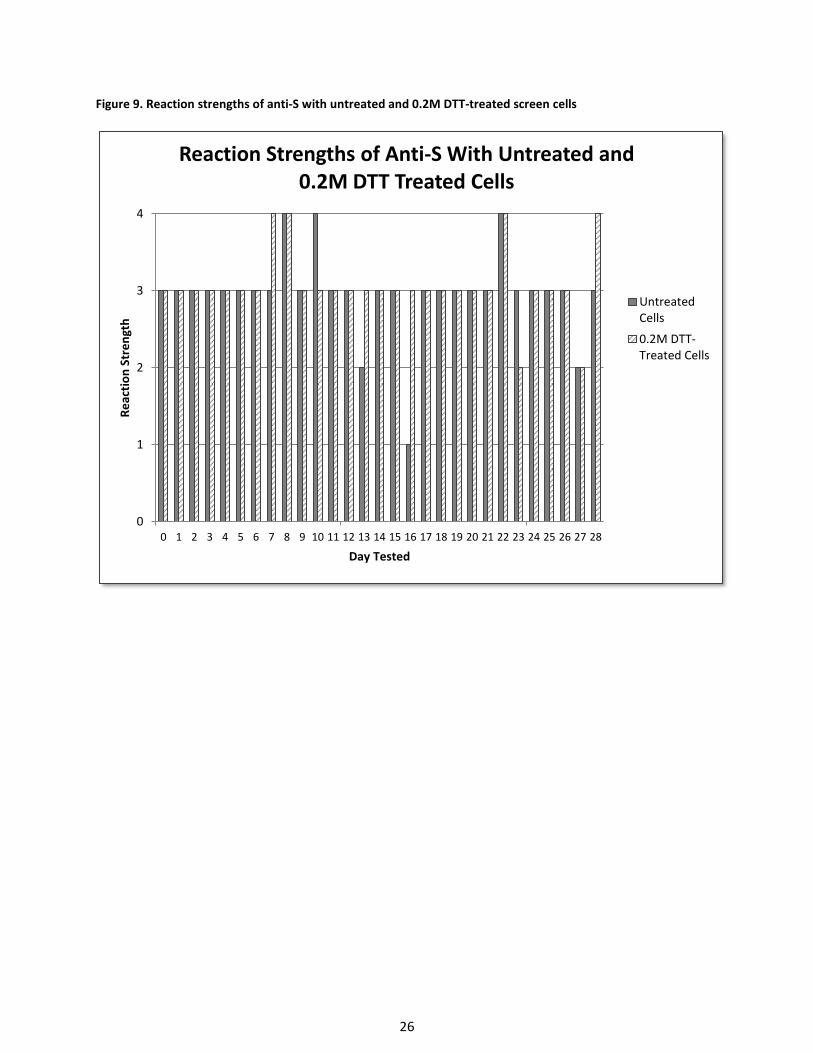
Figure 9. Reaction strengths of anti-S with untreated and 0.2M DTT-treated screen cells
0
1
2
3
4
0 1 2 3 4 5 6 7 8 9 10 11 12 13 14 15 16 17 18 19 20 21 22 23 24 25 26 27 28
Re
acti
on
Str
en
gth
Day Tested
Reaction Strengths of Anti-S With Untreated and 0.2M DTT Treated Cells
UntreatedCells
0.2M DTT-Treated Cells
27
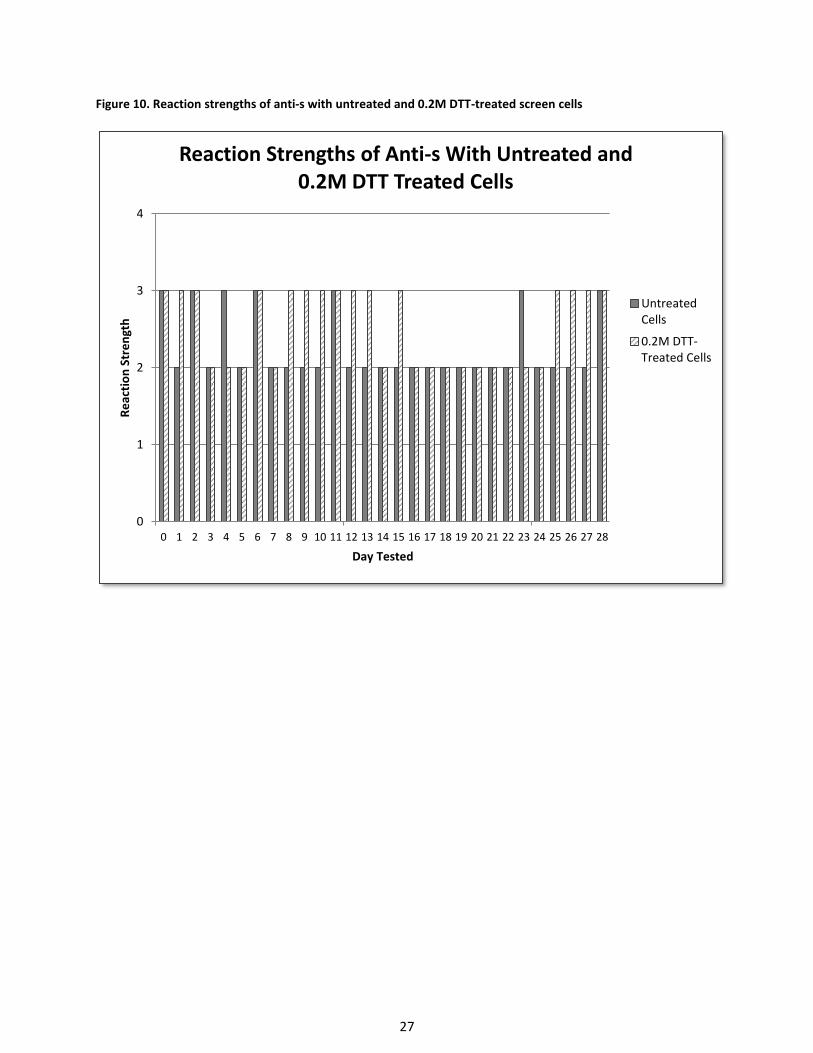
Figure 10. Reaction strengths of anti-s with untreated and 0.2M DTT-treated screen cells
0
1
2
3
4
0 1 2 3 4 5 6 7 8 9 10 11 12 13 14 15 16 17 18 19 20 21 22 23 24 25 26 27 28
Re
acti
on
Str
en
gth
Day Tested
Reaction Strengths of Anti-s With Untreated and 0.2M DTT Treated Cells
UntreatedCells
0.2M DTT-Treated Cells
28
Figure 11. Reaction strengths of anti-Fya with untreated and 0.2M DTT-treated screen cells
0
1
2
3
4
0 1 2 3 4 5 6 7 8 9 10 11 12 13 14 15 16 17 18 19 20 21 22 23 24 25 26 27 28
Re
acti
on
Str
en
gth
Day Tested
Reaction Strengths of Anti-Fya With Untreated and 0.2M DTT Treated Cells
UntreatedCells
0.2M DTT-Treated Cells
29
Figure 12. Reaction strengths of anti-Fyb with untreated and 0.2M DTT-treated screen cells
0
1
2
3
4
0 1 2 3 4 5 6 7 8 9 10 11 12 13 14 15 16 17 18 19 20 21 22 23 24 25 26 27 28
Re
acti
on
Str
en
gth
Day Tested
Reaction Strengths of Anti-Fyb With Untreated and 0.2M DTT Treated Cells
UntreatedCells
0.2M DTT-Treated Cells

30
Figure 13. Reaction strengths of anti-Jka with untreated and 0.2M DTT-treated screen cells
0
1
2
3
4
0 1 2 3 4 5 6 7 8 9 10 11 12 13 14 15 16 17 18 19 20 21 22 23 24 25 26 27 28
Re
acti
on
Str
en
gth
Day Tested
Reaction Strengths of Anti-Jka With Untreated and 0.2M DTT Treated Cells
Untreated Cells
0.2M DTT-Treated Cells

31
Figure 14. Reaction strengths of anti-Jkb with untreated and 0.2M DTT-treated screen cells
0
1
2
3
4
0 1 2 3 4 5 6 7 8 9 10 11 12 13 14 15 16 17 18 19 20 21 22 23 24 25 26 27 28
Re
acti
on
Str
en
gth
Day Tested
Reaction Strengths of Anti-Jkb With Untreated and 0.2M DTT Treated Cells
UntreatedCells
0.2M DTT-Treated Cells
32
Table I. Hemolysis grade of untreated and 0.2M DTT-treated cells based on Haemonetics color comparator chart for each day tested
Day Tested
Cell 0 1 2 3 4 5 6 7 8 9 10 11 12 13 14 15 16 17 18 19 20 21 22 23 24 25 26 27 28
Untreated Immucor 28834 SC I 4 4 4 4 4 4 4 4 4 4 4 4 4 4 4 5 5 5 5 5 5 5 5 5 5 5 5 5 6
Untreated Immucor 28834 SC II 4 4 4 4 4 4 4 4 4 4 4 4 4 4 4 5 5 5 5 5 5 5 5 5 5 5 5 5 6
Untreated Immucor 28834 SC III 4 4 4 4 4 4 4 4 4 4 4 4 4 4 4 5 5 5 5 5 5 5 5 6 6 6 6 6 6
0.2M DTT-treated Immucor 28834 SC I 4 4 4 4 4 4 4 5 5 5 5 5 5 5 5 6 6 6 6 6 6 6 6 6 6 6 6 6 6
0.2M DTT-treated Immucor 28834 SC II 4 4 4 4 4 4 5 5 5 5 5 5 5 5 5 6 6 6 6 6 6 6 6 6 6 6 6 6 6
0.2M DTT-treated Immucor 28834 SC III 4 4 4 4 4 4 4 4 5 5 5 5 5 5 5 6 6 6 6 6 6 6 6 6 6 6 6 6 6


![Vaccinia-Related Kinase 2 Controls ... - oasis.postech.ac.kroasis.postech.ac.kr/bitstream/2014.oak/13020/1/OAIR003791.pdf2, 0.5 mM dithiothreitol, 150 mM KCl, and [-32P]ATP).After30min,thereactionswereresolvedbySDS-PAGEand](https://img.pdfslide.net/doc/110x75/6005bffcdf441b0745737e17/vaccinia-related-kinase-2-controls-oasis-2-05-mm-dithiothreitol-150-mm.jpg)