Embed Size (px)
Citation preview
1
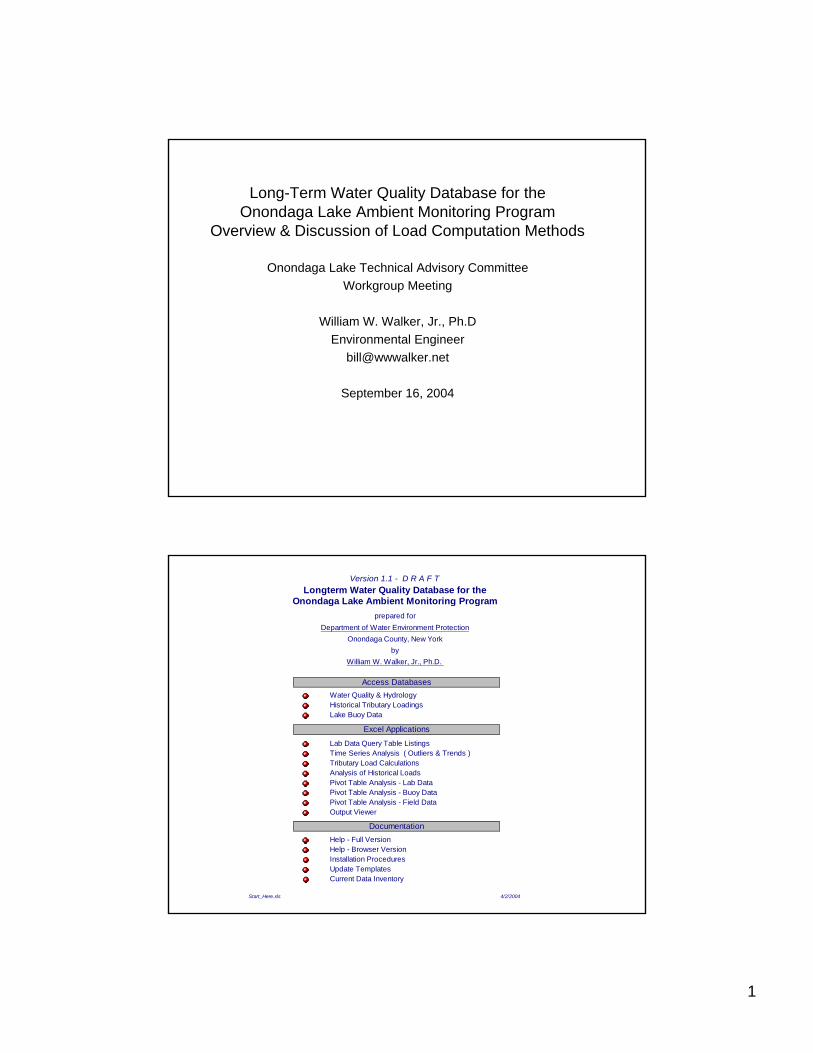
Long-Term Water Quality Database for theOnondaga Lake Ambient Monitoring Program
Overview & Discussion of Load Computation Methods
Onondaga Lake Technical Advisory CommitteeWorkgroup Meeting
William W. Walker, Jr., Ph.DEnvironmental Engineer
September 16, 2004
Water Quality & HydrologyHistorical Tributary LoadingsLake Buoy Data
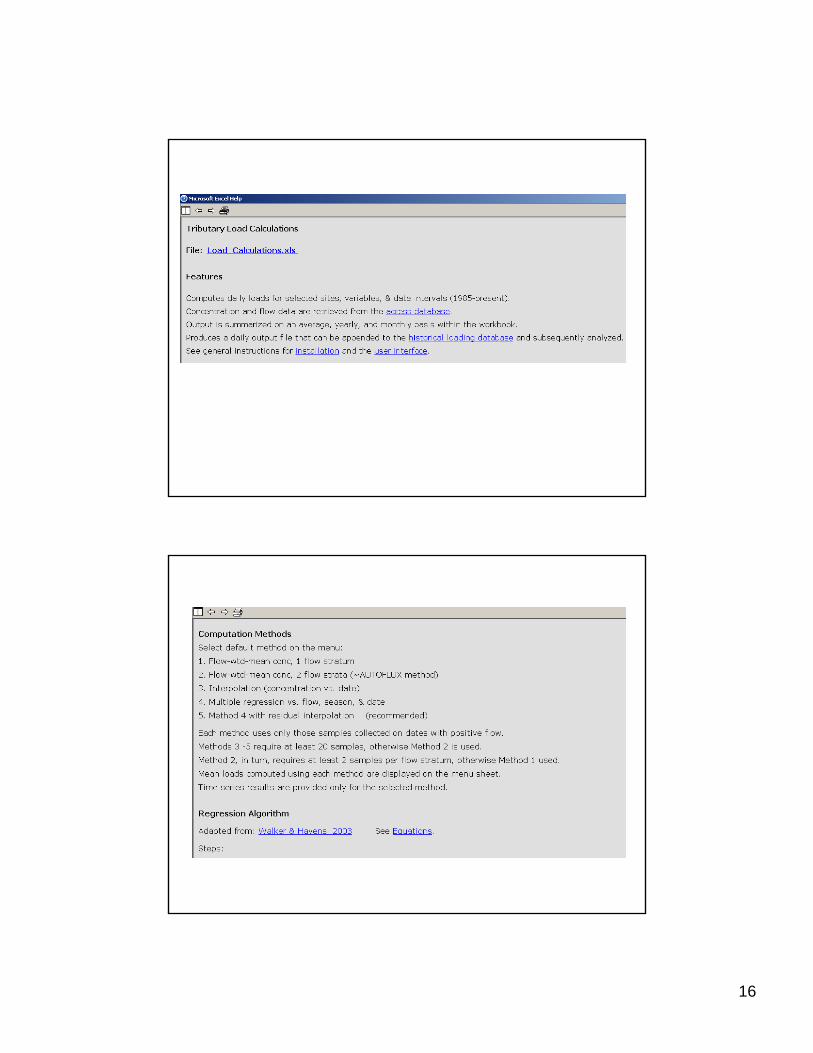
Lab Data Query Table ListingsTime Series Analysis ( Outliers & Trends )Tributary Load CalculationsAnalysis of Historical LoadsPivot Table Analysis - Lab DataPivot Table Analysis - Buoy DataPivot Table Analysis - Field DataOutput Viewer
Help - Full VersionHelp - Browser VersionInstallation ProceduresUpdate TemplatesCurrent Data Inventory
Start_Here.xls 4/2/2004
Documentation
Access Databases
Excel Applications
William W. Walker, Jr., Ph.D.
Version 1.1 - D R A F T
Onondaga Lake Ambient Monitoring Program
Department of Water Environment Protection
by
prepared for
Longterm Water Quality Database for the
Onondaga County, New York
2
3
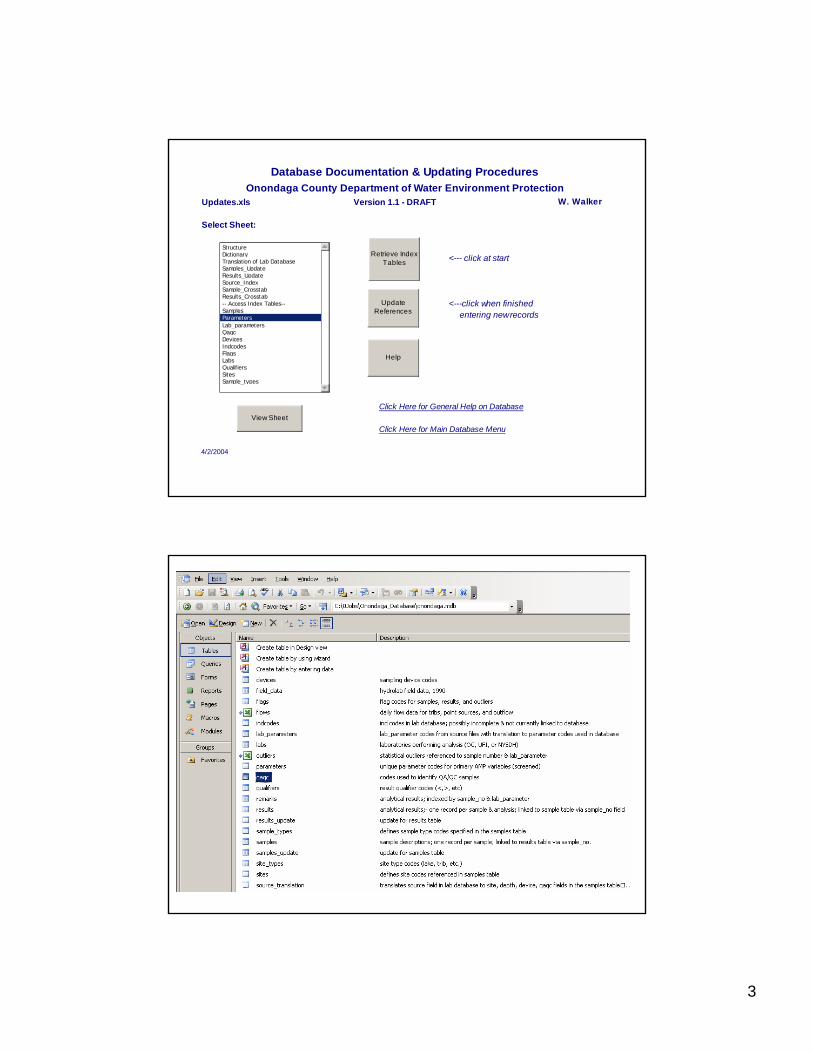
Updates.xls Version 1.1 - DRAFT W. Walker
Select Sheet:
<--- click at start
<---click when finished entering new records
Click Here for General Help on Database
Click Here for Main Database Menu
4/2/2004
Database Documentation & Updating ProceduresOnondaga County Department of Water Environment Protection
StructureDictionaryTranslation of Lab DatabaseSamples_UpdateResults_UpdateSource_IndexSample_CrosstabResults_Crosstab-- Access Index Tables--SamplesParametersLab_parametersQaqcDevicesIndcodesFlagsLabsQualifiersSitesSample_types
Retrieve Index Tables
UpdateReferences
Help
View Sheet
4
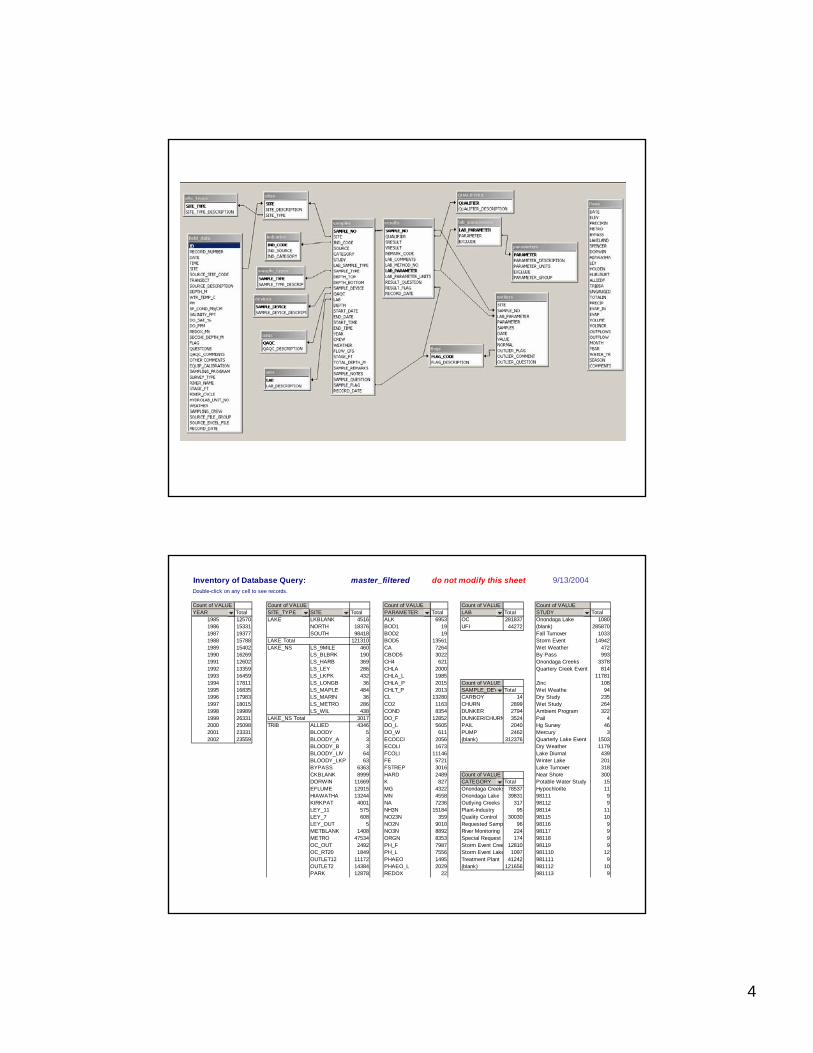
Inventory of Database Query: master_filtered do not modify this sheet 9/13/2004Double-click on any cell to see records.
Count of VALUE Count of VALUE Count of VALUE Count of VALUE Count of VALUEYEAR Total SITE_TYPE SITE Total PARAMETER Total LAB Total STUDY Total
1985 12570 LAKE LKBLANK 4516 ALK 6953 OC 281837 Onondaga Lake 10801986 15331 NORTH 18376 BOD1 19 UFI 44272 (blank) 2858701987 19377 SOUTH 98418 BOD2 19 Fall Turnover 10331988 15788 LAKE Total 121310 BOD5 13561 Storm Event 149421989 15402 LAKE_NS LS_9MILE 460 CA 7264 Wet Weather 4721990 16269 LS_BLBRK 190 CBOD5 3022 By Pass 9931991 12602 LS_HARB 369 CH4 621 Onondaga Creeks 33781992 13359 LS_LEY 286 CHLA 2000 Quartery Creek Event 8141993 16459 LS_LKPK 432 CHLA_L 1985 117811994 17811 LS_LONGB 36 CHLA_P 2015 Count of VALUE Zinc 1081995 16835 LS_MAPLE 484 CHLT_P 2013 SAMPLE_DEVIC Total Wet Weathe 941996 17983 LS_MARIN 36 CL 13280 CARBOY 14 Dry Study 2351997 18015 LS_METRO 286 CO2 1163 CHURN 2899 Wet Study 2641998 19989 LS_WIL 438 COND 8354 DUNKER 2794 Ambient Program 3221999 26331 LAKE_NS Total 3017 DO_F 12852 DUNKER/CHURN 3524 Pail 42000 25098 TRIB ALLIED 4346 DO_L 5605 PAIL 2040 Hg Survey 462001 23331 BLOODY 5 DO_W 611 PUMP 2462 Mercury 32002 23559 BLOODY_A 3 ECOCCI 2056 (blank) 312376 Quarterly Lake Event 1503
BLOODY_B 3 ECOLI 1673 Dry Weather 1179BLOODY_LIV 64 FCOLI 11146 Lake Diurnal 439BLOODY_LKP 63 FE 5721 Winter Lake 201BYPASS 6363 FSTREP 3016 Lake Turnover 318CKBLANK 8999 HARD 2489 Count of VALUE Near Shore 300DORWIN 11669 K 827 CATEGORY Total Potable Water Study 15EFLUME 12915 MG 4322 Onondaga Creeks 78537 Hypochlorite 11HIAWATHA 13244 MN 4558 Onondaga Lake 39831 98111 9KIRKPAT 4001 NA 7236 Outlying Creeks 317 98112 9LEY_11 575 NH3N 15184 Plant-Industry 95 98114 11LEY_7 608 NO23N 359 Quality Control 30030 98115 10LEY_OUT 5 NO2N 9010 Requested Samp 96 98116 9METBLANK 1408 NO3N 8892 River Monitoring 224 98117 9METRO 47534 ORGN 8353 Special Request 174 98118 9OC_OUT 2492 PH_F 7987 Storm Event Cree 12810 98119 9OC_RT20 1849 PH_L 7556 Storm Event Lake 1097 981110 12OUTLET12 11172 PHAEO 1495 Treatment Plant 41242 981111 9OUTLET2 14384 PHAEO_L 2029 (blank) 121656 981112 10PARK 12878 REDOX 22 981113 9
5
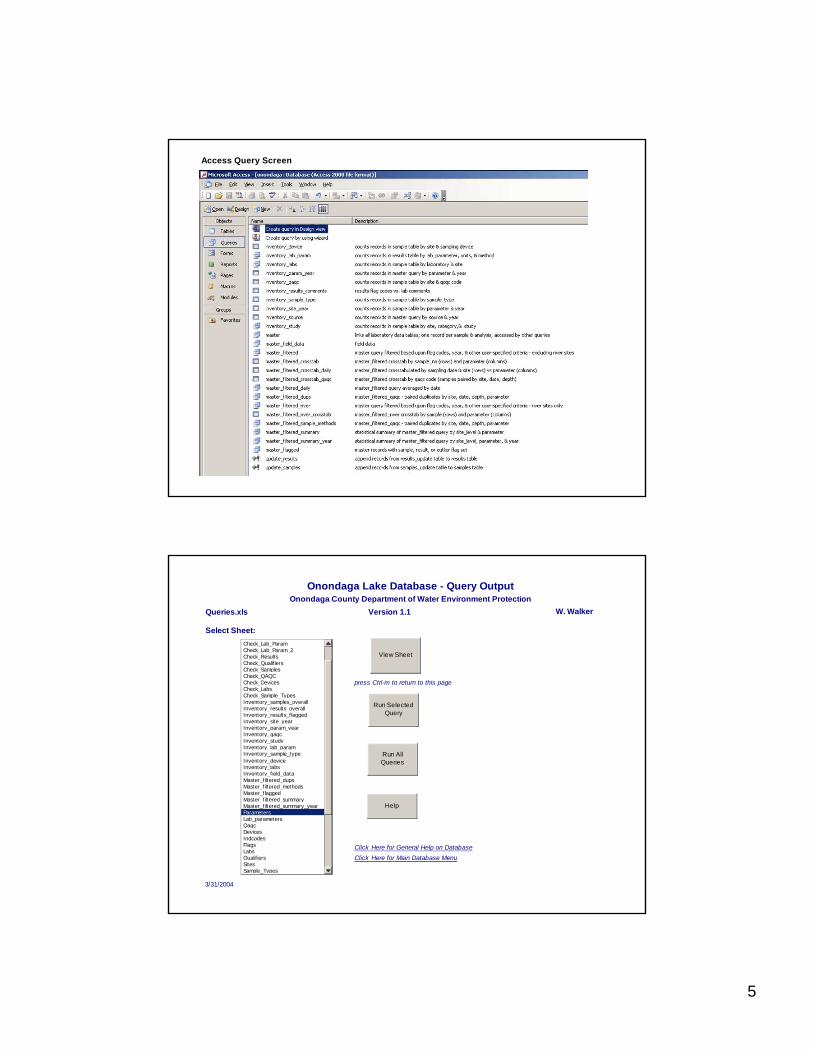
Access Query Screen
Queries.xls Version 1.1
Select Sheet:
press Ctrl-m to return to this page
30Parameters
Click Here for General Help on DatabaseClick Here for Main Database Menu
3/31/2004
Onondaga Lake Database - Query OutputOnondaga County Department of Water Environment Protection
W. Walker
Run All Queries
Check_Lab_ParamCheck_Lab_Param_2Check_ResultsCheck_QualifiersCheck_SamplesCheck_QAQCCheck_DevicesCheck_LabsCheck_Sample_TypesInventory_samples_overallInventory_results_overallInventory_results_flaggedInventory_site_yearInventory_param_yearInventory_qaqcInventory_studyInventory_lab_paramInventory_sample_typeInventory_deviceInventory_labsInventory_field_dataMaster_filtered_dupsMaster_filtered_methodsMaster_flaggedMaster_filtered_summaryMaster_filtered_summary_yearParametersLab_parametersQaqcDevicesIndcodesFlagsLabsQualifiersSitesSample_Types
View Sheet
Run Selected Query
Help
6
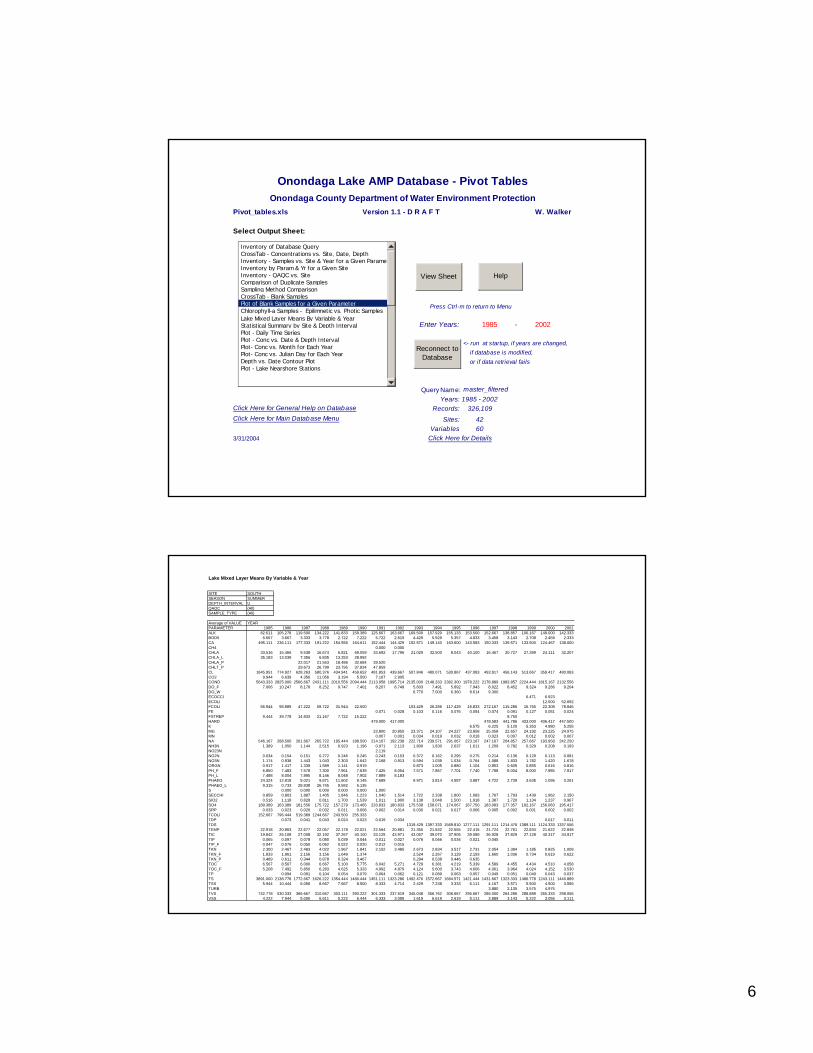
Pivot_tables.xls Version 1.1 - D R A F T W. Walker
Select Output Sheet:
Press Ctrl-m to return to Menu
Enter Years: 1985 - 2002
<- run at startup, if years are changed, if database is modified, or if data retrieval fails
Query Name: master_filteredYears: 1985 - 2002
Click Here for General Help on Database Records: 326,109Click Here for Main Database Menu Sites: 42
Variab les 603/31/2004 Click Here for Details
Onondaga County Department of Water Environment Protection
Onondaga Lake AMP Database - Pivot Tables
Inventory of Database QueryCrossTab - Concentrations vs. Site, Date, DepthInventory - Samples vs. Site & Year for a Given ParametInventory by Param & Yr for a Given SiteInventory - QAQC vs. SiteComparison of Duplicate SamplesSampling Method ComparisonCrossTab - Blank SamplesPlot of Blank Samples for a Given ParameterChlorophyll-a Samples - Epilimnetic vs. Photic SamplesLake Mixed Layer Means By Variable & YearStatistical Summary by Site & Depth IntervalPlot - Daily Time SeriesPlot - Conc vs. Date & Depth IntervalPlot- Conc vs. Month for Each YearPlot- Conc vs. Julian Day for Each YearDepth vs. Date Contour PlotPlot - Lake Nearshore Stations
View Sheet
Reconnect to Database
Help
Lake Mixed Layer Means By Variable & Year
SITE SOUTHSEASON SUMMERDEPTH_INTERVAL UQAQC (All)SAMPLE_TYPE (All)
Average of VALUE YEARPARAMETER 1985 1986 1987 1988 1989 1990 1991 1992 1993 1994 1995 1996 1997 1998 1999 2000 2001ALK 82.611 105.278 119.500 134.222 141.833 159.389 125.667 163.667 169.500 157.929 155.133 153.500 152.667 138.857 106.167 149.000 142.333BOD5 6.667 3.667 3.333 3.778 2.722 7.222 5.722 2.619 4.429 5.929 5.357 4.833 3.458 3.143 2.708 2.458 2.333CA 495.111 236.111 177.333 191.222 154.556 164.611 152.444 144.429 152.571 149.143 163.600 143.583 150.333 139.571 133.500 124.467 138.000CH4 0.000 0.000CHLA 33.516 15.466 9.538 16.674 6.821 69.059 34.692 17.796 21.029 32.500 8.043 40.100 16.467 20.727 27.399 24.111 32.207CHLA_L 35.183 13.039 7.356 6.835 13.253 28.992CHLA_P 22.017 21.553 18.486 32.684 39.520CHLT_P 29.673 26.799 23.795 37.834 47.859CL 1645.951 774.927 628.263 580.376 434.941 459.652 481.853 439.667 507.846 480.071 530.867 437.083 493.917 456.143 513.667 359.417 480.083CO2 9.944 6.639 4.356 11.056 3.194 5.500 7.167 2.905COND 5643.333 2825.000 2566.667 2431.111 2010.556 2094.444 2113.958 1995.714 2135.000 2148.333 2382.300 1978.222 2178.889 1983.857 2224.444 1815.167 2132.556DO_F 7.006 10.247 8.178 8.252 9.747 7.401 8.207 8.749 5.603 7.491 5.892 7.943 8.022 8.452 9.324 9.286 9.204DO_W 6.770 7.000 6.360 8.614 9.300ECOCCI 6.471 6.923ECOLI 12.500 52.692FCOLI 66.944 98.889 47.222 59.722 31.944 22.500 103.429 26.286 117.429 16.833 272.167 115.286 16.765 22.308 78.846FE 0.071 0.028 0.103 0.116 0.076 0.054 0.074 0.091 0.127 0.051 0.024FSTREP 9.444 39.778 14.833 21.167 7.722 15.222 8.750HARD 479.000 417.000 478.583 441.786 433.000 406.417 447.500K 6.575 6.225 5.120 5.353 4.980 5.255MG 23.800 20.850 23.371 24.107 24.227 23.858 25.058 22.657 24.192 23.225 24.975MN 0.007 0.001 0.034 0.019 0.032 0.018 0.023 0.007 0.012 0.002 0.007NA 546.167 288.500 261.667 265.722 195.444 188.500 214.167 192.238 222.714 239.571 291.067 223.167 247.167 204.857 257.667 193.958 242.250NH3N 1.389 1.050 1.144 2.515 0.923 1.196 0.971 2.113 1.800 1.830 2.637 1.611 1.209 0.782 0.329 0.208 0.193NO23N 2.119NO2N 0.634 0.154 0.151 0.272 0.246 0.245 0.243 0.153 0.372 0.162 0.295 0.275 0.214 0.136 0.129 0.113 0.081NO3N 1.174 0.938 1.443 1.043 2.303 1.642 2.168 0.913 0.594 1.039 1.034 0.764 1.088 1.833 1.782 1.420 1.678ORGN 0.917 1.417 1.339 1.589 1.141 0.919 0.873 1.005 0.880 1.104 0.853 0.605 0.855 0.616 0.816PH_F 6.850 7.483 7.578 7.300 7.961 7.639 7.425 8.054 7.571 7.867 7.701 7.740 7.788 8.004 8.000 7.985 7.917PH_L 7.488 8.004 7.895 8.146 8.048 7.902 7.889 8.183PHAEO 24.324 12.815 5.021 9.671 11.602 9.145 7.689 9.971 3.814 4.557 3.887 4.722 2.739 3.635 1.096 0.261PHAEO_L 9.315 0.733 28.838 26.745 9.582 6.135S 0.000 0.000 0.000 0.000 0.000 1.000SECCHI 0.859 0.803 1.887 1.405 1.846 1.223 1.040 1.514 1.722 2.338 1.800 1.083 1.767 1.793 1.439 1.962 2.150SIO2 0.516 1.118 0.828 0.811 1.700 1.539 1.011 1.900 3.138 3.048 1.500 1.918 1.387 1.720 1.134 1.237 0.967SO4 189.389 163.389 181.556 175.722 157.279 173.465 233.833 180.833 175.538 158.071 174.067 167.750 183.083 177.357 192.167 156.083 195.417SRP 0.033 0.023 0.026 0.032 0.011 0.006 0.002 0.014 0.030 0.021 0.017 0.006 0.005 0.002 0.001 0.002 0.002TCOLI 152.667 796.444 519.389 1244.667 243.500 255.333TDP 0.073 0.041 0.043 0.024 0.023 0.019 0.034 0.017 0.011TDS 1319.429 1397.333 1569.810 1277.111 1291.111 1214.476 1389.111 1124.333 1337.556TEMP 22.918 20.863 22.677 22.057 22.178 22.021 22.564 20.881 21.355 21.632 22.555 22.416 21.724 22.761 22.834 21.622 22.848TIC 19.842 26.108 27.008 32.192 37.267 40.100 33.125 43.971 43.067 39.070 37.905 39.089 36.928 37.829 27.128 40.317 34.917TIP 0.065 0.097 0.078 0.080 0.039 0.044 0.011 0.027 0.076 0.046 0.034 0.021 0.045TIP_F 0.047 0.076 0.050 0.062 0.022 0.020 0.012 0.015TKN 2.300 2.467 2.483 4.022 1.967 1.841 2.152 3.485 2.673 2.834 3.517 2.731 2.054 1.384 1.185 0.825 1.008TKN_F 1.833 1.861 2.156 3.156 1.649 1.374 2.524 2.267 3.129 2.193 1.660 1.036 0.734 0.619 0.622TKN_P 0.489 0.611 0.344 0.878 0.324 0.467 0.294 0.538 0.446 0.635TOC 6.567 8.567 6.000 6.667 5.100 5.775 6.042 5.271 4.729 6.381 4.219 5.339 4.589 4.455 4.434 4.510 4.058TOC_F 5.208 7.492 5.850 6.283 4.625 5.333 4.992 4.879 4.124 5.600 3.743 4.606 4.061 3.964 4.024 4.152 3.530TP 0.094 0.091 0.104 0.054 0.079 0.064 0.062 0.121 0.089 0.063 0.057 0.049 0.051 0.049 0.043 0.037TS 3891.000 2138.778 1772.667 1626.222 1354.444 1480.444 1451.111 1323.286 1492.476 1572.667 1684.571 1421.444 1431.667 1323.333 1486.778 1243.111 1440.889TSS 5.944 10.444 6.056 8.667 7.667 8.500 8.333 4.714 2.429 7.238 3.333 6.111 4.167 3.571 5.500 4.500 3.556TURB 3.880 2.135 3.575 4.975TVS 742.778 530.333 366.667 310.667 303.111 393.222 301.333 237.619 345.048 356.762 306.667 295.667 286.000 264.286 288.889 265.333 298.056VSS 4.222 7.944 5.000 6.611 5.222 6.444 6.333 3.095 1.619 6.619 2.619 5.111 3.889 3.143 5.222 3.056 3.111
7
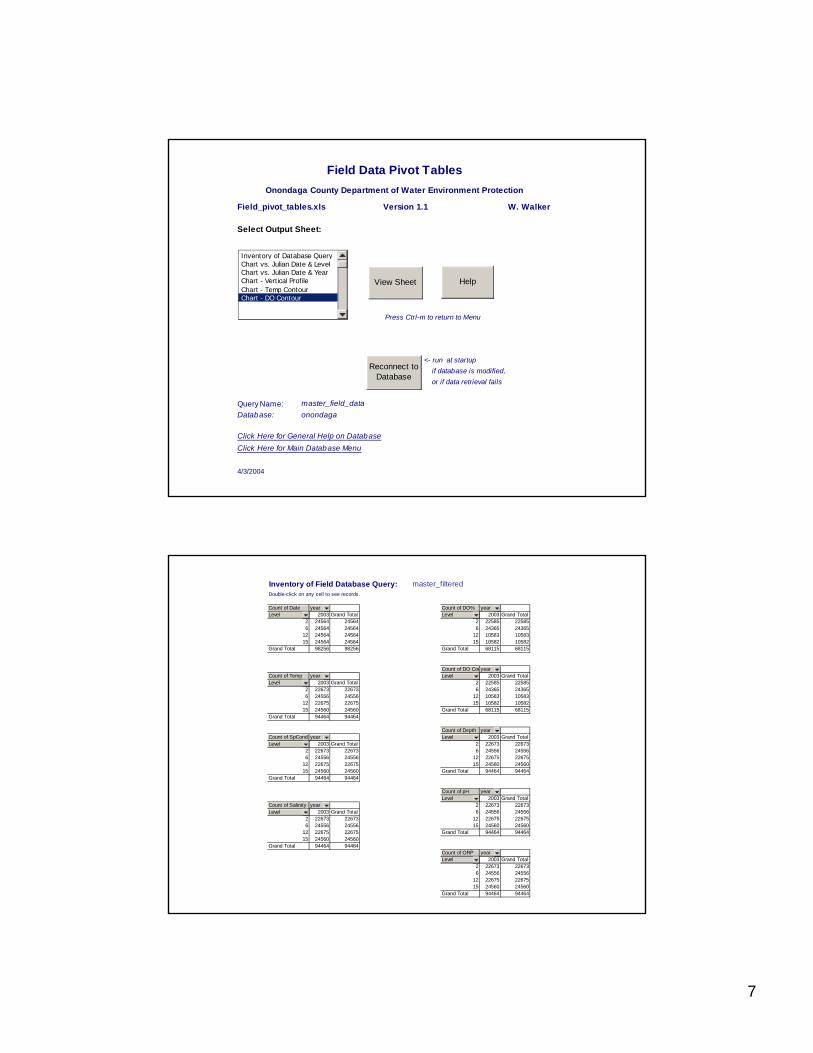
Field_pivot_tables.xls Version 1.1 W. Walker
Select Output Sheet:
Press Ctrl-m to return to Menu
<- run at startup if database is modified, or if data retrieval fails
Query Name: master_field_dataDatabase: onondaga
Click Here for General Help on DatabaseClick Here for Main Database Menu
4/3/2004
Onondaga County Department of Water Environment Protection
Field Data Pivot Tables
Inventory of Database QueryChart vs. Julian Date & LevelChart vs. Julian Date & YearChart - Vertical ProfileChart - Temp ContourChart - DO Contour
View Sheet
Reconnect to Database
Help
Inventory of Field Database Query: master_filteredDouble-click on any cell to see records.
Count of Date year Count of DO% yearLevel 2003 Grand Total Level 2003 Grand Total
2 24564 24564 2 22585 225856 24564 24564 6 24365 24365
12 24564 24564 12 10583 1058315 24564 24564 15 10582 10582
Grand Total 98256 98256 Grand Total 68115 68115
Count of DO ConyearCount of Temp year Level 2003 Grand TotalLevel 2003 Grand Total 2 22585 22585
2 22673 22673 6 24365 243656 24556 24556 12 10583 10583
12 22675 22675 15 10582 1058215 24560 24560 Grand Total 68115 68115
Grand Total 94464 94464
Count of Depth yearCount of SpCond year Level 2003 Grand TotalLevel 2003 Grand Total 2 22673 22673
2 22673 22673 6 24556 245566 24556 24556 12 22675 22675
12 22675 22675 15 24560 2456015 24560 24560 Grand Total 94464 94464
Grand Total 94464 94464
Count of pH yearLevel 2003 Grand Total
Count of Salinity year 2 22673 22673Level 2003 Grand Total 6 24556 24556
2 22673 22673 12 22675 226756 24556 24556 15 24560 24560
12 22675 22675 Grand Total 94464 9446415 24560 24560
Grand Total 94464 94464Count of ORP yearLevel 2003 Grand Total
2 22673 226736 24556 24556
12 22675 2267515 24560 24560
Grand Total 94464 94464
8
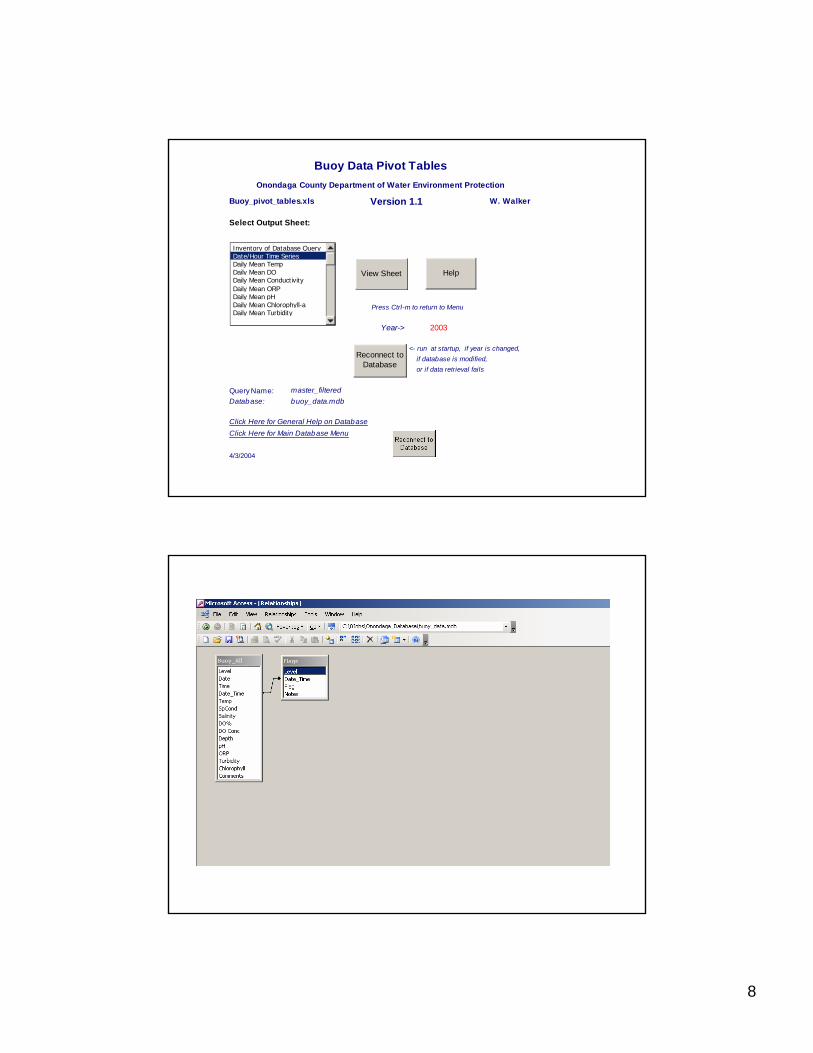
Buoy_pivot_tables.xls Version 1.1 W. Walker
Select Output Sheet:
Press Ctrl-m to return to Menu
Year-> 2003
<- run at startup, if year is changed, if database is modified, or if data retrieval fails
Query Name: master_filteredDatabase: buoy_data.mdb
Click Here for General Help on DatabaseClick Here for Main Database Menu
4/3/2004
Onondaga County Department of Water Environment Protection
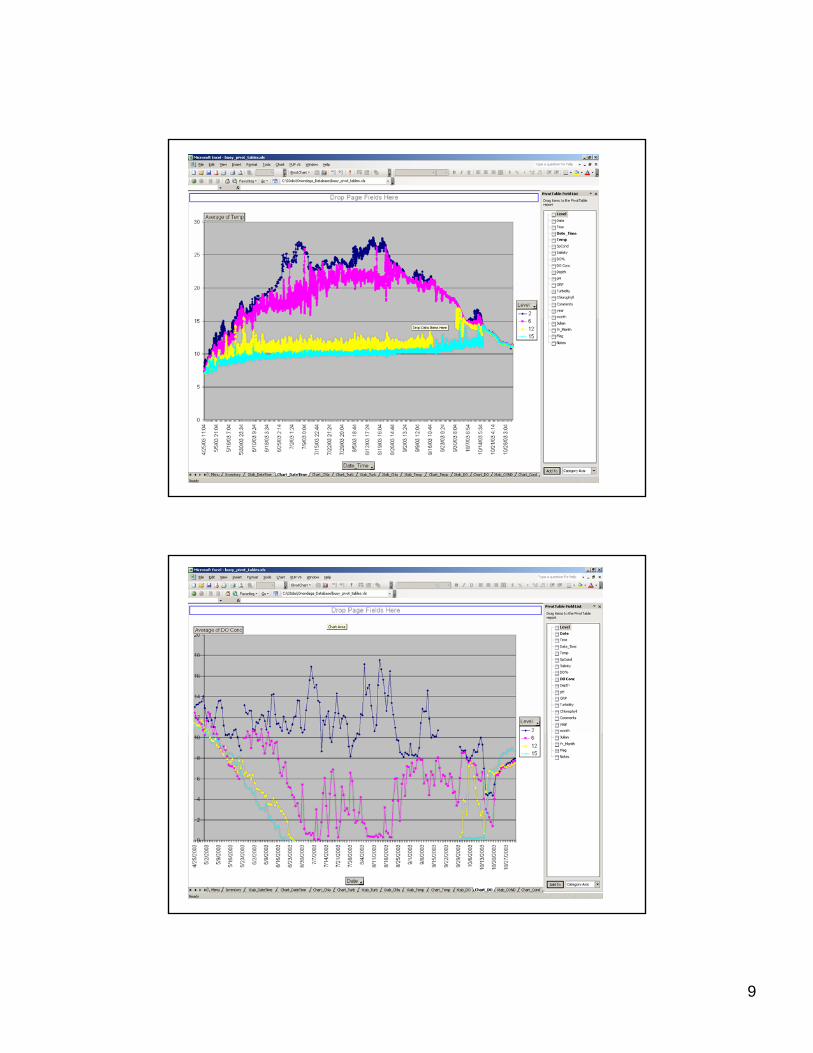
Buoy Data Pivot Tables
Inventory of Database QueryDate/Hour Time SeriesDaily Mean TempDaily Mean DODaily Mean ConductivityDaily Mean ORPDaily Mean pHDaily Mean Chlorophyll-aDaily Mean Turbidity
View Sheet
Reconnect to Database
Help
9
10
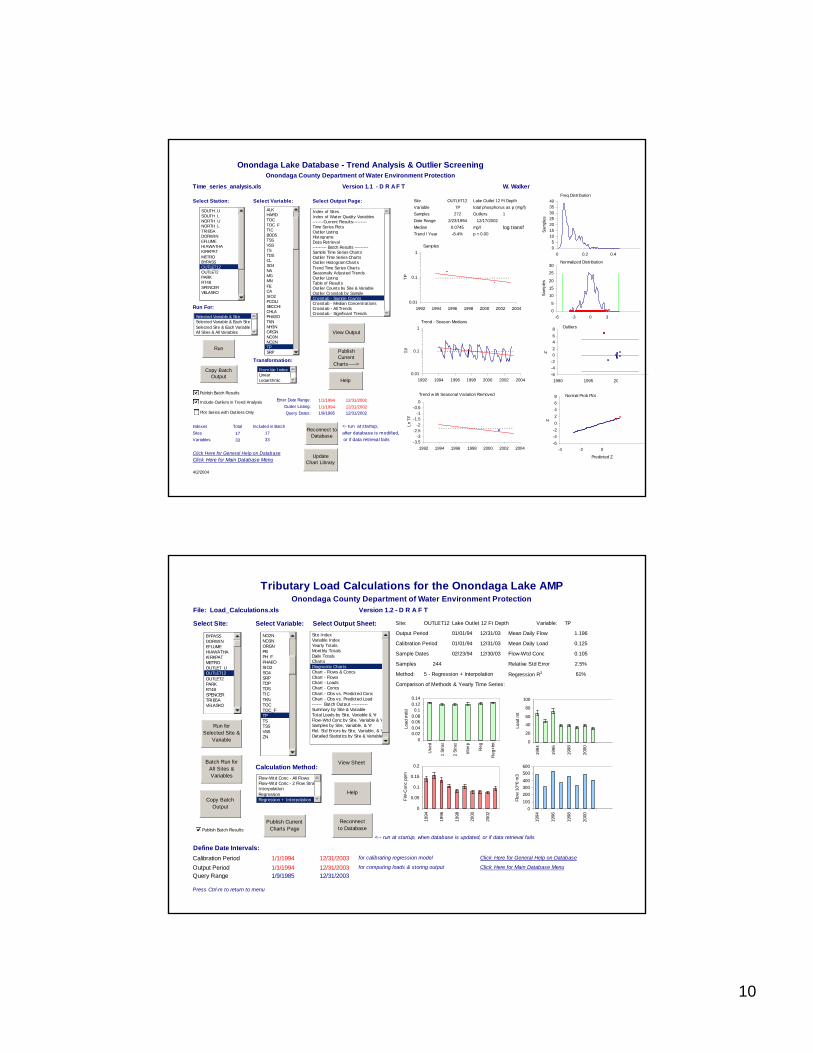
Time_series_analysis.xls Version 1.1 - D R A F T W. Walker
Select Station: Select Variable: Select Output Page: Site OUTLET12 Lake Outlet 12 Ft DepthVariable TP total phosphorus as p (mg/l)Samples 272 Outliers 1Date Range 2/23/1994 12/17/2002Median 0.0745 mg/l log transfTrend / Year -8.4% p = 0.00
Run For:
Transformation:
Enter Date Range: 1/1/1994 12/31/2002Outlier Listing: 1/1/1994 12/31/2002Query Dates: 1/9/1985 12/31/2002
Indexes Total Included in Batch <- run at startup,Sites 17 17 after database is modified,Variables 33 33 or if data retrieval fails
Click Here for General Help on DatabaseClick Here for Main Database Menu
Onondaga Lake Database - Trend Analysis & Outlier ScreeningOnondaga County Department of Water Environment Protection
4/2/2004
SOUTH_USOUTH_LNORTH_UNORTH_LTRIB5ADORWINEFLUMEHIAWATHAKIRKPATMETROBYPASSOUTLET12OUTLET2PARKRT48SPENCERVELASKO
ALKHARDTOCTOC_FTICBOD5TSSVSSTSTDSCLSO4NAMGMNFECASIO2FCOLISECCHICHLAPHAEOTKNNH3NORGNNO3NNO2NTPSRP
Run
Index of SitesIndex of Water Quality Variables-------Current Results---------Time Series PlotsOutlier ListingHistogramsData Retrieval--------- Batch Results ---------Sample Time Series ChartsOutlier Time Series ChartsOutlier Histogram ChartsTrend Time Series ChartsSeasonally Adjusted TrendsOutlier ListingTable of ResultsOutlier Counts by Site & VariableOutlier Crosstab by SampleCrosstab - Sample CountsCrosstab - Median ConcentrationsCrosstab - All TrendsCrosstab - Significant Trends
View Output
Reconnect to Database
Include Outliers in Trend Analysis
Outliers
-6-4-202468
1990 1995 20
Z
Trend - Season Medians
0.01
0.1
1
1992 1994 1996 1998 2000 2002 2004
TP
Publish Batch Results
Copy Batch Output
Help
Plot Series with Outliers Only
Selected Variable & SiteSelected Variable & Each SiteSelected Site & Each VariableAll Sites & All Variables
Normal Prob Plot
-6-4-202468
-4 -2 0
Predicted Z
Z
Trend w ith Seasonal Variation Removed
-3.5-3
-2.5-2
-1.5-1
-0.50
1992 1994 1996 1998 2000 2002 2004
Ln T
P
From Var IndexLinearLogarithmic
Normalized Distribution
0
5
10
15
20
25
30
-6 -3 0 3
Sam
ples
Samples
0.01
0.1
1
1992 1994 1996 1998 2000 2002 2004
TP
Freq Distribution
05
10152025303540
0 0.2 0.4
Sam
ples
Publish Current
Charts----->
UpdateChart Library
File: Load_Calculations.xls Version 1.2 - D R A F T
Select Site: Select Variable: Select Output Sheet: Site: OUTLET12 Lake Outlet 12 Ft Depth Variable: TP
Output Period 01/01/94 12/31/03 Mean Daily Flow 1.196
Calibration Period 01/01/94 12/31/03 Mean Daily Load 0.125
Sample Dates 02/23/94 12/30/03 Flow-Wtd Conc 0.105
Samples 244 Relative Std Error 2.5%
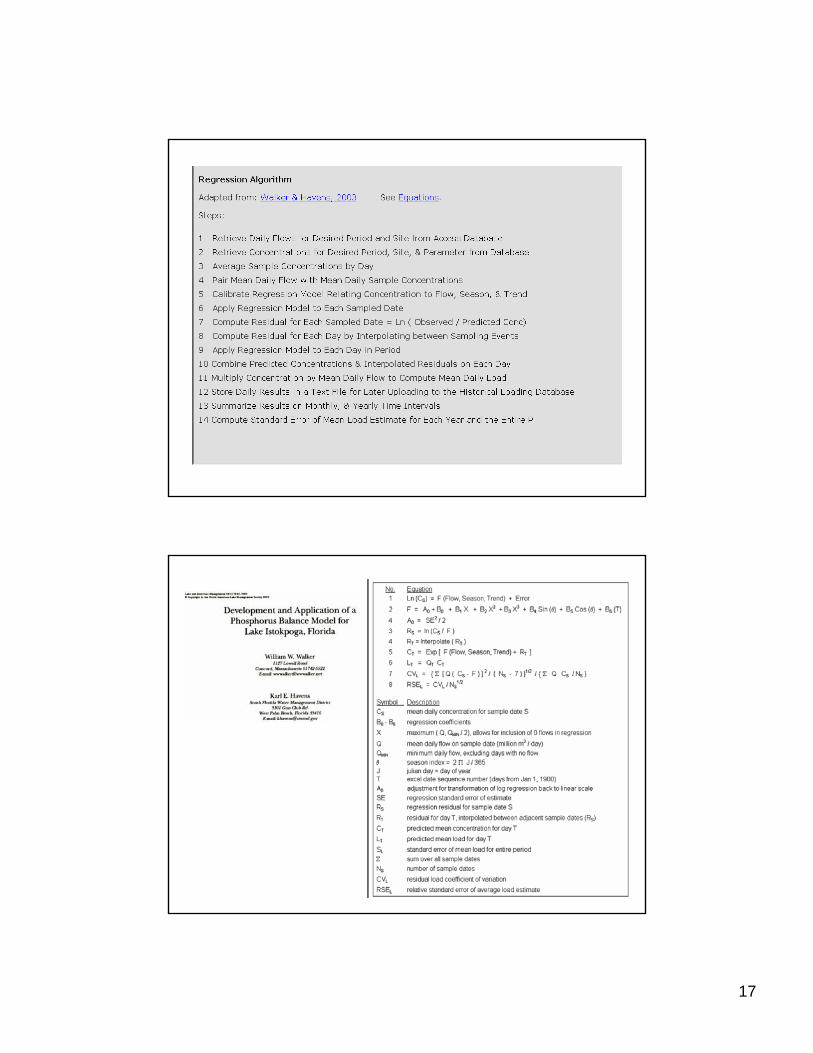
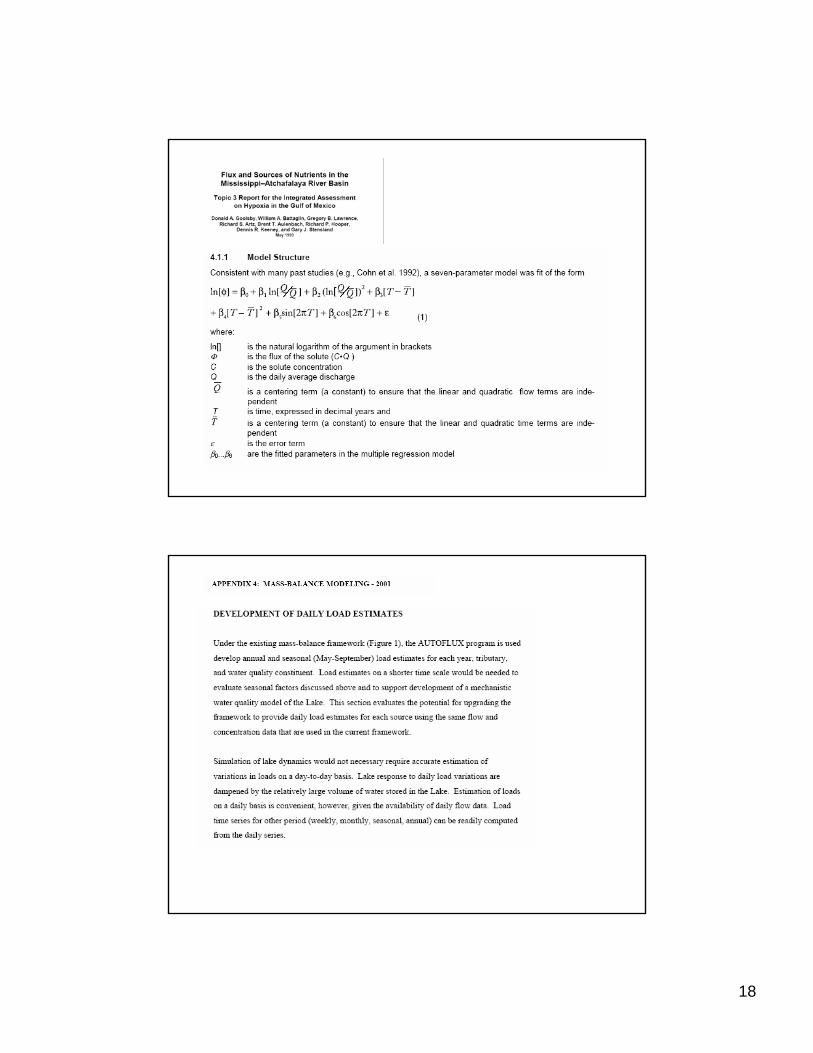
Method: 5 - Regression + Interpolation Regression R2 61%
Comparison of Methods & Yearly Time Series:
Calculation Method:
<-- run at startup, when database is updated, or if data retrieval fails
Define Date Intervals:Calibration Period 1/1/1994 12/31/2003 for calibrating regression model Click Here for General Help on Database
Output Period 1/1/1994 12/31/2003 for computing loads & storing output Click Here for Main Database Menu
Query Range 1/9/1985 12/31/2003
Press Ctrl-m to return to menu
Tributary Load Calculations for the Onondaga Lake AMPOnondaga County Department of Water Environment Protection
Run for Selected Site &
Variable
Batch Run for All Sites & Variables
Reconnect to Database
BYPASSDORWINEFLUMEHIAWATHAKIRKPATMETROOUTLET_UOUTLET12OUTLET2PARKRT48SPENCERTRIB5AVELASKO
NO2NNO3NORGNPBPH_FPHAEOSIO2SO4SRPTDPTDSTICTKNTOCTOC_FTPTSTSSVSSZN 0
0.020.040.060.080.1
0.120.14
Use
d
1 St
rat
2 St
rat
Inte
rp
Reg
Reg
+Int
Load
mt/d
0
20
40
60
80
100
1994
1996
1998
2000
Load
mt
0
0.05
0.1
0.15
0.2
1994
1996
1998
2000
2002
FW-C
onc
ppm
Site IndexVariable IndexYearly TotalsMonthly TotalsDaily TotalsChartsDiagnostic ChartsChart - Flows & ConcsChart - FlowsChart - LoadsChart - ConcsChart - Obs vs. Predicted ConcChart - Obs vs. Predicted Load------ Batch Output ----------Summary by Site & VariableTotal Loads by Site, Variable & YrFlow-Wtd Conc by Site, Variable & YSamples by Site, Variable, & YrRel. Std Errors by Site, Variable, & YDetailed Statistics by Site & Variable
View Sheet
0100200300400500600
1994
1996
1998
2000
Flow
10^
6 m
3
Flow-Wtd Conc - All FlowsFlow-Wtd Conc - 2 Flow StraInterpolationRegressionRegression + InterpolationCopy Batch
Output
Help
Publish Batch Results
Publish CurrentCharts Page
11
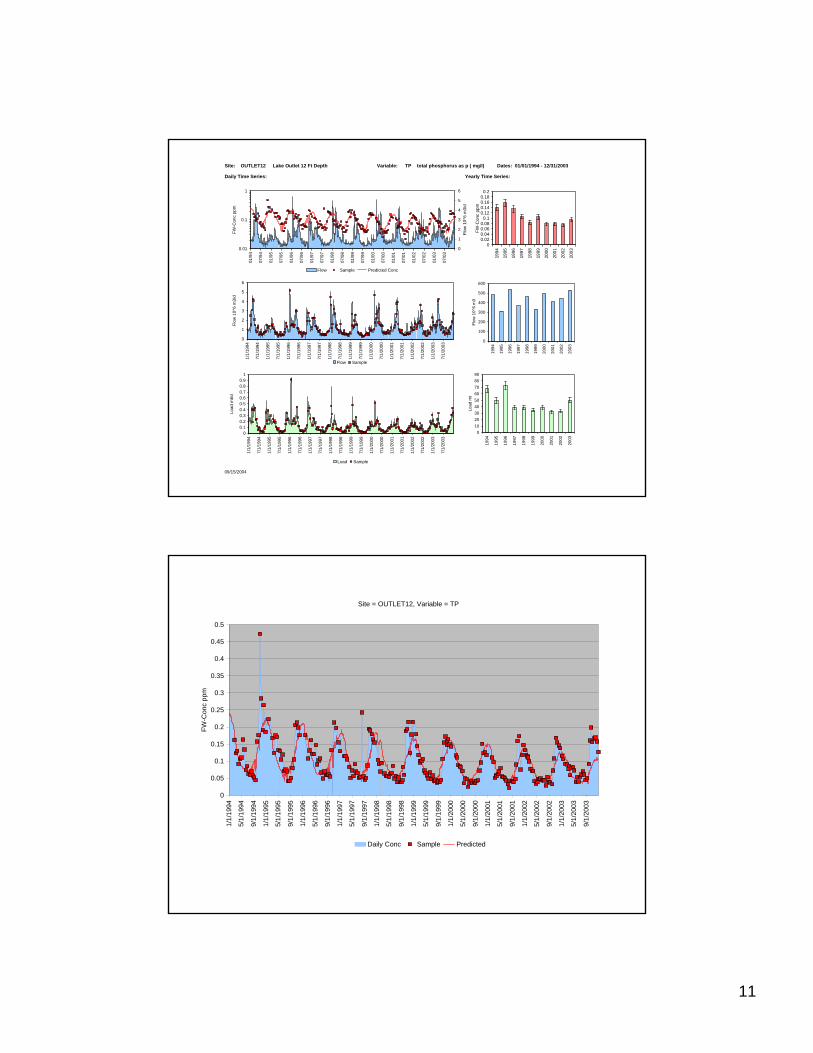
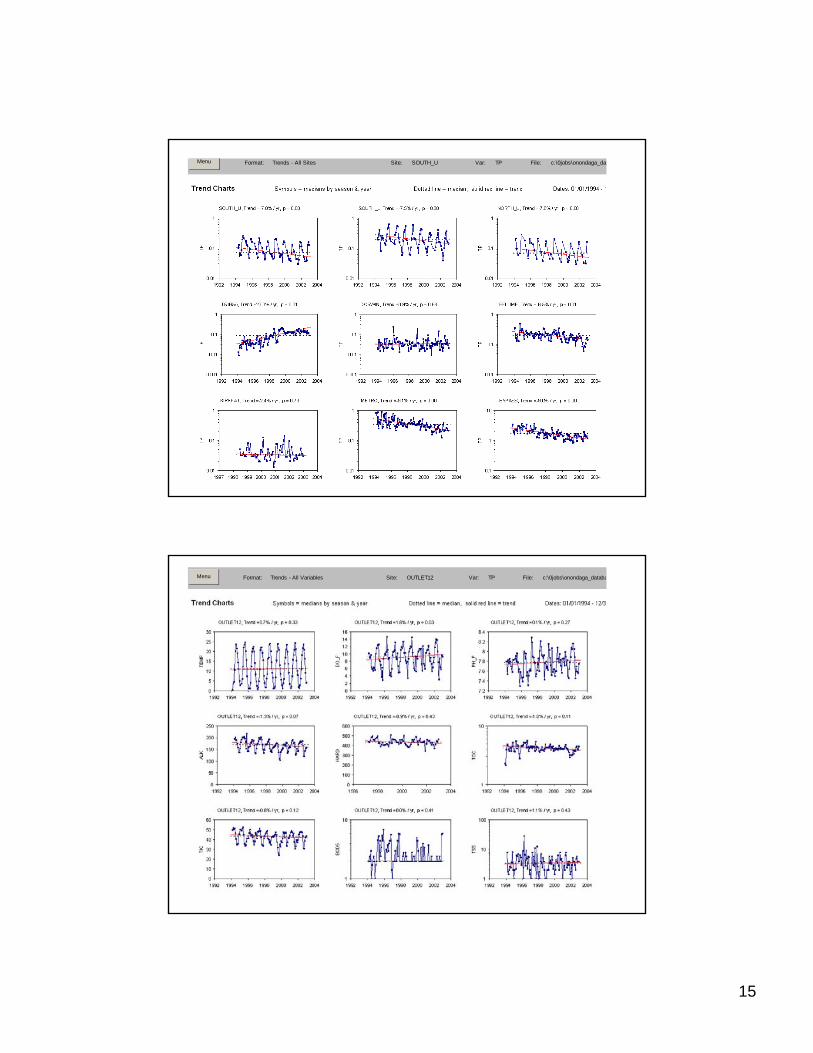
Site: OUTLET12 Lake Outlet 12 Ft Depth Variable: TP total phosphorus as p ( mg/l) Dates: 01/01/1994 - 12/31/2003
Daily Time Series: Yearly Time Series:
09/15/2004
0.01
0.1
1
01/9
4
07/9
4
01/9
5
07/9
5
01/9
6
07/9
6
01/9
7
07/9
7
01/9
8
07/9
8
01/9
9
07/9
9
01/0
0
07/0
0
01/0
1
07/0
1
01/0
2
07/0
2
01/0
3
07/0
3
FW-C
onc
ppm
0
1
2
3
4
5
6
Flow
10^
6 m
3/d
Flow Sample Predicted Conc
00.10.20.30.40.50.60.70.80.9
1
1/1/
1994
7/1/
1994
1/1/
1995
7/1/
1995
1/1/
1996
7/1/
1996
1/1/
1997
7/1/
1997
1/1/
1998
7/1/
1998
1/1/
1999
7/1/
1999
1/1/
2000
7/1/
2000
1/1/
2001
7/1/
2001
1/1/
2002
7/1/
2002
1/1/
2003
7/1/
2003
Load
mt/d
Load Sample
0102030405060708090
1994
1995
1996
1997
1998
1999
2000
2001
2002
2003
Load
mt
00.020.040.060.080.1
0.120.140.160.180.2
1994
1995
1996
1997
1998
1999
2000
2001
2002
2003
FW-C
onc
ppm
0
100
200
300
400
500
600
1994
1995
1996
1997
1998
1999
2000
2001
2002
2003
Flow
10^
6 m
3
0
1
2
3
4
5
6
1/1/
1994
7/1/
1994
1/1/
1995
7/1/
1995
1/1/
1996
7/1/
1996
1/1/
1997
7/1/
1997
1/1/
1998
7/1/
1998
1/1/
1999
7/1/
1999
1/1/
2000
7/1/
2000
1/1/
2001
7/1/
2001
1/1/
2002
7/1/
2002
1/1/
2003
7/1/
2003
Flow
10^
6 m
3/d
Flow Sample
Site = OUTLET12, Variable = TP
0
0.05
0.1
0.15
0.2
0.25
0.3
0.35
0.4
0.45
0.5
1/1/
1994
5/1/
1994
9/1/
1994
1/1/
1995
5/1/
1995
9/1/
1995
1/1/
1996
5/1/
1996
9/1/
1996
1/1/
1997
5/1/
1997
9/1/
1997
1/1/
1998
5/1/
1998
9/1/
1998
1/1/
1999
5/1/
1999
9/1/
1999
1/1/
2000
5/1/
2000
9/1/
2000
1/1/
2001
5/1/
2001
9/1/
2001
1/1/
2002
5/1/
2002
9/1/
2002
1/1/
2003
5/1/
2003
9/1/
2003
FW-C
onc
ppm
Daily Conc Sample Predicted
12
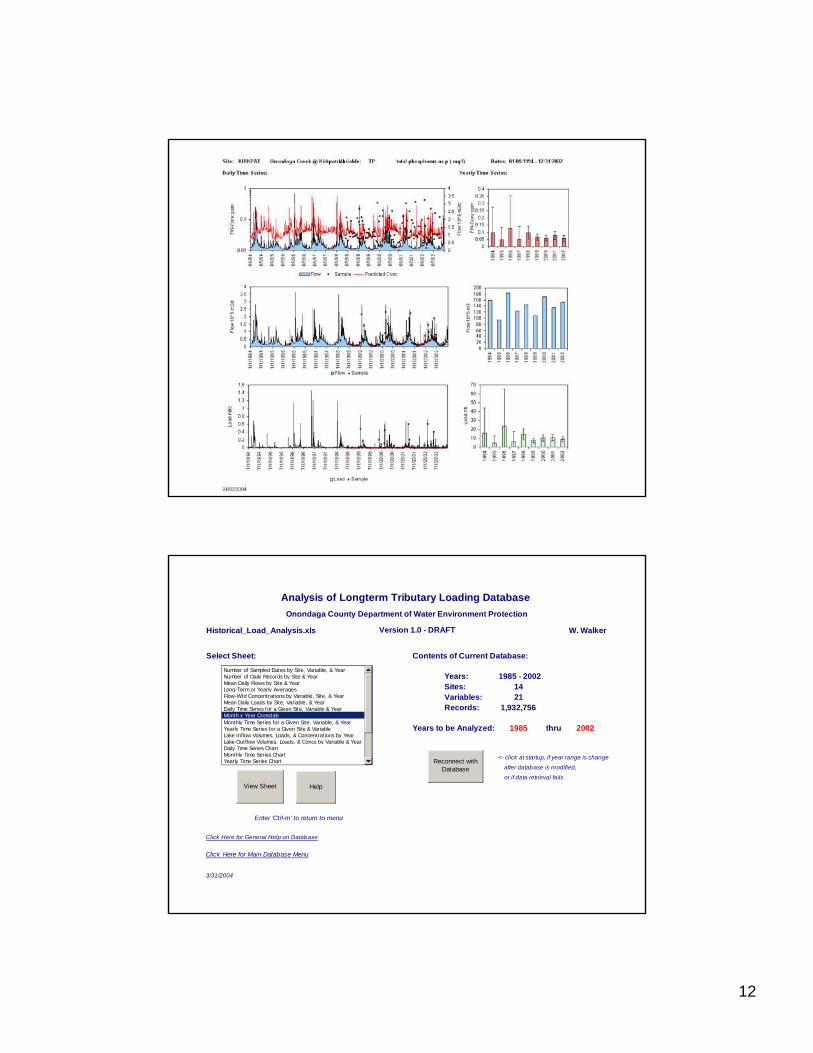
Historical_Load_Analysis.xls W. Walker
Select Sheet: Contents of Current Database:
Years: 1985 - 2002Sites: 14Variables: 21Records: 1,932,756
Years to be Analyzed: 1985 thru 2002
<- click at startup, if year range is changed
after database is modified,
or if data retrieval fails
Enter 'Ctrl-m' to return to menu
Click Here for General Help on Database
Click Here for Main Database Menu
3/31/2004
Analysis of Longterm Tributary Loading Database Onondaga County Department of Water Environment Protection
Version 1.0 - DRAFT
Number of Sampled Dates by Site, Variable, & YearNumber of Daily Records by Site & YearMean Daily Flows by Site & YearLong-Term or Yearly AveragesFlow-Wtd Concentrations by Variable, Site, & YearMean Daily Loads by Site, Variable, & YearDaily Time Series for a Given Site, Variable & YearMonth x Year CrosstabMonthly Time Series for a Given Site, Variable, & YearYearly Time Series for a Given Site & VariableLake Inflow Volumes, Loads, & Concentrations by YearLake Outflow Volumes, Loads, & Concs by Variable & YearDaily Time Series ChartMonthly Time Series ChartYearly Time Series Chart
View Sheet
Reconnect with Database
Help
13
Total
0
2
4
6
8
10
12
14
16
18
1/1/
1985
6/30
/198
512
/27/
1985
6/25
/198
612
/22/
1986
6/20
/198
712
/17/
1987
6/14
/198
812
/11/
1988
6/9/
1989
12/6
/198
96/
4/19
9012
/1/1
990
5/30
/199
111
/26/
1991
5/24
/199
211
/20/
1992
5/19
/199
311
/15/
1993
5/14
/199
411
/10/
1994
5/9/
1995
11/5
/199
55/
3/19
9610
/30/
1996
4/28
/199
710
/25/
1997
4/23
/199
810
/20/
1998
4/18
/199
910
/15/
1999
4/12
/200
010
/9/2
000
4/7/
2001
10/4
/200
14/
2/20
029/
29/2
002
Total
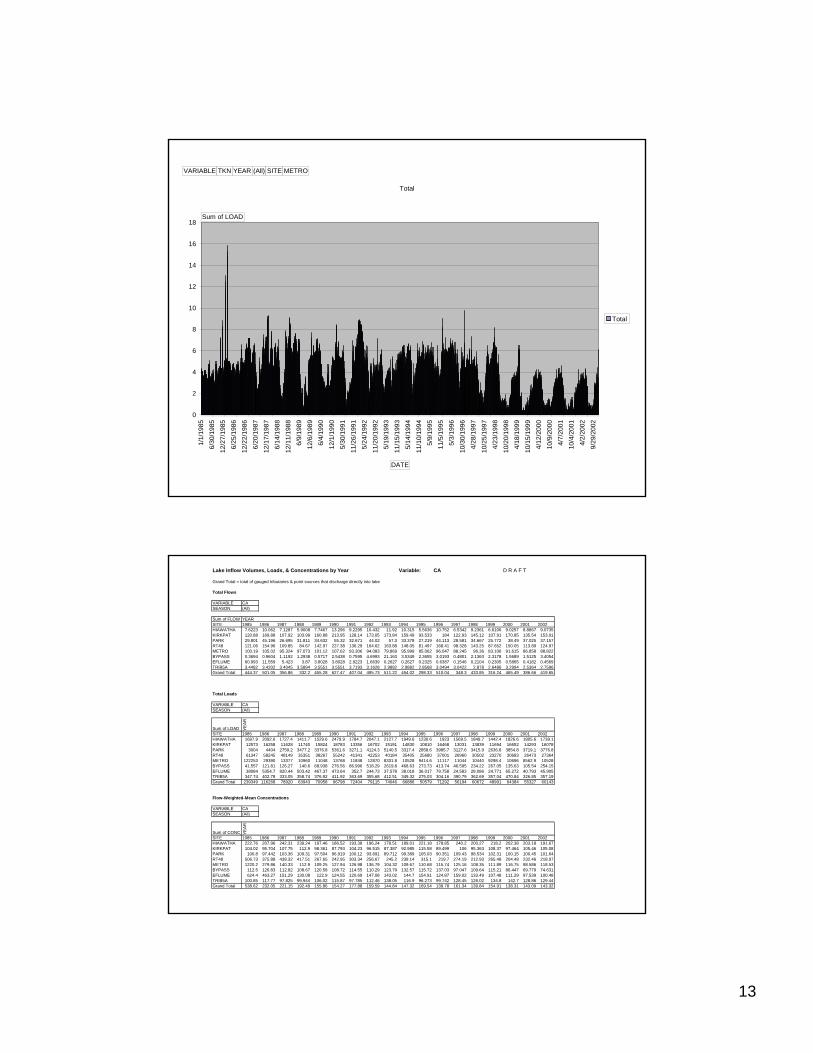
VARIABLE TKN YEAR (All) SITE METRO
Sum of LOAD
DATE
Lake Inflow Volumes, Loads, & Concentrations by Year Variable: CA D R A F T
Grand Total = total of gauged tributaries & point sources that discharge directly into lake
Total Flows
VARIABLE CASEASON (All)
Sum of FLOW YEARSITE 1985 1986 1987 1988 1989 1990 1991 1992 1993 1994 1995 1996 1997 1998 1999 2000 2001 2002HIAWATHA 7.6223 10.062 7.1287 5.9008 7.7467 13.296 9.2295 10.432 11.92 10.315 5.5636 10.752 6.5342 9.2361 6.6106 9.0257 8.8867 9.0735KIRKPAT 120.88 169.88 107.92 103.99 160.88 213.95 128.14 173.05 173.84 159.49 93.533 184 122.93 145.12 107.91 170.85 135.54 153.01PARK 29.801 45.196 26.695 31.811 34.632 55.32 32.671 44.02 57.3 33.378 27.219 44.113 28.581 34.667 25.772 38.49 37.025 37.157RT48 121.06 154.96 109.85 84.67 142.97 227.38 136.29 164.62 163.88 148.05 81.497 168.41 98.328 143.25 87.652 150.05 113.89 124.97METRO 100.19 105.02 95.324 97.073 101.12 107.62 93.306 94.083 79.869 95.999 85.062 96.047 88.245 96.36 83.106 91.615 86.858 88.822BYPASS 0.3694 0.9604 1.1192 1.2938 0.5717 2.5438 0.7595 4.6993 21.163 3.5349 2.3655 3.0193 0.4801 2.1363 2.3178 1.5689 1.5125 3.4054EFLUME 60.993 11.559 5.423 3.87 3.8028 3.8028 2.9223 1.6639 0.2627 0.2627 0.2325 0.6387 0.1546 0.2104 0.2305 0.5865 0.4182 0.4569TRIB5A 3.4482 3.4202 3.4045 3.5894 3.5551 3.5551 3.7193 3.1628 2.9882 2.9882 2.8568 3.0494 3.0422 2.878 2.6486 3.2994 2.5364 2.7596Grand Total 444.37 501.05 356.86 332.2 455.28 627.47 407.04 495.73 511.22 454.02 298.33 510.04 348.3 433.85 316.24 465.49 386.66 419.65
Total Loads
VARIABLE CASEASON (All)
Sum of LOAD YE
AR
SITE 1985 1986 1987 1988 1989 1990 1991 1992 1993 1994 1995 1996 1997 1998 1999 2000 2001 2002HIAWATHA 1697.9 2092.6 1727.4 1411.7 1529.6 2479.9 1784.7 2047.1 2127.7 1949.6 1230.6 1923 1569.5 1849.7 1442.4 1826.6 1805.6 1739.1KIRKPAT 12573 16258 11628 11740 15824 18783 13356 16702 15191 14830 10810 16468 13031 13839 11694 16652 14293 16078PARK 3004 4404 2759.2 3477.2 3376.8 5361.6 3271.1 4124.3 5140.5 3317.4 2858.6 3985.7 3127.6 3415.9 2636.8 3854.8 3719.1 3776.8RT48 61347 58245 48149 35351 38267 55242 41341 42253 40184 35405 25680 37001 26960 30502 23270 30683 26473 27364METRO 122253 29390 13377 10960 11048 13768 11848 12870 8331.8 10528 9414.6 11117 11044 10440 9298.4 10696 8562.9 10528BYPASS 41.557 121.81 126.27 140.6 68.938 276.56 86.996 518.29 2619.8 468.63 273.73 413.74 46.595 234.22 267.05 135.63 105.54 254.15EFLUME 38084 5354.7 820.44 503.42 467.37 473.64 352.7 244.73 37.578 38.018 36.017 79.758 24.583 28.086 24.771 65.272 40.793 45.905TRIB5A 347.74 402.78 333.05 358.74 376.92 411.92 363.69 355.68 412.51 349.32 275.03 304.16 390.79 362.69 357.04 470.84 326.85 357.19Grand Total 239349 116268 78920 63943 70958 96798 72404 79115 74046 66886 50579 71292 56194 60672 48991 64384 55327 60143
Flow-Weighted-Mean Concentrations
VARIABLE CASEASON (All)
Sum of CONC_ YEA
R
SITE 1985 1986 1987 1988 1989 1990 1991 1992 1993 1994 1995 1996 1997 1998 1999 2000 2001 2002HIAWATHA 222.76 207.96 242.31 239.24 197.46 186.52 193.38 196.24 178.51 189.01 221.18 178.85 240.2 200.27 218.2 202.38 203.18 191.67KIRKPAT 104.02 95.704 107.75 112.9 98.361 87.793 104.23 96.515 87.387 92.985 115.58 89.499 106 95.363 108.37 97.464 105.46 105.08PARK 100.8 97.442 103.36 109.31 97.504 96.919 100.12 93.691 89.712 99.389 105.03 90.351 109.43 98.534 102.31 100.15 100.45 101.64RT48 506.73 375.88 438.32 417.51 267.65 242.95 303.34 256.67 245.2 239.14 315.1 219.7 274.19 212.93 265.48 204.48 232.46 218.97METRO 1220.2 279.86 140.33 112.9 109.25 127.94 126.98 136.79 104.32 109.67 110.68 115.74 125.16 108.35 111.89 116.75 98.586 118.53BYPASS 112.5 126.83 112.82 108.67 120.58 108.72 114.55 110.29 123.79 132.57 115.72 137.03 97.047 109.64 115.21 86.447 69.779 74.631EFLUME 624.4 463.27 151.29 130.08 122.9 124.55 120.69 147.08 143.02 144.7 154.91 124.87 159.02 133.49 107.48 111.29 97.539 100.48TRIB5A 100.85 117.77 97.825 99.944 106.02 115.87 97.785 112.46 138.05 116.9 96.273 99.742 128.45 126.02 134.8 142.7 128.86 129.44Grand Total 538.62 232.05 221.15 192.49 155.86 154.27 177.88 159.59 144.84 147.32 169.54 139.78 161.34 139.84 154.91 138.31 143.09 143.32
14
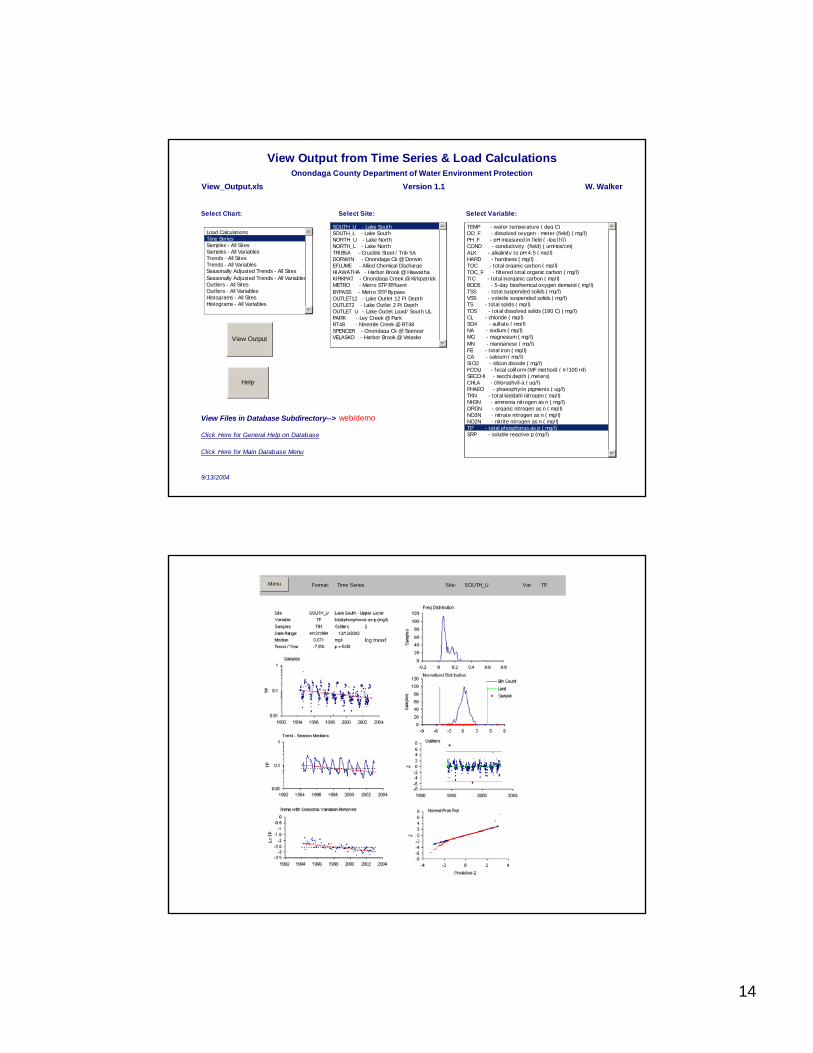
View_Output.xls Version 1.1 W. Walker
Select Chart: Select Site: Select Variable:
View Files in Database Subdirectory--> web/demo
Click Here for General Help on Database
Click Here for Main Database Menu
9/13/2004
View Output from Time Series & Load CalculationsOnondaga County Department of Water Environment Protection
Load CalculationsTime SeriesSamples - All SitesSamples - All VariablesTrends - All SitesTrends - All VariablesSeasonally Adjusted Trends - All SitesSeasonally Adjusted Trends - All VariablesOutliers - All SitesOutliers - All VariablesHistograms - All SitesHistograms - All Variables
SOUTH_U - Lake SouthSOUTH_L - Lake SouthNORTH_U - Lake NorthNORTH_L - Lake NorthTRIB5A - Crucible Steel / Trib 5ADORWIN - Onondaga Ck @ DorwinEFLUME - Allied Chemical DischargeHIAWATHA - Harbor Brook @ HiawathaKIRKPAT - Onondaga Creek @ KirkpatrickMETRO - Metro STP EffluentBYPASS - Metro STP BypassOUTLET12 - Lake Outlet 12 Ft DepthOUTLET2 - Lake Outlet 2 Ft DepthOUTLET_U - Lake Outlet Load/ South ULPARK - Ley Creek @ ParkRT48 - Ninemile Creek @ RT48SPENCER - Onondaga Ck @ SpencerVELASKO - Harbor Brook @ Velasko
TEMP - water temperature ( deg C)DO_F - dissolved oxygen - meter (field) ( mg/l)PH_F - pH measured in field ( -log [h])COND - conductivity (field) ( umHos/cm)ALK - alkalinity to pH 4.5 ( mg/l)HARD - hardness ( mg/l)TOC - total organic carbon ( mg/l)TOC_F - filtered total organic carbon ( mg/l)TIC - total inorganic carbon ( mg/l)BOD5 - 5-day biochemical oxygen demand ( mg/l)TSS - total suspended solids ( mg/l)VSS - volatile suspended solids ( mg/l)TS - total solids ( mg/l)TDS - total dissolved solids (180 C) ( mg/l)CL - chloride ( mg/l)SO4 - sulfate ( mg/l)NA - sodium ( mg/l)MG - magnesium ( mg/l)MN - manganese ( mg/l)FE - total iron ( mg/l)CA - calcium ( mg/l)SIO2 - silicon dioxide ( mg/l)FCOLI - fecal coliform (MF method) ( #/100 ml)SECCHI - secchi depth ( meters)CHLA - chlorophyll-a ( ug/l)PHAEO - phaeophytin pigments ( ug/l)TKN - total kjeldahl nitrogen ( mg/l)NH3N - ammonia nitrogen as n ( mg/l)ORGN - organic nitrogen as n ( mg/l)NO3N - nitrate nitrogen as n ( mg/l)NO2N - nitrite nitrogen as n ( mg/l)TP - total phosphorus as p ( mg/l)SRP - soluble reactive p (mg/l)
View Output
Help
Format: Time Series Site: SOUTH_U Var: TPMenu
15
Format: Trends - All Sites Site: SOUTH_U Var: TP File: c:\0jobs\onondaga_datMenu
Format: Trends - All Variables Site: OUTLET12 Var: TP File: c:\0jobs\onondaga_databaMenu
16
17
18
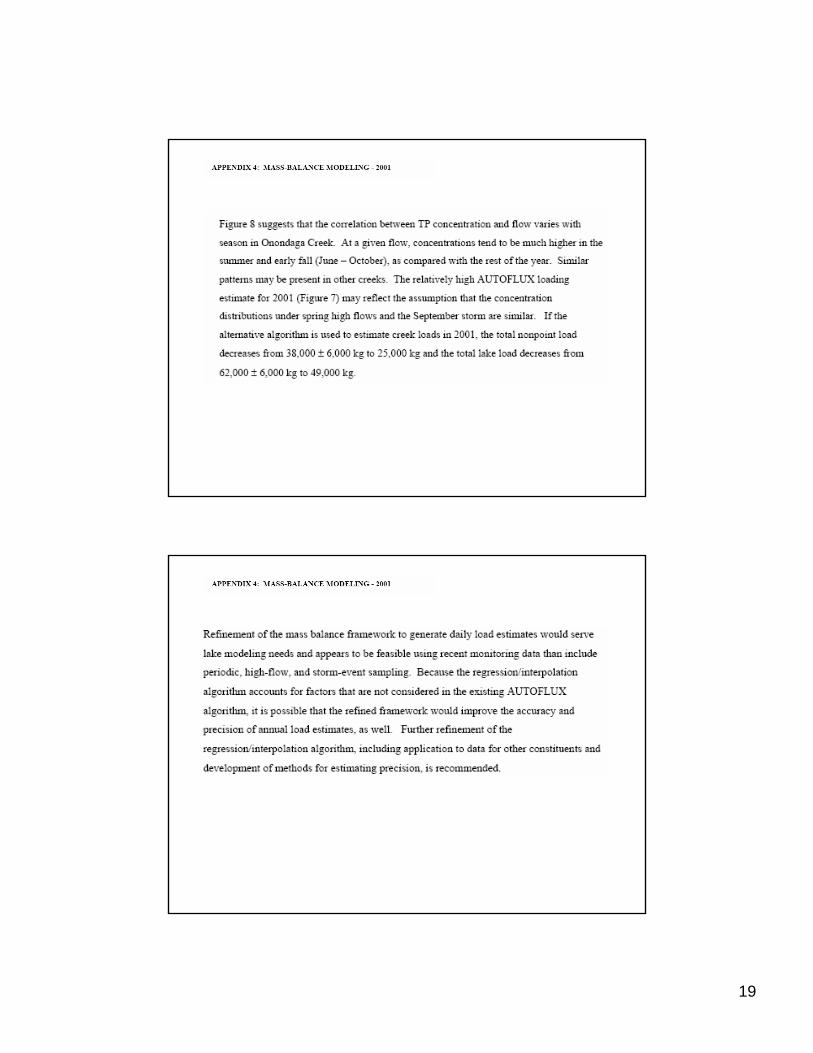
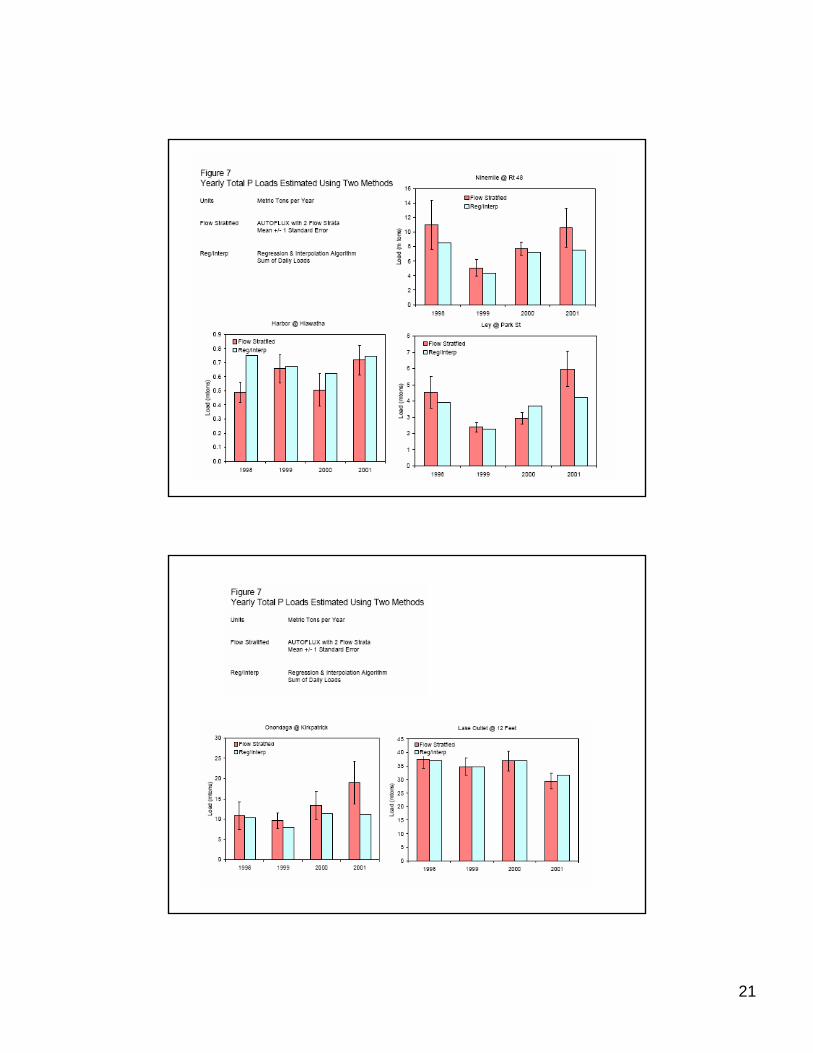
19
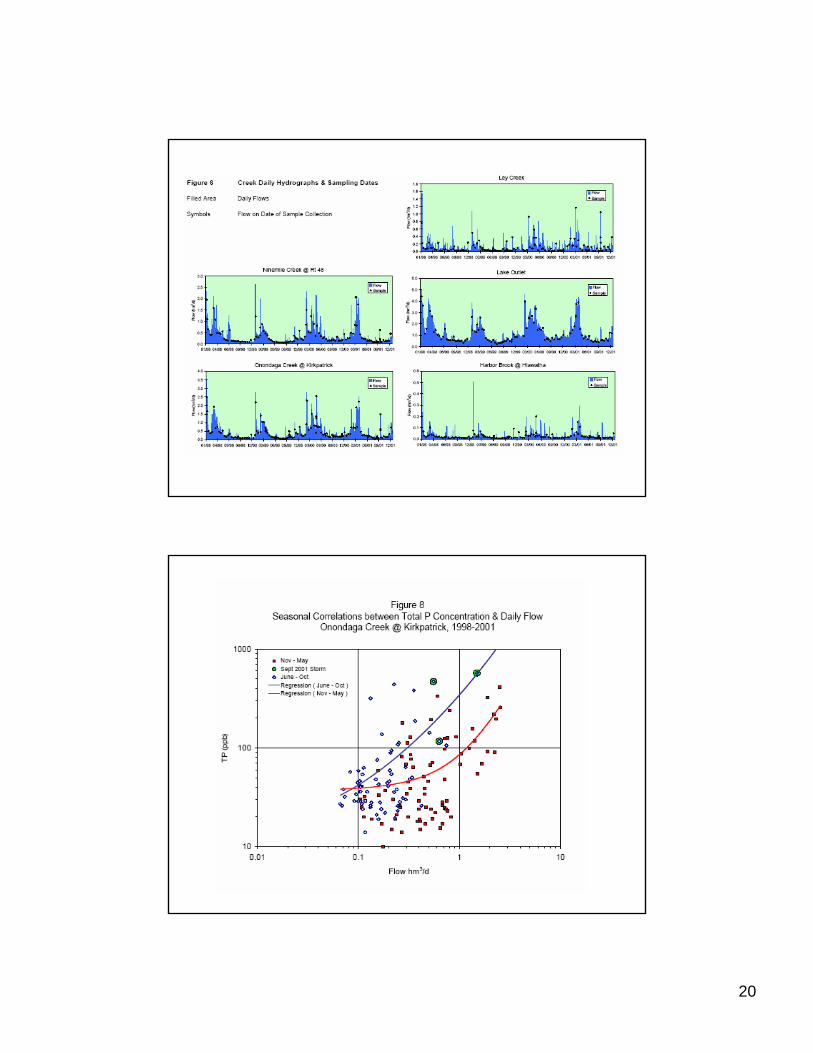
20
21
22
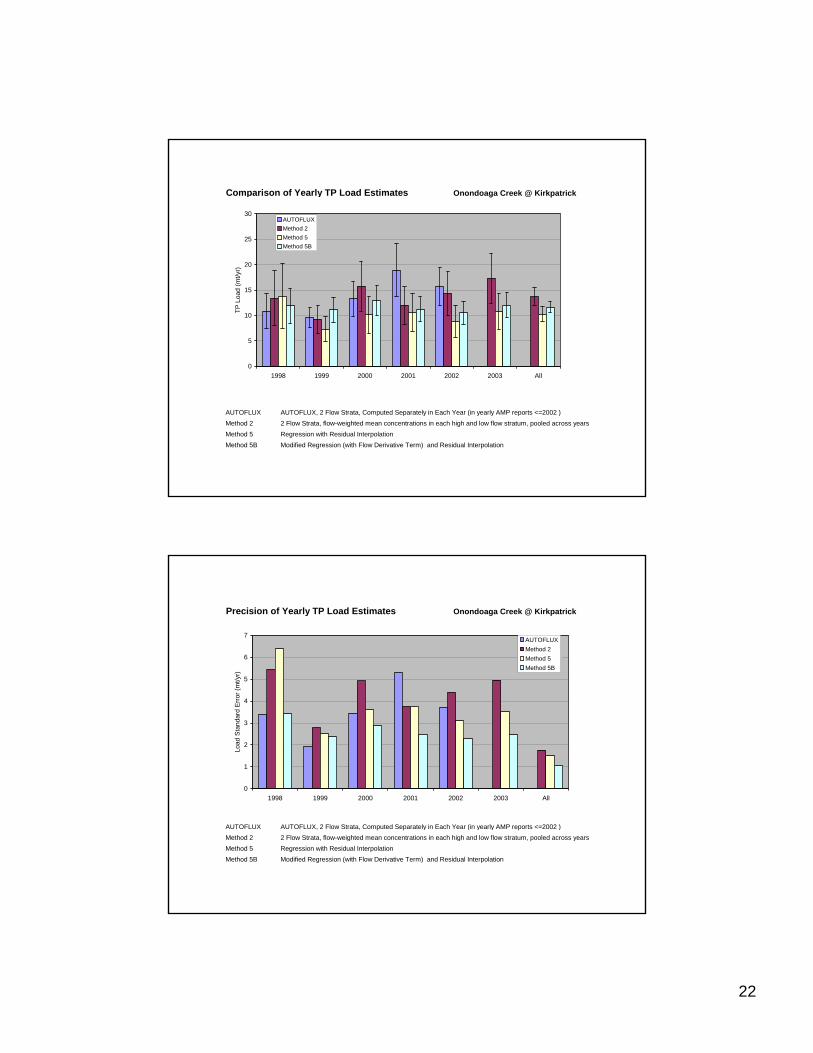
Comparison of Yearly TP Load Estimates Onondoaga Creek @ Kirkpatrick
AUTOFLUX AUTOFLUX, 2 Flow Strata, Computed Separately in Each Year (in yearly AMP reports <=2002 )Method 2 2 Flow Strata, flow-weighted mean concentrations in each high and low flow stratum, pooled across yearsMethod 5 Regression with Residual InterpolationMethod 5B Modified Regression (with Flow Derivative Term) and Residual Interpolation
0
5
10
15
20
25
30
1998 1999 2000 2001 2002 2003 All
TP L
oad
(mt/y
r)
AUTOFLUXMethod 2 Method 5Method 5B
Precision of Yearly TP Load Estimates Onondoaga Creek @ Kirkpatrick
AUTOFLUX AUTOFLUX, 2 Flow Strata, Computed Separately in Each Year (in yearly AMP reports <=2002 )Method 2 2 Flow Strata, flow-weighted mean concentrations in each high and low flow stratum, pooled across yearsMethod 5 Regression with Residual InterpolationMethod 5B Modified Regression (with Flow Derivative Term) and Residual Interpolation
0
1
2
3
4
5
6
7
1998 1999 2000 2001 2002 2003 All
Load
Sta
ndar
d Er
ror (
mt/y
r)
AUTOFLUXMethod 2 Method 5Method 5B
23
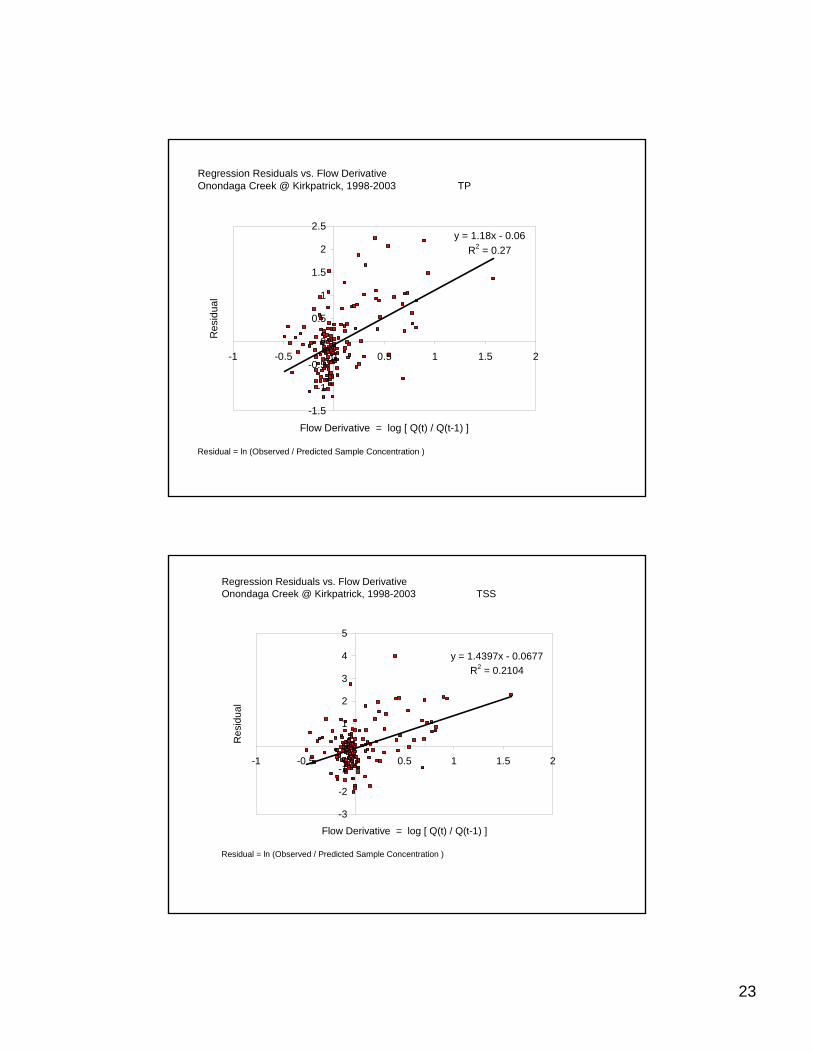
Regression Residuals vs. Flow DerivativeOnondaga Creek @ Kirkpatrick, 1998-2003 TP
Residual = ln (Observed / Predicted Sample Concentration )
y = 1.18x - 0.06R2 = 0.27
-1.5
-1
-0.5
0
0.5
1
1.5
2
2.5
-1 -0.5 0 0.5 1 1.5 2
Flow Derivative = log [ Q(t) / Q(t-1) ]
Res
idua
l
Regression Residuals vs. Flow DerivativeOnondaga Creek @ Kirkpatrick, 1998-2003 TSS
Residual = ln (Observed / Predicted Sample Concentration )
y = 1.4397x - 0.0677R2 = 0.2104
-3
-2
-1
0
1
2
3
4
5
-1 -0.5 0 0.5 1 1.5 2
Flow Derivative = log [ Q(t) / Q(t-1) ]
Res
idua
l
24
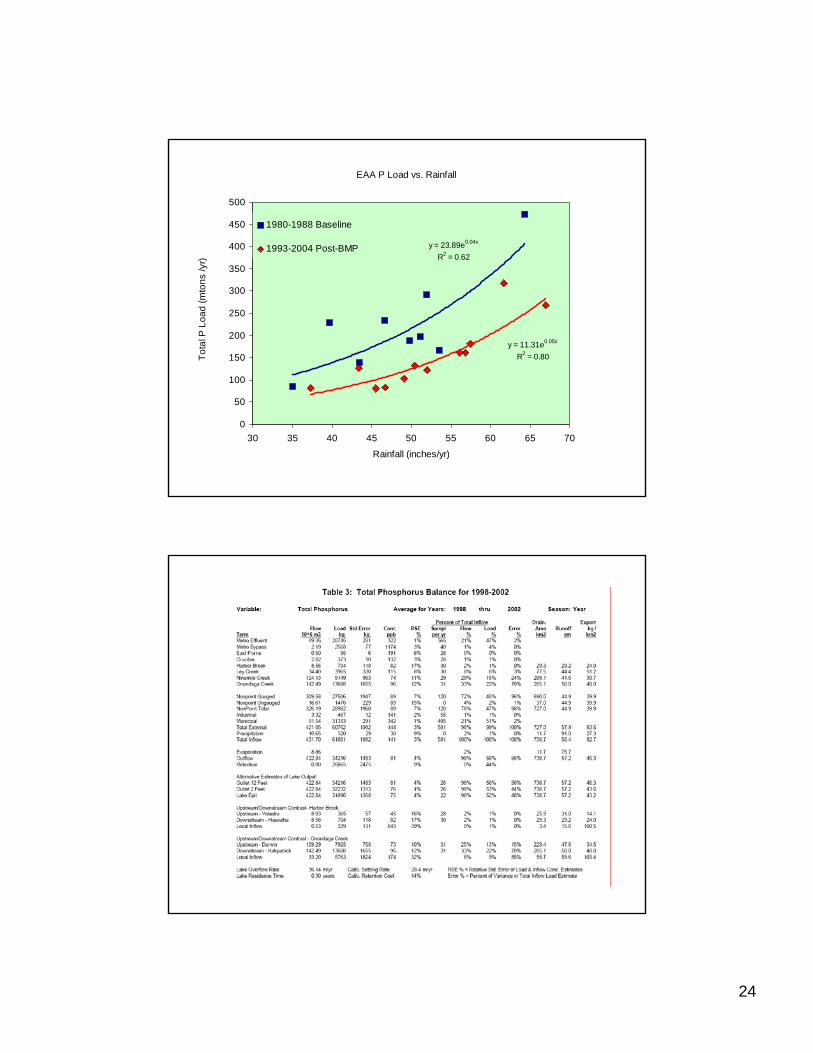
EAA P Load vs. Rainfall
y = 23.89e0.04x
R2 = 0.62
y = 11.31e0.05x
R2 = 0.80
0
50
100
150
200
250
300
350
400
450
500
30 35 40 45 50 55 60 65 70
Rainfall (inches/yr)
Tota
l P L
oad
(mto
ns /y
r)
1980-1988 Baseline
1993-2004 Post-BMP
25
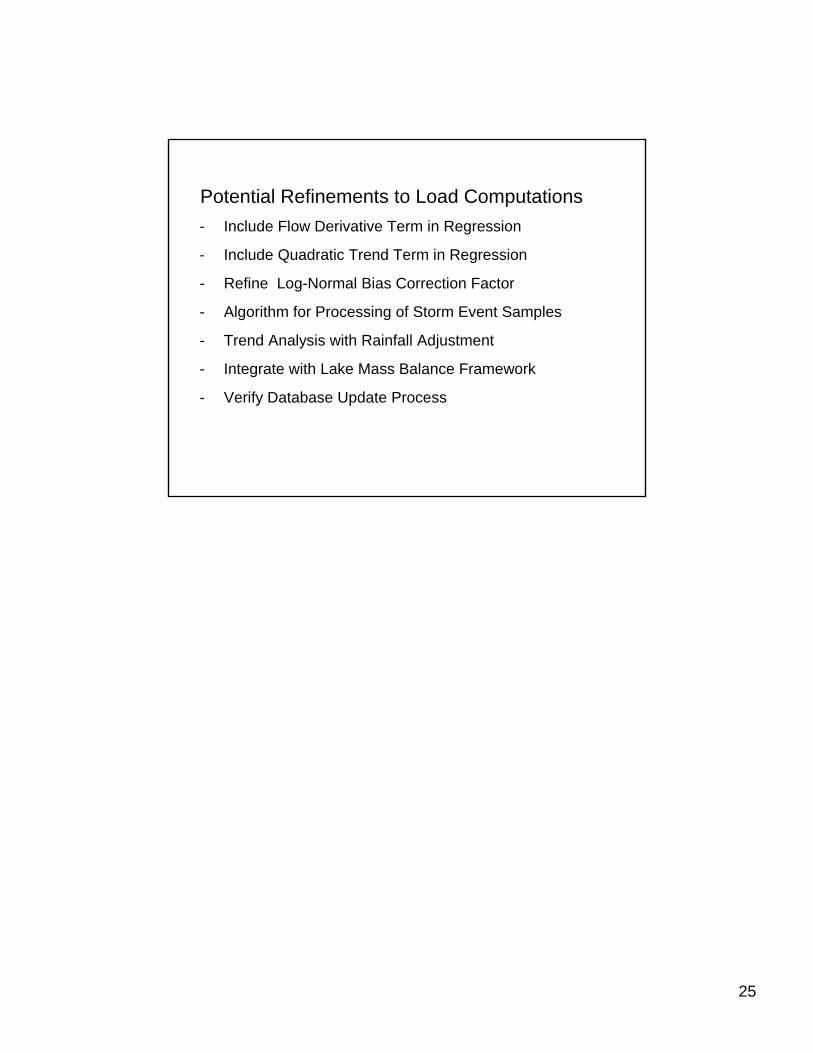
Potential Refinements to Load Computations- Include Flow Derivative Term in Regression
- Include Quadratic Trend Term in Regression
- Refine Log-Normal Bias Correction Factor
- Algorithm for Processing of Storm Event Samples
- Trend Analysis with Rainfall Adjustment
- Integrate with Lake Mass Balance Framework
- Verify Database Update Process