Embed Size (px)
Citation preview
HAL Id: hal-00302872https://hal.archives-ouvertes.fr/hal-00302872
Submitted on 14 Jun 2007
HAL is a multi-disciplinary open accessarchive for the deposit and dissemination of sci-entific research documents, whether they are pub-lished or not. The documents may come fromteaching and research institutions in France orabroad, or from public or private research centers.
L’archive ouverte pluridisciplinaire HAL, estdestinée au dépôt et à la diffusion de documentsscientifiques de niveau recherche, publiés ou non,émanant des établissements d’enseignement et derecherche français ou étrangers, des laboratoirespublics ou privés.
Long-time global radiation for Central Europe derivedfrom ISCCP Dx data
N. Petrenz, M. Sommer, F. H. Berger
To cite this version:N. Petrenz, M. Sommer, F. H. Berger. Long-time global radiation for Central Europe derived fromISCCP Dx data. Atmospheric Chemistry and Physics Discussions, European Geosciences Union, 2007,7 (3), pp.8333-8360. �hal-00302872�
ACPD
7, 8333–8360, 2007
Long-time global
radiation derived
from ISCCP Dx data
N. Petrenz et al.
Title Page
Abstract Introduction
Conclusions References
Tables Figures
◭ ◮
◭ ◮
Back Close
Full Screen / Esc
Printer-friendly Version
Interactive Discussion
EGU
Atmos. Chem. Phys. Discuss., 7, 8333–8360, 2007
www.atmos-chem-phys-discuss.net/7/8333/2007/
© Author(s) 2007. This work is licensed
under a Creative Commons License.
AtmosphericChemistry
and PhysicsDiscussions
Long-time global radiation for Central
Europe derived from ISCCP Dx data
N. Petrenz1, M. Sommer
1, and F. H. Berger
1,2
1TU Dresden, Institute of Hydrology and Meteorology, Department of Meteorology, 01062
Dresden, Germany2German Meteorological Service, Meteorological Observatory Lindenberg (FE LG), 15848
Tauche/Lindenberg, Germany
Received: 4 May 2007 – Accepted: 5 June 2007 – Published: 14 June 2007
Correspondence to: N. Petrenz ([email protected])
8333
ACPD
7, 8333–8360, 2007
Long-time global
radiation derived
from ISCCP Dx data
N. Petrenz et al.
Title Page
Abstract Introduction
Conclusions References
Tables Figures
◭ ◮
◭ ◮
Back Close
Full Screen / Esc
Printer-friendly Version
Interactive Discussion
EGU
Abstract
The global Dx dataset of the “International Satellite Cloud Climatology Project” (IS-
CCP) with a spatial resolution of about 30×30 km2
was analysed to produce spatially
highly resolved long-time datasets to describe the radiation budget for Central Europe
over the period of 1984–2000. The computation of shortwave and longwave radiant5
flux densities at top of atmosphere and at surface was based on 1-D radiative transfer
simulations. The simulations were carried out for all relevant atmospheric and surface
conditions and the results were inserted into a look-up table. Thus, long-time calcula-
tions for all conditions and time slices of the Dx dataset could be realised. The study is
focussed on the global radiation at surface.10
The first examination was carried out for the ISCCP D1 and the ISCCP D2 dataset.
These datasets, including cloud and surface information on a different spatial scale
(280×280 km2), were applied to the produced look-up table analogue to the Dx data.
The calculated global radiation of the D1 and D2 dataset were compared to the Dx
dataset. The differences between these datasets mainly range from 5–15 W m−2
(2–15
6 %) with regional peaks up to 25 W m−2
(10 %).
The evaluation with the GEWEX “Surface Radiation Budget” (SRB) data emphasises
differ-ences between 5–25 W m−2
(6–16%) over land areas. Deviations to an ISCCP
provided flux data set vary from 0 W m−2
in the North up to 35 W m−2
(0–13%) in the
South of Central Europe.20
The global radiation datasets provided by the “Global Energy Balance Archive”
(GEBA) and the “German Meteorological Service” (DWD) agree well, but they are 5–
25 W m−2
(7–10%) lower than the Dx results.
Annual analyses of global radiation of various regional climate models complete the
study. It is figured out that the used models and methods reveal a couple of discrep-25
ancies. Especially in wintertime the results of our analysis differ to the considered
models. Principally the uncer-tainties were caused by the determined range of values
and simplifications for the computa-tion of the radiative transfer simulation.
8334
ACPD
7, 8333–8360, 2007
Long-time global
radiation derived
from ISCCP Dx data
N. Petrenz et al.
Title Page
Abstract Introduction
Conclusions References
Tables Figures
◭ ◮
◭ ◮
Back Close
Full Screen / Esc
Printer-friendly Version
Interactive Discussion
EGU
1 Introduction
The knowledge of incoming and outgoing shortwave and longwave radiant flux densi-
ties pro-vides the key information for the net balance and thus for energy exchanges
between atmos-phere and surface. Therefore it is necessary to infer these radiant flux
densities as accurately as possible to realise a correct characterisation of the Earth’s5
climate system (Hollmann et al., 2006). The radiation budget is object of investigation
in numerous studies, which infer radiant flux densities at top of atmosphere (TOA) and
at surface using ground based measurements or remotely sensed data (Raschke et
al., 2005, 2006).
Among others the “Global Energy Balance Archive” (GEBA/Gilgen et al., 1997;10
Gilgen and Ohmura, 1999), the “Baseline Surface Radiation Network” (BSRN/Ohmura
et al., 1998), the Atmospheric Radiation Measurement” (ARM/Stokes and Schwartz,
1994) or the “Surface Ra-diation Budget Network” (SURFRAD/Augustine et al., 2000)
provide high quality datasets from surface observation sites with directly measured or
derived radiant flux densities. Due to the point measurements spatial interpolations15
are ambiguous and mostly less representative because of the wide distances between
the stations within meteorological networks. Remote sensing systems collect radiative
properties and surface temperatures at different temporal and spatial scales allowing
the derivation of area-integrated radiances and radiant flux densities at different atmo-
spheric layers. In this regard the global datasets of the “Earth Radiation Budget Ex-20
periment” (ERBE/Barkstrom et al., 1989), the “International Satellite Cloud Climatology
Project” (ISCCP/Schiffer and Rossow, 1983), the “Clouds and the Earth’s Radiant En-
ergy System” (CERES/Wielicki et al., 1998) or the GEWEX “Surface Radiation Budget”
(SRB/Stackhouse et al., 2000) are often applied. Estimations of shortwave and long-
wave surface radiation fluxes from satellite measurements are carried out with specially25
developed algorithms consisting of simple parameterisations concerning cloud physics,
atmosphere and aerosols (Darnell et al., 1988, 1992; Gupta et al., 1992; Pinker and
Laszlo, 1992; Pinker et al., 1995; Rossow and Zhang, 1995; Zhang et al., 1995). The
8335
ACPD
7, 8333–8360, 2007
Long-time global
radiation derived
from ISCCP Dx data
N. Petrenz et al.
Title Page
Abstract Introduction
Conclusions References
Tables Figures
◭ ◮
◭ ◮
Back Close
Full Screen / Esc
Printer-friendly Version
Interactive Discussion
EGU
evaluation of calculated radiative flux components is complicated since the parameter-
isation of atmospheric and surface properties is still problematic in model approaches.
The decisive input to the climate system is the incoming solar radiation, which is
nearly con-stant at TOA. Incoming solar radiation is attenuated by the atmosphere and
the description of this process of radiative transfer is treated differently by the available5
transfer codes. Further investigations regarding other radiation budget components as-
sume an exact determination of the direct and diffuse incoming solar radiation (global
radiation). This paper describes and discusses a specially developed method for calcu-
lating radiation budget components at TOA and at surface using various ISCCP data.
Detailed analyses and comparisons for the global radiation are shown.10
2 Input data and method description
2.1 Data source
The ISCCP datasets with a current availability from July 1983 to December 2004 are
used to compute the shortwave and longwave radiant flux components for both TOA
and surface. At present three datasets (Dx/D1/D2) exist combining data of all available15
geostationary and polar orbit weather satellites (Rossow et al., 1996; Rossow and
Schiffer, 1999). The datasets build up on each other (D1 on Dx and D2 on D1) and
include a nearly complete global information of various cloud properties. Table 1 gives
a summery of the spatial and temporal resolution of the datasets as well as the used
parameters.20
Additionally the weekly snow/ice cover data from the “NOAA/National Environmental
Satellite Data and Information Service” (NESDIS) and from the NAVY/NOAA Joint Ice
Center (see Rossow et al., 1991) are enclosed.
As reference the three-hourly ISCCP Dx data with a spatial sampling resolution of
approx. 30×30 km2, one random pixel of 4–7 km without specific knowledge of location25
is characteristic for the whole grid cell, is used. ISCCP D1 and D2 are datasets with an
8336
ACPD
7, 8333–8360, 2007
Long-time global
radiation derived
from ISCCP Dx data
N. Petrenz et al.
Title Page
Abstract Introduction
Conclusions References
Tables Figures
◭ ◮
◭ ◮
Back Close
Full Screen / Esc
Printer-friendly Version
Interactive Discussion
EGU
equal area grid of approx. 280×280 km2
(2.5◦×2.5
◦at the equator), but with different
temporal sampling intervals. Thus the D1 dataset provides three-hourly cloud informa-
tion and the D2 dataset is statistically averaged to three-hourly monthly means (see
more details in Rossow et al., 1996).
All calculations are carried out over the period of 1984–2000 (17 years) covering a5
region of 65◦N/35
◦E/30
◦S/15
◦W (henceforth Central Europe). In the run-up to radia-
tive transfer simulations gaps, plausibility and spatial structures for each dataset are
tested. The global D1 and D2 time series of cloud amount and surface temperature
have only few gaps (<0.2%). Due to the method creating the equal-area grid cells
uncertainties in spatial structures are possible. But the analysis exhibited logical spa-10
tial structures. In contrast the gaps of parameters, which are estimated only during
the day, like optical thickness, cloud type and reflectivity, are more extensive (approx.
5.0%) and cause uncertainties for further computations. Furthermore at the edge of
the geostationary satellite images the data are either missing or of insufficient quality.
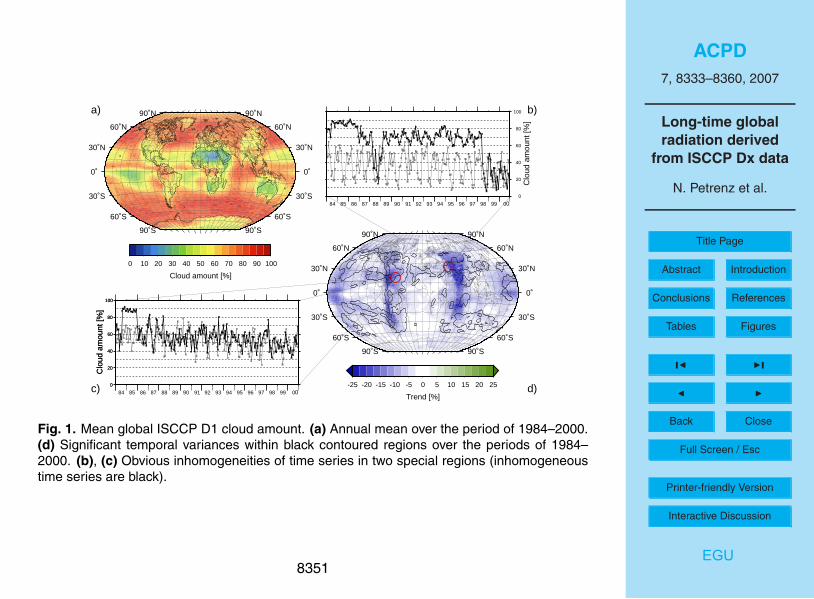
In Fig. 1d the mean global cloud amount of the D1 dataset over the whole period15
is shown in context with the calculated temporal trends. To avoid the influences of
seasonal variations annual means are produced and applied to the trend analysis. A
clear negative trend in the cloud amount of about 2.5% over wide areas with regional
peaks of 15.0% and more is observed. To verify the detected trends the non-parametric
Mann-Kendall test – applicable in case of non-linear trends – is used (Rapp, 2000):20
Q =
N−1∑
i=1
N∑
j=i+1
sgn(yj − yi )
√
118
[N(N − 1)(2N + 5)]
(1)
where Q is the numerical test value, N is the length of the time series, sgn describes
the leading sign, yi and yj are the values to compare. The test only rates the relative
increase or decrease of the values but provides no detailed information of time depen-
dent changes. The corresponding confidence interval V and the probability value α25
8337
ACPD
7, 8333–8360, 2007
Long-time global
radiation derived
from ISCCP Dx data
N. Petrenz et al.
Title Page
Abstract Introduction
Conclusions References
Tables Figures
◭ ◮
◭ ◮
Back Close
Full Screen / Esc
Printer-friendly Version
Interactive Discussion
EGU
to every calculated Q are taken from Rapp (2000). In Fig. 1 the visible global trends
are only significant within the contoured regions exhibiting a confidence interval of
V >99.7%. At the edge of the geostationary satellite images the largest negative trends
occur which are also statistically firmed. Evaluating these trends the time series of two
joining pixel in two different areas are investi-gated (red circles).5
Figure 1c reveals the inhomogenities over the period of August 1984 to December
1985 (black graph). Long-term measurement gaps of the operational geostationary
satellite GOES-East were discovered that intensify these trends. The black graph in
Fig. 1b represents a pixel that belongs to the disk recorded by the geostationary satel-
lite INSAT. The data of this satellite only exist for the period of April 1988 to March10
1989. Due to this huge failure only the data of polar orbit satellites were available
twice per day therefore providing insufficient measurements. At the beginning of 1998
Meteosat-5 has been replaced to the position 63◦
East to compensate for the full disk
of INSAT resulting in consistent time series. Regarding to these analyses the observed
and assured trends within the critical regions are adulterated. For Central Europe only15
Meteosat data are used. There no profoundly long-term gaps and failures could be
located.
The used ISCCP Dx dataset includes pixel level cloud information that is primarily
based on the information of the cloud mask (1=clouds; 0=no clouds) and on relevant
information of cloud top temperature, cloud top pressure and cloud optical thickness.20
With these parameters a classification of cloud classes and cloud layers according to
Rossow et al. (1996) is carried out. 15 cloud classes and three cloud layers could be
determined and the frequencies of each are calculated.
2.2 Radiative Transfer Model (RTM) and method
The computations are carried out with the complex 1-D RTM Streamer, that calculates25
radi-ances and radiant flux densities at each atmospheric level for several atmospheric
and surface conditions (Key, 2001; version 3.0 beta 7). The solution of the radiative
transfer equation can be realized for a horizontal plane-parallel atmosphere with the
8338
ACPD
7, 8333–8360, 2007
Long-time global
radiation derived
from ISCCP Dx data
N. Petrenz et al.
Title Page
Abstract Introduction
Conclusions References
Tables Figures
◭ ◮
◭ ◮
Back Close
Full Screen / Esc
Printer-friendly Version
Interactive Discussion
EGU
Delta-2-Stream-Approximation (Toon et al., 1989) and the Discrete-Ordinate-Method
(DISORT) according to Stamnes et al. (1988). To estimate shortwave (0.2–4.0µm)
and longwave (4.0–500.0µm) radiant flux densities at different layers special input pa-
rameters are required regarding clouds, their geo-metrical, optical and microphysical
properties as well as surface and atmospheric properties. First calculations are carried5
out for the monthly D2 dataset at 12:00 UTC. For that purpose the input parameters
are taken directly from the dataset except information concerning the microphysics of
clouds. The microphysical cloud parameters, like Liquid/Ice Water Content (LWC/IWC)
and effective radius re, are defined according to Polar Radiation Fluxes from ISCCP
(PRFI, 2000). Thus LWC is 0.2 gm−3
and re is 10µm for water clouds and IWC is10
0.07 gm−3
and re is 30µm for ice clouds. Atmospheric and aerosol standard profiles
from surface (0 km) up to TOA (100 km) are specified within the model. The different
vegetation types of the D datasets are adapted to the vegetation types defined in the
RTM Streamer followed by the internal modulation of reflectivity.
To handle radiative transfer computations for all ISCCP D datasets and all radiation15
budget components for the period of 1984–2000 (17 years) look-up tables are a useful
instrument. Hence relevant nodes of all individual model input parameters are defined
and radiative trans-fer computations are carried out for all expedient input parameter
combinations. The resulting shortwave and longwave radiant flux densities with their
appropriate parameter sets are tabulated. Now for every individual input parameter set20
of each grid cell at each time slice the corresponding radiant flux densities can be de-
rived using multidimensional linear interpolations between the parameter increments.
3 Results
3.1 Comparison with other satellite derived data products
The computed and altitude corrected global radiation at surface over the period of25
1984–2000 is based on the highly resolved ISCCP Dx dataset and is shown in Fig. 2
8339
ACPD
7, 8333–8360, 2007
Long-time global
radiation derived
from ISCCP Dx data
N. Petrenz et al.
Title Page
Abstract Introduction
Conclusions References
Tables Figures
◭ ◮
◭ ◮
Back Close
Full Screen / Esc
Printer-friendly Version
Interactive Discussion
EGU
for Central Europe. There the distinctive North-South gradient with values of about
75 W m−2
in the North and maxima of 300 W m−2
in the South of the investigation area
is shown in Fig. 2a. Data gaps along the coastlines are displayed in white. Due to
the solely usage of Meteosat data the covered area is limited to the scanned disk so
less values above ca. 60◦
latitude exist. Figure 2b shows the temporal variability of5
global radiation for the 17 years examined. A statisti-cally firmed increase of global
radiation (10–20 W m−2
) in the South of the target area is distinguished. The strong
contours indicate regions with a confidence interval >99.7% and fine contours assign
a confidence interval of >90.0–95.0%. Positive and negative trends are detected in the
remaining Central Europe as well, but they could not be certified.10
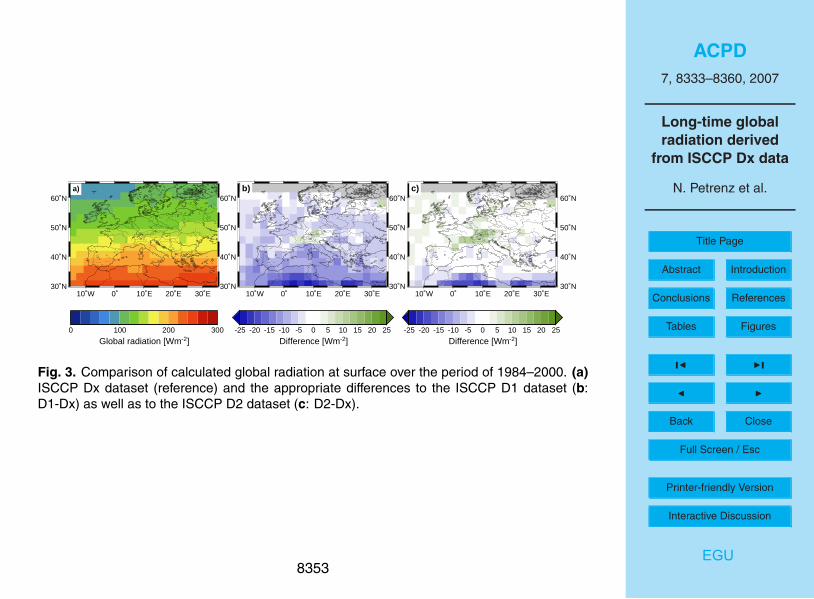
Additionally the global radiation for the ISCCP D1 and ISCCP D2 datasets was com-
puted using the same look-up table as for the Dx dataset in order to provide a common
basis for comparisons between the three datasets. Due to their different temporal and
spatial resolutions the datasets are adapted and upscaled to the resolution of the D2
dataset (monthly means, 280×280 km2). Figure 3 shows that over wide areas the radi-15
ant flux densities of the D1 dataset are approx. 10–15 W m−2
lower than the Dx dataset,
except for the most southern area where differences increase up to 20–30 W m−2
. In
contrast deviations between the Dx and the D2 dataset only appear in few regions,
most notably in alpine regions and in North Africa. Thus values up to ±25 W m−2
in
comparison to the Dx dataset can be observed. Considerable discrepancies to the20
Dx dataset are detected for higher altitudes (Alps) with higher values and for arid en-
vironment (North Africa) with lower values for the D1 and D2 dataset. That suggests
possible uncertainties in altitude correction and in atmospheric and subjacent surface
parameterisation. Given the identical analysis the deviations between the ISCCP D
datasets using same method indicate that after adapting to the comparable resolution25
the parameters of the origin datasets from Dx over D1 to D2 differ considerably. The
differences at northern latitudes above 60◦
are not relevant due to the insufficient Dx
data quality as above mentioned.
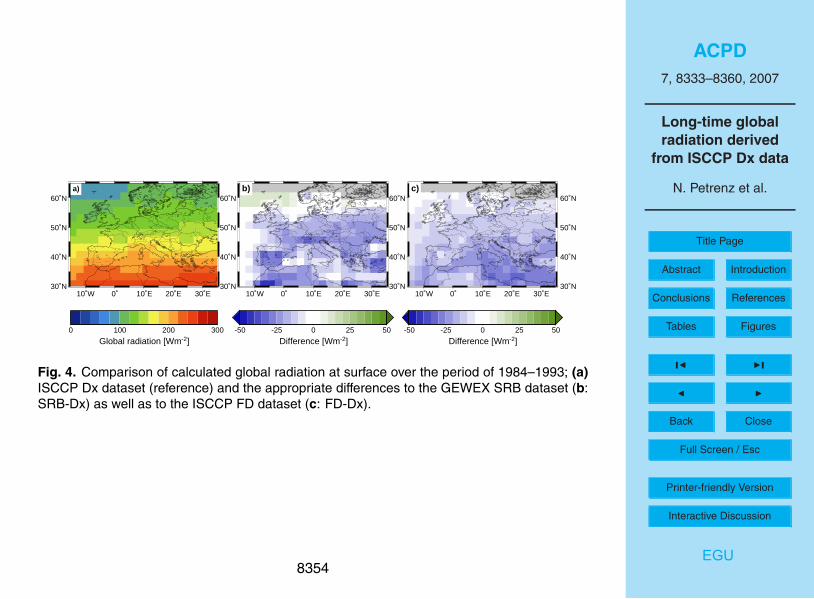
For verification of the Streamer results the satellite data products of the GEWEX SRB
8340
ACPD
7, 8333–8360, 2007
Long-time global
radiation derived
from ISCCP Dx data
N. Petrenz et al.
Title Page
Abstract Introduction
Conclusions References
Tables Figures
◭ ◮
◭ ◮
Back Close
Full Screen / Esc
Printer-friendly Version
Interactive Discussion
EGU
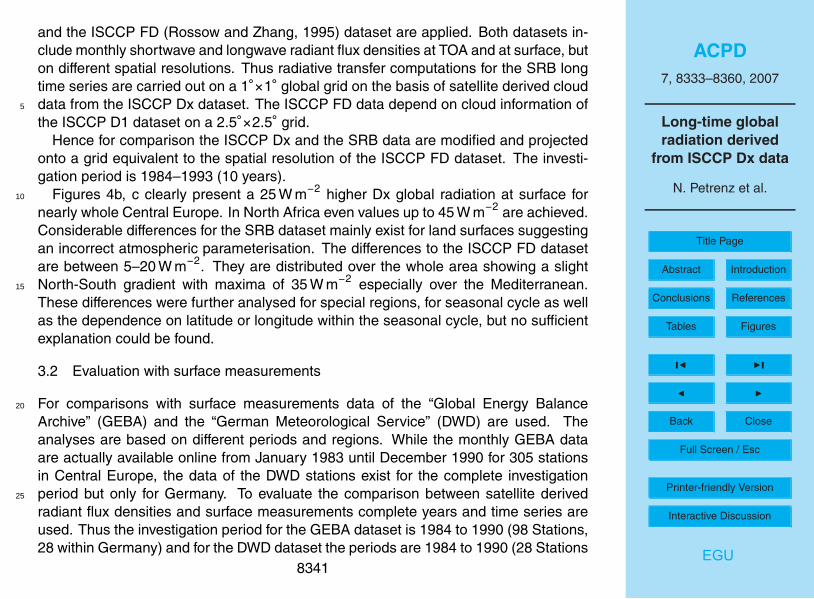
and the ISCCP FD (Rossow and Zhang, 1995) dataset are applied. Both datasets in-
clude monthly shortwave and longwave radiant flux densities at TOA and at surface, but
on different spatial resolutions. Thus radiative transfer computations for the SRB long
time series are carried out on a 1◦×1
◦global grid on the basis of satellite derived cloud
data from the ISCCP Dx dataset. The ISCCP FD data depend on cloud information of5
the ISCCP D1 dataset on a 2.5◦×2.5
◦grid.
Hence for comparison the ISCCP Dx and the SRB data are modified and projected
onto a grid equivalent to the spatial resolution of the ISCCP FD dataset. The investi-
gation period is 1984–1993 (10 years).
Figures 4b, c clearly present a 25 W m−2
higher Dx global radiation at surface for10
nearly whole Central Europe. In North Africa even values up to 45 W m−2
are achieved.
Considerable differences for the SRB dataset mainly exist for land surfaces suggesting
an incorrect atmospheric parameterisation. The differences to the ISCCP FD dataset
are between 5–20 W m−2
. They are distributed over the whole area showing a slight
North-South gradient with maxima of 35 W m−2
especially over the Mediterranean.15
These differences were further analysed for special regions, for seasonal cycle as well
as the dependence on latitude or longitude within the seasonal cycle, but no sufficient
explanation could be found.
3.2 Evaluation with surface measurements
For comparisons with surface measurements data of the “Global Energy Balance20
Archive” (GEBA) and the “German Meteorological Service” (DWD) are used. The
analyses are based on different periods and regions. While the monthly GEBA data
are actually available online from January 1983 until December 1990 for 305 stations
in Central Europe, the data of the DWD stations exist for the complete investigation
period but only for Germany. To evaluate the comparison between satellite derived25
radiant flux densities and surface measurements complete years and time series are
used. Thus the investigation period for the GEBA dataset is 1984 to 1990 (98 Stations,
28 within Germany) and for the DWD dataset the periods are 1984 to 1990 (28 Stations
8341

ACPD
7, 8333–8360, 2007
Long-time global
radiation derived
from ISCCP Dx data
N. Petrenz et al.
Title Page
Abstract Introduction
Conclusions References
Tables Figures
◭ ◮
◭ ◮
Back Close
Full Screen / Esc
Printer-friendly Version
Interactive Discussion
EGU
regarding to GEBA) and 1984–2000 (34 Stations).
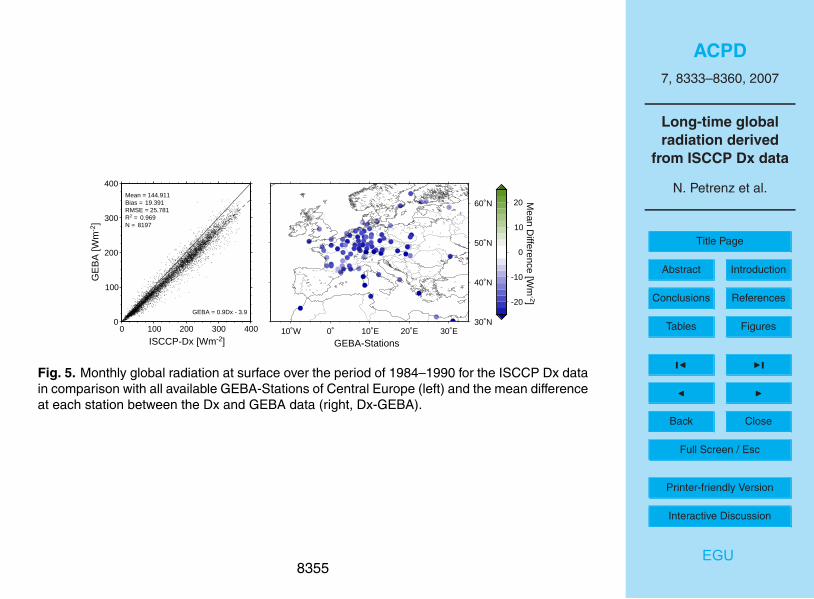
The results are statistically analysed and presented in Fig. 5. The scatterplot (Fig. 5,
left) reflects a good agreement for the global radiation at surface derived from ISCCP
Dx data and the values directly measured at the GEBA stations within the correspond-
ing ISCCP Dx pixel (30×30 km2). But with increasing global radiation values an in-5
crease in scattering is visible. The included statistics for the two datasets reveals that
over the whole investigation period the RMSE is 25.8 W m−2
and the bias is about
19.4 W m−2
. Thus, the values of the ISCCP-Dx pixel are on the average 10% higher
than the values directly measured at the ground stations also mirrored in the equation
for the best linear fit. The differences range from 5–25 W m−2
.10
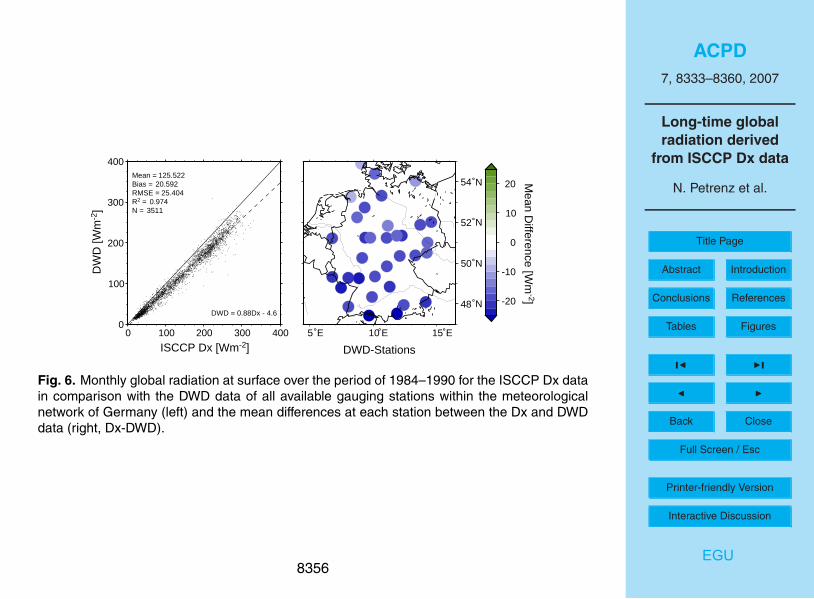
Other investigations are carried out for Germany using the data of the DWD and
GEBA. The scatterplot in Figure 6 illustrates that the Dx global radiation and the DWD
global radiation match well, but the Dx data are approx. 12% higher than the DWD data.
Outliers are mainly observed for the ISCCP Dx data with tendency to be higher than the
pyranometer measurements. The RMSE and the bias between the two datasets are15
25.4 W m−2
and about 20.6 W m−2
respectively. At the individual stations differences
from 10–25 W m−2
occur.
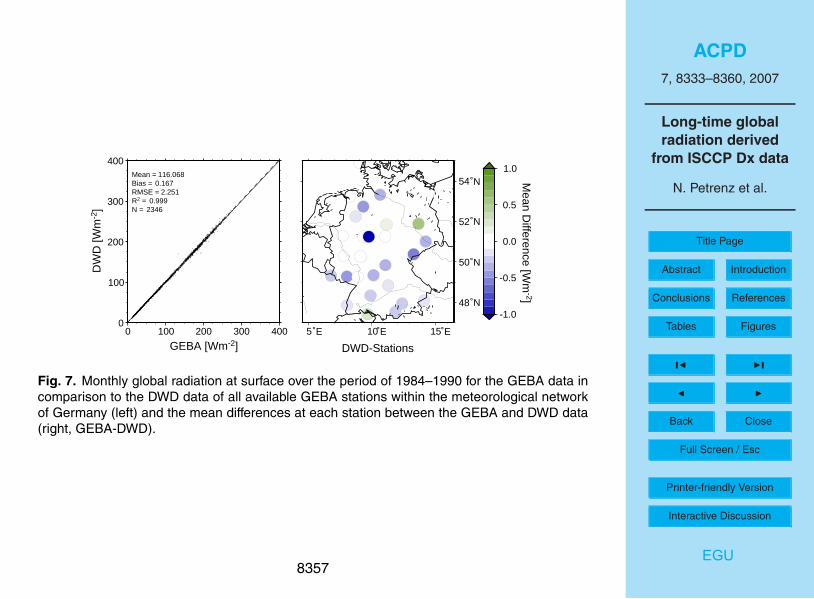
In Fig. 7 analyses regarding observation site measurements of GEBA and DWD are
demonstrated. Excluding a few outliers it is apparent that the data show almost no
deviations solely the GEBA data are in most instances slightly lower than the DWD20
data. As expected the surface measurements (GEBA and DWD) agree.
Among the potential reasons for deviations between satellite data and surface mea-
surements, like coarse atmospheric parameterisation within Streamer or changing
aerosol contents, the target comparison between a point measurement and an area of
30×30 km2
is one of the most effective. The individual pixels within this section have a25
resolution of 4–7 km. For each time slice one random pixel is used to describe the con-
dition of the whole area. Suboptimal case is that every time an other pixel is chosen to
represent a Dx grid cell. Another problem are the radiances determined onboard satel-
lites and in situ because of the different spectral channels of the radiometers. Philipona
8342
ACPD
7, 8333–8360, 2007
Long-time global
radiation derived
from ISCCP Dx data
N. Petrenz et al.
Title Page
Abstract Introduction
Conclusions References
Tables Figures
◭ ◮
◭ ◮
Back Close
Full Screen / Esc
Printer-friendly Version
Interactive Discussion
EGU
(2002) assumes in his investigations that unconditioned pyranometer measurements in
the past systematically underestimate downward shortwave radiant flux density. After
an appropriate correction an approximation of measured and modelled data could be
achieved. Generally the uncertainties of surface measurements should be taken into
account for validation.5
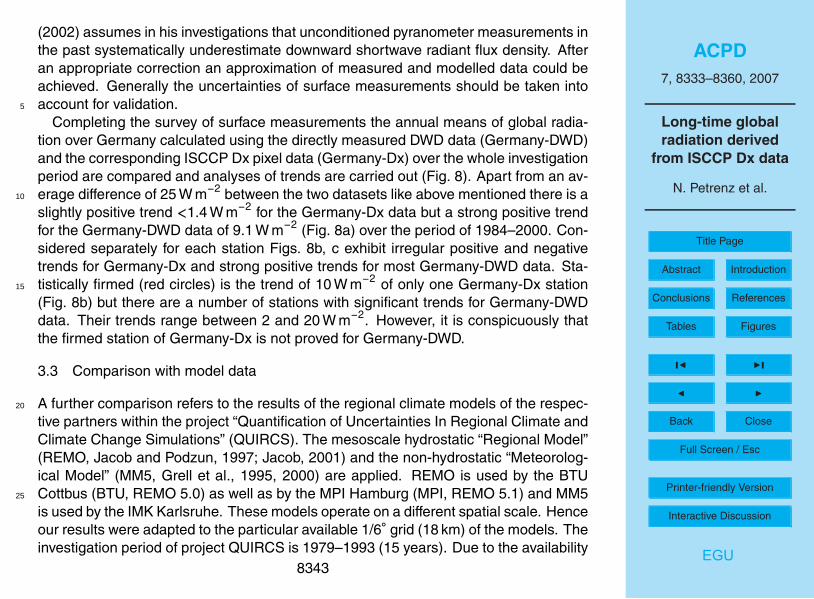
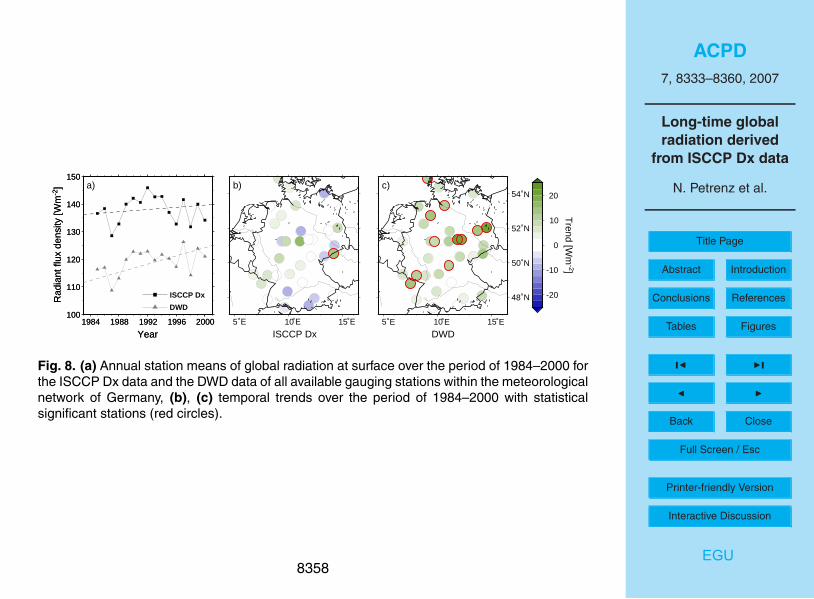
Completing the survey of surface measurements the annual means of global radia-
tion over Germany calculated using the directly measured DWD data (Germany-DWD)
and the corresponding ISCCP Dx pixel data (Germany-Dx) over the whole investigation
period are compared and analyses of trends are carried out (Fig. 8). Apart from an av-
erage difference of 25 W m−2
between the two datasets like above mentioned there is a10
slightly positive trend <1.4 W m−2
for the Germany-Dx data but a strong positive trend
for the Germany-DWD data of 9.1 W m−2
(Fig. 8a) over the period of 1984–2000. Con-
sidered separately for each station Figs. 8b, c exhibit irregular positive and negative
trends for Germany-Dx and strong positive trends for most Germany-DWD data. Sta-
tistically firmed (red circles) is the trend of 10 W m−2
of only one Germany-Dx station15
(Fig. 8b) but there are a number of stations with significant trends for Germany-DWD
data. Their trends range between 2 and 20 W m−2
. However, it is conspicuously that
the firmed station of Germany-Dx is not proved for Germany-DWD.
3.3 Comparison with model data
A further comparison refers to the results of the regional climate models of the respec-20
tive partners within the project “Quantification of Uncertainties In Regional Climate and
Climate Change Simulations” (QUIRCS). The mesoscale hydrostatic “Regional Model”
(REMO, Jacob and Podzun, 1997; Jacob, 2001) and the non-hydrostatic “Meteorolog-
ical Model” (MM5, Grell et al., 1995, 2000) are applied. REMO is used by the BTU
Cottbus (BTU, REMO 5.0) as well as by the MPI Hamburg (MPI, REMO 5.1) and MM525
is used by the IMK Karlsruhe. These models operate on a different spatial scale. Hence
our results were adapted to the particular available 1/6◦
grid (18 km) of the models. The
investigation period of project QUIRCS is 1979–1993 (15 years). Due to the availability
8343
ACPD
7, 8333–8360, 2007
Long-time global
radiation derived
from ISCCP Dx data
N. Petrenz et al.
Title Page
Abstract Introduction
Conclusions References
Tables Figures
◭ ◮
◭ ◮
Back Close
Full Screen / Esc
Printer-friendly Version
Interactive Discussion
EGU
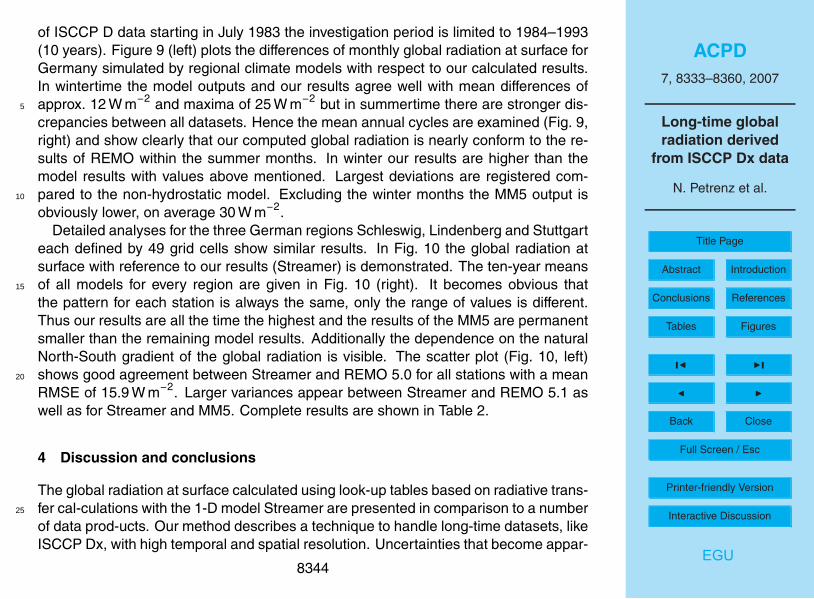
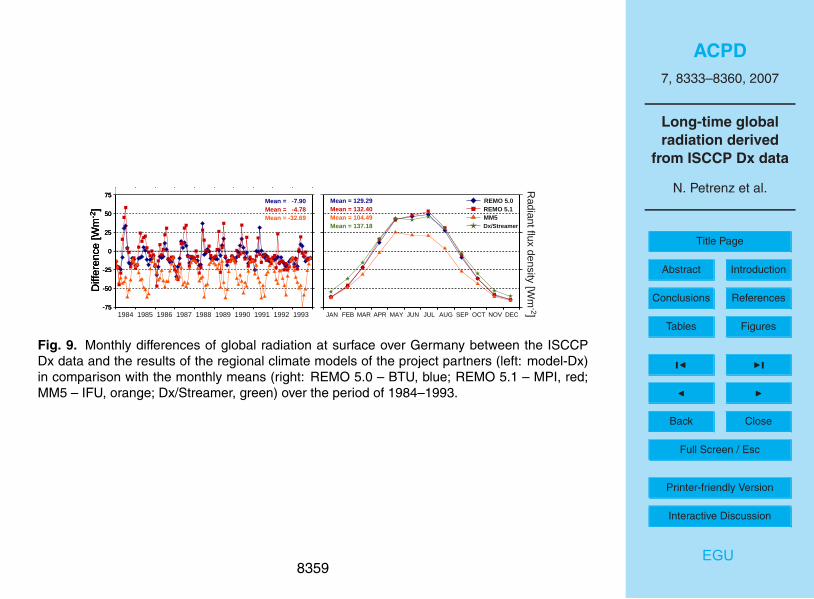
of ISCCP D data starting in July 1983 the investigation period is limited to 1984–1993
(10 years). Figure 9 (left) plots the differences of monthly global radiation at surface for
Germany simulated by regional climate models with respect to our calculated results.
In wintertime the model outputs and our results agree well with mean differences of
approx. 12 W m−2
and maxima of 25 W m−2
but in summertime there are stronger dis-5
crepancies between all datasets. Hence the mean annual cycles are examined (Fig. 9,
right) and show clearly that our computed global radiation is nearly conform to the re-
sults of REMO within the summer months. In winter our results are higher than the
model results with values above mentioned. Largest deviations are registered com-
pared to the non-hydrostatic model. Excluding the winter months the MM5 output is10
obviously lower, on average 30 W m−2
.
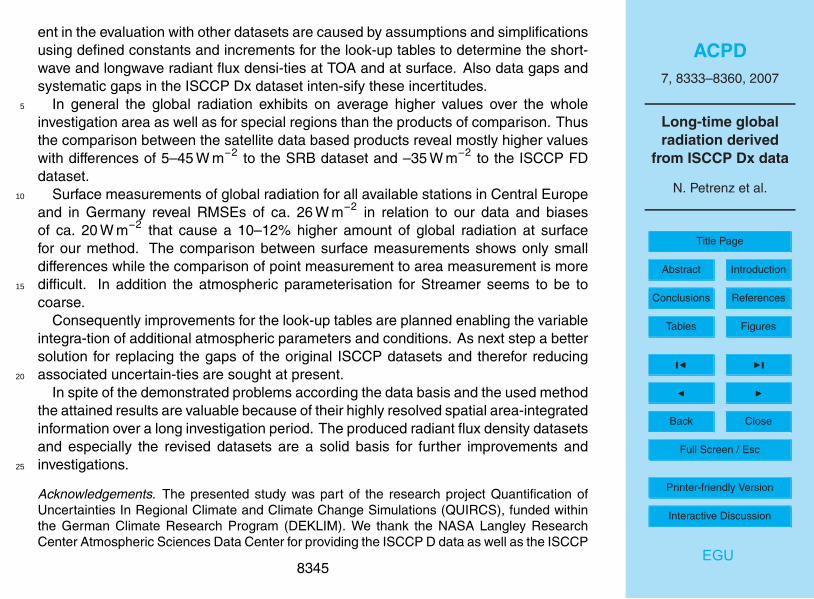
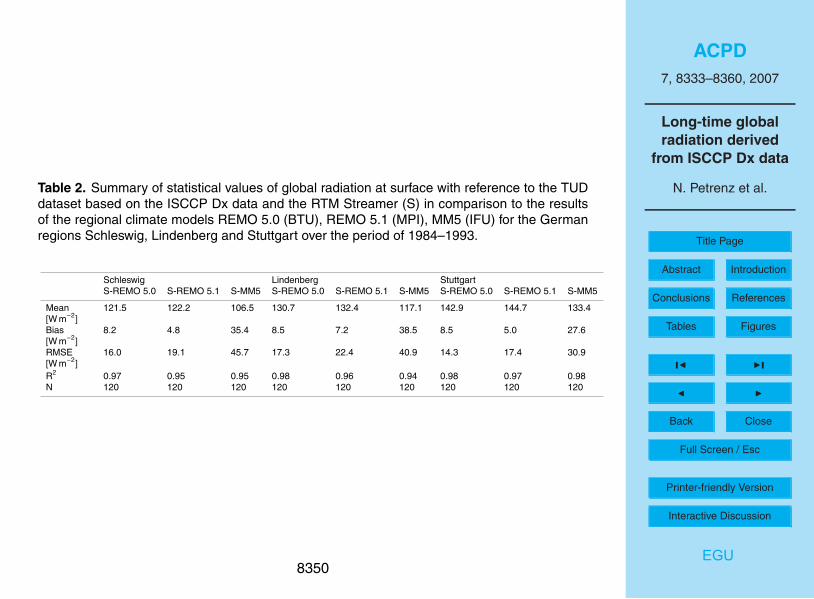
Detailed analyses for the three German regions Schleswig, Lindenberg and Stuttgart
each defined by 49 grid cells show similar results. In Fig. 10 the global radiation at
surface with reference to our results (Streamer) is demonstrated. The ten-year means
of all models for every region are given in Fig. 10 (right). It becomes obvious that15
the pattern for each station is always the same, only the range of values is different.
Thus our results are all the time the highest and the results of the MM5 are permanent
smaller than the remaining model results. Additionally the dependence on the natural
North-South gradient of the global radiation is visible. The scatter plot (Fig. 10, left)
shows good agreement between Streamer and REMO 5.0 for all stations with a mean20
RMSE of 15.9 W m−2
. Larger variances appear between Streamer and REMO 5.1 as
well as for Streamer and MM5. Complete results are shown in Table 2.
4 Discussion and conclusions
The global radiation at surface calculated using look-up tables based on radiative trans-
fer cal-culations with the 1-D model Streamer are presented in comparison to a number25
of data prod-ucts. Our method describes a technique to handle long-time datasets, like
ISCCP Dx, with high temporal and spatial resolution. Uncertainties that become appar-
8344
ACPD
7, 8333–8360, 2007
Long-time global
radiation derived
from ISCCP Dx data
N. Petrenz et al.
Title Page
Abstract Introduction
Conclusions References
Tables Figures
◭ ◮
◭ ◮
Back Close
Full Screen / Esc
Printer-friendly Version
Interactive Discussion
EGU
ent in the evaluation with other datasets are caused by assumptions and simplifications
using defined constants and increments for the look-up tables to determine the short-
wave and longwave radiant flux densi-ties at TOA and at surface. Also data gaps and
systematic gaps in the ISCCP Dx dataset inten-sify these incertitudes.
In general the global radiation exhibits on average higher values over the whole5
investigation area as well as for special regions than the products of comparison. Thus
the comparison between the satellite data based products reveal mostly higher values
with differences of 5–45 W m−2
to the SRB dataset and –35 W m−2
to the ISCCP FD
dataset.
Surface measurements of global radiation for all available stations in Central Europe10
and in Germany reveal RMSEs of ca. 26 W m−2
in relation to our data and biases
of ca. 20 W m−2
that cause a 10–12% higher amount of global radiation at surface
for our method. The comparison between surface measurements shows only small
differences while the comparison of point measurement to area measurement is more
difficult. In addition the atmospheric parameterisation for Streamer seems to be to15
coarse.
Consequently improvements for the look-up tables are planned enabling the variable
integra-tion of additional atmospheric parameters and conditions. As next step a better
solution for replacing the gaps of the original ISCCP datasets and therefor reducing
associated uncertain-ties are sought at present.20
In spite of the demonstrated problems according the data basis and the used method
the attained results are valuable because of their highly resolved spatial area-integrated
information over a long investigation period. The produced radiant flux density datasets
and especially the revised datasets are a solid basis for further improvements and
investigations.25
Acknowledgements. The presented study was part of the research project Quantification of
Uncertainties In Regional Climate and Climate Change Simulations (QUIRCS), funded within
the German Climate Research Program (DEKLIM). We thank the NASA Langley Research
Center Atmospheric Sciences Data Center for providing the ISCCP D data as well as the ISCCP
8345
ACPD
7, 8333–8360, 2007
Long-time global
radiation derived
from ISCCP Dx data
N. Petrenz et al.
Title Page
Abstract Introduction
Conclusions References
Tables Figures
◭ ◮
◭ ◮
Back Close
Full Screen / Esc
Printer-friendly Version
Interactive Discussion
EGU
FD and GEWEX SRB data. The surface radiation data (GEBA, DWD data) have been kindly
provided by the ETH Zurich and the German Meteorological Service. We thank J. Key for
providing the RTM Streamer. The authors wish to thank all involved persons for their help and
for supplying model results.
References5
Augustine, J. A., DeLuisi, J. J., and Long, C. N.: SURFRAD – A National Surface Radia-
tion Budget Network for Atmospheric research, Bull. Amer. Meteorol. Soc., 81, 2341–2357,
2000.
Barkstrom, B., Harrison, E., Smith, G., Green, R., Kibler, J., Cess, R., and the ERBE Science
Team: Earth Radiation Budget Experiment (ERBE) archival and April 1985 results, Bull.10
Amer. Meteorol. Soc., 70, 1254–1262, 1989.
Darnell, W. L., Staylor, W. F., Gupta, S. K., and Denn, F. M.: Estimation of Surface Insolation
using sun-synchronous Satellite data, J. Climate, 1, 820–835, 1988.
Darnell, W. L., Staylor, W. F., Gupta, S. K., Ritchey, N. A., and Wilber, A. C.: Seasonal variation
of surface radiation budget derived from International Satellite Cloud Climatology Project C115
data, J. Geophys. Res., 97, 15 741–15 760, 1992.
Jacob, D. and Podzun, R.: Sensitivity studies with the regional climate model REMO, Meteorol.
Atmos. Phys., 63, 119–129, 1997.
Jacob, D.: A note to the simulation of the annual and inter-annual variability of the water budget
over the Baltic Sea drainage basin, Meteorol. Atmos. Phys., 77, 61–73, 2001.20
Gilgen, H., Wild, M., and Ohmura, A.: Global Energy Balance Archive (GEBA) Report 3: The
GEBA Version 1995 Database, Zurcher Geographische Schriften 74, 105 pp. (available from
Institute of Geography ETH, Winterthurerstr. 190, CH-8057 Zurich, Switzerland), 1997.
Gilgen, H. and Ohmura, A.: The Global Energy Balance Archive (GEBA), Bull. Amer. Meteorol.
Soc., 80, 831–850, 1999.25
Grell, G. A., Dudhia, J., and Stauffer, D. R.:. A description of the fifth generation Penn
State/NCAR mesoscale model (MM5), Technical report, National Centre for Atmospheric
Research, Boulder, Colorado, USA, NCAR/TN-398+STR, 1995.
Grell, G. A., Schade, L., Knoche, R., Pfeiffer, A., and Egger, J.: Nonhydrostatic climate simu-
lations over complex terrain, J. Geophys. Res., 105(D4), 29 595–29 608, 2000.30
8346
ACPD
7, 8333–8360, 2007
Long-time global
radiation derived
from ISCCP Dx data
N. Petrenz et al.
Title Page
Abstract Introduction
Conclusions References
Tables Figures
◭ ◮
◭ ◮
Back Close
Full Screen / Esc
Printer-friendly Version
Interactive Discussion
EGU
Gupta, S. K., Darnell, W. L., and Wilber, A. C.: A Parametrization for Longwave Surface Radia-
tion from Satellite Data: Recent Improvements, J. Appl. Meteorol., 31, 1361–1367, 1992.
Hollmann, R., Muller, R. W., and Gratzki, A.: CM-SAF surface radiation budget: First results
with AVHRR data, Adv. Space Res., 37, 2166–2171, doi:10.1016/j.asr.2005.10.044, 2006.
Key, J. R.: Streamer – User’s Guide, NOAA/NESDIS, 70pp., 2001.5
McMillin, L. M.: Evaluation of a Classification Method for Retrieving Atmospheric Tempera-tures
from Satellite Measurements, J. Appl. Meteorol., 30, 432–446, 1991.
Ohmura, A., Dutton, E. G., Forgan, B., and Co-Authors: Baseline Surface Radiation Net-
work (BSRN/WCRP): New Precision Radiometry for Climate Research, Bull. Amer. Meteorol.
Soc., 79, 2115–2136, 1998.10
Pinker, R. T. and Laszlo, I.: Modeling Surface Solar Irradiance for Satellite Applications on a
Global Scale, J. Appl. Meteorol., 31, 194–211, 1992.
Pinker, R. T., Frouin, R., and Li, Z.: A Review of Satellite Methods to Derive Surface Short-wave
Irradiance, Rem. Sens. Environ., 51, 108–124, 1995.
PRFI: Polar Radiation Fluxes from ISCCP (PRFI) – Procedure Description, http://stratus.ssec.15
wisc.edu/products/d1fluxes/fluxes3.html, 2000.
Rapp, J.: Konzeption, Problematik und Ergebnisse klimatologischer Trends fur Europa und
Deutschland, Berichte des Deutschen Wetterdienstes 212, Offenbach am Main, Selbstverlag
des Deutschen Wetterdienstes, 2000.
Raschke, E., Ohmura, A., Rossow, W. B., Carlson, B. E., Zhang, Y. C., Stubenrauch, C., Kottek,20
M., and Wild, M.: Cloud Effects on the Radiation Budget Based on ISCCP Data (1991 to
1995), Int. J. Climatol., 25, 1103–1125, 2005.
Raschke, E., Bakan, S., and Kinne, S.: An assessment of radiation budget data provided by the
ISCCP and GEWEX-SRB, Geophys. Res. Lett., 33, L07812, doi:10.1029/2005GL025503,
2006.25
Rossow, W. B. and Schiffer, R. A.: ISCCP Cloud data Products, Bull. Amer. Meteorol. Soc., 72,
2–20, 1991.
Rossow, W. B., Garder, L. C., Lu, P. J., and Walker, A. W.: International Satellite Cloud Clima-
tology Project (ISCCP) Documentation of Cloud Data, WMO/TD-266, (revised), 76pp. plus
three appendices, World Clim. Res. Progr. (ICSU and WMO), Geneva, March, 1991.30
Rossow, W. B. and Zhang, Y. C.: Calculation of Surface and Top of Atmosphere Radiative
Fluxes from Physical Quantities Based on ISCCP Data Sets, 2. Validation and first results,
J. Geophys. Res., 100, 1167–1197, 1995.
8347
ACPD
7, 8333–8360, 2007
Long-time global
radiation derived
from ISCCP Dx data
N. Petrenz et al.
Title Page
Abstract Introduction
Conclusions References
Tables Figures
◭ ◮
◭ ◮
Back Close
Full Screen / Esc
Printer-friendly Version
Interactive Discussion
EGU
Rossow, W. B. and Zhang, Y. C.: Documentation of Radiative Flux Dataset (FC), http://isccp.
giss.nasa.gov/docs/docs fc.html, 1995.
Rossow, W. B., Walker, A. W., Beuschel, D. E., and Roiter, M. D.: International Satellite Cloud
Climatology Project (ISCCP): Documentation of new cloud Datasets, WMO/TD-No. 737,
World climate research Programme (ICSU and WMO), Genf, 1996.5
Rossow, W. B. and Schiffer, R. A.: Advances in Understanding Clouds from ISCCP, Bull. Amer.
Meteorol. Soc., 80, 2261–2287, 1999.
Schiffer, R. A. and Rossow, W. B.: The International Satellite Cloud Climatology Project (IS-
CCP): The first project of the World Climate Research Programme, Bull. Amer. Meteorol.
Soc., 64, 779–984, 1983.10
Stackhouse, P. W., Gupta, S. K., Cox, S. J., Chiacchio, M., and Mikovitz, J. C.: The
WCRP/GEWEX Surface Radiation Budget Project Release 2: An assessment of surface
fluxes at 1 degree resolution, 2000, in: Current Problems in Atmospheric Radiation, Inter-
national Radiation Symposium, IRS 2000, edited by: Smith, W. L. and Timofeyev, Y. M., St.
Petersburg, Russia, 24–29 July 2000.15
Stamnes, K., Tsay S. C., Wiscombe, W., and Jayaweera, K.: Numerically Stable Algorithm
for Discrete-Ordinate-Method Radiative Transfer in Multiple Scattering and Emitting Layered
Media, Appl. Opt., 27, 2502–2509, 1988.
Stokes, G. M. and Schwartz, S. E.: The Atmospheric Radiation Measurement (ARM) Program:
Programmatic and Design of the Cloud and Radiation Test Bed, Bull. Amer. Meteorol. Soc.,20
75, 1201–1221, 1994.
Toon, O. B., McKay, C. P., and Ackermann, T. P.: Rapid Calculation of Radiative Heating Rates
and Photodissociation Rates in Inhomogeneous Multiple Scattering Atmospheres, J. Geo-
phys. Res., 94, 16 287–16 301, 1989.
Wielicki, B. A., Barkstrom, B. R., Harrison, E. F., and Co-Authors: Clouds and the Earth’s25
Radiant Energy System (CERES): Algorithm Overview, IEEE Transactions on Geoscience
and Remote Sensing, 36, 1127–1141, 1998.
Zhang, Y. C., Rossow, W. B., and Lacis, A. A.: Calculation of Surface and Top of Atmosphere
Radiative Fluxes from Physical Quantities Based on ISCCP Data Sets, 1. Method and Sen-
sitivity to Input data Uncertainties, J. Geophys. Res., 100, 1149–1165, 1995.30
8348

ACPD
7, 8333–8360, 2007
Long-time global
radiation derived
from ISCCP Dx data
N. Petrenz et al.
Title Page
Abstract Introduction
Conclusions References
Tables Figures
◭ ◮
◭ ◮
Back Close
Full Screen / Esc
Printer-friendly Version
Interactive Discussion
EGU
Table 1. Summary of the used ISCCP data products according to Rossow et al. (1996).
Dataset Temporal Resolution Spatial Resolution Parameters
Cloud Surface Other
ISCCP Dx 3-hourly ca. 30×30 km2
– cloud top temper-
ature
– cloud top pres-
sure
– optical thickness
– (clear sky) sur-
face temperature
– land/water/ near
shore flag
– snow/ice code
– latitude, longi-
tude
– solar zenith angle
– day/night flag
ISCCP D1 3-hourly ca. 280×280 km2
– cloud top temper-
ature
– cloud top pres-
sure
– optical thickness
– (clear sky) sur-
face temperature
– land/water cover
– snow/ice cover
– latitude, longi-
tude
– solar zenith angle
– day/night
ISCCP D2 3-hourly monthly means ca. 280×280 km2
– cloud top temper-
ature
– cloud top pres-
sure
– optical thickness
– surface tempera-
ture
– land/water cover
– snow/ice cover
– latitude, longi-
tude
8349
ACPD
7, 8333–8360, 2007
Long-time global
radiation derived
from ISCCP Dx data
N. Petrenz et al.
Title Page
Abstract Introduction
Conclusions References
Tables Figures
◭ ◮
◭ ◮
Back Close
Full Screen / Esc
Printer-friendly Version
Interactive Discussion
EGU
Table 2. Summary of statistical values of global radiation at surface with reference to the TUD
dataset based on the ISCCP Dx data and the RTM Streamer (S) in comparison to the results
of the regional climate models REMO 5.0 (BTU), REMO 5.1 (MPI), MM5 (IFU) for the German
regions Schleswig, Lindenberg and Stuttgart over the period of 1984–1993.
Schleswig Lindenberg Stuttgart
S-REMO 5.0 S-REMO 5.1 S-MM5 S-REMO 5.0 S-REMO 5.1 S-MM5 S-REMO 5.0 S-REMO 5.1 S-MM5
Mean
[W m−2
]
121.5 122.2 106.5 130.7 132.4 117.1 142.9 144.7 133.4
Bias
[W m−2
]
8.2 4.8 35.4 8.5 7.2 38.5 8.5 5.0 27.6
RMSE
[W m−2
]
16.0 19.1 45.7 17.3 22.4 40.9 14.3 17.4 30.9
R2
0.97 0.95 0.95 0.98 0.96 0.94 0.98 0.97 0.98
N 120 120 120 120 120 120 120 120 120
8350
ACPD
7, 8333–8360, 2007
Long-time global
radiation derived
from ISCCP Dx data
N. Petrenz et al.
Title Page
Abstract Introduction
Conclusions References
Tables Figures
◭ ◮
◭ ◮
Back Close
Full Screen / Esc
Printer-friendly Version
Interactive Discussion
EGU
90˚S 90˚S
60˚S 60˚S
30˚S 30˚S
0˚ 0˚
30˚N 30˚N
60˚N 60˚N
90˚N 90˚N
0 10 20 30 40 50 60 70 80 90 100
Cloud amount [%]
84 85 86 87 88 89 90 91 92 93 94 95 96 97 98 99 0
0
20
40
60
80
100
Clo
ud a
mou
nt [%
]
0
20
40
60
80
100
Clo
ud a
mou
nt [%
]
84 85 86 87 88 89 90 91 92 93 94 95 96 97 98 99 0
0
20
40
60
80
100
Clo
ud a
mou
nt [%
]
90˚S 90˚S
60˚S 60˚S
30˚S 30˚S
0˚ 0˚
30˚N 30˚N
60˚N 60˚N
90˚N 90˚N
-25 -20 -15 -10 -5 0 5 10 15 20 25
Trend [%]
0
0
a) b)
c) d)
Fig. 1. Mean global ISCCP D1 cloud amount. (a) Annual mean over the period of 1984–2000.
(d) Significant temporal variances within black contoured regions over the periods of 1984–
2000. (b), (c) Obvious inhomogeneities of time series in two special regions (inhomogeneous
time series are black).
8351

ACPD
7, 8333–8360, 2007
Long-time global
radiation derived
from ISCCP Dx data
N. Petrenz et al.
Title Page
Abstract Introduction
Conclusions References
Tables Figures
◭ ◮
◭ ◮
Back Close
Full Screen / Esc
Printer-friendly Version
Interactive Discussion
EGU
10˚W 0˚ 10˚E 20˚E 30˚E30˚N
40˚N
50˚N
60˚N
0 100 200 300
Global radiation [Wm-2]
10˚W 0˚ 10˚E 20˚E 30˚E30˚N
40˚N
50˚N
60˚N
-25 -20 -15 -10 -5 0 5 10 15 20 25
Trend [Wm-2]
a) b)
Fig. 2. Global radiation at surface based on ISCCP Dx data. (a) Annual mean over the pe-
riod of 1984–2000, (b) Temporal trend over the period of 1984–2000 with areas of statistical
significance (black contoured).
8352
ACPD
7, 8333–8360, 2007
Long-time global
radiation derived
from ISCCP Dx data
N. Petrenz et al.
Title Page
Abstract Introduction
Conclusions References
Tables Figures
◭ ◮
◭ ◮
Back Close
Full Screen / Esc
Printer-friendly Version
Interactive Discussion
EGU
10˚W 0˚ 10˚E 20˚E 30˚E30˚N
40˚N
50˚N
60˚N
0 100 200 300
Global radiation [Wm-2]
10˚W 0˚ 10˚E 20˚E 30˚E30˚N
40˚N
50˚N
60˚N
-25 -20 -15 -10 -5 0 5 10 15 20 25
Difference [Wm-2]
10˚W 0˚ 10˚E 20˚E 30˚E30˚N 30˚N
40˚N 40˚N
50˚N 50˚N
60˚N 60˚N
-25 -20 -15 -10 -5 0 5 10 15 20 25
Difference [Wm-2]
a) b) c)
Fig. 3. Comparison of calculated global radiation at surface over the period of 1984–2000. (a)
ISCCP Dx dataset (reference) and the appropriate differences to the ISCCP D1 dataset (b:
D1-Dx) as well as to the ISCCP D2 dataset (c: D2-Dx).
8353
ACPD
7, 8333–8360, 2007
Long-time global
radiation derived
from ISCCP Dx data
N. Petrenz et al.
Title Page
Abstract Introduction
Conclusions References
Tables Figures
◭ ◮
◭ ◮
Back Close
Full Screen / Esc
Printer-friendly Version
Interactive Discussion
EGU
10˚W 0˚ 10˚E 20˚E 30˚E30˚N
40˚N
50˚N
60˚N
0 100 200 300
Global radiation [Wm-2]
10˚W 0˚ 10˚E 20˚E 30˚E30˚N
40˚N
50˚N
60˚N
-50 -25 0 25 50
Difference [Wm-2]
10˚W 0˚ 10˚E 20˚E 30˚E30˚N 30˚N
40˚N 40˚N
50˚N 50˚N
60˚N 60˚N
-50 -25 0 25 50
Difference [Wm-2]
a) b) c)
Fig. 4. Comparison of calculated global radiation at surface over the period of 1984–1993; (a)
ISCCP Dx dataset (reference) and the appropriate differences to the GEWEX SRB dataset (b:
SRB-Dx) as well as to the ISCCP FD dataset (c: FD-Dx).
8354
ACPD
7, 8333–8360, 2007
Long-time global
radiation derived
from ISCCP Dx data
N. Petrenz et al.
Title Page
Abstract Introduction
Conclusions References
Tables Figures
◭ ◮
◭ ◮
Back Close
Full Screen / Esc
Printer-friendly Version
Interactive Discussion
EGU
10˚W 0˚ 10˚E 20˚E 30˚E30˚N
40˚N
50˚N
60˚N
-20
-10
0
10
20
0
100
200
300
400
GE
BA
[Wm
-2]
0 100 200 300 400
ISCCP-Dx [Wm-2]
Mean = 144.911Bias = 19.391RMSE = 25.781R2 = 0.969N = 8197
GEBA = 0.9Dx - 3.9
GEBA-Stations
Mean D
ifference [Wm
-2]
Fig. 5. Monthly global radiation at surface over the period of 1984–1990 for the ISCCP Dx data
in comparison with all available GEBA-Stations of Central Europe (left) and the mean difference
at each station between the Dx and GEBA data (right, Dx-GEBA).
8355
ACPD
7, 8333–8360, 2007
Long-time global
radiation derived
from ISCCP Dx data
N. Petrenz et al.
Title Page
Abstract Introduction
Conclusions References
Tables Figures
◭ ◮
◭ ◮
Back Close
Full Screen / Esc
Printer-friendly Version
Interactive Discussion
EGU
-20
-10
0
10
20
48
50
52
54
5 10 150
100
200
300
400
DW
D [W
m-2
]
0 100 200 300 400
ISCCP Dx [Wm-2]
Mean = 125.522Bias = 20.592RMSE = 25.404R2 = 0.974N = 3511
DWD = 0.88Dx - 4.6
DWD-Stations
˚E ˚E ˚E
˚N
˚N
˚N
˚N
Mean D
ifference [Wm
-2]
Fig. 6. Monthly global radiation at surface over the period of 1984–1990 for the ISCCP Dx data
in comparison with the DWD data of all available gauging stations within the meteorological
network of Germany (left) and the mean differences at each station between the Dx and DWD
data (right, Dx-DWD).
8356
ACPD
7, 8333–8360, 2007
Long-time global
radiation derived
from ISCCP Dx data
N. Petrenz et al.
Title Page
Abstract Introduction
Conclusions References
Tables Figures
◭ ◮
◭ ◮
Back Close
Full Screen / Esc
Printer-friendly Version
Interactive Discussion
EGU
-1.0
-0.5
0.0
0.5
1.0
48
50
52
54
5 10 150
100
200
300
400
DW
D [W
m-2
]
0 100 200 300 400
GEBA [Wm-2]
Mean = 116.068Bias = 0.167RMSE = 2.251R2 = 0.999N = 2346
y = -0.006+1.001x
DWD-Stations
˚E ˚E ˚E
˚N
˚N
˚N
˚N
Mean D
ifference [Wm
-2]
Fig. 7. Monthly global radiation at surface over the period of 1984–1990 for the GEBA data in
comparison to the DWD data of all available GEBA stations within the meteorological network
of Germany (left) and the mean differences at each station between the GEBA and DWD data
(right, GEBA-DWD).
8357
ACPD
7, 8333–8360, 2007
Long-time global
radiation derived
from ISCCP Dx data
N. Petrenz et al.
Title Page
Abstract Introduction
Conclusions References
Tables Figures
◭ ◮
◭ ◮
Back Close
Full Screen / Esc
Printer-friendly Version
Interactive Discussion
EGU
100
110
120
130
140
150
Rad
iant
flux
den
sity
[Wm
-2]
1984 1988 1992 1996 2000
Year
100
110
120
130
140
150
Rad
iant
flux
den
sity
[Wm
-2]
1984 1988 1992 1996 2000
Year
DWD
ISCCP Dx
5 10 15
-20
-10
0
10
20
48
50
52
54
5 10 15
DWD-Stations
˚E ˚E ˚E
˚N
˚N
˚N
˚N
Trend [W
m-2]
˚E ˚E ˚E
ISCCP Dx DWD
a) b) c)
Fig. 8. (a) Annual station means of global radiation at surface over the period of 1984–2000 for
the ISCCP Dx data and the DWD data of all available gauging stations within the meteorological
network of Germany, (b), (c) temporal trends over the period of 1984–2000 with statistical
significant stations (red circles).
8358
ACPD
7, 8333–8360, 2007
Long-time global
radiation derived
from ISCCP Dx data
N. Petrenz et al.
Title Page
Abstract Introduction
Conclusions References
Tables Figures
◭ ◮
◭ ◮
Back Close
Full Screen / Esc
Printer-friendly Version
Interactive Discussion
EGU
JAN FEB MAR APR MAY JUN JUL AUG SEP OCT NOV DEC
Shortwave Downward REMO 5.0REMO 5.1MM5Dx/Streamer
Mean = 129.29Mean = 132.40Mean = 104.49Mean = 137.18
-75
-50
-25
0
25
50
75
Diff
eren
ce [W
m-2
]
-75
-50
-25
0
25
50
75
Diff
eren
ce [W
m-2
]
-75
-50
-25
0
25
50
75
Diff
eren
ce [W
m-2
]
1984 1985 1986 1987 1988 1989 1990 1991 1992 1993
Radiant flux density [W
m-2]
Mean = -7.90Mean = -4.78Mean = -32.69
Fig. 9. Monthly differences of global radiation at surface over Germany between the ISCCP
Dx data and the results of the regional climate models of the project partners (left: model-Dx)
in comparison with the monthly means (right: REMO 5.0 – BTU, blue; REMO 5.1 – MPI, red;
MM5 – IFU, orange; Dx/Streamer, green) over the period of 1984–1993.
8359

ACPD
7, 8333–8360, 2007
Long-time global
radiation derived
from ISCCP Dx data
N. Petrenz et al.
Title Page
Abstract Introduction
Conclusions References
Tables Figures
◭ ◮
◭ ◮
Back Close
Full Screen / Esc
Printer-friendly Version
Interactive Discussion
EGU
48
50
52
54
5 10 15
Schleswig
Lindenberg
Stuttgart
0
100
200
300
400
RE
MO
(5.
0 / 5
.1),
MM
5 [W
m-2
]
0 100 200 300 400
Dx/Streamer [Wm-2]
0
100
200
300
400
RE
MO
(5.
0 / 5
.1),
MM
5 [W
m-2
]
0 100 200 300 400
Dx/Streamer [Wm-2]
0
100
200
300
400
RE
MO
(5.
0 / 5
.1),
MM
5 [W
m-2
]
0 100 200 300 400
Dx/Streamer [Wm-2]
0
100
200
300
400
RE
MO
(5.
0 / 5
.1),
MM
5 [W
m-2
]
0 100 200 300 400
Dx/Streamer [Wm-2]
0
100
200
300
400
RE
MO
(5.
0 / 5
.1),
MM
5 [W
m-2
]
0 100 200 300 400
Dx/Streamer [Wm-2]
0
100
200
300
400
RE
MO
(5.
0 / 5
.1),
MM
5 [W
m-2
]
0 100 200 300 400
Dx/Streamer [Wm-2]
0
100
200
300
400
RE
MO
(5.
0 / 5
.1),
MM
5 [W
m-2
]
0 100 200 300 400
Dx/Streamer [Wm-2]
0
100
200
300
400
RE
MO
(5.
0 / 5
.1),
MM
5 [W
m-2
]
0 100 200 300 400
Dx/Streamer [Wm-2]
0
100
200
300
400
RE
MO
(5.
0 / 5
.1),
MM
5 [W
m-2
]
0 100 200 300 400
Dx/Streamer [Wm-2]
REMO 5.0 REMO 5.1 MM5
y =
Stations ˚E ˚E ˚E
˚N
˚N
˚N
˚N
117.20118.55
87.21125.74
126.63130.02
99.37134.79
138.68142.21119.55147.16
REMO 5.0 REMO 5.1 MM5 Dx/Streamer
Fig. 10. Comparison of global radiation at surface (left: monthly values; right: 10-year means)
for the regions Schleswig, Lindenberg and Stuttgart based on ISCCP Dx data (Dx/Streamer,
green) and on the results of the regional climate models of the project partners (REMO 5.0 –
BTU, blue; REMO 5.1 – MPI, red; MM5 – IFU, orange) over the period of 1984–1993.
8360