Embed Size (px)
Citation preview
<www.excelunusual.com> 1
Longitudinal Aircraft Dynamics #4– virtual aircraft definition
by George Lungu
- This section finishes the implementation of the glider wireframe data and charts it.
A few additions to the fuselage – a new method:
- We need to add a windshield (canopy), vertical stabilizer, a middle line and a rudder.
- Rename the current worksheet “Longitudinal_Stability_Model_1”
- Copy the current worksheet and rename the copy “Longitudinal_Stability_Model_2”
- A windshield is created with four additional points, two are copies of from the front-top of the original fuselage points (point#4 and point#12) and two more are connection points between them
- The raw fuselage data is stored in the range AB8:AC47. Let’s leave one row blank space and add the four windshield points in range AB49:AC52.
- AB49: “=AB1” then copy AB49 to cell AC49, AB52: “=AB19” then copy AB52 to AC52
- The two coordinate pairs belong to the start and the end of the canopy and, since the canopy needs to be streamlined with the fuselage, these points will belong to the fuselage.
- The points in between will need to be entered having any different coordinated from the fuselage points and also different between themselves: AB50: “300”, AC50: “0”, AB51: “600”, AC51: “0”.
- Copy the little chart where the fuselage is charted and on the new chart (the copy) click on the chart curve of the fuselage and as you see two data selection rectangles (a purple rectangle for x data and a blue one for y data) extend the data range to contain the newly introduced points by dragging the rectangles down 5 rows.
<www.excelunusual.com> 2
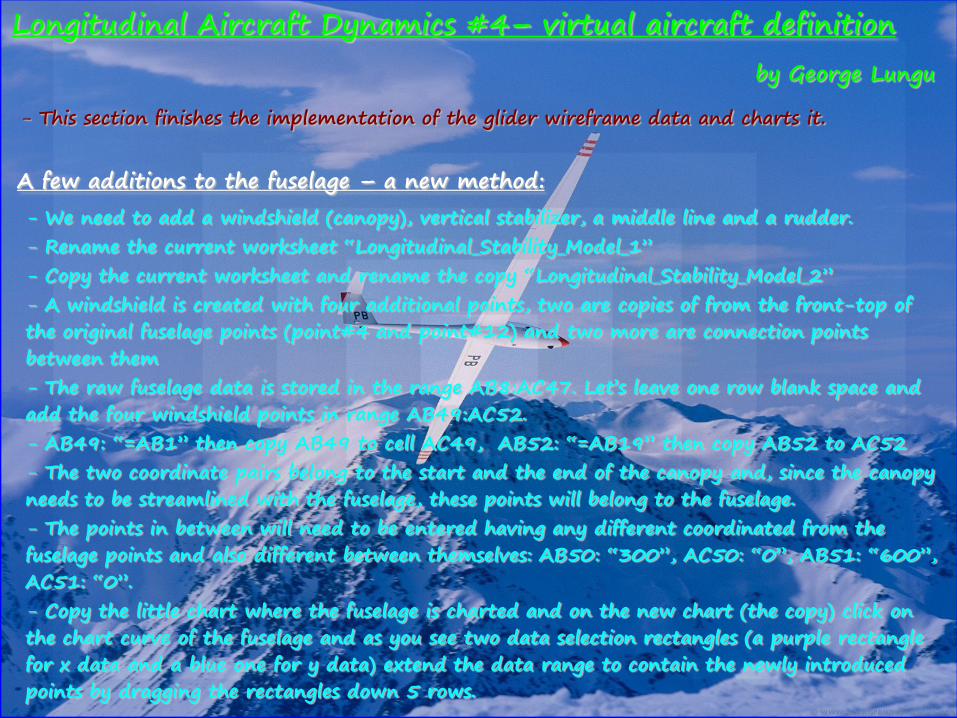
Point coordinate modification by direct chart adjustment (important):
- We will finally build our whole fuselage and continue our extraction using the special macro but for now I wanted to show how to adjust points on a chart.
- There are two windshield points on the central axis. Click on the front one, then wait for a second or two and click again and the cursor will turn into a cross. Now you can grab the point with the mouse by holding down the left mouse button and drag it either horizontally or vertically (not both at the same time). The point will follow the cursor and its coordinate will change!
- Now you can do the same with the second point by dragging it backwards. You can later drag the points vertically, one by one, if you wish.
- Notice that if the point is charted from a constant data cell you can drag it anywhere, but if the point is obtained using a formula from another reference cell you will not be able to change it. There is some “goal
-200
-100
0
100
200
300
0 500 1000 1500 2000 2500 3000
-200
-100
0
100
200
300
0 500 1000 1500 2000 2500 3000
-200
-100
0
100
200
300
0 500 1000 1500 2000 2500 3000
-200
-100
0
100
200
300
0 500 1000 1500 2000 2500 3000
-200
-100
0
100
200
300
0 500 1000 1500 2000 2500 3000
seeking feature” in Excel if you do that but I would recommend that you stay away from it.
- I wanted to introduce the readers to the above method (direct adjustment) since it can sometimes be very useful (occasionally we need coordinates which reference other coordinates and sometimes the charted shape looks different than the drawn shape so we need to perform direct adjustments on the chart). You can choose either to finish the fuselage this way or by drawing and group extracting the coordinates of a bunch of shapes (this is what I choose to do).
Finishing the fuselage the usual way (by freeform vertex coordinate extraction)

<www.excelunusual.com> 3
- Before adding the new canopy edge line make sure you highlight the old shape and Right click => Edit points. After that perform the instruction above. This way you know where your new shape will be with respect to the vertices of the old one!
- Start with this old fuselage freeform shape: Add a new shape (the canopy) => in the draw menu : AutoShapes => Lines => Freeform (4 vertices)
- After you finish the canopy make sure you adjust its
four vertices so you get exactly what you needed.
- Using the same methodology create the vertical stabilizer. Zoom in so you can perfectly match the vertical stabilizer the tail of the plane.
- You can experiment with various shapes. Make sure to name the shapes after creation in a meaningful way. Select the shapes then go to the upper left corner of the worksheet and in the Name Box type the name you like then hit Return.
- I used the following names: Fuselage, Vertical_stabilizer, Mid_line, Canopy_1, Canopy_2,
Canopy_3, Canopy_4, Rudder_hinge and Logo.
- The glider sketch to the right
has about 100 vertices.

<www.excelunusual.com> 4
The coordinate extraction macro:
- This macro is a slightly modified version of a macro from a previous post:
http://excelunusual.com/archive/2011/05/vertx-a-very-useful-macro-for-extracting-the-vertex-coordinates-of-freeforms-part-2/
-The macro acts on a group of selected shapes.
- The macro will print vertex coordinates in columns B and C. Between each shape data it will leave two blank rows.
- Column A will contain the number of points (vertices) that each shape has, the name of each shape and the total number of selected shapes in the group.
- The macro has been slightly modified in the sense that the x-y referencing is now done by shape name instead by shape order of creation. This means that the
Sub VertX_3()
r = 0
[A1:C5000].Clear
Set CL = [a1]
VertArray_0 = ActiveSheet.Shapes("Fuselage").Vertices
x0 = VertArray_0(1, 1)
y0 = VertArray_0(1, 2)
For i = 1 To ActiveWindow.Selection.ShapeRange.Count
NC = ActiveWindow.Selection.ShapeRange.Item(i).Nodes.Count
VertArray =
ActiveWindow.Selection.ShapeRange.Item(i).Vertices
CL.Offset(r, 0).Value = NC
CL.Offset(r + 1, 0) = Selection.ShapeRange.Item(i).Name
CL.Offset(r + 2, 0) = ActiveWindow.Selection.ShapeRange.Count
For n = 1 To NC
CL.Offset(r + n - 1, 1).Value = VertArray(n, 1) - x0
CL.Offset(r + n - 1, 2).Value = -VertArray(n, 2) + y0
Next n
r = r + NC + 2
Next i
End Sub
coordinates of the first point of the shape named “Fuselage” will be used as the origin of the system of coordinates from which all the shapes are charted. In other words the position of the shapes relative to each other stays unchanged, and now the nose of the plane is in the origin (you need to start drawing the fuselage freeform shape from the nose).
-How to use the macro? Bring up the VBA editor and click somewhere within the body of the macro text (the macro is placed in Module1). After that select the group of shapes whose vertex coordinates you need to extract and go the VBA editor and hit “Run” (the triangular button on the top page menu).
- Don’t forget to update ranges and shape names in the macro as you advance through the design and work on new groups of shapes (fuselage, wing, stabilizer, etc)!!!

<www.excelunusual.com> 5
-50
0
50
100
0 50 100 150 200 250 300 350 400 450 500
11
Generating the raw coordinate data for the main wing and stabilizer airfoil profiles:
This is a chart of the extracted x-y coordinates of the freeform object
representing the fuselage. The chart has two series. The fuselage itself and the
logo (red trace). To complete it, wing and stabilizer profiles have to be added.
- The data will be taken from the two .dat files we used for simulation in Xflr5.
- We could use the straight data from those files but the points are too many for our need (the
Buble_Dancer foil has 160 points of data). Besides we would like some hachure or introduce some sort
of zigzag line to highlight the airfoil profile.
- Open the “AG24_Bubble_Dancer.dat” file and plot the airfoil data. It was shown how to do this in
the first section of this tutorial (http://excelunusual.com/archive/2011/05/longitudinal-aircraft-
stability-1-using-xflr5-to-model-the-main-wing-the-horizontal-stabilizer-and-extracting-the-
polynomial-trendlines-for-cl-cd-and-cm/).
- Keeping the airfoil chart as a template, draw a freeform right on top of the chart, taking care to
start the first point of the freeform at the trailing edge of the airfoil and end at the same place.
- After finishing make sure to finely adjust the points and also fill the foil profile with a zigzag pattern.
- Just like before, you will need to use the previous macro to extract the coordinate data.
<www.excelunusual.com> 6
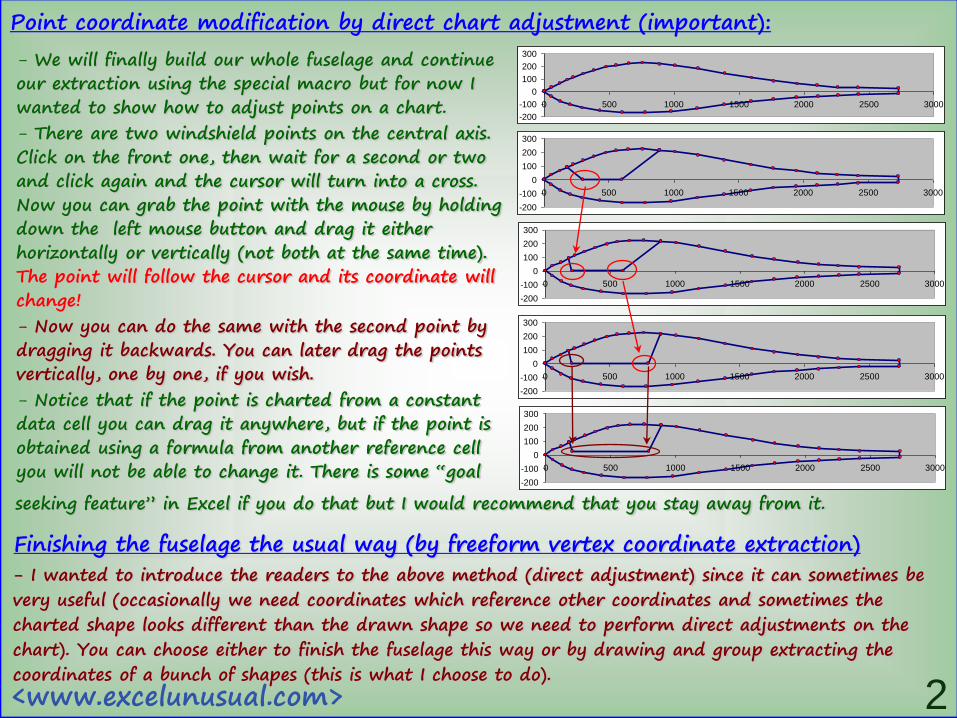
The main wing and the horizontal stabilizer airfoils:
To be continued…
- The snapshot below is a chart based on the full set of main wing airfoil coordinates. It was used as a template to create the freeforms on the right.- The wing contains 8 shapes. The original 160 coordinate points were reduced to a total of 52 including the airfoil skin and the struts (filling).
-0.1
0
0.1
0 0.1 0.2 0.3 0.4 0.5 0.6 0.7 0.8 0.9 1
-30
0
30
60
90
0 100 200 300 400 500 600 700 800 900
- The snapshot below is a chart based on the full set of stabilizer airfoil coordinates. It was used as a template to create the freeforms on the right.- The wing contains 7 shapes. The original 60 coordinate points were reduced to a total of 42 including the airfoil skin and the struts (filling).
-0.1
0
0.1
0 0.1 0.2 0.3 0.4 0.5 0.6 0.7 0.8 0.9 1
-50
-25
0
25
50
-800 -700 -600 -500 -400 -300 -200 -100 0
- Both airfoil data and raw extracted coordinates together with the fuselage raw data are placed (properly labeled) in a separate worksheet called “Freeform_data”. This data will be scaled using the geometrical input parameters to create the final airplane model within the main worksheet.