Embed Size (px)
Citation preview
Journal of Coastal Research 77S-787 Fort Lauderdale, Florida Fall 1992
Longshore Sediment Transport Model for the Indian West Coast
P. Chandramohan and B.U. Nayak
Ocean Engineering Division
National Institute of Oceanography
Dona Paula
Goa 403004, India
,tllllllll:.~~.- ----- ............. ~.----= z--44 ¥rF
ABSTRACT -- - _
CHANDRAMOHAN, P. and NAYAK, B.LJ., 1992. Longshore sediment transport model for the Indianwest coast. Journal of Coa«t.al Research, 8(4), 775 -787. Fort Lauderdale (Florida), ISSN 0749-0208.
J.ongshore sediment transport rates for the indian west coast from Cochin to Porhandar are estimatedfrom ship observed wave data (1968 to 1986). The sediment transport rate is relatively high during thesouthwest monsoon period from .lune to September. Annual gross sediment transport rate is high (1.52 x 10'; rn') along north Kerala, north Karnataka and south Gujarat coasts. Maharashtra coast showsrelatively low annual net transport (0.1 x l O" m'). The annual net transport is south along north Keralaa~d Karnataka coasts. Coasts near Malvan, Dabhol, Murud and Tarapur appear to be nodal drift pointswith equal volume of transport in either direction annually.
ADDITIONAL INDEX WORDS: Sediment transport, Indian coast, longshore transport, nodal drift,littoral drift, rose diagrams.
INTRODUCTION
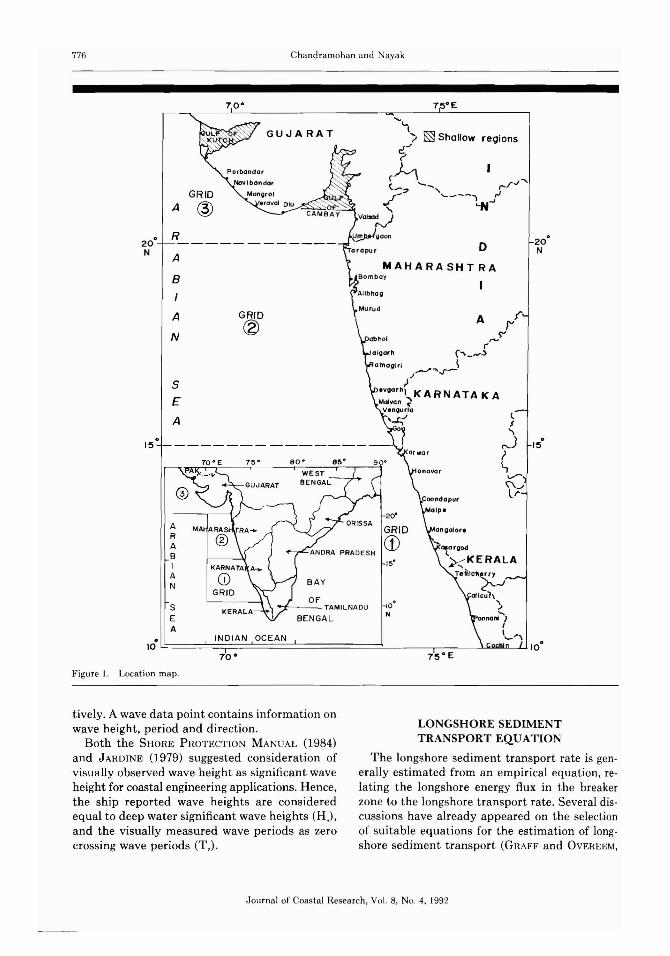
India has a vast coastal zone with about 7 000Km longshoreline bounded by the Bay of Be~galonthe east, the Indian Ocean on the south andtheArabian Sea on the west. The morphology oftheIndian coast is quite heterogeneous. A low andfairly straight east coast is dominated by longsandy beaches. Whereas the west coast is highlyindentedwith headlands and inlets studded witha number of sandy beaches (Figure 1). The coastalong the West Bengal is characterised by shoalsand spits, whereas the Orissa, Andhra PradeshandTamilnadu coasts are marked by long sandybeaches backed by large sand dunes. Long beaches are found between Cochin and Calicut on thewest coast. Low cliffs, pocket beaches and baysarepredominant from Calicut to Mangalore. Karnataka and Maharashtra coastal stretches arecharacterised by creeks, headlands, barriers andpocket beaches. Rocky shores with intermittentsandy beaches are the dominant features alongthesouth Gujarat coast. Gulf of Kutch is markedby deepinlets, offshore islands and marshes. Rannof Kutch gets flooded during the monsoon andbecomes dry and barren the rest of the year. Beach
91027 received ]9 March 1991; accepted in reoision ]2 August 199].
erosion is active along the entire stretch of theKerala coast and at a few places along the Karnataka, Maharashtra and Gujarat coasts. No integrated studies have been undertaken to assessthe littoral environment along the west coast. Instrumentally measured wave data for this regionare very limited. Ship-reported wave informationpublished in Daily Weather Reports were compiled for the present study for estimating thelongshore sediment transport rates. The study areacomprises the Indian west coast from Cochin inKerala to Porbandar in Gujarat (Figure 1).
WAVE DATA
The India Meteorological Department publishes weather data transmitted by ships plying theIndian waters in the form of Indian Daily WeatherReports. Wave heights in half metres, periods inseconds and directions in ten degree resolutionsare reported (SHIPS WEATHER CODE, 1982). Sincethe directional information is not given for thesea waves, only the swell data reported for theperiods 1968 to 1986 were considered for the present study. The study region is divided into 3 grids,each of 5° x 5° size and the swell data pertainingto each grid were compiled (Figure 1). The totalnumber of wave data points compiled were 5,402,2,602 and 1,158 for the grids 1, 2 and 3, respec-
776 Cha ndramoha n and Nayak
15· ---------------
GRID
A @R
A
B
I
A
N
S
E
A
ARABIAN
70·
GRID
®
GUJARAT
oMAHARASHTRA
Bomboy
Figur e 1. Location map.
tiv ely. A wave data poin t contains information onwave height, per iod and direct ion .
Both the SHORE P ROTECTION MANUAL (1984)and JARDINE (1979) suggeste d cons ide ration ofvisually observed wave heigh t as significant wavehe ight for coastal en gineer ing applications. Hence,the ship reported wave hei ghts are conside redequal to deep water significant wave heights (HJ,and the visu ally measured wave peri ods as zerocross ing wave periods (T ,).
LO NGSHORE SEDIMENTTRANSPORT EQUATION
T he longsh ore sed iment tran spor t rate is generally estimated from an empirical equation, relating the longsh ore ene rgy flux in the breakerzone to the longsh ore transport rate. Several discussio ns have already appeared on th e selectionof suitable equa tions for the estimat ion of longshore sed ime nt t ran sport (GRAFF and OVEREEM,
Jou rnal of Coasta l Research , Vol. 8, No.4, 1992
I ...ongshore Sediment Transport 777
(1)
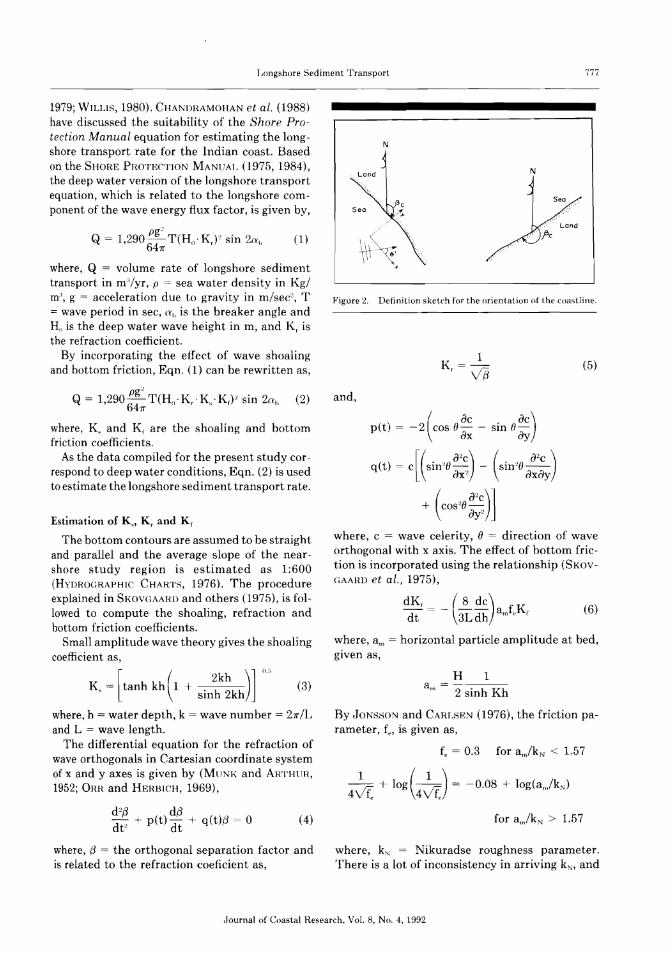
Figure 2. Def nition sketch for the orientation of the coastline.
(5)
Land
N
I\J
Q = 1,290 6Pg~ T(Ho ' Krr~ sin 2a h47r
where, Q = volume rate of longshore sedimenttransport in rrr/yr, p = sea water density in Kg/m", g = acceleration due to gravity in m/sec'', T= wave period in sec, ah is the breaker angle andH, is the deep water wave height in m, and K, isthe refraction coefficient.
By incorporating the effect of wave shoalingand bottom friction, Eqn. (1) can be rewritten as,
1979; WILLIS, 1980). CHANDRAMOHAN et at. (1988)have discussed the suitability of the Shore Protection Manual equation for estimating the longshore transport rate for the Indian coast. Basedon the SHORE PROTECTION MANUAL (1975, 1984),the deep water version of the longshore transportequation, which is related to the longshore component of the wave energy flux factor, is given by,
(6)
Q = 1,290:::T(Ho ' K, .K, .K,)1 sin 2lYh (2)
where, K, and K, are the shoaling and bottomfriction coefficients.
As the data compiled for the present study correspond to deep water conditions, Eqn. (2) is usedto estimate the longshore sediment transport rate.
Estimation of K", K, and K,
The bottom contours are assumed to be straightand parallel and the average slope of the nearshore study region is estimated as 1:600(Hl'DROGRAPHIC CHARTS, 1976). The procedureexplained in SKOVGAARD and others (1975), is followed to compute the shoaling, refraction andbottom friction coefficients.
Small amplitude wave theory gives the shoalingcoefficient as,
K, = ftanh kh(l + Sin~k~kh)J DC, (3)
where, h = water depth, k = wave number = 27r/Land L = wave length.
The differential equation for the refraction ofwave orthogonals in Cartesian coordinate systemof x and y axes is given by (MUNK and ARTHUR,
1952; ORR and HERHICH, 1969),
and,
where, c = wave celerity, 0 = direction of waveorthogonal with x axis. The effect of bottom friction is incorporated using the relationship (SKOV
GAARD et al., 1975),
dK" (8 dC)dt = - 3L dh amCKf
where, am = horizontal particle amplitude at bed,given as,
H 1am = 2 sinh Kh
By JONSSON and CARLSEN (1976), the friction parameter, f, is given as,
f', = 0.3 for am/kN < 1.57
,1;r + log ( ,1;r) = -0.08 + log(am/kN )
4v(. 4vfe
d2~ d~dt2 + p(t) dt + q(t){1 = 0 (4)
where, {3 = the orthogonal separation factor andis related to the refraction coeficient as,
where, k., = Nikuradse roughness parameter.There is a lot of inconsistency in arriving kN , and
Journal of Coastal Research, Vol. 8, No.4, 1992
778 Cha ndramohan an d Nayak
, f di t t t in 105
m3/
monthQuantity 0 se rmen ranspor
190· 170·
190. 170·
-- Southerly
GRID190. 170·
190. 170·
---- Northerly
190· 170· 190. 170·
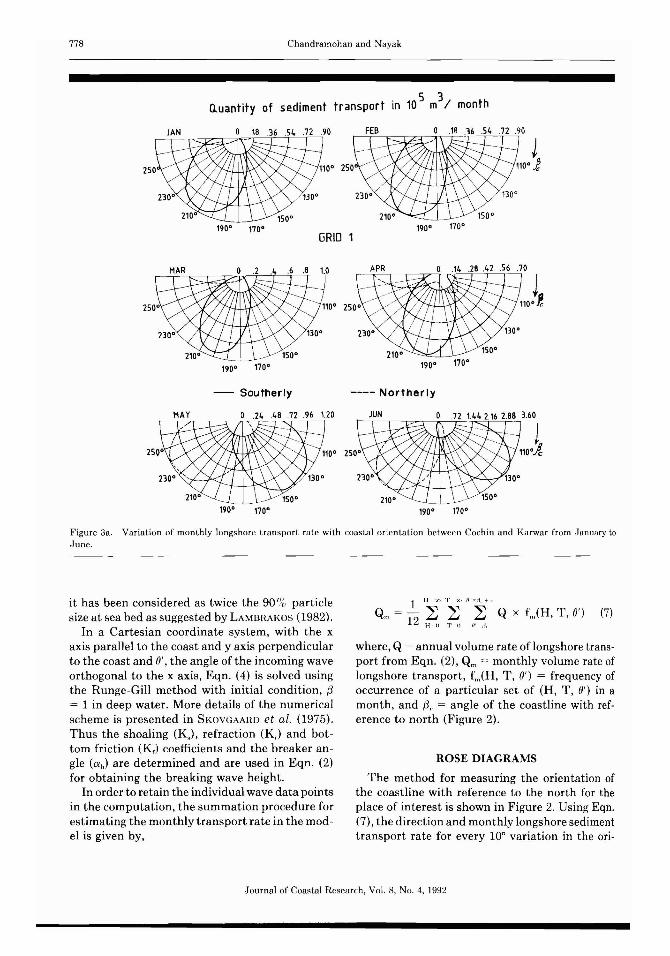
F igure 3a. Vari ation of mon thl y longshore transport rate with coastal orientati on he tween Cochin and Karw ar from .Ianuary toJune.
it has been considered as twice the 90 % particlesize at sea bed as suggested by LAMHRAKOS (1982).
In a Cartesian coordinate system, with the xaxis parallel to the coast and y axis perpendicularto the coast and (J' , the angle of the incoming waveorthogonal to the x axis, Eqn. (4) is solved usin gthe Runge-Gill method with initial condit ion, {3= 1 in deep water. More details of the numericalscheme is presented in SKOVGA ARD et al. (1975) .Thus the shoaling (KJ, refraction (K,) and bottom friction (K ,) coefficients and the breaker angIe (O'h) are determined and are used in Eqn. (2)for obtaining the breaking wave height.
In order to retain the individual wave data pointsin the computation, the summation procedure forestimating the monthly transport rate in the mode� is given by ,
1 I-I ~ _ r...., T x , II' """ I"J,- t :rr
o, = 12 ~ ~ ~ Q x r.nr, T , 1./') (7)H ·· l ) '1'- () /I' /1,
where, Q = annual volume rate of longshore trans port from Eqn. (2), Qm= monthly volume rate oflongshore transport, f..,(H, T, 0') = frequency ofoccurrence of a particular set of (H, T , 0') in amonth, and {3, = angle of the coast line with reference to north (Figure 2).
ROSE DIAGRAMS
The method for measuring the orientation ofth e coastline with reference to the north for theplace of interest is shown in Figure 2. Using Eqn.(7) , the direction and monthly longshore sedimenttransport rate for every 10° variation in the ori-
J ournal of Coastal Research, Vol. 8, No.4, 1992
Longshore Sediment Tran sport 779
5 3Quantity of sediment transport in 10 m / month
JUL o .84 1.6.!lJ52 3.36 420
--
190' 170'
AUG
190' 170'
GRID 1
SEP OCT
190· 170'
.5
J110'i
.60",--,--v-~~--.---1 J
110.1
---- Northerly
DEC
-- Souther Iy
190· 170' 190' 170'
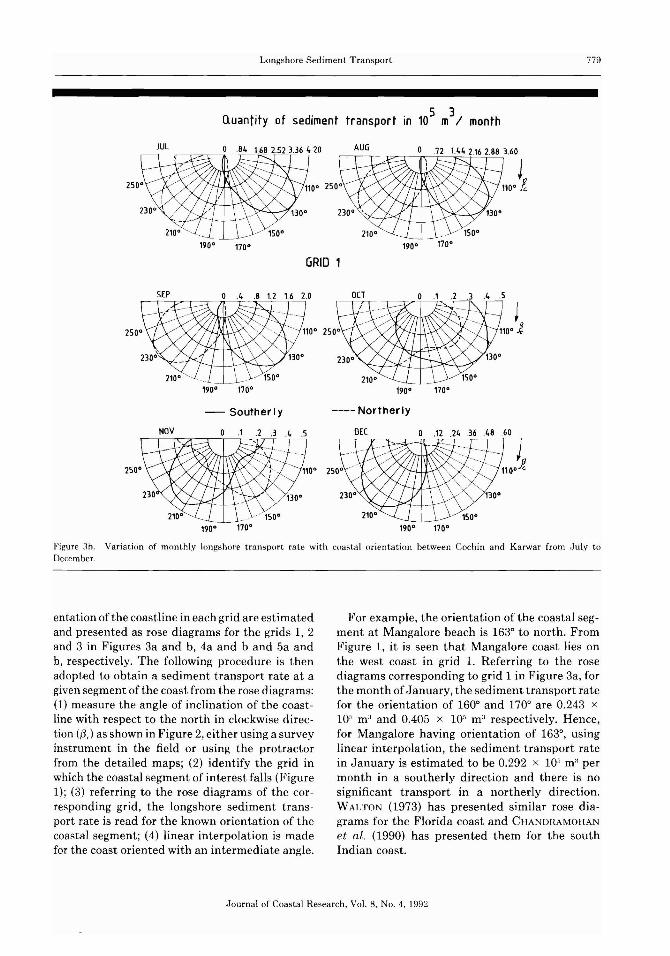
Figure ah . Variation of monthly longshore tr ansport rate with coastal orientation hetween Cochin and Kar war from .Iuly toDecember .
entation of the coastline in each grid are estimatedand presented as rose diagrams for the grids 1,2and 3 in Figures 3a and b, 4a and band 5a andb, respectively. The following procedure is thenadopted to obtain a sediment transport rate at agiven segment of the coast from the rose diagrams:(1) measure the angle of inclination of the coastline with respect to the north in clockwise direction ({3,) as shown in Figure 2, either using a surveyinstrument in the field or using the protractorfrom the detailed maps; (2) identify the grid inwhich the coastal segment of interest falls (Figure1); (3) referring to the rose diagrams of the cor responding grid , the longshore sediment transport rate is read for the known orientation of thecoastal segment; (4) linear interpolation is madefor the coast oriented with an intermediate angle.
For example, the orientation of the coastal segment at Mangalore beach is 163° to north. FromFigure 1, it is seen that Mangalore coast lies onthe west coast in grid 1. Referring to the rosediagrams corresponding to grid 1 in Figure 3a, forthe month of January, the sediment transport ratefor the orientation of 160° and 170° are 0.243 x10" m" and 0.405 x 10" m' respectively. Hence,for Mangalore having orientation of 163°, usinglinear interpolation, the sediment transport ratein January is estimated to be 0.292 x 10" m'' permonth in a southerly direction and there is nosignificant transport in a northerly direction.WALTO N (1973) has presented similar rose diagrams for the Florida coast and CHAN[)f{AMOHAN
et al . (1990) has presented them for the southIndian coast.
Journal of Coasta l Research , Vol. 8, No.4, 1992
780 Chandrarnuhan and Nayak
a.uantity of sediment transport in 10 5m 3/ month
110°
.~------r-______,._.90
t1100 J!
FE8.------.- --~_ .18 .36 .54
GRID 2
JAN
- Southerly ---- Northerly
2500
MAY .22 .44 .66 .88 1.10
1900 1700
JUN .72 1.44 2.16 2.88 3.60
--- J--'-- 110
0~
1700
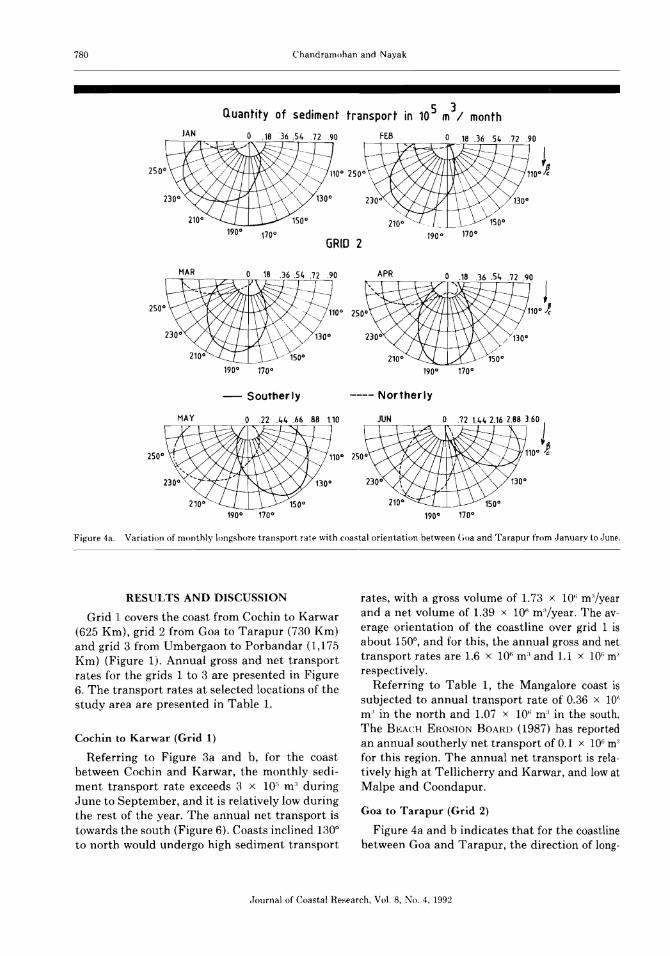
Figure 4a. Variation of monthly longshore transport rate with coastal orientation between (~()a and Tarapur from January to June.
RESULTS AND DISCUSSION
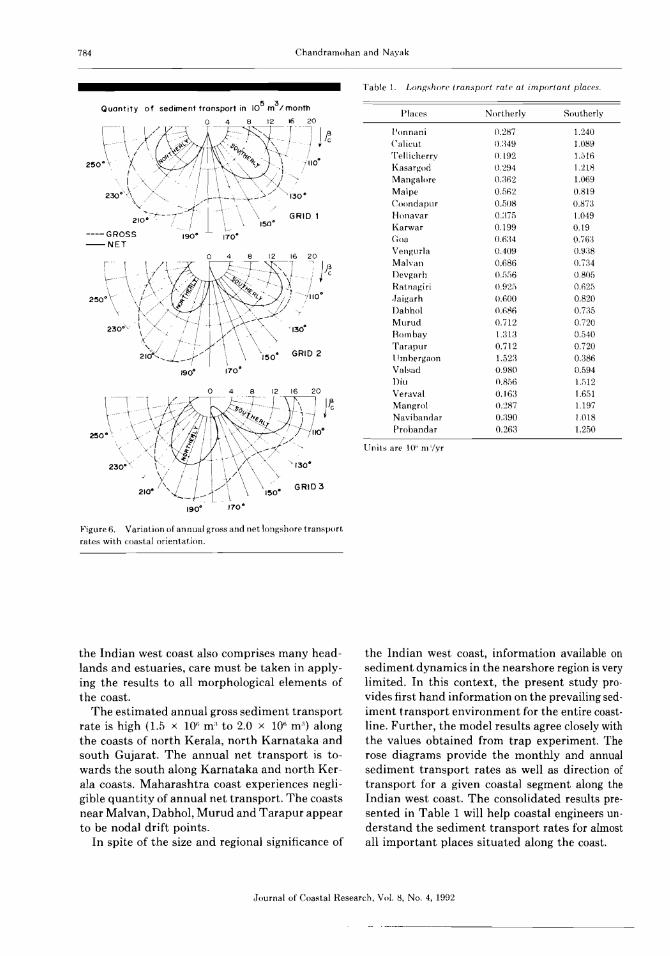
Grid 1 covers the coast from Cochin to Karwar(625 Km), grid 2 from Goa to Tarapur (730 Km)and grid 3 from Umbergaon to Porbandar (1,175Km) (Figure 1). Annual gross and net transportrates for the grids 1 to 3 are presented in Figure6. The transport rates at selected locations of thestudy area are presented in Table 1.
Cochin to Karwar (Grid 1)
Referring to Figure 3a and b, for the coastbetween Cochin and Karwar, the monthly sediment transport rate exceeds 3 x 10;) m' duringJune to September, and it is relatively low duringthe rest of the year. The annual net transport istowards the south (Figure 6). Coasts inclined I~30°
to north would undergo high sediment transport
rates, with a gross volume of 1.73 x 10⁶ m;\/yearand a net volume of 1.39 x 10" m't/year. The average orientation of the coastline over grid 1 isabout 150°, and for this, the annual gross and nettransport rates are 1.6 x 101) m' and 1.1 x lOG m"res pectively.
Referring to Table 1, the Mangalore coast issubjected to annual transport rate of 0.36 x 10'1m" in the north and 1.07 x 10⁶ m'' in the south.The BEACH EROSION BOARD (1987) has reportedan annual southerly net transport of 0.1 x lOG m"for this region. The annual net transport is relatively high at Tellicherry and Karwar, and low atMalpe and Coondapur.
Goa to Tarapur (Grid 2)
Figure 4a and b indicates that for the coastlinebetween Goa and Tarapur, the direction of long-
Journal of Coastal Research, VoL 8, No.4, 1992
Longshore Sediment Transport
Quantity of sediment transport in 105
m3I month
781
o .92 1.84 2.163.68 4.60JUL
1700
GRID 2
AUG o .8 .16 .24 .32 .40
!1100~
1700
SEP
NOV
o .4 .8 1.2 1.6 2.0
-- Southerly
.14 .28 .42 .56 .10
OCT
---Northerly
DEC
o .08 .16 .24 .32 .40
J110 01
o .,it .28 .42 .56 .70
J1100~
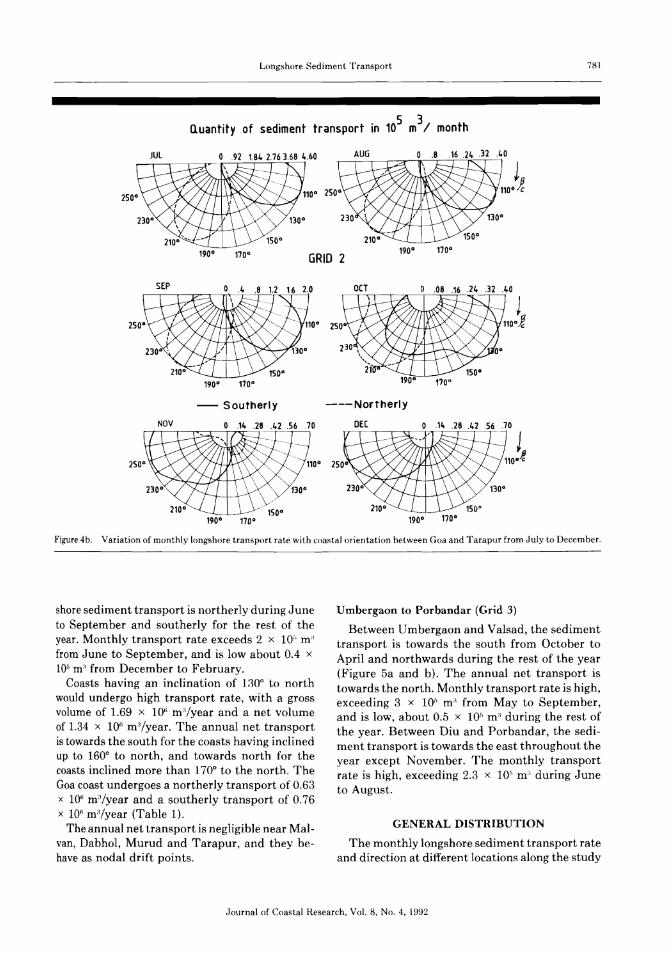
Figure 4b. Variation of monthly longshore transport rate with coastal orientation between Goa and Tarapur from July to December.
shoresediment transport is northerly during Juneto September and southerly for the rest of theyear. Monthly transport rate exceeds 2 x 10 i
) m'from June to September, and is low about 0.4 x10⁵ m" from December to February.
Coasts having an inclination of 1300 to northwould undergo high transport rate, with a grossvolume of 1.69 x lOll mvyear and a net volumeof 1.34 x 10° m-/year. The annual net transportistowards the south for the coasts having inclinedup to 1600 to north, and towards north for thecoasts inclined more than 1700 to the north. TheGoacoast undergoes a northerly transport of 0.63x IO" m-/year and a southerly transport of 0.76x 10⁶ rna/year (Table 1).
The annual net transport is negligible near Malvan, Dabhol, Murud and Tarapur, and they behave as nodal drift points.
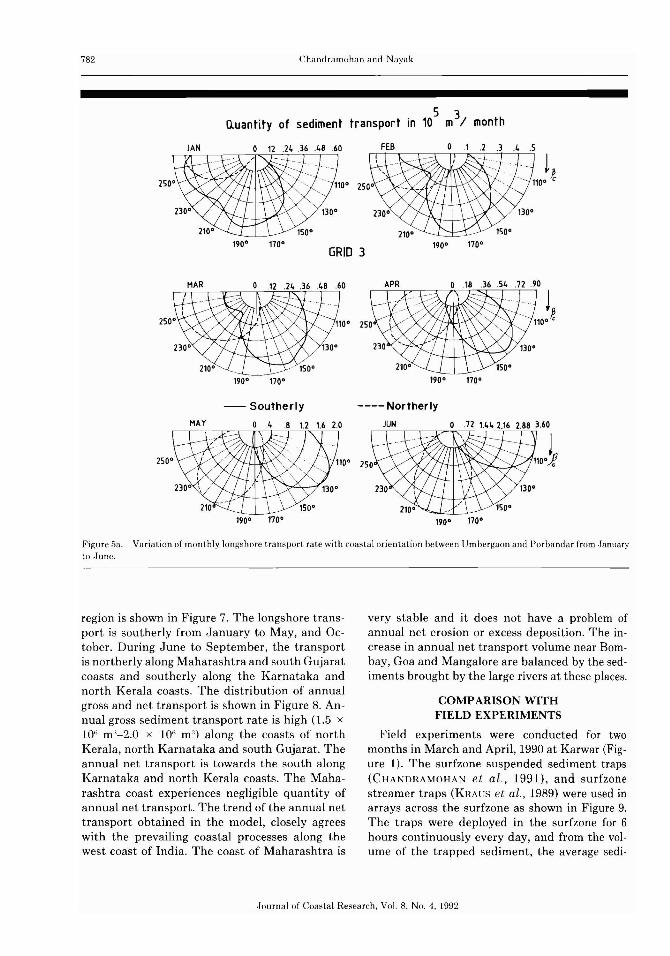
Umbergaon to Porbandar (Grid 3)
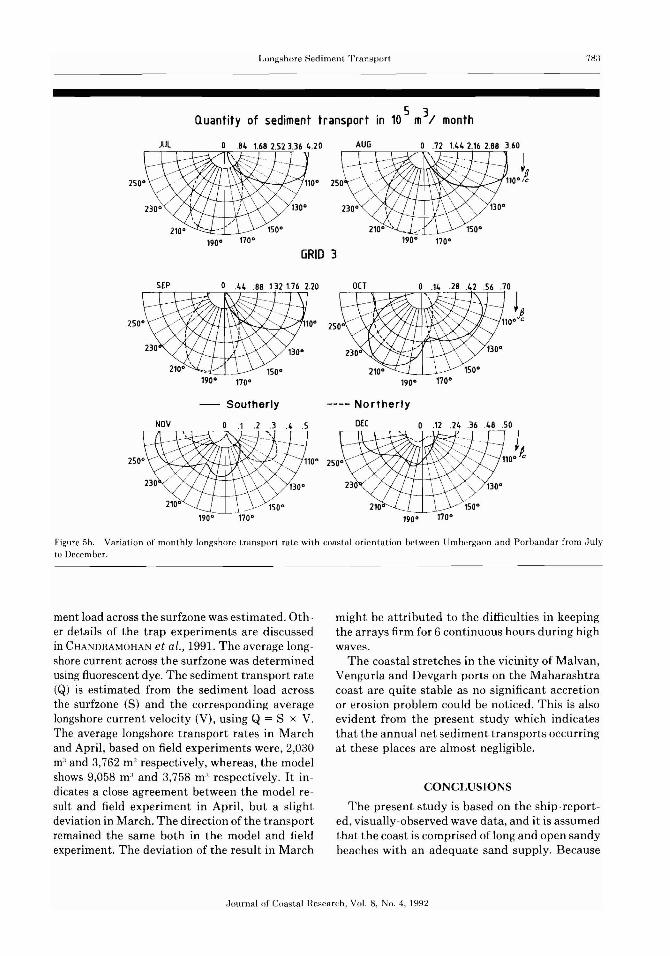
Between Umbergaon and Valsad, the sedimenttransport is towards the south from October toApril and northwards during the rest of the year(Figure 5a and b). The annual net transport istowards the north. Monthly transport rate is high,exceeding 3 x 10f1 m' from May to September,and is low, about 0.5 x 10f} rn' during the rest ofthe year. Between Diu and Porbandar, the sediment transport is towards the east throughout theyear except November. The monthly transportrate is high, exceeding 2.3 x 10⁵ m'' during Juneto August.
GENERAL DISTRIBUTION
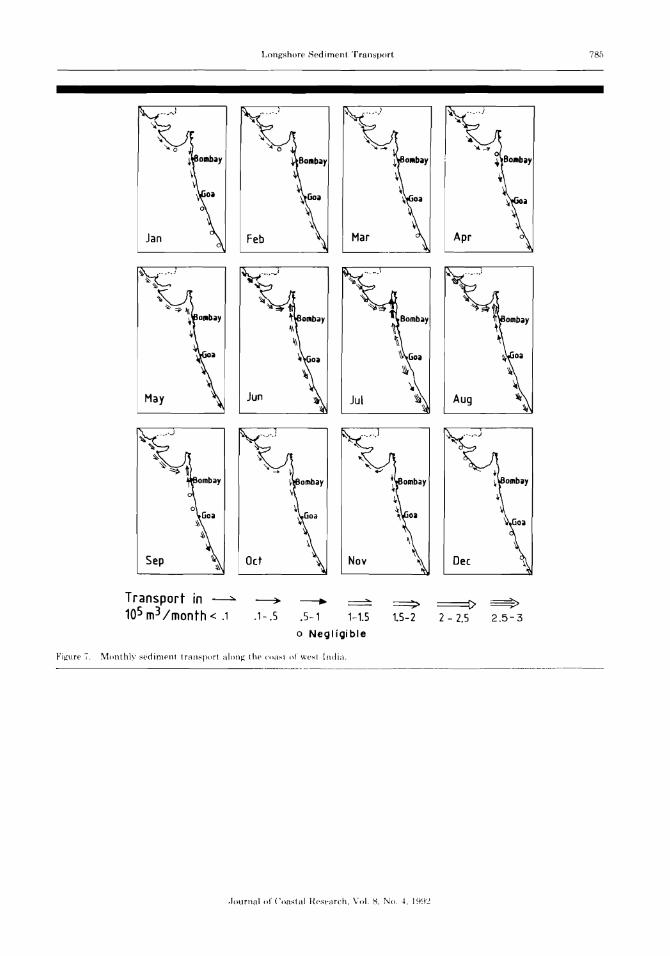
The monthly longshore sediment transport rateand direction at different locations along the study
(Journal of Coastal Research, Vol. 8, No.4, 1992
782 Chandramohan and Nayak
5 3o.uantity of sediment transport in 10 m / month
190·
190·
170·
170·
GRID 3190·
190·
170·
170·
HAY
-- Southerly
190. 170·
---- Norther Iy
JUN
190. 170·
Figure [,a. Variat.ion of mont.hly longshore tr an sport rate with coas tal orientation between Umh ergaon and Porb and ar from -Ianuaryto .Iune.
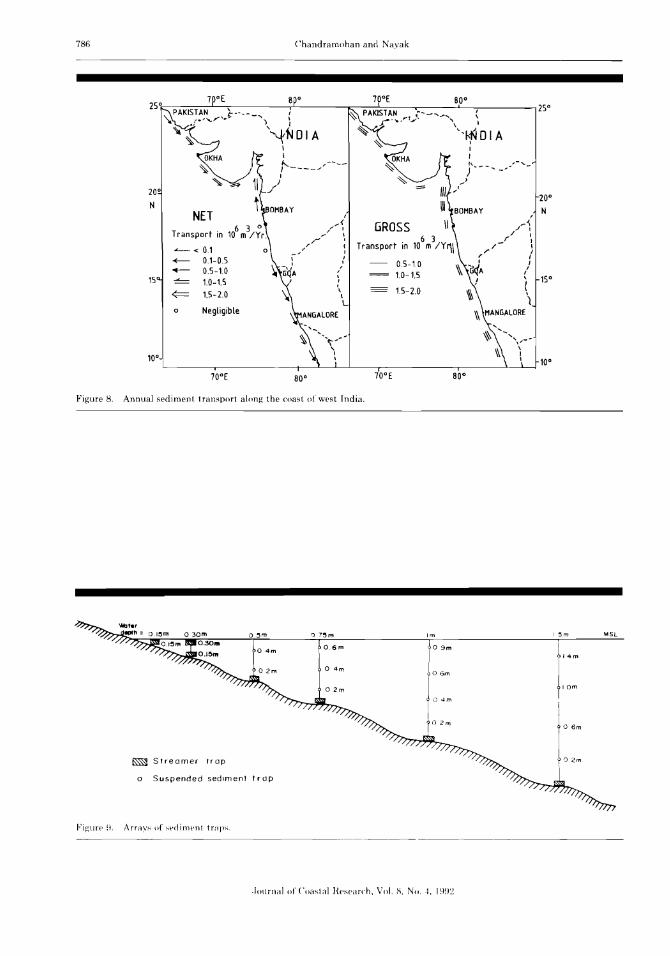
region is shown in Figure 7. The longshore transport is southerly from January to May , and October. During June to September, the transportis northerly along Maharashtra and south Gujaratcoasts and southerly along the Karnataka andnorth Kerala coasts. The distribution of annualgross and net transport is shown in Figure 8. Annual gross sediment transport rate is high (1.5 x10'; m"-2 .0 x 10" m") along the coasts of northKerala, north Karnataka and south Gujarat. Theannual net transport is towards the south alongKarnataka and north Kerala coasts. The Maharashtra coast experiences negligible qu antity ofannual net transport. The trend of the annual nettransport obtained in the model, closely agreeswith the prevailing coastal processes along thewest coast of India. The coast of Maharash tra is
very stable and it does not have a problem ofannual net erosion or excess deposition. The increase in annual net tr ansport volume near Bombay, Goa and Mangalore are balanced by the sediments brought by the large rivers at these places.
COMPARISON WITHFIELD EXPERIMENTS
Field experiments were conducted for twomonths in March and April, 1990 at Karwar (Figure 1) . The surfzone suspended sediment traps(CHANDHAMOHAN et al ., 1991), and surfzonestreamer traps (KRAUS et al., 1989) were used inarrays across the surfzone as shown in Figure 9.The traps were deployed in the surfzone for 6hours continuously every day, and from the volume of the trapped sediment, the average sedi-
Journal of Coastal Resear ch . Vol. 8. No.4, 1992
Longshore Sediment T'ra nsporr 78:J
Quantity of sediment transport in 105m3/ month
110·
GRID 3190. 110·
JUL AUG 3.60r--r-----r--,-----r"7..,.-,.--,--,------r-----r-'----., !
110·~
190· 110· 190· 110·
Southerly ---- No rtherly
DEC
190·
Figure 5b. Var iation of monthly longshore transport ra te with coastal orienta tion betw een Umbergaon and Porb and ar from .lulyto Decem ber.
ment load across th e sur fzone was estimated. Other details of the trap experiments are discussedin CHANDHAMOHAN et al., 1991. The average longshore current across the sur fzone was determinedusing fluorescent dye. The sediment transport rate(Q) is estimated from the sediment load acrossthe surfzone (8) and the corresponding averagelongshore current velocity (V), using Q = S x V.The average longshore transport rates in Marchand April, based on field experiments were , 2,mOm" and 3,762 m" respectively, whereas, th e modelshows 9,058 m" and 3,758 m' respectively. It indicates a close agreement between the mod el result and field experiment in April, but a slightdeviation in March. The direction of th e transportremained the same both in the model and fieldexperiment. The deviation of the result in March
might he att ributed to the difficulties in keepingthe arrays firm for 6 cont inuous hours during highwaves.
The coastal stretches in the vicinity of Malvan,Vengurla and Devgarh ports on the Maharashtracoast a re quite stable as no significant accret ionor erosion problem could be noticed. This is alsoevident from the present study which indicatesthat the annual net sediment transports occurringat these places are almost negligible.
CONCLUSIONS
The present study is based on the ship-reported , visually-observed wave data , and it is assumedthat the coast is comprised of long and open sandybeaches with an adequate sand supply. Because
.lou rna l of Coasta l Rese arch, Vol . B, No. 4, 1992
784 Chandramohan and Nayak
Places Northerly Southerly
Ponnani 0.287 1.240
Calicut O.:~49 1.089Tellicherry O.L92 1.;)16
Kasargod 0.294 1.:U8
Mangalore 0.:362 1.069
Malpe 0.56~ 0.819
Coondapur 0.50H 0.B7:_~
Honavar O.:n5 1.049Karwar 0.199 0.19Goa 0.6:34 O.7{):~
Vengurla 0.409 0.9:38
Malvan 0.68fi 0.734Devgarh O.[}[}6 0.805
Ratnagiri 0.92;') 0.625
.Iaigarh 0.600 0.820
Dabhol ().(-)B~) O.7:~5
Murud 0.712 0.720
Bombay 1.:31:3 0.540
Tarapur 0.712 0.720
Umbergaon 1.52:'3 0.:386Valsad 0.980 0.594Diu o.ass 1.S12
Veraval 0.16:3 1.651
Mangrol ()'~87 1.197
Navibandar 0.:390 1.018
Probandar 0.26:3 1.250
Units are l O"m i/yr
Table 1. Longshore transport rate at important places.
--,iIlO·
\
\ GRID 1150"
---- GROSS 190·--NET
0 4 8 20
:-JPc
250·\
i--------/'110·
\
GRID 2
0 4 /2 16
Figure 6. Variation of annual gross and net longshore transport
rates with coastal orientation.
the Indian west coast also comprises many headlands and estuaries, care must be taken in applying the results to all morphological elements ofthe coast.
The estimated annual gross sediment transportrate is high (1.5 x 10⁶ m" to 2.0 x 10° m') alongthe coasts of north Kerala, north Karnataka andsouth Gujarat. The annual net transport is towards the south along Karnataka and north Kerala coasts. Maharashtra coast experiences negligible quantity of annual net transport. The coastsnear Malvan, Dabhol, Murud and Tarapur appearto be nodal drift points.
In spite of the size and regional significance of
the Indian west coast, information available onsediment dynamics in the nearshore region is verylimited. In this context, the present study provides first hand information on the prevailing sediment transport environment for the entire coastline. Further, the model results agree closely withthe values obtained from trap experiment. Therose diagrams provide the monthly and annualsediment transport rates as well as direction oftransport for a given coastal segment along theIndian west coast. The consolidated results presented in Table 1 will help coastal engineers understand the sediment transport rates for almostall important places situated along the coast.
Journal of Coastal Research, Vol. H, No.4, 1992
Longshore Sediment Transport 785
~
~ Goa ~ oa
'\ ~ ~
'.lI ~
Jun ~ Jul ~ Aug ~
~
---".)
ombay ombay
Goa~\
~
Sep Oct Nov Dec
, \
~~ .. -,)......""""") --.." ...~'
~ ~\l ~
~ \l ~ ~
'\lo ~o ~-., ~~
a.bay
oa~ Goa aa
~0
~
\lJan Feb
I
Mar Apr
_._,--..i
Transport in ~105 m3/month < .1
~
.1- .s------..5-1 1-1.5
~
2 - 2.5o Negligible
Figure '7. Mont hly sedimen: t ransport along t ht' ('()a~l of wesl lnd ia.---~-----~ ---._-- ---------------------------~----------------------
.lournal of Coast al H(~~H-·arch. Vol. H. No.4. 1!19~
786 Chandrarnohan and Navak
I
-~,/ ,/ I
_' I/ I
r J, ,~ GiiA /
1 (
~ \\\ MANGALORE
....
~ .... \;--\\ \
80°
OKHA~
~
10°£
PAKIS!.~~ ,r1.."r:'" - ....- ...".J. \ I
'-'~~DI AII
I
)'~--
/,...-'
GROSS6 :3
Transport in 10 m /Y'"\\
0.5-1.01.0-1.5
1.5-2.0
'-....~ '~'-,
I,
o
Negligible
NET
o
Transport in
.L-- < 0.1+- 0.1-0.5.- 0.5-1.0-- 1.0-1.5¢== 1.5-2.0
1 °EPAKISTAN t---~- i
~ J."'~\.; -"') ~, ' ,.~ ,*NDI A
IOKHA \~ l'---- ....."---
I
~ ~ 11 ../,J
t OHBAY
10°L.--- ----,;-- --+_----L_.....I...-----l..__--r- .---- ---1..-_.L.......j
20°
N
15
BOO
Figure 8. Annual sediment. transport along the coast. of west India.
o_~m 1m 15m MSL
o 4m o 9m, 4m
Om
o 6m
~ Streamer trap o 2m
0 Suspended sedirn e n t trap
FigurE" ~L Arravs of :;t-'diment traps.
.lournal of Coastal I{pst'arch, Vol. S. No. --1-, 19H~
Longshore Sediment Transport 7'<37
ACKNOWLEDGEMENT
The authors are thankful to the Director, National Institute of Oceanography, Goa, India forhis encouragement.
LITERATURE CITED
BEACH EI{OSION BOARD, 1987. Agenda notes of 15thmeeting, Central Water & Power Research Station.Pune, India.
CHANDI{AMOHAN, P.; NAYAK, B.l1., and !lA.Jll, V.S., 1988.Application of longshore transport equations to Andhra coast, East coast of India. Coastal Engineering,12, 285-297.
CHANDHAMOHAN, P.; NA'fAK, B.lJ., and HA,J(l, V.S., 1990.Longshore-transport model for south Indian and Srilankan coasts. Journal Waterwa.v, Port, Coastal andOcean Division (ASCE), 1] 6, 408-424.
CHA~DHAMOHAN,P.; NAYAK, B.U., and SANIL Kl1MAH,V.V., 1991. Sediment transport study using surfzonesediment traps. Technical Report, N.LO., Goa, India(in press).
GRAFF, V. and OVEREEM, V.J., 1979. Evaluation of sediment transport formulae in coastal engineering practice. Coastal Engineering, ~~, 1--;12.
HYDH()(~HAPH rc: CHAIn's, 1976. Naval Hydrographic Office, Government of India, Nos. 202-220.
JAHDINE, T.P., 1979. The reliability of visually observedwave heights. Coastal Engineering, :1, ~t3-:i8.
JONSSON, I.G. and CARLSEN, N.A., 1976. Experirneutaland theoretical investigations in an oscillatory roughturbulent boundary layer. Journal Hvdrographic Research, 14, 45-60.
KHAlIS, N.C.; GIN(~EHICH, K.J., and ROSATI, .J.D., 1989.Duck 85 surf zone sand transport equipment. Technical Report, CERC, U.S. Army Corps of Engrs,Washington, DC.
LA\-lBltAK()S, K.F., 1982. Seabed wave boundary layermeasurements and analysis. Journal Geophysical Research, 87,4171-4189.
Mirc«, W.H. and AHTHIIJ{, R.S., 19.52. Wave intensityalong a refracted ray. Gravity Waves, National Bureau of Standards Circular 521, United States Government Printing Press, Washington, DC, pp. 95-109.
OIUt, T.E. and HERBICH, tJ.R., 1969. Numerical calculation of wave refraction by digital computer. Coastaland Ocean Engineering Division, Report No. 114,Texas A&M University, College Station, Texas.
SHIPS WEATHI·q{ CODE, 1982. India Meteorological Department, Government of India, Pune, India.
SHOHE PHOTECTION MANI1AL, 1975. Coastal EngineeringResearch Centre, U.S. Army, Washington, DC.
SHORE PI{OTECTION MANtIAL, 1984. Coastal EngineeringResearch Centre, lLS. Army, Washington, DC.
SKOV(~AAI{l), 0.; ~J()NSSON, I.G., and BEHTELSEN, ~J.A.,
1975. Computation of wave heights due to refractionand friction. Journal Waterway, Harbors and Coastal Division (ASCE), 1, 15-~~2.
WALTON, ~r.L., ~TI{', 197:t Littoral drift computationsalong the coast of Florida by means of ship waveobservations. Technical Report No. 15, University ofFlorida, Gainesville, Florida.
WILLIS, D.H., 1980. Evaluation of sediment transportformulae in coastal engineering practice-Discussion.Coastal Engineering, 4, 177-181.
I I Rf~SlJM~~ 0
On a est.ime Ie transport de sediments parallelernent a Ia cote de Cochin it Porhandar a partir de donnees de houle observees de
1968 a 1986 d'un bateau. Les transports sedirnentaires sont assez eleves pendant la periode de mousson du SW, de juin aseptembre.
Le taux global annuel de transport est eleve (I,5--2 x 10" m') sur les cotes du Kerala, au nord du Karnataka et du Sud du Gujerat.
La cote de Maharashtra presente un transport net annual assez faible (0, I x TO'' III I). Le transport net annuel est au Sud Ie longdes cotes du Kerala et du Karnataka. Les cotes de Malvan, Dahhol, Murud et Tarapur sont des points nodaux de derive avec un
volume transport.e egal dans chaque direction. Catherine 110us(/w'I.-Hresso!ier. Gccnnorpholiwie r;P/fl~. Moniroug«, France.
l I HESlJMEN l J
Observaciones de olas realizidas desde huques (I ~H)8 ··1986), han permit ido estimar el transport.e de sedimentos a 10largo de la costa
Oeste de la India entre Cochin y Porbandar. Para las costas de: Kerala, Norte de Karnataka y Sud de Gujarat, durante el periodo
de Junio a Set iembre, epoca de del Monson del S\V. el VOIUIlWIl del mat.erial transport.ado rue rulat.ivament.e alto (loG a ? x l O" m ').
En Maharasht.ra, el t ransporte net.o annal calculado rue relat.ivarnente hajo (0.1 x 1()!' ill"). En las costas Norte de Kerala y Karnataka
la direccion del transporte neto fue hacia el Sud. Proximo a las zonas costeras dE' Malvan, Dahhol, Murud y Tarapur, se present.an
dos puntos nodales, eon igual volumen anua l t.ransport.ado en las dirvcciones dorn inant es. Nest or W. Lu nfredi, C1C-l TNLP. LaPlata, Argen! ina.
I I ZllSAl'VlMENFASSlINC [I
An der Wcstkiist e l ndiens wurde zwischen Cor-hin und Porbandar der kustcnparallele Sedimrnttrunsport abgeschat z]; Dies gr-schah
mit Hilfe von Wellenrnessungun, die vorn Schill' <iUS dllrch~ejTIlHt wurdun (I B()K his 19Hf»), Wahrend des Sudwr-stmonsuns. also von
Juni his September, wird relativ viol Sediment kust euparallcl ve rset zt. Die jiihriiche Rate ell'S gesamten SedirnenUransports ist an
den Kusten Nordkeralas, Nordkarnatakas lind Siidgujarats horh (I.:) .'.! ".. 10" rrr). I)agegl~n we ist dip Kuste von Maharashtra ei nen
vergleiehsweise nied r ige n jnhrlichen Net.tot rnnspor t auf (0.1 :> I()' m '}, En1lang dell 1\iist e n Nordke ralas und Karnata kas ist der
jihrliche Nettotranspor1 siidwart» gericht.r·L 1)ie Kustr-nabschni: t.e hr-i Malvan, I rahhul, Murud lind Tarapur scheinen Knotenpunkte
zu sein. da bei ihnen im .Iahr jeweil« gleichp St.'dinwllt nu-ugeu ill he idt-n Hichtllngell transport ier t we rdcn. - Helmut Bruckner,Depart nunt of (,'('()gnl/Jhy, Unu-crsitv of Morburu, (,'ernwrn.
-Iour nal (If ('oast.al H('sparch, Vol. H. No. ·1, 199~
![Longshore current and sediment transportufdcimages.uflib.ufl.edu/UF/00/09/77/43/00001/... · LISTOFFIGURES Figure DistributionofLongshoreVelocityandSediment TransportacrosstheSurfZone(afterZenkovitch[1])](https://img.pdfslide.net/doc/110x75/5eda5a5db3745412b5713394/longshore-current-and-sediment-listoffigures-figure-distributionoflongshorevelocityandsediment.jpg)