Embed Size (px)
Citation preview
Looking at Biosphere-Atmosphere Interactions Differently:
Roles of Switches, Lags and Pulses on Carbon, Water and Energy Fluxes with Data from a Global Network-Fluxnet
Dennis Baldocchi
ESPM/Ecosystem Sciences Div.
University of California, Berkeley
Toronto SeminarMarch 21, 2006
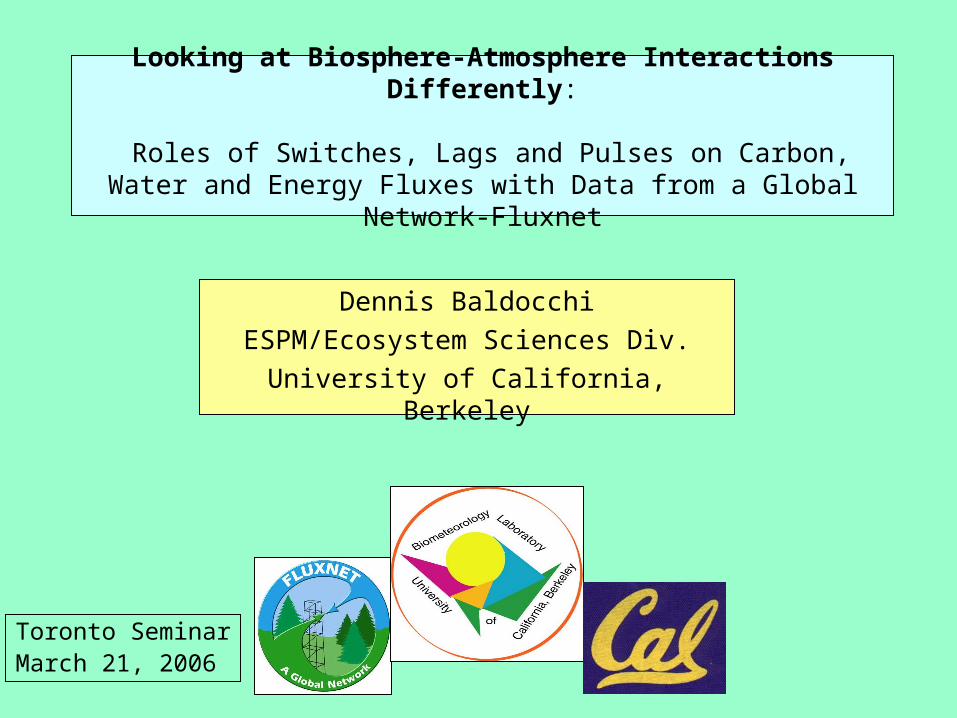
Why Pulses, Switches and Lags are Important?
• They are Features of Complex Dynamical Systems
• Biosphere is a Complex Dynamical System – Constituent Processes are Non-linear and Experience Non-
Gaussian Forcing– Possess Scale-Emergent Properties– Experiences Variability Across a Spectrum of Time and Space
Scales– Solutions are sensitive to initial conditions– Solutions are path dependent– Chaos or Self-Organization can Arise
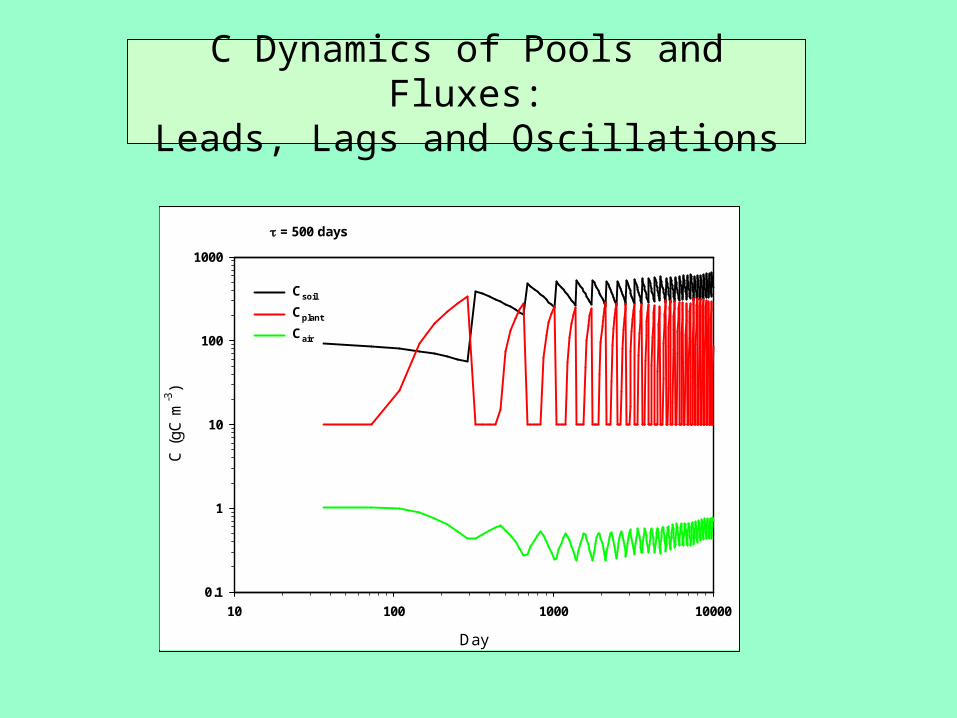
C Dynamics of Pools and Fluxes:Leads, Lags and Oscillations
Day
10 100 1000 10000
C (
gC
m-3
)
0.1
1
10
100
1000
Csoil
Cplant
Cair
= 500 days
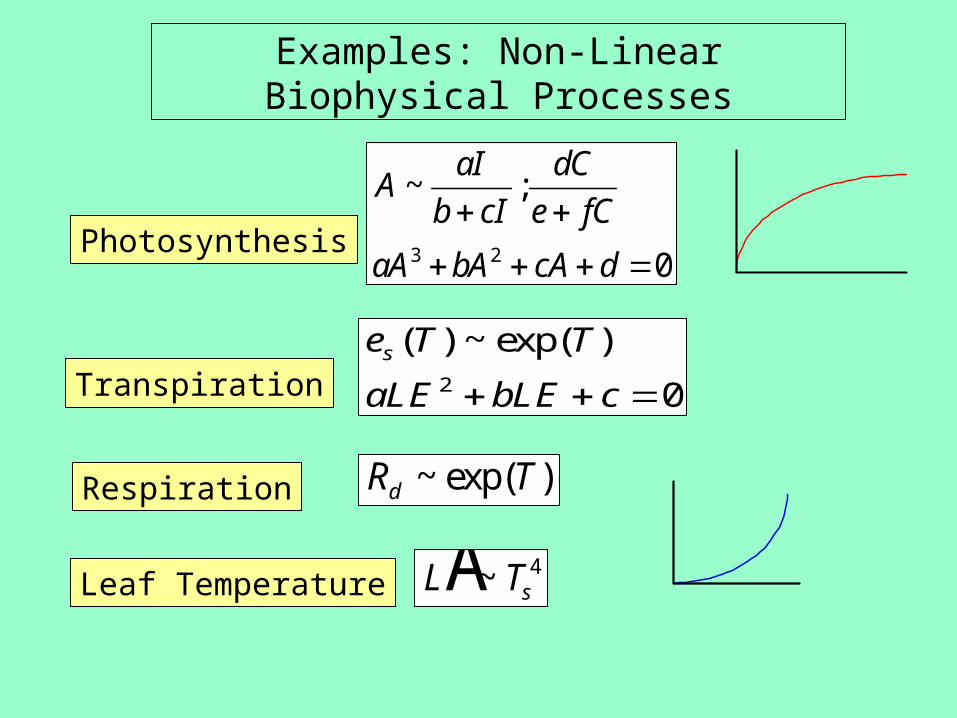
Examples: Non-Linear Biophysical Processes
L TsA~ 4
e T T
aLE bLE cs ( ) ~ exp( )
2 0
AaI
b cI
dC
e fC
aA bA cA d
~ ;
3 2 0
Leaf Temperature
Transpiration
Photosynthesis
Respiration R Td ~ exp( )
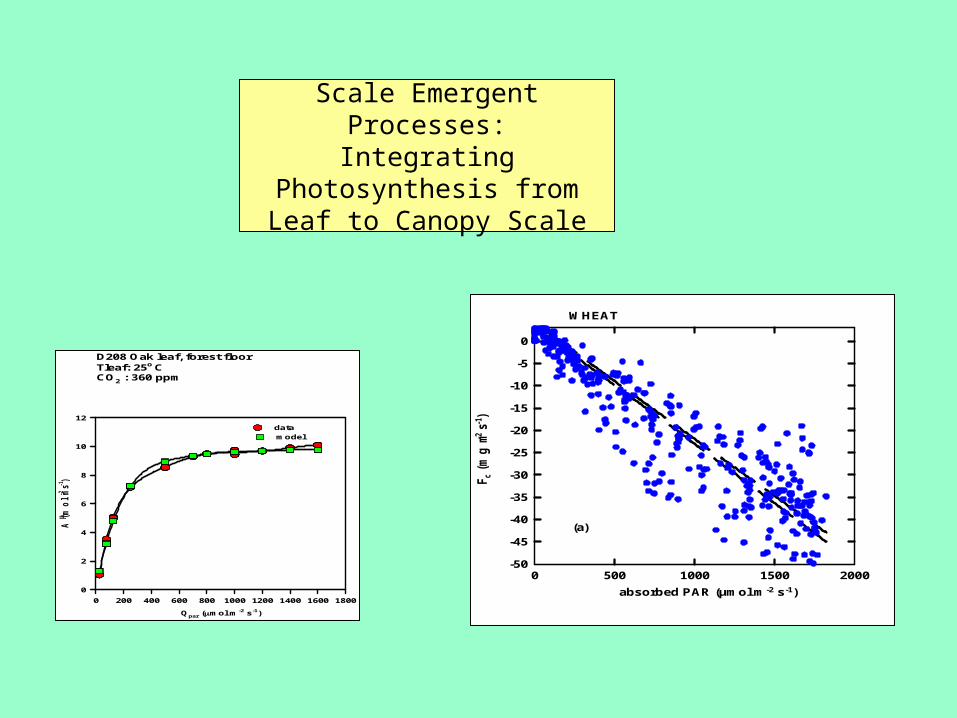
Scale Emergent Processes:Integrating Photosynthesis from Leaf to Canopy Scale
D208 Oak leaf, forest floorTleaf: 25o CCO2 : 360 ppm
Qpar (mol m-2 s-1)
0 200 400 600 800 1000 1200 1400 1600 1800
A (
mo
l m-2 s
-1)
0
2
4
6
8
10
12
data
model
(a)
0 500 1000 1500 2000-50
-45
-40
-35
-30
-25
-20
-15
-10
-5
0
absorbed PAR (µmol m-2 s-1)
WHEAT
Fc
(mg
m-2 s
-1)
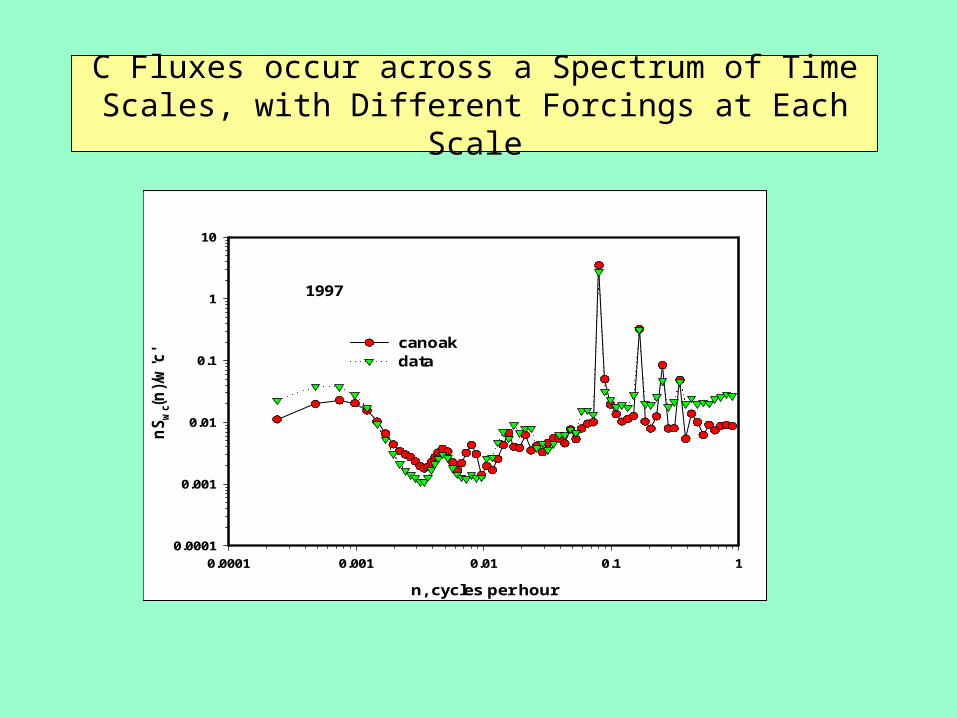
C Fluxes occur across a Spectrum of Time Scales, with Different Forcings at Each Scale
n, cycles per hour
0.0001 0.001 0.01 0.1 1
nS
wc(
n)/
w'c
'
0.0001
0.001
0.01
0.1
1
10
canoakdata
1997
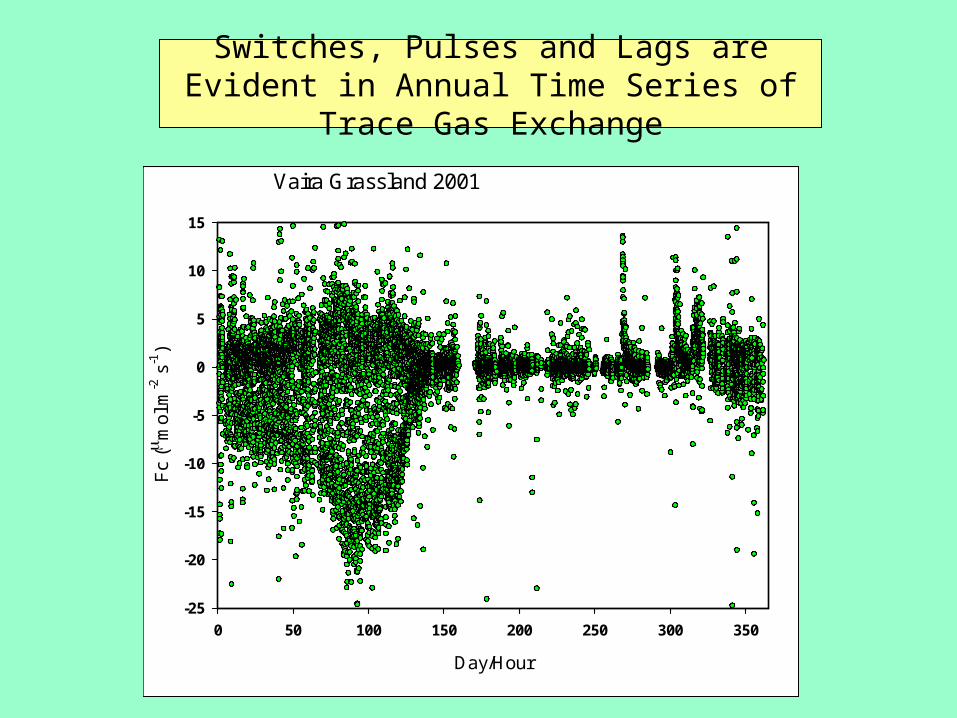
Switches, Pulses and Lags are Evident in Annual Time Series of Trace Gas Exchange
Vaira Grassland 2001
Day/Hour
0 50 100 150 200 250 300 350
Fc
(m
ol m
-2 s
-1)
-25
-20
-15
-10
-5
0
5
10
15
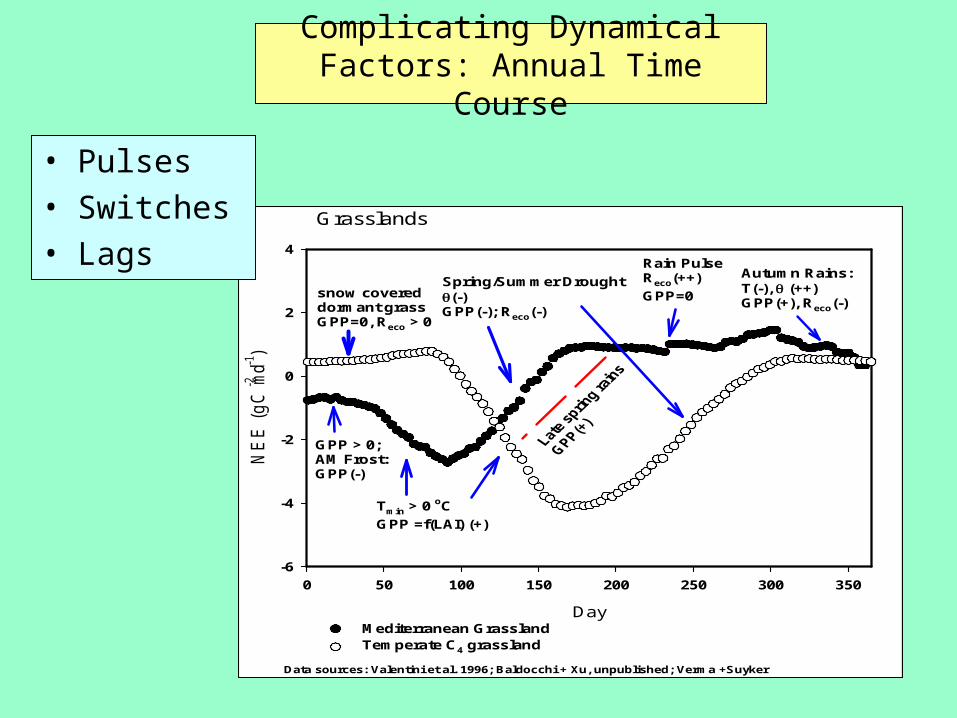
Complicating Dynamical Factors: Annual Time Course
Grasslands
Day
0 50 100 150 200 250 300 350
NE
E (
gC
m-2 d
-1)
-6
-4
-2
0
2
4
Mediterranean GrasslandTemperate C4 grassland
Data sources: Valentini et al. 1996; Baldocchi + Xu, unpublished; Verma +Suyker
Spring/Summer Drought(-)GPP(-); Reco(-)
GPP > 0;AM Frost:GPP(-)
Tmin > 0 oC
GPP =f(LAI) (+)
Rain PulseReco(++)
GPP=0
Autumn Rains:T(-), (++)GPP(+), Reco(-)
snow covereddormant grassGPP=0, Reco > 0
• Pulses• Switches• Lags
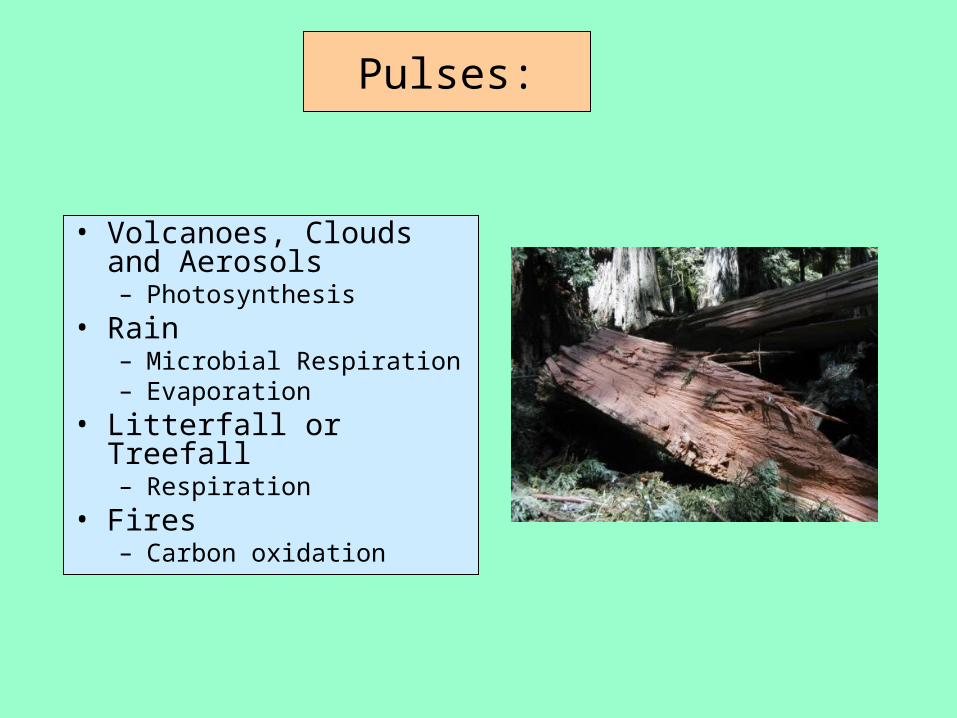
Pulses:
• Volcanoes, Clouds and Aerosols– Photosynthesis
• Rain– Microbial Respiration– Evaporation
• Litterfall or Treefall– Respiration
• Fires– Carbon oxidation
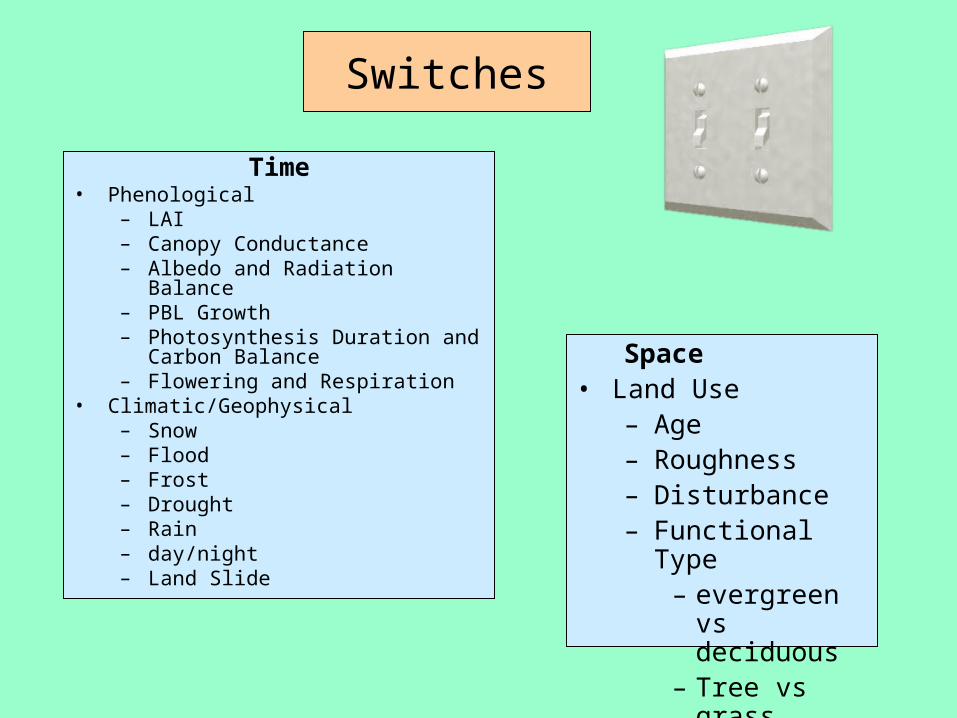
Switches
Time• Phenological
– LAI– Canopy Conductance– Albedo and Radiation Balance – PBL Growth– Photosynthesis Duration and
Carbon Balance– Flowering and Respiration
• Climatic/Geophysical– Snow– Flood– Frost– Drought– Rain– day/night– Land Slide
Space• Land Use
– Age– Roughness– Disturbance– Functional Type
– evergreen vs deciduous
– Tree vs grass
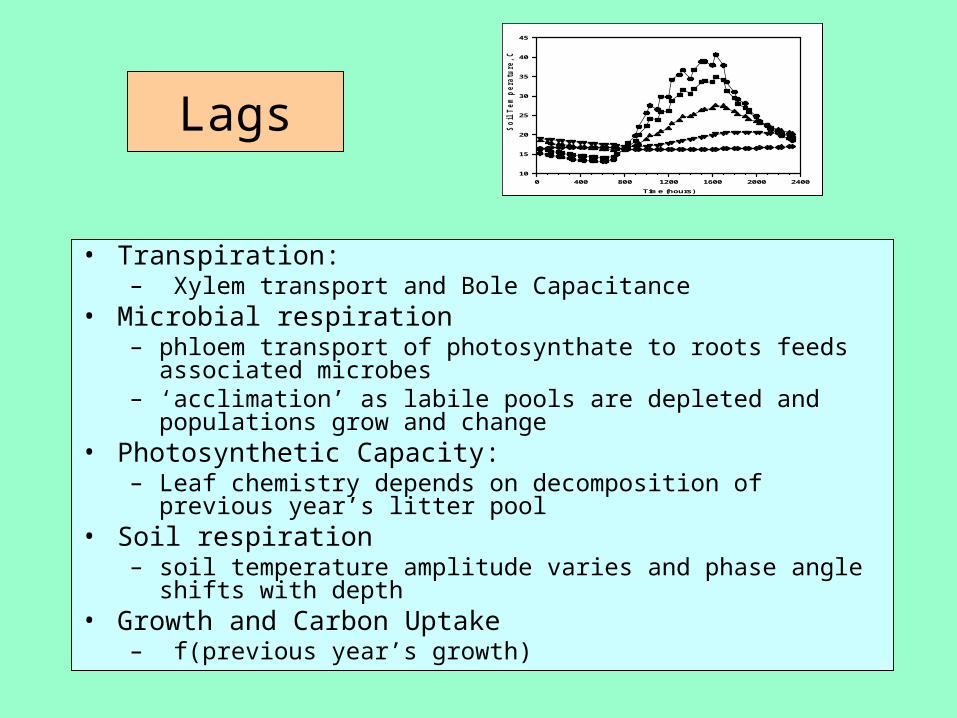
Lags
• Transpiration:– Xylem transport and Bole Capacitance
• Microbial respiration– phloem transport of photosynthate to roots feeds associated
microbes– ‘acclimation’ as labile pools are depleted and populations grow and
change• Photosynthetic Capacity:
– Leaf chemistry depends on decomposition of previous year’s litter pool
• Soil respiration– soil temperature amplitude varies and phase angle shifts with depth
• Growth and Carbon Uptake– f(previous year’s growth)
Time (hours)
0 400 800 1200 1600 2000 2400
So
il T
em
peratu
re, C
10
15
20
25
30
35
40
45
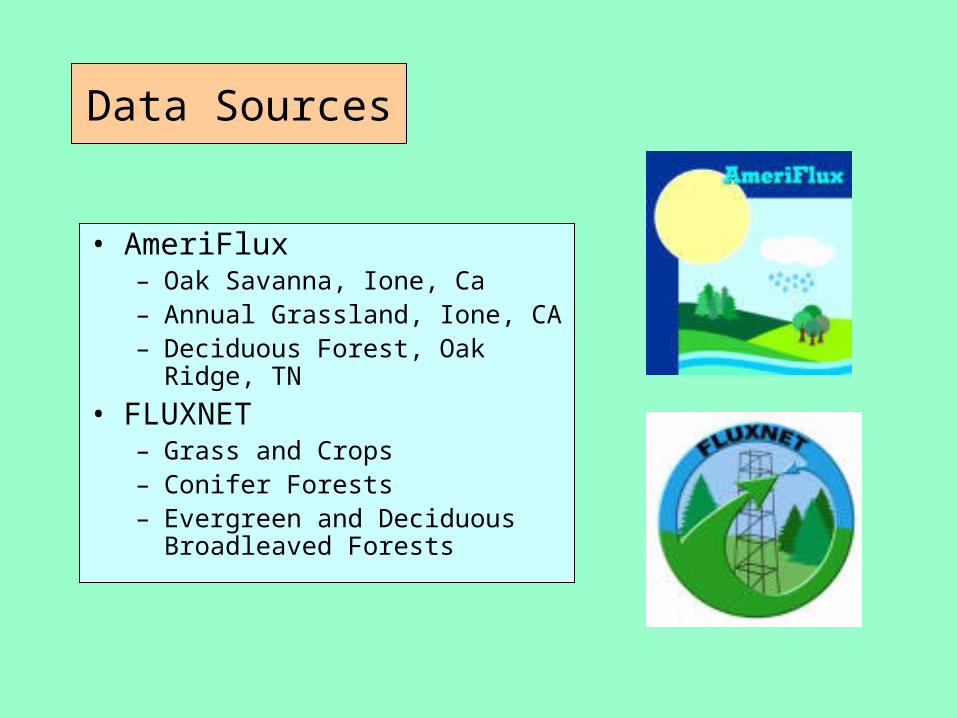
Data Sources
• AmeriFlux– Oak Savanna, Ione, Ca– Annual Grassland, Ione, CA– Deciduous Forest, Oak Ridge,
TN
• FLUXNET – Grass and Crops– Conifer Forests– Evergreen and Deciduous
Broadleaved Forests
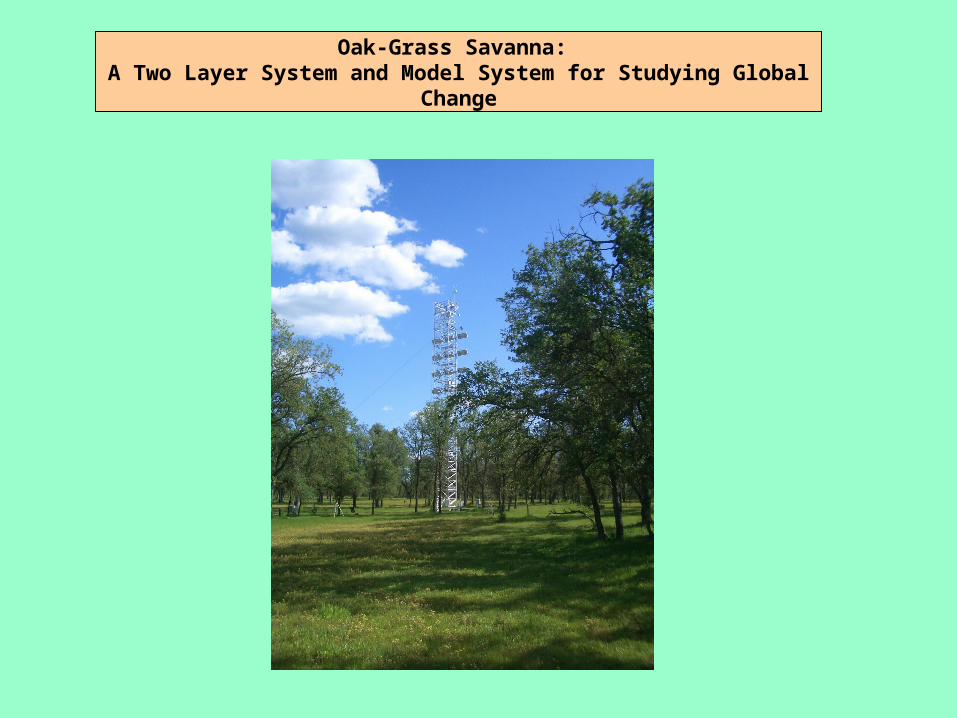
Oak-Grass Savanna: A Two Layer System and Model System for Studying Global Change
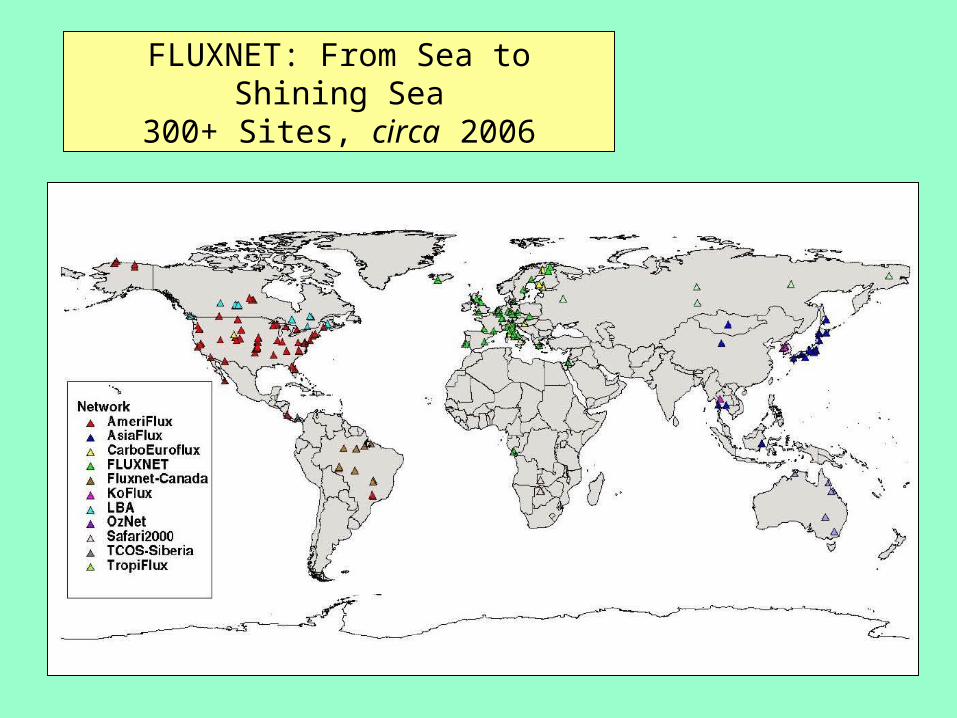
FLUXNET: From Sea to Shining Sea300+ Sites, circa 2006
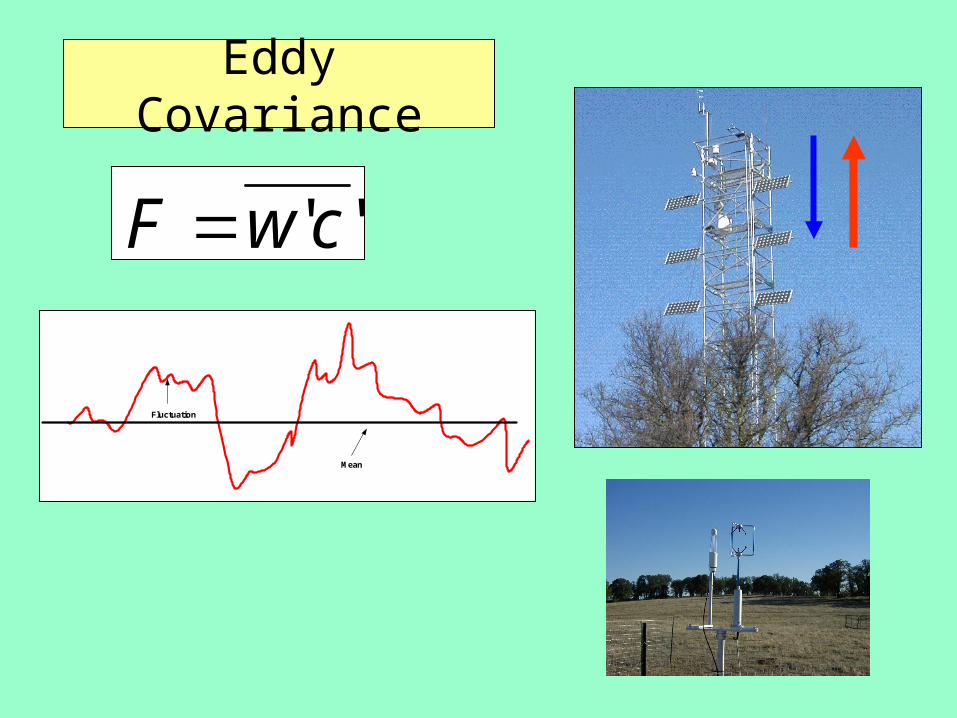
Eddy Covariance
F w c ' '
Mean
Fluctuation
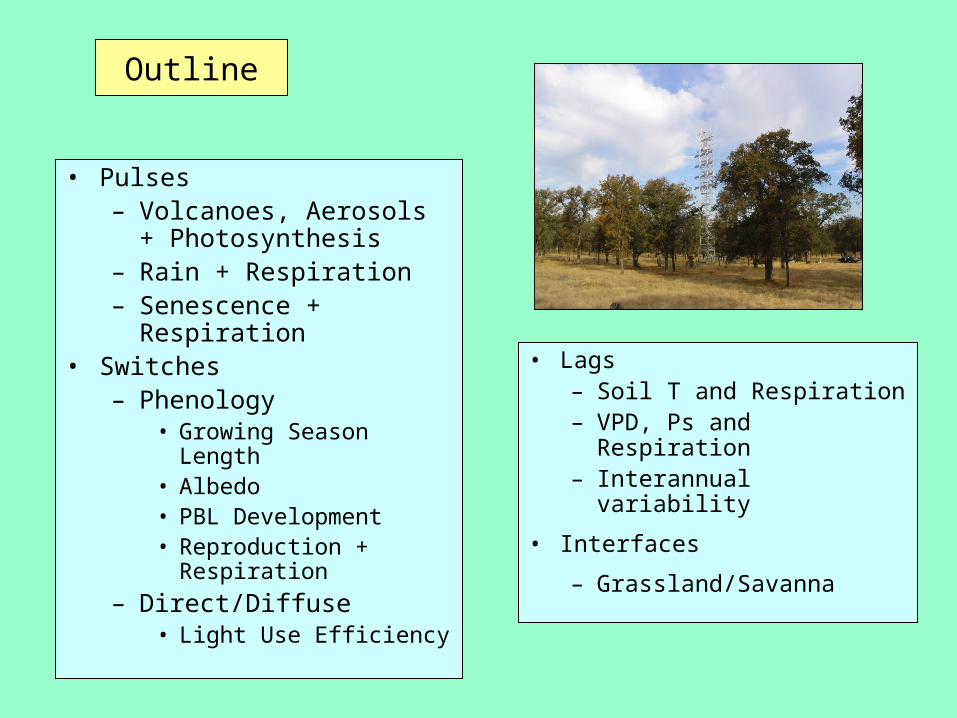
Outline
• Pulses– Volcanoes, Aerosols +
Photosynthesis– Rain + Respiration – Senescence +
Respiration• Switches
– Phenology• Growing Season Length• Albedo• PBL Development• Reproduction +
Respiration
– Direct/Diffuse• Light Use Efficiency
• Lags– Soil T and Respiration– VPD, Ps and Respiration– Interannual variability
• Interfaces
– Grassland/Savanna
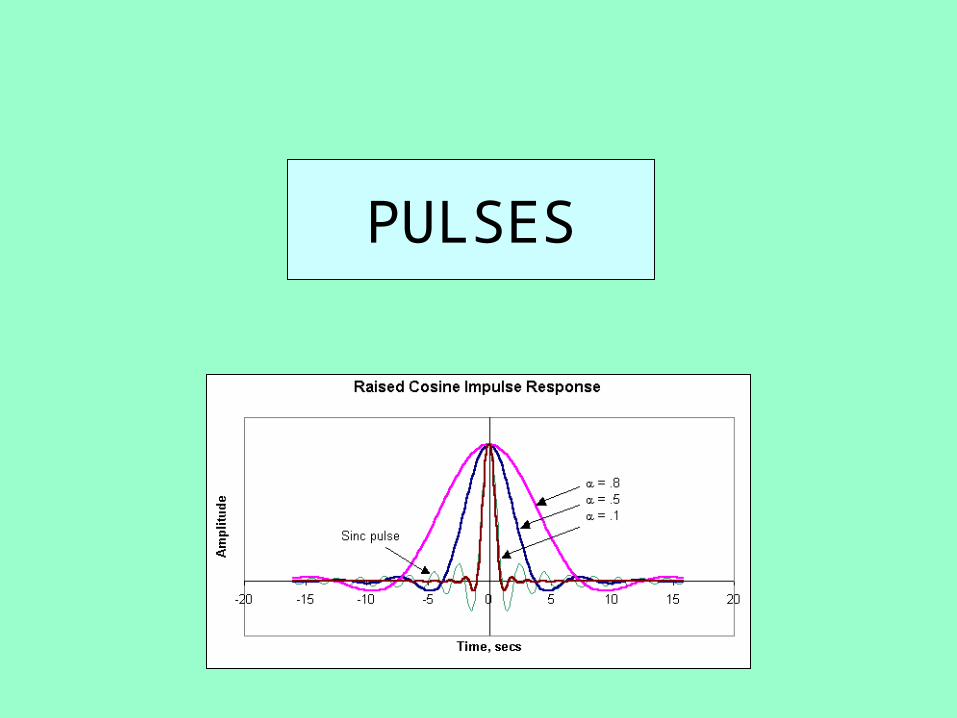
PULSES
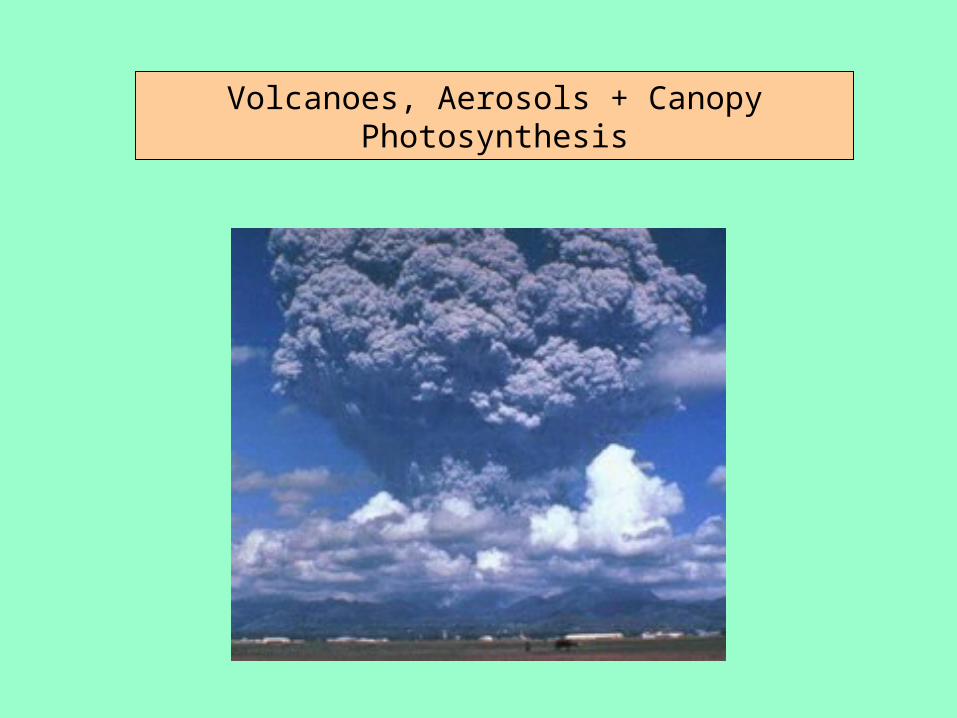
Volcanoes, Aerosols + Canopy Photosynthesis
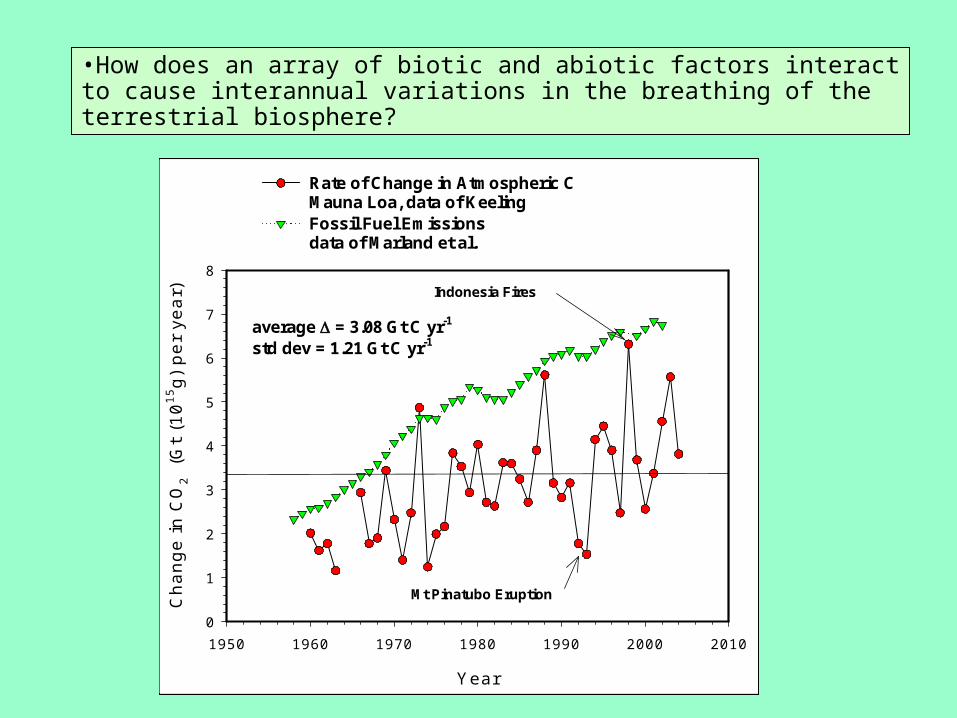
•How does an array of biotic and abiotic factors interact to cause interannual variations in the breathing of the terrestrial biosphere?
Y ear
1950 1960 1970 1980 1990 2000 2010
Ch
an
ge
in
CO
2
(Gt
(10
15g
) p
er
ye
ar)
0
1
2
3
4
5
6
7
8
Rate of Change in Atmospheric CMauna Loa, data of KeelingFossil Fuel Emissionsdata of Marland et al.
average = 3.08 Gt C yr-1
std dev = 1.21 Gt C yr-1
Mt Pinatubo Eruption
Indonesia Fires
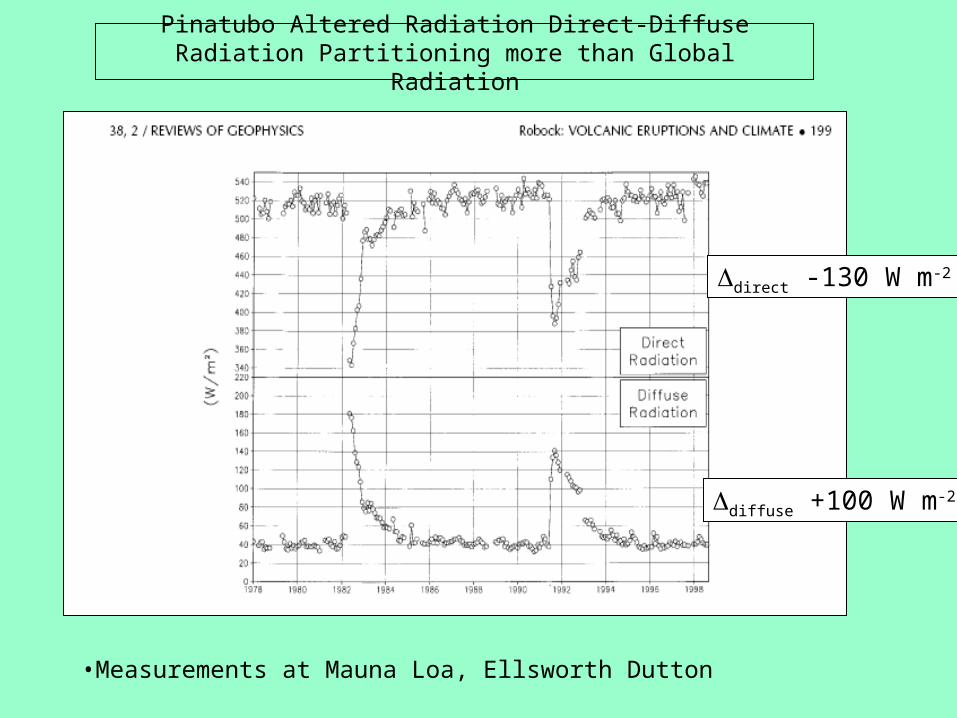
Pinatubo Altered Radiation Direct-Diffuse Radiation Partitioning more than Global Radiation
•Measurements at Mauna Loa, Ellsworth Dutton
direct -130 W m-2
diffuse +100 W m-2
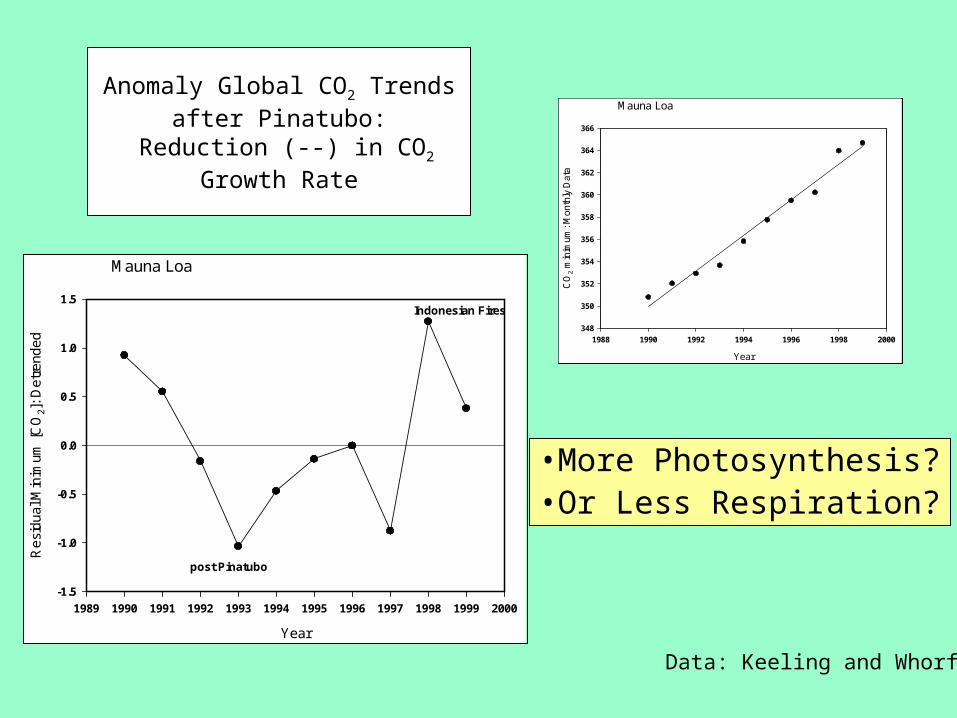
Anomaly Global CO2 Trends after Pinatubo:
Reduction (--) in CO2 Growth Rate
Mauna Loa
Year
1988 1990 1992 1994 1996 1998 2000
CO
2 m
inim
um:
Mon
thly
Dat
a
348
350
352
354
356
358
360
362
364
366
year vs CO@ min
Mauna Loa
Year
1989 1990 1991 1992 1993 1994 1995 1996 1997 1998 1999 2000
Res
idua
l Min
imum
[C
O2]
: D
etre
nded
-1.5
-1.0
-0.5
0.0
0.5
1.0
1.5
post Pinatubo
Indonesian Fires
Data: Keeling and Whorf
•More Photosynthesis?•Or Less Respiration?
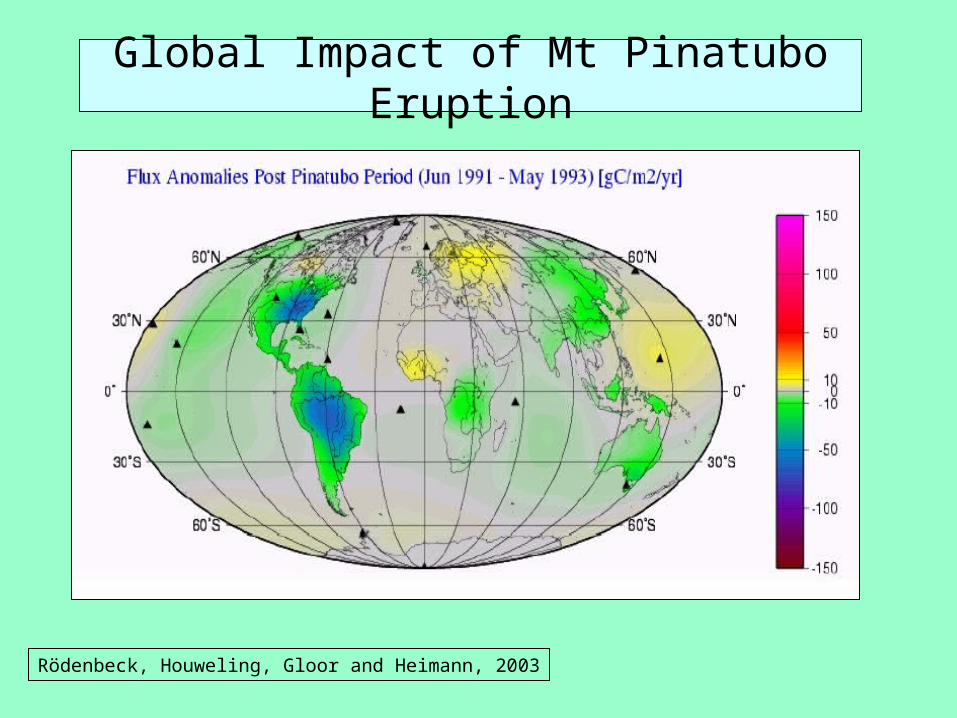
Global Impact of Mt Pinatubo Eruption
Rödenbeck, Houweling, Gloor and Heimann, 2003
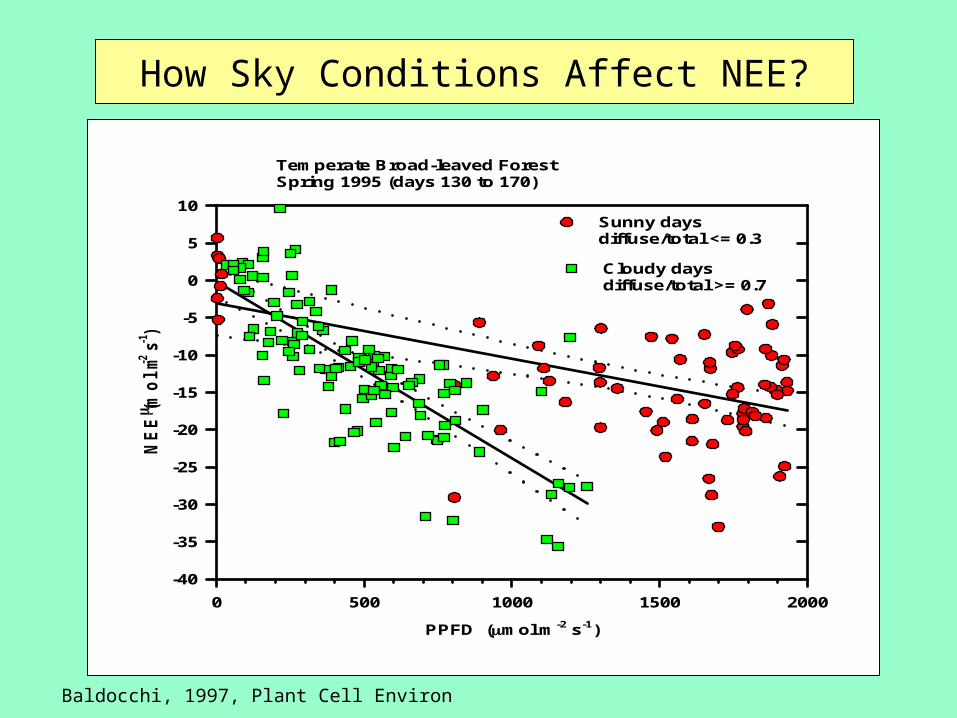
PPFD (mol m-2 s-1)
0 500 1000 1500 2000
NE
E ( m
ol
m-2 s
-1)
-40
-35
-30
-25
-20
-15
-10
-5
0
5
10Sunny daysdiffuse/total <= 0.3
Cloudy daysdiffuse/total >= 0.7
Temperate Broad-leaved ForestSpring 1995 (days 130 to 170)
How Sky Conditions Affect NEE?
Baldocchi, 1997, Plant Cell Environ
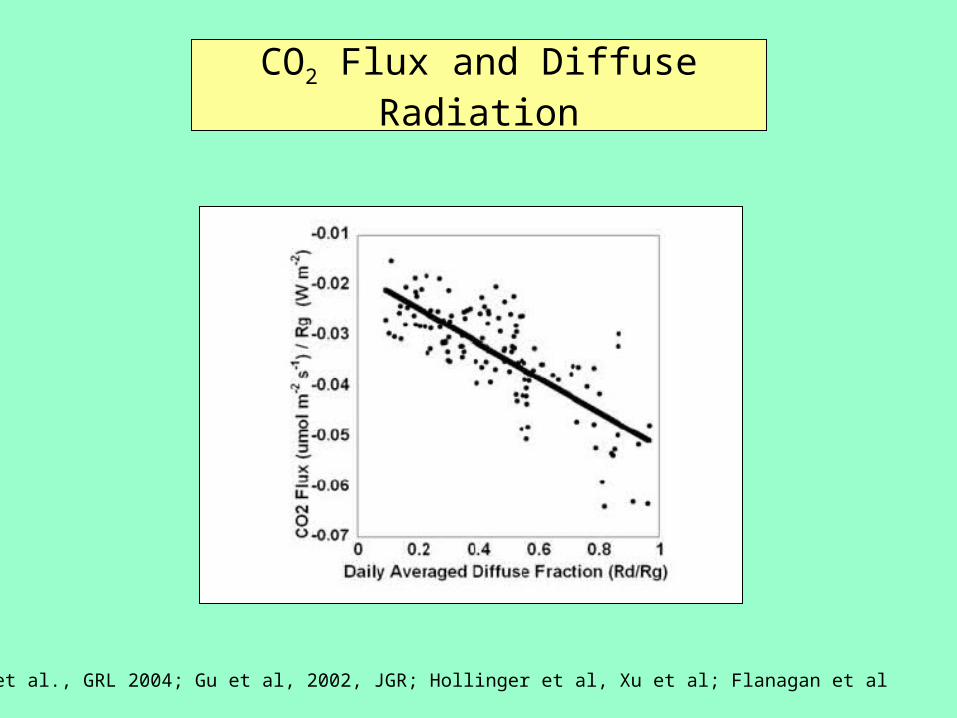
CO2 Flux and Diffuse Radiation
Niyogi et al., GRL 2004; Gu et al, 2002, JGR; Hollinger et al, Xu et al; Flanagan et al
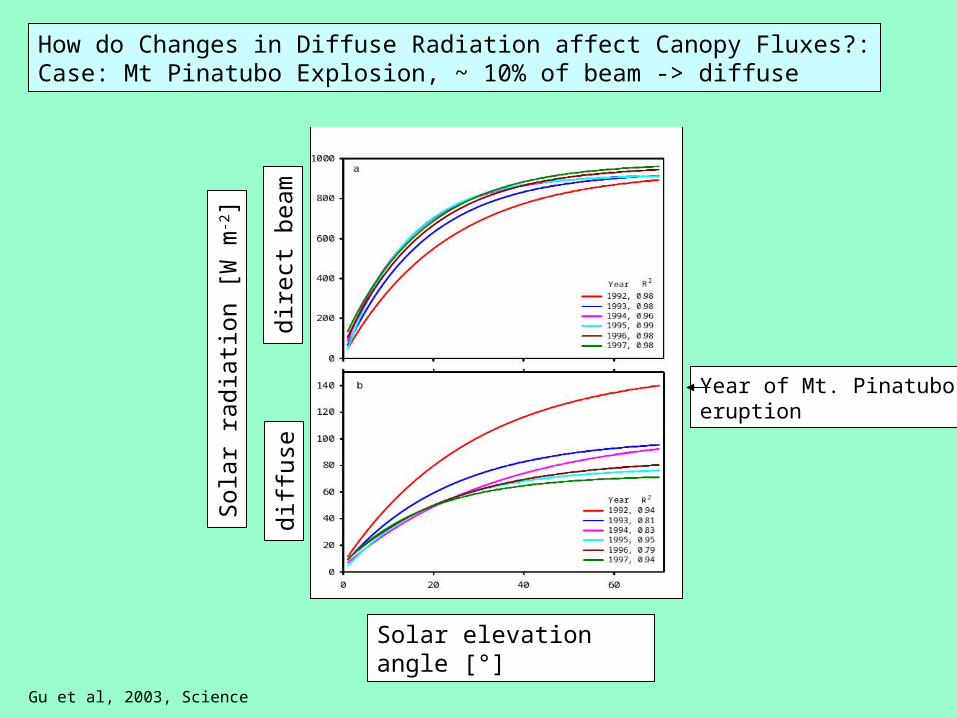
How do Changes in Diffuse Radiation affect Canopy Fluxes?:Case: Mt Pinatubo Explosion, ~ 10% of beam -> diffuse
Gu et al, 2003, Science
dire
ct b
eam
diff
use
Sol
ar r
adia
tion
[W m
-2]
Solar elevation angle [°]
Year of Mt. Pinatuboeruption
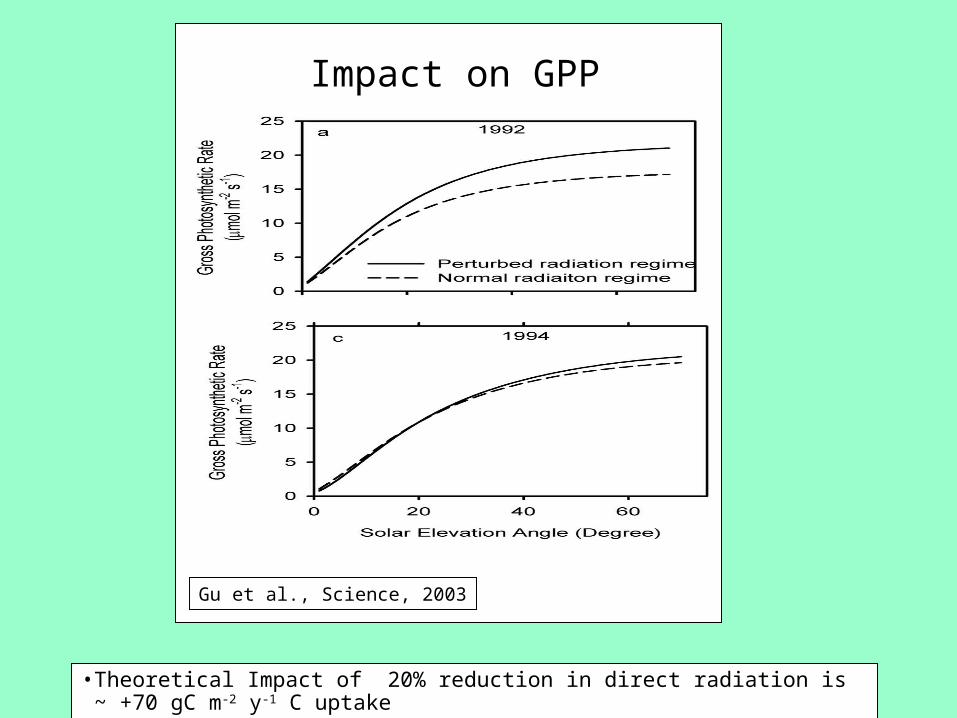
Impact on GPP
Gu et al., Science, 2003
•Theoretical Impact of 20% reduction in direct radiation is ~ +70 gC m-2 y-1 C uptake
Impact of rain pulses on ecosystem respiration:
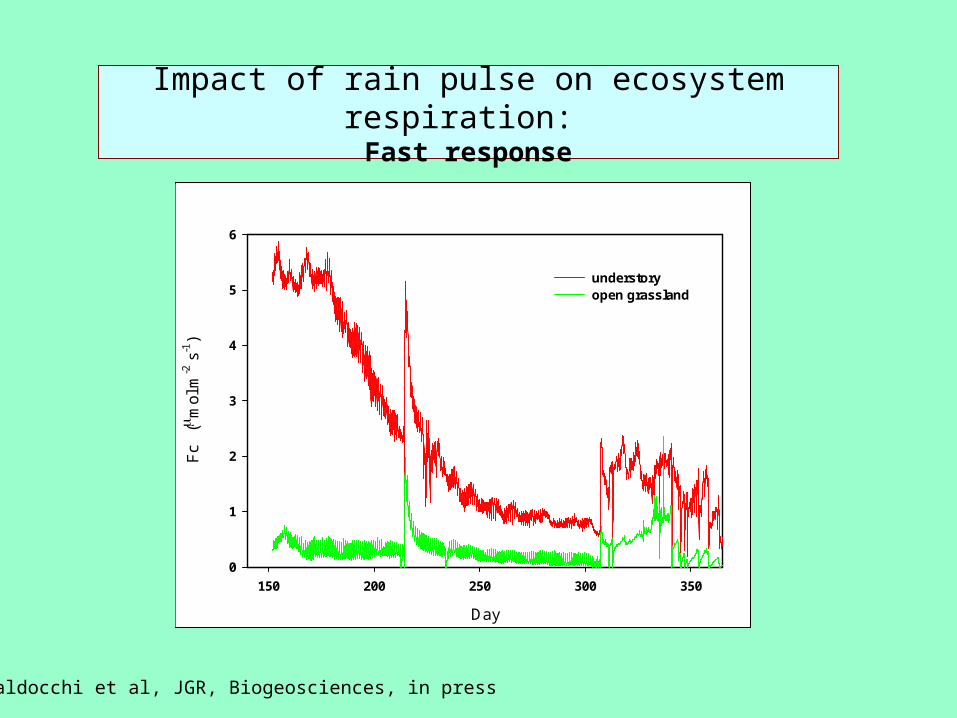
Impact of rain pulse on ecosystem respiration: Fast response
Day
150 200 250 300 350
Fc
( m
ol m
-2 s
-1)
0
1
2
3
4
5
6
understoryopen grassland
Baldocchi et al, JGR, Biogeosciences, in press
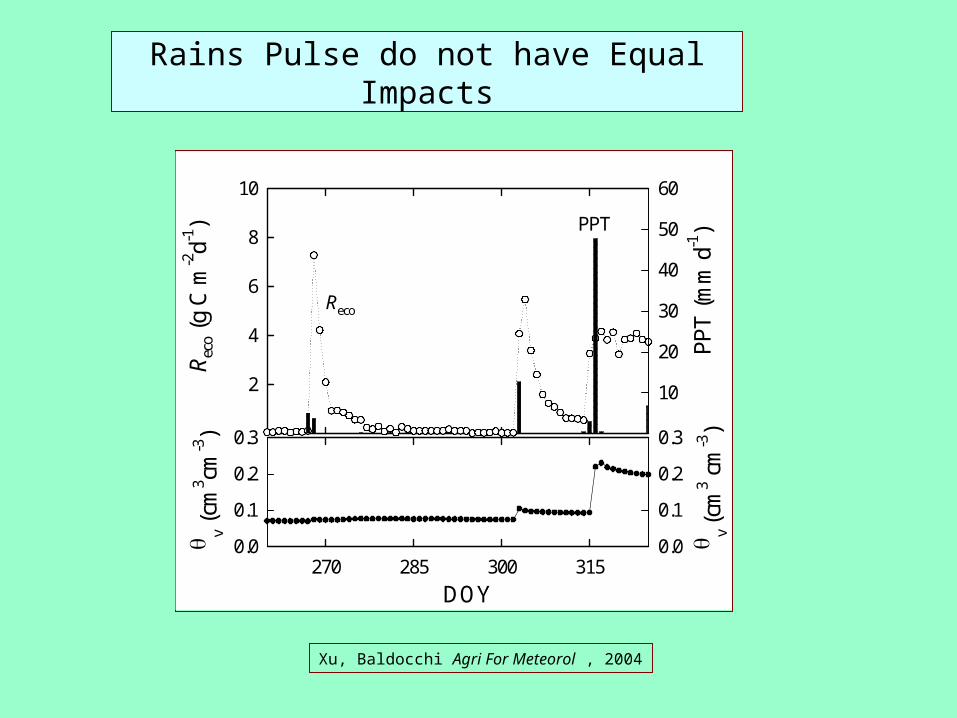
Rains Pulse do not have Equal Impacts
Rec
o (g
C m
-2d-1
)
2
4
6
8
10
PP
T (
mm
d-1
)
10
20
30
40
50
60
DOY270 285 300 315
v (c
m3 cm
-3)
0.0
0.1
0.2
0.3
v (c
m3 c
m-3
)
0.0
0.1
0.2
0.3
Reco
PPT
Xu, Baldocchi Agri For Meteorol , 2004
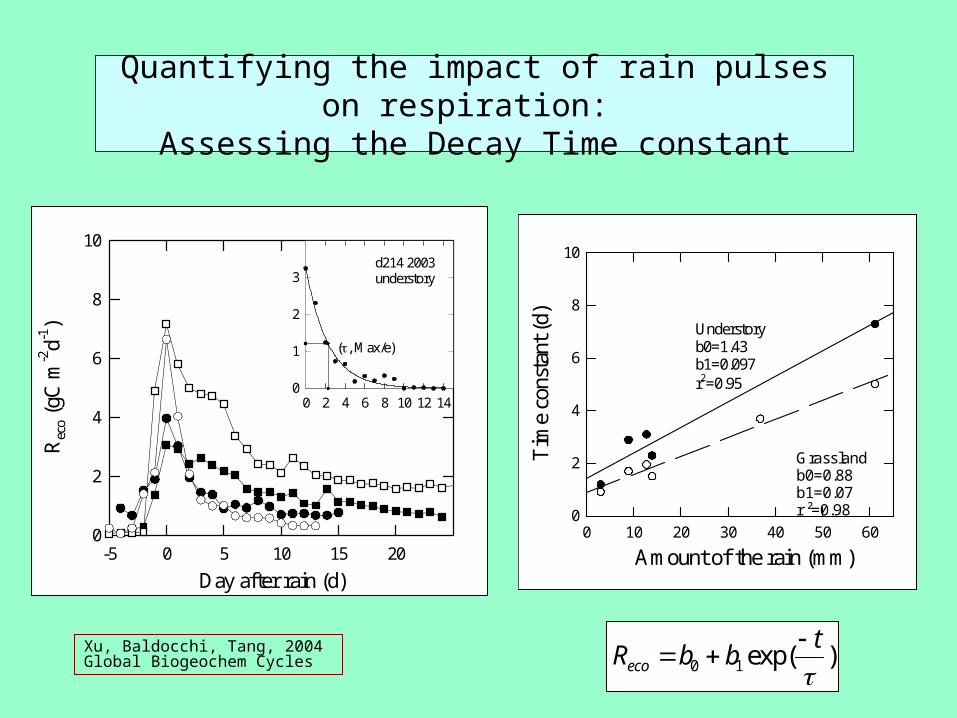
Quantifying the impact of rain pulses on respiration: Assessing the Decay Time constant
Day after rain (d)-5 0 5 10 15 20
Rec
o (g
C m
-2d-1
)
0
2
4
6
8
10
0 2 4 6 8 10 12 140
1
2
3d214 2003 understory
(, Max/e)
Amount of the rain (mm)0 10 20 30 40 50 60
Tim
e co
nsta
nt (
d)0
2
4
6
8
10
Understoryb0=1.43b1=0.097r2=0.95
Grasslandb0=0.88b1=0.07r ²=0.98
Xu, Baldocchi, Tang, 2004 Global Biogeochem Cycles R b b
teco
0 1 exp( )
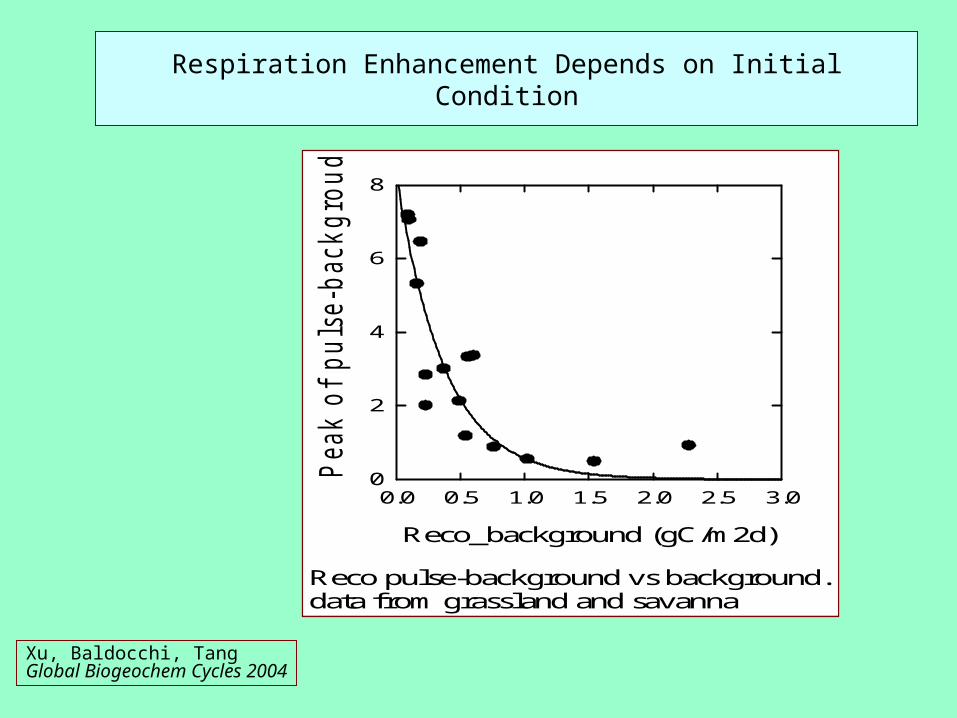
Respiration Enhancement Depends on Initial Condition
Reco pulse-background vs background. data from grassland and savanna
Reco_background (gC/m2d)
0.0 0.5 1.0 1.5 2.0 2.5 3.0
Peak
of
pu
lse-b
ack
gro
ud
(g
C/m
2s)
0
2
4
6
8
Xu, Baldocchi, Tang Global Biogeochem Cycles 2004
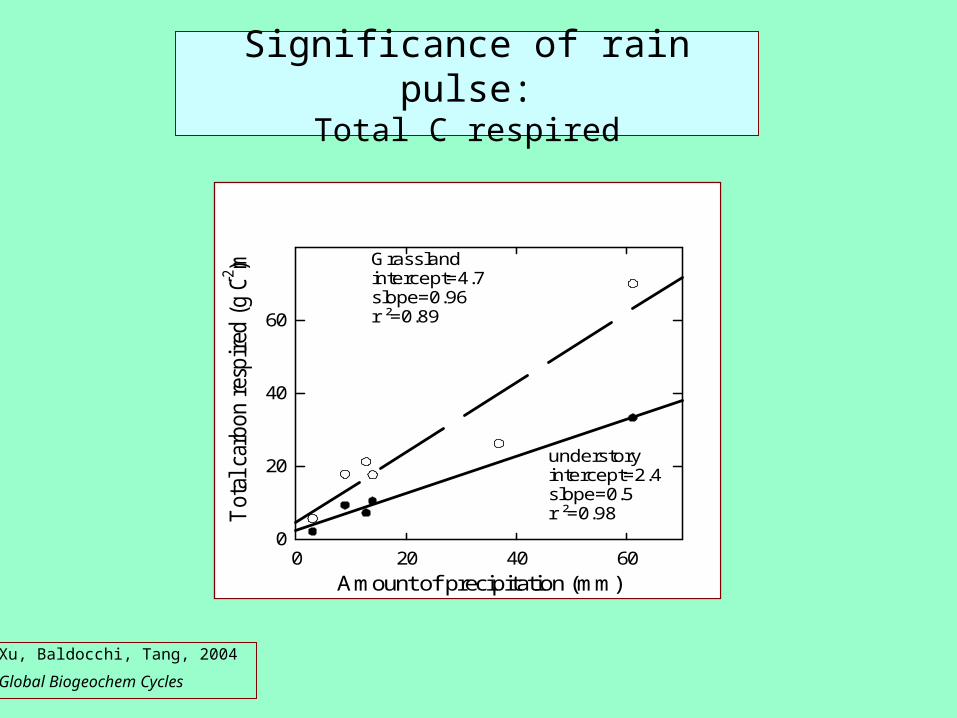
Significance of rain pulse:Total C respired
Amount of precipitation (mm)0 20 40 60
To
tal
carb
on
res
pir
ed (
g C
m-2)
0
20
40
60
Grasslandintercept=4.7slope=0.96r ²=0.89
understoryintercept=2.4slope=0.5r ²=0.98
Xu, Baldocchi, Tang, 2004
Global Biogeochem Cycles
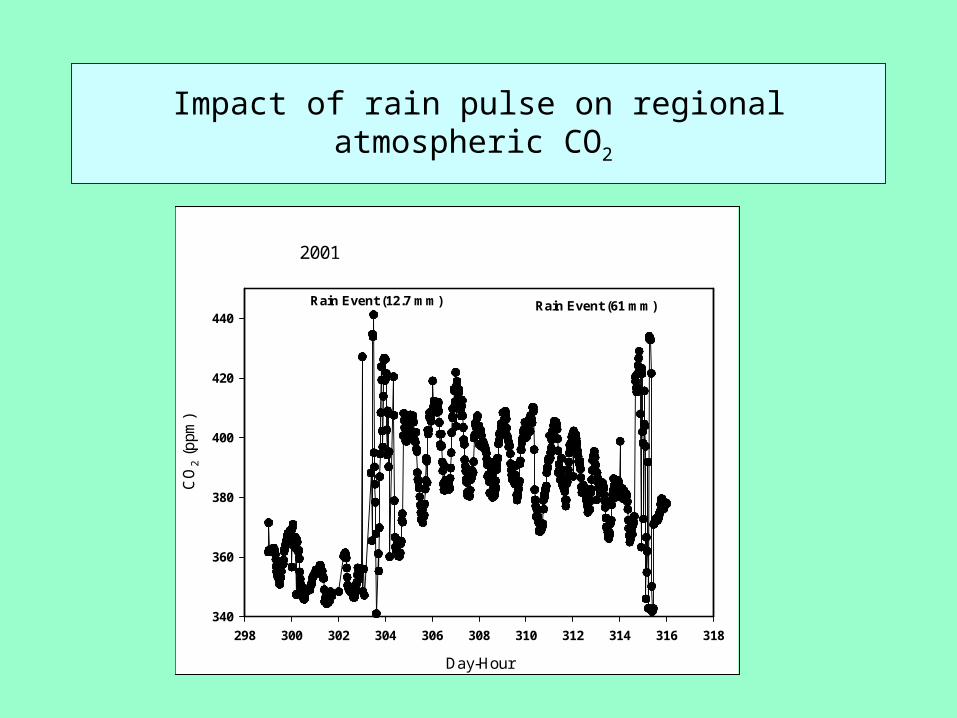
Impact of rain pulse on regional atmospheric CO2
2001
Day-Hour
298 300 302 304 306 308 310 312 314 316 318
CO
2 (
ppm
)
340
360
380
400
420
440Rain Event (12.7 mm) Rain Event (61 mm)
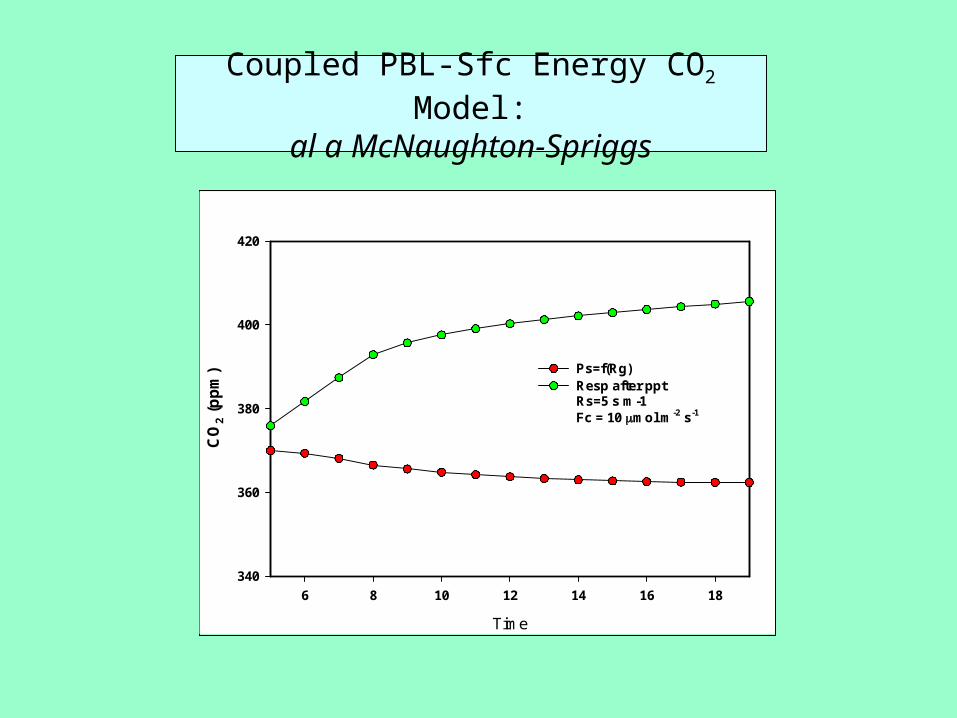
Coupled PBL-Sfc Energy CO2 Model:al a McNaughton-Spriggs
Time
6 8 10 12 14 16 18
CO
2 (
pp
m)
340
360
380
400
420
Ps=f(Rg)Resp after pptRs=5 s m-1Fc = 10 mol m-2 s-1
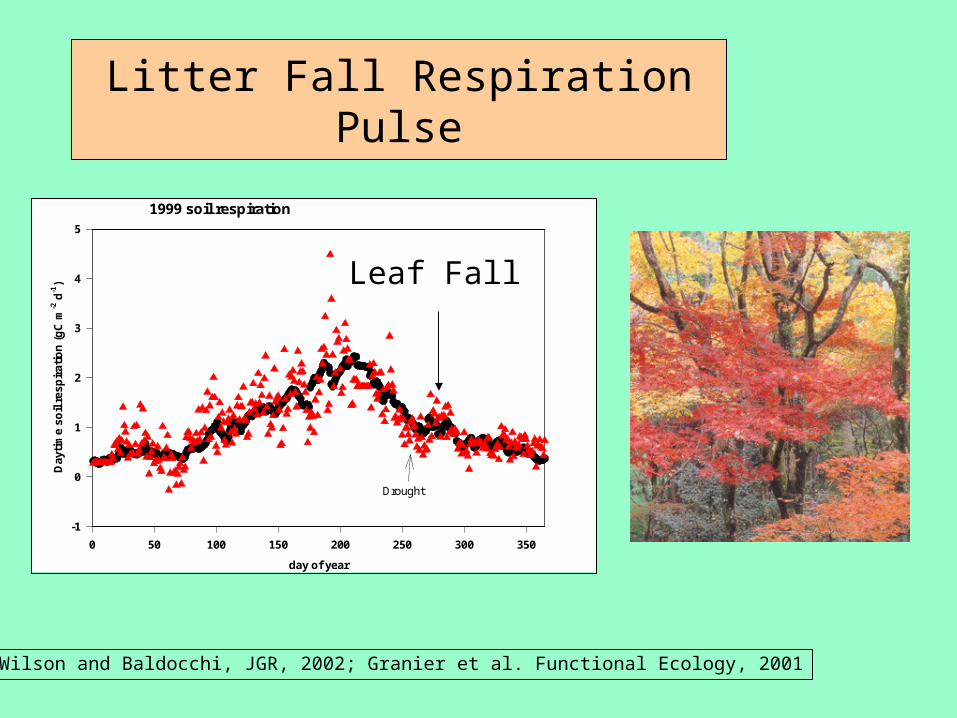
Litter Fall Respiration Pulse
1999 soil respiration
day of year
0 50 100 150 200 250 300 350
Da
ytim
e s
oil
res
pir
ati
on
(g
C m
-2 d
-1)
-1
0
1
2
3
4
5
Drought
Leaf Fall
•Wilson and Baldocchi, JGR, 2002; Granier et al. Functional Ecology, 2001

Switches
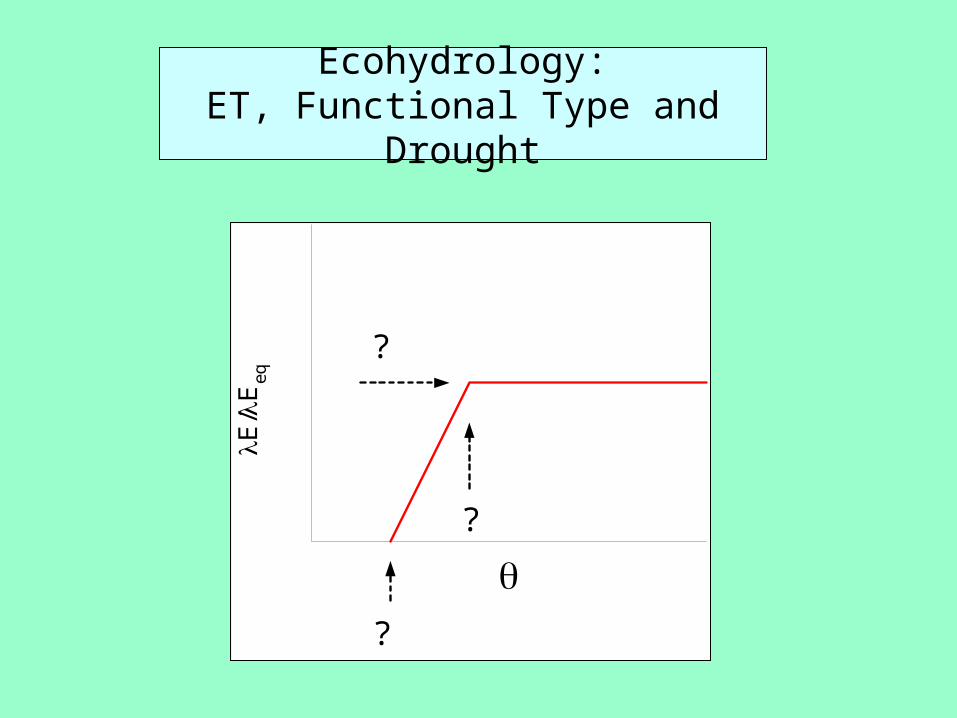
Ecohydrology:ET, Functional Type and Drought
?
?
?
E/
Eeq
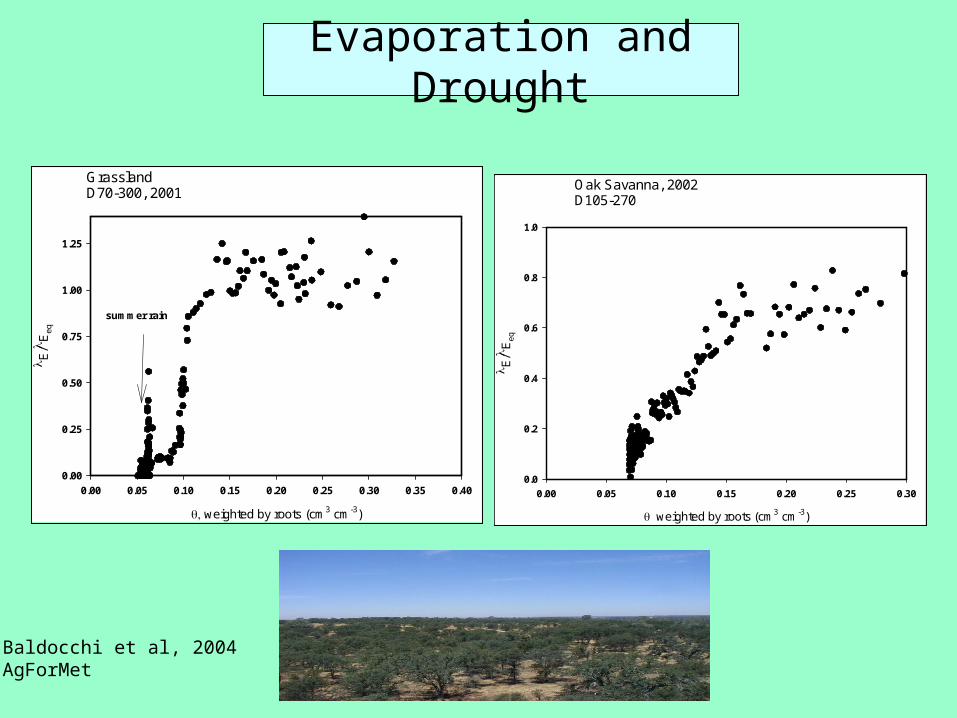
Evaporation and Drought
GrasslandD70-300, 2001
weighted by roots (cm3 cm-3)
0.00 0.05 0.10 0.15 0.20 0.25 0.30 0.35 0.40
E/
Eeq
0.00
0.25
0.50
0.75
1.00
1.25
summer rain
Oak Savanna, 2002D105-270
weighted by roots(cm3 cm-3)
0.00 0.05 0.10 0.15 0.20 0.25 0.30 E
/E
eq
0.0
0.2
0.4
0.6
0.8
1.0
Baldocchi et al, 2004AgForMet
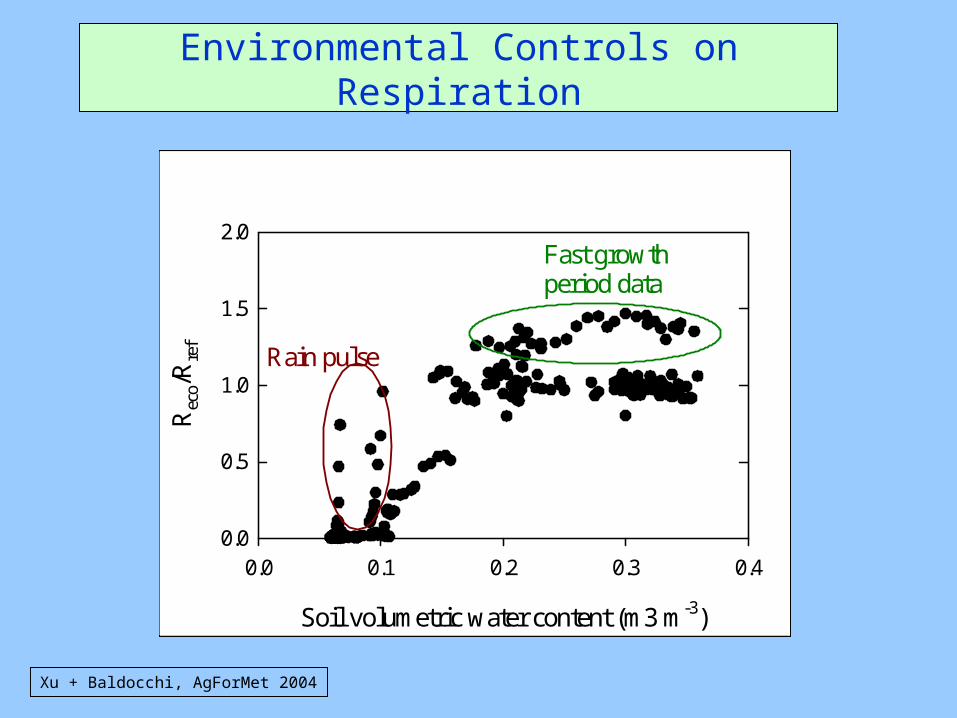
Environmental Controls on Respiration
Soil volumetric water content (m3 m-3)
0.0 0.1 0.2 0.3 0.4
Rec
o/R
ref
0.0
0.5
1.0
1.5
2.0Fast growth period data
Rain pulse
Xu + Baldocchi, AgForMet 2004
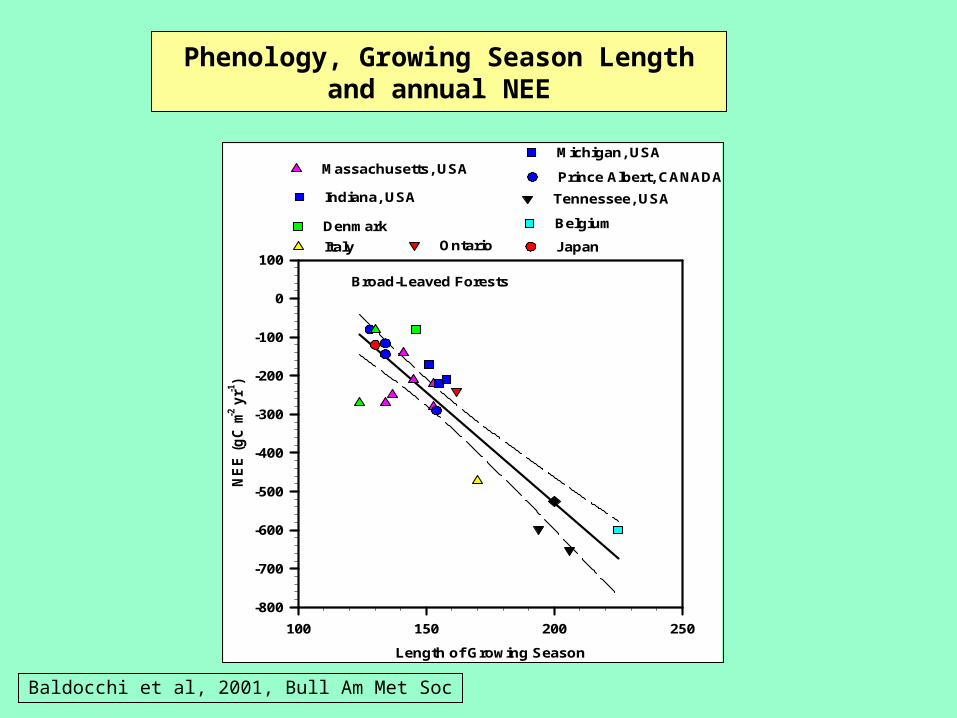
Phenology, Growing Season Length and annual NEE
Broad-Leaved Forests
Length of Growing Season
100 150 200 250
NE
E (
gC
m-2 y
r-1)
-800
-700
-600
-500
-400
-300
-200
-100
0
100Japan
Denmark
Italy
Massachusetts, USA
Belgium
Tennessee, USA
Prince Albert, CANADA
Ontario
Indiana, USA
Michigan, USA
Baldocchi et al, 2001, Bull Am Met Soc
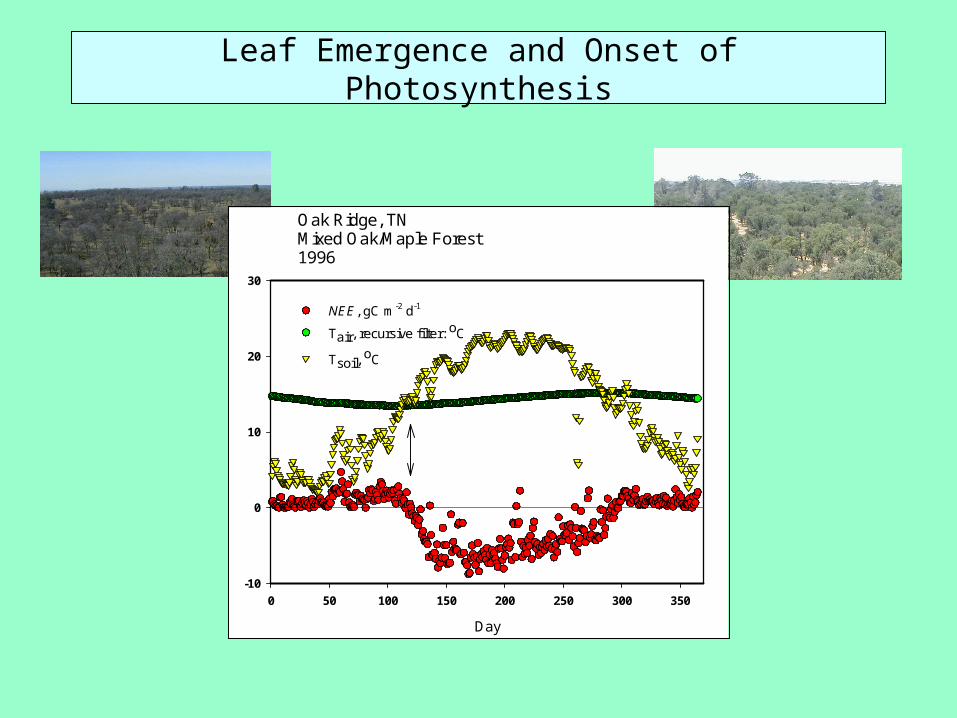
Leaf Emergence and Onset of Photosynthesis
Oak Ridge, TNMixed Oak/Maple Forest1996
Day
0 50 100 150 200 250 300 350
-10
0
10
20
30
NEE, gC m-2 d-1
Tair, recursive filter: oC
Tsoil, oC
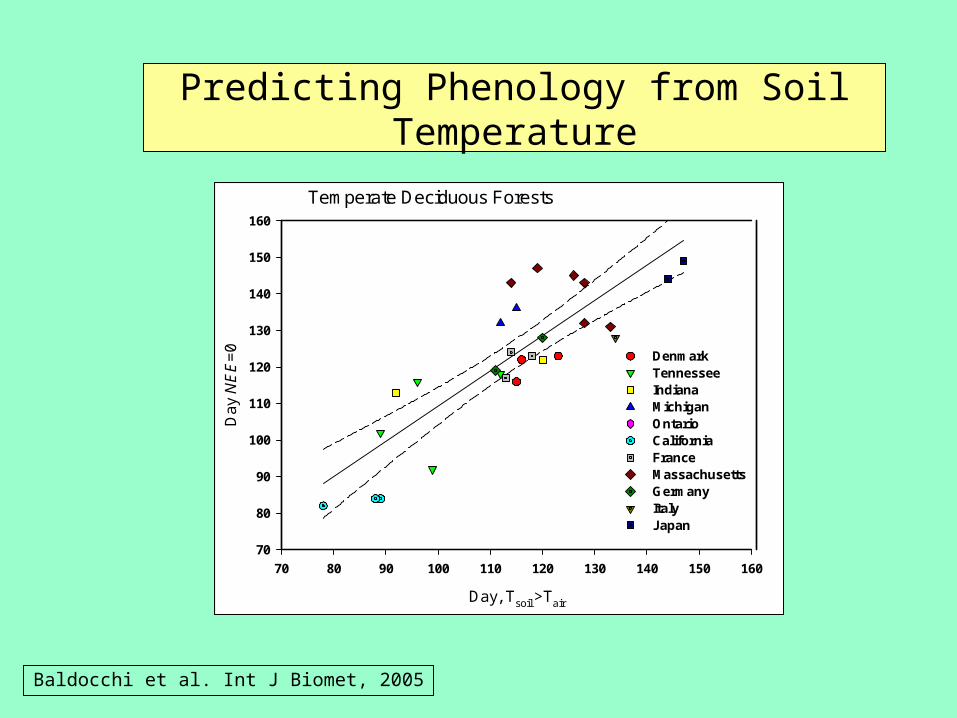
Predicting Phenology from Soil Temperature
Temperate Deciduous Forests
Day, Tsoil >Tair
70 80 90 100 110 120 130 140 150 160
Day
NE
E=
0
70
80
90
100
110
120
130
140
150
160
DenmarkTennesseeIndianaMichiganOntarioCaliforniaFranceMassachusettsGermanyItalyJapan
Baldocchi et al. Int J Biomet, 2005
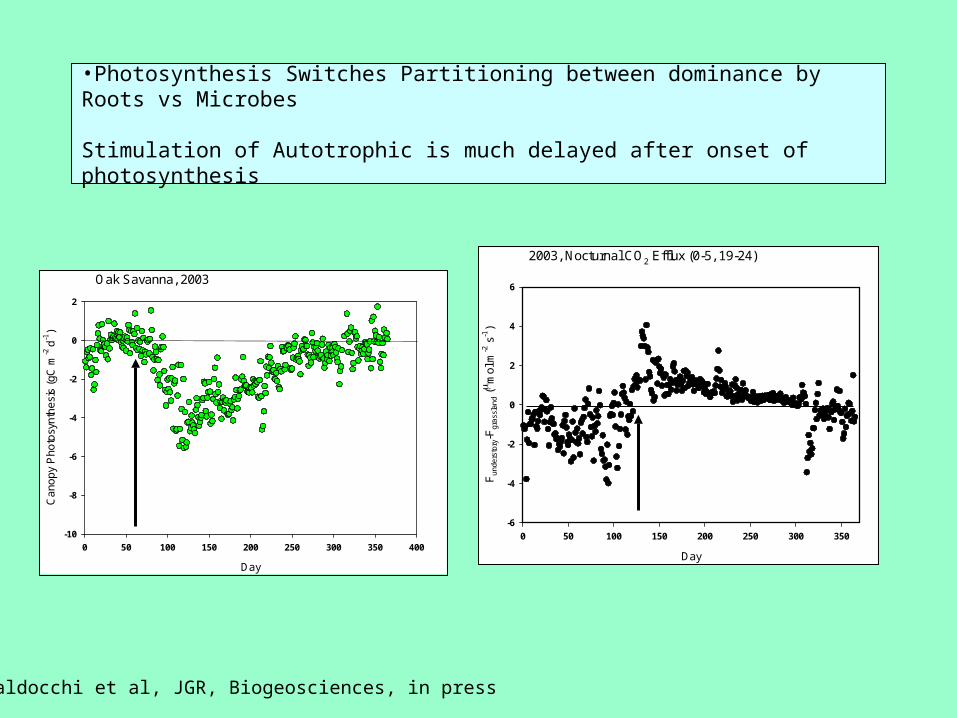
•Photosynthesis Switches Partitioning between dominance by Roots vs Microbes
Stimulation of Autotrophic is much delayed after onset of photosynthesis
2003, Nocturnal CO2 Efflux (0-5, 19-24)
Day
0 50 100 150 200 250 300 350
Fu
nd
ers
tory-F
gra
ssla
nd ( m
ol m
-2 s
-1)
-6
-4
-2
0
2
4
6Oak Savanna, 2003
Day
0 50 100 150 200 250 300 350 400
Ca
no
py
Ph
oto
syn
the
sis
(gC
m-2
d-1
)
-10
-8
-6
-4
-2
0
2
Baldocchi et al, JGR, Biogeosciences, in press
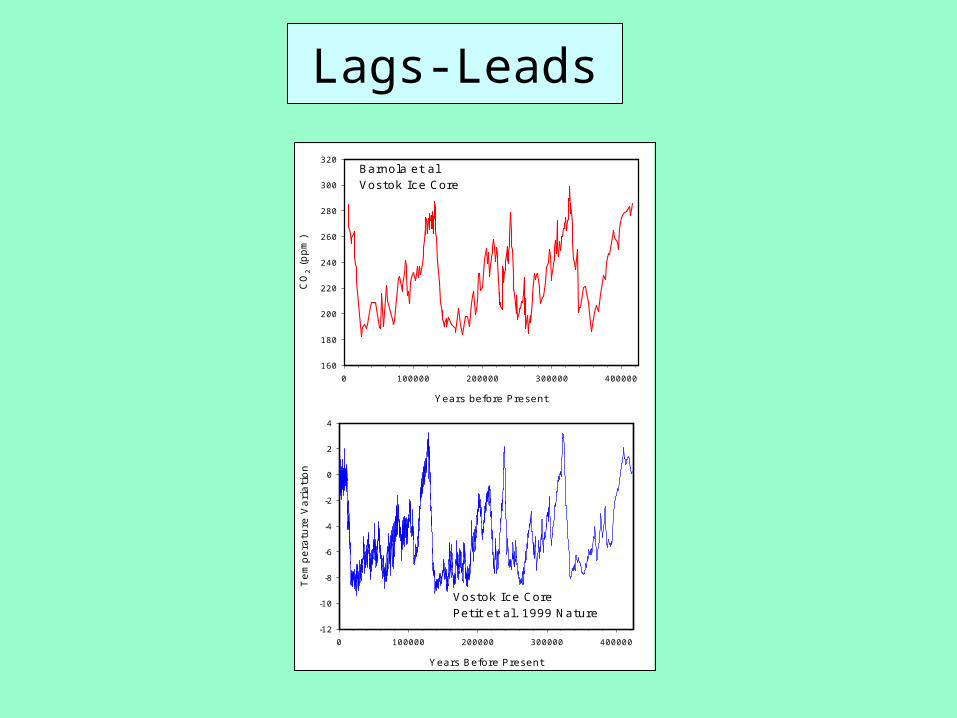
Lags-Leads
Barnola et alVostok Ice Core
Y ears before Present
0 100000 200000 300000 400000
CO
2 (
pp
m)
160
180
200
220
240
260
280
300
320
Vostok Ice CorePetit et al. 1999 Nature
Y ears Before Present
0 100000 200000 300000 400000
Te
mp
era
ture
Va
ria
tio
n
-12
-10
-8
-6
-4
-2
0
2
4
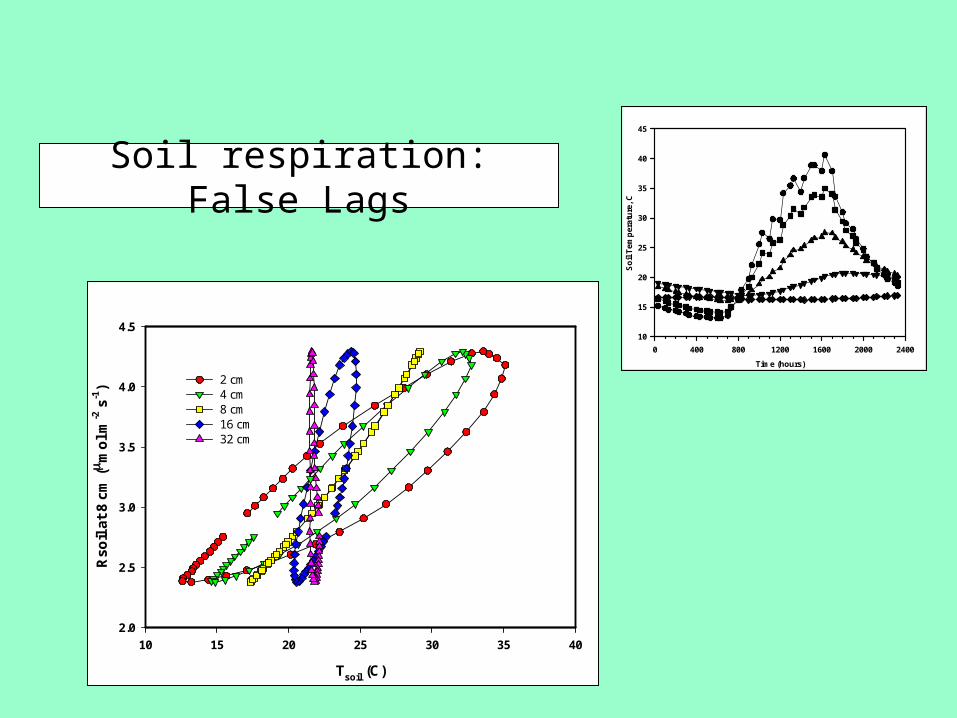
Soil respiration: False Lags
Tsoil (C)
10 15 20 25 30 35 40
Rso
il a
t 8
cm ( m
ol m
-2 s
-1)
2.0
2.5
3.0
3.5
4.0
4.5
2 cm4 cm8 cm16 cm32 cm
Time (hours)
0 400 800 1200 1600 2000 2400
So
il T
emp
erat
ure
, C
10
15
20
25
30
35
40
45
Soil tempreture (oC)
30 35 40 45 50
0.15
0.20
0.25
0.30
0.35
0.40
0.45
0.50
14:50h
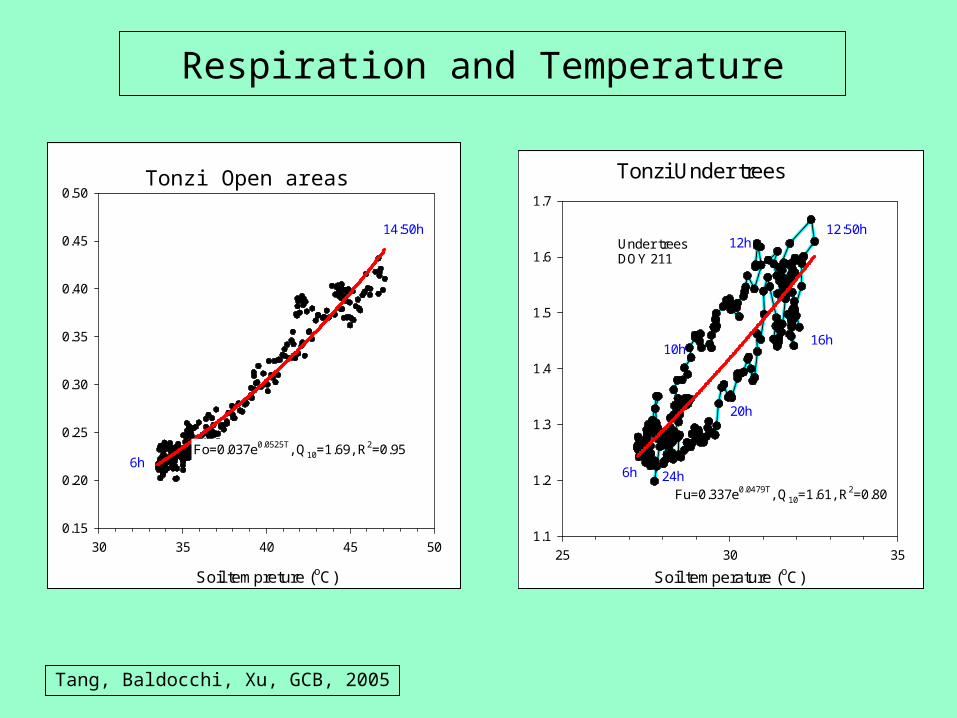
6hFo=0.037e0.0525T, Q10=1.69, R2=0.95
Tonzi Open areas
Soil temperature (oC)
25 30 35
1.1
1.2
1.3
1.4
1.5
1.6
1.7
Under treesDOY 211
Fu=0.337e0.0479T, Q10=1.61, R2=0.80
20h
6h
12:50h12h
16h
Tonzi Under trees
10h
24h
Tang, Baldocchi, Xu, GCB, 2005
Respiration and Temperature
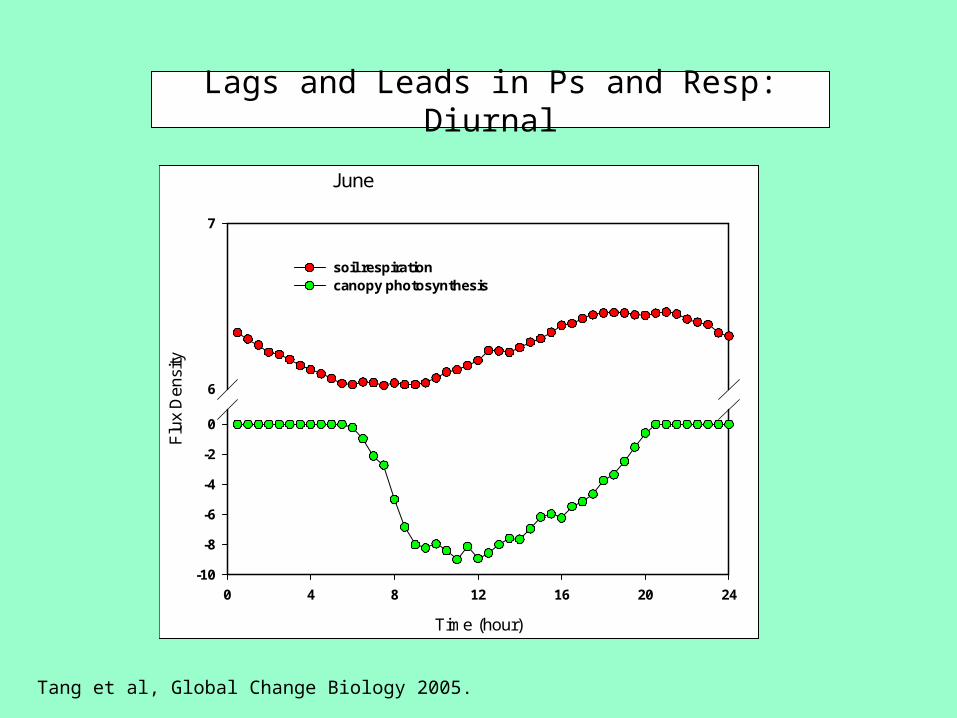
Lags and Leads in Ps and Resp: Diurnal
June
Time (hour)
0 4 8 12 16 20 24
Flu
x D
ensi
ty
-10
-8
-6
-4
-2
0
6
7
soil respirationcanopy photosynthesis
Tang et al, Global Change Biology 2005.
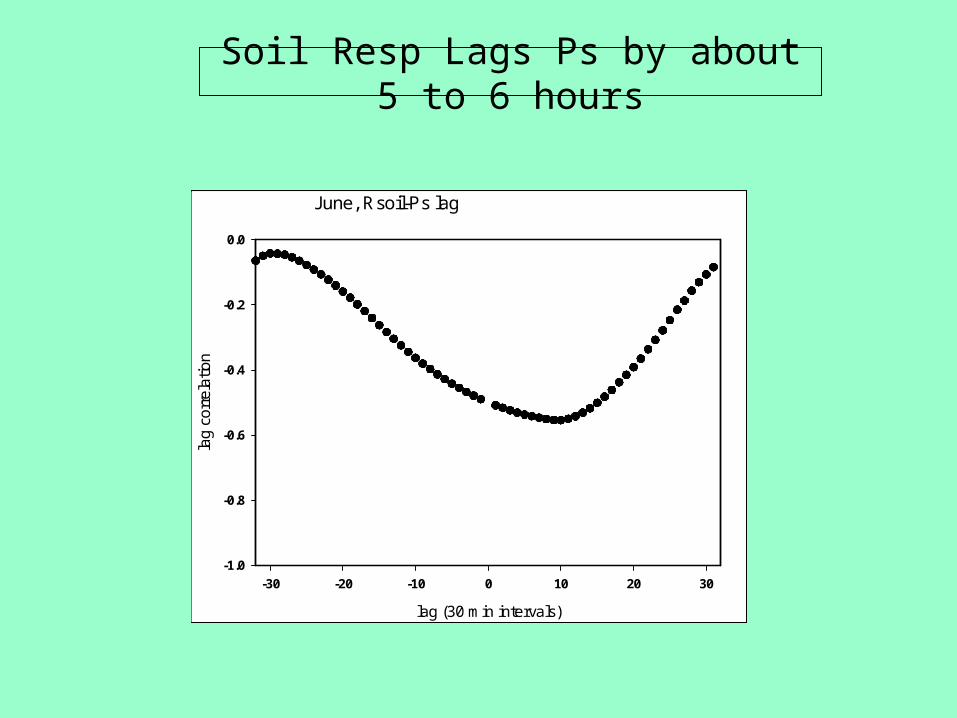
Soil Resp Lags Ps by about 5 to 6 hours
June, Rsoil-Ps lag
lag (30 min intervals)
-30 -20 -10 0 10 20 30
lag
corr
elat
ion
-1.0
-0.8
-0.6
-0.4
-0.2
0.0
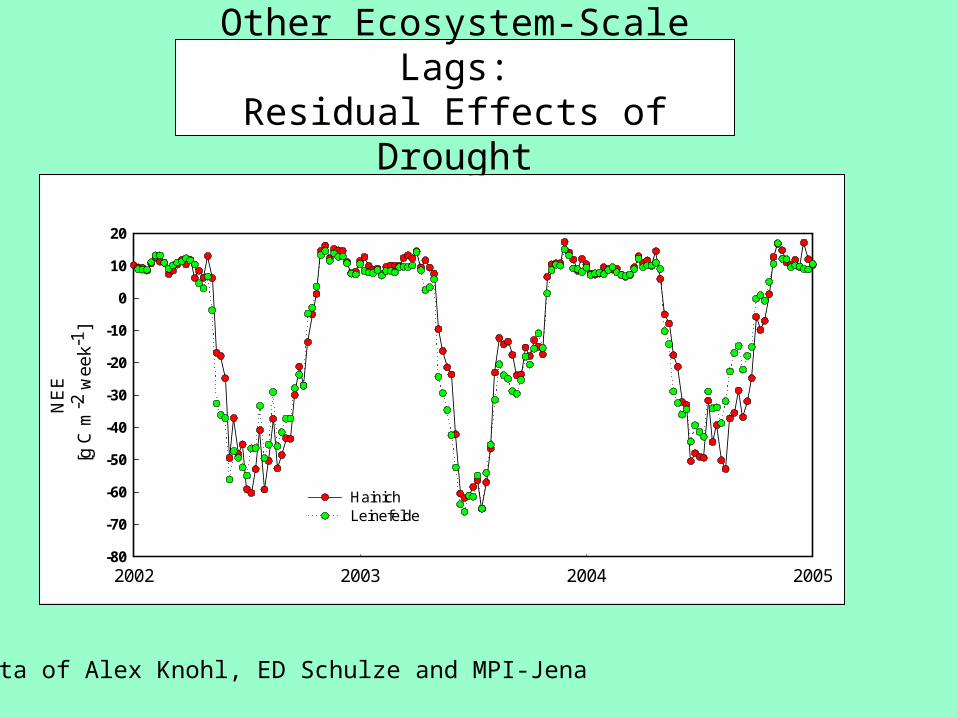
Other Ecosystem-Scale Lags:Residual Effects of Drought
2002 2003 2004 2005
NE
E
[g C
m-2
wee
k-1 ]
-80
-70
-60
-50
-40
-30
-20
-10
0
10
20
HainichLeinefelde
•Data of Alex Knohl, ED Schulze and MPI-Jena
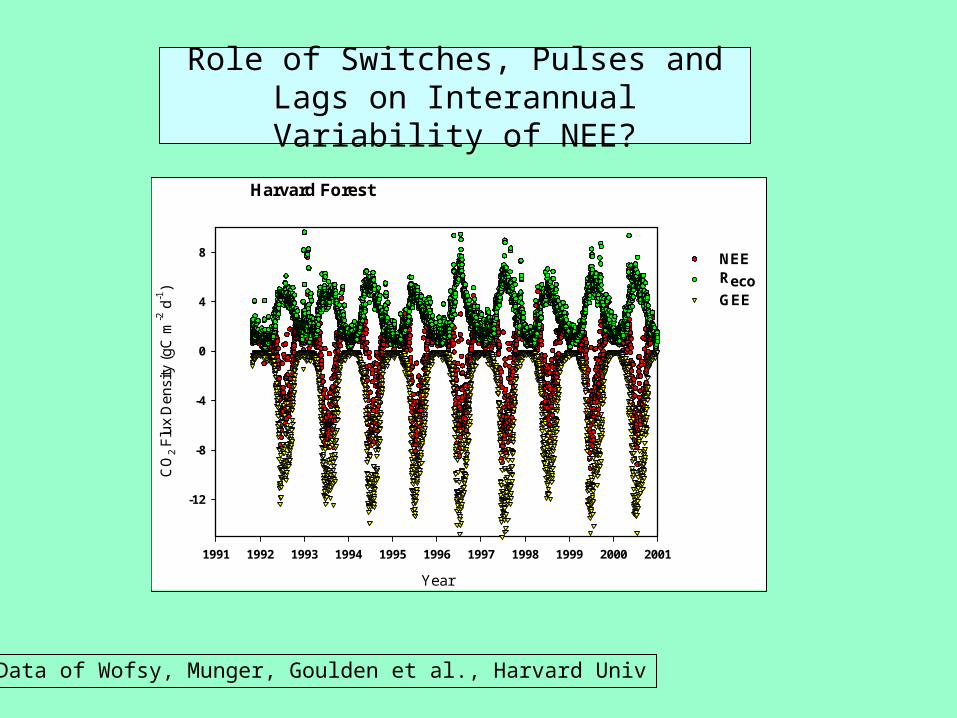
Role of Switches, Pulses and Lags on Interannual Variability of NEE?
Harvard Forest
Year
1991 1992 1993 1994 1995 1996 1997 1998 1999 2000 2001
CO
2 F
lux
Den
sity
(gC
m-2
d-1
)
-12
-8
-4
0
4
8 NEERecoGEE
Data of Wofsy, Munger, Goulden et al., Harvard Univ
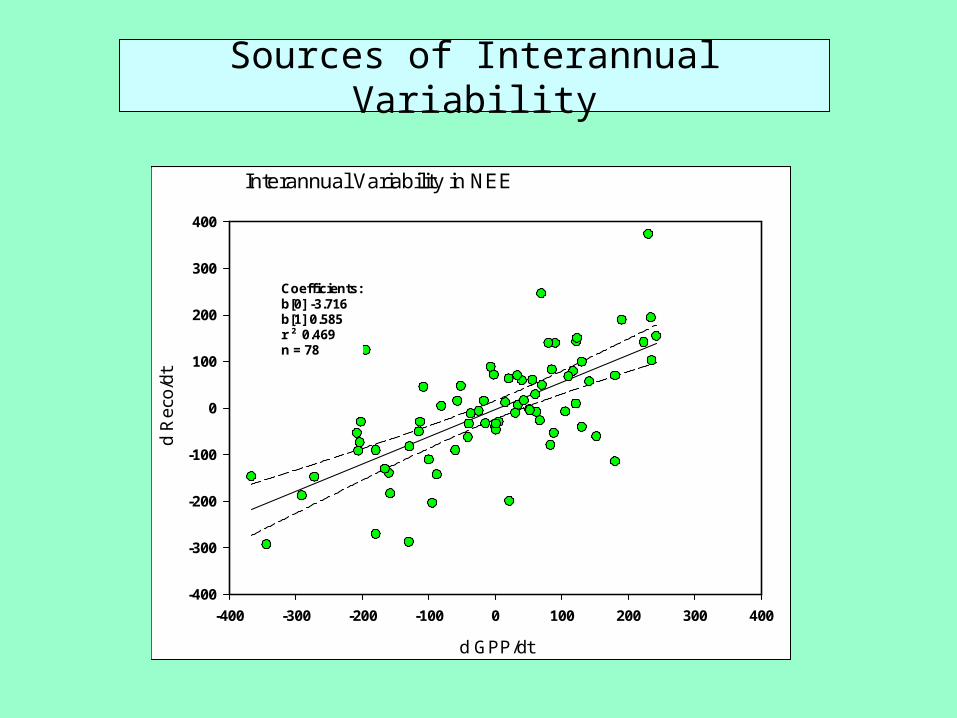
Sources of Interannual Variability
Interannual Variability in NEE
d GPP/dt
-400 -300 -200 -100 0 100 200 300 400
d R
eco/
dt
-400
-300
-200
-100
0
100
200
300
400
Coefficients:b[0] -3.716b[1] 0.585r ² 0.469n = 78
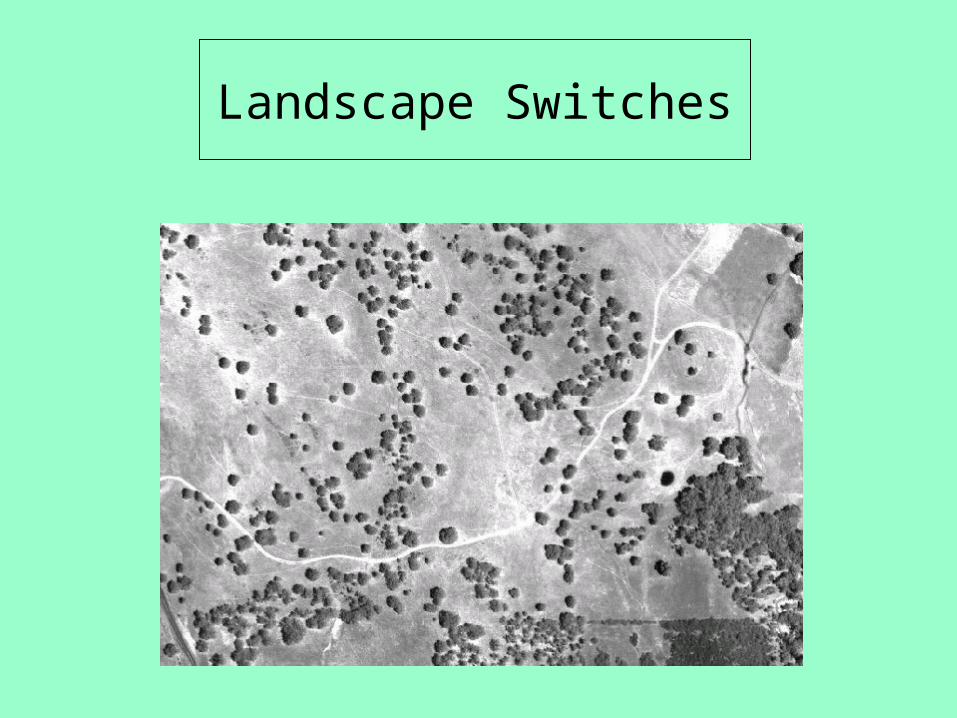
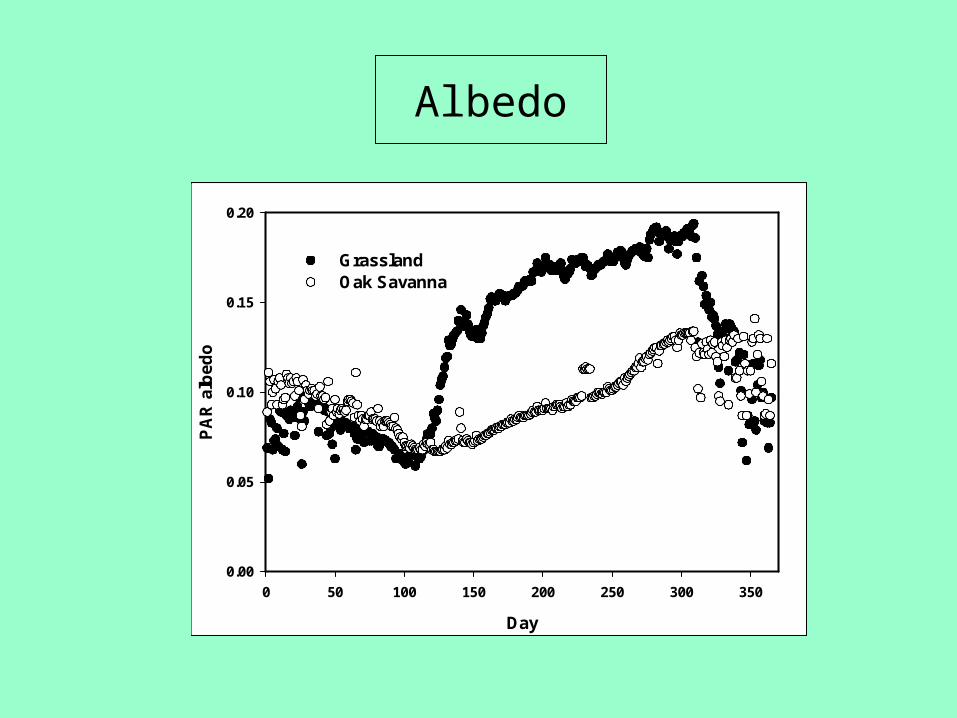
Landscape Switches
Day
0 50 100 150 200 250 300 350
PA
R a
lbed
o
0.00
0.05
0.10
0.15
0.20
GrasslandOak Savanna
Albedo
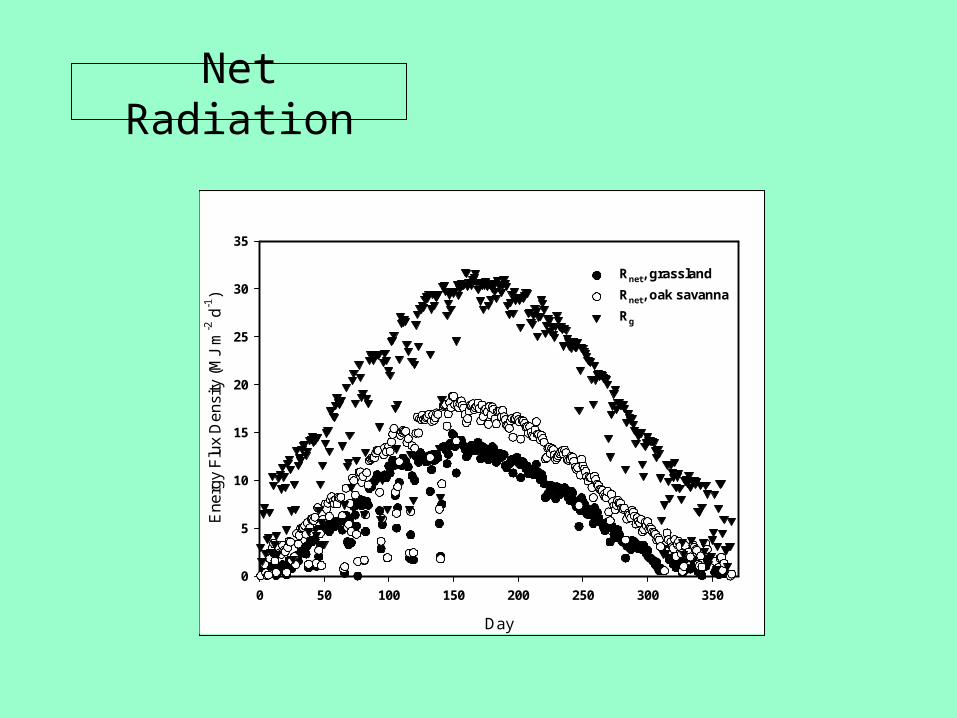
Net Radiation
Day
0 50 100 150 200 250 300 350
En
ergy
Flu
x D
ensi
ty (
MJ
m-2
d-1
)
0
5
10
15
20
25
30
35
Rnet, grassland
Rnet, oak savanna
Rg
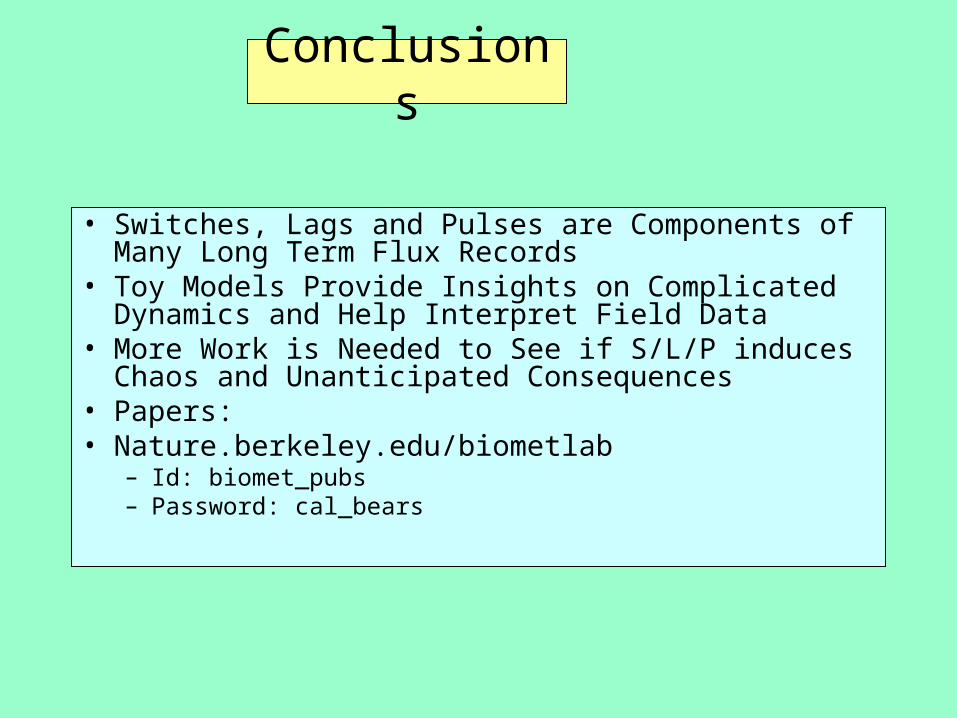
Conclusions
• Switches, Lags and Pulses are Components of Many Long Term Flux Records
• Toy Models Provide Insights on Complicated Dynamics and Help Interpret Field Data
• More Work is Needed to See if S/L/P induces Chaos and Unanticipated Consequences
• Papers:• Nature.berkeley.edu/biometlab
– Id: biomet_pubs– Password: cal_bears
Acknowledgements
• Funding– DOE/TCP, NASA, NIGEC/WESTGEC, Kearney, AES
• Students, Postdocs, Techs, LandownersLianhong Gu, Eva Falge, Jianwu Tang, Liukang Xu, Ted Hehn, Tess Krebs, Alex Knohl, Siyan Ma, Matthias Falk
• Fluxnet Community• Ranchers
– Russell Tonzi, Fran Vaira


![Global response of the terrestrial biosphere to CO and ...€¦ · sea ice and fresh water fluxes at surface. 2.2. Description of the Terrestrial Biosphere Model [8] The terrestrial](https://img.pdfslide.net/doc/110x75/5f51c25c26fb4b0d4a342f9d/global-response-of-the-terrestrial-biosphere-to-co-and-sea-ice-and-fresh-water.jpg)