Embed Size (px)
DESCRIPTION
Looking at the Economics of the Next Generation of Biofuels. Chad Hart Center for Agricultural and Rural Development Iowa State University E-mail: [email protected] May 27, 2008 “Breeding Lignocellulosic Crops for the Bioeconomy” Plant Breeding Lecture Series Iowa State University - PowerPoint PPT Presentation
Citation preview
Looking at the Economics of the Next Generation of Biofuels
Chad HartCenter for Agricultural and Rural Development
Iowa State UniversityE-mail: [email protected]
May 27, 2008
“Breeding Lignocellulosic Crops for the Bioeconomy”Plant Breeding Lecture Series
Iowa State UniversityAmes, Iowa
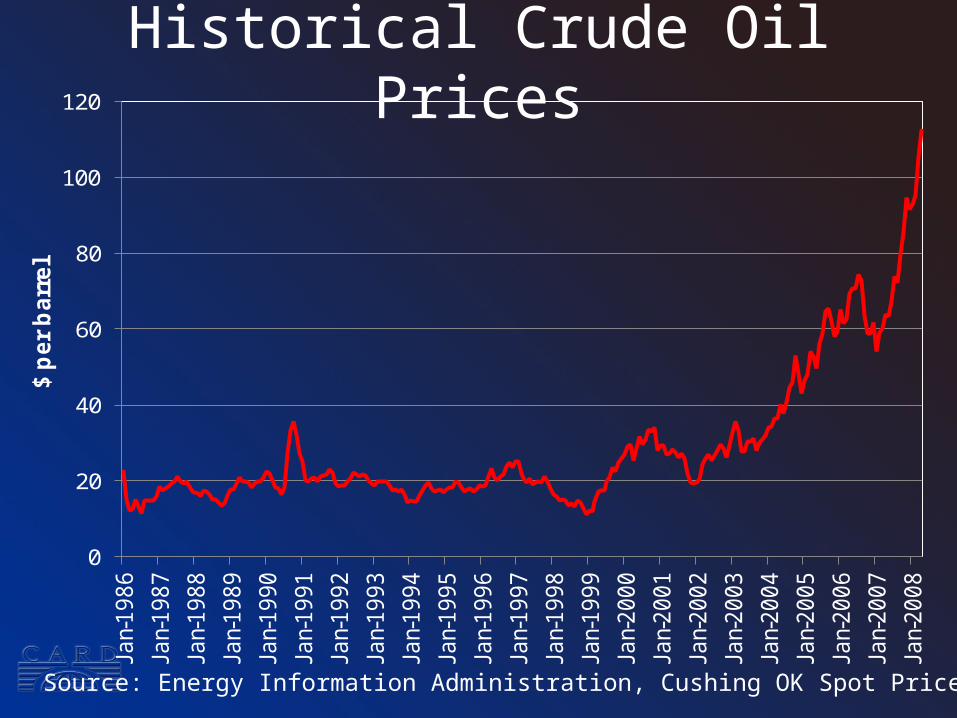
Historical Crude Oil Prices
0
20
40
60
80
100
120Ja
n-1986
Jan-
1987
Jan-
1988
Jan-
1989
Jan-
1990
Jan-
1991
Jan-
1992
Jan-
1993
Jan-
1994
Jan-
1995
Jan-
1996
Jan-
1997
Jan-
1998
Jan-
1999
Jan-
2000
Jan-
2001
Jan-
2002
Jan-
2003
Jan-
2004
Jan-
2005
Jan-
2006
Jan-
2007
Jan-
2008
$ p
er
barr
el
Source: Energy Information Administration, Cushing OK Spot Price
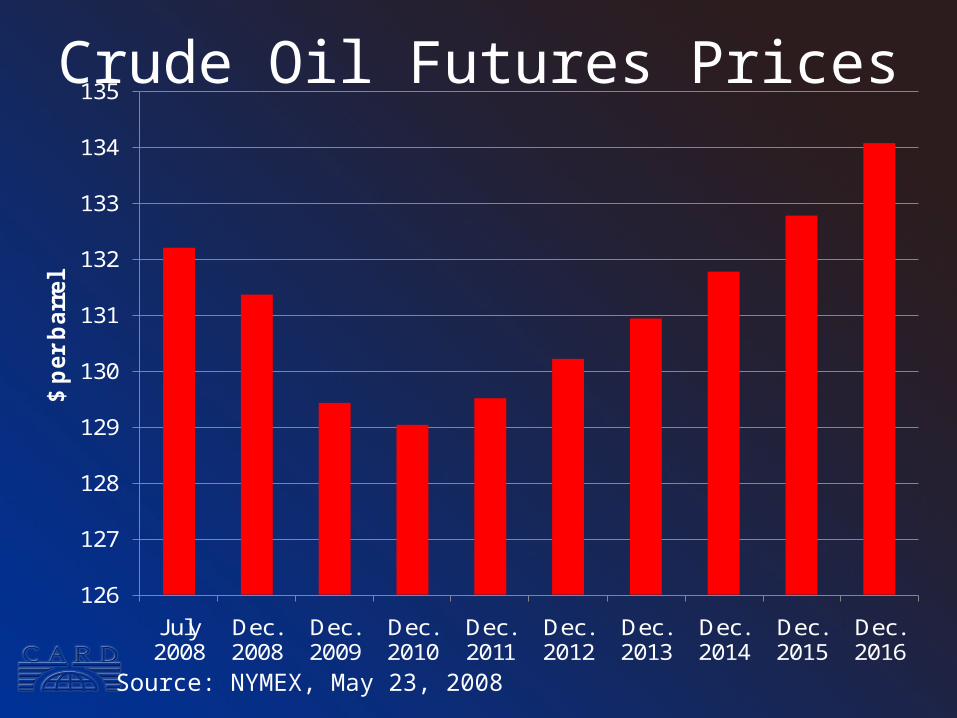
Crude Oil Futures Prices
Source: NYMEX, May 23, 2008
126
127
128
129
130
131
132
133
134
135
July 2008
Dec. 2008
Dec. 2009
Dec. 2010
Dec. 2011
Dec. 2012
Dec. 2013
Dec. 2014
Dec. 2015
Dec. 2016
$ p
er
barr
el
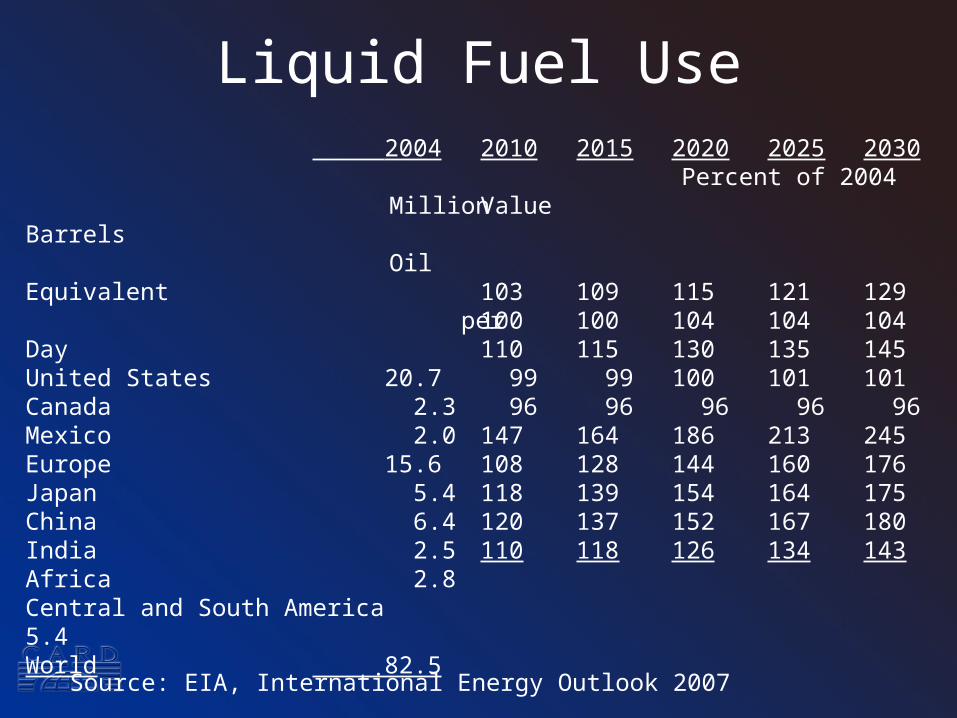
Liquid Fuel Use
Source: EIA, International Energy Outlook 2007
2004 Million Barrels Oil Equivalent per Day
United States 20.7Canada 2.3Mexico 2.0Europe 15.6Japan 5.4China 6.4India 2.5Africa 2.8Central and South America 5.4World 82.5
2010 2015 2020 2025 2030 Percent of 2004 Value
103 109 115 121 129100 100 104 104 104110 115 130 135 145 99 99 100 101 101 96 96 96 96 96147 164 186 213 245108 128 144 160 176118 139 154 164 175120 137 152 167 180110 118 126 134 143
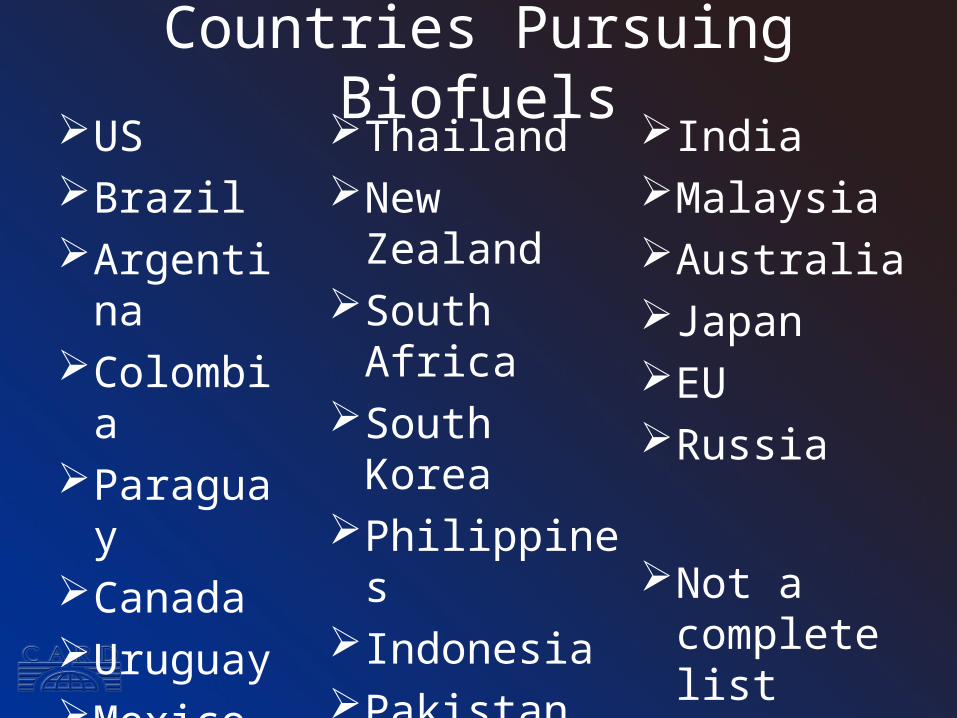
Countries Pursuing BiofuelsUSBrazilArgentinaColombiaParaguayCanadaUruguayMexico
ThailandNew ZealandSouth AfricaSouth KoreaPhilippinesIndonesiaPakistanChina
IndiaMalaysiaAustraliaJapanEURussia
Not a complete list

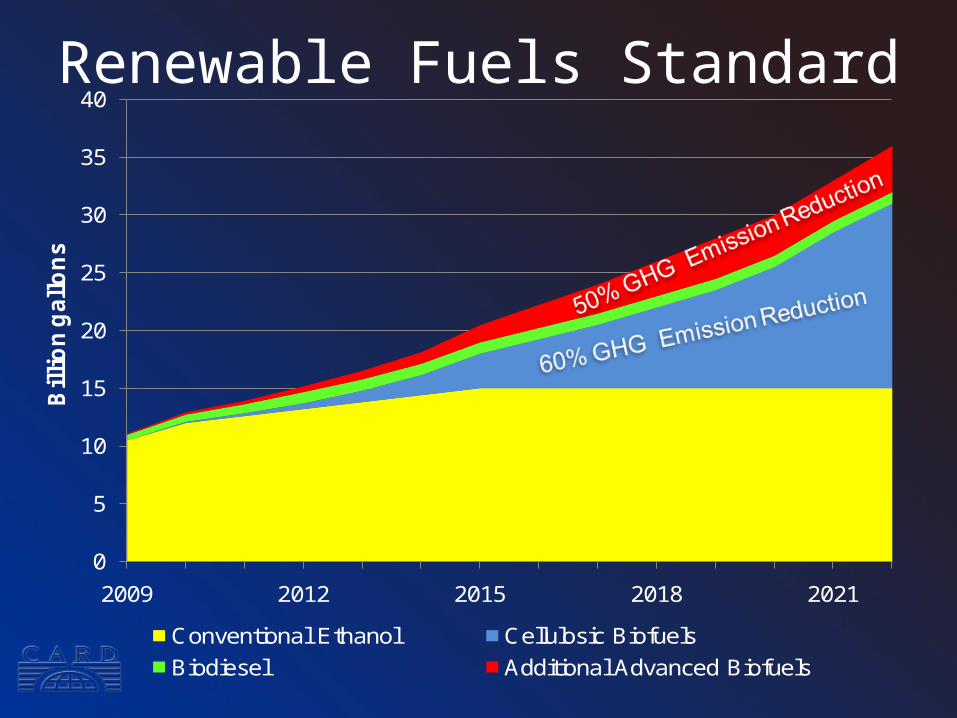
Renewable Fuels Standard
0
5
10
15
20
25
30
35
40
2009 2012 2015 2018 2021
Bil
lio
n g
all
on
s
Conventional Ethanol Cellulosic Biofuels
Biodiesel Additional Advanced Biofuels
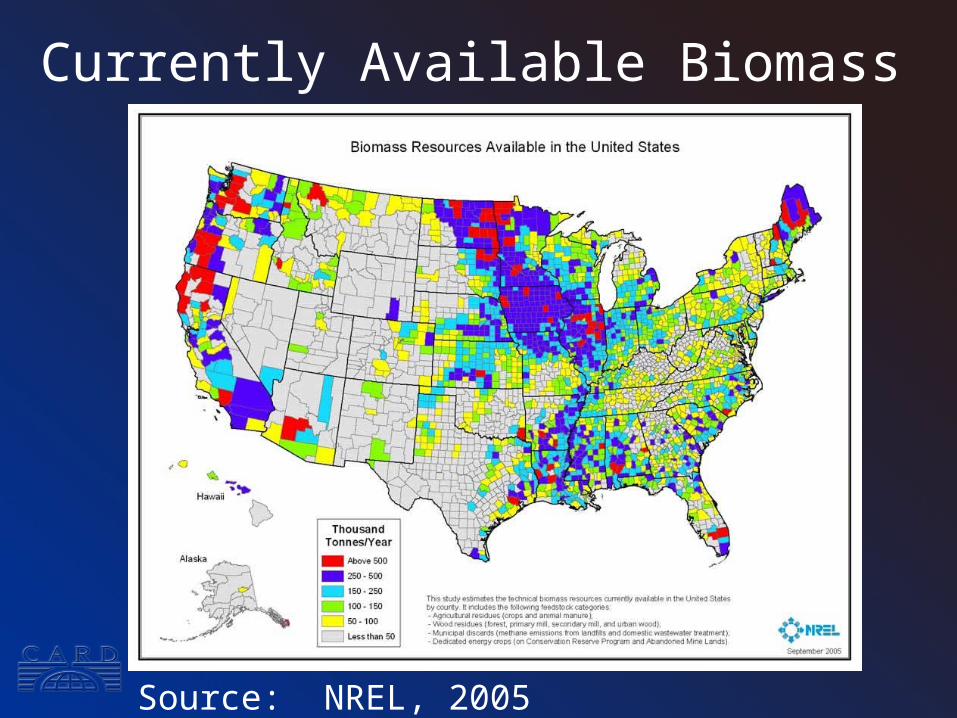
Currently Available Biomass
Source: NREL, 2005
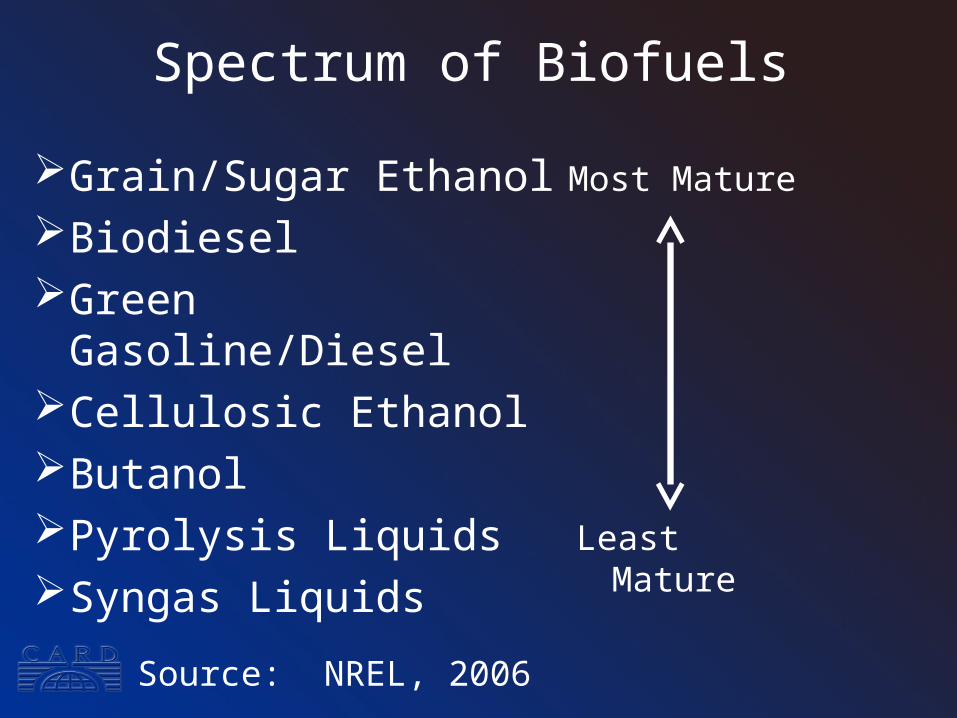
Spectrum of Biofuels
Source: NREL, 2006
Grain/Sugar EthanolBiodieselGreen Gasoline/DieselCellulosic EthanolButanolPyrolysis LiquidsSyngas Liquids
Most Mature
Least Mature
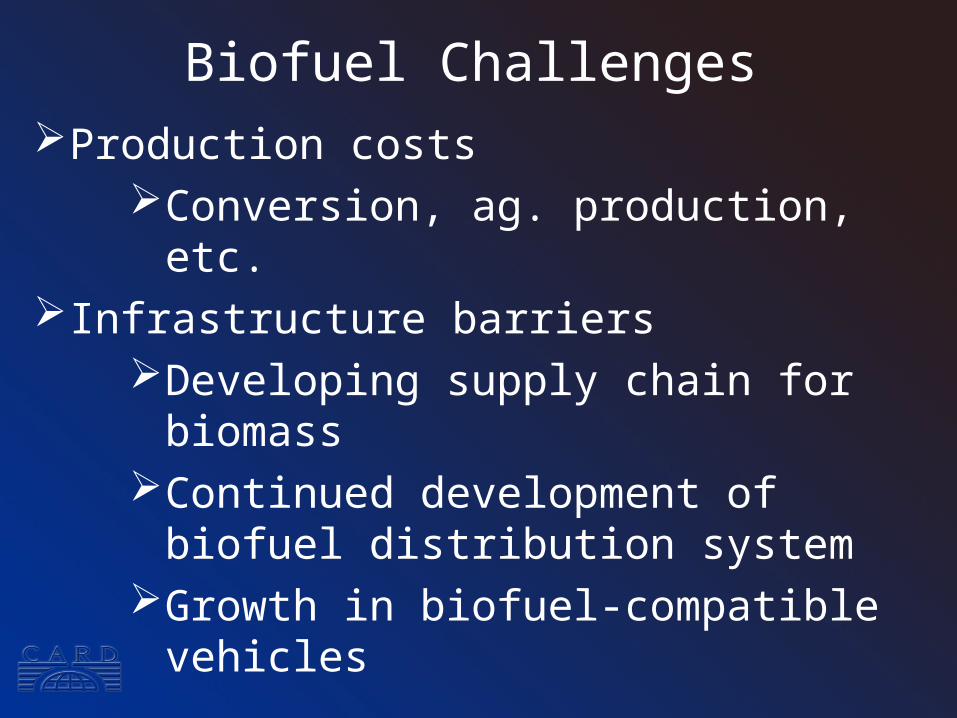
Biofuel ChallengesProduction costs
Conversion, ag. production, etc.Infrastructure barriers
Developing supply chain for biomassContinued development of biofuel
distribution systemGrowth in biofuel-compatible vehicles
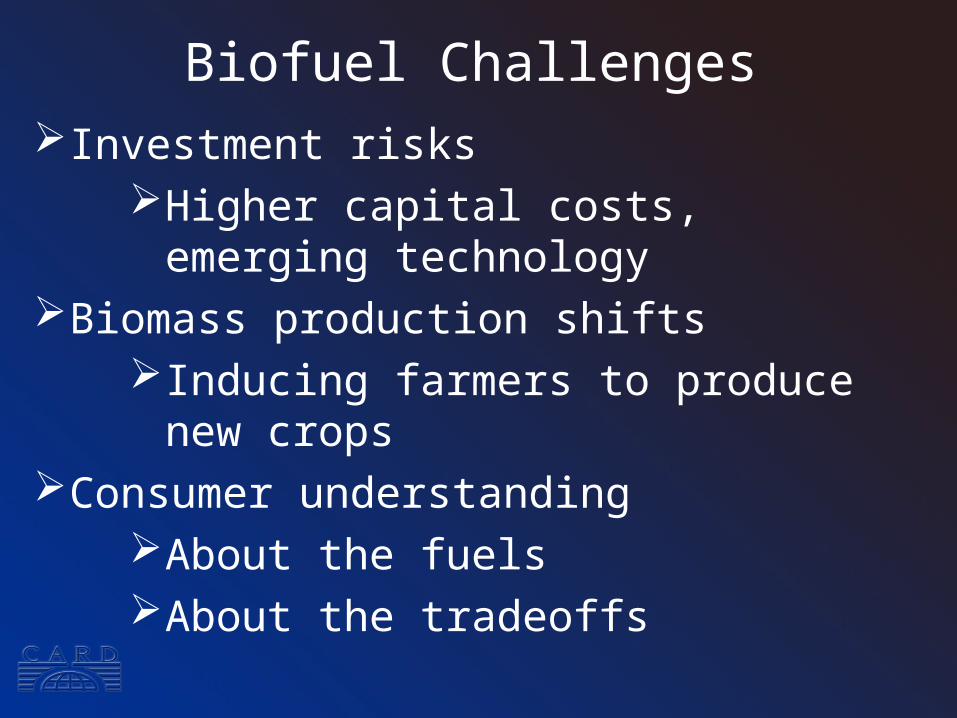
Biofuel ChallengesInvestment risks
Higher capital costs, emerging technology
Biomass production shiftsInducing farmers to produce new crops
Consumer understandingAbout the fuelsAbout the tradeoffs
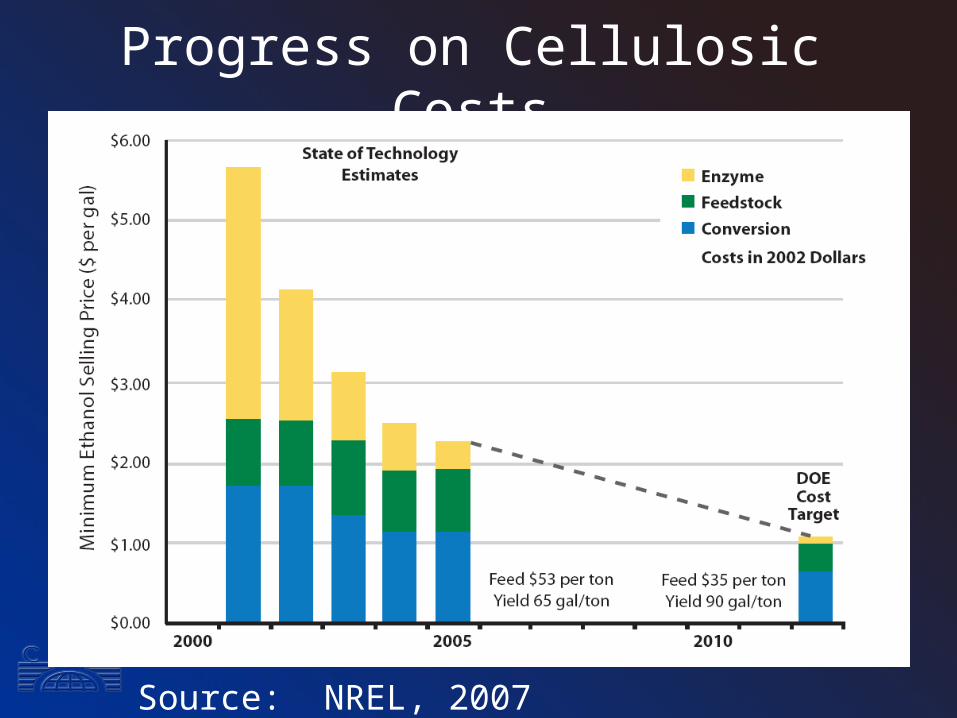
Progress on Cellulosic Costs
Source: NREL, 2007
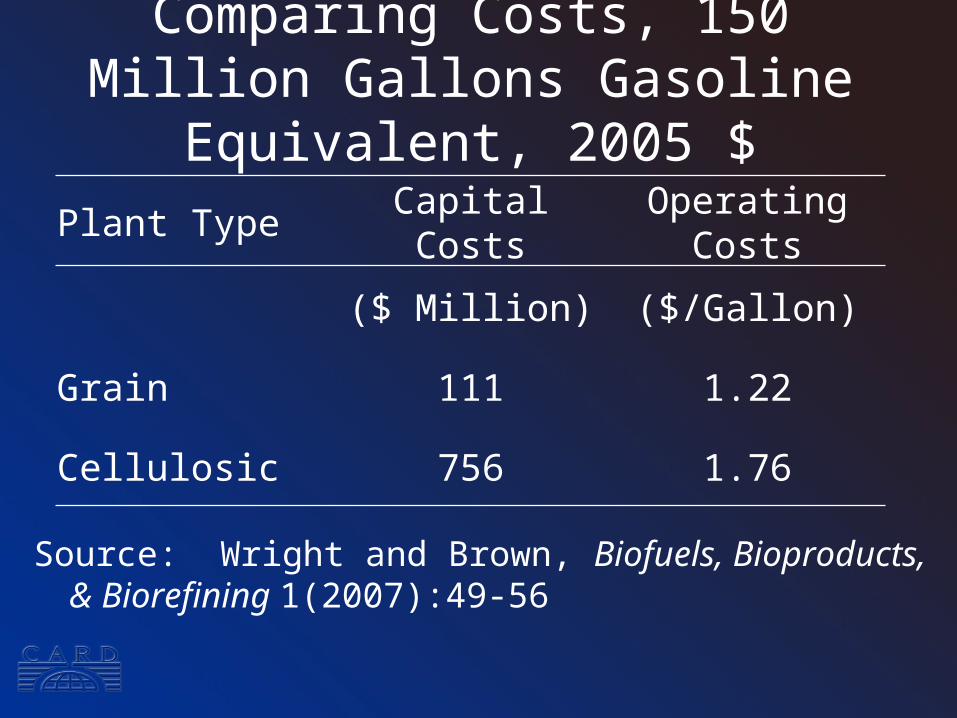
Comparing Costs, 150 Million Gallons Gasoline Equivalent, 2005 $
Source: Wright and Brown, Biofuels, Bioproducts, & Biorefining 1(2007):49-56
Plant Type Capital Costs Operating Costs
($ Million) ($/Gallon)
Grain 111 1.22
Cellulosic 756 1.76
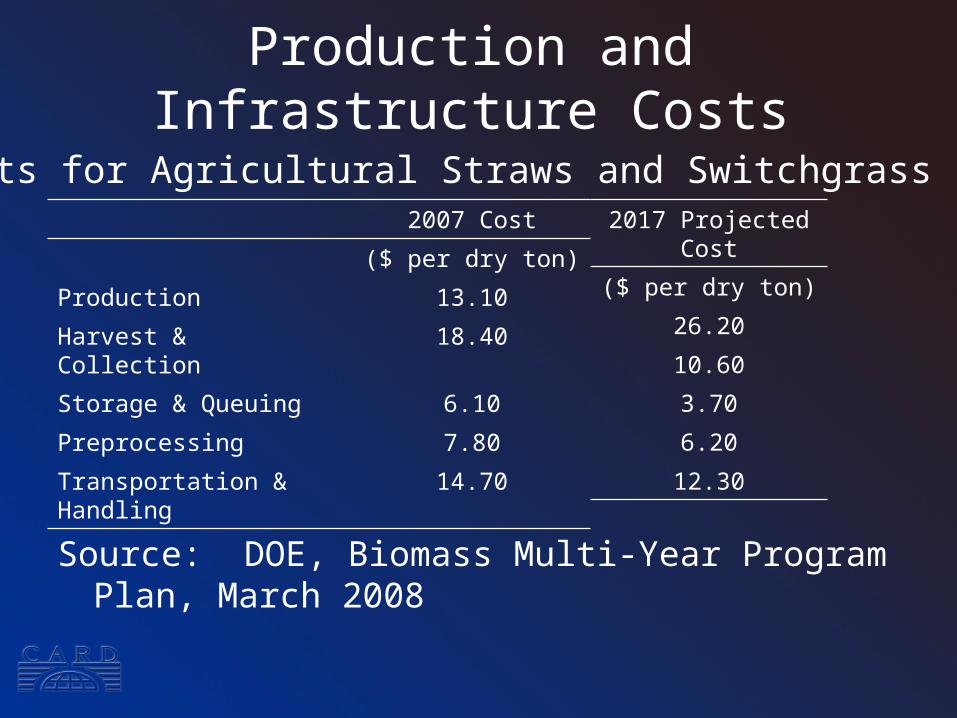
Production and Infrastructure Costs
Source: DOE, Biomass Multi-Year Program Plan, March 2008
2007 Cost
($ per dry ton)
Production 13.10
Harvest & Collection 18.40
Storage & Queuing 6.10
Preprocessing 7.80
Transportation & Handling 14.70
2017 Projected Cost
($ per dry ton)
26.20
10.60
3.70
6.20
12.30
Costs for Agricultural Straws and Switchgrass
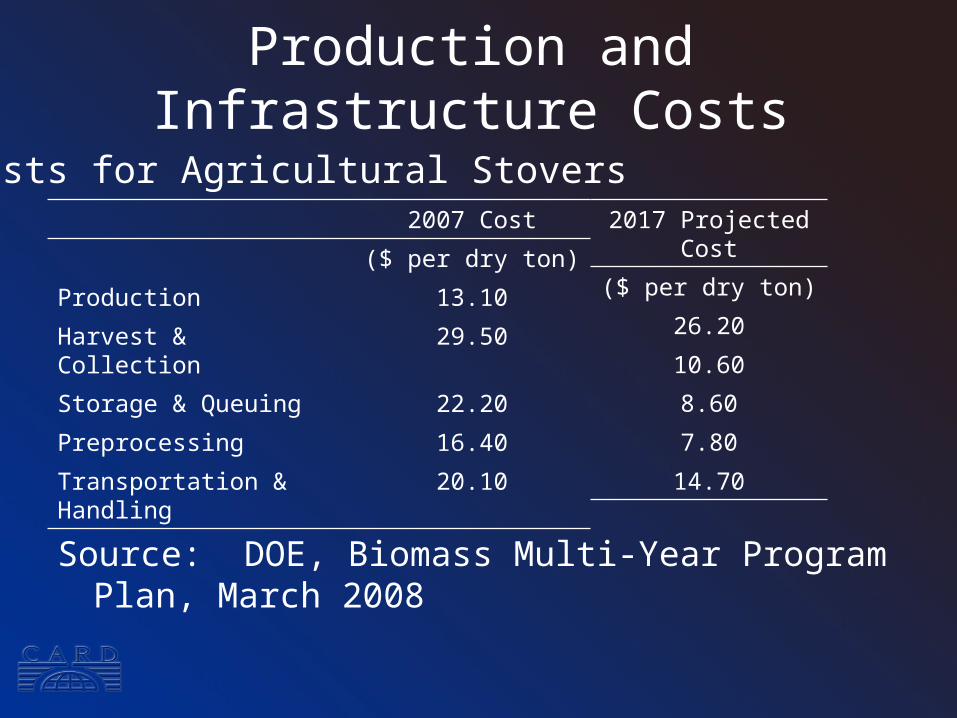
Production and Infrastructure Costs
Source: DOE, Biomass Multi-Year Program Plan, March 2008
2007 Cost
($ per dry ton)
Production 13.10
Harvest & Collection 29.50
Storage & Queuing 22.20
Preprocessing 16.40
Transportation & Handling 20.10
2017 Projected Cost
($ per dry ton)
26.20
10.60
8.60
7.80
14.70
Costs for Agricultural Stovers
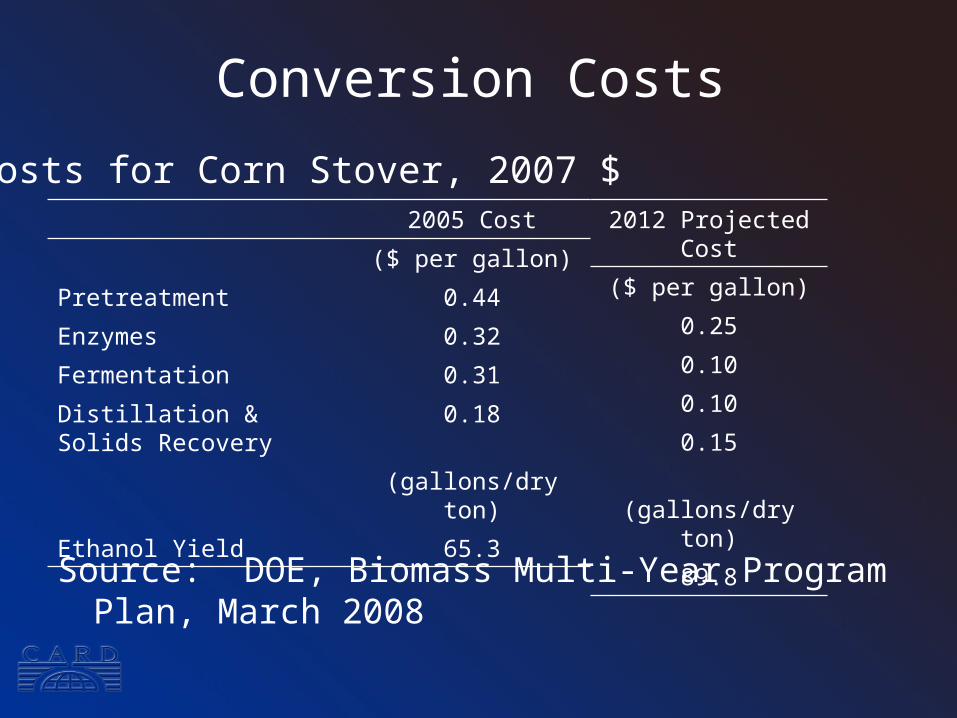
Conversion Costs
Source: DOE, Biomass Multi-Year Program Plan, March 2008
2005 Cost
($ per gallon)
Pretreatment 0.44
Enzymes 0.32
Fermentation 0.31
Distillation & Solids Recovery
0.18
(gallons/dry ton)
Ethanol Yield 65.3
Costs for Corn Stover, 2007 $2012 Projected Cost
($ per gallon)
0.25
0.10
0.10
0.15
(gallons/dry ton)
89.8
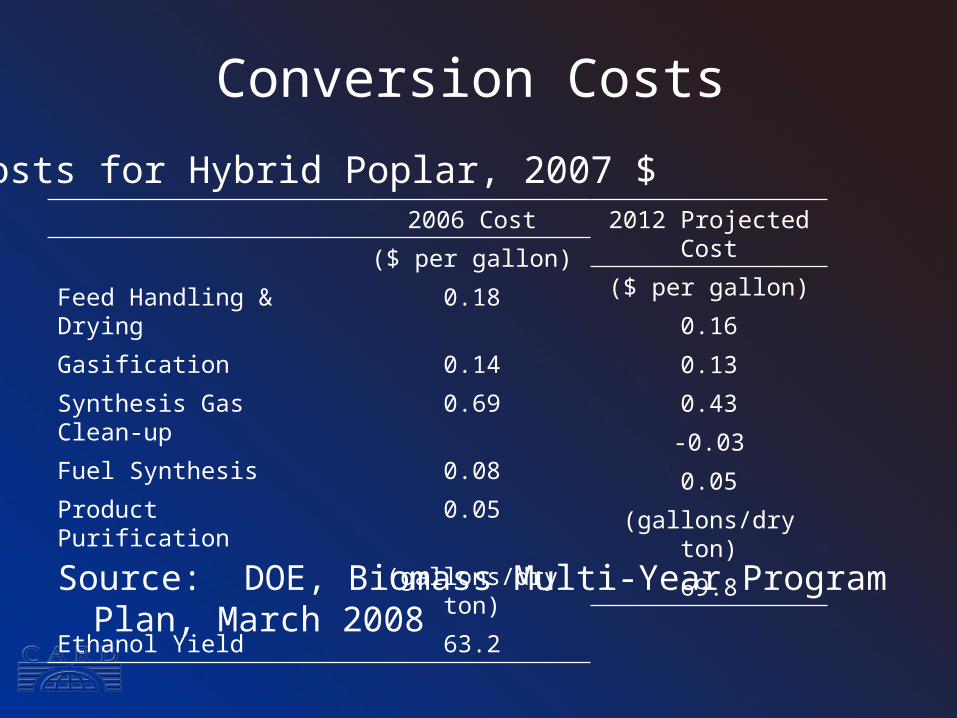
Conversion Costs
Source: DOE, Biomass Multi-Year Program Plan, March 2008
2006 Cost
($ per gallon)
Feed Handling & Drying 0.18
Gasification 0.14
Synthesis Gas Clean-up 0.69
Fuel Synthesis 0.08
Product Purification 0.05
(gallons/dry ton)
Ethanol Yield 63.2
2012 Projected Cost
($ per gallon)
0.16
0.13
0.43
-0.03
0.05
(gallons/dry ton)
69.8
Costs for Hybrid Poplar, 2007 $
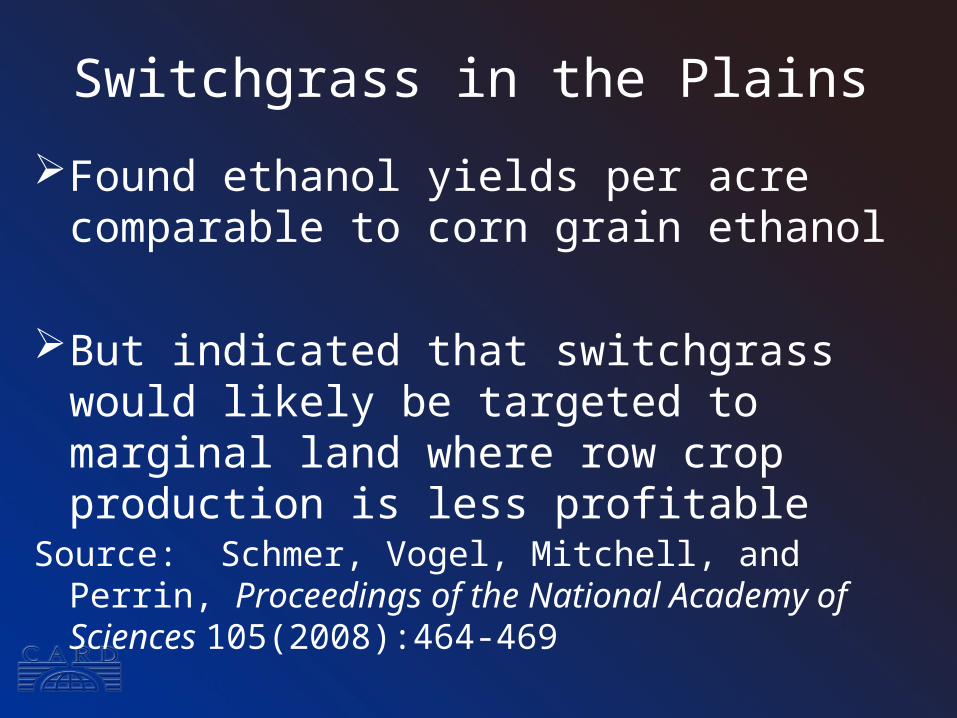
Switchgrass in the Plains
Source: Schmer, Vogel, Mitchell, and Perrin, Proceedings of the National Academy of Sciences 105(2008):464-469
Found ethanol yields per acre comparable to corn grain ethanol
But indicated that switchgrass would likely be targeted to marginal land where row crop production is less profitable
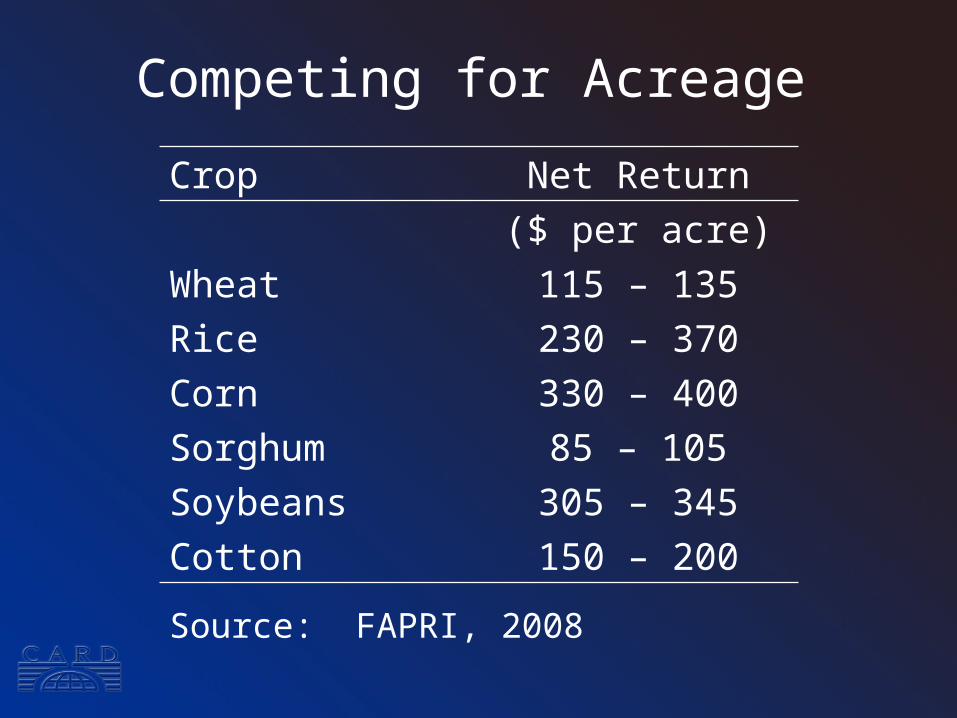
Competing for Acreage
Crop Net Return
($ per acre)
Wheat 115 – 135
Rice 230 – 370
Corn 330 – 400
Sorghum 85 – 105
Soybeans 305 – 345
Cotton 150 – 200
Source: FAPRI, 2008
Renewable Fuels Standard
0
5
10
15
20
25
30
35
40
2009 2012 2015 2018 2021
Bil
lio
n g
all
on
s
Conventional Ethanol Cellulosic Biofuels
Biodiesel Additional Advanced Biofuels
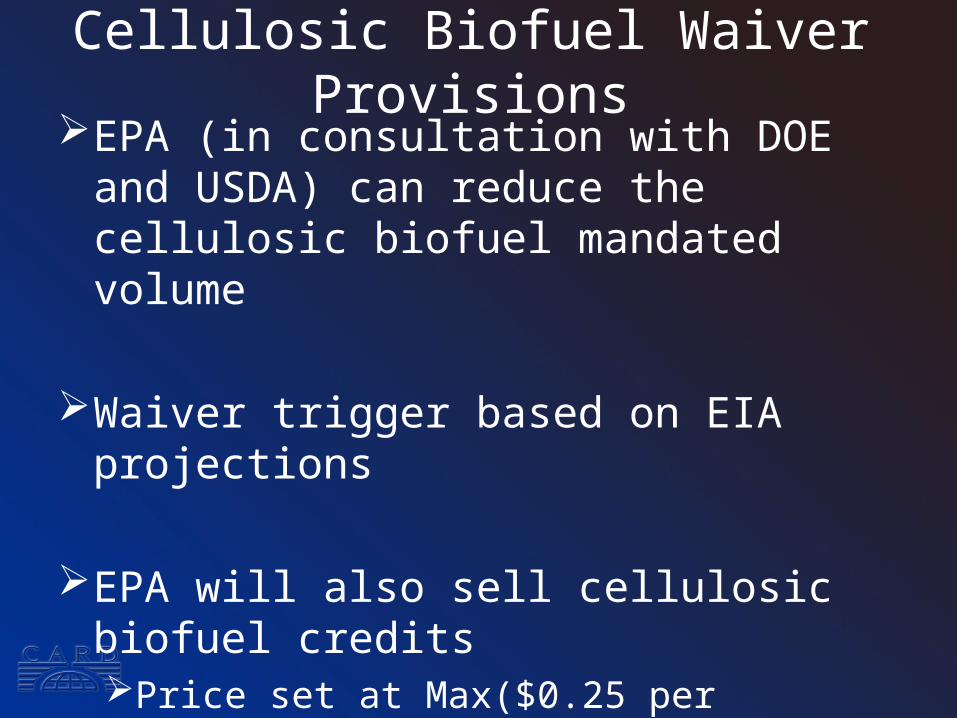
Cellulosic Biofuel Waiver ProvisionsEPA (in consultation with DOE and
USDA) can reduce the cellulosic biofuel mandated volume
Waiver trigger based on EIA projections
EPA will also sell cellulosic biofuel creditsPrice set at Max($0.25 per gallon, $3.00 –
Average wholesale gasoline price per gallon)
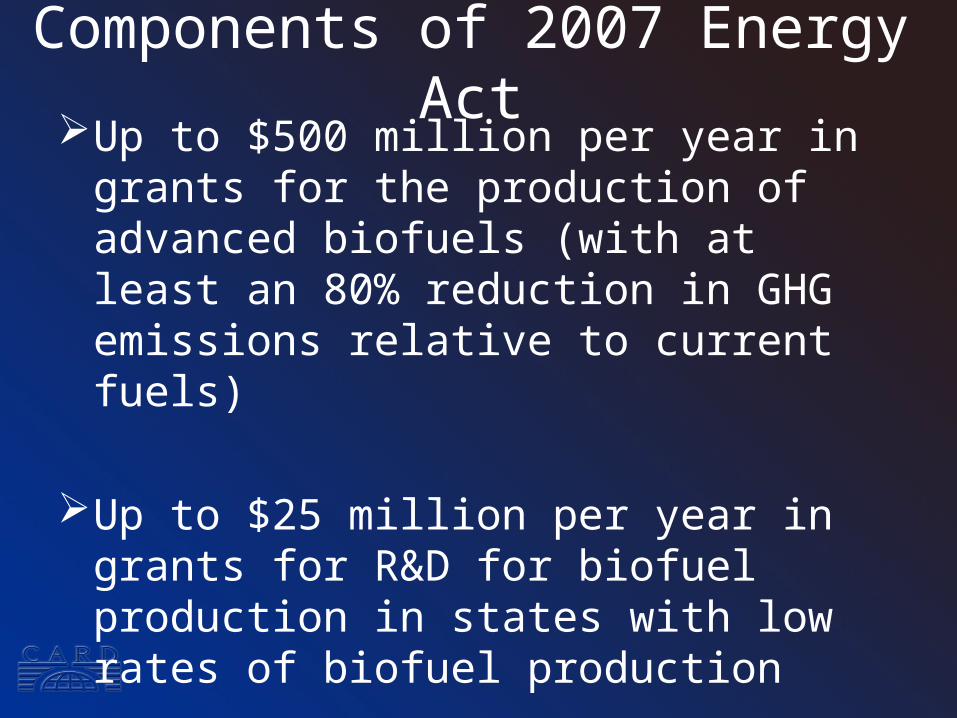
Components of 2007 Energy ActUp to $500 million per year in grants for
the production of advanced biofuels (with at least an 80% reduction in GHG emissions relative to current fuels)
Up to $25 million per year in grants for R&D for biofuel production in states with low rates of biofuel production
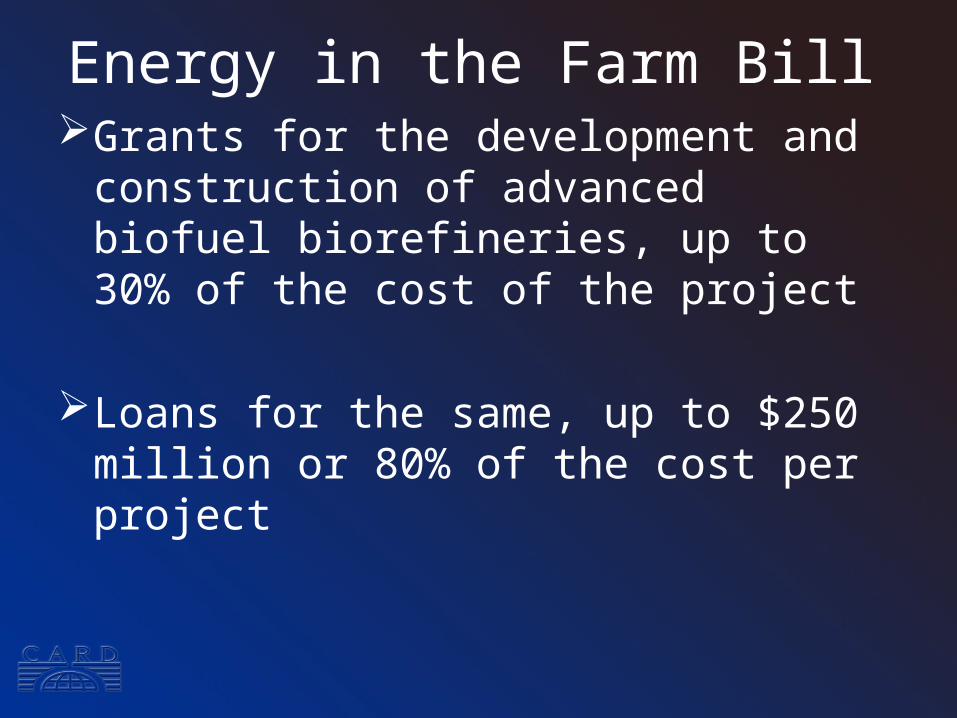
Energy in the Farm BillGrants for the development and
construction of advanced biofuel biorefineries, up to 30% of the cost of the project
Loans for the same, up to $250 million or 80% of the cost per project
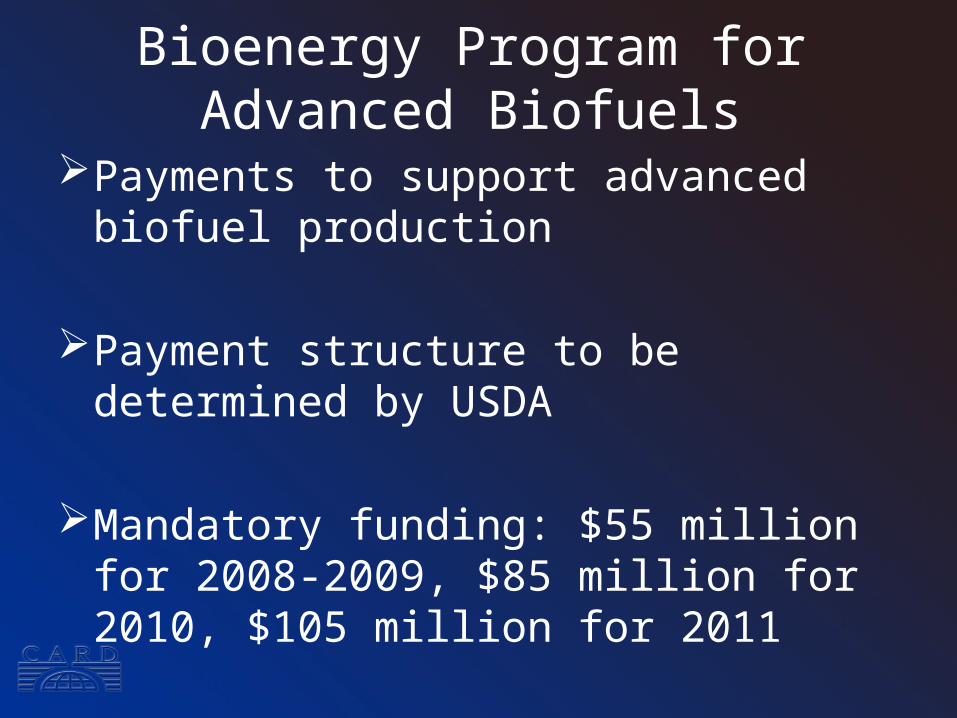
Bioenergy Program for Advanced Biofuels
Payments to support advanced biofuel production
Payment structure to be determined by USDA
Mandatory funding: $55 million for 2008-2009, $85 million for 2010, $105 million for 2011
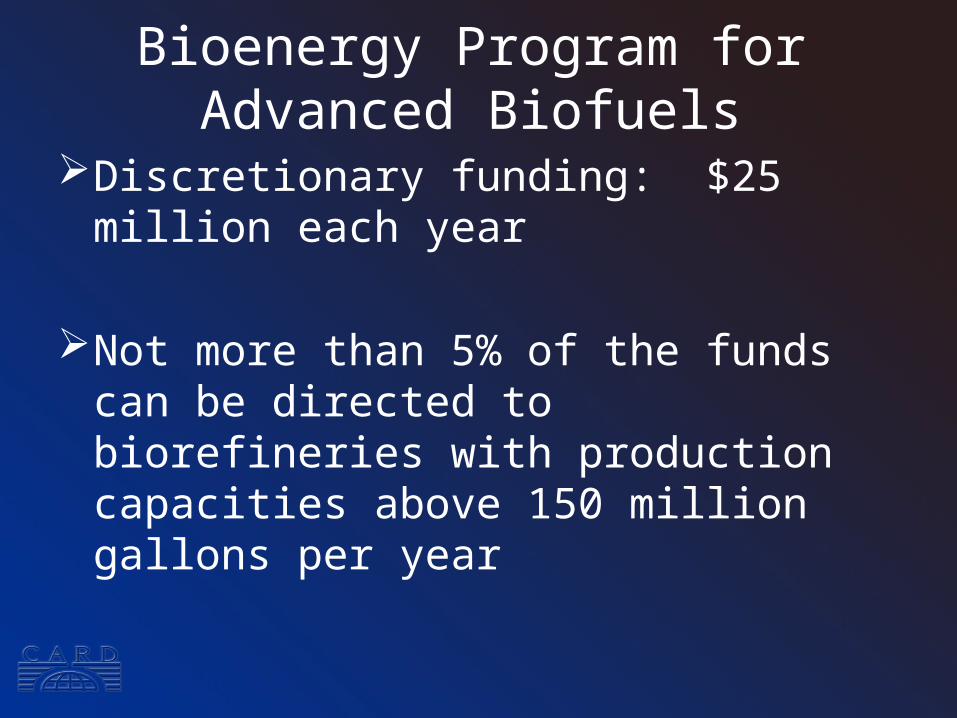
Bioenergy Program for Advanced Biofuels
Discretionary funding: $25 million each year
Not more than 5% of the funds can be directed to biorefineries with production capacities above 150 million gallons per year
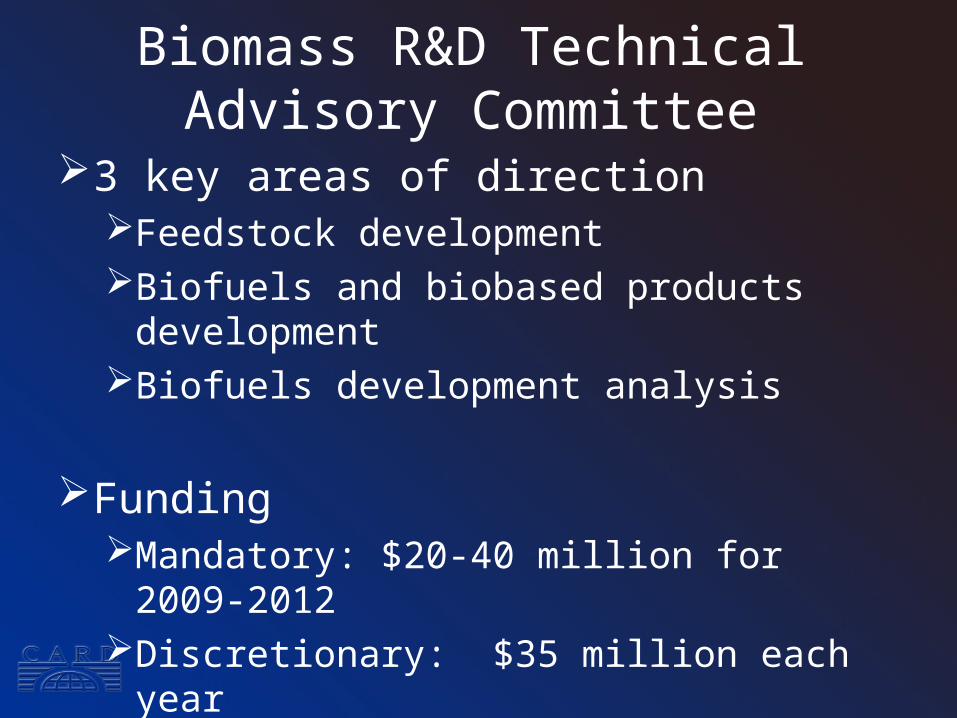
Biomass R&D Technical Advisory Committee
3 key areas of directionFeedstock developmentBiofuels and biobased products developmentBiofuels development analysis
FundingMandatory: $20-40 million for 2009-2012Discretionary: $35 million each year
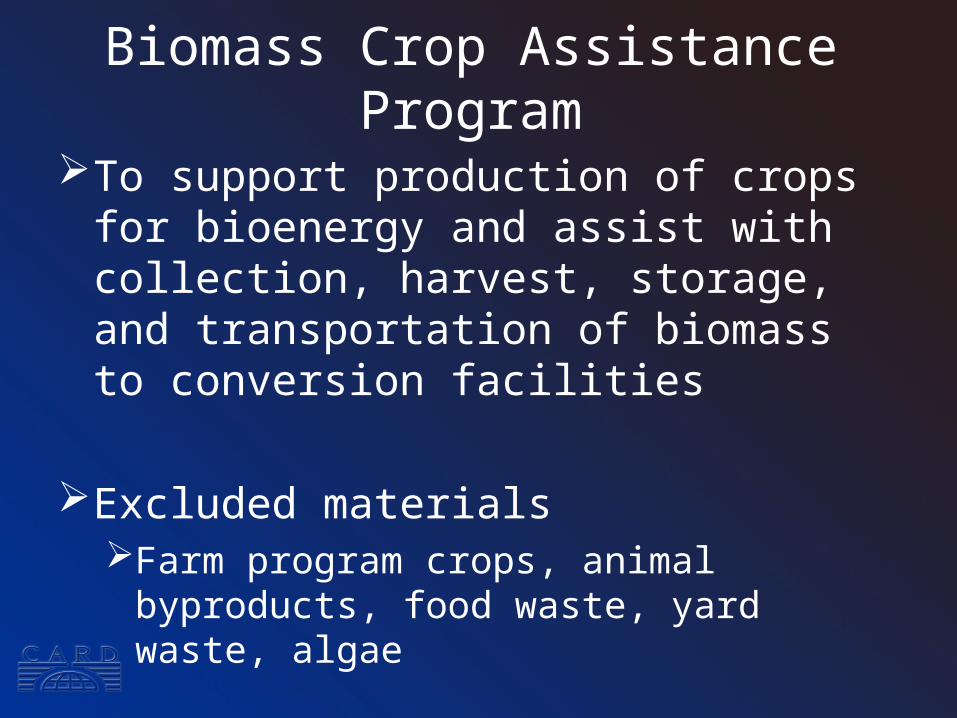
Biomass Crop Assistance Program
To support production of crops for bioenergy and assist with collection, harvest, storage, and transportation of biomass to conversion facilities
Excluded materialsFarm program crops, animal byproducts, food
waste, yard waste, algae
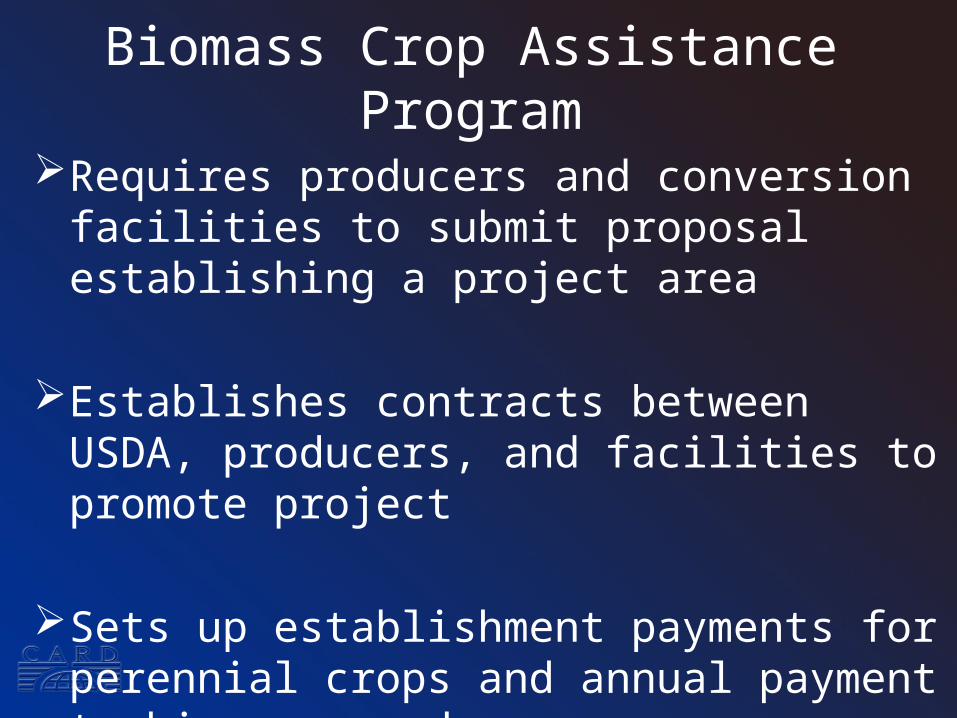
Biomass Crop Assistance Program
Requires producers and conversion facilities to submit proposal establishing a project area
Establishes contracts between USDA, producers, and facilities to promote project
Sets up establishment payments for perennial crops and annual payment to biomass producers
Biomass Crop Assistance Program
Payments are also authorized for biomass collection, harvest, storage, and transportation
Matching payments$1 for each $1 per ton paid by conversion facility,
up to $45 per ton, for 2 years
Other Energy Provisions in the Farm Bill
Cellulosic biofuel producer tax credit: $1.01 per gallonRestricted to domestic production
Waives limits on small ethanol producer credit for cellulosic ($0.10 per gallon)

Thank you for your time.
Any questions?