Embed Size (px)
Citation preview
Looking at the Past, Shaping the Future: Getting to Know Our Students
for the Past 40 Years
NASPA/ACPA 2007 ConferenceOrlando, FL April 2, 2007
Sylvia Hurtado John H. PryorDirector DirectorHigher Education Research Institute Cooperative Institutional Research Program
Higher Education Research Institute University of California at Los Angeles
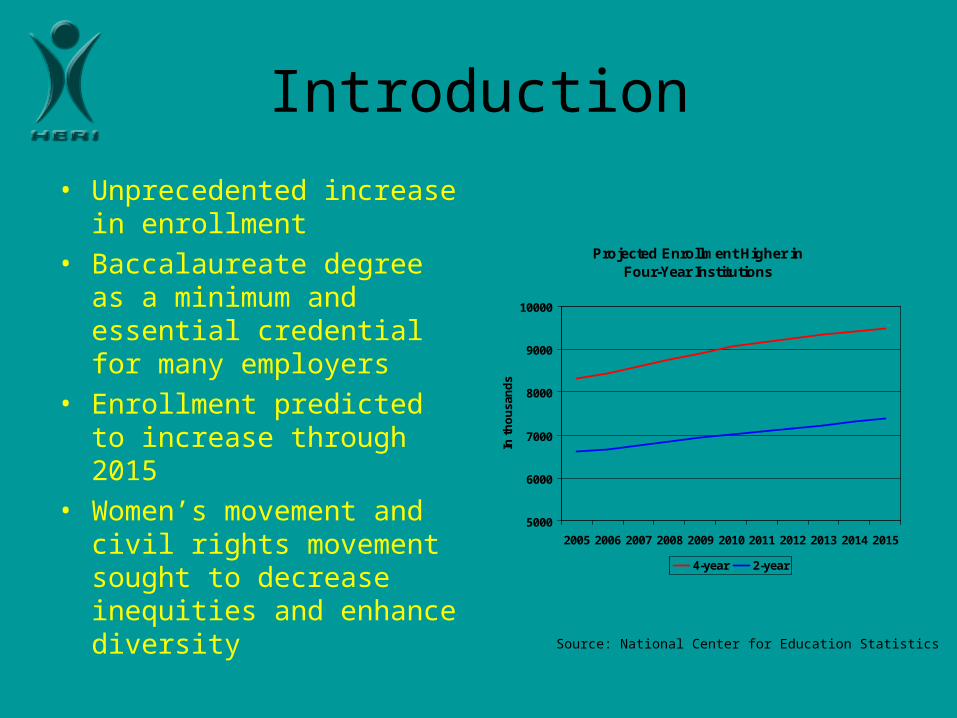
Introduction
• Unprecedented increase in enrollment
• Baccalaureate degree as a minimum and essential credential for many employers
• Enrollment predicted to increase through 2015
• Women’s movement and civil rights movement sought to decrease inequities and enhance diversity Source: National Center for Education Statistics
Projected Enrollment Higher in Four-Year Institutions
5000
6000
7000
8000
9000
10000
2005 2006 2007 2008 2009 2010 2011 2012 2013 2014 2015
In t
ho
usa
nd
s
4-year 2-year
Introduction
• Are our institutions:– Achieving educational equity?– Meeting student’s needs and aspirations?– Developing the values, skills, and knowledge
for an increasingly complex and global society?
Cooperative Institutional Research Program
• Longitudinal Research Program Launched in 1966
• Hundred’s of articles in professional journals and books written using CIRP data
• Astin’s “Theory of Involvement”
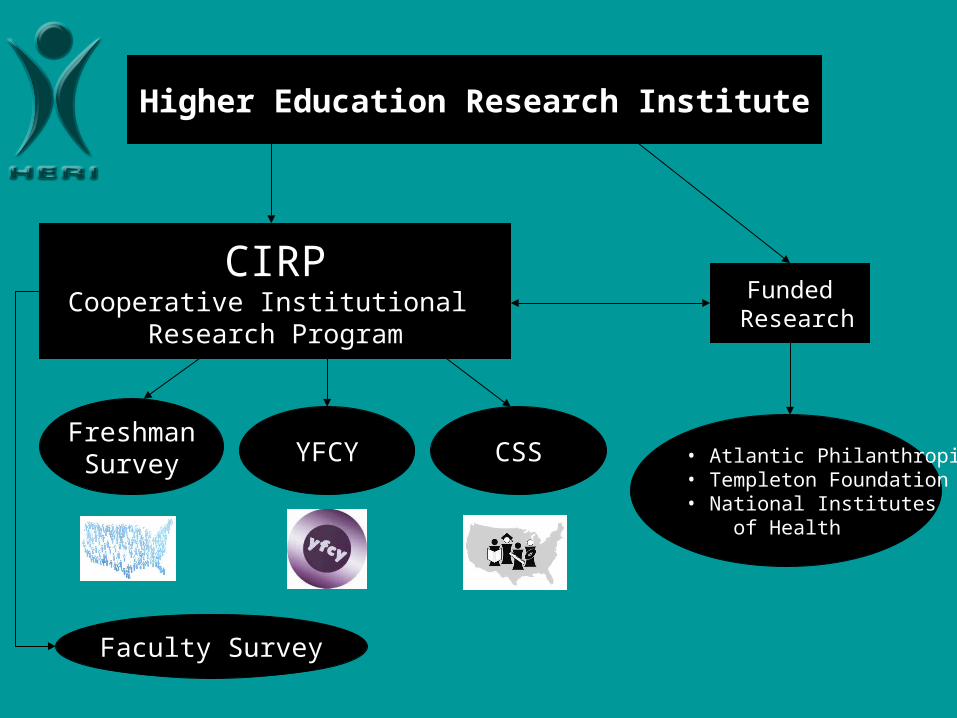
Higher Education Research Institute
CIRPCooperative Institutional
Research Program
FreshmanSurvey YFCY CSS
Faculty Survey
Funded Research
• Atlantic Philanthropies• Templeton Foundation• National Institutes
of Health
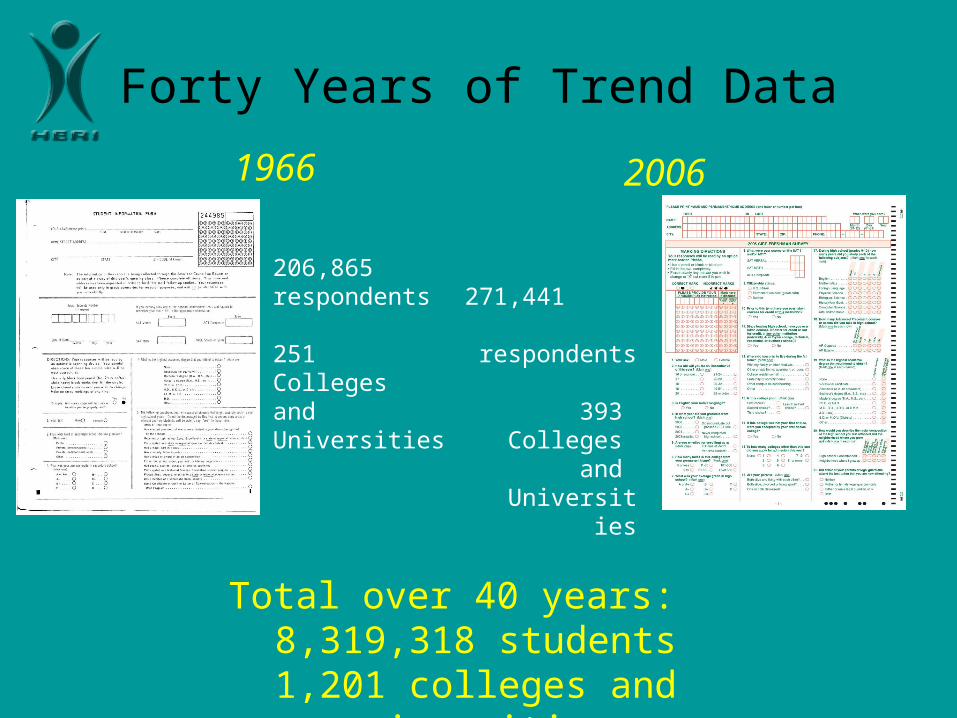
Forty Years of Trend Data
1966 2006
206,865 respondents
251 Colleges and Universities
271,441 respondents
393 Colleges
and Universities
Total over 40 years:8,319,318 students
1,201 colleges and universities
CIRP Freshman Survey Trends
• Major Findings in the Report– Demographics and Implications for a Diverse Society– Access and Affordability– Preparation for College– Technology– Politics and Discourse– Values– Conclusion and Implications
Demographic Changes
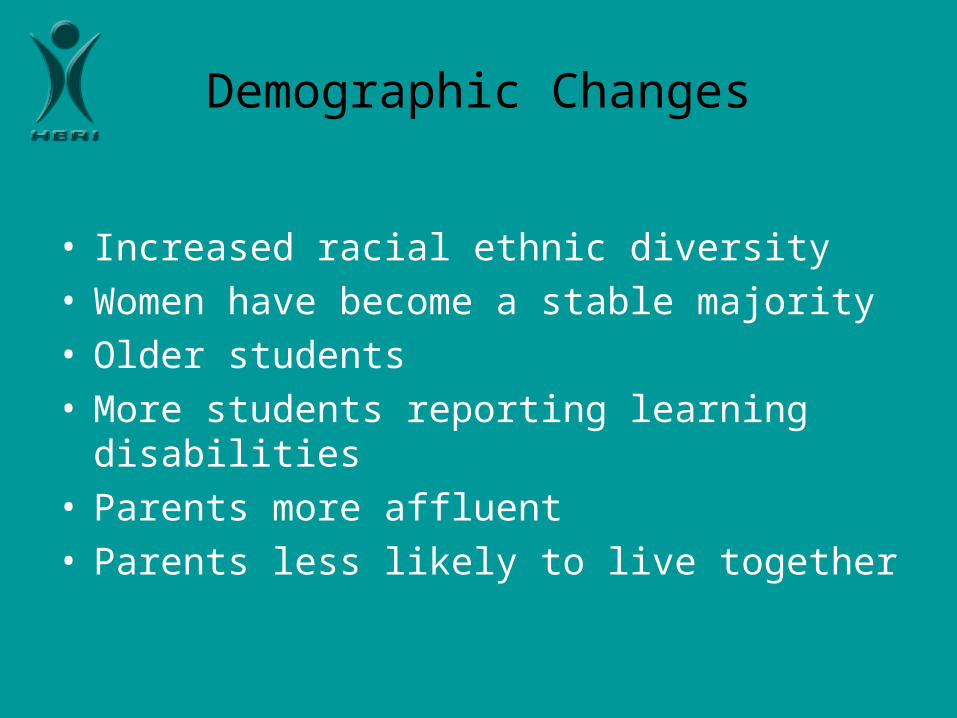
Demographic Changes
• Increased racial ethnic diversity• Women have become a stable majority• Older students• More students reporting learning disabilities• Parents more affluent• Parents less likely to live together
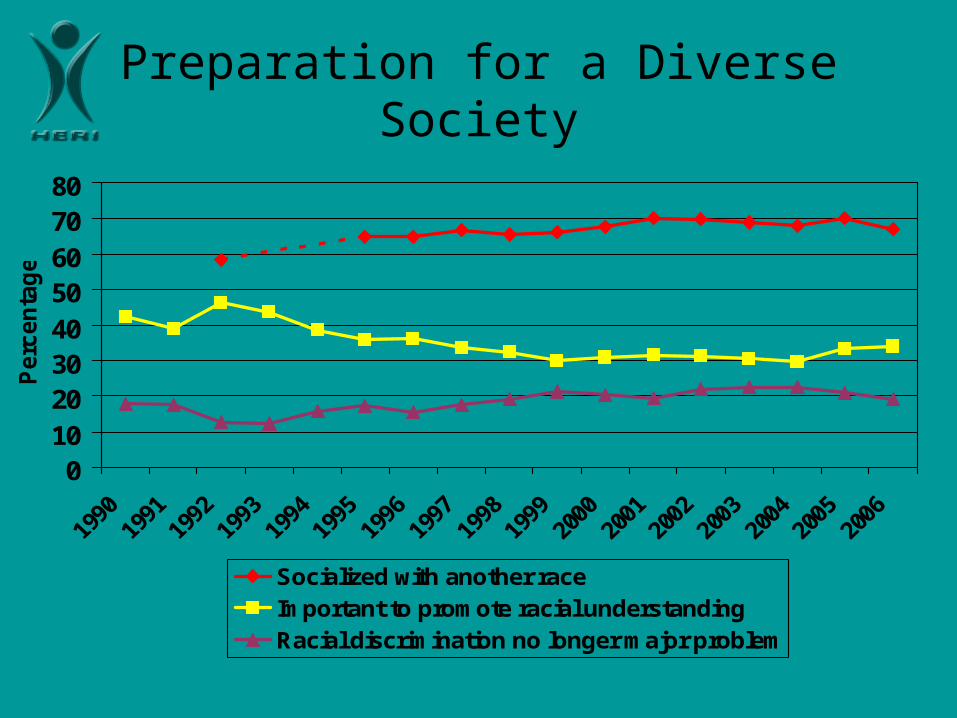
Preparation for a Diverse Society
01020304050607080
Perc
en
tag
e
Socialized with another raceImportant to promote racial understandingRacial discrimination no longer major problem
CIRP Research Reports
•
College Choice
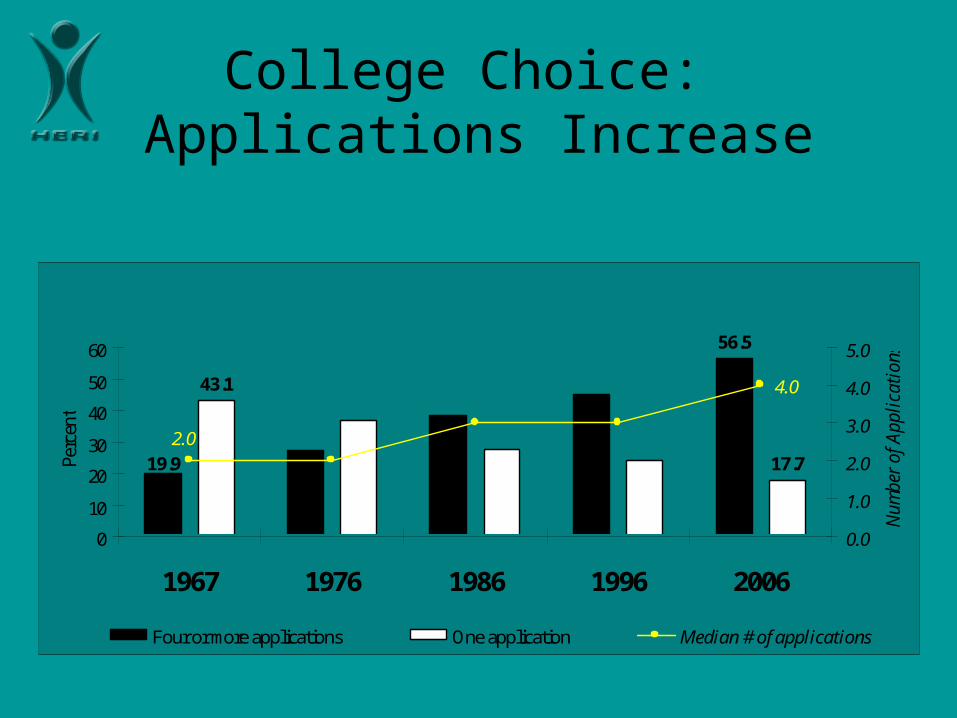
College Choice: Applications Increase
19.9
56.5
43.1
17.7
4.0
2.0
0
10
20
30
40
50
60
1967 1976 1986 1996 2006
Perc
ent
0.0
1.0
2.0
3.0
4.0
5.0
Num
ber
of A
ppli
cati
ons
Four or more applications One application Median # of applications
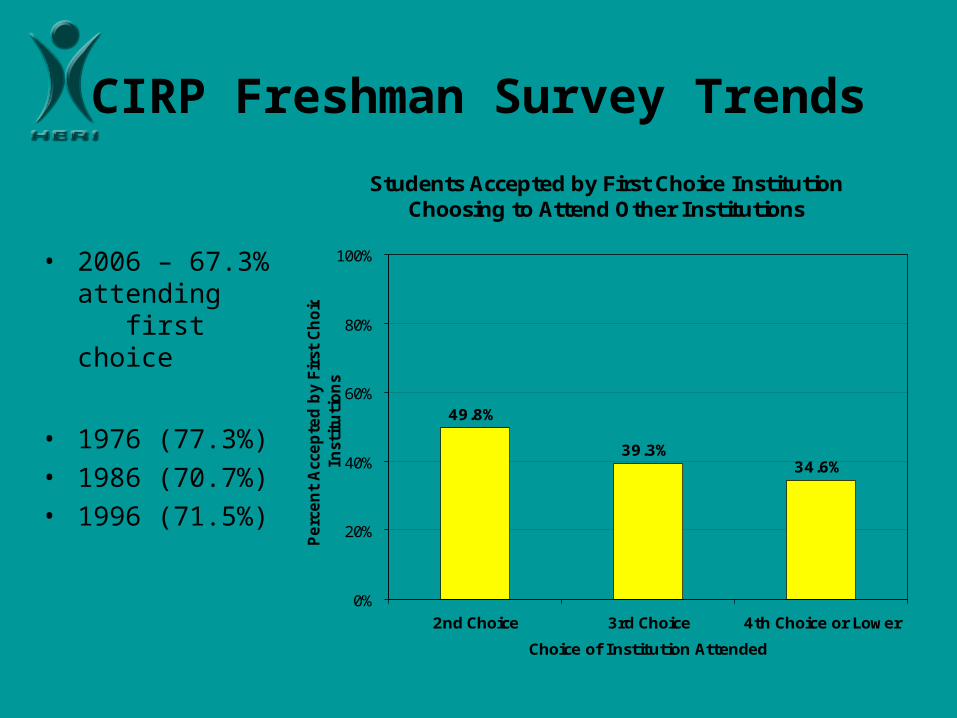
CIRP Freshman Survey Trends
• 2006 – 67.3% attending first choice
• 1976 (77.3%)• 1986 (70.7%)• 1996 (71.5%)
Students Accepted by First Choice Institution Choosing to Attend Other Institutions
49.8%
39.3%34.6%
0%
20%
40%
60%
80%
100%
2nd Choice 3rd Choice 4th Choice or Lower
Choice of Institution Attended
Perc
ent
Acc
epte
d b
y Fi
rst
Choic
e
Inst
ituti
ons
Affordability
Affordability
• Parental Income – Rising faster in the group of parents of college students
than the national average• In 1975, parental income of students was 46% above national
• In 2005, parental income of students was 60% above national
– Rising faster for parents of students in public universities• Family income of students at privates rose 15.7%• Family income of students at publics rose 17.1%
– Fewer students have major concerns about financing their education (11.6%, down from 19.1% in 1995)
Preparation for College
Preparation for College
• Since 1982, completion of recommended levels increased (National Commission on Excellence)
• Most increases in meeting recommended levels of course work were in the first decade
• Still improvement needed in:– Biology (46.8%)– Physical Science (59.9%)– Computer Science (61.6%)
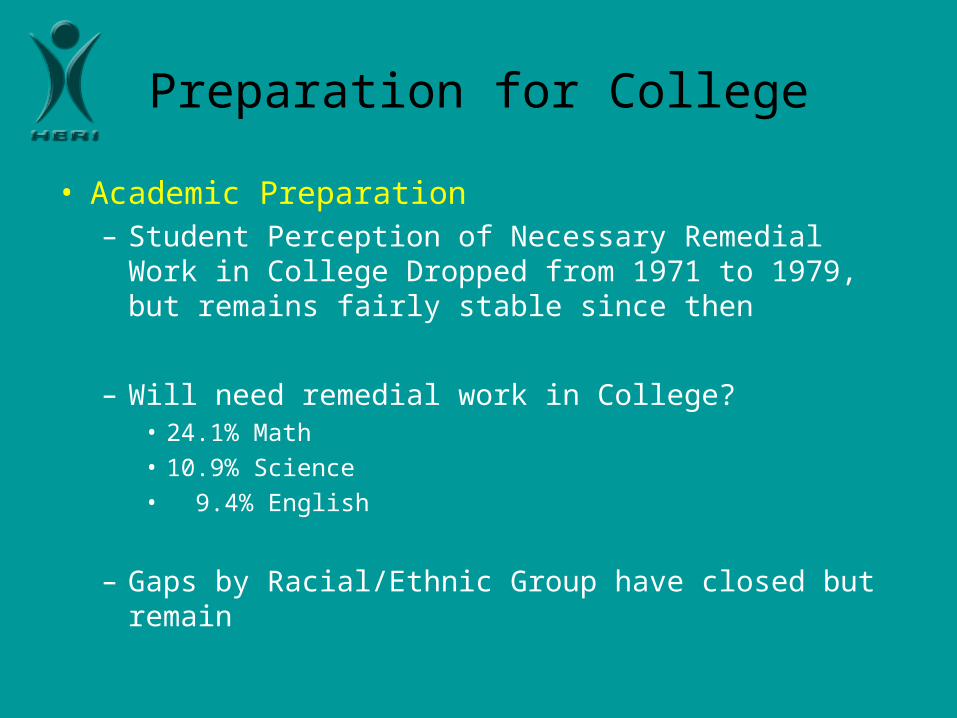
Preparation for College
• Academic Preparation– Student Perception of Necessary Remedial Work in
College Dropped from 1971 to 1979, but remains fairly stable since then
– Will need remedial work in College?• 24.1% Math• 10.9% Science• 9.4% English
– Gaps by Racial/Ethnic Group have closed but remain
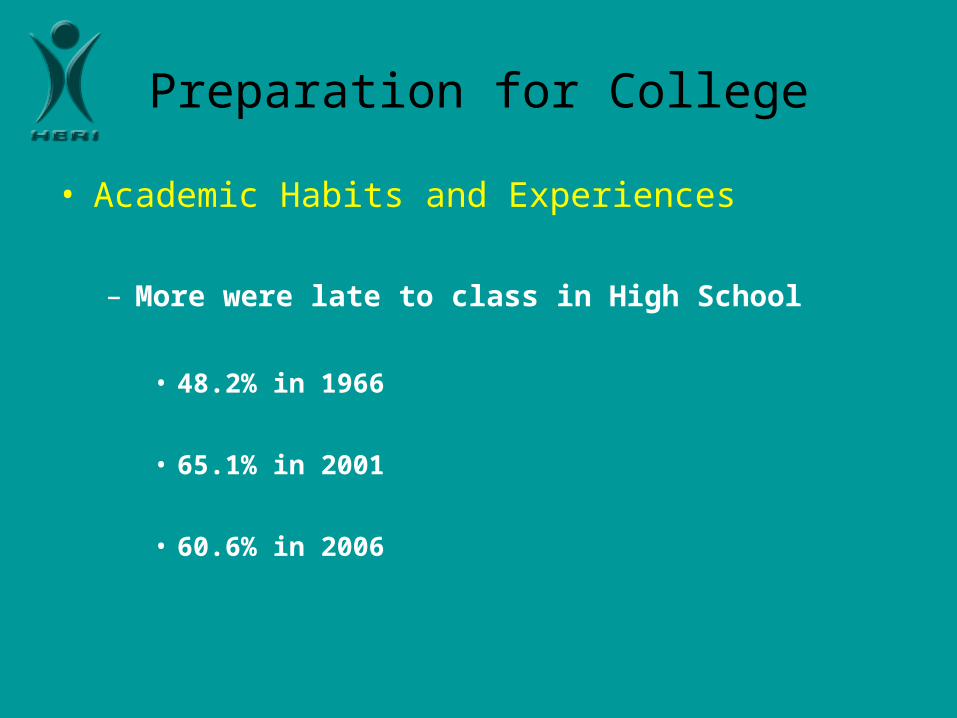
Preparation for College
• Academic Habits and Experiences
– More were late to class in High School
• 48.2% in 1966
• 65.1% in 2001
• 60.6% in 2006
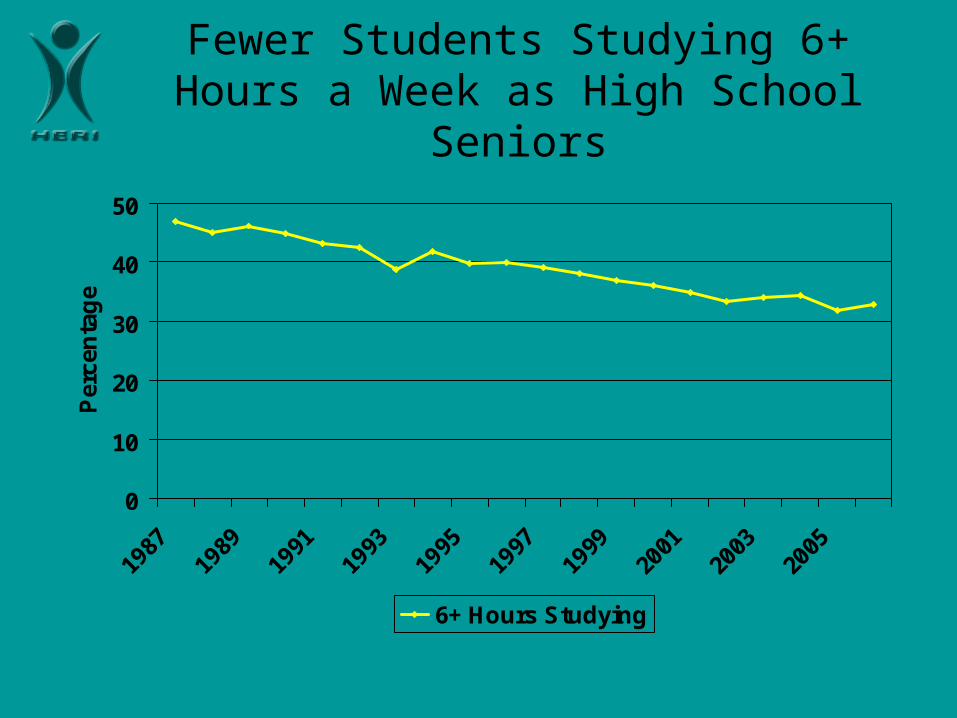
Fewer Students Studying 6+ Hours a Week as High School Seniors
0
10
20
30
40
50
1987
1989
1991
1993
1995
1997
1999
2001
2003
2005
Per
cen
tag
e
6+ Hours Studying
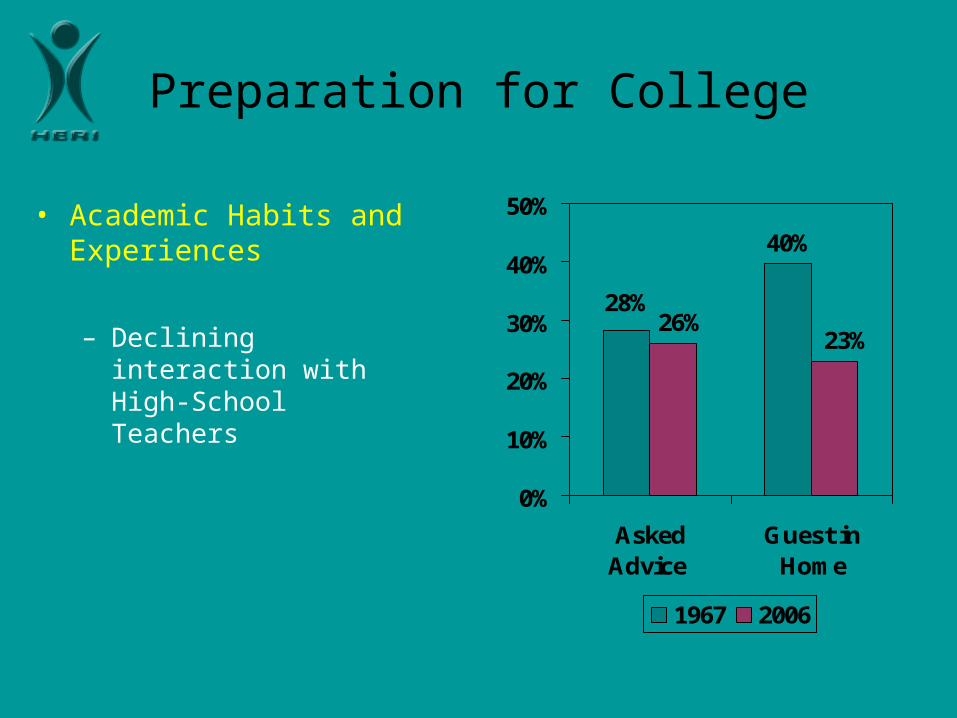
Preparation for College
• Academic Habits and Experiences
– Declining interaction with High-School Teachers
40%
28%
23%26%
0%
10%
20%
30%
40%
50%
AskedAdvice
Guest inHome
1967 2006
Technology
Technology
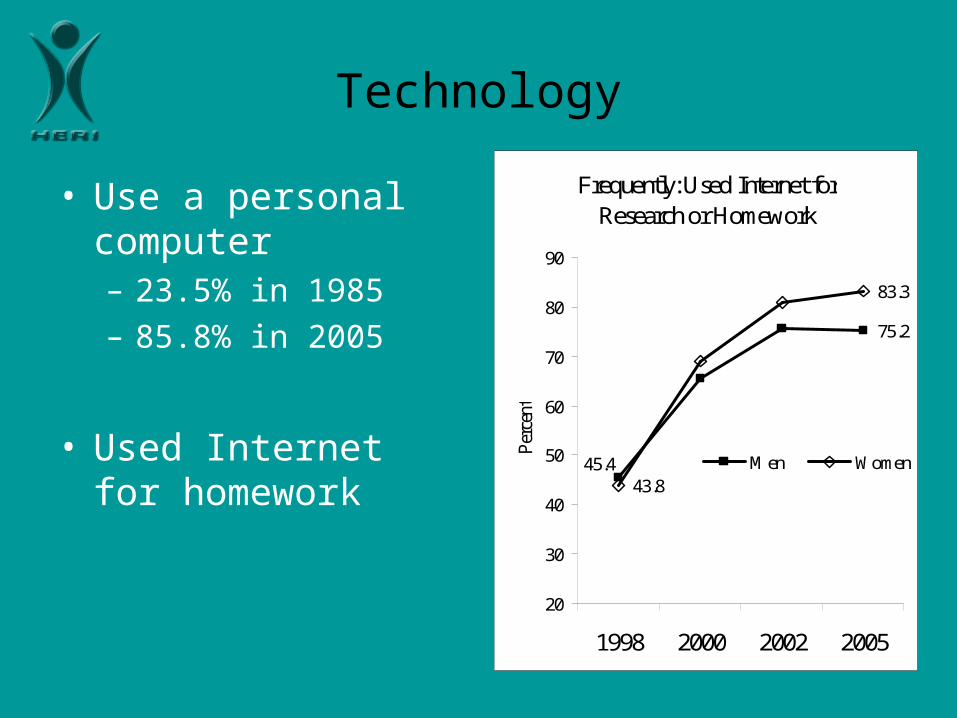
• Use a personal computer– 23.5% in 1985– 85.8% in 2005
• Used Internet for homework
Frequently: Used Internet for Research or Homework
45.4
75.2
43.8
83.3
20
30
40
50
60
70
80
90
1998 2000 2002 2005
Per
cent
Men Women

TechnologyFrequent Use of the Internet for Homework as
High-School Senior
0
10
20
30
40
50
60
70
80
90
100
White Black Asian Hispanic
Per
cen
t
1998
2005
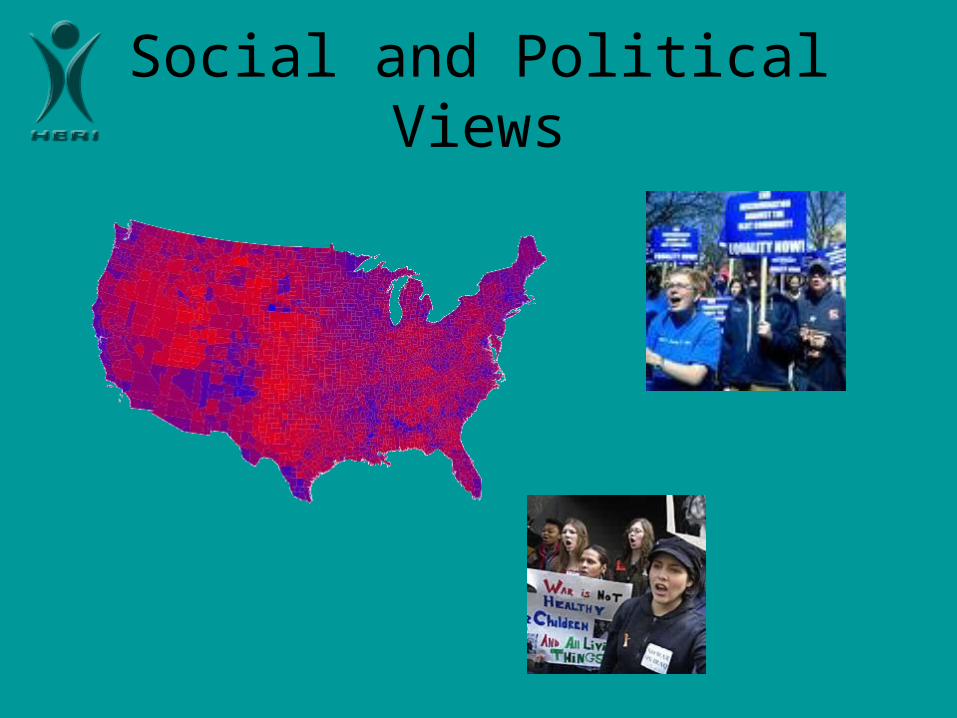
Social and Political Views
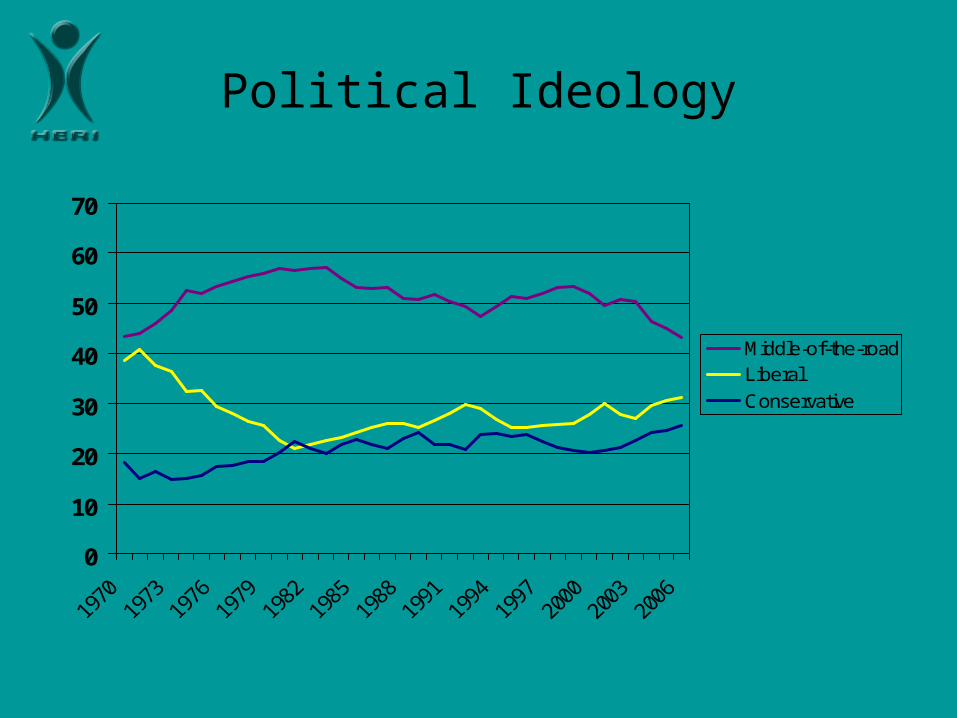
Political Ideology
0
10
20
30
40
50
60
70
Middle-of-the-roadLiberal
Conservative
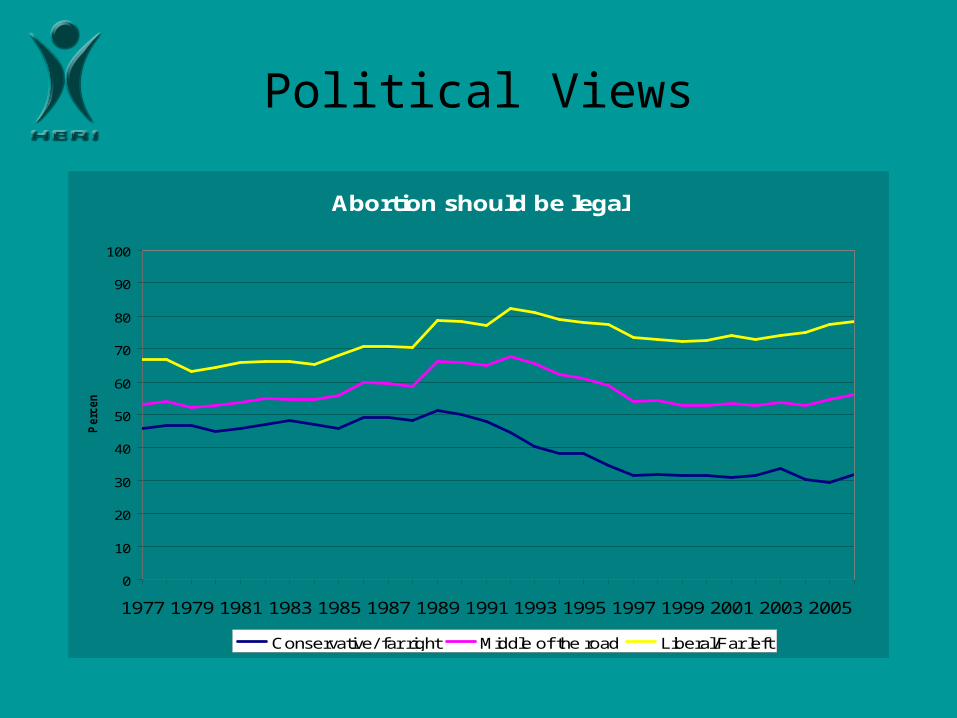
Political Views
Abortion should be legal
0
10
20
30
40
50
60
70
80
90
100
1977 1979 1981 1983 1985 1987 1989 1991 1993 1995 1997 1999 2001 2003 2005
Perc
en
t
Conservative/ far right Middle of the road Liberal/Far left
Political Views
• Shifting views on abortion, gay rights, legalization of marijuana, and using affirmative action in college admissions
• Driving this change has been differential changes among conservatives and liberals
Political Views
• Politics– Greater differences between students
– Also disagree if Colleges have the right to ban extreme speakers:
– Overall agreement has increased:• 24.1% agree in 1986 to 40.5% in 2006
• Conservatives: 55.1% agree
• Liberals: 28.5% agree
Values
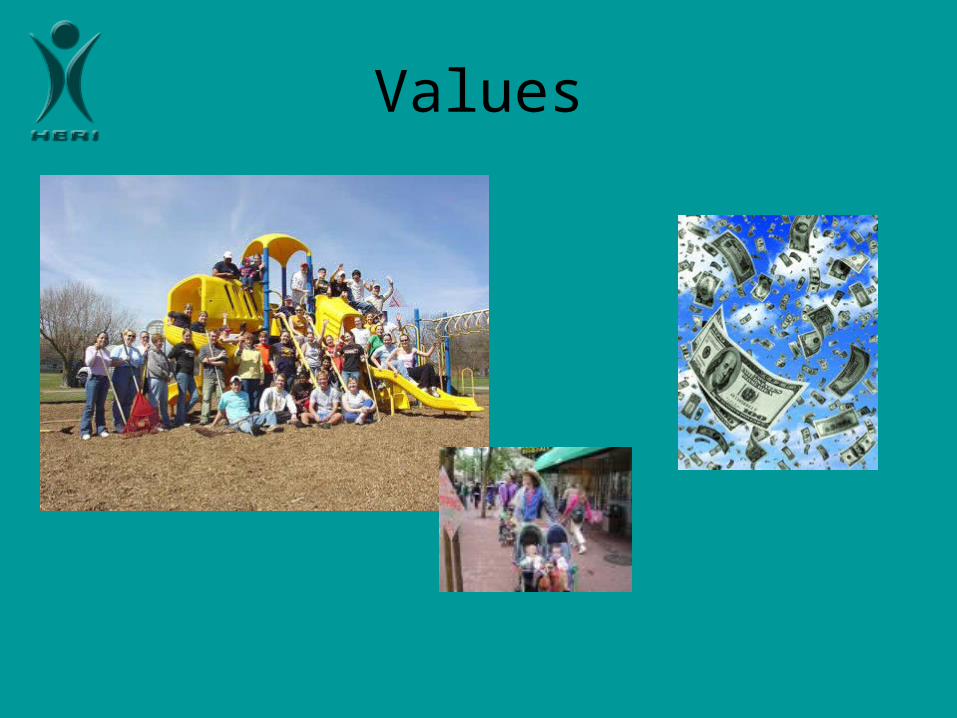
Values
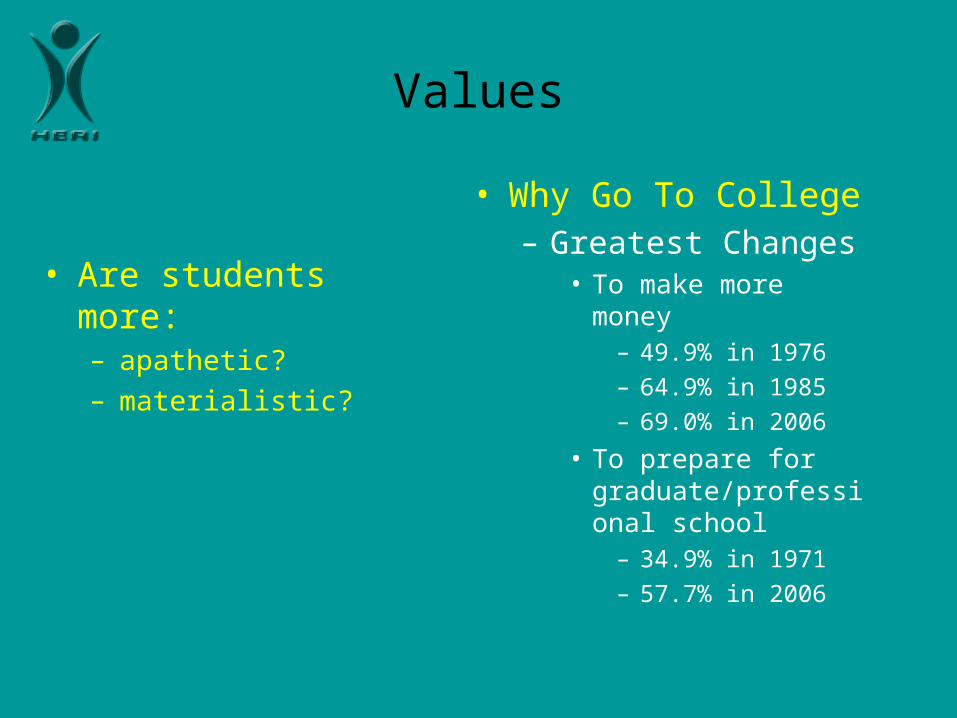
• Are students more: – apathetic?– materialistic?
• Why Go To College– Greatest Changes
• To make more money– 49.9% in 1976
– 64.9% in 1985
– 69.0% in 2006
• To prepare for graduate/professional school
– 34.9% in 1971
– 57.7% in 2006
Values
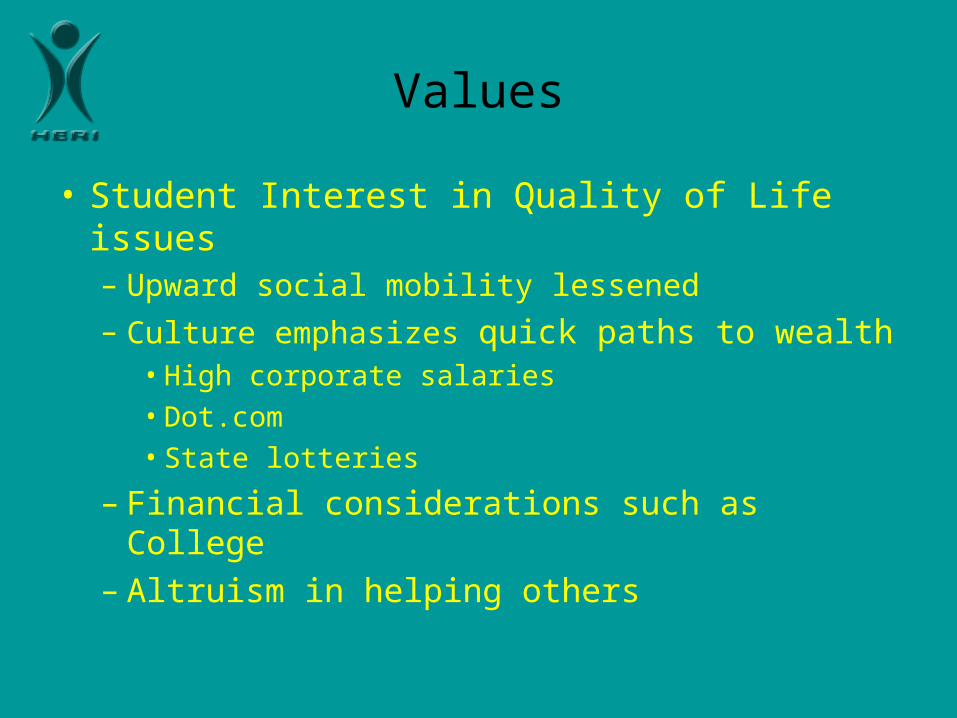
• Student Interest in Quality of Life issues– Upward social mobility lessened
– Culture emphasizes quick paths to wealth• High corporate salaries• Dot.com• State lotteries
– Financial considerations such as College– Altruism in helping others
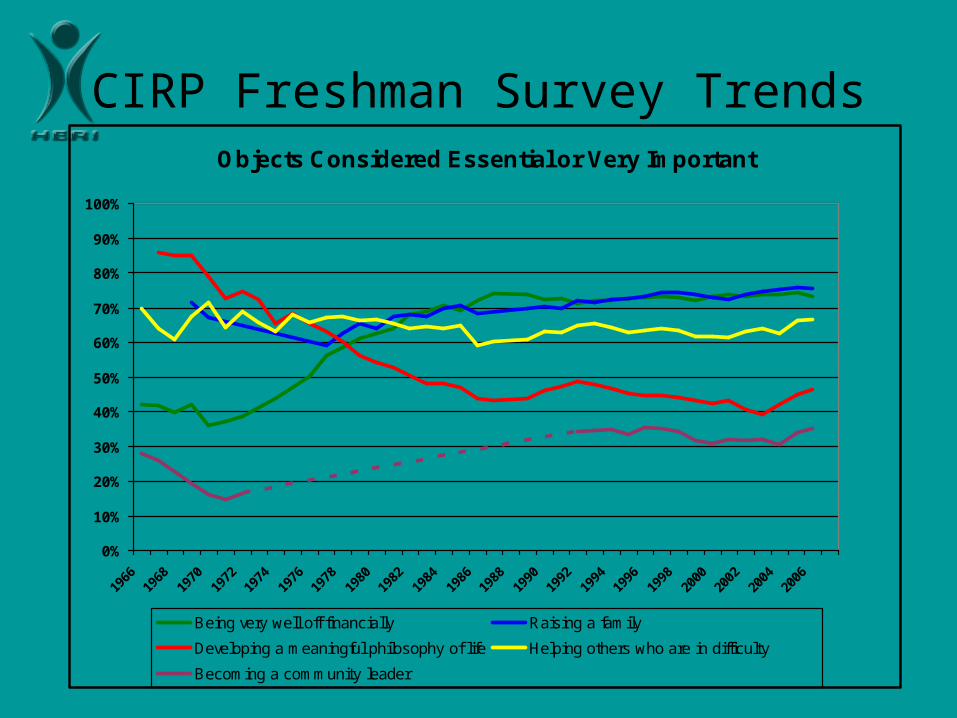
CIRP Freshman Survey Trends
Objects Considered Essential or Very Important
0%
10%
20%
30%
40%
50%
60%
70%
80%
90%
100%
1966
1968
1970
1972
1974
1976
1978
1980
1982
1984
1986
1988
1990
1992
1994
1996
1998
2000
2002
2004
2006
Being very well off financially Raising a family
Developing a meaningful philosophy of life Helping others who are in difficulty
Becoming a community leader
Implications for Student Affairsand College Educators
• Educating students about diversity, promoting civil discourse, and skills for handling conflict are more important today– Co-curricular programming examples – Staff training
Implications for Student Affairsand College Educators
• Reports for special tutoring or remediation have not declined among entering freshmen. How will we meet their needs?– Placement tests, advising, early warning systems,
more advising– Supplemental education in living learning
programs– High school and college partnerships examples
Implications for Student Affairsand College Educators
• Technology progress means keeping up with modes of communication and student learning (e.g.evaluating sources of information).
Implications for Student Affairsand College Educators
• Students want a better quality of life and are altruistic – Millennial generation has received much
criticism but many of the trends preceded them, starting in the 1980s.
– Service opportunities with time for students to reflect on values
– Encourage the development of responsible citizenship
Implications for Student Affairsand College Educators
• Access and Affordability: Balancing the market perspective with broader goals of higher education– Enable more low and middle income students
to make good choices– Work collaboratively with colleges that have
capacity, joint agreements– Using broad definition of talent and multiple
ways of assessing it in admissions
For More Information•
http://www.gseis.ucla.edu/heri
To order “The American Freshman:Forty Year Trends,” or for more information
Go to the HERI booth or use our website:
•40 year trends institutional report for each school that has participated in the 2006 data
collection and has at least 5 years of data