Embed Size (px)
Citation preview

17th World Conference on Nondestructive Testing, 25-28 Oct 2008, Shanghai, China
Loose Parts and Valve Flow Monitoring in Nuclear Power Plants Using Integrated Digital Systems
Sotirios. J. VAHAVIOLOS 1, Spillos. E. KATTIS 2, Mark F. CARLOS 1, Dimitrios A. KOUROUSIS 2, Athanasios A. ANASTASOPOULOS 2, Jason W. DONG 1
1 Physical Acoustics Corporation, Princeton, NJ, USA, Email: [email protected] 2 Envirocoustics A.B.E.E., Athens, GREECE, Email: [email protected]
Abstract
In Nuclear Power plants, a loose part, whether it is from a deteriorated component or from an item inadvertently left in the primary system during construction, refueling, or maintenance, can contribute to component damage and material wear by frequent impacting with other parts in the system. Loose parts may, also, pose other serious threats, such as partial flow blockage and trigger major problems in the nuclear system operation. Loose Parts Monitoring Systems (LPMS) have been developed in order to monitor for, detect and evaluate metallic loose parts in the primary coolant system of Nuclear power plants. Present-day digital LPMS architecture and software flexibility have allowed the integration of additional functions into the same, PC-based, system, such as the capability of parallel monitoring of various critical valves in the plant for flow / leak detection. Integration offers significant advantages as compared to using two separate systems, such as economy, installation efficiency, operator friendliness, etc. Simultaneous monitoring of the two phenomena (loose parts impacts and flow) also enhances signal interpretation capabilities and results in better evaluation and more solid management decisions.
The present paper discusses the application and operational aspects of an integrated Loose Parts and Valve Flow Monitoring System (LPMS-VFMS) for Nuclear power plants, and demonstrates how modern digital Acoustic Emission systems and processing strategies can improve LPMS-VFMS operation and uniquely detect and evaluate, metallic loose parts and critical valve flow, in the presence of severe environmental noise and vibration. Emphasis is given to one of the most critical aspects of a nuclear Loose Parts and Valve Flow Monitoring system, i.e. minimizing false alarms, a major problem existing in older analogue system designs. Loose part and valve flow alarm definition strategies are part of the integrated data acquisition and analysis software and are presented herein, together with unique signal processing functions aiming in eliminating false calls.
Keywords: Loose Parts, Valve Flow, Leak Detection, Acoustic Emission, Nuclear
1. Introduction
A loose part in a Nuclear Power plant may result from a deteriorated component somewhere within the flow circuit or from an item (e.g. a tool) inadvertently left in the primary system during construction, refueling, or maintenance. If introduced inside the plant’s flow, a loose part can contribute to component (e.g. tube or valve) damage and material wear by frequent impacting with other parts in the system, which may, eventually, result in a leakage. Loose parts may, also, pose other serious threats, such as partial flow blockage and trigger major problems in the nuclear system operation. For example[1], loose parts object 3.18cm long and 1.91cm in diameter, identified in steam generator, resulted in

tube wear 38% through wall. As stated in [1], the indication of tube wear was present in prior cycles but was not reported because the indication was distorted due to its location. In another example [1], unit shut down performed when the steam generator primary to secondary leak rate increased to unacceptable levels. Follow up inspection identified a leaking tube and given the nature (volumetric) and location of associated flaws, were attributed to wear from loose parts.
Early detection of such loose parts during operation is a key issue in order for plant management to schedule preventive actions prior to significant damage and catastrophic failures. Consequently, Loose Parts monitoring has been a requirement on nuclear power plants for many years - e.g. by United States Nuclear Regulatory Commission (NCR) [2]. In this respect Loose Parts Monitoring Systems (LPMS) have been developed in order to monitor for, detect and evaluate metallic loose parts in the primary coolant system of Nuclear power plants.
On the other hand, constantly increasing nuclear safety requirements[3] suggest the monitoring of the condition of critical plant elements the change of which may relate to or follow an accident, so that the appropriate and justified actions be taken by plant personnel. In this respect, plants have started implementing the monitoring of critical valves (such as key relief valves in the plant) for flow and leakage detection, as part of their standard on-line integrity assessment tools, since valve leakage may also result in costly shutdowns and pose serious safety threats. Present-day digital LPMS architecture and software flexibility by Physical Acoustics Corporation (PAC) systems have allowed the integration of additional functions into the same, PC-based, system, such as the capability of parallel monitoring of such critical valves in the plant for flow / leak detection using the same system. Integration offers significant advantages as compared to using two separate systems:
- most parts of the two systems’ functions may be similar (e.g. piezoelectric sensors, cabling, data acquisition boards, control unit and cabinet, software base, etc.) therefore significant scale economy can be achieved
- installation of both systems can be performed simultaneously by the same crew, same installation tools (e.g. surface preparation tools for sensor mounting), and same installation materials such as cable conduits, connectors, junction boxes etc., achieving better installation efficiency and management, and faster installation , thereby minimizing shutdown time
- simultaneous monitoring of the two phenomena (loose parts impacts and flow) using the same data acquisition, monitoring and analysis software, reduces operator’s training requirements, enhances user-friendliness, and improves signal interpretation capabilities by distinguishing flow vs. impacts signals, as compared to single-systems, and results in better evaluation and more solid management decisions.
On the other hand, the two functions (impact / leak detection) are performed with the necessary degree of differentiation, e.g, different AE sensor frequency responses suitable for each application, different preamplifier operating frequencies, different user-selectable data filters, separate processing strategies and graphs, as well as separate special loose part and valve flow alarm definition strategies defined by the user taking into account specific site baseline calibration data, thus improving LPMS-VFMS operation while uniquely detecting and evaluating, metallic loose parts and critical valve flow, in the presence of severe environmental noise and vibration and eliminating false calls.

2. LPMS-VFMS Equipment
(i) Sensors
For the Loose Parts Monitoring part of the integrated system, in addition to the hardware requirements stated by NCR in [2], loose parts systems design and function is described in relevant ASME code [4]. Both NCR and ASME documents are used around the world. In compliance with requirements of NCR and/or ASME, low frequency Acoustic Emission (AE) sensors (Figure 1), also known as accelerometers, are located at strategic positions along the reactor vessel (in direct contact with pipes and the vessel) where loose parts are most likely to travel. These piezoelectric accelerometers detect the impact of these
loose parts as they come in contact with the pipe or vessel wall. This impact usually occurs with high force due to the speed at which these large loose parts are travelling. The accelerometers are able to detect the relatively low frequency mechanical vibration propagating from the point of impact and convert this mechanical vibration into an electrical signal which is amplified in the system preamplifier,
processed by the data acquisition system and recorded by the data acquisition computer.
Higher frequency Acoustic Emission sensors are used for the Valve Flow Monitoring part of the integrated system. Such sensors are mounted on or close to the key valves in the plant which are to be monitored, such as Pressurizer PRZ Safety Valves and / or SG (Steam Generator) Safety valves for detection of significant flow. These sensors are able to detect the high-frequency components of the sound of the turbulent flow or leak in the valve, and convert them into electrical signals, like in the case of the accelerometers detecting impacts.
For both functions, the system sensors are specially designed for high temperature Nuclear environments, at least up to 325oC. They are fabricated of Stainless Steel and other high temperature alloys, and are rated at least 1000MRad (Gamma TID over its 40 year rated life). Sensors bear threaded hole for good mounting on the vessels, side through-holes for safety wiring to avoid loosening and attached hard line cable (typically 1 meter) followed by soft line Tefzel cable of adequate length to drive the signal all the way to the preamplifiers or the containment penetrations.
(ii) Preamplifiers
Due to the very high temperatures in the nuclear containment area and the high radiation environment, special considerations are required when it comes to installing and using the required AE preamplifiers. Traditional voltage preamplifiers cannot be used as the preamplifier must be located often a long distance (sometimes up to 100 meters) away from the sensor to keep within the temperature and the radiation limitations of today’s electronics. In these cases, a charge preamplifier is used. The specific advantage of a charge preamplifier, over a voltage
Figure 1. The accelerometer with hard line and soft line cable attached
Figure 2. LPMS-VFMS Cabinet

one, is that the preamplifier can be located long distances away from the sensor without degradation in signal amplitude.
Other preamplifier considerations that have been taken into account in the specific integrated system is in the ability to remotely change the gain of the preamplifier as well as the ability to run diagnostics remotely including an on-board “preamplifier signal input” which injects a known amplitude and frequency sine wave signal into the front of the preamplifier, and an “Auto sensor Test” function to excite the sensors on the structure to determine operability. These remote control gain and diagnostic functions are very important especially when the preamplifiers and sensors are inside containment and it is necessary to determine system integrity at specific test intervals. For each part of the system’s function, the proper operating frequency preamplifiers are used.
(iii) Control Panel
The LPMS-VFMS Control Panel includes the data acquisition computer (housing the signal conditioner and data acquisition cards, the audio monitor, and the standard PC), monitor and PC peripherals, alarm I/O panel and all cable connections. The data acquisition computer is equipped with the LPMS-VFMS data acquisition and analysis software, operating under windows, and acts as the interface controller for the LPMS-VFMS system. The system utilizes multiple PCI-8, eight-channel AE data acquisition boards to meet the end-users specifications for the total number of channels. Understandably, a certain amount of channels is dedicated to the LPMS part and is connected to the low-frequency AE accelerometers, whereas the remaining channels are dedicated to the VFMS part and are connected to the higher-frequency AE sensors.
The PCI-8 card of Physical Acoustics Corporation is an 8-channel, Digital Signal Processing (DSP)-based, cost effective, AE data acquisition system on a single, full-size, PCI card. Through the high performance PCI (Peripheral Component Interconnect) bus, significant AE data transfer speeds (up to 132 MB/second), can be attained, assuring a wide bandwidth bus for multi-channel AE data acquisition and waveform transfer. Each single board is provided with 8 complete high-speed, AE channels of acquisition, waveform processing and transfer, and 8 digital input and output control signals. It is exactly this wide bandwidth of the board that allows it to accommodate for both leak detection and impact / vibration detection applications in the same, integrated system. Other key features of the PCI-8 AE system on a board include four High Pass and four Low Pass filter selections for each channel, totally under software control, power supply to the remote charge preamplifier, separate threshold (sensitivity) adjustment for each channel, floating and fixed threshold option, built-in waveform processing and DMA transfer for high-speed transfer of waveforms on all 8 AE channels, digital signal processing circuitry virtually eliminating drift, thereby achieving high accuracy, stability and reliability, with minimal calibration requirements, etc.
The complete LPMS-VFMS Control Panel is housed in a floor-mounted, vertical-standing, ventilated, drip-proof, seismically rated, environmentally protected to NEMA 12 equivalent, rack-mount cabinet (Figure 2). This Panel houses all the LPMS-VFMS components, including the Data Acquisition System with the Signal Conditioner & Data Acquisition Cards, the video monitor, keyboard & mouse, the Alarm I/O Panel, printer etc. All equipment is bolted to the front panel of the cabinet, from where immediate access to all controls and displays is available. The cabinet’s base is equipped with mounts for permanent bolting to the floor.

3. LPMS-VFMS Integrated Software
The Loose Parts and Valve Flow Monitoring System (LPMS-VFMS) software [5] integrates the two base software components of the system (LPMS and VFMS software) into a unique suite. The LPMS software controls the LPMS data acquisition system and carries out continuous Acoustic Emission (AE) monitoring of the critical nuclear plant components. The VFMS software monitors key valves in the plant (e.g. Pressurizer Safety Valves and Steam Generator Safety Valves) for detection of significant flow. Both parts of the software share a common graphical representation and they have universal tools for system security, diagnostics, setup, alarm processing and reporting.
The LPMS-VFMS software is user friendly and provides a complete user interface for viewing system activity, setting up the system, performing automated and manual diagnostics, performing analysis and processing alarms. The LPMS-VFMS software has been designed with multiple data presentation screens, specifically for easy understanding and offers a complete graphical and icon related analysis for fast problem recognition. The software operates in two main modes: Manual mode allows the user to view the system operation, set adjustable test and operational parameters, set discrimination levels, alert levels, and carry out extra diagnostic tests for system performance verification. Automatic mode continuously monitors for loose parts and valve flow events and displays system status. Upon detection of a loose parts or valve flow event, local alarms are sounded, signals are sent to the Main Plant Computer System (MPCS) and local video monitor displays an analysis mode to provide further information regarding the loose parts or valve flow event to the operator. In automatic mode, all AE activity is logged for future replay. Supervisor mode is available to protect the system from unauthorized tampering with critical system settings. The system provides two levels of security. The first level allows the access to system operation only. The second level allows access to the system configuration also.
There are 12 basic AE monitoring software screens, presenting either time driven data or hit driven data. The 6 screens are dedicated for the LPMS part, 5 screens are dedicated to VFMS part and there is one common reporting screen. The navigation between screens is easy by user selection of the desired screen. Furthermore the system has the ability to automatically select the appropriate screen in case of alarm for fast identification of the potential problem and further actions.
On top of the above, the application offers a large number of user input screens where the end user may setup all the required parameters of the system. Also, indicators of the system status are available (e.g. computer CPU status) and special diagnostics can be executed for all the system components (e.g. sensor calibration).
Figure 3: Average Signal Level per channel and associated alarm levels & status (LPMS)
Figure 4: Average Signal Level per channel and associated alarm levels & status (VFMS)

4. LPMS-VFMS Monitoring Strategies and Non-Critical Alarms
The main time driven data screen for LPMS and VFMS subsystems, shown in Figures 3 and 4, respectively, presents monitoring of average AE signal level (ASL) versus channel for background noise monitoring, leak or other problem detection.
As far as the ASL versus Channel setup data is concerned, it can be seen for this function that the setup items in Figures 5 and 6 are related to the viewing screens of LPMS and VFMS, respectively. For the LPMS subsystem (Figure 5), the first two setup items, on the left, are the alarm level settings for the Low and High ASL alarms. On the right are the ASL High and Low Alarm Time Constants i.e. the amount of time that the ASL must remain out of limits (High and Low, respectively), per channel, for an ASL alarm to come on. The next item is the ASL Time constant which allows the user to select an averaging period to assure that the ASL versus channel display is reacting to the background noise changes and not short time bursts which will be occasionally picked up by the AE transient analysis anyway. For the VFMS subsystem (Figure 7), three similar ASL thresholds are available, the ASL Low threshold that rise a Non-Critical Alarm, the ASL Leakage threshold that rise a Critical Alarm for potential Leakage (see Figure 8) and the Valve Open ASL threshold that rise a Critical Alarm for potential Valve Open condition.
Figure 5: Non-Critical alarms set-up (LPMS)
Figure 6: Critical and Non-Critical alarms set-up (VFMS)
In addition to the above ASL-based alarms, Cabinet Door Open and Low disk space are also being continuously monitored as part of the Non-Critical Automatic Diagnostic tests, as presented in Figure 7.
Other monitoring screens includes, AE signal level versus time per channel (available in both sub-systems) where a user can utilize trending principles to determine channels of concern, the AE monitoring screen (available in LPMS) which as shown in Fehler! Verweisquelle konnte nicht gefunden werden.9 contains multiple key AE graphs including Hits versus channel, Hits versus time, Hits versus amplitude and Amplitude versus Energy correlation graph.
The Critical Alarm setup could be configured and adjusted to the current plant needs using the dialog presented in Fehler! Verweisquelle konnte nicht gefunden werden.10. The “Loose Parts Alarm” box allows the selection of the “Suspect Loose Parts Event” setting
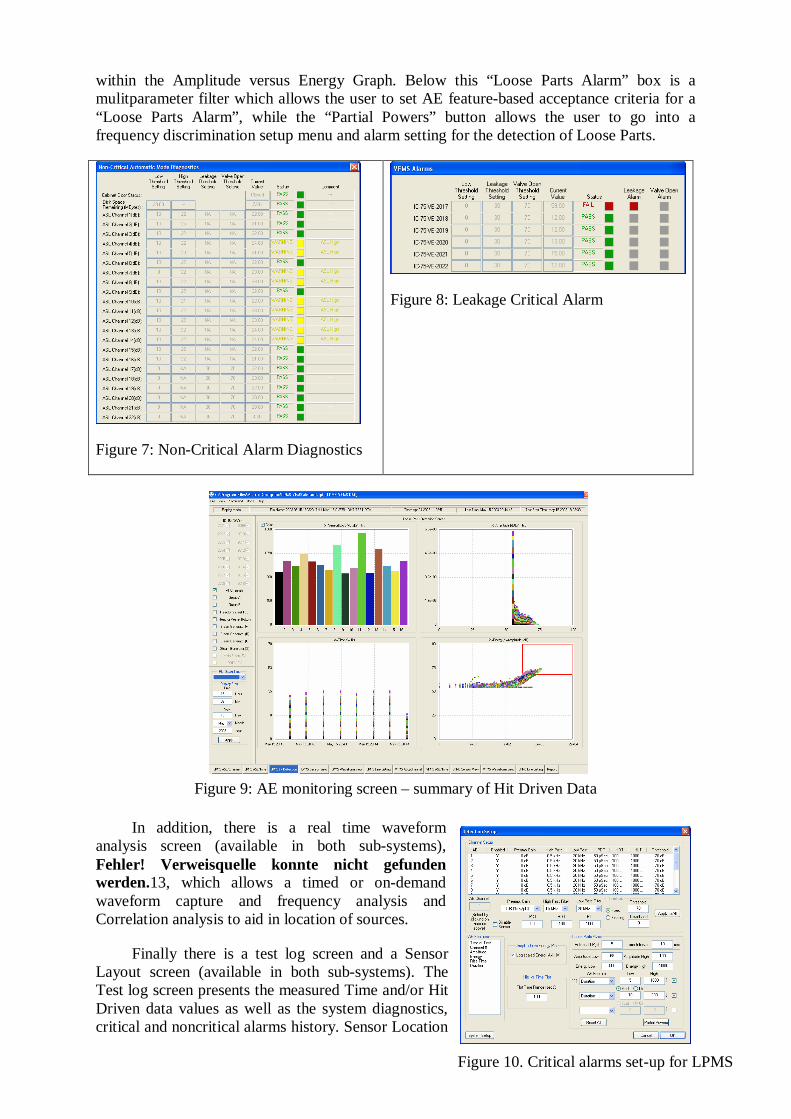
within the Amplitude versus Energy Graph. Below this “Loose Parts Alarm” box is a mulitparameter filter which allows the user to set AE feature-based acceptance criteria for a “Loose Parts Alarm”, while the “Partial Powers” button allows the user to go into a frequency discrimination setup menu and alarm setting for the detection of Loose Parts.
Figure 7: Non-Critical Alarm Diagnostics
Figure 8: Leakage Critical Alarm
In addition, there is a real time waveform analysis screen (available in both sub-systems), Fehler! Verweisquelle konnte nicht gefunden werden.13, which allows a timed or on-demand waveform capture and frequency analysis and Correlation analysis to aid in location of sources.
Finally there is a test log screen and a Sensor Layout screen (available in both sub-systems). The Test log screen presents the measured Time and/or Hit Driven data values as well as the system diagnostics, critical and noncritical alarms history. Sensor Location
Figure 9: AE monitoring screen – summary of Hit Driven Data
Figure 10. Critical alarms set-up for LPMS

Screens (Figure 11 and Figure 12112) shows the relative placement of each sensor, overlaid (and labeled) on a graphic depiction of the plant components that are being monitored. The sensor color indicates the status. Colors vary to show different status. For example, green indicates all things are normal, yellow indicates a Non Critical Failure associated with that channel, while Red indicates a loose parts alarm on that channel. At this point it is worth mentioning that the software is customized for each specific installation. More specifically, depending on the monitoring components and the respective sensors installed on each component, provisions are made for viewing only part of the data e.g. data from the Steam Generator A and the associated Coolant Pump A and so on.
Figure 11. Loose Part Alarm – Sensor Location Screen
Figure 121. Valve Open Alarm – Sensor Location Screen
5. Implementation & Strategies
(i) Loose Parts Alarm Detection
The most important part of the new digital Loose Parts Monitoring system is the critical alarm detection mode. As mentioned earlier, it is extremely important to eliminate false calls. Any alarm in a nuclear plant needs to be taken into account very seriously and because of that, each alarm must be genuine and important. Loose parts systems have suffered a poor reputation over the years due to the older analogue systems’ lack of good alarm discrimination and need to be followed up with a manual, human-assisted (via monitoring replayed waveforms on an oscilloscope) decision. It was for this reason that a significant amount of time was invested in order to come up with automated, on-line, multiple-level alarm criteria in the Loose Parts Monitoring system.
In order to overcome limitations posed by the amplitude-based alarms, a three-level alarm criterio has been implemented including both time and frequency analysis, as well as incorporating pattern recognition techniques in the automated decision-making process. The following is the alarm detection process that has been employed in the Loose Parts Monitoring system. First, a “suspect” loose parts alarm is generated when AE activity meets a defined two-dimensional alarm based on a correlation graph of two critical AE features, as can be seen in the example Fehler! Verweisquelle konnte nicht gefunden werden.. Once detected by the system, this starts an alarm determination process that includes performing a pattern recognition analysis using AE feature analysis from time and frequency domain. If the pre-set criterion for a loose parts alarm is met, a frequency analysis is performed

comparing the high frequency/low frequency content against the alarm criteria for a loose part. Only after all three conditions are met, will a loose part be triggered.
Upon detecting a loose part, a two-minute waveform capture mode is initiated including pre-trigger waveform information for the associated channels. In addition, an alarm output signal is generated to the control room to indicate a loose part detection. Users can view, manipulate and analyze waveforms from the “first arrival” sensor and up to three neighboring sensors, as presented in the example of Fehler! Verweisquelle konnte nicht gefunden werden.3, or to analyze any user selected waveforms. Waveform data is automatically stored for future analysis and information is available for post processing waveform review.
Also, location determination analysis can be performed, using waveform correlation techniques built into the system, as seen in Fehler! Verweisquelle konnte nicht gefunden werden.4. In addition to the three-level loose part alarm criteria, Control Rod Drive Movements (CRDM), can be identified and processed as separate case in order to minimize
false call due to CRDM operations.
(ii) Baseline Impact testing / Initial Calibration
Figure 12. Waveforms processing screen
Figure 13. Correlation-based Location Display
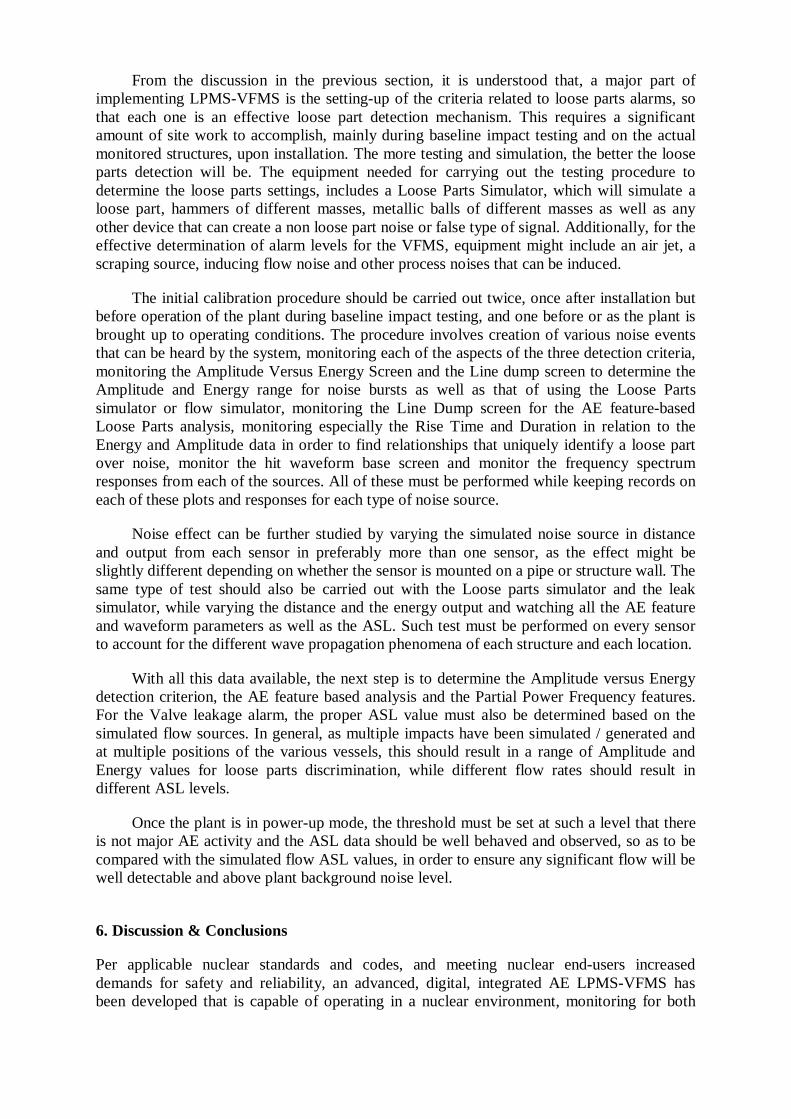
From the discussion in the previous section, it is understood that, a major part of implementing LPMS-VFMS is the setting-up of the criteria related to loose parts alarms, so that each one is an effective loose part detection mechanism. This requires a significant amount of site work to accomplish, mainly during baseline impact testing and on the actual monitored structures, upon installation. The more testing and simulation, the better the loose parts detection will be. The equipment needed for carrying out the testing procedure to determine the loose parts settings, includes a Loose Parts Simulator, which will simulate a loose part, hammers of different masses, metallic balls of different masses as well as any other device that can create a non loose part noise or false type of signal. Additionally, for the effective determination of alarm levels for the VFMS, equipment might include an air jet, a scraping source, inducing flow noise and other process noises that can be induced.
The initial calibration procedure should be carried out twice, once after installation but before operation of the plant during baseline impact testing, and one before or as the plant is brought up to operating conditions. The procedure involves creation of various noise events that can be heard by the system, monitoring each of the aspects of the three detection criteria, monitoring the Amplitude Versus Energy Screen and the Line dump screen to determine the Amplitude and Energy range for noise bursts as well as that of using the Loose Parts simulator or flow simulator, monitoring the Line Dump screen for the AE feature-based Loose Parts analysis, monitoring especially the Rise Time and Duration in relation to the Energy and Amplitude data in order to find relationships that uniquely identify a loose part over noise, monitor the hit waveform base screen and monitor the frequency spectrum responses from each of the sources. All of these must be performed while keeping records on each of these plots and responses for each type of noise source.
Noise effect can be further studied by varying the simulated noise source in distance and output from each sensor in preferably more than one sensor, as the effect might be slightly different depending on whether the sensor is mounted on a pipe or structure wall. The same type of test should also be carried out with the Loose parts simulator and the leak simulator, while varying the distance and the energy output and watching all the AE feature and waveform parameters as well as the ASL. Such test must be performed on every sensor to account for the different wave propagation phenomena of each structure and each location.
With all this data available, the next step is to determine the Amplitude versus Energy detection criterion, the AE feature based analysis and the Partial Power Frequency features. For the Valve leakage alarm, the proper ASL value must also be determined based on the simulated flow sources. In general, as multiple impacts have been simulated / generated and at multiple positions of the various vessels, this should result in a range of Amplitude and Energy values for loose parts discrimination, while different flow rates should result in different ASL levels.
Once the plant is in power-up mode, the threshold must be set at such a level that there is not major AE activity and the ASL data should be well behaved and observed, so as to be compared with the simulated flow ASL values, in order to ensure any significant flow will be well detectable and above plant background noise level.
6. Discussion & Conclusions
Per applicable nuclear standards and codes, and meeting nuclear end-users increased demands for safety and reliability, an advanced, digital, integrated AE LPMS-VFMS has been developed that is capable of operating in a nuclear environment, monitoring for both
Loose parts and Valve Flow. The system integrates older single systems and exhibits significant advantages compared to each sub-system by itself that include:
- increased plant security with the monitoring of critical valves
- enhanced data interpretation and minimization of false alarms, as simultaneous monitoring of the two phenomena (loose parts impacts and flow) using the same data acquisition, monitoring and analysis software, reduces operator’s training requirements and improves signal interpretation capabilities by distinguishing flow vs. impacts signals, as compared to single-systems
- better installation efficiency and management, and faster installation with less paperwork, thereby minimization of shutdown time requirements for installation of both systems since this can be performed simultaneously by the same crew, same tools and same materials
- significant scale economy as most parts of the two systems’ functions may be similar
A feasibility study for loose part energy/mass estimation has been performed using data from simulated impact events. The AE data and the respective waveforms were analyzed by means of NOESIS [6] signal processing and pattern recognition software. Features extracted from the time and frequency domain were transformed using principal component analysis. Representative part of the data was used to train a Back Propagation Neural Network (NN), while the remaining part of the data was used for testing purposes. The preliminary results, proved the feasibility of energy/mass estimation using NN. Experimental and research work in this field is in progress, aiming to classifier validation first in laboratory condition and later in field conditions.
References
[1] NCR Information Notice 2004-10, “Loose Parts in Steam Generators”, USA Nuclear Regulatory Commission Office of Nuclear Reactor Regulation, (2004).
[2] U.S. Nuclear Regulatory Commission, U.S. Nuclear Regulatory Guide #1.133, (1981)
[3] U.S. Nuclear Regulatory Commission, U.S. Nuclear Regulatory Guide #1.97, (Revision 4, June 2006)
[4] ASME OM-S/G-1997, part 12, (1997)
[5] LPMS Operating & Technical Manual, Physical Acoustics Corp, (2007)
[6] NOESIS V. 5.0, Reference Manual, Envirocoustics S.A., (2007)