Embed Size (px)
Citation preview

Los Angeles County Flood Control DistrictU.S. Department of the Interior – Bureau Of ReclamationLos Angeles County Flood Control DistrictU.S. Department of the Interior – Bureau Of Reclamation
KICKOFF MEETINGFEBRUARY 6, 2013KICKOFF MEETINGFEBRUARY 6, 2013
Los Angeles Basin Stormwater Conservation StudyLos Angeles Basin Stormwater Conservation Study
Meeting Objectives
• Overview of Study
• Update on
Progress/Schedule
• Identify Opportunities for
Stakeholder Participation
Bureau of Reclamation, LACFCD, LACDPW – Los Angeles Basin Stormwater Conservation Study
Study Overview
Partnership between:
• Los Angeles County Flood Control District
• U.S. Department of the Interior – Bureau of Reclamation
Basin Study Cost Estimate: $2.4 million
• Reclamation funding: $1 million
• LACFCD funding: $1,364,666
• Local Partners match: $59,960
Official Start Date – December 27, 20122.5 Years to Complete Study
Bureau of Reclamation, LACFCD, LACDPW – Los Angeles Basin Stormwater Conservation Study
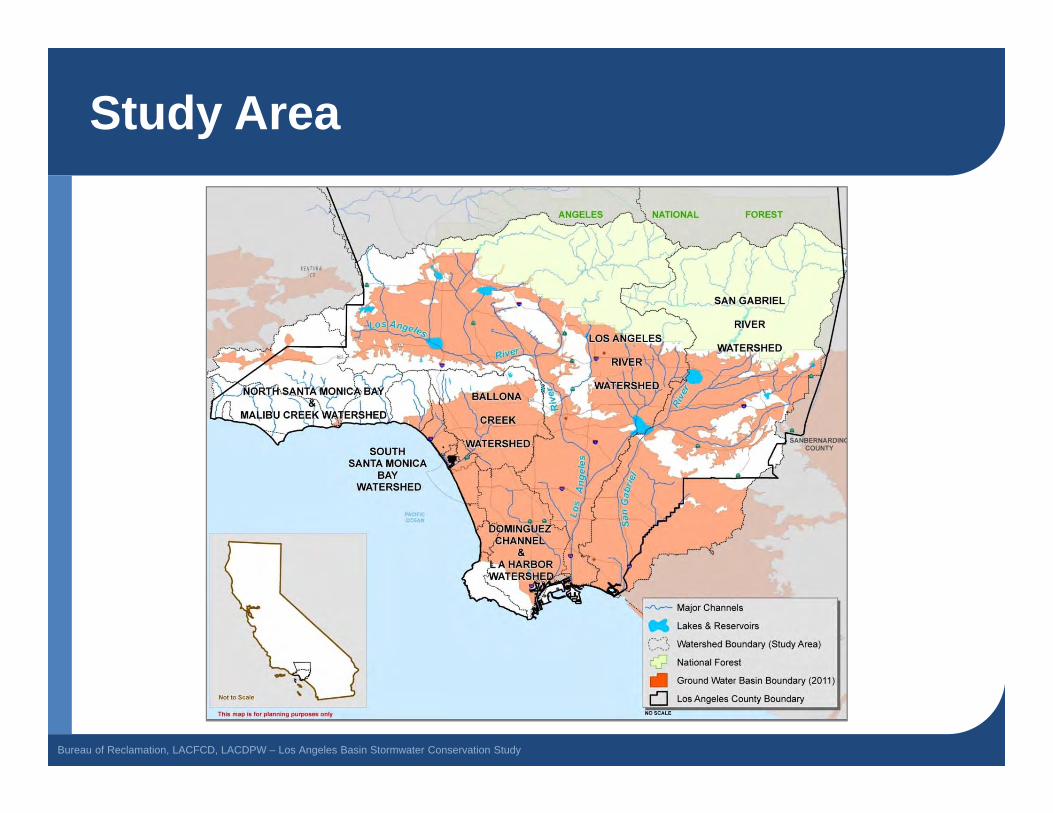
Study Area
Bureau of Reclamation, LACFCD, LACDPW – Los Angeles Basin Stormwater Conservation Study

Study Objectives
Bureau of Reclamation, LACFCD, LACDPW – Los Angeles Basin Stormwater Conservation Study
LA Basin Study Objectives
• Evaluate existing water conservation (capture/recharge) under future conditions
• Evaluate potential for new facilities and operational changes for increased capture and
recharge to address future conditions
Methodology
• Detailed scientific, engineering & economic analyses
• Coordinating with existing & proposed planning efforts
• Developing partnerships
• Local stakeholder involvement
• Highly skilled technical team
Key Considerations
Bureau of Reclamation, LACFCD, LACDPW – Los Angeles Basin Stormwater Conservation Study
• Account for projected climate change
• Population growth

Similar Efforts
Bureau of Reclamation, LACFCD, LACDPW – Los Angeles Basin Stormwater Conservation Study
• Colorado River Basin Water Supply & Demand Study
- Completed December 2012
- http://www.usbr.gov/lc/region/programs/crbstudy.html
• Santa Ana Watershed Basin Study
- In Progress
- http://www.usbr.gov/lc/socal/basinstudies/OWOW.html
Study Outcome
Bureau of Reclamation, LACFCD, LACDPW – Los Angeles Basin Stormwater Conservation Study
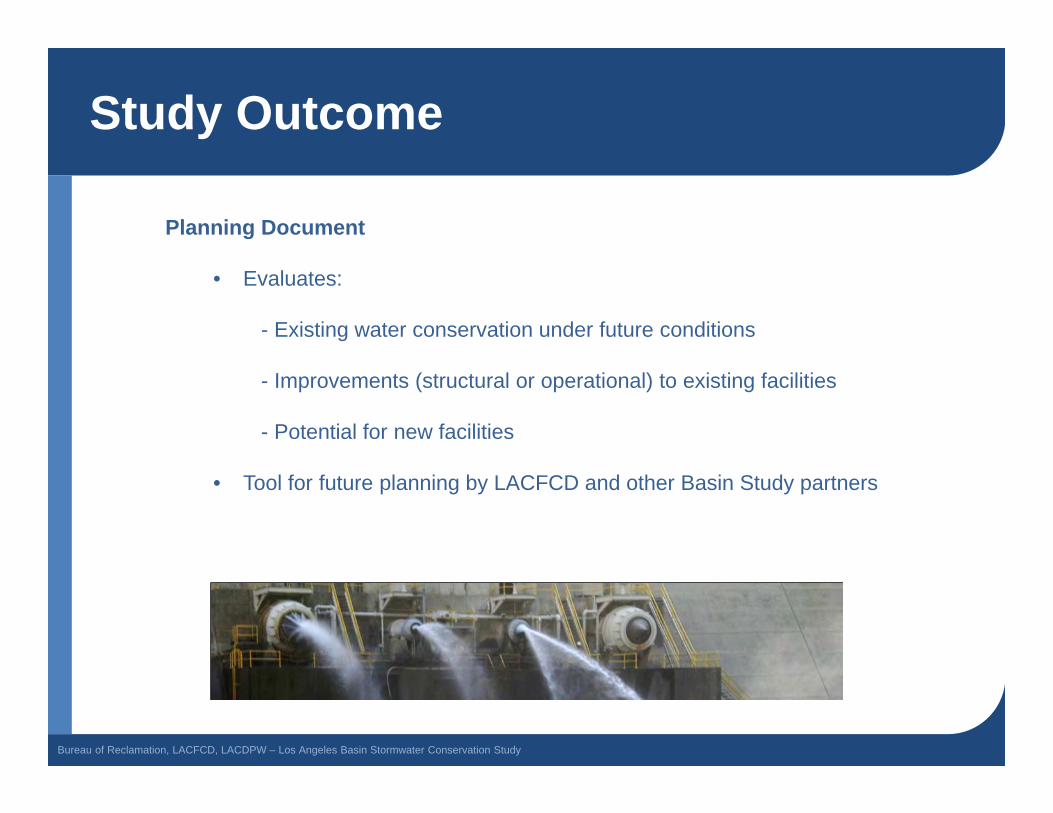
Planning Document
• Evaluates:
- Existing water conservation under future conditions
- Improvements (structural or operational) to existing facilities
- Potential for new facilities
• Tool for future planning by LACFCD and other Basin Study partners

Study Schedule
Bureau of Reclamation, LACFCD, LACDPW – Los Angeles Basin Stormwater Conservation Study
•Water Supply & Water Demand Literature Review and Compilation•Supply Analysis•Assess LACFCD Water Conservation System Contributions•Report Review & Publishing
•General oversight and project guidance•Study Task Facilitation/Coordination•Study Outreach
•Response to Current Climate•Response to Future Climate•Report Review & Publishing
TASK 2 – Water Supply & Demand Projections
•Downscaled Climate Change Modeling•Hydrologic Modeling – Current/Projected•Report Review & Publishing
TASK 3 – Downscaled Climate Change & Hydrologic Modeling
TASK 4 – Existing Infrastructure Response & Operations Plans Analysis
July 2013To
February 2014
January 2013To
May 2015
February 2013To
August 2013
February 2013To
September 2013
TASK 1 – Study Project Management
ACTION SCOPE TARGET

Study Schedule
Bureau of Reclamation, LACFCD, LACDPW – Los Angeles Basin Stormwater Conservation Study
TASK 5 – Infrastructure & Operations Concepts
•Develop Concepts•Evaluate and Refine Concepts•Appraisal-Level Concept Planning•Report Review & Publishing
TASK 6 – Trade-Off Analysis & Recommendations
•Conduct Economic Analysis•Conduct Non-Economic Analysis•Develop Trade-off Matrix •Cost Effectiveness•Develop Recommendations•Report Review & Publishing
TASK 7 – Final Report
•Prepare Final Report•Internal Review•Public Review•Peer Review•Publish and Distribute Final Report
January 2014To
October 2014
October 2014To
February 2015
February 2015To
May 2015
ACTION SCOPE TARGET
Task 3
Bureau of Reclamation, LACFCD, LACDPW – Los Angeles Basin Stormwater Conservation Study
Downscaled Climate Change Model
• Global data
• Refined for use at regional level
• Model Output
- Time and space based precipitation & evaporation data
Hydrologic Model
• Watershed Management Modeling System (WMMS)
• Designed for the Los Angeles region
• Uses Climate Model Output
• Model Output
- Time and space based runoff data (flow rates and volumes)
DELIVERABLE: Task 3 Report

Los Angeles Basin StormwaterConservation Study - Climate Change
Technical Services Center, Denver
February 6, 2013
U.S. Department of the InteriorBureau of Reclamation
RECLAMATIONManaging Water in the West
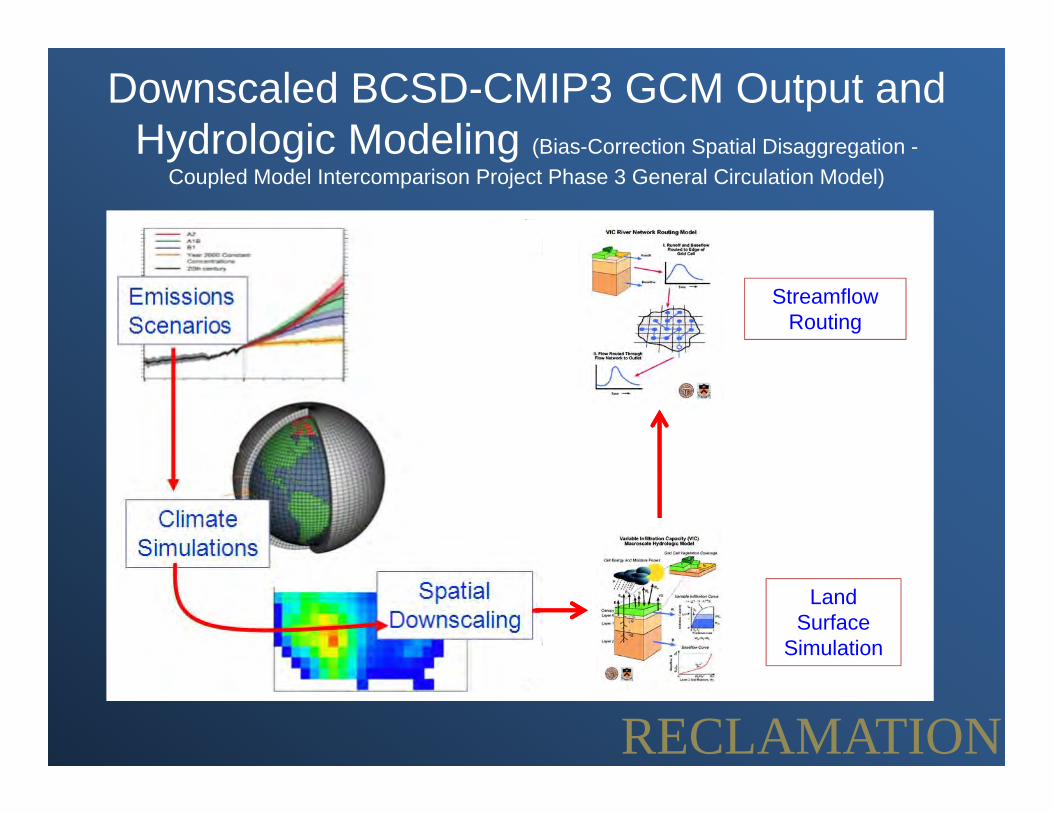
Downscaled BCSD-CMIP3 GCM Output and Hydrologic Modeling (Bias-Correction Spatial Disaggregation -
Coupled Model Intercomparison Project Phase 3 General Circulation Model)
Land Surface
Simulation
Streamflow Routing
RECLAMATION

CMIP-5 (BCCA)Coupled Model Intercomparison Project Phase 5, Bias-correction
and constructed analogs
Source: Brekke and Barsugli
RECLAMATION

Reportinghttp://www.usbr.gov/climate
Technical Report Report to Congress
RECLAMATION

http://gdo-dcp.ucllnl.org/downscaled_cmip3_projections
Online Data Access
RECLAMATION

Online Data Access
RECLAMATION

Online Data Access
RECLAMATION

ObjectiveClimate Change Task
• Develop continuous hourly precipitation and evaporation time‐series for the period 2011‐2099 conditioned on applicable 21st century climate change information to support LACFCD’s watershed management and modeling system (WMMS).
RECLAMATION

How will this be done!
RECLAMATION

Methodology ‐ Definitions
• Historical period, 1986‐1999 (14‐years)
– Observed historical: observed precipitation and temperature over 1986‐1999 [County]
– Simulated historical: climate model derived precipitation and temperature for the 1986‐1999 period [Reclamation]
RECLAMATION

Methodology ‐ Definitions• Future period, 2011‐2099 (89‐years)
• Divided into six representative future periods1. 2011‐2024 (14‐years)2. 2025‐2038 (14‐years)3. 2039‐2052 (14‐years)4. 2053‐2066 (14‐years)5. 2067‐2080 (14‐years)6. 2081‐2099 (19‐years)
• Choice of 14‐years, to be consistent with chosen historical period length of 14‐years (1986‐1999)
RECLAMATION

Methodology ‐ Definitions
• Cool season (Sep‐Apr) – September of previous year through April of next year
• For example for 2013 this would be September 2012 through April 2013
RECLAMATION

Study Area
Los Angeles
Santa Monica Bay
Met sites
~12 km
~12
km
RECLAMATION
x
xx
x
x
x
x
x
x
x
x
x
x
xx
x
x
xx
x
x
x
x
x
x
x
x
x
x
xx
x
x
xx
x
x
x
x
x
x
x
x
x
x
xx
x
x
xx
x
x
x
x
x
x
x
x
x
x
xx
x
Precipitation Change, %(diminished to enhanced)
Tempe
rature Cha
nge, C
(warmer to
hotter)
(P10T10)
(P25T25) (P75T25)
(P75T75)(P25T75)
(P90T10)
(P10T90) (P90T90)
(P50T50)
Q1
Q5
Q2
Q3 Q4
xx
x
x
x
x x
Projection Membership
RECLAMATION

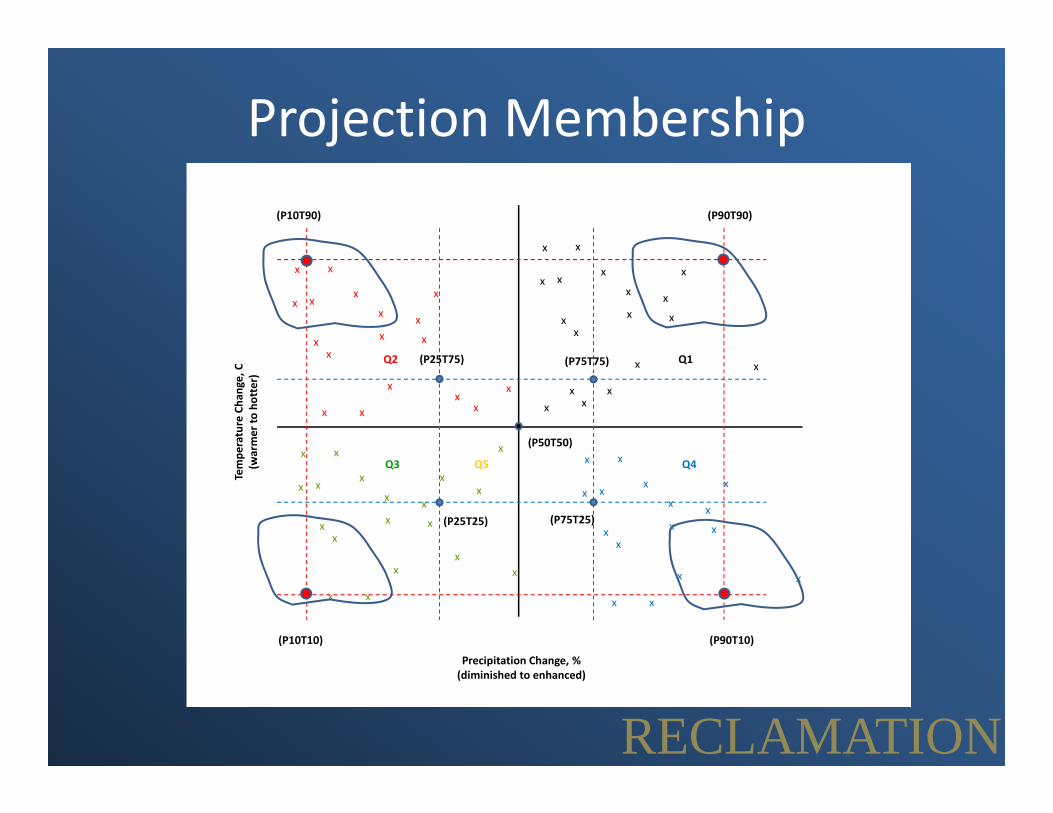
Projection Membership
• Precipitation and Temperature Change
• Estimate change between the historical simulation (1986‐1999) and each of the six future periods (2011‐2024, 2025‐2038, etc.) for each of the 112 climate projections
x
xx
x
x
x
x
xx
x
x
x
x
xx
x
x
xx
x
x
x
x
x
x
x
x
x
x
xx
x
x
xx
x
x
x
x
x
xx
x
x
x
xx
x
x
xx
x
x
x
x
x
x
x
x
x
x
xx
x
Precipitation Change, %(diminished to enhanced)
Tempe
rature Cha
nge, C
(warmer to
hotter)
(P10T10)
(P25T25) (P75T25)
(P75T75)(P25T75)
(P90T10)
(P10T90) (P90T90)
(P50T50)
Q1
Q5
Q2
Q3 Q4
xx
x
x
x
x x
RECLAMATION
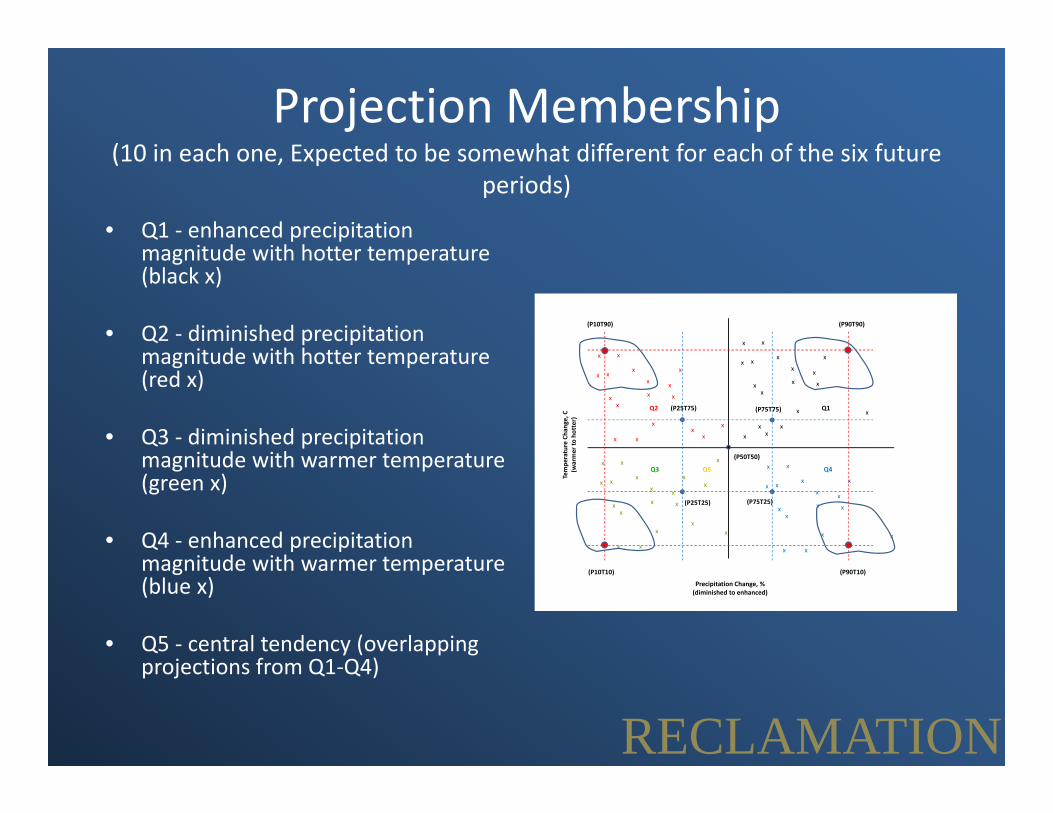
Projection Membership (10 in each one, Expected to be somewhat different for each of the six future
periods)
• Q1 ‐ enhanced precipitation magnitude with hotter temperature (black x)
• Q2 ‐ diminished precipitation magnitude with hotter temperature (red x)
• Q3 ‐ diminished precipitation magnitude with warmer temperature (green x)
• Q4 ‐ enhanced precipitation magnitude with warmer temperature (blue x)
• Q5 ‐ central tendency (overlapping projections from Q1‐Q4)
x
xx
x
x
x
x
xx
x
x
x
x
xx
x
x
xx
x
x
x
x
x
x
x
x
x
x
xx
x
x
xx
x
x
x
x
x
xx
x
x
x
xx
x
x
xx
x
x
x
x
x
x
x
x
x
x
xx
x
Precipitation Change, %(diminished to enhanced)
Tempe
rature Cha
nge, C
(warmer to
hotter)
(P10T10)
(P25T25) (P75T25)
(P75T75)(P25T75)
(P90T10)
(P10T90) (P90T90)
(P50T50)
Q1
Q5
Q2
Q3 Q4
xx
x
x
x
x x
RECLAMATION

0.0 0.2 0.4 0.6 0.8
0.88
0.90
0.92
0.94
0.96
0.98
1.00
x
F(x)
PRCP_001Simulated Historical
0.0 0.1 0.2 0.3 0.4 0.5 0.6 0.70.
880.
900.
920.
940.
960.
981.
00
x
F(x)
PRCP_001Simulated Future
Climate Conditioned Weather Sequences
Estimate percentile specific change factors by comparing distributions Simulated Historical and Simulated Future
1986-19992011-2024
Example Precipitation (inch) CDFs for Julian day 1 (PRCP_001; Jan 1)
RECLAMATION

Climate Conditioned Weather Sequences
In this example, change factor for percentile 0.98 is,
100*(0.2745 – 0.2300) /0.2300 = 19.35%
Interpretation - for the Q1 scenario in the first future period (2011-2024), at the 0.98 percentile, precipitation is expected to increase by 19.35% from the historical period (1986-1999).
0.0 0.2 0.4 0.6 0.8
0.88
0.90
0.92
0.94
0.96
0.98
1.00
x
F(x)
PRCP_001Simulated Historical
0.0 0.1 0.2 0.3 0.4 0.5 0.6 0.7
0.88
0.90
0.92
0.94
0.96
0.98
1.00
x
F(x)
PRCP_001Simulated Future
1986-1999 2011-2024
0.2300” 0.2745”
RECLAMATION

Climate Conditioned Weather Sequences
Future PeriodQ1 Q2 Q3 Q4 Q5
2011‐2024 {…} {…} {…} {…} {…}2025‐2038 {…} {…} {…} {…} {…}2039‐2052 {…} {…} {…} {…} {…}2053‐2066 {…} {…} {…} {…} {…}2067‐2080 {…} {…} {…} {…} {…}2081‐2099 {…} {…} {…} {…} {…}
Climate Scenario
• For example, the cell entry {…} corresponding to future period 2011-2024, and climate scenario Q1 (enhanced precipitation magnitude with hotter temperature) represents precipitation for 5113 days (e.g., Excel® formula, =DATE(2024,12,31)-DATE(2011,1,1)).
• Disaggregate daily precipitation based on historical hourly precipitation proportions.
• Complete 89-year sequence of daily (hence hourly) precipitation, for climate scenario Q1, the six future time-series will be concatenated into a single time-series that will represent this climate scenario.
• Repeat for other scenarios. RECLAMATION
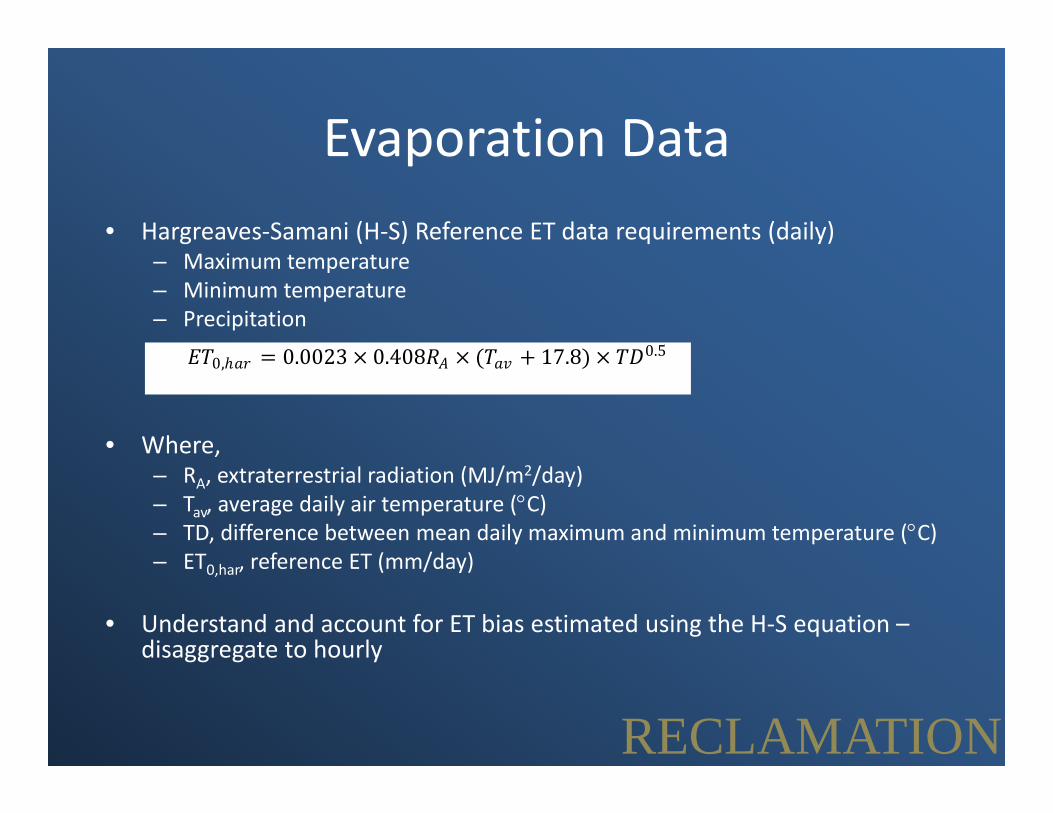
Evaporation Data• Hargreaves‐Samani (H‐S) Reference ET data requirements (daily)
– Maximum temperature– Minimum temperature– Precipitation
• Where,– RA, extraterrestrial radiation (MJ/m2/day)– Tav, average daily air temperature (C)– TD, difference between mean daily maximum and minimum temperature (C)– ET0,har, reference ET (mm/day)
• Understand and account for ET bias estimated using the H‐S equation –disaggregate to hourly
0, 0.0023 0.408 17.8 0.5
RECLAMATION

Deliverables• Input datasets for the WMMS. This will consist of,
– five future climate scenarios Q1‐Q5 for CMIP‐3 and five for CMIP‐5
– each consisting of 89‐years of hourly precipitation and evaporation for precipitation gauge locations and evaporation sites across the Study Area.
• Precipitation frequency analysis for each of the precipitation gauge locations for each of the five climate scenarios (Q1‐Q5) using the GEV‐1 model to estimate the precipitation depth/intensity corresponding to 24‐hr duration and 50‐year return period under a changing climate.
RECLAMATION

Climate Change Questions?
RECLAMATIONManaging Water in the West

Watershed ManagementModeling System
Watershed ManagementModeling System

WMMS Overview
• Model Target Area
• Conservation System
• Weather Data
• WMMS Program
• Model Output
• General Model Accuracy
Bureau of Reclamation, LACFCD, LACDPW – Watershed Management Modeling System Overview
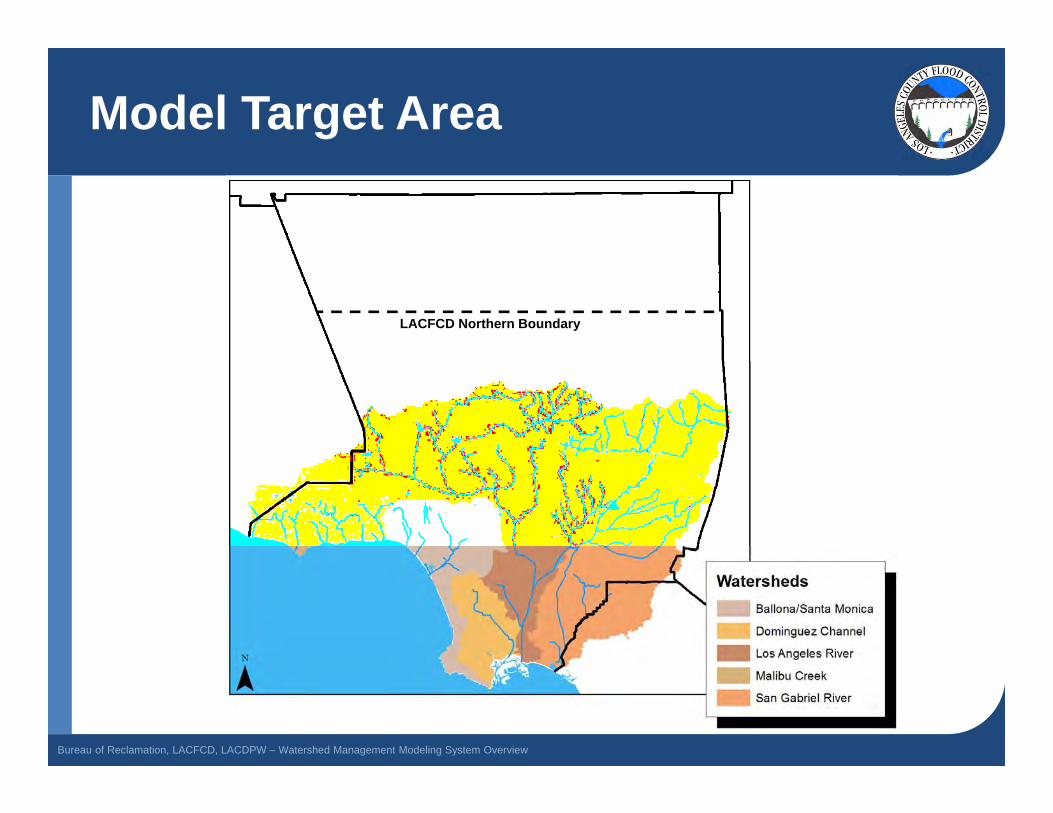
Model Target Area
Bureau of Reclamation, LACFCD, LACDPW – Watershed Management Modeling System Overview
LACFCD Northern Boundary
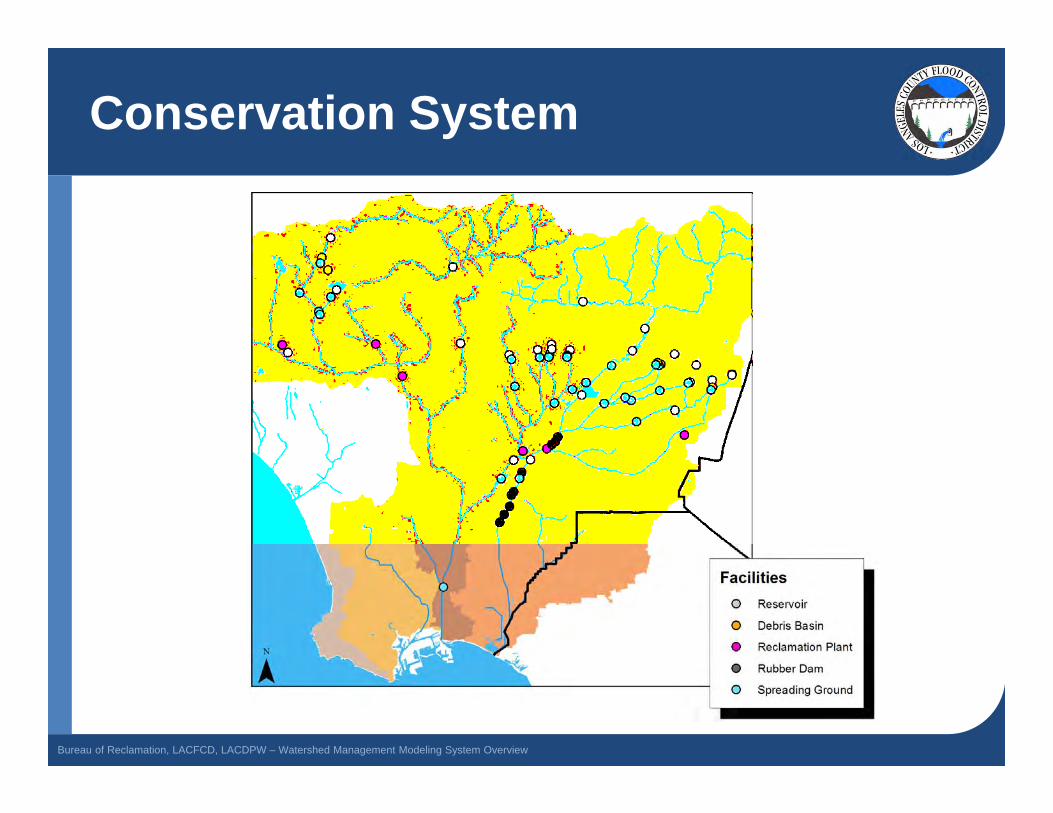
Conservation System
Bureau of Reclamation, LACFCD, LACDPW – Watershed Management Modeling System Overview

Weather Data
Bureau of Reclamation, LACFCD, LACDPW – Watershed Management Modeling System Overview
Weather Data
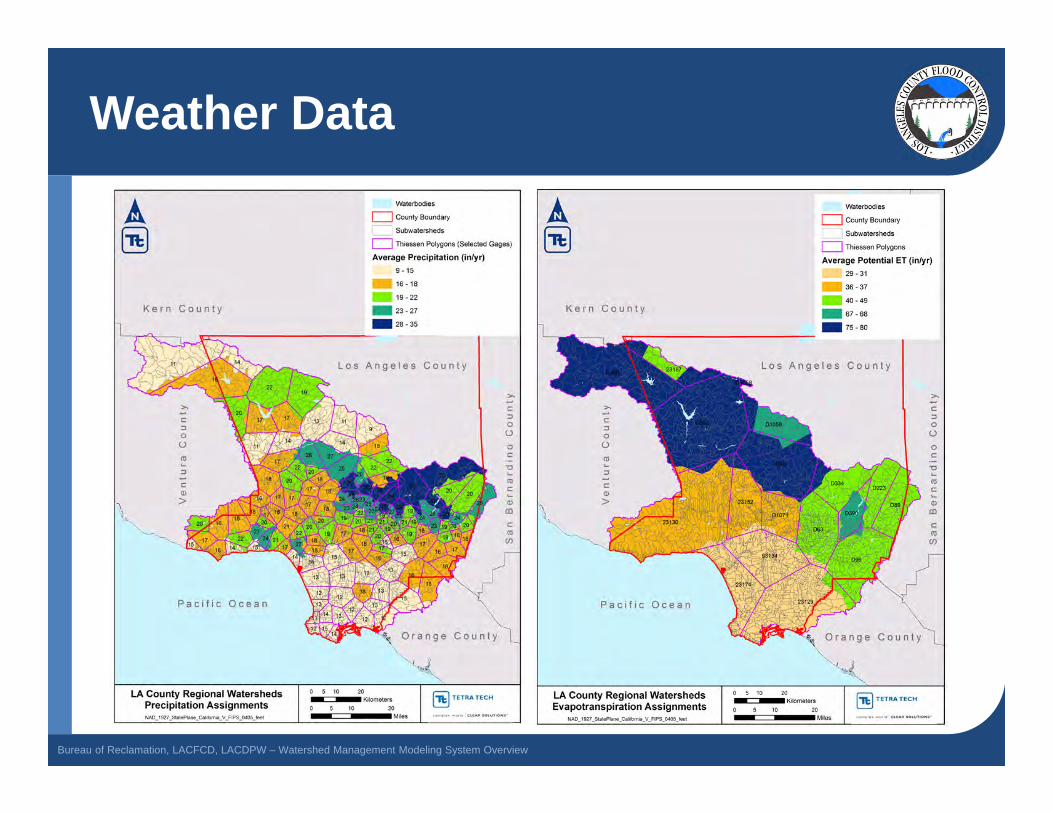
• LACDPW – Water Resource Division Gauges
• California Climate Data Archive
Precipitation & Evaporation Records (1986-2012)
Bureau of Reclamation, LACFCD, LACDPW – Watershed Management Modeling System Overview
Weather Data
Bureau of Reclamation, LACFCD, LACDPW – Watershed Management Modeling System Overview
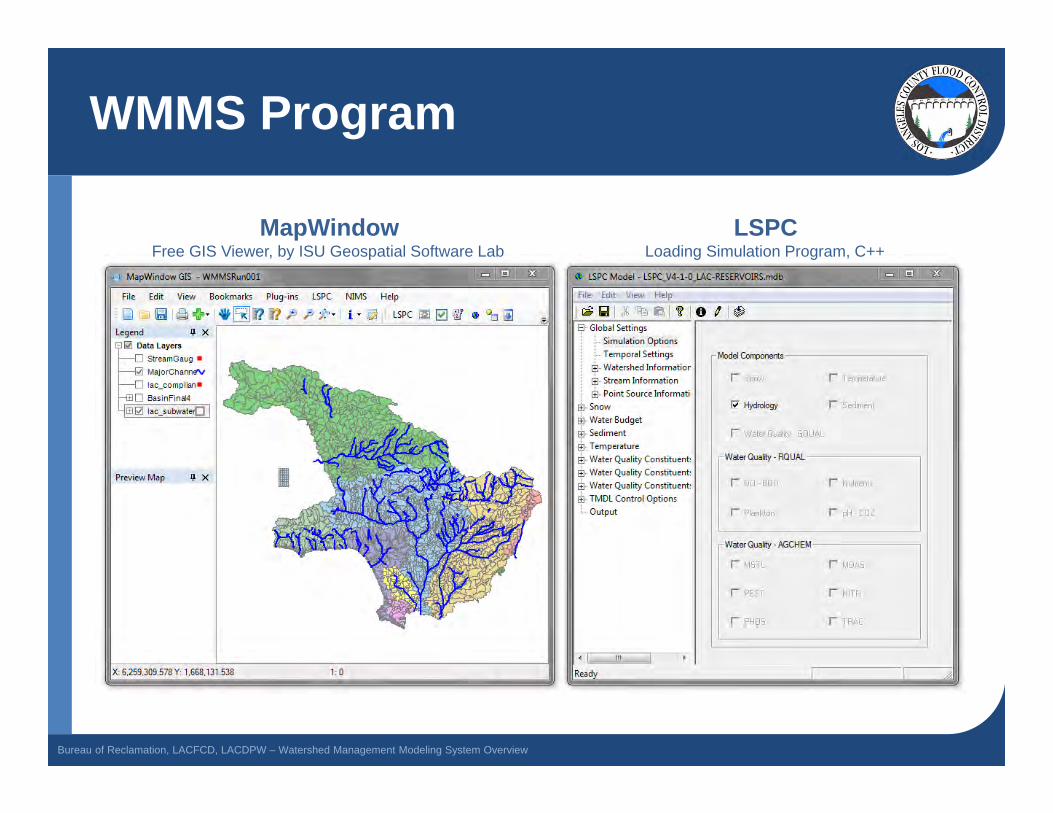
WMMS Program
MapWindow LSPCLoading Simulation Program, C++Free GIS Viewer, by ISU Geospatial Software Lab
Bureau of Reclamation, LACFCD, LACDPW – Watershed Management Modeling System Overview
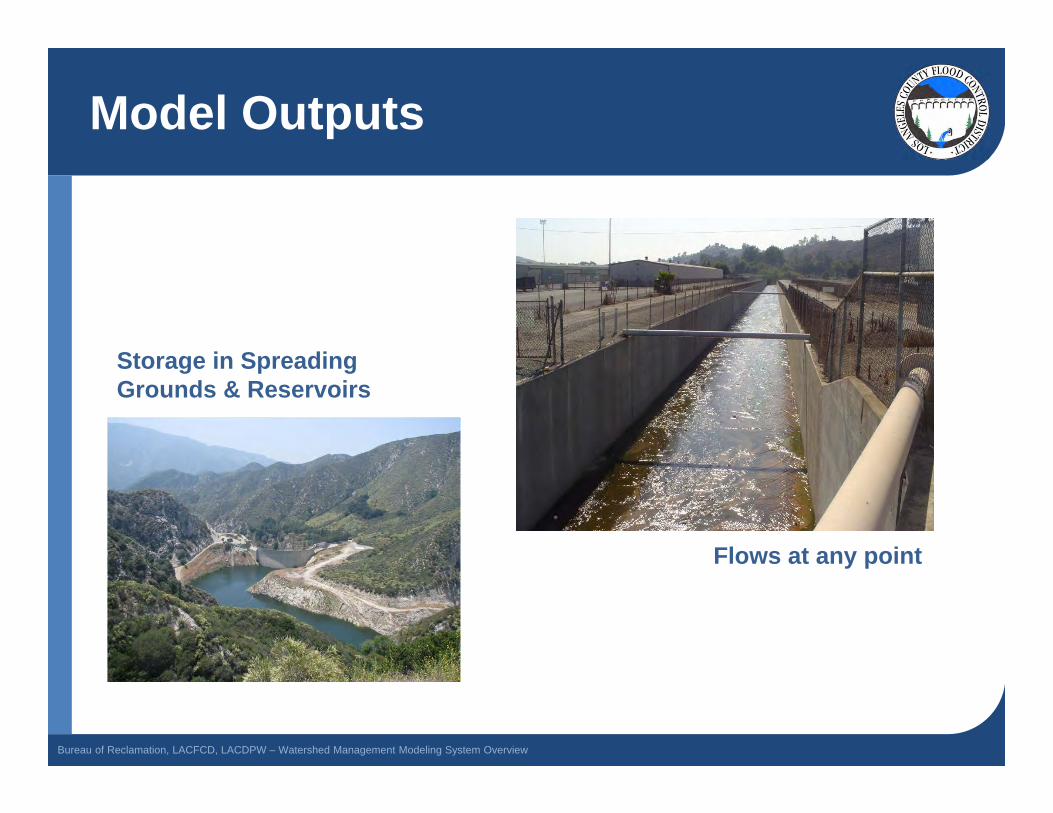
Model Outputs
Bureau of Reclamation, LACFCD, LACDPW – Watershed Management Modeling System Overview
Flows at any point
Storage in SpreadingGrounds & Reservoirs

Model Accuracy
Bureau of Reclamation, LACFCD, LACDPW – Watershed Management Modeling System Overview
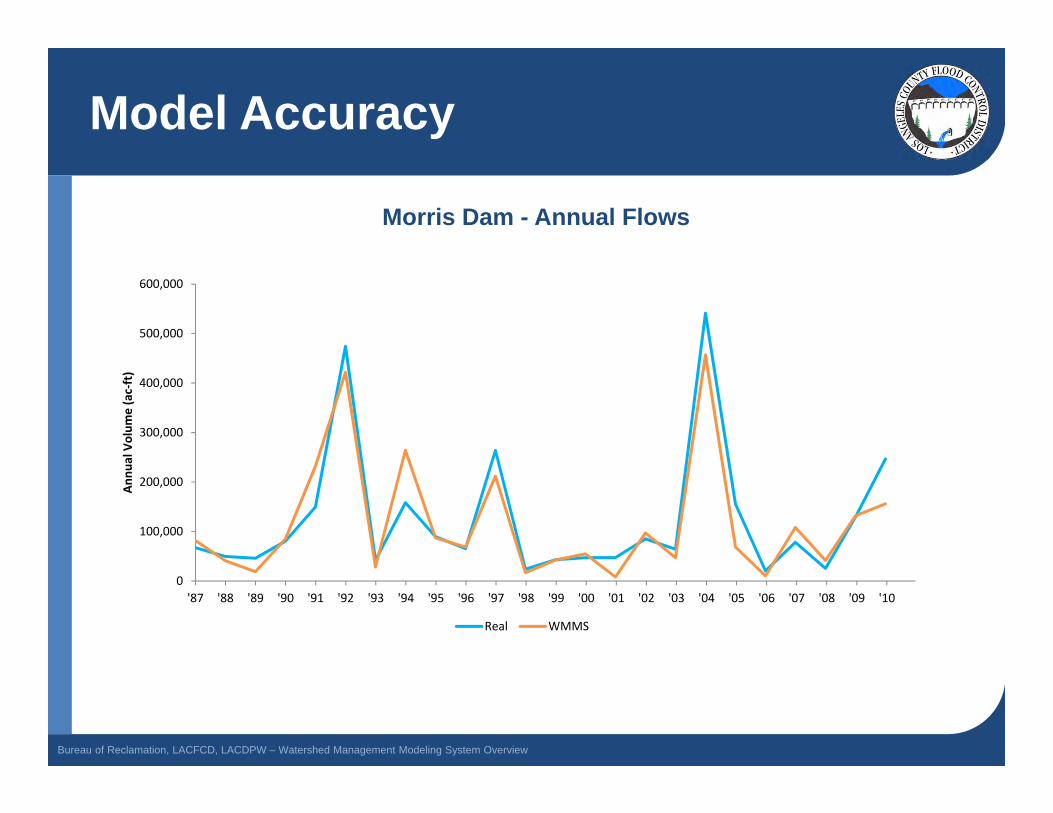
Model Accuracy
0
100,000
200,000
300,000
400,000
500,000
600,000
'87 '88 '89 '90 '91 '92 '93 '94 '95 '96 '97 '98 '99 '00 '01 '02 '03 '04 '05 '06 '07 '08 '09 '10
Annu
al Volum
e (ac‐ft)
Real WMMS
Bureau of Reclamation, LACFCD, LACDPW – Watershed Management Modeling System Overview
Morris Dam - Annual Flows
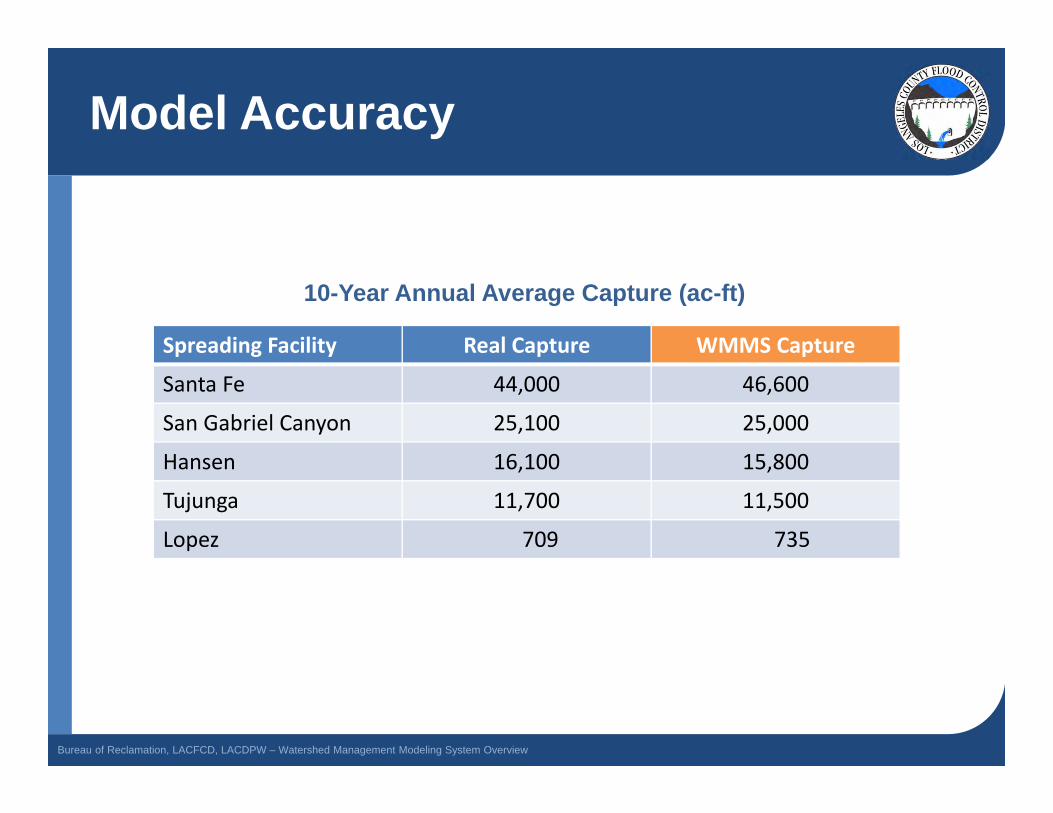
Model Accuracy
Bureau of Reclamation, LACFCD, LACDPW – Watershed Management Modeling System Overview
Spreading Facility Real Capture WMMS Capture
Santa Fe 44,000 46,600
San Gabriel Canyon 25,100 25,000
Hansen 16,100 15,800
Tujunga 11,700 11,500
Lopez 709 735
10-Year Annual Average Capture (ac-ft)

WMMS Download
Bureau of Reclamation, LACFCD, LACDPW – Watershed Management Modeling System Overview
http://dpw.lacounty.gov/wmd/wmms/

WMMS Q&A
Bureau of Reclamation, LACFCD, LACDPW – Watershed Management Modeling System Overview
Hydrologic ModelingQuestions?
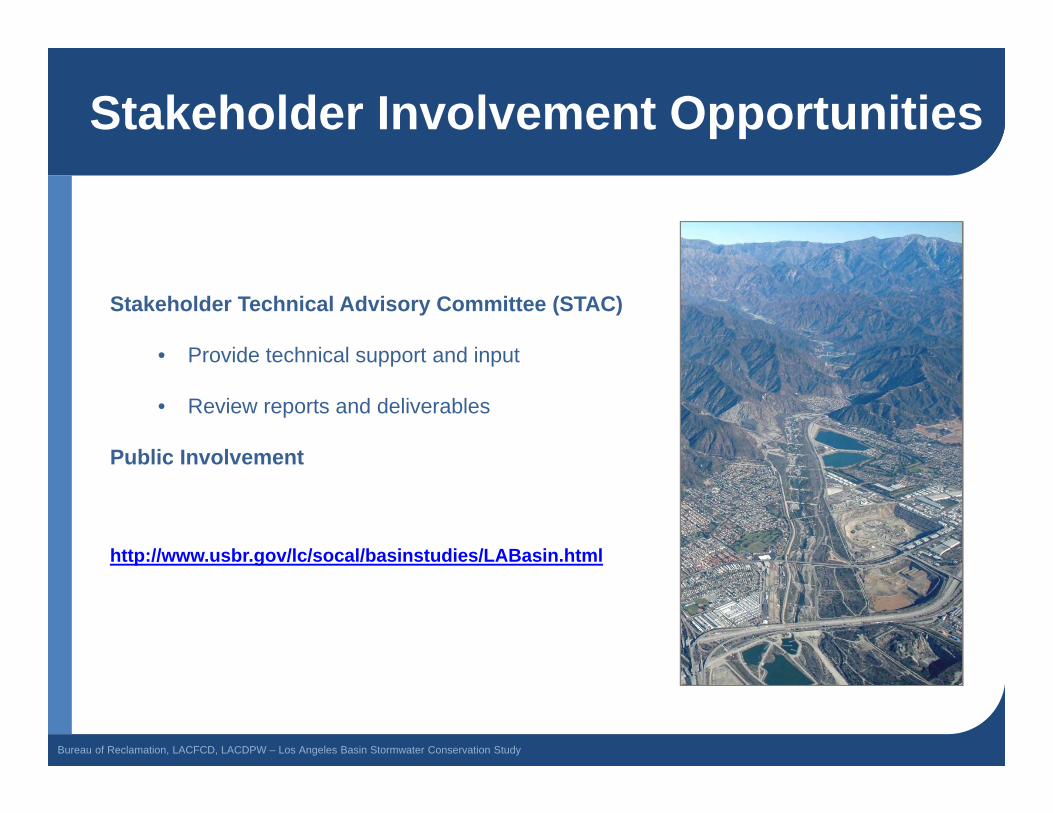
Stakeholder Involvement Opportunities
Bureau of Reclamation, LACFCD, LACDPW – Los Angeles Basin Stormwater Conservation Study
Stakeholder Technical Advisory Committee (STAC)
• Provide technical support and input
• Review reports and deliverables
Public Involvement
http://www.usbr.gov/lc/socal/basinstudies/LABasin.html

Next Steps
Bureau of Reclamation, LACFCD, LACDPW – Los Angeles Basin Stormwater Conservation Study
Perform Task 3
• Run Climate & Hydrologic Models
• Analyze runoff output data
STAC Meeting – Late Summer 2013
• Review Draft Task 3 Report
• Task 4 Scoping
Public Meeting – Fall 2013
Next Tasks
• Task 2 – Water Supply & Demand Projections
• Task 4 – Existing Infrastructure Response & Operations Plans Analysis
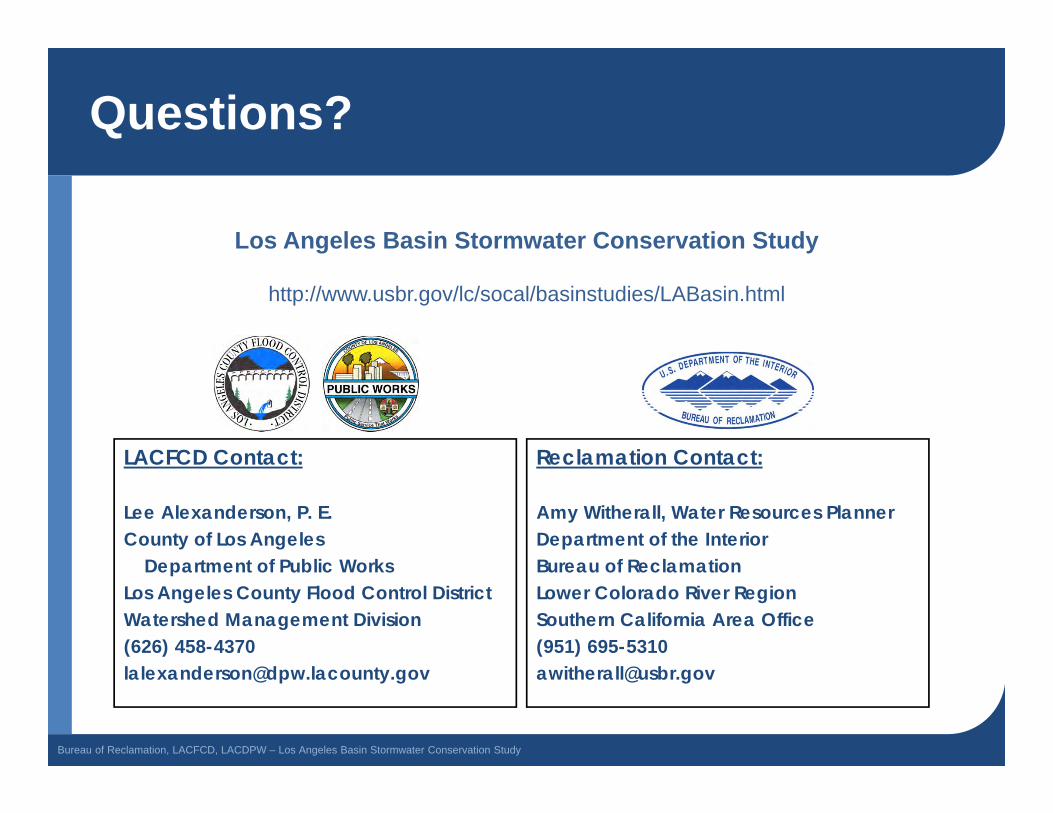
Questions?
Bureau of Reclamation, LACFCD, LACDPW – Los Angeles Basin Stormwater Conservation Study
Los Angeles Basin Stormwater Conservation Study
http://www.usbr.gov/lc/socal/basinstudies/LABasin.html
LACFCD Contact:
Lee Alexanderson, P. E.County of Los Angeles
Department of Public WorksLos Angeles County Flood Control DistrictWatershed Management Division(626) [email protected]
Reclamation Contact:
Amy Witherall, Water Resources PlannerDepartment of the InteriorBureau of ReclamationLower Colorado River RegionSouthern California Area Office(951) [email protected]