Embed Size (px)
Citation preview

1
Loss Rates from Lake Powell and Their Impact on management of the Colorado River 1
Tom Myers1 2
3
ABSTRACT: As demand for water in the southwestern United States increases and climate change 4
potentially decreases the natural flows in the Colorado River system, there will be increased need to 5
optimize the water supply. Lake Powell is a large reservoir with potentially high loss rates to bank 6
storage and evaporation. Bank storage is estimated as a residual in the reservoir water balance. Estimates 7
of local inflow contribute uncertainty to estimates of bank storage. Regression analyses of local inflow 8
with gaged tributaries have improved the estimate of local inflow. Using a stochastic estimate of local 9
inflow based on the standard error of the regression estimator and of gross evaporation based on observed 10
variability at Lake Mead, a reservoir water balance was used to estimate that more than 14.8 billion cubic 11
meters has been stored in the banks, with a 90 percent probability that the value is actually between 11.8 12
and 18.5 billion cubic meters. Groundwater models developed by others, observed groundwater levels, 13
and simple transmissivity calculations confirm these bank storage estimates. Assuming a constant bank 14
storage fraction for simulations of the future may cause managers to underestimate the actual losses from 15
the reservoir. Updated management regimes which account more accurately for bank storage and 16
evaporation could save water that will otherwise be lost to the banks or evaporation. 17
KEYTERMS: Lake Powell, reservoir bank storage, surface water/groundwater interactions, water 18
conservation, water supply, reservoir operations simulations 19
INTRODUCTION 20
As demand for water in the southwestern United States increases and climate change potentially decreases 21
the inflow to the Colorado River system (Christensen and Lettenmaier, 2007; Barnett and Pierce, 2008; 22
1 Hydrologic Consultant, 6320 Walnut Creek Road, Reno NV 89523 (email: [email protected])

2
Barsugli et al., 2009; Miller and Piechota, 2011), the need to optimize the water supply will increase. The 23
Colorado River has 73.4 billion cubic meters (Gm3) of available storage in its ten largest reservoirs 24
(USBR, 2011), which is approximately four times the river’s average annual flow. The live storage in 25
those reservoirs on October 1, 2011, was 47.7 Gm3 (USBR, 2011), after the wettest runoff year in at least 26
15 years. The available storage space, 25.7 Gm3, is about one and a half years of long-term average 27
inflow, estimated to be 18.5 Gm3/y (USBR, 2007). Lake Powell, the second largest reservoir on the river, 28
has a maximum storage equal to 32.1 Gm3. As of August 2010 there was 22.3 Gm3 stored in the banks of 29
the reservoir according to an ongoing water balance 30
(http://www.usbr.gov/lc/region/g4000/NaturalFlow/documentation.html Accessed August 23, 2010). 31
The U.S. Bureau of Reclamation (USBR) manages the Colorado River and reservoirs according to a 32
complex system of laws, treaties, and agreements known as the Law of the River 33
(http://www.usbr.gov/lc/region/g1000/lawofrvr.html, accessed 9/6/2012). USBR simulates the Colorado 34
River system using the Colorado River Simulation System (CRSS: (USBR, 1986), which has been 35
incorporated in RIVERWARE software (Zagona et al., 2001). Assumptions used in CRSS, including 36
reservoir loss rates, affect the results of the simulations (USBR, 2007) and therefore potentially the 37
decision-making processes. The assumptions include loss rates from Lake Powell. 38
Lake Powell loses water from the river system in two ways – to evaporation from the free water surface 39
and bank seepage. Bank seepage is flow to the banks that does not return to the river system whereas bank 40
storage may return to the reservoir or river system. CRSS does not simulate seepage but rather assumes a 41
change in bank storage equal to 8 % of the monthly change in reservoir storage (Jerla, 2005), which 42
averages 0.53 Gm3/mnth. The simulation assumption does not account for USBR’s published values of 43
bank storage. No studies have been completed that demonstrate that water which seeps into the banks 44
actually returns to the reservoir to justify treating all of it as bank storage. The fact that the amount of 45
water stored in the banks approximates a year’s worth of river flow suggests that unaccounted for, the 46

3
bank storage is a large potential error in the simulations and a source of inaccuracy in the management of 47
the river system that is the source of water supply for about 30 million people in the southwestern U.S. 48
The objective of this paper is to improve the estimate of monthly and cumulative bank storage and 49
seepage on Lake Powell by improving the estimate of local inflow, which is ungaged and estimated as a 50
fraction of the difference in gages on the mainstem river as described below. Variability in the estimates 51
of bank storage is estimated using the stochastic properties of local inflow and evaporation. The paper 52
also discusses the differences in actual and simulated bank storage and makes recommendations for 53
utilizing this new information to make more accurate predictions for the management of the water 54
resources in Lake Powell. 55
HYDROLOGY OF LAKE POWELL AND THE UPPER COLORADO RIVER BASIN 56
Lake Powell lies near the downstream end of the upper basin of the Colorado River system which is 57
divided politically into upper and lower basins at Lee Ferry (Figure 1). The total area of the upper basin 58
is 293,200 square kilometers (km2), which is roughly split between the Rocky Mountains headwaters and 59
the Colorado Plateau (Fenneman, 1931). The Colorado River at Lees Ferry gaging station 0938000 60
(Figure 1 and Table 1), which lies about 25 kilometers (km) downstream from Glen Canyon Dam, 61
measures the flow from the upper to the lower basins. The flow at this gage has varied with time (Figure 62
2) with construction of Lake Powell causing the largest change to the flow from the Upper Basin. 63
The Colorado Plateau consists of nearly horizontal sedimentary strata deeply incised by major stream 64
systems and interrupted by north-south trending monoclines, structural domes and basins along with 65
widely scattered extrusive and intrusive igneous features (Blanchard, 1986). The Navajo Sandstone 66
forms the walls of Glen Canyon, and contains and transmits any bank storage and seepage. Thomas 67
(1986) found that the Navajo sandstone dips northward from the reservoir with a conductivity of about 68
0.4 meters per day (m/d). Jacoby et al. (1977) estimated that 10.4 Gm3 of water had been stored in the 69
banks between 1964 and 1976. Thomas (1986) developed a groundwater model which essentially 70

4
verified Jacoby et al.’s estimate of bank storage and indicated that much of the water in the banks would 71
not return to the reservoir. 72
Natural river flows are the flows that would have occurred without upstream human-induced consumptive 73
use (Prairie and Callejo, 2005). Natural flows at Lees Ferry from 1906 to 2007 averaged 18.5 Gm3 per 74
year (Gm3/y) and for 1963 through 2007 averaged 17.8 Gm3/y. Historic flows, the actual gaging station 75
flow measured at the Lees Ferry gage, averaged 14.8 Gm3/y for 1927 through 1962 and 11.9 Gm3/y for 76
1963 through 2007 (Figure 2). The difference between natural and historic flows is the USBR’s estimate 77
of consumptive use within the upper basin. The difference between the two periods includes the effect of 78
Lake Powell and any changes in the watershed condition. 79
Mainstem river inflow to Lake Powell is estimated as the sum of flow at three upstream gages and 80
outflow is the measured flow at the Lees Ferry gage downstream from the reservoir (Table 1 and Figure 81
1). Errors in the flow rates are primarily due to measurement error and normally distributed around zero 82
(Haan, 1977). Local inflow is ungaged inflow that enters the river or reservoir from the 51,400 km2 that 83
lies between the upper and lower gaging stations. Local inflow from this semiarid area includes 84
groundwater discharge, local runoff, and several perennial rivers. Groundwater inflow would be 85
relatively constant to the river or to the reservoir basin although development of the reservoir would 86
change the hydraulic gradient so that the discharge to the reservoir would be lessened or even reversed 87
(Blanchard 1986; Thomas 1986). Local runoff and stream inflow would continue unchanged due to the 88
reservoir except for a portion of the area covered by the reservoir. 89
USBR estimated local inflow for reservoir management as a fraction of the difference in average monthly 90
pre-dam flows measured at the three upstream and one downstream gaging station (Figure 3), similar to 91
Jacoby et al. (1977) (Rick Clayton, USBR Salt Lake City, personal communication, 11/29/2010). Both 92
methods estimate that 0.063 Gm3/mnth is the average for the 1927 through 1962 period, just prior to the 93
closure of the bypass tubes of Glen Canyon Dam in 1963, but the fractions differ by month (Figure 3). 94

5
Local inflow for the period before the reservoir began filling is a gain during all months but April and 95
May (Figure 3) when high flows are recharging the banks. The estimates do not vary among wet or dry 96
years or account for actual watershed conditions but do account for development in the basin in that the 97
estimates have been adjusted to represent natural flows. 98
6
99
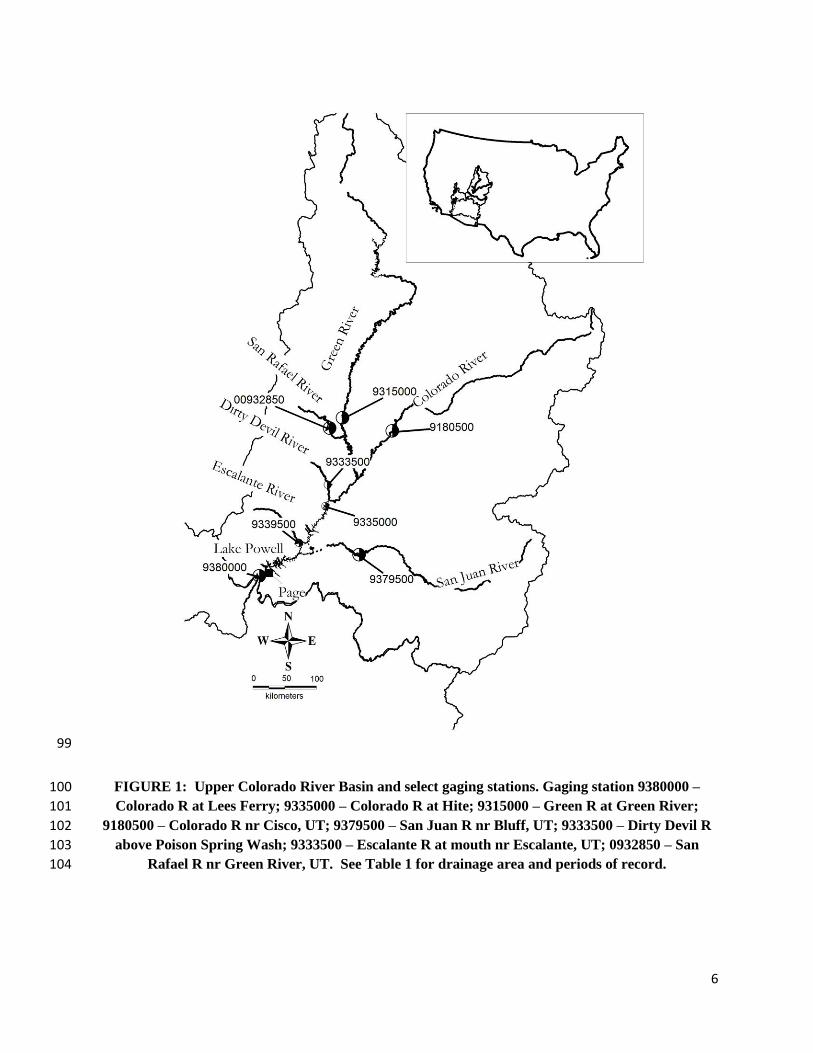
FIGURE 1: Upper Colorado River Basin and select gaging stations. Gaging station 9380000 – 100
Colorado R at Lees Ferry; 9335000 – Colorado R at Hite; 9315000 – Green R at Green River; 101
9180500 – Colorado R nr Cisco, UT; 9379500 – San Juan R nr Bluff, UT; 9333500 – Dirty Devil R 102
above Poison Spring Wash; 9333500 – Escalante R at mouth nr Escalante, UT; 0932850 – San 103
Rafael R nr Green River, UT. See Table 1 for drainage area and periods of record. 104

7
TABLE 1: United States Geological Survey gaging stations in the Upper Colorado River basin, 105 used for this analysis. See Figure 1 for the location of these stations within the basin. Data from 106 U.S. Geological Survey National Water Information System for Utah and Arizona 107 (http://waterdata.usgs.gov/ut/nwis/sw) and Arizona (http://waterdata.usgs.gov/az/nwis/sw/). 108
Gaging Station Name Gaging
Station
Number
Drainage Area
(sq km)1
Period of Record2 Avg
Annual
Flow
(Gm3/y)3
Month
Count
Colorado River nr Cisco,
UT
09180500 62,400 10/13 – present 6.43 1092
San Juan River nr Bluff,
UT
09379500 59,600 10/14 - present 2.00 1019
Green River at Green
River, UT
09315000 116,000 10/1894- present 5.42 1315
Sum of River Inflow
Gages
238,000 13.8
Colorado River nr Lees
Ferry, AZ
09380000 289,600 – 18.54
14.65
12.1 6
1227
Other Gages
Colorado River at Hite 09335000 198,000 8/47 – 9/58 12.0 134
Escalante River nr
Escalante
09337500 829 10/42 – 9/55, 12/71
- present
0.00957 610
Dirty Devil River above
Poison Creek nr
Hanksville
09333500 10,800 10/43-9/98; 6/2001
– present
0.0885 640
San Rafael nr Green
River, Utah
09328500 4260 10/09 – 9/18; 10/45-
present
0.118 876
1. Square kilometers
2 - The period of record may include periods without measurement, however the intent is to use
only gages with a mostly complete record.
3. Cubic meters per year
4. Lees Ferry gage natural flows as estimated by USBR for 1906 through 2007 (Prairie and
Callejos, 2005).
5. Actual Lees Ferry gage flows for 10/21 – 9/63
6. Actual Lees Ferry gage flows 10/63-9/2009
109
110

8
111
FIGURE 2: Historic annual flows on the Colorado River, by water year, below Lake Powell (CR at 112 Lees Ferry) and main river inflow to Lake Powell. See Table 1 for gaging station numbers and data 113 citation. 114
115
FIGURE 3: Local inflow, inflow, and outflow determined as the difference between inflow and flow 116 to the river reach between the upstream gages used as inflow to Lake Powell and the downstream 117
gage used as outflow from the river reach for the period of record 1927 through 1962. (Jacoby et al., 118 1977) 119

9
METHOD OF ANALYSIS 120
Reservoir Water Balance 121
Reservoir water balance may be described with equations 1 through 3. 122
(1) 123
(2) 124
(3) 125
Qi is major river inflow, Ql is local inflow, and P is precipitation on the reservoir surface. E is 126
evaporation from the reservoir surface and Qo is river outflow. Change in reservoir storage may be 127
estimated with stage/volume relationships (USBR, 1985, 2007). If all of the water balance factors are 128
estimated independently, bank storage is a residual that also accounts for errors in the estimation or 129
measurement of any of the factors. Accuracy in the bank storage estimates depends on the accuracy of 130
the estimation of the terms in equations 2 and 3. 131
The local inflow estimate may be the largest source of uncertainty in reservoir bank storage estimates. 132
Local inflow may depend less on the high elevation runoff from the Rocky Mountains than on local 133
factors which are not represented by the three upstream gages. Assuming that relations between local 134
gaging stations and the calculated local inflow are the same after 1963 as before, statistical analyses 135
including correlation and multiple linear regression were used to revise the estimate of local inflow used 136
as input to the reservoir water balance analysis. The multiple linear regression included indicator 137
variables to account for differences among months and the Durbin-Watson test of residuals used to test 138
whether significance depends on autocorrelation (Neter et al. 1985). 139
The residual of the reservoir water balance, calculated using historic flows with Equations 1 through 3, is 140
flow to the bank. Monte Carlo simulations with local inflow and net evaporation estimated as stochastic 141
variables were used to account for uncertainty. The estimated variables were assumed to be normally 142
distributed, using the polar method for estimating N(0,1) random variants (Law and Kelton, 1991). For 143

10
local inflow, the actual standard error from the regression was used for adjusting to actual inflow 144
estimates. The standard deviation for the monthly evaporation rate equaled 10 %, based on data presented 145
in Westenburg et al. (2006). Simulations continued until the moving average of all simulations fluctuated 146
within two percent of the deterministic value of bank storage, determined from the local inflow regression 147
and average evaporation. The upper and lower 90percent confidence bands were determined as the 148
simulation which yielded the final bank storage within five percent of the lowest and highest simulated 149
values. Multiple linear regression of bank storage with reservoir storage characteristics using the 150
deterministic bank storage values was used to consider the controls on the rate that bank storage 151
accumulates or seepage is lost. 152
RESULTS 153
Local Inflow Estimation 154
The correlation coefficient of historic local monthly inflow with the sum of the historic flow at the three 155
upstream gages, for the 1927 through 1962 period, is 0.230 and with the San Juan, Colorado River, and 156
Green River gages is 0.24, 0.22, and 0.23, respectively. This shows that the flow from above these 157
mainstream gages explains only a small amount of variation in local inflow. 158
Table 2 provides monthly and annual statistics for historic local inflow and other rivers that enter the river 159
within the area considered for local inflow (Figure 1). Monthly local inflows from 1927 to 1962 have 160
positive skew and the mean (0.063 Gm3/mnth) exceeds the median by 1.6 times. Local inflows have high 161
variability as indicated by the standard deviation being 2.2 times the mean and numerous negative values 162
due to the river recharging the banks. Accounting for local factors is essential for understanding the 163
variability of local inflow. 164
Three gaged perennial tributary rivers enter the Colorado River within the local inflow reach – the 165
Escalante, Dirty Devil, and San Rafael (Table 1, Figure 1). Their total average annual flow is about 0.216 166

11
Gm3/y for years with coinciding periods of record meaning they account for more than a third of the 167
average local inflow, leaving almost two-thirds unaccounted for (Figure 4 and Table 2). Measured flows 168
from these rivers and the computed local inflow have decreased over the period of record (Figure 4), with 169
decreases for local inflow, San Rafael River, Dirty Devil River, and the Escalante River equaling 1.19, 170
0.905, 0.00937, and 0.00395 million cubic meters per year (Mm3/y), respectively. The cause of the 171
decrease could be development, of which there has been little, or long-term flow changes, as in the 172
Colorado River watershed (Woodhouse et al., 2006; Brekke et al., 2007; Meko et al. 2007). 173
174
FIGURE 4: Water year flow at gaging stations on three Lake Powell tributaries (Escalante River 175 near Escalante, Dirty Devil River above Poison Creek, and San Rafael River near Green River) for 176 their period of record through 2010, and local inflow to the Lake Powell reach from 1927-1962. 177 See Tables 1 and 2 for gaging station numbers, data citations, and flow statistics and Figure 1 for 178 location. 179
Computed local inflow can be negative whereas measured tributary flow is positive. The highest local 180
inflow months correspond with the highest tributary flows on the Escalante and San Rafael Rivers, but 181
not the Dirty Devil (Table 2). The Escalante and San Rafael Rivers have much higher elevation 182
headwaters with snowmelt controlled flow. The Dirty Devil River flows more in response to the 183

12
rainfall/runoff regime, so high flows can occur during any month, but least frequently during summer due 184
to small areal storm coverage. The months May through August were most variable, as shown by the 185
standard deviation of the monthly flows, with the exception of October on the Dirty Devil River (Table 186
2). 187
TABLE 2: Average monthly, average annual flow, and monthly standard deviation at gaging 188 stations on three Lake Powell tributaries (Escalante River near Escalante, Dirty Devil River above 189 Poison Creek, and San Rafael River near Green River) for their period of record to 2010 and local 190 ungaged inflow to the Lake Powell reach from 1927 to 1962. Statistics for local tributaries based on 191 complete period of record (Table 1). Count is the number of months included in calculating the 192 statistics, and the effective count reflects the reduced information content in the mean based on lag 193 1 autocorrelation. 194
Month
Local
Ungaged
Inflow
(1927 – 62) Escalante
Dirty
Devil
San
Rafael
Average Flow (Million cubic meters per
month)
January 21.53 0.62 7.53 3.15
February 26.89 0.69 9.27 4.59
March 10.10 0.93 10.43 7.33
April -68.80 0.95 7.72 6.99
May -39.86 1.73 6.23 20.71
June 190.21 1.40 4.79 37.76
July 211.27 0.47 3.88 10.66
August 99.30 0.64 6.69 6.22
September 57.32 0.49 6.21 5.33
October 49.18 0.60 9.52 6.89
November 52.03 0.51 9.18 4.65
December 33.20 0.53 7.12 3.32
Annual
(Million
cubic meters
per year) 642.38 9.56 88.59 117.59
Standard Deviation
January 21.43 0.45 2.84 2.31
February 27.04 0.45 2.60 2.71
March 51.91 0.61 3.64 7.91
April 75.64 0.95 5.71 9.35
May 148.11 2.19 5.94 26.90

13
June 151.55 2.65 7.44 44.84
July 107.93 0.53 4.76 14.61
August 94.49 0.58 8.33 6.07
September 76.49 0.61 9.07 5.01
October 67.17 0.56 16.24 9.24
November 48.15 0.39 10.14 3.91
December 23.74 0.36 2.14 1.78
Autocorrelation of Monthly Flows
Lag 1 0.27 0.54 0.27 0.48
Lag 2 -0.04 0.24 0.08 0.15
Lag 3 -0.18 0.15 0.07 0.05
Lag 12 0.47 0.04 0.14 0.44
Count 427 610 640 876
Effective
count 245 183 370 309
195
The autocorrelation of monthly local inflow reflects how antecedent conditions can influence runoff, but 196
the differences of autocorrelation among local gaged sites reflects how small-scale events likely influence 197
runoff in the semiarid region contributing to local inflow (Table 2). The 12-month lag is tantamount to 198
year-to-year autocorrelation and is high for overall local inflows and the San Rafael River gage simply 199
because these represent larger drainage areas (Table 1). 200
Simple linear regression analyses between the monthly local inflow and the gaged tributary flows for their 201
common periods of record, yielded low coefficients; the highest coefficient of determination (R2) equals 202
0.16 for local inflow with San Rafael River flow and the other two are less than 0.01. Simple linear 203
regression of local inflow with the sum of the three tributary gages for the period of record that overlaps 204
all three tributary gages explained 27percent of the variance. Multiple regression of local inflow with the 205
three gages for the corresponding period from October 1948 through September 1955 during which all 206
gages have records resulted in the following regression (adjusted R2 (adj R2) = 0.25) 207
4) 208

14
Ql is local inflow, QEsc, QDD, and QSR is monthly flow (Mm3/mnth) at Escalante, Dirty Devil, and 209
San Rafael Rivers, respectively (Table 2). Only the coefficient for QSR was significant, with 210
p=5.7x10⁻⁶, which is reasonable because its drainage area represents more of the local inflow 211
area. Overall, the correlation and regression results reflect that many factors control local inflow 212
and that the gages measure flow from only a portion of the total tributary area. 213
Indicator variable regression (Neter et al., 1985) with QSR, with monthly indicators equaling 1 for 214
observations during that month and 0 otherwise, helps to control for differences in the average flow from 215
the tributary gage and the local inflow among months. This regression (not shown) showed there is a 216
substantial difference in flows among months, but it implicitly assumes the slope of the flow relation is 217
constant among months. The slope and intercept were 0.00293 and 19.5 Mm3/mnth, just slightly different 218
than equation 4, but the indicator variables for April, May, June, July, and August showed the flows 219
differed from the monthly average by -140., -94.6, 71.3, 156., and 52.7 Mm3/mnth (p = 1.21x10⁻⁵, 0.003, 220
0.032, 1.63x10⁻⁶, and 0.081, respectively). The adj R2 increased to 0.715. 221
To test whether the flow relation might differ by month, indicators for the four months which had 222
significant coefficients (p<0.05) were retained, and used to created an interaction term wherein the 223
indicator, 0 or 1, is multiplied by the flow for each month. The interaction term will account for how the 224
relationship varies among months. The resulting equation is 225
226 (5) 227
The adj R2 is 0.78, indicating that equation 5 explains a substantial amount of variance. The regression 228
coefficients for the monthly indicator variables reflect the difference in average local inflow by month. 229
The regression coefficient of the month and San Rafael River flow interaction terms is the amount that the 230
slope of the flow relationship for that month differs from the overall regression slope. The differing 231
relations by month reflect the snowmelt and beginning of the summer monsoon season. The Durbin-232

15
Watson statistic is 2.37 which indicate the residuals are not autocorrelated and the relationship may be 233
used for further analysis without adjustment (Neter et al. 1985). 234
With some exceptions, the local inflow predicted with this regression developed herein tends to be less 235
than the USBR estimate of local inflow (Figure 5). The slope is 1.13 which indicates the USBR estimate 236
is about 13 percent higher. Several high outliers occur for situations that regression prediction is higher 237
than the USBR estimate. In May 1984, high predicted local inflow causes a large residual because the 238
negative coefficient and high river flow caused the USBR to estimate -0.616 Gm3/mnth (Figure 5). 239
240
FIGURE 5: Relation of the U.S. Bureau of Reclamation estimated local inflow and the local inflow 241 based on equation 5. 242
Precipitation and Evaporation 243
Annual precipitation at Page, AZ (Figure 1), equals 16.4 cm/y (Western Regional Climate Center, 244
http://www.wrcc.dri.edu/cgi-bin/cliMAIN.pl?azpage, accessed 11/16/10)(Figure 6). The monthly 245
precipitation volume, equaling the average precipitation over the monthly reservoir areas, was used 246
directly in the water balance analysis. 247

16
USBR estimates monthly evaporation based on a net value of 121 cm /y distributed as shown in Figure 6 248
(Clayton, 2004, 2008). Net evaporation equals gross evaporation minus pre-reservoir evapotranspiration 249
(ET). Gross evaporation is 176 cm/y and pre-reservoir ET loss within the inundated reservoir area (at full 250
pool 664 km2) is 0.280 Gm3/y (Jacoby et al., 1977). Pre-reservoir ET loss included evaporation loss from 251
the hillside area (0.0784 Gm3/y), transpiration from the riparian vegetation, and evaporation from the 252
river surface. Jacoby et al. (1977) assumed that an average water surface area of 506 km2 for a two-thirds 253
full reservoir is representative of the long-term operations of the reservoir. At this area, the total gross 254
evaporation loss is 0.893 Gm3/y. Subtracting the 0.280 Gm3/y pre-reservoir losses from the gross 255
evaporation yields a net evaporation loss of 0.617 Gm3/y, which for a surface area of 506 km2 is 1.22 256
meters per year (m/y), the rate used for CRSS modeling (USBR, 2007). 257
258
FIGURE 6: Evaporation and precipitation rates for Lake Powell as simulated in the water balance. 259
Evaporation as simulated by USBR (2007, Appendix A) and precipitation for 1957 through 2005 260
(Western Regional Climate Center, http://www.wrcc.dri.edu/cgi-bin/cliMAIN.pl?azpage, accessed 261
11/30/10). 262
263

17
Reservoir Water Balance 264
As of September, 2009, the estimated deterministic cumulative bank storage is 15.0 Gm3 (Figure 7). 265
Considering stochasticity, the cumulative bank storage ranges from 11.9 to 18.8 Gm3 for the fifth through 266
ninety-fifth percentile estimate (Figure 7). The highest and lowest bank storage estimates of 125 traces 267
were 20.8 and 10.3 Gm3, respectively. 268
269
FIGURE 7: Deterministic and 5th and 95th percentile cumulative bank storage curves. 270
The deterministic cumulative bank storage first exceeded 14.8 Gm3 in June 1983. Since that time it has 271
fluctuated between 17.3 Gm3 and slightly less than 14.8 Gm3, the lowest value of which was 14.2 Gm3 in 272
April 2008, which also coincided with the lowest reservoir volume since its initial filling. From the peak 273
in June 1989, cumulative bank storage decreased slowly until February 1995, losing about 1.0 Gm3. 274
Reservoir levels then began to increase and the cumulative bank storage crested again in December 1997 275
and remained mostly constant for several years while the reservoir remained at higher levels. Cumulative 276

18
bank storage then began to decrease to its nadir in April 2008, losing about 2.47 Gm3 in ten years during a 277
long-term drought. 278
The fluctuations since 1984 suggest that cumulative bank storage decreases with the reservoir level 279
suggesting that water returns to the reservoir, but at a much lower rate than it had entered the banks 280
during filling. The following regression of bank and reservoir storage over the entire time period shows 281
that monthly bank storage is less when cumulative bank storage is higher and higher when the reservoir 282
storage is high. 283
284 (6) 285
Vb is bank storage, V is reservoir storage, Δ means “change in”, and Spring, Fall, and Summer are 286
indicator variables specifying the season. Adjusted R2 is 0.49 and all coefficients are highly significant 287
(p< 0.0016). The errors are not autocorrelated since the Durbin-Watson statistic is 1.73 (Neter et al. 288
1985). Bank storage is larger both during months with large changes in reservoir storage and/or a near full 289
reservoir, which reflects the hydraulic gradient for flow into the banks. Based on the sign and coefficients 290
for the seasonal indicator variables, the largest amount of water entering bank storage occurs in the 291
summer and water generally leaves the banks during the spring. Overall, the estimated bank storage 292
values are quite variable which reflects their calculation as a water balance residual that has all of the 293
uncertainty in the reservoir water balance relationship. 294
DISCUSSION 295
The deterministic bank storage estimate made herein is about two-thirds of the 2010 USBR estimate. 296
None of the Monte Carlo simulations predicted bank storage as high the USBR estimate. This estimate is 297
lower because estimated local inflow in the Lake Powell reach is less (Figure 5). The USBR estimate 298
depends on upriver flow which is not as predictive of local inflow as is gaged local tributary flow, which 299
has decreased with time, leading to a decrease in estimated total local inflow. The USBR also uses 300

19
natural flow estimates; therefore the bank storage includes error inherent in that estimate as part of its 301
bank storage estimate. Natural flows are higher than historical flows, therefore bank storage estimates 302
using natural flow are higher but include water that has been lost to consumptive use. 303
The deterministic bank storage accumulated since 1964 is almost equivalent to a year’s worth of inflow to 304
the reservoir. There are three apparent questions to consider about bank storage or seepage in Lake 305
Powell: (1) where does the water go?; (2) will it return to the reservoir as the reservoir lowers?; and (3) 306
how much more water will be stored in the banks? 307
Where does the water go? 308
The reservoir water seeps into the Navajo Sandstone and other sedimentary rocks around the reservoir. 309
When the reservoir is full, the total inundated river length is about 299 km with about 233 km along the 310
Colorado River and 66 km along the San Juan River portion of the reservoir, for a total river bank of 311
about 599 km. The unsaturated thickness from the original river level to an approximate average depth is 312
about 152 m at the dam (Thomas, 1986). The pre-reservoir groundwater level sloped up from the river to 313
a point where the groundwater level approximates the full reservoir elevation, about eight km from the 314
river at the dam (Blanchard, 1986). The volume of an unsaturated wedge in the sandstone surrounding 315
the reservoir is about 180 Gm3 accounting for the riverbed slope. If the sandstone porosity varies between 316
0.01 and 0.1 (Anderson and Woessner, 1992), the available bank storage is about 1.80 to 18.0 Gm3 below 317
the pre-reservoir groundwater level. 318
Groundwater flowing toward the river likely no longer reaches it due to backwater caused by the rising 319
reservoir because of backwater into the sediments above the reservoir level (Blanchard, 1986; Thomas, 320
1986), as seen in rising groundwater levels near the reservoir (Figures 8 and 9). Thomas’ (1986) 321
groundwater model simulations found that a long-term equilibrium would result in about 400 years with 322
half of the total bank storage having occurred by 1983. He projected that 36 and 57 percent of the second 323
half of the equilibrium storage would be reached within 50 and 100 years, respectively, although his 324

20
estimates do not account for fluctuation in the reservoir level. This suggests that another 14.8 Gm3 will 325
accumulate in the banks over the next 400 years. Because the groundwater levels near the reservoir have 326
already risen to the level of equilibrium storage, most of the future bank storage will be from groundwater 327
inflow. 328
Will the water return to the reservoir? 329
Water returns to the reservoir as the reservoir level lowers because the gradient reverses near the 330
reservoir, but the regression relations indicate the rate of return is much lower than for water flowing into 331
the banks. Because the sandstone dips downward to the north, water in the banks to the north may have 332
barriers to overcome to return to the reservoir or river system and some may flow past a point where 333
geology prevents its return. 334
Thomas (1986) indicated that the reservoir had not yet affected regional flow patterns in the sandstone, 335
but that “levels in wells within 1 mile of the lake shoreline indicate that the direction of ground-water 336
movement near the lake reverses following the seasonal fluctuations of the lake level” (Thomas, 1986, p. 337
16). His groundwater model showed that within 20 years, groundwater levels will have increased a 338
hundred m near the downstream end of the reservoir and more than 7 m, up to 40 km from the Colorado 339
River. However, the potentiometric surface would still slope toward the river, as found by Blanchard 340
(1986). Neither simulations nor observations suggest a groundwater divide has or will form to prevent 341
water from returning to the reservoir; a divide could form downgradient of the dam causing water to 342
return to the river far below the dam (Thomas, 1986). 343
344

21
345
FIGURE 8: Location of four monitoring wells near Lake Powell. All wells are northwest of the 346 dam within 10 kilometers of the reservoir. Site map upper right is the Upper Colorado River 347 region, see Figure 1. 348
349
FIGURE 9: Groundwater elevation at wells monitored near Lake Powell (see Figure 8). The full 350 lake level is 1128 meters above mean sea level. 351

22
How Much More Water Can Be Stored in the Bank of Lake Powell? 352
The answer depends on the combination of seepage and how groundwater inflow to the Colorado River 353
and inundated tributaries now backs up due to the reservoir level. If the bank storage was half full in 354
1983, then full storage is about 29.0 Gm3 and there is room for an additional 15 Gm3 over the next 400 355
years. Bank storage accumulates above the full pool elevation because groundwater flowing toward the 356
reservoir mounds up against the inflow to sandstone units from the reservoir as shown by groundwater 357
levels near the downstream end of the reservoir (Figure 9). 358
Effect of Simulating Reservoir Management Using a Constant Bank Storage Fraction 359
As noted, the USBR CRSS simulations of the operation of Lake Powell assume that bank storage is 8 360
percent of the change in reservoir storage. This effectively means that the USBR assumes the storage 361
which accumulates in the reservoir is 8 percent greater than the measured water volume increase. It also 362
assumes that water returns to the reservoir at the same rate as the reservoir volume lowers and ignores the 363
long-term storage. 364
The actual fraction that the monthly change in bank storage is of the monthly change in reservoir storage 365
varies substantially but the median negative and positive bank storage fraction has been -0.12 and 0.15 for 366
the entire time period (Figure 10).Since 1983, the median fraction has been 0.12, both positive and 367
negative, indicating more water than simulated both enters and leaves the reservoir bank storage. 368
Bank storage returns to the reservoir slowly as the reservoir volume decreases – much slower than the 369
water flowed to the banks while it was filling – because the reservoir levels generally decrease more 370
slowly than they increase. Since 1983, bank storage decreased at small rates for two periods; the first was 371
quickly made up as the reservoir filled in 1998 (Figure 7). Statistics and modeling indicate that the bank 372
storage will continue to increase if the reservoir returns to high levels. If the long-term trend is toward 373

23
low reservoir levels some of the bank storage may return, though some may be downstream from the 374
dam. If this were the case, CRSS may actually underestimate the long-term bank storage return. 375
376
FIGURE 10: Histogram of the fraction that change in bank storage by month is of change in 377
reservoir storage by month. The figure does not include higher or lower fractions which were 378
primarily occurred during periods with very small reservoir storage changes. 379
The USBR changed its long-term bank storage estimate effective January 1, 2012 (Katrina Grantz, USBR 380
Salt Lake City, personal communication, 2/1/2013). In its 24-month operations report issued 12/9/2011, 381
the USBR reported that bank storage at the end of November 2011 equaled 23.5 Gm3 but the next 382
month’s report, issued 1/12/2012, reported that bank storage equaled 6.6 Gm3 (Operation Plan for 383
Colorado River System Reservoirs (24-Month Study), http://www.usbr.gov/lc/region/g4000/24mo/, 384
accessed 8/8/2012). CRSS will continue to use the 8% of change in reservoir storage. The change has 385
not been documented in a formal study but was based on an assumption that bank storage would have 386
reached a maximum value when Lake Powell essentially filled for the first time on June 22, 1980 and that 387
the corresponding maximum bank storage would equal 7.4 Gm3 as determined based on reservoir 388
geometry and geologic properties estimated in two internal USBR reports issued in 1969 and 1971 389
(Katrina Grantz, USBR Salt Lake City, personal communication, 2/1/2013). Estimated bank storage in 390
this study for the end of June 1980 is 13.1 Gm3 so there is a clearly a difference in the estimates. 391

24
Effect of Simulating Net Evaporation 392
Assuming evaporation based on the difference between gross evaporation and the salvaged losses for a 393
particular reservoir storage amount biases the evaporation estimate. When the reservoir volume is low, 394
the surface area is low and the water considered salvaged by a full reservoir will actually still be lost in 395
the river channel and hillside areas not inundated. It is more accurate to estimate gross evaporation and 396
account for precipitation onto the water surface and proportional salvaged ET. Salvaged ET is the rate 397
determined for a full reservoir adjusted by the proportion of the reservoir area actually inundated. 398
The effect USBR’s assumptions would have on CRSS results depends on the average reservoir level. 399
During low reservoir stage, the assumption would underestimate the actual evaporation loss because use 400
of a net value assumes water is not lost that actually is lost. When the reservoir is near full, the method 401
may estimate a net value that is too high because the full pool may actually salvage more pre-reservoir 402
losses than assumed. In the future if the reservoir level remains low, the USBR assumption may allow 403
too little evaporation loss and allow the USBR to overpredict reservoir storage. 404
Local Inflow between Lake Powell and Lees Ferry 405
The only way to estimate inflow or outflow between Glen Canyon dam and the gage at Lees Ferry is to 406
determine the difference between the gage and the dam releases. USGS gage number 09379910, 407
Colorado River below Glen Canyon Dam, has operated intermittently just 1370 m downstream from the 408
dam, from October 1989 to March 1993 and from March 2000 to September 2002. The flow difference 409
between 1989 and 1993 averaged -0.397 cubic meters per second (cms) and between 2000 and 2002 410
averaged 3.43 cms. 411
Using flow measurements through the power plant since 2000, the USBR has estimated seepage between 412
the dam and Lees Ferry gage to be about 187.5 Mm3/y, which is about 5.95 cms (Rick Clayton, USBR 413
Salt Lake City, personal communication, 11/29/2010). Seepage to the river below the dam from the 414
25
Navajo sandstone below the dam began as early as 1983, after 20 years of reservoir filling, and continues 415
to this day (David Wegner, former Program Manager, Glen Canyon Environmental Studies, 8/6/11, 416
personal communication). 417
Water that enters the river between the dam and Lees Ferry is essentially returning bank storage that is 418
counted as part of the discharge from the system. The fact there is seepage into the river below the dam 419
indicates the estimated bank storage is a net value, with some of the water entering the reservoir returning 420
to the system. Seepage below the dam is accounted for at the Lees Ferry gage, therefore it should not 421
affect the water balance or the bank storage estimate unless seeps discharge below Lees Ferry, more than 422
25.6 km below the dam. 423
CONCLUSION 424
Lake Powell has lost or stored more than 14.8 Gm3 of water in its banks since the bypass tubes were 425
closed in 1963 according to the water balance presented above. Groundwater models completed by others 426
had predicted that amount and indicated that about that much more will flow into the banks within 400 427
years. The accumulating bank storage is not an error in the estimate of local inflow. 428
Water loss to the banks has lessened but has not yet reached steady state. Equilibrium may require as 429
much as 400 years, but much of the loss may actually be due to groundwater not reaching the reservoir 430
rather than to water flowing into the banks from the reservoir. Bank storage returns to the reservoir when 431
the reservoir is low but accumulates much faster when the reservoir fills. Keeping the reservoir lower or 432
even empty may salvage water lost to the banks, reduce evaporation, and possibly recover up to 14.8 Gm3 433
of water already stored there. Keeping the reservoir near empty, however, could affect other values 434
generated in the river, but these are beyond the scope of this paper. 435
Simulating the reservoir operations with a constant bank storage estimate that returns all of the water to 436
the reservoir fails to account for some system losses. Using the higher bank storage fraction determined 437

26
herein and also accounting for cumulative bank storage separately would provide superior estimates and 438
improve the reservoir management. 439
Bank storage relationships are not constant with time and factors not considered in the simple water 440
balance calculation affect the amount of water lost to and returning from the banks. A network of 441
monitoring wells and piezometers around the reservoir would improve the understanding and 442
management of bank storage. Because of differing transmissivity values, there may be levels at which 443
more water discharges into the banks. A detailed groundwater model of bank storage linked to the river 444
simulation models could help to integrate bank storage into surface water management. Detailed 445
monitoring and modeling could allow the USBR to optimize its reservoir storage with bank storage rather 446
than assuming that all water lost will return. 447
Local inflow and evaporation estimates have a large uncertainty. Installing gaging stations on as many 448
local tributaries as feasibleand updating the evaporation data so that year-to-year and seasonal variability 449
is better known would also improve the understanding of reservoir water losses. Both of these water 450
budget components could change with time due to a changing climate, a factor which increases the 451
importance of improving the data. Including the updated estimates in CRSS would change the 452
management of bank storage and evaporation which currently leads to an estimate of more water 453
availability, especially as the reservoir levels trend downward. The evaporation rate accounts for too 454
much salvage of pre-reservoir water loss; long-term downward trends in the reservoir level could result in 455
more predicted bank storage returning to the reservoir than is realistic. 456
ACKNOWLEDGEMENTS 457
The author thanks Rick Clayton, Dave Wegner, and Michael Kellett for helpful technical criticisms and 458
editing. He also thanks the Glen Canyon Institute for funding this research. 459

27
LITERATURE CITED 460
Anderson, M.A., and W.P. Woessner, 1992. Applied Groundwater Modeling: Simulation of Flow and 461
Advective Transport. Academic Press. 462
Barnett, T.P., and D.W. Pierce, 2008. When will Lake Mead go dry? Water Resources Research, Vol. 463
44, W03201, doi:10.1029/2007WR006704. 464
Barsugli, J.J., K.Nowak, B. Rajagopalan, J.R. Prairie, and B. Harding, 2009. Comment on “When will 465
Lake Mead go dry?” by T.P. Barnett and D.W. Pierce. Water Resources Research, Vol. 45, 466
W09601, 6p., 2009, doi:10.1029/2008WR007627. 467
Blanchard, P.J., 1986. Ground-water Conditions in the Lake Powell Area, Utah, Technical Publication 468
No. 84. State of Utah, Dept. of Natural Resources. 469
Brekke, L., B. Harding, T. Piechota, B. Udall, C. Woodhouse, and D. Yates (editors), 2007. Bureau of 470
Reclamation, Climate Technical Work Group, Review of Science and Methods for Incorporating 471
Climate Change Information into Reclamation’s Colorado River Basin Planning Studies, Final 472
Report. 473
Christensen, N. and D.P. Lettenmaier. 2007. A multimodel ensemble approach to assessment of climate 474
change impacts on the hydrology and water resources of the Colorado River basin. Hydrology 475
and Earth System Sciences 11: 1417-1434 476
Clayton, R., 2008. Reclamation Evaporation Methodology for Lake Powell. Unpublished Report. U.S. 477
Bureau of Reclamation, Upper Colorado Region, Salt Lake City, UT. 478
Clayton, R., 2004. Upper Colorado River Consumptive Use Determination at CRSS Natural Flow Node 479
Locations Calendar Years 1971-1995, Methodology Peer Review. U.S. Bureau of Reclamation, 480
Upper Colorado Region, Salt Lake City. 481
28
Fenneman, N.M., 1931. Physiography of the Western United States. McGraw-Hill, New York. 482
Haan, C.T., 1977. Statistical Methods in Hydrology. Iowa State, Ames, Iowa. 483
Jacoby, G.C., R.A. Nelson, S. Patch, and O.L. Anderson, 1977. Evaporation, Bank Storage, and Water 484
Budget at Lake Powell. U.S. Bureau of Reclamation 485
Jerla, C. 2005. An Analysis of Coordinated Operation of Lakes Powell and Mead Under Lower Reservoir 486
Conditions. M.S. Thesis, University of Colorado, Dept. of Civil, Environmental, and 487
Architectural Engineering. 488
Law, A.M., and W.D. Kelton, 1991. Simulation Modeling and Analysis, 2nd ed. McGraw-Hill, New 489
York. 490
Meko, D., C. A. Woodhouse, C. A. Baisan, T. Knight, J. J. Lukas, M. K. Hughes, and M. W. Salzer, 491
2007. Medieval drought in the upper Colorado River Basin, Geophysical Research Letters 34, 492
L10705, doi:10.1029/2007GL029988. 493
Miller, W. Paul and Thomas C. Piechota, 2011. Trends in Western U.S. Snowpack and Related Upper 494
Colorado River Basin Streamflow. Journal of the American Water Resources Association 495
47(6):1197–1210. DOI: 10.1111/j.1752-1688.2011.00565.x 496
Neter, J., W. Wasserman, and M.H. Kutner, 1985. Applied Linear Statistical Models, Regression, 497
Analysis of Variance, and Experimental Designs. Irwin, Homewood, IL. 1127 p. 498
Prairie, J., and R. Callejo, 2005. Natural Flow and Salt Computation Methods, Calendar Years 1971-499
1995. U.S. Bureau of Reclamation, Upper Colorado Regional Office and Lower Colorado 500
Regional Office, Salt Lake City, UT, and Boulder City, NV. 501

29
Thomas, B.E., 1986. Simulation analysis of water-level changes in the Navajo sandstone due to changes 502
in the Altitude of Lake Powell near Wahweap Bay, Utah and Arizona. U.S Geological Survey 503
Water-Resources Investigations Report 85-4207. Salt Lake City 504
USBR (U.S. Bureau of Reclamation), 2011. Draft Annual Operating Plan for Colorado River Reservoirs, 505
2012. U.S. Dept. of the Interior. 506
USBR (U.S. Bureau of Reclamation), 2007. Final Environmental Impact Statement: Colorado River 507
Interim Guidelines for Lower Basin Shortages and Coordinated Operations for Lake Powell and 508
Lake Mead. U.S. Dept of the Interior, Bureau of Reclamation, Upper and Lower Colorado 509
Regions. October 2007. 510
USBR (U.S. Bureau of Reclamation), 1986. Lake Powell Evaporation. U.S. Bureau of Reclamation, 511
Upper Colorado Region, Salt Lake City, UT. 512
USBR (U.S. Bureau of Reclamation), 1985. Colorado River Simulation System (CRSS): System 513
Overview, Denver, Colorado. 514
Westenburg, C.L., G.A. DeMeo, and D.J. Tanko, 2006. Evaporation from Lake Mead, Arizona and 515
Nevada, 1997-99. U.S. Geological Survey Scientific Investigations Report 2006-5252. 516
Woodhouse, C.A., S.T. Gray, and D.M. Meko, 2006. Updated Streamflow Reconstructions for the Upper 517
Colorado River Basin. Water Resources Research 42(5):1-6, doi: 10.1029/2005WR004455. 518
Zagona, E.A., T.J. Fulp, R. Shane, T. Magee, and H.M. Goranflo, 2001. RiverWare: A generalized tool 519
for complex reservoir system modeling. Journal of the American Water Resources Association 520
37(4):913-929 521
522


![[Baden Powell] Baden Powell. Songbook, Vol. 3 (Gui(Bookos.org)](https://img.pdfslide.net/doc/110x75/577cd5c61a28ab9e789b9a94/baden-powell-baden-powell-songbook-vol-3-guibookosorg.jpg)