Embed Size (px)
Citation preview
SPRING 2021
LOUISIANA TECH UNIVERSITY COLLEGE OF BUSINESS
CENTER FOR ECONOMIC RESEARCH
REAL REPORT REGIONAL ECONOMIC ANALYSIS OF LOUISIANA
2 | LOUISIANA TECH UNIVERSITY COLLEGE OF BUSINESS CENTER FOR ECONOMIC RESEARCH
Dean’s MessageThe Center for Economic Research housed in the College of Business at Louisiana Tech University has now
produced six issues of the Regional Economic Analysis of Louisiana (REAL) Report, an ongoing series of
publications designed to provide insight into recent economic developments in Louisiana.
The Spring 2021 issue continues to explore the economic impact of the global COVID-19 pandemic, with
specific focuses on economic forecasts for the state, employment losses and growth, and foreclosure rates.
The team also took a close look at the economic impact of Louisiana Tech’s newest residence facilities as well
as the impact of one Tech student on the local economy.
The REAL Report is produced by the Center for Economic Research, in collaboration with faculty and students
in Louisiana Tech University’s College of Business, for the state of Louisiana and our region of the South.
Business economics students from the College of Business specifically provide strong analytical and critical
thinking skills to a growing North Louisiana region. Undergraduate business economics majors, as they
progress through their degree program, not only learn economic intuition and modeling skills, but also data
science and statistics which makes them some of the most highly sought after graduates from the University.
This report is compiled by undergraduate business economics
majors in partial fulfillment of their Regional Economic Analysis class.
This report and all subsequent issues can be found on the College
of Business website at business.latech.edu/realreport. For more
information on the report or the Regional Economic Analysis class
(ECON 425), please contact Dr. Patrick Scott at [email protected].
Inquiries about specific sections of the report should be referred to
the author of each section, while media inquiries should be directed
As always, I hope this report is beneficial to your efforts.
Table of ContentsMeet the Team . . . . . . . . . . . . . . . . . . . . . . . . . . . . . . . . . . . . . . . . . . . . . . . . . . . . . . . . . . . . . . . . . . . . . . . . . . 3
Louisiana Economic Indicator Forecasts . . . . . . . . . . . . . . . . . . . . . . . . . . . . . . . . . . . . . . . . . . . . . . . . . . . 4
Job Losses and Growth: Examining Employment Shocks Across the State . . . . . . . . . . . . . . . . . . . . . 6
Foreclosure Rates in North Louisiana . . . . . . . . . . . . . . . . . . . . . . . . . . . . . . . . . . . . . . . . . . . . . . . . . . . . . . 8
To Tour or Not to Tour? Is That Even Really a Question? . . . . . . . . . . . . . . . . . . . . . . . . . . . . . . . . . . . . 10
New Residence Hall Construction on Tech Drive . . . . . . . . . . . . . . . . . . . . . . . . . . . . . . . . . . . . . . . . . . 12
Ever Loyal Be: The Economic Impact of One Louisiana Tech Student . . . . . . . . . . . . . . . . . . . . . . . . . 14
Sincerely,
CHRISTOPHER L . MARTIN, PH .D .Dean and Chase Endowed ProfessorCollege of BusinessLouisiana Tech University

REAL REPORT SPRING 2021 | 3
Meet the Team
Bailey Catoire is a senior finance major at Louisiana Tech University from Prairieville, LA. After acquiring his associate’s degree in high school, he spent his years at Tech studying and working as a Senior Residential Assistant. After finishing his bachelors, he plans to continue his studies at Louisiana Tech to acquire his MBA.
Contact Baily at [email protected]
Patrick Miller is a third-year business economics major at Louisiana Tech University from Mandeville, LA. Aside from economic research, Patrick is involved in the Student Government Association as a class senator, and is a member of Pi Kappa Phi Fraternity. He currently serves on the Review Board for the Economic Scholars Program with the Federal Reserve Bank of Dallas and plans to graduate in 2022.
Contact Patrick at [email protected].
Colyn Sevario is a third-year business economics student involved on campus in Student Government Association, Student Recruiters, and the Baptist Collegiate Ministry. Colyn plans to graduate with his undergraduate degree in the Winter of 2022. He is concurrently enrolled pursuing his master’s degree in business administration, which he will graduate with in the Summer of 2022.
Contact Colyn at [email protected].
Joshua Whitlow is a junior finance major from Converse, Louisiana. He has interests in economics, politics, and foreign culture. He plans to graduate in May 2022.
Contact Joshua at [email protected].
Dr. Patrick Scott is an assistant professor of economics and director of the Center For Economic Research. He teaches macroeconomics, monetary theory, and research methods at Louisiana Tech University. His research interests include optimal monetary policy models, dynamic general equilibrium models, time series forecasting, and Bayesian econometrics.
Contact Patrick at [email protected].
4 | LOUISIANA TECH UNIVERSITY COLLEGE OF BUSINESS CENTER FOR ECONOMIC RESEARCH
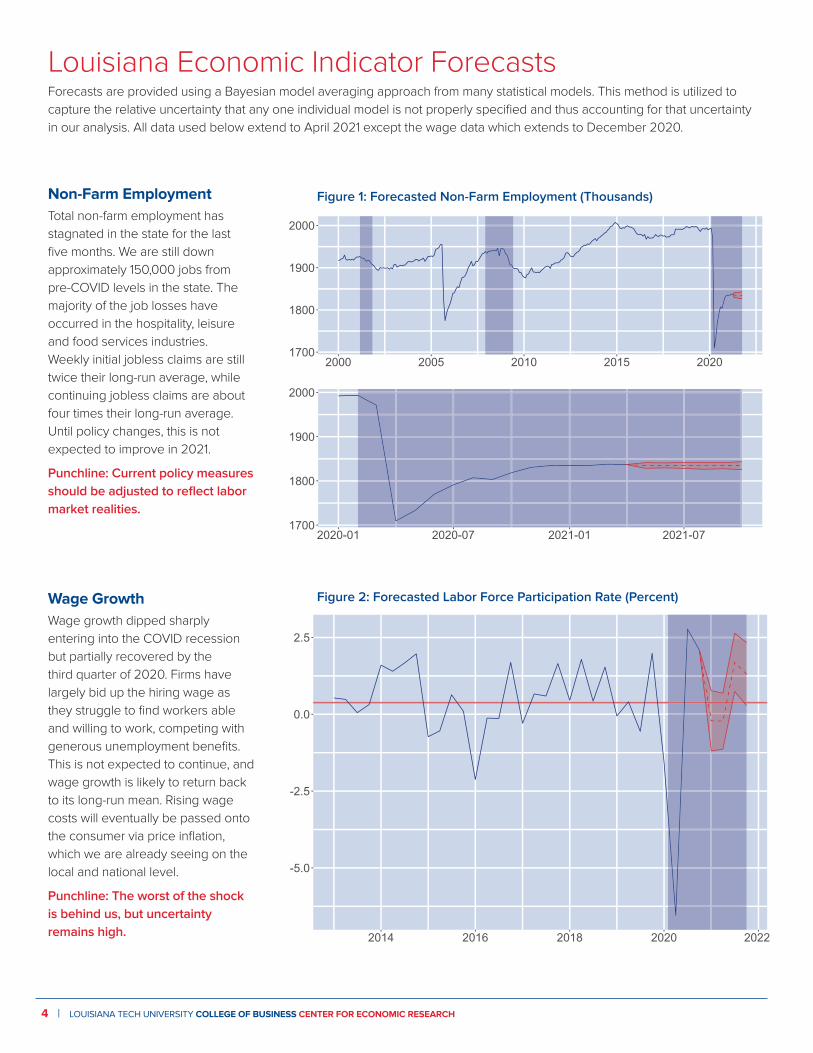
Non-Farm EmploymentTotal non-farm employment has stagnated in the state for the last five months. We are still down approximately 150,000 jobs from pre-COVID levels in the state. The majority of the job losses have occurred in the hospitality, leisure and food services industries. Weekly initial jobless claims are still twice their long-run average, while continuing jobless claims are about four times their long-run average. Until policy changes, this is not expected to improve in 2021.
Punchline: Current policy measures should be adjusted to reflect labor market realities.
Wage GrowthWage growth dipped sharply entering into the COVID recession but partially recovered by the third quarter of 2020. Firms have largely bid up the hiring wage as they struggle to find workers able and willing to work, competing with generous unemployment benefits. This is not expected to continue, and wage growth is likely to return back to its long-run mean. Rising wage costs will eventually be passed onto the consumer via price inflation, which we are already seeing on the local and national level.
Punchline: The worst of the shock is behind us, but uncertainty remains high.
Louisiana Economic Indicator ForecastsForecasts are provided using a Bayesian model averaging approach from many statistical models. This method is utilized to capture the relative uncertainty that any one individual model is not properly specified and thus accounting for that uncertainty in our analysis. All data used below extend to April 2021 except the wage data which extends to December 2020.
1700
1800
1900
2000
2000 2005 2010 2015 2020
1700
1800
1900
2000
2020-01 2020-07 2021-01 2021-07
-5.0
-2.5
0.0
2.5
2014 2016 2018 2020 2022
Figure 1: Forecasted Non-Farm Employment (Thousands)
Figure 2: Forecasted Labor Force Participation Rate (Percent)
REAL REPORT SPRING 2021 | 5
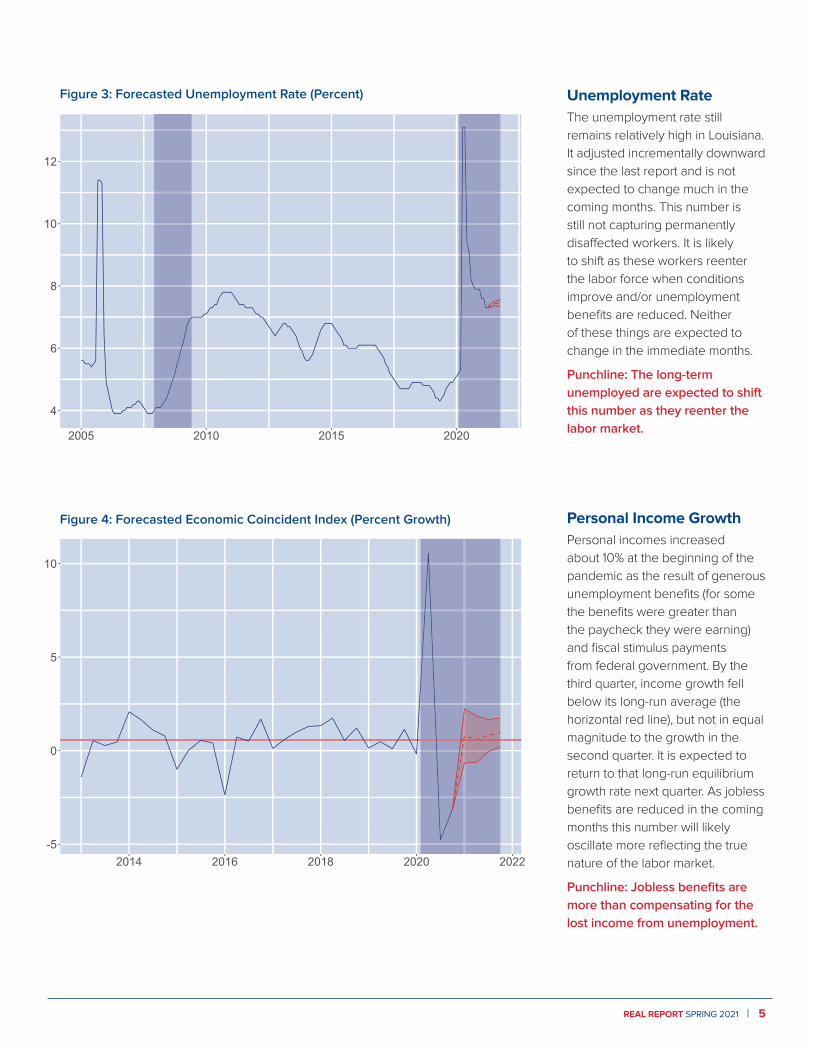
Unemployment Rate The unemployment rate still remains relatively high in Louisiana. It adjusted incrementally downward since the last report and is not expected to change much in the coming months. This number is still not capturing permanently disaffected workers. It is likely to shift as these workers reenter the labor force when conditions improve and/or unemployment benefits are reduced. Neither of these things are expected to change in the immediate months.
Punchline: The long-term unemployed are expected to shift this number as they reenter the labor market.
Personal Income GrowthPersonal incomes increased about 10% at the beginning of the pandemic as the result of generous unemployment benefits (for some the benefits were greater than the paycheck they were earning) and fiscal stimulus payments from federal government. By the third quarter, income growth fell below its long-run average (the horizontal red line), but not in equal magnitude to the growth in the second quarter. It is expected to return to that long-run equilibrium growth rate next quarter. As jobless benefits are reduced in the coming months this number will likely oscillate more reflecting the true nature of the labor market.
Punchline: Jobless benefits are more than compensating for the lost income from unemployment.
-5
0
5
10
2014 2016 2018 2020 2022
4
6
8
10
12
2005 2010 2015 2020
Figure 4: Forecasted Economic Coincident Index (Percent Growth)
Figure 3: Forecasted Unemployment Rate (Percent)
6 | LOUISIANA TECH UNIVERSITY COLLEGE OF BUSINESS CENTER FOR ECONOMIC RESEARCH
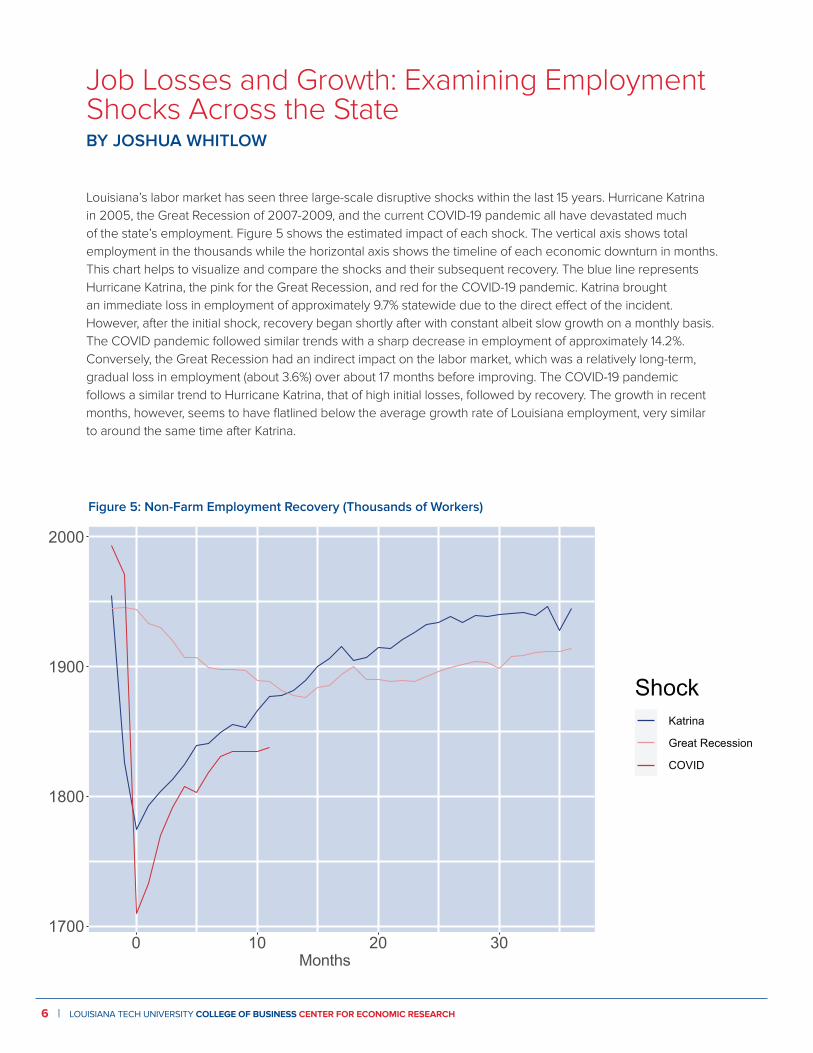
Louisiana’s labor market has seen three large-scale disruptive shocks within the last 15 years. Hurricane Katrina in 2005, the Great Recession of 2007-2009, and the current COVID-19 pandemic all have devastated much of the state’s employment. Figure 5 shows the estimated impact of each shock. The vertical axis shows total employment in the thousands while the horizontal axis shows the timeline of each economic downturn in months. This chart helps to visualize and compare the shocks and their subsequent recovery. The blue line represents Hurricane Katrina, the pink for the Great Recession, and red for the COVID-19 pandemic. Katrina brought an immediate loss in employment of approximately 9.7% statewide due to the direct effect of the incident. However, after the initial shock, recovery began shortly after with constant albeit slow growth on a monthly basis. The COVID pandemic followed similar trends with a sharp decrease in employment of approximately 14.2%. Conversely, the Great Recession had an indirect impact on the labor market, which was a relatively long-term, gradual loss in employment (about 3.6%) over about 17 months before improving. The COVID-19 pandemic follows a similar trend to Hurricane Katrina, that of high initial losses, followed by recovery. The growth in recent months, however, seems to have flatlined below the average growth rate of Louisiana employment, very similar to around the same time after Katrina.
Job Losses and Growth: Examining Employment Shocks Across the StateBY JOSHUA WHITLOW
1700
1800
1900
2000
0 10 20 30
ShockKatrina
Great Recession
COVID
1700
1800
1900
2000
0 10 20 30
ShockKatrina
Great Recession
COVID
Figure 5: Non-Farm Employment Recovery (Thousands of Workers)
Months
REAL REPORT SPRING 2021 | 7
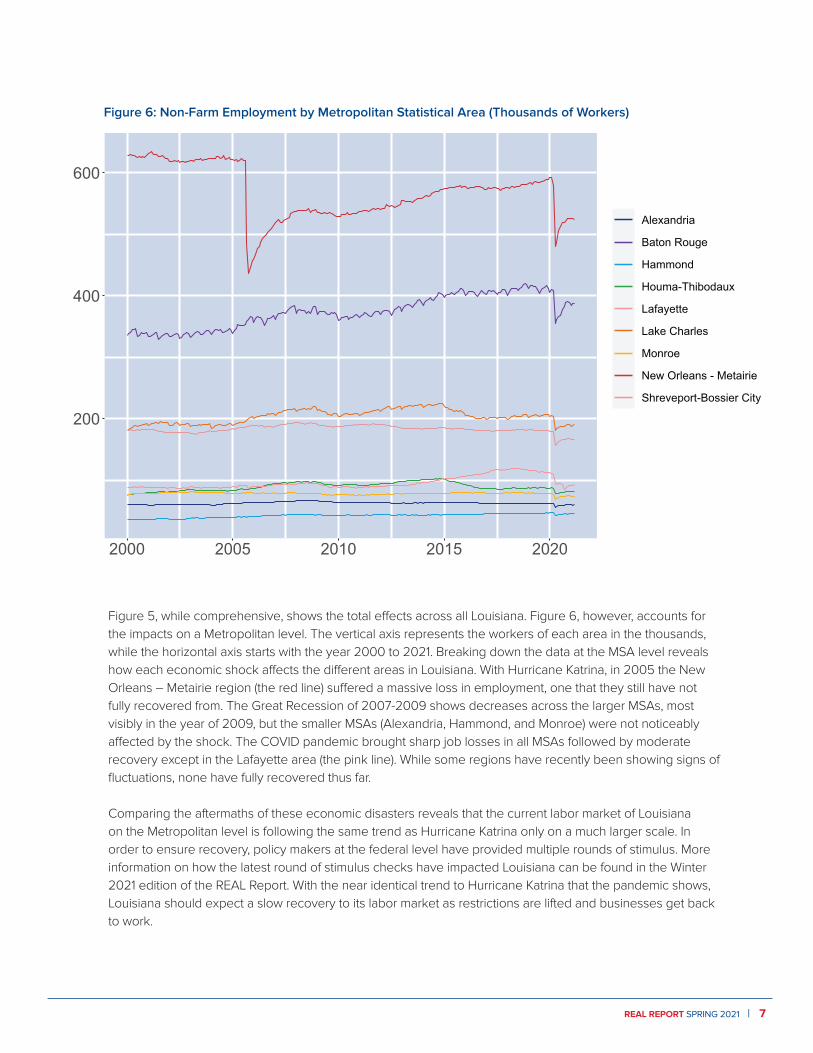
Figure 5, while comprehensive, shows the total effects across all Louisiana. Figure 6, however, accounts for the impacts on a Metropolitan level. The vertical axis represents the workers of each area in the thousands, while the horizontal axis starts with the year 2000 to 2021. Breaking down the data at the MSA level reveals how each economic shock affects the different areas in Louisiana. With Hurricane Katrina, in 2005 the New Orleans – Metairie region (the red line) suffered a massive loss in employment, one that they still have not fully recovered from. The Great Recession of 2007-2009 shows decreases across the larger MSAs, most visibly in the year of 2009, but the smaller MSAs (Alexandria, Hammond, and Monroe) were not noticeably affected by the shock. The COVID pandemic brought sharp job losses in all MSAs followed by moderate recovery except in the Lafayette area (the pink line). While some regions have recently been showing signs of fluctuations, none have fully recovered thus far.
Comparing the aftermaths of these economic disasters reveals that the current labor market of Louisiana on the Metropolitan level is following the same trend as Hurricane Katrina only on a much larger scale. In order to ensure recovery, policy makers at the federal level have provided multiple rounds of stimulus. More information on how the latest round of stimulus checks have impacted Louisiana can be found in the Winter 2021 edition of the REAL Report. With the near identical trend to Hurricane Katrina that the pandemic shows, Louisiana should expect a slow recovery to its labor market as restrictions are lifted and businesses get back to work.
200
400
600
2000 2005 2010 2015 2020
Alexandria
Baton Rouge
Hammond
Houma-Thibodaux
Lafayette
Lake Charles
Monroe
New Orleans - Metairie
Shreveport-Bossier City
200
400
600
2000 2005 2010 2015 2020
Alexandria
Baton Rouge
Hammond
Houma-Thibodaux
Lafayette
Lake Charles
Monroe
New Orleans - Metairie
Shreveport-Bossier City
Figure 6: Non-Farm Employment by Metropolitan Statistical Area (Thousands of Workers)
8 | LOUISIANA TECH UNIVERSITY COLLEGE OF BUSINESS CENTER FOR ECONOMIC RESEARCH
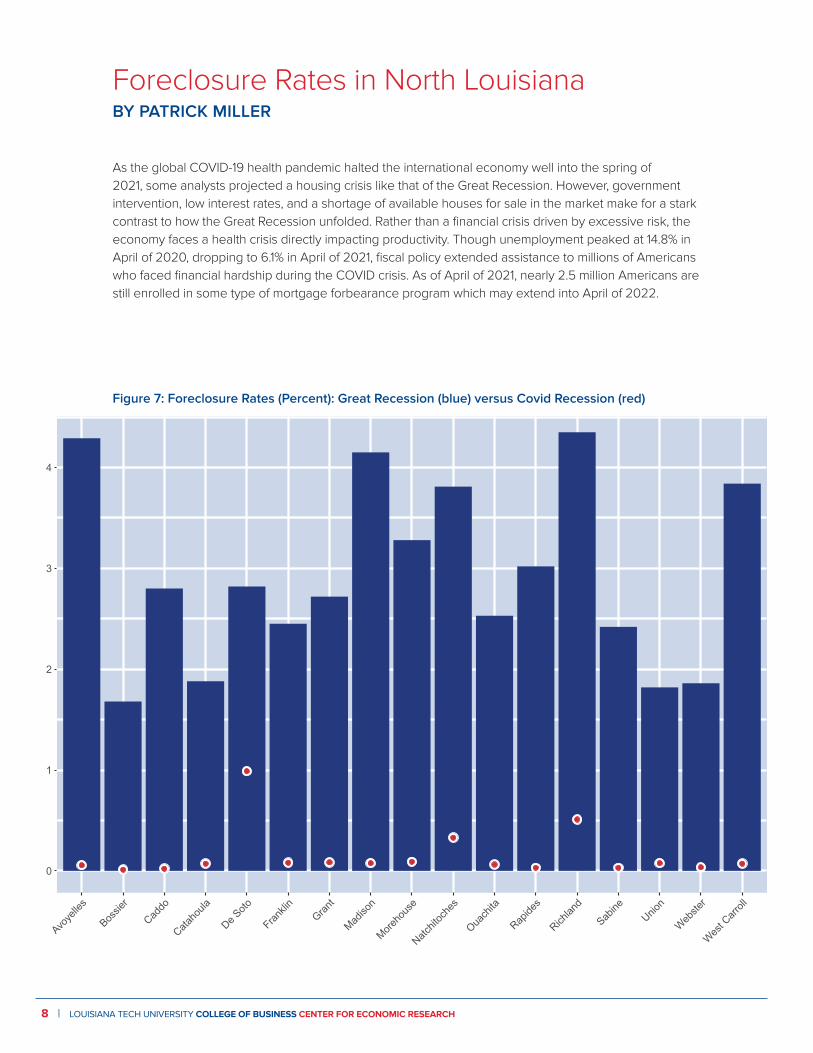
As the global COVID-19 health pandemic halted the international economy well into the spring of 2021, some analysts projected a housing crisis like that of the Great Recession. However, government intervention, low interest rates, and a shortage of available houses for sale in the market make for a stark contrast to how the Great Recession unfolded. Rather than a financial crisis driven by excessive risk, the economy faces a health crisis directly impacting productivity. Though unemployment peaked at 14.8% in April of 2020, dropping to 6.1% in April of 2021, fiscal policy extended assistance to millions of Americans who faced financial hardship during the COVID crisis. As of April of 2021, nearly 2.5 million Americans are still enrolled in some type of mortgage forbearance program which may extend into April of 2022.
Foreclosure Rates in North LouisianaBY PATRICK MILLER
0
1
2
3
4
Avoye
lles
Bossie
r
Caddo
Cataho
ula
De Soto
Frankli
nGran
t
Madiso
n
Moreho
use
Natchit
oche
s
Ouach
ita
Rapide
s
Richlan
d
Sabine
Union
Webste
r
West C
arroll
Figure 7: Foreclosure Rates (Percent): Great Recession (blue) versus Covid Recession (red)
REAL REPORT SPRING 2021 | 9
Foreclosure trends have continued to steadily rise since June of 2020 through April of 2021. Through information obtained from parish level sheriff sale data and public foreclosure websites, I estimate total net loss in terms of loans writ amount to be around $11.9 million so far during the COVID recession for North Louisiana. Figure 7 compares foreclosure rates during the Great Recession, to foreclosure rates amidst COVID. The blue columns represent foreclosures after a seven-year boom cycle of house buying. While the boom cycle of house buying is shorter here, the effects of the current crisis are muted by effective federal intervention aimed at keeping homeowners in their homes during the COVID health crisis. The blue bars in this graph represent four years of foreclosures. The red dots symbolize where each parish is at currently after one year. Despite effective federal intervention, in pocket areas foreclosures continue to rise. The full extent of the foreclosure crisis will only be evident when moratoriums are lifted in April of 2022.
Some parishes faired far worse than others with DeSoto Parish at 0.33% of total homes, or 36 foreclosures resulting in the highest parish level rate of foreclosures in North Louisiana as of March 29, 2021. DeSoto Parish lost an estimated $3.4 million in terms of writ amount lost (about 28% of the total for North Louisiana). Compared to neighboring parishes, DeSoto Parish’s foreclosure rates were higher, despite effective national forbearance programs. This indicates that DeSoto Parish’s foreclosure problem was not caused by COVID, but rather catalyzed by COVID. Foreclosures in DeSoto, Natchitoches, and Richland parishes continue to rise despite current policy attempts to keep people in their homes. Natchitoches Parish had a total of 17 foreclosures during the timeframe recorded. Moreover, an estimated $1.4 million was lost in terms of the amount of writ left on the loan. Richland Parish saw a total of 13 foreclosures totaling an estimated $1.9 in lost writ. The Shreveport-Bossier City MSA saw the most movement in terms of foreclosures with 45 homes totaling $4.9 million in lost writ. In the next year, it is expected that these number will continue to rise. By March of 2011, the Shreveport-Bossier metropolitan area saw 7.3% of total homes enter foreclosure since the beginning in August of 2008. Currently, foreclosures have been muted as a result of policy intervention since the beginning of COVID in late 2020. However, the current number of foreclosures, despite federal intervention, foreshadows a larger impact to the housing market to come.
Louisiana as a whole saw 0.009% of homes enter foreclosure during this time frame, which is higher than the neighboring states of Mississippi at 0.005% and Arkansas at 0.004% in terms of total homes foreclosed. The northern part of Louisiana specifically saw more movement than many southern Louisiana parishes excluding Saint Tammany Parish. While North Louisiana remains relatively more stable than South Louisiana in times of economic crisis, COVID-19 may change that.
10 | LOUISIANA TECH UNIVERSITY COLLEGE OF BUSINESS CENTER FOR ECONOMIC RESEARCH
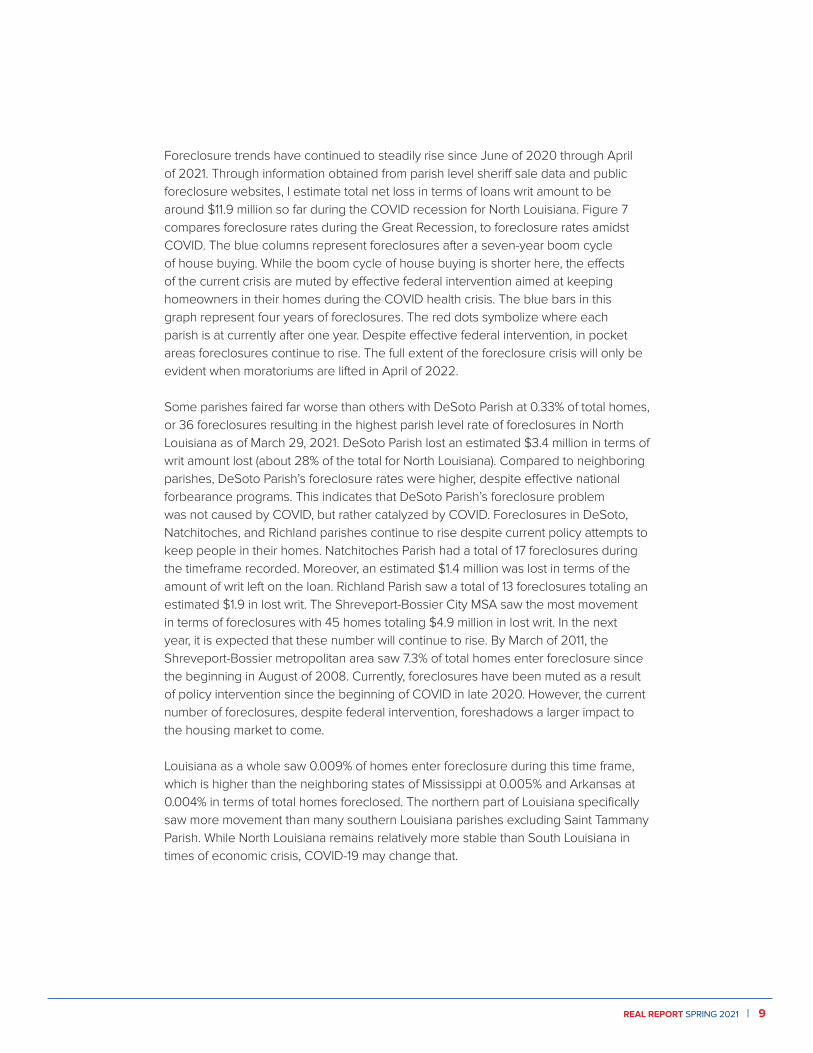
Louisiana Tech Admissions administered 9,729 tours to students with intended entry terms of Fall 2016 – Spring 2021, which may be surprising considering the average total enrollment of Louisiana Tech University was about 12,238 from Fall of 2016 – Fall 2020. 74.34% of these tours were given to students who live in Louisiana. Students from Texas constituted the second largest group with 15.06% of the tours given, and Arkansas students represented 5.51% of the tours given. Although these are our top touring states, we also give tours to students from 44 states across the country including California, New York, and even Hawaii. The tours given were also divided into six groups, five of these groups are the academic colleges of Louisiana Tech and the last group is students who are undecided about their proposed majors. Of the tours given, the College of Engineering and Science contributed to the most students as 33.05% of tours given were to students interested in a major within this college. Following the College of Engineering and Science, the College of Applied and Natural Sciences makes up 19.16% of the tours given. Next, the College of Education receives 8.63% of tours given, and the College of Business tours are 8.00% of the total amount.
To Tour or Not to Tour? Is That Even Really a Question?BY COLYN SEVARIO
0
10
20
Applie
d & N
atural
Scie
nces
Busine
ss
Educa
tion
Engine
ering
& S
cienc
es
Libera
l Arts
Undec
ided
No TourTour
Figure 8: Average ACT Composite Scores by College of Interest
REAL REPORT SPRING 2021 | 11
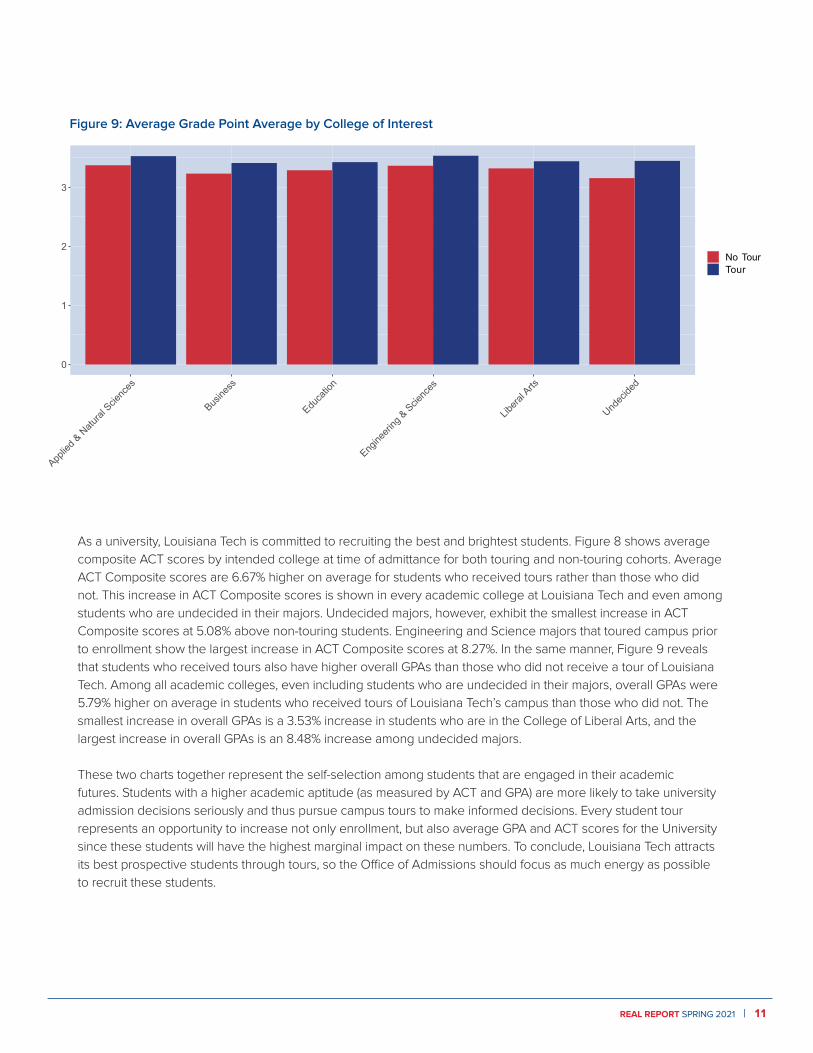
As a university, Louisiana Tech is committed to recruiting the best and brightest students. Figure 8 shows average composite ACT scores by intended college at time of admittance for both touring and non-touring cohorts. Average ACT Composite scores are 6.67% higher on average for students who received tours rather than those who did not. This increase in ACT Composite scores is shown in every academic college at Louisiana Tech and even among students who are undecided in their majors. Undecided majors, however, exhibit the smallest increase in ACT Composite scores at 5.08% above non-touring students. Engineering and Science majors that toured campus prior to enrollment show the largest increase in ACT Composite scores at 8.27%. In the same manner, Figure 9 reveals that students who received tours also have higher overall GPAs than those who did not receive a tour of Louisiana Tech. Among all academic colleges, even including students who are undecided in their majors, overall GPAs were 5.79% higher on average in students who received tours of Louisiana Tech’s campus than those who did not. The smallest increase in overall GPAs is a 3.53% increase in students who are in the College of Liberal Arts, and the largest increase in overall GPAs is an 8.48% increase among undecided majors.
These two charts together represent the self-selection among students that are engaged in their academic futures. Students with a higher academic aptitude (as measured by ACT and GPA) are more likely to take university admission decisions seriously and thus pursue campus tours to make informed decisions. Every student tour represents an opportunity to increase not only enrollment, but also average GPA and ACT scores for the University since these students will have the highest marginal impact on these numbers. To conclude, Louisiana Tech attracts its best prospective students through tours, so the Office of Admissions should focus as much energy as possible to recruit these students.
0
1
2
3
Applie
d & N
atural
Scie
nces
Busine
ss
Educa
tion
Engine
ering
& S
cienc
es
Libera
l Arts
Undec
ided
No TourTour
Figure 9: Average Grade Point Average by College of Interest
12 | LOUISIANA TECH UNIVERSITY COLLEGE OF BUSINESS CENTER FOR ECONOMIC RESEARCH
New Residence Hall Construction on Tech Drive BY BAILEY CATOIRE
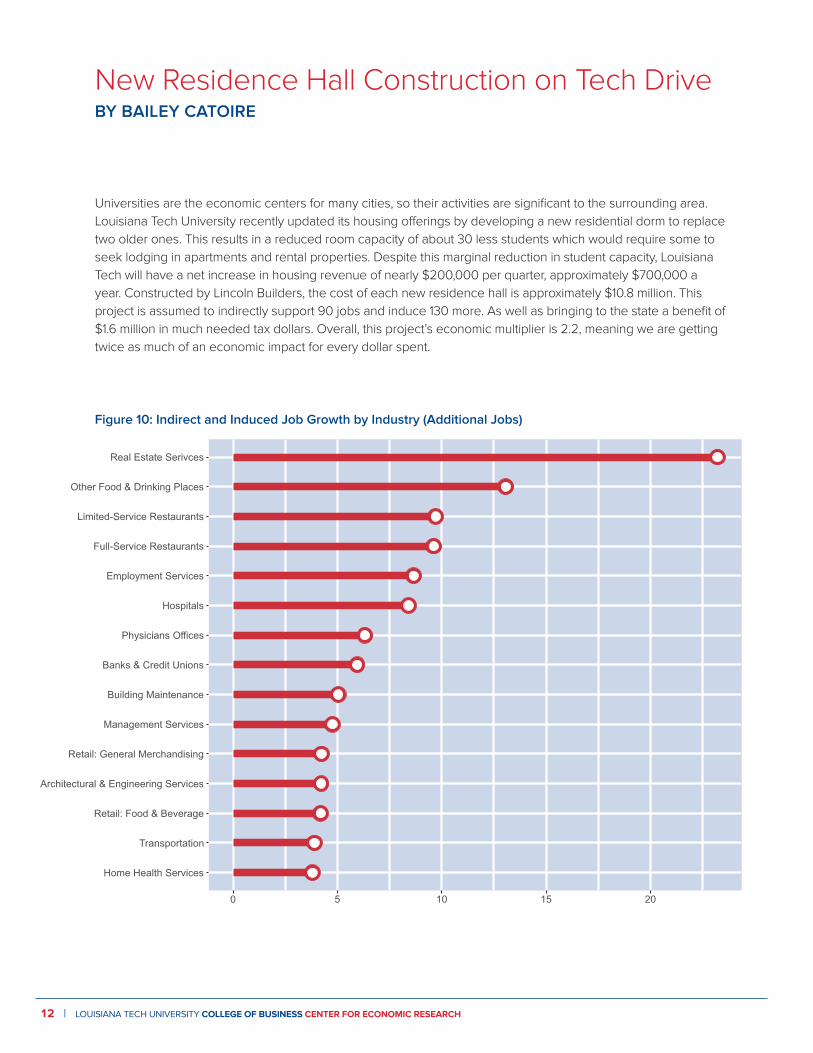
Universities are the economic centers for many cities, so their activities are significant to the surrounding area. Louisiana Tech University recently updated its housing offerings by developing a new residential dorm to replace two older ones. This results in a reduced room capacity of about 30 less students which would require some to seek lodging in apartments and rental properties. Despite this marginal reduction in student capacity, Louisiana Tech will have a net increase in housing revenue of nearly $200,000 per quarter, approximately $700,000 a year. Constructed by Lincoln Builders, the cost of each new residence hall is approximately $10.8 million. This project is assumed to indirectly support 90 jobs and induce 130 more. As well as bringing to the state a benefit of $1.6 million in much needed tax dollars. Overall, this project’s economic multiplier is 2.2, meaning we are getting twice as much of an economic impact for every dollar spent.
Home Health Services
Transportation
Retail: Food & Beverage
Architectural & Engineering Services
Retail: General Merchandising
Management Services
Building Maintenance
Banks & Credit Unions
Physicians Offices
Hospitals
Employment Services
Full-Service Restaurants
Limited-Service Restaurants
Other Food & Drinking Places
Real Estate Serivces
0 5 10 15 20
Figure 10: Indirect and Induced Job Growth by Industry (Additional Jobs)
REAL REPORT SPRING 2021 | 13
0
100
200
300
400
500
Reta
il: G
ener
al M
erch
andi
sein
gRe
tail:
Build
ing
Mat
eria
ls
Nond
epos
itory
Fin
ancia
l Int
erm
edia
tion
Lim
ited-
Serv
ice R
esta
uran
tsDu
rabl
e G
oods
Who
lesa
lers
Real
Est
ate
Serv
ices
Full-
Serv
ice R
esta
uran
ts
Tran
spor
tatio
nEm
ploy
men
t Ser
vices
Oth
er F
ood
& Dr
inkin
g Pl
aces
Arch
itect
ural
& E
ngin
eerin
g Se
rvice
sBa
nks
& Cr
edit
Unio
nsM
anag
emen
t Ser
vices
Phys
ician
s O
ffice
s
Hosp
itals
This project supports over 200 jobs in various industries as shown in Figure 10. The greatest impact is predicted to be on the real estate industry with growth of 22 jobs. This is to be expected with new development and due to the reduced student carrying compacity of the new residence halls, which requires students to look to the surrounding area for housing. This is followed by food services with nearly 30 jobs in various aspects of the industry. This is partially due to the food services that will be in the new on-campus housing complex. Also, with more students living off-campus, they are more likely to seek food in restaurants and other places. Hospitals, physicians, and banks are estimated to add a combined 18 jobs. The remaining significant economic growth is related to the maintenance of the new building and the purchasing of goods and services that are involved with the students moving into it (building maintenance through home and health services). Approximately 24 jobs in total for this segment.
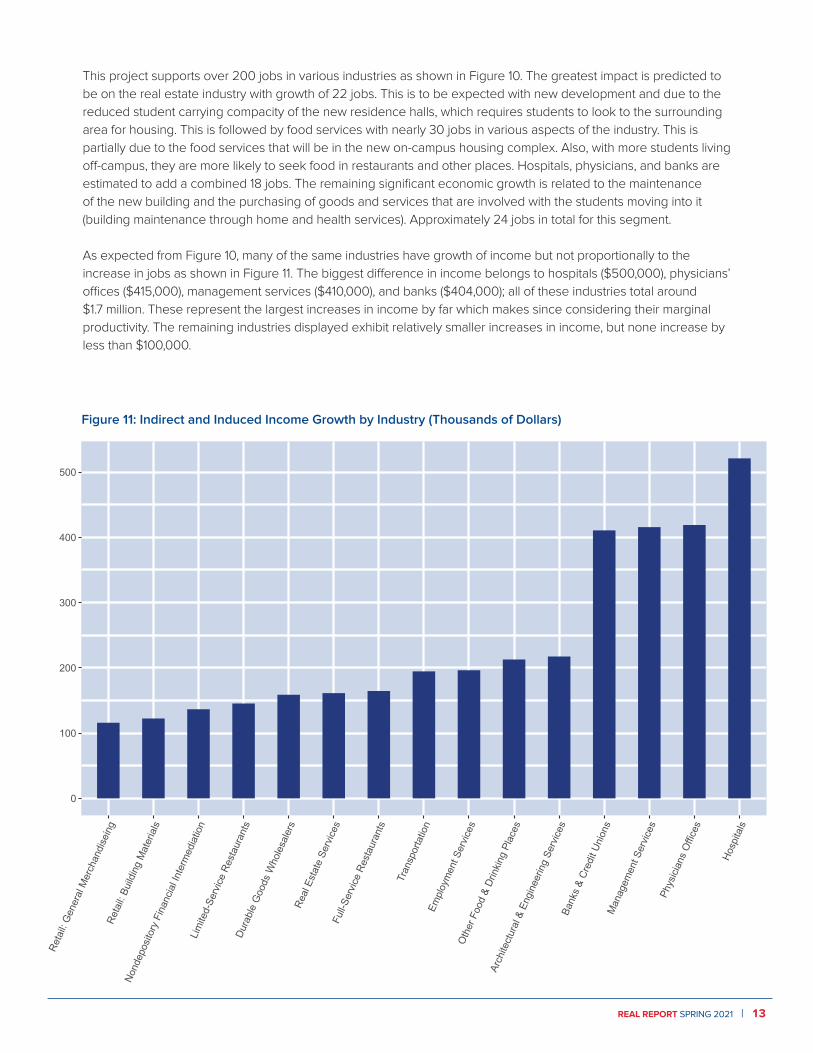
As expected from Figure 10, many of the same industries have growth of income but not proportionally to the increase in jobs as shown in Figure 11. The biggest difference in income belongs to hospitals ($500,000), physicians’ offices ($415,000), management services ($410,000), and banks ($404,000); all of these industries total around $1.7 million. These represent the largest increases in income by far which makes since considering their marginal productivity. The remaining industries displayed exhibit relatively smaller increases in income, but none increase by less than $100,000.
Figure 11: Indirect and Induced Income Growth by Industry (Thousands of Dollars)
14 | LOUISIANA TECH UNIVERSITY COLLEGE OF BUSINESS CENTER FOR ECONOMIC RESEARCH
Figure 12: Percent of Total Economic Effect by Industry (Percent of Total)
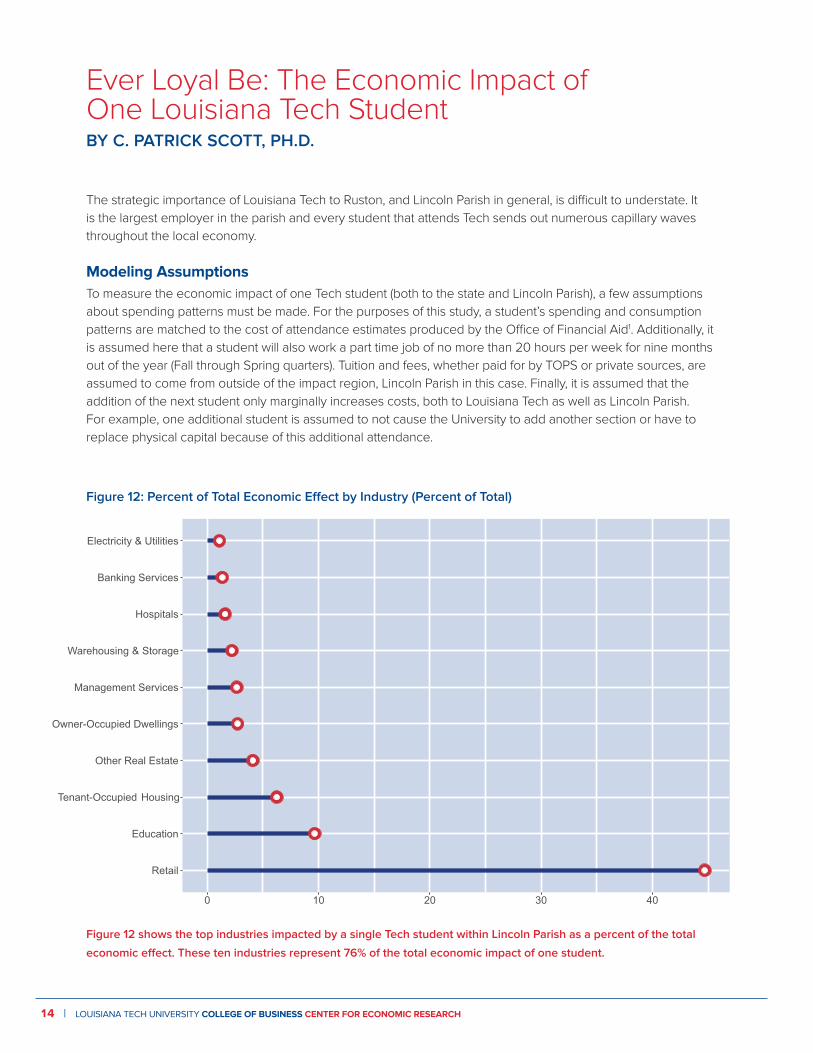
Figure 12 shows the top industries impacted by a single Tech student within Lincoln Parish as a percent of the total
economic effect. These ten industries represent 76% of the total economic impact of one student.
Retail
Education
Tenant-Occupied Housing
Other Real Estate
Owner-Occupied Dwellings
Management Services
Warehousing & Storage
Hospitals
Banking Services
Electricity & Utilities
0 10 20 30 40
The strategic importance of Louisiana Tech to Ruston, and Lincoln Parish in general, is difficult to understate. It is the largest employer in the parish and every student that attends Tech sends out numerous capillary waves throughout the local economy.
Modeling AssumptionsTo measure the economic impact of one Tech student (both to the state and Lincoln Parish), a few assumptions about spending patterns must be made. For the purposes of this study, a student’s spending and consumption patterns are matched to the cost of attendance estimates produced by the Office of Financial Aid1. Additionally, it is assumed here that a student will also work a part time job of no more than 20 hours per week for nine months out of the year (Fall through Spring quarters). Tuition and fees, whether paid for by TOPS or private sources, are assumed to come from outside of the impact region, Lincoln Parish in this case. Finally, it is assumed that the addition of the next student only marginally increases costs, both to Louisiana Tech as well as Lincoln Parish. For example, one additional student is assumed to not cause the University to add another section or have to replace physical capital because of this additional attendance.
Ever Loyal Be: The Economic Impact of One Louisiana Tech StudentBY C. PATRICK SCOTT, PH.D.
REAL REPORT SPRING 2021 | 15
29.3%
13.7%
9.6%
37.5%
9.8%
City Federal Parish Special Districts State
29.3%
13.7%
9.6%
37.5%
9.8%
City Federal Parish Special Districts State
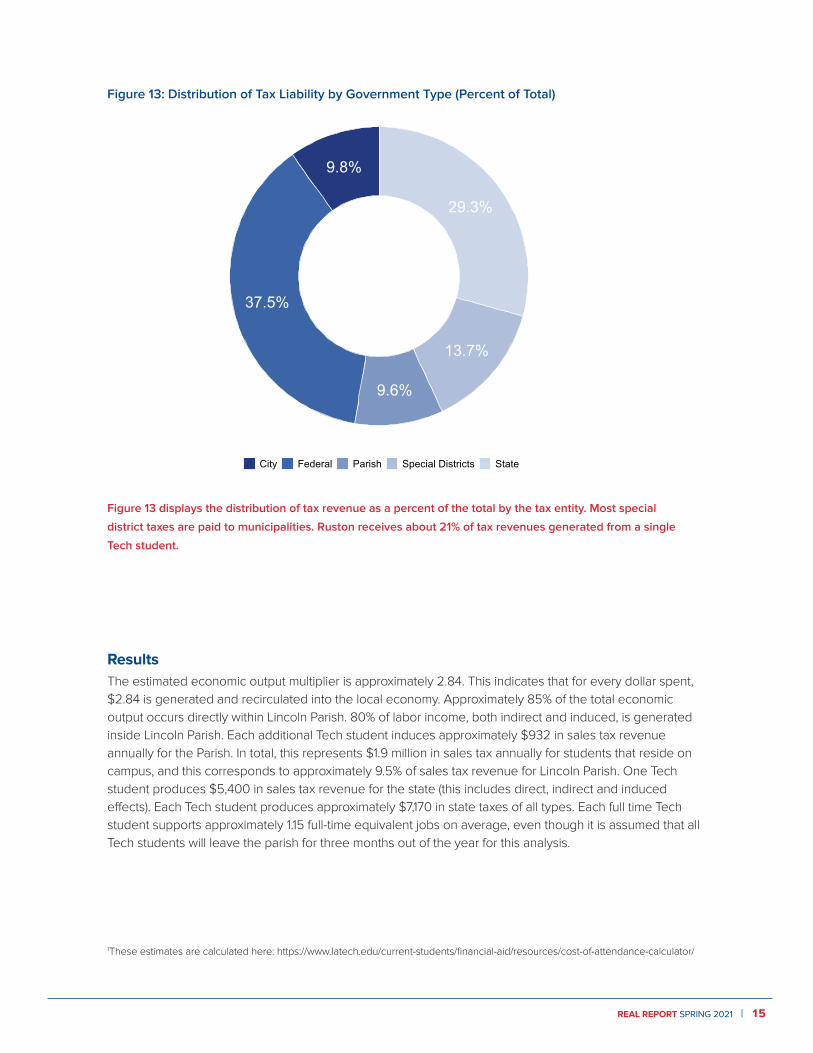
Figure 13: Distribution of Tax Liability by Government Type (Percent of Total)
Figure 13 displays the distribution of tax revenue as a percent of the total by the tax entity. Most special
district taxes are paid to municipalities. Ruston receives about 21% of tax revenues generated from a single
Tech student.
ResultsThe estimated economic output multiplier is approximately 2.84. This indicates that for every dollar spent, $2.84 is generated and recirculated into the local economy. Approximately 85% of the total economic output occurs directly within Lincoln Parish. 80% of labor income, both indirect and induced, is generated inside Lincoln Parish. Each additional Tech student induces approximately $932 in sales tax revenue annually for the Parish. In total, this represents $1.9 million in sales tax annually for students that reside on campus, and this corresponds to approximately 9.5% of sales tax revenue for Lincoln Parish. One Tech student produces $5,400 in sales tax revenue for the state (this includes direct, indirect and induced effects). Each Tech student produces approximately $7,170 in state taxes of all types. Each full time Tech student supports approximately 1.15 full-time equivalent jobs on average, even though it is assumed that all Tech students will leave the parish for three months out of the year for this analysis.
1These estimates are calculated here: https://www.latech.edu/current-students/financial-aid/resources/cost-of-attendance-calculator/
16 | LOUISIANA TECH UNIVERSITY COLLEGE OF BUSINESS CENTER FOR ECONOMIC RESEARCH
Louisiana Tech UniversityCollege of BusinessCenter for Economic Research502 W . Texas Ave . P .O . Box 10318Ruston, LA 71272
(318) 257-4527
business.latech.edu
MISSION STATEMENT Through market-responsive academic programs and impactful teaching and scholarship, Louisiana Tech University’s College of Business graduates business and academic leaders who are innovative, entrepreneurially minded, and analytically and technologically skilled for a globally competitive marketplace.