Embed Size (px)
Citation preview

Low Carbon Ratchaburi (Thailand) 2025
using ExSS
Savitri Garivait, Pornphimol Winyuchakrit, Penvadee Cheewapongphan, Thanonphat Boonmann
15th AIM International WorkshopFebruary 20-22, 2010
NIESTsukuba, Japan

Thailand

Thailand
Agricultural landForest landUrban landGrass and wild landWater
Location latitudes 5º40’ and 20º30’ Nlongitudes 97º20’ and 105º45’ E
Climate hot, wet and cool seasonsMean Annual Temperature 22-32ºCAverage Annual Precipitation 1,692 mmPopulation (2009) 66.7 MillionsTotal Land 514,310 km2 (5 regions) Forestland 183,899 km2
Cropland 305,642 km2
Urban Area 2,957 km2
Grassland 17,742 km2
Irrigation Area 4,070 km2

RatchaburiLocation latitudes 13 ํ 32 ํ 15" N
longitudes 90 ํ 49 ํ 09 " EClimate SW monsoon with very dry zonesMean Annual Temperature 21-38ºCAverage Annual Precipitation 1,303 mm (131 days)Population 2000 (2009) 791,217 (837,383) = 1,2% nat.Total Land 5,196.5 km2 (4 parts)
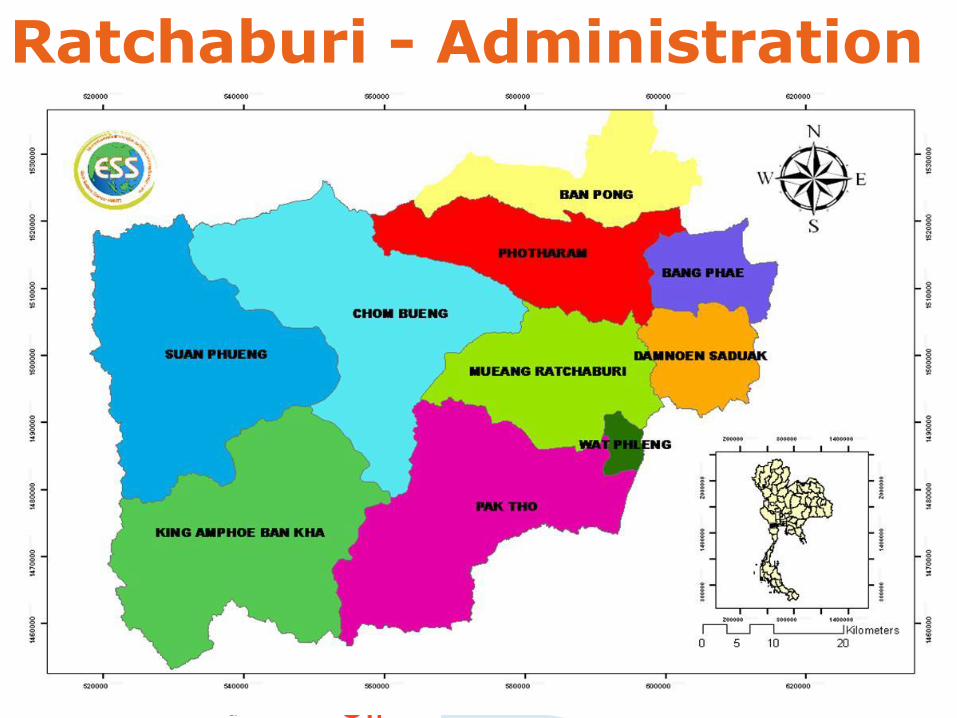
Ratchaburi - Administration

Ratchaburi - Landuse

Ratchaburi - Cropland
Pasture & farmlandPaddy fieldsHorticultureAnnual croplandAquacultureOrchard landPerennial cropland

75,216.49 rai4.25%
10,919.74 rai0.64%
1,913.13 rai 0.10%
1,633,788.54 rai 92.40%
46,277.58 rai 2.61%
Ratchaburi - forestland

Fire Hot Spots(October 08 - April 09)
Agricultural land LayerForest land Layer

Fire Hot Spots (October 08 - April 09)Agricultural land LayerForest land Layer

Ratchaburi –Attractions

Ratchaburi –Economic Activities

Ratchaburi towards LCC Background AIM Training Workshop during Aug-Sept 09
Data Requirements •Population : Y 2000•Socio-economic Accounting Matrix : Y 2000•GPP : Y 2000 assumed as Y 2000•Energy Table : Y 2000•Transport and Technology : Thailand (AIM team)•Base year : Y2000•Target year : 2025

Ratchaburi towards LCC Assumptions for BaU
•GPP growth = GDP growth => 3% annually with• +3% for other industries• +1% for iron and steel• +1% for cement• +2.5% for services• -1% for agriculture• -1% for food
•Population growth = 1.5% annually, all age•No change in size of household
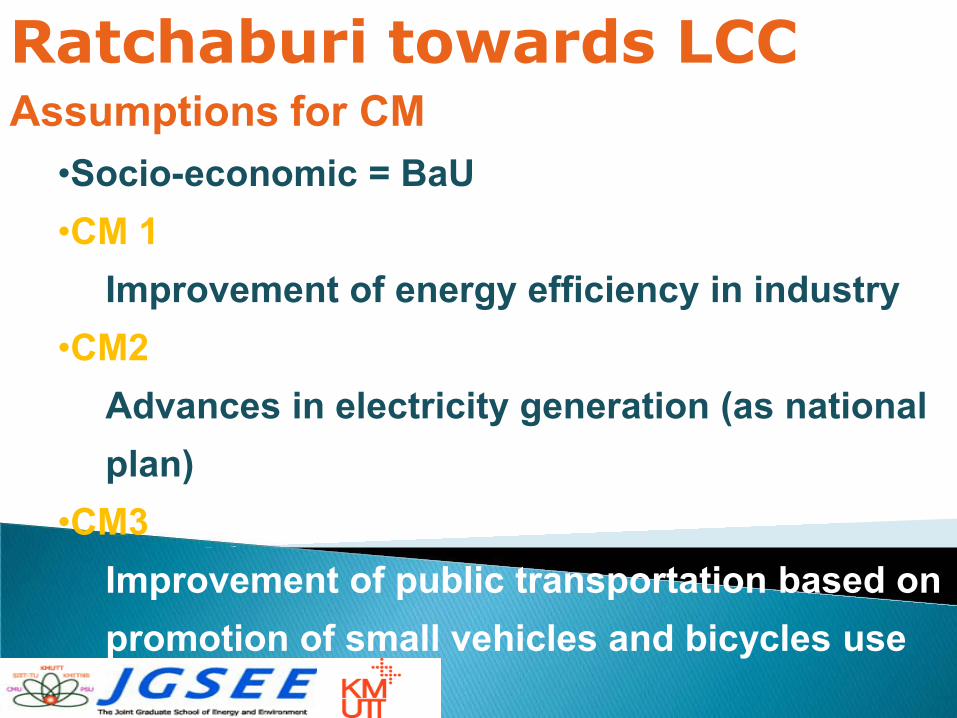
Ratchaburi towards LCC Assumptions for CM
•Socio-economic = BaU•CM 1
Improvement of energy efficiency in industry•CM2
Advances in electricity generation (as national plan)
•CM3Improvement of public transportation based on promotion of small vehicles and bicycles use

Ratchaburi towards LCC - Results Base BAU CM
Population (pers) 791,217 1,148,013 1,148,013Household (house) 201,665 292,605 292,605GPP (Thousand Baht) 92,981,300 190,610,307 190,610,307GPP/Capita (Thousand Baht/pers) 117,517 166,035 166,035Primary (Thousand Baht) 6,725,043 9,885,958 9,885,958Secondary (Thousand Baht) 118,176,674 244,201,978 244,201,978Tertiary (Thousand Baht) 83,337,862 175,360,925 175,360,925
Floor_area 1 2 2Passenger_trs 6,652 9,652 9,041Freight_trs 1,118 2,274 2,274Energy_demand (ktoe) 951 1,726 1,655CO2_emissions (kt CO2) 863 1,592 1,261

Ratchaburi towards LCC - Results
0
500
1000
1500
2000
2500
3000
Base BaU CM
ktoe
Primary Energy Demand
bmsswnuchydgasoilcol
BaU vs Base 83%CM vs Base 36%BaU vs CM -35%

0
500
1000
1500
2000
Base BAU CM
GHG
Emis
sion
s (k
t-CO
2)
GHG Emissions
ftsptsindcomres
Ratchaburi towards LCC - Results
BaU vs Base +45%CM vs Base +31%BaU vs CM -26%

Ratchaburi towards LCC - Conclusions
• ExSS enables to outline a LCC roadmap for Ratchaburi
• Data collection is the limiting step in the application
• First dissemination of results with local government = promising and should be confirmed
• Local government expectations : Implementation

20
ขอบคณุคะ่ Khob Khun Kha
สวสัดคีะ่Sawasdee Kha