Embed Size (px)
Citation preview
Low carbon transport policy for the UK, Keith Buchan, November 2008
1
Low carbon transport policy for the UK Phase 2 Final technical report November 2008 Executive Summary Preface The MTRU project proposal which led to this report was developed during 2005 and match funding for half the cost of the project was sought at the same time. Campaign for Better Transport have co-sponsored both Phase 1 and 2, and provided much additional and welcome support through their transport networks. Their website is www.bettertransport.org.uk .
Thanks are due to the wide range of individuals have commented on draft material, both directly and through the website: www.transportclimate.org . Material has been posted there on a regular basis since the project began. The Transport Planning Society arranged for three public presentation/discussion groups in London, Leeds and Bristol in 2008 which have also greatly assisted in finalising the report. Draft material has also been sent to the Department for Transport, HM Treasury and the Committee for Climate Change and a number of very useful presentations and discussions have been held with all of them over the last two years.
The contents of the report are, of course, entirely the responsibility of the author, Keith Buchan.
Low carbon transport policy for the UK, Keith Buchan, November 2008
2
Main Report Contents Executive Summary 4 Policy Package 21 1 Introduction and Context, Update from Perspectives (Phase 1) 31 2 Carbon (greenhouse gas) budgets 36 3 Land use, transport & journey length 42 4 Smarter choices & behavioural change 49 5 The role of vehicle technology and low carbon fuels 56 Local Transport: 6 Walking 65 7 Cycling 70 8 Car 75 9 Bus 83 10 Rail & rapid transit 99 Longer distance travel: 11 Aviation 103 12 Car 116 13 Public Transport 123 14 International Maritime Freight 132 15 Inland Freight 139 16 Transport Appraisal 158 17 Policy package outcomes 164 18 Policy package Assessment Summary Table 170 References are contained in the main report Keith Buchan November 2008
Low carbon transport policy for the UK, Keith Buchan, November 2008
3
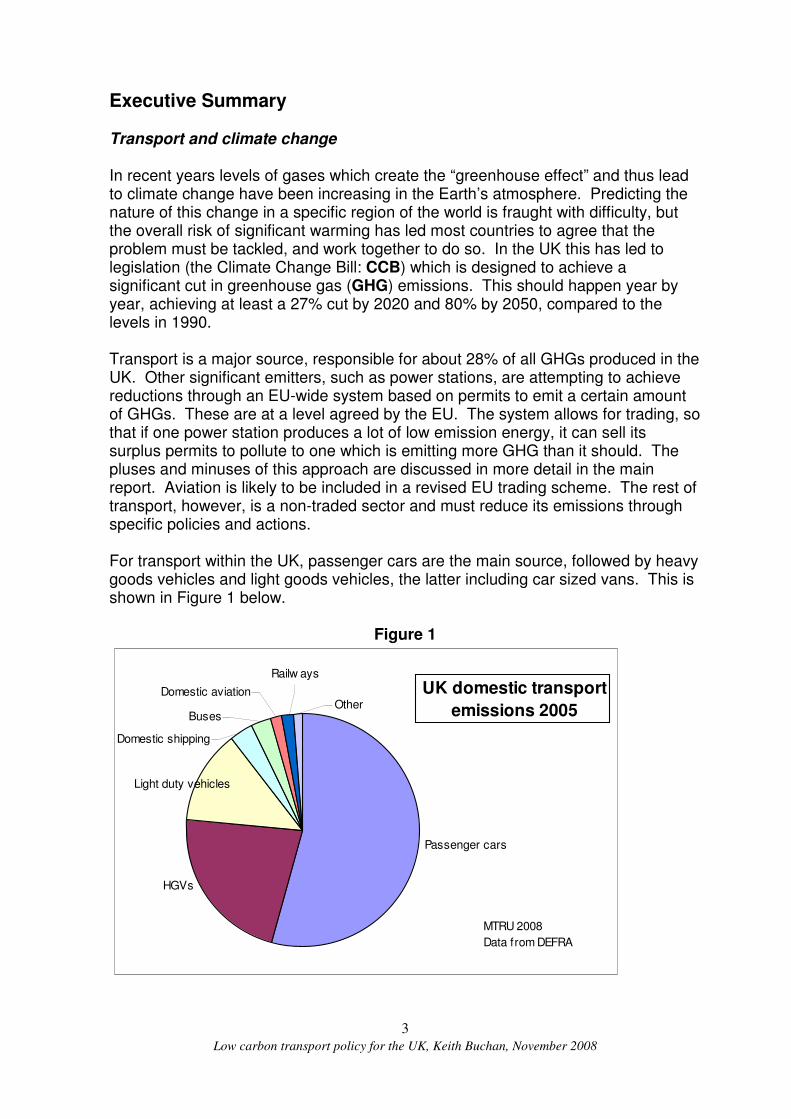
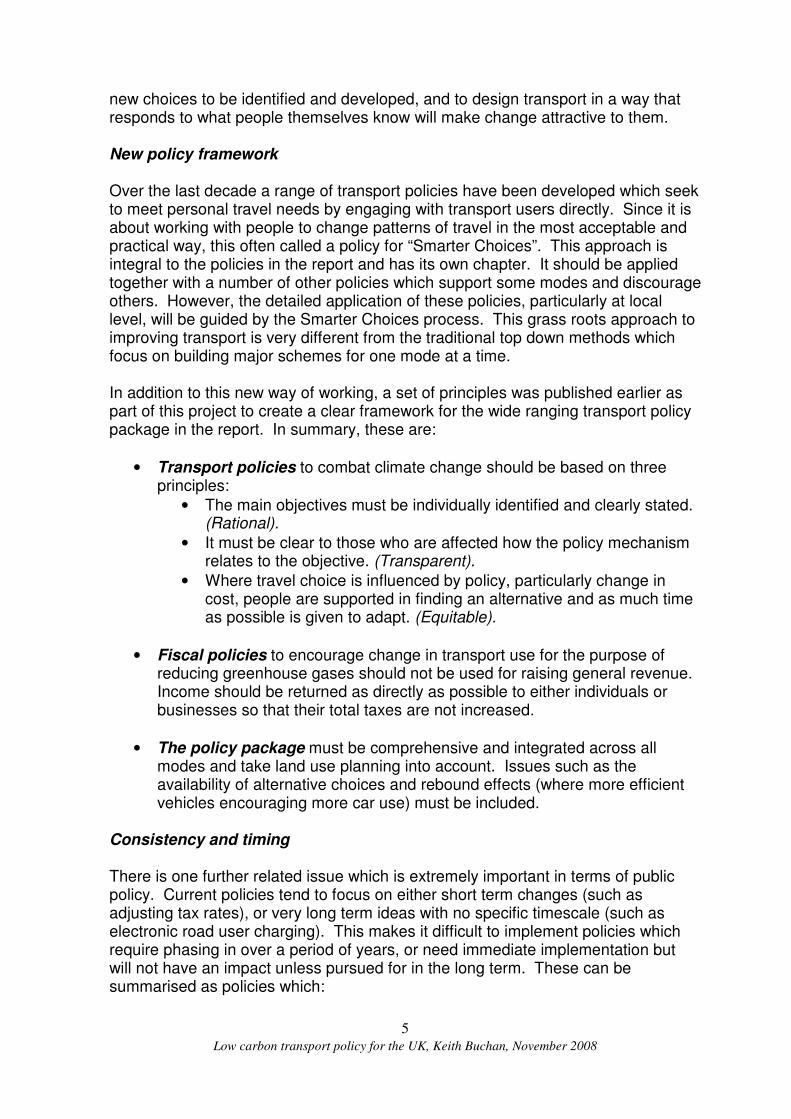
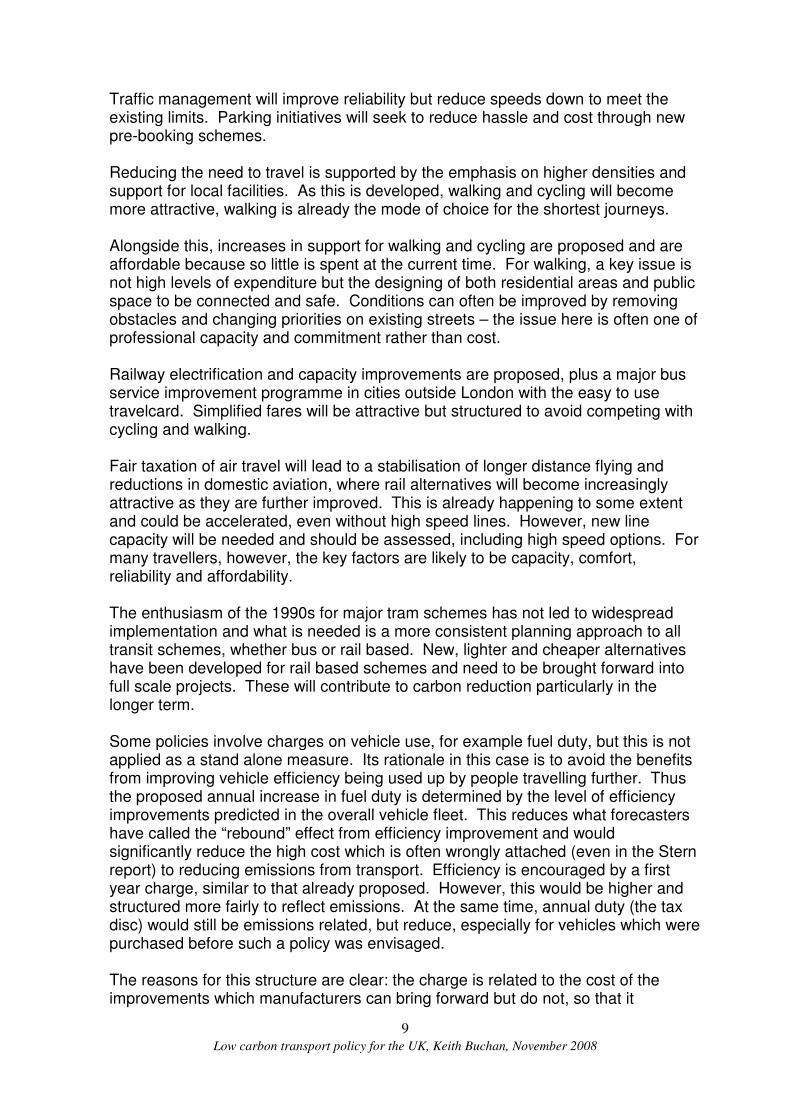
Executive Summary Transport and climate change In recent years levels of gases which create the “greenhouse effect” and thus lead to climate change have been increasing in the Earth’s atmosphere. Predicting the nature of this change in a specific region of the world is fraught with difficulty, but the overall risk of significant warming has led most countries to agree that the problem must be tackled, and work together to do so. In the UK this has led to legislation (the Climate Change Bill: CCB) which is designed to achieve a significant cut in greenhouse gas (GHG) emissions. This should happen year by year, achieving at least a 27% cut by 2020 and 80% by 2050, compared to the levels in 1990. Transport is a major source, responsible for about 28% of all GHGs produced in the UK. Other significant emitters, such as power stations, are attempting to achieve reductions through an EU-wide system based on permits to emit a certain amount of GHGs. These are at a level agreed by the EU. The system allows for trading, so that if one power station produces a lot of low emission energy, it can sell its surplus permits to pollute to one which is emitting more GHG than it should. The pluses and minuses of this approach are discussed in more detail in the main report. Aviation is likely to be included in a revised EU trading scheme. The rest of transport, however, is a non-traded sector and must reduce its emissions through specific policies and actions. For transport within the UK, passenger cars are the main source, followed by heavy goods vehicles and light goods vehicles, the latter including car sized vans. This is shown in Figure 1 below.
Figure 1
Passenger cars
Buses
Railw ays
Other
Domestic shipping
Light duty vehicles
HGVs
Domestic aviation
MTRU 2008
Data from DEFRA
UK domestic transport
emissions 2005
Low carbon transport policy for the UK, Keith Buchan, November 2008
4
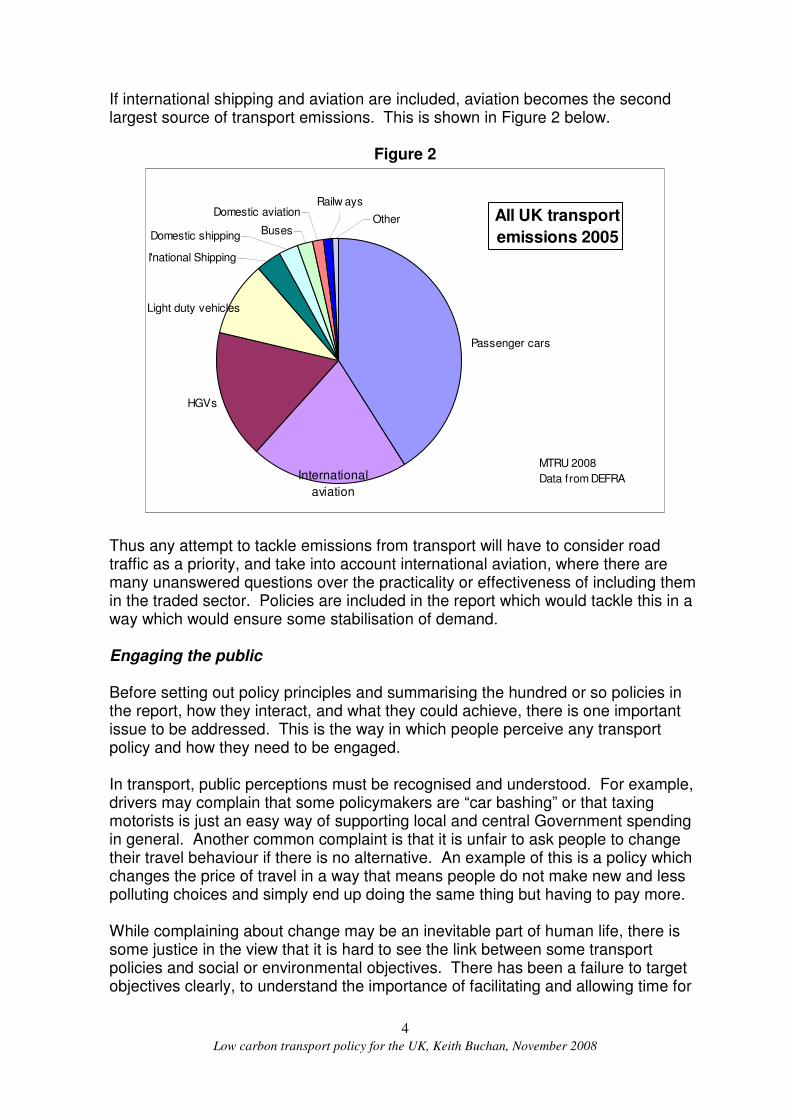
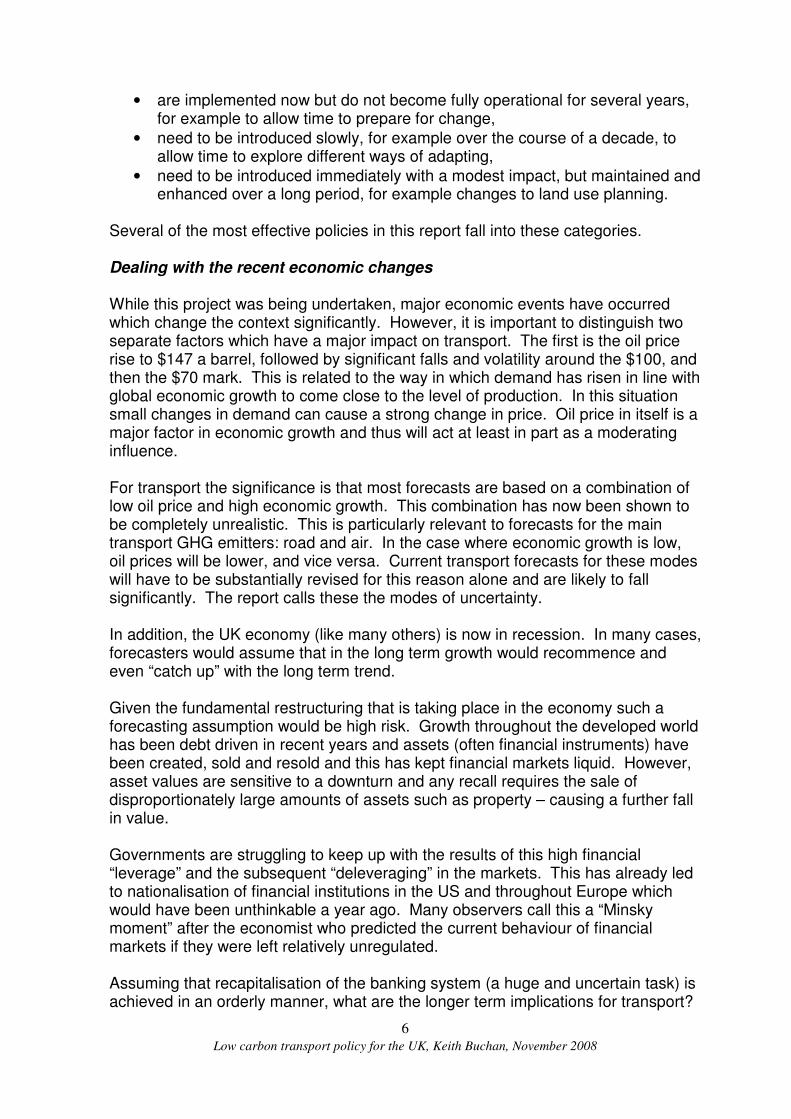
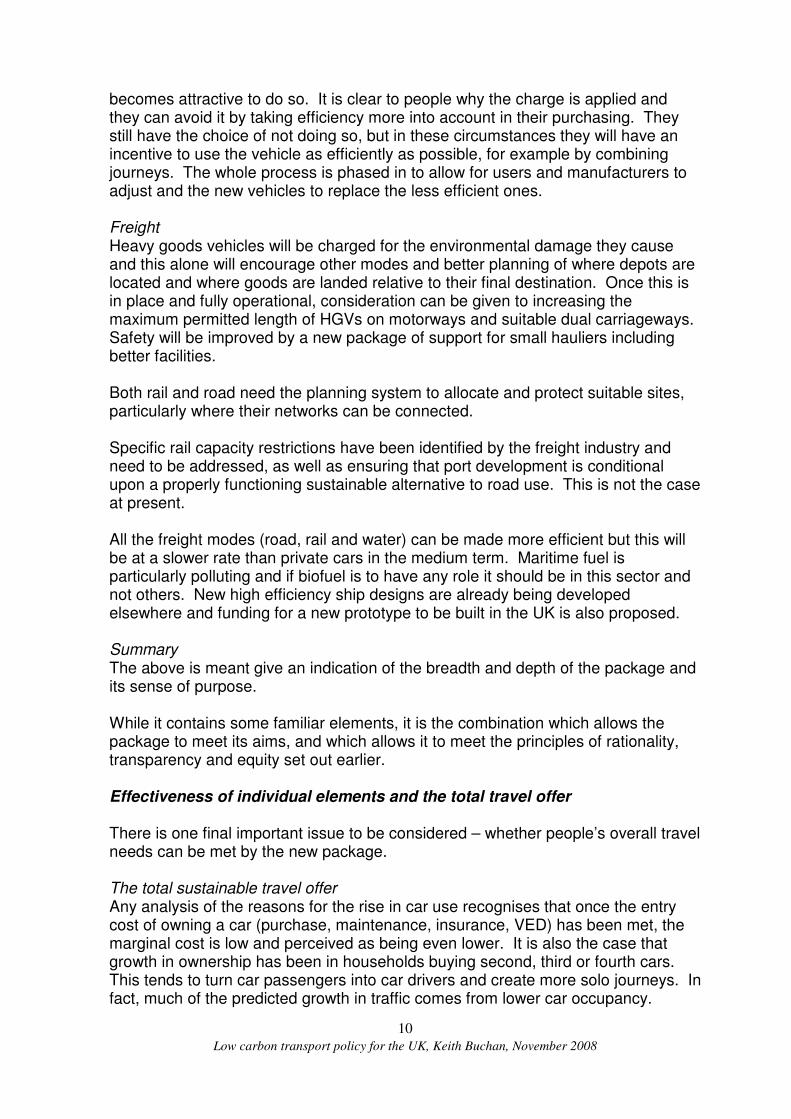
If international shipping and aviation are included, aviation becomes the second largest source of transport emissions. This is shown in Figure 2 below.
Figure 2
HGVs
Passenger cars
International
aviation
Light duty vehicles
I'national Shipping
Domestic shipping
OtherBuses
Domestic aviationRailw ays
MTRU 2008
Data from DEFRA
All UK transport
emissions 2005
Thus any attempt to tackle emissions from transport will have to consider road traffic as a priority, and take into account international aviation, where there are many unanswered questions over the practicality or effectiveness of including them in the traded sector. Policies are included in the report which would tackle this in a way which would ensure some stabilisation of demand. Engaging the public Before setting out policy principles and summarising the hundred or so policies in the report, how they interact, and what they could achieve, there is one important issue to be addressed. This is the way in which people perceive any transport policy and how they need to be engaged. In transport, public perceptions must be recognised and understood. For example, drivers may complain that some policymakers are “car bashing” or that taxing motorists is just an easy way of supporting local and central Government spending in general. Another common complaint is that it is unfair to ask people to change their travel behaviour if there is no alternative. An example of this is a policy which changes the price of travel in a way that means people do not make new and less polluting choices and simply end up doing the same thing but having to pay more. While complaining about change may be an inevitable part of human life, there is some justice in the view that it is hard to see the link between some transport policies and social or environmental objectives. There has been a failure to target objectives clearly, to understand the importance of facilitating and allowing time for
Low carbon transport policy for the UK, Keith Buchan, November 2008
5
new choices to be identified and developed, and to design transport in a way that responds to what people themselves know will make change attractive to them. New policy framework Over the last decade a range of transport policies have been developed which seek to meet personal travel needs by engaging with transport users directly. Since it is about working with people to change patterns of travel in the most acceptable and practical way, this often called a policy for “Smarter Choices”. This approach is integral to the policies in the report and has its own chapter. It should be applied together with a number of other policies which support some modes and discourage others. However, the detailed application of these policies, particularly at local level, will be guided by the Smarter Choices process. This grass roots approach to improving transport is very different from the traditional top down methods which focus on building major schemes for one mode at a time. In addition to this new way of working, a set of principles was published earlier as part of this project to create a clear framework for the wide ranging transport policy package in the report. In summary, these are:
• Transport policies to combat climate change should be based on three principles:
• The main objectives must be individually identified and clearly stated. (Rational).
• It must be clear to those who are affected how the policy mechanism relates to the objective. (Transparent).
• Where travel choice is influenced by policy, particularly change in cost, people are supported in finding an alternative and as much time as possible is given to adapt. (Equitable).
• Fiscal policies to encourage change in transport use for the purpose of
reducing greenhouse gases should not be used for raising general revenue. Income should be returned as directly as possible to either individuals or businesses so that their total taxes are not increased.
• The policy package must be comprehensive and integrated across all
modes and take land use planning into account. Issues such as the availability of alternative choices and rebound effects (where more efficient vehicles encouraging more car use) must be included.
Consistency and timing There is one further related issue which is extremely important in terms of public policy. Current policies tend to focus on either short term changes (such as adjusting tax rates), or very long term ideas with no specific timescale (such as electronic road user charging). This makes it difficult to implement policies which require phasing in over a period of years, or need immediate implementation but will not have an impact unless pursued for in the long term. These can be summarised as policies which:
Low carbon transport policy for the UK, Keith Buchan, November 2008
6
• are implemented now but do not become fully operational for several years, for example to allow time to prepare for change,
• need to be introduced slowly, for example over the course of a decade, to allow time to explore different ways of adapting,
• need to be introduced immediately with a modest impact, but maintained and enhanced over a long period, for example changes to land use planning.
Several of the most effective policies in this report fall into these categories. Dealing with the recent economic changes While this project was being undertaken, major economic events have occurred which change the context significantly. However, it is important to distinguish two separate factors which have a major impact on transport. The first is the oil price rise to $147 a barrel, followed by significant falls and volatility around the $100, and then the $70 mark. This is related to the way in which demand has risen in line with global economic growth to come close to the level of production. In this situation small changes in demand can cause a strong change in price. Oil price in itself is a major factor in economic growth and thus will act at least in part as a moderating influence. For transport the significance is that most forecasts are based on a combination of low oil price and high economic growth. This combination has now been shown to be completely unrealistic. This is particularly relevant to forecasts for the main transport GHG emitters: road and air. In the case where economic growth is low, oil prices will be lower, and vice versa. Current transport forecasts for these modes will have to be substantially revised for this reason alone and are likely to fall significantly. The report calls these the modes of uncertainty. In addition, the UK economy (like many others) is now in recession. In many cases, forecasters would assume that in the long term growth would recommence and even “catch up” with the long term trend. Given the fundamental restructuring that is taking place in the economy such a forecasting assumption would be high risk. Growth throughout the developed world has been debt driven in recent years and assets (often financial instruments) have been created, sold and resold and this has kept financial markets liquid. However, asset values are sensitive to a downturn and any recall requires the sale of disproportionately large amounts of assets such as property – causing a further fall in value. Governments are struggling to keep up with the results of this high financial “leverage” and the subsequent “deleveraging” in the markets. This has already led to nationalisation of financial institutions in the US and throughout Europe which would have been unthinkable a year ago. Many observers call this a “Minsky moment” after the economist who predicted the current behaviour of financial markets if they were left relatively unregulated. Assuming that recapitalisation of the banking system (a huge and uncertain task) is achieved in an orderly manner, what are the longer term implications for transport?
Low carbon transport policy for the UK, Keith Buchan, November 2008
7
The first is that, because travel is income related, a slow down in household expenditure, or a rise in the proportion required for non-discretionary items such as housing, home energy and travel to work, will result in a series of actions which will reduce travel. In this sense, policies which seek to minimise the need to travel and make local communities more attractive will offer positive help. In the longer term, even work catchment areas may change, with commuting distances being stabilised rather than increasing. Options will, however, be maintained by reducing journey costs through car sharing. The reason that the policy package set out in this report offers positive benefits in the new economic situation is that the key objective is not to increase public transport use, it is to reduce emissions by reducing fuel used and thus the real economic costs. In the case of the main emitters these are very closely related to distance travelled, at least in the short and medium term. One route to lower cost, replacing existing vehicles with more efficient (or smaller) models, will be made difficult by the economic situation – new car sales in September and October 2008 were down over 20% on the year before. This clearly has major drawbacks for the current reliance on technology to deliver carbon savings. On the other hand, people will simply be less able to afford to drive or fly, especially longer distances which are not work related. The emphasis on Smarter Choices – helping people to find new and less polluting (and less costly) ways of travelling and influencing the provision of the services they need – is precisely what is required when household budgets are under financial pressure and national budgets suffer from high fuel imports. New ways of delivering economic growth will be the focus of thinking once the crisis has been worked through. The low importance given previously to transport costs and emissions has led to systems which are sensitive to oil prices and rely on cheap sources of supply. These are less resilient to the changes which are inevitable and have already started. Placing a higher level of importance on reducing fuel consumed is the lower risk way forward. Balance between technology and behavioural change Before describing the key elements in the policy package there is one further piece of analysis which has guided their design. This is the issue of whether improving vehicle technology on its own can reduce emissions to meet the climate change targets. The report uses the MTRU spreadsheet model to examine this, and is in broad agreement with the latest DfT research that technology can make a significant contribution, but that it would struggle to deliver even half of the reductions required, particularly in the medium term. Even by 2050, there is no clear pathway for vehicle technology to deliver on its own, although the DfT seems more optimistic, placing great emphasis on electric power. The report examines this in detail and concludes that unless vehicle charging is rationed, a major increase in power station capacity is required of at least 150%. Higher speed vehicle charging on demand would require major rewiring at least of domestic supplies and increased power generating capacity, in
Low carbon transport policy for the UK, Keith Buchan, November 2008
8
line with the speed increase, to cover the peaks. There is no robust estimate of the costs or practicality of meeting all private transport needs through electric power or related new technologies including hydrogen. In addition, high efficiency vehicles such as hybrids offer most improvement at very slow speeds and are not strongly affected by congestion. This has not been properly accounted for in most forecasts of the impact of vehicle technology. The conclusion is that policies which produce more efficient patterns of travel will be needed alongside those for improving fuel consumption both in the medium and the long term, and that they need to be implemented as a matter of urgency. Overview of the policy proposals The report contains a range of policies from walking to aviation and deep sea shipping. They vary in impact but are mutually supportive and need to be implemented as a package. In this sense the policies are genuinely integrated. This brief section indicates the extent and some of the interrelationships between elements of the package. It relates back to the need to engage public understanding and follow the principles of rationality, transparency and equity. Passenger Starting with the issue of providing alternatives, a new public transport accessibility standard is proposed for land use planning to make sure that most people do have an alternative available, particularly for those journeys or occasions where walking or cycling is not suitable. Together with minimum standards for cycle parking and routeing, this balances the proposal for a ceiling on parking spaces. It is integrated with the introduction of a new travel planning (Smarter Choice) initiative for individuals and businesses. There are more specific proposals for improvements to public transport to provide more services, more capacity and a more comprehensive package including a national travelcard compatible with all public transport networks in the UK. This would start with a step change in quality and quantity in the six largest cities outside London. The benchmark will be to avoid the strongly perceived need for second cars or more in many households. This will be supported by the wider availability of car clubs and their inclusion within the travelcard scheme. Smarter Choice schemes at work will have tax concessions instead of the current penalties. At present, cash support to employees for car sharing, walking, cycling or public transport is subject to tax and national insurance, but car parking is not. Tax rules should be amended to reverse this situation. Other journeys including shopping and leisure can be supported by this travel planning process. A programme of free advice will be offered through a major new scheme, delivered locally but funded nationally. Such planning will be a useful part of supporting individuals and businesses in the current economic downturn. Again in terms of engaging people who are affected, a new approach to motoring regulations is proposed, removing the disproportionate treatment of offences which are technical in nature and hard to relate to any objectives other than financial.
Low carbon transport policy for the UK, Keith Buchan, November 2008
9
Traffic management will improve reliability but reduce speeds down to meet the existing limits. Parking initiatives will seek to reduce hassle and cost through new pre-booking schemes. Reducing the need to travel is supported by the emphasis on higher densities and support for local facilities. As this is developed, walking and cycling will become more attractive, walking is already the mode of choice for the shortest journeys. Alongside this, increases in support for walking and cycling are proposed and are affordable because so little is spent at the current time. For walking, a key issue is not high levels of expenditure but the designing of both residential areas and public space to be connected and safe. Conditions can often be improved by removing obstacles and changing priorities on existing streets – the issue here is often one of professional capacity and commitment rather than cost. Railway electrification and capacity improvements are proposed, plus a major bus service improvement programme in cities outside London with the easy to use travelcard. Simplified fares will be attractive but structured to avoid competing with cycling and walking. Fair taxation of air travel will lead to a stabilisation of longer distance flying and reductions in domestic aviation, where rail alternatives will become increasingly attractive as they are further improved. This is already happening to some extent and could be accelerated, even without high speed lines. However, new line capacity will be needed and should be assessed, including high speed options. For many travellers, however, the key factors are likely to be capacity, comfort, reliability and affordability. The enthusiasm of the 1990s for major tram schemes has not led to widespread implementation and what is needed is a more consistent planning approach to all transit schemes, whether bus or rail based. New, lighter and cheaper alternatives have been developed for rail based schemes and need to be brought forward into full scale projects. These will contribute to carbon reduction particularly in the longer term. Some policies involve charges on vehicle use, for example fuel duty, but this is not applied as a stand alone measure. Its rationale in this case is to avoid the benefits from improving vehicle efficiency being used up by people travelling further. Thus the proposed annual increase in fuel duty is determined by the level of efficiency improvements predicted in the overall vehicle fleet. This reduces what forecasters have called the “rebound” effect from efficiency improvement and would significantly reduce the high cost which is often wrongly attached (even in the Stern report) to reducing emissions from transport. Efficiency is encouraged by a first year charge, similar to that already proposed. However, this would be higher and structured more fairly to reflect emissions. At the same time, annual duty (the tax disc) would still be emissions related, but reduce, especially for vehicles which were purchased before such a policy was envisaged. The reasons for this structure are clear: the charge is related to the cost of the improvements which manufacturers can bring forward but do not, so that it
Low carbon transport policy for the UK, Keith Buchan, November 2008
10
becomes attractive to do so. It is clear to people why the charge is applied and they can avoid it by taking efficiency more into account in their purchasing. They still have the choice of not doing so, but in these circumstances they will have an incentive to use the vehicle as efficiently as possible, for example by combining journeys. The whole process is phased in to allow for users and manufacturers to adjust and the new vehicles to replace the less efficient ones. Freight Heavy goods vehicles will be charged for the environmental damage they cause and this alone will encourage other modes and better planning of where depots are located and where goods are landed relative to their final destination. Once this is in place and fully operational, consideration can be given to increasing the maximum permitted length of HGVs on motorways and suitable dual carriageways. Safety will be improved by a new package of support for small hauliers including better facilities. Both rail and road need the planning system to allocate and protect suitable sites, particularly where their networks can be connected. Specific rail capacity restrictions have been identified by the freight industry and need to be addressed, as well as ensuring that port development is conditional upon a properly functioning sustainable alternative to road use. This is not the case at present. All the freight modes (road, rail and water) can be made more efficient but this will be at a slower rate than private cars in the medium term. Maritime fuel is particularly polluting and if biofuel is to have any role it should be in this sector and not others. New high efficiency ship designs are already being developed elsewhere and funding for a new prototype to be built in the UK is also proposed. Summary The above is meant give an indication of the breadth and depth of the package and its sense of purpose. While it contains some familiar elements, it is the combination which allows the package to meet its aims, and which allows it to meet the principles of rationality, transparency and equity set out earlier. Effectiveness of individual elements and the total travel offer There is one final important issue to be considered – whether people’s overall travel needs can be met by the new package. The total sustainable travel offer Any analysis of the reasons for the rise in car use recognises that once the entry cost of owning a car (purchase, maintenance, insurance, VED) has been met, the marginal cost is low and perceived as being even lower. It is also the case that growth in ownership has been in households buying second, third or fourth cars. This tends to turn car passengers into car drivers and create more solo journeys. In fact, much of the predicted growth in traffic comes from lower car occupancy.
Low carbon transport policy for the UK, Keith Buchan, November 2008
11
Thus policies which seek to address use will also have to address the issue of growth in car ownership, particularly multiple household car ownership. This in turn reinforces an important understanding of the way that people perceive the availability of sustainable alternatives. A total package which can cater for all journeys without using a car can be more powerful than taking individual journeys and offering a specific alternative. A combination of a variety of destinations within walking and cycling distance, availability of attractive public transport, and access to car use when most needed (for example through car clubs), will reduce car ownership and produce a greater variety of mode choice. Inner London provides a well documented example of this pattern, where households of a particular structure and income have lower levels of car ownership than comparable households elsewhere. This reflected in their patterns of travel. This can be illustrated by the following example. A journey to a town centre which was undertaken by public transport may have required a late evening bus or train service for the trip home. This may have been much less well used than a service earlier in the day. However, removing it would mean that public transport could no longer deliver the total journey and thus both parts of the journey would have to be undertaken by car. If the person involved does not have a car, and the journey they wish to make is important, they will motivated to get one. The more journeys that require a car, the stronger that motivation. Once a car is bought, it is far less likely that the person will use other public transport services and quite likely they will not use them at all. It will also make walking and cycling less likely. Thus removing what looks like an underused bus service is part of a process that leads directly to the transfer of a large number of journeys to car from public transport, reducing its efficiency and even the viability of previously well used services. Walking and cycling are also reduced and people make longer journeys overall. It is also the case that in the current regulatory framework for buses, with the split between commercial and non-commercial services, there is low opportunity for cross-subsidy to provide a complete network and avoid this effect. This is one of the reasons that public transport planning is more complicated than selling an individual service. It is the reason that this report includes policies which will improve local bus and rail planning and lead to the creation of minimum public transport access standards, starting with those applied to new development. Part of this process will be to support car clubs which give the opportunity to use a car when it is most needed, without undermining the choice of using other modes for a wide range of other journeys. How much reduction is needed and when? There are three key elements to understanding the overall quantity of reductions and even more importantly when they are needed between now and the target date of 2050. They are fully explored in the report but can be summarised as:
• In relation to climate change, total emissions between now and 2050 are what matter - not distant targets.
• Emissions early in the period are more damaging – a tonne of CO2 emitted
Low carbon transport policy for the UK, Keith Buchan, November 2008
12
now will have a warming effect every year to 2050 (and beyond). • Transport is a continuous process and the cheapest opportunities to change
behaviour are lost if they are not taken early – catching up later becomes increasingly expensive.
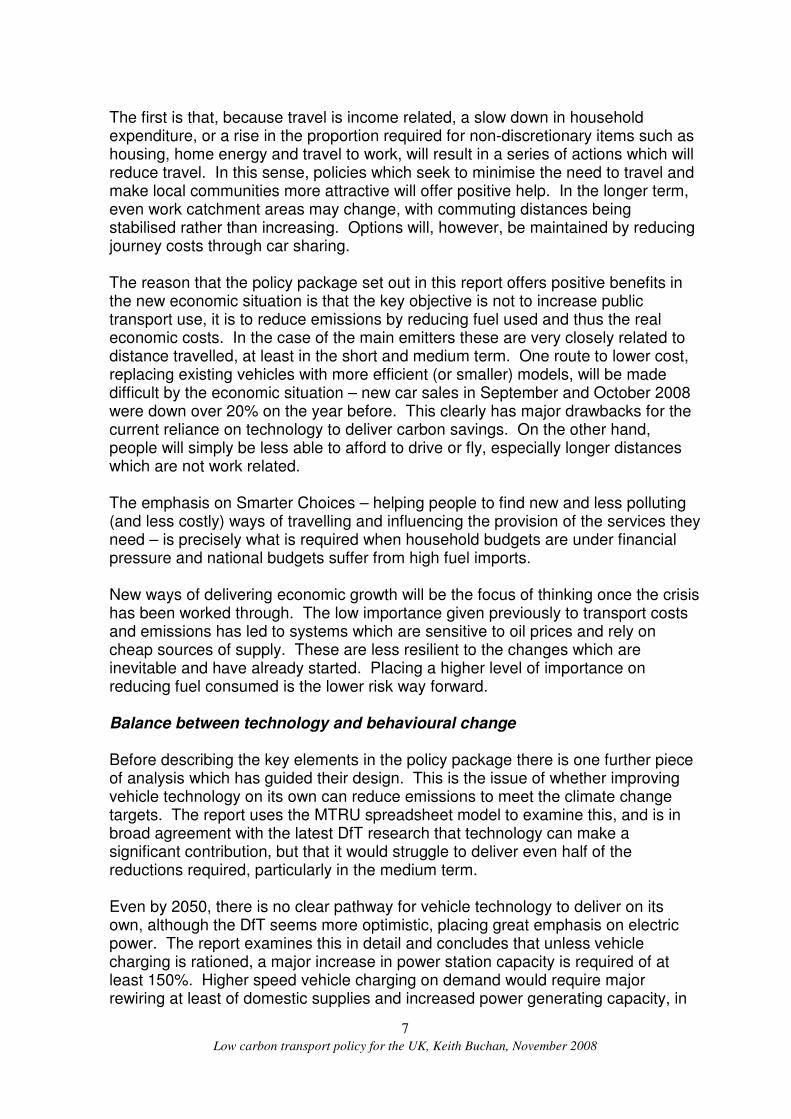
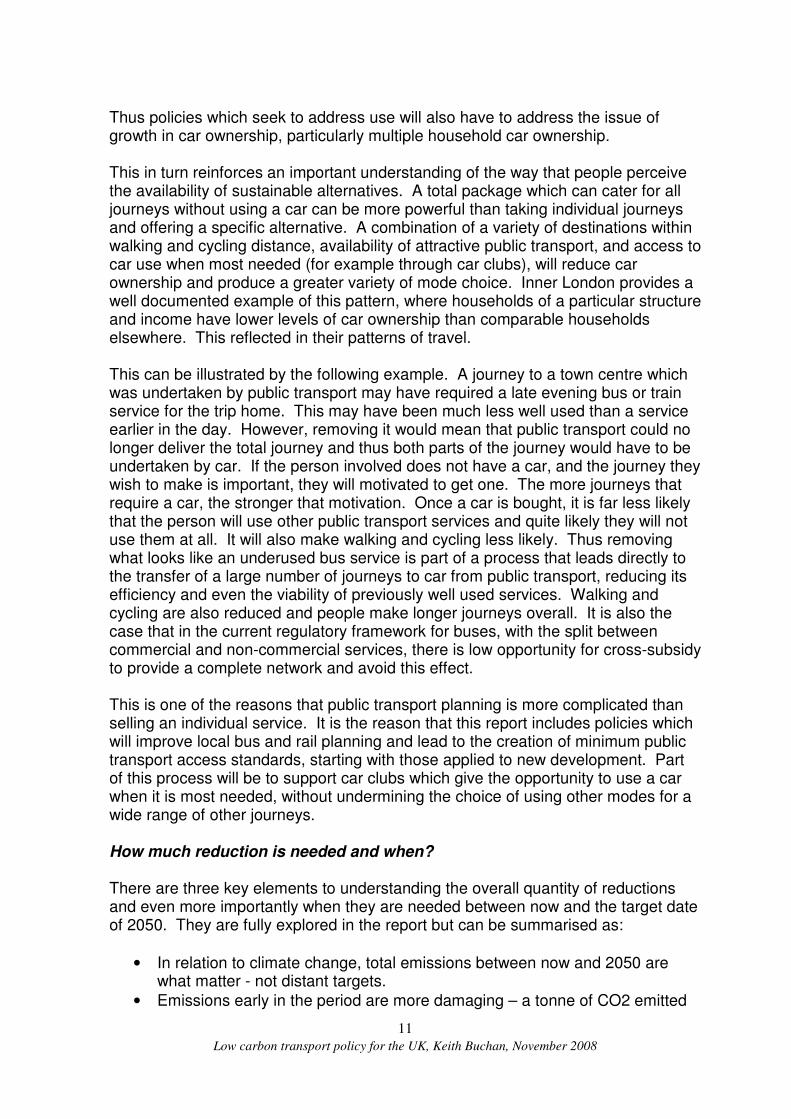
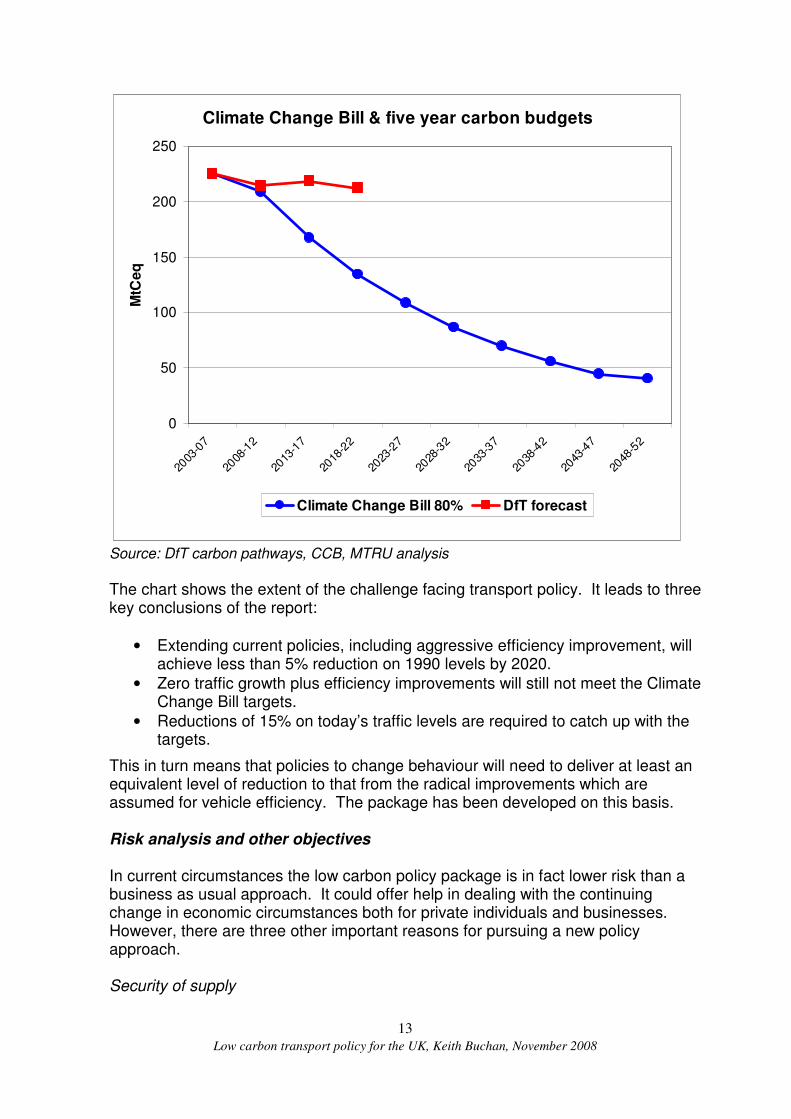
The above assumptions may not at first sight seem controversial, but they have major implications for policy. The first is that effective action must be taken as early as possible to minimise cost and to reduce the risk of climate change. Different policies have very different timescales, for example vehicle efficiency needs early action, but will not have a major impact for over a decade. Behavioural change is much faster. Thus the interactions which result in people choosing where to travel, which mode to use, and how they use their cars, must lead policymaking, rather than isolated proposals limited to improving one mode, or trying to influence choice without considering changes to land use or transport availability. This is not confined to passenger transport – businesses make decisions about which supplier to use, how to organise stockholding and distribution, and where to focus their market, by balancing location and transport cost. It should be noted that the transport of goods produces about a third of domestic transport emissions, and this is growing, while car emissions are higher in total, but stable. Climate Change Bill In terms of policymaking there is one Government initiative above all which will have a major impact on transport emissions – the Climate Change Bill. This has been through its stages in the House of Lords and has passed Committee Stage in the Commons (October 2008). It is expected to be law later in 2008. This creates legally binding targets for reductions, including “at least” 26% on 1990 levels by 2020 and 80% by 2050. The latter was recently raised from 60%. A new independent Committee on Climate Change (CCC) will advise Government on a more detailed set of budgets which will cover 5 year periods up to 2050. The first to have its budget set is 2008-12. These targets and budgets are of course derived from the estimates of what is required to avoid severe climate change. This budget period approach reflects at least in part the need to consider total emissions rather than end date targets. Using the principle that total emissions between now and 2050 are the key, the 5 year emissions budgets required have been estimated for this report in advance of the CCC advice, and used to guide policy development. They can also illustrate the level of change required. This is shown in Figure 3 below. It also shows the most recent Department for Transport estimate of the impacts of existing policy, most of which are derived from improvements in vehicle efficiency and the use of biofuels. The efficiency improvements are the most that could be achieved and make optimistic assumptions about the speed of car replacement.
Figure 3
Low carbon transport policy for the UK, Keith Buchan, November 2008
13
Climate Change Bill & five year carbon budgets
0
50
100
150
200
250
2003
-07
2008
-12
2013
-17
2018
-22
2023
-27
2028
-32
2033
-37
2038
-42
2043
-47
2048
-52
MtC
eq
Climate Change Bill 80% DfT forecast
Source: DfT carbon pathways, CCB, MTRU analysis
The chart shows the extent of the challenge facing transport policy. It leads to three key conclusions of the report:
• Extending current policies, including aggressive efficiency improvement, will achieve less than 5% reduction on 1990 levels by 2020.
• Zero traffic growth plus efficiency improvements will still not meet the Climate Change Bill targets.
• Reductions of 15% on today’s traffic levels are required to catch up with the targets.
This in turn means that policies to change behaviour will need to deliver at least an equivalent level of reduction to that from the radical improvements which are assumed for vehicle efficiency. The package has been developed on this basis. Risk analysis and other objectives In current circumstances the low carbon policy package is in fact lower risk than a business as usual approach. It could offer help in dealing with the continuing change in economic circumstances both for private individuals and businesses. However, there are three other important reasons for pursuing a new policy approach. Security of supply
Low carbon transport policy for the UK, Keith Buchan, November 2008
14
The first of these relates to energy supply, where the UK is no longer an oil or gas exporter. While Governments may support low carbon power generation through nuclear or non-fossil fuel, the current system will take time to change, over a decade to see any significant improvement. For at least the next two decades, the UK will depend on a variety of sources for its energy supply, most of which are outside the EU. This applies to gas, oil or the feedstock for many biofuels. This issue has only recently become a source of attention for policymakers. It is now clearly a political matter and needs to be reflected in transport policy objectives. Health and travel safety Government policy is already moving towards including health, as well as safety and security, in transport objectives. While there are no benefits from using any form of motorised transport (including public modes), there are disbenefits if this reduces overall levels of physical activity. On the other hand, if physical exercise can be incorporated into a normal daily activity, there are clear benefits. Walking is beneficial, but cycling is strongly beneficial in terms of keeping fit as well as maintaining a healthy weight. Despite its apparent low cost, many successful cycle commuter schemes appeal to high income, health conscious employees. Support for both these modes is contained within the package, as part of Smarter Choices, but also in their own right. Safe travel is no longer limited to reducing accidents, although there are policies supporting this, particularly in matching driving behaviour to different road types and locations. Transport safety needs to be accompanied by actions to make travel more secure and to feel so. This involves better street design as well as more secure public transport, walking and cycling networks. Congestion While an economic downturn or high oil prices may reduce traffic without further intervention, policies which could do so in conditions of growth are clearly of benefit. In this report, the main aim is to reduce greenhouse gas (GHG) emissions. Governments have tended, however, to focus more on reducing congestion. While the proposals in this report, such as a fuel duty/efficiency package, land use changes, and Smarter Choices, are targeted to GHG reductions, they will have important congestion benefits. Reductions in congestion may be less than road user charging, because there will be less targeting of the most congested places and times. However, there will be strong association between reducing congestion and the policy package because a major impact will be on commuting, which generally takes place at the most congested time of day. In many ways, however, the long running emphasis on road user charging as the preferred option for demand management has deflected attention from other measures. These may be less “pure” in terms of economic theory, for example local workplace parking charges, but have a predictable effect and may work better with practical policies such as Smarter Choices. This report does not propose either of these forms of charging, but does include a charge on parking spaces above the nationally set ceiling for new development. This would also be applied nationally, to avoid local authority fears of destructive competition from
Low carbon transport policy for the UK, Keith Buchan, November 2008
15
neighbouring authorities. Such competition, and the threat of it, are key reasons which have limited the effectiveness of parking controls. Conclusions This report is Phase Two of a two year project on transport and climate change and sets out a wide ranging package of specific policies to bring transport emissions in line with the levels required to reduce the risk of extreme climate change. Phase One considered an equally wide range of background issues, including the effectiveness of promoting biofuels or offsetting emissions, whether Government created markets in permits to pollute can make a significant contribution, and if they do what the social and moral implications will be. The Executive Summary from Phase One is attached as an Annex to the report. Since the drafting of this report began there have been major changes in oil prices and in the global financial system. There are particular problems in regard to the way economic growth has been achieved through increasing levels of personal and corporate debt. This was secured on the basis of asset values which have proved to be in many cases overestimated or completely lacking. Coupled with weakening of the regulatory system, the evolution of novel financial instruments to avoid it altogether has enabled the current collapse in liquidity, further undermining both personal and corporate asset values. While Governments are now struggling to avoid a global depression, recession in most developed economies has already begun. In this sense the emphasis in this report on transport policies which change behaviour is fortuitous. Many of them will help to reduce resource costs and provide alternatives to the high levels of car and lorry use. The approach to recycling any income from environmental charges fits well with policies to support the real economy and relieve poverty. In addition, any slow down in vehicle purchase (as is currently very much the case) will weaken the impact of technology on total emissions, making behavioural change even more important. In fact, the original set of principles which have guided the whole project are still relevant, in particular that policies should be well targeted, transparent (especially to those who are affected) and equitable. In the light of the Climate Change Bill, which will make reductions in some sectors (including transport) legally binding, the reductions needed in relation to avoiding climate change have been identified together with their timing. These make a package of behavioural change policies essential, contributing at least as much as technological change to reducing transport emissions. The package set out in the report is designed to reduce motorised traffic by around 15% by 2020 instead of catering for growth. The policy package reflects the need for adaptation, phasing and consistency over a longer time period.
Low carbon transport policy for the UK, Keith Buchan, November 2008
16
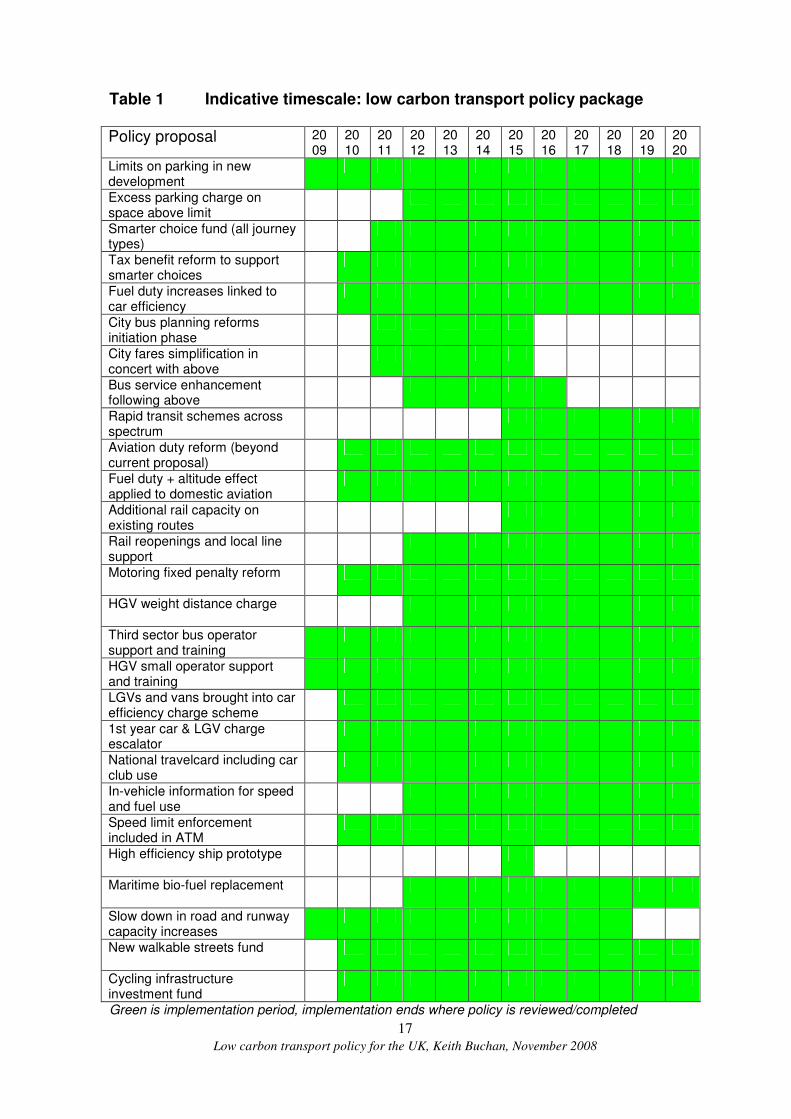
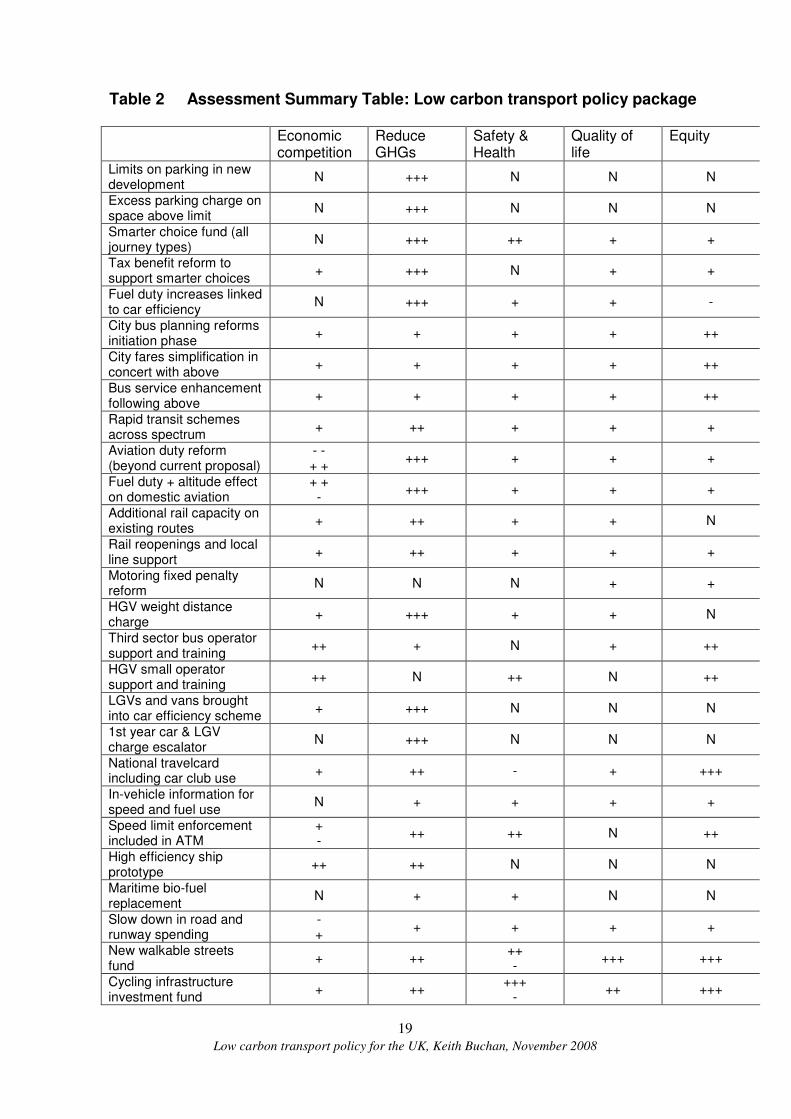
It is also better suited to the new circumstances of oil price volatility linked to economic growth, and the current financial restructuring, than business as usual. These circumstances also mean that most current demand forecasts for road and air will have to be radically revised. Broader objectives such as improving health and reducing congestion are also addressed by the package. Overall the package achieves the level of reductions currently required by reallocating existing transport budgets and a series of environmental charges which are recycled to avoid any increase in general taxation revenue. In many cases the change in travel patterns, for individuals and businesses will reduce their direct costs and make the whole transport system more efficient. A full list of policies from each chapter is set out at the end of this summary. Timetable and assessment In order to give a further picture of how the package could be implemented, a timetable has been prepared for a number of representative policies as set out in Table 1 on the following page. This is followed by a summary assessment against the latest Government objectives for transport, contained in the document Towards a Sustainable Transport System (TaSTS). These five objectives are:
• Maximising the overall competitiveness and productivity of the national economy, so as to achieve a sustained high level of GDP growth.
• Reducing transport’s emissions of CO2 and other greenhouse gases, with the desired outcome of avoiding dangerous climate change.
• Contributing to better health and longer life-expectancy through reducing the risk of death, injury or illness arising from transport, and promoting travel modes that are beneficial to health.
• Improving quality of life for transport users and non-transport users, including through a healthy natural environment, with the desired outcome of improved well-being for all.
• Promoting greater equality of transport opportunity for all citizens, with the desired outcome of achieving a fairer society.
The Assessment Table (Table 2) reflects these in the five columns: Economic competition
Reduce GHGs Safety & Health Quality of life Equity
Low carbon transport policy for the UK, Keith Buchan, November 2008
17
Table 1 Indicative timescale: low carbon transport policy package Policy proposal 20
09 2010
2011
2012
2013
2014
2015
2016
2017
2018
2019
2020
Limits on parking in new development
Excess parking charge on space above limit
Smarter choice fund (all journey types)
Tax benefit reform to support smarter choices
Fuel duty increases linked to car efficiency
City bus planning reforms initiation phase
City fares simplification in concert with above
Bus service enhancement following above
Rapid transit schemes across spectrum
Aviation duty reform (beyond current proposal)
Fuel duty + altitude effect applied to domestic aviation
Additional rail capacity on existing routes
Rail reopenings and local line support
Motoring fixed penalty reform
HGV weight distance charge
Third sector bus operator support and training
HGV small operator support and training
LGVs and vans brought into car efficiency charge scheme
1st year car & LGV charge escalator
National travelcard including car club use
In-vehicle information for speed and fuel use
Speed limit enforcement included in ATM
High efficiency ship prototype
Maritime bio-fuel replacement
Slow down in road and runway capacity increases
New walkable streets fund
Cycling infrastructure investment fund
Green is implementation period, implementation ends where policy is reviewed/completed
Low carbon transport policy for the UK, Keith Buchan, November 2008
18
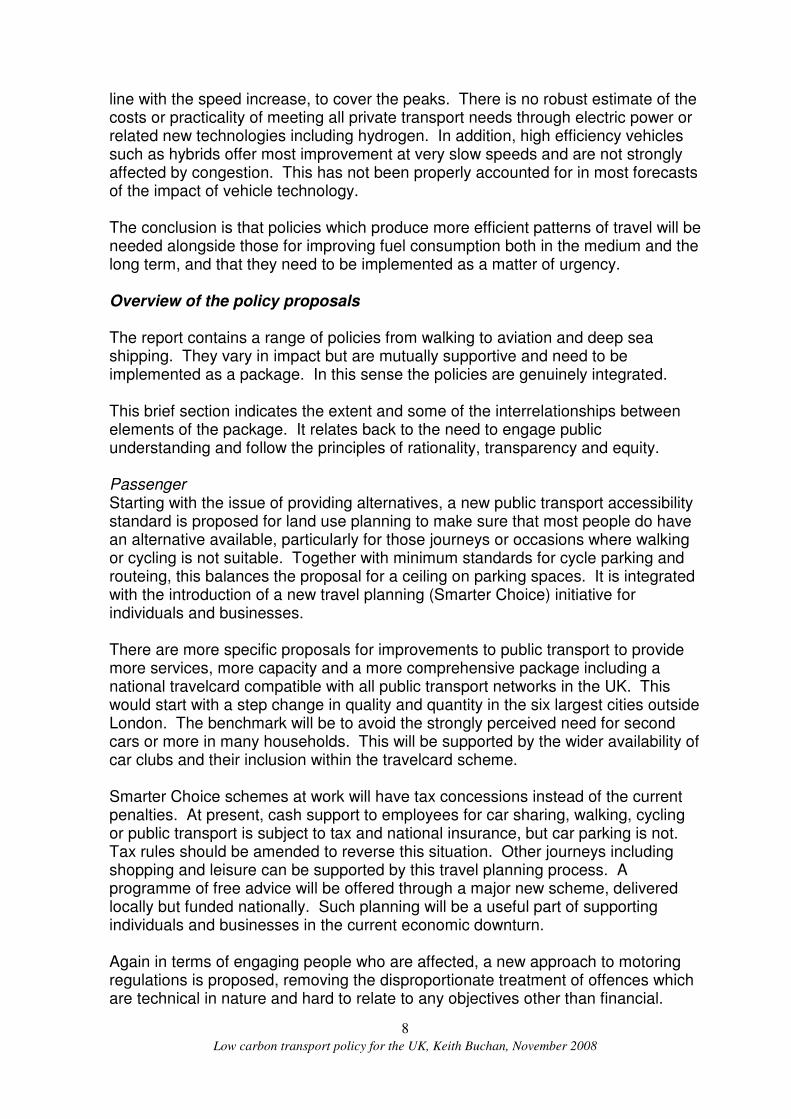
Assessment Summary against TaSTS objectives The following table takes the above sample policies and assesses their performance against the new objectives set out in TaSTS. Where there are negative and positive effects, both scores are shown rather than a neutral entry. Clearly, the policies score very well against the climate change objective, since this is their main motivation. However, the robust nature of, and balance within, the overall package is illustrated by the small number of negatives and the positive scores in achieving other objectives, particularly health and equity. The positive scores appear fairly self evident, but a few of the negatives may need further explanation. Negatives Some policies which impose costs on business have positive as well as negative scores in the competitiveness column, which reflect the fact that the revenue is recycled and that resource costs (mainly oil) are reduced. This is clearly the case for the aviation entries. A more complex issue is the case of speed limit enforcement, where the negative score represents time lost if a lower speed limit is imposed on grounds of fuel efficiency alone. In fact, there should be no negative score from enforcing the existing speed limit, or to be more accurate there is a balancing benefit of obeying the law which must at least equal any time cost. If it did not, illegal behaviour which saved time would have to be supported in social cost benefit analysis. There is also the important issue of how much other people value the increase in law abiding behaviour – this could be calculated in exactly the same way as the value of time currently in use. This sum may well exceed the value of any time costs but is never referred to. There are other complex issues here, for example a comparison of the cost of preventing road fatalities or serious injuries with the cost of preventing the same from violent crime. The answer is that the idea of being law abiding is similar to the situation in relation to avoiding climate change – it is an objective which policy seeks to achieve, not an option which is costed and then traded off in a cost benefit table. The negative scores for walking and cycling under health represent concerns over road safety, although it would be the aim to improve safety as the walking and cycling policies are implemented. It is included to provide a warning as well as being cautious in the assessment table. Key to the Table Score is positive: + or negative: - or neutral: N Scale is low, medium, high
Low carbon transport policy for the UK, Keith Buchan, November 2008
19
Table 2 Assessment Summary Table: Low carbon transport policy package Economic
competition Reduce GHGs
Safety & Health
Quality of life
Equity
Limits on parking in new development
N +++ N N N
Excess parking charge on space above limit
N +++ N N N
Smarter choice fund (all journey types)
N +++ ++ + +
Tax benefit reform to support smarter choices
+ +++ N + +
Fuel duty increases linked to car efficiency
N +++ + + -
City bus planning reforms initiation phase
+ + + + ++
City fares simplification in concert with above
+ + + + ++
Bus service enhancement following above
+ + + + ++
Rapid transit schemes across spectrum
+ ++ + + +
Aviation duty reform (beyond current proposal)
- - + +
+++ + + +
Fuel duty + altitude effect on domestic aviation
+ + -
+++ + + +
Additional rail capacity on existing routes
+ ++ + + N
Rail reopenings and local line support
+ ++ + + +
Motoring fixed penalty reform
N N N + +
HGV weight distance charge
+ +++ + + N
Third sector bus operator support and training
++ + N + ++
HGV small operator support and training
++ N ++ N ++
LGVs and vans brought into car efficiency scheme
+ +++ N N N
1st year car & LGV charge escalator
N +++ N N N
National travelcard including car club use
+ ++ - + +++
In-vehicle information for speed and fuel use
N + + + +
Speed limit enforcement included in ATM
+ -
++ ++ N ++
High efficiency ship prototype
++ ++ N N N
Maritime bio-fuel replacement
N + + N N
Slow down in road and runway spending
- +
+ + + +
New walkable streets fund
+ ++ ++ -
+++ +++
Cycling infrastructure investment fund
+ ++ +++
- ++ +++
Low carbon transport policy for the UK, Keith Buchan, November 2008
20
Policy Package A full list of policies, which are also included at the end of each chapter, is set out below. Transport charge rebate scheme Changes to taxation and transport charges are part of this policy package but the aim is to change behaviour and not to increase Government income. Thus any revenue in excess of current levels of tax will be included in an eco- rebate scheme as follows: 1 Private user surplus recycled as: Annual tax free lump sum cashback Reduction in employee National Insurance Sum added to a new national travelcard scheme 2 Business user surplus recycled as: Annual cash back on business rates Reduction in employer National Insurance Reduction in Corporation Tax Land use policy proposals PPG13 current maximum permitted number of parking spaces in new development made mandatory PPG13 current maxima redefined as applying to gross site area, not gross floor area Current PPG13 maxima reduced by 1% of current level each year from 2010 to 2050 In existing developments, car parking over the limit will be charged at £50 per space from 2010 onwards, rising by £10 per year to 2050 PPG6 strengthened and clarified to focus development in town centres not peripheral locations Minimum public transport accessibility standards set for all inhabited areas according to size of settlement and density Development size linked to the same settlement size/density bands as for PT accessibility Minimum development intensity, defined as ratio of floor area to site area, graded according to size – in other words large developments have to achieve high density
Low carbon transport policy for the UK, Keith Buchan, November 2008
21
Clear support in planning guidance for “Smart Growth” policies for new and existing settlements, especially the “eco-towns” initiative (if it proceeds) PPS3 revised to to include minimum residential development densities above a floor number of dwellings New residential planning guidelines for local facilities with 3rd sector endowments rather than one off capital charges All local plans to identify key walking routes between developments and residential zones and undertake a quality audit by 2020 Location and centralisation decisions for facilities including health, education and leisure to take full account of increased transport costs and emissions and the results of such analysis to be made public.
Policies for behavioural change A national funding scheme for smarter choices would be established deploying £200million a year for 10 years with a phased start up. It would be open to any organisation to deliver the programme, with encouragement to local authority, third sector and commercial partnerships. Programme to be purpose based with specific initiatives for: shopping: (including home delivery, local collection centres, local outlets, local sourcing) schools: (including walking and cycling initiatives but with school safety zones and non-statutory school bus initiatives in rural areas) workplaces: (including established techniques to encourage video conferencing, car share, public transport, cycle and walking, new green cashback scheme exempting up to £300 per employee per year if paid into approved scheme) leisure: build on existing entrance/public transport ticket, as well as range of access improvements by sustainable modes (also see planning guidelines to create more local facilities) Long distance in UK travel & communications initiative for business – looking at ease of planning and booking journeys, identifying obstacles through pilots, £50million over 3 years leading to specific scheme. Policies for technological change First year charges on cars related to their level of emissions to increase annually to 2020 and applied per gram above an efficiency reference level, at least 130 in 2012, 100 in 2015 and 90 by 2020.
Efficiency reference level to rise annually as technology becomes available and thus the charge on less efficient vehicles will also rise in real terms.
Low carbon transport policy for the UK, Keith Buchan, November 2008
22
Air conditioning and other power consuming devices to be included in gms/km calculations. Vans brought within car efficiency standards scheme.
Fuel duty to rise in line with predicted improvements in efficiency to avoid rebound effect.
VED increases to be slowed down as the least effective means of changing purchasing behaviour. Biofuel No transfer of existing land acting as a carbon sink to biofuel use in the UK. No feedstock to be imported until certification can be made reliable - this will help take pressure off food prices and virgin rainforest. No further increases in biofuel content for road surface transport beyond 5% (UK set aside land should just be able to provide this). Priority for biofuel for maritime transport (domestic and international bunker), aim for 50% by 2020, 75% by 2050. Research into 2nd and 3rd generation biofuels accelerated. Urgent UK and international action to preserve existing rainforest stock. Policies for walking In addition to the walking accessibility of individual sites and the permeability of new development set out in the land use chapter: Government Guidance to include:
• scheme appraisal required to reflect the hierarchy in the Manual for Streets • the impact on walking conditions and levels of use to be assessed in all
appraisal of local transport schemes • use of new techniques to measure walkability.
New funding specifically to cover local street audits for walking both where people start and where they finish their journeys. Reform of local street priorities to create safe and walkable home and shop community zones. Reform to include defining areas of shared (negotiable) space – traffic at eye contact speed, fewer boundaries, walking priority. New pedestrianisation challenge fund for local authorities to create best practice examples in different areas, urban, suburban, market town, village etc.
Low carbon transport policy for the UK, Keith Buchan, November 2008
23
Evolution of minimum walkability standards building on best practice – both for new development but also retrofitted. Encouragement of innovative travel bonus schemes as part of Smarter Choices to make walking more attractive for all journey purposes. Avoid changing clock times in October and implement a trial of SDST. Funding for research and development programme with the motor industry into a range of options for encouraging slow car use, from driver alerts to speed limiters. Inclusion of walk catchment as part of defining accessibility – for example larger service or retail development “sinks” need associated high density “sources”. These can be residential or commercial (this is linked to the Government’s concept of agglomeration). Cycling policy proposals Cycle parking standards to be introduced for existing town centres, and at workplaces, leisure and educational facilities through the travel planning initiative – automatic 100% funding from national budget. Second generation priority networks for every town over 15,000 population, based on safe links from homes to workplaces, schools, health centres, parks and other leisure centres – expanding Cycling England programme and extending to 10 years. Completion and extension of current National Cycle Network National bike hire scheme similar to VELIB based at stations and in city centres – pilot schemes in different areas including London, different towns and rural stations by 2010, national scheme by 2015, full demonstration funding. Policies to engage the motorist and respect the role of the car New initiative to create better understanding of why people drive, and among drivers, of why specific traffic controls and management schemes are implemented. National action to promote schemes such as bookable parking and information including the funding of trial schemes. In relation to parking, target deliberate and persistent offenders rather than, for example, people who make occasional minor parking errors, and investigation of the equivalent to a police “caution” for one off minor offences. Removal of income to local authorities in excess of that needed to operate parking schemes to the eco tax rebate scheme.
Low carbon transport policy for the UK, Keith Buchan, November 2008
24
Greater differentiation of traffic offences with wider spectrum of fixed penalties and greater focus on dangerous behaviour. Investigation of national, free motoring “package” possibly including GPS, car security, information and training – developed with established motoring organisations and insurance companies. National car club initiative with common means of payment, possibly with national free “unique need” car access scheme. Local bus policies Introduction of national travelcard which will also include concessionary fares scheme. Introduction of public transport accessibility standards for rural as well as urban areas. Fuel duty rebates (BSOG) scrapped and replaced with hours of service run grant – set at level where no operator faces a reduction (effectively increasing rural grant and encouraging fuel efficiency). PTEs to receive increase in bus subsidy up to 50% of London level per head of population, leading to >30% increase in service kilometres, 10% general reduction in fares and simplification (costing further 10%). Reform of local public transport planning in urban areas to include a new duty to integrate, to provide a comprehensive network and new reserve powers to ensure participation (this is partly in the new Local Transport Bill). Transit policy proposal and programme cost The overall target is difficult to cost without specific schemes. However, the additional expenditure would be of the order of £150-200mn a year, assuming that the schemes over and above those currently planned would focus on lower cost implementation. This does not include money already allocated for new and expanding lines (for example Nottingham Phase 2). It should also be the case that developer contributions, focussing on capital cost, should be easier to negotiate for specific rapid transit schemes. The above must include pilot schemes covering new forms of rapid transit, including bus but more particularly ultra light rail. Aviation policy proposals A per aircraft charge should replace current APD, based on maximum take off weight and distance bands. A double fuel duty charge should be placed on GB domestic flights in addition to a weight distance charge.
Low carbon transport policy for the UK, Keith Buchan, November 2008
25
The EU distance zone should be split into two bands but this may be difficult to negotiate. A single zone is therefore proposed in the short term. Outside the EU a four zone system would strike a reasonable balance between complexity and boundary problems, such as those currently experienced.
Significant increases in the level of charge are proposed, although these do not fully reflect the emissions caused. To put this in perspective, the total charges (not just the increased revenue over existing APD) would still not exceed the application of VAT to international air fares. It would, however, be much better tuned to environmental damage. Excess revenue from any aviation charge imposed for environmental reasons should be recycled. This could be to those who currently suffer airport pollution. Alternatively, income from leisure flights could be recycled to the general population and from business flights to businesses. Car policy proposals ATM is a positive and early measure which would assist motorists but offers the potential to assist in the reduction of emissions directly (through improved traffic flow) and indirectly (through more realistic journey time choices). National speed limits should be enforced to a far higher level than at present and this should be co-ordinated with the roll out of ATM. The use of variable speed limits should be included in a new debate about further reducing national limits on motorways and trunk roads and setting target average speeds. Road maintenance requirements need to be reassessed in the light of HGV controls but not reduced. The need for road building generally and the particular costs and benefits are in a complete state of flux and capital expenditure needs to be slowed down significantly up to 2020. The drivers’ package suggested in the local transport section would also benefit longer distance car users. Longer distance public transport proposals DfT should commission a more comprehensive data set for longer distance road public transport. Vehicle technology improvements for longer distance road vehicles should be sought in parallel with local bus design. Coaches already pay fuel duty, so new registration and VED incentives should be given to improve efficiency.
Low carbon transport policy for the UK, Keith Buchan, November 2008
26
Reopening rail connections should be reconsidered in the light of uncertainty over oil and energy prices, security of supply, and DEFRA carbon prices. Network Rail should consider both a speed priority option and a capacity priority option in its latest study on new rail capacity. The analysis of new rail lines should be explicit about assumptions on
• load factors, • level of electrification, and • sources of electricity supply
and how these change the costs and benefits. The study should look at all options including new freight only sections. A rolling programme of further electrification of the rail network should be assessed as a matter of urgency in view of the uncertainty over self-propulsion methods and the DfT prediction of rising emissions from rail. High speed lines should be considered but detailed issues about how many high speed limited stop paths are needed and how best to provide them (with and without new lines) should be included. No study of future rail capacity should prevent or delay implementation of capacity or other improvements to existing lines, including further electrification. Summary of marine policy framework The carbon cost of sea transport should be included in any carbon tax on the sale of goods. The easiest method of applying this would be a flat rate addition to port charges based on emissions per charter, preferably at EU level. Any carbon harbour tax must take account of the fluctuations and current high price of oil and be phased in. The EU should drop its support for refined biofuel in road vehicles and prioritise the replacement of bunker crude with bio crude as a short to medium term measure. A review of port facilities to identify where new power supply infrastructure is needed should be undertaken. Following this review a programme of port power supply improvement should be undertaken, based on local generation using renewable sources. The Government should initiate a major research and development project on marine propulsion and hull design including wind assistance.
Low carbon transport policy for the UK, Keith Buchan, November 2008
27
The marine project will need sufficient capital funding to build a full size demonstration vessel. Freight policy proposals A weight/ distance charge for HGVs over 25tonnes gross to be introduced, reducing their VED to a nominal amount (EU permitting) and applying the charge to foreign vehicles (similar to Swiss scheme), starting at 10p per kilometre in 2010 and rising to 20p per kilometre by 2020. HGV charge income to fund road industry training initiatives, support for small hauliers, improved local road surface maintenance, new driver facility standards, cashbacks through the licensing system for well maintained vehicles, subsidised insurance costs and free MOT tests. All these would raise safety standards and improve compliance. Remaining income recycled to companies through a lump sum UBR rebate and lower NI contributions or lower corporation tax. HGVs in the distance charging scheme pay only a minimum charge of £50 (requires agreement from the EU). Together with the weight distance charge a review of maximum size limits and restriction of the heaviest lorries to the motorway network plus similar dual carriageway roads. Routes would be defined by local authorities to serve local business. Rail freight bottlenecks addressed in rail capacity programme. Land for intermodal transport to be identified in local and regional plans. Proposals to reform transport appraisal The new objectives for sustainable transport will need to be reflected in NATA, for example health. Proposals which seek to achieve a particular objective can be compared by measuring their effectiveness per pound of cost. Complex schemes will need the decision maker to consider strengths and weaknesses against cost. Appraisal methods mean that NATA often promotes schemes which run counter to government policy. DfT should set up a multi-modal, multi-interest monitoring and advisory group to ensure the widest possible consideration and acceptance of amendments to NATA by professionals and the public. This will help avoid unintended consequences. (this has been partly implemented). In relation to climate change, the concept of achieving a necessary target requires significant change to NATA. NATA could simply apply a pass/fail criterion if schemes do not achieve the target reduction.
Low carbon transport policy for the UK, Keith Buchan, November 2008
28
The NATA appraisal internet site, webtag, should be continued as a source of guidance but extended significantly to include more good practice, for example to support the next four recommendations. The Assessment Summary Table (AST) is at the heart of the appraisal system and needs to be completed in a way that is internally consistent and consistent with other appraisals. This needs a new and more comprehensive approach involving training, better guidance, and monitoring. This should include a specifically trained practitioner having overall responsibility for producing the AST. The development of alternatives to proposed schemes needs to be taken seriously. This needs even greater emphasis in guidance, but also improved monitoring. Schemes should be judged against the best performing alternative, not against an often unrealistic ’do minimum’. Any serious alternative should have its own AST which has a comparable level of detail to the main proposal. The impacts of schemes should be described properly in the AST, for example it should set out how large individual time-savings are or what the noise context is relative to standards for sleep or conversation. These aspects should not just be averaged and have a monetary value put on them. Because of conceptual and practical problems, there should not be trading off of very different costs and benefits to produce a single monetary value, these include: personal injuries and death; climate change; time savings; value of a landscape; damage to historic buildings; street conversation; a night’s sleep; air pollution nuisance; air pollution damage to health; health benefits of exercise and social inclusion. For this reason the preferred option is to describe scheme or policy impacts more accurately, without valuation, in the AST. Forecasting and modelling resources should be prioritised, first ensuring the best possible data (on travel as well as impacts). After this there should be more broad brush testing of properly modelled alternatives. This can be done using the improved travel and other data and much simpler models. Only if absolutely necessary should highly elaborate network based models be developed. Every appraisal relies on forecasts, at present supplied by the DfT through their TEMPRO programme. At present this does not produce a demand management forecast, without road pricing. This could use benchmark values from existing DfT studies such as Smarter Choices. Walking and cycling need to be properly represented in the appraisal process and appropriate methods of modelling them need to be developed that allow for useful comparison of their benefits with other transport modes. When polluting behaviour is reduced and tax is lost as a result that should not be seen as a cost and be allowed to reduce scheme benefits. In reverse, gains in tax through increases in polluting behaviour should not be viewed as a benefit and be allowed to reduce scheme costs. A separate statement on changes in tax revenue
Low carbon transport policy for the UK, Keith Buchan, November 2008
29
should be made. This must distinguish between charges for polluting behaviour and general taxes. � Fuel duty should be seen as an environmental tax which needs to be
minimised by encouraging people to shift to less fuel intensive forms of transport, whereas NATA currently sees it as a source of government income to be maximised
� People shifting to public transport where fares are not subject to VAT and where fuel duty income falls should not be seen as disbenefits of a scheme
Numbers of travellers changing mode should be identified in the appraisal, rather than treated as generated traffic (and thus have their value reduced). Nor should they have their working time values altered when they switch, as at present. The problems of using different average values (including national equity rates) continue to produce counter intuitive results and undermines the basis of a cost benefit analysis of the traditional type. The issue of the compatibility of national and scheme specific forecasts, and valuations, is complex and needs its own research and consultation project. A move away from derived valuations, rather than extending their use, will be of some help.