Embed Size (px)
Citation preview
A Warren Centre project addressing non technical barriers to closing the existing office building energy efficiency gap
LOW ENERGY HIGH RISE BUILDING RESEARCH STUDY Final Research Survey Report March 2009
National Project Consultants Pty Ltd Level 4, 10 Clarke Street Crows Nest PO Box 1060 Crows Nest NSW 1585 T: +61 2 9906 8611 F: +61 2 9906 7318 www.npc.com.au
Exergy Australia Pty Limited Unit H, 58-69 Lathlain Street Belconnen PO Box 546 Belconnen ACT 2616 T +61 02 6257 7066 F+61 02 6257 7063 www.xgl.com.au
in
association with
np c
LEHR Study Report
LEHR Research Survery Report Ver 5.2 NPC+Exergy Page 2 of 148
Acknowledgements National Project Consultants and Exergy would like to acknowledge the following for their significant efforts and contributions without which this report would be diminished: Ms Sue Salmon – Project Director LEHR Project whose tenacity and charm lead to a very good survey completion rate that would otherwise not have been achieved. LEHR Working Groups – for their valuable and constructive feedback Survey Respondents – special thanks to those portfolio managers, asset managers and tenants who gave up so much of their precious and all too scarce time to complete such a comprehensive survey.

LEHR Study Report
LEHR Research Survery Report Ver 5.2 NPC+Exergy Page 3 of 148
Table of Contents
Acknowledgements ................................................................................................................ 2 EXECUTIVE SUMMARY ......................................................................................................... 5 1.0 INTRODUCTION ......................................................................................................... 10 2.0 BACKGROUND ........................................................................................................... 10
2.1 The Energy Gap ......................................................................................................... 10 2.2 The Warren Centre for Advanced Engineering ......................................................... 11 2.3 LEHR Project Overview............................................................................................ 11
Stage 1................................................................................................................................ 11 Stage 2................................................................................................................................ 12 Stage 3................................................................................................................................ 12
3.0 APPROACH AND METHODOLOGY ........................................................................ 12 3.1 Determining Sample Sufficiency............................................................................... 12 3.2 Surveys....................................................................................................................... 14
Base Building Survey ........................................................................................................ 14 Tenancy Survey ................................................................................................................. 15 Management Survey .......................................................................................................... 15
3.3 Analysis...................................................................................................................... 15 4.0 OFFICE MARKET SIZE AND CHARACTERISTICS ............................................... 17
4.1 Overview.................................................................................................................... 17 4.2 Breakdown by City and Area..................................................................................... 17 4.3 Breakdown by Grade ................................................................................................. 19
5.0 DATA SOURCES REVIEW......................................................................................... 19 5.1 Data available............................................................................................................. 19 5.2 Responses................................................................................................................... 21 5.3 Missing data and proxies ........................................................................................... 21 5.4 Survey Exclusions...................................................................................................... 21
5.4.1 Base Building Survey Exclusions...................................................................... 22 5.4.2 Manager Survey Exclusions .............................................................................. 23 5.4.3 Tenancy Survey Exclusions............................................................................... 24 5.4.4 Handling Duplicate Surveys .............................................................................. 24
5.5 Data Characteristics ................................................................................................... 25 5.5.1 By building size (NLA) ..................................................................................... 25 5.5.2 By Energy density.............................................................................................. 25 5.5.3 Relative Car Park Size ....................................................................................... 26
5.6 NABERS Office Energy Ratings............................................................................... 26 5.7 NABERS Office Water Ratings................................................................................. 27 5.8 Survey completion rates............................................................................................. 28
6.0 BUILDING AND RESPONDENT CHARACTERISATION ...................................... 29 6.1 Buildings .................................................................................................................... 29 6.2 Respondents ............................................................................................................... 30
7.0 RELATIONSHIPS AND CORRELATIONS................................................................ 30 7.1 NABERS Office Ratings & Building Classifications................................................ 30 7.2 Sample Performance Characteristics ......................................................................... 31
7.2.1 Building Quality................................................................................................. 31 7.2.2 Age and Refurbishment ..................................................................................... 31 7.2.3 Air-Conditioning Technology............................................................................ 33
7.3 Testing Methodology................................................................................................. 33 7.3.1 ANOVA Tests.................................................................................................... 34 7.3.2 OLS Regression ................................................................................................. 34

LEHR Study Report
LEHR Research Survery Report Ver 5.2 NPC+Exergy Page 4 of 148
7.4 Test Results for Individual Questions........................................................................ 34 7.4.1 Base Building Results ........................................................................................ 35 7.4.2 Manager Survey Results .................................................................................... 38 7.4.3 Tenant Survey Results ....................................................................................... 40
7.5 Aggregation Methodology......................................................................................... 41 7.6 Aggregation Results & Refinements ......................................................................... 42
7.6.1 Aggregation Effects on NABERS Office Energy Ratings ................................ 42 7.6.2 Significant Aggregation Results ........................................................................ 43 7.6.3 Contrasts between Good & Bad Buildings ........................................................ 46
8.0 WATER EFFICIENCY ANALYSES ........................................................................... 48 8.1 Testing Methodology................................................................................................. 48 8.2 Water Efficiency Results ........................................................................................... 48
9.0 RESULTS INTERPRETATION ................................................................................... 51 9.1 Significant Positive Results ....................................................................................... 51 9.2 Null results ................................................................................................................. 52
9.2.1 Building Technology Factors............................................................................. 53 9.2.2 Building Management Factors........................................................................... 53 9.2.3 Skill related factors ............................................................................................ 54 9.2.4 Investment.......................................................................................................... 54
9.3 Barriers & Enablers Assessment................................................................................ 55 9.3.1 Top 5 Barriers .................................................................................................... 55 9.3.2 Top 5 Incentives................................................................................................. 56 9.3.3 Interpretation...................................................................................................... 58
9.4 Overall Impacts.......................................................................................................... 59 APPENDIX A Section 7 Supplementary Data....................................................................... 60 APPENDIX B Survey Response Distributions ...................................................................... 62
B.1 Base Building Survey ................................................................................................ 62 B.2 Manager Survey Responses ....................................................................................... 73 B.3 Tenancy Survey Response ....................................................................................... 100
APPENDIX C Test Results for Individual Questions.......................................................... 104 C.1 Base Building Survey Results.................................................................................. 104 C.2 Manager Survey Results .......................................................................................... 112 C.3 Tenant Survey Results ............................................................................................. 120
APPENDIX D Aggregation Supplement ............................................................................. 130 D.1 Aggregation Definitions........................................................................................... 130 D.2 Categorical Aggregation Variables.......................................................................... 139
APPENDIX E Manager Comments ..................................................................................... 141 APPENDIX F Water Analyses Results ............................................................................... 145 APPENDIX G Survey Questions ........................................................................................ 148

LEHR Study Report
LEHR Research Survery Report Ver 5.2 NPC+Exergy Page 5 of 148
EXECUTIVE SUMMARY Introduction This report summarises the findings of the research phase of the Warren Centre for Advanced Engineering’s Low Energy High Rise (LEHR) project, conducted by National Project Consultants and Exergy Australia Pty Ltd. The purpose of the research was to find measurable evidence of non-technical factors that assist or hinder energy efficiency in commercial office buildings.
The research findings are based on a substantial survey of factors potentially affecting energy efficiency in a sample of 127 buildings. The building sample predominantly comprised larger buildings (over 7,500m²), located in Australia capital cities.
The survey, which was completed on-line, covered both technical and non-technical factors relating to building operation as well as reviewing the activities, attitudes and background of tenants and participants in the building management chain. Answers to questionnaires were tested using a variety of statistical techniques to determine which factors correlate with building efficiency as measured by the NABERS Energy rating scheme.
Building Population & Surveys Based on Property Council of Australia (PCA) data it is estimated there are some 2,000 buildings in the defined population. A sample population size of 150 was deemed sufficient to obtain 100 valid survey sets. Ultimately 189 buildings were nominated. It was decided that this larger number would provide some contingency and so help ensure statistically robust outcomes, provided certain tests were used to confirm the sufficiency of the sample data set including:
• Statistical significance tests • Representational coverage • Bias tests (geographical, climatic, etc)
Three survey types were developed; one each for Base Building, Tenancy and Managers. The Base Building surveys were completed by the facility or building manager responsible for the day to day running of the each building. It comprised technical, energy usage related data and non technical sections. The Tenancy Survey (one major lessee per building) and Managers Survey (one for each of the building, asset and portfolio management levels) were limited to human/non technical matters.
Each survey was made available online with secure access given to respondents via the Internet. This gave people the flexibility of completing the surveys over time whilst allowing the survey team to remotely monitor completion rates. A structured format was used to enable categorisation of responses. However, open-ended answers were also permitted within the structure to enable non-standard situations to be identified.
The total study population was taken to be those office buildings graded either Premium (P), A, B, C or D in the 2006 PCA database. The table below shows a summary of this data with the number of buildings and total NLA broken down by city CBD.
City CBDNo
Bldgs% Area %
Ave Size (m²)
Adelaide 141 6.9% 908,293 6.0% 6,442Brisbane 154 7.5% 1,711,795 11.2% 11,116Canberra 384 18.8% 1,604,371 10.5% 4,178Melbourne 363 17.8% 3,587,321 23.6% 9,882Perth CBD 172 8.4% 1,282,734 8.4% 7,4583-Sydney CBDs 828 40.5% 6,138,220 40.3% 7,413
2042 100% 15,232,734 100% 7,460 Surveys were distributed to a total of 189 base buildings, 188 tenants and 296 managers. Data exhibited a wide variety in the quality of response, varying from complete and plausible, to critically incomplete or non-plausible responses, to those surveys that had not been started at all.
LEHR Study Report
LEHR Research Survery Report Ver 5.2 NPC+Exergy Page 6 of 148
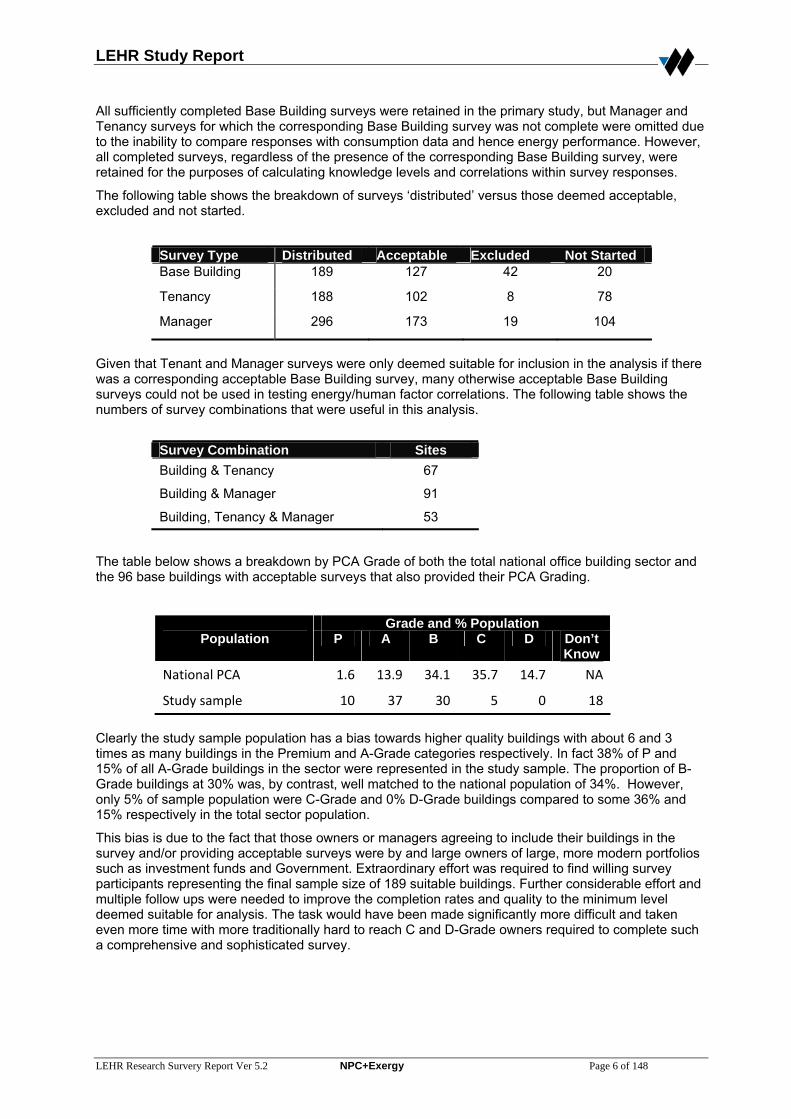
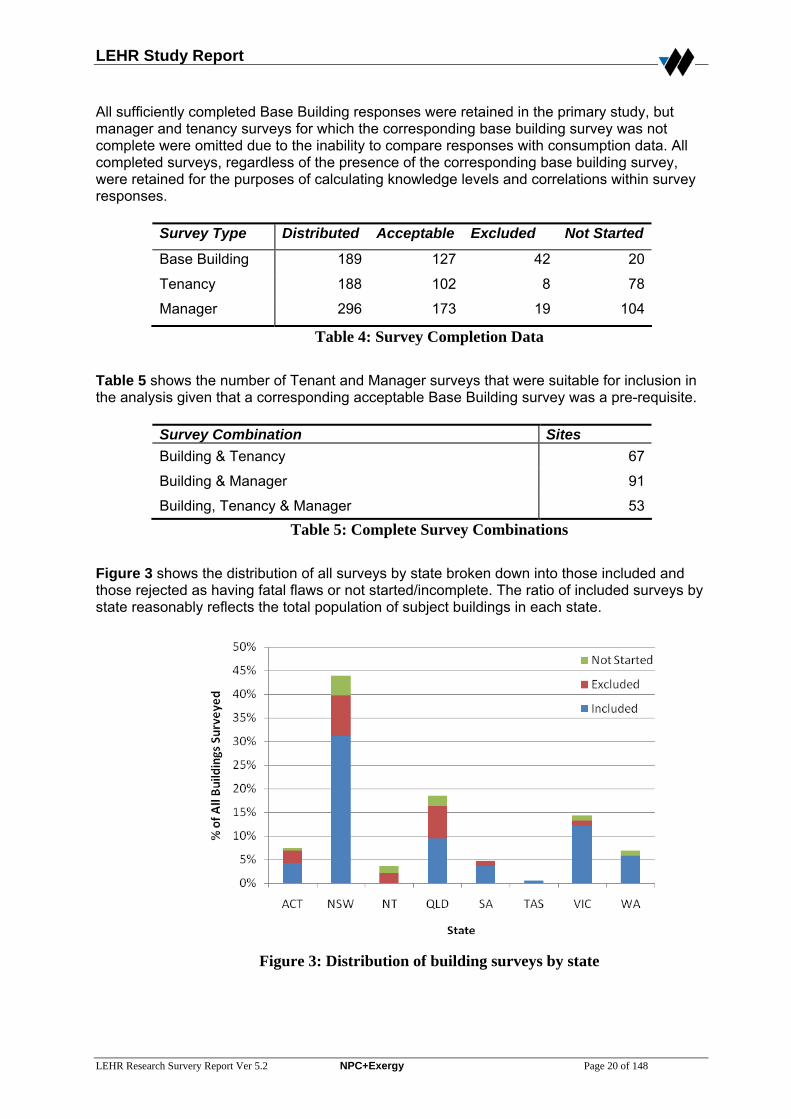
All sufficiently completed Base Building surveys were retained in the primary study, but Manager and Tenancy surveys for which the corresponding Base Building survey was not complete were omitted due to the inability to compare responses with consumption data and hence energy performance. However, all completed surveys, regardless of the presence of the corresponding Base Building survey, were retained for the purposes of calculating knowledge levels and correlations within survey responses.
The following table shows the breakdown of surveys ‘distributed’ versus those deemed acceptable, excluded and not started.
Survey Type Distributed Acceptable Excluded Not Started Base Building 189 127 42 20
Tenancy 188 102 8 78
Manager 296 173 19 104
Given that Tenant and Manager surveys were only deemed suitable for inclusion in the analysis if there was a corresponding acceptable Base Building survey, many otherwise acceptable Base Building surveys could not be used in testing energy/human factor correlations. The following table shows the numbers of survey combinations that were useful in this analysis.
Survey Combination Sites Building & Tenancy 67
Building & Manager 91
Building, Tenancy & Manager 53
The table below shows a breakdown by PCA Grade of both the total national office building sector and the 96 base buildings with acceptable surveys that also provided their PCA Grading.
Grade and % Population Population P A B C D Don’t
Know National PCA 1.6 13.9 34.1 35.7 14.7 NA
Study sample 10 37 30 5 0 18
Clearly the study sample population has a bias towards higher quality buildings with about 6 and 3 times as many buildings in the Premium and A-Grade categories respectively. In fact 38% of P and 15% of all A-Grade buildings in the sector were represented in the study sample. The proportion of B-Grade buildings at 30% was, by contrast, well matched to the national population of 34%. However, only 5% of sample population were C-Grade and 0% D-Grade buildings compared to some 36% and 15% respectively in the total sector population.
This bias is due to the fact that those owners or managers agreeing to include their buildings in the survey and/or providing acceptable surveys were by and large owners of large, more modern portfolios such as investment funds and Government. Extraordinary effort was required to find willing survey participants representing the final sample size of 189 suitable buildings. Further considerable effort and multiple follow ups were needed to improve the completion rates and quality to the minimum level deemed suitable for analysis. The task would have been made significantly more difficult and taken even more time with more traditionally hard to reach C and D-Grade owners required to complete such a comprehensive and sophisticated survey.
LEHR Study Report
LEHR Research Survery Report Ver 5.2 NPC+Exergy Page 7 of 148
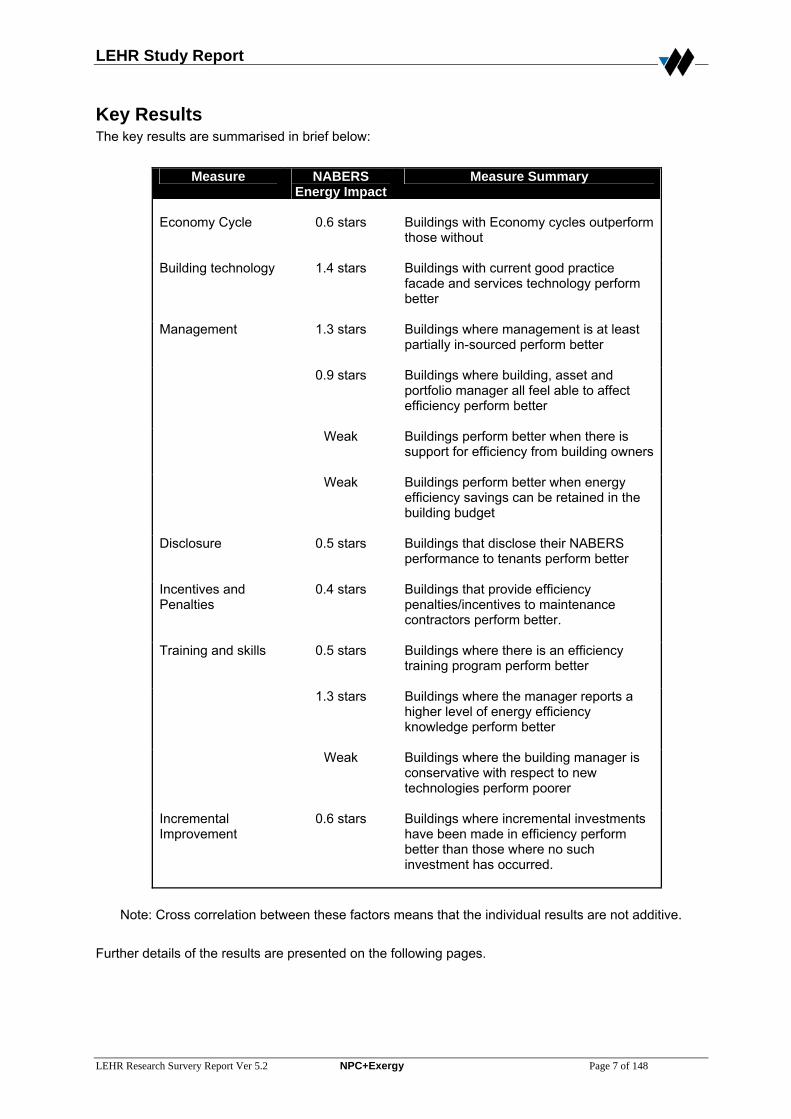
Key Results The key results are summarised in brief below:
Measure NABERS Energy Impact
Measure Summary
Economy Cycle
0.6 stars
Buildings with Economy cycles outperform those without
Building technology
1.4 stars Buildings with current good practice facade and services technology perform better
Management
1.3 stars Buildings where management is at least partially in-sourced perform better
0.9 stars Buildings where building, asset and portfolio manager all feel able to affect efficiency perform better
Weak Buildings perform better when there is support for efficiency from building owners
Weak Buildings perform better when energy efficiency savings can be retained in the building budget
Disclosure
0.5 stars Buildings that disclose their NABERS performance to tenants perform better
Incentives and Penalties
0.4 stars Buildings that provide efficiency penalties/incentives to maintenance contractors perform better.
Training and skills
0.5 stars Buildings where there is an efficiency training program perform better
1.3 stars Buildings where the manager reports a higher level of energy efficiency knowledge perform better
Weak Buildings where the building manager is conservative with respect to new technologies perform poorer
Incremental Improvement
0.6 stars Buildings where incremental investments have been made in efficiency perform better than those where no such investment has occurred.
Note: Cross correlation between these factors means that the individual results are not additive.
Further details of the results are presented on the following pages.
LEHR Study Report
LEHR Research Survery Report Ver 5.2 NPC+Exergy Page 8 of 148
Building Characteristics and Technical Factors The following building-related relationships were identified:
• There is no evidence that property quality across the range Premium, A and B grade has a significant impact on building performance.
• Buildings built within the past 10 years are on average more efficient than older buildings. • Buildings with variable air volume air-conditioning systems show little difference in performance
from other air-conditioning types on average but show an excellent peak potential. This, however, is counteracted by a poor minimum performance, perhaps reflecting the reliance of this system type on control and commissioning for good performance.
• Buildings with economy cycles outperform those without (approximate impact 0.6 stars). • Buildings with generally poor technology performed significantly worse than those with better
technology Of the many factors that did not rate significantly the following factors are noted as showing no impact or significance: Hot water re-heats, the number of floors served by the air-conditioning system and the number of tenants. This indicates that there is specifically no evidence to support these as being significant in determining building performance.
Building Management and Operation The following management and operation related relationships were identified:
• Buildings where the building management is at least partially in-sourced perform better than those with a greater level of outsourcing.
• Public availability of NABERS performance information – particularly to tenants – has a potentially positive impact on base building performance.
• Incentivisation of maintenance contractors for energy efficiency performance produces efficiency dividends.
• Buildings perform better where all members of the building management chain feel they can influence building energy efficiency
• Weaker, but still significant support was found for the following propositions:
o Energy efficiency benefits from support from the building owners,
o Energy efficiency benefits when cost savings can be retained in the building budget.
Of other questions tested, it was found that there was no support for there being a difference in NABERS performance between those operating on gross or net leases. However, only about 5% of the buildings surveyed employed gross leases. Therefore no conclusions can be reached from this study as to the impact of ‘split incentive’ landlord-tenant arrangements on energy efficiency.
Personnel and Skill Factors The following personnel and skill-related relationships were identified:
• Buildings perform better when there is an energy efficiency training program in place. • Managers who considered that they had a greater level of energy efficiency skills were
generally found to operate buildings more efficiently. • Sites where managers were conservative about the implementation of efficiency measures
tended to perform more poorly than sites where managers were prepared to accept some risk in efficiency outcomes.
Of other factors tested, it was found that there was specifically no support for there being a relationship between highest formal qualification level and building performance. This probably reflects the lack of energy efficiency content in the qualifications that are available.

LEHR Study Report
LEHR Research Survery Report Ver 5.2 NPC+Exergy Page 9 of 148
Investment Factors The following investment related relationships were identified:
• Sites that had implemented low-cost management measures had significantly better NABERS performance;
• Sites that had implemented minor capital measures had significantly better NABERS performance.
Of other factors tested it was found that tenant activity in energy efficiency had no impact on base building NABERS performance. This reflects the weak relationship between base building and tenancy NABERS performance.
Perceived Barriers to and Drivers of Energy Efficiency Participants in the building management chain were questioned on their opinions as to the barriers to and drivers of energy efficiency. The following key conclusions were drawn from this part of the study:
• There is a degree of disengagement between portfolio managers and asset/building managers. Asset and building managers are more likely to perceive funding as being an issue.
• Time availability is seen by all managers as a major barrier to energy efficiency uptake and notably this barrier was seen as comparable in magnitude to financial barriers.
• Higher levels of management are more likely to be motivated by company policy than building managers, who are more likely to be motivated by their own environmental concerns.
• OPEX savings featured significantly as a dominating motivator for all managers.
• NABERS ratings were considered a major driver for energy efficiency by asset and building managers, but less so by portfolio managers.
These results indicate that there is a need to improve communication in both directions through the management chain to align objectives.
Water Efficiency The survey also opportunistically included some questions relating to water efficiency, measured on the NABERS water scale. The major conclusions that can be drawn from this are:
• Rainwater collection and the use of air-cooled chillers produce significant improvements in water efficiency.
• Public reporting of NABERS water performance correlates with improved performance, as does the setting of a target for water efficiency. Technical conservatism amongst building managers tends to detract from performance.
• The implementation of low cost management measures and minor capital measures produces performance improvements.
These results largely parallel those for energy efficiency, and indeed a high level of cross correlation was found between sites that had upgraded for energy efficiency and those that had upgraded for water efficiency.
Conclusions The results indicate that there are a number of relatively clearly identifiable factors that can be shown specifically to correlate with improved performance. While it is specifically noted that correlation does not demonstrate causation, the results have been reviewed in this context and in all cases the proposed correlation would reasonably appear to be at least partially causal.
When the above factors are teamed with the apparent magnitude of their impact, it becomes clear that there is potential for most buildings to achieve a 4 Star NABERS Energy base building rating with only limited recourse to major technical refurbishment, which corresponds to a performance improvement of approximately 30% for an average building. Extrapolated across the CBD office building sector, this would be equivalent to a 1.2% reduction in Australia’s total emissions. C and D-Grade buildings were under represented in the sample yet they account for about 20% of the NLA in the sector and anecdotal evidence indicates that they may have a greater energy saving potential per m² than the higher grade buildings. Any efficiency program should target this sub sector using suitable strategies and measures.
LEHR Study Report
LEHR Research Survery Report Ver 5.2 NPC+Exergy Page 10 of 148
1.0 INTRODUCTION Many international studies have shown that the majority of high rise office buildings do not operate at anywhere near their maximum energy efficiency. Many well proven measures with excellent returns on investment are not implemented. This is often termed the ‘energy efficiency gap’ where technically robust savings measures with Internal Rates of Return equal to (or often much better than) that of the core business of the owner or occupant are not implemented. Factors other than feasibility and practicality appear to be in play. These ‘human’ factors act as barriers and appear to include at least processes, practices, knowledge, awareness and attitudes. The primary objective of the Low Energy High Rise (LEHR) research study was to identify the barriers that lead to this gap. Then subject survey data from a sufficiently large and representative sample building population to statistical analysis to determine correlations between barriers and energy performance. The LEHR project team would then use the results of this survey to help determine strategies, mechanisms and tools (a suite of initiatives) to overcome the barriers in existing high rise office buildings in Australia and estimate the Greenhouse gas savings potential of these measures. This report details the outcomes of the statistical analysis of the survey data from a sample of high rise office buildings from cities across Australia. It describes the study approach and methodology and provides an overview of the typical life cycle of and the key stakeholders in the life of a typical office building. A good understanding of these processes and people is needed if the barriers are to be effectively addressed. The market sector for the study is defined and its characteristics and size are addressed together with selection of the sample population. The survey and the surveying process are explained with issues and problems addressed. The statistical techniques used are explained and the results of the statistical analysis given together with an interpretation of the results and conclusions reached.
2.0 BACKGROUND
2.1 The Energy Gap There is ample evidence (as identified in the LEHR Literature Review Report) that the commercial sector internationally carries a high level of unrealised cost-effective energy efficiency opportunity, and the situation in Australia is no different. The potential savings in office buildings have been estimated in the 30-50% region. Many of these opportunities have excellent financial returns but are yet not taken up, indicating that a number of market failures may be occurring. Various US and European studies and reports (as identified in the LEHR Literature Review Report) indicate that this is not just an Australian problem. This failure to take up energy efficient technologies and practices in the sector results in various missed opportunities such as:-
• Reduce energy consumption (by up to 50%) • Reduce greenhouse gas emissions • Reduce water consumption resulting from improved energy efficiency • Reduce peak electricity demand • Create significant financial savings • Improve working conditions and productivity of occupants • Enhance the value of buildings and their rental returns

LEHR Study Report
LEHR Research Survery Report Ver 5.2 NPC+Exergy Page 11 of 148
2.2 The Warren Centre for Advanced Engineering This research project was conceived and sponsored by The Warren Centre for Advanced Engineering. The Warren Centre is an independent, industry-linked institute committed to fostering excellence and innovation in advanced engineering. It is a self-funding, non-profit body operating within the University of Sydney, Australia’s oldest, largest and pre-eminent university. The activities of the Centre are initiated and performed by friends of The Warren Centre — a volunteer group of motivated and committed people who believe in The Centre and its objectives and donate their time and talent to achieve particular outcomes. The Centre brings together leading edge people in a selected field of engineering technology to work as project teams on major technology issues to:
• Develop new insights and knowledge in a specific segment of technology; and • Accelerate a specific technology's use by industry.
These activities impact on engineering practice and business enterprise, and often result in important breakthroughs in the technology. One such project is the LEHR study, the benefits of which The Centre proposes to share with academics, industries and the governments of Australia, China and India. The Warren Centre recognised this industry disconnect or energy gap and so initiated the LEHR project using its unique methodology of engaging industry players in the creation of their own solutions to successfully transform a market sector.
2.3 LEHR Project Overview The primary objective of the LEHR project was to determine strategies, mechanisms, tools and initiatives to overcome barriers to the introduction of proven and cost effective energy efficiency measures in existing high rise office buildings in Australia. The Project Plan allowed for it to be conducted in three stages:
Stage 1 a) Engage the Australian commercial property industry for support in developing a suite
of initiatives including strategies, tools, incentives and measures (e.g. financial instruments and management strategies) to overcome the barriers or create incentives to significantly improve energy efficiency in existing commercial high rise buildings defined as buildings with an NLA of 7,500m2 or greater;
b) Undertake a Literature Review to draw together the current state of knowledge on energy efficiency in the commercial property sector as a starting point for the project;
c) Inform the development of the industry’s suite of initiatives with a ground breaking research project which consisted of developing, conducting and analysing a major industry survey that investigated the premise that “buildings are significantly human rather than merely technical systems and that the key lies in balancing relatively well-trodden technical issues with the far more challenging human and organisational issues that define the ultimate environmental outcomes of buildings in operation”.1
d) The research project’s methodology involved three streams – Building and Tenancies, Behaviour and Process and Modelling, Analysis and Reporting.
1 National Project Consultants & Exergy Pty Ltd Proposal LEHR Research Project 2007
LEHR Study Report
LEHR Research Survery Report Ver 5.2 NPC+Exergy Page 12 of 148
Stage 2 a) Further develop the industry-developed suite of initiatives so that they can be taken up
by the industry and test them in at least 5 case study buildings that are representative of the buildings and tenancies identified by the research project
b) Develop market analysis projections; and c) Disseminate the project’s overall results nationally to stakeholders, including
government, during and at the completion of the project.
Stage 3 This post completion evaluation stage would involve the assessment of the uptake of the suite of initiatives and their impact on energy efficiency. As some time is needed to allow industry and/or government to deploy the various initiatives before the third stage can be undertaken this third stage is beyond the scope of the LEHR project.
3.0 APPROACH AND METHODOLOGY The research project approach included the following key approaches:
• Close collaboration with the project’s industry Working Groups to analyse the technical (e.g. building materials, areas, systems, equipment) and non technical (e.g. people, their behaviour and decision making processes) data and information.
• Completion of qualitative and quantitative research through a series of surveys including Building, Tenancy and Manager (building manager, asset and portfolio manager) Surveys; to understand the processes, behaviours, motivations and barriers to the uptake of energy efficiency.
• Analysis of the data to determine trends and which suggested actions in the suite of initiatives should produce benefits.
• Data analysis to test for any correlations between energy use and consumption related drivers such as age, construction type, occupant’s tenure, nature of HVAC etc.
• Reporting on the results of the LEHR research project.
3.1 Determining Sample Sufficiency In studies of this kind, within reason, the larger the sample set, the better. However, time and cost issues placed practical limitations on the sample size. As there are over 2,000 buildings rated D and above in the capital city CBDs of Australia it was not possible or feasible to survey and analyse all buildings. It was agreed that a smaller sample sizes would yield robust statistical results and valid outcomes, provided certain tests were used to confirm the sufficiency of the sample data set. In response the survey team implemented the following tests:
• Statistical significance tests - statistical tests to determine the statistical significance of the data set with respect to major conclusions and significant representative factors such as average performance data.
• Representational coverage - for the detailed surveys, the issue of sufficiency was determined by coverage rather than statistics. We ensured, through consultation with the Working Groups and a trial survey phase, that our detailed surveys covered examples of leading trends in operation and management that become apparent through the surveys.
• Bias tests - in assembling a data sample, there is often a risk of bias appearing in the sample from a number of sources, including:
o Geographical bias. This was deemed important given that there is strong evidence of different technical and management practices in different markets (for instance the incidence of gross leasing is generally correlated with the relative negotiating
LEHR Study Report
LEHR Research Survery Report Ver 5.2 NPC+Exergy Page 13 of 148
position of tenants versus landlords in a given market). This was managed by ensuring that the sample covered buildings in each of the capital cities.
o Climatic bias. While the vast majority of Australian commercial buildings lie in a generally temperate region, there are significant populations in sub-tropical (i.e. Brisbane) and cool temperate (i.e. Canberra) regions as well as smaller populations in tropical (i.e. Darwin) regions. The sample included good representation from all major regions in a manner that broadly represents the building population. This does mean, however, that the sample is heavily biased to temperate regions.
o “Best site” bias. One of the more insidious risks of requesting data from industry is the possibility that one is only provided with the “good” buildings. Experience shows that this risk is perhaps overstated as most industry groups are not afraid to “air their dirty laundry” in a confidential environment; but nonetheless, it is a risk that has to be monitored and managed. With respect to energy efficiency, this is relatively easily achieved and a review of the characteristics of the final sample population indicates that there was no such bias.
o Institutional owner bias (affecting base building sample). The conventional approach to data sourcing is to approach major portfolio owners. This however risks bias in that these owners might reasonably be expected to have higher developed systems than minor owners. This issue was managed by using a variety of alternative data sourcing routes, in particular tenant groups and real estate managers such as Jones Lang LaSalle. In both cases these groups operate across the full range of ownership organisations.
o Size bias (affecting tenancy sample). There is reasonable anecdotal evidence of differences in tenancy behaviour as the tenancy floor plate increases. This was assessed through looking at the range of tenancy sizes in the domain population and ensuring that there was reasonably good coverage across all sizes.
o Institutional tenant bias (affecting tenancy sample). The conventional approach to data sourcing is to approach major tenants, such as major accounting firms or government departments. This, however, risks bias in that these tenants can reasonably be expected to be different from other tenant groups. The degree to which this bias is relevant is determined by the degree to which the domain population is dominated by such tenants; if larger office buildings are typically tenants by such organisations then there is little bias introduced. To address this bias issue the study team worked with owners to review tenant lists in relevant buildings and target representative rather than necessarily the largest tenant.
Given the range of potentially biasing effects, it was important to define a sampling methodology that was relatively robust to such issues. The approach adopted was as follows:
• Data was sought from major portfolio groups, including: AMP, Mirvac, Colonial First State, Stocklands, GPT, ISPT, Investa, Macquarie, (etc). Wherever possible, the team sought full portfolio capture for each organisation. This provided assurance that “best site” bias was avoided.
• Data was sought from owner organisations associated with buildings identified in the tenant survey
• Data was sought via major real estate agents as representatives of both landlords and tenants in a wide range of buildings outside the major portfolios.
• Data was sought from major tenants, including: state and federal government, major accounting firms, consultancy firms, and banks. Wherever possible, the study team aimed to gain full portfolio capture for each organisation. This provided assurance that “best site” bias was avoided.

LEHR Study Report
LEHR Research Survery Report Ver 5.2 NPC+Exergy Page 14 of 148
• Tenant lists were also sought from owner organisations associated with buildings identified in the base building survey. From this, tenant types and sizes were characterised and contacts to obtain a representative tenant sample, although it is noted that this was not always possible to follow through.
Where data was deemed inadequate in terms of the representation of geographical, climatic and city/regional markets, specific and relevant in-fill data was sought. The general test for representativeness was that the sample should broadly reflect the population structure.
3.2 Surveys Three survey types were developed:
o Base Building o Tenancy o Managers
Each survey was developed in electronic format for secure online access via the Internet. This allowed respondents the flexibility of completing the surveys over time whilst allowing the survey team to remotely monitor completion status and rates. A structured format was used to enable categorisation of responses. However, open-ended answers were also permitted within the structure to enable non-standard situations to be identified. A hard copy of the surveys is provided in Appendix G; however, this does not demonstrate many of the dynamic features built into the live version of the survey. An electronic copy will be maintained at the following url until at least the end of 2009 and this allows users to activate its full functionality in regard to drop down menus and other dynamic features. LEHR web-based research survey http://lehr.npc.com.au/LEHR/html/survey_portal.epl
Base Building Survey This survey was designed to be completed by the facility or building manager responsible for the day to day running of the sample building. It was also accessible by the Asset and Portfolio Managers responsible for the building. It comprised two sections: Technical –this part of the questionnaire addressed physical and operational matters that will or may impact on energy consumption. These included: location, age, time of last and next major refurbishment, areas by end use type (many office towers have retail tenancies), storeys, HVAC plant type and significant features, BMS (age, type and scope), façade type, energy sources, energy and water use history, NABERS Energy performance (formerly ABGR) and/or associated inputs; NABERS water performance and associated inputs, nature and scope of extant energy and water efficiency measures, sub metering, hours of use, occupancy levels, extraordinary energy loads (e.g. data centre), etc. Management – people, structures and process aspects impacting on energy use such as forms of lease and contract, investment decision making, energy and water management plans and senior management commitment to utility efficiency.
The following shows the subject headings for each section: Technical Data and Information
o Building Identifiers o Contact details o Building Details o Building Performance Data
LEHR Study Report
LEHR Research Survery Report Ver 5.2 NPC+Exergy Page 15 of 148
o Refurbishment history o Building Architecture o Building Services o Dominant air conditioning type o Lighting o BMS & Monitoring o Car Park o Water Use
Management Practices
o Building Operation o Leasing Details o Energy Management o Maintenance
Tenancy Survey This questionnaire was completed by one tenant occupying a significant floor area in each sample building selected for a base Building Survey. This confidential questionnaire was kept brief and simple both because tenant organisations generally do not have access to energy technical resources in-house and because of the lower impact tenants have on the energy efficiency of building services. Few technical questions were asked (eg NLA, lease expiry date, lease form), the main focus was on human aspects (attitudes, behaviour, knowledge) and management practices. As with the Base Building survey, a structured format was used to enable categorisation of responses, with some open-ended answers also permitted.
Management Survey This survey, which was confidential to each respondent, was designed for completion by potentially 3 people per sample building: Building Manager, Asset Manager and Portfolio Manager reflecting the three levels of a typical property section of a fund manager. Some of the smaller portfolios and of course the single buildings had much flatter management structures so only 1 or 2 surveys needed to be completed for such buildings. The same survey was used for each manager category and comprised quite an extensive range of non technical questions categorised as follows:
o Level of Authority o Authority over energy matters o Responsibility Limits o Incentives o Attitude o Response Activities o Knowledge o Barriers & Incentives
3.3 Analysis Two basic streams were involved in the data analysis process, namely:
• Statistical analysis, which used the data gathered to determine the existence of trends; and
• Anecdotal/causal analysis, which used assessment of the facts presented to identify what should produce benefits.
LEHR Study Report
LEHR Research Survery Report Ver 5.2 NPC+Exergy Page 16 of 148
These two streams were found to interact in several ways, in particular: • Statistical correlation by itself does not demonstrate causality, and thus needs to be
backed by causal analysis;
• The high degree of noise or inaccuracy in some data meant that even logically causal trends were drowned out by other factors, meaning that there was no statistical support for items that seem logically causal;
• Levels of activity were in some cases so weak that apparently influential practices have not yet made an impact;
• Some items that appeared logically causal did not seem to work, as demonstrated by statistical analysis.
The inherent uncertainties and contradictions in the above meant that considerable care was required in the analysis process and the means by which conclusions were drawn. The analysis process adopted was as follows: Anecdotal/Causal Analysis - review the results of the questionnaires from both the base building and tenancy surveys with a particular focus on:
• Sites with high levels of implementation and their management structures; • Sites with low levels of implementation and how their management structures differed
from those with high levels of implementation • Stakeholder feedback on incentives and disincentives to implementation at these sites • Identified conflicts and contradictions in the information provided by different
stakeholders. From this we developed a picture of key representative management processes and the barriers and incentives for energy efficiency in each area. Statistical Analysis - We took the identified causal trends and structures identified in the anecdotal and causal analysis and reviewed the degree to which these demonstrate statistical significance. A number of techniques were used in this regard:
• Management practices were categorised to enable comparison of one group against another. As a far as possible these were linked to the causal issues
• Buildings were categorised by physical features and systems to enable differences in manageability and/or inherent physical performance limits to be separated from management issues;
• The impact of physical features were tested for statistical significance against the balance of the data set;
• The impact of management practices were tested for statistical significant both in the data set as a whole and against sub-categories of building type.
• Statistical tests were used in this process.
LEHR Study Report
LEHR Research Survery Report Ver 5.2 NPC+Exergy Page 17 of 148
4.0 OFFICE MARKET SIZE AND CHARACTERISTICS
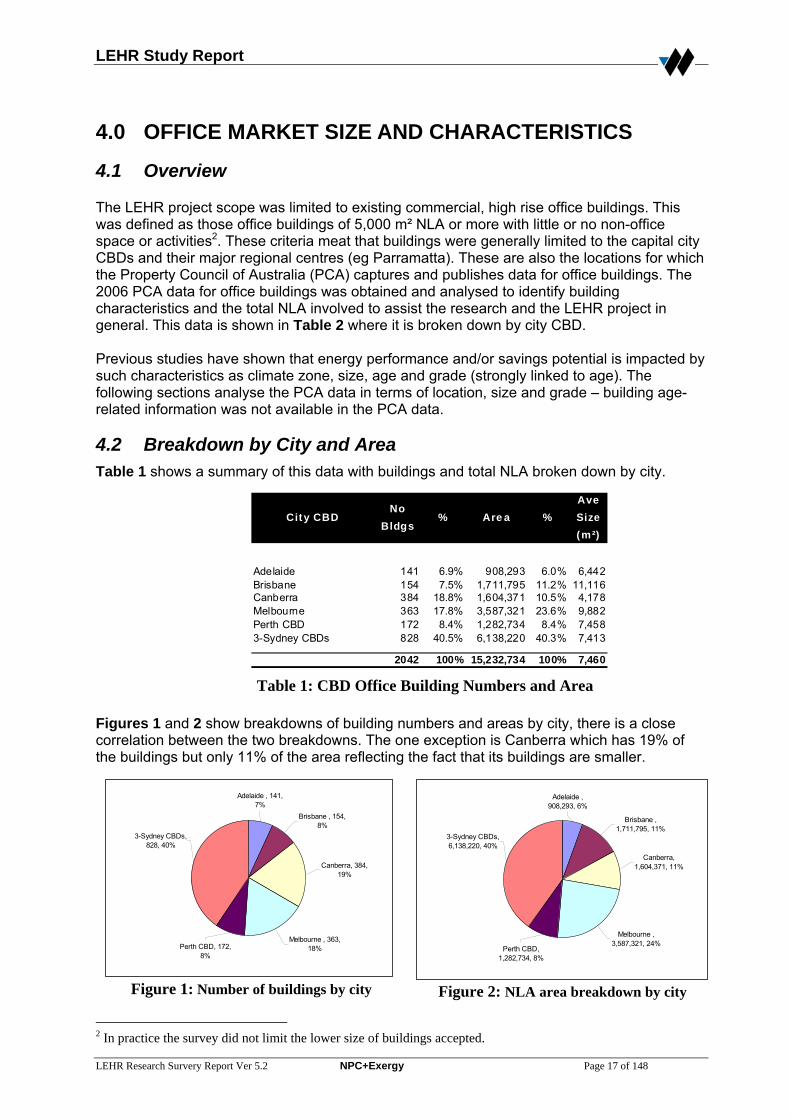
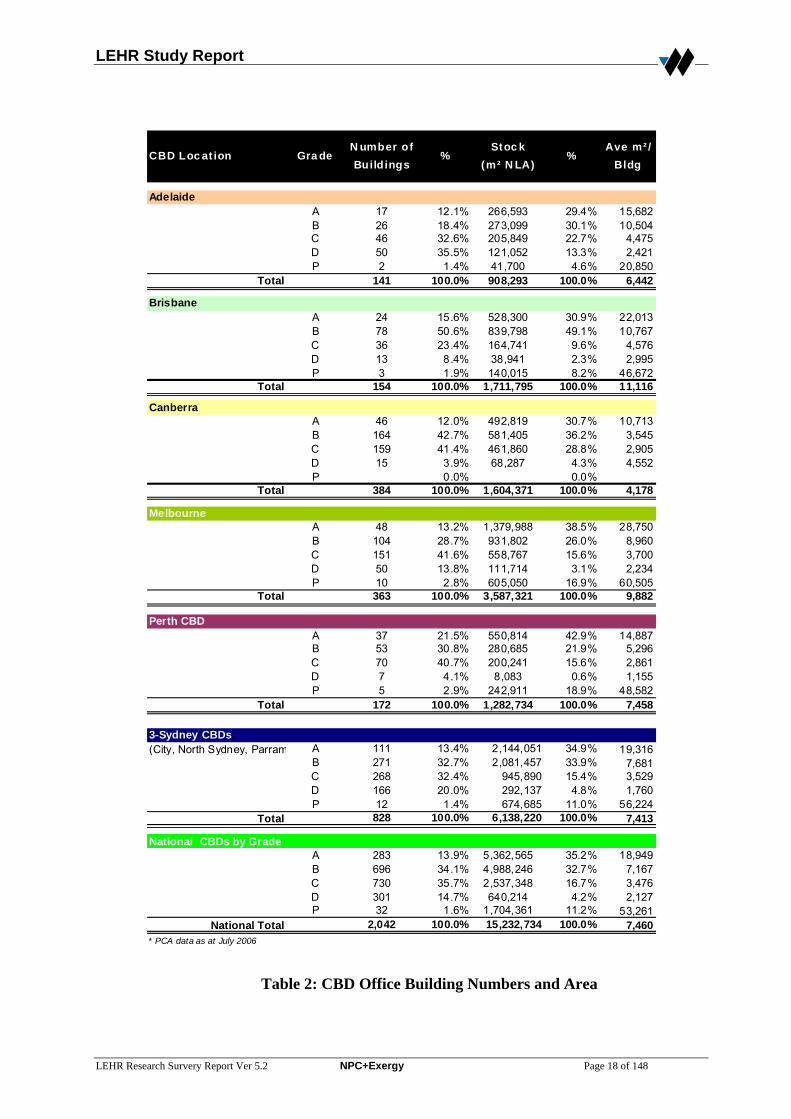
4.1 Overview The LEHR project scope was limited to existing commercial, high rise office buildings. This was defined as those office buildings of 5,000 m² NLA or more with little or no non-office space or activities2. These criteria meat that buildings were generally limited to the capital city CBDs and their major regional centres (eg Parramatta). These are also the locations for which the Property Council of Australia (PCA) captures and publishes data for office buildings. The 2006 PCA data for office buildings was obtained and analysed to identify building characteristics and the total NLA involved to assist the research and the LEHR project in general. This data is shown in Table 2 where it is broken down by city CBD. Previous studies have shown that energy performance and/or savings potential is impacted by such characteristics as climate zone, size, age and grade (strongly linked to age). The following sections analyse the PCA data in terms of location, size and grade – building age-related information was not available in the PCA data.
4.2 Breakdown by City and Area Table 1 shows a summary of this data with buildings and total NLA broken down by city.
City CBDNo
Bldgs% Area %
Ave Size (m²)
Adelaide 141 6.9% 908,293 6.0% 6,442Brisbane 154 7.5% 1,711,795 11.2% 11,116Canberra 384 18.8% 1,604,371 10.5% 4,178Melbourne 363 17.8% 3,587,321 23.6% 9,882Perth CBD 172 8.4% 1,282,734 8.4% 7,4583-Sydney CBDs 828 40.5% 6,138,220 40.3% 7,413
2042 100% 15,232,734 100% 7,460 Table 1: CBD Office Building Numbers and Area
Figures 1 and 2 show breakdowns of building numbers and areas by city, there is a close correlation between the two breakdowns. The one exception is Canberra which has 19% of the buildings but only 11% of the area reflecting the fact that its buildings are smaller.
Adelaide , 141, 7%
Brisbane , 154, 8%
Canberra, 384, 19%
Melbourne , 363, 18%Perth CBD, 172,
8%
3-Sydney CBDs, 828, 40%
Figure 1: Number of buildings by city
3-Sydney CBDs, 6,138,220, 40%
Perth CBD, 1,282,734, 8%
Melbourne , 3,587,321, 24%
Canberra, 1,604,371, 11%
Brisbane , 1,711,795, 11%
Adelaide , 908,293, 6%
Figure 2: NLA area breakdown by city
2 In practice the survey did not limit the lower size of buildings accepted.
LEHR Study Report
LEHR Research Survery Report Ver 5.2 NPC+Exergy Page 18 of 148
CBD Location GradeNumber ofBuildings
%Stock
(m² NLA)%
Ave m²/ Bldg
Adelaide A 17 12.1% 266,593 29.4% 15,682B 26 18.4% 273,099 30.1% 10,504C 46 32.6% 205,849 22.7% 4,475D 50 35.5% 121,052 13.3% 2,421P 2 1.4% 41,700 4.6% 20,850
Total 141 100.0% 908,293 100.0% 6,442
Brisbane A 24 15.6% 528,300 30.9% 22,013B 78 50.6% 839,798 49.1% 10,767C 36 23.4% 164,741 9.6% 4,576D 13 8.4% 38,941 2.3% 2,995P 3 1.9% 140,015 8.2% 46,672
Total 154 100.0% 1,711,795 100.0% 11,116
CanberraA 46 12.0% 492,819 30.7% 10,713B 164 42.7% 581,405 36.2% 3,545C 159 41.4% 461,860 28.8% 2,905D 15 3.9% 68,287 4.3% 4,552P 0.0% 0.0%
Total 384 100.0% 1,604,371 100.0% 4,178
Melbourne A 48 13.2% 1,379,988 38.5% 28,750B 104 28.7% 931,802 26.0% 8,960C 151 41.6% 558,767 15.6% 3,700D 50 13.8% 111,714 3.1% 2,234P 10 2.8% 605,050 16.9% 60,505
Total 363 100.0% 3,587,321 100.0% 9,882
Perth CBDA 37 21.5% 550,814 42.9% 14,887B 53 30.8% 280,685 21.9% 5,296C 70 40.7% 200,241 15.6% 2,861D 7 4.1% 8,083 0.6% 1,155P 5 2.9% 242,911 18.9% 48,582
Total 172 100.0% 1,282,734 100.0% 7,458
3-Sydney CBDs(City, North Sydney, Parram A 111 13.4% 2,144,051 34.9% 19,316
B 271 32.7% 2,081,457 33.9% 7,681C 268 32.4% 945,890 15.4% 3,529D 166 20.0% 292,137 4.8% 1,760P 12 1.4% 674,685 11.0% 56,224
Total 828 100.0% 6,138,220 100.0% 7,413
National CBDs by GradeA 283 13.9% 5,362,565 35.2% 18,949B 696 34.1% 4,988,246 32.7% 7,167C 730 35.7% 2,537,348 16.7% 3,476D 301 14.7% 640,214 4.2% 2,127P 32 1.6% 1,704,361 11.2% 53,261
National Total 2,042 100.0% 15,232,734 100.0% 7,460* PCA data as at July 2006
Table 2: CBD Office Building Numbers and Area

LEHR Study Report
LEHR Research Survery Report Ver 5.2 NPC+Exergy Page 19 of 148
4.3 Breakdown by Grade Of the 2,042 buildings in the 2006 PCA database, over 1,700 of them were rated from B to D accounting for almost 85% of the total, C and D buildings accounted for about 50% of the total. While the NLA of these C and D buildings only accounted for about 20% of the total NLA, their level of potential energy saving per m² is higher, leaving them as a significant sub sector for targeted energy efficiency improvement measures. Table 3 shows both the PCA data for the whole national office building sector and the study’s sample population broken down by PCA Grade.
PCA Grade (% and #) Population P A B C D Total
National PCA # 32 283 696 730 301 2,042
National PCA % 1.6 13.9 34.1 35.7 14.7 100
Study population # 12 43 35 6 0 96
Study population % 10 37 30 5 0 18
Study/national total % 38 15 5 <1 0 5
Table 3: Office sector breakdown by PCA Grade Clearly the survey sample population has a bias towards higher quality buildings with about 6 and 3 times as many buildings in the Premium and A-Grade categories respectively than has the total population but only 1/7th the number of C-Grade and no D-Grade buildings at all. B-grade buildings, by contrast, are represented in a proportion that reflects the national population well. This outcome is most likely due to the fact that the respondents were mostly owners of large portfolios such as investment funds and Government. These owners generally only invest in higher grade buildings or buy lower grade properties so as to upgrade them. Smaller private portfolio or individual property owners are more likely to be able to afford and hold smaller and cheaper C and D-Grade properties; however, these types of owners were not well represented in the survey population.
5.0 DATA SOURCES REVIEW A key objective was to develop an understanding of the empirical relationships between building practices and building energy performance. As such, the research project required sufficient data coverage and quality to enable the statistical testing of suspected causal relationships to energy, and to test for as yet un-proven drivers of energy usage. To achieve these objectives, a sufficient diversity of responses was required for element testing. It was understood that a core objective of LEHR was to understand the impacts on operational energy use within buildings, rather than total greenhouse emissions. To study these impacts, total building energy consumption was a study focus, in addition to greenhouse gas emissions. This assisted in the differentiation between greenhouse reductions achieved on site (through efficiency), as opposed to offsite (through procurement of green power, etc).
5.1 Data available Surveys were distributed to a total of 189 base buildings, 188 tenants and 296 managers with broad geographical distribution across Australian cities. Data exhibited a wide variety in the quality of response, varying from complete and plausible, to critically incomplete or non-plausible responses, to those surveys that had not been started at all (refer Table 4).
LEHR Study Report
LEHR Research Survery Report Ver 5.2 NPC+Exergy Page 20 of 148
All sufficiently completed Base Building responses were retained in the primary study, but manager and tenancy surveys for which the corresponding base building survey was not complete were omitted due to the inability to compare responses with consumption data. All completed surveys, regardless of the presence of the corresponding base building survey, were retained for the purposes of calculating knowledge levels and correlations within survey responses.
Survey Type Distributed Acceptable Excluded Not Started
Base Building 189 127 42 20
Tenancy 188 102 8 78
Manager 296 173 19 104
Table 4: Survey Completion Data
Table 5 shows the number of Tenant and Manager surveys that were suitable for inclusion in the analysis given that a corresponding acceptable Base Building survey was a pre-requisite.
Survey Combination Sites Building & Tenancy 67
Building & Manager 91
Building, Tenancy & Manager 53 Table 5: Complete Survey Combinations
Figure 3 shows the distribution of all surveys by state broken down into those included and those rejected as having fatal flaws or not started/incomplete. The ratio of included surveys by state reasonably reflects the total population of subject buildings in each state.
Figure 3: Distribution of building surveys by state
LEHR Study Report
LEHR Research Survery Report Ver 5.2 NPC+Exergy Page 21 of 148
The breakdown of the Manager and Tenancy according to the status of the corresponding base building survey, are given in Table 6 and Table respectively.
Surveys Corresponding Base Building Survey was acceptable 118 Corresponding Base Building Survey was excluded 55
Table 6: Distribution of Completed Manager Surveys
Surveys Corresponding Base Building Survey was acceptable 67 Corresponding Base Building Survey was excluded 35
Table 7: Distribution of Completed Tenancy Surveys
5.2 Responses Survey data were first screened for responses from the participant. A usable response was either a sensible response to the question (numeric for numeric questions, selection from a drop-down menu etc), or a response of “don’t know”. The responses in the “don’t know” category have been treated as critically different and informative, as compared to questions with no response at all.
5.3 Missing data and proxies A number of surveys were largely complete but missing some important data which otherwise precluded them from use in the analysis. However, in many cases, a proxy variable could be used. For instance, if a site did not specify its electricity consumption, but did specify a NABERS Office Energy rating, it was possible to use the NABERS Office Energy rating as a proxy for energy intensity. The following proxies and alterations were made to the data:
• NABERS Office Energy rating. For those sites where no formal NABERS Office Energy rating was provided, an approximate NABERS Office Energy rating was calculated based on available data.
• NABERS Office Water rating. For those sites where no formal NABERS Office Water rating was provided, an approximate rating was calculated based on available data.
• Post Code (Base building Q1.5): Where the suburb was provided without its corresponding postcode, the correct postcode was added.
• Operational Hours (Base building Q4.4): A number of buildings reported hours of operation between 8 and 12 hours per week. However, based on the buildings in question, the reported hours appear to be for hours per day. These have been extrapolated to a 5 day working week.
• Manager Role (Manager Q3.4a-b): Where no answer was recorded for the role of the respondent (the options provided were Asset Manager (AM), Building Manager (BM) and Portfolio Manager (PM)) but a description of the duties was recorded, the manager type best matching the written description was used.
5.4 Survey Exclusions A set of exclusion criteria were developed, to decide which surveys were sufficiently complete to be useful in data analysis. Each survey entry was assessed against the selection criteria in sequential order, with failure on any single criteria justification for exclusion. The exclusion criteria were developed to ensure that a minimum set of essential questions had to be answered with a valid response.
LEHR Study Report
LEHR Research Survery Report Ver 5.2 NPC+Exergy Page 22 of 148
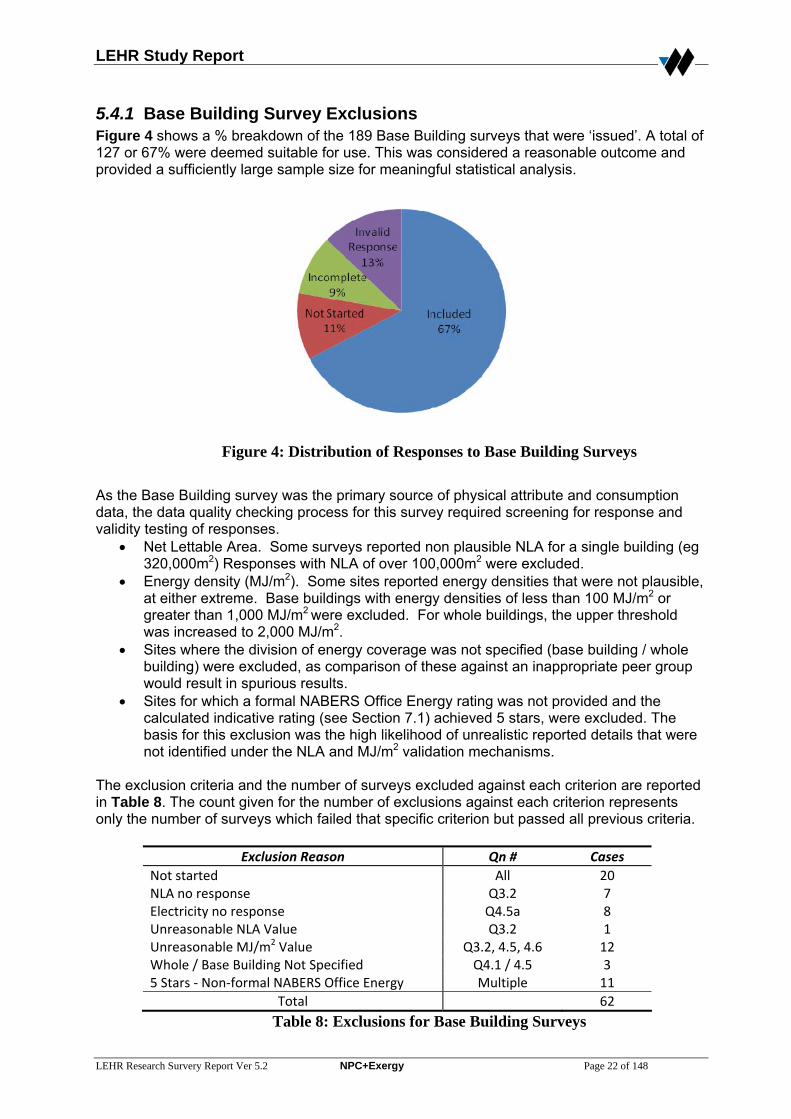
5.4.1 Base Building Survey Exclusions Figure 4 shows a % breakdown of the 189 Base Building surveys that were ‘issued’. A total of 127 or 67% were deemed suitable for use. This was considered a reasonable outcome and provided a sufficiently large sample size for meaningful statistical analysis.
Figure 4: Distribution of Responses to Base Building Surveys
As the Base Building survey was the primary source of physical attribute and consumption data, the data quality checking process for this survey required screening for response and validity testing of responses.
• Net Lettable Area. Some surveys reported non plausible NLA for a single building (eg 320,000m2) Responses with NLA of over 100,000m2 were excluded.
• Energy density (MJ/m2). Some sites reported energy densities that were not plausible, at either extreme. Base buildings with energy densities of less than 100 MJ/m2 or greater than 1,000 MJ/m2
were excluded. For whole buildings, the upper threshold was increased to 2,000 MJ/m2.
• Sites where the division of energy coverage was not specified (base building / whole building) were excluded, as comparison of these against an inappropriate peer group would result in spurious results.
• Sites for which a formal NABERS Office Energy rating was not provided and the calculated indicative rating (see Section 7.1) achieved 5 stars, were excluded. The basis for this exclusion was the high likelihood of unrealistic reported details that were not identified under the NLA and MJ/m2 validation mechanisms.
The exclusion criteria and the number of surveys excluded against each criterion are reported in Table 8. The count given for the number of exclusions against each criterion represents only the number of surveys which failed that specific criterion but passed all previous criteria.
Exclusion Reason Qn # Cases
Not started All 20 NLA no response Q3.2 7 Electricity no response Q4.5a 8 Unreasonable NLA Value Q3.2 1 Unreasonable MJ/m2 Value Q3.2, 4.5, 4.6 12 Whole / Base Building Not Specified Q4.1 / 4.5 3 5 Stars ‐ Non‐formal NABERS Office Energy Multiple 11
Total 62 Table 8: Exclusions for Base Building Surveys

LEHR Study Report
LEHR Research Survery Report Ver 5.2 NPC+Exergy Page 23 of 148
Due to the large proportion of incomplete surveys, some surveys which were near complete but failed only one of the essential criteria were still retained in the study. However, no leniency was given where the exclusion criteria involved consumption data. A list of the buildings excluded based on the unreasonable MJ/m2 or 5 stars informal NABERS Office Energy rating are detailed in Appendix A.
5.4.2 Manager Survey Exclusions For a Manager survey to be deemed sufficiently complete, it was required that the manager had completed the majority of question 9 relating to their qualifications and knowledge of building operations. In implementing this criterion, the cut-off point for sufficient completion was set at responses to 50% of questions. A disappointing 41% were either not started or incomplete. Just 173 or 40% were deemed suitable in spite of exhaustive follow up (see Table 9 and Figure 5).
Figure 5: Distribution of responses to Manager Survey
In handling the management surveys, a number of surveys did not include a response for “authority in regards to the premises” which was used as the basis for the separation into Asset, Building and Portfolio Managers. In the majority of these cases a comment was provided with regards to the manager’s authority and this was used for classification purposes. Only when neither a comment nor a response to the original question was recorded were surveys excluded. In addition to describing the manager’s role and experience, a requirement was included that at least a partial response was made regarding management policies and operations. The method used for defining sufficient completion in this case was that at least one of questions 4 to 8 were fully answered.
Exclusion Reason Qn # Cases Not Started NA 104 Knowledge 9 16
Type of Manager 3.4 2 Survey Body 4‐8 1
Total 123 Table 9: Exclusions for Manager Surveys
LEHR Study Report
LEHR Research Survery Report Ver 5.2 NPC+Exergy Page 24 of 148
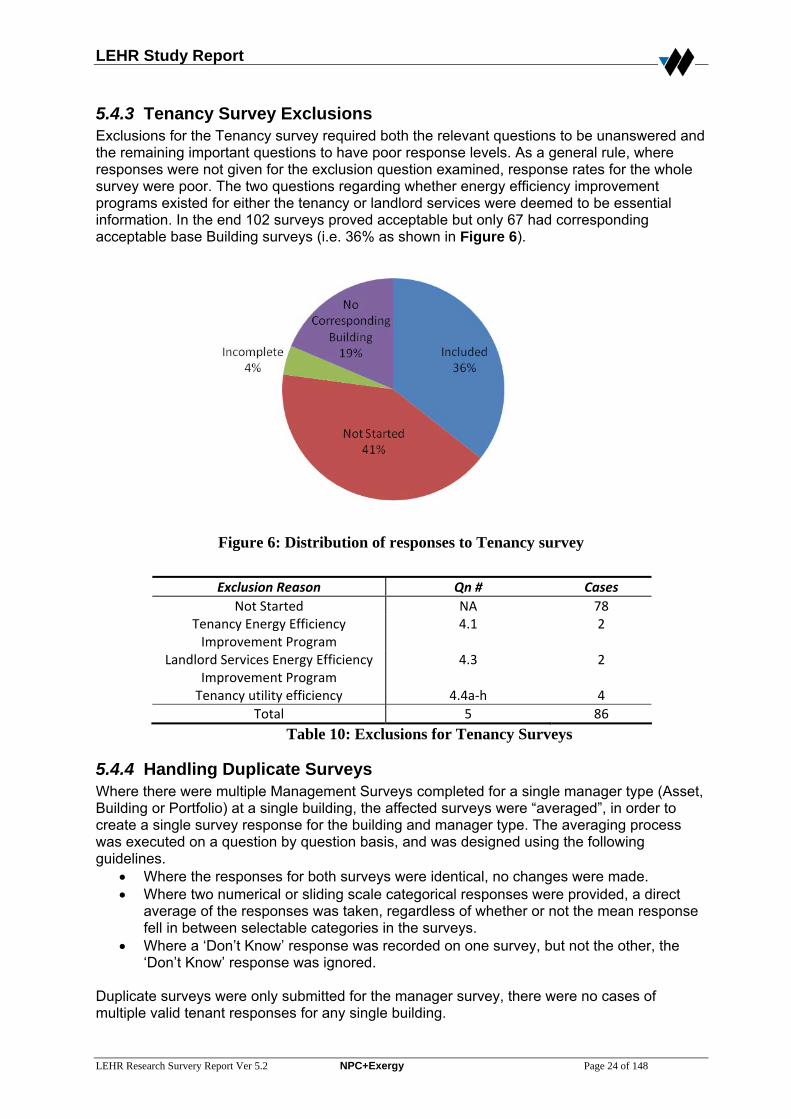
5.4.3 Tenancy Survey Exclusions Exclusions for the Tenancy survey required both the relevant questions to be unanswered and the remaining important questions to have poor response levels. As a general rule, where responses were not given for the exclusion question examined, response rates for the whole survey were poor. The two questions regarding whether energy efficiency improvement programs existed for either the tenancy or landlord services were deemed to be essential information. In the end 102 surveys proved acceptable but only 67 had corresponding acceptable base Building surveys (i.e. 36% as shown in Figure 6).
Figure 6: Distribution of responses to Tenancy survey
Exclusion Reason Qn # Cases
Not Started NA 78 Tenancy Energy Efficiency Improvement Program
4.1 2
Landlord Services Energy Efficiency Improvement Program
4.3 2
Tenancy utility efficiency 4.4a‐h 4 Total 5 86
Table 10: Exclusions for Tenancy Surveys
5.4.4 Handling Duplicate Surveys Where there were multiple Management Surveys completed for a single manager type (Asset, Building or Portfolio) at a single building, the affected surveys were “averaged”, in order to create a single survey response for the building and manager type. The averaging process was executed on a question by question basis, and was designed using the following guidelines.
• Where the responses for both surveys were identical, no changes were made. • Where two numerical or sliding scale categorical responses were provided, a direct
average of the responses was taken, regardless of whether or not the mean response fell in between selectable categories in the surveys.
• Where a ‘Don’t Know’ response was recorded on one survey, but not the other, the ‘Don’t Know’ response was ignored.
Duplicate surveys were only submitted for the manager survey, there were no cases of multiple valid tenant responses for any single building.
LEHR Study Report
LEHR Research Survery Report Ver 5.2 NPC+Exergy Page 25 of 148
5.5 Data Characteristics
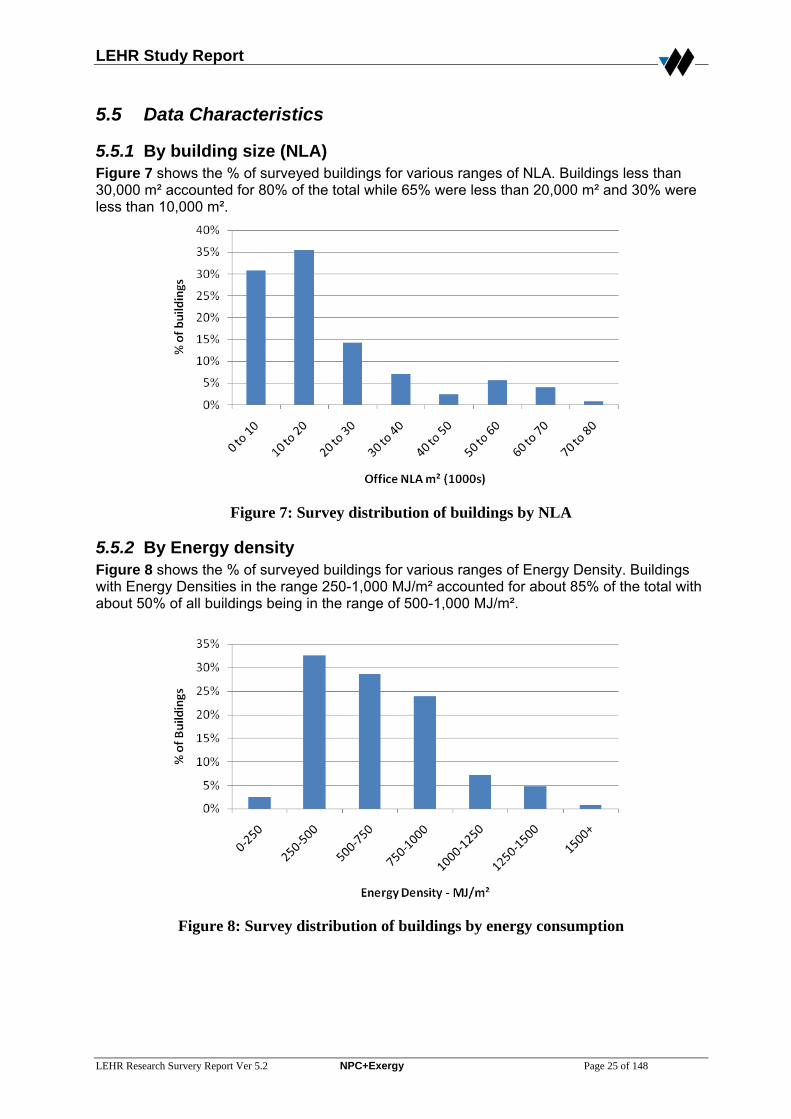
5.5.1 By building size (NLA) Figure 7 shows the % of surveyed buildings for various ranges of NLA. Buildings less than 30,000 m² accounted for 80% of the total while 65% were less than 20,000 m² and 30% were less than 10,000 m².
Figure 7: Survey distribution of buildings by NLA
5.5.2 By Energy density Figure 8 shows the % of surveyed buildings for various ranges of Energy Density. Buildings with Energy Densities in the range 250-1,000 MJ/m² accounted for about 85% of the total with about 50% of all buildings being in the range of 500-1,000 MJ/m².
Figure 8: Survey distribution of buildings by energy consumption

LEHR Study Report
LEHR Research Survery Report Ver 5.2 NPC+Exergy Page 26 of 148
5.5.3 Relative Car Park Size Figure 9 shows the % of surveyed buildings for various ranges of car space capacity. Buildings with 10 or less spaces per 1,000 m² NLA accounted for about 70% of the survey sample population.
Figure 9: Survey distribution of Car Spaces per 1,000 m² NLA
5.6 NABERS Office Energy Ratings The primary benchmark used for building performance in the data analysis section was the NABERS Office Energy rating. Respondents to the Base Building survey were given the option of providing consumption and NABERS Office Energy rating information for either the base building or the whole building. As shown in Table , 86 respondents (68%) provided a Base Building rating, while half as many at 41 (32%) provided a Whole Building rating. For these responses the average Base Building rating was 2.87 Stars with an average of 2.96 for the Whole Building rating. Response Type Surveys Proportion Mean Rating Median Rating Base Building 86 68% 2.87 3.25 Whole Building 41 32% 2.96 2.91
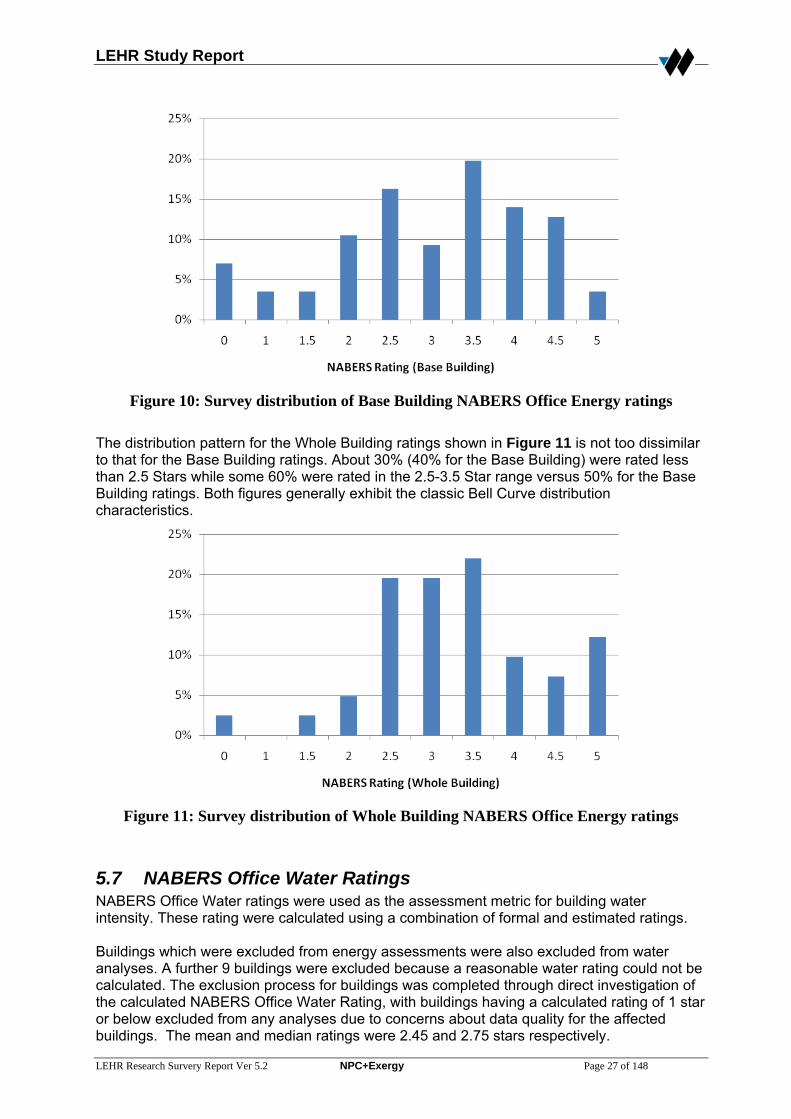
Table 11: Division of responses by rating type Figure 10 shows the % of surveyed buildings for various NABERS Star ratings. About 40% were rated at 2.5 Stars or less and 60% rated at 3-5 Stars. About 45% of those surveyed had ratings in the 2.5-3.5 range.
LEHR Study Report
LEHR Research Survery Report Ver 5.2 NPC+Exergy Page 27 of 148
Figure 10: Survey distribution of Base Building NABERS Office Energy ratings
The distribution pattern for the Whole Building ratings shown in Figure 11 is not too dissimilar to that for the Base Building ratings. About 30% (40% for the Base Building) were rated less than 2.5 Stars while some 60% were rated in the 2.5-3.5 Star range versus 50% for the Base Building ratings. Both figures generally exhibit the classic Bell Curve distribution characteristics.
Figure 11: Survey distribution of Whole Building NABERS Office Energy ratings
5.7 NABERS Office Water Ratings NABERS Office Water ratings were used as the assessment metric for building water intensity. These rating were calculated using a combination of formal and estimated ratings. Buildings which were excluded from energy assessments were also excluded from water analyses. A further 9 buildings were excluded because a reasonable water rating could not be calculated. The exclusion process for buildings was completed through direct investigation of the calculated NABERS Office Water Rating, with buildings having a calculated rating of 1 star or below excluded from any analyses due to concerns about data quality for the affected buildings. The mean and median ratings were 2.45 and 2.75 stars respectively.
LEHR Study Report
LEHR Research Survery Report Ver 5.2 NPC+Exergy Page 28 of 148
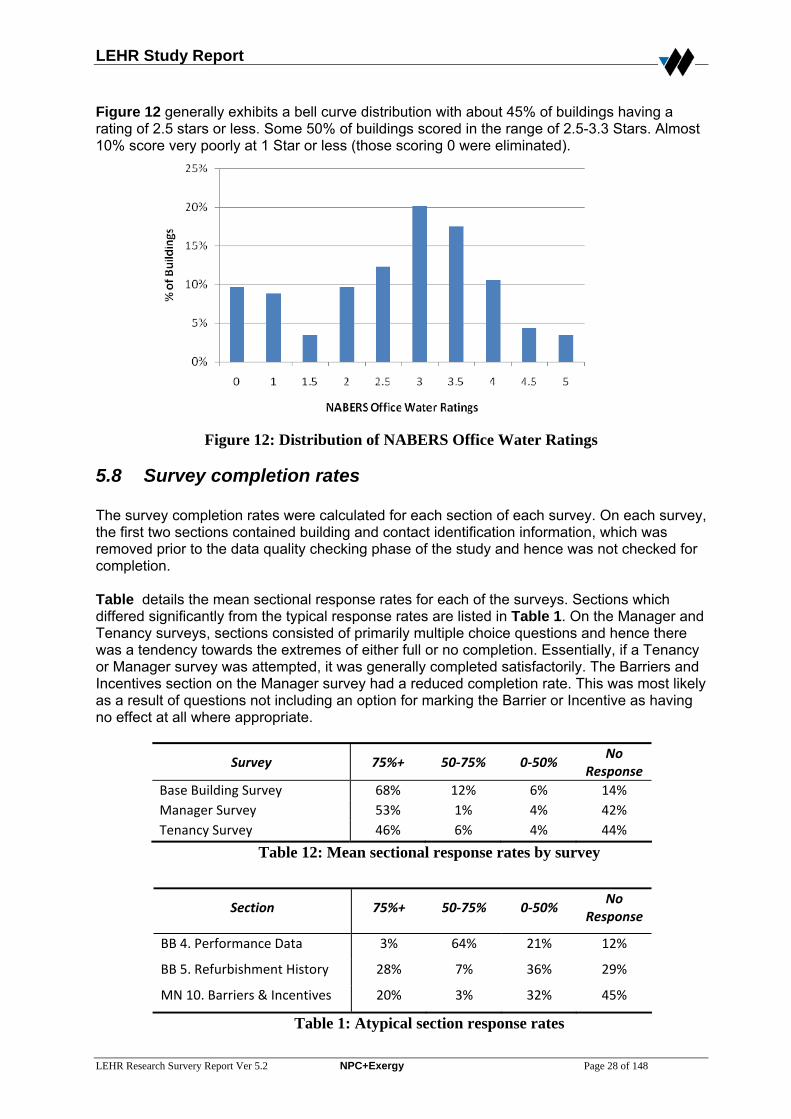
Figure 12 generally exhibits a bell curve distribution with about 45% of buildings having a rating of 2.5 stars or less. Some 50% of buildings scored in the range of 2.5-3.3 Stars. Almost 10% score very poorly at 1 Star or less (those scoring 0 were eliminated).
Figure 12: Distribution of NABERS Office Water Ratings
5.8 Survey completion rates The survey completion rates were calculated for each section of each survey. On each survey, the first two sections contained building and contact identification information, which was removed prior to the data quality checking phase of the study and hence was not checked for completion. Table details the mean sectional response rates for each of the surveys. Sections which differed significantly from the typical response rates are listed in Table 1. On the Manager and Tenancy surveys, sections consisted of primarily multiple choice questions and hence there was a tendency towards the extremes of either full or no completion. Essentially, if a Tenancy or Manager survey was attempted, it was generally completed satisfactorily. The Barriers and Incentives section on the Manager survey had a reduced completion rate. This was most likely as a result of questions not including an option for marking the Barrier or Incentive as having no effect at all where appropriate.
Survey 75%+ 50‐75% 0‐50% No
Response Base Building Survey 68% 12% 6% 14% Manager Survey 53% 1% 4% 42% Tenancy Survey 46% 6% 4% 44%
Table 12: Mean sectional response rates by survey
Section 75%+ 50‐75% 0‐50% No
Response
BB 4. Performance Data 3% 64% 21% 12%
BB 5. Refurbishment History 28% 7% 36% 29%
MN 10. Barriers & Incentives 20% 3% 32% 45%
Table 1: Atypical section response rates

LEHR Study Report
LEHR Research Survery Report Ver 5.2 NPC+Exergy Page 29 of 148
Base Building surveys generally exhibited a high degree of completion, with relatively few categories with no response. An exception to this rule however was the section relating to refurbishment, which appears due to the fact that many buildings in this dataset have not been refurbished. If repeating this exercise, the first question in this area should be a yes/no question about refurbishment at the site. However, whilst base building response rates were generally higher than the other categories, the large number of open ended questions (such as energy data) resulted in a significant number of entries being non-plausible when range tested. The calculations of response rates was not extend to include fields provided for general comments or questions which were only required to be answered under certain conditions.
6.0 BUILDING AND RESPONDENT CHARACTERISATION The survey data and related statistics provided some interesting insights into both the buildings, their systems, they way they are managed as well as the attitudes and capabilities of the people managing and leasing them.
6.1 Buildings Using the mean of the data from the Base Building surveys, the following provides a profile for what might be considered a typical high rise building: Year Built 1985 Air conditioning refurb 1998 Age of lighting 13 yrs Last envelope refurb 1993 Next envelope refurb 2016 Area (m² NLA) 21,000 (median 15,300) Lease form Net rent (approx 80%) Stories 17 PCA grade A or B range (70%) Occupied by Tenants NABERS energy rating 3.2 (formal) NABERS water rating 2.7 Rating type Base Building Operating hours pw 56 Method of cooling Water cooled chiller AC type Variable volume AHU + economy cycle Tenant lighting T8 with louvers, manual control or time switch Systems control BMS Energy sub metering Moderate to none Given that the sample population was weighted towards the larger, newer and higher quality buildings in the sector it would be reasonable to expect that the more typical building would be somewhat different to this. It would tend to be older, smaller with a lower NABERS rating due to such factors as a greater proportion of T8 type lights, less instances of economy cycles and variable volume AHUs and have an older style BMS or possibly none at all. Anecdotally and based on our own experiences, these are characteristics of typical C and D-Grade buildings.
LEHR Study Report
LEHR Research Survery Report Ver 5.2 NPC+Exergy Page 30 of 148
6.2 Respondents Most managers were staff members, the majority of which are not provided with any specific incentives to save energy. Almost 40% said that no energy efficiency target had been set and that no training program was in place. Most managers seem to firmly believe that they have the necessary skills, process and resources to effectively manage energy efficiency matters and that they have an active efficiency program in place. Most managers said they were prepared to take some technological risks but on the other hand about 50% also said they would only invest in proven technology. The vast majority reported positive experiences with past energy efficiency programs. A clear majority of buildings do not have an energy target and most are not required to and do not report performance either publicly or to their tenants. The majority of tenants and maintenance contractors do not appear to be offered incentives and suffer no penalties under their leases and contracts respectively for failing to improve energy efficiency. On average the minimum acceptable payback period was given as 4 years.
7.0 RELATIONSHIPS AND CORRELATIONS The targeted outcome of the LEHR study was to assess the relationship between a number of aspects of building management and infrastructure on building energy (and as a secondary, opportunistic exercise, for water consumption). The assessment of these relationships was approached from an empirical basis, with the data capable of identifying the statistical strength and magnitude of relationships, but unable to determine causal direction. Tests were conducted on both raw data (question by question) and on aggregated scores, designed to test the impact of a group of policies. The aggregations tested were either identified from trends within the data, or on the basis of suspected relationships.
7.1 NABERS Office Ratings & Building Classifications The benchmark used for assessing building energy consumption was the NABERS Office Energy rating, formerly known as ABGR (the Australian Building Greenhouse Rating). Where buildings did not report a certified NABERS Office Energy rating, an indicative rating was calculated based on the background data provided. Both Base Building and Whole Building ratings were used within this study. Whole building ratings used an assumed occupant density of 1 person per 15m2 and 1 computer per person. Raw rating scores were used for calculated ratings. Certified ratings were modified by 0.25 of a star to place these data in the middle of their respective rating bands, to ensure comparability between the data sets. Difference analysis was used as one of the analysis techniques for this study. Difference analysis requires the definition of two populations, and then examines the differences in the underlying data for each population. In the context of LEHR, it is desirable to determine the differences in the populations of “good” performing buildings and “bad” performing buildings. For this analysis, buildings with a rating at or above 3 stars were allocated to the good category, and buildings with ratings of below 3 stars allocated to the bad category. This classification partitioned the data set into two equally sized groups, which is demonstrated in Table 14.
Building Classification Surveys Proportion Good 64 50% Bad 63 50%
Table 14: Distribution of “Good” and “Bad” performing buildings
LEHR Study Report
LEHR Research Survery Report Ver 5.2 NPC+Exergy Page 31 of 148
7.2 Sample Performance Characteristics The performance of buildings versus key identifying features was tested on a simple statistical basis. In each case, the sample was divided on the basis of the required characteristic and the NABERS Energy performance for each sub-group compared. In the following statistical graphs the red centre dots identify the sample subgroup mean; the error bars (red) the statistical uncertainty in this mean, the middle bar (bold black) the median, the outer bold black bars the 25th and 75th percentiles and the dotted lines the 10th and 90th percentiles. DN = Don’t know.
7.2.1 Building Quality Figure 13 shows the relationship between the reported PCA property grade and the building performance as measured under NABERS. It is clear that there is no statistically significant difference between the mean performances of each property grade. This is important as it indicates that a higher property grade is not an inherent barrier to the achievement of performance. It also means that other questions relating to building performance can be examined without additional cross reference to property quality. The data also indicates that all property grades had buildings achieving 4 stars under NABERS, indicating that there was no discernable difference in maximum performance. However, this can only be said of Grades P, A and B as there were only six C-Grade and no D-Grade buildings in the sample. Experience and anecdotal evidence indicates that C and D-Grade buildings have lower NABERS Energy ratings with a possible average in the 2.0-2.5 star range or maybe less.
0
0.5
1
1.5
2
2.5
3
3.5
4
4.5
5
NABER
S Energy Rating
PCA Grade
Figure 13: NABERS Energy rating for different PCA property quality grades.
7.2.2 Age and Refurbishment The impact of building age on NABERS performance is examined in Figure 14. It can be seen from the figure that the newer building stock shows a significantly better performance on average, although almost all age groups show some buildings performing at 4 Stars. This can be interpreted either as the impact of recent energy efficiency programs on new building efficiency or alternatively as being the impact of age and system decay.

LEHR Study Report
LEHR Research Survery Report Ver 5.2 NPC+Exergy Page 32 of 148
Given that C and D-Grade buildings were under represented in the sample population and the fact that these tend to be much older and with poor energy efficiency, their proportional inclusion in the survey would cause the ratings trend to drop rather than rise from about the 40-year point in Figure 14.
00.5
1
1.52
2.5
33.5
4
4.5
5
NABERS Energy Rating
Building Age
Figure 14: Impact of building age on building performance.
In Figure 15, the impact of refurbishment on building performance is shown. It can be seen that all the performance means are within each other’s error bands, indicating that the differences in means are not particularly significant. Of interest, however is the 1-2 years since refurbishment group, which shows the most differentiated average performance. This can be interpreted as being the result of recent refurbishment activity, aimed at energy efficiency, which anecdotally has been strong in approximately this time period. The alternative interpretation is that refurbishments that have been undertaken in earlier years have not produced long term efficiency improvement.
0
0.5
1
1.5
2
2.5
3
3.5
4
4.5
5
NABERS Energy Rating
Time Since Last Refurbishment
Figure 15: Impact of time since building refurbishment on NABERS performance.
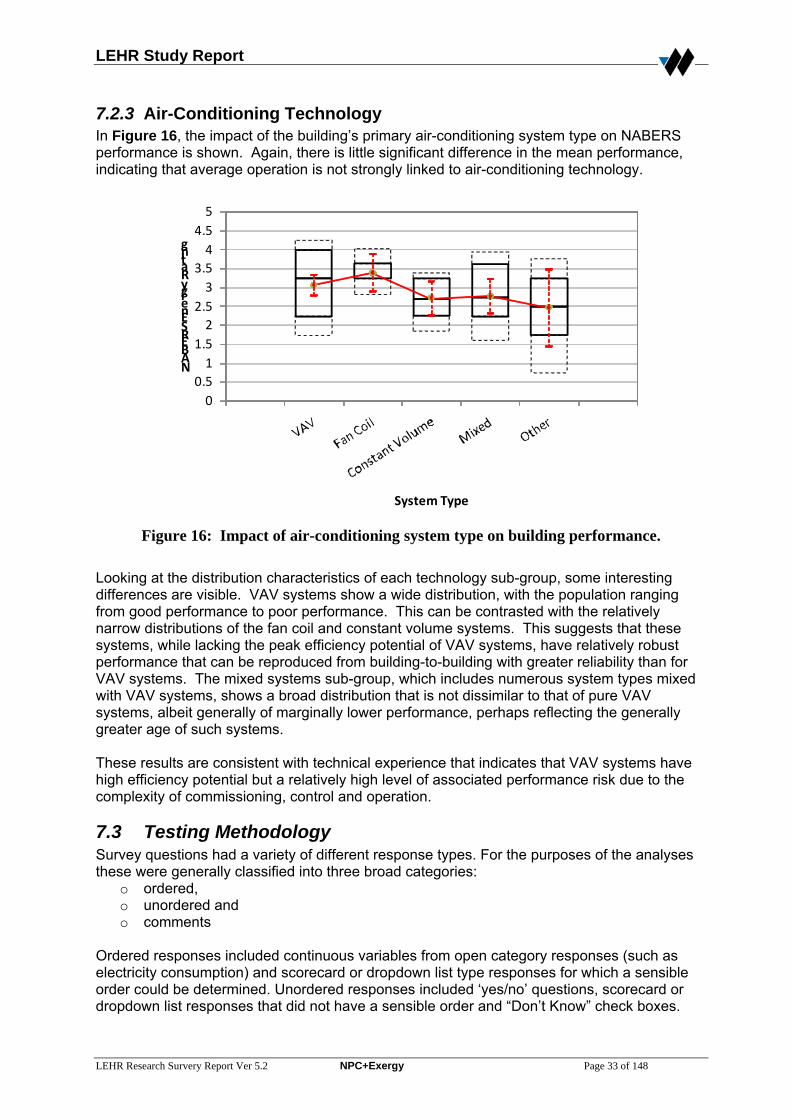
LEHR Study Report
LEHR Research Survery Report Ver 5.2 NPC+Exergy Page 33 of 148
7.2.3 Air-Conditioning Technology In Figure 16, the impact of the building’s primary air-conditioning system type on NABERS performance is shown. Again, there is little significant difference in the mean performance, indicating that average operation is not strongly linked to air-conditioning technology.
00.51
1.52
2.53
3.54
4.55
NABERS Energy Rating
System Type
Figure 16: Impact of air-conditioning system type on building performance.
Looking at the distribution characteristics of each technology sub-group, some interesting differences are visible. VAV systems show a wide distribution, with the population ranging from good performance to poor performance. This can be contrasted with the relatively narrow distributions of the fan coil and constant volume systems. This suggests that these systems, while lacking the peak efficiency potential of VAV systems, have relatively robust performance that can be reproduced from building-to-building with greater reliability than for VAV systems. The mixed systems sub-group, which includes numerous system types mixed with VAV systems, shows a broad distribution that is not dissimilar to that of pure VAV systems, albeit generally of marginally lower performance, perhaps reflecting the generally greater age of such systems. These results are consistent with technical experience that indicates that VAV systems have high efficiency potential but a relatively high level of associated performance risk due to the complexity of commissioning, control and operation.
7.3 Testing Methodology Survey questions had a variety of different response types. For the purposes of the analyses these were generally classified into three broad categories:
o ordered, o unordered and o comments
Ordered responses included continuous variables from open category responses (such as electricity consumption) and scorecard or dropdown list type responses for which a sensible order could be determined. Unordered responses included ‘yes/no’ questions, scorecard or dropdown list responses that did not have a sensible order and “Don’t Know” check boxes.
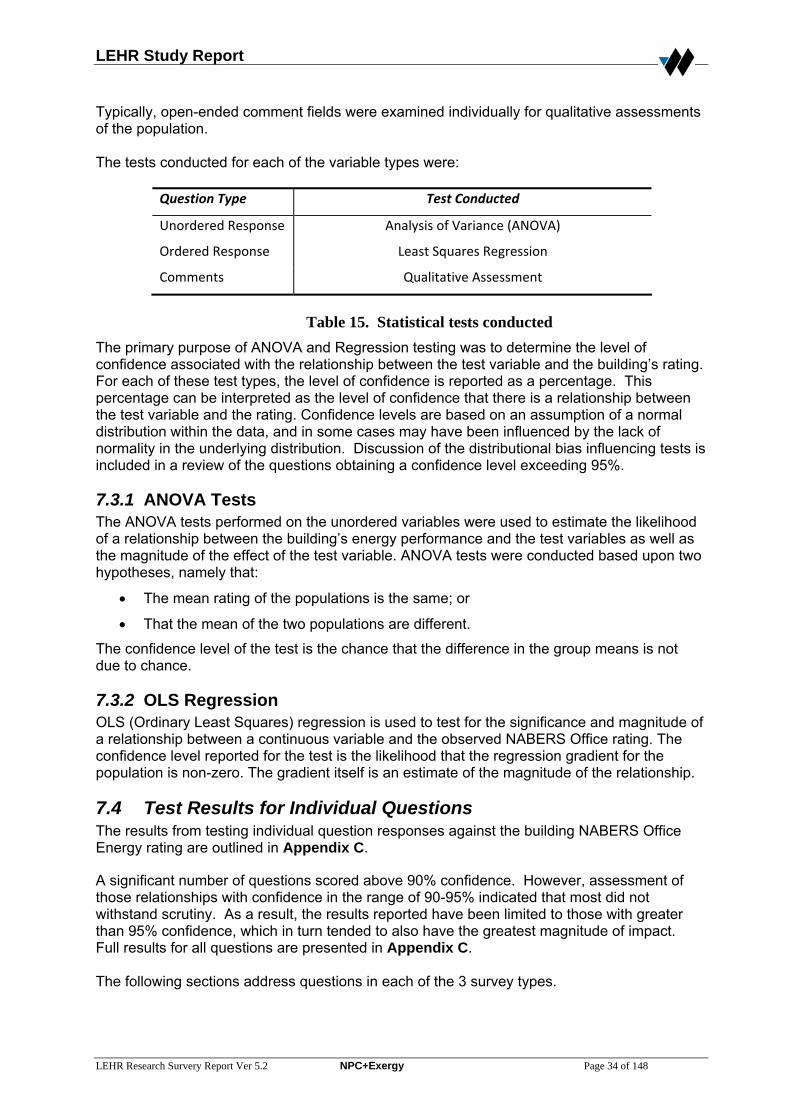
LEHR Study Report
LEHR Research Survery Report Ver 5.2 NPC+Exergy Page 34 of 148
Typically, open-ended comment fields were examined individually for qualitative assessments of the population. The tests conducted for each of the variable types were:
Question Type Test Conducted
Unordered Response Analysis of Variance (ANOVA)
Ordered Response Least Squares Regression
Comments Qualitative Assessment
Table 15. Statistical tests conducted
The primary purpose of ANOVA and Regression testing was to determine the level of confidence associated with the relationship between the test variable and the building’s rating. For each of these test types, the level of confidence is reported as a percentage. This percentage can be interpreted as the level of confidence that there is a relationship between the test variable and the rating. Confidence levels are based on an assumption of a normal distribution within the data, and in some cases may have been influenced by the lack of normality in the underlying distribution. Discussion of the distributional bias influencing tests is included in a review of the questions obtaining a confidence level exceeding 95%.
7.3.1 ANOVA Tests The ANOVA tests performed on the unordered variables were used to estimate the likelihood of a relationship between the building’s energy performance and the test variables as well as the magnitude of the effect of the test variable. ANOVA tests were conducted based upon two hypotheses, namely that:
• The mean rating of the populations is the same; or
• That the mean of the two populations are different.
The confidence level of the test is the chance that the difference in the group means is not due to chance.
7.3.2 OLS Regression OLS (Ordinary Least Squares) regression is used to test for the significance and magnitude of a relationship between a continuous variable and the observed NABERS Office rating. The confidence level reported for the test is the likelihood that the regression gradient for the population is non-zero. The gradient itself is an estimate of the magnitude of the relationship.
7.4 Test Results for Individual Questions The results from testing individual question responses against the building NABERS Office Energy rating are outlined in Appendix C.
A significant number of questions scored above 90% confidence. However, assessment of those relationships with confidence in the range of 90-95% indicated that most did not withstand scrutiny. As a result, the results reported have been limited to those with greater than 95% confidence, which in turn tended to also have the greatest magnitude of impact. Full results for all questions are presented in Appendix C. The following sections address questions in each of the 3 survey types.
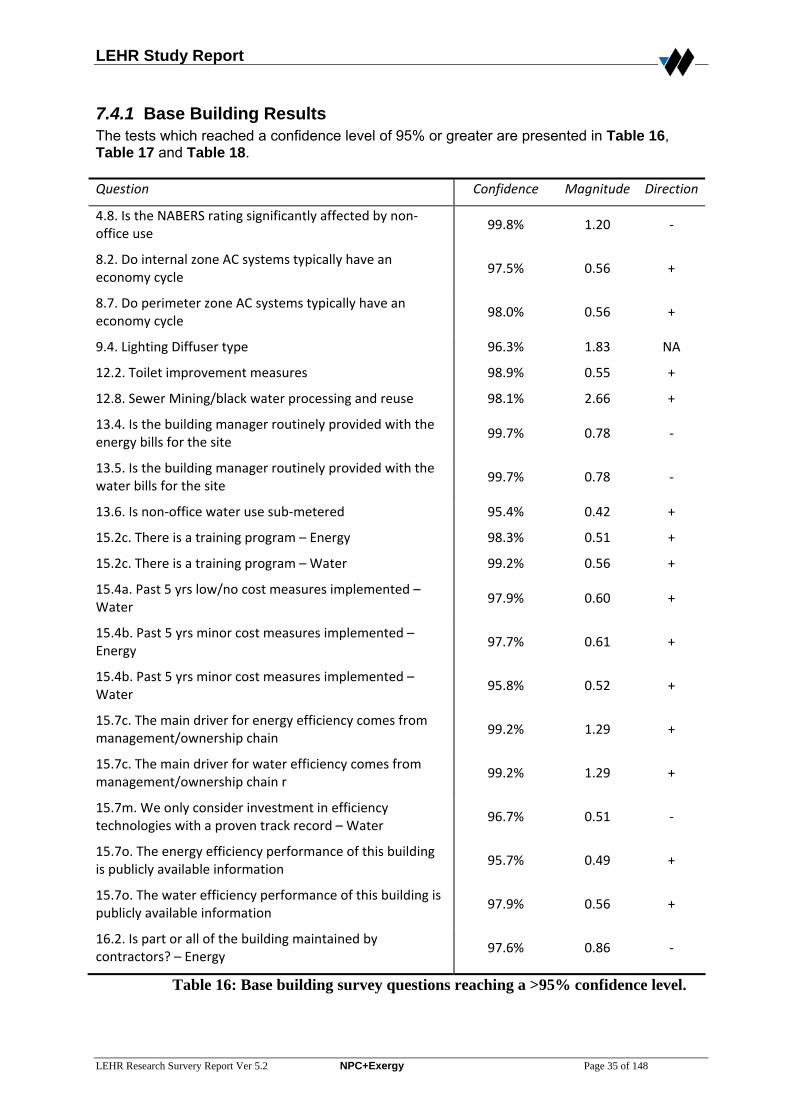
LEHR Study Report
LEHR Research Survery Report Ver 5.2 NPC+Exergy Page 35 of 148
7.4.1 Base Building Results The tests which reached a confidence level of 95% or greater are presented in Table 16, Table 17 and Table 18. Question Confidence Magnitude Direction
4.8. Is the NABERS rating significantly affected by non‐office use
99.8% 1.20 ‐
8.2. Do internal zone AC systems typically have an economy cycle
97.5% 0.56 +
8.7. Do perimeter zone AC systems typically have an economy cycle
98.0% 0.56 +
9.4. Lighting Diffuser type 96.3% 1.83 NA
12.2. Toilet improvement measures 98.9% 0.55 +
12.8. Sewer Mining/black water processing and reuse 98.1% 2.66 +
13.4. Is the building manager routinely provided with the energy bills for the site
99.7% 0.78 ‐
13.5. Is the building manager routinely provided with the water bills for the site
99.7% 0.78 ‐
13.6. Is non‐office water use sub‐metered 95.4% 0.42 +
15.2c. There is a training program – Energy 98.3% 0.51 +
15.2c. There is a training program – Water 99.2% 0.56 +
15.4a. Past 5 yrs low/no cost measures implemented – Water
97.9% 0.60 +
15.4b. Past 5 yrs minor cost measures implemented – Energy
97.7% 0.61 +
15.4b. Past 5 yrs minor cost measures implemented – Water
95.8% 0.52 +
15.7c. The main driver for energy efficiency comes from management/ownership chain
99.2% 1.29 +
15.7c. The main driver for water efficiency comes from management/ownership chain r
99.2% 1.29 +
15.7m. We only consider investment in efficiency technologies with a proven track record – Water
96.7% 0.51 ‐
15.7o. The energy efficiency performance of this building is publicly available information
95.7% 0.49 +
15.7o. The water efficiency performance of this building is publicly available information
97.9% 0.56 +
16.2. Is part or all of the building maintained by contractors? – Energy
97.6% 0.86 ‐
Table 16: Base building survey questions reaching a >95% confidence level.
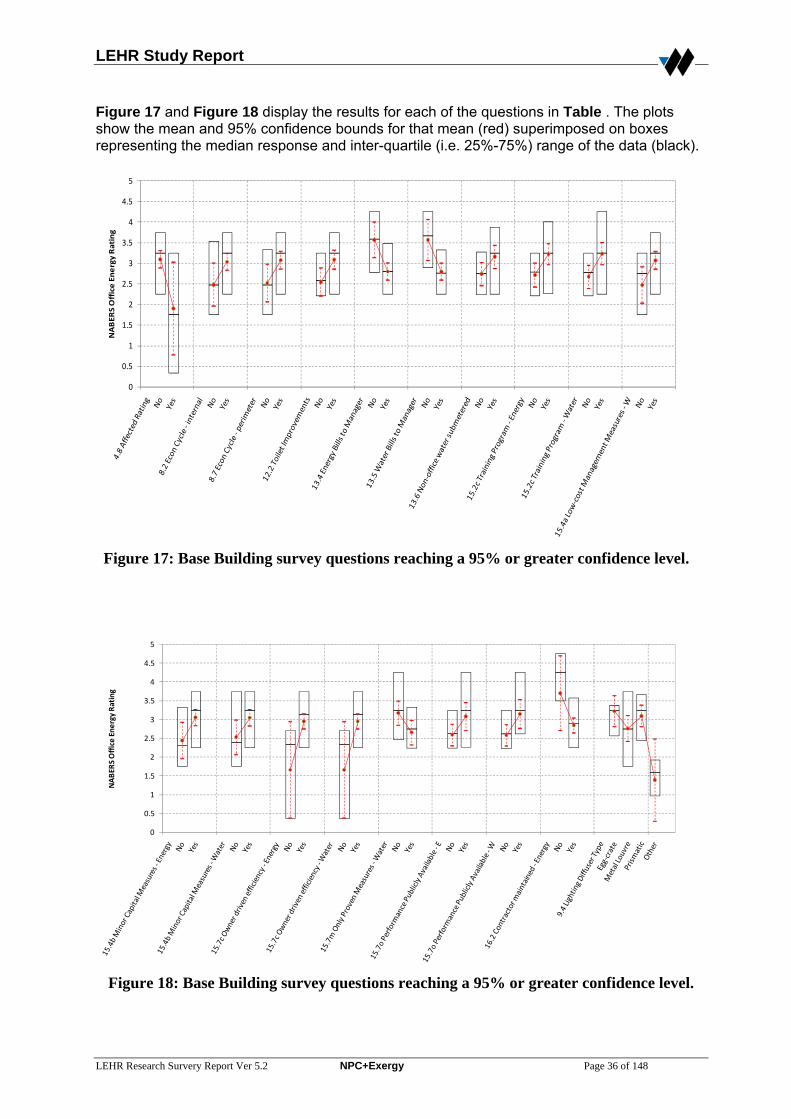
LEHR Study Report
LEHR Research Survery Report Ver 5.2 NPC+Exergy Page 36 of 148
Figure 17 and Figure 18 display the results for each of the questions in Table . The plots show the mean and 95% confidence bounds for that mean (red) superimposed on boxes representing the median response and inter-quartile (i.e. 25%-75%) range of the data (black).
0
0.5
1
1.5
2
2.5
3
3.5
4
4.5
5
NABER
S Office Energy Rating
Figure 17: Base Building survey questions reaching a 95% or greater confidence level.
0
0.5
1
1.5
2
2.5
3
3.5
4
4.5
5
NABER
S Office Energy Rating
Figure 18: Base Building survey questions reaching a 95% or greater confidence level.

LEHR Study Report
LEHR Research Survery Report Ver 5.2 NPC+Exergy Page 37 of 148
Figure 17 and Figure 18 provide information for assessing the distributional characteristics of the variables which affect the validity of the magnitude and confidence levels reported in Table . Whilst all relationships identified in these figures have a relationship identified with confidence of 95% or greater, the data does not identify the causal direction of the relationship. The validity and causality issues associated with each relationship are discussed on a question-by-question basis below.
• Q4.8: Affected Rating (by non-office tenancies): Buildings with non-office tenants impacting upon the rating exhibited lower ratings. This makes logical sense but is not relevant to the outcomes of the study.
• Q8.2 / 8.7 Economy Cycle (AC System): The presence of economy cycles in HVAC systems exhibited a strong relationship with higher building performance. This makes sense as a causal relationship for the mainly temperate climates covered by the survey.
• Q12.2 Toilet improvement measures: A relationship was identified between good energy ratings and toilet improvements. As toilet improvements were also highly correlated with other energy efficiency measures, this relationship can be seen as coincidental rather than causal; in effect, buildings that have undertaken toilet improvement measures are likely to be better progressed with energy efficiency improvements. Toilet upgrades generally only occur as part of a major building or floor refurbishment.
• Q13.4 / 13.5 Energy / Water Bills provided to the manager: The data indicates that buildings where bills were provided to the building manger exhibited poorer performance. This does not make immediate logical sense and has been interpreted as a non-causal relationship.
• Q13.6 Non-office water use is sub-metered: Sub-metering of water use exhibited a relationship with higher ratings. However, water sub-metering was also correlated with the presence of other energy efficiency measures. Thus, as with Q12.2, the relationship is likely to indicate that sites with advanced water efficiency programs are also advanced with energy efficiency.
• Q15.2c There is a training program (Energy & Water): There is a substantial change in variance between the two populations, which may be impacting upon the validity of the test. Regardless, the difference in means is sufficient to indicate a relationship between training and higher ratings. This has been interpreted as being a causal relationship.
• Q15.4a Low-cost management measures implemented: Buildings with these measures implemented tended to perform better. This makes immediate logical sense as a causal relationship.
• Q15.4b Low-cost capital measures implemented: Buildings with these measures implemented tended to perform better, although the differences in distributional shape reduced the strength of this relationship. Nonetheless, this makes immediate logical sense as a causal relationship.
• Q15.7c The main driver [for energy and water efficiency] comes from within the ownership chain: Statistical tests for this group are substantially distorted by the low number of buildings where the main driver is not coming from the owner group. This limits the significance that can be attached to this relationship.
• Q15.7m Only consider proven measures (water): The distribution of responses between the two categories is very even, however within the “No” category there was a wider distribution of levels of performance. This is consistent with the concept of a higher risk associated with unproven measures. Due to the even distribution between the groups, the confidence with the result of a lower mean for buildings in the “Yes”

LEHR Study Report
LEHR Research Survery Report Ver 5.2 NPC+Exergy Page 38 of 148
category is strong. It is worth noting that a similar result (confidence 81%) was observed for the same question asked with respect to Energy investments. The responses for energy and water were strongly correlated. Based on this it is concluded that there is a viable but weak link between general technological conservatism and poorer performance.
• Q15.7o Performance Publicly Available?: Both Energy and Water exhibited a strong relationship between efficiency reporting and building performance. It is noted that this could be either causal – i.e. the public reporting encourages better performance – or coincidental - i.e. buildings with better performance are more likely to report that performance, or indeed both.
• Q16.2 Contractor Maintained – Energy?: This question shows wide error bounds on the buildings not maintained by contractors, largely driven by the small number of respondents within this group, and a number of outliers in the small population. Caution needs to be applied to the interpretation of this relationship.
• Q9.4 Lighting Diffuser Type: The strength of this result can clearly be seen to come from the difference in performance between the predefined options and “other”. There are only three buildings in the category “other”, resulting in this category and relationship being of limited interpretational value.
7.4.2 Manager Survey Results Due to the difference in the roles of each of the three manager types, testing of the manager survey questions was done separately for each type. Consequently, the manager survey questions were subject to a significantly higher risk of displaying bias due to the significantly smaller sample sizes. Portfolio Managers (PM) and Asset Managers (AM) were the worst affected with sample sizes of 16 and 39 respectively. Question Confidence Magnitude Direction
AM 8.1. Operational changes you have made in the past year to maintain or improve energy efficiency in relation to the building(s) you are involved with?
98.3% 1.83 ‐
AM 8.3. Management or business process changes have you made in the past two years to maintain or improve energy efficiency in your buildings?
96.5% 1.17 ‐
BM 3.1. Are you an employee of the building owner or a contractor?
97.1% 0.59 Employee
PM 6.1. How long do the budget structures that you work within allow you to hold onto energy savings for reinvestment within your own budget?
97.7% 1.12 +
PM 9.3. How long have you been working with commercial buildings?
95.7% 2.03 ‐
Table 17: Manager survey questions reaching a >95% confidence level
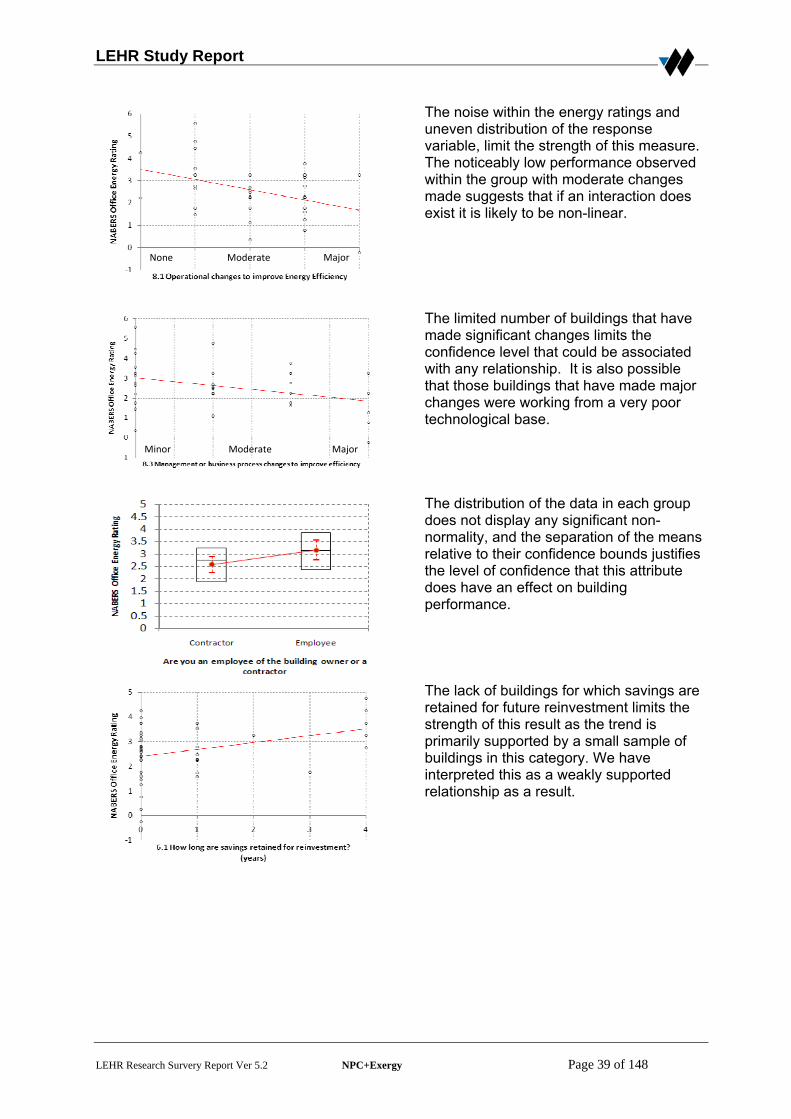
LEHR Study Report
LEHR Research Survery Report Ver 5.2 NPC+Exergy Page 39 of 148
The noise within the energy ratings and uneven distribution of the response variable, limit the strength of this measure. The noticeably low performance observed within the group with moderate changes made suggests that if an interaction does exist it is likely to be non-linear.
The limited number of buildings that have made significant changes limits the confidence level that could be associated with any relationship. It is also possible that those buildings that have made major changes were working from a very poor technological base.
The distribution of the data in each group does not display any significant non-normality, and the separation of the means relative to their confidence bounds justifies the level of confidence that this attribute does have an effect on building performance.
The lack of buildings for which savings are retained for future reinvestment limits the strength of this result as the trend is primarily supported by a small sample of buildings in this category. We have interpreted this as a weakly supported relationship as a result.
MajorMinor Moderate
None MajorModerate
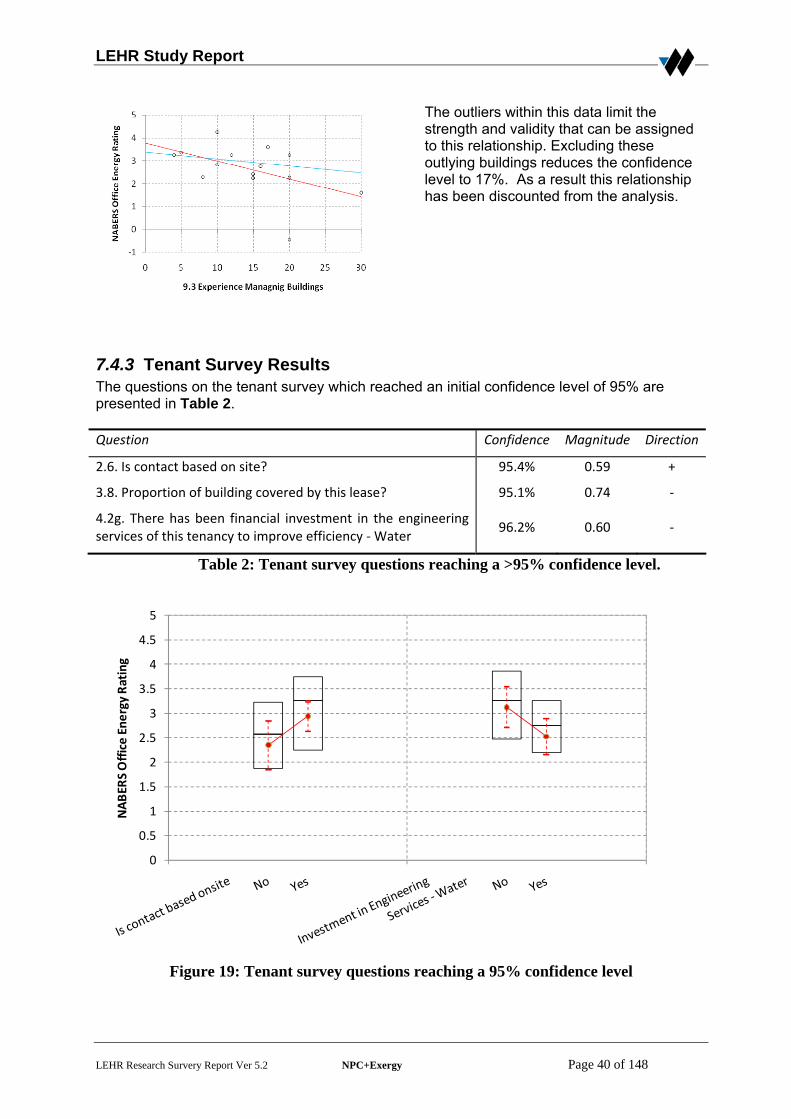
LEHR Study Report
LEHR Research Survery Report Ver 5.2 NPC+Exergy Page 40 of 148
The outliers within this data limit the strength and validity that can be assigned to this relationship. Excluding these outlying buildings reduces the confidence level to 17%. As a result this relationship has been discounted from the analysis.
7.4.3 Tenant Survey Results The questions on the tenant survey which reached an initial confidence level of 95% are presented in Table 2. Question Confidence Magnitude Direction
2.6. Is contact based on site? 95.4% 0.59 +
3.8. Proportion of building covered by this lease? 95.1% 0.74 ‐
4.2g. There has been financial investment in the engineering services of this tenancy to improve efficiency ‐ Water
96.2% 0.60 ‐
Table 2: Tenant survey questions reaching a >95% confidence level.
0
0.5
1
1.5
2
2.5
3
3.5
4
4.5
5
NABER
S Office Energy Rating
Figure 19: Tenant survey questions reaching a 95% confidence level
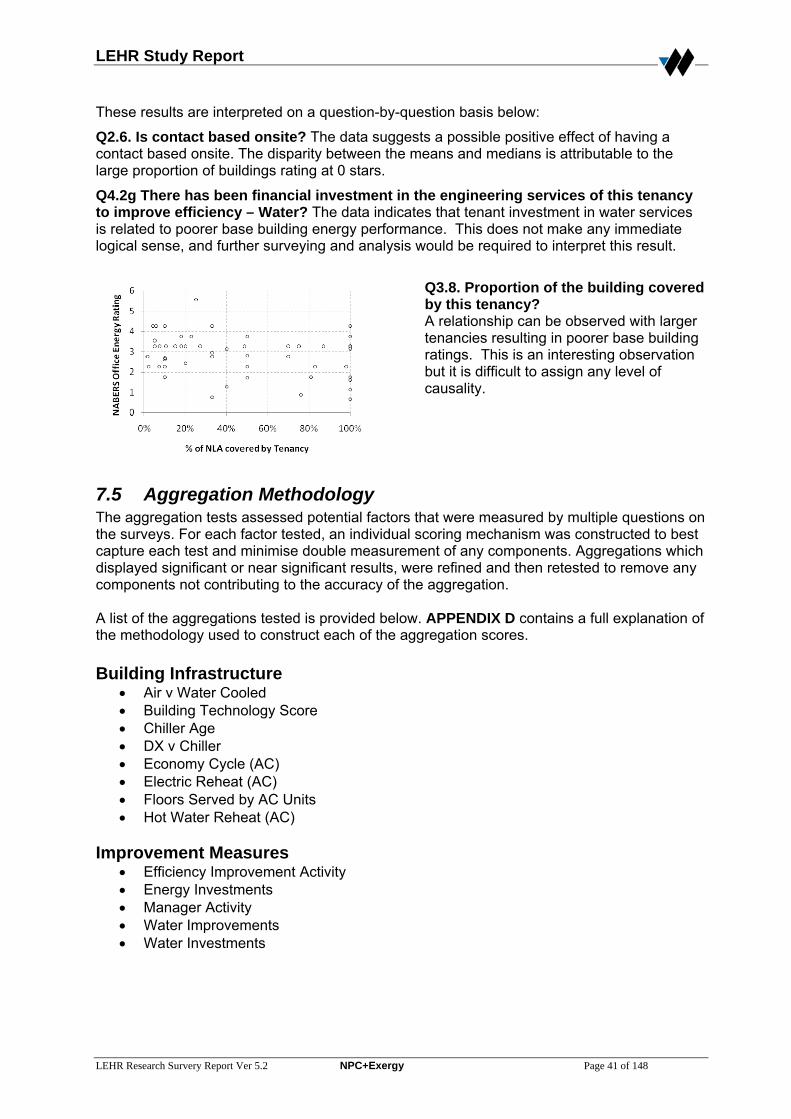
LEHR Study Report
LEHR Research Survery Report Ver 5.2 NPC+Exergy Page 41 of 148
These results are interpreted on a question-by-question basis below:
Q2.6. Is contact based onsite? The data suggests a possible positive effect of having a contact based onsite. The disparity between the means and medians is attributable to the large proportion of buildings rating at 0 stars.
Q4.2g There has been financial investment in the engineering services of this tenancy to improve efficiency – Water? The data indicates that tenant investment in water services is related to poorer base building energy performance. This does not make any immediate logical sense, and further surveying and analysis would be required to interpret this result.
Q3.8. Proportion of the building covered by this tenancy? A relationship can be observed with larger tenancies resulting in poorer base building ratings. This is an interesting observation but it is difficult to assign any level of causality.
7.5 Aggregation Methodology The aggregation tests assessed potential factors that were measured by multiple questions on the surveys. For each factor tested, an individual scoring mechanism was constructed to best capture each test and minimise double measurement of any components. Aggregations which displayed significant or near significant results, were refined and then retested to remove any components not contributing to the accuracy of the aggregation. A list of the aggregations tested is provided below. APPENDIX D contains a full explanation of the methodology used to construct each of the aggregation scores. Building Infrastructure
• Air v Water Cooled • Building Technology Score • Chiller Age • DX v Chiller • Economy Cycle (AC) • Electric Reheat (AC) • Floors Served by AC Units • Hot Water Reheat (AC)
Improvement Measures
• Efficiency Improvement Activity • Energy Investments • Manager Activity • Water Improvements • Water Investments
LEHR Study Report
LEHR Research Survery Report Ver 5.2 NPC+Exergy Page 42 of 148
Management
• Attitude of Manager – Average • Attitude of Manager - Best • Attitude of Manager - Worst • Highest Qualifications • Manager Accreditation • Manager Skill Diversity • Manager Experience • Manager’s Attitude towards Energy Efficiency • Manager’s Attitude towards Greenhouse Emissions • Manager’s Authority over Energy Matters • Manager’s Perceived Skills • Multiple Managers • Skills and Resources • Staff Managed • Training Score
Monitoring
• BMS Energy Monitoring • BMS Water Monitoring • Monitoring and Targeting • Tracking to Targets
Policy
• Base Building Policy • Financial Process • Maintenance Team Incentives • Maintenance Team Penalties • Manager’s Financial Limits • Manager Incentives
Tenants
• Green Lease • Gross v Net Lease • Multiple Tenants • Performance in Tenant Agreements • Reporting to Tenants • Tenant Activity • Tenant Control
7.6 Aggregation Results & Refinements
7.6.1 Aggregation Effects on NABERS Office Energy Ratings All aggregations were tested for both the significance and magnitude of any relationship with building performance. The metric used to measure the magnitude was the maximum effect on the NABERS Office rating. For unordered variables, this was determined by the largest difference in mean star rating between any two groups whilst for ordered variables, it was determined to be the predicted difference in the star rating observed between the highest and lowest variable scores observed. The results of this analysis are summarised in Figure 20.

LEHR Study Report
LEHR Research Survery Report Ver 5.2 NPC+Exergy Page 43 of 148
Figure 20: Aggregation regression results - Effect Size v Confidence
The aggregations circled in Figure 20 which did not obtain a level of confidence of 20%, were not supported by the data collected in this study. The low level of confidence associated with these results may either be due to a genuine lack of a relationship within the population or limitations of the data collected. Nonetheless these unsupported aggregations are indicative of measures or items that would not appear, from the data, to be of great impact on NABERS Energy performance.
7.6.2 Significant Aggregation Results There were five aggregation tests which achieved a confidence level of 95% or greater, and a further three which achieved a confidence level of greater than 90%. These aggregations are summarised in Table 19 and examined on an individual basis below. Aggregation Confidence Magnitude Direction
Building Technology Score 99.5% 1.30 +
Economy Cycle (AC) 97.8% 0.57 Yes
Water Improvements 94.8% 0.76 +
Manager’s Perceived Skills 94.8% 1.21 +
Multiple Managers 99.3% 0.88 Yes
Staff Managed 99.7% 1.32 +
Maintenance Team Penalties 91.2% 0.41 +
Report to Tenants 95.7% 0.55 +
Table 19: Significant aggregation regression results
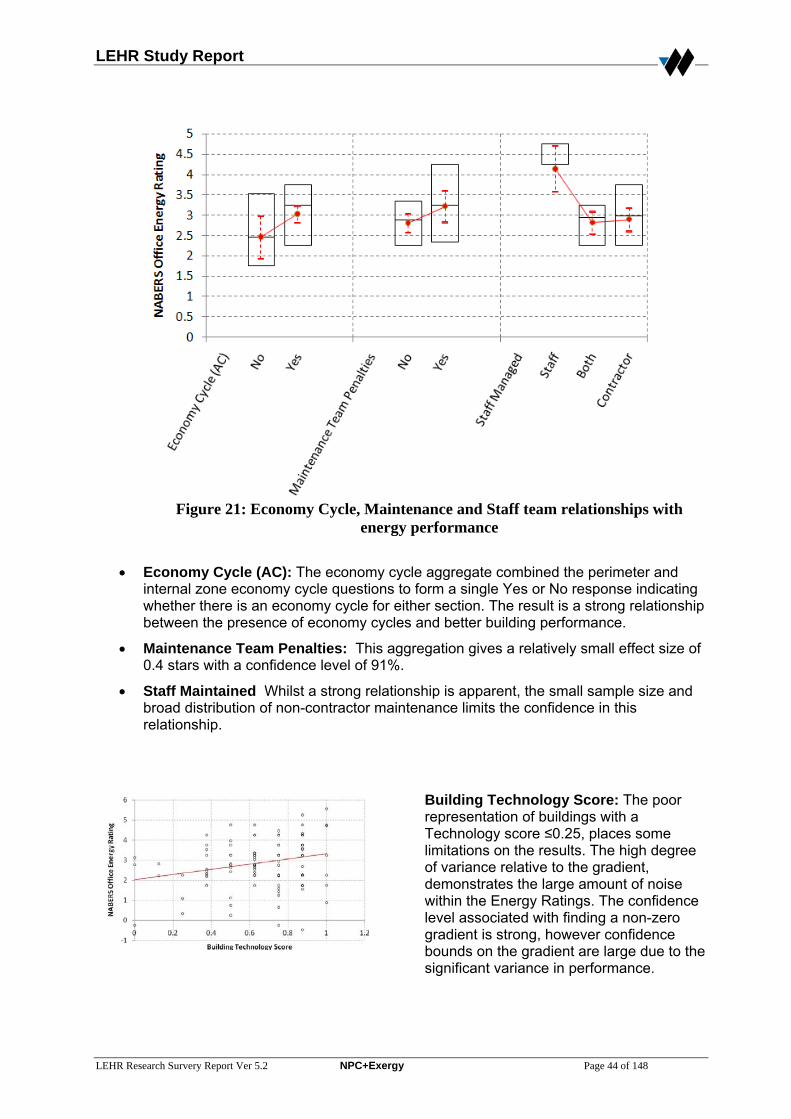
LEHR Study Report
LEHR Research Survery Report Ver 5.2 NPC+Exergy Page 44 of 148
Figure 21: Economy Cycle, Maintenance and Staff team relationships with energy performance
• Economy Cycle (AC): The economy cycle aggregate combined the perimeter and
internal zone economy cycle questions to form a single Yes or No response indicating whether there is an economy cycle for either section. The result is a strong relationship between the presence of economy cycles and better building performance.
• Maintenance Team Penalties: This aggregation gives a relatively small effect size of 0.4 stars with a confidence level of 91%.
• Staff Maintained Whilst a strong relationship is apparent, the small sample size and broad distribution of non-contractor maintenance limits the confidence in this relationship.
Building Technology Score: The poor representation of buildings with a Technology score ≤0.25, places some limitations on the results. The high degree of variance relative to the gradient, demonstrates the large amount of noise within the Energy Ratings. The confidence level associated with finding a non-zero gradient is strong, however confidence bounds on the gradient are large due to the significant variance in performance.
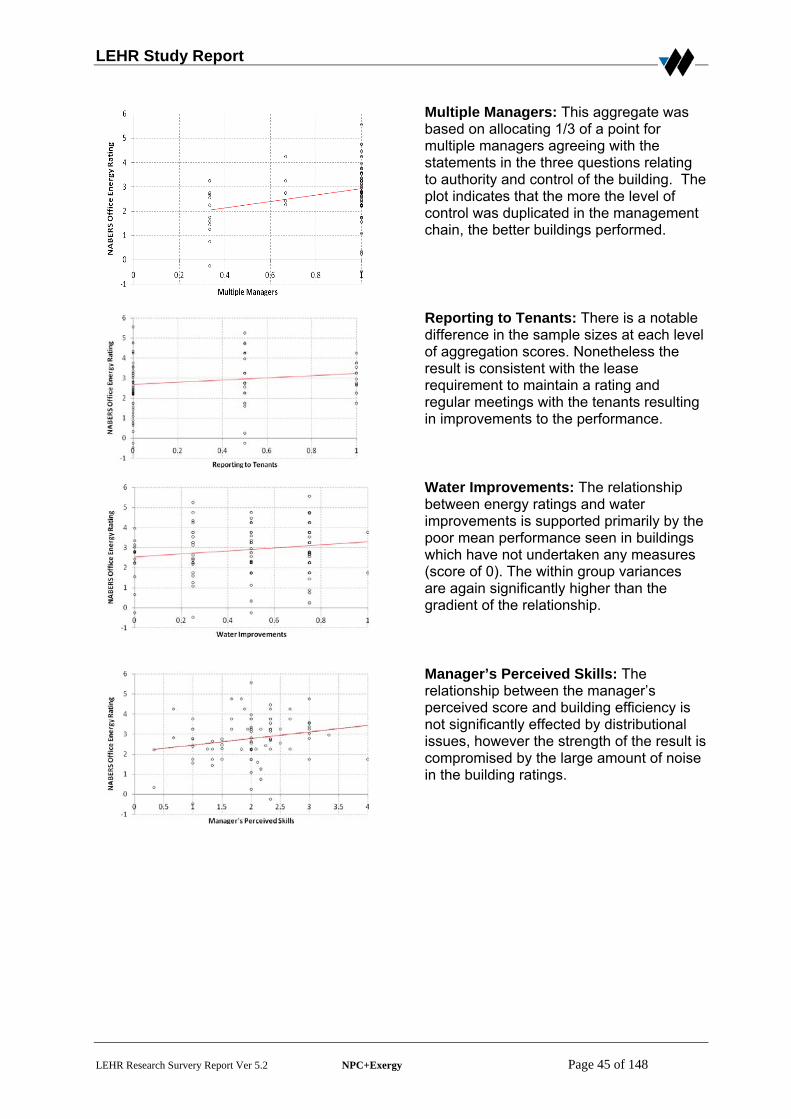
LEHR Study Report
LEHR Research Survery Report Ver 5.2 NPC+Exergy Page 45 of 148
Multiple Managers: This aggregate was based on allocating 1/3 of a point for multiple managers agreeing with the statements in the three questions relating to authority and control of the building. The plot indicates that the more the level of control was duplicated in the management chain, the better buildings performed.
Reporting to Tenants: There is a notable difference in the sample sizes at each level of aggregation scores. Nonetheless the result is consistent with the lease requirement to maintain a rating and regular meetings with the tenants resulting in improvements to the performance.
Water Improvements: The relationship between energy ratings and water improvements is supported primarily by the poor mean performance seen in buildings which have not undertaken any measures (score of 0). The within group variances are again significantly higher than the gradient of the relationship.
Manager’s Perceived Skills: The relationship between the manager’s perceived score and building efficiency is not significantly effected by distributional issues, however the strength of the result is compromised by the large amount of noise in the building ratings.
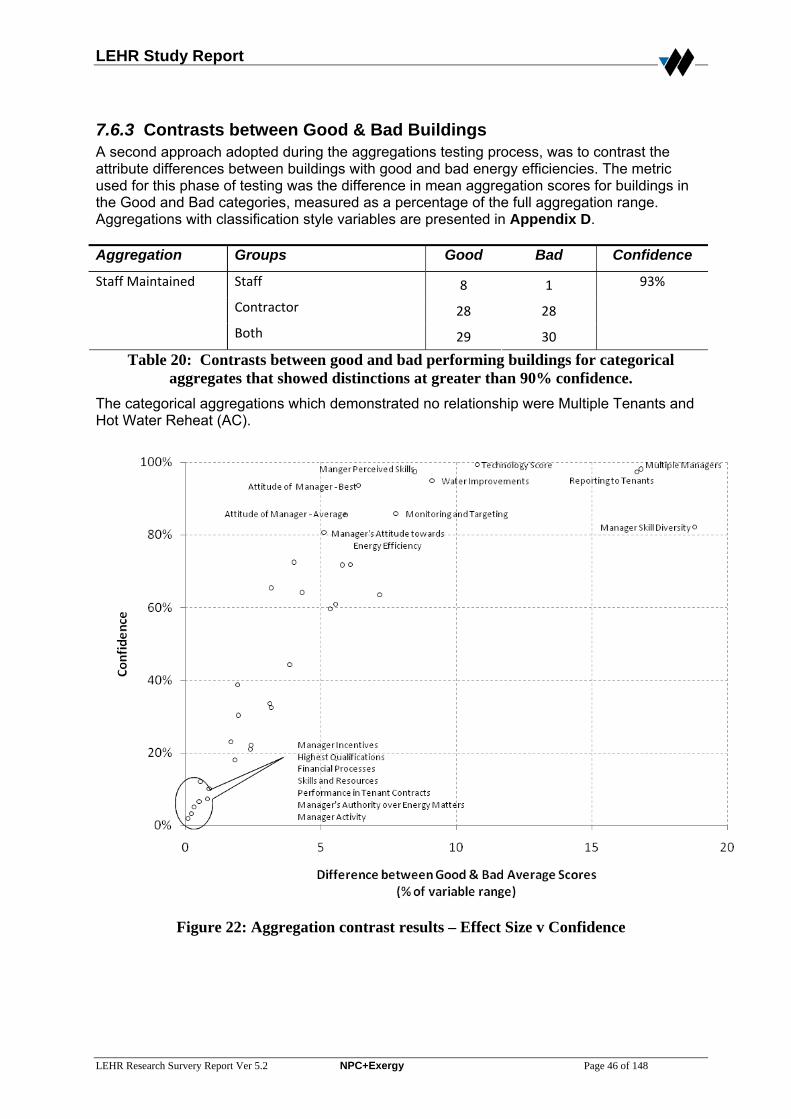
LEHR Study Report
LEHR Research Survery Report Ver 5.2 NPC+Exergy Page 46 of 148
7.6.3 Contrasts between Good & Bad Buildings A second approach adopted during the aggregations testing process, was to contrast the attribute differences between buildings with good and bad energy efficiencies. The metric used for this phase of testing was the difference in mean aggregation scores for buildings in the Good and Bad categories, measured as a percentage of the full aggregation range. Aggregations with classification style variables are presented in Appendix D. Aggregation Groups Good Bad Confidence
Staff Maintained Staff 8 1
Contractor 28 28
Both 29 30
93%
Table 20: Contrasts between good and bad performing buildings for categorical aggregates that showed distinctions at greater than 90% confidence.
The categorical aggregations which demonstrated no relationship were Multiple Tenants and Hot Water Reheat (AC).
Figure 22: Aggregation contrast results – Effect Size v Confidence

LEHR Study Report
LEHR Research Survery Report Ver 5.2 NPC+Exergy Page 47 of 148
Figure 23 demonstrates the limitations imposed on the tests dues to poor variable distributions. Specifically:
• Multiple Managers: The distribution of multiple manager scores is not sufficient to establish the presence of a relationship.
• Attitude of Manager – Best: The distribution of the variable scores is not sufficient to support a conclusion.
• Reporting to Tenants: The three-level scoring mechanism limits the interpretability of the quartile boxes. However the distribution of the scores across each of the categories is sufficient to support the interaction identified between building performance and the calculated reporting score.
• Water Improvements: The water improvements score has sufficient distribution across the levels to support the finding of different scores. This parameter was cross-correlated with other efficiency measures.
• Technology Score: The data supports the test finding of a significant technology score difference between the good and bad buildings.
• Manager Perceived Skills: The data supports the identified differences in manager’s perceived skills between good and bad performing buildings.
0
0.2
0.4
0.6
0.8
1
Standardised Variable Scores
Figure 23: Contrasts between aggregate scores for good and bad performing buildings
(aggregates reaching the 90% confidence level). Note that in Figure 24 the median for “bad” under multiple managers is the same as the lower quartile and the median and both quartiles are the same for “good” for the same question.
LEHR Study Report
LEHR Research Survery Report Ver 5.2 NPC+Exergy Page 48 of 148
8.0 WATER EFFICIENCY ANALYSES A further objective of the LEHR project was to analyse the effect of building factors and management on building water efficiency. For the purposes of assessing these factors, relevant questions from the surveys were tested against the NABERS Office Water Rating of the building. As with tests for energy consumption, in the absence of a reported certified NABERS Office Water Rating, an approximate rating was calculated.
8.1 Testing Methodology Tests for water efficiency were targeted towards questions on the base building survey, with a feasible effect on the building water efficiency. The questions tested were: 7.1: What is the primary method of cooling? 7.9: Does the building have a tenant condenser water system? 10.6: What is the extent of water sub metering? 12: Water Use – entire section 13.5: Is the building manager provided with water bills for the site? 13.6: Is non-office water use sub metered? 15: Water Management – entire section’s water responses were tested. Tests were conducted in accordance with the procedures used for energy assessments.
8.2 Water Efficiency Results Many of the tests for the effect of water efficiency factors had reduced strength due to a poor distribution of responses, with many of the yes or no style questions receiving less than 10 responses for some categories. The results of the water efficiency tests are presented in Figure 24, with variables obtaining a confidence level of 90% or above presented in Table 21 and Figure 25. The complete results from the water analyses are presented in Appendix F. When examining the results associated with improvement measures such as rainwater recovery and reuse and grey water recovery and reuse, it is also important to understand the underlying hierarchy of water investments. These high cost measures are typically only implemented in buildings which have also made many of the smaller cost improvements, meaning that any effects found in tests for these measures may in fact be artefacts of the implementation of multiple lower cost measures.
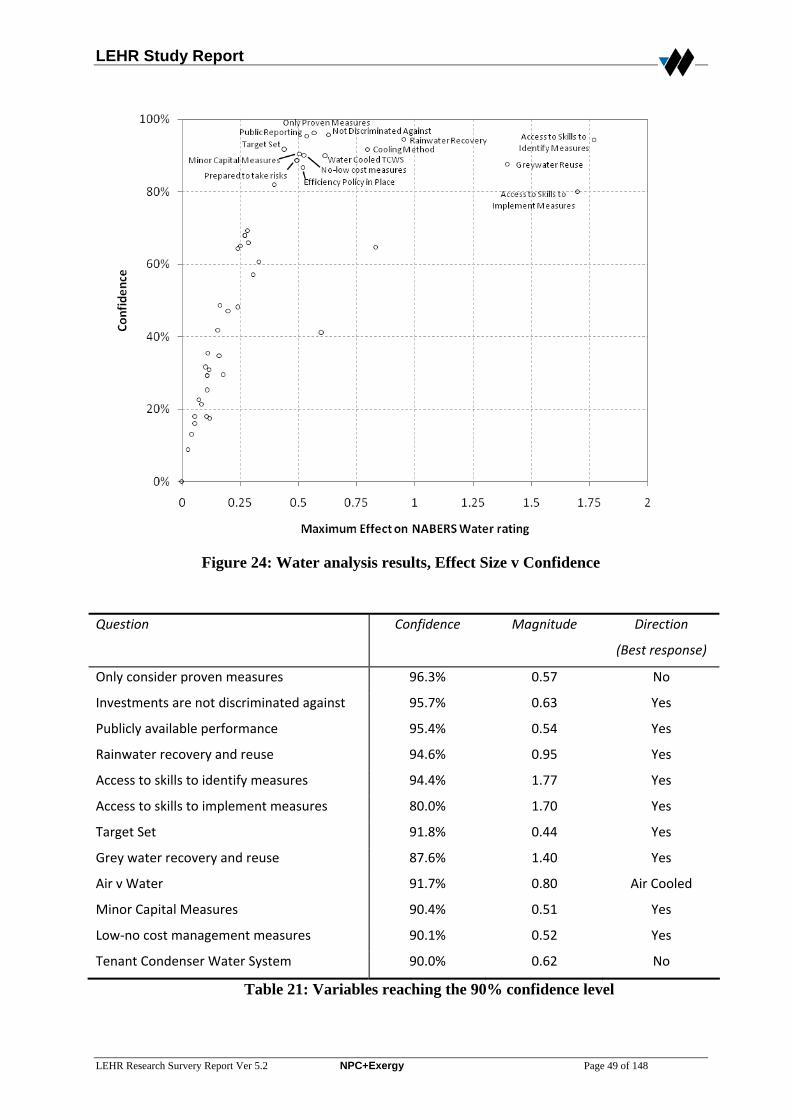
LEHR Study Report
LEHR Research Survery Report Ver 5.2 NPC+Exergy Page 49 of 148
Figure 24: Water analysis results, Effect Size v Confidence
Question Confidence Magnitude Direction
(Best response)
Only consider proven measures 96.3% 0.57 No
Investments are not discriminated against 95.7% 0.63 Yes
Publicly available performance 95.4% 0.54 Yes
Rainwater recovery and reuse 94.6% 0.95 Yes
Access to skills to identify measures 94.4% 1.77 Yes
Access to skills to implement measures 80.0% 1.70 Yes
Target Set 91.8% 0.44 Yes
Grey water recovery and reuse 87.6% 1.40 Yes
Air v Water 91.7% 0.80 Air Cooled
Minor Capital Measures 90.4% 0.51 Yes
Low‐no cost management measures 90.1% 0.52 Yes
Tenant Condenser Water System 90.0% 0.62 No
Table 21: Variables reaching the 90% confidence level
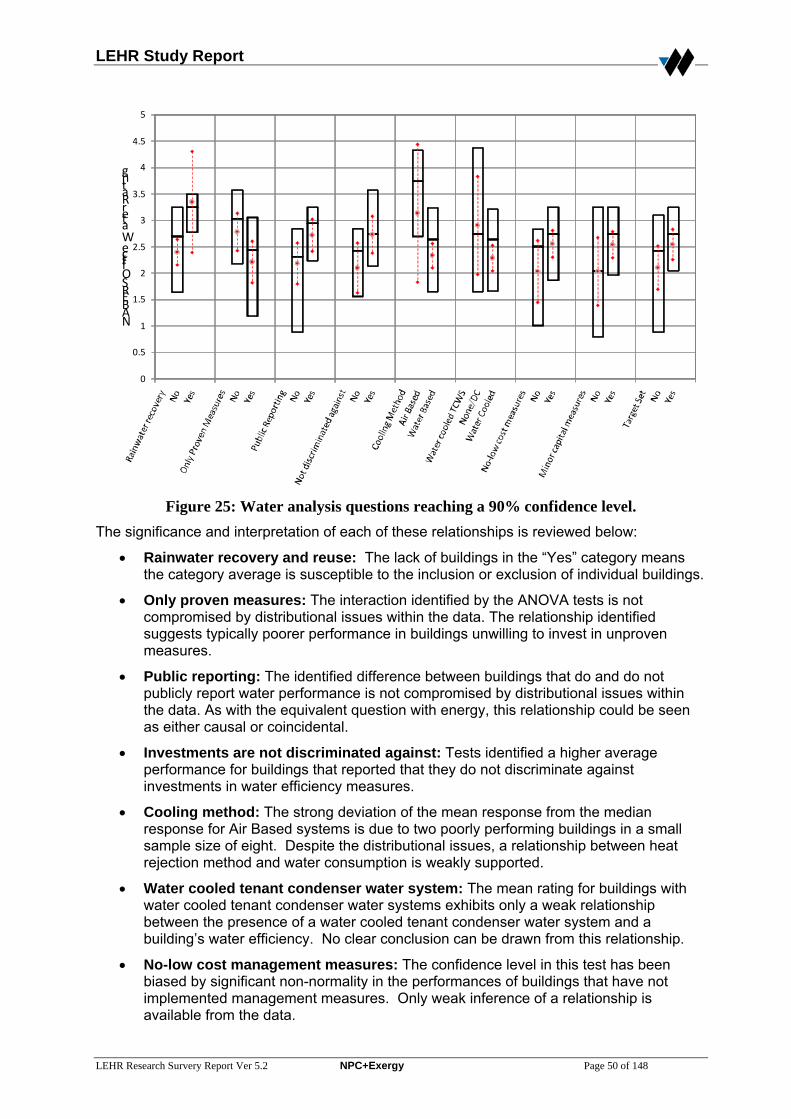
LEHR Study Report
LEHR Research Survery Report Ver 5.2 NPC+Exergy Page 50 of 148
0
0.5
1
1.5
2
2.5
3
3.5
4
4.5
5
NABERS Office Water Rating
Figure 25: Water analysis questions reaching a 90% confidence level.
The significance and interpretation of each of these relationships is reviewed below:
• Rainwater recovery and reuse: The lack of buildings in the “Yes” category means the category average is susceptible to the inclusion or exclusion of individual buildings.
• Only proven measures: The interaction identified by the ANOVA tests is not compromised by distributional issues within the data. The relationship identified suggests typically poorer performance in buildings unwilling to invest in unproven measures.
• Public reporting: The identified difference between buildings that do and do not publicly report water performance is not compromised by distributional issues within the data. As with the equivalent question with energy, this relationship could be seen as either causal or coincidental.
• Investments are not discriminated against: Tests identified a higher average performance for buildings that reported that they do not discriminate against investments in water efficiency measures.
• Cooling method: The strong deviation of the mean response from the median response for Air Based systems is due to two poorly performing buildings in a small sample size of eight. Despite the distributional issues, a relationship between heat rejection method and water consumption is weakly supported.
• Water cooled tenant condenser water system: The mean rating for buildings with water cooled tenant condenser water systems exhibits only a weak relationship between the presence of a water cooled tenant condenser water system and a building’s water efficiency. No clear conclusion can be drawn from this relationship.
• No-low cost management measures: The confidence level in this test has been biased by significant non-normality in the performances of buildings that have not implemented management measures. Only weak inference of a relationship is available from the data.
LEHR Study Report
LEHR Research Survery Report Ver 5.2 NPC+Exergy Page 51 of 148
• Minor capital measures: There is weak support for a relationship between capital measures and water ratings.
• Target Set: The presence of targets which had been set for the building’s water efficiency was exhibited a moderate relationship with building performance.
• Access to skills: There were only two buildings which responded as not having access to adequate skills and knowledge. This sample set is insufficient to draw valid conclusions. The only buildings which responded as not having access to adequate skills were the same for both skills needed to identify and skills needed to implement hence this result is equivalent for both questions.
• Grey water Recovery and Reuse: Only two buildings reported having implemented these measures. This sample is insufficient to draw valid conclusions.
Overall the results for water appear to broadly mirror those for energy and conclusions for one would appear generally valid for the other as a result.
9.0 RESULTS INTERPRETATION
9.1 Significant Positive Results Based on the analyses above, the following factors have been identified as having a significant and potentially causal impact on NABERS Office Energy performance: Individual Questions
• Economy Cycle,
• Training program
• Low cost management measures implemented
• Minor capital measures
• Main driver from the ownership chain (weak)
• Only consider proven measures (conservatism causing poorer performance)
• Staff maintained (weak)
• Public performance reporting
• Tenant contact based onsite
• Savings retained for reinvestment (weak)
Aggregation Regressions
• Economy cycle
• Maintenance team penalties
• Staff maintained
• Building Technology
• Reporting to tenants
• Multiple managers
• Manager’s perceived skills
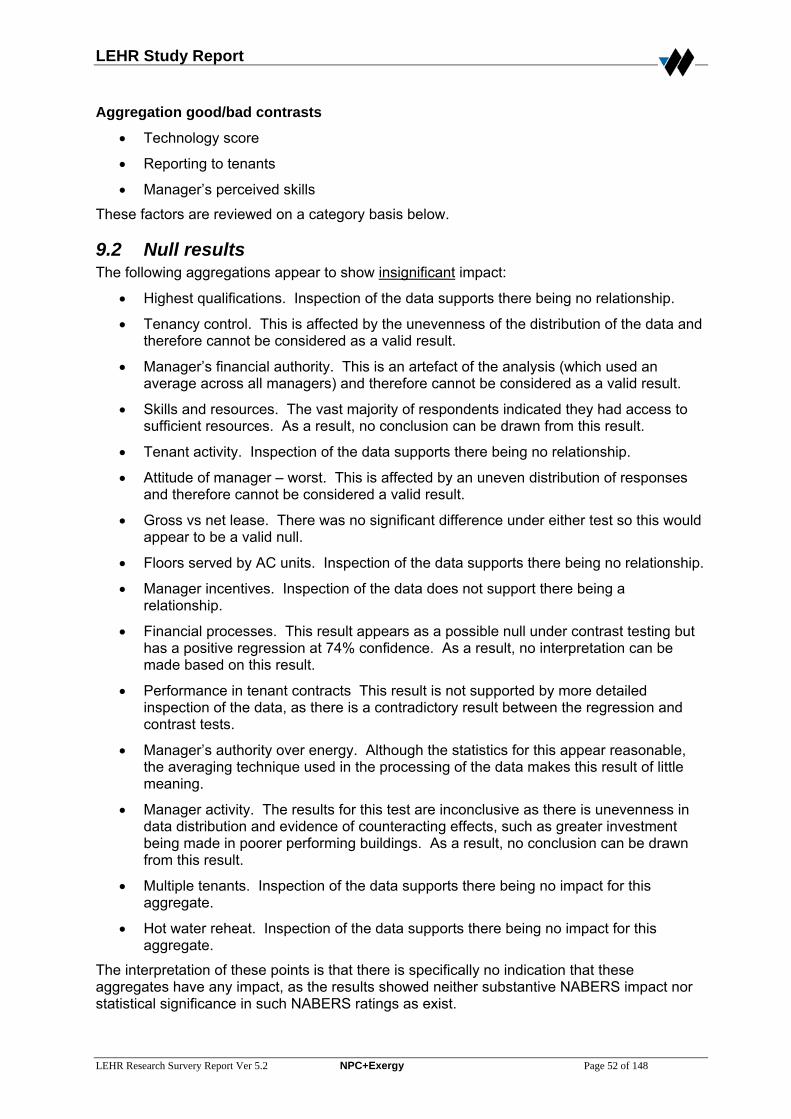
LEHR Study Report
LEHR Research Survery Report Ver 5.2 NPC+Exergy Page 52 of 148
Aggregation good/bad contrasts
• Technology score
• Reporting to tenants
• Manager’s perceived skills
These factors are reviewed on a category basis below.
9.2 Null results The following aggregations appear to show insignificant impact:
• Highest qualifications. Inspection of the data supports there being no relationship.
• Tenancy control. This is affected by the unevenness of the distribution of the data and therefore cannot be considered as a valid result.
• Manager’s financial authority. This is an artefact of the analysis (which used an average across all managers) and therefore cannot be considered as a valid result.
• Skills and resources. The vast majority of respondents indicated they had access to sufficient resources. As a result, no conclusion can be drawn from this result.
• Tenant activity. Inspection of the data supports there being no relationship.
• Attitude of manager – worst. This is affected by an uneven distribution of responses and therefore cannot be considered a valid result.
• Gross vs net lease. There was no significant difference under either test so this would appear to be a valid null.
• Floors served by AC units. Inspection of the data supports there being no relationship.
• Manager incentives. Inspection of the data does not support there being a relationship.
• Financial processes. This result appears as a possible null under contrast testing but has a positive regression at 74% confidence. As a result, no interpretation can be made based on this result.
• Performance in tenant contracts This result is not supported by more detailed inspection of the data, as there is a contradictory result between the regression and contrast tests.
• Manager’s authority over energy. Although the statistics for this appear reasonable, the averaging technique used in the processing of the data makes this result of little meaning.
• Manager activity. The results for this test are inconclusive as there is unevenness in data distribution and evidence of counteracting effects, such as greater investment being made in poorer performing buildings. As a result, no conclusion can be drawn from this result.
• Multiple tenants. Inspection of the data supports there being no impact for this aggregate.
• Hot water reheat. Inspection of the data supports there being no impact for this aggregate.
The interpretation of these points is that there is specifically no indication that these aggregates have any impact, as the results showed neither substantive NABERS impact nor statistical significance in such NABERS ratings as exist.
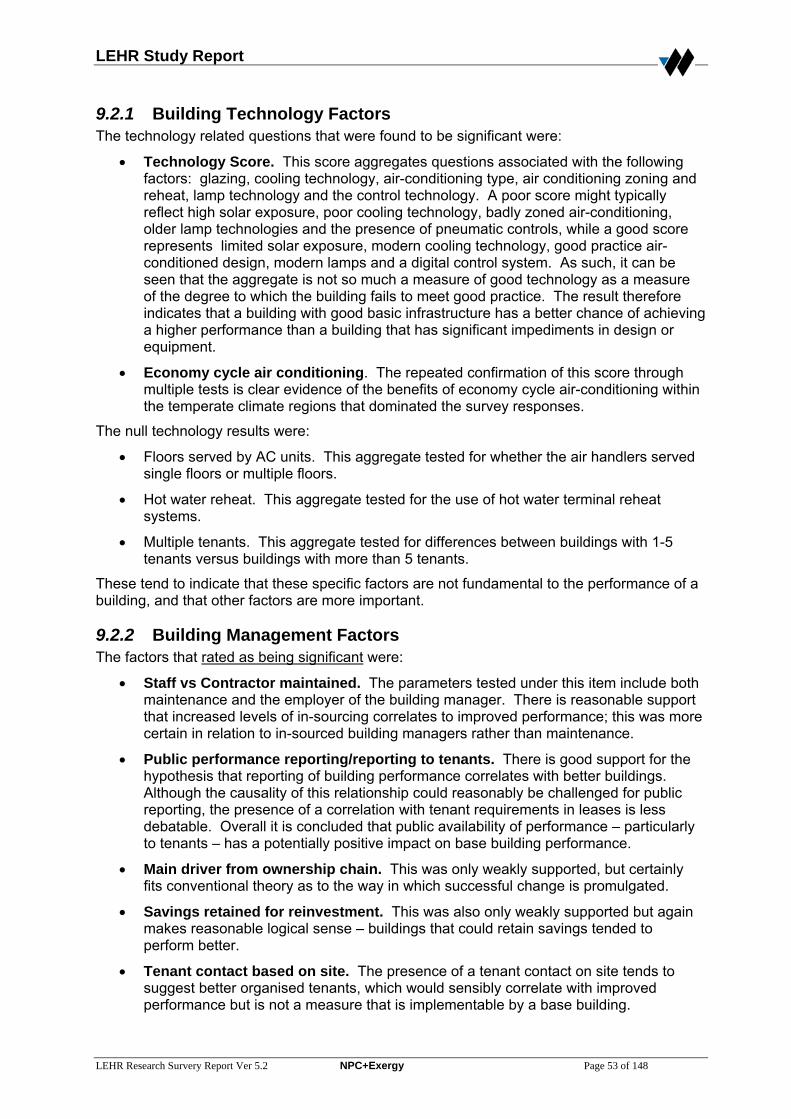
LEHR Study Report
LEHR Research Survery Report Ver 5.2 NPC+Exergy Page 53 of 148
9.2.1 Building Technology Factors The technology related questions that were found to be significant were:
• Technology Score. This score aggregates questions associated with the following factors: glazing, cooling technology, air-conditioning type, air conditioning zoning and reheat, lamp technology and the control technology. A poor score might typically reflect high solar exposure, poor cooling technology, badly zoned air-conditioning, older lamp technologies and the presence of pneumatic controls, while a good score represents limited solar exposure, modern cooling technology, good practice air-conditioned design, modern lamps and a digital control system. As such, it can be seen that the aggregate is not so much a measure of good technology as a measure of the degree to which the building fails to meet good practice. The result therefore indicates that a building with good basic infrastructure has a better chance of achieving a higher performance than a building that has significant impediments in design or equipment.
• Economy cycle air conditioning. The repeated confirmation of this score through multiple tests is clear evidence of the benefits of economy cycle air-conditioning within the temperate climate regions that dominated the survey responses.
The null technology results were:
• Floors served by AC units. This aggregate tested for whether the air handlers served single floors or multiple floors.
• Hot water reheat. This aggregate tested for the use of hot water terminal reheat systems.
• Multiple tenants. This aggregate tested for differences between buildings with 1-5 tenants versus buildings with more than 5 tenants.
These tend to indicate that these specific factors are not fundamental to the performance of a building, and that other factors are more important.
9.2.2 Building Management Factors The factors that rated as being significant were:
• Staff vs Contractor maintained. The parameters tested under this item include both maintenance and the employer of the building manager. There is reasonable support that increased levels of in-sourcing correlates to improved performance; this was more certain in relation to in-sourced building managers rather than maintenance.
• Public performance reporting/reporting to tenants. There is good support for the hypothesis that reporting of building performance correlates with better buildings. Although the causality of this relationship could reasonably be challenged for public reporting, the presence of a correlation with tenant requirements in leases is less debatable. Overall it is concluded that public availability of performance – particularly to tenants – has a potentially positive impact on base building performance.
• Main driver from ownership chain. This was only weakly supported, but certainly fits conventional theory as to the way in which successful change is promulgated.
• Savings retained for reinvestment. This was also only weakly supported but again makes reasonable logical sense – buildings that could retain savings tended to perform better.
• Tenant contact based on site. The presence of a tenant contact on site tends to suggest better organised tenants, which would sensibly correlate with improved performance but is not a measure that is implementable by a base building.
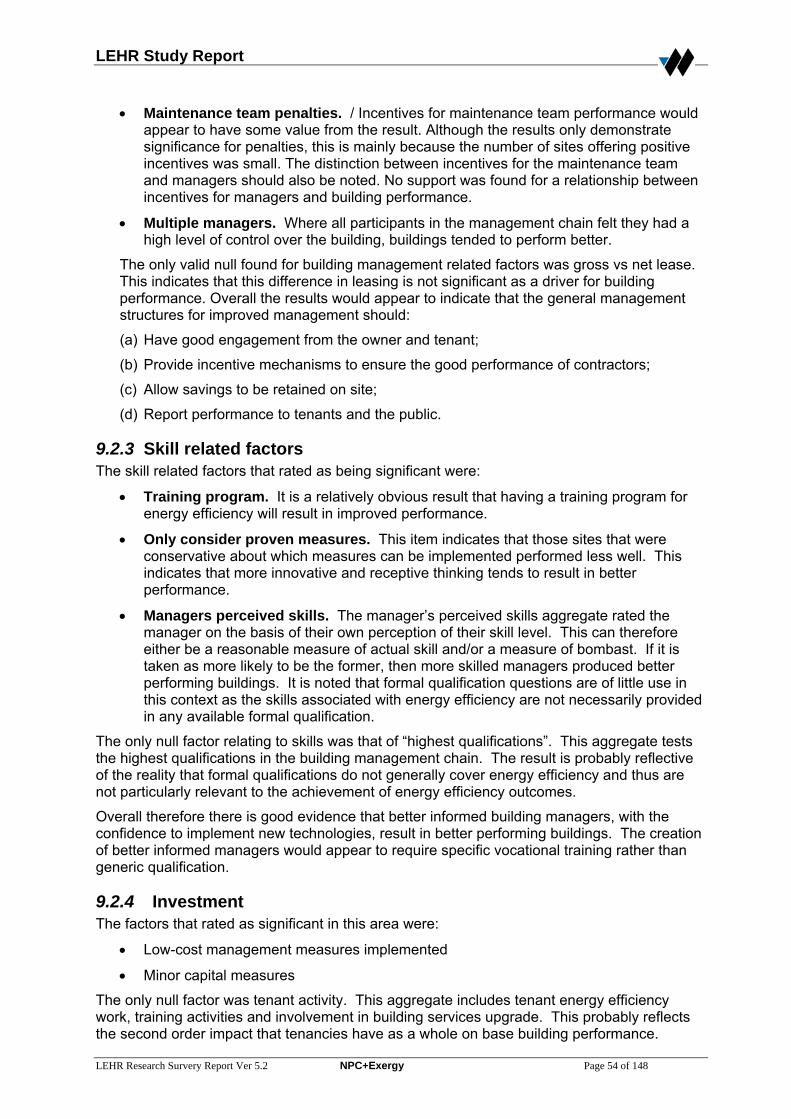
LEHR Study Report
LEHR Research Survery Report Ver 5.2 NPC+Exergy Page 54 of 148
• Maintenance team penalties. / Incentives for maintenance team performance would appear to have some value from the result. Although the results only demonstrate significance for penalties, this is mainly because the number of sites offering positive incentives was small. The distinction between incentives for the maintenance team and managers should also be noted. No support was found for a relationship between incentives for managers and building performance.
• Multiple managers. Where all participants in the management chain felt they had a high level of control over the building, buildings tended to perform better.
The only valid null found for building management related factors was gross vs net lease. This indicates that this difference in leasing is not significant as a driver for building performance. Overall the results would appear to indicate that the general management structures for improved management should:
(a) Have good engagement from the owner and tenant;
(b) Provide incentive mechanisms to ensure the good performance of contractors;
(c) Allow savings to be retained on site;
(d) Report performance to tenants and the public.
9.2.3 Skill related factors The skill related factors that rated as being significant were:
• Training program. It is a relatively obvious result that having a training program for energy efficiency will result in improved performance.
• Only consider proven measures. This item indicates that those sites that were conservative about which measures can be implemented performed less well. This indicates that more innovative and receptive thinking tends to result in better performance.
• Managers perceived skills. The manager’s perceived skills aggregate rated the manager on the basis of their own perception of their skill level. This can therefore either be a reasonable measure of actual skill and/or a measure of bombast. If it is taken as more likely to be the former, then more skilled managers produced better performing buildings. It is noted that formal qualification questions are of little use in this context as the skills associated with energy efficiency are not necessarily provided in any available formal qualification.
The only null factor relating to skills was that of “highest qualifications”. This aggregate tests the highest qualifications in the building management chain. The result is probably reflective of the reality that formal qualifications do not generally cover energy efficiency and thus are not particularly relevant to the achievement of energy efficiency outcomes.
Overall therefore there is good evidence that better informed building managers, with the confidence to implement new technologies, result in better performing buildings. The creation of better informed managers would appear to require specific vocational training rather than generic qualification.
9.2.4 Investment The factors that rated as significant in this area were:
• Low-cost management measures implemented
• Minor capital measures
The only null factor was tenant activity. This aggregate includes tenant energy efficiency work, training activities and involvement in building services upgrade. This probably reflects the second order impact that tenancies have as a whole on base building performance.
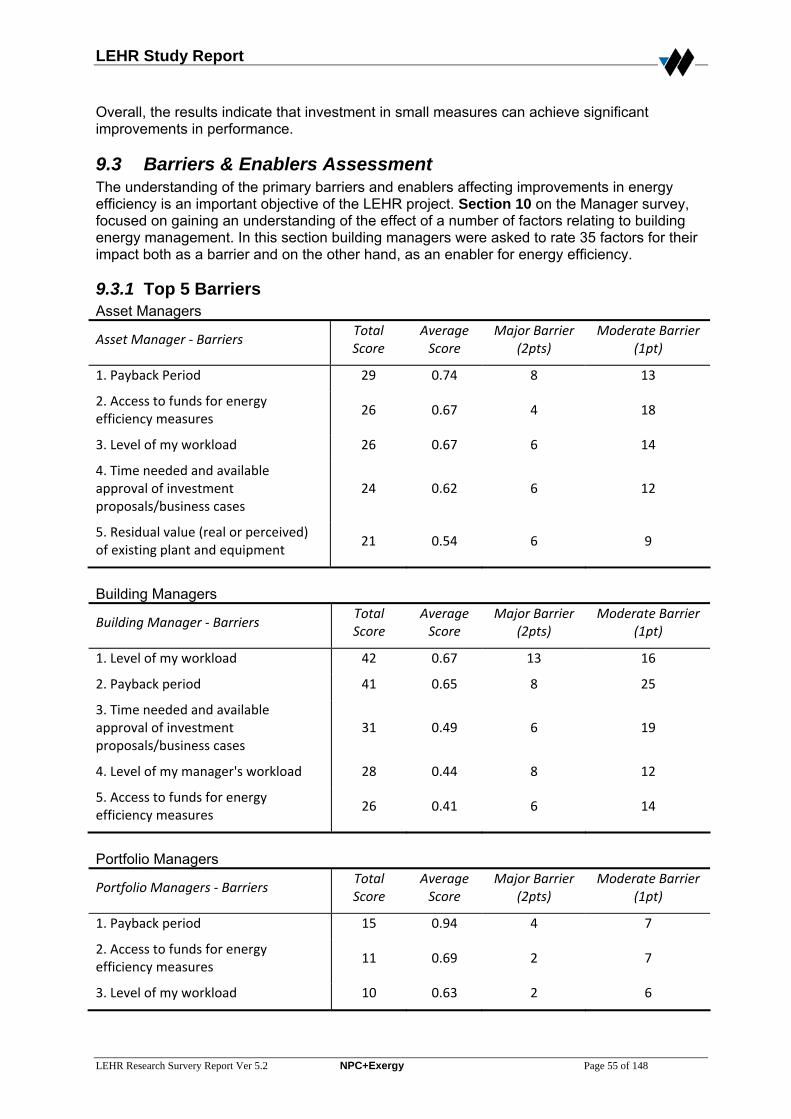
LEHR Study Report
LEHR Research Survery Report Ver 5.2 NPC+Exergy Page 55 of 148
Overall, the results indicate that investment in small measures can achieve significant improvements in performance.
9.3 Barriers & Enablers Assessment The understanding of the primary barriers and enablers affecting improvements in energy efficiency is an important objective of the LEHR project. Section 10 on the Manager survey, focused on gaining an understanding of the effect of a number of factors relating to building energy management. In this section building managers were asked to rate 35 factors for their impact both as a barrier and on the other hand, as an enabler for energy efficiency.
9.3.1 Top 5 Barriers Asset Managers
Asset Manager ‐ Barriers Total Score
Average Score
Major Barrier (2pts)
Moderate Barrier (1pt)
1. Payback Period 29 0.74 8 13
2. Access to funds for energy efficiency measures
26 0.67 4 18
3. Level of my workload 26 0.67 6 14
4. Time needed and available approval of investment proposals/business cases
24 0.62 6 12
5. Residual value (real or perceived) of existing plant and equipment
21 0.54 6 9
Building Managers
Building Manager ‐ Barriers Total Score
Average Score
Major Barrier (2pts)
Moderate Barrier (1pt)
1. Level of my workload 42 0.67 13 16
2. Payback period 41 0.65 8 25
3. Time needed and available approval of investment proposals/business cases
31 0.49 6 19
4. Level of my manager's workload 28 0.44 8 12
5. Access to funds for energy efficiency measures
26 0.41 6 14
Portfolio Managers
Portfolio Managers ‐ Barriers Total Score
Average Score
Major Barrier (2pts)
Moderate Barrier (1pt)
1. Payback period 15 0.94 4 7
2. Access to funds for energy efficiency measures
11 0.69 2 7
3. Level of my workload 10 0.63 2 6
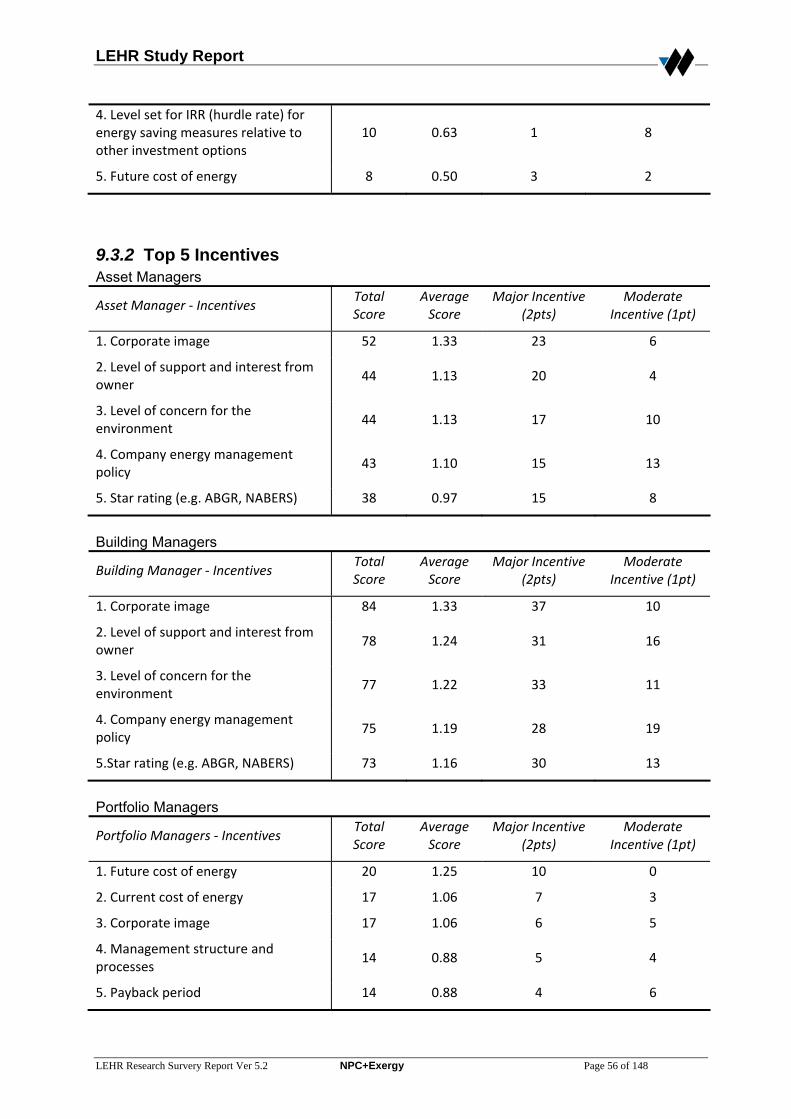
LEHR Study Report
LEHR Research Survery Report Ver 5.2 NPC+Exergy Page 56 of 148
4. Level set for IRR (hurdle rate) for energy saving measures relative to other investment options
10 0.63 1 8
5. Future cost of energy 8 0.50 3 2
9.3.2 Top 5 Incentives Asset Managers
Asset Manager ‐ Incentives Total Score
Average Score
Major Incentive (2pts)
Moderate Incentive (1pt)
1. Corporate image 52 1.33 23 6
2. Level of support and interest from owner
44 1.13 20 4
3. Level of concern for the environment
44 1.13 17 10
4. Company energy management policy
43 1.10 15 13
5. Star rating (e.g. ABGR, NABERS) 38 0.97 15 8
Building Managers
Building Manager ‐ Incentives Total Score
Average Score
Major Incentive (2pts)
Moderate Incentive (1pt)
1. Corporate image 84 1.33 37 10
2. Level of support and interest from owner
78 1.24 31 16
3. Level of concern for the environment
77 1.22 33 11
4. Company energy management policy
75 1.19 28 19
5.Star rating (e.g. ABGR, NABERS) 73 1.16 30 13
Portfolio Managers
Portfolio Managers ‐ Incentives Total Score
Average Score
Major Incentive (2pts)
Moderate Incentive (1pt)
1. Future cost of energy 20 1.25 10 0
2. Current cost of energy 17 1.06 7 3
3. Corporate image 17 1.06 6 5
4. Management structure and processes
14 0.88 5 4
5. Payback period 14 0.88 4 6
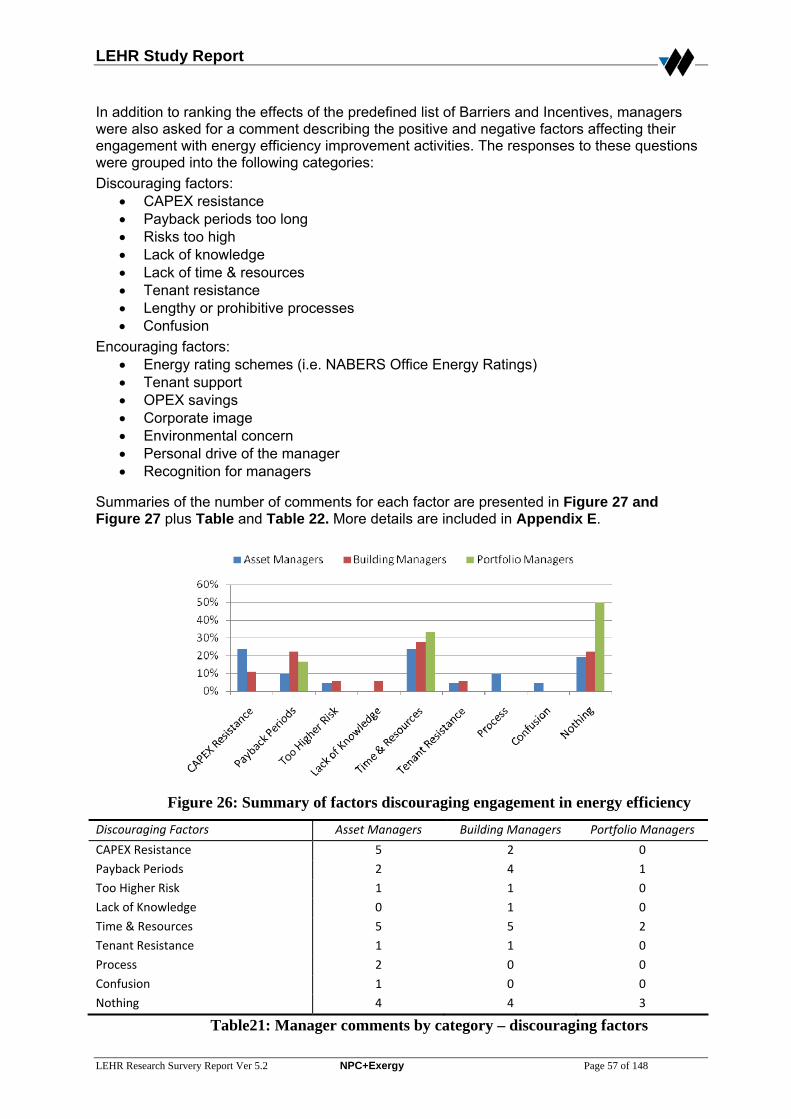
LEHR Study Report
LEHR Research Survery Report Ver 5.2 NPC+Exergy Page 57 of 148
In addition to ranking the effects of the predefined list of Barriers and Incentives, managers were also asked for a comment describing the positive and negative factors affecting their engagement with energy efficiency improvement activities. The responses to these questions were grouped into the following categories: Discouraging factors:
• CAPEX resistance • Payback periods too long • Risks too high • Lack of knowledge • Lack of time & resources • Tenant resistance • Lengthy or prohibitive processes • Confusion
Encouraging factors: • Energy rating schemes (i.e. NABERS Office Energy Ratings) • Tenant support • OPEX savings • Corporate image • Environmental concern • Personal drive of the manager • Recognition for managers
Summaries of the number of comments for each factor are presented in Figure 27 and Figure 27 plus Table and Table 22. More details are included in Appendix E.
Figure 26: Summary of factors discouraging engagement in energy efficiency
Discouraging Factors Asset Managers Building Managers Portfolio Managers
CAPEX Resistance 5 2 0 Payback Periods 2 4 1 Too Higher Risk 1 1 0 Lack of Knowledge 0 1 0 Time & Resources 5 5 2 Tenant Resistance 1 1 0 Process 2 0 0 Confusion 1 0 0 Nothing 4 4 3
Table21: Manager comments by category – discouraging factors
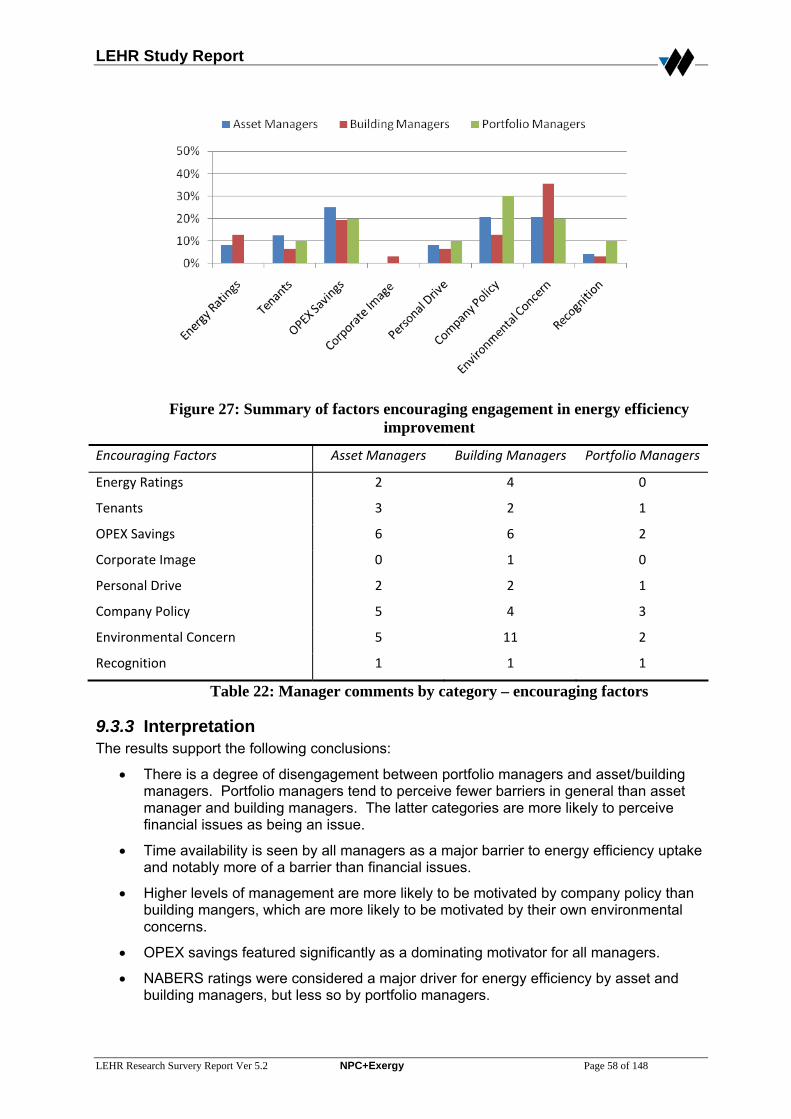
LEHR Study Report
LEHR Research Survery Report Ver 5.2 NPC+Exergy Page 58 of 148
Figure 27: Summary of factors encouraging engagement in energy efficiency improvement
Encouraging Factors Asset Managers Building Managers Portfolio Managers
Energy Ratings 2 4 0
Tenants 3 2 1
OPEX Savings 6 6 2
Corporate Image 0 1 0
Personal Drive 2 2 1
Company Policy 5 4 3
Environmental Concern 5 11 2
Recognition 1 1 1
Table 22: Manager comments by category – encouraging factors
9.3.3 Interpretation The results support the following conclusions:
• There is a degree of disengagement between portfolio managers and asset/building managers. Portfolio managers tend to perceive fewer barriers in general than asset manager and building managers. The latter categories are more likely to perceive financial issues as being an issue.
• Time availability is seen by all managers as a major barrier to energy efficiency uptake and notably more of a barrier than financial issues.
• Higher levels of management are more likely to be motivated by company policy than building mangers, which are more likely to be motivated by their own environmental concerns.
• OPEX savings featured significantly as a dominating motivator for all managers.
• NABERS ratings were considered a major driver for energy efficiency by asset and building managers, but less so by portfolio managers.
LEHR Study Report
LEHR Research Survery Report Ver 5.2 NPC+Exergy Page 59 of 148
These results indicate that there is a need to improve communication in both directions through the management chain to align objectives. It is also important that in the process of engagement (as identified in Section 9.2.2) the differences in motivations are considered.
9.4 Overall Impacts Owing to the high level of variation in the circumstances of individual buildings, it is hard to draw on specific evidence to assess the overall impacts of identified measures on building performance. However, it would appear reasonable to assert that, as there are buildings performing at 4 Stars NABERS for most building technology, PCA grades and ages, there is a reasonable potential for most buildings to be upgraded to this level. This matches well with the specific correlation-based results which show impacts of 0.5 stars and higher for major groups of activities. This overall result asserts the potential for a sector-wide performance improvement of approximately 30% relative to average (2.5 Star NABERS) performance, which coincidentally matches independent assessment by Exergy based on energy audits3. If applied to the entire commercial office population of Australia, this extrapolates to a 1.2% reduction in Australia’s national emissions total. It could be argued that given the nature of the study sample this reduction potential is conservative. Firstly, the 2000 odd buildings in the PCA total population do not include buildings in such centres as Melbourne’s Southbank or Sydney’s Chatswood and North Ryde commercial zones. Secondly, C and D-Grade buildings were under represented in the study sample population and there is evidence that these have a greater energy saving potential per m² than the P and A-Grade buildings that were over represented in the sample. These findings are documented in a study report “Delivering Sustainability: Improving the energy efficiency of the CBD” by Dr R Reed and Ms S Wilkinson from the University of Melbourne. They were commissioned by the Royal Institute of Chartered Surveyors (RICS) in 2005 to study energy use in the same high rise building sector as for the LEHR study but it was limited to the in Melbourne CBD. This was a 100% population study (326 buildings versus 363 in the 2006 PCA data for Melbourne) involving site inspections and comprehensive data gathering (NLA, Grade, building characteristics, age and energy). Unfortunately the RICS report did not address the relationships between GHG emissions or energy density and building Grade. However, they did find 3 other important relationships:
1. The higher the m²/person ratio the greater the building emissions;
2. The smaller the building the greater the energy use and the emissions; and
3. Emissions and energy use increase dramatically with building age
Given that C and D buildings are older, smaller and have higher area per occupant space ratios than P, A and B-Grade buildings, this supports the argument that C and D buildings are likely to be higher energy users and Greenhouse gas emitters, at least on a per m² basis. This will make up in part for the fact that while they are 50% of the population in number, they only account for 20% of the sector’s total floor area. Therefore, C and D-Grade buildings should be a special area of focus in any suite of measures developed by the LEHR project if maximum cost effective impact is to be made on Greenhouse gas emissions and energy savings.
3 Energy Efficiency Potential of Commercial Office Buildings in Australia, C.J Bloomfield and P. Bannister, Sustainable Buildings 2007 (SB07), Hong Kong, December 2007.
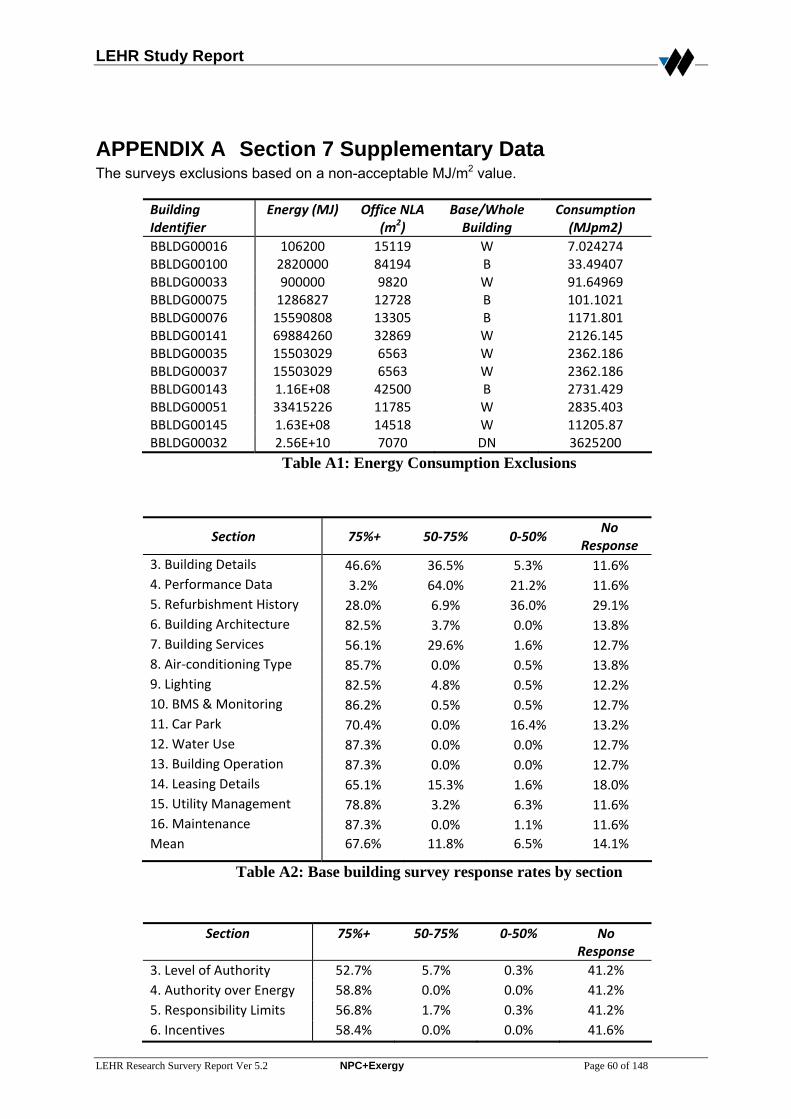
LEHR Study Report
LEHR Research Survery Report Ver 5.2 NPC+Exergy Page 60 of 148
APPENDIX A Section 7 Supplementary Data The surveys exclusions based on a non-acceptable MJ/m2 value.
Building Identifier
Energy (MJ) Office NLA (m2)
Base/Whole Building
Consumption (MJpm2)
BBLDG00016 106200 15119 W 7.024274 BBLDG00100 2820000 84194 B 33.49407 BBLDG00033 900000 9820 W 91.64969 BBLDG00075 1286827 12728 B 101.1021 BBLDG00076 15590808 13305 B 1171.801 BBLDG00141 69884260 32869 W 2126.145 BBLDG00035 15503029 6563 W 2362.186 BBLDG00037 15503029 6563 W 2362.186 BBLDG00143 1.16E+08 42500 B 2731.429 BBLDG00051 33415226 11785 W 2835.403 BBLDG00145 1.63E+08 14518 W 11205.87 BBLDG00032 2.56E+10 7070 DN 3625200
Table A1: Energy Consumption Exclusions
Section 75%+ 50‐75% 0‐50% No
Response 3. Building Details 46.6% 36.5% 5.3% 11.6% 4. Performance Data 3.2% 64.0% 21.2% 11.6% 5. Refurbishment History 28.0% 6.9% 36.0% 29.1% 6. Building Architecture 82.5% 3.7% 0.0% 13.8% 7. Building Services 56.1% 29.6% 1.6% 12.7% 8. Air‐conditioning Type 85.7% 0.0% 0.5% 13.8% 9. Lighting 82.5% 4.8% 0.5% 12.2% 10. BMS & Monitoring 86.2% 0.5% 0.5% 12.7% 11. Car Park 70.4% 0.0% 16.4% 13.2% 12. Water Use 87.3% 0.0% 0.0% 12.7% 13. Building Operation 87.3% 0.0% 0.0% 12.7% 14. Leasing Details 65.1% 15.3% 1.6% 18.0% 15. Utility Management 78.8% 3.2% 6.3% 11.6% 16. Maintenance 87.3% 0.0% 1.1% 11.6% Mean 67.6% 11.8% 6.5% 14.1%
Table A2: Base building survey response rates by section
Section 75%+ 50‐75% 0‐50% No
Response 3. Level of Authority 52.7% 5.7% 0.3% 41.2% 4. Authority over Energy 58.8% 0.0% 0.0% 41.2% 5. Responsibility Limits 56.8% 1.7% 0.3% 41.2% 6. Incentives 58.4% 0.0% 0.0% 41.6%
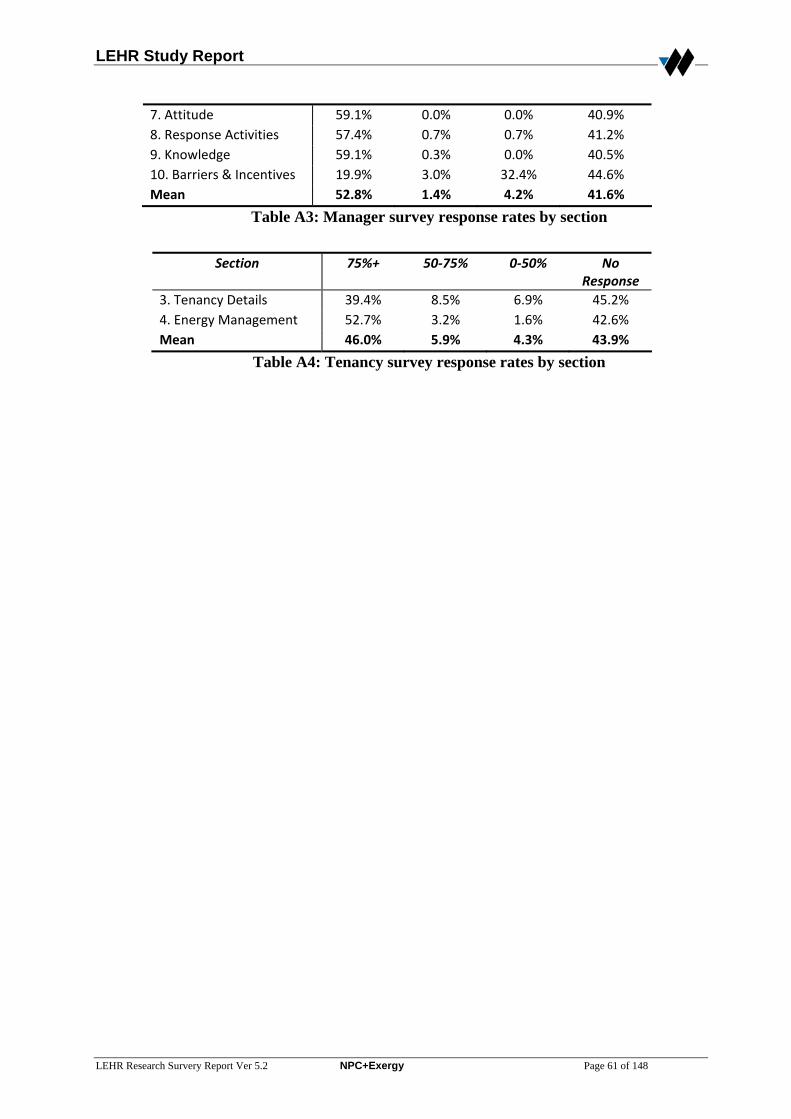
LEHR Study Report
LEHR Research Survery Report Ver 5.2 NPC+Exergy Page 61 of 148
7. Attitude 59.1% 0.0% 0.0% 40.9% 8. Response Activities 57.4% 0.7% 0.7% 41.2% 9. Knowledge 59.1% 0.3% 0.0% 40.5% 10. Barriers & Incentives 19.9% 3.0% 32.4% 44.6% Mean 52.8% 1.4% 4.2% 41.6%
Table A3: Manager survey response rates by section
Section 75%+ 50‐75% 0‐50% No Response
3. Tenancy Details 39.4% 8.5% 6.9% 45.2% 4. Energy Management 52.7% 3.2% 1.6% 42.6% Mean 46.0% 5.9% 4.3% 43.9%
Table A4: Tenancy survey response rates by section
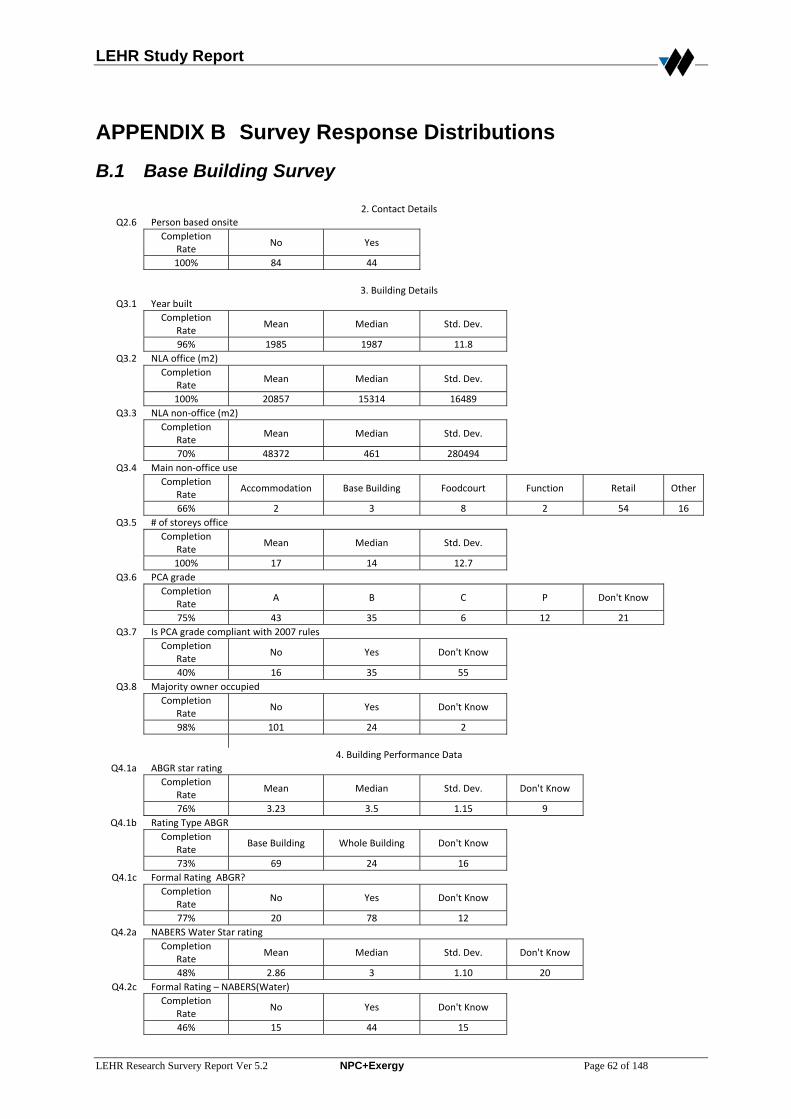
LEHR Study Report
LEHR Research Survery Report Ver 5.2 NPC+Exergy Page 62 of 148
APPENDIX B Survey Response Distributions
B.1 Base Building Survey
2. Contact Details Q2.6 Person based onsite
Completion Rate
No Yes
100% 84 44
3. Building Details
Q3.1 Year built Completion
Rate Mean Median Std. Dev.
96% 1985 1987 11.8
Q3.2 NLA office (m2) Completion
Rate Mean Median Std. Dev.
100% 20857 15314 16489
Q3.3 NLA non‐office (m2) Completion
Rate Mean Median Std. Dev.
70% 48372 461 280494
Q3.4 Main non‐office use Completion
Rate Accommodation Base Building Foodcourt Function Retail Other
66% 2 3 8 2 54 16
Q3.5 # of storeys office Completion
Rate Mean Median Std. Dev.
100% 17 14 12.7
Q3.6 PCA grade Completion
Rate A B C P Don't Know
75% 43 35 6 12 21
Q3.7 Is PCA grade compliant with 2007 rules Completion
Rate No Yes Don't Know
40% 16 35 55
Q3.8 Majority owner occupied Completion
Rate No Yes Don't Know
98% 101 24 2
4. Building Performance Data
Q4.1a ABGR star rating Completion
Rate Mean Median Std. Dev. Don't Know
76% 3.23 3.5 1.15 9
Q4.1b Rating Type ABGR Completion
Rate Base Building Whole Building Don't Know
73% 69 24 16
Q4.1c Formal Rating ABGR? Completion
Rate No Yes Don't Know
77% 20 78 12
Q4.2a NABERS Water Star rating Completion
Rate Mean Median Std. Dev. Don't Know
48% 2.86 3 1.10 20
Q4.2c Formal Rating – NABERS(Water) Completion
Rate No Yes Don't Know
46% 15 44 15
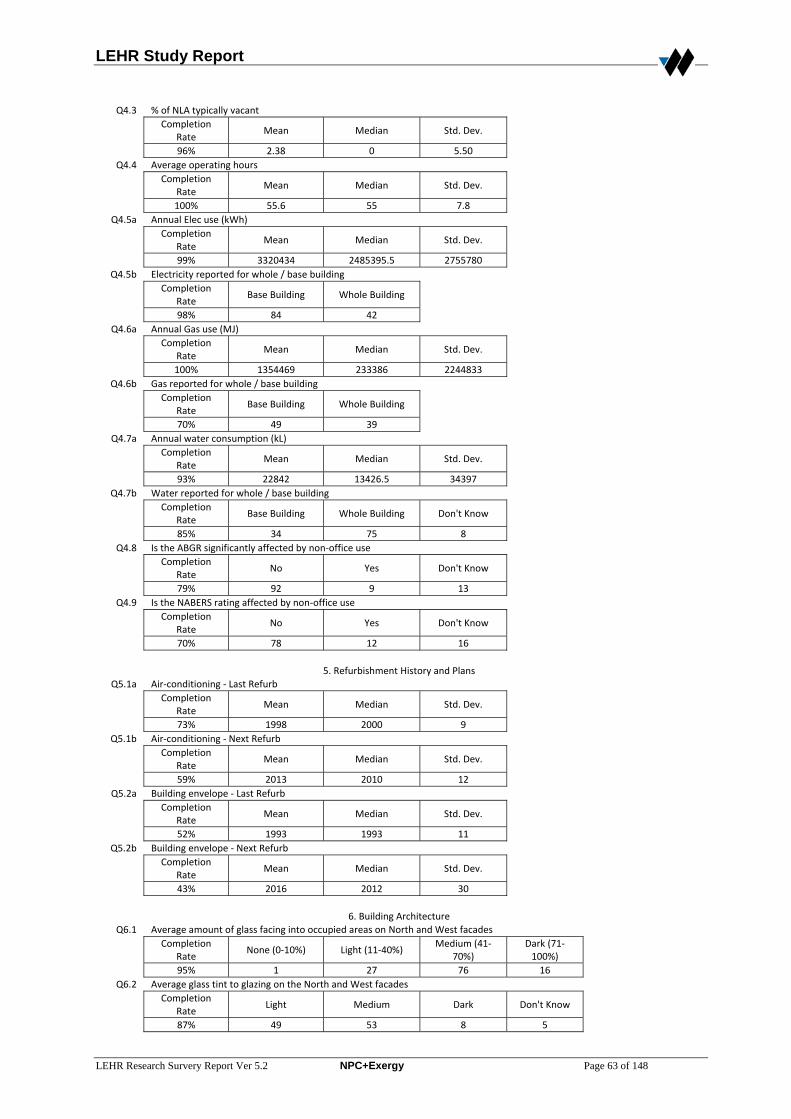
LEHR Study Report
LEHR Research Survery Report Ver 5.2 NPC+Exergy Page 63 of 148
Q4.3 % of NLA typically vacant Completion
Rate Mean Median Std. Dev.
96% 2.38 0 5.50
Q4.4 Average operating hours Completion
Rate Mean Median Std. Dev.
100% 55.6 55 7.8
Q4.5a Annual Elec use (kWh) Completion
Rate Mean Median Std. Dev.
99% 3320434 2485395.5 2755780
Q4.5b Electricity reported for whole / base building Completion
Rate Base Building Whole Building
98% 84 42
Q4.6a Annual Gas use (MJ) Completion
Rate Mean Median Std. Dev.
100% 1354469 233386 2244833
Q4.6b Gas reported for whole / base building Completion
Rate Base Building Whole Building
70% 49 39
Q4.7a Annual water consumption (kL) Completion
Rate Mean Median Std. Dev.
93% 22842 13426.5 34397
Q4.7b Water reported for whole / base building Completion
Rate Base Building Whole Building Don't Know
85% 34 75 8
Q4.8 Is the ABGR significantly affected by non‐office use Completion
Rate No Yes Don't Know
79% 92 9 13
Q4.9 Is the NABERS rating affected by non‐office use Completion
Rate No Yes Don't Know
70% 78 12 16
5. Refurbishment History and Plans
Q5.1a Air‐conditioning ‐ Last Refurb Completion
Rate Mean Median Std. Dev.
73% 1998 2000 9
Q5.1b Air‐conditioning ‐ Next Refurb Completion
Rate Mean Median Std. Dev.
59% 2013 2010 12
Q5.2a Building envelope ‐ Last Refurb Completion
Rate Mean Median Std. Dev.
52% 1993 1993 11
Q5.2b Building envelope ‐ Next Refurb Completion
Rate Mean Median Std. Dev.
43% 2016 2012 30
6. Building Architecture
Q6.1 Average amount of glass facing into occupied areas on North and West facades Completion
Rate None (0‐10%) Light (11‐40%)
Medium (41‐70%)
Dark (71‐100%)
95% 1 27 76 16
Q6.2 Average glass tint to glazing on the North and West facades Completion
Rate Light Medium Dark Don't Know
87% 49 53 8 5
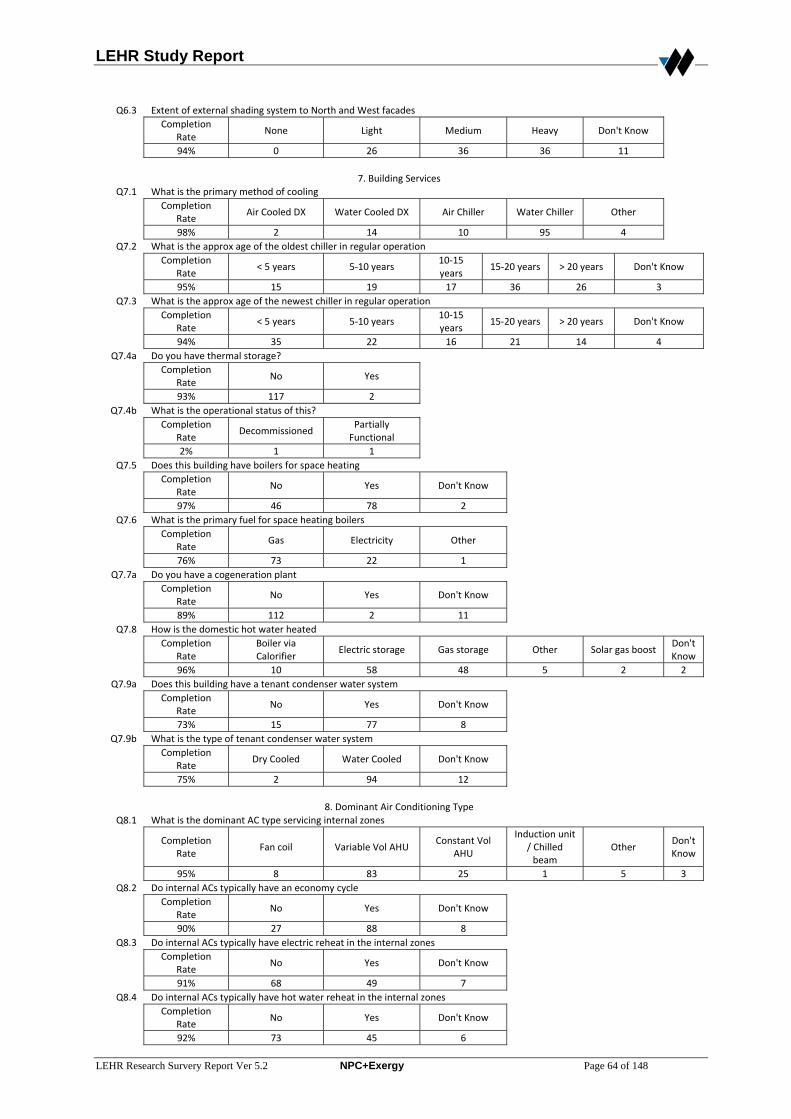
LEHR Study Report
LEHR Research Survery Report Ver 5.2 NPC+Exergy Page 64 of 148
Q6.3 Extent of external shading system to North and West facades Completion
Rate None Light Medium Heavy Don't Know
94% 0 26 36 36 11
7. Building Services
Q7.1 What is the primary method of cooling Completion
Rate Air Cooled DX Water Cooled DX Air Chiller Water Chiller Other
98% 2 14 10 95 4
Q7.2 What is the approx age of the oldest chiller in regular operation Completion
Rate < 5 years 5‐10 years
10‐15 years
15‐20 years > 20 years Don't Know
95% 15 19 17 36 26 3 Q7.3 What is the approx age of the newest chiller in regular operation
Completion Rate
< 5 years 5‐10 years 10‐15 years
15‐20 years > 20 years Don't Know
94% 35 22 16 21 14 4 Q7.4a Do you have thermal storage?
Completion Rate
No Yes
93% 117 2
Q7.4b What is the operational status of this? Completion
Rate Decommissioned
Partially Functional
2% 1 1 Q7.5 Does this building have boilers for space heating
Completion Rate
No Yes Don't Know
97% 46 78 2
Q7.6 What is the primary fuel for space heating boilers Completion
Rate Gas Electricity Other
76% 73 22 1
Q7.7a Do you have a cogeneration plant Completion
Rate No Yes Don't Know
89% 112 2 11
Q7.8 How is the domestic hot water heated Completion
Rate Boiler via Calorifier
Electric storage Gas storage Other Solar gas boost Don't Know
96% 10 58 48 5 2 2 Q7.9a Does this building have a tenant condenser water system
Completion Rate
No Yes Don't Know
73% 15 77 8
Q7.9b What is the type of tenant condenser water system Completion
Rate Dry Cooled Water Cooled Don't Know
75% 2 94 12
8. Dominant Air Conditioning Type
Q8.1 What is the dominant AC type servicing internal zones
Completion Rate
Fan coil Variable Vol AHU Constant Vol
AHU
Induction unit / Chilled beam
Other Don't Know
95% 8 83 25 1 5 3 Q8.2 Do internal ACs typically have an economy cycle
Completion Rate
No Yes Don't Know
90% 27 88 8
Q8.3 Do internal ACs typically have electric reheat in the internal zones Completion
Rate No Yes Don't Know
91% 68 49 7
Q8.4 Do internal ACs typically have hot water reheat in the internal zones Completion
Rate No Yes Don't Know
92% 73 45 6
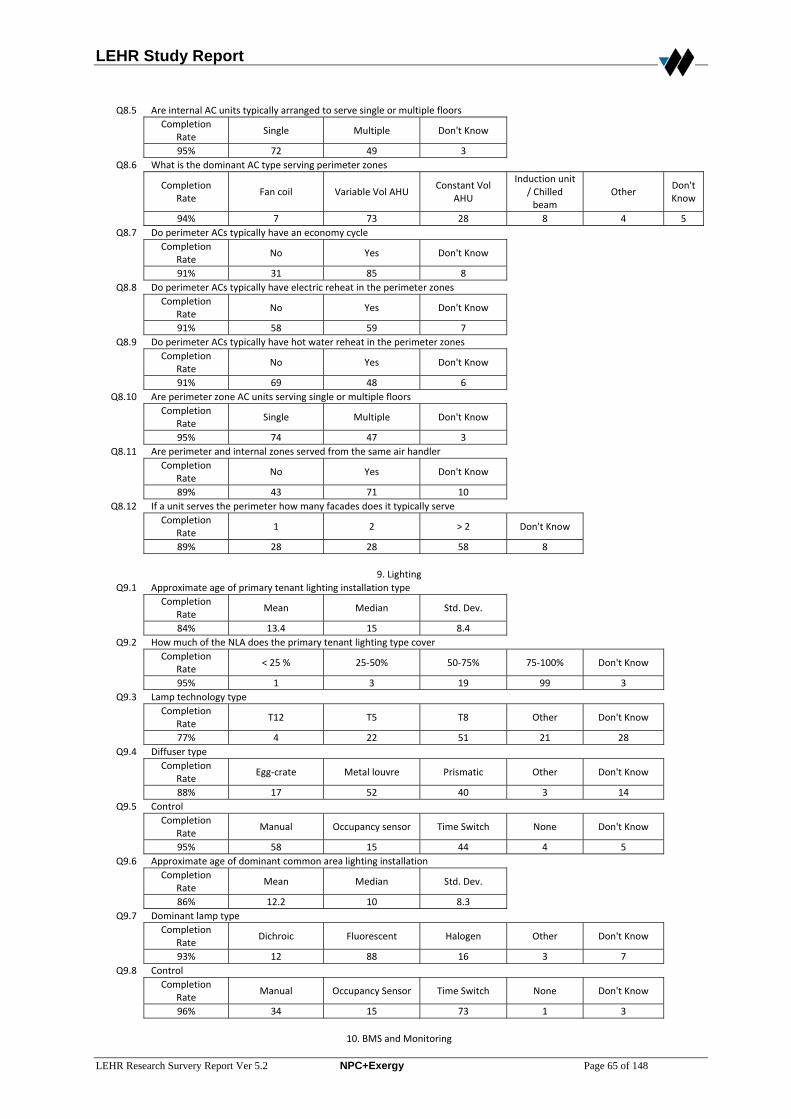
LEHR Study Report
LEHR Research Survery Report Ver 5.2 NPC+Exergy Page 65 of 148
Q8.5 Are internal AC units typically arranged to serve single or multiple floors Completion
Rate Single Multiple Don't Know
95% 72 49 3
Q8.6 What is the dominant AC type serving perimeter zones
Completion Rate
Fan coil Variable Vol AHU Constant Vol
AHU
Induction unit / Chilled beam
Other Don't Know
94% 7 73 28 8 4 5 Q8.7 Do perimeter ACs typically have an economy cycle
Completion Rate
No Yes Don't Know
91% 31 85 8
Q8.8 Do perimeter ACs typically have electric reheat in the perimeter zones Completion
Rate No Yes Don't Know
91% 58 59 7
Q8.9 Do perimeter ACs typically have hot water reheat in the perimeter zones Completion
Rate No Yes Don't Know
91% 69 48 6
Q8.10 Are perimeter zone AC units serving single or multiple floors Completion
Rate Single Multiple Don't Know
95% 74 47 3
Q8.11 Are perimeter and internal zones served from the same air handler Completion
Rate No Yes Don't Know
89% 43 71 10
Q8.12 If a unit serves the perimeter how many facades does it typically serve Completion
Rate 1 2 > 2 Don't Know
89% 28 28 58 8
9. Lighting
Q9.1 Approximate age of primary tenant lighting installation type Completion
Rate Mean Median Std. Dev.
84% 13.4 15 8.4
Q9.2 How much of the NLA does the primary tenant lighting type cover Completion
Rate < 25 % 25‐50% 50‐75% 75‐100% Don't Know
95% 1 3 19 99 3
Q9.3 Lamp technology type Completion
Rate T12 T5 T8 Other Don't Know
77% 4 22 51 21 28
Q9.4 Diffuser type Completion
Rate Egg‐crate Metal louvre Prismatic Other Don't Know
88% 17 52 40 3 14
Q9.5 Control Completion
Rate Manual Occupancy sensor Time Switch None Don't Know
95% 58 15 44 4 5
Q9.6 Approximate age of dominant common area lighting installation Completion
Rate Mean Median Std. Dev.
86% 12.2 10 8.3
Q9.7 Dominant lamp type Completion
Rate Dichroic Fluorescent Halogen Other Don't Know
93% 12 88 16 3 7
Q9.8 Control Completion
Rate Manual Occupancy Sensor Time Switch None Don't Know
96% 34 15 73 1 3
10. BMS and Monitoring
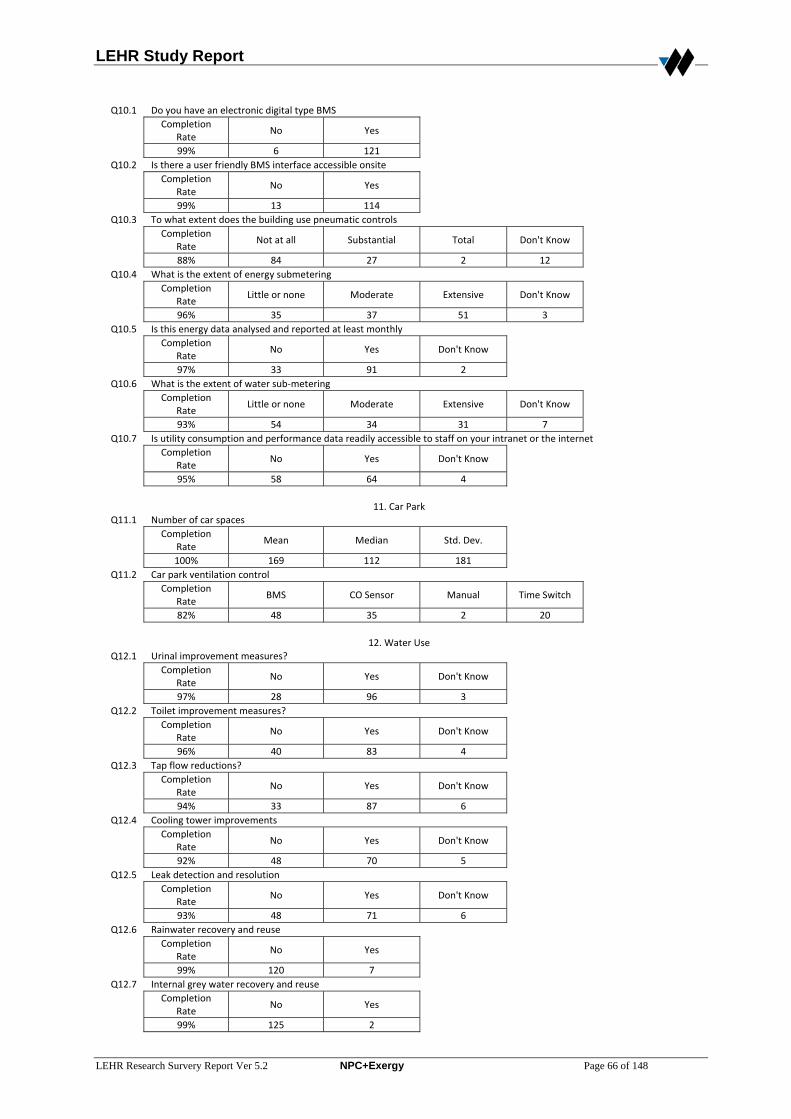
LEHR Study Report
LEHR Research Survery Report Ver 5.2 NPC+Exergy Page 66 of 148
Q10.1 Do you have an electronic digital type BMS Completion
Rate No Yes
99% 6 121
Q10.2 Is there a user friendly BMS interface accessible onsite Completion
Rate No Yes
99% 13 114
Q10.3 To what extent does the building use pneumatic controls Completion
Rate Not at all Substantial Total Don't Know
88% 84 27 2 12
Q10.4 What is the extent of energy submetering Completion
Rate Little or none Moderate Extensive Don't Know
96% 35 37 51 3
Q10.5 Is this energy data analysed and reported at least monthly Completion
Rate No Yes Don't Know
97% 33 91 2
Q10.6 What is the extent of water sub‐metering Completion
Rate Little or none Moderate Extensive Don't Know
93% 54 34 31 7
Q10.7 Is utility consumption and performance data readily accessible to staff on your intranet or the internet Completion
Rate No Yes Don't Know
95% 58 64 4
11. Car Park
Q11.1 Number of car spaces Completion
Rate Mean Median Std. Dev.
100% 169 112 181
Q11.2 Car park ventilation control Completion
Rate BMS CO Sensor Manual Time Switch
82% 48 35 2 20
12. Water Use
Q12.1 Urinal improvement measures? Completion
Rate No Yes Don't Know
97% 28 96 3
Q12.2 Toilet improvement measures? Completion
Rate No Yes Don't Know
96% 40 83 4
Q12.3 Tap flow reductions? Completion
Rate No Yes Don't Know
94% 33 87 6
Q12.4 Cooling tower improvements Completion
Rate No Yes Don't Know
92% 48 70 5
Q12.5 Leak detection and resolution Completion
Rate No Yes Don't Know
93% 48 71 6
Q12.6 Rainwater recovery and reuse Completion
Rate No Yes
99% 120 7
Q12.7 Internal grey water recovery and reuse Completion
Rate No Yes
99% 125 2
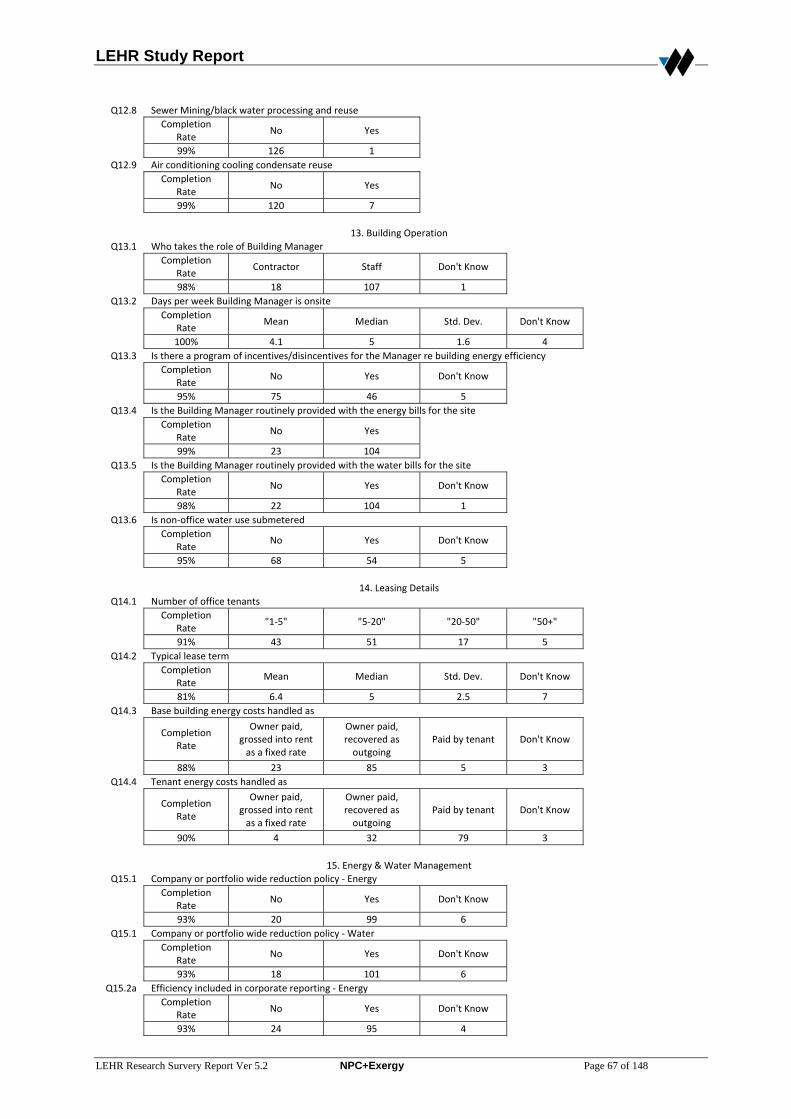
LEHR Study Report
LEHR Research Survery Report Ver 5.2 NPC+Exergy Page 67 of 148
Q12.8 Sewer Mining/black water processing and reuse Completion
Rate No Yes
99% 126 1
Q12.9 Air conditioning cooling condensate reuse Completion
Rate No Yes
99% 120 7
13. Building Operation
Q13.1 Who takes the role of Building Manager Completion
Rate Contractor Staff Don't Know
98% 18 107 1
Q13.2 Days per week Building Manager is onsite Completion
Rate Mean Median Std. Dev. Don't Know
100% 4.1 5 1.6 4
Q13.3 Is there a program of incentives/disincentives for the Manager re building energy efficiency Completion
Rate No Yes Don't Know
95% 75 46 5
Q13.4 Is the Building Manager routinely provided with the energy bills for the site Completion
Rate No Yes
99% 23 104
Q13.5 Is the Building Manager routinely provided with the water bills for the site Completion
Rate No Yes Don't Know
98% 22 104 1
Q13.6 Is non‐office water use submetered Completion
Rate No Yes Don't Know
95% 68 54 5
14. Leasing Details
Q14.1 Number of office tenants Completion
Rate "1‐5" "5‐20" "20‐50" "50+"
91% 43 51 17 5
Q14.2 Typical lease term Completion
Rate Mean Median Std. Dev. Don't Know
81% 6.4 5 2.5 7
Q14.3 Base building energy costs handled as
Completion Rate
Owner paid, grossed into rent as a fixed rate
Owner paid, recovered as outgoing
Paid by tenant Don't Know
88% 23 85 5 3
Q14.4 Tenant energy costs handled as
Completion Rate
Owner paid, grossed into rent as a fixed rate
Owner paid, recovered as outgoing
Paid by tenant Don't Know
90% 4 32 79 3
15. Energy & Water Management
Q15.1 Company or portfolio wide reduction policy ‐ Energy Completion
Rate No Yes Don't Know
93% 20 99 6
Q15.1 Company or portfolio wide reduction policy ‐ Water Completion
Rate No Yes Don't Know
93% 18 101 6
Q15.2a Efficiency included in corporate reporting ‐ Energy Completion
Rate No Yes Don't Know
93% 24 95 4
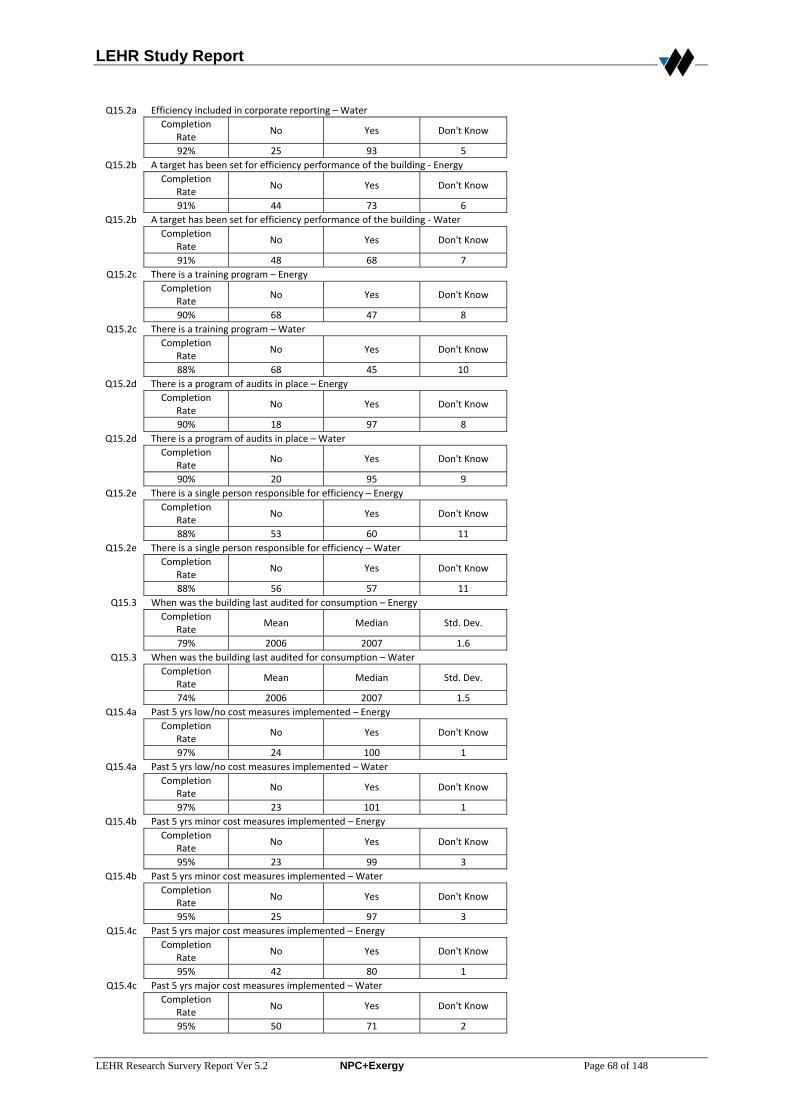
LEHR Study Report
LEHR Research Survery Report Ver 5.2 NPC+Exergy Page 68 of 148
Q15.2a Efficiency included in corporate reporting – Water Completion
Rate No Yes Don't Know
92% 25 93 5
Q15.2b A target has been set for efficiency performance of the building ‐ Energy Completion
Rate No Yes Don't Know
91% 44 73 6
Q15.2b A target has been set for efficiency performance of the building ‐ Water Completion
Rate No Yes Don't Know
91% 48 68 7
Q15.2c There is a training program – Energy Completion
Rate No Yes Don't Know
90% 68 47 8
Q15.2c There is a training program – Water Completion
Rate No Yes Don't Know
88% 68 45 10
Q15.2d There is a program of audits in place – Energy Completion
Rate No Yes Don't Know
90% 18 97 8
Q15.2d There is a program of audits in place – Water Completion
Rate No Yes Don't Know
90% 20 95 9
Q15.2e There is a single person responsible for efficiency – Energy Completion
Rate No Yes Don't Know
88% 53 60 11
Q15.2e There is a single person responsible for efficiency – Water Completion
Rate No Yes Don't Know
88% 56 57 11
Q15.3 When was the building last audited for consumption – Energy Completion
Rate Mean Median Std. Dev.
79% 2006 2007 1.6
Q15.3 When was the building last audited for consumption – Water Completion
Rate Mean Median Std. Dev.
74% 2006 2007 1.5
Q15.4a Past 5 yrs low/no cost measures implemented – Energy Completion
Rate No Yes Don't Know
97% 24 100 1
Q15.4a Past 5 yrs low/no cost measures implemented – Water Completion
Rate No Yes Don't Know
97% 23 101 1
Q15.4b Past 5 yrs minor cost measures implemented – Energy Completion
Rate No Yes Don't Know
95% 23 99 3
Q15.4b Past 5 yrs minor cost measures implemented – Water Completion
Rate No Yes Don't Know
95% 25 97 3
Q15.4c Past 5 yrs major cost measures implemented – Energy Completion
Rate No Yes Don't Know
95% 42 80 1
Q15.4c Past 5 yrs major cost measures implemented – Water Completion
Rate No Yes Don't Know
95% 50 71 2
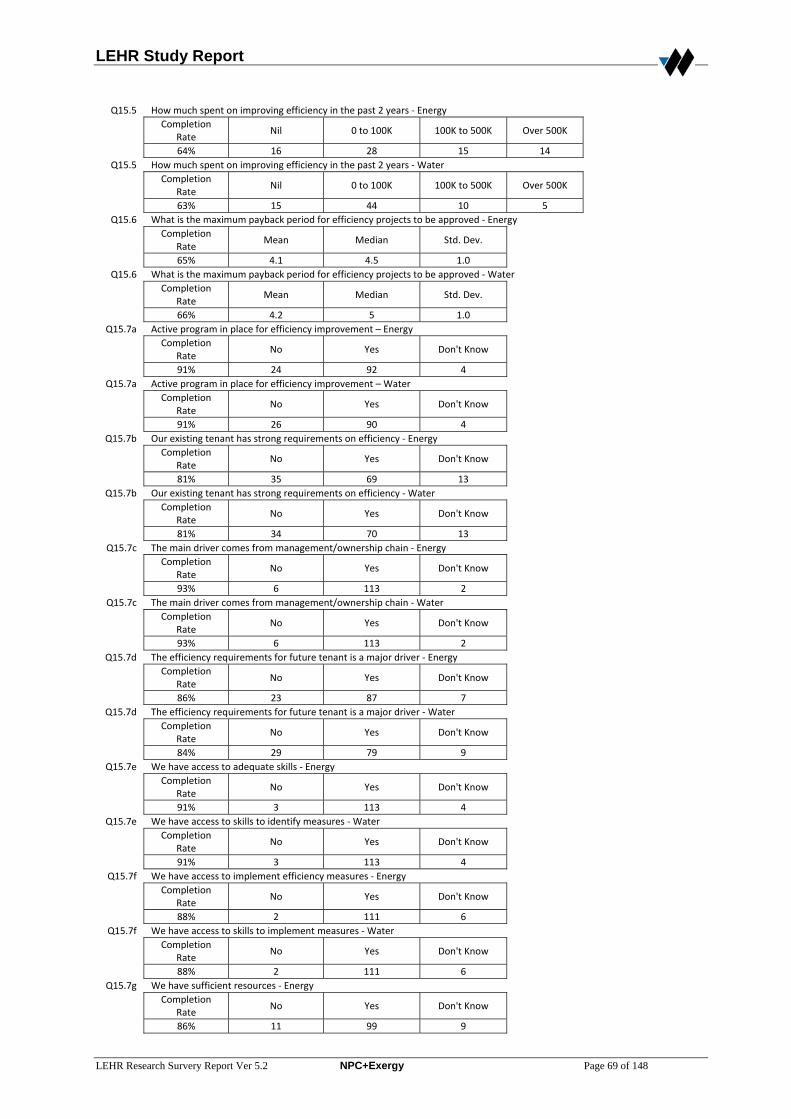
LEHR Study Report
LEHR Research Survery Report Ver 5.2 NPC+Exergy Page 69 of 148
Q15.5 How much spent on improving efficiency in the past 2 years ‐ Energy Completion
Rate Nil 0 to 100K 100K to 500K Over 500K
64% 16 28 15 14
Q15.5 How much spent on improving efficiency in the past 2 years ‐ Water Completion
Rate Nil 0 to 100K 100K to 500K Over 500K
63% 15 44 10 5
Q15.6 What is the maximum payback period for efficiency projects to be approved ‐ Energy Completion
Rate Mean Median Std. Dev.
65% 4.1 4.5 1.0
Q15.6 What is the maximum payback period for efficiency projects to be approved ‐ Water Completion
Rate Mean Median Std. Dev.
66% 4.2 5 1.0
Q15.7a Active program in place for efficiency improvement – Energy Completion
Rate No Yes Don't Know
91% 24 92 4
Q15.7a Active program in place for efficiency improvement – Water Completion
Rate No Yes Don't Know
91% 26 90 4
Q15.7b Our existing tenant has strong requirements on efficiency ‐ Energy Completion
Rate No Yes Don't Know
81% 35 69 13
Q15.7b Our existing tenant has strong requirements on efficiency ‐ Water Completion
Rate No Yes Don't Know
81% 34 70 13
Q15.7c The main driver comes from management/ownership chain ‐ Energy Completion
Rate No Yes Don't Know
93% 6 113 2
Q15.7c The main driver comes from management/ownership chain ‐ Water Completion
Rate No Yes Don't Know
93% 6 113 2
Q15.7d The efficiency requirements for future tenant is a major driver ‐ Energy Completion
Rate No Yes Don't Know
86% 23 87 7
Q15.7d The efficiency requirements for future tenant is a major driver ‐ Water Completion
Rate No Yes Don't Know
84% 29 79 9
Q15.7e We have access to adequate skills ‐ Energy Completion
Rate No Yes Don't Know
91% 3 113 4
Q15.7e We have access to skills to identify measures ‐ Water Completion
Rate No Yes Don't Know
91% 3 113 4
Q15.7f We have access to implement efficiency measures ‐ Energy Completion
Rate No Yes Don't Know
88% 2 111 6
Q15.7f We have access to skills to implement measures ‐ Water Completion
Rate No Yes Don't Know
88% 2 111 6
Q15.7g We have sufficient resources ‐ Energy Completion
Rate No Yes Don't Know
86% 11 99 9
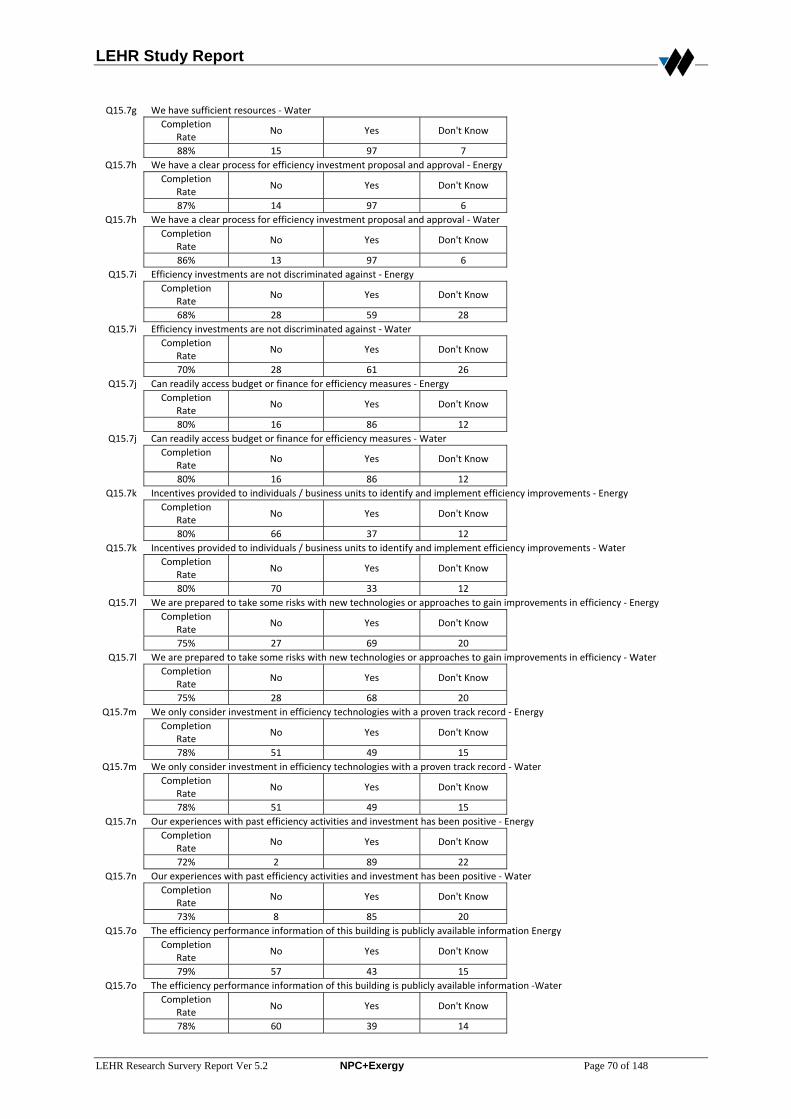
LEHR Study Report
LEHR Research Survery Report Ver 5.2 NPC+Exergy Page 70 of 148
Q15.7g We have sufficient resources ‐ Water Completion
Rate No Yes Don't Know
88% 15 97 7
Q15.7h We have a clear process for efficiency investment proposal and approval ‐ Energy Completion
Rate No Yes Don't Know
87% 14 97 6
Q15.7h We have a clear process for efficiency investment proposal and approval ‐ Water Completion
Rate No Yes Don't Know
86% 13 97 6
Q15.7i Efficiency investments are not discriminated against ‐ Energy Completion
Rate No Yes Don't Know
68% 28 59 28
Q15.7i Efficiency investments are not discriminated against ‐ Water Completion
Rate No Yes Don't Know
70% 28 61 26
Q15.7j Can readily access budget or finance for efficiency measures ‐ Energy Completion
Rate No Yes Don't Know
80% 16 86 12
Q15.7j Can readily access budget or finance for efficiency measures ‐ Water Completion
Rate No Yes Don't Know
80% 16 86 12
Q15.7k Incentives provided to individuals / business units to identify and implement efficiency improvements ‐ Energy Completion
Rate No Yes Don't Know
80% 66 37 12
Q15.7k Incentives provided to individuals / business units to identify and implement efficiency improvements ‐ Water Completion
Rate No Yes Don't Know
80% 70 33 12
Q15.7l We are prepared to take some risks with new technologies or approaches to gain improvements in efficiency ‐ Energy Completion
Rate No Yes Don't Know
75% 27 69 20
Q15.7l We are prepared to take some risks with new technologies or approaches to gain improvements in efficiency ‐ Water Completion
Rate No Yes Don't Know
75% 28 68 20
Q15.7m We only consider investment in efficiency technologies with a proven track record ‐ Energy Completion
Rate No Yes Don't Know
78% 51 49 15
Q15.7m We only consider investment in efficiency technologies with a proven track record ‐ Water Completion
Rate No Yes Don't Know
78% 51 49 15
Q15.7n Our experiences with past efficiency activities and investment has been positive ‐ Energy Completion
Rate No Yes Don't Know
72% 2 89 22
Q15.7n Our experiences with past efficiency activities and investment has been positive ‐ Water Completion
Rate No Yes Don't Know
73% 8 85 20
Q15.7o The efficiency performance information of this building is publicly available information Energy Completion
Rate No Yes Don't Know
79% 57 43 15
Q15.7o The efficiency performance information of this building is publicly available information ‐Water Completion
Rate No Yes Don't Know
78% 60 39 14

LEHR Study Report
LEHR Research Survery Report Ver 5.2 NPC+Exergy Page 71 of 148
Q15.7p We are required to report the efficiency performance of the base building to one or more tenants on a regular basis ‐Energy Completion
Rate No Yes Don't Know
88% 77 35 4
Q15.7p We are required to report the efficiency performance of the base building to one or more tenants on a regular basis ‐Water Completion
Rate No Yes Don't Know
88% 77 36 3
Q15.7q This building has a specific efficiency performance target that involves a penalty or incentive ‐ Energy Completion
Rate No Yes Don't Know
82% 85 20 12
Q15.7q This building has a specific efficiency performance target that involves a penalty or incentive ‐ Water Completion
Rate No Yes Don't Know
82% 82 23 12
Q15.7r One or more tenants' leases require efficiency performance target ‐ Energy Completion
Rate No Yes Don't Know
80% 83 20 13
Q15.7r One or more tenants' leases require efficiency performance target ‐ Water Completion
Rate No Yes Don't Know
80% 86 17 13
Q15.7s We monitor usage regularly and track to a target ‐ Energy Completion
Rate No Yes Don't Know
88% 43 69 4
Q15.7s We monitor usage regularly and track to a target ‐ Water Completion
Rate No Yes Don't Know
87% 48 63 5
Q15.7t We monitor usage regularly but no target ‐ Energy Completion
Rate No Yes Don't Know
88% 61 51 2
Q15.7t We monitor usage regularly but no target ‐ Water Completion
Rate No Yes Don't Know
88% 62 50 3
Q15.7u We have regular meetings with tenants ‐ Energy Completion
Rate No Yes Don't Know
89% 70 44 1
Q15.7u We have regular meetings with tenants ‐ Water Completion
Rate No Yes Don't Know
88% 72 41 1
16. Maintenance
Q16.1 Is part or all of the building maintain by staff ‐ Energy Completion
Rate No Yes
98% 57 68
Q16.1 Is part or all of the building maintain by staff ‐ Water Completion
Rate No Yes
98% 60 65
Q16.1a In‐house staff given positive incentives to improve efficiency ‐ Energy Completion
Rate No Yes Don't Know
67% 46 40 2
Q16.1a In‐house staff given positive incentives to improve efficiency ‐ Water Completion
Rate No Yes Don't Know
67% 47 39 1
Q16.1b In‐house staff penalised for failing to improve efficiency ‐ Energy
Completion No Yes Don't Know
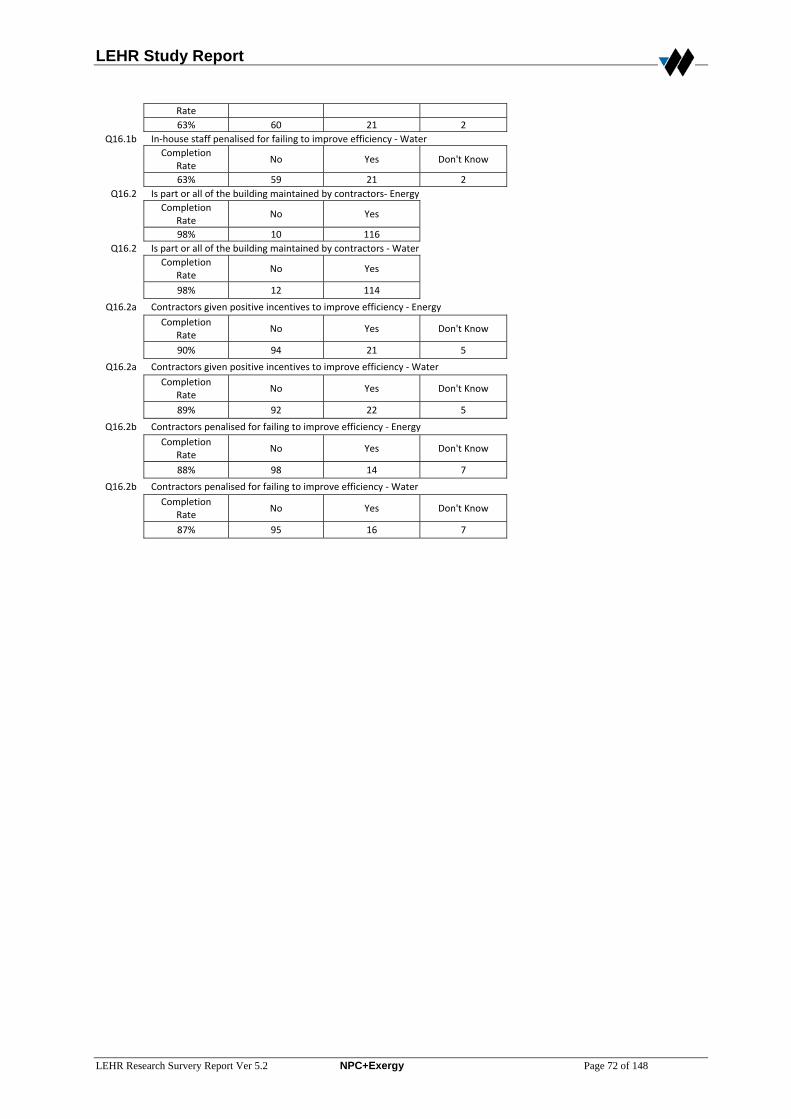
LEHR Study Report
LEHR Research Survery Report Ver 5.2 NPC+Exergy Page 72 of 148
Rate 63% 60 21 2
Q16.1b In‐house staff penalised for failing to improve efficiency ‐ Water Completion
Rate No Yes Don't Know
63% 59 21 2
Q16.2 Is part or all of the building maintained by contractors‐ Energy Completion
Rate No Yes
98% 10 116
Q16.2 Is part or all of the building maintained by contractors ‐ Water Completion
Rate No Yes
98% 12 114
Q16.2a Contractors given positive incentives to improve efficiency ‐ Energy Completion
Rate No Yes Don't Know
90% 94 21 5
Q16.2a Contractors given positive incentives to improve efficiency ‐ Water Completion
Rate No Yes Don't Know
89% 92 22 5
Q16.2b Contractors penalised for failing to improve efficiency ‐ Energy Completion
Rate No Yes Don't Know
88% 98 14 7
Q16.2b Contractors penalised for failing to improve efficiency ‐ Water Completion
Rate No Yes Don't Know
87% 95 16 7
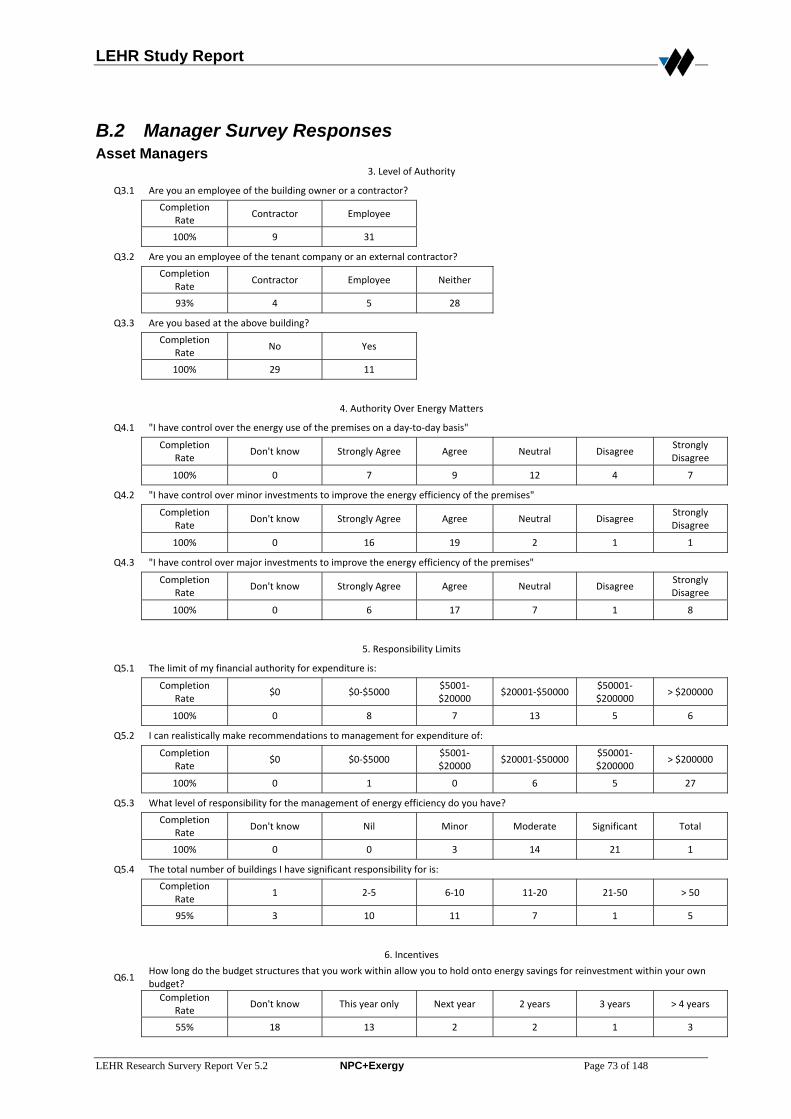
LEHR Study Report
LEHR Research Survery Report Ver 5.2 NPC+Exergy Page 73 of 148
B.2 Manager Survey Responses Asset Managers
3. Level of Authority
Q3.1 Are you an employee of the building owner or a contractor?
Completion
Rate Contractor Employee
100% 9 31
Q3.2 Are you an employee of the tenant company or an external contractor?
Completion
Rate Contractor Employee Neither
93% 4 5 28
Q3.3 Are you based at the above building?
Completion
Rate No Yes
100% 29 11
4. Authority Over Energy Matters
Q4.1 "I have control over the energy use of the premises on a day‐to‐day basis"
Completion
Rate Don't know Strongly Agree Agree Neutral Disagree
Strongly Disagree
100% 0 7 9 12 4 7
Q4.2 "I have control over minor investments to improve the energy efficiency of the premises"
Completion
Rate Don't know Strongly Agree Agree Neutral Disagree
Strongly Disagree
100% 0 16 19 2 1 1
Q4.3 "I have control over major investments to improve the energy efficiency of the premises"
Completion
Rate Don't know Strongly Agree Agree Neutral Disagree
Strongly Disagree
100% 0 6 17 7 1 8
5. Responsibility Limits
Q5.1 The limit of my financial authority for expenditure is:
Completion
Rate $0 $0‐$5000
$5001‐$20000
$20001‐$50000 $50001‐$200000
> $200000
100% 0 8 7 13 5 6
Q5.2 I can realistically make recommendations to management for expenditure of:
Completion
Rate $0 $0‐$5000
$5001‐$20000
$20001‐$50000 $50001‐$200000
> $200000
100% 0 1 0 6 5 27
Q5.3 What level of responsibility for the management of energy efficiency do you have?
Completion
Rate Don't know Nil Minor Moderate Significant Total
100% 0 0 3 14 21 1
Q5.4 The total number of buildings I have significant responsibility for is:
Completion
Rate 1 2‐5 6‐10 11‐20 21‐50 > 50
95% 3 10 11 7 1 5
6. Incentives
Q6.1 How long do the budget structures that you work within allow you to hold onto energy savings for reinvestment within your own budget?
Completion
Rate Don't know This year only Next year 2 years 3 years > 4 years
55% 18 13 2 2 1 3

LEHR Study Report
LEHR Research Survery Report Ver 5.2 NPC+Exergy Page 74 of 148
Q6.2 If you make an energy efficiency improvement, what impact will it have on your personal financial position (ie salary or bonus)?
Completion
Rate Don't know
Strong negative impact
Negative Impact
No change Positive Impact
Strong Positive Impact
95% 2 0 0 26 10 1
Q6.3 If you make an energy efficiency improvement, what impact will it have on your employer's financial position?
Completion
Rate Don't know
Strong negative impact
Negative Impact
No change Positive Impact
Strong Positive Impact
90% 4 0 1 13 11 10
Q6.4 If you make an energy efficiency improvement, what impact will it have on your standing with your employer?
Completion
Rate Don't know
Strong negative impact
Negative Impact
No change Positive Impact
Strong Positive Impact
100% 0 0 1 6 13 19
Q6.5 If you make an energy efficiency improvement, what impact will it have on your job as a whole?
Completion
Rate Don't know
Strong negative impact
Negative Impact
No change Positive Impact
Strong Positive Impact
100% 0 0 1 11 17 10
7. Attitude
Q7.1 ”Low energy use in operation is an important objective for existing buildings and refurbishments."
Completion
Rate Don't know Strongly Agree Agree Neutral Disagree
Strongly Disagree
100% 0 33 5 0 0 1
Q7.2 “Low energy cost is an important objective for existing buildings and refurbishments."
Completion
Rate Don't know Strongly Agree Agree Neutral Disagree
Strongly Disagree
100% 0 29 8 2 0 0
Q7.3 "Incorporating energy efficiency can represent good value for money"
Completion
Rate Don't know Strongly Agree Agree Neutral Disagree
Strongly Disagree
100% 0 31 7 1 0 0
Q7.4 "My response to statements similar to the three above but in relation to water efficiency would be the same or even more positive."
Completion
Rate Don't know Strongly Agree Agree Neutral Disagree
Strongly Disagree
100% 0 34 5 0 0 0
Q7.5 "The greenhouse effect is a major environmental problem"
Completion
Rate Don't know Strongly Agree Agree Neutral Disagree
Strongly Disagree
100% 0 32 4 2 1 0
Q7.6 "My industry has a responsibility to reduce greenhouse gas emissions"
Completion
Rate Don't know Strongly Agree Agree Neutral Disagree
Strongly Disagree
100% 0 32 6 0 1 0
Q7.7 "My response to the above two statements in relation to the environment would be the same or even more positive for water efficiency."
Completion
Rate Don't know Strongly Agree Agree Neutral Disagree
Strongly Disagree
100% 0 34 3 2 0 0
8. Response Activities
Q8.1 What level operational changes have you made in the past year to maintain or improve energy efficiency in relation to the building(s) you are involved with?
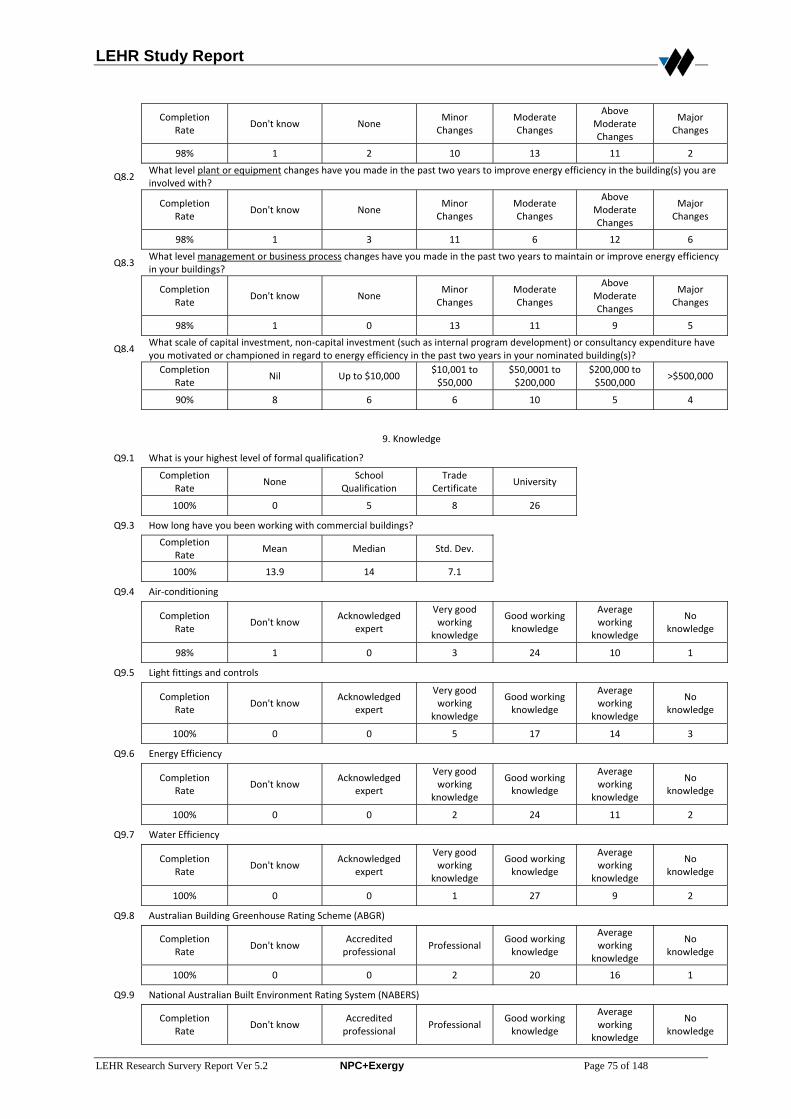
LEHR Study Report
LEHR Research Survery Report Ver 5.2 NPC+Exergy Page 75 of 148
Completion
Rate Don't know None
Minor Changes
Moderate Changes
Above Moderate Changes
Major Changes
98% 1 2 10 13 11 2
Q8.2 What level plant or equipment changes have you made in the past two years to improve energy efficiency in the building(s) you are involved with?
Completion
Rate Don't know None
Minor Changes
Moderate Changes
Above Moderate Changes
Major Changes
98% 1 3 11 6 12 6
Q8.3 What level management or business process changes have you made in the past two years to maintain or improve energy efficiency in your buildings?
Completion
Rate Don't know None
Minor Changes
Moderate Changes
Above Moderate Changes
Major Changes
98% 1 0 13 11 9 5
Q8.4 What scale of capital investment, non‐capital investment (such as internal program development) or consultancy expenditure have you motivated or championed in regard to energy efficiency in the past two years in your nominated building(s)?
Completion
Rate Nil Up to $10,000
$10,001 to $50,000
$50,0001 to $200,000
$200,000 to $500,000
>$500,000
90% 8 6 6 10 5 4
9. Knowledge
Q9.1 What is your highest level of formal qualification?
Completion
Rate None
School Qualification
Trade Certificate
University
100% 0 5 8 26
Q9.3 How long have you been working with commercial buildings?
Completion
Rate Mean Median Std. Dev.
100% 13.9 14 7.1
Q9.4 Air‐conditioning
Completion
Rate Don't know
Acknowledged expert
Very good working
knowledge
Good working knowledge
Average working
knowledge
No knowledge
98% 1 0 3 24 10 1
Q9.5 Light fittings and controls
Completion
Rate Don't know
Acknowledged expert
Very good working
knowledge
Good working knowledge
Average working
knowledge
No knowledge
100% 0 0 5 17 14 3
Q9.6 Energy Efficiency
Completion
Rate Don't know
Acknowledged expert
Very good working
knowledge
Good working knowledge
Average working
knowledge
No knowledge
100% 0 0 2 24 11 2
Q9.7 Water Efficiency
Completion
Rate Don't know
Acknowledged expert
Very good working
knowledge
Good working knowledge
Average working
knowledge
No knowledge
100% 0 0 1 27 9 2
Q9.8 Australian Building Greenhouse Rating Scheme (ABGR)
Completion
Rate Don't know
Accredited professional
Professional Good working knowledge
Average working
knowledge
No knowledge
100% 0 0 2 20 16 1
Q9.9 National Australian Built Environment Rating System (NABERS)
Completion
Rate Don't know
Accredited professional
Professional Good working knowledge
Average working
knowledge
No knowledge
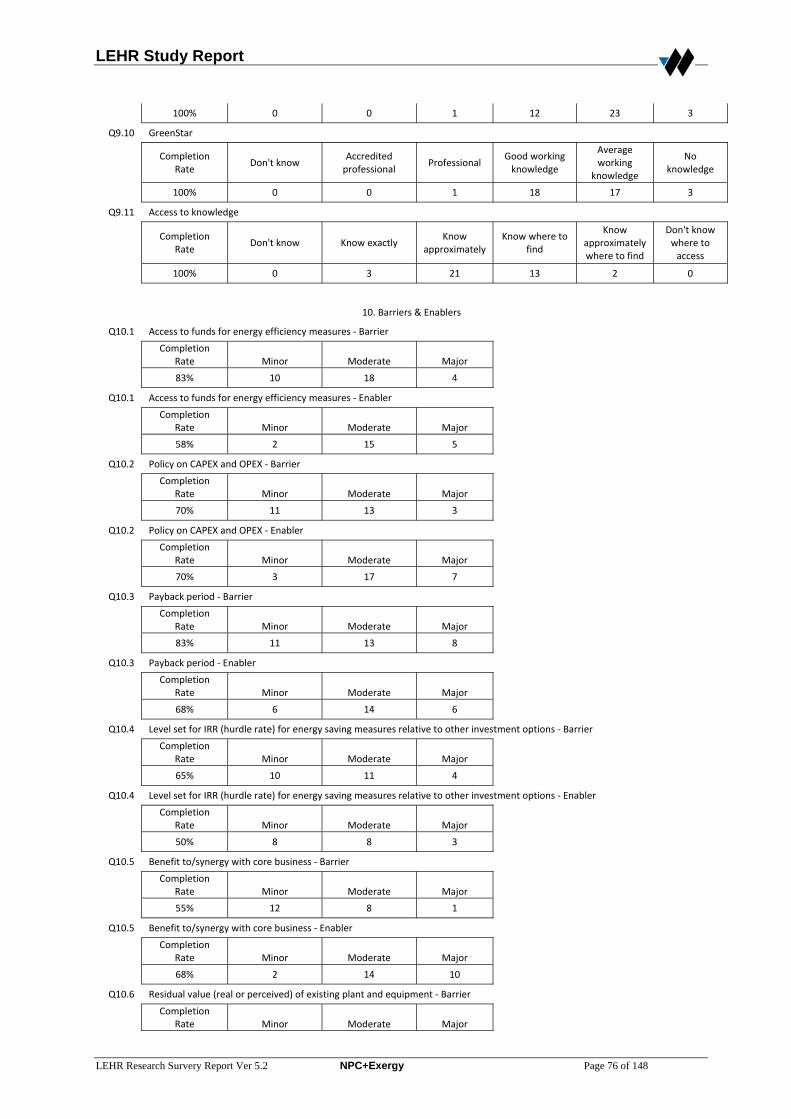
LEHR Study Report
LEHR Research Survery Report Ver 5.2 NPC+Exergy Page 76 of 148
100% 0 0 1 12 23 3
Q9.10 GreenStar
Completion
Rate Don't know
Accredited professional
Professional Good working knowledge
Average working
knowledge
No knowledge
100% 0 0 1 18 17 3
Q9.11 Access to knowledge
Completion
Rate Don't know Know exactly
Know approximately
Know where to find
Know approximately where to find
Don't know where to access
100% 0 3 21 13 2 0
10. Barriers & Enablers
Q10.1 Access to funds for energy efficiency measures ‐ Barrier
Completion
Rate Minor Moderate Major
83% 10 18 4
Q10.1 Access to funds for energy efficiency measures ‐ Enabler
Completion
Rate Minor Moderate Major
58% 2 15 5
Q10.2 Policy on CAPEX and OPEX ‐ Barrier
Completion
Rate Minor Moderate Major
70% 11 13 3
Q10.2 Policy on CAPEX and OPEX ‐ Enabler
Completion
Rate Minor Moderate Major
70% 3 17 7
Q10.3 Payback period ‐ Barrier
Completion
Rate Minor Moderate Major
83% 11 13 8
Q10.3 Payback period ‐ Enabler
Completion
Rate Minor Moderate Major
68% 6 14 6
Q10.4 Level set for IRR (hurdle rate) for energy saving measures relative to other investment options ‐ Barrier
Completion
Rate Minor Moderate Major
65% 10 11 4
Q10.4 Level set for IRR (hurdle rate) for energy saving measures relative to other investment options ‐ Enabler
Completion
Rate Minor Moderate Major
50% 8 8 3
Q10.5 Benefit to/synergy with core business ‐ Barrier
Completion
Rate Minor Moderate Major
55% 12 8 1
Q10.5 Benefit to/synergy with core business ‐ Enabler
Completion
Rate Minor Moderate Major
68% 2 14 10
Q10.6 Residual value (real or perceived) of existing plant and equipment ‐ Barrier
Completion
Rate Minor Moderate Major
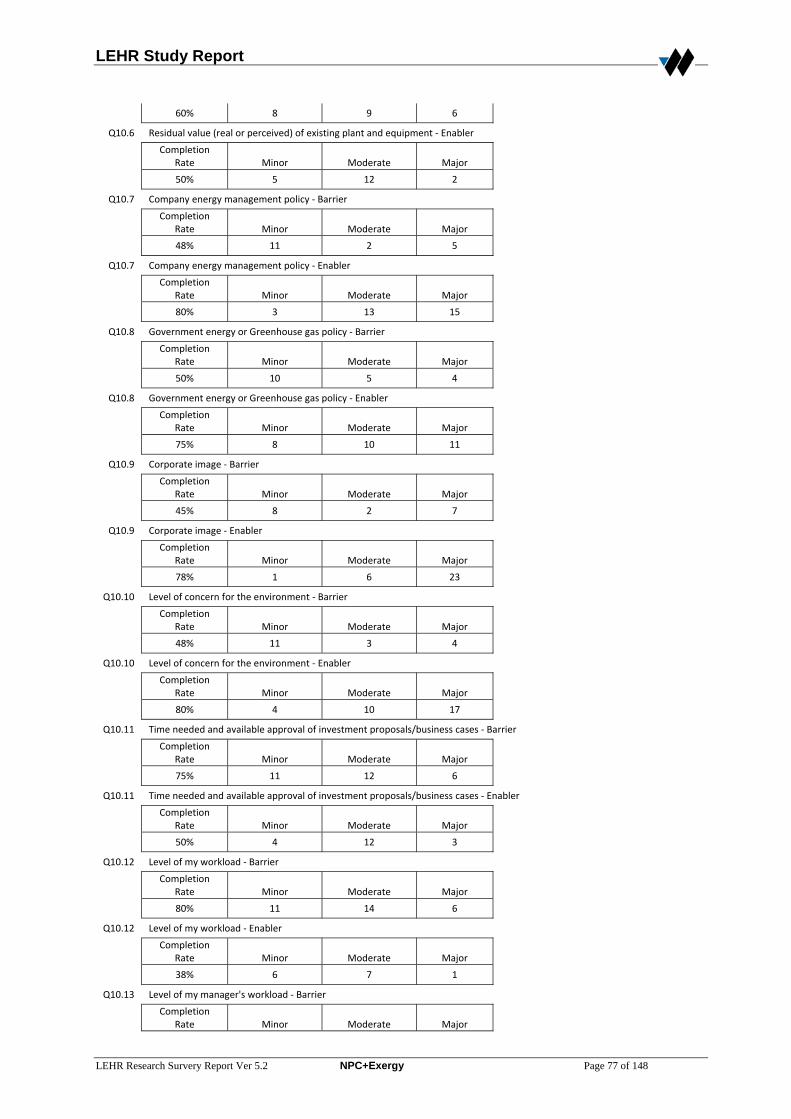
LEHR Study Report
LEHR Research Survery Report Ver 5.2 NPC+Exergy Page 77 of 148
60% 8 9 6
Q10.6 Residual value (real or perceived) of existing plant and equipment ‐ Enabler
Completion
Rate Minor Moderate Major
50% 5 12 2
Q10.7 Company energy management policy ‐ Barrier
Completion
Rate Minor Moderate Major
48% 11 2 5
Q10.7 Company energy management policy ‐ Enabler
Completion
Rate Minor Moderate Major
80% 3 13 15
Q10.8 Government energy or Greenhouse gas policy ‐ Barrier
Completion
Rate Minor Moderate Major
50% 10 5 4
Q10.8 Government energy or Greenhouse gas policy ‐ Enabler
Completion
Rate Minor Moderate Major
75% 8 10 11
Q10.9 Corporate image ‐ Barrier
Completion
Rate Minor Moderate Major
45% 8 2 7
Q10.9 Corporate image ‐ Enabler
Completion
Rate Minor Moderate Major
78% 1 6 23
Q10.10 Level of concern for the environment ‐ Barrier
Completion
Rate Minor Moderate Major
48% 11 3 4
Q10.10 Level of concern for the environment ‐ Enabler
Completion
Rate Minor Moderate Major
80% 4 10 17
Q10.11 Time needed and available approval of investment proposals/business cases ‐ Barrier
Completion
Rate Minor Moderate Major
75% 11 12 6
Q10.11 Time needed and available approval of investment proposals/business cases ‐ Enabler
Completion
Rate Minor Moderate Major
50% 4 12 3
Q10.12 Level of my workload ‐ Barrier
Completion
Rate Minor Moderate Major
80% 11 14 6
Q10.12 Level of my workload ‐ Enabler
Completion
Rate Minor Moderate Major
38% 6 7 1
Q10.13 Level of my manager's workload ‐ Barrier
Completion
Rate Minor Moderate Major
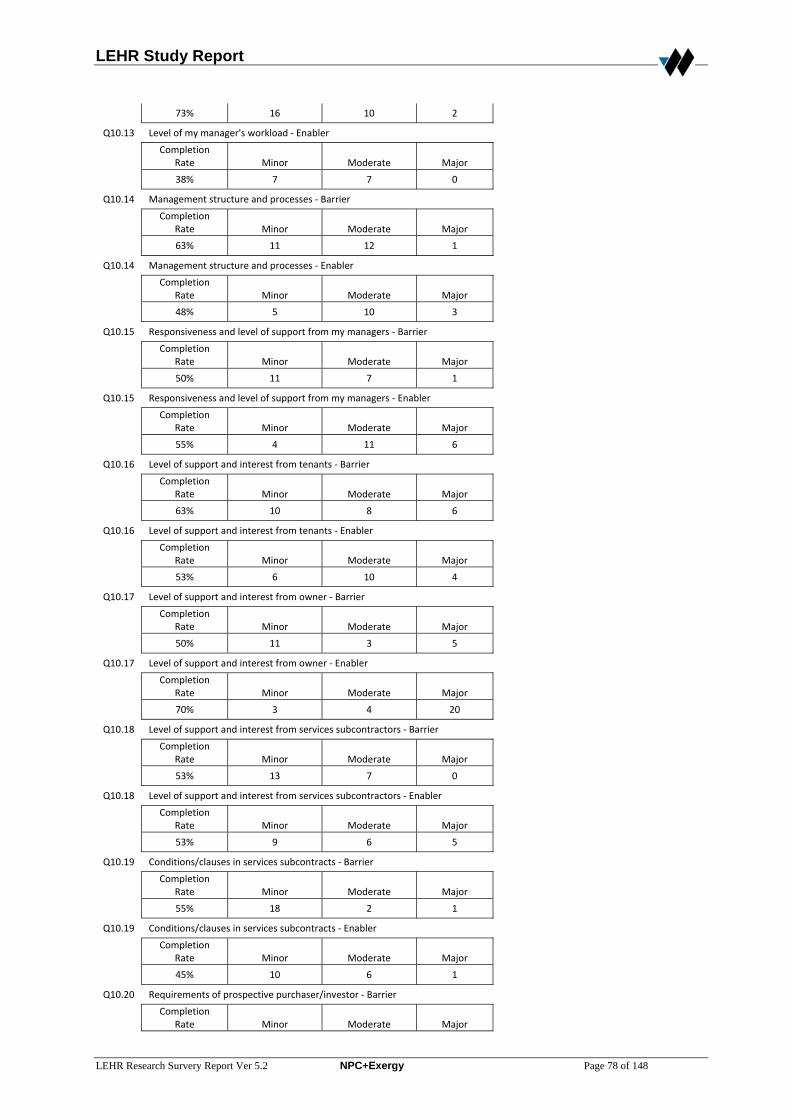
LEHR Study Report
LEHR Research Survery Report Ver 5.2 NPC+Exergy Page 78 of 148
73% 16 10 2
Q10.13 Level of my manager's workload ‐ Enabler
Completion
Rate Minor Moderate Major
38% 7 7 0
Q10.14 Management structure and processes ‐ Barrier
Completion
Rate Minor Moderate Major
63% 11 12 1
Q10.14 Management structure and processes ‐ Enabler
Completion
Rate Minor Moderate Major
48% 5 10 3
Q10.15 Responsiveness and level of support from my managers ‐ Barrier
Completion
Rate Minor Moderate Major
50% 11 7 1
Q10.15 Responsiveness and level of support from my managers ‐ Enabler
Completion
Rate Minor Moderate Major
55% 4 11 6
Q10.16 Level of support and interest from tenants ‐ Barrier
Completion
Rate Minor Moderate Major
63% 10 8 6
Q10.16 Level of support and interest from tenants ‐ Enabler
Completion
Rate Minor Moderate Major
53% 6 10 4
Q10.17 Level of support and interest from owner ‐ Barrier
Completion
Rate Minor Moderate Major
50% 11 3 5
Q10.17 Level of support and interest from owner ‐ Enabler
Completion
Rate Minor Moderate Major
70% 3 4 20
Q10.18 Level of support and interest from services subcontractors ‐ Barrier
Completion
Rate Minor Moderate Major
53% 13 7 0
Q10.18 Level of support and interest from services subcontractors ‐ Enabler
Completion
Rate Minor Moderate Major
53% 9 6 5
Q10.19 Conditions/clauses in services subcontracts ‐ Barrier
Completion
Rate Minor Moderate Major
55% 18 2 1
Q10.19 Conditions/clauses in services subcontracts ‐ Enabler
Completion
Rate Minor Moderate Major
45% 10 6 1
Q10.20 Requirements of prospective purchaser/investor ‐ Barrier
Completion
Rate Minor Moderate Major

LEHR Study Report
LEHR Research Survery Report Ver 5.2 NPC+Exergy Page 79 of 148
35% 9 4 0
Q10.20 Requirements of prospective purchaser/investor ‐ Enabler
Completion
Rate Minor Moderate Major
55% 6 14 1
Q10.21 Cooperation and coordination of the design team ‐ Barrier
Completion
Rate Minor Moderate Major
45% 9 7 1
Q10.21 Cooperation and coordination of the design team ‐ Enabler
Completion
Rate Minor Moderate Major
53% 7 6 7
Q10.22 Time available for design team to consider options ‐ Barrier
Completion
Rate Minor Moderate Major
65% 12 13 0
Q10.22 Time available for design team to consider options ‐ Enabler
Completion
Rate Minor Moderate Major
30% 5 6 0
Q10.23 Level of specialist knowledge of the design team ‐ Barrier
Completion
Rate Minor Moderate Major
53% 12 6 2
Q10.23 Level of specialist knowledge of the design team ‐ Enabler
Completion
Rate Minor Moderate Major
43% 4 4 8
Q10.24 Confidence level in technology to deliver claimed saving ‐ Barrier
Completion
Rate Minor Moderate Major
65% 13 9 3
Q10.24 Confidence level in technology to deliver claimed saving ‐ Enabler
Completion
Rate Minor Moderate Major
43% 5 10 1
Q10.25 Access to necessary expertise to evaluate or operate the technology ‐ Barrier
Completion
Rate Minor Moderate Major
60% 15 6 2
Q10.25 Access to necessary expertise to evaluate or operate the technology ‐ Enabler
Completion
Rate Minor Moderate Major
53% 8 7 5
Q10.26 Access to resources needed for implementation of projects ‐ Barrier
Completion
Rate Minor Moderate Major
68% 10 15 1
Q10.26 Access to resources needed for implementation of projects ‐ Enabler
Completion
Rate Minor Moderate Major
40% 4 9 2
Q10.27 Access to resources needed to operate and maintain new technology ‐ Barrier
Completion
Rate Minor Moderate Major

LEHR Study Report
LEHR Research Survery Report Ver 5.2 NPC+Exergy Page 80 of 148
70% 19 7 1
Q10.27 Access to resources needed to operate and maintain new technology ‐ Enabler
Completion
Rate Minor Moderate Major
38% 4 9 1
Q10.28 Quality of supplier information, data and technical support ‐ Barrier
Completion
Rate Minor Moderate Major
63% 15 8 1
Q10.28 Quality of supplier information, data and technical support ‐ Enabler
Completion
Rate Minor Moderate Major
45% 9 8 0
Q10.29 Availability of equipment or technology in the market ‐ Barrier
Completion
Rate Minor Moderate Major
58% 11 10 1
Q10.29 Availability of equipment or technology in the market ‐ Enabler
Completion
Rate Minor Moderate Major
50% 4 13 2
Q10.30 Lease terms and conditions especially split incentives under net leases ‐ Barrier
Completion
Rate Minor Moderate Major
58% 11 7 4
Q10.30 Lease terms and conditions especially split incentives under net leases ‐ Enabler
Completion
Rate Minor Moderate Major
30% 4 6 1
Q10.31 Lease duration or remaining term ‐ Barrier
Completion
Rate Minor Moderate Major
55% 8 9 4
Q10.31 Lease duration or remaining term ‐ Enabler
Completion
Rate Minor Moderate Major
33% 2 9 1
Q10.32 Current cost of energy ‐ Barrier
Completion
Rate Minor Moderate Major
58% 11 9 2
Q10.32 Current cost of energy ‐ Enabler
Completion
Rate Minor Moderate Major
55% 6 10 5
Q10.33 Future cost of energy ‐ Barrier
Completion
Rate Minor Moderate Major
43% 6 6 4
Q10.33 Future cost of energy ‐ Enabler
Completion
Rate Minor Moderate Major
70% 3 12 12
Q10.34 Building Grade (Property Council of Australia) ‐ Barrier
Completion
Rate Minor Moderate Major
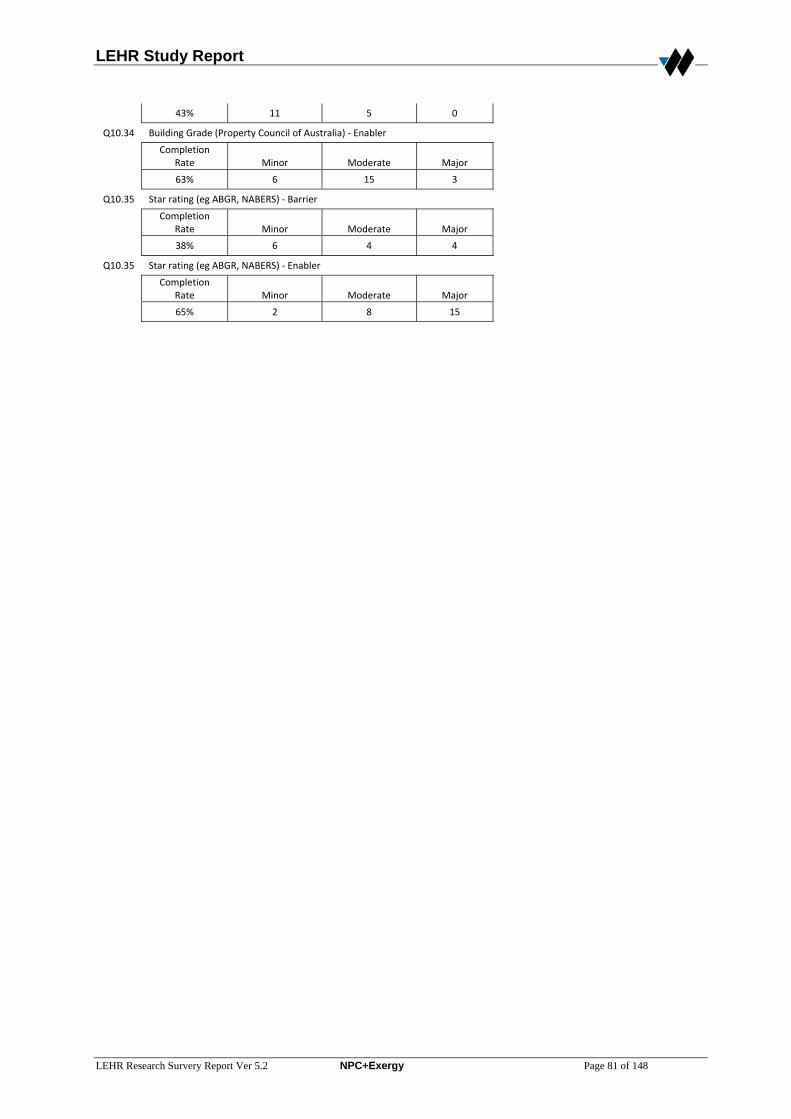
LEHR Study Report
LEHR Research Survery Report Ver 5.2 NPC+Exergy Page 81 of 148
43% 11 5 0
Q10.34 Building Grade (Property Council of Australia) ‐ Enabler
Completion
Rate Minor Moderate Major
63% 6 15 3
Q10.35 Star rating (eg ABGR, NABERS) ‐ Barrier
Completion
Rate Minor Moderate Major
38% 6 4 4
Q10.35 Star rating (eg ABGR, NABERS) ‐ Enabler
Completion
Rate Minor Moderate Major
65% 2 8 15

LEHR Study Report
LEHR Research Survery Report Ver 5.2 NPC+Exergy Page 82 of 148
Building Managers 3. Level of Authority
Q3.1 Are you an employee of the building owner or a contractor?
Completion
Rate Contractor Employee
100% 40 24
Q3.2 Are you an employee of the tenant company or an external contractor?
Completion
Rate Contractor Employee Neither
98% 26 3 34
Q3.3 Are you based at the above building?
Completion
Rate No Yes
100% 37 27
4. Authority Over Energy Matters
Q4.1 "I have control over the energy use of the premises on a day‐to‐day basis"
Completion
Rate Don't know Strongly Agree Agree Neutral Disagree
Strongly Disagree
100% 0 15 22 12 10 4
Q4.2 "I have control over minor investments to improve the energy efficiency of the premises"
Completion
Rate Don't know Strongly Agree Agree Neutral Disagree
Strongly Disagree
100% 0 15 29 16 3 0
Q4.3 "I have control over major investments to improve the energy efficiency of the premises"
Completion
Rate Don't know Strongly Agree Agree Neutral Disagree
Strongly Disagree
100% 0 3 21 18 9 12
5. Responsibility Limits
Q5.1 The limit of my financial authority for expenditure is:
Completion
Rate $0 $0‐$5000
$5001‐$20000
$20001‐$50000 $50001‐$200000
> $200000
100% 3 30 18 10 0 2
Q5.2 I can realistically make recommendations to management for expenditure of:
Completion
Rate $0 $0‐$5000
$5001‐$20000
$20001‐$50000 $50001‐$200000
> $200000
100% 0 2 5 6 6 44
Q5.3 What level of responsibility for the management of energy efficiency do you have?
Completion
Rate Don't know Nil Minor Moderate Significant Total
100% 0 0 9 11 38 5
Q5.4 The total number of buildings I have significant responsibility for is:
Completion
Rate 1 2‐5 6‐10 11‐20 21‐50 > 50
100% 13 32 13 5 0 0
6. Incentives
Q6.1 How long do the budget structures that you work within allow you to hold onto energy savings for reinvestment within your own budget?
Completion
Rate Don't know This year only Next year 2 years 3 years > 4 years
67% 20 25 10 1 1 5
Q6.2 If you make an energy efficiency improvement, what impact will it have on your personal financial position (ie salary or bonus)?

LEHR Study Report
LEHR Research Survery Report Ver 5.2 NPC+Exergy Page 83 of 148
Completion
Rate Don't know
Strong negative impact
Negative Impact
No change Positive Impact
Strong Positive Impact
98% 1 1 1 40 13 7
Q6.3 If you make an energy efficiency improvement, what impact will it have on your employer's financial position?
Completion
Rate Don't know
Strong negative impact
Negative Impact
No change Positive Impact
Strong Positive Impact
80% 13 2 0 23 11 14
Q6.4 If you make an energy efficiency improvement, what impact will it have on your standing with your employer?
Completion
Rate Don't know
Strong negative impact
Negative Impact
No change Positive Impact
Strong Positive Impact
89% 7 2 1 8 20 25
Q6.5 If you make an energy efficiency improvement, what impact will it have on your job as a whole?
Completion
Rate Don't know
Strong negative impact
Negative Impact
No change Positive Impact
Strong Positive Impact
94% 4 2 1 15 28 13
7. Attitude
Q7.1 ”Low energy use in operation is an important objective for existing buildings and refurbishments."
Completion
Rate Don't know Strongly Agree Agree Neutral Disagree
Strongly Disagree
100% 0 54 7 1 0 1
Q7.2 ”Low energy cost is an important objective for existing buildings and refurbishments."
Completion
Rate Don't know Strongly Agree Agree Neutral Disagree
Strongly Disagree
100% 0 45 14 3 0 1
Q7.3 "Incorporating energy efficiency can represent good value for money"
Completion
Rate Don't know Strongly Agree Agree Neutral Disagree
Strongly Disagree
100% 0 36 24 1 2 0
Q7.4 "My response to statements similar to the three above but in relation to water efficiency would be the same or even more positive."
Completion
Rate Don't know Strongly Agree Agree Neutral Disagree
Strongly Disagree
98% 0 46 14 0 1 1
Q7.5 "The greenhouse effect is a major environmental problem"
Completion
Rate Don't know Strongly Agree Agree Neutral Disagree
Strongly Disagree
95% 3 40 16 2 1 1
Q7.6 "My industry has a responsibility to reduce greenhouse gas emissions"
Completion
Rate Don't know Strongly Agree Agree Neutral Disagree
Strongly Disagree
100% 0 48 10 3 1 1
Q7.7 "My response to the above two statements in relation to the environment would be the same or even more positive for water efficiency."
Completion
Rate Don't know Strongly Agree Agree Neutral Disagree
Strongly Disagree
100% 0 42 12 2 3 4
8. Response Activities
Q8.1 What level operational changes have you made in the past year to maintain or improve energy efficiency in relation to the building(s) you are involved with?
Completion
Rate Don't know None
Minor Changes
Moderate Changes
Above Moderate Changes
Major Changes
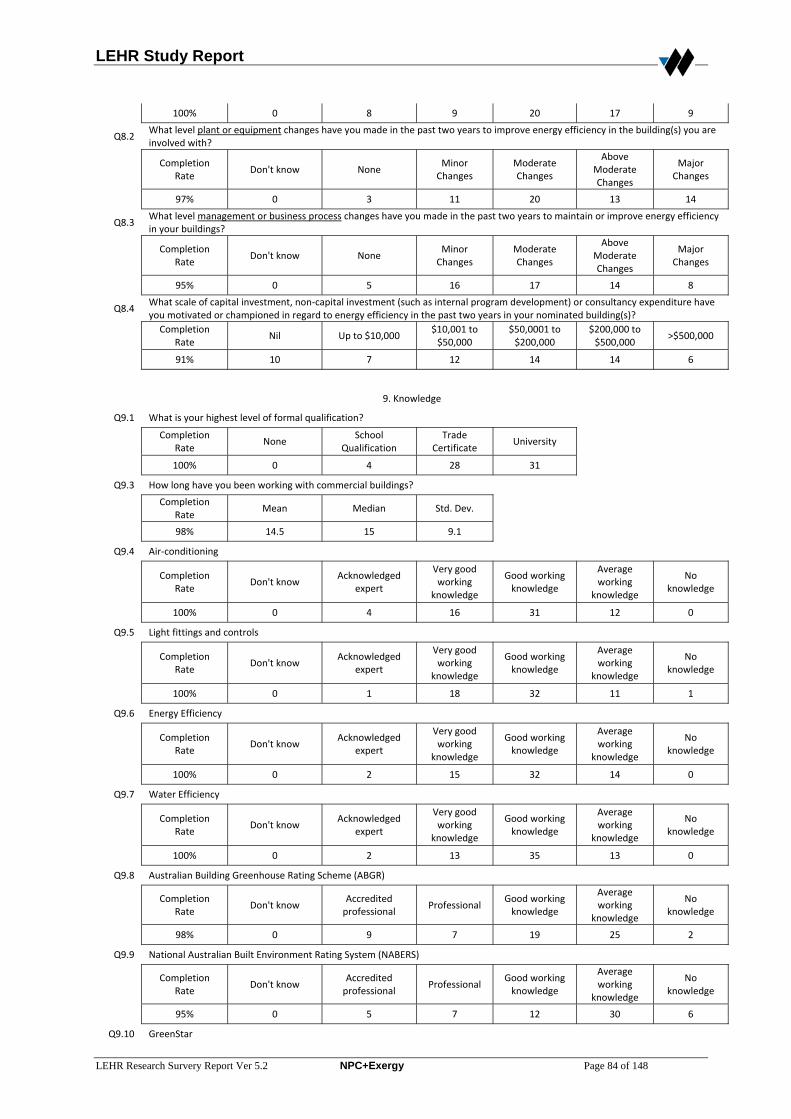
LEHR Study Report
LEHR Research Survery Report Ver 5.2 NPC+Exergy Page 84 of 148
100% 0 8 9 20 17 9
Q8.2 What level plant or equipment changes have you made in the past two years to improve energy efficiency in the building(s) you are involved with?
Completion
Rate Don't know None
Minor Changes
Moderate Changes
Above Moderate Changes
Major Changes
97% 0 3 11 20 13 14
Q8.3 What level management or business process changes have you made in the past two years to maintain or improve energy efficiency in your buildings?
Completion
Rate Don't know None
Minor Changes
Moderate Changes
Above Moderate Changes
Major Changes
95% 0 5 16 17 14 8
Q8.4 What scale of capital investment, non‐capital investment (such as internal program development) or consultancy expenditure have you motivated or championed in regard to energy efficiency in the past two years in your nominated building(s)?
Completion
Rate Nil Up to $10,000
$10,001 to $50,000
$50,0001 to $200,000
$200,000 to $500,000
>$500,000
91% 10 7 12 14 14 6
9. Knowledge
Q9.1 What is your highest level of formal qualification?
Completion
Rate None
School Qualification
Trade Certificate
University
100% 0 4 28 31
Q9.3 How long have you been working with commercial buildings?
Completion
Rate Mean Median Std. Dev.
98% 14.5 15 9.1
Q9.4 Air‐conditioning
Completion
Rate Don't know
Acknowledged expert
Very good working
knowledge
Good working knowledge
Average working
knowledge
No knowledge
100% 0 4 16 31 12 0
Q9.5 Light fittings and controls
Completion
Rate Don't know
Acknowledged expert
Very good working
knowledge
Good working knowledge
Average working
knowledge
No knowledge
100% 0 1 18 32 11 1
Q9.6 Energy Efficiency
Completion
Rate Don't know
Acknowledged expert
Very good working
knowledge
Good working knowledge
Average working
knowledge
No knowledge
100% 0 2 15 32 14 0
Q9.7 Water Efficiency
Completion
Rate Don't know
Acknowledged expert
Very good working
knowledge
Good working knowledge
Average working
knowledge
No knowledge
100% 0 2 13 35 13 0
Q9.8 Australian Building Greenhouse Rating Scheme (ABGR)
Completion
Rate Don't know
Accredited professional
Professional Good working knowledge
Average working
knowledge
No knowledge
98% 0 9 7 19 25 2
Q9.9 National Australian Built Environment Rating System (NABERS)
Completion
Rate Don't know
Accredited professional
Professional Good working knowledge
Average working
knowledge
No knowledge
95% 0 5 7 12 30 6
Q9.10 GreenStar
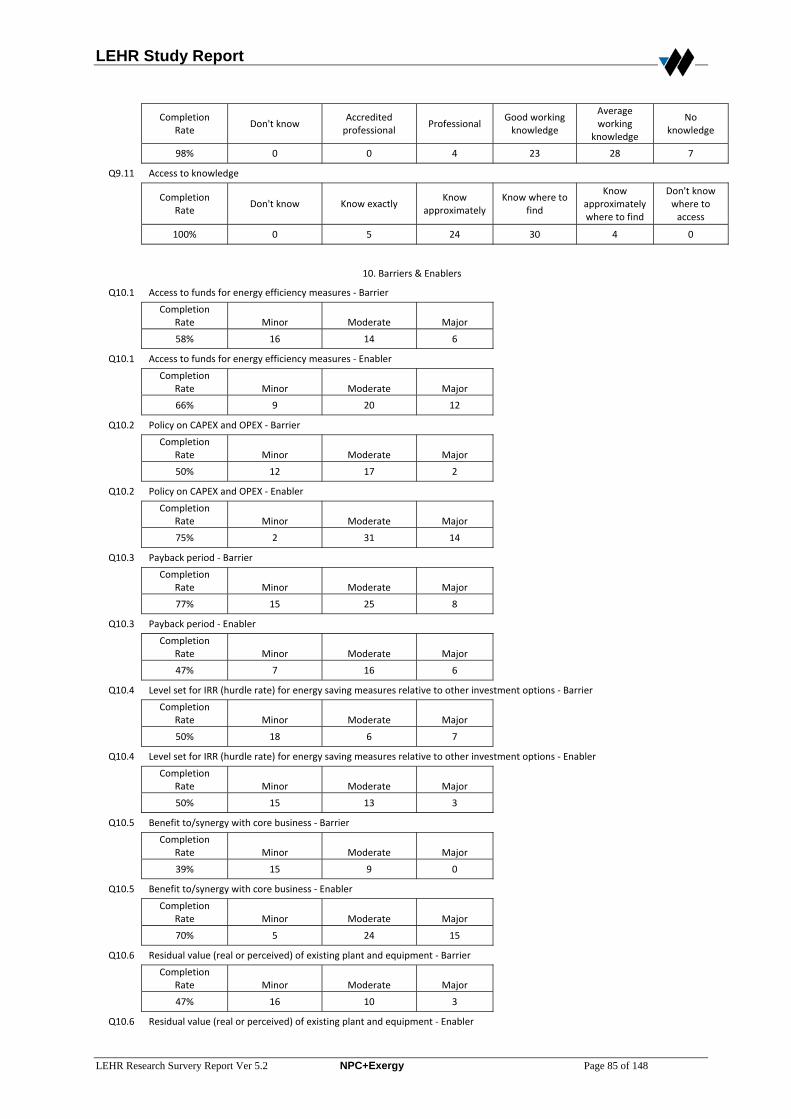
LEHR Study Report
LEHR Research Survery Report Ver 5.2 NPC+Exergy Page 85 of 148
Completion
Rate Don't know
Accredited professional
Professional Good working knowledge
Average working
knowledge
No knowledge
98% 0 0 4 23 28 7
Q9.11 Access to knowledge
Completion
Rate Don't know Know exactly
Know approximately
Know where to find
Know approximately where to find
Don't know where to access
100% 0 5 24 30 4 0
10. Barriers & Enablers
Q10.1 Access to funds for energy efficiency measures ‐ Barrier
Completion
Rate Minor Moderate Major
58% 16 14 6
Q10.1 Access to funds for energy efficiency measures ‐ Enabler
Completion
Rate Minor Moderate Major
66% 9 20 12
Q10.2 Policy on CAPEX and OPEX ‐ Barrier
Completion
Rate Minor Moderate Major
50% 12 17 2
Q10.2 Policy on CAPEX and OPEX ‐ Enabler
Completion
Rate Minor Moderate Major
75% 2 31 14
Q10.3 Payback period ‐ Barrier
Completion
Rate Minor Moderate Major
77% 15 25 8
Q10.3 Payback period ‐ Enabler
Completion
Rate Minor Moderate Major
47% 7 16 6
Q10.4 Level set for IRR (hurdle rate) for energy saving measures relative to other investment options ‐ Barrier
Completion
Rate Minor Moderate Major
50% 18 6 7
Q10.4 Level set for IRR (hurdle rate) for energy saving measures relative to other investment options ‐ Enabler
Completion
Rate Minor Moderate Major
50% 15 13 3
Q10.5 Benefit to/synergy with core business ‐ Barrier
Completion
Rate Minor Moderate Major
39% 15 9 0
Q10.5 Benefit to/synergy with core business ‐ Enabler
Completion
Rate Minor Moderate Major
70% 5 24 15
Q10.6 Residual value (real or perceived) of existing plant and equipment ‐ Barrier
Completion
Rate Minor Moderate Major
47% 16 10 3
Q10.6 Residual value (real or perceived) of existing plant and equipment ‐ Enabler
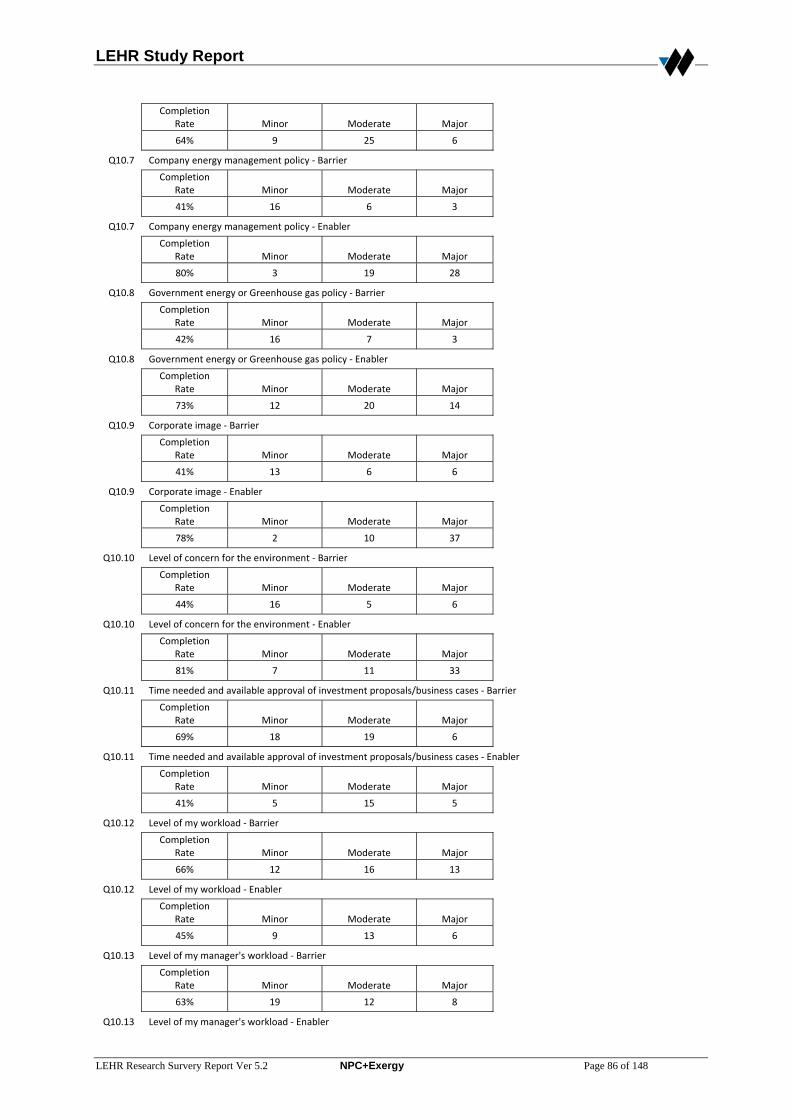
LEHR Study Report
LEHR Research Survery Report Ver 5.2 NPC+Exergy Page 86 of 148
Completion
Rate Minor Moderate Major
64% 9 25 6
Q10.7 Company energy management policy ‐ Barrier
Completion
Rate Minor Moderate Major
41% 16 6 3
Q10.7 Company energy management policy ‐ Enabler
Completion
Rate Minor Moderate Major
80% 3 19 28
Q10.8 Government energy or Greenhouse gas policy ‐ Barrier
Completion
Rate Minor Moderate Major
42% 16 7 3
Q10.8 Government energy or Greenhouse gas policy ‐ Enabler
Completion
Rate Minor Moderate Major
73% 12 20 14
Q10.9 Corporate image ‐ Barrier
Completion
Rate Minor Moderate Major
41% 13 6 6
Q10.9 Corporate image ‐ Enabler
Completion
Rate Minor Moderate Major
78% 2 10 37
Q10.10 Level of concern for the environment ‐ Barrier
Completion
Rate Minor Moderate Major
44% 16 5 6
Q10.10 Level of concern for the environment ‐ Enabler
Completion
Rate Minor Moderate Major
81% 7 11 33
Q10.11 Time needed and available approval of investment proposals/business cases ‐ Barrier
Completion
Rate Minor Moderate Major
69% 18 19 6
Q10.11 Time needed and available approval of investment proposals/business cases ‐ Enabler
Completion
Rate Minor Moderate Major
41% 5 15 5
Q10.12 Level of my workload ‐ Barrier
Completion
Rate Minor Moderate Major
66% 12 16 13
Q10.12 Level of my workload ‐ Enabler
Completion
Rate Minor Moderate Major
45% 9 13 6
Q10.13 Level of my manager's workload ‐ Barrier
Completion
Rate Minor Moderate Major
63% 19 12 8
Q10.13 Level of my manager's workload ‐ Enabler
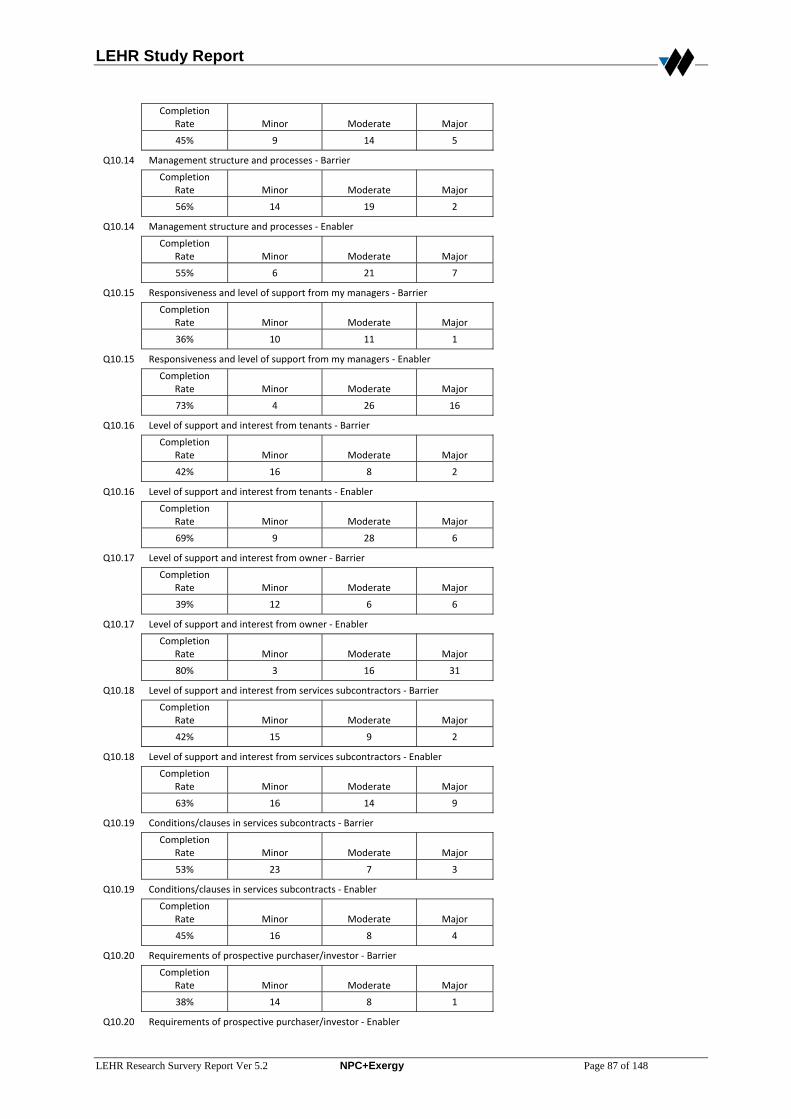
LEHR Study Report
LEHR Research Survery Report Ver 5.2 NPC+Exergy Page 87 of 148
Completion
Rate Minor Moderate Major
45% 9 14 5
Q10.14 Management structure and processes ‐ Barrier
Completion
Rate Minor Moderate Major
56% 14 19 2
Q10.14 Management structure and processes ‐ Enabler
Completion
Rate Minor Moderate Major
55% 6 21 7
Q10.15 Responsiveness and level of support from my managers ‐ Barrier
Completion
Rate Minor Moderate Major
36% 10 11 1
Q10.15 Responsiveness and level of support from my managers ‐ Enabler
Completion
Rate Minor Moderate Major
73% 4 26 16
Q10.16 Level of support and interest from tenants ‐ Barrier
Completion
Rate Minor Moderate Major
42% 16 8 2
Q10.16 Level of support and interest from tenants ‐ Enabler
Completion
Rate Minor Moderate Major
69% 9 28 6
Q10.17 Level of support and interest from owner ‐ Barrier
Completion
Rate Minor Moderate Major
39% 12 6 6
Q10.17 Level of support and interest from owner ‐ Enabler
Completion
Rate Minor Moderate Major
80% 3 16 31
Q10.18 Level of support and interest from services subcontractors ‐ Barrier
Completion
Rate Minor Moderate Major
42% 15 9 2
Q10.18 Level of support and interest from services subcontractors ‐ Enabler
Completion
Rate Minor Moderate Major
63% 16 14 9
Q10.19 Conditions/clauses in services subcontracts ‐ Barrier
Completion
Rate Minor Moderate Major
53% 23 7 3
Q10.19 Conditions/clauses in services subcontracts ‐ Enabler
Completion
Rate Minor Moderate Major
45% 16 8 4
Q10.20 Requirements of prospective purchaser/investor ‐ Barrier
Completion
Rate Minor Moderate Major
38% 14 8 1
Q10.20 Requirements of prospective purchaser/investor ‐ Enabler

LEHR Study Report
LEHR Research Survery Report Ver 5.2 NPC+Exergy Page 88 of 148
Completion
Rate Minor Moderate Major
48% 12 12 6
Q10.21 Cooperation and coordination of the design team ‐ Barrier
Completion
Rate Minor Moderate Major
38% 15 7 1
Q10.21 Cooperation and coordination of the design team ‐ Enabler
Completion
Rate Minor Moderate Major
47% 8 17 4
Q10.22 Time available for design team to consider options ‐ Barrier
Completion
Rate Minor Moderate Major
42% 10 10 6
Q10.22 Time available for design team to consider options ‐ Enabler
Completion
Rate Minor Moderate Major
41% 8 16 1
Q10.23 Level of specialist knowledge of the design team ‐ Barrier
Completion
Rate Minor Moderate Major
38% 10 11 2
Q10.23 Level of specialist knowledge of the design team ‐ Enabler
Completion
Rate Minor Moderate Major
45% 4 20 4
Q10.24 Confidence level in technology to deliver claimed saving ‐ Barrier
Completion
Rate Minor Moderate Major
53% 15 15 3
Q10.24 Confidence level in technology to deliver claimed saving ‐ Enabler
Completion
Rate Minor Moderate Major
50% 9 15 7
Q10.25 Access to necessary expertise to evaluate or operate the technology ‐ Barrier
Completion
Rate Minor Moderate Major
50% 23 4 4
Q10.25 Access to necessary expertise to evaluate or operate the technology ‐ Enabler
Completion
Rate Minor Moderate Major
56% 12 11 12
Q10.26 Access to resources needed for implementation of projects ‐ Barrier
Completion
Rate Minor Moderate Major
52% 20 6 6
Q10.26 Access to resources needed for implementation of projects ‐ Enabler
Completion
Rate Minor Moderate Major
58% 16 11 9
Q10.27 Access to resources needed to operate and maintain new technology ‐ Barrier
Completion
Rate Minor Moderate Major
53% 18 12 3
Q10.27 Access to resources needed to operate and maintain new technology ‐ Enabler
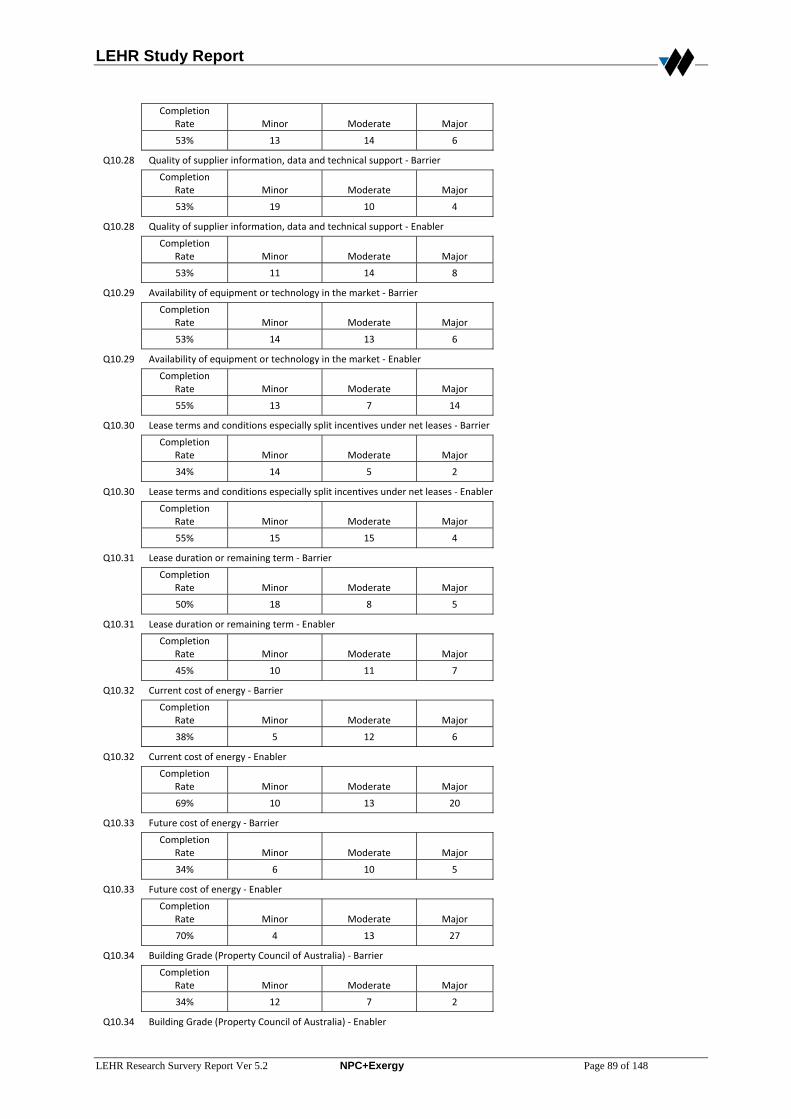
LEHR Study Report
LEHR Research Survery Report Ver 5.2 NPC+Exergy Page 89 of 148
Completion
Rate Minor Moderate Major
53% 13 14 6
Q10.28 Quality of supplier information, data and technical support ‐ Barrier
Completion
Rate Minor Moderate Major
53% 19 10 4
Q10.28 Quality of supplier information, data and technical support ‐ Enabler
Completion
Rate Minor Moderate Major
53% 11 14 8
Q10.29 Availability of equipment or technology in the market ‐ Barrier
Completion
Rate Minor Moderate Major
53% 14 13 6
Q10.29 Availability of equipment or technology in the market ‐ Enabler
Completion
Rate Minor Moderate Major
55% 13 7 14
Q10.30 Lease terms and conditions especially split incentives under net leases ‐ Barrier
Completion
Rate Minor Moderate Major
34% 14 5 2
Q10.30 Lease terms and conditions especially split incentives under net leases ‐ Enabler
Completion
Rate Minor Moderate Major
55% 15 15 4
Q10.31 Lease duration or remaining term ‐ Barrier
Completion
Rate Minor Moderate Major
50% 18 8 5
Q10.31 Lease duration or remaining term ‐ Enabler
Completion
Rate Minor Moderate Major
45% 10 11 7
Q10.32 Current cost of energy ‐ Barrier
Completion
Rate Minor Moderate Major
38% 5 12 6
Q10.32 Current cost of energy ‐ Enabler
Completion
Rate Minor Moderate Major
69% 10 13 20
Q10.33 Future cost of energy ‐ Barrier
Completion
Rate Minor Moderate Major
34% 6 10 5
Q10.33 Future cost of energy ‐ Enabler
Completion
Rate Minor Moderate Major
70% 4 13 27
Q10.34 Building Grade (Property Council of Australia) ‐ Barrier
Completion
Rate Minor Moderate Major
34% 12 7 2
Q10.34 Building Grade (Property Council of Australia) ‐ Enabler

LEHR Study Report
LEHR Research Survery Report Ver 5.2 NPC+Exergy Page 90 of 148
Completion
Rate Minor Moderate Major
69% 10 14 19
Q10.35 Star rating (eg ABGR, NABERS) ‐ Barrier
Completion
Rate Minor Moderate Major
33% 11 5 4
Q10.35 Star rating (eg ABGR, NABERS) ‐ Enabler
Completion
Rate Minor Moderate Major
72% 2 13 30
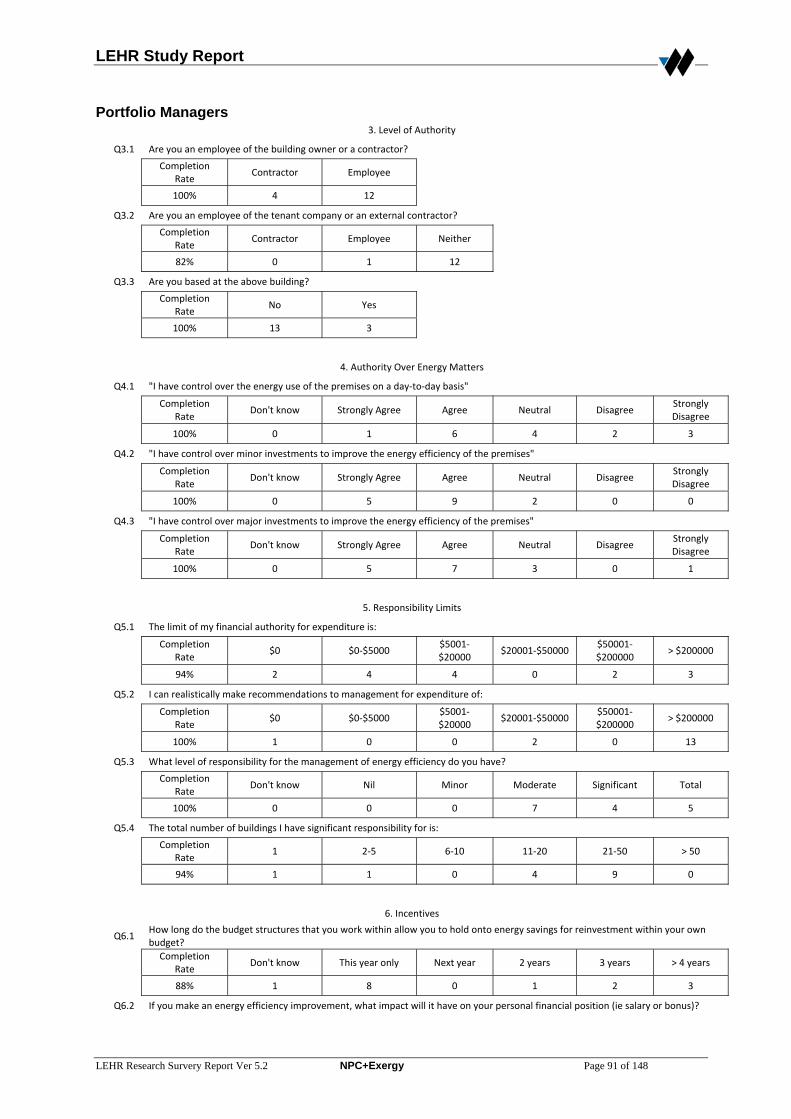
LEHR Study Report
LEHR Research Survery Report Ver 5.2 NPC+Exergy Page 91 of 148
Portfolio Managers 3. Level of Authority
Q3.1 Are you an employee of the building owner or a contractor?
Completion
Rate Contractor Employee
100% 4 12
Q3.2 Are you an employee of the tenant company or an external contractor?
Completion
Rate Contractor Employee Neither
82% 0 1 12
Q3.3 Are you based at the above building?
Completion
Rate No Yes
100% 13 3
4. Authority Over Energy Matters
Q4.1 "I have control over the energy use of the premises on a day‐to‐day basis"
Completion
Rate Don't know Strongly Agree Agree Neutral Disagree
Strongly Disagree
100% 0 1 6 4 2 3
Q4.2 "I have control over minor investments to improve the energy efficiency of the premises"
Completion
Rate Don't know Strongly Agree Agree Neutral Disagree
Strongly Disagree
100% 0 5 9 2 0 0
Q4.3 "I have control over major investments to improve the energy efficiency of the premises"
Completion
Rate Don't know Strongly Agree Agree Neutral Disagree
Strongly Disagree
100% 0 5 7 3 0 1
5. Responsibility Limits
Q5.1 The limit of my financial authority for expenditure is:
Completion
Rate $0 $0‐$5000
$5001‐$20000
$20001‐$50000 $50001‐$200000
> $200000
94% 2 4 4 0 2 3
Q5.2 I can realistically make recommendations to management for expenditure of:
Completion
Rate $0 $0‐$5000
$5001‐$20000
$20001‐$50000 $50001‐$200000
> $200000
100% 1 0 0 2 0 13
Q5.3 What level of responsibility for the management of energy efficiency do you have?
Completion
Rate Don't know Nil Minor Moderate Significant Total
100% 0 0 0 7 4 5
Q5.4 The total number of buildings I have significant responsibility for is:
Completion
Rate 1 2‐5 6‐10 11‐20 21‐50 > 50
94% 1 1 0 4 9 0
6. Incentives
Q6.1 How long do the budget structures that you work within allow you to hold onto energy savings for reinvestment within your own budget?
Completion
Rate Don't know This year only Next year 2 years 3 years > 4 years
88% 1 8 0 1 2 3
Q6.2 If you make an energy efficiency improvement, what impact will it have on your personal financial position (ie salary or bonus)?
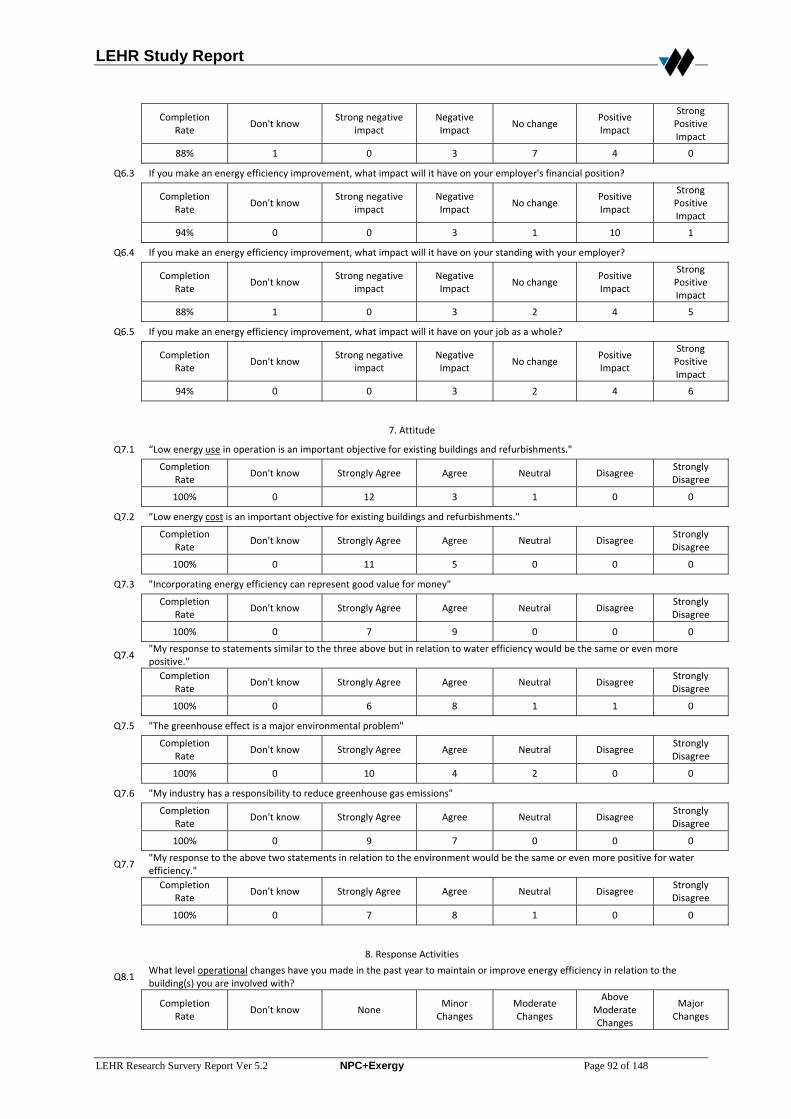
LEHR Study Report
LEHR Research Survery Report Ver 5.2 NPC+Exergy Page 92 of 148
Completion
Rate Don't know
Strong negative impact
Negative Impact
No change Positive Impact
Strong Positive Impact
88% 1 0 3 7 4 0
Q6.3 If you make an energy efficiency improvement, what impact will it have on your employer's financial position?
Completion
Rate Don't know
Strong negative impact
Negative Impact
No change Positive Impact
Strong Positive Impact
94% 0 0 3 1 10 1
Q6.4 If you make an energy efficiency improvement, what impact will it have on your standing with your employer?
Completion
Rate Don't know
Strong negative impact
Negative Impact
No change Positive Impact
Strong Positive Impact
88% 1 0 3 2 4 5
Q6.5 If you make an energy efficiency improvement, what impact will it have on your job as a whole?
Completion
Rate Don't know
Strong negative impact
Negative Impact
No change Positive Impact
Strong Positive Impact
94% 0 0 3 2 4 6
7. Attitude
Q7.1 “Low energy use in operation is an important objective for existing buildings and refurbishments."
Completion
Rate Don't know Strongly Agree Agree Neutral Disagree
Strongly Disagree
100% 0 12 3 1 0 0
Q7.2 ”Low energy cost is an important objective for existing buildings and refurbishments."
Completion
Rate Don't know Strongly Agree Agree Neutral Disagree
Strongly Disagree
100% 0 11 5 0 0 0
Q7.3 "Incorporating energy efficiency can represent good value for money"
Completion
Rate Don't know Strongly Agree Agree Neutral Disagree
Strongly Disagree
100% 0 7 9 0 0 0
Q7.4 "My response to statements similar to the three above but in relation to water efficiency would be the same or even more positive."
Completion
Rate Don't know Strongly Agree Agree Neutral Disagree
Strongly Disagree
100% 0 6 8 1 1 0
Q7.5 "The greenhouse effect is a major environmental problem"
Completion
Rate Don't know Strongly Agree Agree Neutral Disagree
Strongly Disagree
100% 0 10 4 2 0 0
Q7.6 "My industry has a responsibility to reduce greenhouse gas emissions"
Completion
Rate Don't know Strongly Agree Agree Neutral Disagree
Strongly Disagree
100% 0 9 7 0 0 0
Q7.7 "My response to the above two statements in relation to the environment would be the same or even more positive for water efficiency."
Completion
Rate Don't know Strongly Agree Agree Neutral Disagree
Strongly Disagree
100% 0 7 8 1 0 0
8. Response Activities
Q8.1 What level operational changes have you made in the past year to maintain or improve energy efficiency in relation to the building(s) you are involved with?
Completion
Rate Don't know None
Minor Changes
Moderate Changes
Above Moderate Changes
Major Changes

LEHR Study Report
LEHR Research Survery Report Ver 5.2 NPC+Exergy Page 93 of 148
100% 0 2 5 4 3 2
Q8.2 What level plant or equipment changes have you made in the past two years to improve energy efficiency in the building(s) you are involved with?
Completion
Rate Don't know None
Minor Changes
Moderate Changes
Above Moderate Changes
Major Changes
94% 1 3 3 5 4 0
Q8.3 What level management or business process changes have you made in the past two years to maintain or improve energy efficiency in your buildings?
Completion
Rate Don't know None
Minor Changes
Moderate Changes
Above Moderate Changes
Major Changes
100% 0 3 6 3 2 2
Q8.4 What scale of capital investment, non‐capital investment (such as internal program development) or consultancy expenditure have you motivated or championed in regard to energy efficiency in the past two years in your nominated building(s)?
Completion
Rate Nil Up to $10,000
$10,001 to $50,000
$50,0001 to $200,000
$200,000 to $500,000
>$500,000
65% 3 0 2 2 3 6
9. Knowledge
Q9.1 What is your highest level of formal qualification?
Completion
Rate None
School Qualification
Trade Certificate
University
100% 0 3 0 13
Q9.3 How long have you been working with commercial buildings?
Completion
Rate Mean Median Std. Dev.
100% 12.3 12 6.7
Q9.4 Air‐conditioning
Completion
Rate Don't know
Acknowledged expert
Very good working
knowledge
Good working knowledge
Average working
knowledge
No knowledge
100% 0 1 4 6 4 1
Q9.5 Light fittings and controls
Completion
Rate Don't know
Acknowledged expert
Very good working
knowledge
Good working knowledge
Average working
knowledge
No knowledge
100% 0 1 5 4 6 0
Q9.6 Energy Efficiency
Completion
Rate Don't know
Acknowledged expert
Very good working
knowledge
Good working knowledge
Average working
knowledge
No knowledge
100% 0 0 6 7 3 0
Q9.7 Water Efficiency
Completion
Rate Don't know
Acknowledged expert
Very good working
knowledge
Good working knowledge
Average working
knowledge
No knowledge
100% 1 1 5 7 2 0
Q9.8 Australian Building Greenhouse Rating Scheme (ABGR)
Completion
Rate Don't know
Accredited professional
Professional Good working knowledge
Average working
knowledge
No knowledge
100% 0 1 5 5 5 0
Q9.9 National Australian Built Environment Rating System (NABERS)
Completion
Rate Don't know
Accredited professional
Professional Good working knowledge
Average working
knowledge
No knowledge
100% 0 1 5 4 3 3
Q9.10 GreenStar
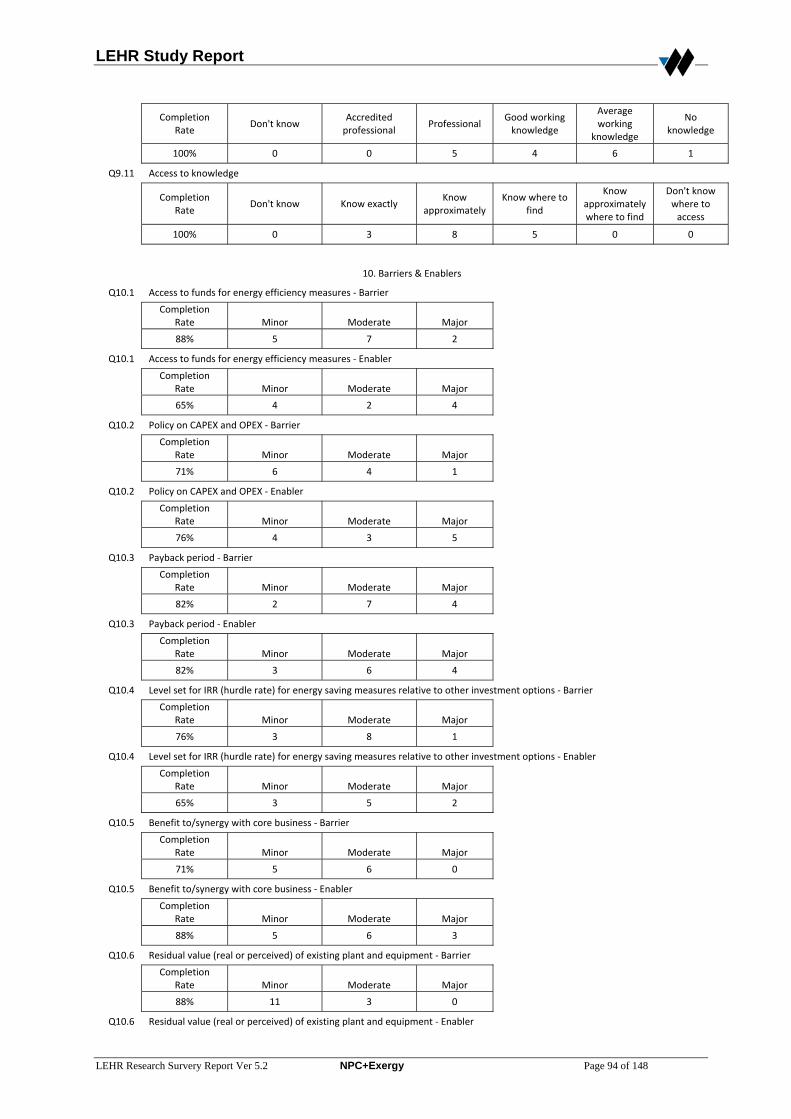
LEHR Study Report
LEHR Research Survery Report Ver 5.2 NPC+Exergy Page 94 of 148
Completion
Rate Don't know
Accredited professional
Professional Good working knowledge
Average working
knowledge
No knowledge
100% 0 0 5 4 6 1
Q9.11 Access to knowledge
Completion
Rate Don't know Know exactly
Know approximately
Know where to find
Know approximately where to find
Don't know where to access
100% 0 3 8 5 0 0
10. Barriers & Enablers
Q10.1 Access to funds for energy efficiency measures ‐ Barrier
Completion
Rate Minor Moderate Major
88% 5 7 2
Q10.1 Access to funds for energy efficiency measures ‐ Enabler
Completion
Rate Minor Moderate Major
65% 4 2 4
Q10.2 Policy on CAPEX and OPEX ‐ Barrier
Completion
Rate Minor Moderate Major
71% 6 4 1
Q10.2 Policy on CAPEX and OPEX ‐ Enabler
Completion
Rate Minor Moderate Major
76% 4 3 5
Q10.3 Payback period ‐ Barrier
Completion
Rate Minor Moderate Major
82% 2 7 4
Q10.3 Payback period ‐ Enabler
Completion
Rate Minor Moderate Major
82% 3 6 4
Q10.4 Level set for IRR (hurdle rate) for energy saving measures relative to other investment options ‐ Barrier
Completion
Rate Minor Moderate Major
76% 3 8 1
Q10.4 Level set for IRR (hurdle rate) for energy saving measures relative to other investment options ‐ Enabler
Completion
Rate Minor Moderate Major
65% 3 5 2
Q10.5 Benefit to/synergy with core business ‐ Barrier
Completion
Rate Minor Moderate Major
71% 5 6 0
Q10.5 Benefit to/synergy with core business ‐ Enabler
Completion
Rate Minor Moderate Major
88% 5 6 3
Q10.6 Residual value (real or perceived) of existing plant and equipment ‐ Barrier
Completion
Rate Minor Moderate Major
88% 11 3 0
Q10.6 Residual value (real or perceived) of existing plant and equipment ‐ Enabler

LEHR Study Report
LEHR Research Survery Report Ver 5.2 NPC+Exergy Page 95 of 148
Completion
Rate Minor Moderate Major
59% 3 3 3
Q10.7 Company energy management policy ‐ Barrier
Completion
Rate Minor Moderate Major
65% 7 3 0
Q10.7 Company energy management policy ‐ Enabler
Completion
Rate Minor Moderate Major
88% 5 5 4
Q10.8 Government energy or Greenhouse gas policy ‐ Barrier
Completion
Rate Minor Moderate Major
65% 7 2 1
Q10.8 Government energy or Greenhouse gas policy ‐ Enabler
Completion
Rate Minor Moderate Major
88% 5 6 3
Q10.9 Corporate image ‐ Barrier
Completion
Rate Minor Moderate Major
65% 8 1 1
Q10.9 Corporate image ‐ Enabler
Completion
Rate Minor Moderate Major
88% 3 5 6
Q10.10 Level of concern for the environment ‐ Barrier
Completion
Rate Minor Moderate Major
65% 8 1 1
Q10.10 Level of concern for the environment ‐ Enabler
Completion
Rate Minor Moderate Major
88% 6 3 5
Q10.11 Time needed and available approval of investment proposals/business cases ‐ Barrier
Completion
Rate Minor Moderate Major
82% 10 3 0
Q10.11 Time needed and available approval of investment proposals/business cases ‐ Enabler
Completion
Rate Minor Moderate Major
71% 6 5 0
Q10.12 Level of my workload ‐ Barrier
Completion
Rate Minor Moderate Major
88% 6 6 2
Q10.12 Level of my workload ‐ Enabler
Completion
Rate Minor Moderate Major
59% 4 4 1
Q10.13 Level of my manager's workload ‐ Barrier
Completion
Rate Minor Moderate Major
71% 6 4 1
Q10.13 Level of my manager's workload ‐ Enabler
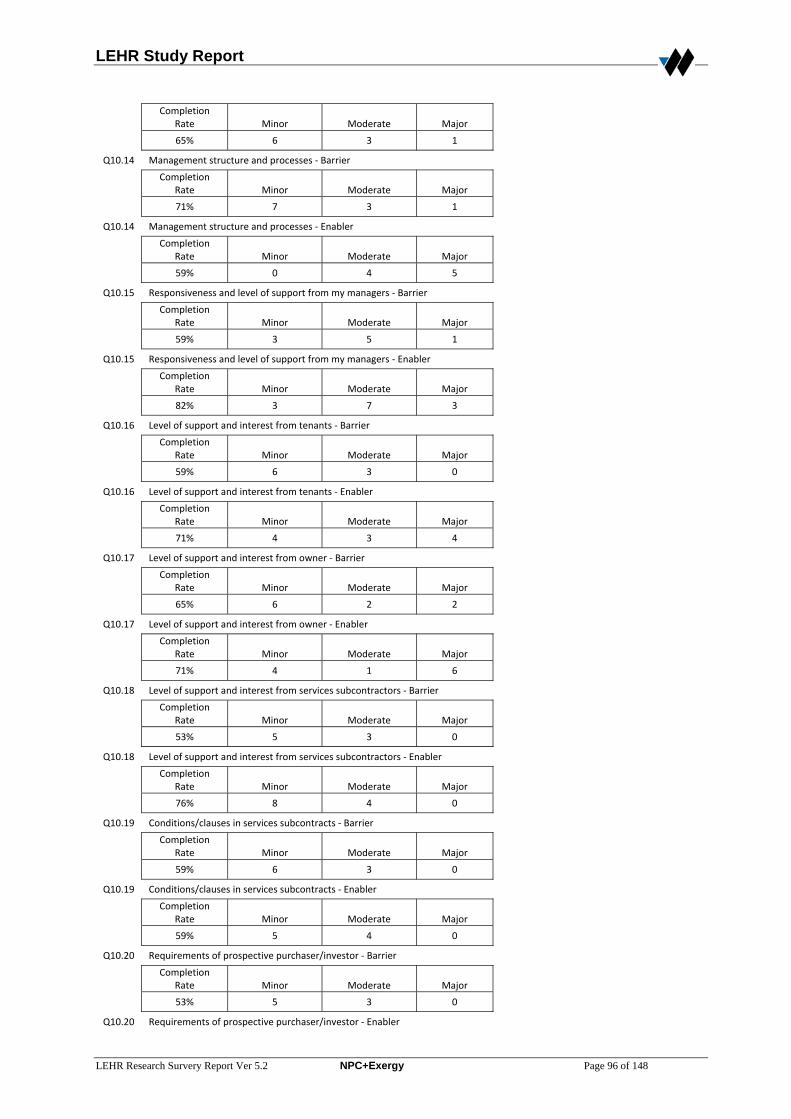
LEHR Study Report
LEHR Research Survery Report Ver 5.2 NPC+Exergy Page 96 of 148
Completion
Rate Minor Moderate Major
65% 6 3 1
Q10.14 Management structure and processes ‐ Barrier
Completion
Rate Minor Moderate Major
71% 7 3 1
Q10.14 Management structure and processes ‐ Enabler
Completion
Rate Minor Moderate Major
59% 0 4 5
Q10.15 Responsiveness and level of support from my managers ‐ Barrier
Completion
Rate Minor Moderate Major
59% 3 5 1
Q10.15 Responsiveness and level of support from my managers ‐ Enabler
Completion
Rate Minor Moderate Major
82% 3 7 3
Q10.16 Level of support and interest from tenants ‐ Barrier
Completion
Rate Minor Moderate Major
59% 6 3 0
Q10.16 Level of support and interest from tenants ‐ Enabler
Completion
Rate Minor Moderate Major
71% 4 3 4
Q10.17 Level of support and interest from owner ‐ Barrier
Completion
Rate Minor Moderate Major
65% 6 2 2
Q10.17 Level of support and interest from owner ‐ Enabler
Completion
Rate Minor Moderate Major
71% 4 1 6
Q10.18 Level of support and interest from services subcontractors ‐ Barrier
Completion
Rate Minor Moderate Major
53% 5 3 0
Q10.18 Level of support and interest from services subcontractors ‐ Enabler
Completion
Rate Minor Moderate Major
76% 8 4 0
Q10.19 Conditions/clauses in services subcontracts ‐ Barrier
Completion
Rate Minor Moderate Major
59% 6 3 0
Q10.19 Conditions/clauses in services subcontracts ‐ Enabler
Completion
Rate Minor Moderate Major
59% 5 4 0
Q10.20 Requirements of prospective purchaser/investor ‐ Barrier
Completion
Rate Minor Moderate Major
53% 5 3 0
Q10.20 Requirements of prospective purchaser/investor ‐ Enabler
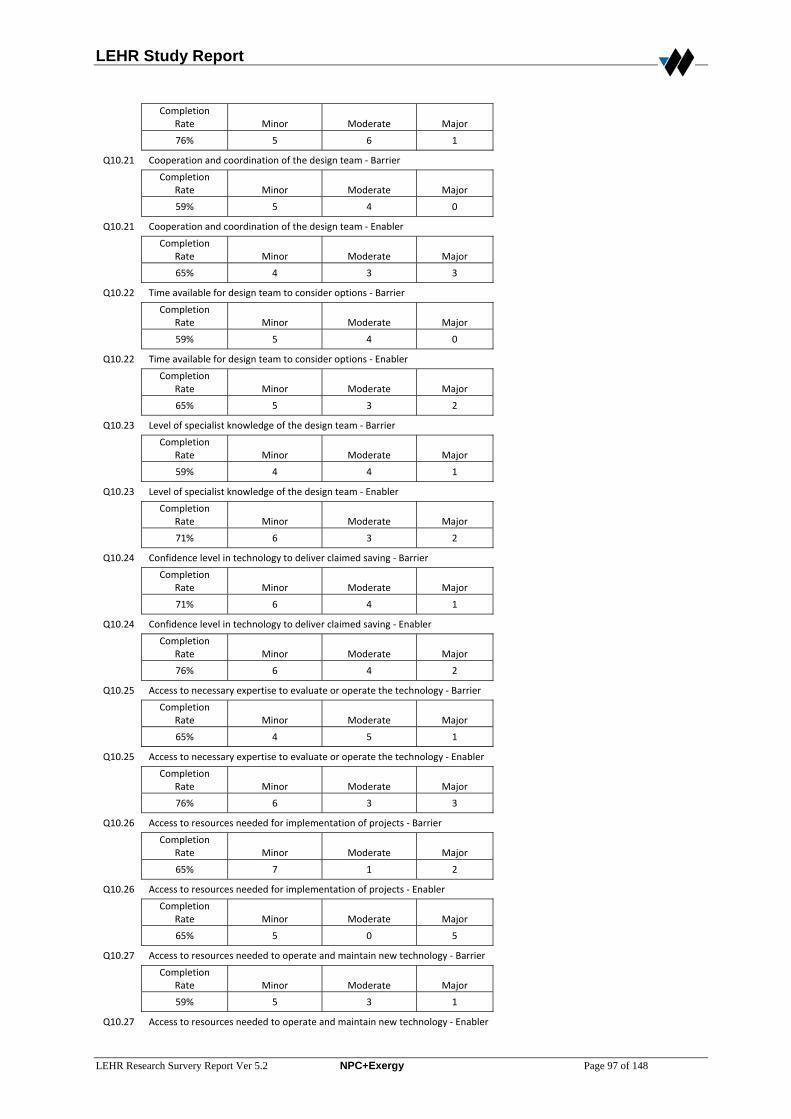
LEHR Study Report
LEHR Research Survery Report Ver 5.2 NPC+Exergy Page 97 of 148
Completion
Rate Minor Moderate Major
76% 5 6 1
Q10.21 Cooperation and coordination of the design team ‐ Barrier
Completion
Rate Minor Moderate Major
59% 5 4 0
Q10.21 Cooperation and coordination of the design team ‐ Enabler
Completion
Rate Minor Moderate Major
65% 4 3 3
Q10.22 Time available for design team to consider options ‐ Barrier
Completion
Rate Minor Moderate Major
59% 5 4 0
Q10.22 Time available for design team to consider options ‐ Enabler
Completion
Rate Minor Moderate Major
65% 5 3 2
Q10.23 Level of specialist knowledge of the design team ‐ Barrier
Completion
Rate Minor Moderate Major
59% 4 4 1
Q10.23 Level of specialist knowledge of the design team ‐ Enabler
Completion
Rate Minor Moderate Major
71% 6 3 2
Q10.24 Confidence level in technology to deliver claimed saving ‐ Barrier
Completion
Rate Minor Moderate Major
71% 6 4 1
Q10.24 Confidence level in technology to deliver claimed saving ‐ Enabler
Completion
Rate Minor Moderate Major
76% 6 4 2
Q10.25 Access to necessary expertise to evaluate or operate the technology ‐ Barrier
Completion
Rate Minor Moderate Major
65% 4 5 1
Q10.25 Access to necessary expertise to evaluate or operate the technology ‐ Enabler
Completion
Rate Minor Moderate Major
76% 6 3 3
Q10.26 Access to resources needed for implementation of projects ‐ Barrier
Completion
Rate Minor Moderate Major
65% 7 1 2
Q10.26 Access to resources needed for implementation of projects ‐ Enabler
Completion
Rate Minor Moderate Major
65% 5 0 5
Q10.27 Access to resources needed to operate and maintain new technology ‐ Barrier
Completion
Rate Minor Moderate Major
59% 5 3 1
Q10.27 Access to resources needed to operate and maintain new technology ‐ Enabler

LEHR Study Report
LEHR Research Survery Report Ver 5.2 NPC+Exergy Page 98 of 148
Completion
Rate Minor Moderate Major
65% 6 1 3
Q10.28 Quality of supplier information, data and technical support ‐ Barrier
Completion
Rate Minor Moderate Major
65% 5 5 0
Q10.28 Quality of supplier information, data and technical support ‐ Enabler
Completion
Rate Minor Moderate Major
65% 4 5 1
Q10.29 Availability of equipment or technology in the market ‐ Barrier
Completion
Rate Minor Moderate Major
65% 7 3 0
Q10.29 Availability of equipment or technology in the market ‐ Enabler
Completion
Rate Minor Moderate Major
71% 5 4 2
Q10.30 Lease terms and conditions especially split incentives under net leases ‐ Barrier
Completion
Rate Minor Moderate Major
53% 7 1 0
Q10.30 Lease terms and conditions especially split incentives under net leases ‐ Enabler
Completion
Rate Minor Moderate Major
59% 5 3 1
Q10.31 Lease duration or remaining term ‐ Barrier
Completion
Rate Minor Moderate Major
59% 7 1 1
Q10.31 Lease duration or remaining term ‐ Enabler
Completion
Rate Minor Moderate Major
65% 4 4 2
Q10.32 Current cost of energy ‐ Barrier
Completion
Rate Minor Moderate Major
71% 5 4 2
Q10.32 Current cost of energy ‐ Enabler
Completion
Rate Minor Moderate Major
82% 3 3 7
Q10.33 Future cost of energy ‐ Barrier
Completion
Rate Minor Moderate Major
71% 6 2 3
Q10.33 Future cost of energy ‐ Enabler
Completion
Rate Minor Moderate Major
82% 3 0 10
Q10.34 Building Grade (Property Council of Australia) ‐ Barrier
Completion
Rate Minor Moderate Major
59% 7 2 0
Q10.34 Building Grade (Property Council of Australia) ‐ Enabler
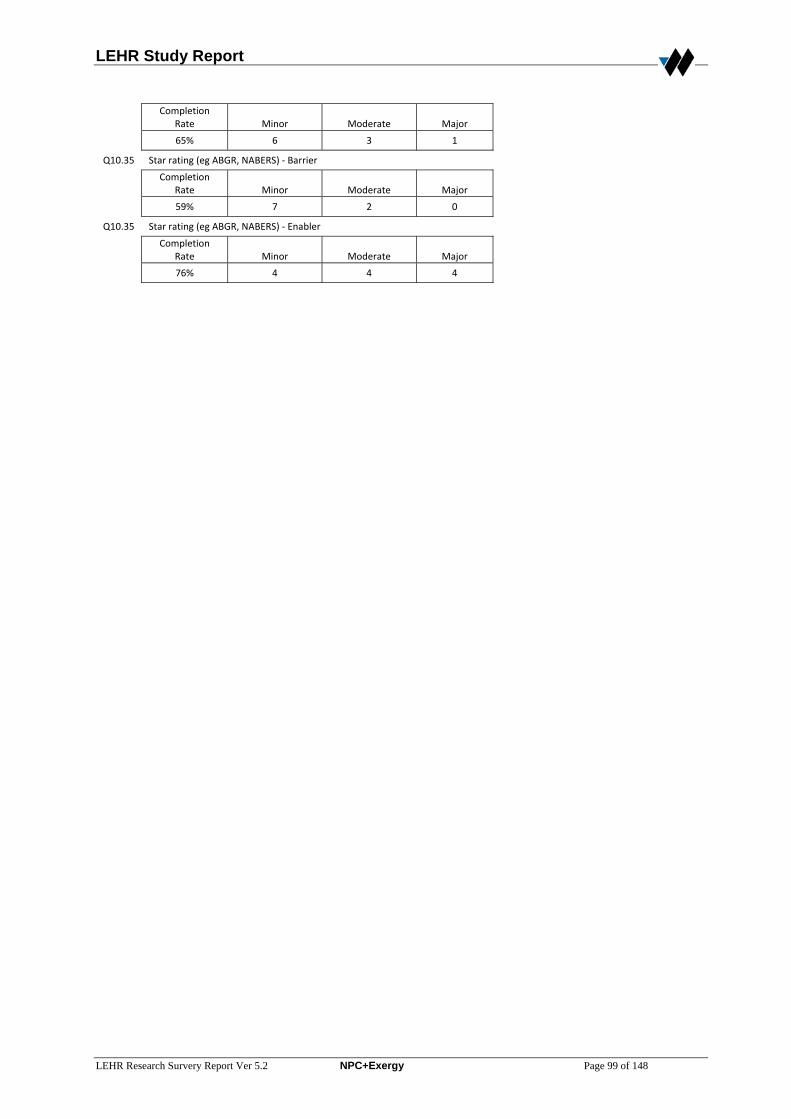
LEHR Study Report
LEHR Research Survery Report Ver 5.2 NPC+Exergy Page 99 of 148
Completion
Rate Minor Moderate Major
65% 6 3 1
Q10.35 Star rating (eg ABGR, NABERS) ‐ Barrier
Completion
Rate Minor Moderate Major
59% 7 2 0
Q10.35 Star rating (eg ABGR, NABERS) ‐ Enabler
Completion
Rate Minor Moderate Major
76% 4 4 4
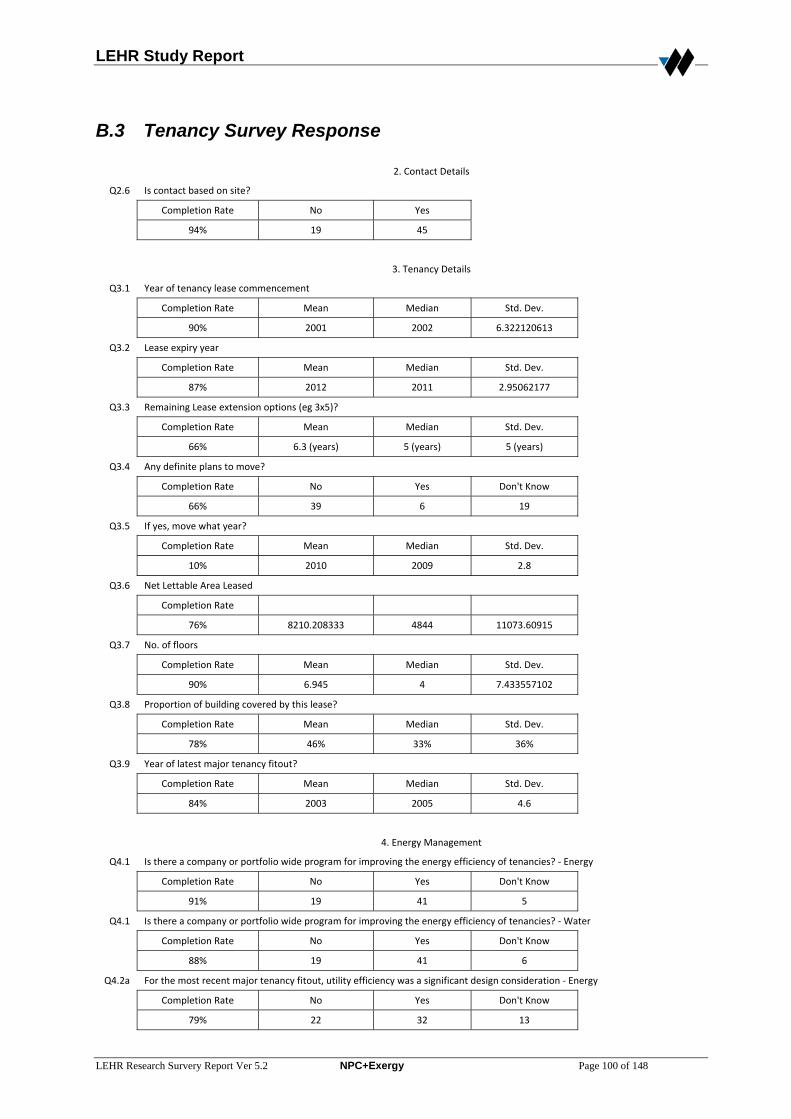
LEHR Study Report
LEHR Research Survery Report Ver 5.2 NPC+Exergy Page 100 of 148
B.3 Tenancy Survey Response
2. Contact Details
Q2.6 Is contact based on site?
Completion Rate No Yes
94% 19 45
3. Tenancy Details
Q3.1 Year of tenancy lease commencement
Completion Rate Mean Median Std. Dev.
90% 2001 2002 6.322120613
Q3.2 Lease expiry year
Completion Rate Mean Median Std. Dev.
87% 2012 2011 2.95062177
Q3.3 Remaining Lease extension options (eg 3x5)?
Completion Rate Mean Median Std. Dev.
66% 6.3 (years) 5 (years) 5 (years)
Q3.4 Any definite plans to move?
Completion Rate No Yes Don't Know
66% 39 6 19
Q3.5 If yes, move what year?
Completion Rate Mean Median Std. Dev.
10% 2010 2009 2.8
Q3.6 Net Lettable Area Leased
Completion Rate
76% 8210.208333 4844 11073.60915
Q3.7 No. of floors
Completion Rate Mean Median Std. Dev.
90% 6.945 4 7.433557102
Q3.8 Proportion of building covered by this lease?
Completion Rate Mean Median Std. Dev.
78% 46% 33% 36%
Q3.9 Year of latest major tenancy fitout?
Completion Rate Mean Median Std. Dev.
84% 2003 2005 4.6
4. Energy Management
Q4.1 Is there a company or portfolio wide program for improving the energy efficiency of tenancies? ‐ Energy
Completion Rate No Yes Don't Know
91% 19 41 5
Q4.1 Is there a company or portfolio wide program for improving the energy efficiency of tenancies? ‐ Water
Completion Rate No Yes Don't Know
88% 19 41 6
Q4.2a For the most recent major tenancy fitout, utility efficiency was a significant design consideration ‐ Energy
Completion Rate No Yes Don't Know
79% 22 32 13
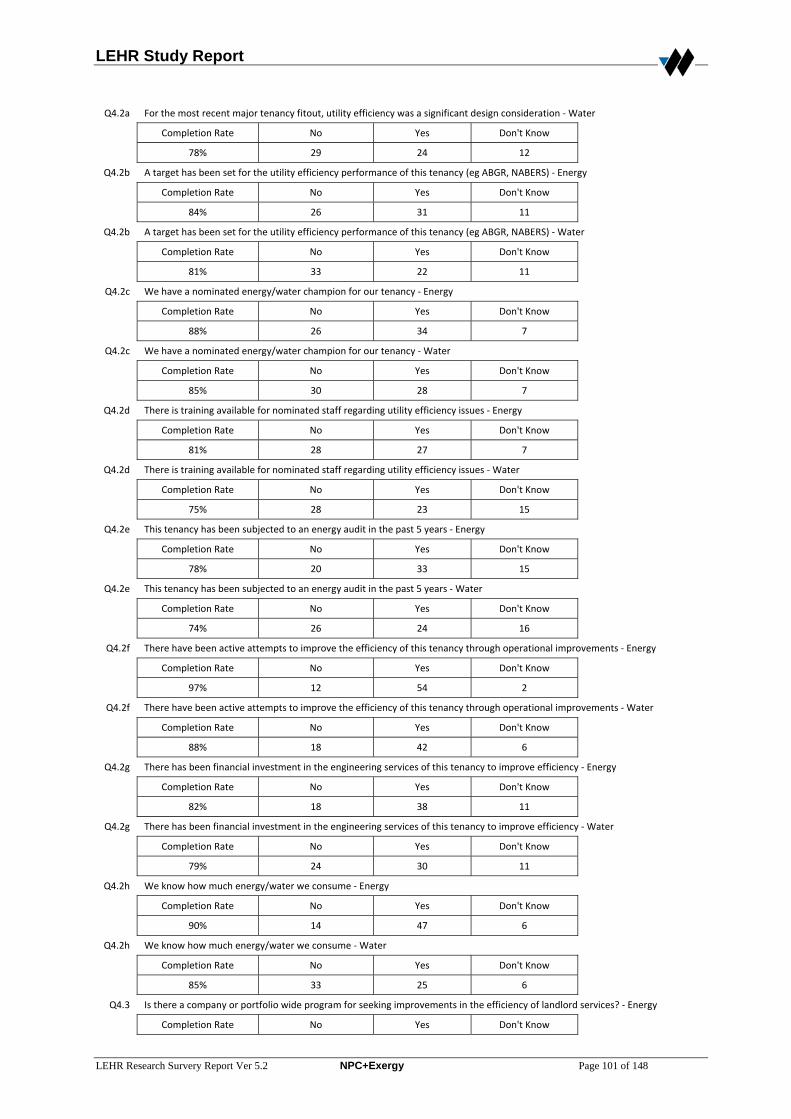
LEHR Study Report
LEHR Research Survery Report Ver 5.2 NPC+Exergy Page 101 of 148
Q4.2a For the most recent major tenancy fitout, utility efficiency was a significant design consideration ‐ Water
Completion Rate No Yes Don't Know
78% 29 24 12
Q4.2b A target has been set for the utility efficiency performance of this tenancy (eg ABGR, NABERS) ‐ Energy
Completion Rate No Yes Don't Know
84% 26 31 11
Q4.2b A target has been set for the utility efficiency performance of this tenancy (eg ABGR, NABERS) ‐ Water
Completion Rate No Yes Don't Know
81% 33 22 11
Q4.2c We have a nominated energy/water champion for our tenancy ‐ Energy
Completion Rate No Yes Don't Know
88% 26 34 7
Q4.2c We have a nominated energy/water champion for our tenancy ‐ Water
Completion Rate No Yes Don't Know
85% 30 28 7
Q4.2d There is training available for nominated staff regarding utility efficiency issues ‐ Energy
Completion Rate No Yes Don't Know
81% 28 27 7
Q4.2d There is training available for nominated staff regarding utility efficiency issues ‐ Water
Completion Rate No Yes Don't Know
75% 28 23 15
Q4.2e This tenancy has been subjected to an energy audit in the past 5 years ‐ Energy
Completion Rate No Yes Don't Know
78% 20 33 15
Q4.2e This tenancy has been subjected to an energy audit in the past 5 years ‐ Water
Completion Rate No Yes Don't Know
74% 26 24 16
Q4.2f There have been active attempts to improve the efficiency of this tenancy through operational improvements ‐ Energy
Completion Rate No Yes Don't Know
97% 12 54 2
Q4.2f There have been active attempts to improve the efficiency of this tenancy through operational improvements ‐ Water
Completion Rate No Yes Don't Know
88% 18 42 6
Q4.2g There has been financial investment in the engineering services of this tenancy to improve efficiency ‐ Energy
Completion Rate No Yes Don't Know
82% 18 38 11
Q4.2g There has been financial investment in the engineering services of this tenancy to improve efficiency ‐ Water
Completion Rate No Yes Don't Know
79% 24 30 11
Q4.2h We know how much energy/water we consume ‐ Energy
Completion Rate No Yes Don't Know
90% 14 47 6
Q4.2h We know how much energy/water we consume ‐ Water
Completion Rate No Yes Don't Know
85% 33 25 6
Q4.3 Is there a company or portfolio wide program for seeking improvements in the efficiency of landlord services? ‐ Energy
Completion Rate No Yes Don't Know
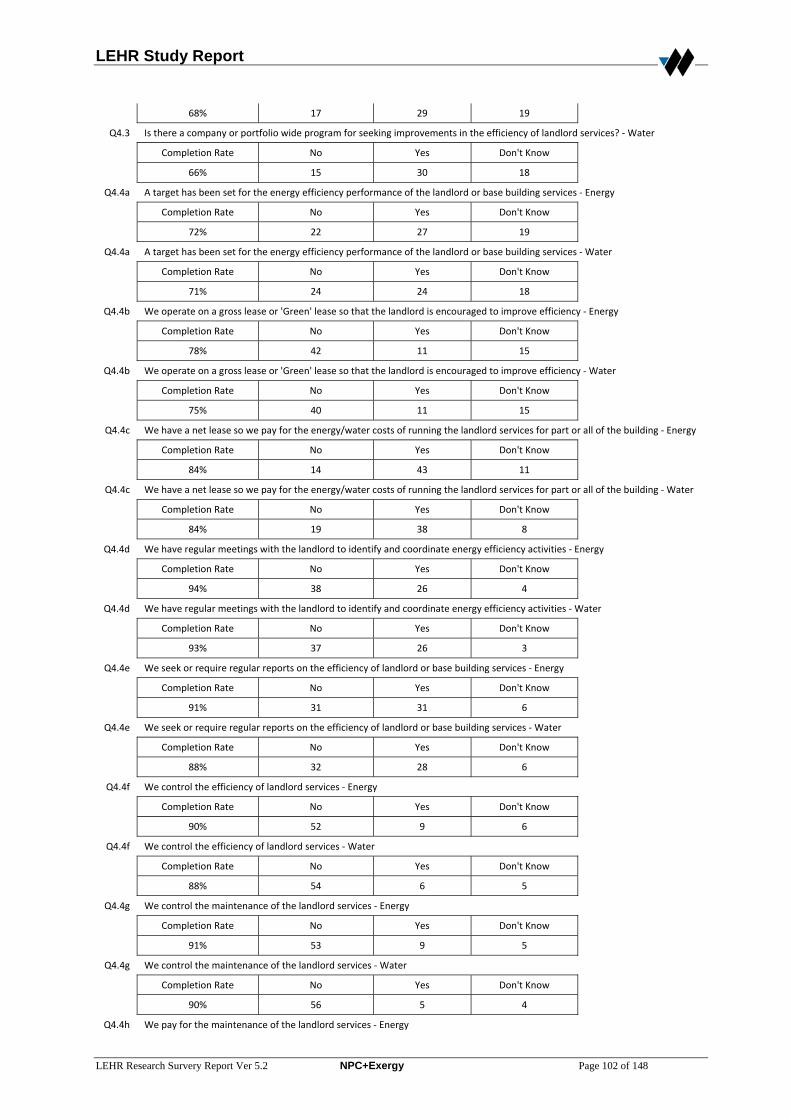
LEHR Study Report
LEHR Research Survery Report Ver 5.2 NPC+Exergy Page 102 of 148
68% 17 29 19
Q4.3 Is there a company or portfolio wide program for seeking improvements in the efficiency of landlord services? ‐ Water
Completion Rate No Yes Don't Know
66% 15 30 18
Q4.4a A target has been set for the energy efficiency performance of the landlord or base building services ‐ Energy
Completion Rate No Yes Don't Know
72% 22 27 19
Q4.4a A target has been set for the energy efficiency performance of the landlord or base building services ‐ Water
Completion Rate No Yes Don't Know
71% 24 24 18
Q4.4b We operate on a gross lease or 'Green' lease so that the landlord is encouraged to improve efficiency ‐ Energy
Completion Rate No Yes Don't Know
78% 42 11 15
Q4.4b We operate on a gross lease or 'Green' lease so that the landlord is encouraged to improve efficiency ‐ Water
Completion Rate No Yes Don't Know
75% 40 11 15
Q4.4c We have a net lease so we pay for the energy/water costs of running the landlord services for part or all of the building ‐ Energy
Completion Rate No Yes Don't Know
84% 14 43 11
Q4.4c We have a net lease so we pay for the energy/water costs of running the landlord services for part or all of the building ‐ Water
Completion Rate No Yes Don't Know
84% 19 38 8
Q4.4d We have regular meetings with the landlord to identify and coordinate energy efficiency activities ‐ Energy
Completion Rate No Yes Don't Know
94% 38 26 4
Q4.4d We have regular meetings with the landlord to identify and coordinate energy efficiency activities ‐ Water
Completion Rate No Yes Don't Know
93% 37 26 3
Q4.4e We seek or require regular reports on the efficiency of landlord or base building services ‐ Energy
Completion Rate No Yes Don't Know
91% 31 31 6
Q4.4e We seek or require regular reports on the efficiency of landlord or base building services ‐ Water
Completion Rate No Yes Don't Know
88% 32 28 6
Q4.4f We control the efficiency of landlord services ‐ Energy
Completion Rate No Yes Don't Know
90% 52 9 6
Q4.4f We control the efficiency of landlord services ‐ Water
Completion Rate No Yes Don't Know
88% 54 6 5
Q4.4g We control the maintenance of the landlord services ‐ Energy
Completion Rate No Yes Don't Know
91% 53 9 5
Q4.4g We control the maintenance of the landlord services ‐ Water
Completion Rate No Yes Don't Know
90% 56 5 4
Q4.4h We pay for the maintenance of the landlord services ‐ Energy
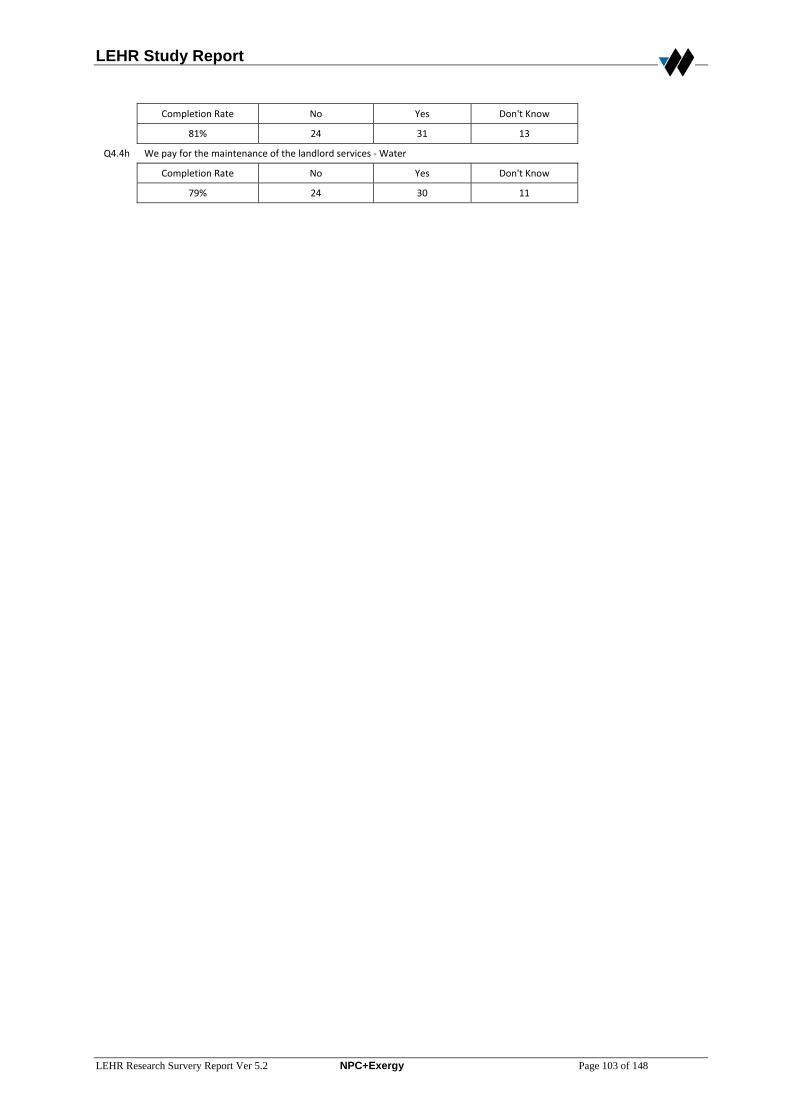
LEHR Study Report
LEHR Research Survery Report Ver 5.2 NPC+Exergy Page 103 of 148
Completion Rate No Yes Don't Know
81% 24 31 13
Q4.4h We pay for the maintenance of the landlord services ‐ Water
Completion Rate No Yes Don't Know
79% 24 30 11
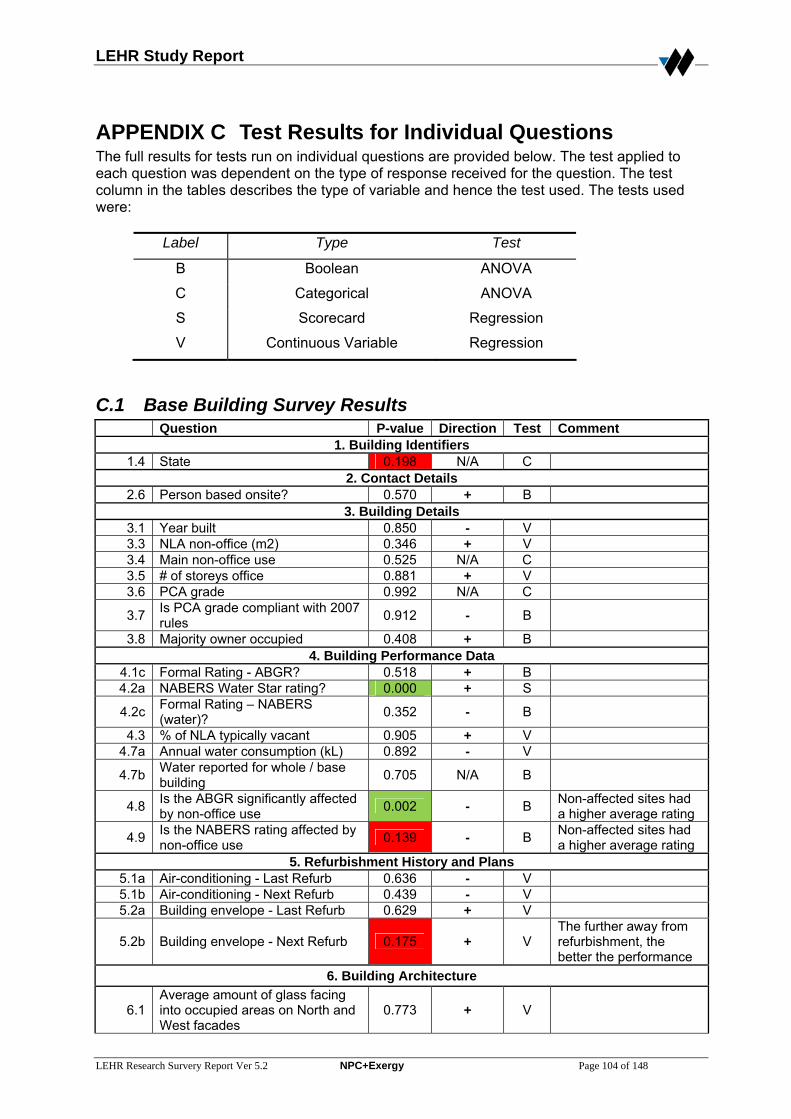
LEHR Study Report
LEHR Research Survery Report Ver 5.2 NPC+Exergy Page 104 of 148
APPENDIX C Test Results for Individual Questions The full results for tests run on individual questions are provided below. The test applied to each question was dependent on the type of response received for the question. The test column in the tables describes the type of variable and hence the test used. The tests used were:
Label Type Test
B Boolean ANOVA
C Categorical ANOVA
S Scorecard Regression
V Continuous Variable Regression
C.1 Base Building Survey Results Question P-value Direction Test Comment
1. Building Identifiers 1.4 State 0.198 N/A C
2. Contact Details 2.6 Person based onsite? 0.570 + B
3. Building Details 3.1 Year built 0.850 - V 3.3 NLA non-office (m2) 0.346 + V 3.4 Main non-office use 0.525 N/A C 3.5 # of storeys office 0.881 + V 3.6 PCA grade 0.992 N/A C
3.7 Is PCA grade compliant with 2007 rules 0.912 - B
3.8 Majority owner occupied 0.408 + B 4. Building Performance Data
4.1c Formal Rating - ABGR? 0.518 + B 4.2a NABERS Water Star rating? 0.000 + S
4.2c Formal Rating – NABERS (water)? 0.352 - B
4.3 % of NLA typically vacant 0.905 + V 4.7a Annual water consumption (kL) 0.892 - V
4.7b Water reported for whole / base building 0.705 N/A B
4.8 Is the ABGR significantly affected by non-office use 0.002 - B Non-affected sites had
a higher average rating
4.9 Is the NABERS rating affected by non-office use 0.139 - B Non-affected sites had
a higher average rating 5. Refurbishment History and Plans
5.1a Air-conditioning - Last Refurb 0.636 - V 5.1b Air-conditioning - Next Refurb 0.439 - V 5.2a Building envelope - Last Refurb 0.629 + V
5.2b Building envelope - Next Refurb 0.175 + V The further away from refurbishment, the better the performance
6. Building Architecture
6.1 Average amount of glass facing into occupied areas on North and West facades
0.773 + V
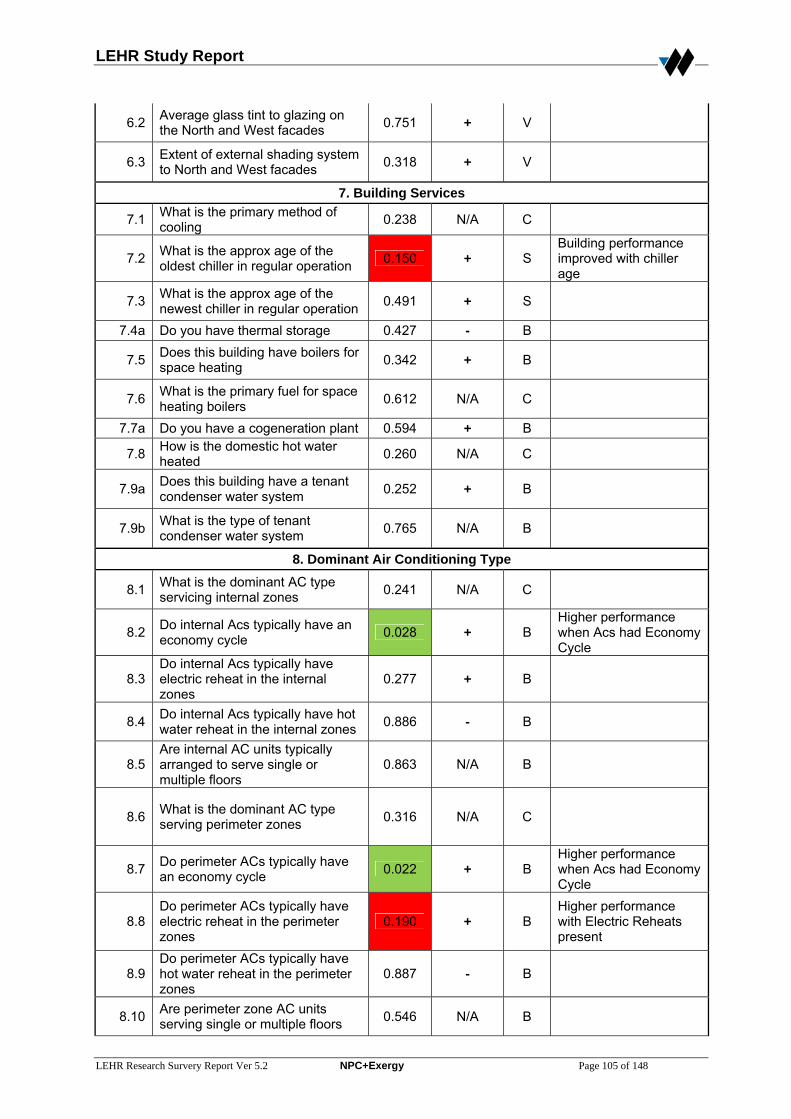
LEHR Study Report
LEHR Research Survery Report Ver 5.2 NPC+Exergy Page 105 of 148
6.2 Average glass tint to glazing on the North and West facades 0.751 + V
6.3 Extent of external shading system to North and West facades 0.318 + V
7. Building Services
7.1 What is the primary method of cooling 0.238 N/A C
7.2 What is the approx age of the oldest chiller in regular operation 0.150 + S
Building performance improved with chiller age
7.3 What is the approx age of the newest chiller in regular operation 0.491 + S
7.4a Do you have thermal storage 0.427 - B
7.5 Does this building have boilers for space heating 0.342 + B
7.6 What is the primary fuel for space heating boilers 0.612 N/A C
7.7a Do you have a cogeneration plant 0.594 + B
7.8 How is the domestic hot water heated 0.260 N/A C
7.9a Does this building have a tenant condenser water system 0.252 + B
7.9b What is the type of tenant condenser water system 0.765 N/A B
8. Dominant Air Conditioning Type
8.1 What is the dominant AC type servicing internal zones 0.241 N/A C
8.2 Do internal Acs typically have an economy cycle 0.028 + B
Higher performance when Acs had Economy Cycle
8.3 Do internal Acs typically have electric reheat in the internal zones
0.277 + B
8.4 Do internal Acs typically have hot water reheat in the internal zones 0.886 - B
8.5 Are internal AC units typically arranged to serve single or multiple floors
0.863 N/A B
8.6 What is the dominant AC type serving perimeter zones 0.316 N/A C
8.7 Do perimeter ACs typically have an economy cycle 0.022 + B
Higher performance when Acs had Economy Cycle
8.8 Do perimeter ACs typically have electric reheat in the perimeter zones
0.190 + B Higher performance with Electric Reheats present
8.9 Do perimeter ACs typically have hot water reheat in the perimeter zones
0.887 - B
8.10 Are perimeter zone AC units serving single or multiple floors 0.546 N/A B
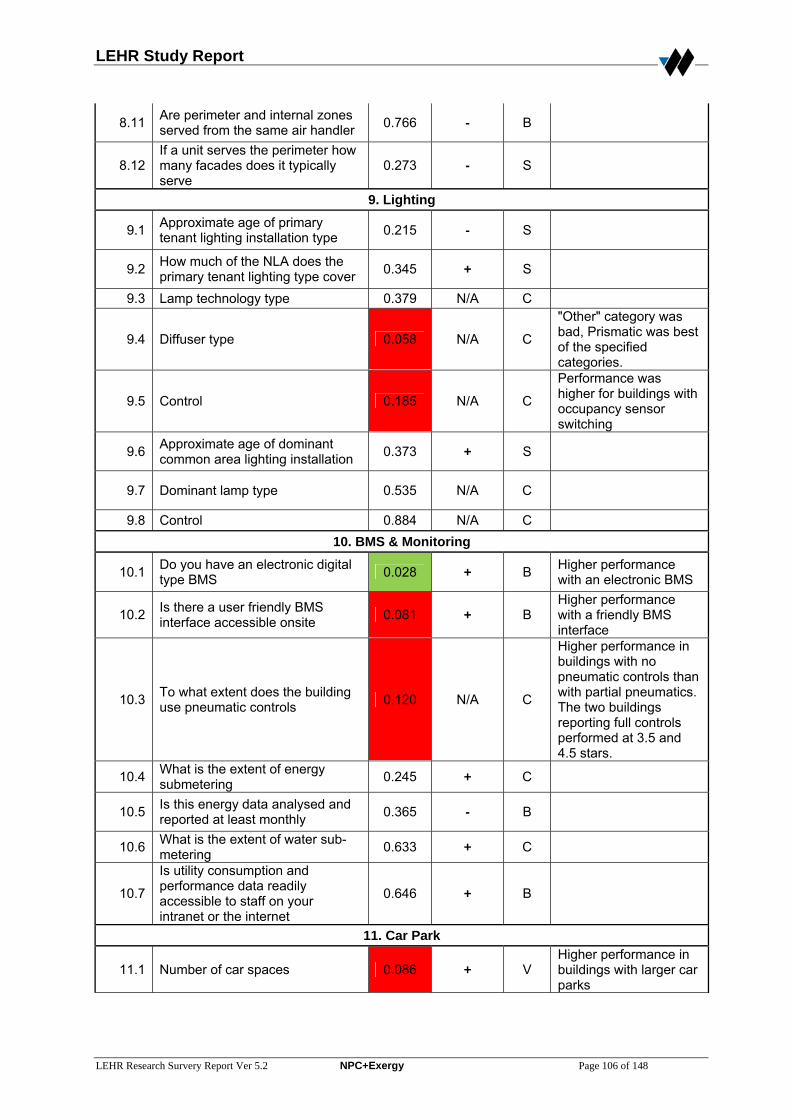
LEHR Study Report
LEHR Research Survery Report Ver 5.2 NPC+Exergy Page 106 of 148
8.11 Are perimeter and internal zones served from the same air handler 0.766 - B
8.12 If a unit serves the perimeter how many facades does it typically serve
0.273 - S
9. Lighting
9.1 Approximate age of primary tenant lighting installation type 0.215 - S
9.2 How much of the NLA does the primary tenant lighting type cover 0.345 + S
9.3 Lamp technology type 0.379 N/A C
9.4 Diffuser type 0.058 N/A C
"Other" category was bad, Prismatic was best of the specified categories.
9.5 Control 0.185 N/A C
Performance was higher for buildings with occupancy sensor switching
9.6 Approximate age of dominant common area lighting installation 0.373 + S
9.7 Dominant lamp type 0.535 N/A C
9.8 Control 0.884 N/A C 10. BMS & Monitoring
10.1 Do you have an electronic digital type BMS 0.028 + B Higher performance
with an electronic BMS
10.2 Is there a user friendly BMS interface accessible onsite 0.081 + B
Higher performance with a friendly BMS interface
10.3 To what extent does the building use pneumatic controls 0.120 N/A C
Higher performance in buildings with no pneumatic controls than with partial pneumatics. The two buildings reporting full controls performed at 3.5 and 4.5 stars.
10.4 What is the extent of energy submetering 0.245 + C
10.5 Is this energy data analysed and reported at least monthly 0.365 - B
10.6 What is the extent of water sub-metering 0.633 + C
10.7
Is utility consumption and performance data readily accessible to staff on your intranet or the internet
0.646 + B
11. Car Park
11.1 Number of car spaces 0.086 + V Higher performance in buildings with larger car parks
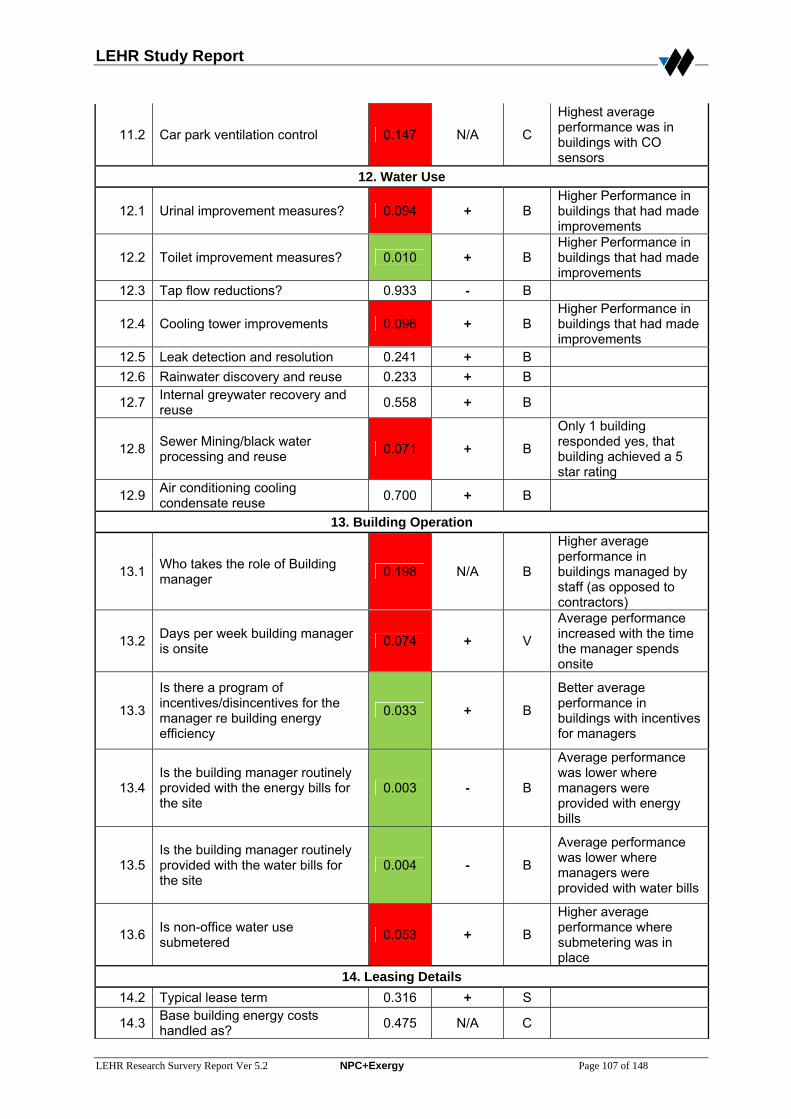
LEHR Study Report
LEHR Research Survery Report Ver 5.2 NPC+Exergy Page 107 of 148
11.2 Car park ventilation control 0.147 N/A C
Highest average performance was in buildings with CO sensors
12. Water Use
12.1 Urinal improvement measures? 0.094 + B Higher Performance in buildings that had made improvements
12.2 Toilet improvement measures? 0.010 + B Higher Performance in buildings that had made improvements
12.3 Tap flow reductions? 0.933 - B
12.4 Cooling tower improvements 0.096 + B Higher Performance in buildings that had made improvements
12.5 Leak detection and resolution 0.241 + B 12.6 Rainwater discovery and reuse 0.233 + B
12.7 Internal greywater recovery and reuse 0.558 + B
12.8 Sewer Mining/black water processing and reuse 0.071 + B
Only 1 building responded yes, that building achieved a 5 star rating
12.9 Air conditioning cooling condensate reuse 0.700 + B
13. Building Operation
13.1 Who takes the role of Building manager 0.198 N/A B
Higher average performance in buildings managed by staff (as opposed to contractors)
13.2 Days per week building manager is onsite 0.074 + V
Average performance increased with the time the manager spends onsite
13.3
Is there a program of incentives/disincentives for the manager re building energy efficiency
0.033 + B
Better average performance in buildings with incentives for managers
13.4 Is the building manager routinely provided with the energy bills for the site
0.003 - B
Average performance was lower where managers were provided with energy bills
13.5 Is the building manager routinely provided with the water bills for the site
0.004 - B
Average performance was lower where managers were provided with water bills
13.6 Is non-office water use submetered 0.053 + B
Higher average performance where submetering was in place
14. Leasing Details 14.2 Typical lease term 0.316 + S
14.3 Base building energy costs handled as? 0.475 N/A C

LEHR Study Report
LEHR Research Survery Report Ver 5.2 NPC+Exergy Page 108 of 148
14.4 Tenant energy costs handled as? 0.930 N/A C 15. Energy and water Management
15.1 Company or portfolio wide reduction policy? - Energy 0.530 + B
15.1 Company or portfolio wide reduction policy? - Water 0.388 + B
15.2a Efficiency included in corporate reporting - Energy 0.405 + B
15.2a Efficiency included in corporate reporting - Water 0.206 + B
15.2b A target has been set for efficiency performance of the building? - Energy
0.265 + B
15.2b A target has been set for efficiency performance of the building? - Water
0.325 + B
15.2c There is a training program - Energy 0.004 + B
Higher average performance for "Yes" response
15.2c There is a training program - Water 0.002 + B
Higher average performance for "Yes" response
15.2d There is a program of audits in place - Energy 0.070 + B
Higher average performance for "Yes" response
15.2d There is a program of audits in place - Water 0.016 + B
Higher average performance for "Yes" response
15.2e There is a single person responsible for efficiency - Energy 0.642 - B
15.2e There is a single person responsible for efficiency - Water 0.933 - B
15.4a Past 5 yrs low/no cost measures implemented - Energy 0.332 + B
15.4a Past 5 yrs low/no cost measures implemented - Water 0.045 + B
Higher average performance for "Yes" response
15.4b Past 5 yrs minor cost measures implemented - Energy 0.012 + B
Higher average performance for "Yes" response
15.4b Past 5 yrs minor cost measures implemented - Water 0.029 + B
Higher average performance for "Yes" response
15.4c Past 5 yrs major cost measures implemented - Energy 0.206 - B
15.4c Past 5 yrs major cost measures implemented - Water 0.331 - B
15.7a Active program in place for efficiency improvement - Energy 0.182 + B
Higher average performance for "Yes" response
15.7a Active program in place for efficiency improvement - Water 0.060 + B
Higher average performance for "Yes" response

LEHR Study Report
LEHR Research Survery Report Ver 5.2 NPC+Exergy Page 109 of 148
15.7b Our existing tenant has strong requirements on efficiency - Energy
0.200 + B Higher average performance for "Yes" response
15.7b Our existing tenant has strong requirements on efficiency - Water
0.151 + B Higher average performance for "Yes" response
15.7c The main driver comes from management/ownership chain - Energy
0.020 + B Higher average performance for "Yes" response
15.7c The main driver comes from management/ownership chain - Water
0.020 + B Higher average performance for "Yes" response
15.7d The efficiency requirements for future tenants is a major driver - Energy
0.130 - B Lower average performance for "Yes" response
15.7d The efficiency requirements for future tenants is a major driver - Water
0.278 - B
15.7e We have access to adequate skills - Energy 0.200 + B
15.7e We have access to adequate skills - Water 0.200 + B
15.7f We have access to implement efficiency measures - Energy 0.073 + B
Higher average performance for "Yes" response
15.7f We have access to implement efficiency measures - Water 0.073 + B
Higher average performance for "Yes" response
15.7g We have sufficient resources - Energy 0.345 + B
15.7g We have sufficient resources - Water 0.684 + B
15.7h We have a clear process for efficiency investment proposal and approval - Energy
0.050 + B Higher average performance for "Yes" response
15.7h We have a clear process for efficiency investment proposal and approval - Water
0.035 + B Higher average performance for "Yes" response
15.7i Efficiency investments are not discriminated - Energy 0.772 + B
15.7i Efficiency investments are not discriminated - Water 0.659 + B
15.7j Can readily access budget or finance for efficiency measures - Energy
0.072 + B Higher average performance for "Yes" response
15.7j Can readily access budget or finance for efficiency measures - Water
0.072 + B Higher average performance for "Yes" response
15.7k
Incentives provided to individuals / business units to identify and implement efficiency improvements - Energy
0.162 + B Higher average performance for "Yes" response
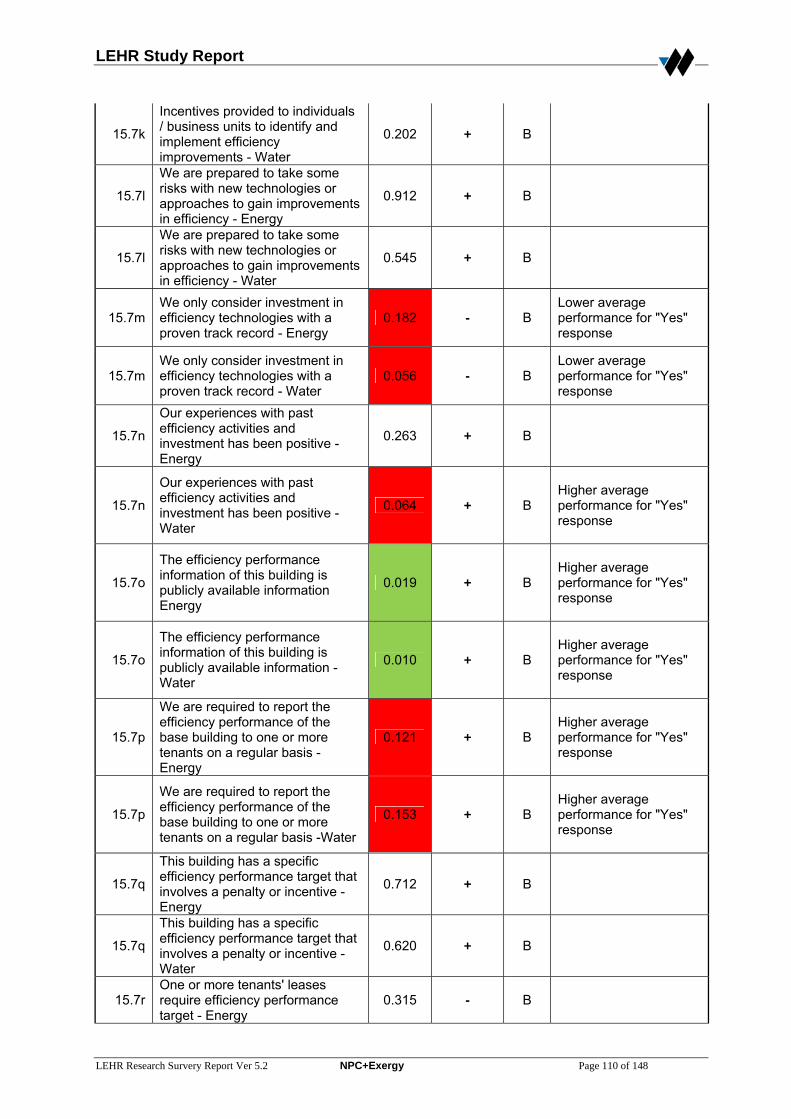
LEHR Study Report
LEHR Research Survery Report Ver 5.2 NPC+Exergy Page 110 of 148
15.7k
Incentives provided to individuals / business units to identify and implement efficiency improvements - Water
0.202 + B
15.7l
We are prepared to take some risks with new technologies or approaches to gain improvements in efficiency - Energy
0.912 + B
15.7l
We are prepared to take some risks with new technologies or approaches to gain improvements in efficiency - Water
0.545 + B
15.7m We only consider investment in efficiency technologies with a proven track record - Energy
0.182 - B Lower average performance for "Yes" response
15.7m We only consider investment in efficiency technologies with a proven track record - Water
0.056 - B Lower average performance for "Yes" response
15.7n
Our experiences with past efficiency activities and investment has been positive - Energy
0.263 + B
15.7n
Our experiences with past efficiency activities and investment has been positive - Water
0.064 + B Higher average performance for "Yes" response
15.7o
The efficiency performance information of this building is publicly available information Energy
0.019 + B Higher average performance for "Yes" response
15.7o
The efficiency performance information of this building is publicly available information -Water
0.010 + B Higher average performance for "Yes" response
15.7p
We are required to report the efficiency performance of the base building to one or more tenants on a regular basis -Energy
0.121 + B Higher average performance for "Yes" response
15.7p
We are required to report the efficiency performance of the base building to one or more tenants on a regular basis -Water
0.153 + B Higher average performance for "Yes" response
15.7q
This building has a specific efficiency performance target that involves a penalty or incentive - Energy
0.712 + B
15.7q
This building has a specific efficiency performance target that involves a penalty or incentive - Water
0.620 + B
15.7r One or more tenants' leases require efficiency performance target - Energy
0.315 - B
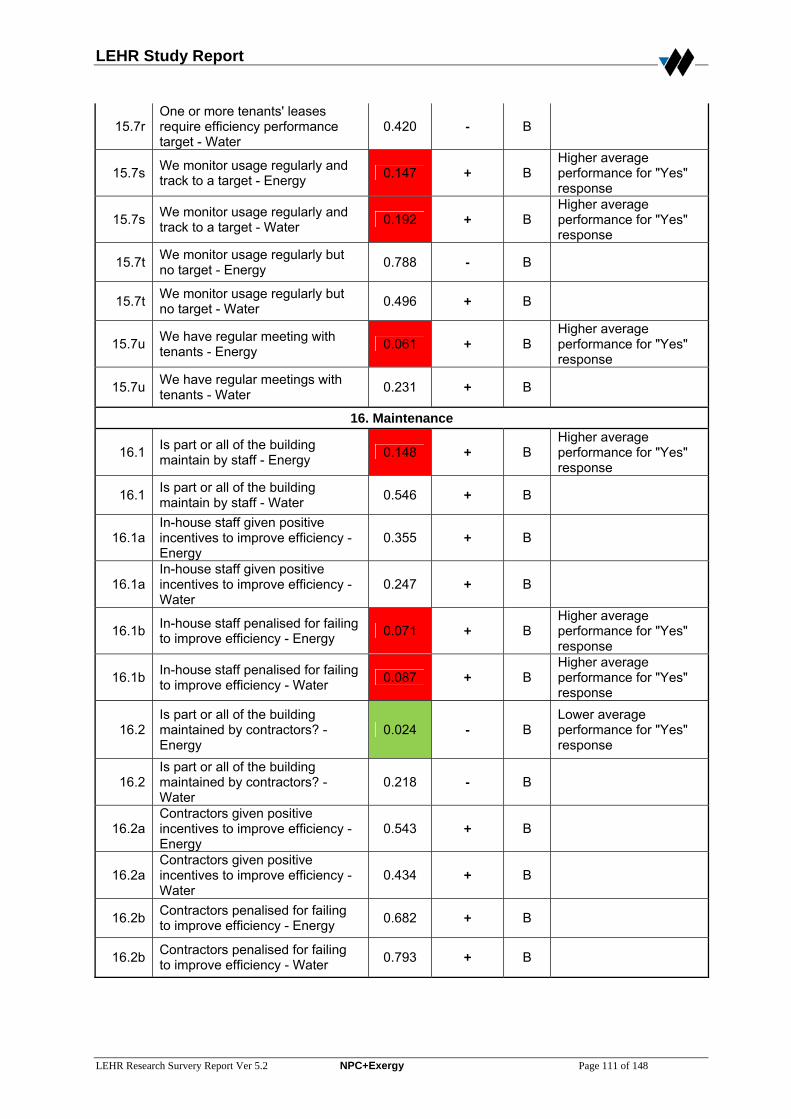
LEHR Study Report
LEHR Research Survery Report Ver 5.2 NPC+Exergy Page 111 of 148
15.7r One or more tenants' leases require efficiency performance target - Water
0.420 - B
15.7s We monitor usage regularly and track to a target - Energy 0.147 + B
Higher average performance for "Yes" response
15.7s We monitor usage regularly and track to a target - Water 0.192 + B
Higher average performance for "Yes" response
15.7t We monitor usage regularly but no target - Energy 0.788 - B
15.7t We monitor usage regularly but no target - Water 0.496 + B
15.7u We have regular meeting with tenants - Energy 0.061 + B
Higher average performance for "Yes" response
15.7u We have regular meetings with tenants - Water 0.231 + B
16. Maintenance
16.1 Is part or all of the building maintain by staff - Energy 0.148 + B
Higher average performance for "Yes" response
16.1 Is part or all of the building maintain by staff - Water 0.546 + B
16.1a In-house staff given positive incentives to improve efficiency - Energy
0.355 + B
16.1a In-house staff given positive incentives to improve efficiency - Water
0.247 + B
16.1b In-house staff penalised for failing to improve efficiency - Energy 0.071 + B
Higher average performance for "Yes" response
16.1b In-house staff penalised for failing to improve efficiency - Water 0.087 + B
Higher average performance for "Yes" response
16.2 Is part or all of the building maintained by contractors? - Energy
0.024 - B Lower average performance for "Yes" response
16.2 Is part or all of the building maintained by contractors? - Water
0.218 - B
16.2a Contractors given positive incentives to improve efficiency - Energy
0.543 + B
16.2a Contractors given positive incentives to improve efficiency - Water
0.434 + B
16.2b Contractors penalised for failing to improve efficiency - Energy 0.682 + B
16.2b Contractors penalised for failing to improve efficiency - Water 0.793 + B

LEHR Study Report
LEHR Research Survery Report Ver 5.2 NPC+Exergy Page 112 of 148
C.2 Manager Survey Results Asset Managers
Question P-value Direction Test Comment 3. Level of Authority
3.1 Are you an employee of the building owner or a contractor? 0.689 N/A C
3.2 Are you an employee of the tenant company or an external contractor?
0.595 N/A C
3.3 Are you based at the above building? 0.066 + B
Higher average performance for "Yes" response
4. Authority Over Energy Matters
4.1 "I have control over the energy use of the premises on a day-to-day basis"
0.665 + S
4.2 "I have control over minor investments to improve the energy efficiency of the premises"
0.587 - S
4.3 "I have control over major investments to improve the energy efficiency of the premises"
0.027 - S
Section 4 Aggregate 0.456 - 5. Responsibility Limits
5.1 The limit of my financial authority for expenditure is: 0.454 - S
5.2 I can realistically make recommendations to management for expenditure of:
0.541 + S
5.3 What level of responsibility for the management of energy efficiency do you have?
0.559 + S
5.4 The total number of buildings I have significant responsibility for is:
0.548 + S
Section 5 Aggregate 0.660 + 6. Incentives
6.1
How long do the budget structures that you work within allow you to hold onto energy savings for reinvestment within your own budget?
0.327 + S
6.2
If you make an energy efficiency improvement, what impact will it have on your personal financial position (ie salary or bonus)?
0.795 + S
6.3
If you make an energy efficiency improvement, what impact will it have on your employer's financial position?
0.467 + S
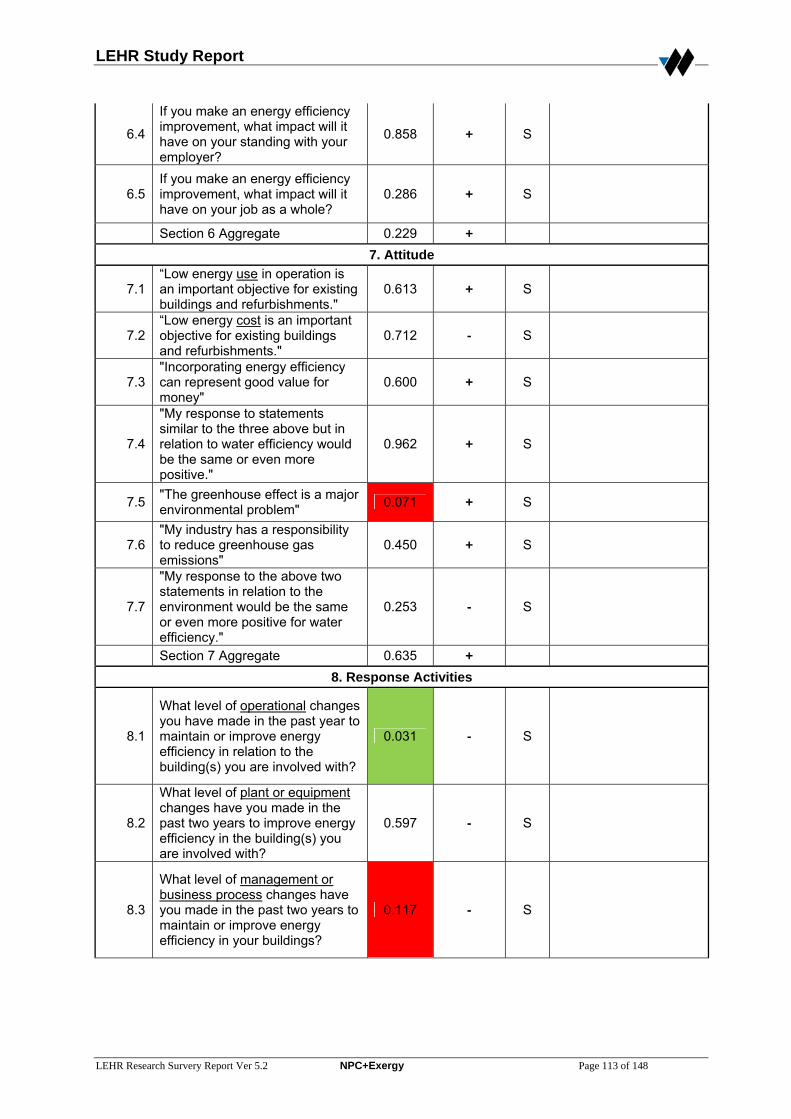
LEHR Study Report
LEHR Research Survery Report Ver 5.2 NPC+Exergy Page 113 of 148
6.4
If you make an energy efficiency improvement, what impact will it have on your standing with your employer?
0.858 + S
6.5 If you make an energy efficiency improvement, what impact will it have on your job as a whole?
0.286 + S
Section 6 Aggregate 0.229 + 7. Attitude
7.1 “Low energy use in operation is an important objective for existing buildings and refurbishments."
0.613 + S
7.2 “Low energy cost is an important objective for existing buildings and refurbishments."
0.712 - S
7.3 "Incorporating energy efficiency can represent good value for money"
0.600 + S
7.4
"My response to statements similar to the three above but in relation to water efficiency would be the same or even more positive."
0.962 + S
7.5 "The greenhouse effect is a major environmental problem" 0.071 + S
7.6 "My industry has a responsibility to reduce greenhouse gas emissions"
0.450 + S
7.7
"My response to the above two statements in relation to the environment would be the same or even more positive for water efficiency."
0.253 - S
Section 7 Aggregate 0.635 + 8. Response Activities
8.1
What level of operational changes you have made in the past year to maintain or improve energy efficiency in relation to the building(s) you are involved with?
0.031 - S
8.2
What level of plant or equipment changes have you made in the past two years to improve energy efficiency in the building(s) you are involved with?
0.597 - S
8.3
What level of management or business process changes have you made in the past two years to maintain or improve energy efficiency in your buildings?
0.117 - S
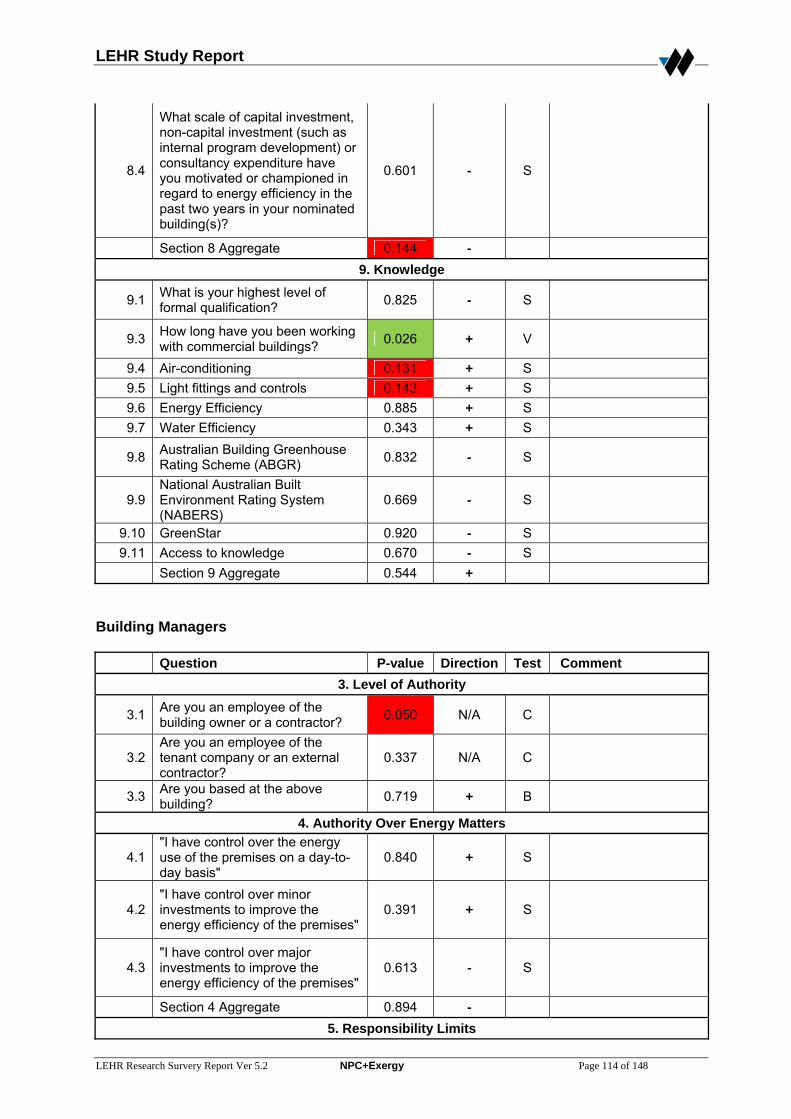
LEHR Study Report
LEHR Research Survery Report Ver 5.2 NPC+Exergy Page 114 of 148
8.4
What scale of capital investment, non-capital investment (such as internal program development) or consultancy expenditure have you motivated or championed in regard to energy efficiency in the past two years in your nominated building(s)?
0.601 - S
Section 8 Aggregate 0.144 - 9. Knowledge
9.1 What is your highest level of formal qualification? 0.825 - S
9.3 How long have you been working with commercial buildings? 0.026 + V
9.4 Air-conditioning 0.131 + S 9.5 Light fittings and controls 0.143 + S 9.6 Energy Efficiency 0.885 + S 9.7 Water Efficiency 0.343 + S
9.8 Australian Building Greenhouse Rating Scheme (ABGR) 0.832 - S
9.9 National Australian Built Environment Rating System (NABERS)
0.669 - S
9.10 GreenStar 0.920 - S 9.11 Access to knowledge 0.670 - S
Section 9 Aggregate 0.544 + Building Managers
Question P-value Direction Test Comment 3. Level of Authority
3.1 Are you an employee of the building owner or a contractor? 0.050 N/A C
3.2 Are you an employee of the tenant company or an external contractor?
0.337 N/A C
3.3 Are you based at the above building? 0.719 + B
4. Authority Over Energy Matters
4.1 "I have control over the energy use of the premises on a day-to-day basis"
0.840 + S
4.2 "I have control over minor investments to improve the energy efficiency of the premises"
0.391 + S
4.3 "I have control over major investments to improve the energy efficiency of the premises"
0.613 - S
Section 4 Aggregate 0.894 - 5. Responsibility Limits
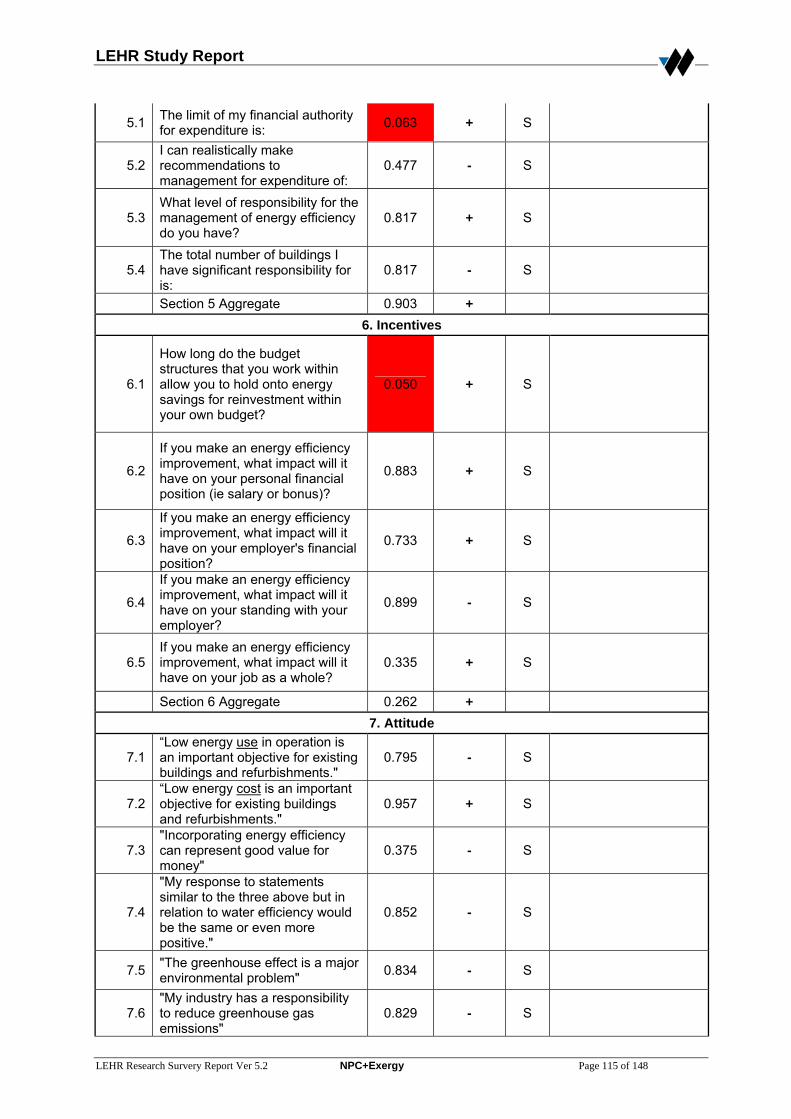
LEHR Study Report
LEHR Research Survery Report Ver 5.2 NPC+Exergy Page 115 of 148
5.1 The limit of my financial authority for expenditure is: 0.063 + S
5.2 I can realistically make recommendations to management for expenditure of:
0.477 - S
5.3 What level of responsibility for the management of energy efficiency do you have?
0.817 + S
5.4 The total number of buildings I have significant responsibility for is:
0.817 - S
Section 5 Aggregate 0.903 + 6. Incentives
6.1
How long do the budget structures that you work within allow you to hold onto energy savings for reinvestment within your own budget?
0.050 + S
6.2
If you make an energy efficiency improvement, what impact will it have on your personal financial position (ie salary or bonus)?
0.883 + S
6.3
If you make an energy efficiency improvement, what impact will it have on your employer's financial position?
0.733 + S
6.4
If you make an energy efficiency improvement, what impact will it have on your standing with your employer?
0.899 - S
6.5 If you make an energy efficiency improvement, what impact will it have on your job as a whole?
0.335 + S
Section 6 Aggregate 0.262 + 7. Attitude
7.1 “Low energy use in operation is an important objective for existing buildings and refurbishments."
0.795 - S
7.2 “Low energy cost is an important objective for existing buildings and refurbishments."
0.957 + S
7.3 "Incorporating energy efficiency can represent good value for money"
0.375 - S
7.4
"My response to statements similar to the three above but in relation to water efficiency would be the same or even more positive."
0.852 - S
7.5 "The greenhouse effect is a major environmental problem" 0.834 - S
7.6 "My industry has a responsibility to reduce greenhouse gas emissions"
0.829 - S
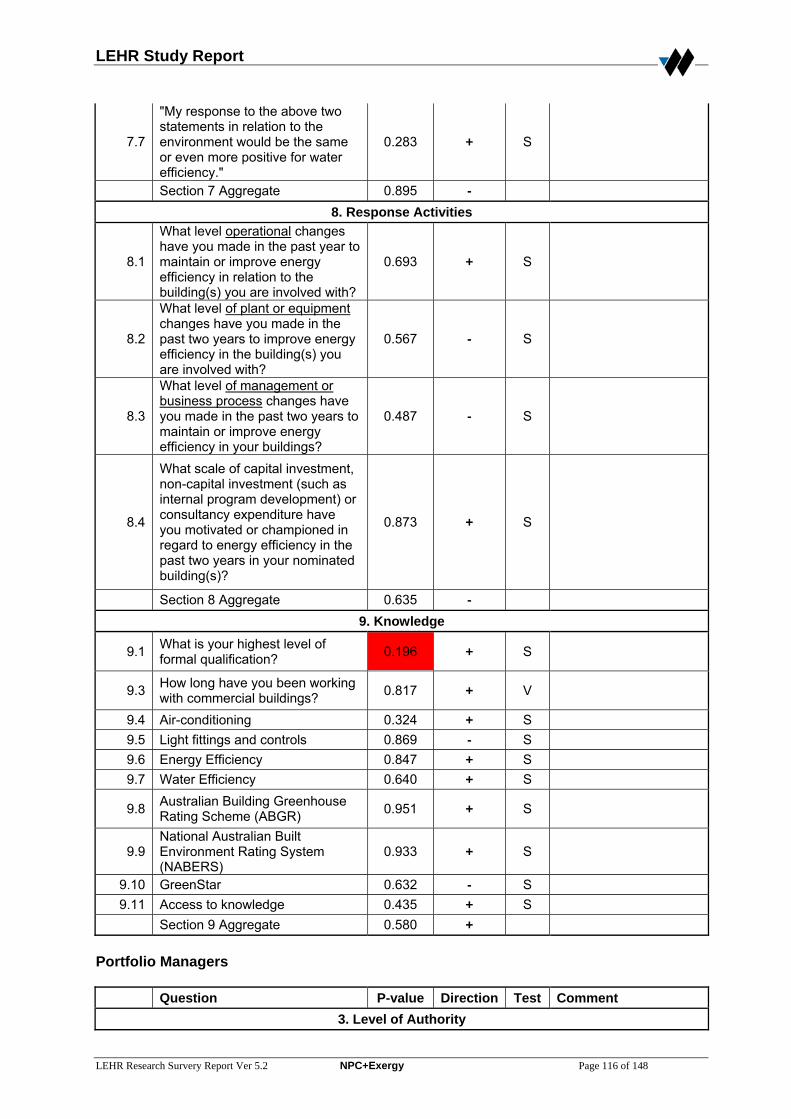
LEHR Study Report
LEHR Research Survery Report Ver 5.2 NPC+Exergy Page 116 of 148
7.7
"My response to the above two statements in relation to the environment would be the same or even more positive for water efficiency."
0.283 + S
Section 7 Aggregate 0.895 - 8. Response Activities
8.1
What level operational changes have you made in the past year to maintain or improve energy efficiency in relation to the building(s) you are involved with?
0.693 + S
8.2
What level of plant or equipment changes have you made in the past two years to improve energy efficiency in the building(s) you are involved with?
0.567 - S
8.3
What level of management or business process changes have you made in the past two years to maintain or improve energy efficiency in your buildings?
0.487 - S
8.4
What scale of capital investment, non-capital investment (such as internal program development) or consultancy expenditure have you motivated or championed in regard to energy efficiency in the past two years in your nominated building(s)?
0.873 + S
Section 8 Aggregate 0.635 - 9. Knowledge
9.1 What is your highest level of formal qualification? 0.196 + S
9.3 How long have you been working with commercial buildings? 0.817 + V
9.4 Air-conditioning 0.324 + S 9.5 Light fittings and controls 0.869 - S 9.6 Energy Efficiency 0.847 + S 9.7 Water Efficiency 0.640 + S
9.8 Australian Building Greenhouse Rating Scheme (ABGR) 0.951 + S
9.9 National Australian Built Environment Rating System (NABERS)
0.933 + S
9.10 GreenStar 0.632 - S 9.11 Access to knowledge 0.435 + S
Section 9 Aggregate 0.580 + Portfolio Managers
Question P-value Direction Test Comment 3. Level of Authority
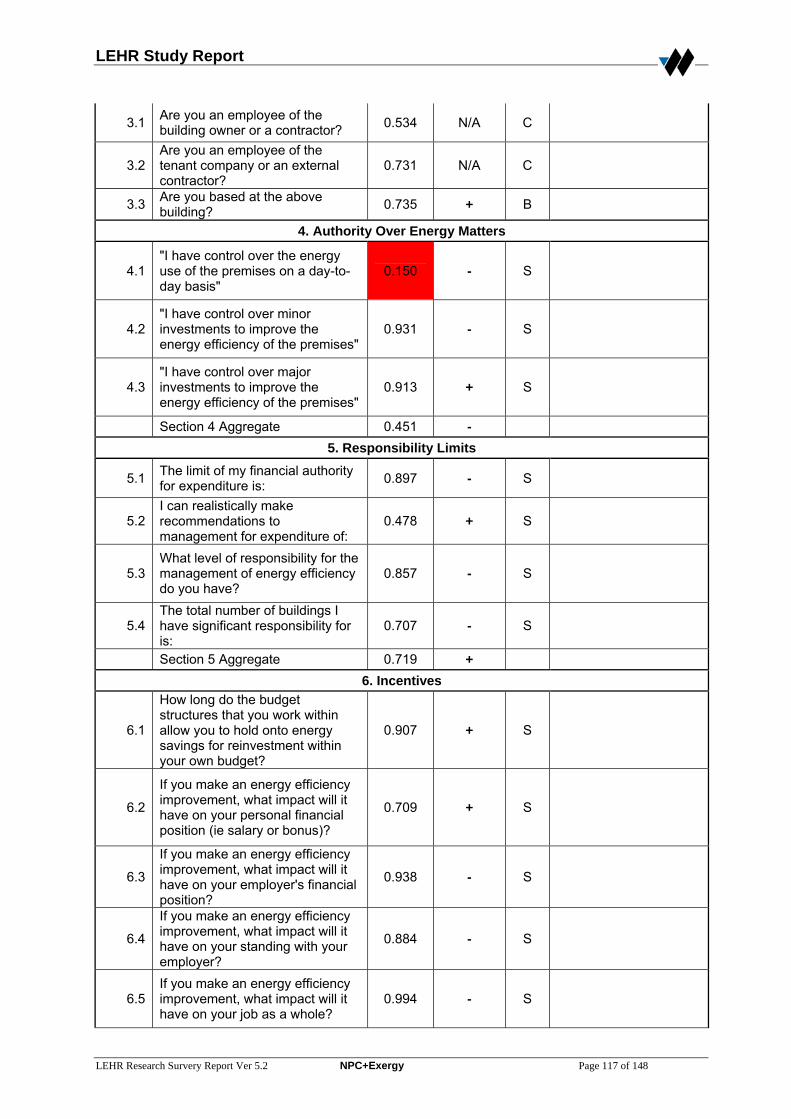
LEHR Study Report
LEHR Research Survery Report Ver 5.2 NPC+Exergy Page 117 of 148
3.1 Are you an employee of the building owner or a contractor? 0.534 N/A C
3.2 Are you an employee of the tenant company or an external contractor?
0.731 N/A C
3.3 Are you based at the above building? 0.735 + B
4. Authority Over Energy Matters
4.1 "I have control over the energy use of the premises on a day-to-day basis"
0.150 - S
4.2 "I have control over minor investments to improve the energy efficiency of the premises"
0.931 - S
4.3 "I have control over major investments to improve the energy efficiency of the premises"
0.913 + S
Section 4 Aggregate 0.451 - 5. Responsibility Limits
5.1 The limit of my financial authority for expenditure is: 0.897 - S
5.2 I can realistically make recommendations to management for expenditure of:
0.478 + S
5.3 What level of responsibility for the management of energy efficiency do you have?
0.857 - S
5.4 The total number of buildings I have significant responsibility for is:
0.707 - S
Section 5 Aggregate 0.719 + 6. Incentives
6.1
How long do the budget structures that you work within allow you to hold onto energy savings for reinvestment within your own budget?
0.907 + S
6.2
If you make an energy efficiency improvement, what impact will it have on your personal financial position (ie salary or bonus)?
0.709 + S
6.3
If you make an energy efficiency improvement, what impact will it have on your employer's financial position?
0.938 - S
6.4
If you make an energy efficiency improvement, what impact will it have on your standing with your employer?
0.884 - S
6.5 If you make an energy efficiency improvement, what impact will it have on your job as a whole?
0.994 - S

LEHR Study Report
LEHR Research Survery Report Ver 5.2 NPC+Exergy Page 118 of 148
Section 6 Aggregate 0.909 + 7. Attitude
7.1 “Low energy use in operation is an important objective for existing buildings and refurbishments."
0.765 - S
7.2 “Low energy cost is an important objective for existing buildings and refurbishments."
0.787 + S
7.3 "Incorporating energy efficiency can represent good value for money"
0.769 + S
7.4
"My response to statements similar to the three above but in relation to water efficiency would be the same or even more positive."
0.954 + S
7.5 "The greenhouse effect is a major environmental problem" 0.246 + S
7.6 "My industry has a responsibility to reduce greenhouse gas emissions"
0.189 - S
7.7
"My response to the above two statements in relation to the environment would be the same or even more positive for water efficiency."
0.788 - S
Section 7 Aggregate 0.977 + 8. Response Activities
8.1
What level of operational changes you have made in the past year to maintain or improve energy efficiency in relation to the building(s) you are involved with?
0.782 + S
8.2
What level of plant or equipment changes have you made in the past two years to improve energy efficiency in the building(s) you are involved with?
0.775 + S
8.3
What level of management or business process changes have you made in the past two years to maintain or improve energy efficiency in your buildings?
0.654 + S
8.4
What scale of capital investment, non-capital investment (such as internal program development) or consultancy expenditure have you motivated or championed in regard to energy efficiency in the past two years in your nominated building(s)?
0.951 - S
Section 8 Aggregate 0.696 + 9. Knowledge
9.1 What is your highest level of formal qualification? 0.701 - S

LEHR Study Report
LEHR Research Survery Report Ver 5.2 NPC+Exergy Page 119 of 148
9.3 How long have you been working with commercial buildings? 0.042 - V
9.4 Air-conditioning 0.980 + S 9.5 Light fittings and controls 0.765 + S 9.6 Energy Efficiency 0.300 + S 9.7 Water Efficiency 0.738 + S
9.8 Australian Building Greenhouse Rating Scheme (ABGR) 0.326 + S
9.9 National Australian Built Environment Rating System (NABERS)
0.204 + S
9.10 GreenStar 0.082 + S 9.11 Access to knowledge 0.140 + S
Section 9 Aggregate 0.358 +

LEHR Study Report
LEHR Research Survery Report Ver 5.2 NPC+Exergy Page 120 of 148
C.3 Tenant Survey Results
Question P-value Direction Test Comment 2. Contact Details
2.6 Is contact based on site? 0.152 + B Higher average performance where the contact is based onsite
3. Tenancy Details
3.4 Any definite plans to move? 0.062 + B
Higher average building performance where tenant indicated plans to move
3.5 If yes, move what year? 0.719 - V 3.7 No. of floors 0.941 - V
3.8 Proportion of building covered by this lease? 0.120 - V
Average performance decreased with the % of the building covered by the lease increased
4. Energy Management
4.1
Is there a company or portfolio wide program for improving the energy efficiency of tenancies? - Energy
0.614 - B
4.1
Is there a company or portfolio wide program for improving the energy efficiency of tenancies? - Water
0.444 - B
4.2a
For the most recent major tenancy fitout, utility efficiency was a significant design consideration - Energy
0.688 + B
4.2a
For the most recent major tenancy fitout, utility efficiency was a significant design consideration - Water
0.439 - B
4.2b
A target has been set for the utility efficiency performance of this tenancy (eg ABGR, NABERS) - Energy
0.478 + B
4.2b
A target has been set for the utility efficiency performance of this tenancy (eg ABGR, NABERS) - Water
0.793 - B
4.2c We have a nominated energy/water champion for our tenancy - Energy
0.853 - B
4.2c We have a nominated energy/water champion for our tenancy - Water
0.783 - B
4.2d There is training available for nominated staff regarding utility efficiency issues - Energy
0.470 - B
4.2d There is training available for nominated staff regarding utility efficiency issues - Water
0.574 - B

LEHR Study Report
LEHR Research Survery Report Ver 5.2 NPC+Exergy Page 121 of 148
4.2e This tenancy has been subjected to an energy audit in the past 5 years - Energy
0.757 + B
4.2e This tenancy has been subjected to an energy audit in the past 5 years - Water
0.844 + B
4.2f
There have been active attempts to improve the efficiency of this tenancy through operational improvements - Energy
0.488 - B
4.2f
There have been active attempts to improve the efficiency of this tenancy through operational improvements - Water
0.142 - B Lower average performance for "Yes" response
4.2g
There has been financial investment in the engineering services of this tenancy to improve efficiency - Energy
0.163 - B Lower average performance for "Yes" response
4.2g
There has been financial investment in the engineering services of this tenancy to improve efficiency - Water
0.021 - B Lower average performance for "Yes" response
4.2h We know how much energy/water we consume - Energy 0.250 + B
4.2h We know how much energy/water we consume - Water 0.195 + B
Higher average performance for "Yes" response
4.3
Is there a company or portfolio wide program for seeking improvements in the efficiency of landlord services? - Energy
0.398 - B
4.3
Is there a company or portfolio wide program for seeking improvements in the efficiency of landlord services? - Water
0.902 + B
4.4a
A target has been set for the energy efficiency performance of the landlord or base building services - Energy
0.823 + B
4.4a
A target has been set for the energy efficiency performance of the landlord or base building services - Water
0.972 + B
4.4b
We operate on a gross lease or 'Green' lease so that the landlord is encouraged to improve efficiency - Energy
0.624 + B
4.4b
We operate on a gross lease or 'Green' lease so that the landlord is encouraged to improve efficiency - Water
0.992 - B
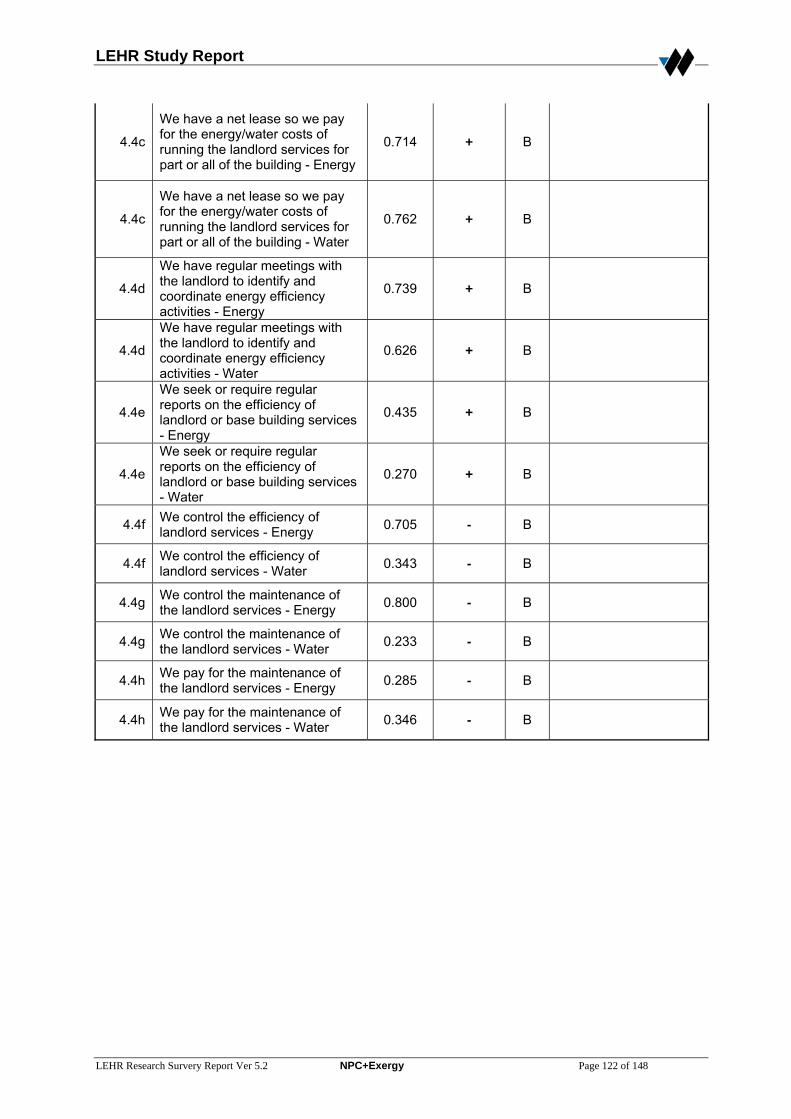
LEHR Study Report
LEHR Research Survery Report Ver 5.2 NPC+Exergy Page 122 of 148
4.4c
We have a net lease so we pay for the energy/water costs of running the landlord services for part or all of the building - Energy
0.714 + B
4.4c
We have a net lease so we pay for the energy/water costs of running the landlord services for part or all of the building - Water
0.762 + B
4.4d
We have regular meetings with the landlord to identify and coordinate energy efficiency activities - Energy
0.739 + B
4.4d
We have regular meetings with the landlord to identify and coordinate energy efficiency activities - Water
0.626 + B
4.4e
We seek or require regular reports on the efficiency of landlord or base building services - Energy
0.435 + B
4.4e
We seek or require regular reports on the efficiency of landlord or base building services - Water
0.270 + B
4.4f We control the efficiency of landlord services - Energy 0.705 - B
4.4f We control the efficiency of landlord services - Water 0.343 - B
4.4g We control the maintenance of the landlord services - Energy 0.800 - B
4.4g We control the maintenance of the landlord services - Water 0.233 - B
4.4h We pay for the maintenance of the landlord services - Energy 0.285 - B
4.4h We pay for the maintenance of the landlord services - Water 0.346 - B
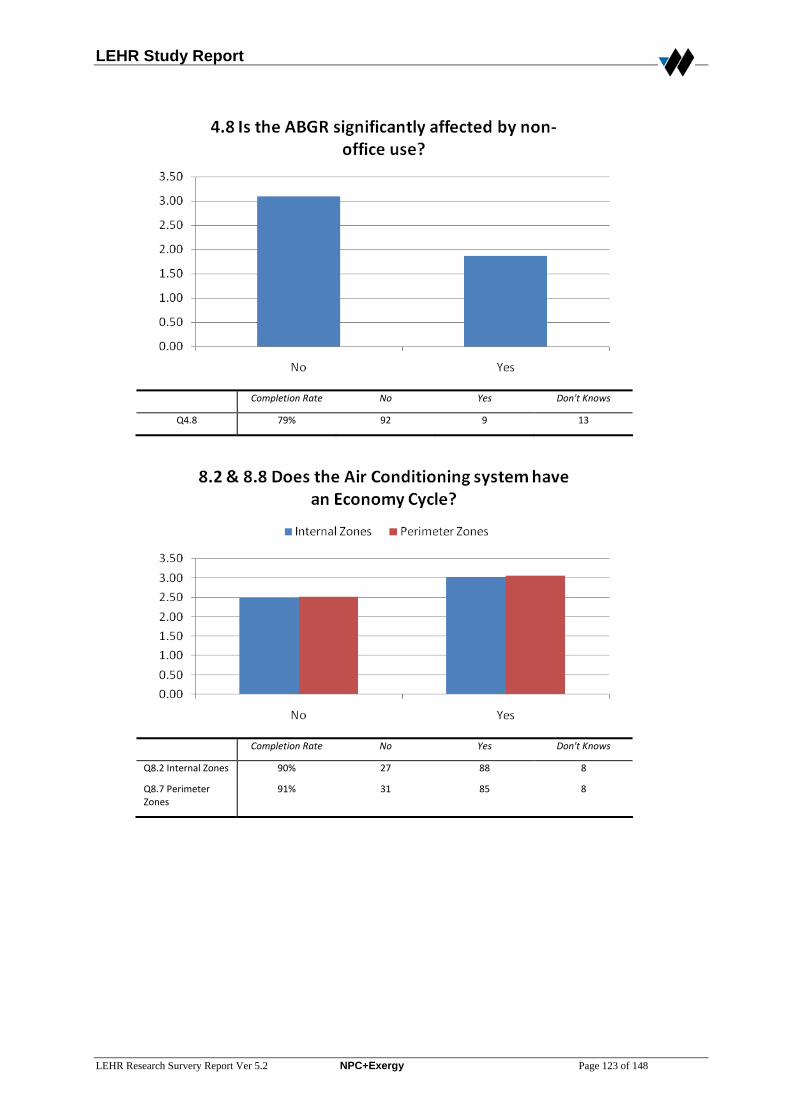
LEHR Study Report
LEHR Research Survery Report Ver 5.2 NPC+Exergy Page 123 of 148
Completion Rate No Yes Don't Knows
Q4.8 79% 92 9 13
Completion Rate No Yes Don't Knows
Q8.2 Internal Zones 90% 27 88 8
Q8.7 Perimeter Zones
91% 31 85 8
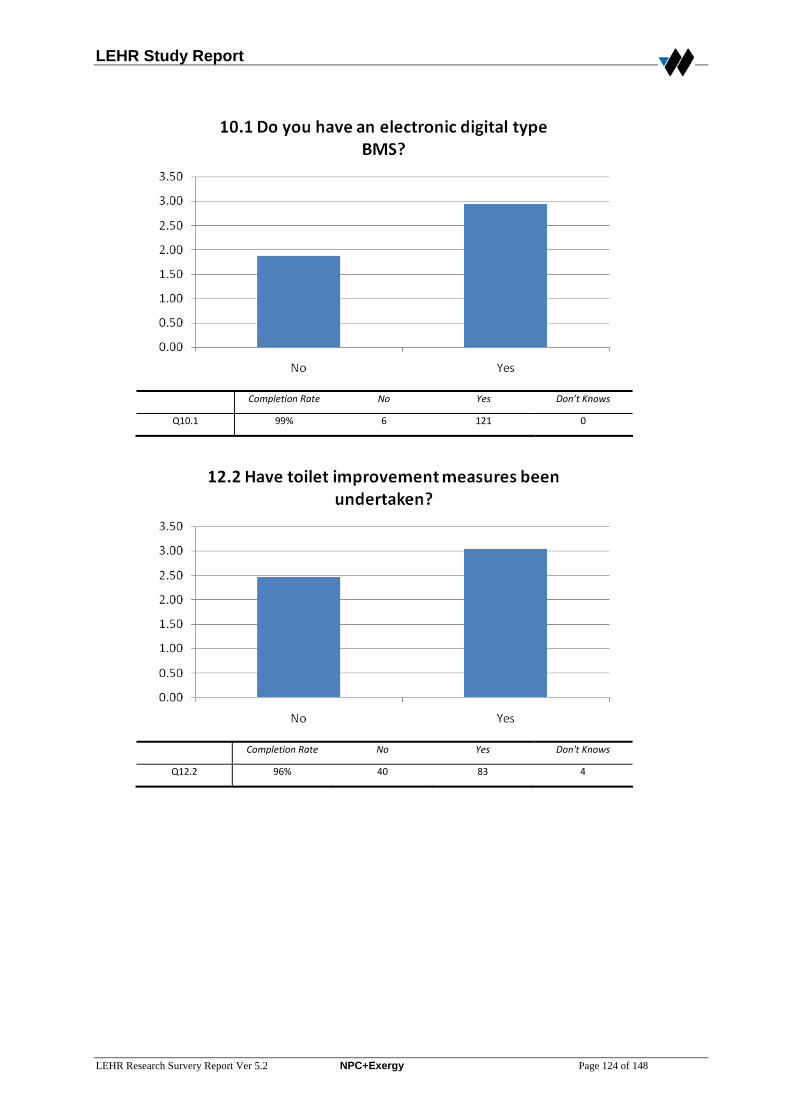
LEHR Study Report
LEHR Research Survery Report Ver 5.2 NPC+Exergy Page 124 of 148
Completion Rate No Yes Don’t Knows
Q10.1 99% 6 121 0
Completion Rate No Yes Don't Knows
Q12.2 96% 40 83 4
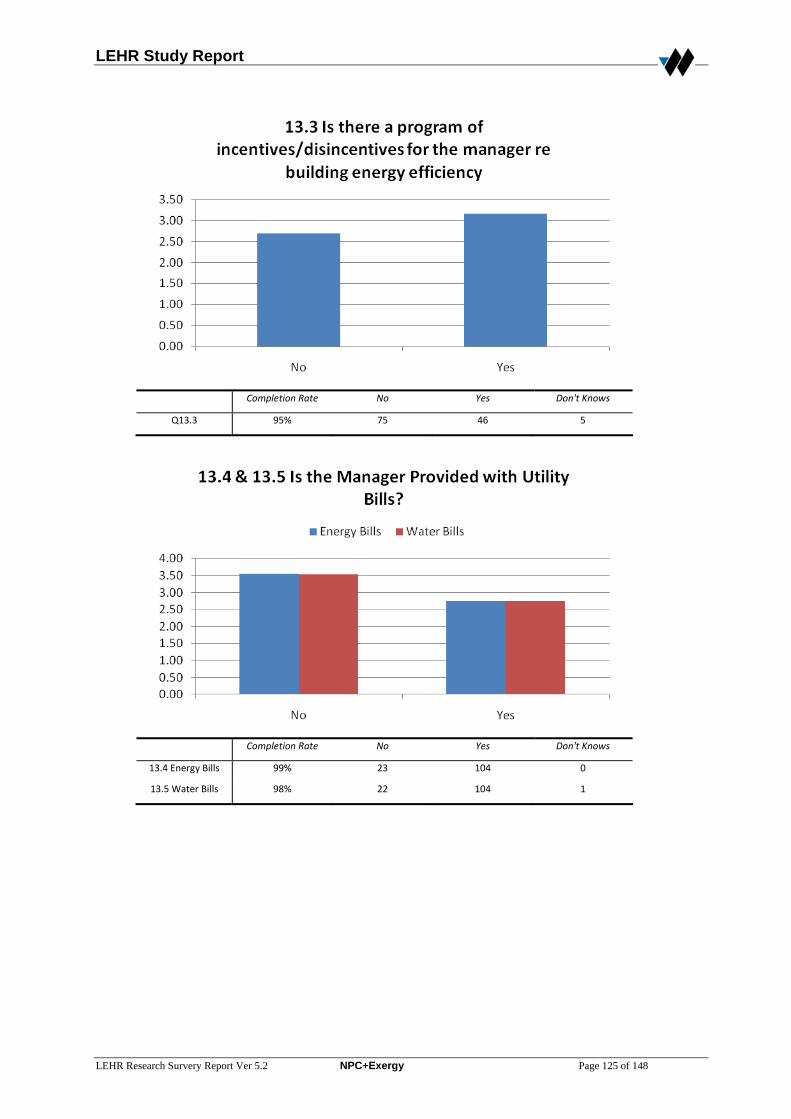
LEHR Study Report
LEHR Research Survery Report Ver 5.2 NPC+Exergy Page 125 of 148
Completion Rate No Yes Don't Knows
Q13.3 95% 75 46 5
Completion Rate No Yes Don't Knows
13.4 Energy Bills 99% 23 104 0
13.5 Water Bills 98% 22 104 1
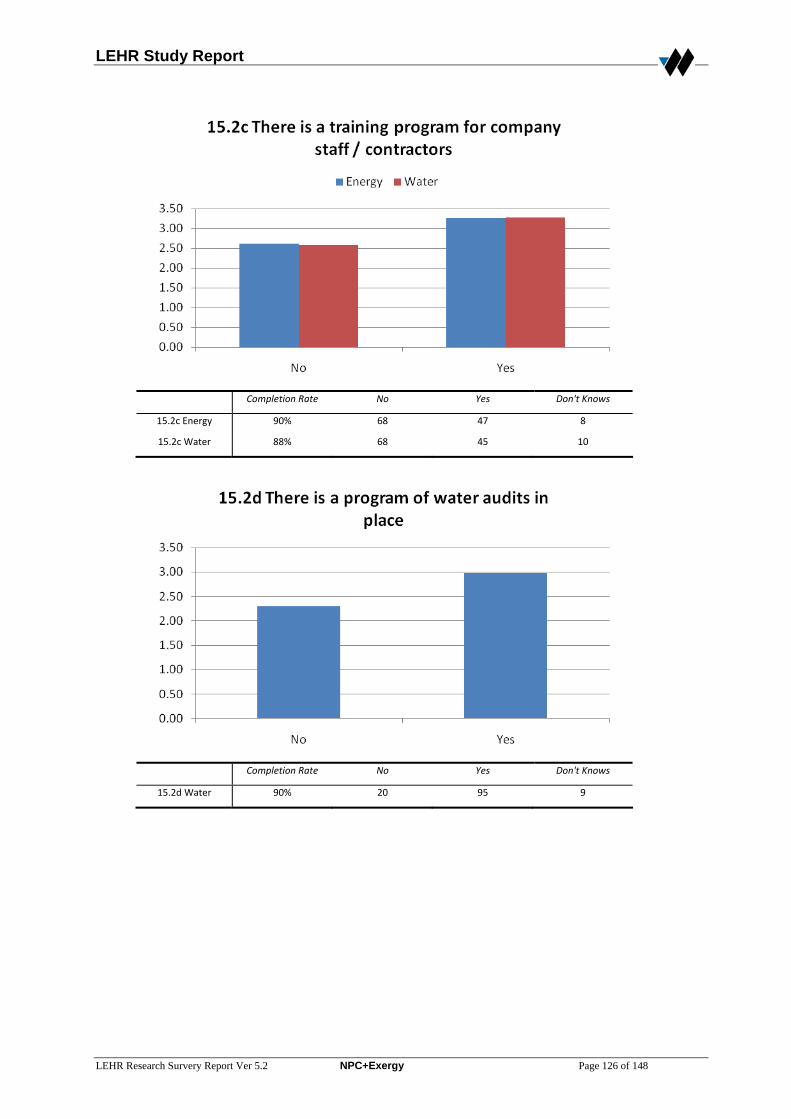
LEHR Study Report
LEHR Research Survery Report Ver 5.2 NPC+Exergy Page 126 of 148
Completion Rate No Yes Don't Knows
15.2c Energy 90% 68 47 8
15.2c Water 88% 68 45 10
Completion Rate No Yes Don't Knows
15.2d Water 90% 20 95 9

LEHR Study Report
LEHR Research Survery Report Ver 5.2 NPC+Exergy Page 127 of 148
Completion Rate No Yes Don't Knows
15.4a Water 97% 23 101 1
Completion Rate No Yes Don't Knows
15.4b Energy 95% 23 99 3
15.4b Water 95% 25 97 3
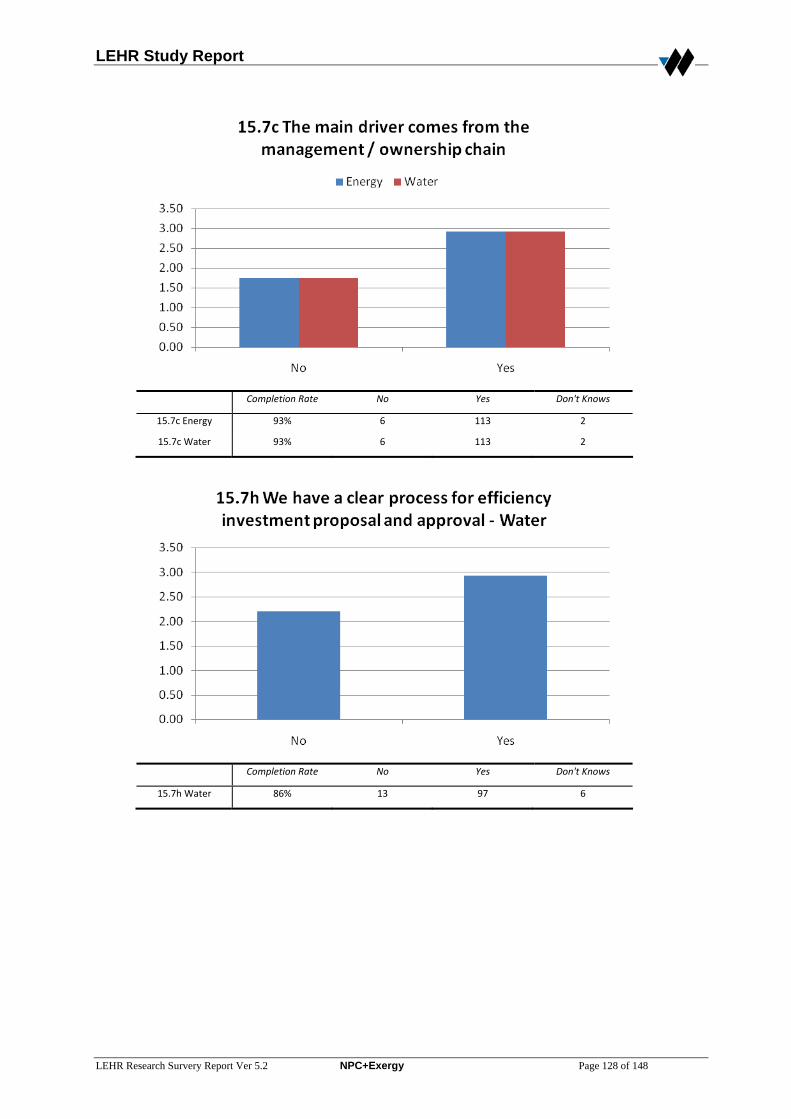
LEHR Study Report
LEHR Research Survery Report Ver 5.2 NPC+Exergy Page 128 of 148
Completion Rate No Yes Don't Knows
15.7c Energy 93% 6 113 2
15.7c Water 93% 6 113 2
Completion Rate No Yes Don't Knows
15.7h Water 86% 13 97 6
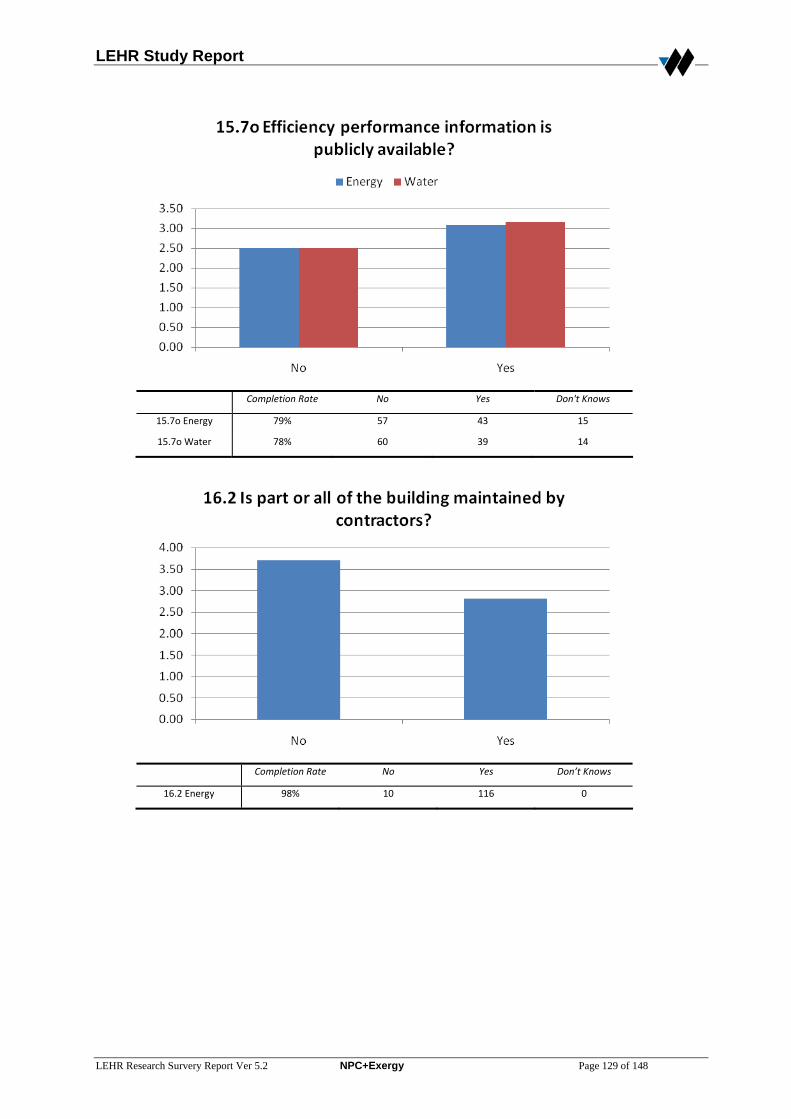
LEHR Study Report
LEHR Research Survery Report Ver 5.2 NPC+Exergy Page 129 of 148
Completion Rate No Yes Don't Knows
15.7o Energy 79% 57 43 15
15.7o Water 78% 60 39 14
Completion Rate No Yes Don’t Knows
16.2 Energy 98% 10 116 0

LEHR Study Report
LEHR Research Survery Report Ver 5.2 NPC+Exergy Page 130 of 148
Completion Rate No Yes Don’t Knows
4.2g Water 98% 24 30 11
APPENDIX D Aggregation Supplement
D.1 Aggregation Definitions Building Infrastructure Air v Water Cooled Base Building, Q7.1 Was the primary method of cooling air or water based? Building Technology Score Base Building, Q6.1, 6.2, 6.3, 7.1, 7.2, 7.3, 8.1, 8.4, 8.6, 8.9, 8.11, 9.3, 10.3 Designed to test the relationship between a building’s physical attributes and its energy performance, the aggregation includes components reflecting the lighting, chillers, HVAC configuration, glazing and controls of the building. Chiller Age Base Building, Q7.2, 7.3 Does the average age of the regularly operating chillers affect building performance? DX v Chiller Base Building, Q7.1 Is the primary cooling provided by a Chiller or DX based system? Economy Cycle (AC) Base Building, Q8.2, 8.7 Do the primary AC units typically have Economy Cycles? Electric Reheat (AC) Base Building, Q8.3, 8.8 Do the primary AC units typically have Electric Reheats in use? Floors Served by AC Units
LEHR Study Report
LEHR Research Survery Report Ver 5.2 NPC+Exergy Page 131 of 148
Base Building, Q8.5, 8.10 Are the AC Units typically setup to serve single or multiple floors? – Aggregation across the perimeter and internal zone questions. Hot Water Reheat (AC) Base Building, Q8.4, 8.9 Do the primary AC units typically have Hot Water Reheats in use? Improvement Measures Efficiency Improvement Activity Base Building, Q15.2b-d and Q15.4a-c Tests the level of activity directed towards energy efficiency improvements as measured by the Base Building survey questions. This aggregation takes into account training and monitoring activities as well as investment activity. Energy Investments Based Building, Q15.4a-c Tests the level of investment into improving the building’s Energy Efficiency. Manager Activity Manager, Q8.1-4 To what extent have changes directed at improving energy efficiency been made in the last 2 years? Water Improvements Base Building, Q12.1-10 Scores the number of water efficiency improvement measures which have been implemented. Water Investments Base Building, Q15.4a-c (Water) Tests the level of investment into improving the building’s Water Efficiency. – Based Building Management Attitude of Manager – Average Manager, Q7.1, 7.2, 7.6 This aggregate looks at the average response from all manager, averaged across the three questions. Attitude of Manager - Best Manager, Q7.1, 7.2, 7.6 This aggregate looks at the most positive response with regards to energy efficiency from any manager, averaged across all questions. Attitude of Manager - Worst Manager, Q7.1, 7.2, 7.6 This aggregate looks at the least positive response with regards to energy efficiency from any manager, averaged across all questions. Highest Qualifications Manager Q9.1 This aggregate combines the highest level of education responses from each of the managers, the highest qualifications score reflects the highest level of education achieved by any manager.
LEHR Study Report
LEHR Research Survery Report Ver 5.2 NPC+Exergy Page 132 of 148
Manager Accreditation Manager, Q9.8, 9.10 This aggregate tests the effect of having an accredited NABERS Office assessor or Green Star professional managing the building. Manager Confusion Manager, Q6.1-5, 7.1-3, 7.6, 9.3-6, 9.8, 9.10 This aggregate was directed at testing whether differences in attitudes and skills between the managers would affect the building performance. Manager Experience Manager, Q9.3 This score involved a simple rescaling of the Manager’s experience managing buildings, based on the non-linear growth of experience with time. The new scoring mechanism partitioned managers into the categories 0-2, 2-5, 5-10 and >10 years of experience. Manager’s Attitude towards Energy Efficiency Manager Q7.1-3 This aggregate is directed to the manager’s attitudes towards the viability and social responsibility motivations for energy efficiency. Manager’s Attitude towards Greenhouse Emissions Manager Q7.5, 7.6 This aggregate tests the manager’s attitude towards the problem of the greenhouse effect and the industries responsibility to reduce greenhouse gas emissions. Manager’s Authority over Energy Matters Manager, Q4.1-3 A direct average of the section 4 aggregated scores for each manager, the aggregate tests for the presence of a manager with direct responsibility for energy management issues. Manager’s Perceived Skills Manager, Q9.3-6 This aggregate tests the effect of the manager’s self evaluated experience with regards to energy efficiency, lighting and air conditioning. The effect of perceived skills as opposed to recognised skills (as measured by the Manager Accreditation aggregate) was a targeted comparison. Multiple Managers Manager, Q4.1-3 Designed to test whether it is better to have multiple managers or a single manager responsible for energy efficiency improvements, this aggregate provides a score reflecting the amount of duplication of authority with regards to energy efficiency. Skills and Resources Base Building, Q15.7e-g This aggregate measures the availability of the skills and resources required to identify, evaluate and implement energy efficiency improvement measures. Staff Maintained Base Building, Q16.1-2 This aggregate was designed to test for differences in building performance between buildings maintained by in-house staff and buildings maintained by contractors. Training Score
LEHR Study Report
LEHR Research Survery Report Ver 5.2 NPC+Exergy Page 133 of 148
Base Building, Q15.2c, Manager, Q9.11 This aggregate’s score represents the processes in place for building management to gain information regarding energy efficiency, either through the provision of a training program or access to the appropriate information. Monitoring BMS Energy Monitoring Base Building, Q10.4-5, 10.7 This aggregate provides a score for the level of monitoring of energy consumption available through the building’s BMS. BMS Water Monitoring Base Building, Q10.6-7 This aggregate provides a score for the level of monitoring of water consumption available through the building’s BMS. Monitoring and Targeting Base Building, Q10.4-5, 15.7s-t This aggregate scores the availability and degree of assessment of energy consumption data Tracking to Targets Base Building, 15.7q-s This aggregate tests for the presence of a target for energy efficiency. The aggregated variable is a Boolean with a score of 1 if any of the questions were answered with a Yes and 0 otherwise. Policy Base Building Policy Base Building, Q15.1, 15.2b-d, 15.7a,q,s Scores the building for the degree to which building energy efficiency policies have been developed and implemented. Financial Process Base Building, 15.7h-k Scores buildings according to the processes in place for accessing funds for energy efficiency improvement. The score also reflects incentives provided for identifying and implementing improvements. Maintenance Team Incentives Base Building, Q16.1a, 16.2a Are members of the maintenance team provided with incentives for improving energy efficiency? This score takes the answer from 16.1a or 16.2a (or both) depending who is involved in building operation (Questions 16.1 and 16.2) Maintenance Team Penalties Are members of the maintenance team penalised for failing to improve energy efficiency? This score takes the answers from 16.1a or 16.2a (or both) depending who is involved in building operation (Questions 16.1 and 16.2) Manager’s Financial Limits Manager, Q5.1-2 Scores the level to which managers can make and recommend building investments.

LEHR Study Report
LEHR Research Survery Report Ver 5.2 NPC+Exergy Page 134 of 148
Manager Incentives Manager, Q6.1-5 Measures the incentive structures in place to encourage managers to improve building energy efficiency. The scope of this aggregate covers the manager’s and company’s financial position, the manager’s ability to reinvest the savings made and the effect on the manager’s job as a whole. Tenants Green Lease Tenant, Q4.4b Are any tenants operating on a Green Lease? Gross v Net Lease Base Building, Q14.3a This aggregate classifies the tenancies’ lease agreements as either Gross or Net Leases according to the response to the question regarding how base building energy costs are handled. Multiple Tenants Base Building, Q14.1 This aggregate is a direct split into 1-5 or more than 5 office tenants. Performance in Tenant Agreements Tenant, Q4.4a,b,d,e This aggregate provides a score representing the degree to which the tenancy agreements include activities targeted at energy efficiency. The aggregate covers lease arrangements, reporting and meetings with tenants. Reporting to Tenants Base Building, Q15.7p,u This aggregate combines the questions regarding the energy efficiency performance and reporting requirements included in tenancy agreements. Tenant Activity Tenant, Q4.2a-h This aggregate combines the activities undertaken by the tenants which aimed at improving energy efficiency. The scope of the aggregate includes consideration in tenancy fitouts, energy audits, investments and staff training. Tenant Control Tenant, 4.4f,g This aggregate combines the responses for whether tenants have control over the efficiency and maintenance of landlord services. Aggregation results for testing effect on NABERS Offiice Energy rating Aggregation Confidence Magnitude Direction (Best)
Air v Water Cooled 21.6% 0.37 NA
Building Technology Score 99.5% 1.30 +
Chiller Age 42.7% 0.14 NA
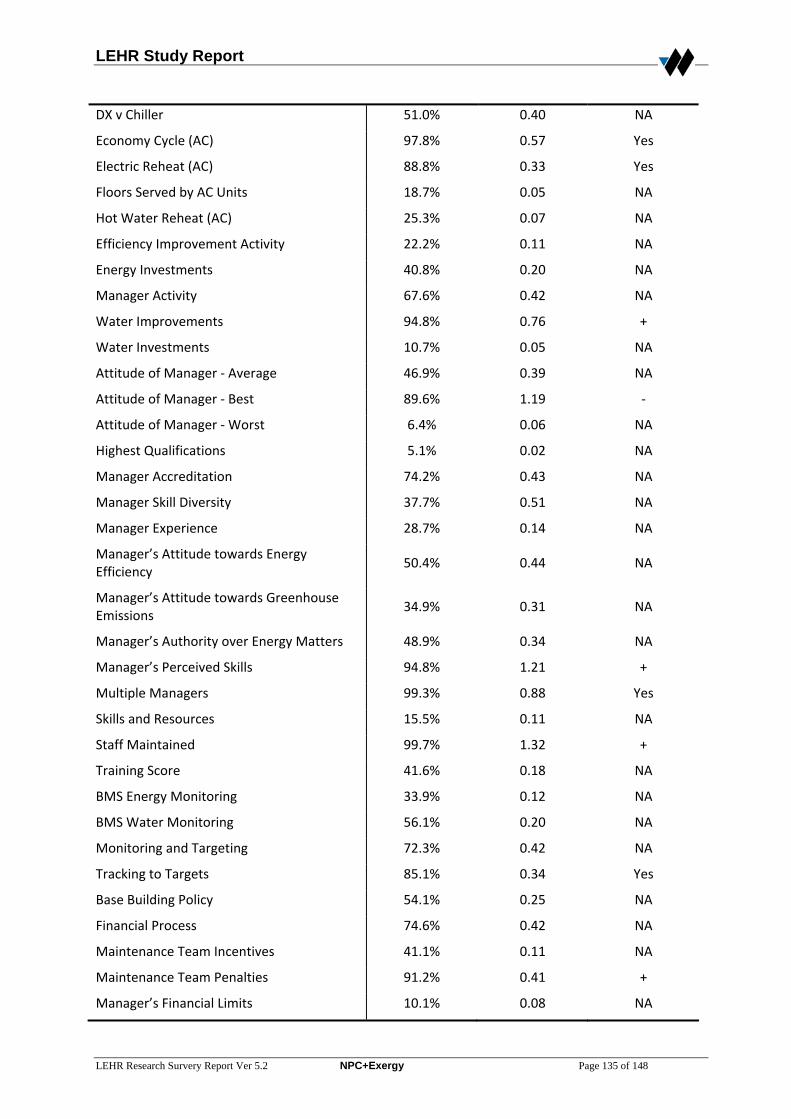
LEHR Study Report
LEHR Research Survery Report Ver 5.2 NPC+Exergy Page 135 of 148
DX v Chiller 51.0% 0.40 NA
Economy Cycle (AC) 97.8% 0.57 Yes
Electric Reheat (AC) 88.8% 0.33 Yes
Floors Served by AC Units 18.7% 0.05 NA
Hot Water Reheat (AC) 25.3% 0.07 NA
Efficiency Improvement Activity 22.2% 0.11 NA
Energy Investments 40.8% 0.20 NA
Manager Activity 67.6% 0.42 NA
Water Improvements 94.8% 0.76 +
Water Investments 10.7% 0.05 NA
Attitude of Manager ‐ Average 46.9% 0.39 NA
Attitude of Manager ‐ Best 89.6% 1.19 ‐
Attitude of Manager ‐ Worst 6.4% 0.06 NA
Highest Qualifications 5.1% 0.02 NA
Manager Accreditation 74.2% 0.43 NA
Manager Skill Diversity 37.7% 0.51 NA
Manager Experience 28.7% 0.14 NA
Manager’s Attitude towards Energy Efficiency
50.4% 0.44 NA
Manager’s Attitude towards Greenhouse Emissions
34.9% 0.31 NA
Manager’s Authority over Energy Matters 48.9% 0.34 NA
Manager’s Perceived Skills 94.8% 1.21 +
Multiple Managers 99.3% 0.88 Yes
Skills and Resources 15.5% 0.11 NA
Staff Maintained 99.7% 1.32 +
Training Score 41.6% 0.18 NA
BMS Energy Monitoring 33.9% 0.12 NA
BMS Water Monitoring 56.1% 0.20 NA
Monitoring and Targeting 72.3% 0.42 NA
Tracking to Targets 85.1% 0.34 Yes
Base Building Policy 54.1% 0.25 NA
Financial Process 74.6% 0.42 NA
Maintenance Team Incentives 41.1% 0.11 NA
Maintenance Team Penalties 91.2% 0.41 +
Manager’s Financial Limits 10.1% 0.08 NA
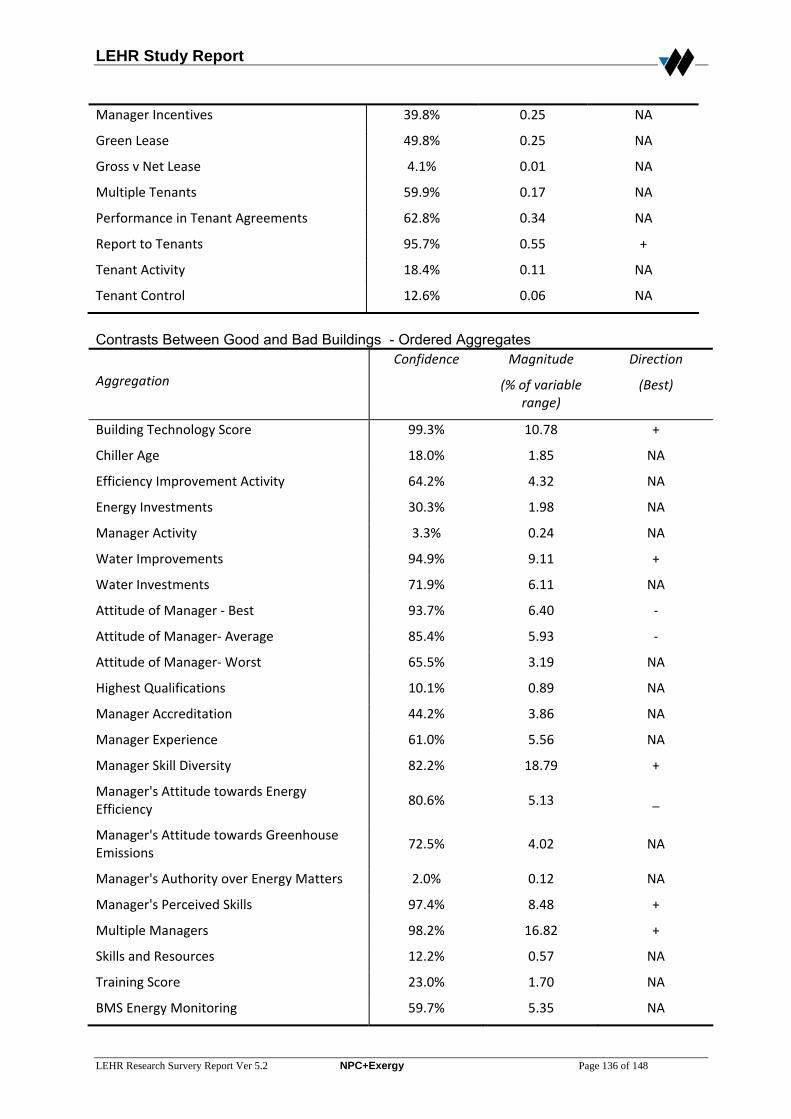
LEHR Study Report
LEHR Research Survery Report Ver 5.2 NPC+Exergy Page 136 of 148
Manager Incentives 39.8% 0.25 NA
Green Lease 49.8% 0.25 NA
Gross v Net Lease 4.1% 0.01 NA
Multiple Tenants 59.9% 0.17 NA
Performance in Tenant Agreements 62.8% 0.34 NA
Report to Tenants 95.7% 0.55 +
Tenant Activity 18.4% 0.11 NA
Tenant Control 12.6% 0.06 NA
Contrasts Between Good and Bad Buildings - Ordered Aggregates
Aggregation
Confidence Magnitude
(% of variable range)
Direction
(Best)
Building Technology Score 99.3% 10.78 +
Chiller Age 18.0% 1.85 NA
Efficiency Improvement Activity 64.2% 4.32 NA
Energy Investments 30.3% 1.98 NA
Manager Activity 3.3% 0.24 NA
Water Improvements 94.9% 9.11 +
Water Investments 71.9% 6.11 NA
Attitude of Manager ‐ Best 93.7% 6.40 ‐
Attitude of Manager‐ Average 85.4% 5.93 ‐
Attitude of Manager‐ Worst 65.5% 3.19 NA
Highest Qualifications 10.1% 0.89 NA
Manager Accreditation 44.2% 3.86 NA
Manager Experience 61.0% 5.56 NA
Manager Skill Diversity 82.2% 18.79 +
Manager's Attitude towards Energy Efficiency
80.6% 5.13 _
Manager's Attitude towards Greenhouse Emissions
72.5% 4.02 NA
Manager's Authority over Energy Matters 2.0% 0.12 NA
Manager's Perceived Skills 97.4% 8.48 +
Multiple Managers 98.2% 16.82 +
Skills and Resources 12.2% 0.57 NA
Training Score 23.0% 1.70 NA
BMS Energy Monitoring 59.7% 5.35 NA
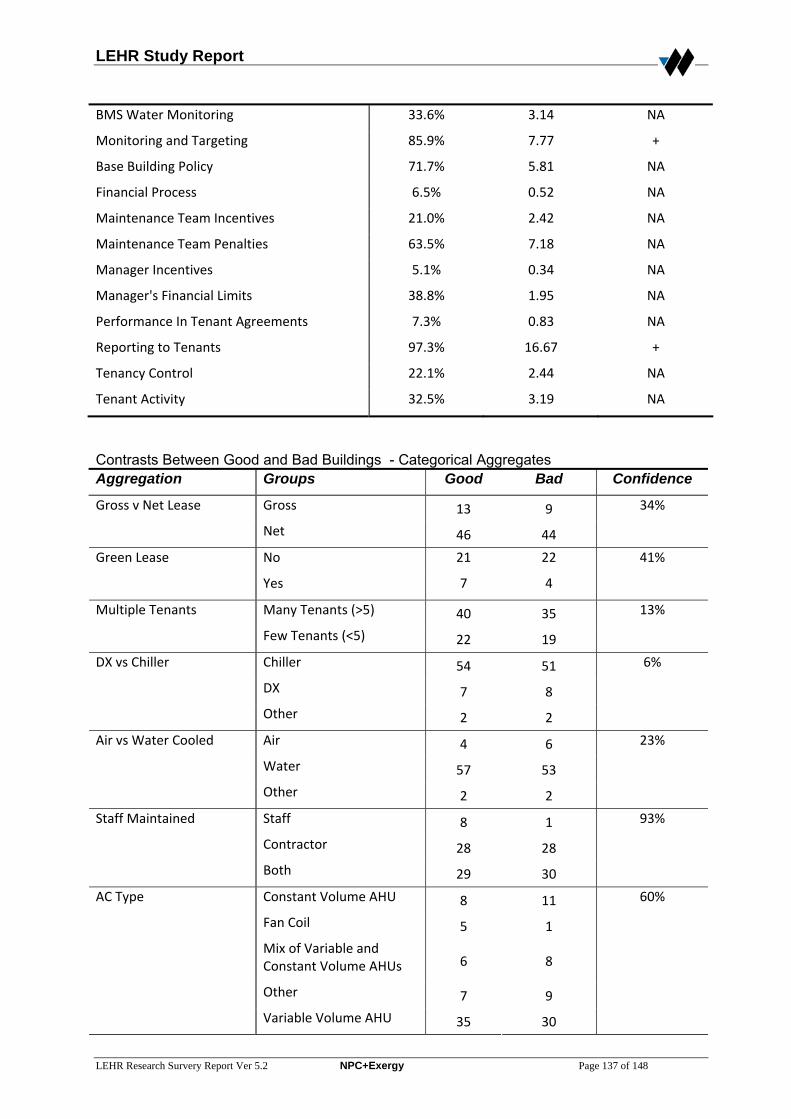
LEHR Study Report
LEHR Research Survery Report Ver 5.2 NPC+Exergy Page 137 of 148
BMS Water Monitoring 33.6% 3.14 NA
Monitoring and Targeting 85.9% 7.77 +
Base Building Policy 71.7% 5.81 NA
Financial Process 6.5% 0.52 NA
Maintenance Team Incentives 21.0% 2.42 NA
Maintenance Team Penalties 63.5% 7.18 NA
Manager Incentives 5.1% 0.34 NA
Manager's Financial Limits 38.8% 1.95 NA
Performance In Tenant Agreements 7.3% 0.83 NA
Reporting to Tenants 97.3% 16.67 +
Tenancy Control 22.1% 2.44 NA
Tenant Activity 32.5% 3.19 NA
Contrasts Between Good and Bad Buildings - Categorical Aggregates Aggregation Groups Good Bad Confidence
Gross 13 9 Gross v Net Lease
Net 46 44
34%
No 21 22 Green Lease
Yes 7 4
41%
Many Tenants (>5) 40 35 Multiple Tenants
Few Tenants (<5) 22 19
13%
Chiller 54 51
DX 7 8
DX vs Chiller
Other 2 2
6%
Air 4 6
Water 57 53
Air vs Water Cooled
Other 2 2
23%
Staff 8 1
Contractor 28 28
Staff Maintained
Both 29 30
93%
Constant Volume AHU 8 11
Fan Coil 5 1
Mix of Variable and Constant Volume AHUs 6 8
Other 7 9
AC Type
Variable Volume AHU 35 30
60%
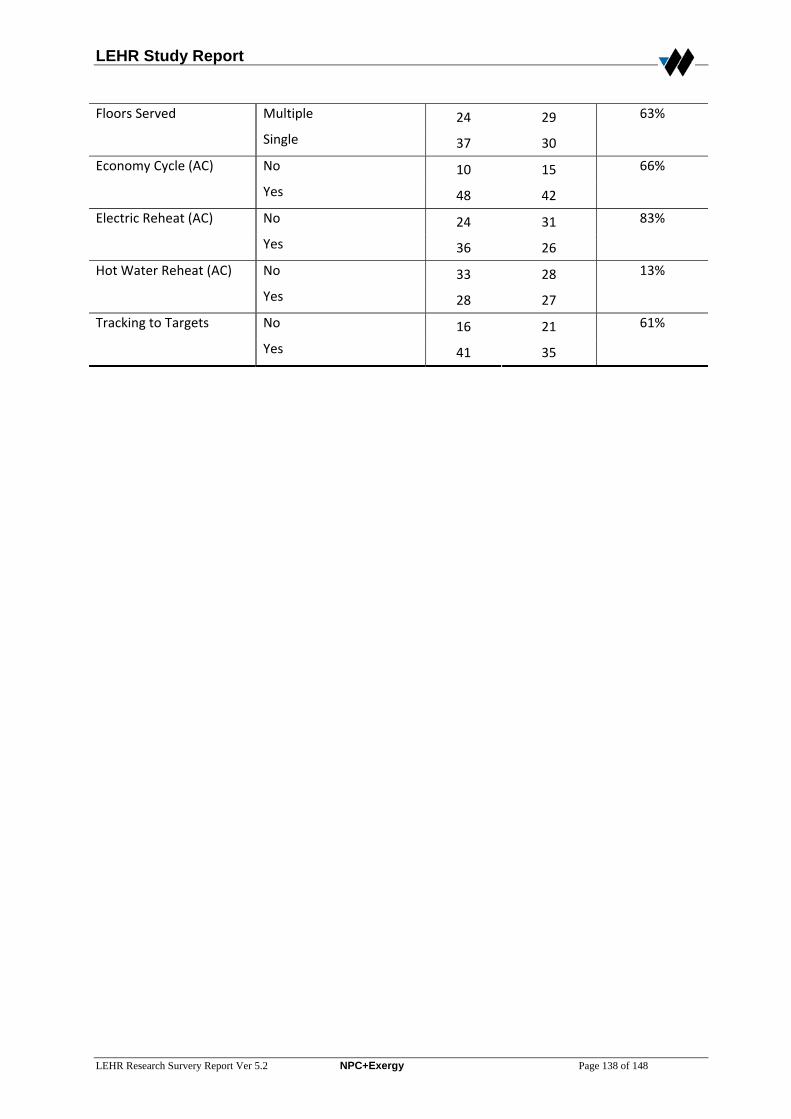
LEHR Study Report
LEHR Research Survery Report Ver 5.2 NPC+Exergy Page 138 of 148
Multiple 24 29 Floors Served
Single 37 30
63%
No 10 15 Economy Cycle (AC)
Yes 48 42
66%
No 24 31 Electric Reheat (AC)
Yes 36 26
83%
No 33 28 Hot Water Reheat (AC)
Yes 28 27
13%
No 16 21 Tracking to Targets
Yes 41 35
61%
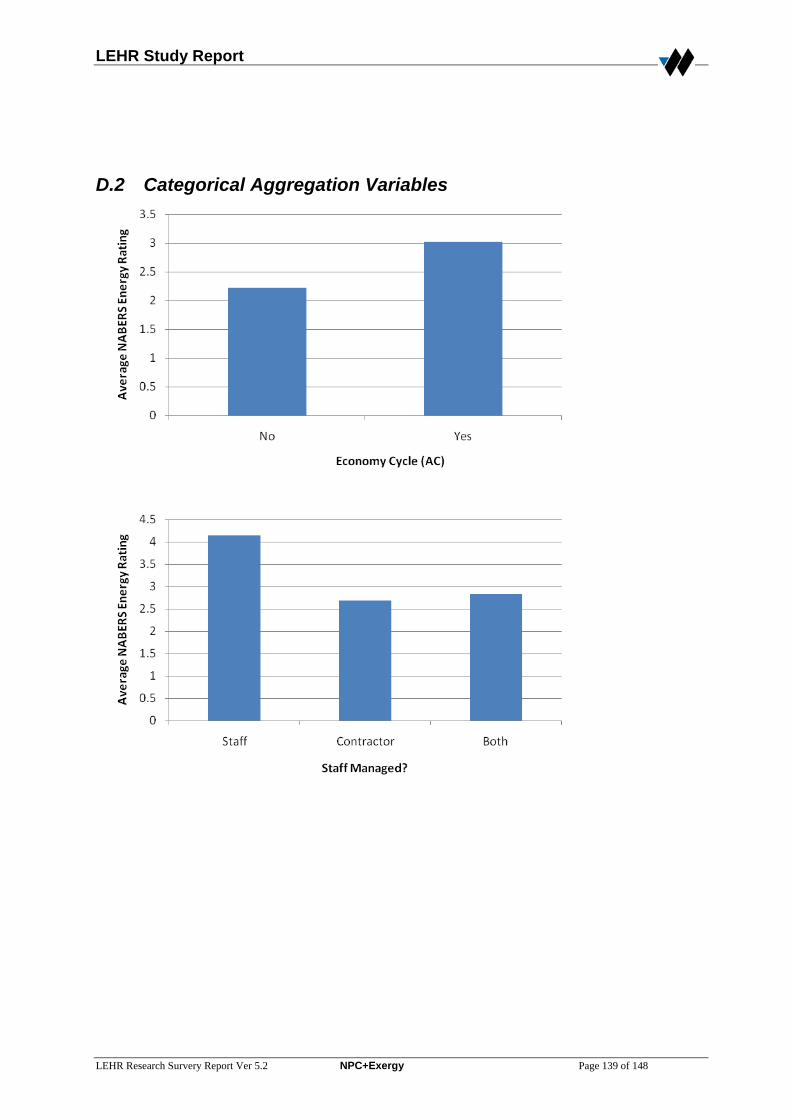
LEHR Study Report
LEHR Research Survery Report Ver 5.2 NPC+Exergy Page 139 of 148
D.2 Categorical Aggregation Variables

LEHR Study Report
LEHR Research Survery Report Ver 5.2 NPC+Exergy Page 140 of 148
LEHR Study Report
LEHR Research Survery Report Ver 5.2 NPC+Exergy Page 141 of 148
APPENDIX E Manager Comments Anything that currently encourages you to engage in energy efficiency improvement? ASSET MANAGERS
• A desire to do the right thing by the environment, for my children’s sake. • A focus within <owner company> from the top down • Budget allocation for specific Greenhouse projects and government requirements. • Company Policy and the rising cost of energy • Contributing to the environment and potentially the reduction in costs (in that order).
To have a well running building • <owner company> have a strong Sustainability Policy as does <agent>. • If it will reduce the workload • Improved pay back periods • My own concerns for the environment • Only personal interest at this stage. The industry is not forced to make this an issue • Personal commitment to challenge climate change to protect and develop future
generations environment • Personal drive to deliver higher efficiencies • Positioning of assets • Retain current and win new tenants via way of green leases backed up by building
ABGR/NABERS rating. • Team recognition. Owner satisfaction. Property performance. • Tenants • The engagement of the board of directors. This is seen as a core area not peripheral. • The incentive is that the impact of the works must be represented in the impact on the
ABGR for the building and the energy costs. • The marketing benefits in reducing outgoings costs for tenant occupants and the small
contribution to helping the environment.
BUILDING MANAGERS • A feeling that I am contributing in a small part to a sustainable future • Anything that reduces greenhouse gases, and improves our environment for the future
of our children • Awareness of the benefits through good communication, training, etc. • Climate warming - sustainability of resources. Social responsibility. Costs of energies
(energy) or (sic) therefore property operational costs have to be rationalised to retain a commercial edge retaining client/tenant satisfaction.
• Company policy to reduce CO2 emissions and individual KPI's and my general care for operational efficiency and the environment.
• Engaging in energy efficiency improvement is part of our KPI and attaining set targets will be rewarded; it's rewarding to contribute in reducing greenhouse gas emission which is the main contributor in global warming
• I have been trained in energy and plant management and practised in the field for many years. I always find it challenging and rewarding.
• Improve ABGR, minimise Greenhouse gas emissions • Increasingly, demand from tenants and owners is that buildings should be managed in
an environmentally responsible manner. • It gives me piece of mind, knowing that I have done as much as I can to reduce energy
consumption and increase efficiency without detrimental impact or reduced comfort for occupants of the premises.

LEHR Study Report
LEHR Research Survery Report Ver 5.2 NPC+Exergy Page 142 of 148
• It’s the right thing to do • Management are always willing to support energy efficiency improvements which are
cost efficient • My employer and building owners actively encourages participation in all sustainability
projects • Personal responsibility felt to start changing the way we consume • Personal understanding and benefit • Professional Recognition • Reduce running costs of building, increase ABGR, make building more efficient • Reduced building OPEX and maintaining and improving ABGR. • Rising costs of Water & Electricity usage • The achievement and ongoing maintenance of a 4.5 star ABGR rating. Owner and
management company policies. Market expectations. Corporate image. • The cost savings for the company and environmental benefits • The drive from the building owners to improve the buildings ABGR rating. • The satisfaction of getting where the building ought to be as well as helping the
environment.
PORTFOLIO MANAGERS • A sense of personal wellbeing and achievement • Acceptance and support from other staff • Company global policy • My own concern for the environment • Personal want, environmental benefit, use of new technologies, financial benefit • Reducing building outgoings & attracting tenants to vacancies • <Owner company> policies, growing personal knowledge and fundamental property
investment management • Targets that have been set for the short medium and long term
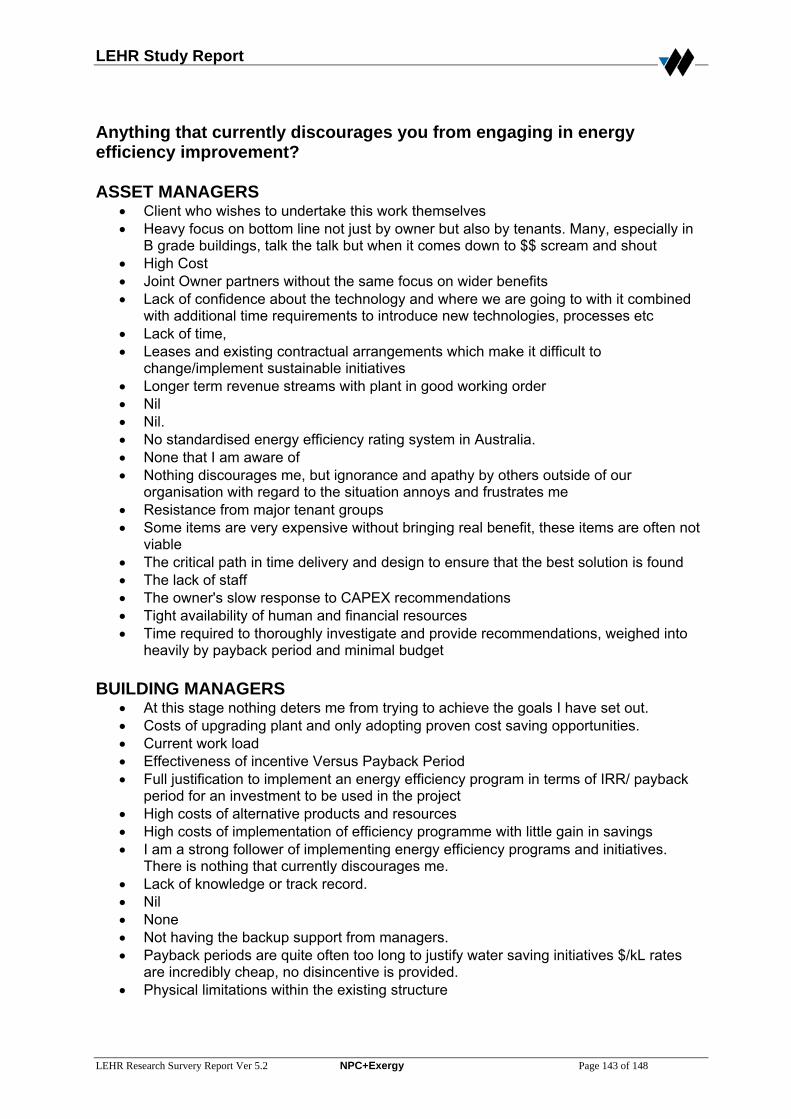
LEHR Study Report
LEHR Research Survery Report Ver 5.2 NPC+Exergy Page 143 of 148
Anything that currently discourages you from engaging in energy efficiency improvement? ASSET MANAGERS
• Client who wishes to undertake this work themselves • Heavy focus on bottom line not just by owner but also by tenants. Many, especially in
B grade buildings, talk the talk but when it comes down to $$ scream and shout • High Cost • Joint Owner partners without the same focus on wider benefits • Lack of confidence about the technology and where we are going to with it combined
with additional time requirements to introduce new technologies, processes etc • Lack of time, • Leases and existing contractual arrangements which make it difficult to
change/implement sustainable initiatives • Longer term revenue streams with plant in good working order • Nil • Nil. • No standardised energy efficiency rating system in Australia. • None that I am aware of • Nothing discourages me, but ignorance and apathy by others outside of our
organisation with regard to the situation annoys and frustrates me • Resistance from major tenant groups • Some items are very expensive without bringing real benefit, these items are often not
viable • The critical path in time delivery and design to ensure that the best solution is found • The lack of staff • The owner's slow response to CAPEX recommendations • Tight availability of human and financial resources • Time required to thoroughly investigate and provide recommendations, weighed into
heavily by payback period and minimal budget BUILDING MANAGERS
• At this stage nothing deters me from trying to achieve the goals I have set out. • Costs of upgrading plant and only adopting proven cost saving opportunities. • Current work load • Effectiveness of incentive Versus Payback Period • Full justification to implement an energy efficiency program in terms of IRR/ payback
period for an investment to be used in the project • High costs of alternative products and resources • High costs of implementation of efficiency programme with little gain in savings • I am a strong follower of implementing energy efficiency programs and initiatives.
There is nothing that currently discourages me. • Lack of knowledge or track record. • Nil • None • Not having the backup support from managers. • Payback periods are quite often too long to justify water saving initiatives $/kL rates
are incredibly cheap, no disincentive is provided. • Physical limitations within the existing structure
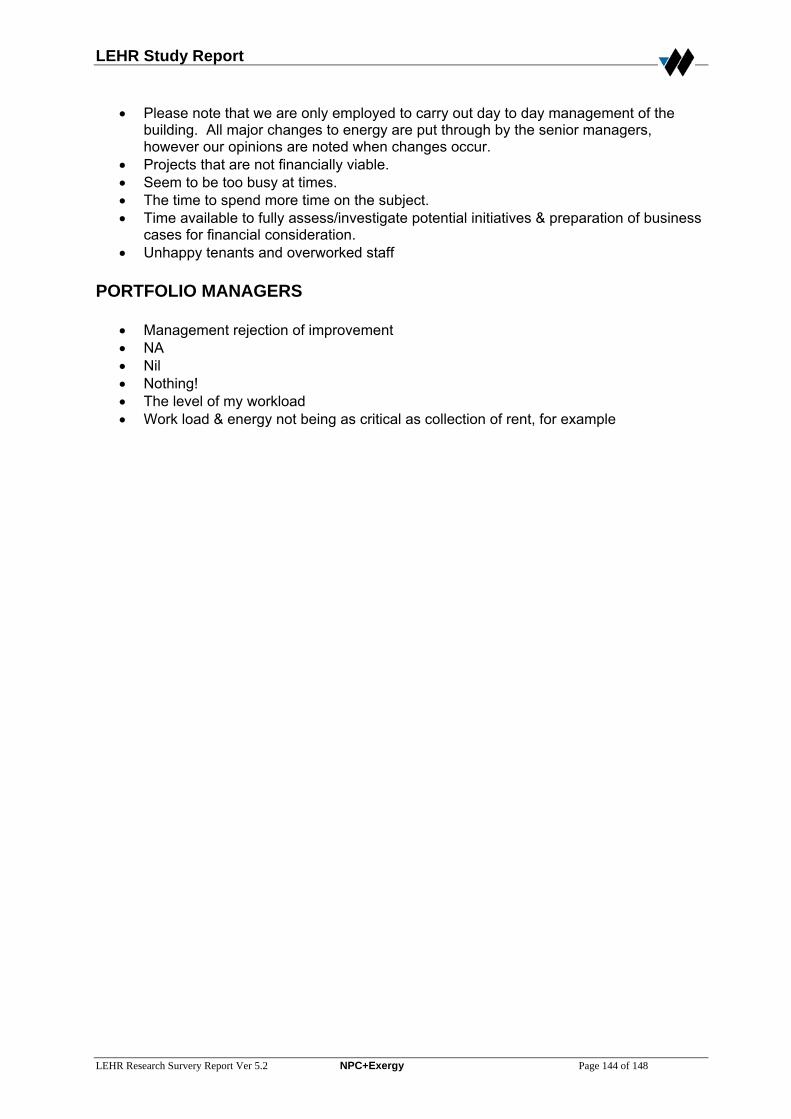
LEHR Study Report
LEHR Research Survery Report Ver 5.2 NPC+Exergy Page 144 of 148
• Please note that we are only employed to carry out day to day management of the building. All major changes to energy are put through by the senior managers, however our opinions are noted when changes occur.
• Projects that are not financially viable. • Seem to be too busy at times. • The time to spend more time on the subject. • Time available to fully assess/investigate potential initiatives & preparation of business
cases for financial consideration. • Unhappy tenants and overworked staff
PORTFOLIO MANAGERS
• Management rejection of improvement • NA • Nil • Nothing! • The level of my workload • Work load & energy not being as critical as collection of rent, for example
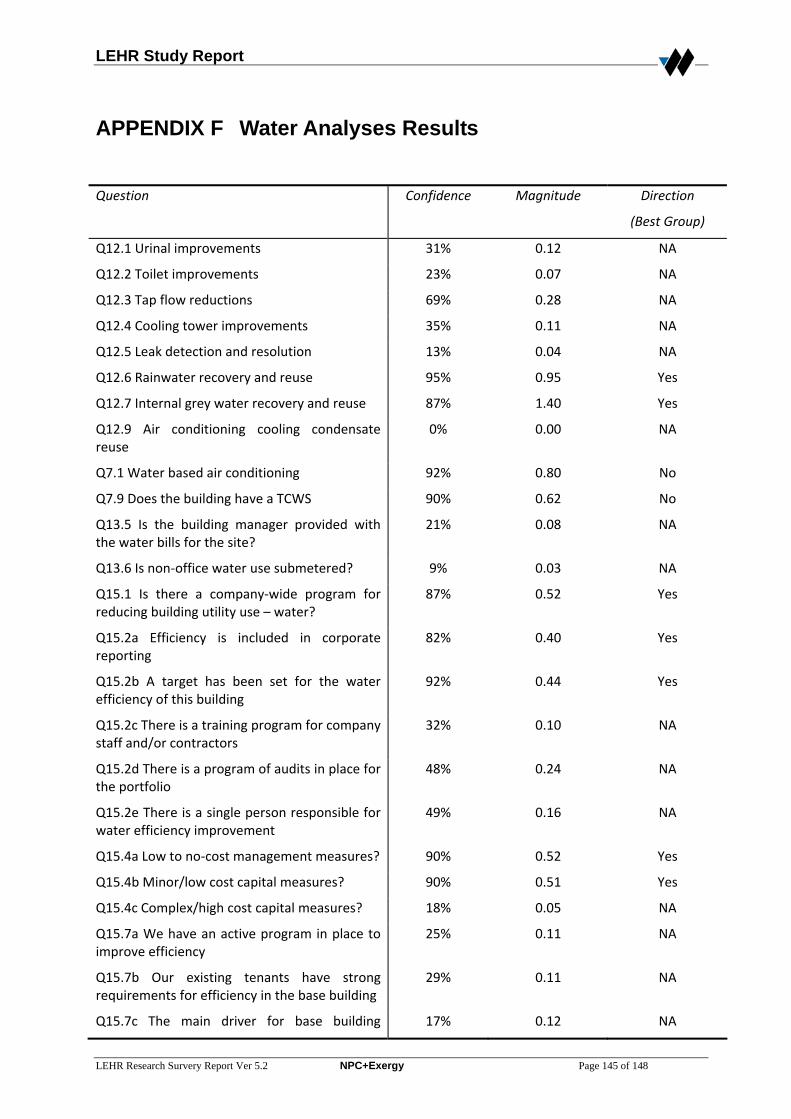
LEHR Study Report
LEHR Research Survery Report Ver 5.2 NPC+Exergy Page 145 of 148
APPENDIX F Water Analyses Results
Question Confidence Magnitude Direction
(Best Group)
Q12.1 Urinal improvements 31% 0.12 NA
Q12.2 Toilet improvements 23% 0.07 NA
Q12.3 Tap flow reductions 69% 0.28 NA
Q12.4 Cooling tower improvements 35% 0.11 NA
Q12.5 Leak detection and resolution 13% 0.04 NA
Q12.6 Rainwater recovery and reuse 95% 0.95 Yes
Q12.7 Internal grey water recovery and reuse 87% 1.40 Yes
Q12.9 Air conditioning cooling condensate reuse
0% 0.00 NA
Q7.1 Water based air conditioning 92% 0.80 No
Q7.9 Does the building have a TCWS 90% 0.62 No
Q13.5 Is the building manager provided with the water bills for the site?
21% 0.08 NA
Q13.6 Is non‐office water use submetered? 9% 0.03 NA
Q15.1 Is there a company‐wide program for reducing building utility use – water?
87% 0.52 Yes
Q15.2a Efficiency is included in corporate reporting
82% 0.40 Yes
Q15.2b A target has been set for the water efficiency of this building
92% 0.44 Yes
Q15.2c There is a training program for company staff and/or contractors
32% 0.10 NA
Q15.2d There is a program of audits in place for the portfolio
48% 0.24 NA
Q15.2e There is a single person responsible for water efficiency improvement
49% 0.16 NA
Q15.4a Low to no‐cost management measures? 90% 0.52 Yes
Q15.4b Minor/low cost capital measures? 90% 0.51 Yes
Q15.4c Complex/high cost capital measures? 18% 0.05 NA
Q15.7a We have an active program in place to improve efficiency
25% 0.11 NA
Q15.7b Our existing tenants have strong requirements for efficiency in the base building
29% 0.11 NA
Q15.7c The main driver for base building 17% 0.12 NA
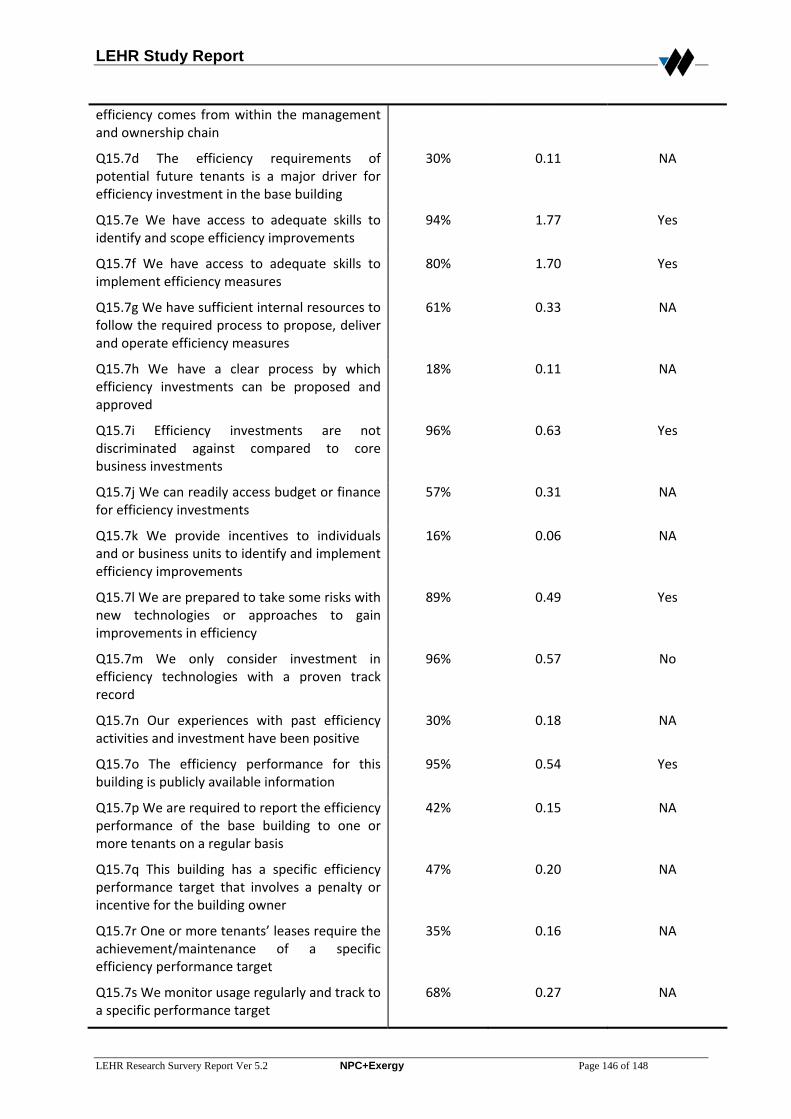
LEHR Study Report
LEHR Research Survery Report Ver 5.2 NPC+Exergy Page 146 of 148
efficiency comes from within the management and ownership chain
Q15.7d The efficiency requirements of potential future tenants is a major driver for efficiency investment in the base building
30% 0.11 NA
Q15.7e We have access to adequate skills to identify and scope efficiency improvements
94% 1.77 Yes
Q15.7f We have access to adequate skills to implement efficiency measures
80% 1.70 Yes
Q15.7g We have sufficient internal resources to follow the required process to propose, deliver and operate efficiency measures
61% 0.33 NA
Q15.7h We have a clear process by which efficiency investments can be proposed and approved
18% 0.11 NA
Q15.7i Efficiency investments are not discriminated against compared to core business investments
96% 0.63 Yes
Q15.7j We can readily access budget or finance for efficiency investments
57% 0.31 NA
Q15.7k We provide incentives to individuals and or business units to identify and implement efficiency improvements
16% 0.06 NA
Q15.7l We are prepared to take some risks with new technologies or approaches to gain improvements in efficiency
89% 0.49 Yes
Q15.7m We only consider investment in efficiency technologies with a proven track record
96% 0.57 No
Q15.7n Our experiences with past efficiency activities and investment have been positive
30% 0.18 NA
Q15.7o The efficiency performance for this building is publicly available information
95% 0.54 Yes
Q15.7p We are required to report the efficiency performance of the base building to one or more tenants on a regular basis
42% 0.15 NA
Q15.7q This building has a specific efficiency performance target that involves a penalty or incentive for the building owner
47% 0.20 NA
Q15.7r One or more tenants’ leases require the achievement/maintenance of a specific efficiency performance target
35% 0.16 NA
Q15.7s We monitor usage regularly and track to a specific performance target
68% 0.27 NA
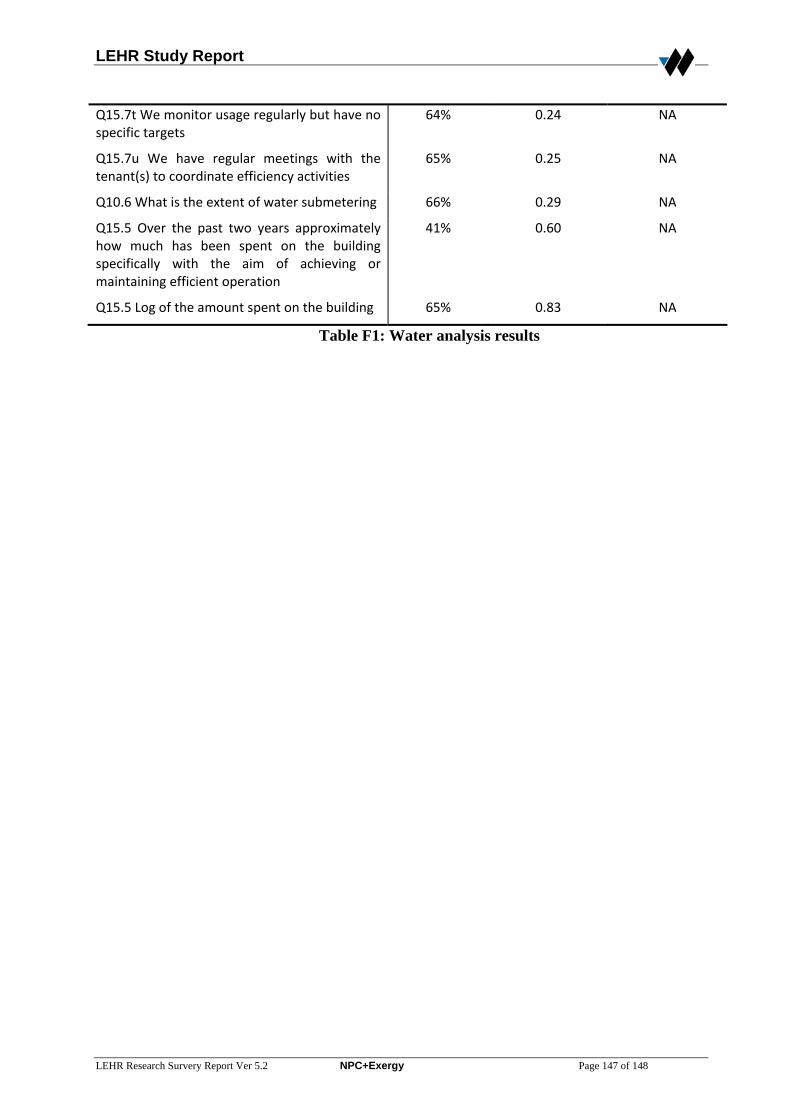
LEHR Study Report
LEHR Research Survery Report Ver 5.2 NPC+Exergy Page 147 of 148
Q15.7t We monitor usage regularly but have no specific targets
64% 0.24 NA
Q15.7u We have regular meetings with the tenant(s) to coordinate efficiency activities
65% 0.25 NA
Q10.6 What is the extent of water submetering 66% 0.29 NA
Q15.5 Over the past two years approximately how much has been spent on the building specifically with the aim of achieving or maintaining efficient operation
41% 0.60 NA
Q15.5 Log of the amount spent on the building 65% 0.83 NA
Table F1: Water analysis results
LEHR Study Report
LEHR Research Survery Report Ver 5.2 NPC+Exergy Page 148 of 148
APPENDIX G Survey Questions
LOW ENERGY HIGH RISE BUILDING RESEARCH STUDY Research Survey Questionnaire
National Project Consultants Pty Ltd Level 4, 10 Clarke Street Crows Nest PO Box 1060 Crows Nest NSW 1585 T: +61 2 9906 8611 F: +61 2 9906 7318 www.npc.com.au
npc
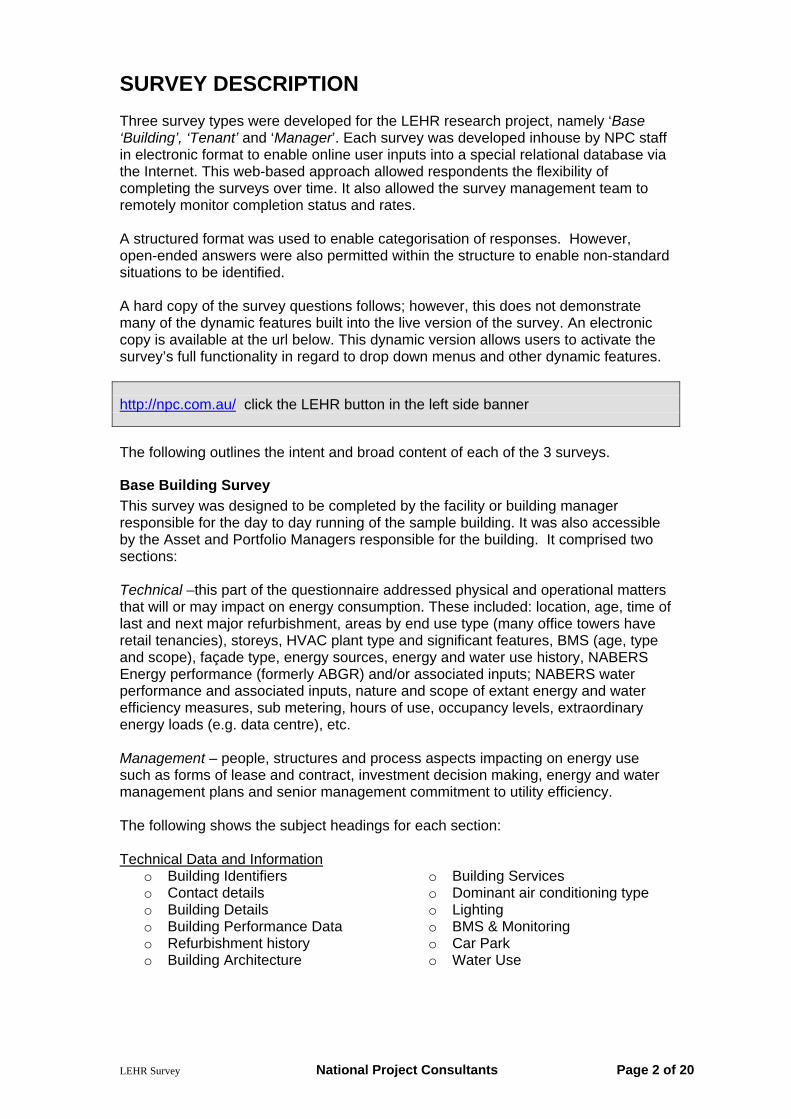
LEHR Survey National Project Consultants Page 2 of 20
SURVEY DESCRIPTION Three survey types were developed for the LEHR research project, namely ‘Base ‘Building’, ‘Tenant’ and ‘Manager’. Each survey was developed inhouse by NPC staff in electronic format to enable online user inputs into a special relational database via the Internet. This web-based approach allowed respondents the flexibility of completing the surveys over time. It also allowed the survey management team to remotely monitor completion status and rates. A structured format was used to enable categorisation of responses. However, open-ended answers were also permitted within the structure to enable non-standard situations to be identified. A hard copy of the survey questions follows; however, this does not demonstrate many of the dynamic features built into the live version of the survey. An electronic copy is available at the url below. This dynamic version allows users to activate the survey’s full functionality in regard to drop down menus and other dynamic features. http://npc.com.au/ click the LEHR button in the left side banner
The following outlines the intent and broad content of each of the 3 surveys.
Base Building Survey This survey was designed to be completed by the facility or building manager responsible for the day to day running of the sample building. It was also accessible by the Asset and Portfolio Managers responsible for the building. It comprised two sections: Technical –this part of the questionnaire addressed physical and operational matters that will or may impact on energy consumption. These included: location, age, time of last and next major refurbishment, areas by end use type (many office towers have retail tenancies), storeys, HVAC plant type and significant features, BMS (age, type and scope), façade type, energy sources, energy and water use history, NABERS Energy performance (formerly ABGR) and/or associated inputs; NABERS water performance and associated inputs, nature and scope of extant energy and water efficiency measures, sub metering, hours of use, occupancy levels, extraordinary energy loads (e.g. data centre), etc. Management – people, structures and process aspects impacting on energy use such as forms of lease and contract, investment decision making, energy and water management plans and senior management commitment to utility efficiency.
The following shows the subject headings for each section: Technical Data and Information
o Building Identifiers o Contact details o Building Details o Building Performance Data o Refurbishment history o Building Architecture
o Building Services o Dominant air conditioning type o Lighting o BMS & Monitoring o Car Park o Water Use
LEHR Survey National Project Consultants Page 3 of 20
Management Practices
o Building Operation o Leasing Details o Energy Management o Maintenance
Tenancy Survey This questionnaire was completed by one tenant occupying a significant floor area in each sample building selected for a base Building Survey. This confidential questionnaire was kept brief and simple both because tenant organisations generally do not have access to energy technical resources in-house and because of the lower impact tenants have on the energy efficiency of building services. Few technical questions were asked (eg NLA, lease expiry date, lease form), the main focus was on human aspects (attitudes, behaviour, knowledge) and management practices. As with the Base Building survey, a structured format was used to enable categorisation of responses, with some open-ended answers also permitted.
Management Survey This survey, which was confidential to each respondent, was designed for completion by potentially 3 people per sample building: Building Manager, Asset Manager and Portfolio Manager reflecting the three levels of a typical property section of a fund manager. Some of the smaller portfolios and of course the single buildings had much flatter management structures so only 1 or 2 surveys needed to be completed for such buildings. The same survey was used for each manager category and comprised quite an extensive range of non technical questions categorised as follows:
o Level of Authority o Authority over energy matters o Responsibility Limits o Incentives o Attitude o Response Activities o Knowledge o Barriers & Incentives

LEHR Survey National Project Consultants Page 4 of 20
Base Building Survey Technical Data and Information 1. Building Identifiers
Building Name
Street Address
Suburb
State/Territory --
Postcode
Owner Name
Owner Contact Tel #
2. Contact details for the person tasked with managing completion of this questionnaire
Name
Position
Organisation
Phone
Person based on-site? --
3. Building Details
1. Year Built
2. NLA Office (m2)
3.NLA Non Office (m2)
4.Main Non Office Use
--
5. # of Storeys Office
6. PCA Grade --
7. Is this PCA Grade compliant with the latest 2007 PCA rules?
--
8. Majority owner occupied?
--
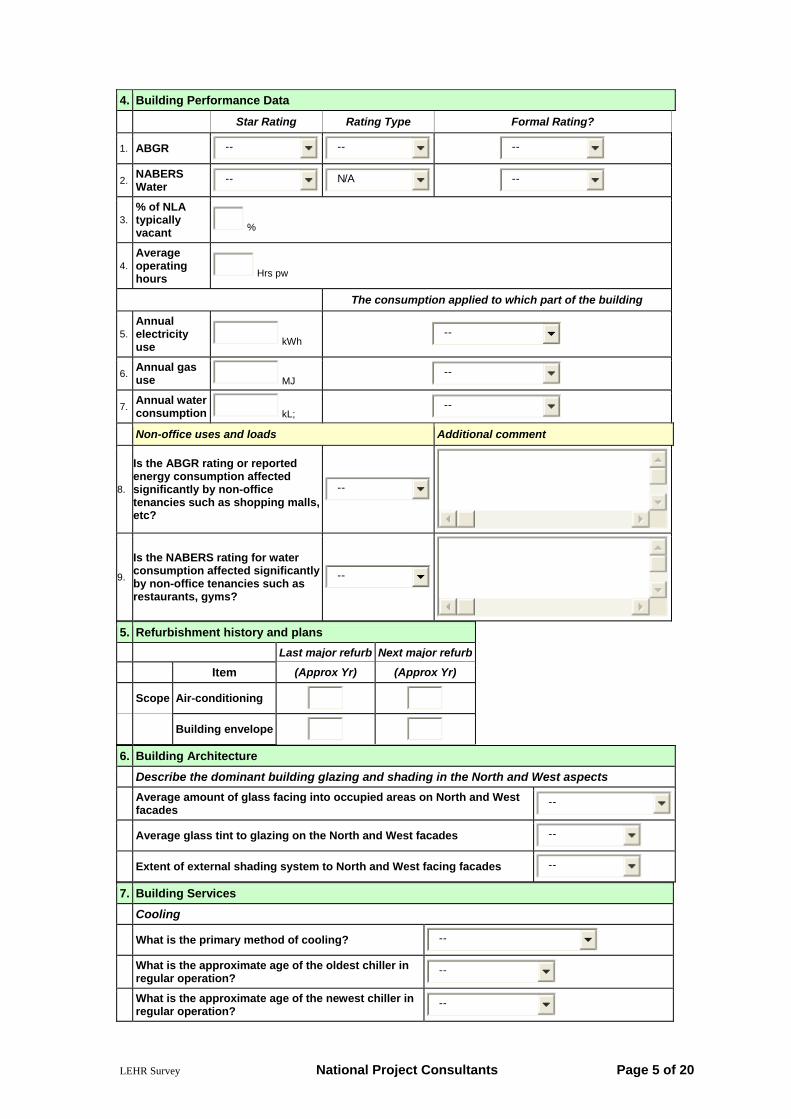
LEHR Survey National Project Consultants Page 5 of 20
4. Building Performance Data
Star Rating Rating Type Formal Rating?
1. ABGR --
-- --
2. NABERS Water
--
N/A --
3. % of NLA typically vacant %
4. Average operating hours Hrs pw
The consumption applied to which part of the building
5. Annual electricity use kWh
--
6. Annual gas use MJ
--
7. Annual water consumption kL;
--
Non-office uses and loads Additional comment
8.
Is the ABGR rating or reported energy consumption affected significantly by non-office tenancies such as shopping malls, etc?
--
9.
Is the NABERS rating for water consumption affected significantly by non-office tenancies such as restaurants, gyms?
--
5. Refurbishment history and plans Last major refurb Next major refurb Item (Approx Yr) (Approx Yr)
Scope Air-conditioning
Building envelope
6. Building Architecture Describe the dominant building glazing and shading in the North and West aspects
Average amount of glass facing into occupied areas on North and West facades
--
Average glass tint to glazing on the North and West facades --
Extent of external shading system to North and West facing facades --
7. Building Services Cooling
What is the primary method of cooling? --
What is the approximate age of the oldest chiller in regular operation?
--
What is the approximate age of the newest chiller in regular operation?
--
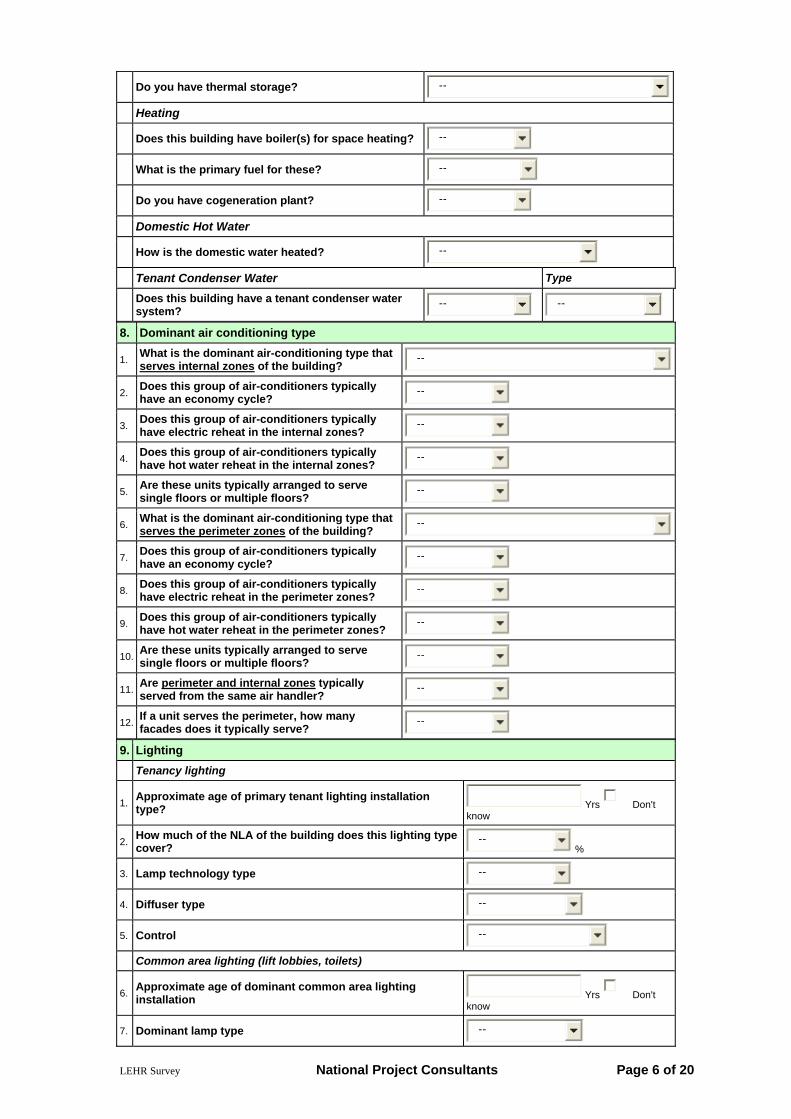
LEHR Survey National Project Consultants Page 6 of 20
Do you have thermal storage? --
Heating
Does this building have boiler(s) for space heating? --
What is the primary fuel for these? --
Do you have cogeneration plant? --
Domestic Hot Water
How is the domestic water heated? --
Tenant Condenser Water Type
Does this building have a tenant condenser water system?
--
--
8. Dominant air conditioning type
1. What is the dominant air-conditioning type that serves internal zones of the building?
--
2. Does this group of air-conditioners typically have an economy cycle?
--
3. Does this group of air-conditioners typically have electric reheat in the internal zones?
--
4. Does this group of air-conditioners typically have hot water reheat in the internal zones?
--
5. Are these units typically arranged to serve single floors or multiple floors?
--
6. What is the dominant air-conditioning type that serves the perimeter zones of the building?
--
7. Does this group of air-conditioners typically have an economy cycle?
--
8. Does this group of air-conditioners typically have electric reheat in the perimeter zones?
--
9. Does this group of air-conditioners typically have hot water reheat in the perimeter zones?
--
10. Are these units typically arranged to serve single floors or multiple floors?
--
11. Are perimeter and internal zones typically served from the same air handler?
--
12. If a unit serves the perimeter, how many facades does it typically serve?
--
9. Lighting Tenancy lighting
1. Approximate age of primary tenant lighting installation type? Yrs Don't
know
2. How much of the NLA of the building does this lighting type cover?
-- %
3. Lamp technology type --
4. Diffuser type --
5. Control --
Common area lighting (lift lobbies, toilets)
6. Approximate age of dominant common area lighting installation Yrs Don't
know
7. Dominant lamp type --
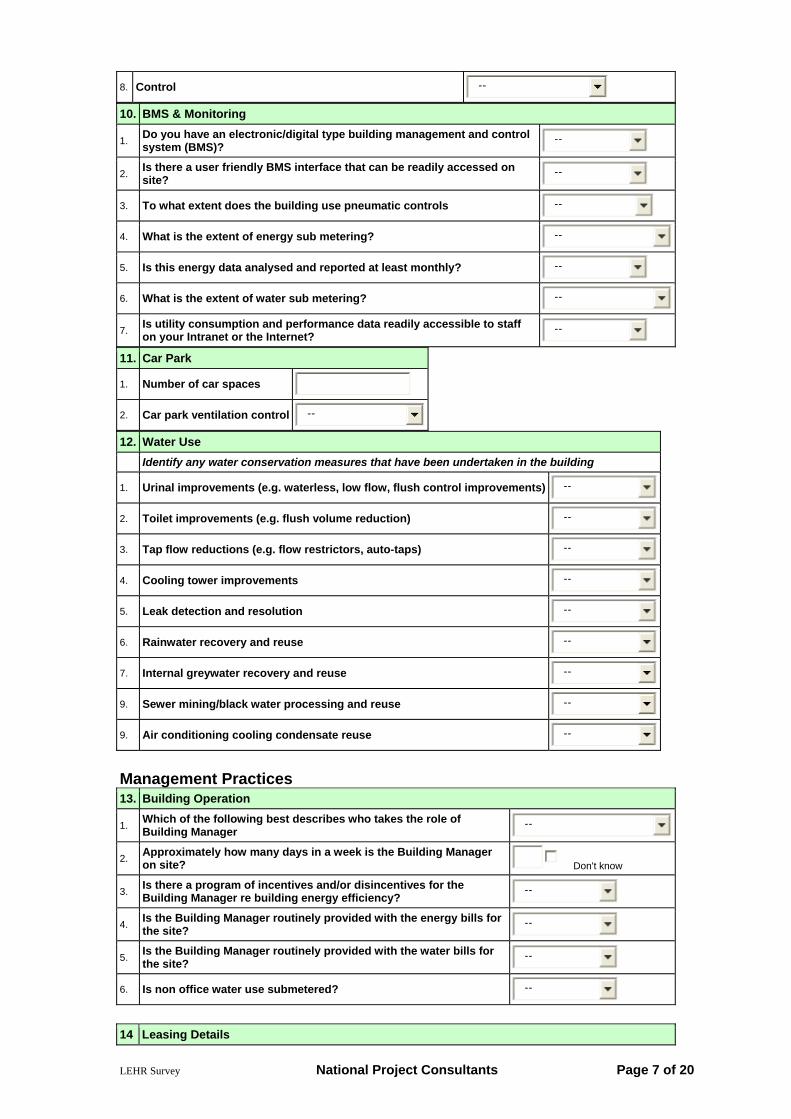
LEHR Survey National Project Consultants Page 7 of 20
8. Control --
10. BMS & Monitoring
1. Do you have an electronic/digital type building management and control system (BMS)?
--
2. Is there a user friendly BMS interface that can be readily accessed on site?
--
3. To what extent does the building use pneumatic controls --
4. What is the extent of energy sub metering? --
5. Is this energy data analysed and reported at least monthly? --
6. What is the extent of water sub metering? --
7. Is utility consumption and performance data readily accessible to staff on your Intranet or the Internet?
--
11. Car Park
1. Number of car spaces
2. Car park ventilation control --
12. Water Use Identify any water conservation measures that have been undertaken in the building
1. Urinal improvements (e.g. waterless, low flow, flush control improvements) --
2. Toilet improvements (e.g. flush volume reduction) --
3. Tap flow reductions (e.g. flow restrictors, auto-taps) --
4. Cooling tower improvements --
5. Leak detection and resolution --
6. Rainwater recovery and reuse --
7. Internal greywater recovery and reuse --
9. Sewer mining/black water processing and reuse --
9. Air conditioning cooling condensate reuse --
Management Practices 13. Building Operation
1. Which of the following best describes who takes the role of Building Manager
--
2. Approximately how many days in a week is the Building Manager on site? Don't know
3. Is there a program of incentives and/or disincentives for the Building Manager re building energy efficiency?
--
4. Is the Building Manager routinely provided with the energy bills for the site?
--
5. Is the Building Manager routinely provided with the water bills for the site?
--
6. Is non office water use submetered? --
14 Leasing Details
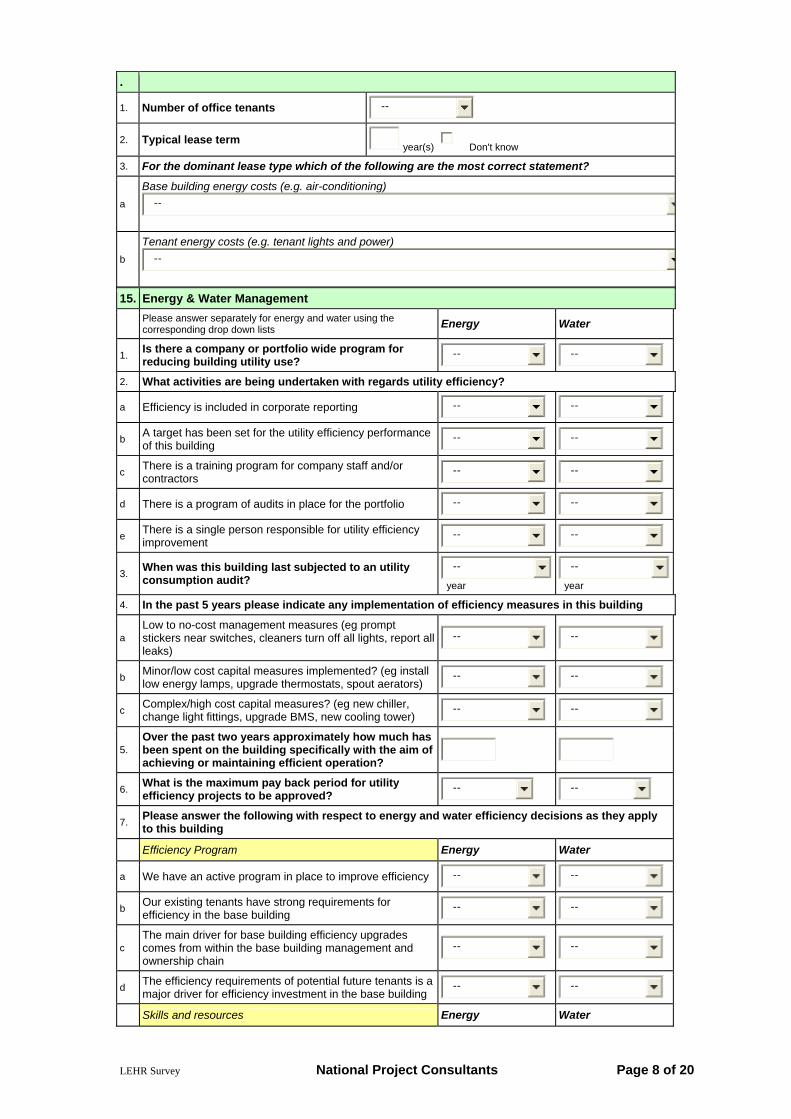
LEHR Survey National Project Consultants Page 8 of 20
.
1. Number of office tenants --
2. Typical lease term year(s) Don't know
3. For the dominant lease type which of the following are the most correct statement?
a
Base building energy costs (e.g. air-conditioning) --
b
Tenant energy costs (e.g. tenant lights and power) --
15. Energy & Water Management
Please answer separately for energy and water using the corresponding drop down lists Energy Water
1. Is there a company or portfolio wide program for reducing building utility use?
--
--
2. What activities are being undertaken with regards utility efficiency?
a Efficiency is included in corporate reporting --
--
b A target has been set for the utility efficiency performance of this building
--
--
c There is a training program for company staff and/or contractors
--
--
d There is a program of audits in place for the portfolio --
--
e There is a single person responsible for utility efficiency improvement
--
--
3. When was this building last subjected to an utility consumption audit?
--
year
--
year
4. In the past 5 years please indicate any implementation of efficiency measures in this building
a Low to no-cost management measures (eg prompt stickers near switches, cleaners turn off all lights, report all leaks)
--
--
b Minor/low cost capital measures implemented? (eg install low energy lamps, upgrade thermostats, spout aerators)
--
--
c Complex/high cost capital measures? (eg new chiller, change light fittings, upgrade BMS, new cooling tower)
--
--
5. Over the past two years approximately how much has been spent on the building specifically with the aim of achieving or maintaining efficient operation?
6. What is the maximum pay back period for utility efficiency projects to be approved?
--
--
7. Please answer the following with respect to energy and water efficiency decisions as they apply to this building
Efficiency Program Energy Water
a We have an active program in place to improve efficiency --
--
b Our existing tenants have strong requirements for efficiency in the base building
--
--
c The main driver for base building efficiency upgrades comes from within the base building management and ownership chain
--
--
d The efficiency requirements of potential future tenants is a major driver for efficiency investment in the base building
--
--
Skills and resources Energy Water
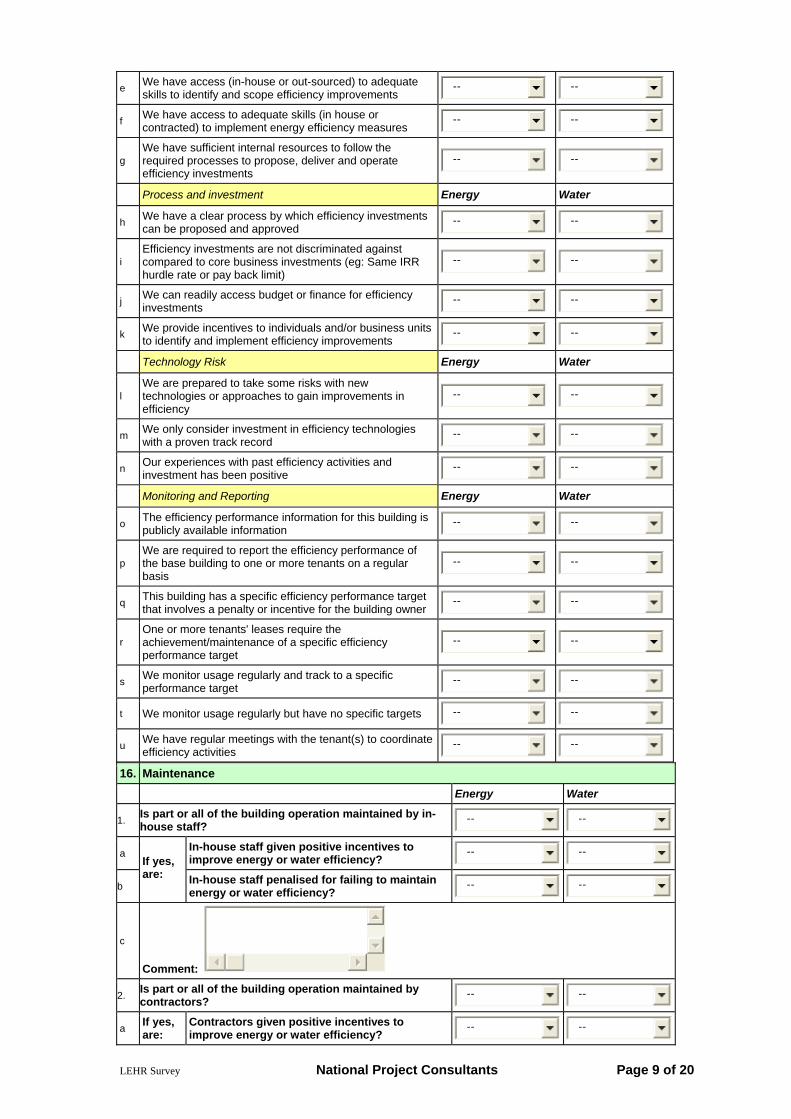
LEHR Survey National Project Consultants Page 9 of 20
e We have access (in-house or out-sourced) to adequate skills to identify and scope efficiency improvements
--
--
f We have access to adequate skills (in house or contracted) to implement energy efficiency measures
--
--
g We have sufficient internal resources to follow the required processes to propose, deliver and operate efficiency investments
--
--
Process and investment Energy Water
h We have a clear process by which efficiency investments can be proposed and approved
--
--
i Efficiency investments are not discriminated against compared to core business investments (eg: Same IRR hurdle rate or pay back limit)
--
--
j We can readily access budget or finance for efficiency investments
--
--
k We provide incentives to individuals and/or business units to identify and implement efficiency improvements
--
--
Technology Risk Energy Water
l We are prepared to take some risks with new technologies or approaches to gain improvements in efficiency
--
--
m We only consider investment in efficiency technologies with a proven track record
--
--
n Our experiences with past efficiency activities and investment has been positive
--
--
Monitoring and Reporting Energy Water
o The efficiency performance information for this building is publicly available information
--
--
p We are required to report the efficiency performance of the base building to one or more tenants on a regular basis
--
--
q This building has a specific efficiency performance target that involves a penalty or incentive for the building owner
--
--
r One or more tenants' leases require the achievement/maintenance of a specific efficiency performance target
--
--
s We monitor usage regularly and track to a specific performance target
--
--
t We monitor usage regularly but have no specific targets --
--
u We have regular meetings with the tenant(s) to coordinate efficiency activities
--
--
16. Maintenance Energy Water
1. Is part or all of the building operation maintained by in-house staff?
--
--
a In-house staff given positive incentives to improve energy or water efficiency?
--
--
b
If yes, are: In-house staff penalised for failing to maintain
energy or water efficiency? --
--
c
Comment:
2. Is part or all of the building operation maintained by contractors?
--
--
a If yes, are:
Contractors given positive incentives to improve energy or water efficiency?
--
--
LEHR Survey National Project Consultants Page 10 of 20
b Contractors penalised for failing to maintain energy or water efficiency?
--
--
c
Comment:
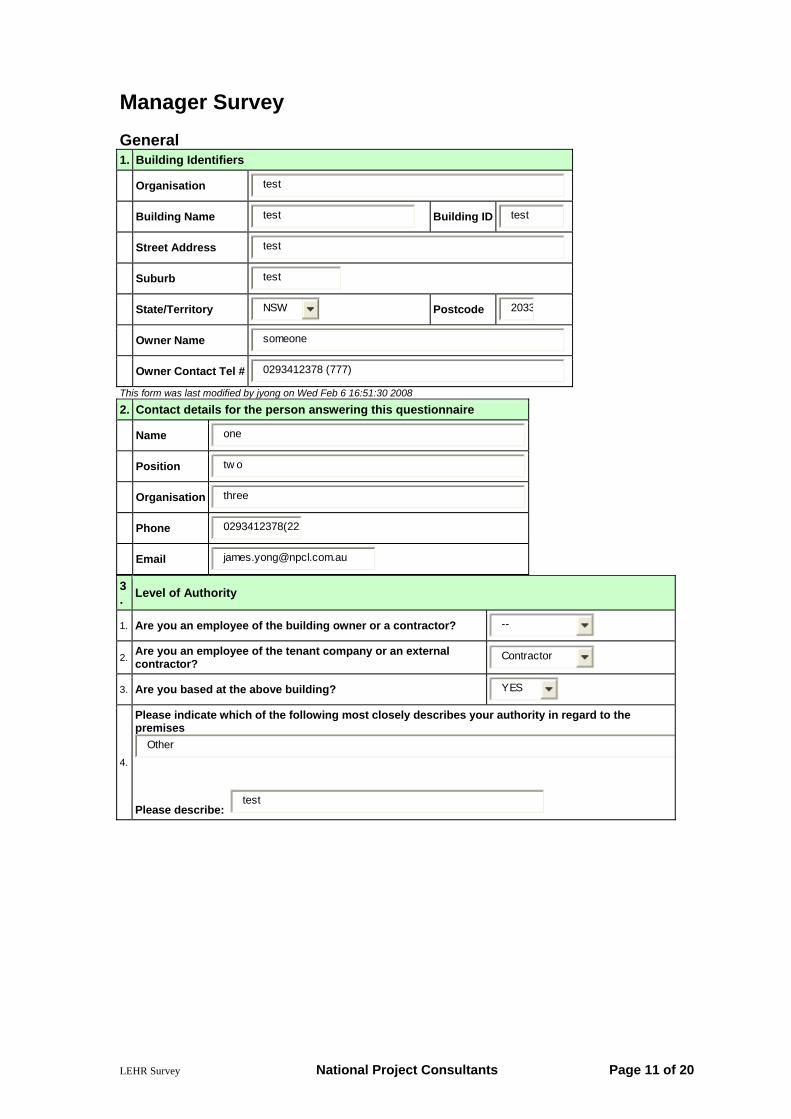
LEHR Survey National Project Consultants Page 11 of 20
Manager Survey General 1. Building Identifiers
Organisation test
Building Name test
Building ID test
Street Address test
Suburb test
State/Territory NSW
Postcode 2033
Owner Name someone
Owner Contact Tel # 0293412378 (777)
This form was last modified by jyong on Wed Feb 6 16:51:30 2008
2. Contact details for the person answering this questionnaire
Name one
Position tw o
Organisation three
Phone 0293412378(222
Email [email protected]
3. Level of Authority
1. Are you an employee of the building owner or a contractor? --
2. Are you an employee of the tenant company or an external contractor?
Contractor
3. Are you based at the above building? YES
4.
Please indicate which of the following most closely describes your authority in regard to the premises
Other
Please describe: test
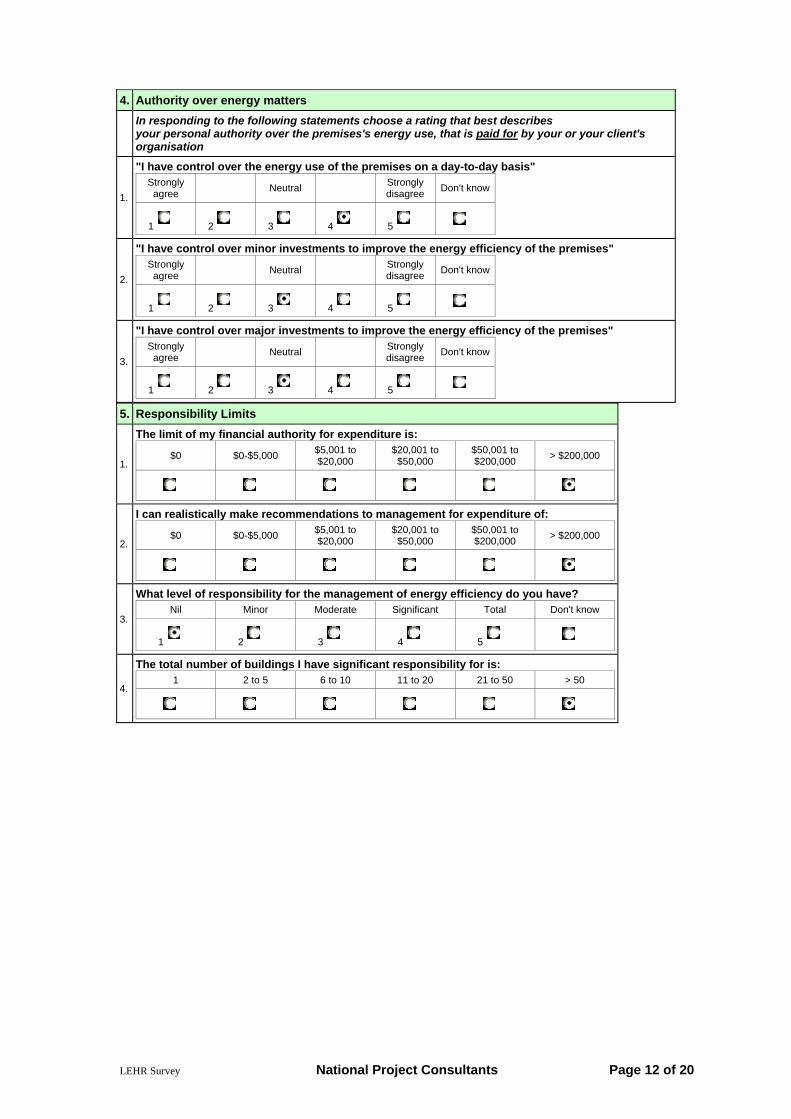
LEHR Survey National Project Consultants Page 12 of 20
4. Authority over energy matters
In responding to the following statements choose a rating that best describes your personal authority over the premises's energy use, that is paid for by your or your client's organisation
1.
"I have control over the energy use of the premises on a day-to-day basis" Strongly agree Neutral Strongly
disagree Don't know
1 2 3 4 5
2.
"I have control over minor investments to improve the energy efficiency of the premises" Strongly agree Neutral Strongly
disagree Don't know
1 2 3 4 5
3.
"I have control over major investments to improve the energy efficiency of the premises" Strongly agree Neutral Strongly
disagree Don't know
1 2 3 4 5
5. Responsibility Limits
1.
The limit of my financial authority for expenditure is:
$0 $0-$5,000 $5,001 to $20,000
$20,001 to $50,000
$50,001 to $200,000 > $200,000
2.
I can realistically make recommendations to management for expenditure of:
$0 $0-$5,000 $5,001 to $20,000
$20,001 to $50,000
$50,001 to $200,000 > $200,000
3.
What level of responsibility for the management of energy efficiency do you have? Nil Minor Moderate Significant Total Don't know
1 2 3 4 5
4.
The total number of buildings I have significant responsibility for is: 1 2 to 5 6 to 10 11 to 20 21 to 50 > 50
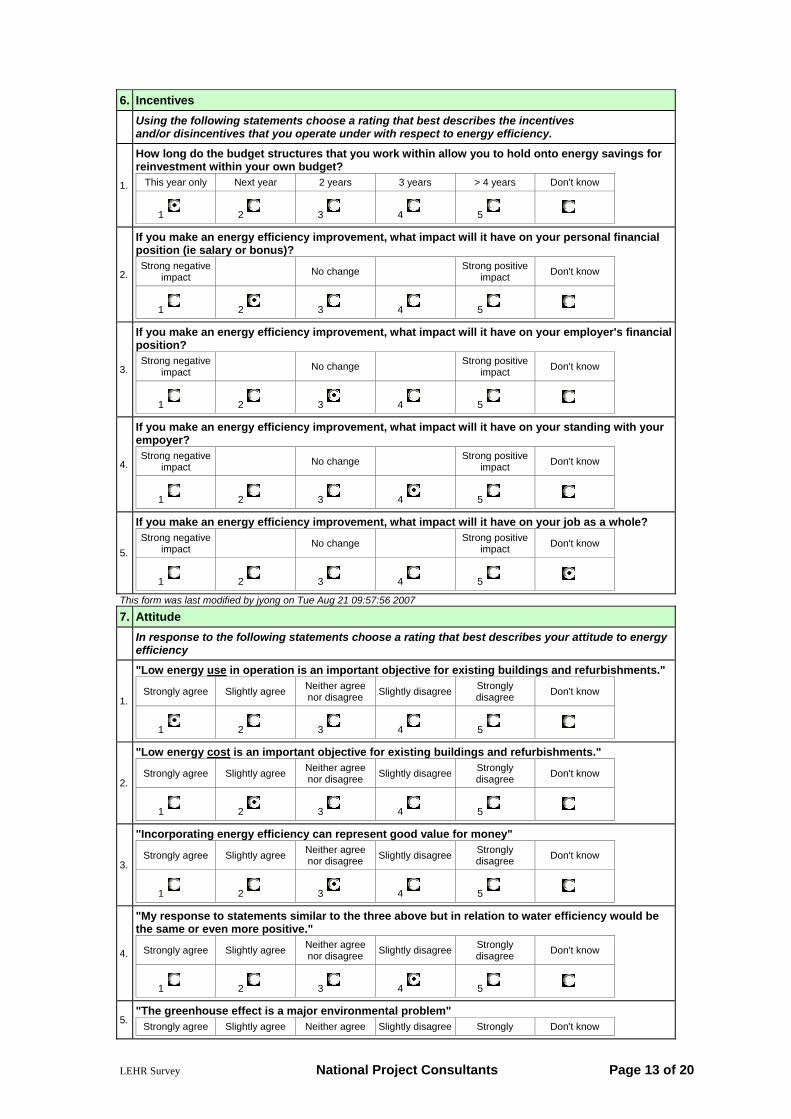
LEHR Survey National Project Consultants Page 13 of 20
6. Incentives
Using the following statements choose a rating that best describes the incentives and/or disincentives that you operate under with respect to energy efficiency.
1.
How long do the budget structures that you work within allow you to hold onto energy savings for reinvestment within your own budget?
This year only Next year 2 years 3 years > 4 years Don't know
1 2 3 4 5
2.
If you make an energy efficiency improvement, what impact will it have on your personal financial position (ie salary or bonus)? Strong negative
impact No change Strong positive impact Don't know
1 2 3 4 5
3.
If you make an energy efficiency improvement, what impact will it have on your employer's financial position? Strong negative
impact No change Strong positive impact Don't know
1 2 3 4 5
4.
If you make an energy efficiency improvement, what impact will it have on your standing with your empoyer? Strong negative
impact No change Strong positive impact Don't know
1 2 3 4 5
5.
If you make an energy efficiency improvement, what impact will it have on your job as a whole? Strong negative
impact No change Strong positive impact Don't know
1 2 3 4 5 This form was last modified by jyong on Tue Aug 21 09:57:56 2007
7. Attitude
In response to the following statements choose a rating that best describes your attitude to energy efficiency
1.
"Low energy use in operation is an important objective for existing buildings and refurbishments."
Strongly agree Slightly agree Neither agree nor disagree Slightly disagree Strongly
disagree Don't know
1 2 3 4 5
2.
"Low energy cost is an important objective for existing buildings and refurbishments."
Strongly agree Slightly agree Neither agree nor disagree Slightly disagree Strongly
disagree Don't know
1 2 3 4 5
3.
"Incorporating energy efficiency can represent good value for money"
Strongly agree Slightly agree Neither agree nor disagree Slightly disagree Strongly
disagree Don't know
1 2 3 4 5
4.
"My response to statements similar to the three above but in relation to water efficiency would be the same or even more positive."
Strongly agree Slightly agree Neither agree nor disagree Slightly disagree Strongly
disagree Don't know
1 2 3 4 5
5. "The greenhouse effect is a major environmental problem"
Strongly agree Slightly agree Neither agree Slightly disagree Strongly Don't know
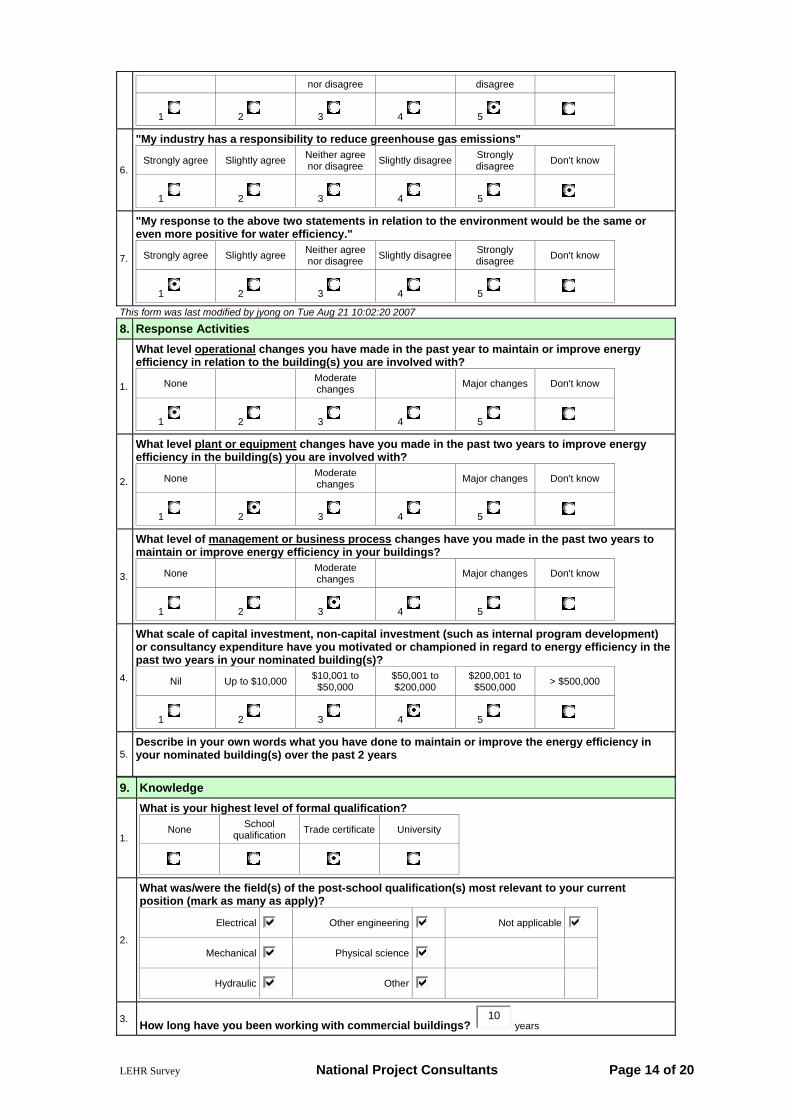
LEHR Survey National Project Consultants Page 14 of 20
nor disagree disagree
1 2 3 4 5
6.
"My industry has a responsibility to reduce greenhouse gas emissions"
Strongly agree Slightly agree Neither agree nor disagree Slightly disagree Strongly
disagree Don't know
1 2 3 4 5
7.
"My response to the above two statements in relation to the environment would be the same or even more positive for water efficiency."
Strongly agree Slightly agree Neither agree nor disagree Slightly disagree Strongly
disagree Don't know
1 2 3 4 5 This form was last modified by jyong on Tue Aug 21 10:02:20 2007
8. Response Activities
1.
What level operational changes you have made in the past year to maintain or improve energy efficiency in relation to the building(s) you are involved with?
None Moderate changes Major changes Don't know
1 2 3 4 5
2.
What level plant or equipment changes have you made in the past two years to improve energy efficiency in the building(s) you are involved with?
None Moderate changes Major changes Don't know
1 2 3 4 5
3.
What level of management or business process changes have you made in the past two years to maintain or improve energy efficiency in your buildings?
None Moderate changes Major changes Don't know
1 2 3 4 5
4.
What scale of capital investment, non-capital investment (such as internal program development) or consultancy expenditure have you motivated or championed in regard to energy efficiency in the past two years in your nominated building(s)?
Nil Up to $10,000 $10,001 to $50,000
$50,001 to $200,000
$200,001 to $500,000 > $500,000
1 2 3 4 5
5. Describe in your own words what you have done to maintain or improve the energy efficiency in your nominated building(s) over the past 2 years
9. Knowledge
1.
What is your highest level of formal qualification?
None School qualification Trade certificate University
2.
What was/were the field(s) of the post-school qualification(s) most relevant to your current position (mark as many as apply)?
Electrical
Other engineering Not applicable
Mechanical
Physical science
Hydraulic
Other
3. How long have you been working with commercial buildings? 10
years
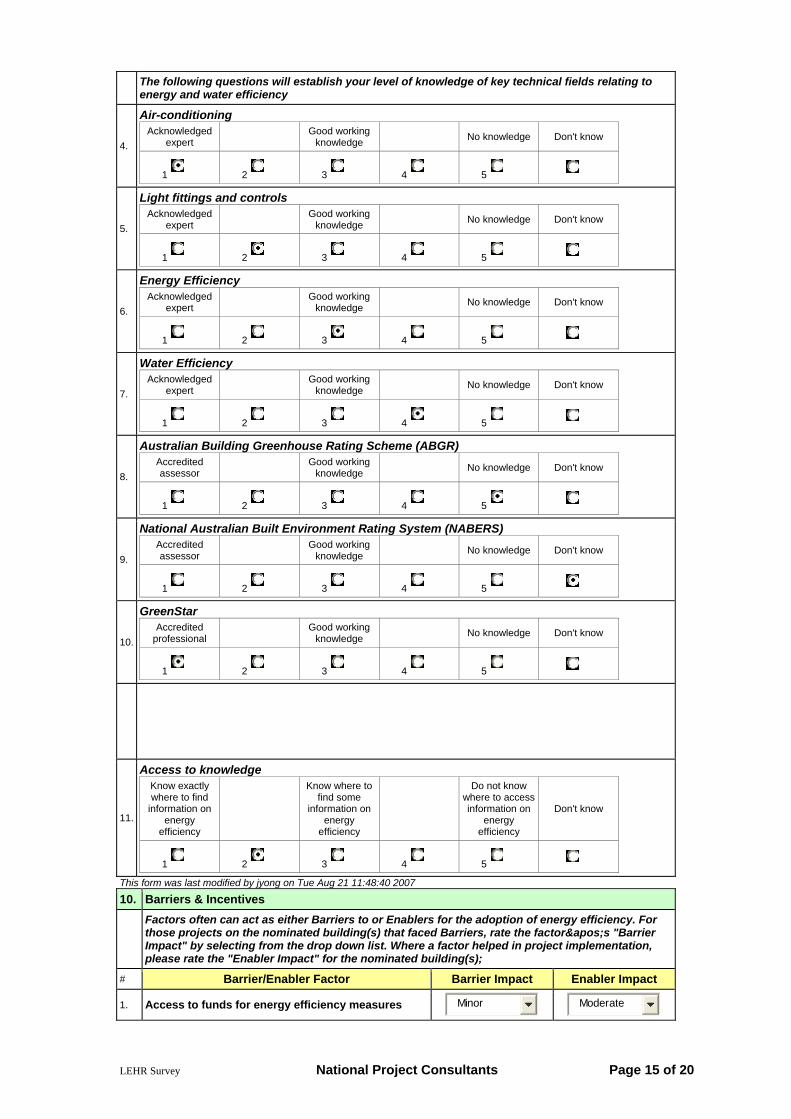
LEHR Survey National Project Consultants Page 15 of 20
The following questions will establish your level of knowledge of key technical fields relating to energy and water efficiency
4.
Air-conditioning Acknowledged
expert Good working knowledge No knowledge Don't know
1 2 3 4 5
5.
Light fittings and controls Acknowledged
expert Good working knowledge No knowledge Don't know
1 2 3 4 5
6.
Energy Efficiency Acknowledged
expert Good working knowledge No knowledge Don't know
1 2 3 4 5
7.
Water Efficiency Acknowledged
expert Good working knowledge No knowledge Don't know
1 2 3 4 5
8.
Australian Building Greenhouse Rating Scheme (ABGR) Accredited assessor Good working
knowledge No knowledge Don't know
1 2 3 4 5
9.
National Australian Built Environment Rating System (NABERS) Accredited assessor Good working
knowledge No knowledge Don't know
1 2 3 4 5
10.
GreenStar Accredited
professional Good working knowledge No knowledge Don't know
1 2 3 4 5
11.
Access to knowledge Know exactly where to find
information on energy
efficiency
Know where to find some
information on energy
efficiency
Do not know where to access information on
energy efficiency
Don't know
1 2 3 4 5 This form was last modified by jyong on Tue Aug 21 11:48:40 2007
10. Barriers & Incentives
Factors often can act as either Barriers to or Enablers for the adoption of energy efficiency. For those projects on the nominated building(s) that faced Barriers, rate the factor's "Barrier Impact" by selecting from the drop down list. Where a factor helped in project implementation, please rate the "Enabler Impact" for the nominated building(s);
# Barrier/Enabler Factor Barrier Impact Enabler Impact
1. Access to funds for energy efficiency measures Minor
Moderate
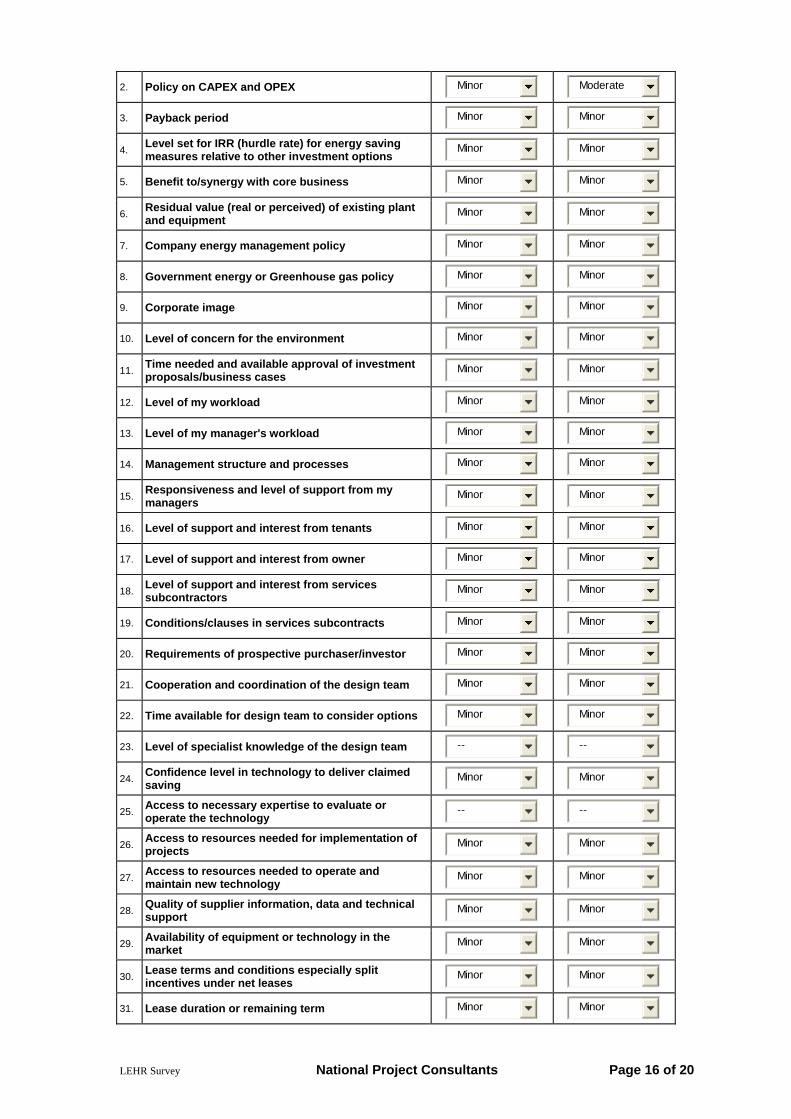
LEHR Survey National Project Consultants Page 16 of 20
2. Policy on CAPEX and OPEX Minor
Moderate
3. Payback period Minor
Minor
4. Level set for IRR (hurdle rate) for energy saving measures relative to other investment options
Minor
Minor
5. Benefit to/synergy with core business Minor
Minor
6. Residual value (real or perceived) of existing plant and equipment
Minor
Minor
7. Company energy management policy Minor
Minor
8. Government energy or Greenhouse gas policy Minor
Minor
9. Corporate image Minor
Minor
10. Level of concern for the environment Minor
Minor
11. Time needed and available approval of investment proposals/business cases
Minor
Minor
12. Level of my workload Minor
Minor
13. Level of my manager's workload Minor
Minor
14. Management structure and processes Minor
Minor
15. Responsiveness and level of support from my managers
Minor
Minor
16. Level of support and interest from tenants Minor
Minor
17. Level of support and interest from owner Minor
Minor
18. Level of support and interest from services subcontractors
Minor
Minor
19. Conditions/clauses in services subcontracts Minor
Minor
20. Requirements of prospective purchaser/investor Minor
Minor
21. Cooperation and coordination of the design team Minor
Minor
22. Time available for design team to consider options Minor
Minor
23. Level of specialist knowledge of the design team --
--
24. Confidence level in technology to deliver claimed saving
Minor
Minor
25. Access to necessary expertise to evaluate or operate the technology
--
--
26. Access to resources needed for implementation of projects
Minor
Minor
27. Access to resources needed to operate and maintain new technology
Minor
Minor
28. Quality of supplier information, data and technical support
Minor
Minor
29. Availability of equipment or technology in the market
Minor
Minor
30. Lease terms and conditions especially split incentives under net leases
Minor
Minor
31. Lease duration or remaining term Minor
Minor
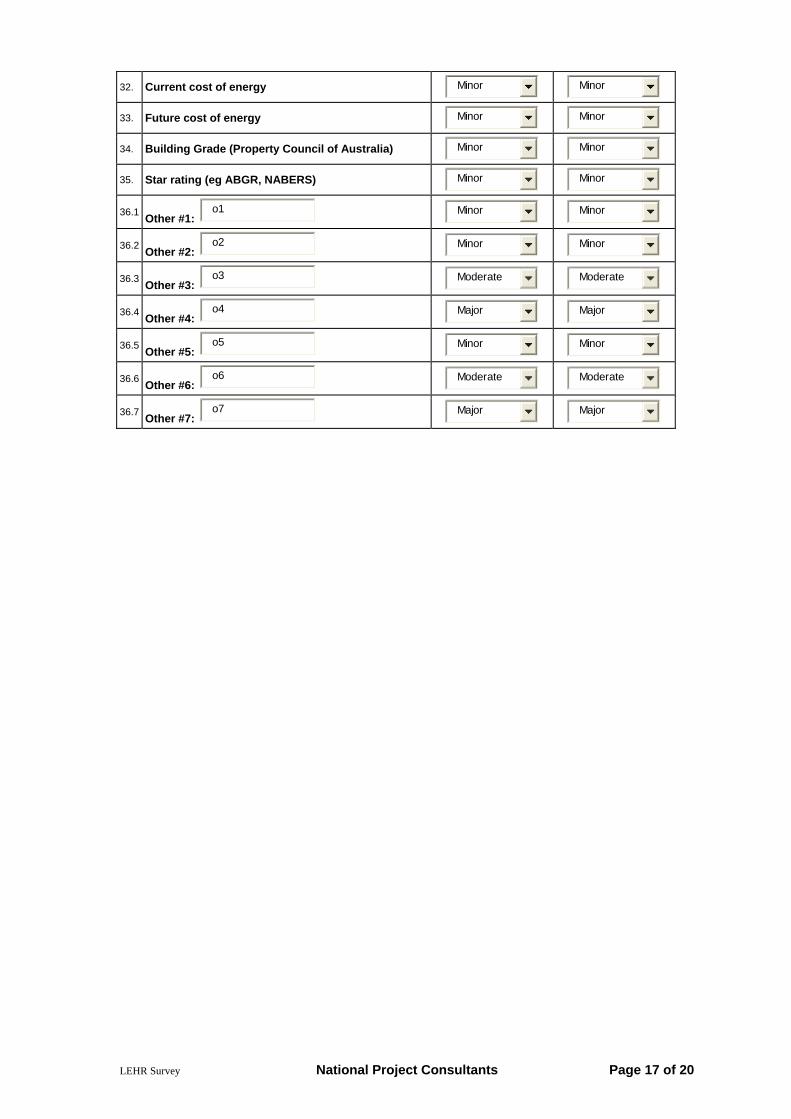
LEHR Survey National Project Consultants Page 17 of 20
32. Current cost of energy Minor
Minor
33. Future cost of energy Minor
Minor
34. Building Grade (Property Council of Australia) Minor
Minor
35. Star rating (eg ABGR, NABERS) Minor
Minor
36.1 Other #1: o1
Minor
Minor
36.2 Other #2: o2
Minor
Minor
36.3 Other #3: o3
Moderate
Moderate
36.4 Other #4: o4
Major
Major
36.5 Other #5: o5
Minor
Minor
36.6 Other #6: o6
Moderate
Moderate
36.7 Other #7: o7
Major
Major
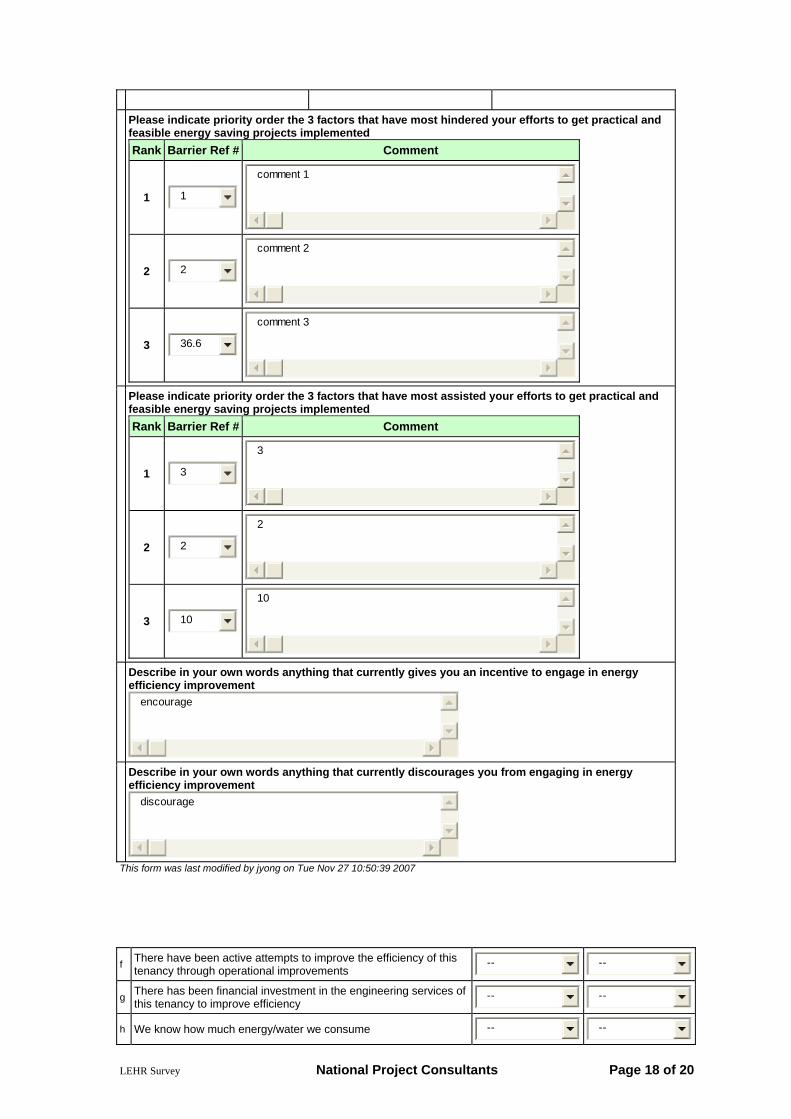
LEHR Survey National Project Consultants Page 18 of 20
Please indicate priority order the 3 factors that have most hindered your efforts to get practical and feasible energy saving projects implemented Rank Barrier Ref # Comment
1 1
comment 1
2 2
comment 2
3 36.6
comment 3
Please indicate priority order the 3 factors that have most assisted your efforts to get practical and feasible energy saving projects implemented Rank Barrier Ref # Comment
1 3
3
2 2
2
3 10
10
Describe in your own words anything that currently gives you an incentive to engage in energy efficiency improvement
encourage
Describe in your own words anything that currently discourages you from engaging in energy efficiency improvement
discourage
This form was last modified by jyong on Tue Nov 27 10:50:39 2007
f There have been active attempts to improve the efficiency of this
tenancy through operational improvements --
--
g There has been financial investment in the engineering services of this tenancy to improve efficiency
--
--
h We know how much energy/water we consume --
--
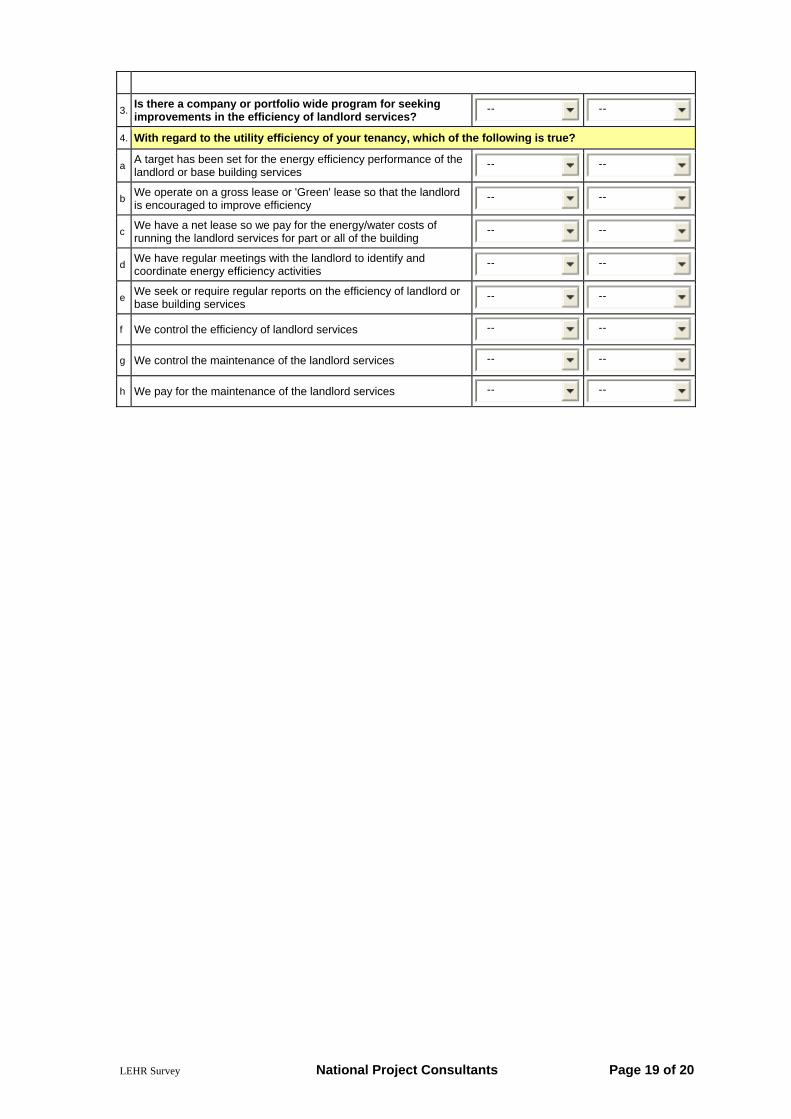
LEHR Survey National Project Consultants Page 19 of 20
3. Is there a company or portfolio wide program for seeking improvements in the efficiency of landlord services?
--
--
4. With regard to the utility efficiency of your tenancy, which of the following is true?
a A target has been set for the energy efficiency performance of the landlord or base building services
--
--
b We operate on a gross lease or 'Green' lease so that the landlord is encouraged to improve efficiency
--
--
c We have a net lease so we pay for the energy/water costs of running the landlord services for part or all of the building
--
--
d We have regular meetings with the landlord to identify and coordinate energy efficiency activities
--
--
e We seek or require regular reports on the efficiency of landlord or base building services
--
--
f We control the efficiency of landlord services --
--
g We control the maintenance of the landlord services --
--
h We pay for the maintenance of the landlord services --
--

LEHR Survey National Project Consultants Page 20 of 20
Tenant’s Survey
Management Practices 1. Sample Building
1. Building Name
2. Street Address
2. Contact details for the person answering this questionnaire
1. Contact's Name
2. Contact Position
3. Tenant Organisation
4. Office Phone
Mobile
5. Email
6. Is contact based on site? --
3. Tenancy Details
1. Year of tenancy lease commencement Yr
2. Lease expiry year Yr
3. Remaining Lease extension options (eg 3x5)? Yr
4. Any definite plans to move? --
5. If yes, move what year? Yr
6. Net Lettable Area Leased m2
7. No. of floors
8. Proportion of building covered by this lease? %
9. Year of latest major tenancy fitout? Yr
4. Energy management
Note: Read 'energy efficiency' to also cover water efficiency Energy Water
1. Is there a company or portfolio wide program for improving the energy efficiency of tenancies?
-- --
2. With regards the utility efficiency of your tenancy, which of the following is true?
a For the most recent major tenancy fitout, utility efficiency was a significant design consideration
-- --
b A target has been set for the utility efficiency performance of this tenancy (eg ABGR, NABERS)
-- --
c We have a nominated energy/water champion for our tenancy -- --
d There is training available for nominated staff regarding utility efficiency issues
-- --
e This tenancy has been subjected to an energy audit in the past 5 years
-- --