Embed Size (px)
Citation preview
72nd EAGE Conference & Exhibition incorporating SPE EUROPEC 2010 Barcelona, Spain, 14 - 17 June 2010
B015Low-frequency Generation Using SeismicVibratorsG.J.M. Baeten* (Shell International E&P BV), A. Egreteau (CGGVeritas), J.Gibson (CGGVeritas), F. Lin (CGGVeritas), P. Maxwell (CGGVeritas) & J.J.Sallas (GeoMagic)
SUMMARYTypical specifications for a seismic vibrator include a low-frequency limit determined by the reaction massweight, the piston stroke and the pump flow rating. Emission of frequencies well below this so-calleddisplacement limit is investigated using dedicated sweep designs. The impact of the low frequencyemissions on geophysical and mechanical particle motions is investigated using a variety of differentsensors, downhole, along a 2D receiver line and on the seismic vibrator.
Introduction
A low-frequency Vibroseis test was performed at the Devine test site in Texas. The Devine low-frequency test was a joint effort between CGGVeritas and Shell. The test objective was to emit and record low-frequency (down to 1 Hz) energy using a seismic vibrator, and to assess the propagation characteristics of dedicated low-frequency sweeps using downhole recordings. The emission and recording of low-frequency energy with the Vibroseis method is cumbersome for a variety of reasons. The vibrator displacement limit, in combination with hydraulic pump flow limitations, constrains vibrator output at low frequencies (Bagaini, 2008, Sallas, 2010). Vibrator control electronics can experience difficulties in maintaining amplitude- and phase lock for low-frequency, low-amplitude sweep signals. Hydraulic nonlinearities, vehicle isolation, baseplate flexure and rocking resonance have the potential to further compromise the low-frequency output. Since the vibrator is a surface source, propagation characteristics of the wavefield into the far field of the earth dictate another 6 dB/octave of signal attenuation (Baeten et al, 1988). And, finally, recording the wavefield with conventional (10 Hz) geophones yields a 12 dB/octave decay in signal strength. The Devine test, with its dedicated downhole and surface measurements, provided valuable data to assess the impact of the abovementioned limitations.
Method and/or Theory
Successful application of low-frequency seismic acquisition requires detailed analysis of all issues mentioned in the introduction. The experiment in Devine comprised the following elements:
1. Vibrator measurements. Although there are also developments in the field of developing novel low-frequency vibrators, a conventional AHV-III vibrator equipped with a VE432 control electronics was used during the test. The mechanical behaviour of the vibrator was monitored using several accelerometers that were mounted on the vehicle. The following measurements were made on the vibrator:
Accelerations: reaction mass, baseplate Additional measurements:
Mass LVDT 2 accelerometers to measure vehicle isolation at low frequency Measuring of rocking motion using 8 magnetic base accelerometers.
2. Downhole measurements. Low-frequency propagation characteristics are best measured in a
downhole configuration. Downhole receivers (Geospace HS-1 2HZ) with a natural frequency of 2 Hz were deployed at a depth of approx. 1 km. The tool was directly connected to the Sercel 428 surface recorder. Since the far field region is approximately one wavelength away from the source, and the lowest frequency of interest was 1 Hz, the 1 km depth of the downhole array was not quite sufficient to measure far field relations at all frequencies of interest.
3. Surface measurements. The impact of receiver characteristics was investigated by deploying a surface line of approx. 3 km length, with receivers deployed at 15 m increments.
Using this experimental setup, numerous different sweeps were emitted by a single vibrator. The sweeps varied in begin-and end frequency, and sweep length. To have an accurate idea of the noise conditions that prevailed during the test, a total of about 200 noise records were recorded with different record lengths (10 to 70 s). Finally, at one location sweeps were repeated 360 times to provide records with a high S/N ratio.
72nd EAGE Conference & Exhibition incorporating SPE EUROPEC 2010 Barcelona, Spain, 14 - 17 June 2010
Results
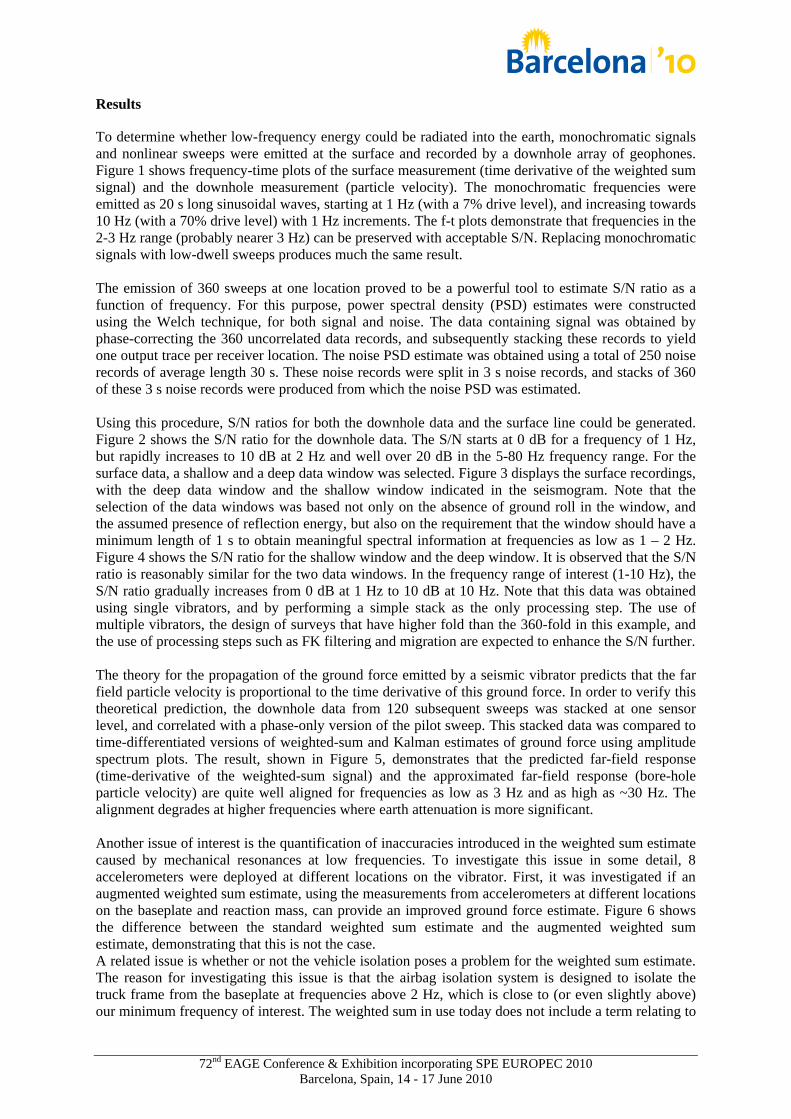
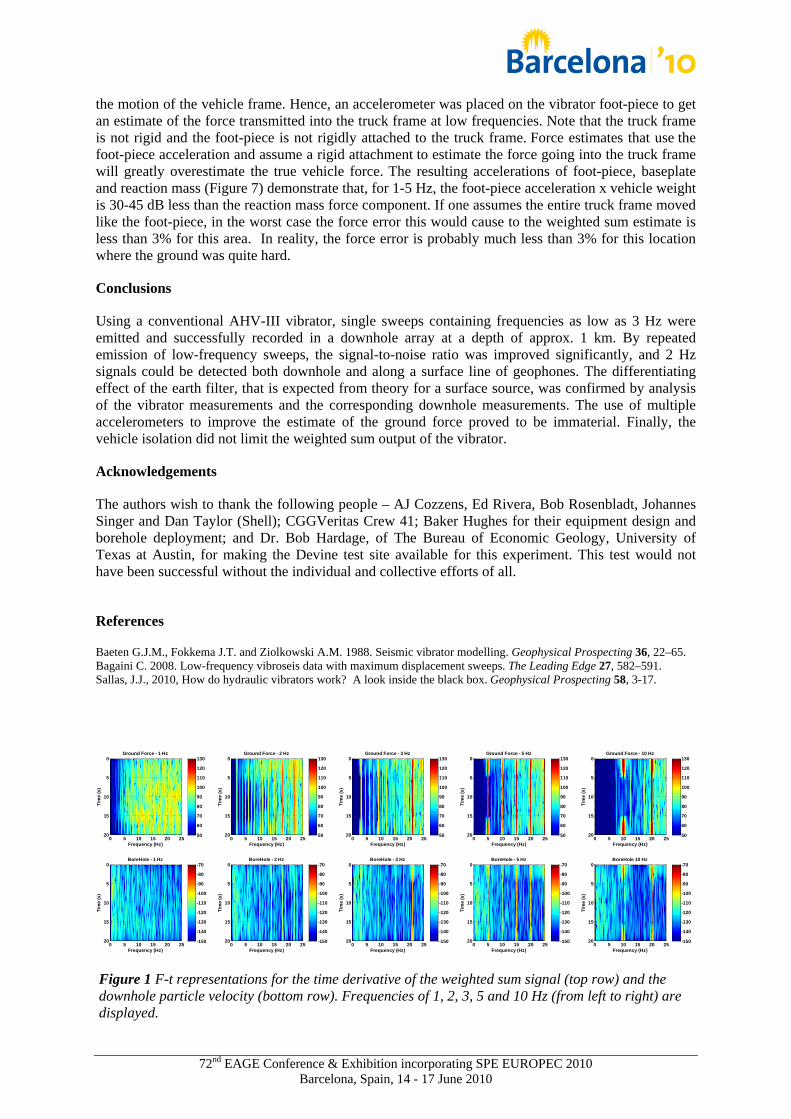
To determine whether low-frequency energy could be radiated into the earth, monochromatic signals and nonlinear sweeps were emitted at the surface and recorded by a downhole array of geophones. Figure 1 shows frequency-time plots of the surface measurement (time derivative of the weighted sum signal) and the downhole measurement (particle velocity). The monochromatic frequencies were emitted as 20 s long sinusoidal waves, starting at 1 Hz (with a 7% drive level), and increasing towards 10 Hz (with a 70% drive level) with 1 Hz increments. The f-t plots demonstrate that frequencies in the 2-3 Hz range (probably nearer 3 Hz) can be preserved with acceptable S/N. Replacing monochromatic signals with low-dwell sweeps produces much the same result. The emission of 360 sweeps at one location proved to be a powerful tool to estimate S/N ratio as a function of frequency. For this purpose, power spectral density (PSD) estimates were constructed using the Welch technique, for both signal and noise. The data containing signal was obtained by phase-correcting the 360 uncorrelated data records, and subsequently stacking these records to yield one output trace per receiver location. The noise PSD estimate was obtained using a total of 250 noise records of average length 30 s. These noise records were split in 3 s noise records, and stacks of 360 of these 3 s noise records were produced from which the noise PSD was estimated. Using this procedure, S/N ratios for both the downhole data and the surface line could be generated. Figure 2 shows the S/N ratio for the downhole data. The S/N starts at 0 dB for a frequency of 1 Hz, but rapidly increases to 10 dB at 2 Hz and well over 20 dB in the 5-80 Hz frequency range. For the surface data, a shallow and a deep data window was selected. Figure 3 displays the surface recordings, with the deep data window and the shallow window indicated in the seismogram. Note that the selection of the data windows was based not only on the absence of ground roll in the window, and the assumed presence of reflection energy, but also on the requirement that the window should have a minimum length of 1 s to obtain meaningful spectral information at frequencies as low as 1 – 2 Hz. Figure 4 shows the S/N ratio for the shallow window and the deep window. It is observed that the S/N ratio is reasonably similar for the two data windows. In the frequency range of interest (1-10 Hz), the S/N ratio gradually increases from 0 dB at 1 Hz to 10 dB at 10 Hz. Note that this data was obtained using single vibrators, and by performing a simple stack as the only processing step. The use of multiple vibrators, the design of surveys that have higher fold than the 360-fold in this example, and the use of processing steps such as FK filtering and migration are expected to enhance the S/N further. The theory for the propagation of the ground force emitted by a seismic vibrator predicts that the far field particle velocity is proportional to the time derivative of this ground force. In order to verify this theoretical prediction, the downhole data from 120 subsequent sweeps was stacked at one sensor level, and correlated with a phase-only version of the pilot sweep. This stacked data was compared to time-differentiated versions of weighted-sum and Kalman estimates of ground force using amplitude spectrum plots. The result, shown in Figure 5, demonstrates that the predicted far-field response (time-derivative of the weighted-sum signal) and the approximated far-field response (bore-hole particle velocity) are quite well aligned for frequencies as low as 3 Hz and as high as ~30 Hz. The alignment degrades at higher frequencies where earth attenuation is more significant. Another issue of interest is the quantification of inaccuracies introduced in the weighted sum estimate caused by mechanical resonances at low frequencies. To investigate this issue in some detail, 8 accelerometers were deployed at different locations on the vibrator. First, it was investigated if an augmented weighted sum estimate, using the measurements from accelerometers at different locations on the baseplate and reaction mass, can provide an improved ground force estimate. Figure 6 shows the difference between the standard weighted sum estimate and the augmented weighted sum estimate, demonstrating that this is not the case. A related issue is whether or not the vehicle isolation poses a problem for the weighted sum estimate. The reason for investigating this issue is that the airbag isolation system is designed to isolate the truck frame from the baseplate at frequencies above 2 Hz, which is close to (or even slightly above) our minimum frequency of interest. The weighted sum in use today does not include a term relating to
72nd EAGE Conference & Exhibition incorporating SPE EUROPEC 2010 Barcelona, Spain, 14 - 17 June 2010
the motion of the vehicle frame. Hence, an accelerometer was placed on the vibrator foot-piece to get an estimate of the force transmitted into the truck frame at low frequencies. Note that the truck frame is not rigid and the foot-piece is not rigidly attached to the truck frame. Force estimates that use the foot-piece acceleration and assume a rigid attachment to estimate the force going into the truck frame will greatly overestimate the true vehicle force. The resulting accelerations of foot-piece, baseplate and reaction mass (Figure 7) demonstrate that, for 1-5 Hz, the foot-piece acceleration x vehicle weight is 30-45 dB less than the reaction mass force component. If one assumes the entire truck frame moved like the foot-piece, in the worst case the force error this would cause to the weighted sum estimate is less than 3% for this area. In reality, the force error is probably much less than 3% for this location where the ground was quite hard.
Conclusions
Using a conventional AHV-III vibrator, single sweeps containing frequencies as low as 3 Hz were emitted and successfully recorded in a downhole array at a depth of approx. 1 km. By repeated emission of low-frequency sweeps, the signal-to-noise ratio was improved significantly, and 2 Hz signals could be detected both downhole and along a surface line of geophones. The differentiating effect of the earth filter, that is expected from theory for a surface source, was confirmed by analysis of the vibrator measurements and the corresponding downhole measurements. The use of multiple accelerometers to improve the estimate of the ground force proved to be immaterial. Finally, the vehicle isolation did not limit the weighted sum output of the vibrator.
Acknowledgements
The authors wish to thank the following people – AJ Cozzens, Ed Rivera, Bob Rosenbladt, Johannes Singer and Dan Taylor (Shell); CGGVeritas Crew 41; Baker Hughes for their equipment design and borehole deployment; and Dr. Bob Hardage, of The Bureau of Economic Geology, University of Texas at Austin, for making the Devine test site available for this experiment. This test would not have been successful without the individual and collective efforts of all.
References
Baeten G.J.M., Fokkema J.T. and Ziolkowski A.M. 1988. Seismic vibrator modelling. Geophysical Prospecting 36, 22–65. Bagaini C. 2008. Low-frequency vibroseis data with maximum displacement sweeps. The Leading Edge 27, 582–591. Sallas, J.J., 2010, How do hydraulic vibrators work? A look inside the black box. Geophysical Prospecting 58, 3-17.
Frequency (Hz)
Tim
e (s
)
Ground Force - 1 Hz
0 5 10 15 20 25
0
5
10
15
20 50
60
70
80
90
100
110
120
130
Frequency (Hz)
Tim
e (s
)
BoreHole - 1 Hz
0 5 10 15 20 25
0
5
10
15
20 -150
-140
-130
-120
-110
-100
-90
-80
-70
Frequency (Hz)
Tim
e (s
)
Ground Force - 2 Hz
0 5 10 15 20 25
0
5
10
15
20 50
60
70
80
90
100
110
120
130
Frequency (Hz)
Tim
e (s
)
BoreHole - 2 Hz
0 5 10 15 20 25
0
5
10
15
20 -150
-140
-130
-120
-110
-100
-90
-80
-70
Frequency (Hz)
Tim
e (s
)
Ground Force - 3 Hz
0 5 10 15 20 25
0
5
10
15
20 50
60
70
80
90
100
110
120
130
Frequency (Hz)
Tim
e (s
)
BoreHole - 3 Hz
0 5 10 15 20 25
0
5
10
15
20 -150
-140
-130
-120
-110
-100
-90
-80
-70
Frequency (Hz)
Tim
e (s
)
Ground Force - 5 Hz
0 5 10 15 20 25
0
5
10
15
20 50
60
70
80
90
100
110
120
130
Frequency (Hz)
Tim
e (s
)
BoreHole - 5 Hz
0 5 10 15 20 25
0
5
10
15
20 -150
-140
-130
-120
-110
-100
-90
-80
-70
Frequency (Hz)
Tim
e (s
)
Ground Force - 10 Hz
0 5 10 15 20 25
0
5
10
15
20 50
60
70
80
90
100
110
120
130
Frequency (Hz)
Tim
e (s
)
BoreHole 10 Hz
0 5 10 15 20 25
0
5
10
15
20 -150
-140
-130
-120
-110
-100
-90
-80
-70
Figure 1 F-t representations for the time derivative of the weighted sum signal (top row) and the downhole particle velocity (bottom row). Frequencies of 1, 2, 3, 5 and 10 Hz (from left to right) are displayed.
72nd EAGE Conference & Exhibition incorporating SPE EUROPEC 2010 Barcelona, Spain, 14 - 17 June 2010
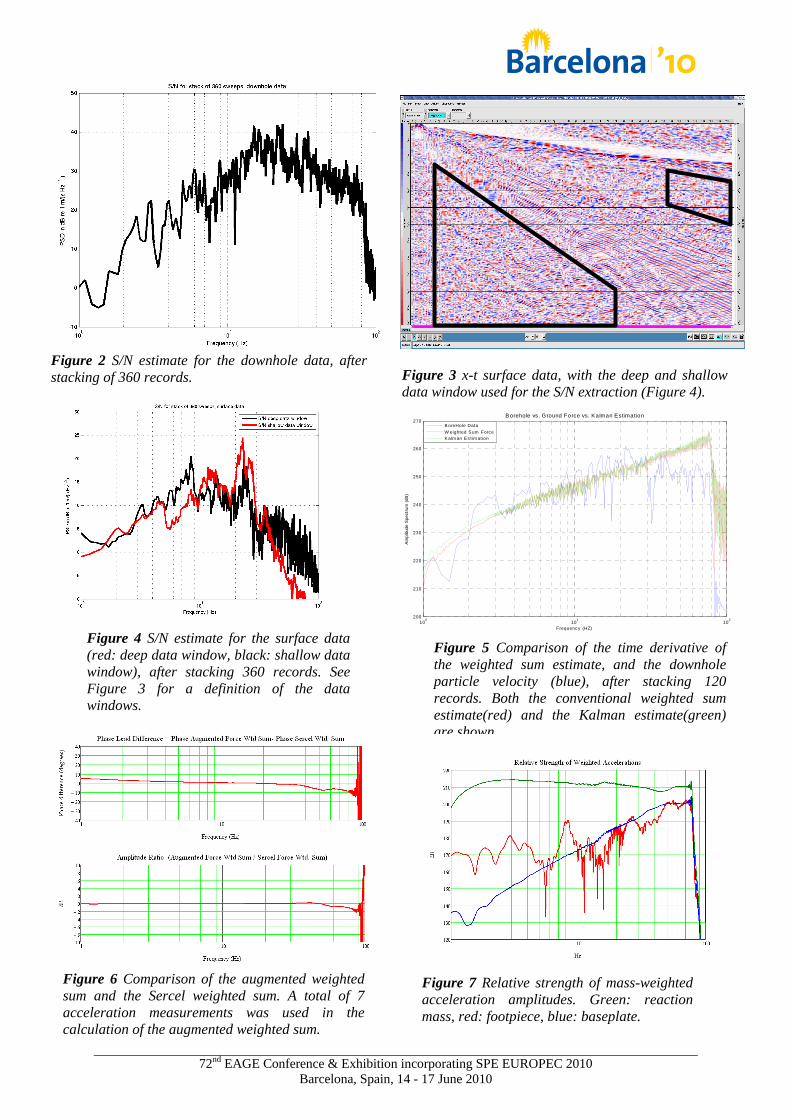
Figure 2 S/N estimate for the downhole data, after stacking of 360 records. Figure 3 x-t surface data, with the deep and shallow
data window used for the S/N extraction (Figure 4).
270
72nd EAGE Conference & Exhibition incorporating SPE EUROPEC 2010 Barcelona, Spain, 14 - 17 June 2010
Figure 4 S/N estimate for the surface data (red: deep data window, black: shallow data window), after stacking 360 records. See Figure 3 for a definition of the data windows.
Figure 6 Comparison of the augmented weighted sum and the Sercel weighted sum. A total of 7 acceleration measurements was used in the calculation of the augmented weighted sum.
Figure 7 Relative strength of mass-weighted acceleration amplitudes. Green: reaction mass, red: footpiece, blue: baseplate.
100
101
102
200
210
220
230
240
250
260
Frequency (HZ)
Am
plitu
de S
pect
rum
(dB
)
B orehole vs. Ground Force vs. Kalman Estimation
B oreHole Data
W eighted Sum ForceK alm an Es tim ation
Figure 5 Comparison of the time derivative of the weighted sum estimate, and the downhole particle velocity (blue), after stacking 120 records. Both the conventional weighted sum estimate(red) and the Kalman estimate(green) are shown


![Seismic low-frequency effects from oil-saturated reservoir ... · [2] G.M.Goloshubin, and V.A.Korneev, 2000, Seismic low-frequency effects from fluid-saturated reservoir: Expanded](https://img.pdfslide.net/doc/110x75/5f09860b7e708231d4273bc4/seismic-low-frequency-effects-from-oil-saturated-reservoir-2-gmgoloshubin.jpg)

![Infragravity waves in the deep ocean: Generation ...people.atmos.ucla.edu/uchiyama/pdf/JGR2008.pdf[2] Seismologists have detected Earth’s hum, i.e., low-frequency seismic free oscillations](https://img.pdfslide.net/doc/110x75/5f781faa6b6b1e1563149521/infragravity-waves-in-the-deep-ocean-generation-2-seismologists-have-detected.jpg)