Embed Size (px)
Citation preview
Low-Latency Trading and Price Discovery: Evidence
from the Tokyo Stock Exchange in the Pre-Opening
and Opening Periods
MARIO BELLIA, LORIANA PELIZZON, MARTI G. SUBRAHMANYAM,
JUN UNO and DARYA YUFEROVA∗
ABSTRACT
We study whether the presence of low-latency traders (including high-frequency traders(HFTs)) in the pre-opening period contributes to market quality, defined by price discoveryand liquidity provision, in the opening auction. We use a unique dataset from the TokyoStock Exchange (TSE) based on server-IDs and find that HFTs dynamically alter their pres-ence in different stocks and on different days. In spite of the lack of immediate execution,about one quarter of HFTs participate in the pre-opening period, and contribute signifi-cantly to market quality in the pre-opening period, the opening auction that ensues andthe continuous trading period. Their contribution is largely different from that of the otherHFTs during the continuous period.
JEL classification: G12, G14.
Key-words: High-Frequency Traders (HFTs), Pre-Opening, Opening Call Auction, Price
Discovery, Liquidity provision.
∗Bellia and Pelizzon are with SAFE, Goethe University and Ca’ Foscari University of Venice. Subrah-manyam is with Leonard N. Stern School of Business, New York University. Uno is with Waseda Universityand Ca’ Foscari University of Venice and Yuferova is with Norwegian School of Economics (NHH). We aregrateful to Jonathan Brogaard, Austin Gerig, Bjorn Hagstromer, Joel Hasbrouck, Frank Hatheway, TerryHendershott, Andrei Kirilenko, Mark van Achter, anonymous high-frequency traders, and participants atthe FMA European Conference 2015, the 4th International Conference on the Industrial Organization ofSecurities and Derivatives Markets: High Frequency Trading, the SAFE Microstructure Workshop, GoetheUniversity, the Conference on Securities Markets Trends, Risks and Policies, CONSOB-BAFFI CAREFIN,Bocconi University, the Swiss Society for Financial Market Research SGF Conference, the Nippon FinanceAssociation Meeting, and the CFS Conference on High Frequency Trading, for helpful suggestions. We alsothank the Tokyo Stock Exchange for providing us with anonymous detailed account-level data, which formedthe basis of the research reported on in this paper. This work was carried out with the generous financialsupport of EUROFIDAI, which we appreciate. We also thank the Research Center SAFE, funded by theState of Hessen Initiative for Research (LOEWE), for financial support. Darya Yuferova also gratefullyacknowledges the Vereniging Trustfonds Erasmus Universiteit Rotterdam for supporting her research visitto NYU Stern and is also grateful to Rotterdam School of Management, Erasmus University, where somework on this paper was carried out during her PhD studies.
Global equity markets have been fundamentally altered in the past decade due to vast
improvements in the speed of trading and the consequent fragmentation of market activ-
ity. Among other changes, in many markets, traditional market makers have been replaced
by high-frequency traders (HFTs), operating at the level of a few milliseconds or even mi-
croseconds.1 This increase in trading speed allows markets to operate far beyond human
capabilities, given that the average time it takes for a human to blink varies from 300 to 400
milliseconds. These technological developments have had a dramatic impact on the behavior
of liquidity providers and consumers in financial markets, and have implications for price dis-
covery. The resulting changes have led to intense debate and scrutiny from investors, market
makers, exchanges, and regulators regarding the advantageous, even unfairly advantageous,
status of HFTs in global markets.2
Regulators in many countries have been debating, and in some cases have implemented,
new regulations on HFTs in recent years. A financial transaction tax has been adopted by
France, Italy, and Canada. While there are many aspects of HFT activity and its impact
on global equity markets, two issues come to the fore in any policy discussion on the role of
HFTs. The first is whether HFTs contribute to price discovery in the sense that they improve
the incorporation of new information into asset prices in terms of speed and accuracy. The
second is whether they contribute to an improvement in market liquidity, which would permit
market participants to enter and exit a position in an asset rapidly and at a minimal cost.
These issues have to be posed in the context of the trading schedules of equity markets.
Many equity markets around the world have several distinct periods during the trading
day: the pre-opening period, when quotes are placed and trades may or may not occur, an
opening call auction, when buy and sell orders are crossed to determine an opening price,
and a continuous trading period, when normal trading activity occurs, with posted quotes,
orders, and trades. These three periods have different characteristics and the extent of HFT
activity may, therefore, vary across them.
In this paper, we aim to investigate the HFTs’ ability to contribute to price discovery
and liquidity provision in these three different periods. To our knowledge, we are the first to
1See Brogaard (2010), Jovanovic and Menkveld (2015), Hendershott and Riordan (2013), and Raman andYadav (2014), for evidence of this phenomenon.
2See Lewis (2014) for a popular account of this perspective.
2
investigate whether HFTs contribute to market quality in the pre-opening period (i.e., when
there are no trades) and in the opening call auction (i.e., when speed capacity is irrelevant).
It is important to examine the first two periods before analyzing the continuous period,
because the pre-opening period has very different characteristics. The pre-opening period
is the first time in the day that information accumulated overnight gets incorporated into
market prices, even if only quotes are posted and no trades occur. In contrast, the opening
call auction is the first time in the day (after the previous day’s closing) that market prices can
incorporate new information accumulated overnight, based on actual trades. The continuous
trading period, on the other hand, provides a much longer period of trading, but in the
context of the arrival of new information, which may affect market fundamentals. HFTs’
contributions to price discovery and liquidity may well differ between the three periods. We
focus, in this paper, on HFT activity in the pre-opening period and the opening call auction,
using the continuous trading period for comparative purposes. Given the growing presence
of very fast traders in the market, the manner in which price discovery occurs during the
pre-opening period is a crucial issue to be investigated, as is the liquidity provision during
the opening auction.
The main questions we address in this paper are related to the role of fast traders,
i.e., HFTs, in the pre-opening period, and the difference in trader behavior between this
period, on the one hand, and the opening call auction and continuous trading period that
follow, on the other. First, we investigate whether, in the absence of trading, HFTs still
participate in the pre-opening period and, if they do participate, whether they are more or
less active in the pre-opening period than during the continuous period that ensues. Second,
we investigate whether HFTs that are present in the pre-opening period contribute to price
discovery also in the continuous trading period that ensues. Third, we study whether HFTs
provide liquidity in the opening auction, and compare the liquidity provision that occurs
with that in the continuous trading period, again distinguishing between HFTs that are
present in the opening call auction and those that are present only in the continuous period.
In order to empirically investigate these questions, we use a unique dataset provided by
the Tokyo Stock Exchange (TSE), one of the largest stock markets in the world and the
market with the largest presence of HFT activity: 55% compared to 49% in the U.S. market
3
and 35% in the European market, as of 2013 (as documented by Hosaka (2014)). The TSE
is also unique in relation to other major stock exchanges in the world, since it has a market
share of over 90% of all Japanese stocks, while the NASDAQ and the New York Stock
Exchange, for example, have a market share of well under 30% of their markets. Also, our
analysis is not affected by information flows of stocks traded in multiple locations, because
the TSE trades in a different time zone than the major stock exchanges in Europe and
the U.S. (which trade some Japanese stocks directly or in the form of depositary receipts).
Finally, our data cover all 1,702 stocks traded on the First Section of the TSE, comprising
over 94.8% of the overall trading volume and 98.6% of the market capitalization of Japanese
stocks, with reliable timestamp data. Our analysis, therefore, refers to virtually the whole
Japanese market, and not a subset of it as has been the case in almost every prior study.
At the TSE, the execution of orders is not permitted during the pre-opening period and,
hence, buy/sell schedules can be crossed. In fact, traders cannot seek immediacy in this
period; therefore, HFTs that have the advantage of moving more quickly than other traders
in reacting to new information or order flow cannot employ their superior ability to achieve
speedy execution. This may result in almost no presence of HFTs in the opening auction
period, although this warrants empirical scrutiny. Therefore, it is interesting to investigate
the role played by HFTs during these periods.
A major challenge we face to investigate this question is to identify which traders are
HFTs. Our data relate to trading information at the disaggregated level of the virtual servers
used for trading.3 Based on virtual server usage, we are, therefore, able to infer account-level
trading. Hence, we are quite different from prior studies in the microstructure literature,
that lack access to such disaggregated data, and are either forced to rely on a HFT/non-HFT
flag or, when they do use account-level information, are able to cover only a small sample of
the market, and even then, typically focus only on the continuous period.
Moreover, our database permits us to dynamically disentangle the types of trader, on
a stock-by-stock, day-by-day, and period-by-period basis. Thus, it is comparable to stud-
3The study closest in spirit to ours is one by Brogaard, Hagstromer, Norden, and Riordan (2015), who usesubscription data for different speeds of co-location services as a screening device for HFTs. They distinguishbetween traders based on their usage of the low-latency facility, but do not have the relevant information onthe server configurations of individual trading desks that we do. Our data are far more granular than theirsand permit a more detailed day-by-day and stock-by-stock analysis.
4
ies having access to trader identification data and, hence, offers several advantages for re-
searchers that are worth highlighting. First, given the granularity of our data, one can check
whether there are differences between trader activity in the pre-opening period, the open-
ing auction, and the continuous trading period that ensues. In turn, our data allow us to
measure the impacts of different types of traders on price discovery and liquidity provision.
Thus, only with trader identification data one can shed some light on the price discovery and
liquidity consequences of HFT activity. Second, our data permit a comprehensive classifica-
tion scheme, which applies to the trading data on the stock-day-period basis. As we show
in our paper, traders tend to switch their type from one day to another, and from one stock
to the next; thus, the comprehensive nature of our data allows us to move away from the ad
hoc assumption of an immutable HFT classification: “once an HFT, forever an HFT.”
Using the granular data available to us, we classify traders into 12 subgroups based on
speed and inventory behavior during the continuous period. In terms of speed, we identify
three subgroups, namely FAST, MODERATE, and SLOW; in terms of inventory, we identify
four subgroups, namely LARGE, MEDIUM, SMALL, and NOTRADE, based on end-of-day
inventory. Although these two characteristics, speed and inventory, are generally used in the
literature to identify HFTs, they cannot be seen as perfect substitutes. Indeed, it would be
better to keep the two dimensions separate in the analysis of the data, which is what we
propose to do in our empirical work.
We investigate the issues defined above using the perspective of a policymaker who wishes
to assess the benefits of HFT activity in the equity market in the pre-opening period, in
the opening call auction and in the continuous period. We find that one quarter of HFTs
trading within the continuous period also participate in the pre-opening and opening auction.
However, even if they comprise only a minority of HFTs, their participation is highly relevant
in terms of the number of quotes they make. We examine the contribution HFTs make to
price discovery and find that they do contribute to it during the pre-opening period. Indeed,
compared to other types of traders, they are among the groups that contribute the most. We
also examine the price discovery contribution made by HFTs in the continuous period and
show that, as a group, they contribute to price discovery during that period as well (in line
with previous literature, as in Brogaard, Hendershott, and Riordan (2014)). However, the
5
subgroup of HFTs that actively participates in the pre-opening section does not contribute
to price discovery during the continuous period. This indicates that, while HFTs contribute
to price discovery both in the pre-opening and in the continuous period, there is considerable
heterogeneity in their contributions by subgroups.
In terms of the HFTs’ liquidity contribution during the opening call auction, our analysis
shows that HFTs significantly contribute to liquidity provision during the opening call. In
line with the previous literature, however, we find that HFTs consume liquidity during the
continuous period. The subgroup that actively participates during the pre-opening period,
though, contributes to liquidity provision during both the opening call auction and the con-
tinuous period. For all three metrics of HFT activity - (i) participation, (ii) price discovery,
and (iii) liquidity provision - we perform several detailed analyses, aiming to disentangle the
contribution of HFTs conditional on systematic and idiosyncratic volatility. Overall, we find
that HFTs do not harm market quality when systematic or idiosyncratic volatility is high.
The outline of the paper is as follows. In Section I, we survey the literature on HFTs,
price discovery and liquidity provision. In Section II, we provide a detailed description of the
research issues, the hypotheses we investigate, and the empirical methodology we employ.
Section III describes the institutional details of the TSE, particularly for HFTs, and the
special features of our database. In Section IV, we describe the data-filtering procedures we
use to identify the 12 trader groups based on activity during the continuous period. Our
empirical analysis and results are presented in Section V. Section VI presents our robustness
checks and Section VII concludes.
I. Literature review
Our study contributes to the empirical literature on the impact of HFT activity on var-
ious measures of market quality, i.e. price discovery and liquidity provision. The recent
HFT-specific theoretical literature deals with the speed advantage of HFTs in terms of in-
formation processing and trading. Most of it focuses only on the continuous trading session.
Their greater speed allows HFTs to react more quickly to public news than other traders
(as in theoretical research by Cespa and Foucault (2011), Pagnotta and Philippon (2011),
6
Aıt-Sahalia and Saglam (2014), Jovanovic and Menkveld (2015), Budish, Cramton, and Shim
(2015), Biais, Foucault, and Moinas (2015) and Foucault, Hombert, and Rosu (2016)). The
body of empirical studies on HFT trading activities is growing rapidly. For a review of this
burgeoning literature, see Jones (2013) and Biais and Foucault (2014). Studies on HFTs and
market quality include Hendershott and Moulton (2011), Hendershott, Jones, and Menkveld
(2011), Easley, de Prado, and O’Hara (2012), Hendershott and Riordan (2013), Malinova,
Park, and Riordan (2013), Boehmer, Fong, and Wu (2014), Brogaard, Hendershott, and Rior-
dan (2014), Menkveld (2013), Brogaard, Hagstromer, Norden, and Riordan (2015), Gomber,
Arndt, Lutat, and Uhle (2011), Menkveld (2013), Chaboud, Chiquoine, Hjalmarsson, and
Vega (2014), Hagstromer and Norden (2013), Baron, Brogaard, Hagstromer, and Kirilenko
(2016), and Kirilenko, Kyle, Samadi, and Tuzun (2016). The focus of most of this literature
is on the continuous trading session, rather than the pre-opening period of the trading day.
However, none of these studies describe how HFTs prepare their positions during the pre-
opening period, in anticipation of the continuous trading session, nor do they investigate the
behavior of HFTs that carry inventories overnight. In contrast to the prior literature, the
particular emphasis of this paper is on HFT behavior in the pre-opening period: If HFTs
indeed have superior information-processing ability then it will be advantageous for them to
place orders in the pre-opening period as well.
Our research is also related to the microstructure of trading activity in the market pre-
opening period. The pattern of the market pre-opening trading has been studied in the
earlier literature (e.g., by Amihud and Mendelson (1991), Biais, Hillion, and Spatt (1999),
Cao, Ghysels, and Hatheway (2000), Ciccotello and Hatheway (2000), Madhavan and Pan-
chapagesan (2000), and Barclay and Hendershott (2003)). However, much of this literature
is dated, and is based on research conducted well before the rapid growth in the number
of HFTs over the course of the past decade or so. It is, therefore, necessary to examine
trading activity in the pre-opening period once again, given the dramatic changes that have
occurred since the advent of HFT activity. In summary, our paper is related to the previous
and current literature on HFTs, but differs in several dimensions. First, it relies on a unique
characterization of HFTs that is derived from the specifics of the trading technology (as de-
scribed in detail in Section IV below), rather than relying merely on trading metrics. Second,
7
we use the whole market sample to identify different trader groups on the TSE, while other
papers have relied on reasonably complete information, but for a much smaller subset of the
market. Our reliance on the identification of server IDs permits us to get around the problem
of limited access to client-specific trading data, and yet obtain complete data for the whole
market. Third, to our knowledge, there are no papers that investigate the impact of HFT
activity on the price discovery process in the pre-opening period and liquidity provision in
the opening call auction. Our paper aims to fill this void.
II. Research issues, hypotheses and methodology
We take the perspective of a policymaker who wishes to assess the benefits of HFT
activity in equity markets. Hence, our perspective is positive: What is the impact of HFTs
on the functioning of such markets?4 There are two principal potential benefits of such
activity for markets: price discovery and liquidity. Price discovery refers to the speed and
unbiasedness of the process by which new information, revealed through trading and posting
quotes, is incorporated into the market price of an asset. Liquidity refers to the speed and
cost of entering and exiting an existing position in the asset in a small time interval.
A. Research issues
The quoted or traded price of an asset changes in response to the arrival of new informa-
tion. In addition, a trade or even a quote by one market participant, either in response to the
information, or for other reasons such as liquidity, may influence other market participants to
change their quotes. Hence, in a market where multiple players are posting quotes, prices are
constantly changing for both reasons: information and the trading itself. A natural question
that arises with regard to assessing the effectiveness of any market innovation or structural
change is whether it influences the speed with which the market price incorporates the twin
influences of information and trading, and also whether and how rapidly that price converges
to its equilibrium value. While equilibrium values may be difficult to assess in fast-moving
4We defer normative issues such as the optimal strategy for an HFT, including order placement, size,time, etc., to future research.
8
markets, with the constant arrival of new information, it may be easier to assess how closely
prices adjust to the price that will prevail at a particular point in the future, when several
trades are likely to occur. For example, if quotes are being placed in the pre-opening period,
a natural question would be whether a quote for a particular asset moves the price towards or
away from the price that is going to prevail in the opening call auction. This is the concept
of price discovery that we will explore in detail in this paper:
DEFINITION: Price discovery is defined as the effect of a given quote, trade, or type of
trader on the deviation of the mid-price from the price that will prevail at a particular point
in the future.
A parallel question arises in relation to whether a given quote improves or deteriorates
the liquidity in the market, as defined by its impact on immediacy and/or the price impact of
the execution of orders. In general, a trade or order that reduces the effective bid-ask spread
can be said to improve liquidity. To illustrate, if more quotes or orders are being placed
on one side of the market than the other, there is a greater imbalance, and hence a decline
in liquidity. For instance, if a particular type of trader decreases this imbalance between
demand and supply, she is said to improve liquidity. In that sense, liquidity provision (or
consumption) measures the extent to which a particular trader mimics the behavior of a
designated market maker (who provides liquidity) or an informed trader (who consumes
liquidity). Hence, the definition of liquidity in our context is:
DEFINITION: Liquidity is defined as the effect of a given quote, trade, or type of trader on
the reduction in the imbalance between the demand and supply of an asset in the market.
Given these broad conceptual definitions of price discovery and liquidity, we frame the
research issues that we seek to investigate:
1. Do HFTs participate in the pre-opening period, despite the fact that no trading occurs
during that period of time? If so, what is their level of activity?
2. Do the same HFTs participate in all three time segments, pre-opening, opening call
auction, and the continuous periods?
3. Do HFTs participate in the opening call auction and, if so, with what intensity?
9
4. What is HFTs’ contribution to price discovery in the pre-opening and continuous pe-
riods?
5. What is HFTs’ contribution to liquidity in the opening call auction and continuous
periods?
B. Hypotheses
We address the above questions in terms of specific empirical hypotheses, which are listed
below:
HYPOTHESIS 1: HFTs are the most active participants in the pre-opening, opening call
auction, and continuous periods.
This hypothesis establishes that HFTs are significant players in the market.
HYPOTHESIS 2: Of all types of trader, HFTs contribute the most to price discovery in the
pre-opening and continuous periods.
Although there is no trading in the pre-opening period, the placement of quotes by the
various traders has an impact on price movement during that period. In addition, the
opening call auction that follows is a result of the price discovery process during the pre-
opening period.
HYPOTHESIS 3: Of all types of trader, HFTs contribute the most to liquidity in the opening
call auction and the continuous period.
Liquidity can be measured only when there is actual placement of orders and trading
occurs, and not with the mere posting of quotations. Hence, it is relevant to speak of
liquidity only in the case of the opening call auction and the continuous period.
C. Methodology
C.1. HFT participation
The key issue in addressing Hypothesis 1 is the presence of HFTs during the pre-opening
section, characterized by the absence of trading. We also aim to test whether they have
10

a presence that is larger than that of the other types of trader, and whether a significant
proportion of HFTs participate in the pre-opening section. We investigate this hypothesis
by looking first at their presence in the pre-opening period, the opening auction, and the
continuous period. We define the trader presence ratio as the percentage of traders in trader
group l that submit at least one quote for stock j, on day k, in any of the sections of the
day. More formally,
PRp,j,k,l =Number of trading desksp,j,k,l∑p
Number of trading desksp,j,k,l(1)
where p is the period considered (pre-opening, opening auction, continuous) for stock j, on
day k, for the trader group l. Therefore, the Number of trading desksp,j,k,l is the number of
traders in trader group l that submit at least one quote for stock j on day k in period p.
We then investigate their presence in the pre-opening (and the continuous) period using
the activity ratio based on the number of quotes:
QARp,j,k,l =Number of quotesp,j,k,l∑l
Number of quotesp,j,k,l(2)
where p is one of the two periods considered, pre-opening or continuous (there are no quotes
in the opening auctions, only trades), and where the ratio relates to stock j, day k, and
trader group l.
For the opening auction, we calculate the activity ratio by considering the number of
shares traded, instead of the number of quotes:
TARp,j,k,l =Number of shares tradedp,j,k,l∑l
Number of shares tradedp,j,k,l
(3)
where p is one of the periods considered (opening auction or continuous), for stock j, day k,
and trader group l. We calculate this other ratio for the continuous period as well.
11
C.2. Price discovery
The key issue in addressing Hypothesis 2 regarding price discovery is the informativeness
of trading by HFTs. We investigate which trader groups contribute to the price discovery
process, and compare the extent of their contributions using order-by-order (trade-by-trade)
data and associated quoted (traded) price changes. In this manner, we take advantage of our
detailed data, as we can pinpoint an order (trade) that moves the quoted (traded) price and,
thus, we can identify which trader group submitted that order (initialized that trade) and
the type of the order. We measure the amount of new information incorporated into stock
prices using the weighted price contribution (WPC) suggested and used also by Barclay and
Warner (1993), Cao, Ghysels, and Hatheway (2000), and Barclay and Hendershott (2003).
The WPC measures how much the prices deviate from the price that will prevail at a later
date, for instance between the pre-opening period and the opening call auction. We apply
the same methodology for both the pre-opening and the continuous period. Specifically, for
the continuous period we concentrate our analysis only on the first thirty minutes because
we wish to compare the behavior of traders between the pre-opening and the continuous
period with a minimal effect from new information.
First, we define the price discovery contribution as the amount by which an incoming
order (trade) moves the quoted (traded) price closer to the reference price. Thus, we com-
pute the price discovery contribution (PDC) on an order-by-order (trade-by-trade) basis, as
follows:
PDCi,j,k = Deviationi,j,k −Deviationi−1,j,k (4)
where Deviationi,j,k is calculated in two different ways for the pre-opening and continuous
periods, but with a reduction in the deviation being viewed as price discovery.
For the continuous period, the deviation of the trading prices from the price at 9:30 a.m.
is calculated as
Deviationi,j,k =
∣∣∣∣ Pi,j,k
P930j,k
− 1
∣∣∣∣× 100 (5)
where Pi,j,k is the trading price at the time of the i-th transaction, for stock j, on day k, and
P930j,k is the price at 9:30 a.m. for stock j on day k. In order to determine the price during
12
the first 30 minutes of continuous trading, we use the average trading price between 9:30 and
9:35 a.m. to avoid the bid-ask bounce problem. Deviationi,j,k in this case is the absolute
deviation from the price at 9:30 a.m., of the traded price at the time of the i-th trade, for
stock j on day k (see equation (5)). Similarly, Deviationi−1,j,k is the absolute deviation from
the price at 9:30 a.m., of the traded price at the time of the (i− 1)-th trade, for stock j on
day k.
The amount by which Deviationi,j,k is lower than Deviationi−1,j,k is the contribution
to price discovery made by the order that initiates the i-th trade. Orders that initiate the
transaction are new market orders and new or revised limit orders that either lock in or
“cross” the prevailing bid-ask spread.5 We discard those transactions from the continuous
trading period for which we cannot identify the initiating order.6 We refer to orders that
initiate a transaction as “aggressive orders” (as in Biais, Hillion, and Spatt (1995), Ranaldo
(2004), Duong, Kalev, and Krishnamurti (2009), and Yamamoto (2011)). For the pre-
opening, Deviationi,j,k is defined as
Deviationi,j,k =
∣∣∣∣Mi,j,k
Oj,k
− 1
∣∣∣∣× 100 (6)
where Mi,j,k is the quoted price at the time of arrival of order i for stock j on day k, and
Oj,k is the opening price for stock j on day k.
Deviationi,j,k in this case is the absolute deviation of the quoted price from the open-
ing price, immediately after order i is entered for stock j on day k (see equation (6)).
Deviationi−1,j,k is the absolute deviation of the quoted price from the opening price, imme-
diately before order i is entered for stock j on day k. The amount by which Deviationi,j,k is
lower than Deviationi−1,j,k is the contribution to price discovery made by order i.
Among the orders submitted during the pre-opening period, we can identify those orders
with the potential to impact the prevailing quotes. We call them “aggressive orders” (as
5Locked limit orders are orders with the limit buy (sell) price equal to the best ask (bid) price, whilecrossed limit orders are orders with limit buy (sell) price greater (smaller) than the best ask (bid) price (seeCao, Ghysels, and Hatheway (2000)).
6If an order imbalance causes a larger price change than the pre-specified amount (e.g., the maximumprice change between two trades is 70 Japanese Yen in the price range 3000-5000 Japanese Yen), the TSEstops continuous trading and conducts a call auction. The TSE disseminates special quotes to notify themarket about the trading halt. In our sample, less than 1% of the trades fall into this category.
13
for the continuous period described above). The TSE uses unique rules for determining the
best pre-opening bid and ask quotes. These rules are different from those applied in the
continuous period and are briefly explained in Section III and in the Internet Appendix A.
There are four cases in which we categorize an order as aggressive: (1) all market orders; (2)
a limit buy order with a limit price greater than or equal to the prevailing best bid; (3) a
limit sell order with a limit price less than or equal to the prevailing ask; and (4) any orders
submitted at a time when the best bid equals the best ask.7 When PDCi,j,k as defined in
equation (4) is negative, the deviation is reduced and the quoted (traded) price moves closer
to the reference price. We define the WPC for stock j, day k, and order i as
WPCi,j,k =PDCj,k∑
j
|PDCj,k|× PDCi,j,k
PDCj,k
(7)
where PDCi,j,k is the price discovery contribution of order (trade) i, for stock j, on day
k; PDCj,k is the accumulated price discovery contribution for stock j, on day k. The first
term of WPC is the weighting factor for the stock j on day k. The second term is the
percentage contribution made by order (trade) i to the total price discovery, during either
the pre-opening or the continuous period, for stock j on day k. Since the size of PDC varies
for each stock and each day, the relative contribution adjusts for the scale difference across
stocks as well as across trading days, while the first factor adjusts for the relative importance
of price discovery across stocks on day k. When PDCj,k equals zero, we do not compute
WPC for stock j on day k. We also winsorize PDCi,j,k at the 0.1% and 99.9% levels.
There are several approaches in the existing literature, for measuring price informative-
ness. For example, Hasbrouck (1995) develops a methodology for estimating information
shares. In addition, Van Bommel (2011) summarizes three prominent alternatives that have
been used widely in the literature: (1) the variance ratio; (2) the R2 of the regression of
unbiasedness of prices; and (3) the weighted price contribution (WPC), which is the one
7Such a situation occurs when the cumulative amount of buy orders equals that of sell orders. Thus,the next order must cause an imbalance between buy and sell orders, and make the best ask higher thanthe best bid price. We refer to such orders as “locked orders.” Cao, Ghysels, and Hatheway (2000) analyzelocked/crossed market quotes during the NASDAQ pre-opening period. In the TSE’s pre-opening period,the market best quotes may be locked, which means that the best ask equals the best bid, but crossed quotes(which means that the best bid is greater than the best ask) never happen, by rule.
14
used in this paper. In simple terms, the variance ratio compares the variances in, say, the
pre-opening period and the continuous period, and the test looks at whether that ratio is
equal to one. The R2 of the unbiasedness regression tests, for example, whether the evolution
of prices in the pre-opening period is an unbiased predictor of the prices in the call auction.
Van Bommel (2011) argues that, if the price process is a driftless martingale, only the WPC
is an unbiased estimator for the return variance explained during a time interval. On top of
this, we prefer using the WPC methodology to the other metrics for a variety of reasons.
First, we do not take a position on price efficiency or the long-term fundamental value of
the asset. Rather, we measure the deviation with respect to the price observed later, at a
given point in time. Our concept of price discovery is, therefore, different from the informa-
tion share measure developed by Hasbrouck (1995) and Hasbrouck (2002), which requires
the notion of an unobservable efficient price. In fact, thanks to the granularity of our data
to identify the actions of individual traders, we are not constrained to merely document a
statistical relationship between trading intensity and subsequent price movements, but are
able to provide a detailed analysis of how each action by a given trader can move the price,
all other influences being held fixed.
C.3. Liquidity
Since our data provide information at the millisecond level on trade size, trade direction,
and the initiator of the trade, we can study, in detail, for each trade, whether liquidity is
provided or consumed, and by which trader. There are several alternative proxies that could
be used to analyze market liquidity, but for our purpose here, we define liquidity provision
(consumption) depending on whether a trader acts like a market maker (taker). In other
words, during the continuous period, a liquidity provider is one that posts orders that do
not initiate trades: orders that are not market orders or marketable limit orders. We look,
in detail, at all such orders and calculate for each trader group, each trade, each stock, and
on each day, the following liquidity provision (LP) and liquidity consumption (LC) ratios for
the continuous period:
LPi,j,k,l =Number of shares tradedi,j,k,l | Traderl does not initiate trade
Total traded volume of first 30 minutes of continuous periodj,k
(8)
15
LCi,j,k,l =Number of shares tradedi,j,k,l | Traderl initiates trade
Total traded volume of first 30 minutes of continuous periodj,k
(9)
where LP represents the liquidity provision and LC the liquidity consumption of trade i for
stock j on day k. We then define the net liquidity provision for the continuous period by
calculating the difference between the two ratios, that is
NLPi,j,k,l = LCi,j,k,l − LPi,j,k,l (10)
We calculate a similar measure for the opening call auction. In this case, we assume that
the trader is a liquidity provider when she is trading in the opposite direction of the market.
Otherwise, she is a liquidity consumer. We define the direction of the trade by analyzing the
difference between the opening call auction price Pa and the closing price of the day before
Pc. When Pa > Pc (Pa < Pc), a selling (buying) trade is trading against the market and is
therefore providing liquidity, and a buying (selling) trade is demanding liquidity. Based on
this definition, we calculate, for the opening call auction,
LPi,j,k,l =Number of sharesi,j,k,ltraded against the market
Total traded volume of the auctionj,k
(11)
LCi,j,k,l =Number of sharesi,j,k,l traded in the same direction as the market
Total traded volume of the auctionj,k
(12)
We then calculate the net liquidity provision for the opening call auction by calculating the
difference between the two ratios, as in equation (10) above.
C.4. Testing methodology
In the previous subsections, we have defined the different measures we employ to inves-
tigate the three hypotheses. For these measures, we report their averages and test whether
these ratios are statistically different to those of the other trader groups by estimating the
following panel regression:
Yp,j,k,l = a0,p +∑
al,p ∗ Il + ep,j,k,l (13)
16
where Yp,j,k,l is the investigated measure, that is, participation measured by QAR or TAR,
price discovery by WPC, and liquidity provision by NLP . p is the period considered (pre-
opening, opening auction, continuous) for stock j, on day k, for trader group l. Il is a
dummy variable that equals 1 for trader group l. We then test whether the coefficients al
are statistically different from zero, and statistically different between one trader group and
another.
We also perform a second test for whether (i) the HFT presence, (ii) the price discovery
contribution, and (iii) the liquidity provision are statistically larger than all the other trader
groups considered as non-HFTs, in line with the analysis presented in the previous literature.
More formally, we estimate the following regression:
Yp,j,k,l = a0,p + aHFT,p ∗ IHFT + ep,j,k,l (14)
where p is the period considered (pre-opening, opening auction, continuous), for stock j, on
day k, for trader group l, and IHFT,p is a dummy variable that equals 1, for the trader group
that we identify as HFT using the methodology described below.
III. Institutional structure and data description
A. Institutional structure of HFT on the TSE
The trading schedule for the TSE is characterized by two separate trading periods, one in
the morning and one in the afternoon, along with two pre-opening periods (one early in the
morning and the other in the middle of the day).8 Figure 1 provides a representation of the
different trading periods. In each trading period, morning and afternoon, the opening price
is determined by a single price auction (“Itayose” in Japanese) that kicks off at 9:00 a.m. in
the case of the morning session, and at 12:30 p.m. in the case of the afternoon session, based
8In Japan, there are two private venues, SBI Japannext and ChiX-Japan, whose trading periods startbefore 9:00 a.m.; however, very little trading occurs before 9:00 a.m. It should be mentioned that, for theNikkei Stock Index Futures, traded on the Singapore Stock Exchange (SGX) in Singapore, trading starts at8:45 a.m., Tokyo time, and such trading may also contribute to price discovery.
17
on buy and sell orders accumulated during the pre-opening periods that precede them.9
[Place Figure 1 about here]
The opening time on the TSE is not randomized, as happens on some European ex-
changes such as Deutsche Bourse. As soon as the opening price of a stock is determined,
the continuous trading period for the stock commences. Thus, these three-periods segments,
the pre-opening, the opening call auction, and the continuous trading periods, are connected
seamlessly. In the pre-opening period, investors are free to submit orders as they do in the
continuous period. There are two general types of orders allowed on the TSE: limit orders
and market orders.10 Each trading day, the TSE starts receiving orders from its member-
brokers at 8:00 a.m. (12:05 p.m. for the afternoon session), and does so without executing
any orders until the single price auction for the market opening begins, at 9:00 a.m. (12:30
p.m.).
As soon as the TSE receives orders, it disseminates the pre-opening quotes, not just the
best ask and best bid, but 10 quotes above and below the best quotes, to the market.11 Every
time the exchange receives an order, the pre-opening quotes are refreshed. The best ask (bid)
is identified as the smallest (largest) ask (bid) price at which the cumulative depth of the
ask (bid) schedule is greater than the cumulative depth of the bid (ask) schedule. A detailed
description of the determination of the best bid and ask, and the rules are reported in the
Internet Appendix A. The principle underlying the order matching is based on price and
time priority in the continuous period. In the opening call auction, however, time priority
is ignored. That is, all orders placed in the pre-opening period, before the opening price has
been determined, are regarded as simultaneous orders.
The opening auction determines the price at which the largest number of executions (in
terms of number of shares) is possible. There are three conditions to be met at the auction:
9Single price auctions are used to determine closing prices as well. The rules for the establishment of theclosing call auction price are slightly different from those for the opening call auction price. See TSE (2015).
10Traders can specify that an order only be eligible for execution at the opening auction. Should it not beexecuted at the opening auction, such an order will be cancelled automatically, rather than being moved tothe continuous trading period.
11A subscriber to the “full quotes” service would be able to see information (price and quantity) on theentire order book. However, the quantities for the best ask and the best bid will be the same as for thestandard service.
18
(1) All market orders must be executed at the opening price. (2) Orders with a sell limit
price lower than the opening price, and buy limit price higher than the opening price, must
be executed. (3) Buy and sell orders with limit prices equal to the opening price must be
executed for the entire amount on either the buy or the sell side. The third condition suggests
that, often, orders on either side, whose limit prices are equal to the opening price, are not
fully executable. If this happens, the TSE allocates the available shares to participating
member firms on a pro-rated basis.12 As explained above, the speed (or timing) of order
submission does not matter during the pre-opening period because of the lack of time priority
in the opening call auction. Therefore, investors care about the timing of their submission
only due to the third condition above, and the treatment of unfilled orders in the continuous
period, when time priority is activated. It should be noted that the feature of the opening
call auction, whereby there is no time priority for limit orders submitted during the pre-
opening period, can cause delayed order submissions, price revisions, and cancellations, until
just before market opening.
B. Virtual server IDs and data
We use order data covering the complete history of an order (new order entry, execution,
revision of quantity or price, and cancellation in the pre-opening and continuous trading
periods) obtained from the TSE. Each historic record is time-stamped at the millisecond
level, and includes information on order type, side (buy or sell), number of shares, limit
price, unique order number, and virtual server ID. We also use data on the filled orders,
and unfilled orders (cancelled immediately) for the opening call auctions, during the period
of our study, between April 1 and May 31, 2013. We focus on April and May 2013 since
the volatility of the stock market rose around that time, after the new governor of the Bank
of Japan, Haruhiko Kuroda, announced a new aggressive quantitative easing (QE) policy
for the bank. Given the structural change in the regime, a number of unexpected events
occurred during this period, rendering the role of the pre-opening quotes more crucial than
at any other time.
The unique feature of this study is that we use novel data provided by the TSE, which
12For further details of pro-rated allocation refer to TSE (2015, pp. 28–20).
19
include the unique IDs of the VS.13 We find that 5,580 VS were used in the sample period
considered. However, we observe that orders pertaining to the same stock are sometimes
submitted by different VS; for example, an order submitted by VS “A” was cancelled by VS
“B.” To determine the relationship between VS, we therefore investigate the entire universe
of stocks traded on the TSE’s First Section in the period considered, that is all 1,702 stocks.14
By combining all the order and trade information from the market in our sample period,
we identify 3,021 groups of VSs which we call traders because they represent trading desks.
Figure 2 depicts the sizes of the traders based on the number of VS they employ. Among
the 3,021 traders, 329 utilize between two and 41 VS, while the rest (2,692) use only a single
VS.15
[Place Figure 2 about here]
Thanks to our matching procedure, our database is similar to the one with the anonymous
trader identifiers, because we are able to track the traders’ behavior through time. To
our knowledge there are only few studies in the HFT literature that use a database with
user/trader identifier: Hagstromer and Norden (2013), Malinova et al. (2013), Menkveld
(2013), Brogaard et al. (2015), Baron et al. (2016), and Korajczyk and Murphy (2015). The
data typically come from Nordic (NASDAQ OMX) or Canadian (Toronto Stock Exchange)
markets, with the exception of Menkveld (2013) who focuses on the Dutch market. However,
market fragmentation poses an important limitation for the abovementioned studies and, in
particular, for the coverage of platforms on which a particular stock is traded. Even if the
data cover not only regulated exchanges, but also alternative trading venues, such additional
data are limited to the country under investigation, thus excluding, for instance, the data
regarding traders’ behavior in respect to Canadian stocks being traded in U.S. markets.
Moreover, even if information from different platforms is available, it is not a trivial task to
13The Virtual Server (VS) is the logical path established between TSE’s system (matching engine) and auser’s system in order to communicate with each other. Internet Appendix B describes the typical setup ofmultiple VSs used by one trader.
14Stocks listed on the TSE are split into different sections based on their market capitalization, the numberof shareholders, and other parameters. The First Section of the TSE includes relatively large companies,and comprises about 94.8% of the overall trading volume and 98.6% of the market capitalization.
15In contrast to Brogaard, Hagstromer, Norden, and Riordan (2015), who use the grade of the co-locationservice as a categorizing device for measuring the speed requirements of traders, we focus instead on howtraders configure their respective trading environments.
20
synchronize the time stamps of trades and quotes across different venues, which makes it
virtually impossible to analyze which particular order moved a particular price. In contrast
to the Nordic and Canadian equity markets, the Japanese market exhibits a very low degree
of fragmentation. In particular, only 6.5% of the total trading volume in 2013 was hosted
by private venues other than the TSE.16 Besides that, when the Japanese market is open,
most major markets in North America and Europe are closed.
Last but not least, the Japanese market is a bigger market than the Nordic and Canadian
ones and, thus, likely to attract more HFT activity. In fact, as mentioned above, according
to Hosaka (2014) the TSE market has an HFT presence of 55% of trades, compared to 49%
in the U.S. and 35% in Europe. All in all, our data have an important advantage over the
data previously used in the literature as they allow us to avoid issues that arise from market
fragmentation and therefore allow us to provide a more complete picture of HFT activity.
To our knowledge, we are also the first to utilize trade/quote data with trader identifiers to
analyze the pre-opening period. It should be stressed that our data are composed of all the
stocks in the TOPIX100, the index of major stocks, in Japan. Additionally, we do not have
concerns about market segmentation.
Table I presents the characteristics of the traders, based on the trading environment of
the 1,702 stocks in the TSE’s First Section. As the table shows, the median number of stocks
traded per day, per group of VSs, ranges from 183 when only one VS is used, to 963 when
40 VSs are used. The median number of stocks traded, per VS, decreases monotonically
from the group that uses only one VS (183 stocks) to the group that uses 20-29 VSs (16
stocks). Increasing the number of VSs beyond 30 leads to an increase in the number of stocks
allocated to each VS. We also investigate the maximum speed capabilities of the different
traders as well as the end-of-day inventories. We measure the speed as the minimum time
that elapsed between two consecutive order submissions for the same stock. Traders with
just a single VS place orders with a median speed of 12 seconds, and a median inventory
of 100%. These characteristics match those of retail and wholesale brokers, which typically
have several buy-side customers. For traders that use multiple VSs, as the number of VSs
16Chi-X Japan accounts for 2.7% of market share, while Japannext PTS accounts for roughly the 3.8% ofthe market share. See Chi-X (2013) and Japannext (2013).
21
used by a trader increases from two to 41, the median speed moves to one millisecond;
therefore, as soon as the number of VSs used increases, speed increases as well. The median
inventory varies considerably across traders, but is negatively related to the number of VSs
used, reflecting the variety of investment horizons among them, and indicating that traders
with higher speeds usually hold less inventory at the end of the day. In the TSE, some
traders, such as HFTs, use multiple VSs exclusively because of a limitation on the number
of quotes submitted per second for each VS.17 As the table shows, by using multiple VSs,
the traders are able to increase their trading speed significantly.
[Place Table I about here]
C. The universe of stocks and the sample period
For our analysis on market quality, we limit the sample of stocks to the constituents of
the TOPIX100 index, during April and May 2013. This index is comprised of stocks from
the TSE’s First Section, with high liquidity and relatively large market capitalization, and
comprises over 60% of TSE market capitalization. Of the TOPIX100 stocks, we exclude
three that have larger trading volumes in exchanges other than the TSE, since the focus of
our study is the trading system on this exchange.18
In our analysis, we exclude stock-days for which special quotes are disseminated before or
during the single price auction, because orders submitted during the pre-opening period do
not meet the normal opening price rules. For the purpose of our analysis, we concentrate on
three periods: the pre-opening section excluding the first 10 minutes, the opening auction,
and the first 30 minutes of the continuous period. We exclude the first 10 minutes of the
pre-opening period because during the first 10 minutes, the limit order book accumulates
17The TSE provides three levels of service, with a maximum of 60, 40, and 20 quotes per second, respec-tively. We refer to all messages, including cancellations, in our definition of quotes. According to a prominentHFT, for a trader that wishes to be truly anonymous, at least 20 VSs are necessary, in order to implement astrategy of trading 1,500 stocks all at once. If the HFT also needs to cancel several orders immediately aftersubmitting new ones, an additional 20 VSs may be required, making a total of 40 VSs necessary to supportintensive HFT activity across multiple stocks. Using multiple VSs, each trader optimizes the performanceof the trading operations for their subset of stocks. Some traders operate within a specific group of stocksevery day, in which case they may fix the allocation of stocks to each VS. Other traders may change part oftheir allocation on a day-by-day basis.
18The three excluded stocks are Murata, Nintendo, and Nihon Densan.
22
many orders that were waiting overnight for the beginning of the pre-opening period. The
arrival times of these orders are not directly related to the traders’ actual submission de-
cisions. Therefore, in our analysis of the pre-opening period, we focus on the remaining
50 minutes, during which traders monitor pre-opening quotes and make order submission
decisions accordingly.19
We focus on the first 30 minutes of the continuous trading period, as we wish to analyze
the difference in trader behavior, based on the same information, but in different trading
periods: the pre-opening period, the opening call auction, and the continuous trading period.
If we extended the sample to the full continuous trading period, we would contaminate our
analysis with new information arriving in the market later in the trading day, and harm the
comparability with the other periods.
IV. HFT identification
The data we have allow us to (i) track trader behavior, (ii) cluster traders into several
different groups and, in particular, (iii) identify HFTs.
A. HFT identification strategy
A useful guideline defining the features of HFTs has been presented by the U.S.’s Se-
curities and Exchange Commission (SEC). The document, (SEC, 2010, p. 45), lists five
characteristics of HFTs:
1. “Use of extraordinarily high speed and sophisticated programs for generating, routing,
and executing orders.”
2. “Use of co-location services and individual data feeds offered by exchanges and others
to minimize network and other latencies.”
3. “Very short time-frames for establishing and liquidating positions.”
4. “Submission of numerous orders that are cancelled shortly after submission.”
19The inclusion of the first 10 minutes heavily affects the WPC, measures. However, the role of HFTs isqualitatively similar, if we include the first 10 minutes in the analysis.
23
5. “Ending the trading day in as close to a flat position as possible (that is, not carrying
significant, unhedged positions overnight).”
Motivated by this list of characteristics, we use both speed and inventory to classify traders.
These two metrics are closely related to all five characteristics listed above: speed matches
characteristics 1, 2, and 4 above, while inventory matches characteristics 3 and 5. The speed
is largely determined by the trading infrastructure in which each trading desk invests (the
number of VSs, the software programs used, the quality of servers installed, etc.), and which
is not easily replaceable in the short run, whereas inventory is closely related to trading
styles, such as those exhibited by buy-side investors, market makers, and arbitrageurs.
With these two measures in mind, we are able to investigate how the different traders’
behavior affects the pre-opening period. One issue we have to address in our classification is
whether the members of different groups of traders remain the same across time and stocks.
To our knowledge, HFTs engage in a variety of strategies that do not necessarily remain the
same from one day to the next or across stocks. In fact, HFTs implement multiple algorithms
depending on whether they believe that the liquidity-taking or the liquidity-making strategy
offers more profitable opportunities for a given stock on a given day. Therefore, we can
assume that traders can engage in different types of trading strategies on a stock-by-stock
and day-by-day basis. Keeping this type of strategic behavior in mind, we compute our
metrics on a per-stock, per-day basis, for all trading desks.
A.1. Speed
We empirically measure the minimum elapsed time between two consecutive order sub-
missions for the same stock, without any restrictions, for a combination of two order types
(i.e., any two out of new orders, cancellations, and revisions during our sample period), as
a measure of speed.20 We refer to our measure of time elapsed, using the time stamp of the
order, as speed. In other words, a high speed means a short elapsed time between order
submissions. Some authors refer to this concept as latency, but we prefer to use speed since
20Hasbrouck and Saar (2013) measure low-latency activity by identifying “strategic runs,” which are linkedsubmissions, cancellations, and executions that are likely to be part of a dynamic strategy. However, theirdata do not enable them to identify individual traders as we can.
24
we take latency to have connotations of the technological limits of speed, rather than the
actual speed realized. Henceforth, we simply call our measure “speed”.
A realization of a very high speed has to be supported by the appropriate trader’s in-
frastructure. Hence, the number of VSs a trader uses is a crucial determinant of her speed.
As noted earlier, we observe varying numbers of VSs, ranging from one to 41, used by the
same trader, in our sample period. We also find that the number of stocks allocated to an
individual VS is negatively associated with the speed of the trader and vice versa.21
A.2. Inventory
The other major classification variable we employ is the inventory of the trader. Trader
inventory is estimated as the (absolute) ratio of the buy volume minus the sell volume at the
end of day k, divided by the total trading volume of the trader on that day. Many empirical
studies report that the key characteristic of HFT liquidity providers is a flat inventory
position at the end of each trading day (Menkveld (2013), Kirilenko, Kyle, Samadi, and
Tuzun (2016), and SEC (2014)). To investigate this issue further, we compute the end-of-
day inventory for each trader and for each stock, as well as intraday inventory, volatility of
intraday inventory, and the number of times during the day that the inventory crosses zero,
per trader-stock-day.
A.3. Classification
We classify all traders according to observed speed and inventory during the continuous
trading period for each stock-day. We apply the following classification scheme: We divide
all traders, based on their speed, into three groups: FAST, MODERATE, and SLOW. For
each stock-day, the SLOW group includes traders with a speed greater than 60 seconds. We
then split the remainder of the speed distribution relative to the median per stock per day.
Therefore, the FAST group includes traders whose speed is less than the median, and the
MODERATE group includes traders whose speed is greater than the median, but smaller
than or equal to 60 seconds. Where we are unable to compute the speed due to the absence
21A detailed analysis of the relationship between speed and quotes per VS is provided in the InternetAppendix C.
25
of multiple orders for the same stock on the same day, we treat the trader as a SLOW trader.
Therefore, our definition of speed is not nominal speed but relative speed. This is in line
with what Baron, Brogaard, Hagstromer, and Kirilenko (2016) find, that it is relative speed,
and not nominal speed, which drives differences in performance across HFTs: it is not being
fast that allows a HFT to capture trading opportunities but being the fastest. This is also
in line with the theoretical literature on HFTs: Biais, Foucault, and Moinas (2015), Budish,
Cramton, and Shim (2015), and Menkveld and Zoican (2015).
We also divide all traders into four groups based on their inventory for each stock-day:
LARGE, MEDIUM, SMALL, and NOTRADE. Inventory at the end of the day is calculated
by the absolute value of the number of shares bought minus the number of shares sold
during the day, as a fraction of the total volume of shares bought and sold in the day for
that particular stock. In particular, if a trader’s inventory is equal to 100%, we consider
the trader to be a LARGE inventory trader. If a trader’s inventory is not computable, we
consider the trader to be a NOTRADE agent. The rest of the distribution is split on a
stock-day basis relative to the median to form the MEDIUM and SMALL inventory groups.
It is important to note that we differentiate between a trader who ends a particular day with
a flat inventory as a result of buy and sell activity throughout the day, and a NOTRADE
agent. It should also be noted that NOTRADE agents include traders that submit orders,
but whose orders are not filled. Table II briefly summarizes our scheme.
[Place Table II about here]
B. HFT identification: summary statistics
Based on the classification of the groups we report in Table II, we calculate several
summary statistics on the behavior of the different groups of traders as reported in Table
III.
[Place Table III about here]
Table III presents the summary statistics for speed and inventory for each group under
our classification procedure. The median minimum speed in the FAST group varies, across
26

different inventory subgroups, from nine to four milliseconds. The MODERATE group
exhibits a much higher median minimum speed, ranging from 3.3 to 6.8 seconds. The SLOW
group has a median minimum speed of above 300 seconds. Note that similar patterns hold
if we focus on the bottom 1%, 5%, or 10% of the speed distribution, instead of the specified
minimum speed.
By construction, the LARGE inventory subgroup always has a 100% end-of-day inventory,
meaning that, during the day, traders either only buy or only sell the stock. Traders from
the MEDIUM inventory subgroup tend to end their trading day with an inventory of around
65% of the total volume traded, while traders from the SMALL inventory subgroup can end
up with an inventory as low as 15%. Patterns for the median intraday inventory and its
volatility are consistent with the end-of-day inventory. Besides that, we also estimate the
number of times during the day that the signed inventory crosses zero. FAST/SMALL and
MODERATE/SMALL traders exhibit the largest median number of zero crossings. Based
on the speed and inventory classifications, one can consider FAST/SMALL traders as HFTs,
as indicated in brackets in all the tables.
We emphasize that we use information from the continuous period on the same stock-day
to describe trader behavior in the pre-opening period. This is motivated by changes in the
traders’ strategies from one day to another as documented by Table IV for the transition
frequency matrix of trader strategies. In particular, we observe that on average, only in
27.84% of cases do traders remain in the same group from one active stock-day to the next.
The most persistent group is the SLOW/LARGE group (51.92%). Among FAST traders,
the greatest persistence is observed for the FAST/SMALL (HFTs) group (40.99%). Within
the same speed group, ignoring the differences in inventory, we observe more persistence: on
average, traders tend to remain in the same speed group in 61.40% of the cases. Traders
tend to remain in the same inventory group in 44.45% of the cases, on average, ignoring the
speed dimension, with the largest contribution to this persistence coming from the LARGE
inventory group.
[Place Table IV about here]
As far as we know, all the empirical studies in the literature, except ASIC (2013) and
27
Benos and Sagade (2016), assume that HFTs behave in an identical manner every day, and
for every stock. We do not claim that one approach dominates the other, but simply that
they have different purposes. Our objective is to identify the impact on market quality of
HFT activity when these traders use their speed capacity.
To gain an idea of the difference in the traders’ characteristics, if we use one of the
classification procedures proposed in the literature, we apply a scheme following Brogaard,
Hagstromer, Norden, and Riordan (2015), a modification of the Kirilenko, Kyle, Samadi, and
Tuzun (2016) approach, which splits traders into two groups, namely HFTs and non-HFTs,
based on three criteria: end-of-day inventory, inventory at the end of each minute, and volume
traded. Our analysis show that this classification does not always identify very fast traders
and their activity during the pre-opening period. In fact, based on this classification scheme,
we identify only five traders as HFTs with very little activity coming from them in the pre-
opening period. Note that most of the observations are marked as non-HFTs, suggesting that
the Kirilenko, Kyle, Samadi, and Tuzun (2016) scheme is a stricter (narrower) classification of
HFTs than the classification we propose. We believe that the diversity of market participants
in the TSE better suits our more comprehensive approach than the narrower alternative
scheme proposed earlier. We, therefore, prefer our HFT identification strategy, given that
the Kirilenko, Kyle, Samadi, and Tuzun (2016) scheme seems less appropriate for the TSE
market, at least with the current thresholds in place.22
V. Results
We now present the results of our empirical investigation, in line with the hypotheses
presented in Section II above. The presentation consists of three subsections, dealing with
(1) the participation of HFTs at three different times, the pre-opening period, the opening
auction, and the continuous trading period; (2) the contribution of HFTs to price discovery
during the pre-opening and continuous trading periods; and (3) the impact of HFT trading
on liquidity in the opening call auction and the continuous trading period. In the robustness
analysis (in Section VI), we also check whether HFTs change their behavior in terms of (1),
22A detailed description of the results is reported in the Internet Appendix D.
28
(2), and (3) in different volatility regimes.
A. HFT participation
HYPOTHESIS 1: HFTs are the most active participants in the pre-opening, opening call
auction and continuous trading periods.
We investigate the participation of the different trader groups, and specifically those that
we identify as HFTs (the FAST/SMALL group), in the pre-opening period, the opening
auction, and the first 30 minutes of the continuous period, using the whole continuous period
as a benchmark. We first compute the presence ratio (PR) defined in equation (1). Table
V shows the PRs of all 12 groups in the three periods.
[Place Table V about here]
The PRs of HFTs during the pre-opening period and the opening call auction are 26.96%
and 17.47%, respectively. These results address the question of whether HFTs participate
in the pre-opening period, despite the fact that no trading occurs at that point in time. Our
analysis shows that, even though there is no trading, one quarter of HFTs do participate
in the pre-opening period.23 Table V also shows that in the continuous period (the first
30 minutes), 83.65% are present, confirming that the large majority of HFT traders do
participate during the early part of the trading day. Table V also shows that 16.16% of
HFTs actively participate in all three periods: pre-opening, opening auction, and continuous
periods. The table also reports a distinction between HFTs that actively trade in the opening
auction (Active-w-Trade) along with those that are present in the pre-opening period but do
not trade during the opening auction (Active-w/o-Trade) and, on the other hand, those that
are Non-Active in both the pre-opening period and the opening auction, but do participate
in the continuous period. In the continuous period, almost all of the Active-w-Trade HFTs
also participate in the continuous period, and the same applies to Active-w/o-Trade HFTs.
However, the majority of HFTs present in the continuous period are Non-Active (58.91%).
Figure 3 shows the presence of HFT traders during different periods of the trading day. In
23For a detailed description of the order flow by the different groups of traders during the pre-openingperiod, see the Internet Appendix E.
29
particular, we show that 26.96% of HFTs are present in the pre-opening period. Out of these
traders, 65% (=17.47/26.96) execute their orders in the opening call auction. Among those
traders that execute their orders in the opening call auction, 93% (=16.16/17.47) are also
present in the first 30 minutes of the continuous trading period.
[Place Figure 3 about here]
Going beyond mere presence, we next compute the level of activity, based on quotes
submitted by traders in the different periods, that is, the QAR defined in equation (2). In
Table VI, Panel A, we report the average QAR.
[Place Table VI about here]
Table VI, Panel A, shows that HFTs represent the trader group with the largest pro-
portion of orders submitted, with about 20.58% of the total orders submitted during the
pre-opening period, defined as averages, which splits into about 4.98% by the Active-w/o-
Trade and 15.60% by the Active-w-Trade group, respectively. For comparison, the table
shows that HFTs are also the trader group submitting the majority of quotes during the
continuous period (42.05%), almost double the percentage submitted during the pre-opening
period. This indicates that the majority of the quotes in the continuous period are submitted
by HFTs that are not present during the pre-opening period (Non-Active). We also analyze
the behavior of traders based on aggressive orders alone. We find that in the pre-opening
period, HFTs places the highest number of aggressive orders in relation to the total number
of orders, which indicates their interest in affecting the price.24 The variation of the QAR
within the speed and inventory categories also suggests that both the speed and inventory di-
mensions are important when analyzing the impacts of the different trader groups on market
quality.
In Table VI, Panel B, we perform a formal test of whether this activity is also sta-
tistically significant (see equation (13)). We estimate the coefficient using the Active-w-
Trade SLOW/SMALL group as a base case. We observe that HFTs are confirmed as being
statistically significantly present, with the largest coefficient among all groups during the
24Please see Internet Appendix F for details.
30
pre-opening period and the first 30 minutes of the continuous period. The test of signifi-
cance is based on clustered standard errors (by stock). We also computed robust standard
errors and the results were similar. We also performed a test of whether Active-w-Trade
HFTs have a statistically larger presence during the pre-opening period than Active-w-Trade
FAST/MEDIUM, MODERATE/SMALL, and MODERATE/MEDIUM traders. We reject
the null hypothesis that the coefficients are the same at the 1% level, for Active-w-Trade
MODERATE/MEDIUM traders. However, we cannot reject the hypothesis that quoting ac-
tivity is the same for FAST/SMALL (HFTs), FAST/MEDIUM, and MODERATE/SMALL
traders. Put differently, Active-w-Trade HFTs are among the top three trader groups in
terms of quoting activity during the pre-opening period, while Non-Active HFTs are the
most active group during the continuous period.
Finally, we investigate whether HFTs as a trader group have a QAR that is larger than
non-HFTs. The results are reported in Table VI, Panel C, and show that HFTs have a
quoting activity ratio that is 6.11% larger than that of non-HFTs in the pre-opening period
(12.09% larger in the continuous period). Active-w-Trade HFTs have a quoting activity ratio
that is 11.39% larger than all other traders, as a group. Non-Active HFTs have a quoting
activity ratio that is 28.10% larger than all the other traders in the continuous period. This
test indicates that, even if there is a huge dispersion in their participation across stocks
and across days, there is always a significant fraction of quotes posted by HFTs in both the
pre-opening and continuous periods.
So far, we have presented a comparative analysis of the pre-opening and continuous
periods. We repeat the above analysis for participation in the opening auction, using trades
rather than quotes, to measure the trading activity ratio TAR, defined in equation (3). The
results are reported in Table VII.
[Place Table VII about here]
Table VII, Panel A, shows that HFTs do participate significantly in the opening auction:
36.65% of the volume traded during the auction relates to HFTs, either as sellers or buyers.
Compared with the other trader groups, they trade the second largest fraction. In line with
previous empirical evidence, HFTs also contribute greatly to the volume traded during the
31
continuous period. The same panel shows a large difference between the volume traded by
HFTs present in the auction, and those present only during the continuous period. Those
that are not active during the auction (Non-Active) are responsible for 44.40% of the total
volume of trades during the continuous period, while those that are active during the opening
auction (Active-w-Trade) account, on average, for 19.79%.
We next perform a test of whether HFT participation is statistically different from zero,
and not driven by outliers (see equation (13)). These results are reported in Table VII,
Panel B. As shown, the presence of HFTs in all periods is significantly different from the
TAR of the base-case group (Active-w-Trade SLOW/SMALL), and also different from zero,
at the 1% level. HFTs are the second among the trader groups participating in the opening
auction, in terms of TAR, while the most active group are the FAST/MEDIUM traders
(the F -test we perform shows the difference between the two groups’ trading activity to be
statistically different from zero).
We also perform a general comparison of HFTs versus non-HFTs, by grouping all the
other trader groups into one, and the results are reported in Table VII, Panel C, showing
that, during the opening call auction, HFTs exhibit a level of trading activity that is 16.23%
higher than the level of the other traders, and showing this difference in presence to be
statistically different from zero. During the continuous period, HFTs have a trading activity
level that is 17.50% larger than that of the other traders. However, Non-Active (Active-w-
Trade) HFTs have a trading activity level 38.42% (12.86%) larger than that of the other
traders.
B. Price discovery
HYPOTHESIS 2: Of all types of trader, HFTs contribute the most to price discovery in the
pre-opening and continuous trading periods.
Our data allow us to measure the PDC by individual order and, in particular, by individ-
ual aggressive order, so that we can aggregate the WPC according to the trader group that
submitted the order, to show the proportion of the price contribution made by a particular
trader group. We calculate the WPC as described in equation (7). The results of the WPC
32
analysis are reported in Table VIII.
[Place Table VIII about here]
Table VIII, Panel A, shows that the main contribution to the WPC comes from FAST/MEDIUM
(-26.66%) traders, followed by the HFTs (-16.23%) and MODERATE/SMALL (-13.61%)
traders, during the pre-opening period. Moreover, we find that HFTs that are Active-w-
Trade during the auction contribute 13.67% to the WPC, while those that are Active-w/o-
Trade account for only 2.56%. The panel also shows the results of the WPC analysis for the
first 30 minutes of the continuous trading period. HFTs, in this case, contribute 35.47% to
price discovery, the largest contribution among all the trader groups. However, there is a lot
of heterogeneity among HFTs, with big differences between those that actively participate
in the pre-opening period and the opening auction, and the Non-Active HFTs. Non-Active
HFTs are responsible for -37.99% of the WPC during the continuous period. On the con-
trary, among the traders that are active during pre-opening period, Active-w-Trade HFTs
no longer contribute to price discovery, and if anything detract from it (+3.85%).
Table VIII, Panel B, presents the results of a formal test of whether the price discovery
caused by HFTs is statistically significant. We estimate the regression using the Active-
w-Trade SLOW/SMALL group as the base case. The largest price discovery contribution
during the pre-opening period is made by the Active-w-Trade FAST/MEDIUM traders,
followed by the Active-w-Trade HFTs. In the continuous period, the Non-Active HFTs
show the largest WPC, while the Active-w-Trade HFTs show WPC that are not statistically
different from zero. Therefore, the statistical analysis indicates that Active-w-Trade HFTs
do not contribute to price discovery, but neither do they harm it.
Table VIII, Panel C, investigates whether HFTs as a trader group have a WPC larger
than that of non-HFTs. It shows that HFTs as a group contribute more to price discovery
than the other trader groups (-3.70%, which is statistically significant at the 1% level), in the
pre-opening period. However, only Active-w-Trade HFTs show a significant amount of price
discovery that is statistically larger than that made by non-HFTs during the pre-opening
period. Active-w/o-Trade HFTs actually reduce price discovery during the pre-opening
period. In the continuous period, HFTs contribute significantly to price discovery, with this
33
contribution coming largely from Non-Active HFTs. Active-w-Trade HFTs have an impact
that is not statistically significant, while Active-w/o-Trade HFTs deteriorate price discovery.
These results confirm the heterogeneity of HFTs and the difference in their contributions to
market quality, conditional on the period considered: pre-opening versus continuous.25
One of the characteristics of the opening price is that its volatility is larger than that of
the closing price (Stoll and Whaley (1990); Amihud and Mendelson (1991); Berkman, Koch,
Tuttle, and Zhang (2012)). This stylized fact has been attributed to many factors, includ-
ing the accumulation of information and concentration of orders overnight, with attendant
consequences for asymmetry of information, and market-maker intervention. Amihud and
Mendelson (1991) conclude that the higher volatility of the opening price of the morning
session is due to the staleness of the reference price, which is the closing price of the previous
day (18 hours prior to opening). However, in this section, the WPC analysis for the pre-
opening period is based on the auction price, which may be less stale. To check whether this
assumption affects the overall results for the major contributors to price discovery during the
pre-opening period, we consider the average price between 9:30 and 9:35 a.m. as a reference
price, rather than the auction price, which is used for investigating price discovery for the
continuous period. Our analysis confirms that the selection of the reference price does not
affect our conclusions. The results are reported in Table IA.6 of Internet Appendix G. We
also investigate the impact of a particular order type on price discovery (similarly to Barclay
and Warner (1993) and Chakravarty (2001)). Breaking down the WPC order by order and
trader by trader, we find that the types of order contributing most to the WPC are new limit
and market orders submitted by Active-w-Trade traders. Cancellations of market orders and
price revisions of limit orders also contribute to price discovery. On the other hand, quantity
revisions and cancellations of limit orders increase the deviation of the quoted price from the
opening price.26
In the literature there have been other approaches used to investigate price discovery. In
the robustness section (see Section VI), we summarize the results of several other comple-
25The results of the test of whether the contributions from trader groups are significantly different acrossstock-date are very similar to Table VIII, Panel B (the results are reported in Table IA.5 of Internet AppendixG).
26For a detailed description of the analysis see the Internet Appendix G, Table IA.7.
34
mentary analyses that we performed related to price discovery. First, we investigate price
discovery by looking at the deviation of the pre-opening quoted price from the opening price,
computed for each second of the entire pre-opening period, in different stock groups. Second,
we test the price efficiency of the pre-opening quotes, using an unbiasedness regression that
has been widely used in the literature (e.g., Biais, Hillion, and Spatt (1999), Barclay and
Hendershott (2003), and Barclay and Hendershott (2008)). This analysis highlight results
that are consistent with the WPC study presented in this section.
C. Liquidity provision
HYPOTHESIS 3: Of all types of trader, HFTs contribute the most to liquidity in the opening
call auction and the continuous trading period.
In this subsection, we investigate the contribution of HFTs to liquidity provision in the
opening auction and the continuous period. We use the Net Liquidity Provision measure
(NLP ) defined in equation (10) based on the liquidity-demanding and liquidity-supplying
trading volumes, relative to the total trading volume during the opening auction, and the
first 30 minutes of the continuous period. Table IX presents the NLP s during the opening
auction and the continuous period.
[Place Table IX about here]
Table IX, Panel A, shows that HFTs provide liquidity to the market during the opening
auction, but consume liquidity during the continuous period. Again, we find considerable
heterogeneity among HFTs: Active-w-Trade HFTs provide liquidity during both the opening
auction and the continuous period, while Active-w/o-Trade HFTs contribute to liquidity pro-
vision during the continuous period. However, Non-Active HFTs largely consume liquidity.
This result is similar to what we find for the continuous period in relation to price discovery.
The result can be theoretically justified if we keep in mind the canonical microstructure
models of Kyle (1985), Glosten and Milgrom (1985) and others, in which informed investors
consume liquidity. Indeed, in the Kyle model, uninformed liquidity traders supply liquidity,
on average, by selling/buying for other reasons, such as liquidity needs, while informed in-
35
vestors take advantage of this liquidity provision by executing their informed trades against
them.
In Table IX, Panel B, we perform the regression analysis (see equation (13)) and the
results confirm those reported in Panel A. Non-Active HFTs significantly consume liquid-
ity and the other HFTs contribute to liquidity in both the opening auction and the con-
tinuous period. We perform an F -test to compare liquidity provision in the opening call
auction by FAST/SMALL (HFTs), MODERATE/SMALL, and MODERATE/MEDIUM
traders. We show that the main liquidity provider in the opening call auction is the
MODERATE/MEDIUM trader group, while HFTs share second place with the MODER-
ATE/SMALL traders. In Table IX, Panel C, we compare HFTs to non-HFTs and find that
in the pre-opening period they contribute significantly to liquidity, while in the continuous
trading period they largely consume liquidity. This result, however, is driven completely by
Non-Active HFTs.
To conclude, Active-w-Trade HFTs are among the main liquidity providers in the opening
call auction and the continuous period. Non-Active HFTs are major liquidity demanders in
the continuous period.
VI. Robustness checks
We present in this section several robustness checks related to HFT behavior in different
volatility regimes and investigate the contribution to price discovery by HFTs using two
other approaches used in the literature. The first approach investigates the contribution of
HFTs to the speed of price discovery. The second approach is based on the unbiasedness
of the pre-opening quotes, another measure the literature proposes for investigating price
discovery.
A. HFT behavior in different volatility regimes
In this robustness check, we analyze whether the above results are affected by market-
wide (systematic) and stock-specific (idiosyncratic) movements in stock prices from one day
to the next. In fact, the SEC (2010) and others express concern about the impact of HFTs
36
on market quality, especially during times of stress. In our analysis, we distinguish between
systematic and idiosyncratic volatility. In this spirit, we investigate whether we can observe
differences in the participation, price discovery, and liquidity provision of HFTs, when the
daily price dispersion of the market is large, and when the daily price dispersion of a single
stock is large, even when market volatility is low. We measure market volatility by the
difference between the daily highest value of the index TOPIX and the lowest value, and we
measure stock volatility by the difference between the daily highest price of the stock and the
lowest price. We then calculate the median during the sample period of the aforementioned
difference for the market and stock volatilities. We set a systematic volatility dummy to
one, when the value of the market volatility is above the median, and zero otherwise. We
set the stock volatility dummy to one, when the value of the stock volatility is above the
median, and zero otherwise. We estimate the idiosyncratic volatility dummy as the difference
between the stock volatility dummy and the product of the systematic volatility dummy and
the stock volatility dummy.27
By interacting the systematic and idiosyncratic volatility dummies with the trader group
dummies, we test the hypothesis of whether there is any difference in HFT behavior, during
the days when there is high systematic or idiosyncratic volatility:
Yp,j,k,l = a0,p +∑
(al,p ∗ Il + bl,p ∗ Il ∗ SysV olk + cl,p ∗ Il ∗ IdioV olj,k)
+ b0,pSysV olk + c0,pIdioV olj,k + ep,j,k,l
(15)
where Yp,j,k,l is the investigated measure, that is, participation measured by QAR and TAR,
price discovery by WPC, and liquidity provision by NLP . p is the period considered (pre-
opening, opening auction, continuous) for stock j, day k, and trader group l. Il is a dummy
variable that equals one for the trader group l. SysV olk is a dummy variable that equals
one, if the high minus low range for the TOPIX index on day k is higher than the median.
IdioV olk is a dummy variable that equals one, if the high minus low range for stock j on day
k is higher than the median and SysV olk is not equal to one on day k. We then test whether
27We acknowledge that using the median may not be enough to identify stressful periods. However, sincewe only have 41 days in our sample, tests based on stricter criteria may suffer from a lack of power, ashappens with the test in Brogaard, Hendershott, and Riordan (2014). Nevertheless, in unreported results,we repeat the analysis using the 90th-percentile instead of the median and, if anything, the results becomestronger.
37
the coefficients bl and cl are statistically different from zero. In Tables X, XI, XII, and XIII,
we report bl (Panel A) and cl (Panel B) from the regressions for the quoting activity, trading
activity, price discovery, and liquidity provision of traders in different volatility regimes.
[Place Table X about here]
The results in Table X confirm that all HFTs, except Non-Active HFTs, increase their
quoting activity relative to other trader groups, in times of high systematic and idiosyncratic
volatility, with this effect being more pronounced for idiosyncratic volatility. Non-Active
HFTs do not change their behavior.
The results of the trading activity analysis are reported in Table XI. The analysis also
shows that the trading activity during the opening auction and the continuous trading period
of Active-w-Trade HFTs increases with systematic volatility, while other HFTs do not change
their behavior. Idiosyncratic volatility also leads to an increase in the trading activity of
HFTs relative to other trader groups, with the exception of Non-Active HFTs, who do not
change their behavior.
[Place Table XI about here]
This is consistent with the analysis of the QAR: Non-Active HFTs tend to behave in
a similar manner when volatility is higher. This finding is consistent with the idea that
idiosyncratic volatility is indicative of the larger amount of stock-specific information, rather
than stress alone. These results confirm the results of Brogaard, Hendershott, and Riordan
(2014) for the continuous period. However, by considering both the systematic volatility
and the idiosyncratic volatility, our analysis shows that, in both the pre-opening and the
continuous section, HFTs do not reduce their participation on days when systematic or
idiosyncratic volatility is high.
We then investigate whether WPC is affected by different systematic and idiosyncratic
volatility regimes. We find that most of the HFTs do not change their contribution to price
discovery across different volatility regimes, with only two exceptions: First, Non-Active
HFTs contribute more to price discovery during the first 30 minutes of the continuous trading
period when systematic volatility is high. Second, Active-w-Trade HFTs contribute more
38
to price discovery during the pre-opening period in times of high idiosyncratic volatility.
Remarkably, none of the HFTs decrease their price discovery contribution in regimes with
high systematic/idiosyncratic volatility.
[Place Table XII about here]
We next investigate whether there are differences in HFTs’ liquidity provision across
different volatility regimes. We observe that HFTs’ liquidity provision in the opening call
auction is not affected by volatility. We show that, in times of high systematic/idiosyncratic
volatility, Non-Active HFTs consume less liquidity than in times of low systematic/idiosyncratic
volatility. Active-w/o-Trade HFTs also increase their liquidity provision in times of high
idiosyncratic volatility. The results are reported in Table XIII. In brief, HFTs’ liquidity
provision does not decrease in highly volatile periods.
[Place Table XIII about here]
To sum up, we do not find any evidence that HFTs decrease their presence in the market,
or stop facilitating price discovery or providing liquidity, in times of high systematic or
idiosyncratic volatility.
B. HFT and Speed in price discovery
One of the questions we aim to answer with this paper concerns price discovery. We
have considered the pre-opening period without distinguishing the earlier part of the period
from the minute just before the auction. However, the order submission activity during the
pre-opening section varies as the auction time approaches. As further analysis of the role
of HFTs on price discovery, we aim to investigate how HFT affect the speed of the price
convergence to the auction price. We perform this analysis by studying whether stocks with
a greater presence of HFTs show different patterns of price convergence of the quoted price to
the opening price. We looked at the distribution of HFTs activity across stocks and observed
that there is a wide variation in their activity from stock to stock during the pre-opening
period. By splitting the sample of stocks into two groups: stocks where the activity of HFTs
is large compared with all the other stocks, our analysis shows that the deviation from the
39
opening price is always smaller for the stocks where there is an active presence of HFTs i.e.,
their presence improves the speed of convergence to the auction price and, therefore, the
efficiency of the price discovery process.28
C. Unbiasedness of the quoted price
The literature on price discovery in the pre-opening period investigates price efficiency
by analyzing when the quoted price is statistically equal to the opening price during the
pre-opening period.29 The earlier the two prices are statistically equal, the greater is the
price efficiency. We perform the test for the price efficiency of the pre-opening quotes by
distinguishing stocks where HFT are largely active from other stocks.
Our analysis shows that the quoted price for stocks with a greater presence of HFTs is
statistically equal to the opening price almost immediately after the first 10 minutes. In
contrast, for stocks where the HFTs presence is lower, this difference becomes insignificant
only few seconds before the opening call auction. This indicates that price efficiency is higher
for the stocks with higher HFT participation (see the Internet Appendix H for a detailed
description of the analysis and the results).
VII. Conclusion
The market pre-opening period and the opening call auction are important features of
many stock markets nowadays. Our study focuses on HFT activity in these trading periods,
which has come to dominate global equity markets. Key questions we ask in this paper are
whether, in the absence of trading, very fast traders (including HFTs) still participate in
the market, and how the presence of fast traders contributes to price discovery in the pre-
opening period, and to liquidity provision in the opening call auction. In order to empirically
investigate these questions, we use a unique dataset provided by the TSE, which allows us
to develop a more comprehensive classification of traders than in the prior literature and
28For a detailed description of this analysis see the Internet appendix G.29Among other papers that use an unbiasedness regression to investigate price discovery are Biais,
Hillion, and Spatt (1999), Barclay and Hendershott (2003, 2008), Comerton-Forde and Rydge (2006), andChakrabarty, Corwin, and Panayides (2011).
40
to investigate the behavior of different categories of traders, based on their capability for
high-speed trading.
We classify traders into three speed and four inventory groups (making a total of 12
groups) on a stock-day basis. We observe that, on average, in only 28% of cases do traders
remain in the same speed/inventory group from one day to the next. It is, therefore, not
appropriate to assume that HFTs always trade all stocks in the same manner, every day.
Hence, our classification of traders based on both speed of trading and inventory, vary across
stocks and across days to focus on the effect of HFT activity on market quality when HFTs
actually use their speed capacity.
Our empirical results for the TSE show that HFTs participate in the pre-opening period
and in the opening auction to a lesser extent than in the continuous trading period. In
particular, only a quarter of HFTs participate during pre-opening period. However, HFTs
exhibit the largest quoting activity during pre-opening period and the second largest trading
activity at the opening call auction among all 12 trader groups.
We find that HFTs orders play a central role in price discovery during pre-opening period
and in liquidity provision at the opening call auction. We also show that there is a large
heterogeneity in the contribution to market quality by HFTs. As a group, HFTs provide
liquidity in the call auction but consume liquidity in the continuous period. However, HFTs
that execute their orders during the opening call auction (Active-w-Trade) provide liquidity
both in the call auction and the continuous trading period. On the contrary, HFTs that do
not participate in the pre-opening period (Non-Active) are the main liquidity consumers,
while playing a greater role in price discovery during the continuous trading period.
To conclude, our results suggest that HFTs that participate in the pre-opening period
are different from those that only participate in the continuous trading period and play a
different role in price formation and liquidity provision in pre-opening, opening call and
continuous section. Future studies should take into consideration this heterogeneity when
they investigate the role of HFTs on market quality.
41

References
Aıt-Sahalia, Yacine, and Mehmet Saglam, 2014, High frequency traders: Taking advantage
of speed, Working paper.
Amihud, Yakov, and Haim Mendelson, 1991, Volatility, efficiency, and trading: Evidence
from the Japanese stock market, Journal of Finance 46, 1765–1789.
ASIC, 2013, Dark liquidity and high-frequency trading, Australian Securities and Invest-
ments Commission: Report 331.
Barclay, Michael J, and Terrence Hendershott, 2003, Price discovery and trading after hours,
Review of Financial Studies 16, 1041–1073.
Barclay, Michael J, and Terrence Hendershott, 2008, A comparison of trading and non-
trading mechanisms for price discovery, Journal of Empirical Finance 15, 839–849.
Barclay, Michael J, and Jerold B Warner, 1993, Stealth trading and volatility: Which trades
move prices?, Journal of Financial Economics 34, 281–305.
Baron, Matthew, Jonathan Brogaard, Bjorn Hagstromer, and Andrei Kirilenko, 2016, Risk
and return in high-frequency trading, Available at SSRN.
Benos, Evangelos, and Satchit Sagade, 2016, Price discovery and the cross-section of high-
frequency trading, Journal of Financial Market Forthcoming.
Berkman, Henk, Paul D Koch, Laura Tuttle, and Ying Jenny Zhang, 2012, Paying attention:
overnight returns and the hidden cost of buying at the open, Journal of Financial and
Quantitative Analysis 47, 715–741.
Biais, Bruno, and Thierry Foucault, 2014, HFT and market quality, Bankers, Markets and
Investors 128, 5–19.
Biais, Bruno, Thierry Foucault, and Sophie Moinas, 2015, Equilibrium fast trading, Journal
of Financial Economics 116, 292–313.
Biais, Bruno, Pierre Hillion, and Chester Spatt, 1995, An empirical analysis of the limit
order book and the order flow in the Paris Bourse, Journal of Finance 50, 1655–1689.
Biais, Bruno, Pierre Hillion, and Chester Spatt, 1999, Price discovery and learning during
the preopening period in the Paris Bourse, Journal of Political Economy 107, 1218–1248.
42
Boehmer, Ekkehart, Kingsley YL Fong, and Juan Julie Wu, 2014, International evidence on
algorithmic trading, Working paper.
Brogaard, Jonathan, 2010, High frequency trading and its impact on market quality, Working
paper.
Brogaard, Jonathan, Bjorn Hagstromer, Lars L Norden, and Ryan Riordan, 2015, Trading
fast and slow: Colocation and market quality, Review of Financial Studies 28, 3407–3443.
Brogaard, Jonathan, Terrence Hendershott, and Ryan Riordan, 2014, High-frequency trading
and price discovery, Review of Financial Studies 27, 2267–2306.
Budish, Eric B., Peter Cramton, and John J. Shim, 2015, The high-frequency trading arms
race: Frequent batch auctions as a market design response, Quarterly Journal of Eco-
nomics 130, 1547–1621.
Cao, Charles, Eric Ghysels, and Frank Hatheway, 2000, Price discovery without trading:
Evidence from the NASDAQ preopening, The Journal of Finance 55, 1339–1365.
Cespa, Giovanni, and Thierry Foucault, 2011, Learning from prices, liquidity spillovers, and
market segmentation, CEPR Discussion Paper No. DP8350.
Chaboud, Alain, Benjamin Chiquoine, Erik Hjalmarsson, and Clara Vega, 2014, Rise of the
machines: Algorithmic trading in the foreign exchange market, The Journal of Finance 5,
2045–2084.
Chakrabarty, Bidisha, Shane A Corwin, and Marios A Panayides, 2011, When a halt is not a
halt: An analysis of off-NYSE trading during NYSE market closures, Journal of Financial
Intermediation 20, 361–386.
Chakravarty, Sugato, 2001, Stealth-trading: Which traders’ trades move stock prices?, Jour-
nal of Financial Economics 61, 289–307.
Chi-X, 2013, CHI-X Japan Monthly Statistics Report.
Ciccotello, Conrad S, and Frank M Hatheway, 2000, Indicating ahead: Best execution and
the NASDAQ preopening, Journal of Financial Intermediation 9, 184–212.
Comerton-Forde, Carole, and James Rydge, 2006, The influence of call auction algorithm
rules on market efficiency, Journal of Financial Markets 9, 199–222.
Duong, Huu Nhan, Petko S Kalev, and Chandrasekhar Krishnamurti, 2009, Order aggressive-
ness of institutional and individual investors, Pacific-Basin Finance Journal 17, 533–546.
43
Easley, David, Marcos M Lopez de Prado, and Maureen O’Hara, 2012, Flow toxicity and
liquidity in a high-frequency world, Review of Financial Studies 25, 1457–1493.
Foucault, Thierry, Johan Hombert, and Ioanid Rosu, 2016, News trading and speed, Journal
of Finance 71, 335–382.
Glosten, Lawrence R, and Paul R. Milgrom, 1985, Bid, ask and transaction prices in a
specialist market with heterogeneously informed traders, Journal of Financial Economics
1, 71–100.
Gomber, Peter, Bjorn Arndt, Marco Lutat, and Tim Uhle, 2011, High-frequency trading,
Working paper.
Hagstromer, Bjorn, and Lars Norden, 2013, The diversity of high-frequency traders, Journal
of Financial Markets 16, 741–770.
Hasbrouck, Joel, 1995, One security, many markets: determining the contributions to price
discovery, Journal of Finance 50, 1175–1199.
Hasbrouck, Joel, 2002, Stalking the “efficient price” in market microstructure specifications:
an overview, Journal of Financial Markets 5, 1–19.
Hasbrouck, Joel, and Gideon Saar, 2013, Low-latency trading, Journal of Financial Markets
16, 646–649.
Hendershott, Terrence, Charles M Jones, and Albert J Menkveld, 2011, Does algorithmic
trading improve liquidity?, Journal of Finance 66, 1–33.
Hendershott, Terrence, and Pamela C Moulton, 2011, Automation, speed, and stock market
quality: The NYSE’s hybrid, Journal of Financial Markets 14, 568–604.
Hendershott, Terrence, and Ryan Riordan, 2013, Algorithmic trading and the market for
liquidity, Journal of Financial and Quantitative Analysis 48, 1001–1024.
Hosaka, G., 2014, Analysis of high-frequency trading at Tokyo Stock Exchange, Working
paper.
Japannext, SBI, 2013, Japannext PTS Monthly Statistics.
Jones, Charles M, 2013, What do we know about high-frequency trading?, Working paper.
Jovanovic, B, and Albert J Menkveld, 2015, Middlemen in limit-order markets, Working
paper.
44
Kirilenko, Andrei A, Albert S Kyle, Mehrdad Samadi, and Tugkan Tuzun, 2016, The Flash
crash: High frequency trading in an electronic market, Journal of Finance, Forthcoming.
Korajczyk, Robert A., and Dermot Murphy, 2015, High frequency market making to large
institutional trades, Available at SSRN.
Kyle, A S, 1985, Continuous auctions and insider trading, Econometrica 53, 1315–1335.
Lewis, Michael, 2014, Flash boys: A Wall Street revolt (WW Norton & Company).
Madhavan, Ananth, and Venkatesh Panchapagesan, 2000, Price discovery in auction markets:
A look inside the black box, Review of Financial Studies 13, 627–658.
Malinova, Katya, Andreas Park, and Ryan Riordan, 2013, Do retail traders suffer from high
frequency traders?, Working paper.
Menkveld, Albert J, 2013, High frequency trading and the new market makers, Journal of
Financial Markets 16, 712–740.
Menkveld, Albert J, and Marius A Zoican, 2015, Need for speed? Low latency trading and
adverse selection, Working paper.
Pagnotta, Emiliano, and Thomas Philippon, 2011, Competing on speed, Working paper.
Raman, V., and P. Yadav, 2014, Liquidity provision, information, and inventory management
in limit order markets: An analysis of order revisions, Working paper.
Ranaldo, Angelo, 2004, Order aggressiveness in limit order book markets, Journal of Finan-
cial Markets 7, 53–74.
SEC, 2010, Concept release on equity market structure, Release No. 34-61358, File No.
S7-02-10.
SEC, 2014, Equity market structure literature review. Part II: High frequency trading.
Stoll, Hans R, and Robert E Whaley, 1990, Stock market structure and volatility, Review of
Financial Studies 3, 37–71.
TSE, 2015, Tokyo Stock Exchange: Guide to TSE trading methodology.
Van Bommel, Jos, 2011, Measuring price discovery: the variance ratio, the r 2, and the
weighted price contribution, Finance Research Letters 3, 112–119.
Yamamoto, Ryuichi, 2011, Order aggressiveness, pre-trade transparency, and long memory
in an order-driven market, Journal of Economic Dynamics and Control 35, 1938–1963.
45
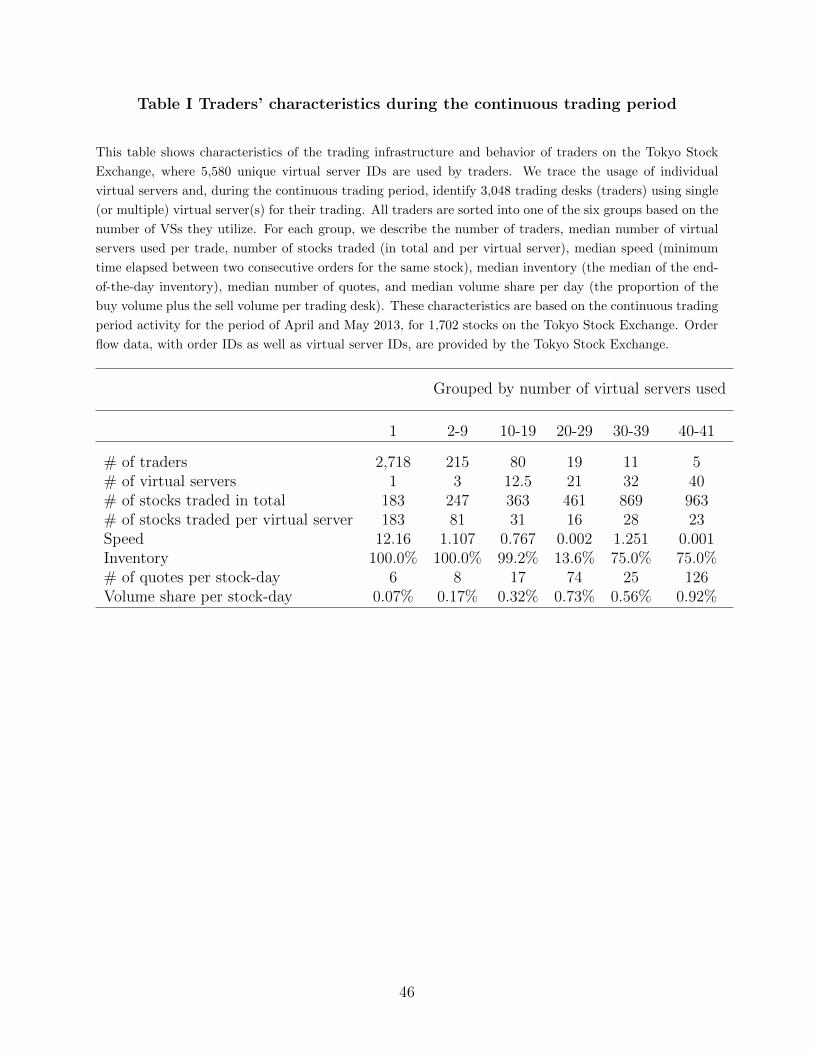
Table I Traders’ characteristics during the continuous trading period
This table shows characteristics of the trading infrastructure and behavior of traders on the Tokyo Stock
Exchange, where 5,580 unique virtual server IDs are used by traders. We trace the usage of individual
virtual servers and, during the continuous trading period, identify 3,048 trading desks (traders) using single
(or multiple) virtual server(s) for their trading. All traders are sorted into one of the six groups based on the
number of VSs they utilize. For each group, we describe the number of traders, median number of virtual
servers used per trade, number of stocks traded (in total and per virtual server), median speed (minimum
time elapsed between two consecutive orders for the same stock), median inventory (the median of the end-
of-the-day inventory), median number of quotes, and median volume share per day (the proportion of the
buy volume plus the sell volume per trading desk). These characteristics are based on the continuous trading
period activity for the period of April and May 2013, for 1,702 stocks on the Tokyo Stock Exchange. Order
flow data, with order IDs as well as virtual server IDs, are provided by the Tokyo Stock Exchange.
Grouped by number of virtual servers used
1 2-9 10-19 20-29 30-39 40-41
# of traders 2,718 215 80 19 11 5# of virtual servers 1 3 12.5 21 32 40# of stocks traded in total 183 247 363 461 869 963# of stocks traded per virtual server 183 81 31 16 28 23Speed 12.16 1.107 0.767 0.002 1.251 0.001Inventory 100.0% 100.0% 99.2% 13.6% 75.0% 75.0%# of quotes per stock-day 6 8 17 74 25 126Volume share per stock-day 0.07% 0.17% 0.32% 0.73% 0.56% 0.92%
46
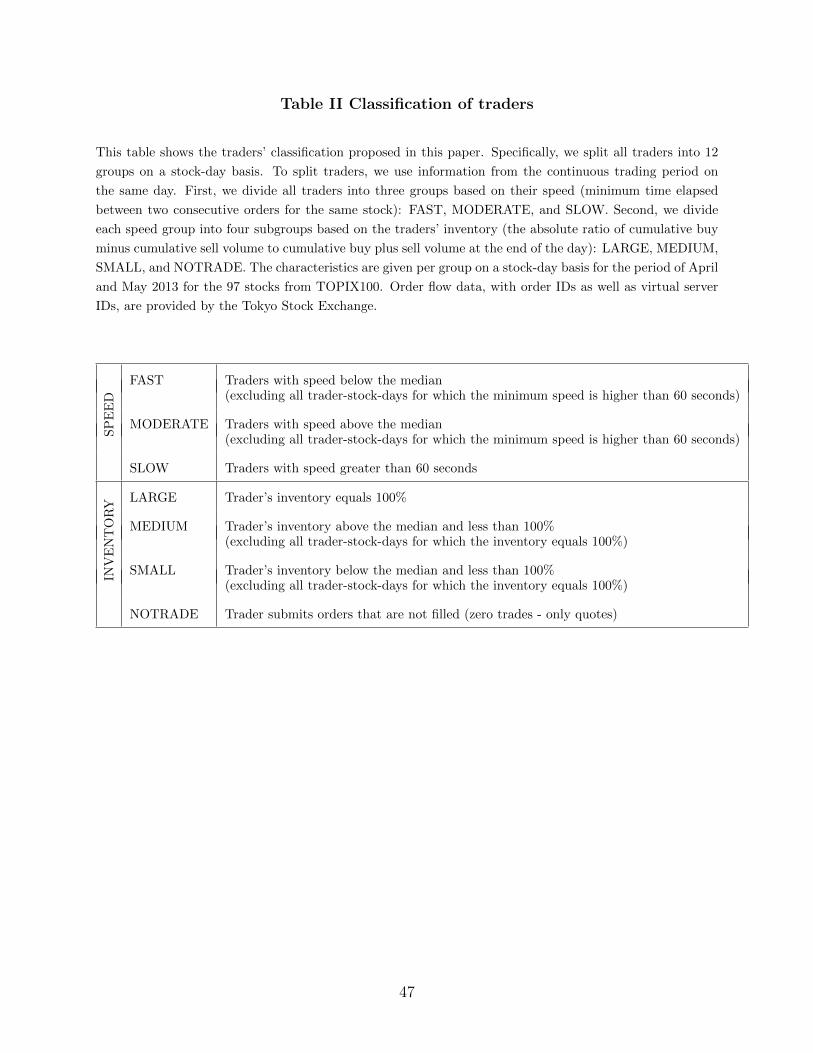
Table II Classification of traders
This table shows the traders’ classification proposed in this paper. Specifically, we split all traders into 12
groups on a stock-day basis. To split traders, we use information from the continuous trading period on
the same day. First, we divide all traders into three groups based on their speed (minimum time elapsed
between two consecutive orders for the same stock): FAST, MODERATE, and SLOW. Second, we divide
each speed group into four subgroups based on the traders’ inventory (the absolute ratio of cumulative buy
minus cumulative sell volume to cumulative buy plus sell volume at the end of the day): LARGE, MEDIUM,
SMALL, and NOTRADE. The characteristics are given per group on a stock-day basis for the period of April
and May 2013 for the 97 stocks from TOPIX100. Order flow data, with order IDs as well as virtual server
IDs, are provided by the Tokyo Stock Exchange.
SP
EE
D
FAST Traders with speed below the median(excluding all trader-stock-days for which the minimum speed is higher than 60 seconds)
MODERATE Traders with speed above the median(excluding all trader-stock-days for which the minimum speed is higher than 60 seconds)
SLOW Traders with speed greater than 60 seconds
INV
EN
TO
RY
LARGE Trader’s inventory equals 100%
MEDIUM Trader’s inventory above the median and less than 100%(excluding all trader-stock-days for which the inventory equals 100%)
SMALL Trader’s inventory below the median and less than 100%(excluding all trader-stock-days for which the inventory equals 100%)
NOTRADE Trader submits orders that are not filled (zero trades - only quotes)
47
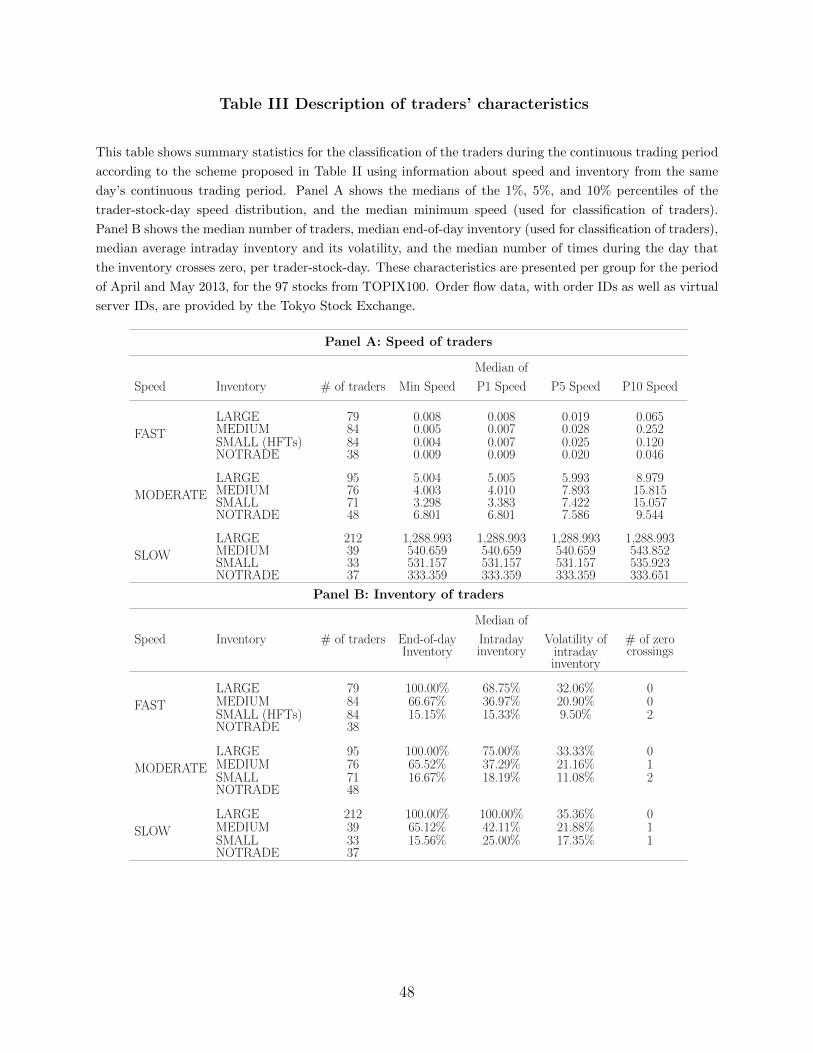
Table III Description of traders’ characteristics
This table shows summary statistics for the classification of the traders during the continuous trading period
according to the scheme proposed in Table II using information about speed and inventory from the same
day’s continuous trading period. Panel A shows the medians of the 1%, 5%, and 10% percentiles of the
trader-stock-day speed distribution, and the median minimum speed (used for classification of traders).
Panel B shows the median number of traders, median end-of-day inventory (used for classification of traders),
median average intraday inventory and its volatility, and the median number of times during the day that
the inventory crosses zero, per trader-stock-day. These characteristics are presented per group for the period
of April and May 2013, for the 97 stocks from TOPIX100. Order flow data, with order IDs as well as virtual
server IDs, are provided by the Tokyo Stock Exchange.
Panel A: Speed of traders
Median of
Speed Inventory # of traders Min Speed P1 Speed P5 Speed P10 Speed
FAST
LARGE 79 0.008 0.008 0.019 0.065MEDIUM 84 0.005 0.007 0.028 0.252SMALL (HFTs) 84 0.004 0.007 0.025 0.120NOTRADE 38 0.009 0.009 0.020 0.046
MODERATE
LARGE 95 5.004 5.005 5.993 8.979MEDIUM 76 4.003 4.010 7.893 15.815SMALL 71 3.298 3.383 7.422 15.057NOTRADE 48 6.801 6.801 7.586 9.544
SLOW
LARGE 212 1,288.993 1,288.993 1,288.993 1,288.993MEDIUM 39 540.659 540.659 540.659 543.852SMALL 33 531.157 531.157 531.157 535.923NOTRADE 37 333.359 333.359 333.359 333.651
Panel B: Inventory of traders
Median of
Speed Inventory # of traders End-of-dayInventory
Intradayinventory
Volatility ofintradayinventory
# of zerocrossings
FAST
LARGE 79 100.00% 68.75% 32.06% 0MEDIUM 84 66.67% 36.97% 20.90% 0SMALL (HFTs) 84 15.15% 15.33% 9.50% 2NOTRADE 38
MODERATE
LARGE 95 100.00% 75.00% 33.33% 0MEDIUM 76 65.52% 37.29% 21.16% 1SMALL 71 16.67% 18.19% 11.08% 2NOTRADE 48
SLOW
LARGE 212 100.00% 100.00% 35.36% 0MEDIUM 39 65.12% 42.11% 21.88% 1SMALL 33 15.56% 25.00% 17.35% 1NOTRADE 37
48
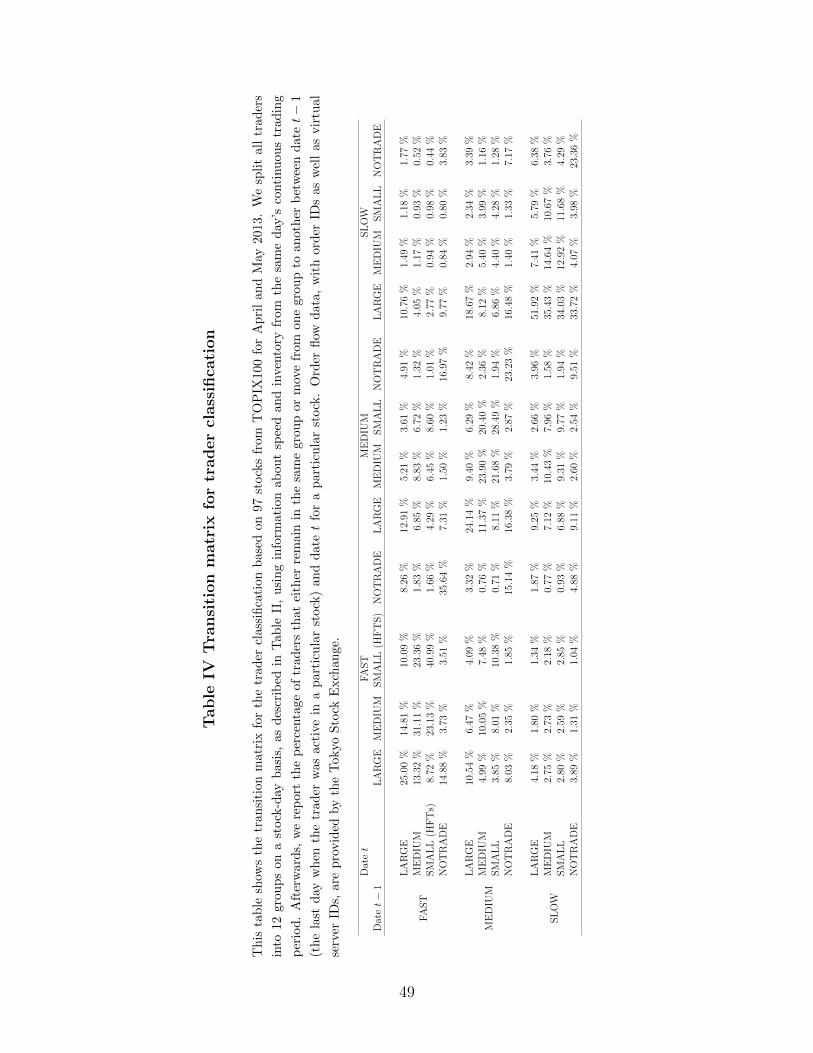
Tab
leIV
Tra
nsi
tion
matr
ixfo
rtr
ader
class
ifica
tion
Th
ista
ble
show
sth
etr
ansi
tion
mat
rix
for
the
trad
ercl
ass
ifica
tion
base
don
97
stock
sfr
om
TO
PIX
100
for
Ap
ril
an
dM
ay2013.
We
spli
tall
trad
ers
into
12gr
oup
son
ast
ock
-day
bas
is,
asd
escr
ibed
inT
ab
leII
,u
sin
gin
form
ati
on
ab
ou
tsp
eed
an
din
vento
ryfr
om
the
sam
ed
ay’s
conti
nu
ou
str
adin
g
per
iod.
Aft
erw
ards,
we
rep
ort
the
per
centa
geof
trad
ers
that
eith
erre
main
inth
esa
me
gro
up
or
mov
efr
om
on
egro
up
toan
oth
erb
etw
een
date
t−
1
(th
ela
std
ayw
hen
the
trad
erw
asac
tive
ina
part
icu
lar
stock
)an
dd
ate
tfo
ra
part
icu
lar
stock
.O
rder
flow
data
,w
ith
ord
erID
sas
wel
las
vir
tual
serv
erID
s,ar
ep
rovid
edby
the
Tok
yoS
tock
Exch
an
ge.
Dat
et
FA
ST
ME
DIU
MSL
OW
Dat
et−
1L
AR
GE
ME
DIU
MSM
AL
L(H
FT
S)
NO
TR
AD
EL
AR
GE
ME
DIU
MSM
AL
LN
OT
RA
DE
LA
RG
EM
ED
IUM
SM
AL
LN
OT
RA
DE
FA
ST
LA
RG
E25
.00
%14
.81
%10
.09
%8.
26%
12.9
1%
5.21
%3.
61%
4.91
%10
.76
%1.
49%
1.18
%1.
77%
ME
DIU
M13
.32
%31
.11
%23
.36
%1.
83%
6.85
%8.
83%
6.72
%1.
32%
4.05
%1.
17%
0.93
%0.
52%
SM
AL
L(H
FT
s)8.
72%
23.1
3%
40.9
9%
1.66
%4.
29%
6.45
%8.
60%
1.01
%2.
77%
0.94
%0.
98%
0.44
%N
OT
RA
DE
14.8
8%
3.73
%3.
51%
35.6
4%
7.31
%1.
50%
1.23
%16
.97
%9.
77%
0.84
%0.
80%
3.83
%
ME
DIU
M
LA
RG
E10
.54
%6.
47%
4.09
%3.
32%
24.1
4%
9.40
%6.
29%
8.42
%18
.67
%2.
94%
2.34
%3.
39%
ME
DIU
M4.
99%
10.0
5%
7.48
%0.
76%
11.3
7%
23.9
0%
20.4
0%
2.36
%8.
12%
5.40
%3.
99%
1.16
%SM
AL
L3.
85%
8.01
%10
.38
%0.
71%
8.11
%21
.68
%28
.49
%1.
94%
6.86
%4.
40%
4.28
%1.
28%
NO
TR
AD
E8.
03%
2.35
%1.
85%
15.1
4%
16.3
8%
3.79
%2.
87%
23.2
3%
16.4
8%
1.40
%1.
33%
7.17
%
SL
OW
LA
RG
E4.
18%
1.80
%1.
34%
1.87
%9.
25%
3.44
%2.
66%
3.96
%51
.92
%7.
41%
5.79
%6.
38%
ME
DIU
M2.
75%
2.73
%2.
18%
0.77
%7.
12%
10.4
3%
7.96
%1.
58%
35.4
3%
14.6
4%
10.6
7%
3.76
%SM
AL
L2.
80%
2.59
%2.
85%
0.93
%6.
88%
9.31
%9.
77%
1.94
%34
.03
%12
.92
%11
.68
%4.
29%
NO
TR
AD
E3.
89%
1.31
%1.
04%
4.88
%9.
11%
2.60
%2.
54%
9.51
%33
.72
%4.
07%
3.98
%23
.36
%
49
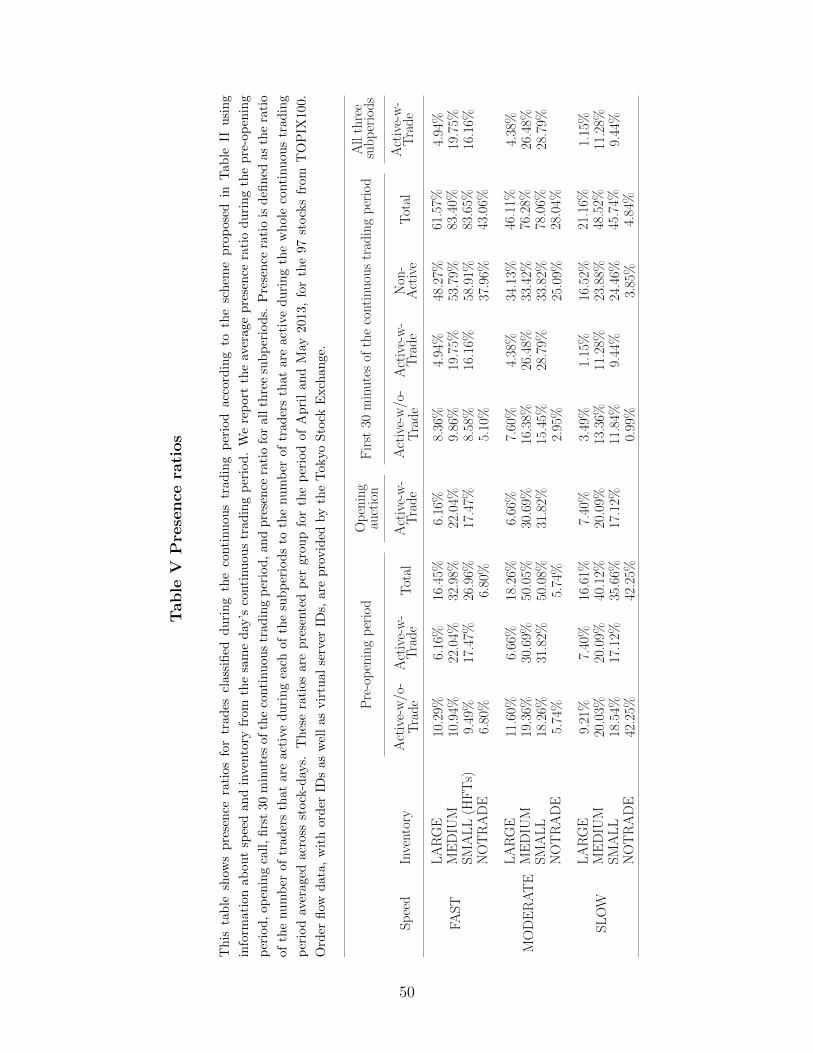
Table
VP
rese
nce
rati
os
Th
ista
ble
show
sp
rese
nce
rati
osfo
rtr
ades
class
ified
du
rin
gth
eco
nti
nu
ou
str
ad
ing
per
iod
acc
ord
ing
toth
esc
hem
ep
rop
ose
din
Tab
leII
usi
ng
info
rmat
ion
abou
tsp
eed
and
inve
nto
ryfr
omth
esa
me
day
’sco
nti
nu
ou
str
ad
ing
per
iod
.W
ere
port
the
aver
age
pre
sen
cera
tio
du
rin
gth
ep
re-o
pen
ing
per
iod,
open
ing
call
,fi
rst
30m
inu
tes
ofth
eco
nti
nu
ou
str
ad
ing
per
iod
,an
dp
rese
nce
rati
ofo
rall
thre
esu
bp
erio
ds.
Pre
sen
cera
tio
isd
efin
edas
the
rati
o
ofth
enu
mb
erof
trad
ers
that
are
acti
ved
uri
ng
each
of
the
sub
per
iod
sto
the
nu
mb
erof
trad
ers
that
are
act
ive
du
rin
gth
ew
hole
conti
nu
ou
str
ad
ing
per
iod
aver
aged
acro
ssst
ock
-day
s.T
hes
era
tios
are
pre
sente
dp
ergro
up
for
the
per
iod
of
Ap
ril
an
dM
ay2013,
for
the
97
stock
sfr
om
TO
PIX
100.
Ord
erfl
owd
ata,
wit
hor
der
IDs
asw
ell
asvir
tual
serv
erID
s,are
pro
vid
edby
the
Tokyo
Sto
ckE
xch
an
ge.
Pre-openingperiod
Opening
auction
First
30minutesof
thecontinuoustradingperiod
Allthree
subperiods
Speed
Inventory
Active-w/o-
Trade
Active-w-
Trade
Total
Active-w-
Trade
Active-w/o-
Trade
Active-w-
Trade
Non-
Active
Total
Active-w-
Trade
FAST
LARGE
10.29%
6.16%
16.45%
6.16%
8.36%
4.94%
48.27%
61.57%
4.94%
MEDIU
M10.94%
22.04%
32.98%
22.04%
9.86%
19.75%
53.79%
83.40%
19.75%
SMALL(H
FTs)
9.49%
17.47%
26.96%
17.47%
8.58%
16.16%
58.91%
83.65%
16.16%
NOTRADE
6.80%
6.80%
5.10%
37.96%
43.06%
MODERATE
LARGE
11.60%
6.66%
18.26%
6.66%
7.60%
4.38%
34.13%
46.11%
4.38%
MEDIU
M19.36%
30.69%
50.05%
30.69%
16.38%
26.48%
33.42%
76.28%
26.48%
SMALL
18.26%
31.82%
50.08%
31.82%
15.45%
28.79%
33.82%
78.06%
28.79%
NOTRADE
5.74%
5.74%
2.95%
25.09%
28.04%
SLOW
LARGE
9.21%
7.40%
16.61%
7.40%
3.49%
1.15%
16.52%
21.16%
1.15%
MEDIU
M20.03%
20.09%
40.12%
20.09%
13.36%
11.28%
23.88%
48.52%
11.28%
SMALL
18.54%
17.12%
35.66%
17.12%
11.84%
9.44%
24.46%
45.74%
9.44%
NOTRADE
42.25%
42.25%
0.99%
3.85%
4.84%
50
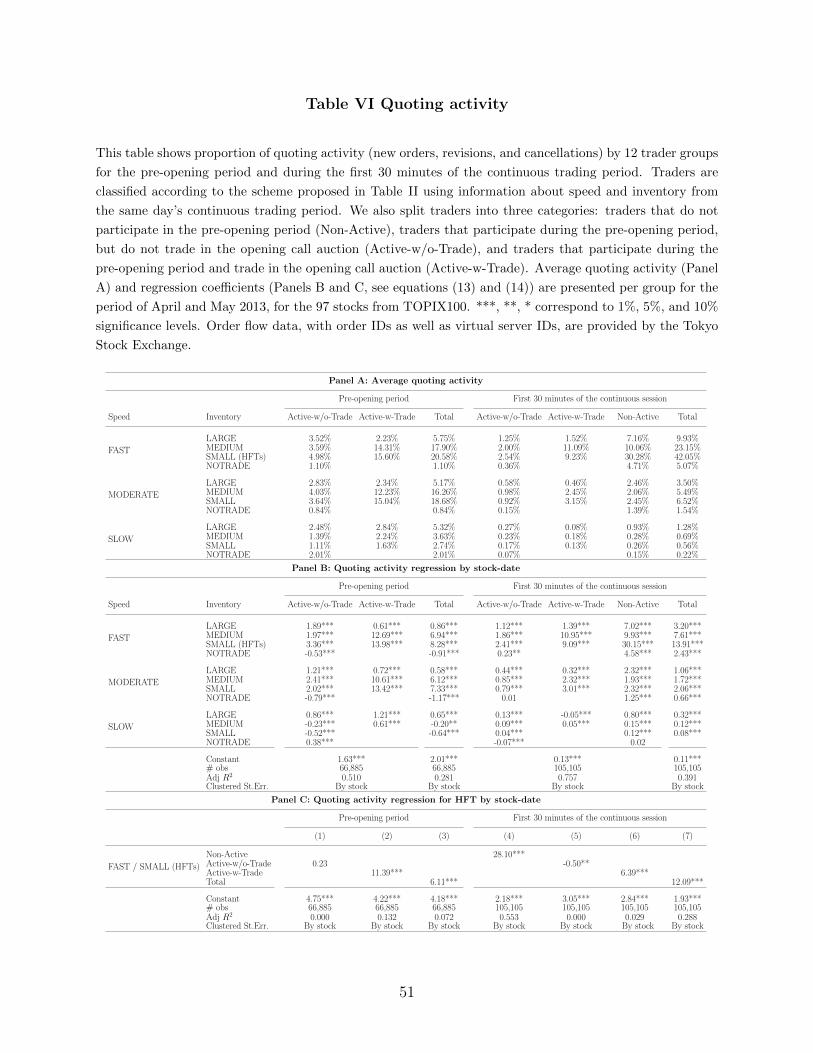
Table VI Quoting activity
This table shows proportion of quoting activity (new orders, revisions, and cancellations) by 12 trader groups
for the pre-opening period and during the first 30 minutes of the continuous trading period. Traders are
classified according to the scheme proposed in Table II using information about speed and inventory from
the same day’s continuous trading period. We also split traders into three categories: traders that do not
participate in the pre-opening period (Non-Active), traders that participate during the pre-opening period,
but do not trade in the opening call auction (Active-w/o-Trade), and traders that participate during the
pre-opening period and trade in the opening call auction (Active-w-Trade). Average quoting activity (Panel
A) and regression coefficients (Panels B and C, see equations (13) and (14)) are presented per group for the
period of April and May 2013, for the 97 stocks from TOPIX100. ***, **, * correspond to 1%, 5%, and 10%
significance levels. Order flow data, with order IDs as well as virtual server IDs, are provided by the Tokyo
Stock Exchange.
Panel A: Average quoting activity
Pre-opening period First 30 minutes of the continuous session
Speed Inventory Active-w/o-Trade Active-w-Trade Total Active-w/o-Trade Active-w-Trade Non-Active Total
FAST
LARGE 3.52% 2.23% 5.75% 1.25% 1.52% 7.16% 9.93%MEDIUM 3.59% 14.31% 17.90% 2.00% 11.09% 10.06% 23.15%SMALL (HFTs) 4.98% 15.60% 20.58% 2.54% 9.23% 30.28% 42.05%NOTRADE 1.10% 1.10% 0.36% 4.71% 5.07%
MODERATE
LARGE 2.83% 2.34% 5.17% 0.58% 0.46% 2.46% 3.50%MEDIUM 4.03% 12.23% 16.26% 0.98% 2.45% 2.06% 5.49%SMALL 3.64% 15.04% 18.68% 0.92% 3.15% 2.45% 6.52%NOTRADE 0.84% 0.84% 0.15% 1.39% 1.54%
SLOW
LARGE 2.48% 2.84% 5.32% 0.27% 0.08% 0.93% 1.28%MEDIUM 1.39% 2.24% 3.63% 0.23% 0.18% 0.28% 0.69%SMALL 1.11% 1.63% 2.74% 0.17% 0.13% 0.26% 0.56%NOTRADE 2.01% 2.01% 0.07% 0.15% 0.22%
Panel B: Quoting activity regression by stock-date
Pre-opening period First 30 minutes of the continuous session
Speed Inventory Active-w/o-Trade Active-w-Trade Total Active-w/o-Trade Active-w-Trade Non-Active Total
FAST
LARGE 1.89*** 0.61*** 0.86*** 1.12*** 1.39*** 7.02*** 3.20***MEDIUM 1.97*** 12.69*** 6.94*** 1.86*** 10.95*** 9.93*** 7.61***SMALL (HFTs) 3.36*** 13.98*** 8.28*** 2.41*** 9.09*** 30.15*** 13.91***NOTRADE -0.53*** -0.91*** 0.23** 4.58*** 2.43***
MODERATE
LARGE 1.21*** 0.72*** 0.58*** 0.44*** 0.32*** 2.32*** 1.06***MEDIUM 2.41*** 10.61*** 6.12*** 0.85*** 2.32*** 1.93*** 1.72***SMALL 2.02*** 13.42*** 7.33*** 0.79*** 3.01*** 2.32*** 2.06***NOTRADE -0.79*** -1.17*** 0.01 1.25*** 0.66***
SLOW
LARGE 0.86*** 1.21*** 0.65*** 0.13*** -0.05*** 0.80*** 0.32***MEDIUM -0.23*** 0.61*** -0.20** 0.09*** 0.05*** 0.15*** 0.12***SMALL -0.52*** -0.64*** 0.04*** 0.12*** 0.08***NOTRADE 0.38*** -0.07*** 0.02
Constant 1.63*** 2.01*** 0.13*** 0.11***# obs 66,885 66,885 105,105 105,105Adj R2 0.510 0.281 0.757 0.391Clustered St.Err. By stock By stock By stock By stock
Panel C: Quoting activity regression for HFT by stock-date
Pre-opening period First 30 minutes of the continuous session
(1) (2) (3) (4) (5) (6) (7)
FAST / SMALL (HFTs)
Non-Active 28.10***Active-w/o-Trade 0.23 -0.50**Active-w-Trade 11.39*** 6.39***Total 6.11*** 12.09***
Constant 4.75*** 4.22*** 4.18*** 2.18*** 3.05*** 2.84*** 1.93***# obs 66,885 66,885 66,885 105,105 105,105 105,105 105,105Adj R2 0.000 0.132 0.072 0.553 0.000 0.029 0.288Clustered St.Err. By stock By stock By stock By stock By stock By stock By stock
51
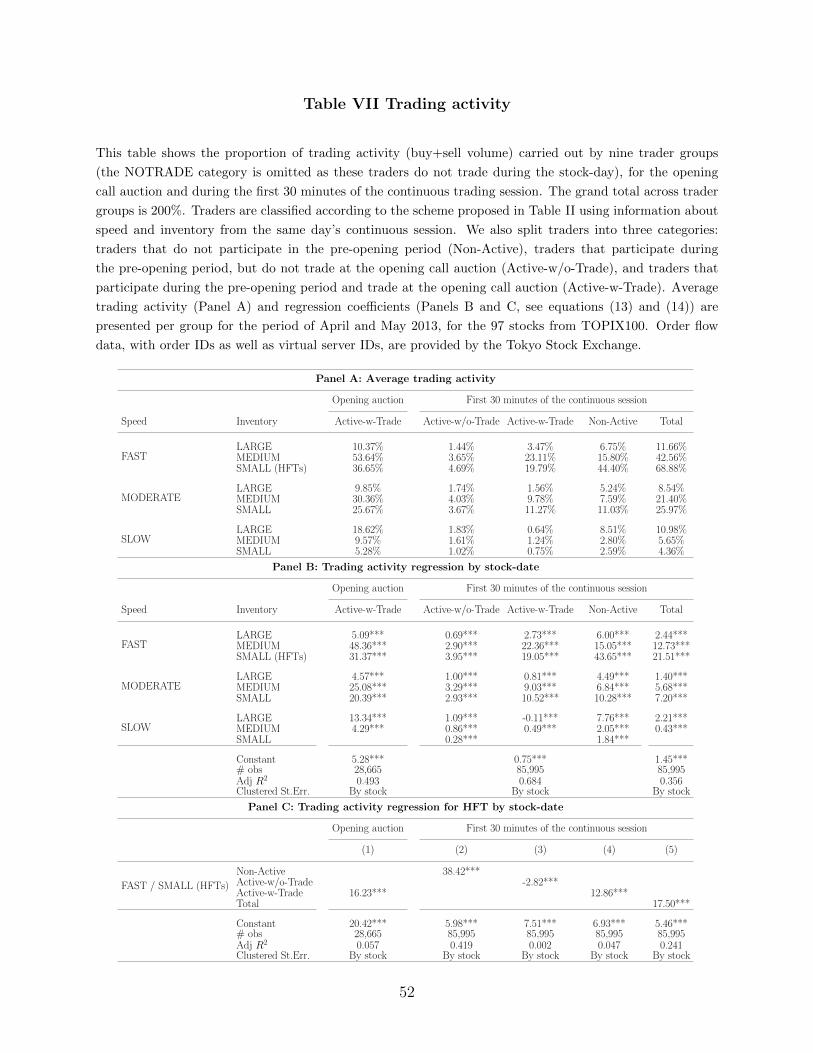
Table VII Trading activity
This table shows the proportion of trading activity (buy+sell volume) carried out by nine trader groups
(the NOTRADE category is omitted as these traders do not trade during the stock-day), for the opening
call auction and during the first 30 minutes of the continuous trading session. The grand total across trader
groups is 200%. Traders are classified according to the scheme proposed in Table II using information about
speed and inventory from the same day’s continuous session. We also split traders into three categories:
traders that do not participate in the pre-opening period (Non-Active), traders that participate during
the pre-opening period, but do not trade at the opening call auction (Active-w/o-Trade), and traders that
participate during the pre-opening period and trade at the opening call auction (Active-w-Trade). Average
trading activity (Panel A) and regression coefficients (Panels B and C, see equations (13) and (14)) are
presented per group for the period of April and May 2013, for the 97 stocks from TOPIX100. Order flow
data, with order IDs as well as virtual server IDs, are provided by the Tokyo Stock Exchange.
Panel A: Average trading activity
Opening auction First 30 minutes of the continuous session
Speed Inventory Active-w-Trade Active-w/o-Trade Active-w-Trade Non-Active Total
FASTLARGE 10.37% 1.44% 3.47% 6.75% 11.66%MEDIUM 53.64% 3.65% 23.11% 15.80% 42.56%SMALL (HFTs) 36.65% 4.69% 19.79% 44.40% 68.88%
MODERATELARGE 9.85% 1.74% 1.56% 5.24% 8.54%MEDIUM 30.36% 4.03% 9.78% 7.59% 21.40%SMALL 25.67% 3.67% 11.27% 11.03% 25.97%
SLOWLARGE 18.62% 1.83% 0.64% 8.51% 10.98%MEDIUM 9.57% 1.61% 1.24% 2.80% 5.65%SMALL 5.28% 1.02% 0.75% 2.59% 4.36%
Panel B: Trading activity regression by stock-date
Opening auction First 30 minutes of the continuous session
Speed Inventory Active-w-Trade Active-w/o-Trade Active-w-Trade Non-Active Total
FASTLARGE 5.09*** 0.69*** 2.73*** 6.00*** 2.44***MEDIUM 48.36*** 2.90*** 22.36*** 15.05*** 12.73***SMALL (HFTs) 31.37*** 3.95*** 19.05*** 43.65*** 21.51***
MODERATELARGE 4.57*** 1.00*** 0.81*** 4.49*** 1.40***MEDIUM 25.08*** 3.29*** 9.03*** 6.84*** 5.68***SMALL 20.39*** 2.93*** 10.52*** 10.28*** 7.20***
SLOWLARGE 13.34*** 1.09*** -0.11*** 7.76*** 2.21***MEDIUM 4.29*** 0.86*** 0.49*** 2.05*** 0.43***SMALL 0.28*** 1.84***
Constant 5.28*** 0.75*** 1.45***# obs 28,665 85,995 85,995Adj R2 0.493 0.684 0.356Clustered St.Err. By stock By stock By stock
Panel C: Trading activity regression for HFT by stock-date
Opening auction First 30 minutes of the continuous session
(1) (2) (3) (4) (5)
FAST / SMALL (HFTs)
Non-Active 38.42***Active-w/o-Trade -2.82***Active-w-Trade 16.23*** 12.86***Total 17.50***
Constant 20.42*** 5.98*** 7.51*** 6.93*** 5.46***# obs 28,665 85,995 85,995 85,995 85,995Adj R2 0.057 0.419 0.002 0.047 0.241Clustered St.Err. By stock By stock By stock By stock By stock
52
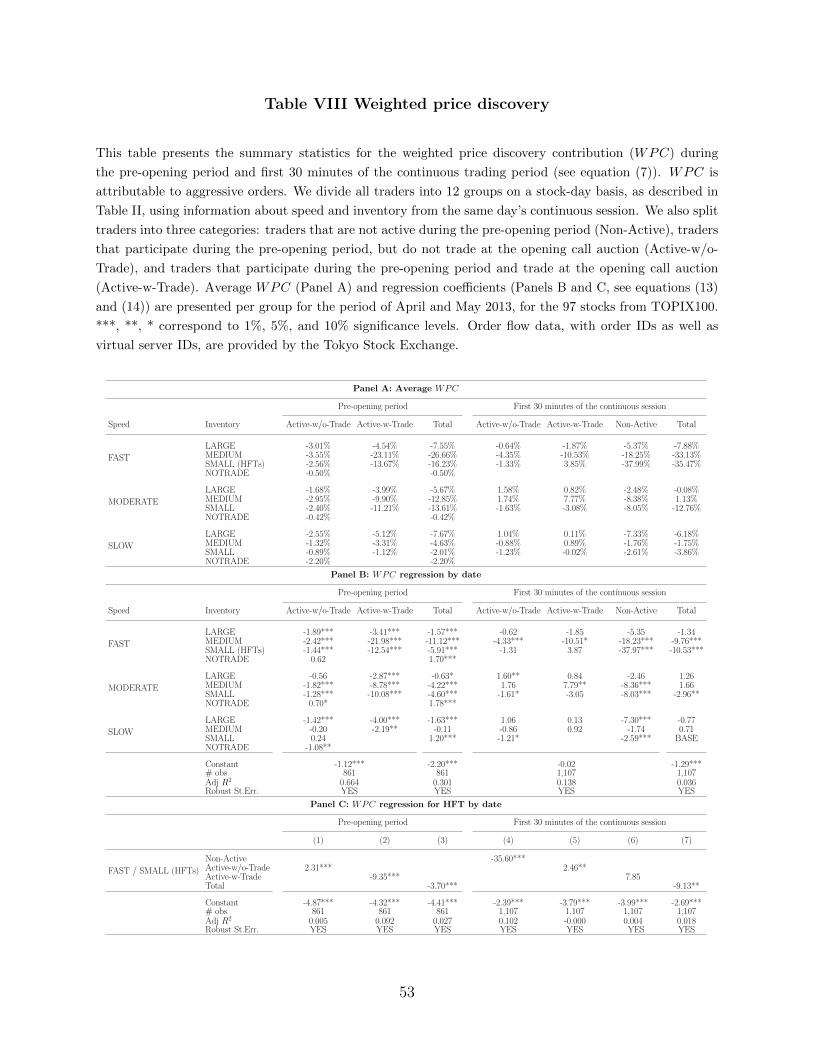
Table VIII Weighted price discovery
This table presents the summary statistics for the weighted price discovery contribution (WPC) during
the pre-opening period and first 30 minutes of the continuous trading period (see equation (7)). WPC is
attributable to aggressive orders. We divide all traders into 12 groups on a stock-day basis, as described in
Table II, using information about speed and inventory from the same day’s continuous session. We also split
traders into three categories: traders that are not active during the pre-opening period (Non-Active), traders
that participate during the pre-opening period, but do not trade at the opening call auction (Active-w/o-
Trade), and traders that participate during the pre-opening period and trade at the opening call auction
(Active-w-Trade). Average WPC (Panel A) and regression coefficients (Panels B and C, see equations (13)
and (14)) are presented per group for the period of April and May 2013, for the 97 stocks from TOPIX100.
***, **, * correspond to 1%, 5%, and 10% significance levels. Order flow data, with order IDs as well as
virtual server IDs, are provided by the Tokyo Stock Exchange.
Panel A: Average WPC
Pre-opening period First 30 minutes of the continuous session
Speed Inventory Active-w/o-Trade Active-w-Trade Total Active-w/o-Trade Active-w-Trade Non-Active Total
FAST
LARGE -3.01% -4.54% -7.55% -0.64% -1.87% -5.37% -7.88%MEDIUM -3.55% -23.11% -26.66% -4.35% -10.53% -18.25% -33.13%SMALL (HFTs) -2.56% -13.67% -16.23% -1.33% 3.85% -37.99% -35.47%NOTRADE -0.50% -0.50%
MODERATE
LARGE -1.68% -3.99% -5.67% 1.58% 0.82% -2.48% -0.08%MEDIUM -2.95% -9.90% -12.85% 1.74% 7.77% -8.38% 1.13%SMALL -2.40% -11.21% -13.61% -1.63% -3.08% -8.05% -12.76%NOTRADE -0.42% -0.42%
SLOW
LARGE -2.55% -5.12% -7.67% 1.04% 0.11% -7.33% -6.18%MEDIUM -1.32% -3.31% -4.63% -0.88% 0.89% -1.76% -1.75%SMALL -0.89% -1.12% -2.01% -1.23% -0.02% -2.61% -3.86%NOTRADE -2.20% -2.20%
Panel B: WPC regression by date
Pre-opening period First 30 minutes of the continuous session
Speed Inventory Active-w/o-Trade Active-w-Trade Total Active-w/o-Trade Active-w-Trade Non-Active Total
FAST
LARGE -1.89*** -3.41*** -1.57*** -0.62 -1.85 -5.35 -1.34MEDIUM -2.42*** -21.98*** -11.12*** -4.33*** -10.51* -18.23*** -9.76***SMALL (HFTs) -1.44*** -12.54*** -5.91*** -1.31 3.87 -37.97*** -10.53***NOTRADE 0.62 1.70***
MODERATE
LARGE -0.56 -2.87*** -0.63* 1.60** 0.84 -2.46 1.26MEDIUM -1.82*** -8.78*** -4.22*** 1.76 7.79** -8.36*** 1.66SMALL -1.28*** -10.08*** -4.60*** -1.61* -3.05 -8.03*** -2.96**NOTRADE 0.70* 1.78***
SLOW
LARGE -1.42*** -4.00*** -1.63*** 1.06 0.13 -7.30*** -0.77MEDIUM -0.20 -2.19** -0.11 -0.86 0.92 -1.74 0.71SMALL 0.24 1.20*** -1.21* -2.59*** BASENOTRADE -1.08**
Constant -1.12*** -2.20*** -0.02 -1.29***# obs 861 861 1,107 1,107Adj R2 0.664 0.301 0.138 0.036Robust St.Err. YES YES YES YES
Panel C: WPC regression for HFT by date
Pre-opening period First 30 minutes of the continuous session
(1) (2) (3) (4) (5) (6) (7)
FAST / SMALL (HFTs)
Non-Active -35.60***Active-w/o-Trade 2.31*** 2.46**Active-w-Trade -9.35*** 7.85Total -3.70*** -9.13**
Constant -4.87*** -4.32*** -4.41*** -2.39*** -3.79*** -3.99*** -2.69***# obs 861 861 861 1,107 1,107 1,107 1,107Adj R2 0.005 0.092 0.027 0.102 -0.000 0.004 0.018Robust St.Err. YES YES YES YES YES YES YES
53
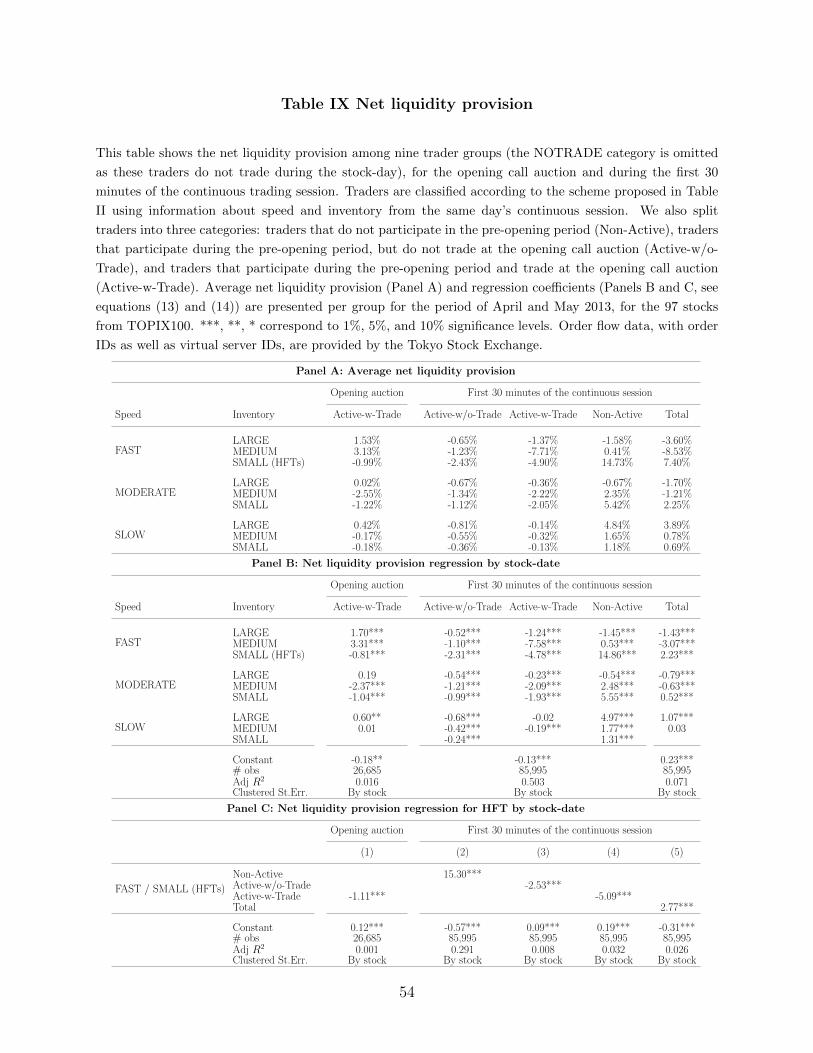
Table IX Net liquidity provision
This table shows the net liquidity provision among nine trader groups (the NOTRADE category is omitted
as these traders do not trade during the stock-day), for the opening call auction and during the first 30
minutes of the continuous trading session. Traders are classified according to the scheme proposed in Table
II using information about speed and inventory from the same day’s continuous session. We also split
traders into three categories: traders that do not participate in the pre-opening period (Non-Active), traders
that participate during the pre-opening period, but do not trade at the opening call auction (Active-w/o-
Trade), and traders that participate during the pre-opening period and trade at the opening call auction
(Active-w-Trade). Average net liquidity provision (Panel A) and regression coefficients (Panels B and C, see
equations (13) and (14)) are presented per group for the period of April and May 2013, for the 97 stocks
from TOPIX100. ***, **, * correspond to 1%, 5%, and 10% significance levels. Order flow data, with order
IDs as well as virtual server IDs, are provided by the Tokyo Stock Exchange.
Panel A: Average net liquidity provision
Opening auction First 30 minutes of the continuous session
Speed Inventory Active-w-Trade Active-w/o-Trade Active-w-Trade Non-Active Total
FASTLARGE 1.53% -0.65% -1.37% -1.58% -3.60%MEDIUM 3.13% -1.23% -7.71% 0.41% -8.53%SMALL (HFTs) -0.99% -2.43% -4.90% 14.73% 7.40%
MODERATELARGE 0.02% -0.67% -0.36% -0.67% -1.70%MEDIUM -2.55% -1.34% -2.22% 2.35% -1.21%SMALL -1.22% -1.12% -2.05% 5.42% 2.25%
SLOWLARGE 0.42% -0.81% -0.14% 4.84% 3.89%MEDIUM -0.17% -0.55% -0.32% 1.65% 0.78%SMALL -0.18% -0.36% -0.13% 1.18% 0.69%
Panel B: Net liquidity provision regression by stock-date
Opening auction First 30 minutes of the continuous session
Speed Inventory Active-w-Trade Active-w/o-Trade Active-w-Trade Non-Active Total
FASTLARGE 1.70*** -0.52*** -1.24*** -1.45*** -1.43***MEDIUM 3.31*** -1.10*** -7.58*** 0.53*** -3.07***SMALL (HFTs) -0.81*** -2.31*** -4.78*** 14.86*** 2.23***
MODERATELARGE 0.19 -0.54*** -0.23*** -0.54*** -0.79***MEDIUM -2.37*** -1.21*** -2.09*** 2.48*** -0.63***SMALL -1.04*** -0.99*** -1.93*** 5.55*** 0.52***
SLOWLARGE 0.60** -0.68*** -0.02 4.97*** 1.07***MEDIUM 0.01 -0.42*** -0.19*** 1.77*** 0.03SMALL -0.24*** 1.31***
Constant -0.18** -0.13*** 0.23***# obs 26,685 85,995 85,995Adj R2 0.016 0.503 0.071Clustered St.Err. By stock By stock By stock
Panel C: Net liquidity provision regression for HFT by stock-date
Opening auction First 30 minutes of the continuous session
(1) (2) (3) (4) (5)
FAST / SMALL (HFTs)
Non-Active 15.30***Active-w/o-Trade -2.53***Active-w-Trade -1.11*** -5.09***Total 2.77***
Constant 0.12*** -0.57*** 0.09*** 0.19*** -0.31***# obs 26,685 85,995 85,995 85,995 85,995Adj R2 0.001 0.291 0.008 0.032 0.026Clustered St.Err. By stock By stock By stock By stock By stock
54
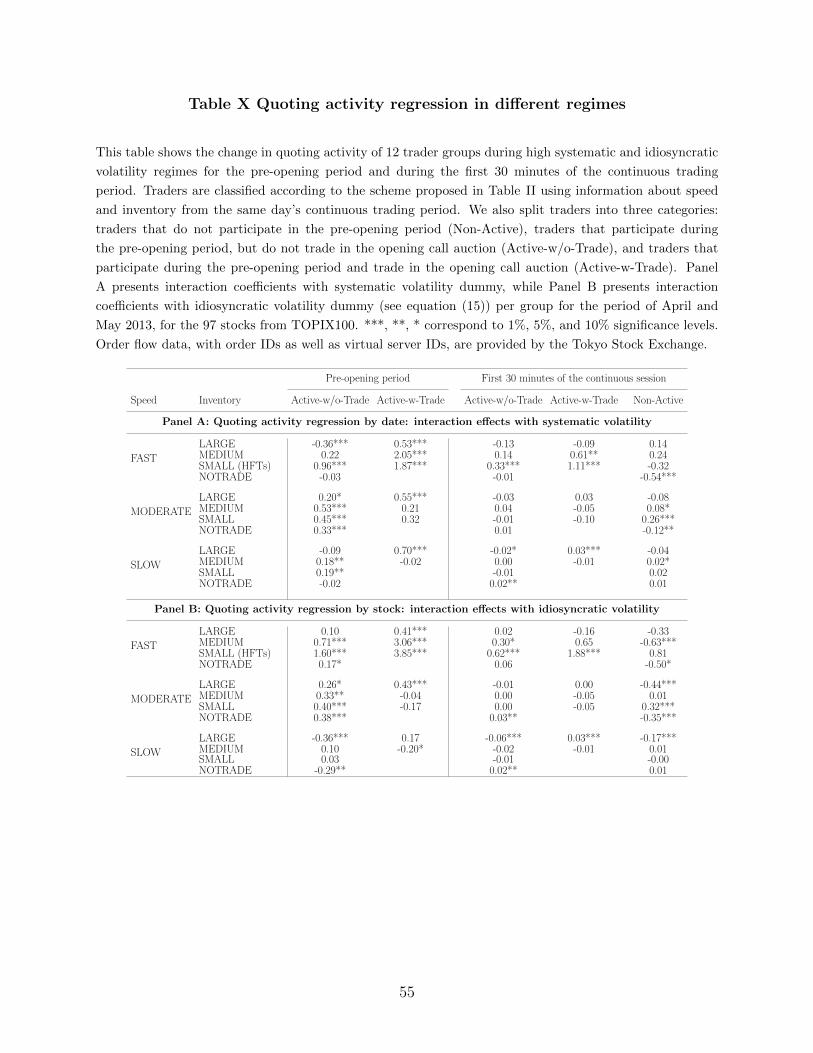
Table X Quoting activity regression in different regimes
This table shows the change in quoting activity of 12 trader groups during high systematic and idiosyncratic
volatility regimes for the pre-opening period and during the first 30 minutes of the continuous trading
period. Traders are classified according to the scheme proposed in Table II using information about speed
and inventory from the same day’s continuous trading period. We also split traders into three categories:
traders that do not participate in the pre-opening period (Non-Active), traders that participate during
the pre-opening period, but do not trade in the opening call auction (Active-w/o-Trade), and traders that
participate during the pre-opening period and trade in the opening call auction (Active-w-Trade). Panel
A presents interaction coefficients with systematic volatility dummy, while Panel B presents interaction
coefficients with idiosyncratic volatility dummy (see equation (15)) per group for the period of April and
May 2013, for the 97 stocks from TOPIX100. ***, **, * correspond to 1%, 5%, and 10% significance levels.
Order flow data, with order IDs as well as virtual server IDs, are provided by the Tokyo Stock Exchange.
Pre-opening period First 30 minutes of the continuous session
Speed Inventory Active-w/o-Trade Active-w-Trade Active-w/o-Trade Active-w-Trade Non-Active
Panel A: Quoting activity regression by date: interaction effects with systematic volatility
FAST
LARGE -0.36*** 0.53*** -0.13 -0.09 0.14MEDIUM 0.22 2.05*** 0.14 0.61** 0.24SMALL (HFTs) 0.96*** 1.87*** 0.33*** 1.11*** -0.32NOTRADE -0.03 -0.01 -0.54***
MODERATE
LARGE 0.20* 0.55*** -0.03 0.03 -0.08MEDIUM 0.53*** 0.21 0.04 -0.05 0.08*SMALL 0.45*** 0.32 -0.01 -0.10 0.26***NOTRADE 0.33*** 0.01 -0.12**
SLOW
LARGE -0.09 0.70*** -0.02* 0.03*** -0.04MEDIUM 0.18** -0.02 0.00 -0.01 0.02*SMALL 0.19** -0.01 0.02NOTRADE -0.02 0.02** 0.01
Panel B: Quoting activity regression by stock: interaction effects with idiosyncratic volatility
FAST
LARGE 0.10 0.41*** 0.02 -0.16 -0.33MEDIUM 0.71*** 3.06*** 0.30* 0.65 -0.63***SMALL (HFTs) 1.60*** 3.85*** 0.62*** 1.88*** 0.81NOTRADE 0.17* 0.06 -0.50*
MODERATE
LARGE 0.26* 0.43*** -0.01 0.00 -0.44***MEDIUM 0.33** -0.04 0.00 -0.05 0.01SMALL 0.40*** -0.17 0.00 -0.05 0.32***NOTRADE 0.38*** 0.03** -0.35***
SLOW
LARGE -0.36*** 0.17 -0.06*** 0.03*** -0.17***MEDIUM 0.10 -0.20* -0.02 -0.01 0.01SMALL 0.03 -0.01 -0.00NOTRADE -0.29** 0.02** 0.01
55
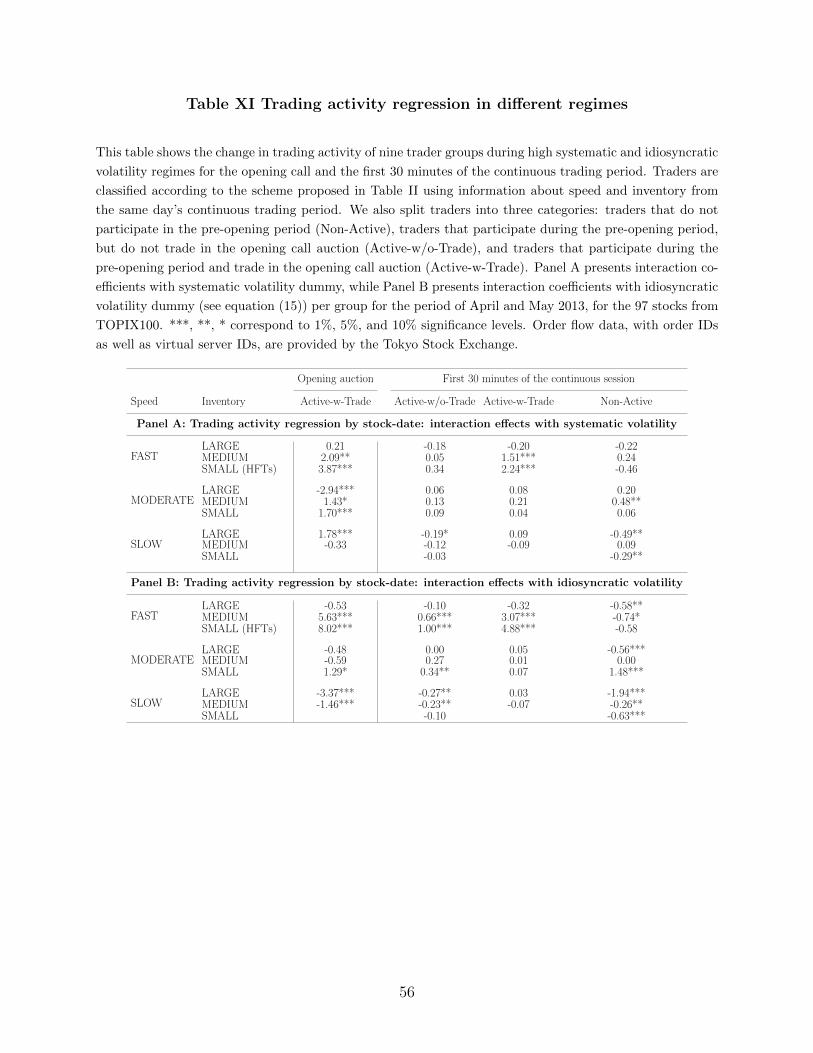
Table XI Trading activity regression in different regimes
This table shows the change in trading activity of nine trader groups during high systematic and idiosyncratic
volatility regimes for the opening call and the first 30 minutes of the continuous trading period. Traders are
classified according to the scheme proposed in Table II using information about speed and inventory from
the same day’s continuous trading period. We also split traders into three categories: traders that do not
participate in the pre-opening period (Non-Active), traders that participate during the pre-opening period,
but do not trade in the opening call auction (Active-w/o-Trade), and traders that participate during the
pre-opening period and trade in the opening call auction (Active-w-Trade). Panel A presents interaction co-
efficients with systematic volatility dummy, while Panel B presents interaction coefficients with idiosyncratic
volatility dummy (see equation (15)) per group for the period of April and May 2013, for the 97 stocks from
TOPIX100. ***, **, * correspond to 1%, 5%, and 10% significance levels. Order flow data, with order IDs
as well as virtual server IDs, are provided by the Tokyo Stock Exchange.
Opening auction First 30 minutes of the continuous session
Speed Inventory Active-w-Trade Active-w/o-Trade Active-w-Trade Non-Active
Panel A: Trading activity regression by stock-date: interaction effects with systematic volatility
FASTLARGE 0.21 -0.18 -0.20 -0.22MEDIUM 2.09** 0.05 1.51*** 0.24SMALL (HFTs) 3.87*** 0.34 2.24*** -0.46
MODERATELARGE -2.94*** 0.06 0.08 0.20MEDIUM 1.43* 0.13 0.21 0.48**SMALL 1.70*** 0.09 0.04 0.06
SLOWLARGE 1.78*** -0.19* 0.09 -0.49**MEDIUM -0.33 -0.12 -0.09 0.09SMALL -0.03 -0.29**
Panel B: Trading activity regression by stock-date: interaction effects with idiosyncratic volatility
FASTLARGE -0.53 -0.10 -0.32 -0.58**MEDIUM 5.63*** 0.66*** 3.07*** -0.74*SMALL (HFTs) 8.02*** 1.00*** 4.88*** -0.58
MODERATELARGE -0.48 0.00 0.05 -0.56***MEDIUM -0.59 0.27 0.01 0.00SMALL 1.29* 0.34** 0.07 1.48***
SLOWLARGE -3.37*** -0.27** 0.03 -1.94***MEDIUM -1.46*** -0.23** -0.07 -0.26**SMALL -0.10 -0.63***
56
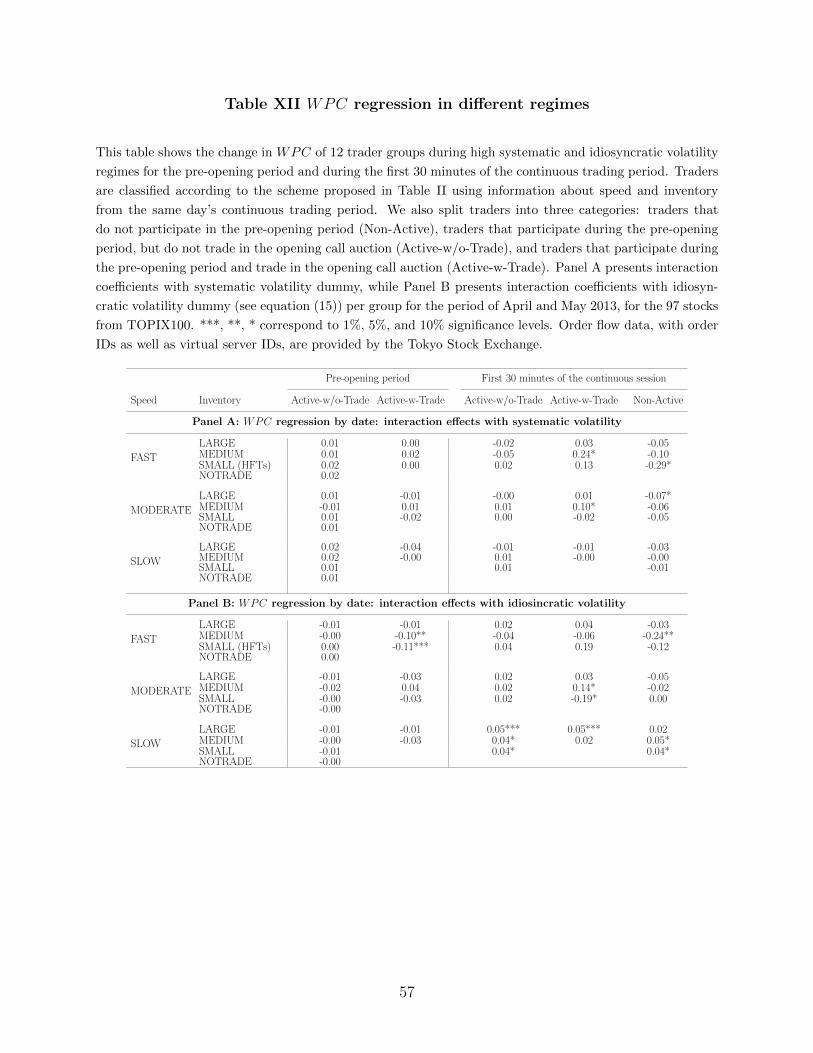
Table XII WPC regression in different regimes
This table shows the change in WPC of 12 trader groups during high systematic and idiosyncratic volatility
regimes for the pre-opening period and during the first 30 minutes of the continuous trading period. Traders
are classified according to the scheme proposed in Table II using information about speed and inventory
from the same day’s continuous trading period. We also split traders into three categories: traders that
do not participate in the pre-opening period (Non-Active), traders that participate during the pre-opening
period, but do not trade in the opening call auction (Active-w/o-Trade), and traders that participate during
the pre-opening period and trade in the opening call auction (Active-w-Trade). Panel A presents interaction
coefficients with systematic volatility dummy, while Panel B presents interaction coefficients with idiosyn-
cratic volatility dummy (see equation (15)) per group for the period of April and May 2013, for the 97 stocks
from TOPIX100. ***, **, * correspond to 1%, 5%, and 10% significance levels. Order flow data, with order
IDs as well as virtual server IDs, are provided by the Tokyo Stock Exchange.
Pre-opening period First 30 minutes of the continuous session
Speed Inventory Active-w/o-Trade Active-w-Trade Active-w/o-Trade Active-w-Trade Non-Active
Panel A: WPC regression by date: interaction effects with systematic volatility
FAST
LARGE 0.01 0.00 -0.02 0.03 -0.05MEDIUM 0.01 0.02 -0.05 0.24* -0.10SMALL (HFTs) 0.02 0.00 0.02 0.13 -0.29*NOTRADE 0.02
MODERATE
LARGE 0.01 -0.01 -0.00 0.01 -0.07*MEDIUM -0.01 0.01 0.01 0.10* -0.06SMALL 0.01 -0.02 0.00 -0.02 -0.05NOTRADE 0.01
SLOW
LARGE 0.02 -0.04 -0.01 -0.01 -0.03MEDIUM 0.02 -0.00 0.01 -0.00 -0.00SMALL 0.01 0.01 -0.01NOTRADE 0.01
Panel B: WPC regression by date: interaction effects with idiosincratic volatility
FAST
LARGE -0.01 -0.01 0.02 0.04 -0.03MEDIUM -0.00 -0.10** -0.04 -0.06 -0.24**SMALL (HFTs) 0.00 -0.11*** 0.04 0.19 -0.12NOTRADE 0.00
MODERATE
LARGE -0.01 -0.03 0.02 0.03 -0.05MEDIUM -0.02 0.04 0.02 0.14* -0.02SMALL -0.00 -0.03 0.02 -0.19* 0.00NOTRADE -0.00
SLOW
LARGE -0.01 -0.01 0.05*** 0.05*** 0.02MEDIUM -0.00 -0.03 0.04* 0.02 0.05*SMALL -0.01 0.04* 0.04*NOTRADE -0.00
57
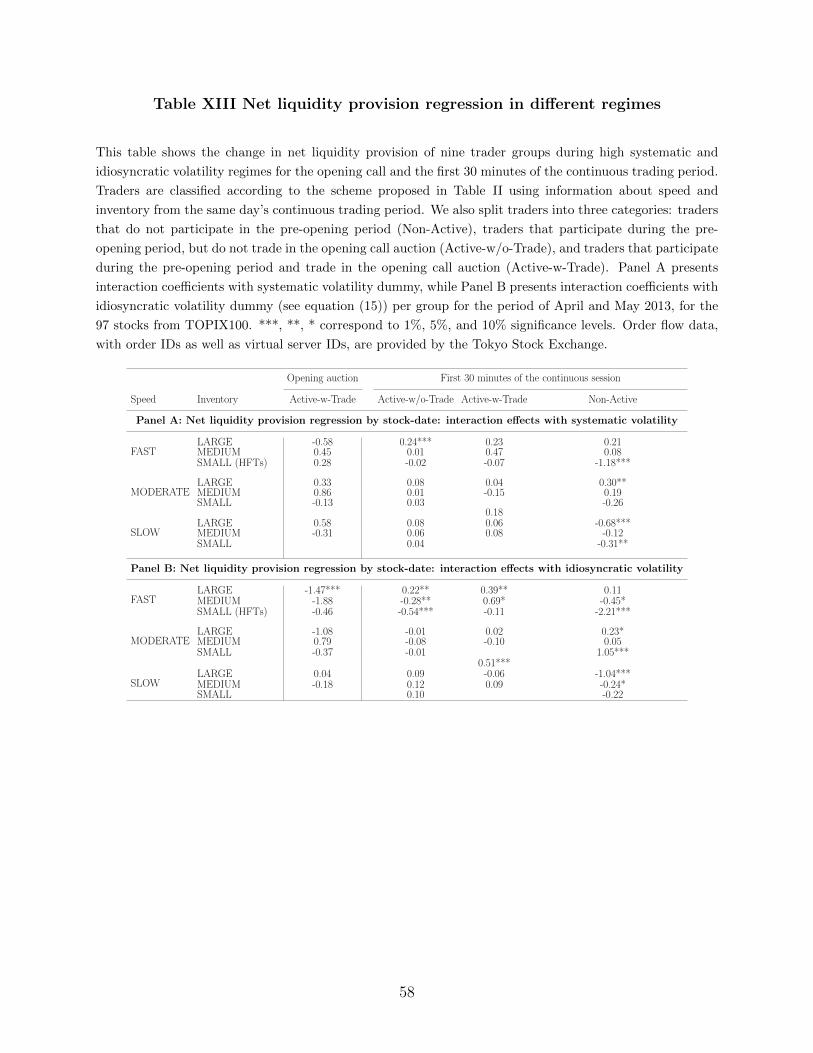
Table XIII Net liquidity provision regression in different regimes
This table shows the change in net liquidity provision of nine trader groups during high systematic and
idiosyncratic volatility regimes for the opening call and the first 30 minutes of the continuous trading period.
Traders are classified according to the scheme proposed in Table II using information about speed and
inventory from the same day’s continuous trading period. We also split traders into three categories: traders
that do not participate in the pre-opening period (Non-Active), traders that participate during the pre-
opening period, but do not trade in the opening call auction (Active-w/o-Trade), and traders that participate
during the pre-opening period and trade in the opening call auction (Active-w-Trade). Panel A presents
interaction coefficients with systematic volatility dummy, while Panel B presents interaction coefficients with
idiosyncratic volatility dummy (see equation (15)) per group for the period of April and May 2013, for the
97 stocks from TOPIX100. ***, **, * correspond to 1%, 5%, and 10% significance levels. Order flow data,
with order IDs as well as virtual server IDs, are provided by the Tokyo Stock Exchange.
Opening auction First 30 minutes of the continuous session
Speed Inventory Active-w-Trade Active-w/o-Trade Active-w-Trade Non-Active
Panel A: Net liquidity provision regression by stock-date: interaction effects with systematic volatility
FASTLARGE -0.58 0.24*** 0.23 0.21MEDIUM 0.45 0.01 0.47 0.08SMALL (HFTs) 0.28 -0.02 -0.07 -1.18***
MODERATELARGE 0.33 0.08 0.04 0.30**MEDIUM 0.86 0.01 -0.15 0.19SMALL -0.13 0.03 -0.26
0.18
SLOWLARGE 0.58 0.08 0.06 -0.68***MEDIUM -0.31 0.06 0.08 -0.12SMALL 0.04 -0.31**
Panel B: Net liquidity provision regression by stock-date: interaction effects with idiosyncratic volatility
FASTLARGE -1.47*** 0.22** 0.39** 0.11MEDIUM -1.88 -0.28** 0.69* -0.45*SMALL (HFTs) -0.46 -0.54*** -0.11 -2.21***
MODERATELARGE -1.08 -0.01 0.02 0.23*MEDIUM 0.79 -0.08 -0.10 0.05SMALL -0.37 -0.01 1.05***
0.51***
SLOWLARGE 0.04 0.09 -0.06 -1.04***MEDIUM -0.18 0.12 0.09 -0.24*SMALL 0.10 -0.22
58
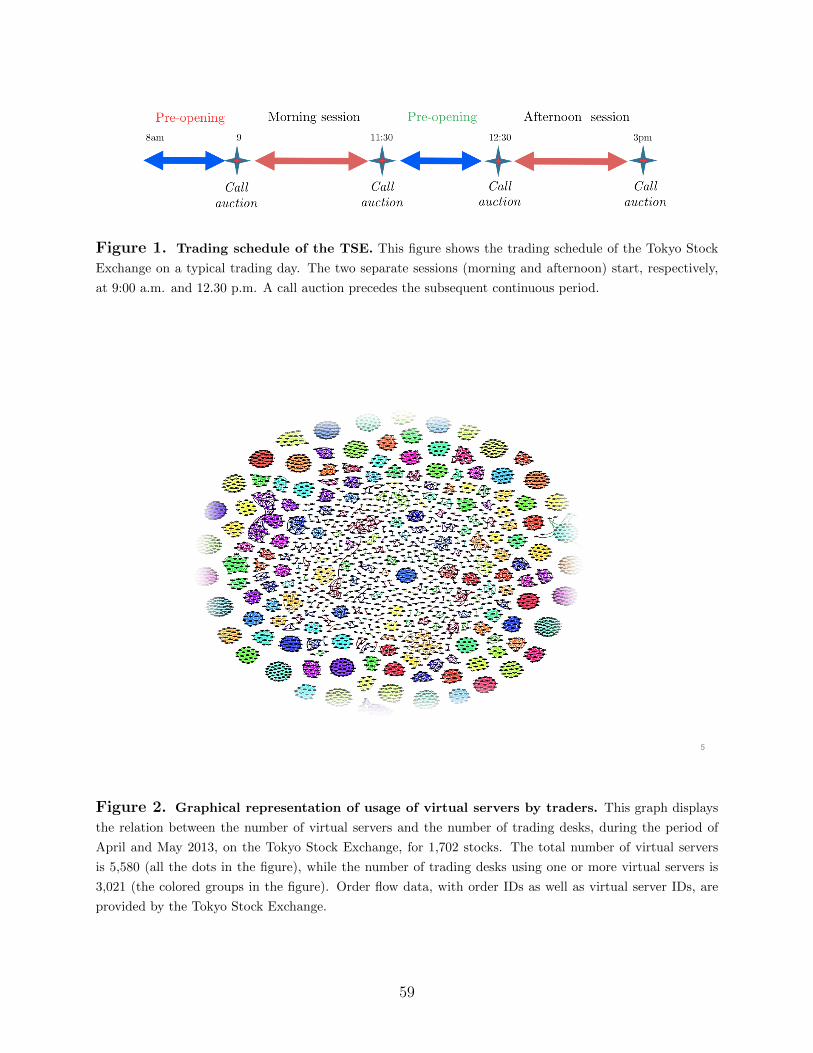
Figure 1. Trading schedule of the TSE. This figure shows the trading schedule of the Tokyo Stock
Exchange on a typical trading day. The two separate sessions (morning and afternoon) start, respectively,
at 9:00 a.m. and 12.30 p.m. A call auction precedes the subsequent continuous period.
5
Figure 2. Graphical representation of usage of virtual servers by traders. This graph displays
the relation between the number of virtual servers and the number of trading desks, during the period of
April and May 2013, on the Tokyo Stock Exchange, for 1,702 stocks. The total number of virtual servers
is 5,580 (all the dots in the figure), while the number of trading desks using one or more virtual servers is
3,021 (the colored groups in the figure). Order flow data, with order IDs as well as virtual server IDs, are
provided by the Tokyo Stock Exchange.
59
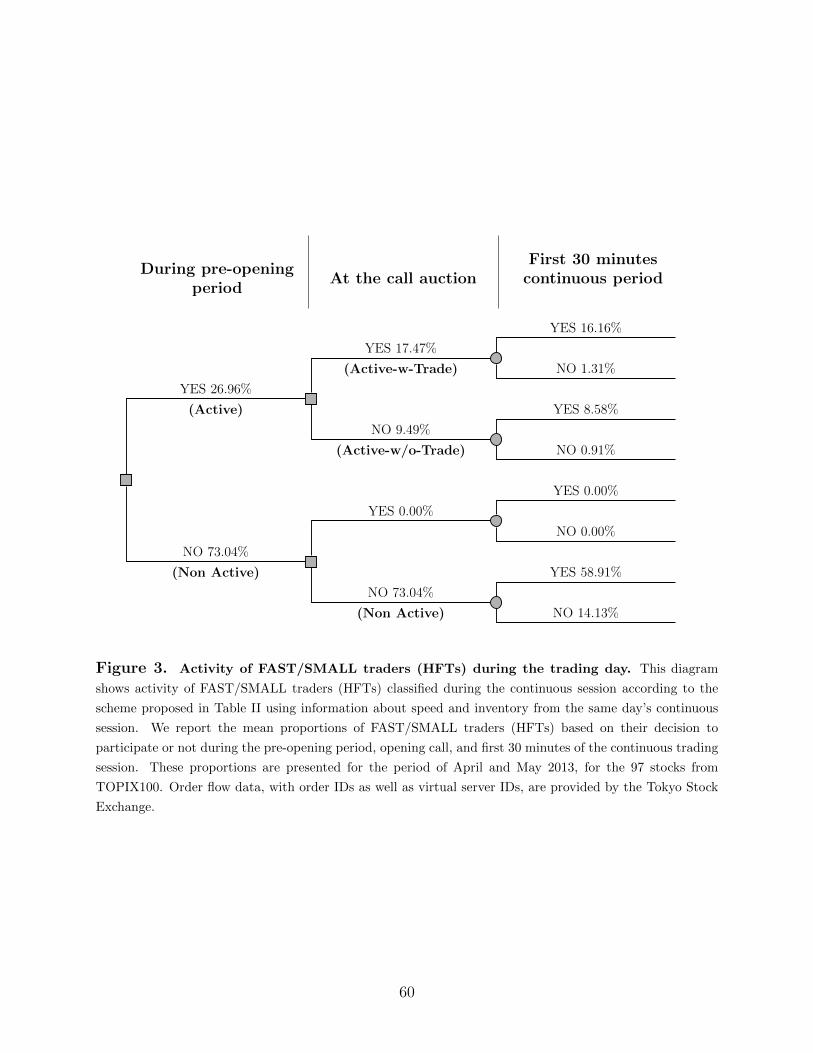
During pre-openingperiod
At the call auctionFirst 30 minutes
continuous period
NO 73.04%
(Non Active)
NO 73.04%
(Non Active) NO 14.13%
YES 58.91%
YES 0.00%
NO 0.00%
YES 0.00%
YES 26.96%
(Active)
NO 9.49%
(Active-w/o-Trade) NO 0.91%
YES 8.58%
YES 17.47%
(Active-w-Trade) NO 1.31%
YES 16.16%
Figure 3. Activity of FAST/SMALL traders (HFTs) during the trading day. This diagram
shows activity of FAST/SMALL traders (HFTs) classified during the continuous session according to the
scheme proposed in Table II using information about speed and inventory from the same day’s continuous
session. We report the mean proportions of FAST/SMALL traders (HFTs) based on their decision to
participate or not during the pre-opening period, opening call, and first 30 minutes of the continuous trading
session. These proportions are presented for the period of April and May 2013, for the 97 stocks from
TOPIX100. Order flow data, with order IDs as well as virtual server IDs, are provided by the Tokyo Stock
Exchange.
60
Internet Appendix for
“Low-Latency Trading and Price Discovery: Evidence from the
Tokyo Stock Exchange in the Pre-Opening and Opening Periods”
MARIO BELLIA, LORIANA PELIZZON, MARTI G. SUBRAHMANYAM,
JUN UNO and DARYA YUFEROVA
ABSTRACT
This supplemental appendix describes the determination of the best quotes during the pre-
opening period, the configuration of multiple virtual servers (VS) used by a trader and presents
additional analyses and robustness checks.
1
Contents
A Best quotes during the pre-opening period 3
B Configuration of multiple virtual servers (VSs) used by one trader 5
C Speed model estimation 6
D An alternative classification scheme: Kirilenko, Kyle, Samadi, and Tuzun (2016) 8
E Order flow in the pre-opening period 11
F Aggressive orders 15
G Additional analysis for price discovery 17G.1 Regression on WPC per stock-day . . . . . . . . . . . . . . . . . . . . . . . . . . . . 17G.2 Price discovery with different reference price . . . . . . . . . . . . . . . . . . . . . . . 17G.3 Price discovery by order type . . . . . . . . . . . . . . . . . . . . . . . . . . . . . . . 19G.4 Speed of price discovery . . . . . . . . . . . . . . . . . . . . . . . . . . . . . . . . . . 21
H Unbiasedness of the quoted price 24
List of Tables
IA.1 Speed model estimation . . . . . . . . . . . . . . . . . . . . . . . . . . . . . . . . . . 7IA.2 Classification scheme proposed by Kirilenko et al. (2016) . . . . . . . . . . . . . . . . 9IA.3 Comparison of classifications . . . . . . . . . . . . . . . . . . . . . . . . . . . . . . . 10IA.4 Aggressive orders during pre-opening period . . . . . . . . . . . . . . . . . . . . . . . 16IA.5 Weighted price discovery regression by stock-date . . . . . . . . . . . . . . . . . . . . 17IA.6 Contribution to weighted price discovery: different reference prices . . . . . . . . . . 18IA.7 Contribution to weighted price discovery by order type during the pre-opening period 20IA.8 Aggressive orders across stocks . . . . . . . . . . . . . . . . . . . . . . . . . . . . . . 22
List of Figures
IA.1 Determination of best bid and ask prices during the pre-opening period . . . . . . . 4IA.2 Illustration of a possible VS configuration . . . . . . . . . . . . . . . . . . . . . . . . 5IA.3 Flow of total order submission in the pre-opening period . . . . . . . . . . . . . . . . 12IA.4 Flow of new orders and cancellations in the last 10 minutes of the pre-opening period 13IA.5 Order flow during the last second of the pre-opening period . . . . . . . . . . . . . . 14IA.6 Deviation from the opening price . . . . . . . . . . . . . . . . . . . . . . . . . . . . . 21IA.7 Comparison of the deviation from the opening price between stocks for which high-
speed traders have different levels of participation . . . . . . . . . . . . . . . . . . . . 23IA.8 Tests of unbiasedness regressions of the pre-opening mid-quotes . . . . . . . . . . . . 24IA.9 Comparison of the test of unbiasedness regressions between stocks with different
levels of high-speed traders participation . . . . . . . . . . . . . . . . . . . . . . . . . 25
2
A. Best quotes during the pre-opening period
The pre-opening quotes consist of bid and ask prices and their associated quantities. In thecase of the TSE, the best bid and ask prices are determined differently during the pre-openingperiod than during the continuous trading period. During the continuous trading period, the bestbid is the highest available bid price, and the best ask is the lowest available ask price. This meansthat the bid and ask schedules do not intersect as the submission of a buy order with a limit pricegreater or equal than the best available ask price will cause the immediate execution of that orderand it will not join the queue in the limit order book.
On the contrary, during the pre-opening period no execution is allowed before the openingauction, when all orders are executed at a single price. Therefore, the best bid and ask pricesreported during the pre-opening period are the respective prices at which the bid (demand) andask (supply) schedules intersect. The best ask is identified as the smallest ask price at which thecumulative depth of the ask schedule is greater than the cumulative depth of the bid schedule. Thebest bid is identified as the largest bid price at which the cumulative depth of the bid schedule isgreater than the cumulative depth of the ask schedule.1
This appendix illustrates how the best bid price and the best ask price are determined duringthe pre-opening period. First of all, the TSE computes the cumulative amount of eligible buy andsell orders (depth) at each price. Usually, more buy orders are accumulated around lower pricesand more sell orders are accumulated around higher prices so that there is a point at which thesituation of “cumulative buy orders” being greater than “cumulative sells” turns into “cumulativebuys” being less than or equal to “cumulative sells”. The best bid is the highest bid price at whichthe cumulative bid depth is greater than the cumulative ask depth and the best ask is the lowestask price at which the cumulative ask depth is greater than the cumulative bid depth.
Therefore, the best bid and ask prices reported during the pre-opening period are the respectiveprices at which the bid (demand) and ask (supply) schedules intersect. Either the best ask or thebest bid price is the opening price, as a result of the single price auction explained in Section III. Inthe pre-opening period, however, the cumulative amounts of buy and sell orders can be the same,particularly at the beginning of the pre-opening period when just a few orders have been entered.In these special situations, the TSE has another rule for determining the best bid and ask in thepre-opening period, which is based on yesterday’s closing price or the upper or lower daily limit onthe price of a stock. Refer to TSE (2015) for details.
1We use two different sources for the best bid and ask prices in the pre-opening period. First, we use the ThomsonReuters Tick History (TRTH) data with a millisecond time stamp. However, there is a time stamp mismatch betweenthe order flow data provided by the TSE and the TRTH best quotes time stamp. Therefore, for the analysis thatrequires exact matching between these two databases, we construct the best bid-offer ourselves on a tick-by-tick basis.This is a non-trivial task due to the multiple rules employed by the TSE. We verify the sequence of our best bid andask estimates using the TRTH database, and ensure that our estimates are consistent with the TRTH best bid andask prices time stamped without a time delay.
3
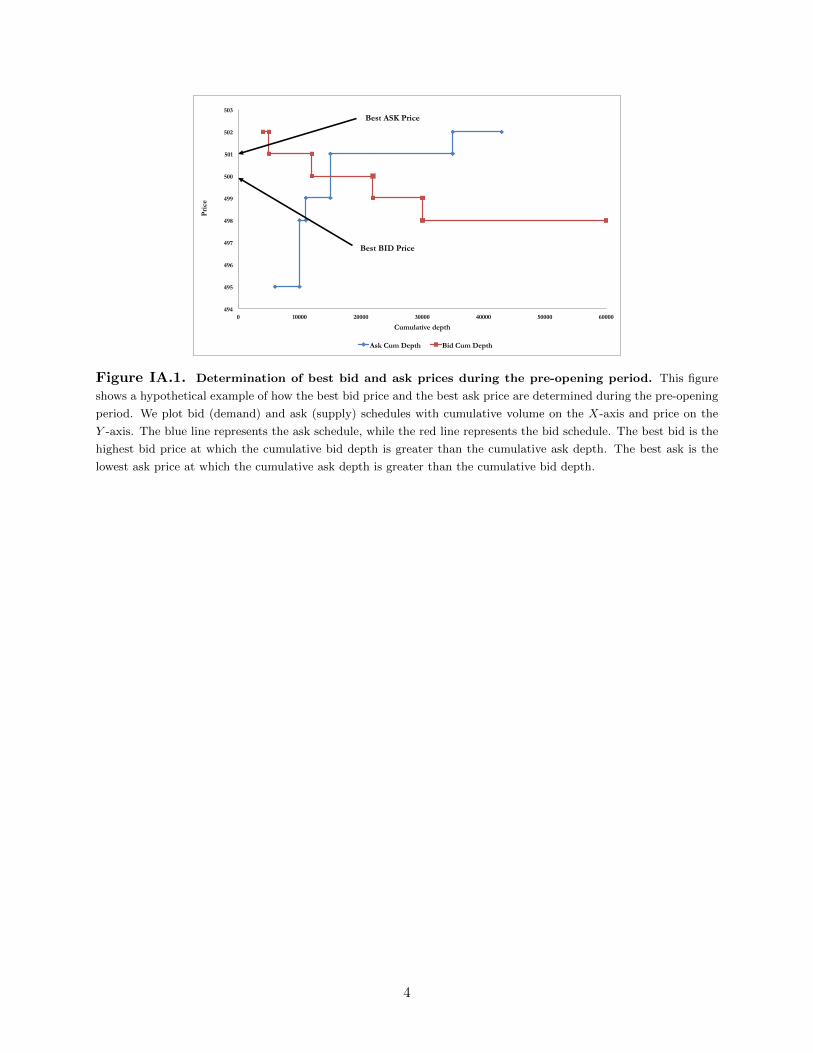
494
495
496
497
498
499
500
501
502
503
0 10000 20000 30000 40000 50000 60000
Pri
ce
Cumulative depth
Ask Cum Depth Bid Cum Depth
Best ASK Price
Best BID Price
Figure IA.1. Determination of best bid and ask prices during the pre-opening period. This figure
shows a hypothetical example of how the best bid price and the best ask price are determined during the pre-opening
period. We plot bid (demand) and ask (supply) schedules with cumulative volume on the X-axis and price on the
Y -axis. The blue line represents the ask schedule, while the red line represents the bid schedule. The best bid is the
highest bid price at which the cumulative bid depth is greater than the cumulative ask depth. The best ask is the
lowest ask price at which the cumulative ask depth is greater than the cumulative bid depth.
4
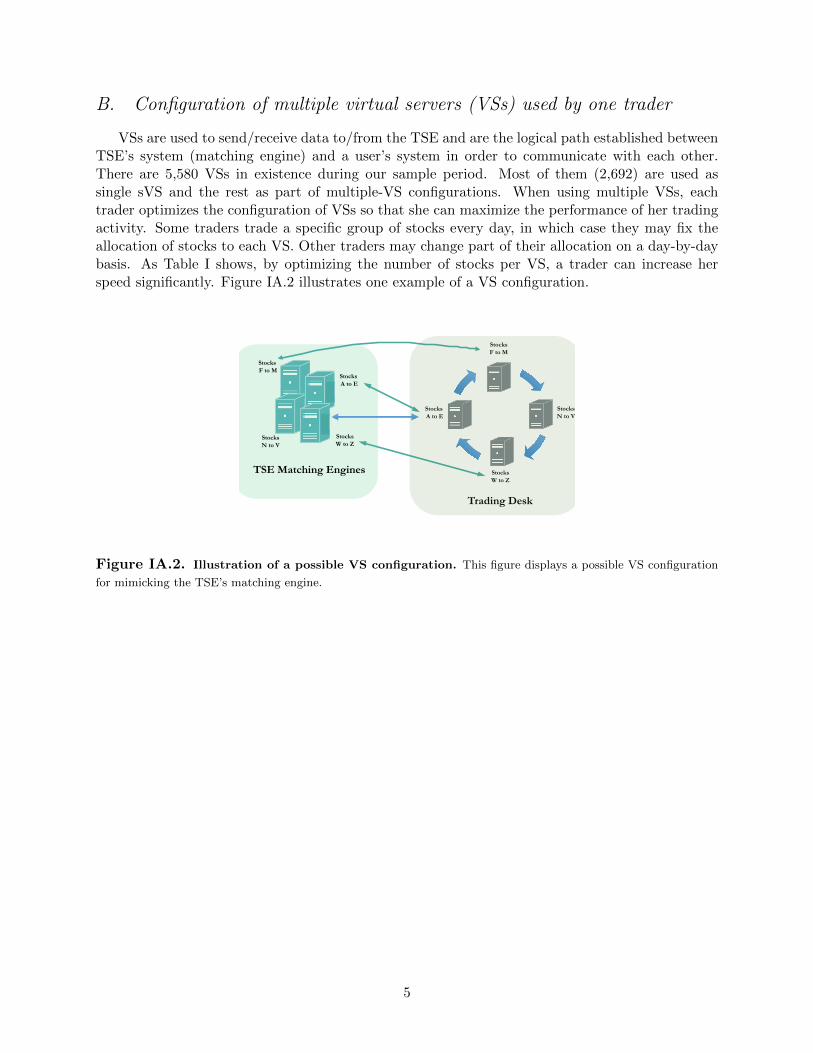
B. Configuration of multiple virtual servers (VSs) used by one trader
VSs are used to send/receive data to/from the TSE and are the logical path established betweenTSE’s system (matching engine) and a user’s system in order to communicate with each other.There are 5,580 VSs in existence during our sample period. Most of them (2,692) are used assingle sVS and the rest as part of multiple-VS configurations. When using multiple VSs, eachtrader optimizes the configuration of VSs so that she can maximize the performance of her tradingactivity. Some traders trade a specific group of stocks every day, in which case they may fix theallocation of stocks to each VS. Other traders may change part of their allocation on a day-by-daybasis. As Table I shows, by optimizing the number of stocks per VS, a trader can increase herspeed significantly. Figure IA.2 illustrates one example of a VS configuration.
TSE Matching Engines
Trading Desk
Stocks F to M
Stocks A to E
Stocks W to Z
Stocks N to V
Stocks A to E
Stocks F to M
Stocks N to V
Stocks W to Z
Figure IA.2. Illustration of a possible VS configuration. This figure displays a possible VS configuration
for mimicking the TSE’s matching engine.
5
C. Speed model estimation
Due to the limitation on the number of quotes per second per VS imposed by the TSE (seefootnote 17 of the paper), the coverage of stocks and intensity of quotes of a trader determinethe size of their operation. Our novel data on virtual server IDs allow us to estimate the relationbetween speed, VS configuration, and quote intensity, using the following equation:
Speedj,k,l = a+ b ln(Quotej,k,l)+
c ln(Nstockk,l/NV Sl) + d ln(MaxQuotek,l) + εj,k,l(IA.1)
Speedj,k,l is the speed measure for stock j, day k, and trader l. Quotej,k,l is the number of quotesfor stock j, day k, and trader l. Nstockk,l is the number of stocks traded on day k by trader l.NV Sl is the number of virtual servers used by trader l (a fixed number during our sample period).MaxQuotek,l is the maximum number of quotes per second sent by trader l on day k.
The daily number of stocks per VS indicates the trader’s speed requirement. The number ofquotes is used by other studies to identify HFTs that engage in market making. The maximumnumber of quotes per second is another aspect of trading style; for example, an index arbitragermight execute a basket of 225 Nikkei Index constituents simultaneously. Our empirical measureof speed is limited by the time stamp unit of one millisecond, meaning that the distribution ofobserved elapsed time is clustered at one millisecond. Taking into account the censored nature ofthe dependent variable, we use a Tobit model to estimate equation (IA.1).
Table IA.1 shows a strong relation between the number of stocks per VS, the total number ofquotes, and the maximum number of quotes per second. The smaller the number of stocks perVS, and the larger the number of quotes (maximum number of quotes per second), the lower is thespeed.
6
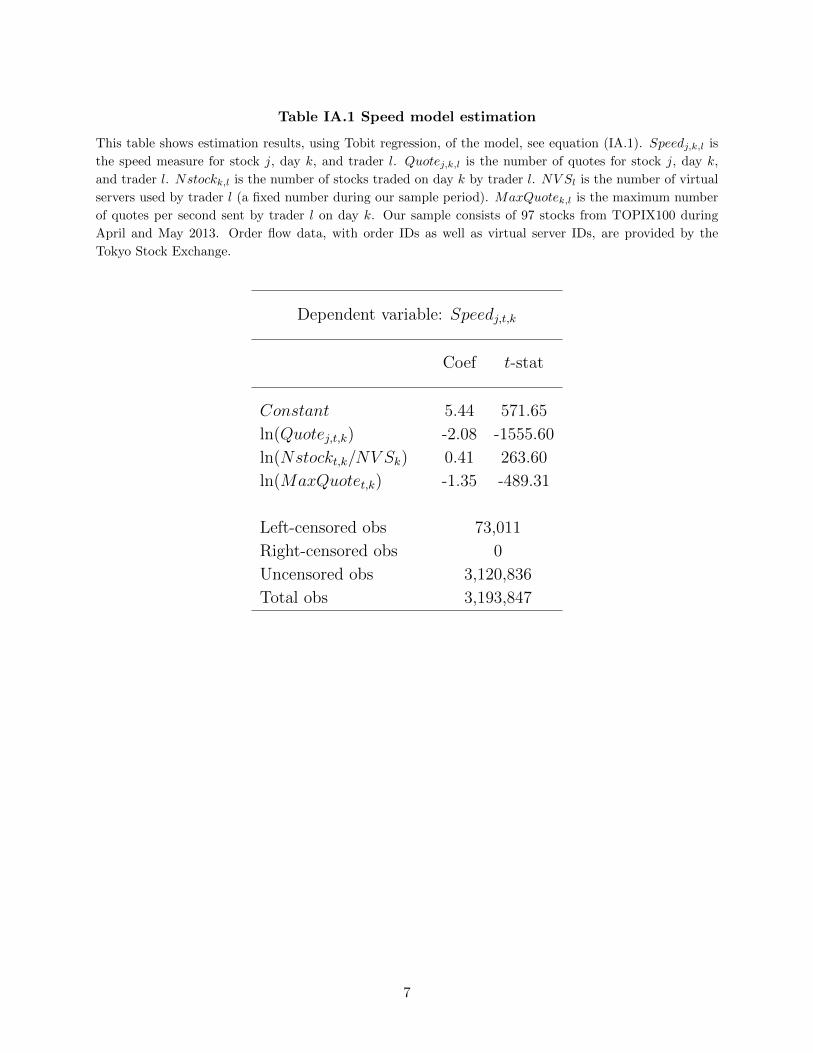
Table IA.1 Speed model estimation
This table shows estimation results, using Tobit regression, of the model, see equation (IA.1). Speedj,k,l is
the speed measure for stock j, day k, and trader l. Quotej,k,l is the number of quotes for stock j, day k,
and trader l. Nstockk,l is the number of stocks traded on day k by trader l. NV Sl is the number of virtual
servers used by trader l (a fixed number during our sample period). MaxQuotek,l is the maximum number
of quotes per second sent by trader l on day k. Our sample consists of 97 stocks from TOPIX100 during
April and May 2013. Order flow data, with order IDs as well as virtual server IDs, are provided by the
Tokyo Stock Exchange.
Dependent variable: Speedj,t,k
Coef t-stat
Constant 5.44 571.65
ln(Quotej,t,k) -2.08 -1555.60
ln(Nstockt,k/NV Sk) 0.41 263.60
ln(MaxQuotet,k) -1.35 -489.31
Left-censored obs 73,011
Right-censored obs 0
Uncensored obs 3,120,836
Total obs 3,193,847
7
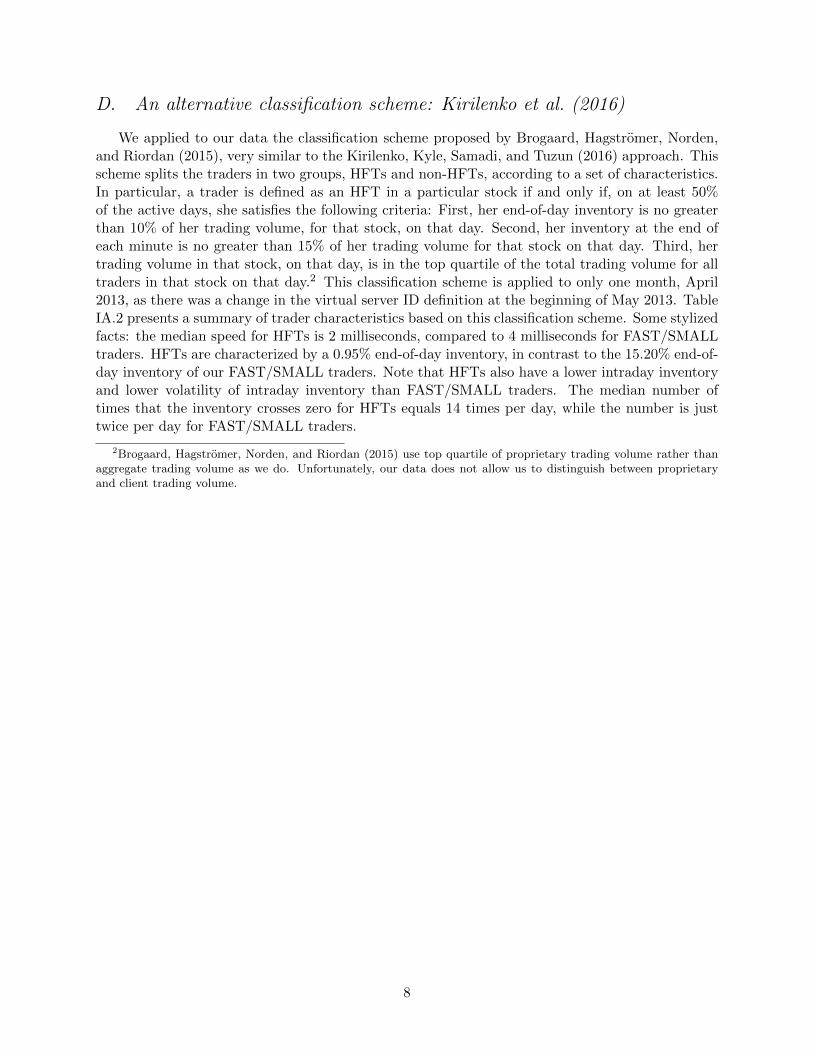
D. An alternative classification scheme: Kirilenko et al. (2016)
We applied to our data the classification scheme proposed by Brogaard, Hagstromer, Norden,and Riordan (2015), very similar to the Kirilenko, Kyle, Samadi, and Tuzun (2016) approach. Thisscheme splits the traders in two groups, HFTs and non-HFTs, according to a set of characteristics.In particular, a trader is defined as an HFT in a particular stock if and only if, on at least 50%of the active days, she satisfies the following criteria: First, her end-of-day inventory is no greaterthan 10% of her trading volume, for that stock, on that day. Second, her inventory at the end ofeach minute is no greater than 15% of her trading volume for that stock on that day. Third, hertrading volume in that stock, on that day, is in the top quartile of the total trading volume for alltraders in that stock on that day.2 This classification scheme is applied to only one month, April2013, as there was a change in the virtual server ID definition at the beginning of May 2013. TableIA.2 presents a summary of trader characteristics based on this classification scheme. Some stylizedfacts: the median speed for HFTs is 2 milliseconds, compared to 4 milliseconds for FAST/SMALLtraders. HFTs are characterized by a 0.95% end-of-day inventory, in contrast to the 15.20% end-of-day inventory of our FAST/SMALL traders. Note that HFTs also have a lower intraday inventoryand lower volatility of intraday inventory than FAST/SMALL traders. The median number oftimes that the inventory crosses zero for HFTs equals 14 times per day, while the number is justtwice per day for FAST/SMALL traders.
2Brogaard, Hagstromer, Norden, and Riordan (2015) use top quartile of proprietary trading volume rather thanaggregate trading volume as we do. Unfortunately, our data does not allow us to distinguish between proprietaryand client trading volume.
8
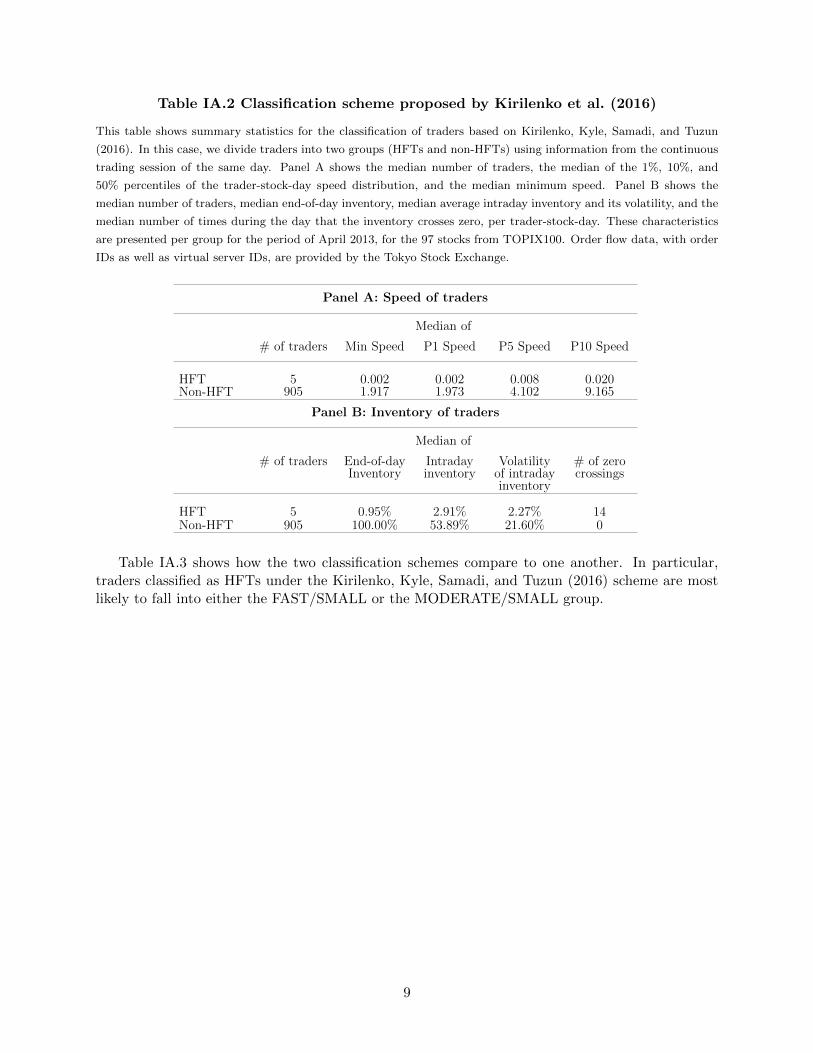
Table IA.2 Classification scheme proposed by Kirilenko et al. (2016)
This table shows summary statistics for the classification of traders based on Kirilenko, Kyle, Samadi, and Tuzun
(2016). In this case, we divide traders into two groups (HFTs and non-HFTs) using information from the continuous
trading session of the same day. Panel A shows the median number of traders, the median of the 1%, 10%, and
50% percentiles of the trader-stock-day speed distribution, and the median minimum speed. Panel B shows the
median number of traders, median end-of-day inventory, median average intraday inventory and its volatility, and the
median number of times during the day that the inventory crosses zero, per trader-stock-day. These characteristics
are presented per group for the period of April 2013, for the 97 stocks from TOPIX100. Order flow data, with order
IDs as well as virtual server IDs, are provided by the Tokyo Stock Exchange.
Panel A: Speed of traders
Median of
# of traders Min Speed P1 Speed P5 Speed P10 Speed
HFT 5 0.002 0.002 0.008 0.020Non-HFT 905 1.917 1.973 4.102 9.165
Panel B: Inventory of traders
Median of
# of traders End-of-dayInventory
Intradayinventory
Volatilityof intradayinventory
# of zerocrossings
HFT 5 0.95% 2.91% 2.27% 14Non-HFT 905 100.00% 53.89% 21.60% 0
Table IA.3 shows how the two classification schemes compare to one another. In particular,traders classified as HFTs under the Kirilenko, Kyle, Samadi, and Tuzun (2016) scheme are mostlikely to fall into either the FAST/SMALL or the MODERATE/SMALL group.
9
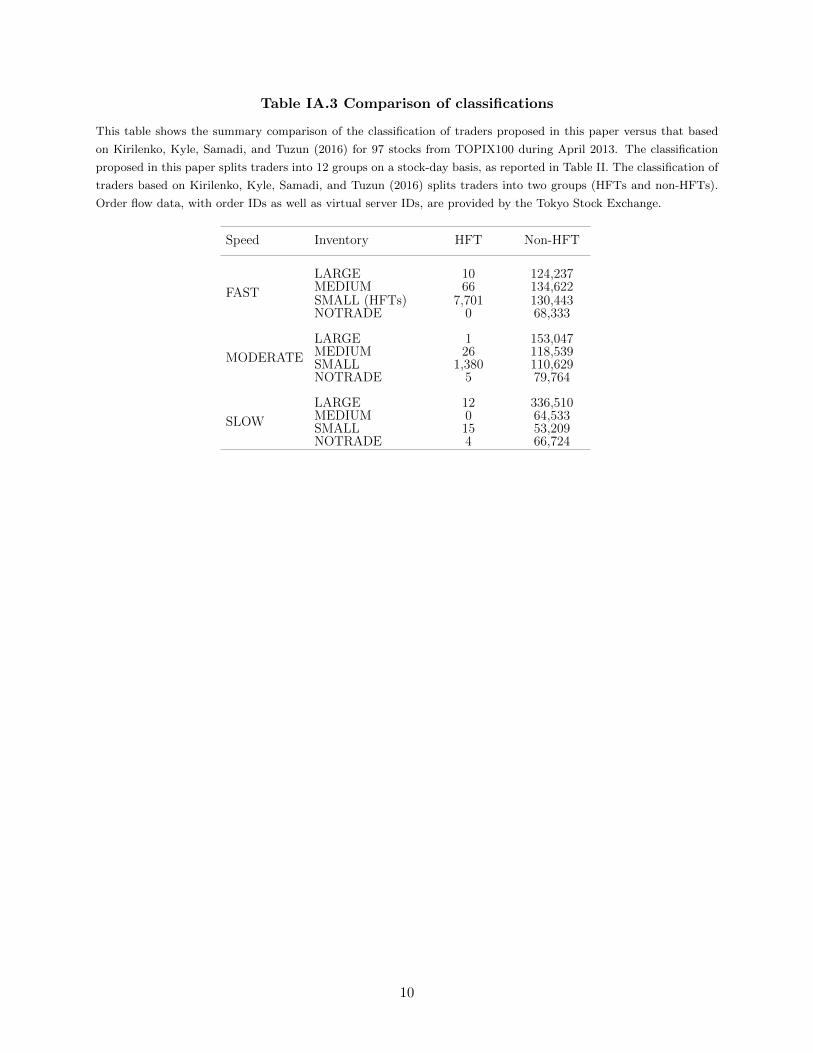
Table IA.3 Comparison of classifications
This table shows the summary comparison of the classification of traders proposed in this paper versus that based
on Kirilenko, Kyle, Samadi, and Tuzun (2016) for 97 stocks from TOPIX100 during April 2013. The classification
proposed in this paper splits traders into 12 groups on a stock-day basis, as reported in Table II. The classification of
traders based on Kirilenko, Kyle, Samadi, and Tuzun (2016) splits traders into two groups (HFTs and non-HFTs).
Order flow data, with order IDs as well as virtual server IDs, are provided by the Tokyo Stock Exchange.
Speed Inventory HFT Non-HFT
FAST
LARGE 10 124,237MEDIUM 66 134,622SMALL (HFTs) 7,701 130,443NOTRADE 0 68,333
MODERATE
LARGE 1 153,047MEDIUM 26 118,539SMALL 1,380 110,629NOTRADE 5 79,764
SLOW
LARGE 12 336,510MEDIUM 0 64,533SMALL 15 53,209NOTRADE 4 66,724
10
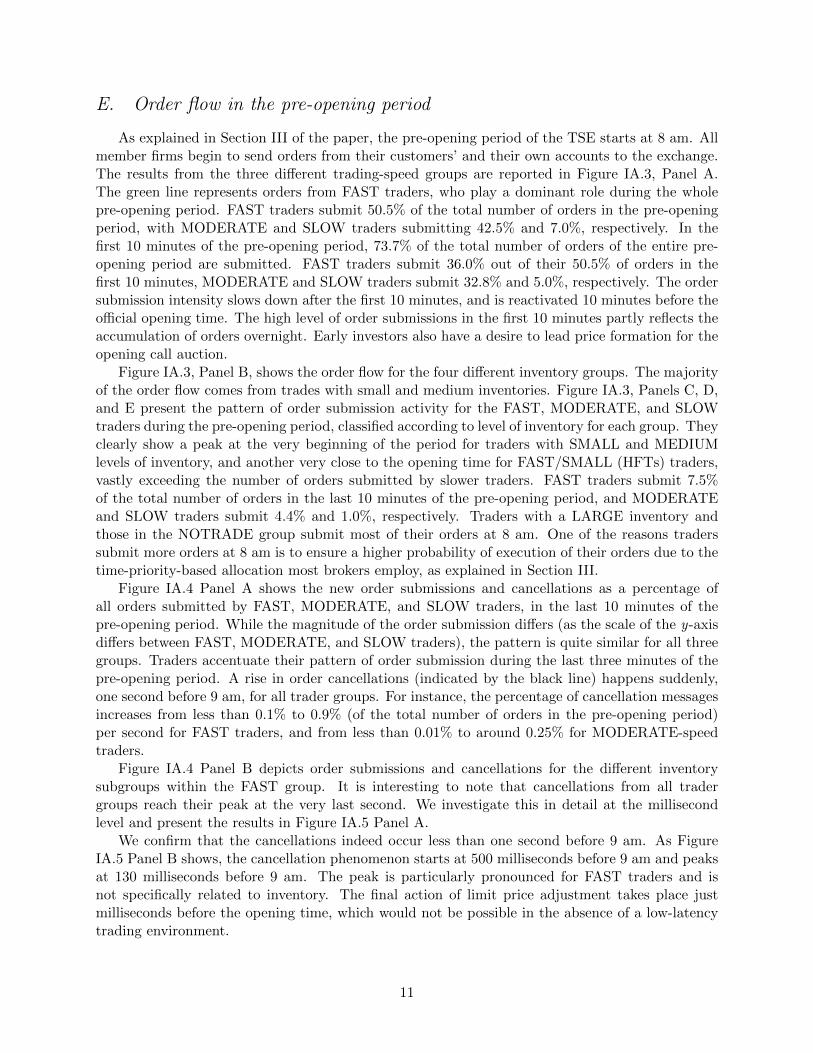
E. Order flow in the pre-opening period
As explained in Section III of the paper, the pre-opening period of the TSE starts at 8 am. Allmember firms begin to send orders from their customers’ and their own accounts to the exchange.The results from the three different trading-speed groups are reported in Figure IA.3, Panel A.The green line represents orders from FAST traders, who play a dominant role during the wholepre-opening period. FAST traders submit 50.5% of the total number of orders in the pre-openingperiod, with MODERATE and SLOW traders submitting 42.5% and 7.0%, respectively. In thefirst 10 minutes of the pre-opening period, 73.7% of the total number of orders of the entire pre-opening period are submitted. FAST traders submit 36.0% out of their 50.5% of orders in thefirst 10 minutes, MODERATE and SLOW traders submit 32.8% and 5.0%, respectively. The ordersubmission intensity slows down after the first 10 minutes, and is reactivated 10 minutes before theofficial opening time. The high level of order submissions in the first 10 minutes partly reflects theaccumulation of orders overnight. Early investors also have a desire to lead price formation for theopening call auction.
Figure IA.3, Panel B, shows the order flow for the four different inventory groups. The majorityof the order flow comes from trades with small and medium inventories. Figure IA.3, Panels C, D,and E present the pattern of order submission activity for the FAST, MODERATE, and SLOWtraders during the pre-opening period, classified according to level of inventory for each group. Theyclearly show a peak at the very beginning of the period for traders with SMALL and MEDIUMlevels of inventory, and another very close to the opening time for FAST/SMALL (HFTs) traders,vastly exceeding the number of orders submitted by slower traders. FAST traders submit 7.5%of the total number of orders in the last 10 minutes of the pre-opening period, and MODERATEand SLOW traders submit 4.4% and 1.0%, respectively. Traders with a LARGE inventory andthose in the NOTRADE group submit most of their orders at 8 am. One of the reasons traderssubmit more orders at 8 am is to ensure a higher probability of execution of their orders due to thetime-priority-based allocation most brokers employ, as explained in Section III.
Figure IA.4 Panel A shows the new order submissions and cancellations as a percentage ofall orders submitted by FAST, MODERATE, and SLOW traders, in the last 10 minutes of thepre-opening period. While the magnitude of the order submission differs (as the scale of the y-axisdiffers between FAST, MODERATE, and SLOW traders), the pattern is quite similar for all threegroups. Traders accentuate their pattern of order submission during the last three minutes of thepre-opening period. A rise in order cancellations (indicated by the black line) happens suddenly,one second before 9 am, for all trader groups. For instance, the percentage of cancellation messagesincreases from less than 0.1% to 0.9% (of the total number of orders in the pre-opening period)per second for FAST traders, and from less than 0.01% to around 0.25% for MODERATE-speedtraders.
Figure IA.4 Panel B depicts order submissions and cancellations for the different inventorysubgroups within the FAST group. It is interesting to note that cancellations from all tradergroups reach their peak at the very last second. We investigate this in detail at the millisecondlevel and present the results in Figure IA.5 Panel A.
We confirm that the cancellations indeed occur less than one second before 9 am. As FigureIA.5 Panel B shows, the cancellation phenomenon starts at 500 milliseconds before 9 am and peaksat 130 milliseconds before 9 am. The peak is particularly pronounced for FAST traders and isnot specifically related to inventory. The final action of limit price adjustment takes place justmilliseconds before the opening time, which would not be possible in the absence of a low-latencytrading environment.
11
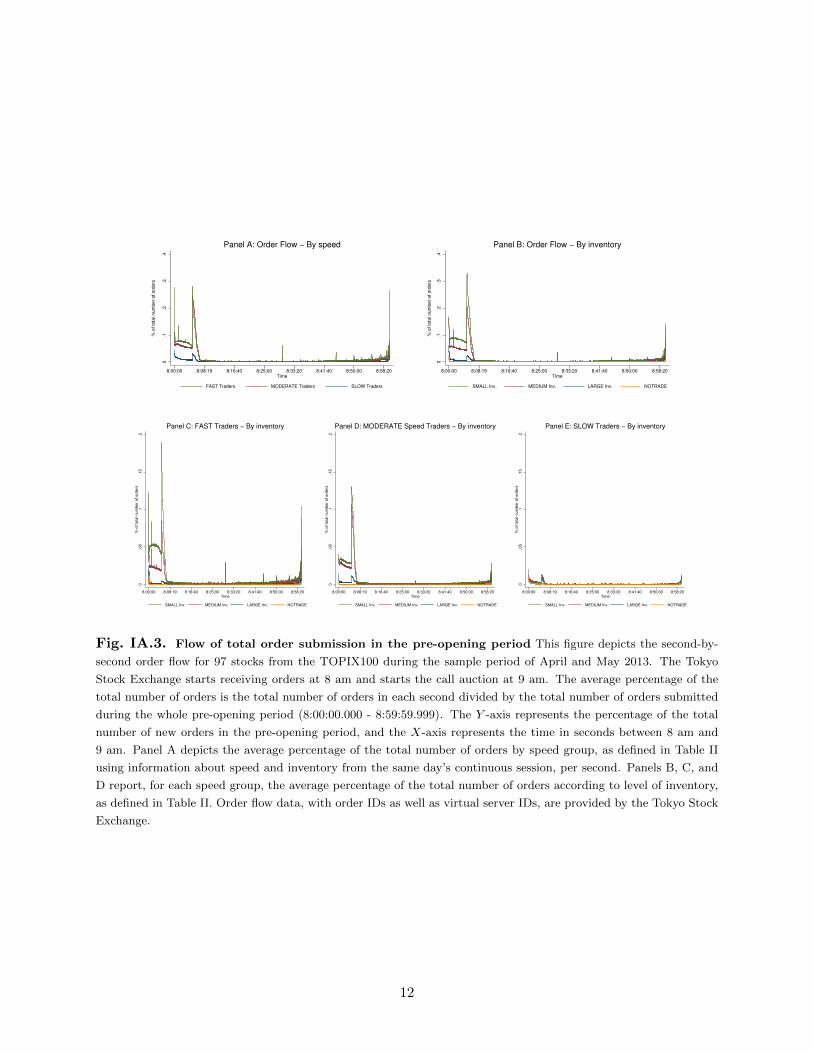
0.1
.2.3
.4
% o
f to
tal n
um
be
r o
f o
rde
rs
8:00:00 8:08:19 8:16:40 8:25:00 8:33:20 8:41:40 8:50:00 8:58:20Time
FAST Traders MODERATE Traders SLOW Traders
Panel A: Order Flow − By speed
0.1
.2.3
.4
% o
f to
tal n
um
be
r o
f o
rde
rs
8:00:00 8:08:19 8:16:40 8:25:00 8:33:20 8:41:40 8:50:00 8:58:20Time
SMALL Inv. MEDIUM Inv. LARGE Inv. NOTRADE
Panel B: Order Flow − By inventory
0.0
5.1
.15
.2%
of to
tal num
ber
of ord
ers
8:00:00 8:08:19 8:16:40 8:25:00 8:33:20 8:41:40 8:50:00 8:58:20Time
SMALL Inv. MEDIUM Inv. LARGE Inv. NOTRADE
Panel C: FAST Traders − By inventory
0.0
5.1
.15
.2%
of to
tal num
ber
of ord
ers
8:00:00 8:08:19 8:16:40 8:25:00 8:33:20 8:41:40 8:50:00 8:58:20Time
SMALL Inv. MEDIUM Inv. LARGE Inv. NOTRADE
Panel D: MODERATE Speed Traders − By inventory
0.0
5.1
.15
.2%
of to
tal num
ber
of ord
ers
8:00:00 8:08:19 8:16:40 8:25:00 8:33:20 8:41:40 8:50:00 8:58:20Time
SMALL Inv. MEDIUM Inv. LARGE Inv. NOTRADE
Panel E: SLOW Traders − By inventory
Fig. IA.3. Flow of total order submission in the pre-opening period This figure depicts the second-by-
second order flow for 97 stocks from the TOPIX100 during the sample period of April and May 2013. The Tokyo
Stock Exchange starts receiving orders at 8 am and starts the call auction at 9 am. The average percentage of the
total number of orders is the total number of orders in each second divided by the total number of orders submitted
during the whole pre-opening period (8:00:00.000 - 8:59:59.999). The Y -axis represents the percentage of the total
number of new orders in the pre-opening period, and the X-axis represents the time in seconds between 8 am and
9 am. Panel A depicts the average percentage of the total number of orders by speed group, as defined in Table II
using information about speed and inventory from the same day’s continuous session, per second. Panels B, C, and
D report, for each speed group, the average percentage of the total number of orders according to level of inventory,
as defined in Table II. Order flow data, with order IDs as well as virtual server IDs, are provided by the Tokyo Stock
Exchange.
12
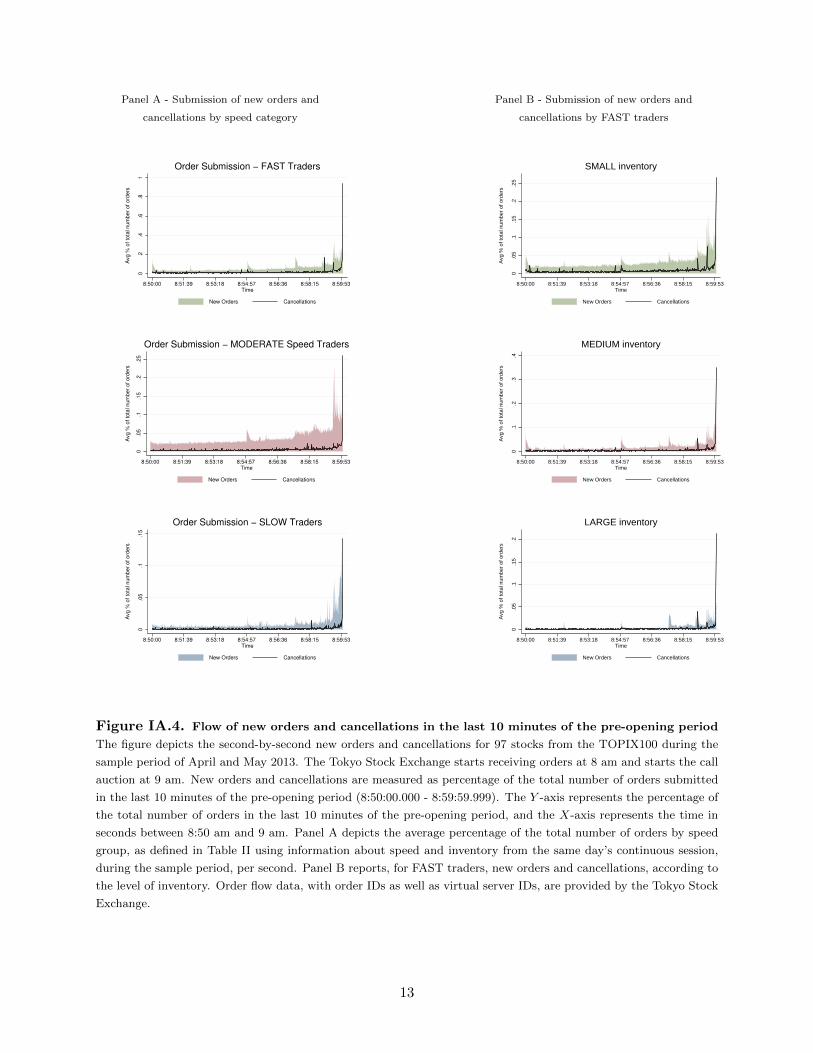
Panel A - Submission of new orders and
cancellations by speed category
0.2
.4.6
.81
Avg
% o
f to
tal n
um
be
r o
f o
rde
rs
8:50:00 8:51:39 8:53:18 8:54:57 8:56:36 8:58:15 8:59:53Time
New Orders Cancellations
Order Submission − FAST Traders
0.0
5.1
.15
.2.2
5
Avg
% o
f to
tal n
um
be
r o
f o
rde
rs
8:50:00 8:51:39 8:53:18 8:54:57 8:56:36 8:58:15 8:59:53Time
New Orders Cancellations
Order Submission − MODERATE Speed Traders
0.0
5.1
.15
Avg
% o
f to
tal n
um
be
r o
f o
rde
rs
8:50:00 8:51:39 8:53:18 8:54:57 8:56:36 8:58:15 8:59:53Time
New Orders Cancellations
Order Submission − SLOW Traders
Panel B - Submission of new orders and
cancellations by FAST traders
0.0
5.1
.15
.2.2
5
Avg
% o
f tot
al n
umbe
r of
ord
ers
8:50:00 8:51:39 8:53:18 8:54:57 8:56:36 8:58:15 8:59:53Time
New Orders Cancellations
SMALL inventory
0.1
.2.3
.4
Avg
% o
f tot
al n
umbe
r of
ord
ers
8:50:00 8:51:39 8:53:18 8:54:57 8:56:36 8:58:15 8:59:53Time
New Orders Cancellations
MEDIUM inventory
0.0
5.1
.15
.2
Avg
% o
f tot
al n
umbe
r of
ord
ers
8:50:00 8:51:39 8:53:18 8:54:57 8:56:36 8:58:15 8:59:53Time
New Orders Cancellations
LARGE inventory
Figure IA.4. Flow of new orders and cancellations in the last 10 minutes of the pre-opening period
The figure depicts the second-by-second new orders and cancellations for 97 stocks from the TOPIX100 during the
sample period of April and May 2013. The Tokyo Stock Exchange starts receiving orders at 8 am and starts the call
auction at 9 am. New orders and cancellations are measured as percentage of the total number of orders submitted
in the last 10 minutes of the pre-opening period (8:50:00.000 - 8:59:59.999). The Y -axis represents the percentage of
the total number of orders in the last 10 minutes of the pre-opening period, and the X-axis represents the time in
seconds between 8:50 am and 9 am. Panel A depicts the average percentage of the total number of orders by speed
group, as defined in Table II using information about speed and inventory from the same day’s continuous session,
during the sample period, per second. Panel B reports, for FAST traders, new orders and cancellations, according to
the level of inventory. Order flow data, with order IDs as well as virtual server IDs, are provided by the Tokyo Stock
Exchange.
13
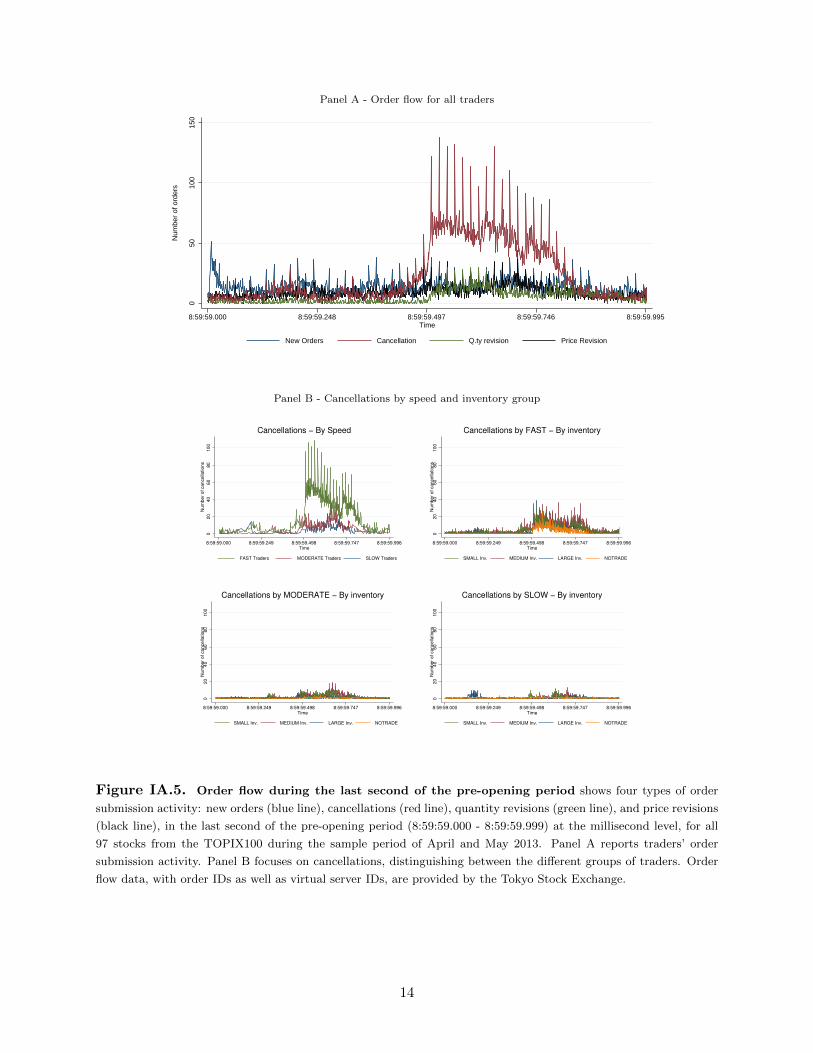
Panel A - Order flow for all traders
050
100
150
Num
ber
of o
rder
s
8:59:59.000 8:59:59.248 8:59:59.497 8:59:59.746 8:59:59.995Time
New Orders Cancellation Q.ty revision Price Revision
Panel B - Cancellations by speed and inventory group
020
40
60
80
100
Num
ber
of cancella
tions
8:59:59.000 8:59:59.249 8:59:59.498 8:59:59.747 8:59:59.996Time
FAST Traders MODERATE Traders SLOW Traders
Cancellations − By Speed0
20
40
60
80
100
Num
ber
of cancella
tions
8:59:59.000 8:59:59.249 8:59:59.498 8:59:59.747 8:59:59.996Time
SMALL Inv. MEDIUM Inv. LARGE Inv. NOTRADE
Cancellations by FAST − By inventory
020
40
60
80
100
Num
ber
of cancella
tions
8:59:59.000 8:59:59.249 8:59:59.498 8:59:59.747 8:59:59.996Time
SMALL Inv. MEDIUM Inv. LARGE Inv. NOTRADE
Cancellations by MODERATE − By inventory
020
40
60
80
100
Num
ber
of cancella
tions
8:59:59.000 8:59:59.249 8:59:59.498 8:59:59.747 8:59:59.996Time
SMALL Inv. MEDIUM Inv. LARGE Inv. NOTRADE
Cancellations by SLOW − By inventory
Figure IA.5. Order flow during the last second of the pre-opening period shows four types of order
submission activity: new orders (blue line), cancellations (red line), quantity revisions (green line), and price revisions
(black line), in the last second of the pre-opening period (8:59:59.000 - 8:59:59.999) at the millisecond level, for all
97 stocks from the TOPIX100 during the sample period of April and May 2013. Panel A reports traders’ order
submission activity. Panel B focuses on cancellations, distinguishing between the different groups of traders. Order
flow data, with order IDs as well as virtual server IDs, are provided by the Tokyo Stock Exchange.
14
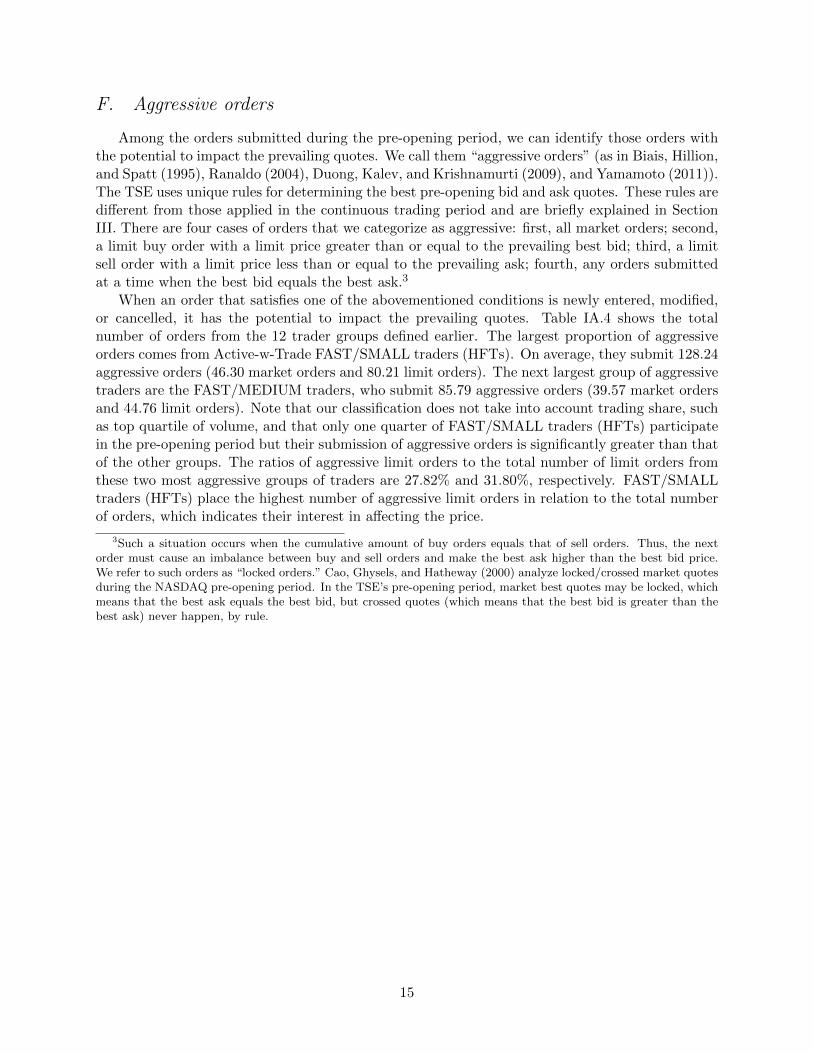
F. Aggressive orders
Among the orders submitted during the pre-opening period, we can identify those orders withthe potential to impact the prevailing quotes. We call them “aggressive orders” (as in Biais, Hillion,and Spatt (1995), Ranaldo (2004), Duong, Kalev, and Krishnamurti (2009), and Yamamoto (2011)).The TSE uses unique rules for determining the best pre-opening bid and ask quotes. These rules aredifferent from those applied in the continuous trading period and are briefly explained in SectionIII. There are four cases of orders that we categorize as aggressive: first, all market orders; second,a limit buy order with a limit price greater than or equal to the prevailing best bid; third, a limitsell order with a limit price less than or equal to the prevailing ask; fourth, any orders submittedat a time when the best bid equals the best ask.3
When an order that satisfies one of the abovementioned conditions is newly entered, modified,or cancelled, it has the potential to impact the prevailing quotes. Table IA.4 shows the totalnumber of orders from the 12 trader groups defined earlier. The largest proportion of aggressiveorders comes from Active-w-Trade FAST/SMALL traders (HFTs). On average, they submit 128.24aggressive orders (46.30 market orders and 80.21 limit orders). The next largest group of aggressivetraders are the FAST/MEDIUM traders, who submit 85.79 aggressive orders (39.57 market ordersand 44.76 limit orders). Note that our classification does not take into account trading share, suchas top quartile of volume, and that only one quarter of FAST/SMALL traders (HFTs) participatein the pre-opening period but their submission of aggressive orders is significantly greater than thatof the other groups. The ratios of aggressive limit orders to the total number of limit orders fromthese two most aggressive groups of traders are 27.82% and 31.80%, respectively. FAST/SMALLtraders (HFTs) place the highest number of aggressive limit orders in relation to the total numberof orders, which indicates their interest in affecting the price.
3Such a situation occurs when the cumulative amount of buy orders equals that of sell orders. Thus, the nextorder must cause an imbalance between buy and sell orders and make the best ask higher than the best bid price.We refer to such orders as “locked orders.” Cao, Ghysels, and Hatheway (2000) analyze locked/crossed market quotesduring the NASDAQ pre-opening period. In the TSE’s pre-opening period, market best quotes may be locked, whichmeans that the best ask equals the best bid, but crossed quotes (which means that the best bid is greater than thebest ask) never happen, by rule.
15

Table IA.4 Aggressive orders during pre-opening period
This table shows summary statistics across stock-days for order aggressiveness for the 12 trader groups,
during the pre-opening period excluding the first 10 minutes, for 97 stocks from the TOPIX100, during the
sample period of April and May 2013. Order flow data, with order IDs as well as virtual server IDs, are
provided by the Tokyo Stock Exchange.
Panel A: Active-w/o-Trade
Speed Inventory Total # ofaggressiveorders
# of marketorders
# of aggressivelimit orders
# of zeroimabalance
orders
Ratio of totalorder
aggressiveness
Ratio of limitorder
aggressiveness
FAST
LARGE 13.20 0.41 12.03 0.76 46.46% 44.16%MEDIUM 17.75 0.90 16.24 0.61 46.46% 44.26%SMALL (HFTs) 28.01 0.51 26.47 1.02 47.92% 46.52%NOTRADE 2.83 0.07 2.50 0.26 35.14% 32.39%
MODERATE
LARGE 5.53 0.65 4.11 0.77 27.76% 22.20%MEDIUM 8.53 0.87 6.58 1.08 25.85% 21.19%SMALL 8.89 0.73 7.22 0.95 28.37% 24.32%NOTRADE 1.41 0.17 1.01 0.23 26.43% 20.43%
SLOW
LARGE 4.61 0.49 3.45 0.67 27.86% 22.42%MEDIUM 2.39 0.22 1.78 0.39 25.89% 20.67%SMALL 2.10 0.16 1.68 0.26 28.35% 24.02%NOTRADE 4.03 0.50 2.99 0.53 27.74% 22.21%
Panel B: Active-w-Trade
Speed Inventory Total # ofaggressiveorders
# of marketorders
# of aggressivelimit orders
# of zeroimabalance
orders
Ratio of totalorder
aggressiveness
Ratio of limitorder
aggressiveness
FASTLARGE 13.51 6.52 6.82 0.17 60.23% 43.33%MEDIUM 85.79 39.57 44.76 1.46 47.20% 31.80%SMALL (HFTs) 128.24 46.30 80.21 1.73 38.13% 27.82%
MODERATELARGE 12.28 6.00 6.04 0.24 51.24% 34.08%MEDIUM 54.43 22.02 30.75 1.66 39.51% 26.96%SMALL 77.02 29.07 45.83 2.12 37.44% 26.26%
SLOWLARGE 14.37 8.24 5.90 0.22 74.99% 55.18%MEDIUM 8.79 4.41 4.08 0.31 57.75% 38.82%SMALL 6.40 3.09 3.10 0.21 58.13% 40.23%
16
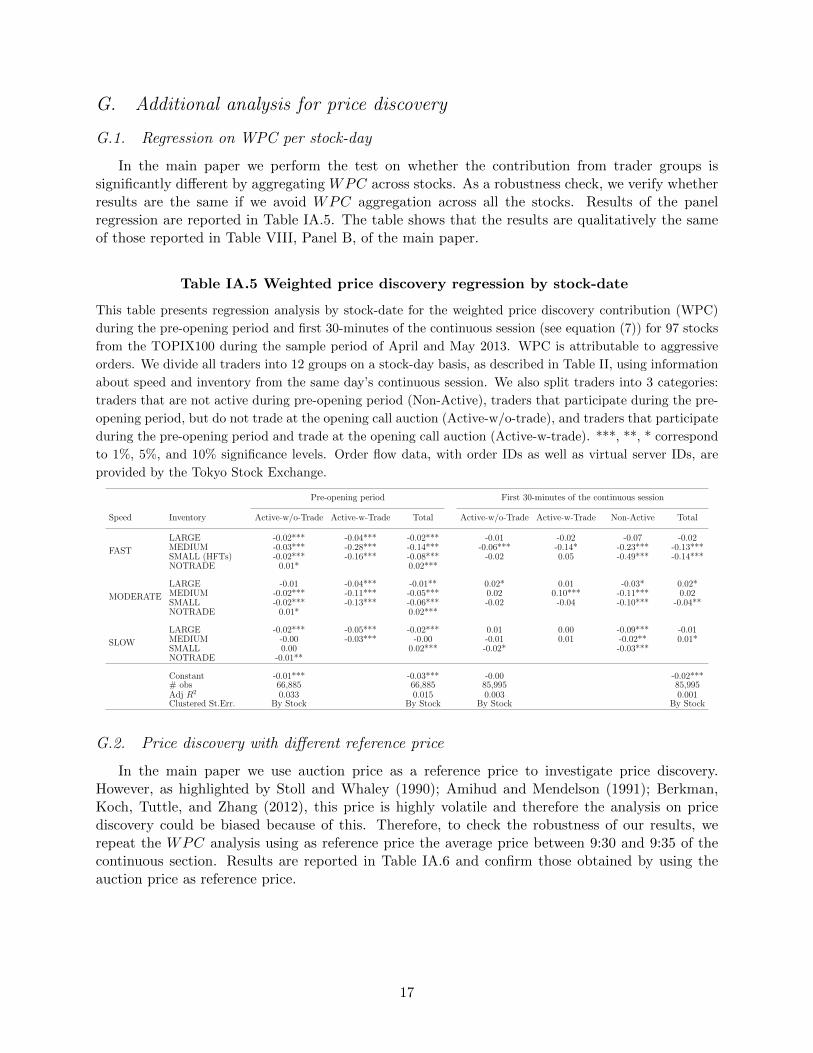
G. Additional analysis for price discovery
G.1. Regression on WPC per stock-day
In the main paper we perform the test on whether the contribution from trader groups issignificantly different by aggregating WPC across stocks. As a robustness check, we verify whetherresults are the same if we avoid WPC aggregation across all the stocks. Results of the panelregression are reported in Table IA.5. The table shows that the results are qualitatively the sameof those reported in Table VIII, Panel B, of the main paper.
Table IA.5 Weighted price discovery regression by stock-date
This table presents regression analysis by stock-date for the weighted price discovery contribution (WPC)
during the pre-opening period and first 30-minutes of the continuous session (see equation (7)) for 97 stocks
from the TOPIX100 during the sample period of April and May 2013. WPC is attributable to aggressive
orders. We divide all traders into 12 groups on a stock-day basis, as described in Table II, using information
about speed and inventory from the same day’s continuous session. We also split traders into 3 categories:
traders that are not active during pre-opening period (Non-Active), traders that participate during the pre-
opening period, but do not trade at the opening call auction (Active-w/o-trade), and traders that participate
during the pre-opening period and trade at the opening call auction (Active-w-trade). ***, **, * correspond
to 1%, 5%, and 10% significance levels. Order flow data, with order IDs as well as virtual server IDs, are
provided by the Tokyo Stock Exchange.
Pre-opening period First 30-minutes of the continuous session
Speed Inventory Active-w/o-Trade Active-w-Trade Total Active-w/o-Trade Active-w-Trade Non-Active Total
FAST
LARGE -0.02*** -0.04*** -0.02*** -0.01 -0.02 -0.07 -0.02MEDIUM -0.03*** -0.28*** -0.14*** -0.06*** -0.14* -0.23*** -0.13***SMALL (HFTs) -0.02*** -0.16*** -0.08*** -0.02 0.05 -0.49*** -0.14***NOTRADE 0.01* 0.02***
MODERATE
LARGE -0.01 -0.04*** -0.01** 0.02* 0.01 -0.03* 0.02*MEDIUM -0.02*** -0.11*** -0.05*** 0.02 0.10*** -0.11*** 0.02SMALL -0.02*** -0.13*** -0.06*** -0.02 -0.04 -0.10*** -0.04**NOTRADE 0.01* 0.02***
SLOW
LARGE -0.02*** -0.05*** -0.02*** 0.01 0.00 -0.09*** -0.01MEDIUM -0.00 -0.03*** -0.00 -0.01 0.01 -0.02** 0.01*SMALL 0.00 0.02*** -0.02* -0.03***NOTRADE -0.01**
Constant -0.01*** -0.03*** -0.00 -0.02***# obs 66,885 66,885 85,995 85,995Adj R2 0.033 0.015 0.003 0.001Clustered St.Err. By Stock By Stock By Stock By Stock
G.2. Price discovery with different reference price
In the main paper we use auction price as a reference price to investigate price discovery.However, as highlighted by Stoll and Whaley (1990); Amihud and Mendelson (1991); Berkman,Koch, Tuttle, and Zhang (2012), this price is highly volatile and therefore the analysis on pricediscovery could be biased because of this. Therefore, to check the robustness of our results, werepeat the WPC analysis using as reference price the average price between 9:30 and 9:35 of thecontinuous section. Results are reported in Table IA.6 and confirm those obtained by using theauction price as reference price.
17
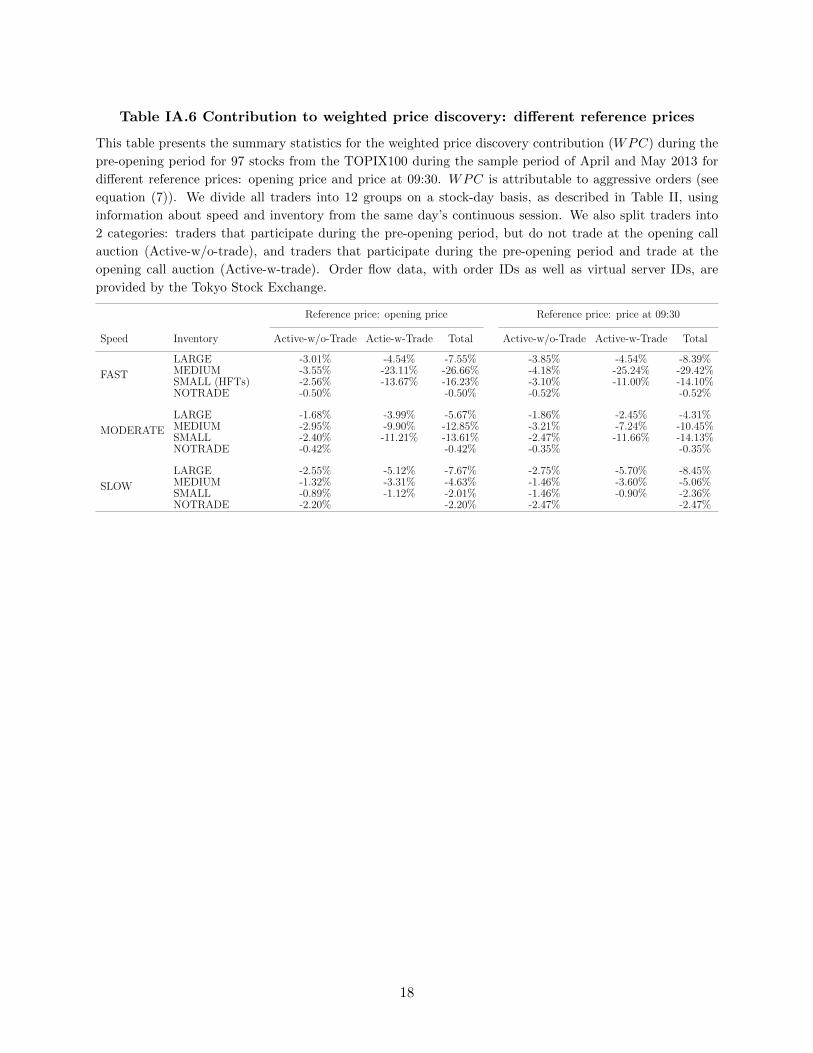
Table IA.6 Contribution to weighted price discovery: different reference prices
This table presents the summary statistics for the weighted price discovery contribution (WPC) during the
pre-opening period for 97 stocks from the TOPIX100 during the sample period of April and May 2013 for
different reference prices: opening price and price at 09:30. WPC is attributable to aggressive orders (see
equation (7)). We divide all traders into 12 groups on a stock-day basis, as described in Table II, using
information about speed and inventory from the same day’s continuous session. We also split traders into
2 categories: traders that participate during the pre-opening period, but do not trade at the opening call
auction (Active-w/o-trade), and traders that participate during the pre-opening period and trade at the
opening call auction (Active-w-trade). Order flow data, with order IDs as well as virtual server IDs, are
provided by the Tokyo Stock Exchange.
Reference price: opening price Reference price: price at 09:30
Speed Inventory Active-w/o-Trade Actie-w-Trade Total Active-w/o-Trade Active-w-Trade Total
FAST
LARGE -3.01% -4.54% -7.55% -3.85% -4.54% -8.39%MEDIUM -3.55% -23.11% -26.66% -4.18% -25.24% -29.42%SMALL (HFTs) -2.56% -13.67% -16.23% -3.10% -11.00% -14.10%NOTRADE -0.50% -0.50% -0.52% -0.52%
MODERATE
LARGE -1.68% -3.99% -5.67% -1.86% -2.45% -4.31%MEDIUM -2.95% -9.90% -12.85% -3.21% -7.24% -10.45%SMALL -2.40% -11.21% -13.61% -2.47% -11.66% -14.13%NOTRADE -0.42% -0.42% -0.35% -0.35%
SLOW
LARGE -2.55% -5.12% -7.67% -2.75% -5.70% -8.45%MEDIUM -1.32% -3.31% -4.63% -1.46% -3.60% -5.06%SMALL -0.89% -1.12% -2.01% -1.46% -0.90% -2.36%NOTRADE -2.20% -2.20% -2.47% -2.47%
18
G.3. Price discovery by order type
Our data allow us to measure PDC by individual order, so that we can aggregate WPC accord-ing to the trader group that submitted the order, and show the proportion of the price contributionmade by a particular trader group and order type (similarly to Barclay and Warner (1993) andChakravarty (2001)). Which types of orders contribute most to price discovery? According toTable IA.7, the types of orders contributing most to the WPC are new limit and market orderssubmitted by Active-w-Trade traders. Cancellations of market orders and price revisions of limitorders also contribute to price discovery. On the other hand, quantity revisions and cancellations oflimit orders increase the deviation of the quoted price from the opening price. Orders from Active-w/o-Trade traders have a marginal effect. Our overall results indicate that quote setting during thepre-opening period is conducted by the Active-w-Trade FAST/SMALL (HFTs), FAST/MEDIUM,MODERATE/SMALL, and MODERATE/MEDIUM groups. Therefore, traders with high speedsand small inventories are indeed the ones that contribute the most to price discovery during thepre-opening period, even though there is no trading in this period, and only a fraction of fasttraders participate.
19
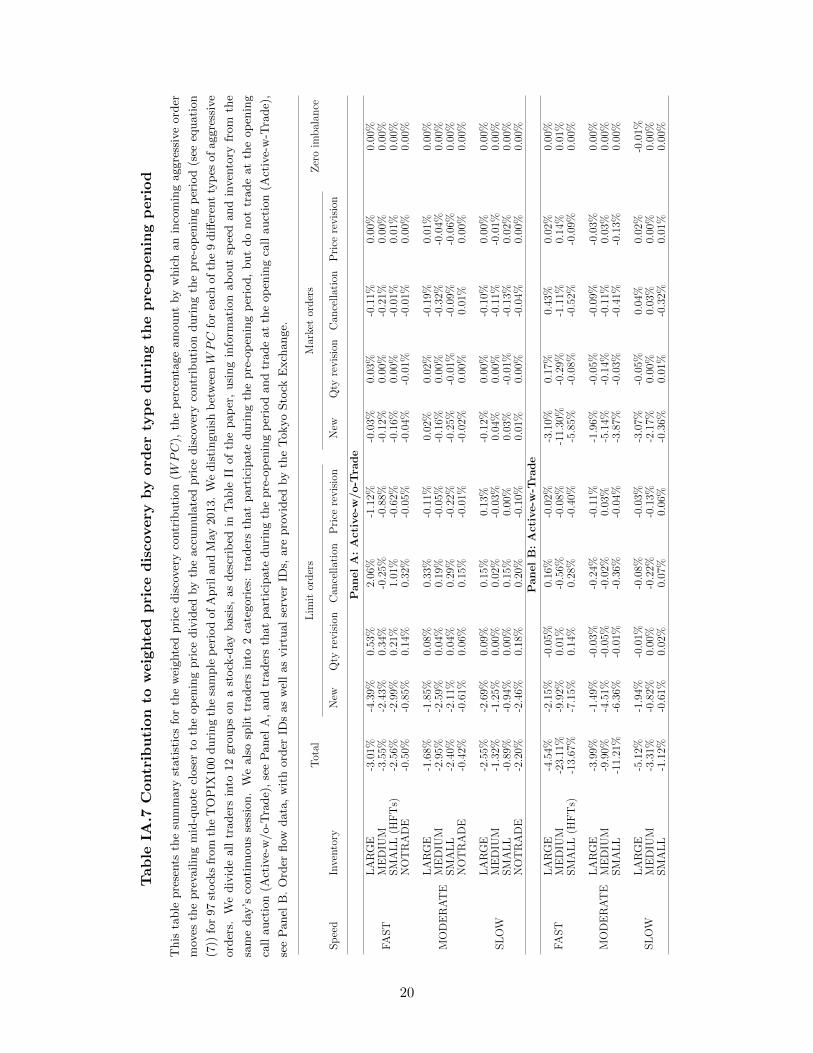
Tab
leIA
.7C
ontr
ibu
tion
tow
eig
hte
dp
rice
dis
covery
by
ord
er
typ
ed
uri
ng
the
pre
-op
en
ing
peri
od
This
table
pre
sents
the
sum
mary
stati
stic
sfo
rth
ew
eighte
dpri
cedis
cover
yco
ntr
ibuti
on
(WPC
),th
ep
erce
nta
ge
am
ount
by
whic
han
inco
min
gaggre
ssiv
eord
er
mov
esth
epre
vailin
gm
id-q
uote
close
rto
the
op
enin
gpri
cediv
ided
by
the
acc
um
ula
ted
pri
cedis
cover
yco
ntr
ibuti
on
duri
ng
the
pre
-op
enin
gp
erio
d(s
eeeq
uati
on
(7))
for
97
stock
sfr
om
the
TO
PIX
100
duri
ng
the
sam
ple
per
iod
of
Apri
land
May
2013.
We
dis
tinguis
hb
etw
eenWPC
for
each
of
the
9diff
eren
tty
pes
of
aggre
ssiv
e
ord
ers.
We
div
ide
all
trader
sin
to12
gro
ups
on
ast
ock
-day
basi
s,as
des
crib
edin
Table
IIof
the
pap
er,
usi
ng
info
rmati
on
ab
out
spee
dand
inven
tory
from
the
sam
eday
’sco
nti
nuous
sess
ion.
We
als
osp
lit
trader
sin
to2
cate
gori
es:
trader
sth
at
part
icip
ate
duri
ng
the
pre
-op
enin
gp
erio
d,
but
do
not
trade
at
the
op
enin
g
call
auct
ion
(Act
ive-
w/o-T
rade)
,se
eP
anel
A,
and
trader
sth
at
part
icip
ate
duri
ng
the
pre
-op
enin
gp
erio
dand
trade
at
the
op
enin
gca
llauct
ion
(Act
ive-
w-T
rade)
,
see
Panel
B.
Ord
erflow
data
,w
ith
ord
erID
sas
wel
las
vir
tual
serv
erID
s,are
pro
vid
edby
the
Tokyo
Sto
ckE
xch
ange.
Total
Lim
itorders
Marketorders
Zeroim
balan
ce
Speed
Inventory
New
Qty
revision
Can
cellation
Price
revision
New
Qty
revision
Can
cellation
Price
revision
PanelA:Active-w
/o-T
rade
FAST
LARGE
-3.01%
-4.39%
0.53%
2.06%
-1.12%
-0.03%
0.03%
-0.11%
0.00%
0.00%
MEDIU
M-3.55%
-2.43%
0.34%
-0.25%
-0.88%
-0.12%
0.00%
-0.21%
0.00%
0.00%
SMALL(H
FTs)
-2.56%
-2.99%
0.21%
1.01%
-0.62%
-0.16%
0.00%
-0.01%
0.01%
0.00%
NOTRADE
-0.50%
-0.85%
0.14%
0.32%
-0.05%
-0.04%
-0.01%
-0.01%
0.00%
0.00%
MODERATE
LARGE
-1.68%
-1.85%
0.08%
0.33%
-0.11%
0.02%
0.02%
-0.19%
0.01%
0.00%
MEDIU
M-2.95%
-2.59%
0.04%
0.19%
-0.05%
-0.16%
0.00%
-0.32%
-0.04%
0.00%
SMALL
-2.40%
-2.11%
0.04%
0.29%
-0.22%
-0.25%
-0.01%
-0.09%
-0.06%
0.00%
NOTRADE
-0.42%
-0.61%
0.06%
0.15%
-0.01%
-0.02%
0.00%
0.01%
0.00%
0.00%
SLOW
LARGE
-2.55%
-2.69%
0.09%
0.15%
0.13%
-0.12%
0.00%
-0.10%
0.00%
0.00%
MEDIU
M-1.32%
-1.25%
0.00%
0.02%
-0.03%
0.04%
0.00%
-0.11%
-0.01%
0.00%
SMALL
-0.89%
-0.94%
0.00%
0.15%
0.00%
0.03%
-0.01%
-0.13%
0.02%
0.00%
NOTRADE
-2.20%
-2.46%
0.18%
0.20%
-0.10%
0.01%
0.00%
-0.04%
0.00%
0.00%
PanelB:Active-w
-Tra
de
FAST
LARGE
-4.54%
-2.15%
-0.05%
0.16%
-0.02%
-3.10%
0.17%
0.43%
0.02%
0.00%
MEDIU
M-23.11%
-9.92%
0.01%
-0.56%
-0.08%
-11.30%
-0.29%
-1.11%
0.14%
0.01%
SMALL(H
FTs)
-13.67%
-7.15%
0.14%
0.28%
-0.40%
-5.85%
-0.08%
-0.52%
-0.09%
0.00%
MODERATE
LARGE
-3.99%
-1.49%
-0.03%
-0.24%
-0.11%
-1.96%
-0.05%
-0.09%
-0.03%
0.00%
MEDIU
M-9.90%
-4.51%
-0.05%
-0.02%
0.03%
-5.14%
-0.14%
-0.11%
0.03%
0.00%
SMALL
-11.21%
-6.36%
-0.01%
-0.36%
-0.04%
-3.87%
-0.03%
-0.41%
-0.13%
0.00%
SLOW
LARGE
-5.12%
-1.94%
-0.01%
-0.08%
-0.03%
-3.07%
-0.05%
0.04%
0.02%
-0.01%
MEDIU
M-3.31%
-0.82%
0.00%
-0.22%
-0.13%
-2.17%
0.00%
0.03%
0.00%
0.00%
SMALL
-1.12%
-0.61%
0.02%
0.07%
0.06%
-0.36%
0.01%
-0.32%
0.01%
0.00%
20
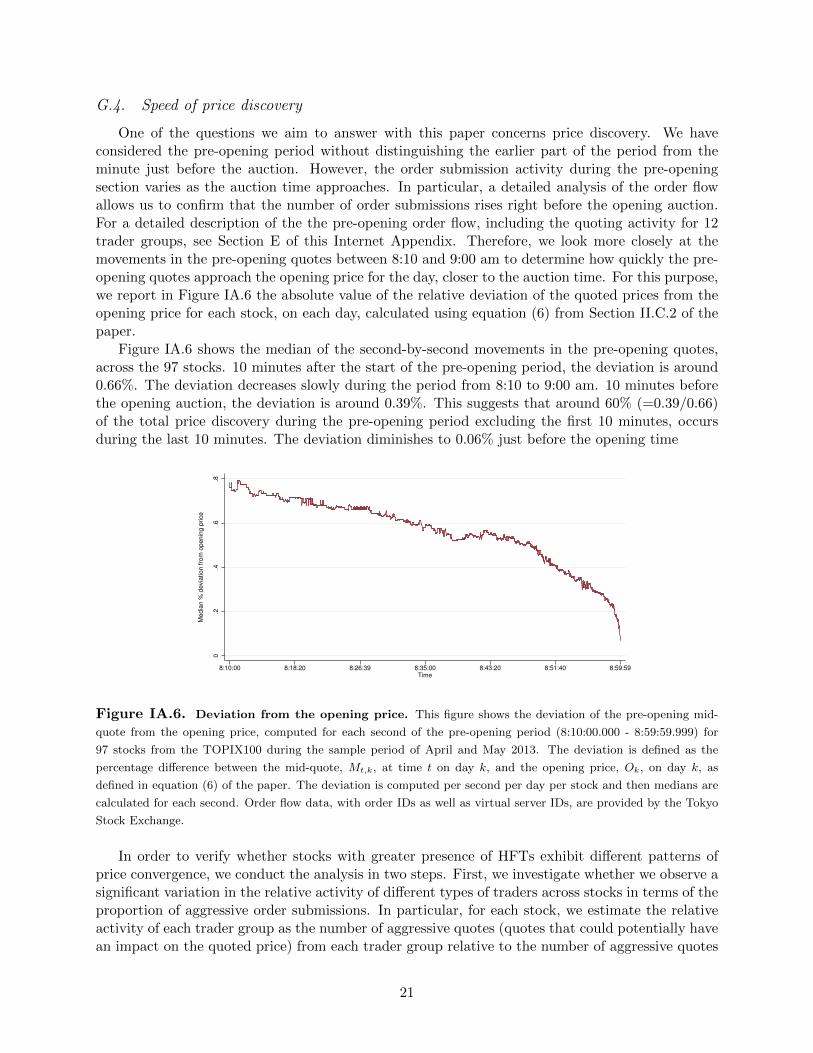
G.4. Speed of price discovery
One of the questions we aim to answer with this paper concerns price discovery. We haveconsidered the pre-opening period without distinguishing the earlier part of the period from theminute just before the auction. However, the order submission activity during the pre-openingsection varies as the auction time approaches. In particular, a detailed analysis of the order flowallows us to confirm that the number of order submissions rises right before the opening auction.For a detailed description of the the pre-opening order flow, including the quoting activity for 12trader groups, see Section E of this Internet Appendix. Therefore, we look more closely at themovements in the pre-opening quotes between 8:10 and 9:00 am to determine how quickly the pre-opening quotes approach the opening price for the day, closer to the auction time. For this purpose,we report in Figure IA.6 the absolute value of the relative deviation of the quoted prices from theopening price for each stock, on each day, calculated using equation (6) from Section II.C.2 of thepaper.
Figure IA.6 shows the median of the second-by-second movements in the pre-opening quotes,across the 97 stocks. 10 minutes after the start of the pre-opening period, the deviation is around0.66%. The deviation decreases slowly during the period from 8:10 to 9:00 am. 10 minutes beforethe opening auction, the deviation is around 0.39%. This suggests that around 60% (=0.39/0.66)of the total price discovery during the pre-opening period excluding the first 10 minutes, occursduring the last 10 minutes. The deviation diminishes to 0.06% just before the opening time
0.2
.4.6
.8
Me
dia
n %
de
via
tio
n f
rom
op
en
ing
price
8:10:00 8:18:20 8:26:39 8:35:00 8:43:20 8:51:40 8:59:59Time
Figure IA.6. Deviation from the opening price. This figure shows the deviation of the pre-opening mid-
quote from the opening price, computed for each second of the pre-opening period (8:10:00.000 - 8:59:59.999) for
97 stocks from the TOPIX100 during the sample period of April and May 2013. The deviation is defined as the
percentage difference between the mid-quote, Mt,k, at time t on day k, and the opening price, Ok, on day k, as
defined in equation (6) of the paper. The deviation is computed per second per day per stock and then medians are
calculated for each second. Order flow data, with order IDs as well as virtual server IDs, are provided by the Tokyo
Stock Exchange.
In order to verify whether stocks with greater presence of HFTs exhibit different patterns ofprice convergence, we conduct the analysis in two steps. First, we investigate whether we observe asignificant variation in the relative activity of different types of traders across stocks in terms of theproportion of aggressive order submissions. In particular, for each stock, we estimate the relativeactivity of each trader group as the number of aggressive quotes (quotes that could potentially havean impact on the quoted price) from each trader group relative to the number of aggressive quotes
21
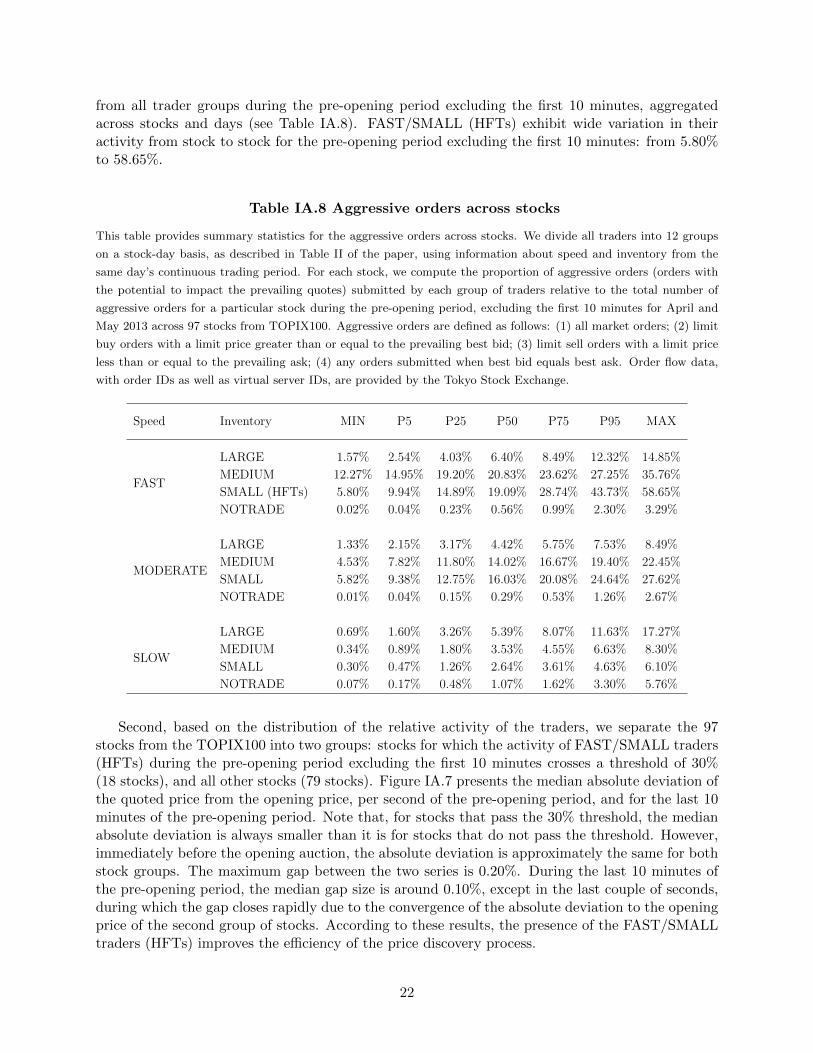
from all trader groups during the pre-opening period excluding the first 10 minutes, aggregatedacross stocks and days (see Table IA.8). FAST/SMALL (HFTs) exhibit wide variation in theiractivity from stock to stock for the pre-opening period excluding the first 10 minutes: from 5.80%to 58.65%.
Table IA.8 Aggressive orders across stocks
This table provides summary statistics for the aggressive orders across stocks. We divide all traders into 12 groups
on a stock-day basis, as described in Table II of the paper, using information about speed and inventory from the
same day’s continuous trading period. For each stock, we compute the proportion of aggressive orders (orders with
the potential to impact the prevailing quotes) submitted by each group of traders relative to the total number of
aggressive orders for a particular stock during the pre-opening period, excluding the first 10 minutes for April and
May 2013 across 97 stocks from TOPIX100. Aggressive orders are defined as follows: (1) all market orders; (2) limit
buy orders with a limit price greater than or equal to the prevailing best bid; (3) limit sell orders with a limit price
less than or equal to the prevailing ask; (4) any orders submitted when best bid equals best ask. Order flow data,
with order IDs as well as virtual server IDs, are provided by the Tokyo Stock Exchange.
Speed Inventory MIN P5 P25 P50 P75 P95 MAX
FAST
LARGE 1.57% 2.54% 4.03% 6.40% 8.49% 12.32% 14.85%
MEDIUM 12.27% 14.95% 19.20% 20.83% 23.62% 27.25% 35.76%
SMALL (HFTs) 5.80% 9.94% 14.89% 19.09% 28.74% 43.73% 58.65%
NOTRADE 0.02% 0.04% 0.23% 0.56% 0.99% 2.30% 3.29%
MODERATE
LARGE 1.33% 2.15% 3.17% 4.42% 5.75% 7.53% 8.49%
MEDIUM 4.53% 7.82% 11.80% 14.02% 16.67% 19.40% 22.45%
SMALL 5.82% 9.38% 12.75% 16.03% 20.08% 24.64% 27.62%
NOTRADE 0.01% 0.04% 0.15% 0.29% 0.53% 1.26% 2.67%
SLOW
LARGE 0.69% 1.60% 3.26% 5.39% 8.07% 11.63% 17.27%
MEDIUM 0.34% 0.89% 1.80% 3.53% 4.55% 6.63% 8.30%
SMALL 0.30% 0.47% 1.26% 2.64% 3.61% 4.63% 6.10%
NOTRADE 0.07% 0.17% 0.48% 1.07% 1.62% 3.30% 5.76%
Second, based on the distribution of the relative activity of the traders, we separate the 97stocks from the TOPIX100 into two groups: stocks for which the activity of FAST/SMALL traders(HFTs) during the pre-opening period excluding the first 10 minutes crosses a threshold of 30%(18 stocks), and all other stocks (79 stocks). Figure IA.7 presents the median absolute deviation ofthe quoted price from the opening price, per second of the pre-opening period, and for the last 10minutes of the pre-opening period. Note that, for stocks that pass the 30% threshold, the medianabsolute deviation is always smaller than it is for stocks that do not pass the threshold. However,immediately before the opening auction, the absolute deviation is approximately the same for bothstock groups. The maximum gap between the two series is 0.20%. During the last 10 minutes ofthe pre-opening period, the median gap size is around 0.10%, except in the last couple of seconds,during which the gap closes rapidly due to the convergence of the absolute deviation to the openingprice of the second group of stocks. According to these results, the presence of the FAST/SMALLtraders (HFTs) improves the efficiency of the price discovery process.
22
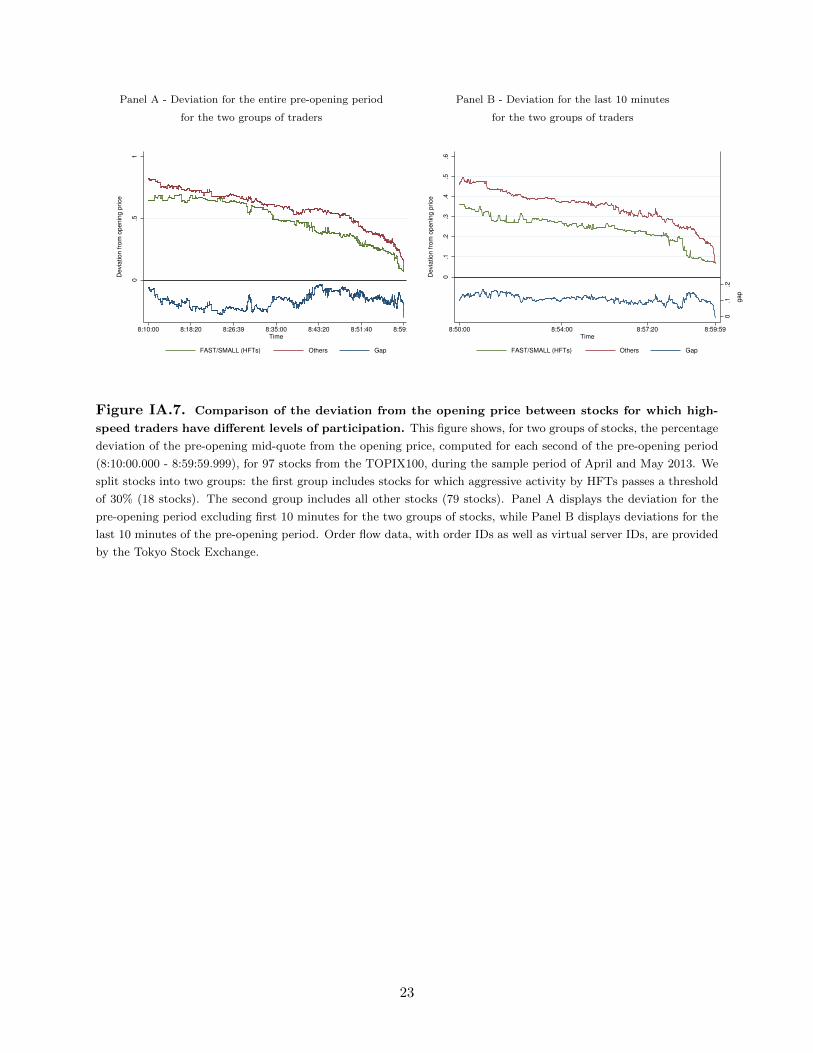
Panel A - Deviation for the entire pre-opening period
for the two groups of traders
0.1
.2
ga
p
0.5
1
De
via
tio
n f
rom
op
en
ing
price
8:10:00 8:18:20 8:26:39 8:35:00 8:43:20 8:51:40 8:59:59Time
FAST/SMALL (HFTs) Others Gap
Panel B - Deviation for the last 10 minutes
for the two groups of traders
0.1
.2
ga
p
0.1
.2.3
.4.5
.6
De
via
tio
n f
rom
op
en
ing
price
8:50:00 8:54:00 8:57:20 8:59:59Time
FAST/SMALL (HFTs) Others Gap
Figure IA.7. Comparison of the deviation from the opening price between stocks for which high-
speed traders have different levels of participation. This figure shows, for two groups of stocks, the percentage
deviation of the pre-opening mid-quote from the opening price, computed for each second of the pre-opening period
(8:10:00.000 - 8:59:59.999), for 97 stocks from the TOPIX100, during the sample period of April and May 2013. We
split stocks into two groups: the first group includes stocks for which aggressive activity by HFTs passes a threshold
of 30% (18 stocks). The second group includes all other stocks (79 stocks). Panel A displays the deviation for the
pre-opening period excluding first 10 minutes for the two groups of stocks, while Panel B displays deviations for the
last 10 minutes of the pre-opening period. Order flow data, with order IDs as well as virtual server IDs, are provided
by the Tokyo Stock Exchange.
23
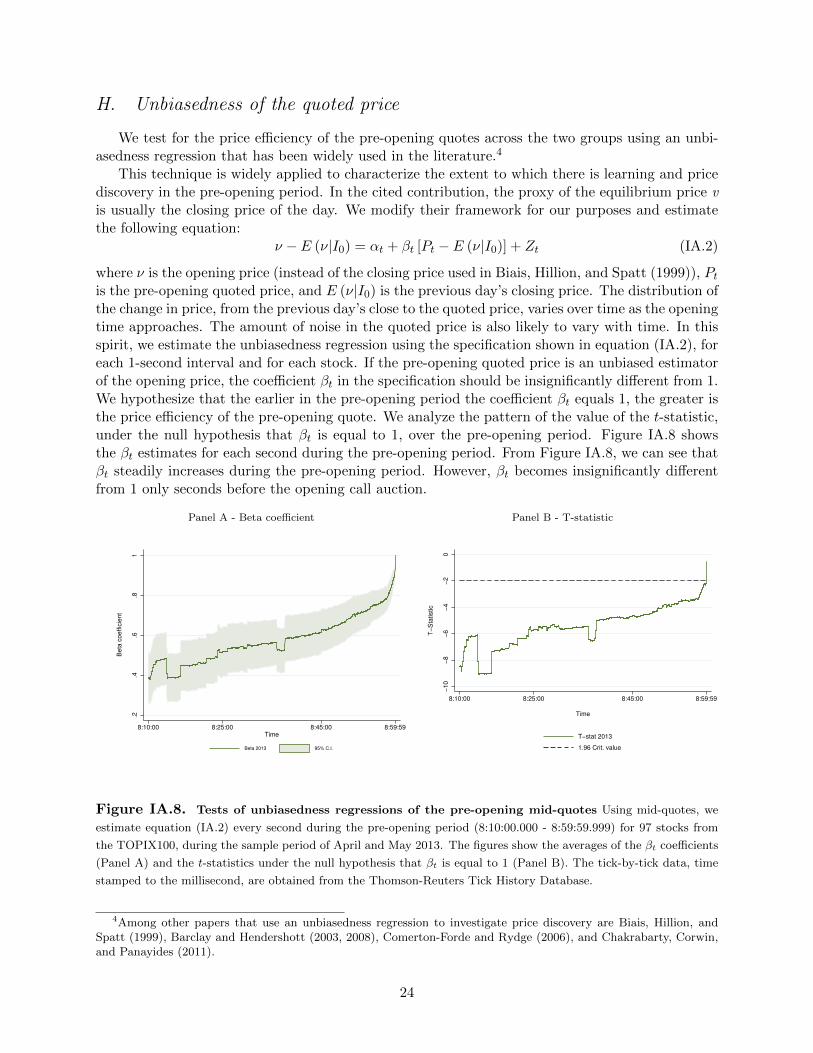
H. Unbiasedness of the quoted price
We test for the price efficiency of the pre-opening quotes across the two groups using an unbi-asedness regression that has been widely used in the literature.4
This technique is widely applied to characterize the extent to which there is learning and pricediscovery in the pre-opening period. In the cited contribution, the proxy of the equilibrium price vis usually the closing price of the day. We modify their framework for our purposes and estimatethe following equation:
ν − E (ν|I0) = αt + βt [Pt − E (ν|I0)] + Zt (IA.2)
where ν is the opening price (instead of the closing price used in Biais, Hillion, and Spatt (1999)), Pt
is the pre-opening quoted price, and E (ν|I0) is the previous day’s closing price. The distribution ofthe change in price, from the previous day’s close to the quoted price, varies over time as the openingtime approaches. The amount of noise in the quoted price is also likely to vary with time. In thisspirit, we estimate the unbiasedness regression using the specification shown in equation (IA.2), foreach 1-second interval and for each stock. If the pre-opening quoted price is an unbiased estimatorof the opening price, the coefficient βt in the specification should be insignificantly different from 1.We hypothesize that the earlier in the pre-opening period the coefficient βt equals 1, the greater isthe price efficiency of the pre-opening quote. We analyze the pattern of the value of the t-statistic,under the null hypothesis that βt is equal to 1, over the pre-opening period. Figure IA.8 showsthe βt estimates for each second during the pre-opening period. From Figure IA.8, we can see thatβt steadily increases during the pre-opening period. However, βt becomes insignificantly differentfrom 1 only seconds before the opening call auction.
Panel A - Beta coefficient
.2.4
.6.8
1
Beta
coeffic
ient
8:10:00 8:25:00 8:45:00 8:59:59
Time
Beta 2013 95% C.I.
Panel B - T-statistic
−10
−8
−6
−4
−2
0
T−
Sta
tistic
8:10:00 8:25:00 8:45:00 8:59:59
Time
T−stat 2013
1.96 Crit. value
Figure IA.8. Tests of unbiasedness regressions of the pre-opening mid-quotes Using mid-quotes, we
estimate equation (IA.2) every second during the pre-opening period (8:10:00.000 - 8:59:59.999) for 97 stocks from
the TOPIX100, during the sample period of April and May 2013. The figures show the averages of the βt coefficients
(Panel A) and the t-statistics under the null hypothesis that βt is equal to 1 (Panel B). The tick-by-tick data, time
stamped to the millisecond, are obtained from the Thomson-Reuters Tick History Database.
4Among other papers that use an unbiasedness regression to investigate price discovery are Biais, Hillion, andSpatt (1999), Barclay and Hendershott (2003, 2008), Comerton-Forde and Rydge (2006), and Chakrabarty, Corwin,and Panayides (2011).
24
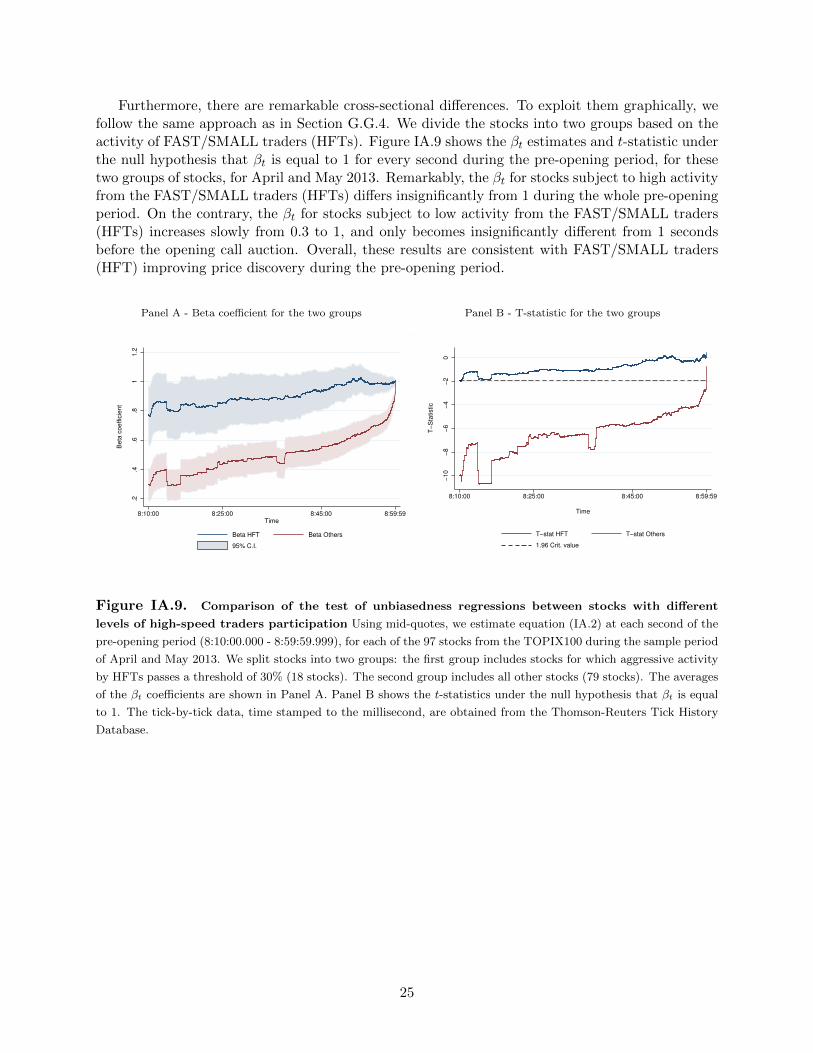
Furthermore, there are remarkable cross-sectional differences. To exploit them graphically, wefollow the same approach as in Section G.G.4. We divide the stocks into two groups based on theactivity of FAST/SMALL traders (HFTs). Figure IA.9 shows the βt estimates and t-statistic underthe null hypothesis that βt is equal to 1 for every second during the pre-opening period, for thesetwo groups of stocks, for April and May 2013. Remarkably, the βt for stocks subject to high activityfrom the FAST/SMALL traders (HFTs) differs insignificantly from 1 during the whole pre-openingperiod. On the contrary, the βt for stocks subject to low activity from the FAST/SMALL traders(HFTs) increases slowly from 0.3 to 1, and only becomes insignificantly different from 1 secondsbefore the opening call auction. Overall, these results are consistent with FAST/SMALL traders(HFT) improving price discovery during the pre-opening period.
Panel A - Beta coefficient for the two groups
.2.4
.6.8
11.2
Beta
coeffic
ient
8:10:00 8:25:00 8:45:00 8:59:59
Time
Beta HFT Beta Others
95% C.I.
Panel B - T-statistic for the two groups
−10
−8
−6
−4
−2
0
T−
Sta
tistic
8:10:00 8:25:00 8:45:00 8:59:59
Time
T−stat HFT T−stat Others
1.96 Crit. value
Figure IA.9. Comparison of the test of unbiasedness regressions between stocks with different
levels of high-speed traders participation Using mid-quotes, we estimate equation (IA.2) at each second of the
pre-opening period (8:10:00.000 - 8:59:59.999), for each of the 97 stocks from the TOPIX100 during the sample period
of April and May 2013. We split stocks into two groups: the first group includes stocks for which aggressive activity
by HFTs passes a threshold of 30% (18 stocks). The second group includes all other stocks (79 stocks). The averages
of the βt coefficients are shown in Panel A. Panel B shows the t-statistics under the null hypothesis that βt is equal
to 1. The tick-by-tick data, time stamped to the millisecond, are obtained from the Thomson-Reuters Tick History
Database.
25
References
Amihud, Yakov, and Haim Mendelson, 1991, Volatility, efficiency, and trading: Evidence from the
Japanese stock market, Journal of Finance 46, 1765–1789.
Barclay, Michael J, and Terrence Hendershott, 2003, Price discovery and trading after hours, Review
of Financial Studies 16, 1041–1073.
Barclay, Michael J, and Terrence Hendershott, 2008, A comparison of trading and non-trading
mechanisms for price discovery, Journal of Empirical Finance 15, 839–849.
Barclay, Michael J, and Jerold B Warner, 1993, Stealth trading and volatility: Which trades move
prices?, Journal of Financial Economics 34, 281–305.
Berkman, Henk, Paul D Koch, Laura Tuttle, and Ying Jenny Zhang, 2012, Paying attention:
overnight returns and the hidden cost of buying at the open, Journal of Financial and Quanti-
tative Analysis 47, 715–741.
Biais, Bruno, Pierre Hillion, and Chester Spatt, 1995, An empirical analysis of the limit order book
and the order flow in the Paris Bourse, Journal of Finance 50, 1655–1689.
Biais, Bruno, Pierre Hillion, and Chester Spatt, 1999, Price discovery and learning during the
preopening period in the Paris Bourse, Journal of Political Economy 107, 1218–1248.
Brogaard, Jonathan, Bjorn Hagstromer, Lars L Norden, and Ryan Riordan, 2015, Trading fast and
slow: Colocation and market quality, Review of Financial Studies 28, 3407–3443.
Cao, Charles, Eric Ghysels, and Frank Hatheway, 2000, Price discovery without trading: Evidence
from the NASDAQ preopening, The Journal of Finance 55, 1339–1365.
Chakrabarty, Bidisha, Shane A Corwin, and Marios A Panayides, 2011, When a halt is not a halt:
An analysis of off-NYSE trading during NYSE market closures, Journal of Financial Intermedi-
ation 20, 361–386.
Chakravarty, Sugato, 2001, Stealth-trading: Which traders’ trades move stock prices?, Journal of
Financial Economics 61, 289–307.
Comerton-Forde, Carole, and James Rydge, 2006, The influence of call auction algorithm rules on
market efficiency, Journal of Financial Markets 9, 199–222.
26
Duong, Huu Nhan, Petko S Kalev, and Chandrasekhar Krishnamurti, 2009, Order aggressiveness
of institutional and individual investors, Pacific-Basin Finance Journal 17, 533–546.
Kirilenko, Andrei A, Albert S Kyle, Mehrdad Samadi, and Tugkan Tuzun, 2016, The Flash crash:
High frequency trading in an electronic market, Journal of Finance, Forthcoming.
Ranaldo, Angelo, 2004, Order aggressiveness in limit order book markets, Journal of Financial
Markets 7, 53–74.
Stoll, Hans R, and Robert E Whaley, 1990, Stock market structure and volatility, Review of Fi-
nancial Studies 3, 37–71.
TSE, 2015, Tokyo Stock Exchange: Guide to TSE trading methodology.
Yamamoto, Ryuichi, 2011, Order aggressiveness, pre-trade transparency, and long memory in an
order-driven market, Journal of Economic Dynamics and Control 35, 1938–1963.
27