Embed Size (px)
Citation preview
C A L I F O R N I A I N S T I T U T E O F T E C H N O L O G Y
D O E C O N T R A C T D E - F C 2 6 - 0 1 B 1 5 3 6 2
D R . W I L L I A M G O D D A R D I I I , P R I N C I P A L
I N V E S T I G A T O R , C A L T E C H
LOWER COST METHODS FOR IMPROVED OIL RECOVERY (IOR) VIA SURFACTANT FLOODING
DOE Project: DE-FC26-01BC15362
PI: William A. Goddard III
Co-PI: Yongchun Tang
Senior Staff: Patrick Shuler, Mario Blanco
Postdoctoral Scholars: Seung Soon Jang, Shiang-Tai Lin, Prabal Maiti,
Yongfu Wu, Stefan Iglauer, Xiaohang Zhang
California Institute of Technology
Final Report September, 2001 – September, 2004
Covering the period from September, 2001 – September, 2003 -- 3 Year Report Compiled by Patrick Shuler and Mario Blanco
Sections written by Mario Blanco, Seung Soon Jang, Shiang-Tai Lin, and Patrick Shuler.
Completed September, 2004
Disclaimer
This report was prepared as an account of work sponsored by an agency of the United States Government. Neither the United States Government nor any agency thereof, nor any of their employees, makes any warranty, express or implied, or assumes any legal liability or responsibility for the accuracy, completeness, or usefulness of any information, apparatus, product, or process disclosed, or represents that its use would not infringe privately owned rights. Reference herein to any specific commercial product, process, or service by trade name, trademark, manufacturer, or otherwise does not necessarily constitute or imply its endorsement, recommendation, or favoring by the United States Government or any agency thereof. The views and opinions of authors expressed herein do not necessarily state or reflect those of the United States Government or any agency thereof.
1
Lower Cost Methods for Improved Oil Recovery via Surfactant Flooding DOE Project: DE-FC26-01BC15362
PI: William A. Goddard III Co-PI: Yongchun Tang
Senior Staff: Patrick Shuler, Mario Blanco.
Post doctoral Scholars: Seung Soon Jang, Shiang-Tai Lin, Prabal Maiti, Stefan Iglauer, Yongfu Wu, Xiaohang Zhang
California Institute of Technology
Final Report for Project September, 2001 – September, 2004
1. ABSTRACT This report provides a summary of the work performed in this 3-year project sponsored by DOE. The overall objective of this project is to identify new, potentially more cost-effective surfactant formulations for improved oil recovery (IOR). The general approach is to use an integrated experimental and computational chemistry effort to improve our understanding of the link between surfactant structure and performance, and from this knowledge, develop improved IOR surfactant formulations. Accomplishments for the project include: 1) completion of a literature review to assemble current and new surfactant IOR ideas, 2) Development of new atomistic-level MD (molecular dynamic) modeling methodologies to calculate IFT (interfacial tension) rigorously from first principles, 3) exploration of less computationally intensive meso-scale methods to estimate IFT, Quantitative Structure Property Relationship (QSPR), and cohesive energy density (CED) calculations, 4) experiments to screen many surfactant structures for desirable low IFT and solid adsorption behavior, and 5) further experimental characterization of the more promising new candidate formulations (based on alkyl polyglycosides (APG) and alkyl propoxy sulfate surfactants). Important findings from this project include: 1) the IFT between two pure substances may be calculated quantitatively from fundamental principles using Molecular Dynamics, the same approach can provide qualitative results for ternary systems containing a surfactant, 2) low concentrations of alkyl polyglycoside surfactants have potential for IOR (Improved Oil Recovery) applications from a technical standpoint (if formulated properly with a cosurfactant, they can create a low IFT at low concentration) and also are viable economically as they are available commercially, and 3) the alkylpropoxy sulfate surfactants have promising IFT performance also, plus these surfactants can have high optimal salinity and so may be attractive for use in higher salinity reservoirs. Alkylpropoxy sulfate surfactants are not yet available as large volume commercial products. The results presented herein can provide the needed industrial impetus for extending application (alkyl polyglycoside) or scaling up (alkylpropoxy sulfates) of these two promising surfactants for enhanced oil recovery. Furthermore, the advanced simulations tools presented here can be used to continue to uncover new types of surfactants with promising properties such as inherent low IFT and biodegradability.
2
TABLE OF CONTENTS Page 1. Abstract 2 2. Table of Contents 3 3. List of Graphical Materials and Tables 5 4. Executive Summary 14 5. Introduction 16 5.1 Project Description 16 5.2 Literature review highlights 18 6. Experimental and Numerical Methods 20 6.1 Computational Chemistry Methods 20 6.2 Experimental Procedures 27 7. Results and Discussion 31 7.1 Theoretical Calculations 31
7.1.1 Summary of key findings from theoretical study 31 7.1.2 MD Model Validation and Calculation Sensitivity Analysis 32 7.13 MD Model Calculations of IFT for Alkyl Benzene Sulfonate Surfactants 36 7.14 Salinity Effects Investigated in Molecular Dynamic (MD) Simulations 40
7.15 Molecular Modeling Study of Two Model Alkyl Polyglycosides (APG) -- Water/n-Octanol Cosurfactant with n-Octane 46
7.16 Molecular Modeling Study of Two Model Alkyl Polyglycosides (APG) -- Small Isomeric Difference in Structure Creates Large Change in Behavior 59
7.17 Study of IFT of alkyl propoxylated sulfate surfactants via MD simulations 61 7.1.8 QSPR (Quantitative Structure Property Relationship) 74
7.1.9 Mesoscale Model -- Dependence of Interfacial Tension on Surface Architecture 74 7.1.10 Cohesive Energy Density in the Water-Surfactant-Oil System -- Molecular Origin of IFT 78
7.1.11 Hildebrand and Hansen Parameters – Insights from Solubility Parameters 82
7.2 Experimental Investigation 84 7.2.1 Initial Screening of Surfactants for Low IFT 84 7.2.2 Initial Screening of Surfactants for Solid Adsorption 89 7.2.3 More Detailed Study for Calamide CW-100 92 7.2.4 Alkyl Polyglycoside (APG) Surfactants -- Background 96
3
7.2.5 Alkyl Polyglycosides (APG) Formulated with n-Alcohols as Cosurfactant 97 7.2.6 Alkly Polyglycosides (APG) Formulated with Aromatic Alcohols as Cosurfactants 108 7.2.7 Alkly Polyglycosides (APG) Formulated with Sorbitan-Type and Other Surfactants 115 7.2.8 Alkyl Polyglycosides (APG) Formulations—Effect of Oil Phase Composition 120 7.2.9. Pure APG Formulations – Study of Structure Effects 122 7.2.10 Alkyl Propoxy Sulfate Surfactants 131 7.3 Project Implications/Ideas for Improved Surfactant Formulations 145 8. Conclusions 145 9. References 147 10. List of Acronyms and Abbreviations 150 Appendices 152 A -- Further Surfactant Adsorption Experimental Results 153 Attachments
1. Published papers and presentations 2. Literature review report (previously provided as supplement to second annual
report)
4
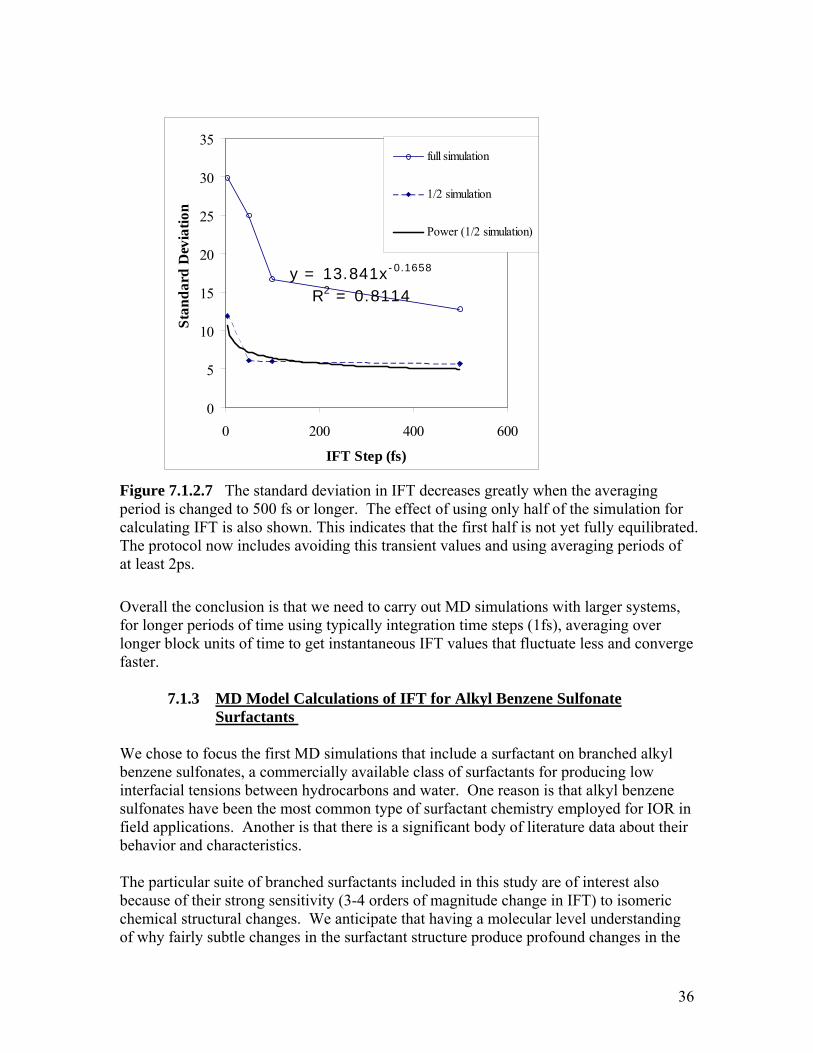
3. LIST OF GRAPHICAL MATERIAL AND TABLES LIST OF FIGURES Figure 5.1.1. The residual oil trapped in a porous medium after water flooding may be reduced if the ratio of viscous to capillary forces (Nc) becomes large enough. Typical curves are shown for a low- and high- permeability sandstone. Figure 5.1.2. Schematic of the surfactant flooding process applied to a field. Figure 6.1.2.1 Example MD result showing distribution of atoms between a liquid and gas phase. The surface tension may be calculated by applying the Kirkwood-Buff formula. Figure 6.1.3.1. Different model surfactants used in predicting their interfacial surface tension. Figure 7.1.2.1 Molecular description of a liquid/gas system. Individual molecules of argon at 57 ºK are shown as purple dots. (a) Initial and (b) Final configuration of gas/liquid described via a Lennard Jones Fluid Model. Calculated surface tension computed from the difference in normal and tangential stress at interface via the Kirkwood-Buff formula (Equation 4). Figure 7.1.2.2. This shows the variability in calculated IFT values from atomistic constant pressure (NPT) simulations versus the size of the simulated cell. As the size (indicated by the n x n Miller indices of the cell base, e.g., 1x1, 2x1, 2x2, 3x3) increases the IFT values fluctuate less and become mostly positive. Figure 7.1.2.3 The figure shows the time averaged IFT for the same surfactant system as a function of time. Value appears to converge after 30 ps. Figure 7.1.2.4 The integration time step, typically 1.0 fs, has a measurable but small effect on the calculated IFT values over short dynamics (5 ps). For longer dynamics (not shown), 1.0 fs time steps are adequate to estimate IFT. Figure 7.1.2.5 The figure shows no difference in increasing the number of slabs from 100 to 800 in the integration of Kirkwood-Buff IFT formula. Most runs use 100 to 200. Figure 7.1.2.6 IFT values are averaged over a period of time before being printed out for further analysis. Figure 7.1.2.7 The standard deviation in IFT decreases greatly when the averaging period is changed to 500 fs or longer. The effect of using only half of the simulation for calculating IFT is also shown.
5
Figure 7.1.3.1. Branched alkyl benzene sulfonates. (m=1,2,3,4,5,6,7). Figure 7.1.3.2. Density profile and stress profile for C16_4 (isomeric substitution of benzosulfonate on 4th position of a C16 carbon chain). Figure 7.1.3.3. Interfacial tension profile for C16_4. The integrated profile leads to a interfacial tension of γ=11.03 dynes/cm. Figure 7.1.3.4. Change of interfacial tension as a function of attachment position of benzosulfonate group as calculated by MD simulations. Figure 7.1.3.5. Comparable experimental results of interfacial tension as a function of attachment position of benzosulfonate group (Doe and Wade, 1977). (IFT measured at 25 C, iso-pentanol 2 wt%, 3 g/l NaCl, 0.7 g/l surfactant). Figure 7.1.3.6. Full set of experimental data reported for interfacial tension for water/n-alkane for isomers of C16-benzosulfonates. Note that the No. 4 isomer gives the lowest IFT for n-decane as the oil phase. Figure 7.1.4.1. Running average of IFT between liquid/vacuum interface for pure water and 6.3% NaCl solution. Figure 7.1.4.2. Density profile for pure water. Figure 7.1.4.3. Calculated IFT versus salinity for number 4 isomer of C16 linear alkyl benzene sulfonates Figure 7.1.4.4. Stress profiles associated with calculations containing salt
Figure 7.1.4.5. Interfacial tension profile for molecular dynamic cases that include salt. Figure 7.1.4.6. Fluid density profiles for molecular dynamic calculations containing salt
Figure 7.1.5.1. Schematic molecular structure of a typical APG surfactant.
Figure 7.1.5.2 Schematic Chemical Structure of HBDM Figure 7.1.5.3. (a) Absolute Stereochemistry of the Decyl version of HBDM surfactant. (b) Molecular model of head group displaying the full stereochemistry for HNDM. Each color line is one atom. Figure 7.1.5.4. ESP Charges for head group of HBDM Each colored line is one atom.
Figure 7.1.5.5. Binding energy distributions for 100,000 pairs of surfactant/cosurfactant. Surfactant is HBDM in the trans conformation, cosurfactant is n-octanol.
6
Figure 7.1.5.6. Four most binding conformations for pairs of surfactant/cosurfactant. HBDM is in the gauche conformation; cosurfactant is n-octanol. Each ball is one atom. Figure 7.1.5.7. Four most binding conformations for pairs of surfactant/cosurfactant. Surfactant is HBDM in the trans conformation. cosurfactant is n-octanol. Each ball is one atom. Figure 7.1.5.8. a) Octane/Octanol/HBDM/water interface model. Left side is n-octane, Middle is interfacial region, Right size is bulk aqueous phase. b) Top view of the n-octanol layer. Shows only n-octanol molecules to simplify the picture. Figure 7.1.5.9. Octane/water interfacial structure of HBDM after 500 ps of NPT molecular dynamics at 300K. Both, all-trans and S-shaped molecular conformations were observed. Figure 7.1.5.10. Top and bottom views of Octane/water interfacial structure of HBDM/n-octanol. Figure 7.1.5.11. (a) Octane/water interfacial structure of OBDM after 3250 picoseconds of NVT molecular dynamics (only OBDM surfactant structure shown). Formulation contains n-octanol:OBDM in a 30:1 molar ratio. (b). Octane/water interfacial structure of HBDM after 500 ps of NPT molecular dynamics. Figure 7.1.5.12. Initial structure of a single OBDM molecule shown on the left. On the right is shown the unit cell used in MD simulations of n-octanol:OBDM calculations. Figure 7.1.5.13. (a) Parallel and transverse components of the pressure tensor in OBDM 3.25 ns simulation at room temperature. (b) Calculated instantaneous (blue) and cumulative (pink) IFT values (left scale is IFT in dyne/cm). Figure 7.1.6.1. Molecular structure of two subject glucosides Figure 7.1.6.2. Changes in molecular structure of n-Octyl-D-Glucoside. Figure 7.1.7.1. Structure of a alkyl propoxylated sulfate surfactant used in MD simulations. Figure 7.1.7.2. A typical structure of the alkyl propoxy sulfate systems. Aqueous surfactant layer between two oil layers. Figure 7.1.7.3. Final structure for each alkyl propoxylated sulfate system. Aqueous surfactant layer between two oil layers. Figure 7.1.7.4. Density profile for each system. The slab ID is scaled z coordinate. The aqueous phase is in the middle, between oil phases sitting on both ends.
7
Figure 7.1.7.5. Stress profiles and tension profiles for each system. Figure 7.1.7.6. Comparison of IFT between surfactant molecules with different number of propylene oxide group. Figure 7.1.7.7. Final structure for each system as a function of temperature. Aqueous surfactant layer between two oil layers. Figure 7.17.8. Density profile for each system studied here. The slab ID is a scaled z coordinate. The middle phase is water and both sides correspond to oil. The parts shown as peaks in these profiles come from the surfactant. Figure 7.1.7.9. Stress profiles and tension profiles for each temperature, 280,300, and 350 K, from top to bottom. Figure 7.1.7.10. Change in IFT as a function of temperature. Figure 7.1.7.11. Typical structure for oil/surfactant/water system. Alkyl propoxy sulfate surfactant solution and n-decane. Figure 7.1.7.12. Change in IFT as a function of concentration. Figure 7.1.9.1. Snapshots of initial and final configuration for liquid-vapor interface. Figure 7.1.9.2. Density profile for the vapor-liquid interface. Figure 7.1.9.3 Stress profile (both tangential and normal components) for the vapor-liquid interface. Figure 7.1.9.4. Variations of IFT as a function of hydrocarbon tail length for a single chain surfactant. Figure 7.1.9.5. Correlation function between the polar head group and oil beads for different positions of this polar head group. Figure 7.1.9.6. Variation of IFT as a function of position of the polar group along the surfactant backbone. The solid line is a guide to eye only. Figure 7.1.9.7. Density profile for different positions of the polar group. Figure 7.1.9.8. Snapshots of final configurations for various positions of the polar group (1,2,4, and 6 positions). Figure 7.1.10.1a. Spatial distribution of atomic strain energy in the z-direction for water-decane mixture.
8
Figure 7.1.10.1b. Molecular model of the water-decane mixture. Figure 7.1.10.2a. Spatial distribution of atomic strain energy in the z-direction for water-surfactant(C16_8)-decane mixture. Figure 7.1.10.2b. Molecular model of the water-surfactant (C16_8)-decane mixture. Figure 7.1.10.3a. Spatial distribution of atomic strain energy in the z-direction for water-surfactant(C16_4)-decane mixture. Figure 7.1.103b. Molecular model of the water-surfactant (C16_4)-decane mixture. Figure 7.1.11.1. Calculated Hansen parameters for water, PG 2062, n-octane, and several alcohols. Figure 7.2.1.1. Comparison of IFT for octyl and dodecyl sulfate surfactants Figure 7.2.1.2. Octyl sulfate surfactant IFT versus salinity for different n-alkane hydrocarbons as the oil phase. Figure 7.2.1.3. Structure of Aerosol series of surfactants Figure 7.2.1.4. IFT for a series of esters of sulfosuccinic acid versus n-octane. Figure 7.2.1.5. Structure of Zonyl flourosurfactnts and Neodol surfactant
Figure 7.2.1.6. Structure of commercial gemini surfactants evaluated Figure 7.2.1.7. Measured IFT for different commercial gemini surfactants versus salinity. The oil phase is n-octane in all cases. Figure 7.2.2.1. Measured retention of SDBS onto kaolinite clay Figure 7.2.2.2. Details of structure for Pluronic series of nonionic surfactants Figure 7.2.2.3. Increase in mass adsorption of Pluoronic products with an increase in the PO/EO ratio. Figure 7.2.24. Structure details for the Igepal series of surfactants studied. Figure 7.2.2.5. Solid adsorption of a series of Igepal surfactants onto kaolinite clay. Figure 7.2.3.1. Adsorption isotherm for Calamide CW-100 onto kaolinite clay at 25 C.
9
Figure 7.2.3.2. Tertiary oil recovery for CW-100 and TR-70 in Berea sandstone coreflood experiments. Figure 7.2.4.1. Molecular structure of a typical alkyl polyglycoside (APG) Figure 7.2.5.1a. IFT measured for equilibrated samples containing PG 2062 and smaller n-alcohols versus n-octane as the hydrocarbon phase. Figure 7.2.5.1b. IFT measured for equilibrated samples containing PG 2062 and larger n-alcohols versus n-octane as the hydrocarbon phase. Figure 7.2.5.2. Increasing the alkyl chain length of the commerical APG surfactants decreases the IFT when blended with a 1-alcohol cosurfactant. Figure 7.2.5.3. Experimental data of the minimum IFT measured for selected APG/alcohol formulations. Figure 7.2.5.4. Molecular structure of mannose surfactant tested that has a C16 alkyl chain hydrophobic tail Figure 7.2.5.5. Measured IFT results for n-hexadecyl-beta-D-mannose (HBDM) surfactant with a series of different alcohol cosurfactants Figure 7.2.5.6. Data illustrating IFT is nearly independent of temperature for a mixture of APG surfactant/alcohol versus n-octane. Figure 7.2.5.7. Data illustrating IFT is nearly independent of the salinity for an APG surfactant/alcohol formulation versus n-octane. Figure 7.2.5.8. Adsorption of APG products increases with an increase in their average alkyl chain length. Figure 7.2.5.9 Berea Coreflood oil recovery test result – PG 2062/n-octanol formulation Figure 7.2.5.10. IFT data versus mole fraction of n-octanol in a butanol/octanol/dodecanol cosurfactant blend. Figure 7.2.6.1. Comparison of IFT behavior for different alcohol cosurfactants, all containing 6 carbons. Figure 7.2.6.2. Measured IFT with different aromatic alcohols as APG cosurfactants Figure 7.2.6.3. 1-naphthol as a cosurfactant with APG surfactants may create a low IFT condition at a low chemical concentration.
10
Figure 7.2.6.4. Tertiary oil recovery for Berea coreflood test using a formulation containing PG 2062 and 1-butanol/1-naphthol. Figure 7.2.6.5. Effect of functional group in cosurfactant on the IFT when formulated with PG 2062 and measured versus n-octane. Figure 7.2.6.6. IFT measurements for formulations containing PG 2062 and diethylene mono glycol butyl ether as cosurfactant Figure 7.2.7.1. Example of a SPAN surfactant Figure 7.2.7.2. Example of a TWEEN surfactant
Figure 7.2.7.3. IFT measured for different mixtures of PG 2067 APG and some SPAN surfactants. Figure 7.2.7.4. Greater oil recovery occurs in a sand pack experiment when injecting a PG 2067 / SPAN 20 chemical solution versus a waterflood. Figure 7.2.8.1. Effect of oil phase composition on the IFT with PG 2062/n-butanol formulations at room temperature. Figure 7.2.8.2. Effect of oil phase composition on the IFT with PG 2062/n-octanol formulations at room temperature. Figure 7.2.9.1. Five different pure APG structures included in IFT experimental study with n-octanol as cosurfactant Figure 7.2.9.2. Structures of surfactants containing an aromatic function Figure 7.2.9.3. Structure of alpha- and beta- forms of a surfactant Figures 7.2.10.1 – 7.2.10.9. IFT for 9 different Alfoterra Figure 7.2.10.10. IFT results for 0.2 wt% Alfoterra 13, 15, and 18 versus salinity Figure 7.2.10.11. IFT results for 0.2 wt% Alfoterra 63, 65, and 68 versus salinity Figure 7.2.10.12. IFT measured for blends of alkyl propoxy sulfates and APG commercial surfactants Figure 7.2.10.13. Tertiary oil recovery results from injection of a Alfoterra 38 chemical formulation. Figure 7.2.10.14. Tertiary oil recovery results from injection of a Alfoterra 23 chemical formulation.
11
LIST OF TABLES Table 7.1.4.1. Comparison of the change of water/vacuum IFT at different salt (NaCl) concentrations. Table 7.1.5.1. Properties of n-Decyl β-D-maltoside Table 7.1.7.1. Density and dimensions of whole system for alkyl propoxylated sulfates Table 7.1.7.2. The cell parameters and the densities
Table 7.1.11.1. Calculated Values of Hansen Parameters for Components in Figure 7.1.11.1 Table 7.2.1.1 Representative list of surfactants in the initial IFT screening evaluation
Table 7.2.1.2. Measured IFT results with flourosurfactants Table 7.2.3.1 Measured IFT Between CW-100 Surfactant Formulation and n-Octane
Table 7.2.5.1. Replicate Measurements at a Low IFT Condition Table 7.2.5.2. Effect of Salinity and Temperature on IFT for a Near Optimum Formulation Table 7.2.5.3. IFT Values at 25 ºC for a Series of APG/n-Alcohols in Fresh Water
Table 7.2.5.4. Selected adsorption results for APG/cosurfactant formulations Table 7.2.5.5. IFT changes versus blends of cosurfactant n-alcohols with PG 2062 surfactant. Table 7.2.6.1 IFT values for PG 2062/1-naphthol formulations versus n-octane, with the initial values of 1-naphthol of about 600 ppm in the aqueous phase. Table 7.2.6.2. IFT for PG 2062/ethanol/1-naphthol formulations versus n-octane. Table 7.2.6.3. IFT for PG 2062/alcohol/1-naphthol formulations versus n-octane. Table 7.2.7.1. Chemical structure information for SPAN and TWEEN surfactants. Table 7.2.7.2. Measured IFT for APG / SPAN surfactant mixtures in a 2% NaCl brine versus n-octane as the hydrocarbon phase.
12
Table 7.2.7.3. Measured IFT for APG / TWEEN surfactant mixtures in a 2% NaCl brine versus n-octane as the hydrocarbon phase at room temperature. Table 7.2.7.4. Selected adsorption results for APG/cosurfactant formulations Table 7.2.9.1. IFT results for various pure APG surfactants in fresh water with n-octanol as a cosurfactant Table 7.2.9.2. IFT results for various pure APG surfactants with an aromatic function Table 7.2.9.3a. IFT Results for Mixtures of Maltoside and Sorbitan Surfactants; Equilibrated Samples Table 7.2.9.3b. IFT Results for Mixtures of Maltoside and Sorbitan Surfactants Non-equilibrated Samples Table 7.2.9.4 IFT results for n-Octyl-apha-D- and n-Octyl-beta-Glucoside surfactants Table 7.2.10.1. Effect of number of average PO groups and temperature Table 7.2.10.2. IFT measurements at 0.2 wt% for selected Alfoterra products Table 7.2.10.3. IFT measurements at 0.1 wt% for selected Alfoterra products Table 7.2.10.4. Effect of Alfoterra concentration on IFT for selected formulations Table 7.2.10.5. Alfoterra surfactant IFT versus two crude oils with 0.3 wt% NaCl Table 7.2.10.6. Alfoterra 28 surfactant IFT versus GOM crude oil and n-octane Table 7.2.10.7. Adsorption of Alfoterra surfactants onto kaolinite clay Table 7.2.10.8. Rank order of Alfoterra surfactants by solid adsorption onto kaolinite.
13
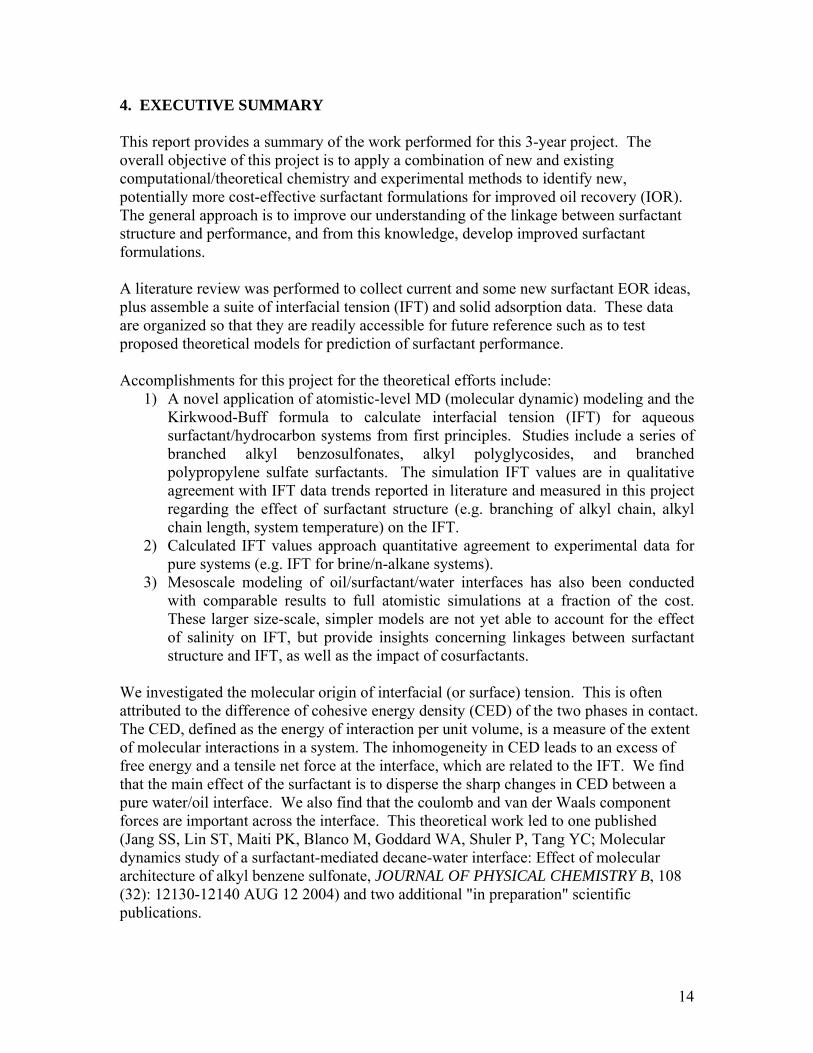
4. EXECUTIVE SUMMARY This report provides a summary of the work performed for this 3-year project. The overall objective of this project is to apply a combination of new and existing computational/theoretical chemistry and experimental methods to identify new, potentially more cost-effective surfactant formulations for improved oil recovery (IOR). The general approach is to improve our understanding of the linkage between surfactant structure and performance, and from this knowledge, develop improved surfactant formulations. A literature review was performed to collect current and some new surfactant EOR ideas, plus assemble a suite of interfacial tension (IFT) and solid adsorption data. These data are organized so that they are readily accessible for future reference such as to test proposed theoretical models for prediction of surfactant performance. Accomplishments for this project for the theoretical efforts include:
1) A novel application of atomistic-level MD (molecular dynamic) modeling and the Kirkwood-Buff formula to calculate interfacial tension (IFT) for aqueous surfactant/hydrocarbon systems from first principles. Studies include a series of branched alkyl benzosulfonates, alkyl polyglycosides, and branched polypropylene sulfate surfactants. The simulation IFT values are in qualitative agreement with IFT data trends reported in literature and measured in this project regarding the effect of surfactant structure (e.g. branching of alkyl chain, alkyl chain length, system temperature) on the IFT.
2) Calculated IFT values approach quantitative agreement to experimental data for pure systems (e.g. IFT for brine/n-alkane systems).
3) Mesoscale modeling of oil/surfactant/water interfaces has also been conducted with comparable results to full atomistic simulations at a fraction of the cost. These larger size-scale, simpler models are not yet able to account for the effect of salinity on IFT, but provide insights concerning linkages between surfactant structure and IFT, as well as the impact of cosurfactants.
We investigated the molecular origin of interfacial (or surface) tension. This is often attributed to the difference of cohesive energy density (CED) of the two phases in contact. The CED, defined as the energy of interaction per unit volume, is a measure of the extent of molecular interactions in a system. The inhomogeneity in CED leads to an excess of free energy and a tensile net force at the interface, which are related to the IFT. We find that the main effect of the surfactant is to disperse the sharp changes in CED between a pure water/oil interface. We also find that the coulomb and van der Waals component forces are important across the interface. This theoretical work led to one published (Jang SS, Lin ST, Maiti PK, Blanco M, Goddard WA, Shuler P, Tang YC; Molecular dynamics study of a surfactant-mediated decane-water interface: Effect of molecular architecture of alkyl benzene sulfonate, JOURNAL OF PHYSICAL CHEMISTRY B, 108 (32): 12130-12140 AUG 12 2004) and two additional "in preparation" scientific publications.
14
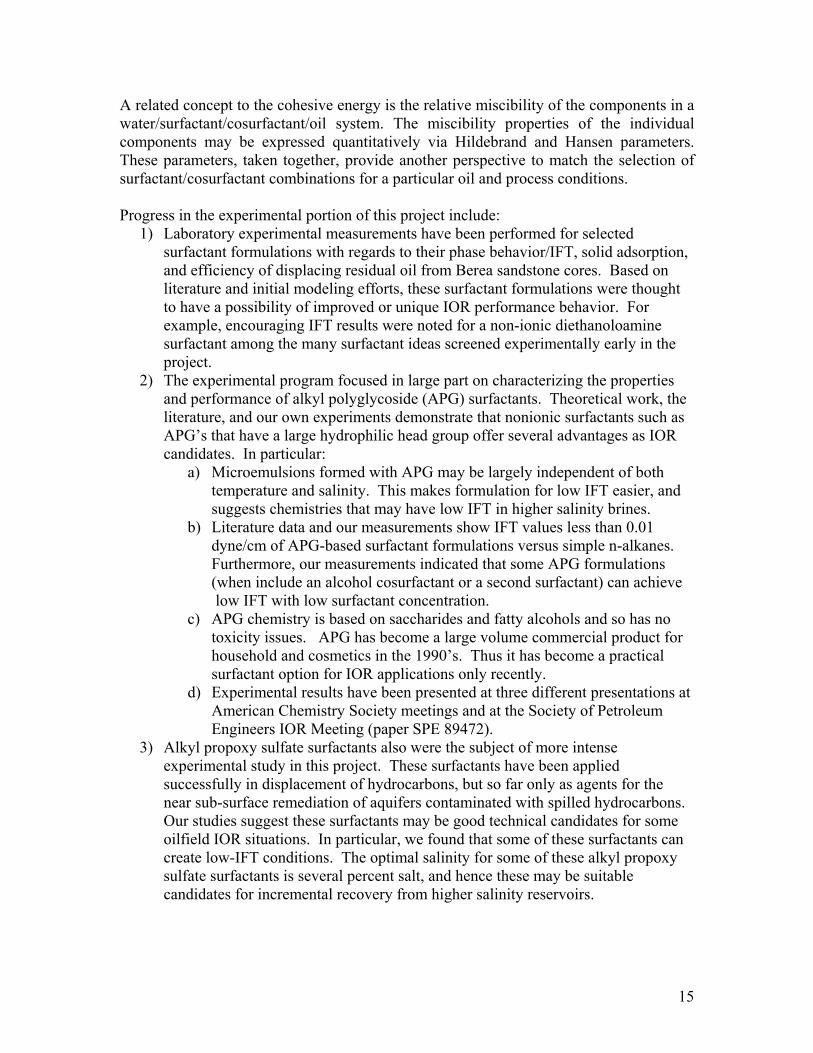
A related concept to the cohesive energy is the relative miscibility of the components in a water/surfactant/cosurfactant/oil system. The miscibility properties of the individual components may be expressed quantitatively via Hildebrand and Hansen parameters. These parameters, taken together, provide another perspective to match the selection of surfactant/cosurfactant combinations for a particular oil and process conditions. Progress in the experimental portion of this project include:
1) Laboratory experimental measurements have been performed for selected surfactant formulations with regards to their phase behavior/IFT, solid adsorption, and efficiency of displacing residual oil from Berea sandstone cores. Based on literature and initial modeling efforts, these surfactant formulations were thought to have a possibility of improved or unique IOR performance behavior. For example, encouraging IFT results were noted for a non-ionic diethanoloamine surfactant among the many surfactant ideas screened experimentally early in the project.
2) The experimental program focused in large part on characterizing the properties and performance of alkyl polyglycoside (APG) surfactants. Theoretical work, the literature, and our own experiments demonstrate that nonionic surfactants such as APG’s that have a large hydrophilic head group offer several advantages as IOR candidates. In particular:
a) Microemulsions formed with APG may be largely independent of both temperature and salinity. This makes formulation for low IFT easier, and suggests chemistries that may have low IFT in higher salinity brines.
b) Literature data and our measurements show IFT values less than 0.01 dyne/cm of APG-based surfactant formulations versus simple n-alkanes.
Furthermore, our measurements indicated that some APG formulations (when include an alcohol cosurfactant or a second surfactant) can achieve low IFT with low surfactant concentration. c) APG chemistry is based on saccharides and fatty alcohols and so has no
toxicity issues. APG has become a large volume commercial product for household and cosmetics in the 1990’s. Thus it has become a practical surfactant option for IOR applications only recently.
d) Experimental results have been presented at three different presentations at American Chemistry Society meetings and at the Society of Petroleum Engineers IOR Meeting (paper SPE 89472).
3) Alkyl propoxy sulfate surfactants also were the subject of more intense experimental study in this project. These surfactants have been applied successfully in displacement of hydrocarbons, but so far only as agents for the near sub-surface remediation of aquifers contaminated with spilled hydrocarbons. Our studies suggest these surfactants may be good technical candidates for some oilfield IOR situations. In particular, we found that some of these surfactants can
create low-IFT conditions. The optimal salinity for some of these alkyl propoxy sulfate surfactants is several percent salt, and hence these may be suitable candidates for incremental recovery from higher salinity reservoirs.
15
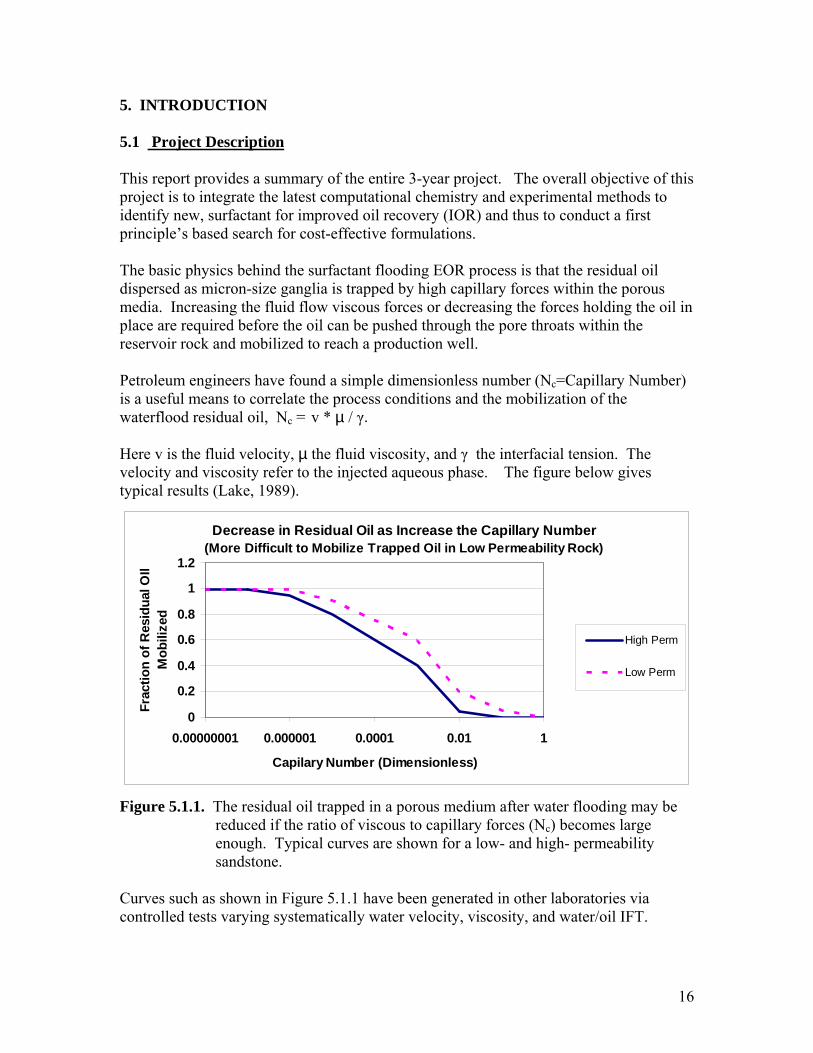
5. INTRODUCTION 5.1 Project Description This report provides a summary of the entire 3-year project. The overall objective of this project is to integrate the latest computational chemistry and experimental methods to identify new, surfactant for improved oil recovery (IOR) and thus to conduct a first principle’s based search for cost-effective formulations. The basic physics behind the surfactant flooding EOR process is that the residual oil dispersed as micron-size ganglia is trapped by high capillary forces within the porous media. Increasing the fluid flow viscous forces or decreasing the forces holding the oil in place are required before the oil can be pushed through the pore throats within the reservoir rock and mobilized to reach a production well. Petroleum engineers have found a simple dimensionless number (Nc=Capillary Number) is a useful means to correlate the process conditions and the mobilization of the waterflood residual oil, Nc = v * µ / γ. Here v is the fluid velocity, µ the fluid viscosity, and γ the interfacial tension. The velocity and viscosity refer to the injected aqueous phase. The figure below gives typical results (Lake, 1989).
Decrease in Residual Oil as Increase the Capillary Number(More Difficult to Mobilize Trapped Oil in Low Permeability Rock)
0
0.2
0.4
0.6
0.8
1
1.2
0.00000001 0.000001 0.0001 0.01 1
Capilary Number (Dimensionless)
Frac
tion
of R
esid
ual O
Il M
obili
zed
High Perm
Low Perm
Figure 5.1.1. The residual oil trapped in a porous medium after water flooding may be reduced if the ratio of viscous to capillary forces (Nc) becomes large enough. Typical curves are shown for a low- and high- permeability sandstone. Curves such as shown in Figure 5.1.1 have been generated in other laboratories via controlled tests varying systematically water velocity, viscosity, and water/oil IFT.
16
• The Nc is only around 10-7 for a typical water flood. • The Nc must be increased by a few orders-of-magnitude to mobilize significant
trapped oil. It is not practical to do this via increasing water injection rate. • It is even more difficult to mobilize the oil if the reservoir rock is low
permeability and thus the pores are smaller size (increases capillary trapping of the residual oil).
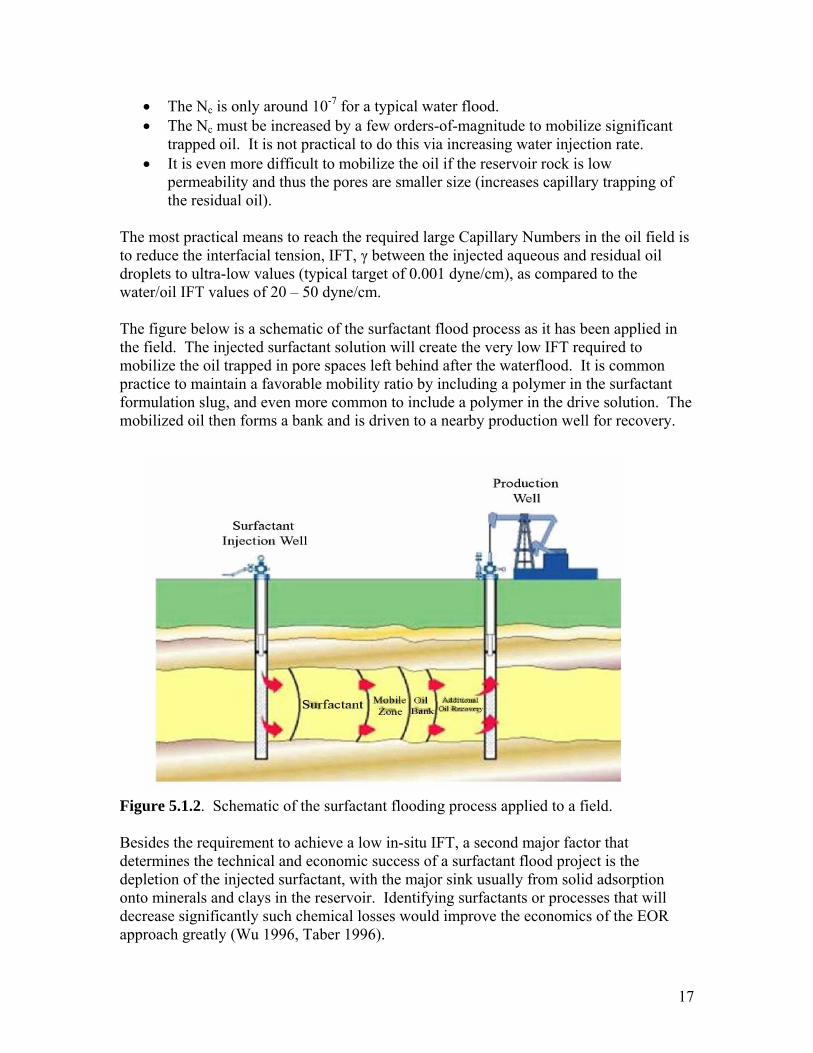
The most practical means to reach the required large Capillary Numbers in the oil field is to reduce the interfacial tension, IFT, γ between the injected aqueous and residual oil droplets to ultra-low values (typical target of 0.001 dyne/cm), as compared to the water/oil IFT values of 20 – 50 dyne/cm. The figure below is a schematic of the surfactant flood process as it has been applied in the field. The injected surfactant solution will create the very low IFT required to mobilize the oil trapped in pore spaces left behind after the waterflood. It is common practice to maintain a favorable mobility ratio by including a polymer in the surfactant formulation slug, and even more common to include a polymer in the drive solution. The mobilized oil then forms a bank and is driven to a nearby production well for recovery. Figure 5.1.2. Schematic of the surfactant flooding process applied to a field. Besides the requirement to achieve a low in-situ IFT, a second major factor that determines the technical and economic success of a surfactant flood project is the depletion of the injected surfactant, with the major sink usually from solid adsorption onto minerals and clays in the reservoir. Identifying surfactants or processes that will decrease significantly such chemical losses would improve the economics of the EOR approach greatly (Wu 1996, Taber 1996).
17
Laboratory studies and surfactant flood field tests have demonstrated this improved oil recovery (IOR) method can mobilize and produce significant post-waterflood residual oil Green and Willhite, 1998). There are several major economic hurdles to widespread commercial deployment of this technology to the oil field, however. Perhaps the largest impediment is the relatively high chemical cost for this process. In addition, field tests of surfactant flooding have identified several technical barriers. These include problems such as less than anticipated reduction in the interfacial tension (IFT) and high retention of the surfactant in the reservoir (Lake, 1989, Wu 1996, Taber 1996). Our general study approach is to improve our understanding of the linkage between surfactant structure and performance, and from this, develop improved surfactant formulations. Literature and laboratory data provide test cases to tune the theoretical models and help develop correlations between the surfactant structure and their IFT and adsorption behavior. Additional experiments then have been performed to quantify the potential improvement in performance of surfactant structures suggested by this computational chemistry effort. Desirable characteristics of alternate chemical formulations include those: 1) able to create ultra-low IFT over a substantial range of low and moderate concentrations, 2) suffering minimal loss in the reservoir due to mineral and clay adsorption, 3) with inherently lower unit chemical cost, and 4) exhibiting desirable IFT and adsorption behavior for more technically challenging conditions such as higher salinity reservoirs. This integrated theoretical and experimental study in particular emphasizes Point 1), that is, identifying chemical systems that may attain low IFT versus hydrocarbons, while keeping in mind the other 3 objectives. The experimental work also addresses the other desirable chemical performance characteristics. This report primarily is divided between a presentation of the theoretical and experimental work. Within each part we include a discussion of how the two parallel efforts are integrated together, plus at the end there is a general discussion of results and conclusions that ties everything together. 5.2 Literature review highlights
A literature review (Task 1 of the project) was included as a supplement to the second Annual report and appears as a supplement also in this final project report. One purpose of the literature review is to identify data sets that can provide good test cases for the theoretical effort to develop prediction methods for surfactant IFT and surfactant adsorption. In particular, we have organized data for a series of alkylbenzene sulfonates for purposes of initial model development. In addition, the survey of the literature indicated a number of classes of surfactants as potential candidates for EOR besides alkyl benzene sulfonates, such as alpha-olefin
18
sulfonates, diphenyl ether sulfonate, alkyl propoxy ethoxy sulfates and sulfonates, alkyl ethoxylated carboxylates, betain and sulfo-betaines, and alkyl polyglycosides and other carbohydrate/bio-based surfactants. Published papers reviewed show the evolution of the surfactant flooding EOR technology over the last 30 years, with the literature review summarizing more recent innovations such as: combining caustic with surfactant, development of surfactants for mobilizing organic compounds, but for purposes of remediation of contaminated aquifers, carbohydrate /bio-based surfactants, and particular anionic/cationic surfactant blends. Three types of surfactants in particular have emerged from the literature search as being newer, intriguing ideas for EOR applications. First, sulfonated alkyl aromatics have been reported as being suitable for EOR just recently, and in fact these have seen use in some small field projects (Berger, 2002). These are different structures in that the sulfonate group is attached to the alkyl chain as opposed to the benzene ring. In contrast to the usual alkyl benzene sulfonates, alkyl groups are coupled to a sulfonated aromatic ring. One advantage claimed for this newer type of surfactant is that it is easier to manufacture because it can be synthesized as a one step process. Alkyl propoxylated sulfates are an interesting surfactant idea as they have become popular for remediation of spilled hydrocarbons (so-called NAPL, nonaqueous phase liquids) from aquifers in recent years, but this chemistry has not been exploited recently for oil field EOR. Workers have developed surfactant formulations to mobilize NAPL’s that can achieve low IFT, require minimal addition of co-surfactant, and suffer only low losses due to solid adsorption (Jayanti, 2001). These NAPL’ s studied for these remediation projects may be quite different in character than typical crude oils, but the alkyl propxylated sulfates likely can be adapted for EOR purposes in many oil reservoirs. Alkyl polyglucosides (APG, and possibly other carbohydrate/sugar based surfactants) are a third, intriguing surfactant type that has come from the literature search so far. Published reports suggest these surfactants can be formulated to have some unusual characteristics such as having the ability to formulate a middle-phase, low IFT condition that is not sensitive to changes in salt or temperature (Forster, 1996). One patent from 1991 (U.S. 4,985,154) claims the application of APG surfactants for EOR, but there does not seem to have been follow-up studies in the published literature in this area. We show that these compounds offer the ability to generate ultra-low IFT at very low concentrations once a feasible cosurfactant is properly identified Other ideas that are even more speculative include the newer versions of the so-called “dimeric” or “gemini” surfactants. These molecules have two identical tail structures connected at the head group by a spacer group. Some of the potential advantages of these gemini surfactants indicated by the literature are 1) lower surface tension, 2), lower cmc, so that the minimum surface tension occurs at a lower concentration, and 3) better solubilizing, wetting, foaming properties. The gemini version of surfactants may have a tendency for less adsorption as compared to the monomeric version of the same surfactant molecule. Finally, some dimeric surfactants show remarkable rheological
19
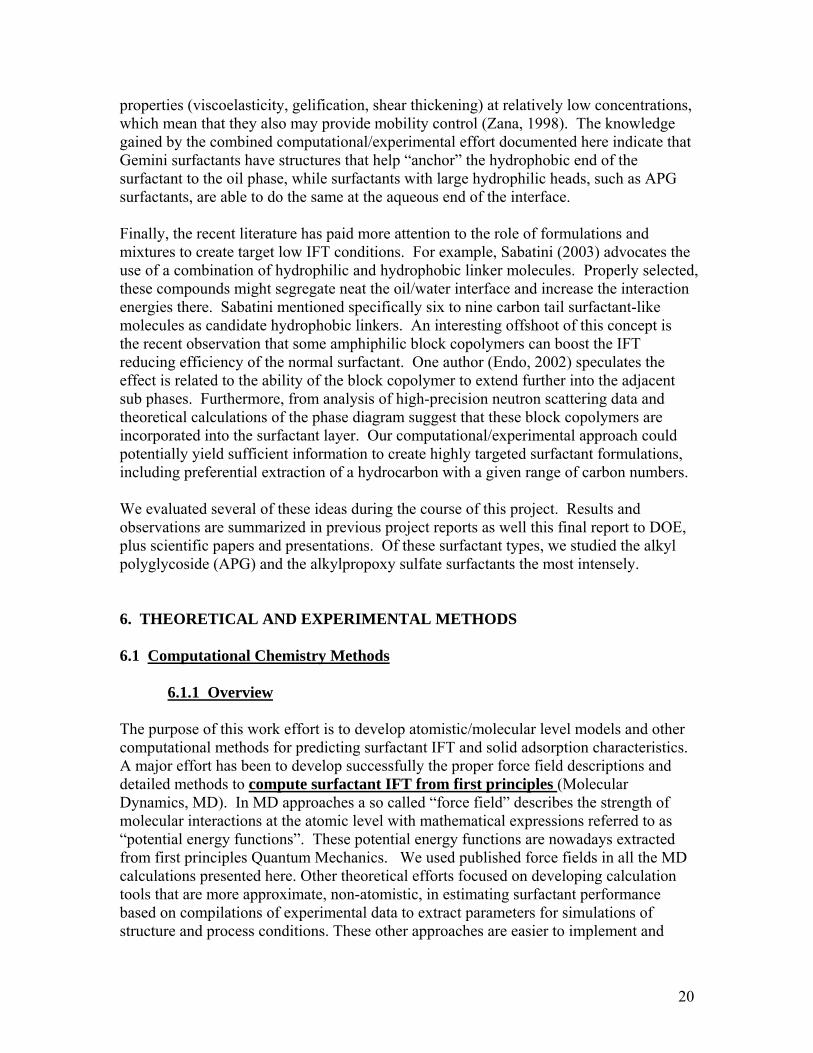
properties (viscoelasticity, gelification, shear thickening) at relatively low concentrations, which mean that they also may provide mobility control (Zana, 1998). The knowledge gained by the combined computational/experimental effort documented here indicate that Gemini surfactants have structures that help “anchor” the hydrophobic end of the surfactant to the oil phase, while surfactants with large hydrophilic heads, such as APG surfactants, are able to do the same at the aqueous end of the interface. Finally, the recent literature has paid more attention to the role of formulations and mixtures to create target low IFT conditions. For example, Sabatini (2003) advocates the use of a combination of hydrophilic and hydrophobic linker molecules. Properly selected, these compounds might segregate neat the oil/water interface and increase the interaction energies there. Sabatini mentioned specifically six to nine carbon tail surfactant-like molecules as candidate hydrophobic linkers. An interesting offshoot of this concept is the recent observation that some amphiphilic block copolymers can boost the IFT reducing efficiency of the normal surfactant. One author (Endo, 2002) speculates the effect is related to the ability of the block copolymer to extend further into the adjacent sub phases. Furthermore, from analysis of high-precision neutron scattering data and theoretical calculations of the phase diagram suggest that these block copolymers are incorporated into the surfactant layer. Our computational/experimental approach could potentially yield sufficient information to create highly targeted surfactant formulations, including preferential extraction of a hydrocarbon with a given range of carbon numbers. We evaluated several of these ideas during the course of this project. Results and observations are summarized in previous project reports as well this final report to DOE, plus scientific papers and presentations. Of these surfactant types, we studied the alkyl polyglycoside (APG) and the alkylpropoxy sulfate surfactants the most intensely. 6. THEORETICAL AND EXPERIMENTAL METHODS 6.1 Computational Chemistry Methods
6.1.1 Overview The purpose of this work effort is to develop atomistic/molecular level models and other computational methods for predicting surfactant IFT and solid adsorption characteristics. A major effort has been to develop successfully the proper force field descriptions and detailed methods to compute surfactant IFT from first principles (Molecular Dynamics, MD). In MD approaches a so called “force field” describes the strength of molecular interactions at the atomic level with mathematical expressions referred to as “potential energy functions”. These potential energy functions are nowadays extracted from first principles Quantum Mechanics. We used published force fields in all the MD calculations presented here. Other theoretical efforts focused on developing calculation tools that are more approximate, non-atomistic, in estimating surfactant performance based on compilations of experimental data to extract parameters for simulations of structure and process conditions. These other approaches are easier to implement and
20
require less intensive calculations. We also explore here with qualitative success some of these so called “meso-scale” or Quantitative Structure Property Relationship (QSPR) approaches. We now examine the first principle MD approach referred to above. 6.1.2 Molecular Dynamics Approach -- Calculation of IFT We have implemented a computational module to estimate Interfacial Tension (IFT) from first principles Molecular Dynamics (MD). The density profile is given by (1)
sVzn
z)(
) zLyxs( =ρ LV ∆= The normal and transverse pressures are given by
[ ]∫ −= )()(2/1 zPzPdz TNγ
(2)
ij
ij
j rrVP ((
)(∑i ij
ij
sBN
rduzTkzz
)(1)),
2
−= ρ
(3)
ij
ij
ji ij
ijij
sBT rV
P (( ∑−= ρrdu
ryx
Tkzz)(
21))
),(
22 +
where kB is the Bolztman’s constant and T is the absolute temperature. The differential terms in Equations (2) and (3) represent the change in interaction energies, u, with the inter particle distances, rij. The IFT is computed from the Kirkwood-Buff formula
. (4) Where the normal, PN, and transverse stresses, PT, are given by the stress tensor components. The interface plane is perpendicular to z and it has a particle density ρ(z), temperature T, and volume Vs. It has been customary to neglect the long range interactions in the estimation of IFT because of the difficulties in portioning these into local contributions to the stress tensor. We take into account long range electrostatics (Ewald sums) with a new formulation of the virial contribution by each atom.
21
xy
z
xy
z
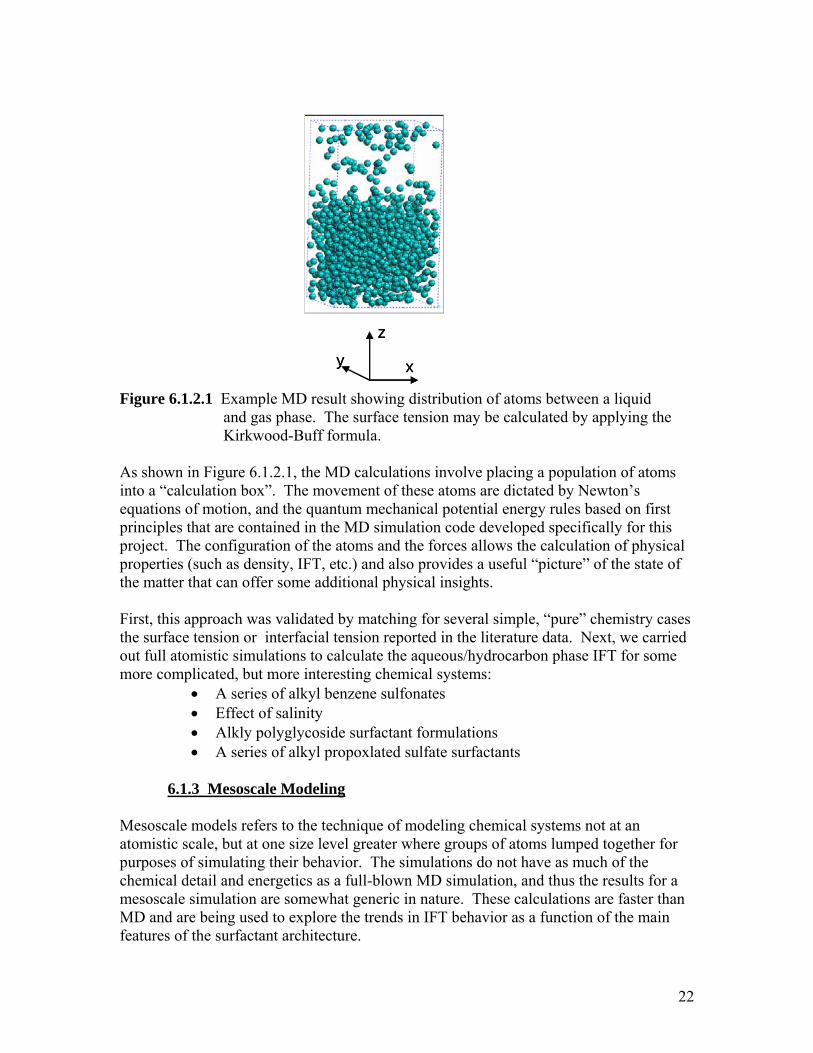
Figure 6.1.2.1 Example MD result showing distribution of atoms between a liquid and gas phase. The surface tension may be calculated by applying the Kirkwood-Buff formula. As shown in Figure 6.1.2.1, the MD calculations involve placing a population of atoms into a “calculation box”. The movement of these atoms are dictated by Newton’s equations of motion, and the quantum mechanical potential energy rules based on first principles that are contained in the MD simulation code developed specifically for this project. The configuration of the atoms and the forces allows the calculation of physical properties (such as density, IFT, etc.) and also provides a useful “picture” of the state of the matter that can offer some additional physical insights. First, this approach was validated by matching for several simple, “pure” chemistry cases the surface tension or interfacial tension reported in the literature data. Next, we carried out full atomistic simulations to calculate the aqueous/hydrocarbon phase IFT for some more complicated, but more interesting chemical systems:
• A series of alkyl benzene sulfonates • Effect of salinity • Alkly polyglycoside surfactant formulations • A series of alkyl propoxlated sulfate surfactants
6.1.3 Mesoscale Modeling Mesoscale models refers to the technique of modeling chemical systems not at an atomistic scale, but at one size level greater where groups of atoms lumped together for purposes of simulating their behavior. The simulations do not have as much of the chemical detail and energetics as a full-blown MD simulation, and thus the results for a mesoscale simulation are somewhat generic in nature. These calculations are faster than MD and are being used to explore the trends in IFT behavior as a function of the main features of the surfactant architecture.
22
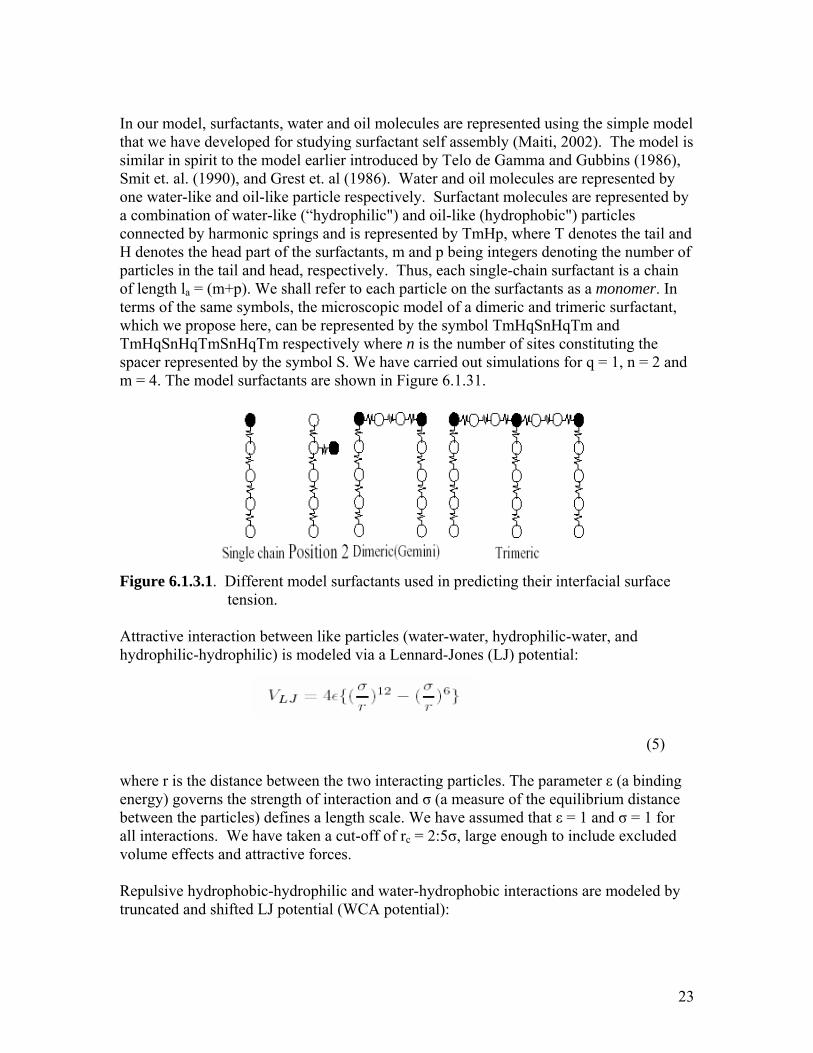
In our model, surfactants, water and oil molecules are represented using the simple model that we have developed for studying surfactant self assembly (Maiti, 2002). The model is similar in spirit to the model earlier introduced by Telo de Gamma and Gubbins (1986), Smit et. al. (1990), and Grest et. al (1986). Water and oil molecules are represented by one water-like and oil-like particle respectively. Surfactant molecules are represented by a combination of water-like (“hydrophilic") and oil-like (hydrophobic") particles connected by harmonic springs and is represented by TmHp, where T denotes the tail and H denotes the head part of the surfactants, m and p being integers denoting the number of particles in the tail and head, respectively. Thus, each single-chain surfactant is a chain of length la = (m+p). We shall refer to each particle on the surfactants as a monomer. In terms of the same symbols, the microscopic model of a dimeric and trimeric surfactant, which we propose here, can be represented by the symbol TmHqSnHqTm and TmHqSnHqTmSnHqTm respectively where n is the number of sites constituting the spacer represented by the symbol S. We have carried out simulations for q = 1, n = 2 and m = 4. The model surfactants are shown in Figure 6.1.31.
Figure 6.1.3.1. Different model surfactants used in predicting their interfacial surface tension. Attractive interaction between like particles (water-water, hydrophilic-water, and hydrophilic-hydrophilic) is modeled via a Lennard-Jones (LJ) potential:
(5) where r is the distance between the two interacting particles. The parameter ε (a binding energy) governs the strength of interaction and σ (a measure of the equilibrium distance between the particles) defines a length scale. We have assumed that ε = 1 and σ = 1 for all interactions. We have taken a cut-off of rc = 2:5σ, large enough to include excluded volume effects and attractive forces. Repulsive hydrophobic-hydrophilic and water-hydrophobic interactions are modeled by truncated and shifted LJ potential (WCA potential):
23
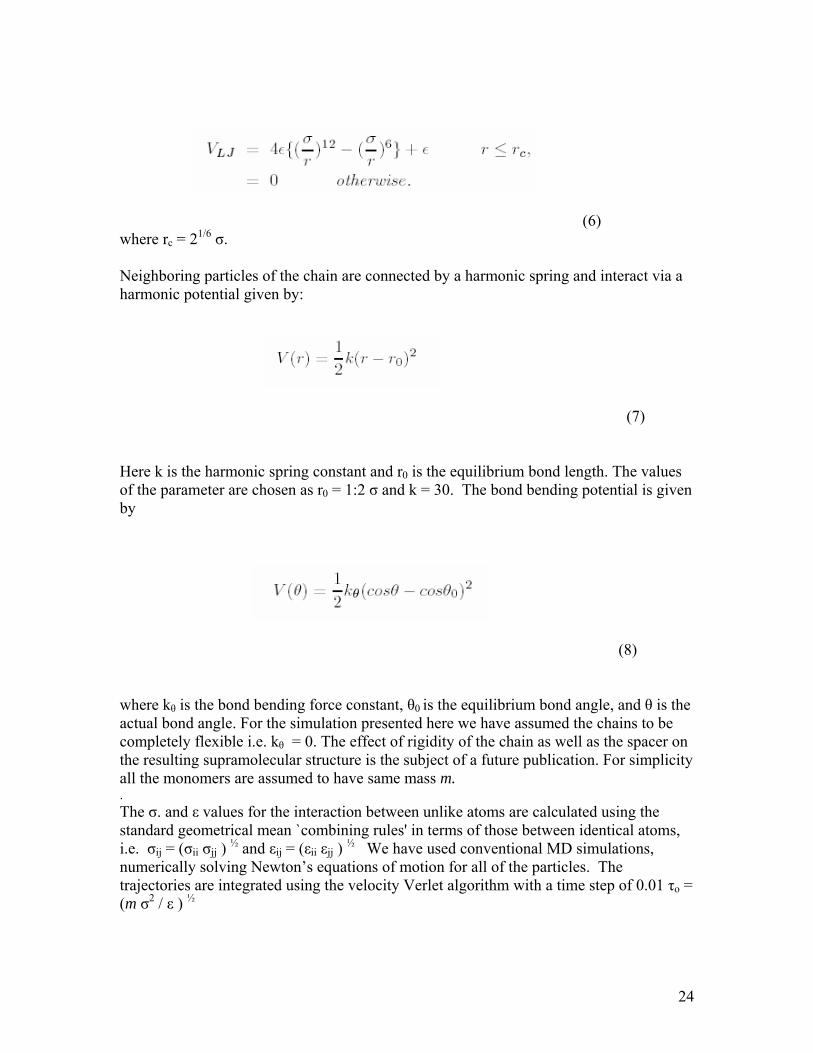
(6) where rc = 21/6 σ. Neighboring particles of the chain are connected by a harmonic spring and interact via a harmonic potential given by:
(7) Here k is the harmonic spring constant and r0 is the equilibrium bond length. The values of the parameter are chosen as r0 = 1:2 σ and k = 30. The bond bending potential is given by
(8) where kθ is the bond bending force constant, θ0 is the equilibrium bond angle, and θ is the actual bond angle. For the simulation presented here we have assumed the chains to be completely flexible i.e. kθ = 0. The effect of rigidity of the chain as well as the spacer on the resulting supramolecular structure is the subject of a future publication. For simplicity all the monomers are assumed to have same mass m. . The σ. and ε values for the interaction between unlike atoms are calculated using the standard geometrical mean `combining rules' in terms of those between identical atoms, i.e. σij = (σii σjj ) ½ and εij = (εii εjj ) ½ We have used conventional MD simulations, numerically solving Newton’s equations of motion for all of the particles. The trajectories are integrated using the velocity Verlet algorithm with a time step of 0.01 τo = (m σ2 / ε ) ½
24
The non-bonded interactions were computed using cell list with phantom atoms. This simplifies the computation of forces across periodic boundaries by introducing copies of all atoms that are within a distance rc of any region boundary and placing them just outside the simulation regime adjacent to the opposite boundary. 6.1.4 QSPR A number of surfactants have been screened for low IFT behavior, some types not considered for EOR applications previously, through a traditional Quantitative Structure Property Relationship expression (QSPR). The concept behind this method is to relate the structure of the molecules and its solution properties to its behavior (e.g. interfacial tension). The motivation for exploring this approach is that if it is successful, it is a calculation method that is much faster than full, molecular-level simulation and can provide semi-quantitative predictions of its behavior (e.g. IFT) based on the molecular structure and process conditions. Because this approach relies heavily on experimental data to “tune” the model, it has limited value with regards to gaining fundamental understanding of cause/effect and in extrapolating the observations to the behavior of significantly different surfactant structures. 6.1.5 Cohesive Energy -- Origin of IFT The molecular origin of interfacial (or surface) tension is often attributed to the difference of cohesive energy density (CED) of the two phases in contact. The CED, defined as the energy of interaction per unit volume, is a measure of the extent of molecular interactions in a system. The motivation for these series of calculations is to ascertain if CED simulations would aid in understanding the particular details of the different energetic components as to how they relate to IFT behavior. One advantage of this approach is that the computational effort is less intense than full MD simulations. Molecules in a bulk phase experience the same the forces (and interactions) from all directions. However, molecules at an interface would experience different molecular interactions from the two phases, each of which has a specific value of CED. Such inhomogeneity in CED leads to an excess of free energy and a tensile net force at the interface. The interfacial tension is directly related to the interface excess free energy and the tensile force.
Here we perform an analysis on the spatial distribution (along the z-direction) of the atomic strain energy of the water-surfactant-oil. The atomic strain energy, when summed over all the atoms in a system gives the total energy of the system. This is a good measure of local molecular interactions and is identical to the cohesive energy for systems whose intramolecular interactions are negligible.
25
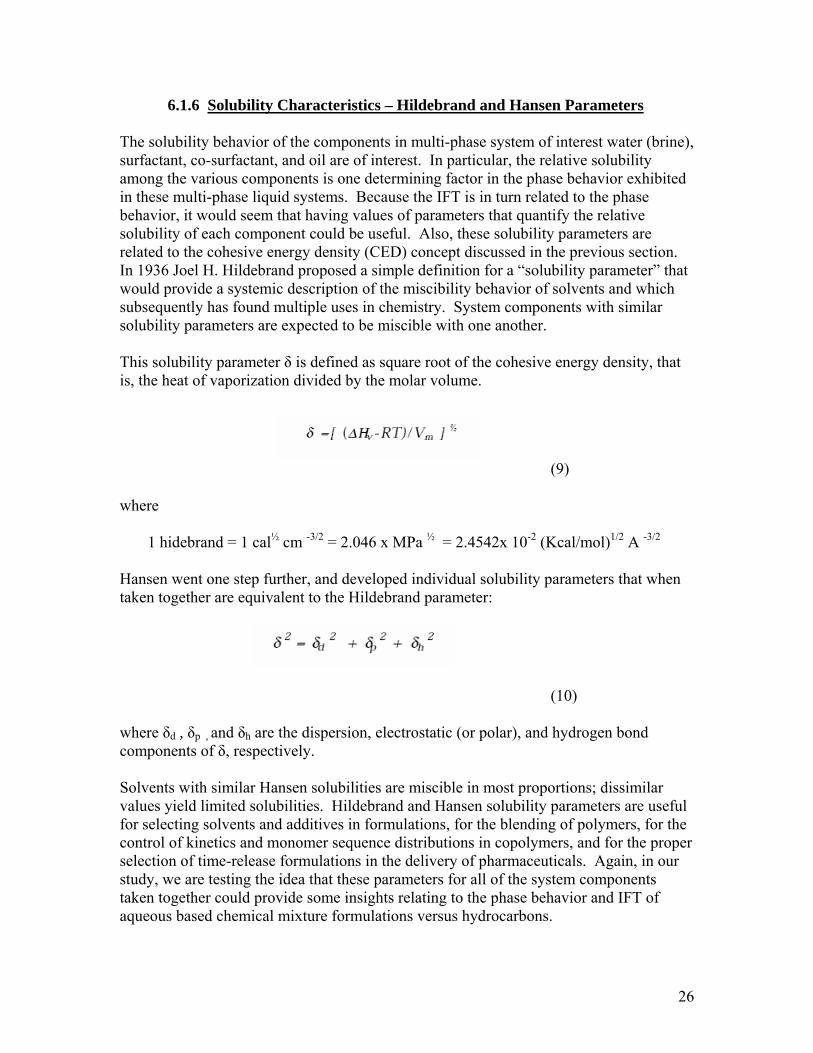
6.1.6 Solubility Characteristics – Hildebrand and Hansen Parameters The solubility behavior of the components in multi-phase system of interest water (brine), surfactant, co-surfactant, and oil are of interest. In particular, the relative solubility among the various components is one determining factor in the phase behavior exhibited in these multi-phase liquid systems. Because the IFT is in turn related to the phase behavior, it would seem that having values of parameters that quantify the relative solubility of each component could be useful. Also, these solubility parameters are related to the cohesive energy density (CED) concept discussed in the previous section. In 1936 Joel H. Hildebrand proposed a simple definition for a “solubility parameter” that would provide a systemic description of the miscibility behavior of solvents and which subsequently has found multiple uses in chemistry. System components with similar solubility parameters are expected to be miscible with one another. This solubility parameter δ is defined as square root of the cohesive energy density, that is, the heat of vaporization divided by the molar volume.
(9) where 1 hidebrand = 1 cal½ cm -3/2 = 2.046 x MPa ½ = 2.4542x 10⁻² (Kcal/mol)1/2 A -3/2 Hansen went one step further, and developed individual solubility parameters that when taken together are equivalent to the Hildebrand parameter:
(10) where δd , δp , and δh are the dispersion, electrostatic (or polar), and hydrogen bond components of δ, respectively. Solvents with similar Hansen solubilities are miscible in most proportions; dissimilar values yield limited solubilities. Hildebrand and Hansen solubility parameters are useful for selecting solvents and additives in formulations, for the blending of polymers, for the control of kinetics and monomer sequence distributions in copolymers, and for the proper selection of time-release formulations in the delivery of pharmaceuticals. Again, in our study, we are testing the idea that these parameters for all of the system components taken together could provide some insights relating to the phase behavior and IFT of aqueous based chemical mixture formulations versus hydrocarbons.
26
The Hildebrand parameter can be calculated easily for compounds with known heats of vaporization and densities. The Hansen parameters may be measured with difficulty, but their values for the chemical formulations in our study may be most revealing when coupled with the experimental observations of phase behavior/IFT. Our strategy is to calculate these Hansen parameters for the relevant compounds because of the experimental difficulties to generate these solubility parameters. Recent work at the California Institute of Technology in fact already considered molecular modeling approaches to calculate Hansen parameters (M. Belmares, M. Blanco, W. A Goddard, R. B Ross, et-al, “Hildebrand and Hansen Solubility Parameters from Molecular Dynamics with Applications to Electronic Nose Polymer Sensors”, in press, Journal of Computational Chemistry). This other study used calculated Hansen values as a tool in a study of the swelling behavior of polymers when exposed to different organic vapors. A Cohesive Energy Density (CED) computational method was used that offers consistency throughout the various organic compounds of interest in formulation work. CED is a multiple sampling Molecular Dynamics method that estimates Hildebrand and Hansen solubility parameters with good precision (ca. 0.44 hildebrands). The use of multiple sampling techniques allows for the precise determination of solubility parameters in a systematic way. The CED method, when combined with a generic force field and quantum mechanically determined atomic charges yields first-principles hildebrand parameter predictions in good agreement with experiment (rms 1.1 hildebrands). The CED method overcomes the common equilibration problems with condensed phase molecular dynamics, i.e., how to choose initial molecular configurations not far from equilibrium at normal densities. 6.2 Experimental Procedures 6.2.1. Phase Behavior and IFT
The purpose of these measurements is to determine for aqueous solutions with candidate surfactant formulations the phase behavior and IFT versus various hydrocarbons. Data from these tests are used to compare against and validate theoretical model predictions. Other tests focus on screening new ideas for surfactant formulations to determine their potential suitability for the more serious study as EOR agents. The basic procedure for these experiments is to prepare test tube size samples that contain brine, surfactant, cosurfactant, and a hydrocarbon. A common screening test recipe was:
• Surfactant concentration of 2 wt% • Co-surfactant, (optional) • Salt solutions, NaCl, usually 1 or 2 wt% • Hydrocarbon phase, various n-alkanes, most often n-octane • Water to oil ratio, usually 1:1
More intense study of phase behavior and IFT was performed for formulations containing alkyl polyglycosides (APG) surfactant. These candidate formulations tested a large
27
number of different chemical combinations APG/cosurfactants and chemical concentrations. A significant number of tests also were performed for formulations containing alkyl propoxysulfate surfactants. The test tubes are mixed well for several hours and allowed to stand for several days or as much as a few weeks to allow the fluids to come to phase equilibrium at ambient conditions. The physical appearance of the phases are noted, such as the relative volumes of the aqueous and oleic phases, and if any third, so-called middle-phase forms. Other qualitative information collected are the color or opacity/clarity of the various phases. The interfacial tension (IFT) was determined for selected phase equilibrated samples by using a spinning drop tensiometer method (from Temco, Inc.) as detailed elsewhere (Cayais, 1977). For our samples we loaded the glass tube with the aqueous phase, followed by injection of a few microliters of the uppermost oleic phase. The glass tube was spun in the instrument and the IFT determined from the oil drop geometry. Because the samples already come from fluids at phase equilibrium, typically it required less than 2 hours for the measured IFT to stabilize to a final value. This same procedure was used whether the sample had only 2 phases, or a third middle-phase. For the case of 3 phase samples, it is much easier to measure IFT between the excess phases than to attempt to measure the IFT that includes the middle-phase because of the opacity of the middle-phase emulsion. The IFT of the excess phases are still representative of the behavior of the IFT with the middle-phases because of Antov’s rule: IFT (aq-oil) < or = IFT (aq-middle) + IFT (middle-oil) For middle-phase systems, the greater of the IFT (aq-middle) or the IFT (middle-oil) is the “controlling one” that determines the mobilization of residual oil. One implication is that the IFT (aq-oil) will be its lowest under the same process conditions as the controlling IFT’s associated with middle-phase. Also, the reported IFT (aq-oil) may overestimate the actual, controlling IFT, but at the very worst by a factor of two. In some instances we measured the “fresh” IFT values, by which we mean the IFT between the aqueous formulation and an oil drop that had never been exposed previously to an aqueous solution. These measurements are more convenient because they bypass the lengthy procedure to create phase behavior tubes, followed by waiting some days for the phases to approach equilibrium. On the other hand, at least several hours time usually is required to attain a steady-state IFT due to the fluids not starting from a mutual equilibration. Also, our intuition is that the IFT from the phase-equilibrated samples is more representative of actual conditions where the aqueous and oil phases have a long contact time. The rationale for using n-alkanes as the hydrocarbon phase is that previous studies by other workers demonstrate they are a good proxy for real crude oils for trends in IFT behavior. In fact the EACN (Equivalent Alkane Carbon Number) concept (see for example Cash, 1976) says that for most crude oils there is a single average n-alkane that
28
best mimics its phase behavior and IFT trends versus surfactant formulations. One may then screen a number of surfactants using a simple n-alkane (or appropriate mixture) as a good proxy for that crude oil. In particular, previous studies indicate that for several crude oils investigated, that these oils have an EACN that may be modeled by alkanes ranging between n-hexane to n-decane. Thus, this current study has selected n-octane as a “typical” representative hydrocarbon. That is to say, surfactant formulations that are effective in reducing IFT versus n-octane are likely good candidates also for mobilizing crude oils. In addition, using n-alkanes as the hydrocarbon phases offers the advantages of being a low cost material that can be obtained easily with a consistent quality, thereby improving the probability of obtaining reproducible results. Yet another reason to use simple alkanes is that many previous investigations have also used these materials as test hydrocarbons. Hence it is easier to compare our results to some of those reported in the literature.
6.2.2 Surfactant Adsorption onto Kaolinite Clay
The purpose of this study effort is to quantify and compare the adsorption tendency of the various surfactant formulations we evaluate. A number of commercial surfactants have been evaluated for their tendency to adsorb onto kaolinite clay. All of these tests were conducted at 25 °C with a weight ratio of liquid/solid of 20, and for an exposure period of 8 hours. The rationale for using a clay in the adsorption portion of the study is that it is the clays with their relatively huge surface area that dominate chemical adsorption (at least in sandstone reservoirs). Kaolinite is selected (obtained from the University of Missouri) as the adsorbent of choice because 1) it is among the most common clays found in oil reservoirs, 2) it may be obtained in a fairly reproducible form, 3) it is inexpensive, and 4) it is a stable material (e.g., will not swell when immersed in fresh water). The composition provided by the supplier for the kaolinite has the following major components (weight percents):
SiO2 44.2 Al2O3 39.7 TiO2 1.39 Fe2O3 0.13 with trace amounts of sodium, manganese, calcium, potassium, phosphorous, and fluorine. They also provide a measured specific surface area of about 10 square meter/gram. The general procedure in these adsorption experiments includes
• Prepare surfactant solutions in NaCl brines (default is 2 wt%). • Use kaolinite clay with surfactant solution in test tubes at a weight ratio of 1:20
(0.5 g clay and 9.5 g solution). • The sample is shaken at room temperature for 8 hours.
29
• Centrifuge the test tubes for at least 1 hour to separate the solid material and the solution. In some cases the sample is centrifuged twice.
• Transfer the separated solution for analysis to determine the surfactant concentration remaining in the supernatant solution.
• From the reduction in the surfactant concentration in the supernatant solution, one may calculate the amount of surfactant transferred to the kaolinite solid phase.
Analysis of the remaining, equilibrium surfactant bulk concentration following exposure to the test solid material (kaolinite in this case) is a key to being able to measure surfactant adsorption accurately. The surfactant analytical method (for example, UV or IR) selected depends upon the chemistry of the subject surfactant. More recently we developed a gravimetric method to screen samples for solid adsorption. The basic procedure is to measure carefully on an analytical balance the starting weights of the dish, kaolinite, and starting surfactant solution. Per the step-by-step procedure listed above, the disaggregated kaolinite clay is exposed to the surfactant solution and the equilibrated supernatant solution is removed from the test tube. An aliquot of this supernatant solution is evaporated to dryness. Knowing the activity of the starting surfactant material and brine salinity, one can calculate the mass of surfactant that is left in the supernatant solution. Hence, these data provide the quantitative value of the reduction in the amount of the surfactant in solution and thereby the total surfactant retention. An advantage of this approach is that it avoids the complication of having to perform an analytical chemical assay test of the supernatant solution. 6.2.3 Coreflood Tests of Residual Oil Displacement Common laboratory procedures were used to test mobilization of residual oil from Berea sandstone cores. The experimental steps include:
• Saturate a Berea sandstone core (1” x 12”) with a brine • Pump brine through the core to condition it to the water chemistry and establish
the initial permeability by measurement of rate and pressures. • Displace the brine with the test oil (an n-alkane) until reaching an irreducible
water condition. • Water flood with a brine until reach residual oil saturation. • Inject the candidate surfactant formulation for a target pore volume. • Inject the polymer chaser slug/water drive until obtain no further tertiary oil
recovery. These flow experiments were performed at a nominal superficial velocity of about 3 feet/day during the chemical injection steps. Higher velocities were used during the flow stapes to introduce brine and oil. All oil displacement tests reported here were performed at room temperature.
30
7. RESULTS AND DISCUSSION 7.1 Theoretical Calculations
7.1.1 Summary of key findings from theoretical study Some of the key findings from the theoretical investigation include:
• The MD simulation methods employed for calculating IFT are validated for simple one and two component systems.
• The MD IFT calculations for ternary complex chemical system that include surfactants and other components are more useful for predicting IFT trends rather than exact values. The limitations are not of the method but of computational resources (cpu time) needed to carry out the calculations to reach convergence. It is expected that as additional processors are made available ternary systems will also yield quantitative (sub dyne/cm) accurate results.
This detailed, molecular-level analysis provides additional insights as to the characteristics associated with low IFT conditions. For example:
• MD results have shown the structure that surfactants adopt at the interface between water and oil. In turn this elicited additional directions for research, such as the need to add larger hydrophilic head groups to the surfactant
• Molecular simulations are able to provide information of the association between surfactant and cosurfactant. For example, we ran extensive MD simulations where cosurfactants coexisted in a 30:1 mole ratio with surfactant molecules for long periods of time. We surmise that the cosurfactant is able to keep surfactant molecules from overcrowding the interface, spreading their effect over a larger surface area while, achieving ultra low IFT with minimal concentrations. Such layers are shown to be thermally stable by the MD simulation.
• The MD tools used here also inspire new models of the oil/water interface. For example, one conceptual model is that the interface consists of a single layer of surfactant between oil and water. This is not supported by the experimental evidence. Oil/Surfactant/water systems of low IFT typically have a large third phase (interface). This interface is optically turbid. Our simulations indicate that multi-layers (oil/surfactant/water/surfactant/oil) are quite stable and may be responsible for the third phase in such formulations. We surmise that this phase consists of an intimate folding of water/surfactant/oil layers, an indication that the interfacial tension is low enough to allow such complex, flexible, layers to fold on themselves over and over.
Less complicated theoretical tools have the potential to provide other useful information with a reduced computation effort. For example: • We were able to extract similar information from the fully atomistic simulations
using “bead” simulation approach where entire chemical groups are represented by a single bead. In this case we were able to identify that alkylbenzosulfonate (Cn, n=16) substituted in the 4th carbon were optimal structures to yield low IFT. The results are corroborated by the experiments and the more advanced fully
31
atomistic simulations. However, such “bead” models are of limited use since the “bead-bead” interactions cannot be estimated from first principles. Such interactions are typically set arbitrarily by the modeler, typically to fit a given observed experimental data. This defeats the purpose of studying systems de nove, i.e., without the need for chemical synthesis and laboratory measurements.
7.1.2 MD Model Validation and Calculation Sensitivity Analysis
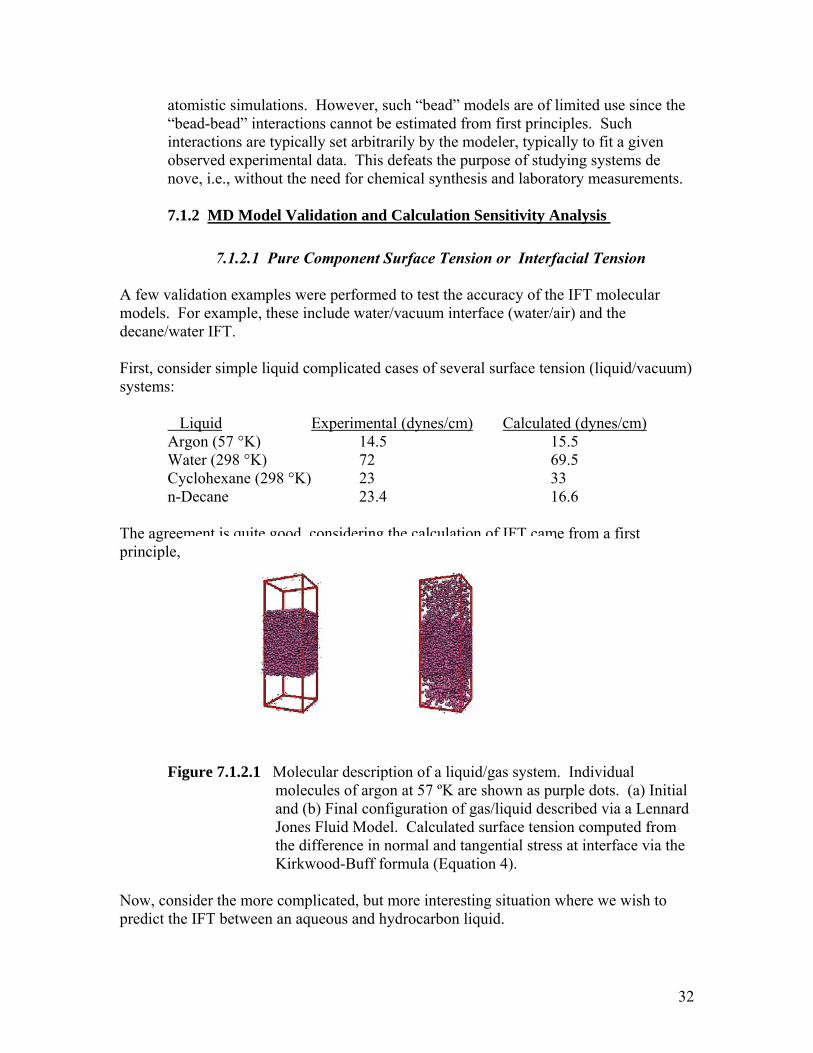
7.1.2.1 Pure Component Surface Tension or Interfacial Tension A few validation examples were performed to test the accuracy of the IFT molecular models. For example, these include water/vacuum interface (water/air) and the decane/water IFT. First, consider simple liquid complicated cases of several surface tension (liquid/vacuum) systems: Liquid Experimental (dynes/cm) Calculated (dynes/cm) Argon (57 °K) 14.5 15.5 Water (298 °K) 72 69.5 Cyclohexane (298 °K) 23 33 n-Decane 23.4 16.6 The agreement is quite good, considering the calculation of IFT came from a first principle, molecular-level analysis. (a) (b) Figure 7.1.2.1 Molecular description of a liquid/gas system. Individual molecules of argon at 57 ºK are shown as purple dots. (a) Initial and (b) Final configuration of gas/liquid described via a Lennard Jones Fluid Model. Calculated surface tension computed from the difference in normal and tangential stress at interface via the Kirkwood-Buff formula (Equation 4). Now, consider the more complicated, but more interesting situation where we wish to predict the IFT between an aqueous and hydrocarbon liquid.
32
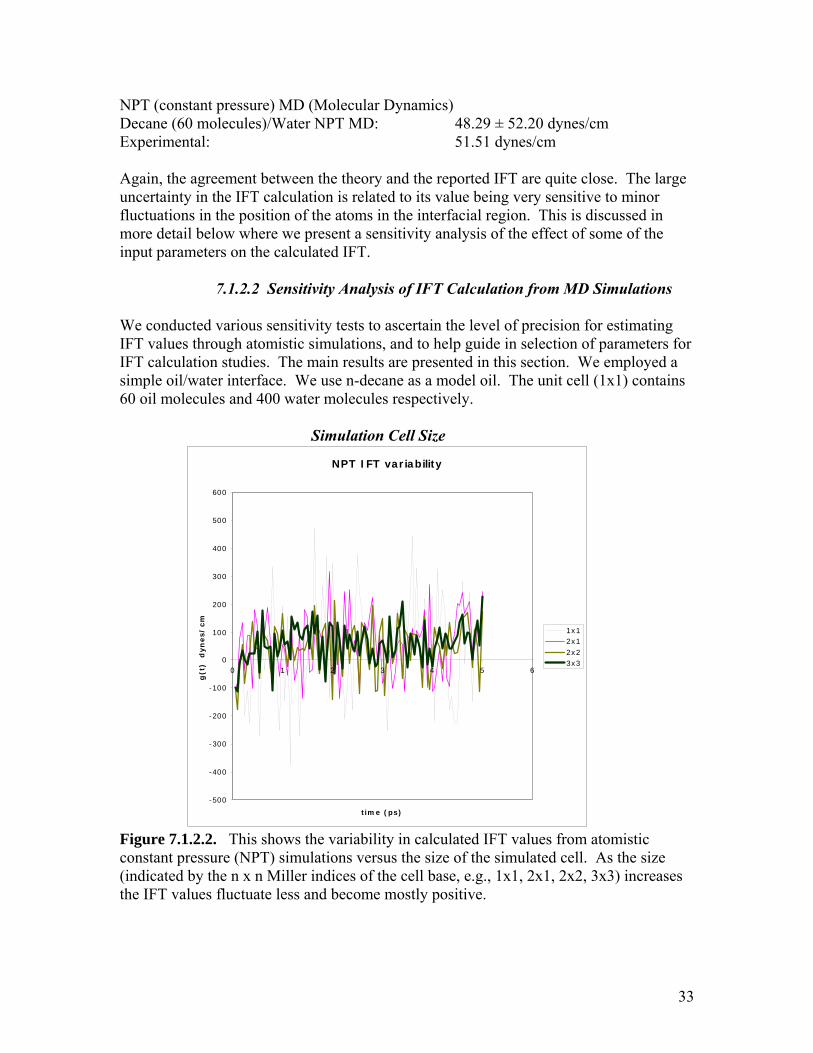
NPT (constant pressure) MD (Molecular Dynamics) Decane (60 molecules)/Water NPT MD: 48.29 ± 52.20 dynes/cm Experimental: 51.51 dynes/cm Again, the agreement between the theory and the reported IFT are quite close. The large uncertainty in the IFT calculation is related to its value being very sensitive to minor fluctuations in the position of the atoms in the interfacial region. This is discussed in more detail below where we present a sensitivity analysis of the effect of some of the input parameters on the calculated IFT.
7.1.2.2 Sensitivity Analysis of IFT Calculation from MD Simulations
We conducted various sensitivity tests to ascertain the level of precision for estimating IFT values through atomistic simulations, and to help guide in selection of parameters for IFT calculation studies. The main results are presented in this section. We employed a simple oil/water interface. We use n-decane as a model oil. The unit cell (1x1) contains 60 oil molecules and 400 water molecules respectively.
Simulation Cell Size
NPT IFT variability
-500
-400
-300
-200
-100
0
100
200
300
400
500
600
0 1 2 3 4 5 6
time (ps)
g(t
) d
yn
es/
cm
1x12x12x23x3
Figure 7.1.2.2. This shows the variability in calculated IFT values from atomistic constant pressure (NPT) simulations versus the size of the simulated cell. As the size (indicated by the n x n Miller indices of the cell base, e.g., 1x1, 2x1, 2x2, 3x3) increases the IFT values fluctuate less and become mostly positive.
33
Total Simulation Time
2x2 NVT <γ(t)> dynes/cm50.8
0
10
20
30
40
50
60
70
80
90
100
0 10 20 30 40 50 60
Time (ps)
g (t)
(dyn
es/c
m)
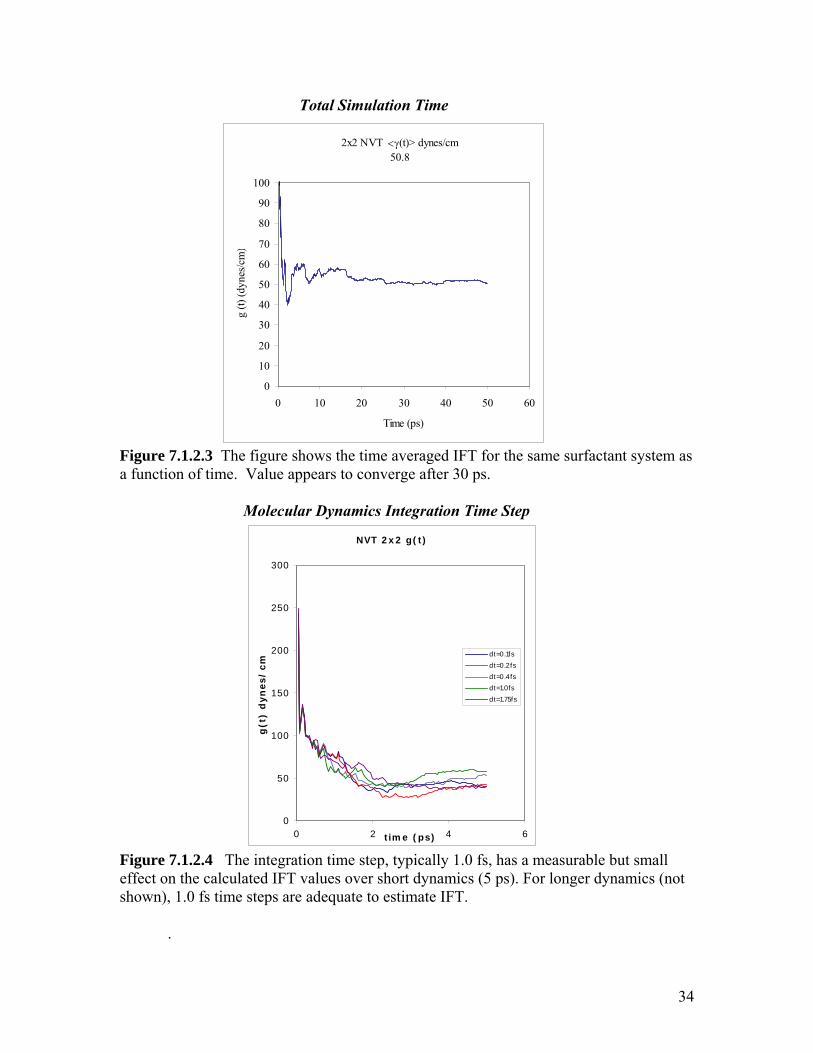
Figure 7.1.2.3 The figure shows the time averaged IFT for the same surfactant system as a function of time. Value appears to converge after 30 ps.
Molecular Dynamics Integration Time Step
NVT 2x2 g(t)
0
50
100
150
200
250
300
0 2 4 6time (ps)
g(t
) d
yn
es/
cm
dt=0.1fsdt=0.2fsdt=0.4fsdt=1.0fsdt=1.75fs
Figure 7.1.2.4 The integration time step, typically 1.0 fs, has a measurable but small effect on the calculated IFT values over short dynamics (5 ps). For longer dynamics (not shown), 1.0 fs time steps are adequate to estimate IFT.
.
34
Number of Slabs in the Kirkwood-Buff Integration
Figure the number of slabs from
IFT Averaging Time Period
Figure 7.1.2.6 e before being printed out for furt reat variability in the individual
les
SLAB IFT variability
-200
-150
-100
-50
0
50
100
150
200
250
300
0 1 2 3 4 5 6
time (ps)
g(t
) d
yn
es/
cm
100 slabs200400800
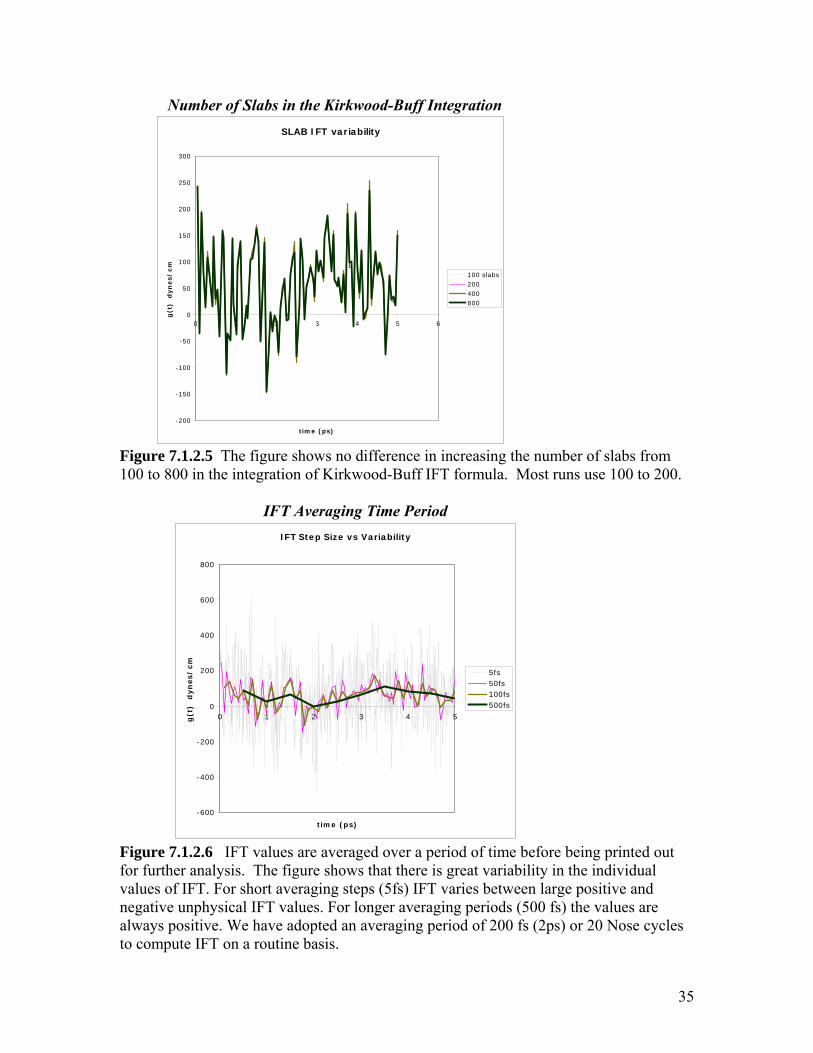
7.1.2.5 The figure shows no difference in increasing 100 to 800 in the integration of Kirkwood-Buff IFT formula. Most runs use 100 to 200.
IFT Step Size vs Variability
-600
-400
-200
0
200
400
600
800
0 1 2 3 4 5
time (ps)
g(t
) d
yn
es/
cm
5fs50fs100fs500fs
IFT values are averaged over a period of timher analysis. The figure shows that there is g
values of IFT. For short averaging steps (5fs) IFT varies between large positive and negative unphysical IFT values. For longer averaging periods (500 fs) the values are always positive. We have adopted an averaging period of 200 fs (2ps) or 20 Nose cycto compute IFT on a routine basis.
35
igur averaging eriod is changed to 500 fs or longer. The effect of using only half of the simulation for
ated.
onclusion is that we need to carry out MD simulations with larger systems, r longer periods of time using typically integration time steps (1fs), averaging over
7.1.3 MD Model Calculations of IFT for Alkyl Benzene Sulfonate
y = 13.841x-0.1658
R2 = 0.8114
0
5
10
15
20
25
30
35
0 200 400 600
IFT Step (fs)
F e 7.1.2.7 The standard deviation in IFT decreases greatly when thepcalculating IFT is also shown. This indicates that the first half is not yet fully equilibrThe protocol now includes avoiding this transient values and using averaging periods of at least 2ps. Overall the cfolonger block units of time to get instantaneous IFT values that fluctuate less and convergefaster.
Surfactants
We cho D simulations that include a surfactant on branched alkyl
enzene sulfonates, a commercially available class of surfactants for producing low
R in r
d surfactants included in this study are of interest also ecause of their strong sensitivity (3-4 orders of magnitude change in IFT) to isomeric
g
se to focus the first Mbinterfacial tensions between hydrocarbons and water. One reason is that alkyl benzene sulfonates have been the most common type of surfactant chemistry employed for IOfield applications. Another is that there is a significant body of literature data about theibehavior and characteristics. The particular suite of branchebchemical structural changes. We anticipate that having a molecular level understandinof why fairly subtle changes in the surfactant structure produce profound changes in the
Sta
ndar
d D
evia
tion
full simulation
1/2 simulation
Power (1/2 simulation)
36
IFT will be very valuable for calculations to project IFT behavior for other, novel surfactant concepts. These IFT molecular simulations were performed under the following conditions of a
ater/surfactant/oil interface. w Surfactant: C16_2, C16_3, C16_4, C16_5, C16_6, and C16_8. This nomenclature
enotes a benzene sulfonyl type of C16 straight chain alkyl sulfonate, with the second
dnumber giving the differing alkyl chain point of attachment. Structure:
Cn-1H2n-1CmH2m+1
SO3Na (m+1)φC16S m.w. = 381.6
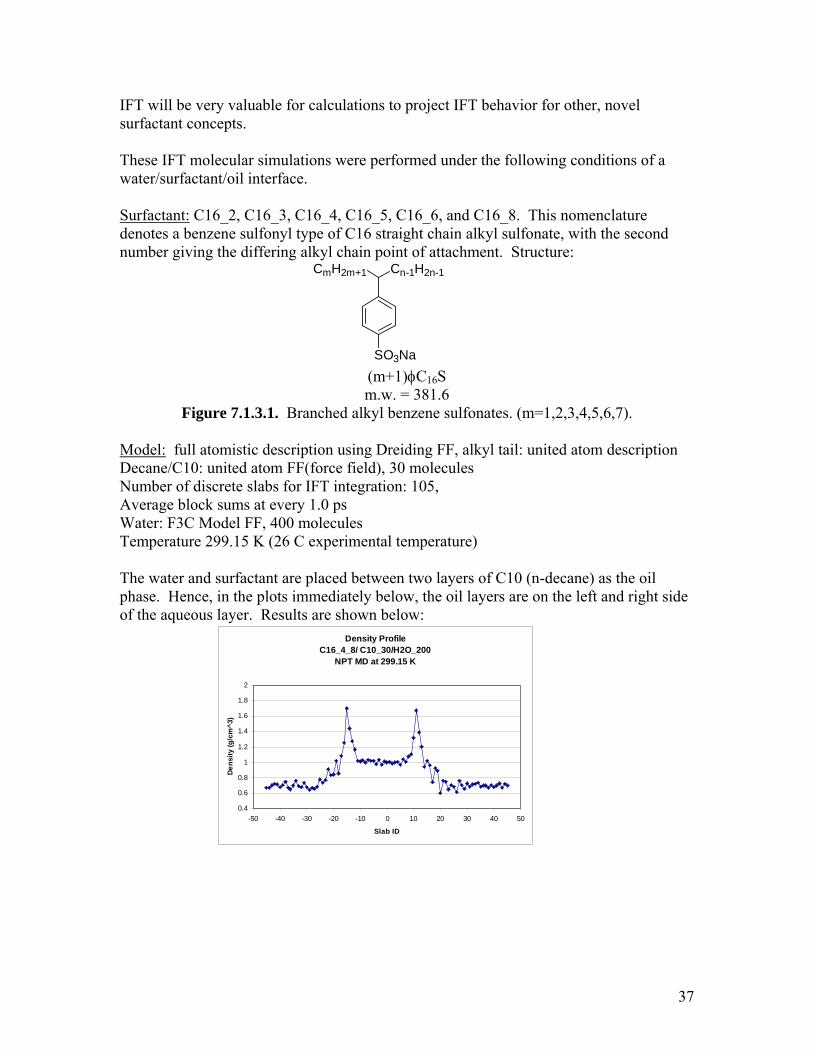
Figure 7.1.3.1. Branched alkyl benzene sulfonates. (m=1,2,3,4,5,6,7).
Model:
f iption Decane/C10: united atom FF(force field), 30 molecules
ental temperature)
f C10 (n-decane) as the oil hase. Hence, in the plots immediately below, the oil layers are on the left and right side
ull atomistic description using Dreiding FF, alkyl tail: united atom descr
Number of discrete slabs for IFT integration: 105, Average block sums at every 1.0 ps Water: F3C Model FF, 400 molecules Temperature 299.15 K (26 C experim The water and surfactant are placed between two layers opof the aqueous layer. Results are shown below:
Density ProfileC16_4_8/ C10_30/H2O_200
NPT MD at 299.15 K
0.4
0.6
0.8
1
1.2
1.4
1.6
1.8
2
-50 -40 -30 -20 -10 0 10 20 30 40 50
Slab ID
Dens
ity (g
/cm
^3)
37
Stress ProfileC16_4_8/C10_30/H2O_200
NPT MD at 299.15 K
-1.2
-1
-0.8
-0.6
-0.4
-0.2
0
0.2
0.4
0.6
-50 -40 -30 -20 -10 0 10 20 30 40 50
Slab ID
Stre
ss (G
Pa)
PnPt
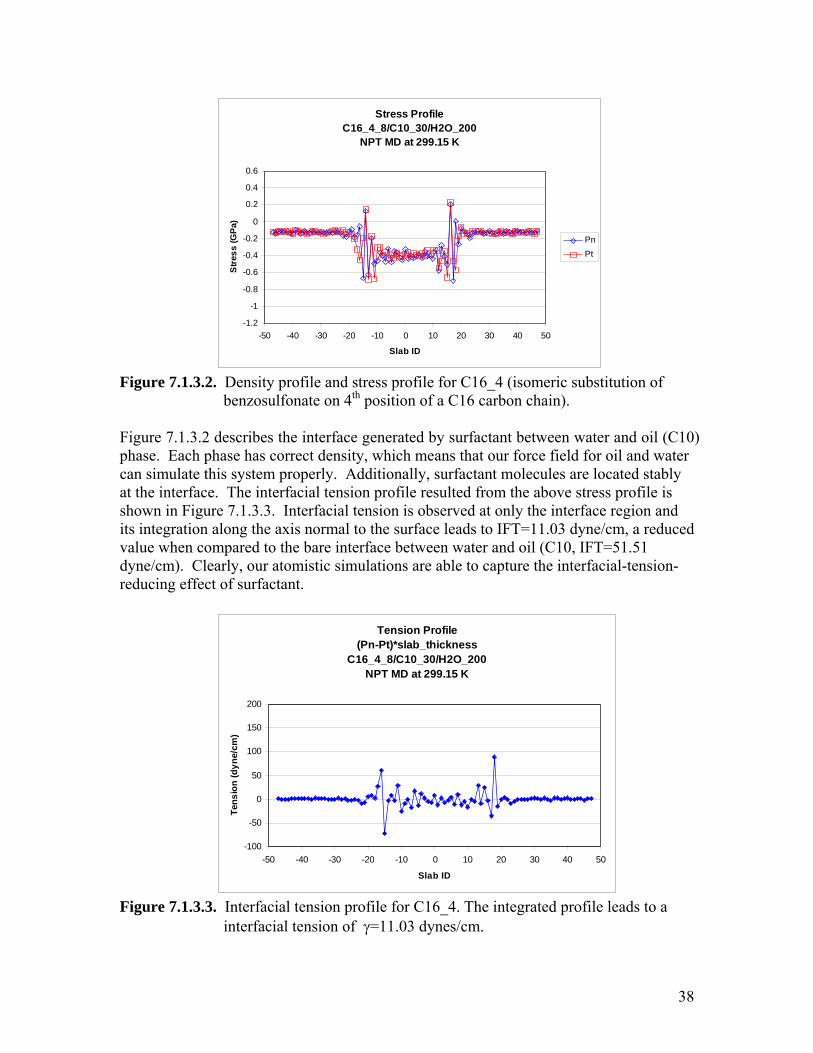
Figure 7.1.3.2. Density profile and stress profile for C16_4 (isomeric substitution of benzosulfonate on 4th position of a C16 carbon chain). Figure 7.1.3.2 describes the interface generated by surfactant between water and oil (C10) phase. Each phase has correct density, which means that our force field for oil and water can simulate this system properly. Additionally, surfactant molecules are located stably at the interface. The interfacial tension profile resulted from the above stress profile is shown in Figure 7.1.3.3. Interfacial tension is observed at only the interface region and its integration along the axis normal to the surface leads to IFT=11.03 dyne/cm, a reduced value when compared to the bare interface between water and oil (C10, IFT=51.51 dyne/cm). Clearly, our atomistic simulations are able to capture the interfacial-tension-reducing effect of surfactant.
Tension Profile(Pn-Pt)*slab_thickness
C16_4_8/C10_30/H2O_200NPT MD at 299.15 K
-100
-50
0
50
100
150
200
-50 -40 -30 -20 -10 0 10 20 30 40 50
Slab ID
Tens
ion
(dyn
e/cm
)
Figure 7.1.3.3. Interfacial tension profile for C16_4. The integrated profile leads to a interfacial tension of γ=11.03 dynes/cm.
38
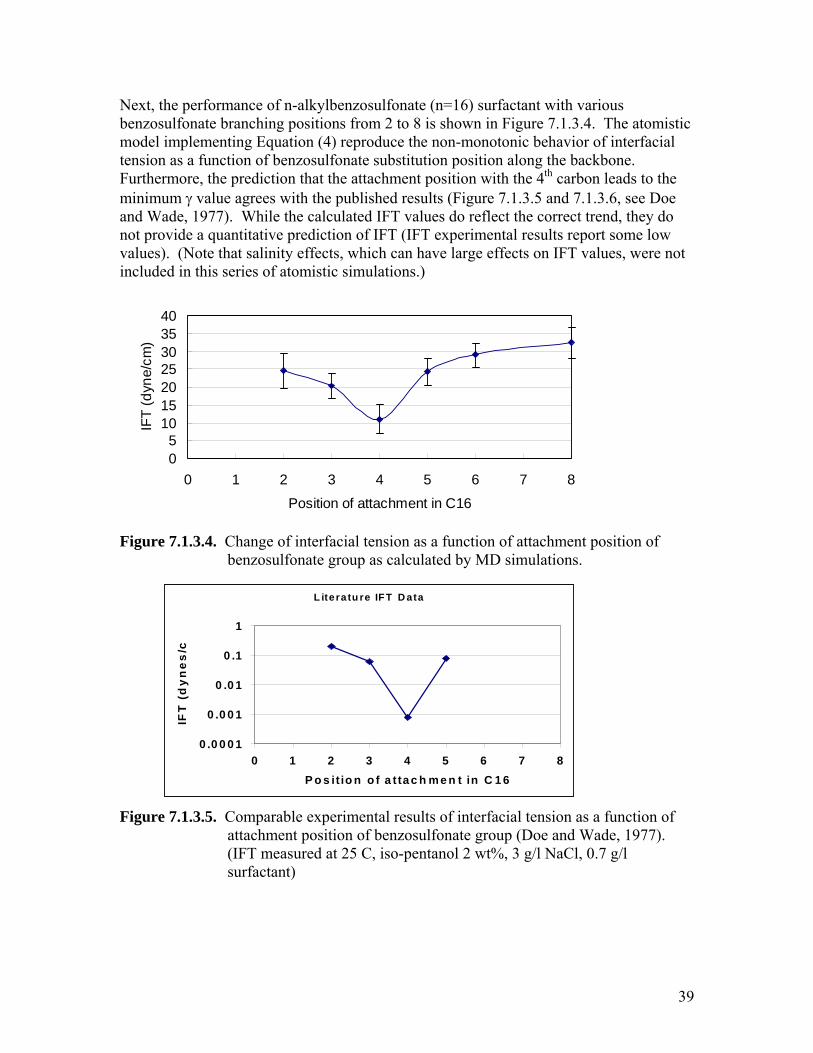
Next, the performance of n-alkylbenzosulfonate (n=16) surfactant with various benzosulfonate branching positions from 2 to 8 is shown in Figure 7.1.3.4. The atomistic model implementing Equation (4) reproduce the non-monotonic behavior of interfacial tension as a function of benzosulfonate substitution position along the backbone. Furthermore, the prediction that the attachment position with the 4th carbon leads to the minimum γ value agrees with the published results (Figure 7.1.3.5 and 7.1.3.6, see Doe and Wade, 1977). While the calculated IFT values do reflect the correct trend, they do not provide a quantitative prediction of IFT (IFT experimental results report some low values). (Note that salinity effects, which can have large effects on IFT values, were not included in this series of atomistic simulations.)
05
10152025303540
0 1 2 3 4 5 6 7 8
Position of attachment in C16
IFT
(dyn
e/cm
)
Figure 7.1.3.4. Change of interfacial tension as a function of attachment position of benzosulfonate group as calculated by MD simulations.
L itera tu re IFT D ata
0 .0 0 0 1
0 .0 0 1
0 .0 1
0 .1
1
0 1 2 3 4 5 6 7 8P o s it io n o f a t ta c h m e n t in C 1 6
IFT
(d
yn
es
/c
Figure 7.1.3.5. Comparable experimental results of interfacial tension as a function of attachment position of benzosulfonate group (Doe and Wade, 1977). (IFT measured at 25 C, iso-pentanol 2 wt%, 3 g/l NaCl, 0.7 g/l surfactant)
39
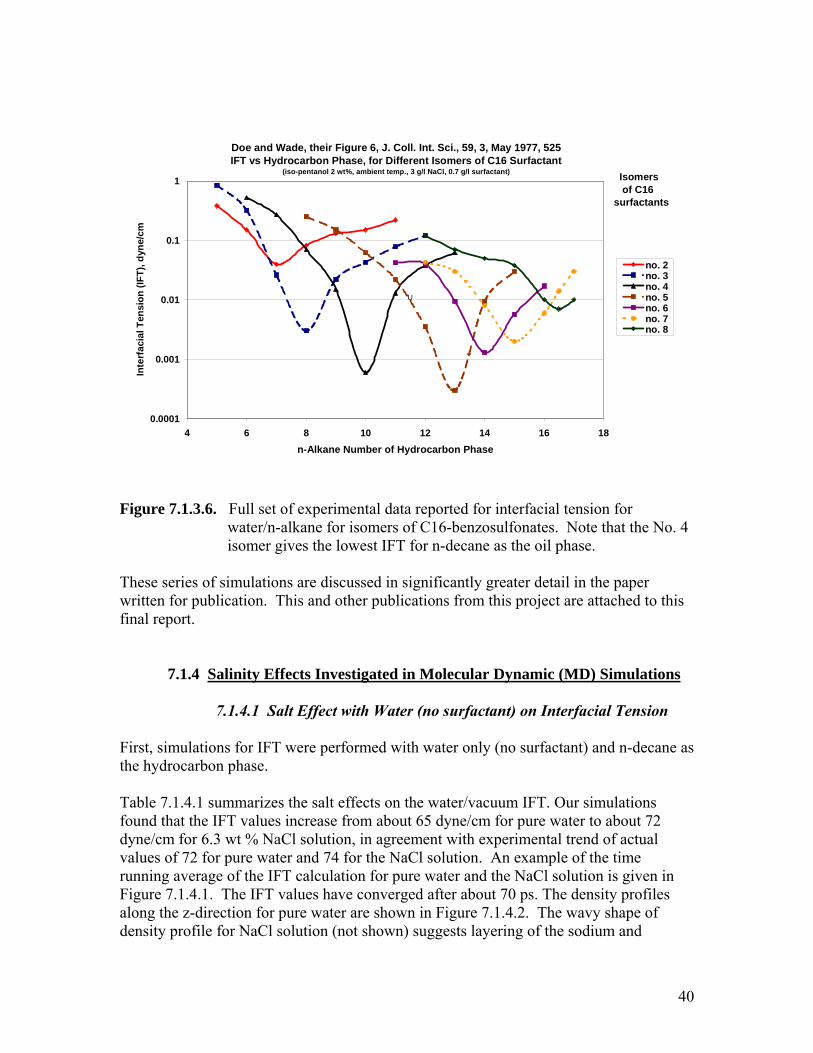
Doe and Wade, their Figure 6, J. Coll. Int. Sci., 59, 3, May 1977, 525IFT vs Hydrocarbon Phase, for Different Isomers of C16 Surfactant
(iso-pentanol 2 wt%, ambient temp., 3 g/l NaCl, 0.7 g/l surfactant)
0.0001
0.001
0.01
0.1
1
4 6 8 10 12 14 16 18n-Alkane Number of Hydrocarbon Phase
Inte
rfac
ial T
ensi
on (I
FT),
dyne
/cm
no. 2no. 3no. 4no. 5no. 6no. 7no. 8
Isomers of C16surfactants
U
Figure 7.1.3.6. Full set of experimental data reported for interfacial tension for water/n-alkane for isomers of C16-benzosulfonates. Note that the No. 4 isomer gives the lowest IFT for n-decane as the oil phase.
These series of simulations are discussed in significantly greater detail in the paper written for publication. This and other publications from this project are attached to this final report. 7.1.4 Salinity Effects Investigated in Molecular Dynamic (MD) Simulations
7.1.4.1 Salt Effect with Water (no surfactant) on Interfacial Tension First, simulations for IFT were performed with water only (no surfactant) and n-decane as the hydrocarbon phase. Table 7.1.4.1 summarizes the salt effects on the water/vacuum IFT. Our simulations found that the IFT values increase from about 65 dyne/cm for pure water to about 72 dyne/cm for 6.3 wt % NaCl solution, in agreement with experimental trend of actual values of 72 for pure water and 74 for the NaCl solution. An example of the time running average of the IFT calculation for pure water and the NaCl solution is given in Figure 7.1.4.1. The IFT values have converged after about 70 ps. The density profiles along the z-direction for pure water are shown in Figure 7.1.4.2. The wavy shape of density profile for NaCl solution (not shown) suggests layering of the sodium and
40
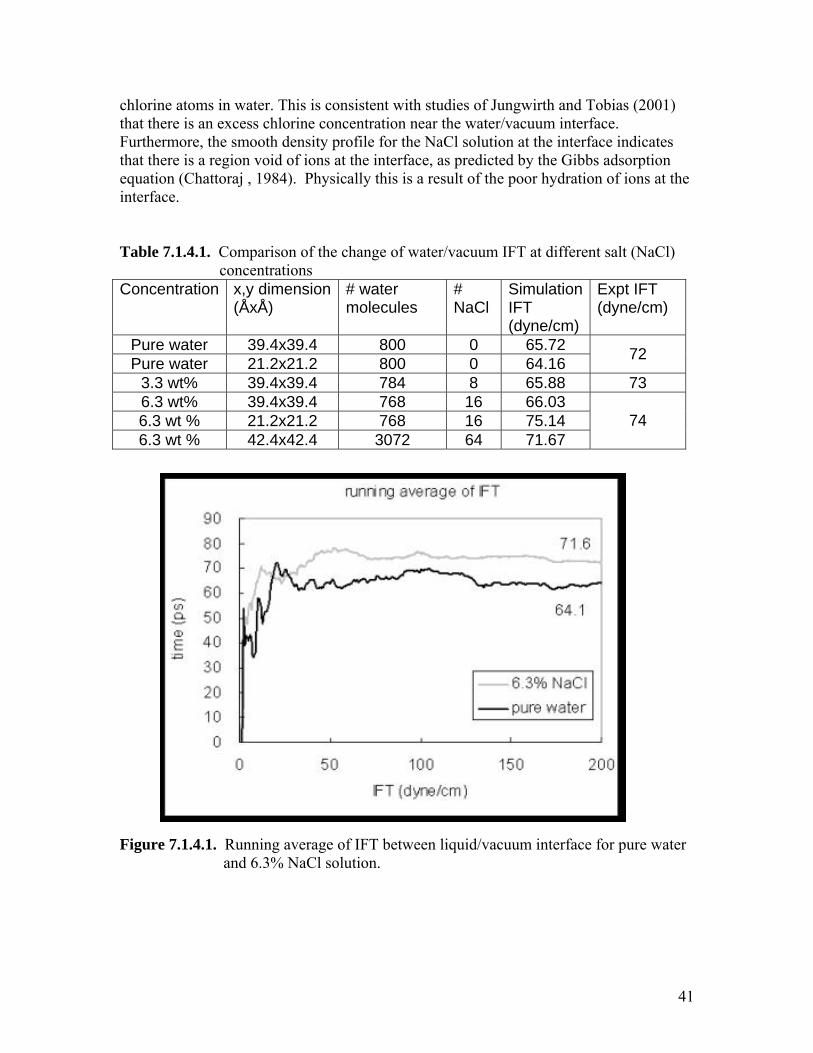
chlorine atoms in water. This is consistent with studies of Jungwirth and Tobias (2001) that there is an excess chlorine concentration near the water/vacuum interface. Furthermore, the smooth density profile for the NaCl solution at the interface indicates that there is a region void of ions at the interface, as predicted by the Gibbs adsorption equation (Chattoraj , 1984). Physically this is a result of the poor hydration of ions at the interface. Table 7.1.4.1. Comparison of the change of water/vacuum IFT at different salt (NaCl) concentrations Concentration x,y dimension
(ÅxÅ) # water molecules
# NaCl
Simulation IFT (dyne/cm)
Expt IFT (dyne/cm)
Pure water 39.4x39.4 800 0 65.72 Pure water 21.2x21.2 800 0 64.16 72
3.3 wt% 39.4x39.4 784 8 65.88 73 6.3 wt% 39.4x39.4 768 16 66.03 6.3 wt % 21.2x21.2 768 16 75.14 6.3 wt % 42.4x42.4 3072 64 71.67
74
Figure 7.1.4.1. Running average of IFT between liquid/vacuum interface for pure water and 6.3% NaCl solution.
41
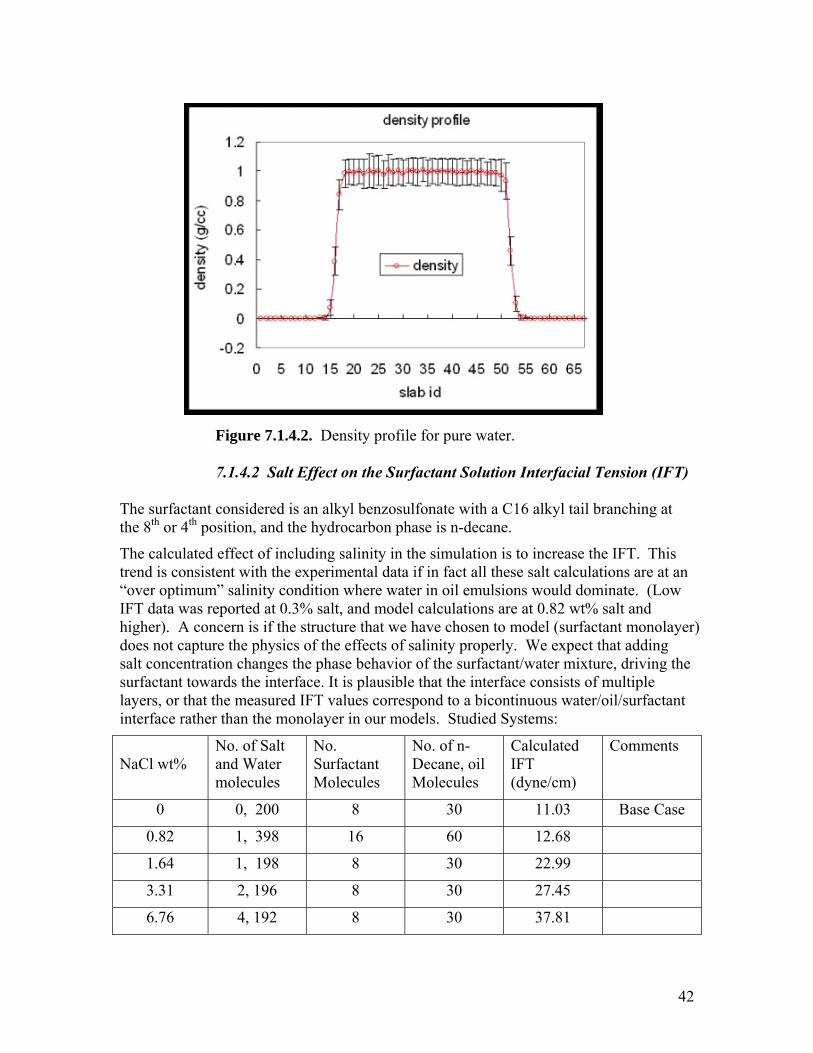
Figure 7.1.4.2. Density profile for pure water.
7.1.4.2 Salt Effect on the Surfactant Solution Interfacial Tension (IFT)
The surfactant considered is an alkyl benzosulfonate with a C16 alkyl tail branching at the 8th or 4th position, and the hydrocarbon phase is n-decane.
The calculated effect of including salinity in the simulation is to increase the IFT. This trend is consistent with the experimental data if in fact all these salt calculations are at an “over optimum” salinity condition where water in oil emulsions would dominate. (Low IFT data was reported at 0.3% salt, and model calculations are at 0.82 wt% salt and higher). A concern is if the structure that we have chosen to model (surfactant monolayer) does not capture the physics of the effects of salinity properly. We expect that adding salt concentration changes the phase behavior of the surfactant/water mixture, driving the surfactant towards the interface. It is plausible that the interface consists of multiple layers, or that the measured IFT values correspond to a bicontinuous water/oil/surfactant interface rather than the monolayer in our models. Studied Systems:
NaCl wt%
No. of Salt and Water molecules
No. Surfactant Molecules
No. of n-Decane, oil Molecules
Calculated IFT (dyne/cm)
Comments
0 0, 200 8 30 11.03 Base Case
0.82 1, 398 16 60 12.68
1.64 1, 198 8 30 22.99
3.31 2, 196 8 30 27.45
6.76 4, 192 8 30 37.81
42
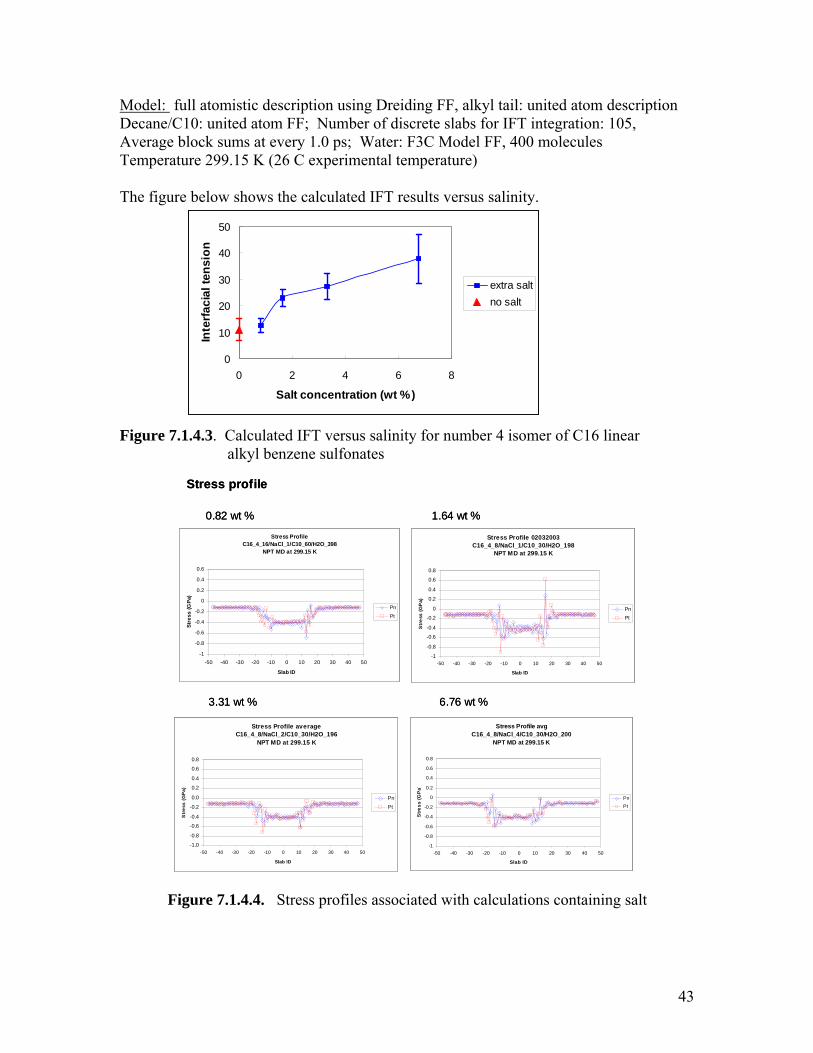
Model: full atomistic description using Dreiding FF, alkyl tail: united atom description Decane/C10: united atom FF; Number of discrete slabs for IFT integration: 105, Average block sums at every 1.0 ps; Water: F3C Model FF, 400 molecules Temperature 299.15 K (26 C experimental temperature) The figure below shows the calculated IFT results versus salinity.
0
10
20
30
40
50
0 2 4 6 8
Salt concentration (wt %)
Inte
rfaci
al te
nsio
n
extra saltno salt
Figure 7.1.4.3. Calculated IFT versus salinity for number 4 isomer of C16 linear alkyl benzene sulfonates
Stress Profile 02032003C16_4_8/NaCl_1/C10_30/H2O_198
NPT MD at 299.15 K
-1
-0.8
-0.6
-0.4
-0.2
0
0.2
0.4
0.6
0.8
-50 -40 -30 -20 -10 0 10 20 30 40 50
Slab ID
Str
ess
(GP
a)
PnPt
Stress Profile averageC16_4_8/NaCl_2/C10_30/H2O_196
NPT MD at 299.15 K
-1.0
-0.8
-0 6
-0 4Str
e
.
.
-0.2
0.0
0.2
0.4
0.6
0.8
-50 -40 -30 -20 -10 0 10 20 30 40 50
Slab ID
ss (G
Pa)
Pn
Pt
Stress Profile avgC16_4_8/NaCl_4/C10_30/H2O_200
NPT MD at 299.15 K
-1
-0.8
-0.6
-0.4
-0.2
0
0.2
0.4
0.6
0.8
-50 -40 -30 -20 -10 0 10 20 30 40 50
Slab ID
Stre
ss (G
Pa)
PnPt
Stress ProfileC16_4_16/NaCl_1/C10_60/H2O_398
NPT MD at 299.15 K
-1
-0.8
-0.6
-0.4
-0.2
0
0.2
0.4
0.6
-50 -40 -30 -20 -10 0 10 20 30 40 50
Slab ID
Stre
ss (G
Pa)
PnPt
0.82 wt % 1.64 wt %
3.31 wt % 6.76 wt %
Stress profile
Stress Profile 02032003C16_4_8/NaCl_1/C10_30/H2O_198
NPT MD at 299.15 K
-1
-0.8
-0.6
-0.4
-0.2
0
0.2
0.4
0.6
0.8
-50 -40 -30 -20 -10 0 10 20 30 40 50
Slab ID
Str
ess
(GP
a)
PnPt
Stress Profile averageC16_4_8/NaCl_2/C10_30/H2O_196
NPT MD at 299.15 K
-1.0
-0.8
.
.
-0.2
0.0
0.2
0.4
0.6
0.8
-50 -40 -30 -20 -10 0 10 20 30 40 50
Slab ID
ss (G
Pa)
-0 6
-0 4Str
e
Pn
Pt
Stress Profile avgC16_4_8/NaCl_4/C10_30/H2O_200
NPT MD at 299.15 K
-1
-0.8
-0.6
-0.4
-0.2
0
0.2
0.4
0.6
0.8
-50 -40 -30 -20 -10 0 10 20 30 40 50
Slab ID
Stre
ss (G
Pa)
PnPt
Stress ProfileC16_4_16/NaCl_1/C10_60/H2O_398
NPT MD at 299.15 K
-1
-0.8
-0.6
-0.4
-0.2
0
0.2
0.4
0.6
-50 -40 -30 -20 -10 0 10 20 30 40 50
Slab ID
Stre
ss (G
Pa)
PnPt
0.82 wt % 1.64 wt %
3.31 wt % 6.76 wt %
Stress profile
Figure 7.1.4.4. Stress profiles associated with calculations containing salt
43
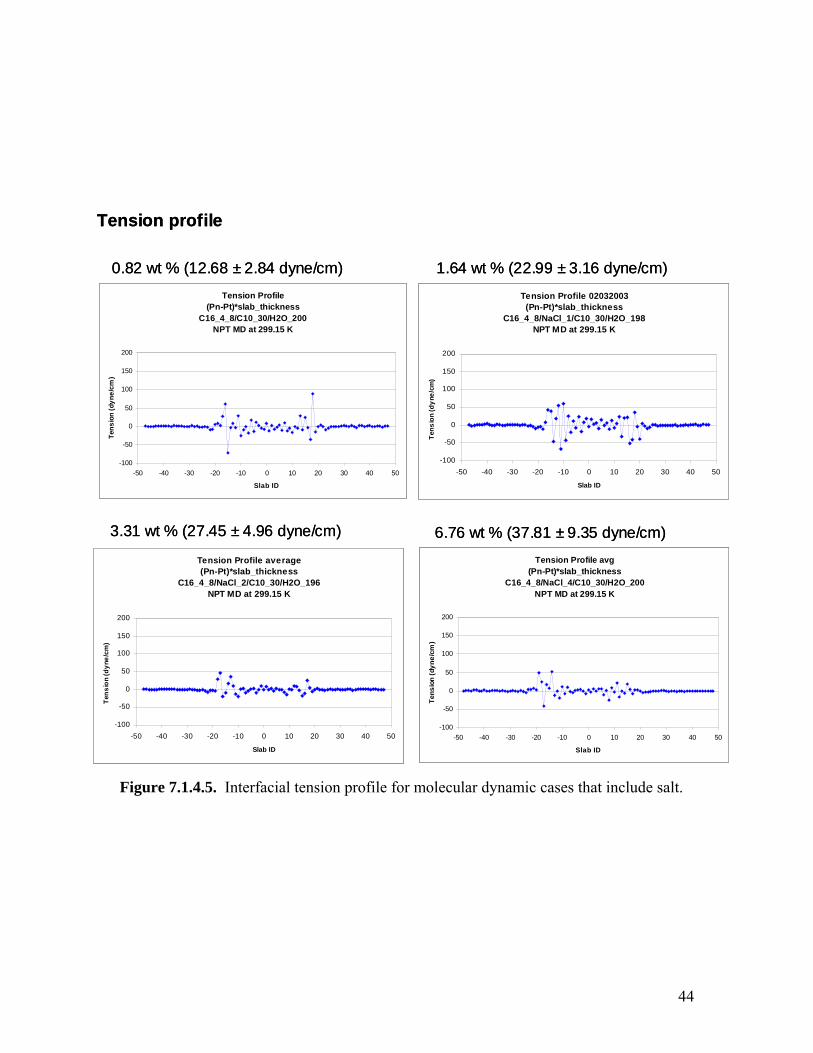
6.76 wt % (37.81 ± 9.35 dyne/cm)
Tension Profile(Pn-Pt)*slab_thickness
C16_4_8/C10_30/H2O_200NPT MD at 299.15 K
-100
Figure 7.1.4.5. Interfacial tension profile for molecular dynamic cases that include salt.
-50
0
0
0
0
-50 -40 -30 -20 -10 0 10 20 30 40 50
Slab ID
Tens
ion
(dyn
e/cm
)
20
50
10
15
3.31 wt % (27.45 ± 4.96 dyne/cm)
1.64 wt % (22.99 ± 3.16 dyne/cm)Tension Profile 02032003
(Pn-Pt)*slab_thicknessC16_4_8/NaCl_1/C10_30/H2O_198
NPT MD at 299.15 K
-100
-50
0
50
100
150
200
-50 -40 -30 -20 -10 0 10 20 30 40 50
Slab ID
Tens
ion
(dyn
e/cm
)
Tension Profile average(Pn-Pt)*slab_thickness
C16_4_8/NaCl_2/C10_30/H2O_196NPT MD at 299.15 K
-100
-50
100
150
200
-50 -40 -30 -20 -10 0 10 20 30 40 50
Slab ID
Tens
ion
(dyn
e/cm
)
0
50
Tension Profile avg(Pn-Pt)*slab_thickness
C16_4_8/NaCl_4/C10_30/H2O_200NPT MD at 299.15 K
-100
-50
0
50
100
150
200
-50 -40 -30 -20 -10 0 10 20 30 40 50
Slab ID
Tens
ion
(dyn
e/cm
)
0.82 wt % (12.68 ± 2.84 dyne/cm)
Tension profile
6.76 wt % (37.81 ± 9.35 dyne/cm)
Tension Profile(Pn-Pt)*slab_thickness
C16_4_8/C10_30/H2O_200NPT MD at 299.15 K
-100
0
0
0
0
-50 -40 -30 -20 -10 0 10 20 30 40 50
Slab ID
Tens
ion
(dyn
e/cm
)
20
15
10
50
-50
3.31 wt % (27.45 ± 4.96 dyne/cm)
1.64 wt % (22.99 ± 3.16 dyne/cm)Tension Profile 02032003
(Pn-Pt)*slab_thicknessC16_4_8/NaCl_1/C10_30/H2O_198
NPT MD at 299.15 K
-100
-50
0
50
100
150
200
-50 -40 -30 -20 -10 0 10 20 30 40 50
Slab ID
Tens
ion
(dyn
e/cm
)
Tension Profile average(Pn-Pt)*slab_thickness
C16_4_8/NaCl_2/C10_30/H2O_196NPT MD at 299.15 K
-100
-50
100
150
200
-50 -40 -30 -20 -10 0 10 20 30 40 50
Slab ID
Tens
ion
(dyn
e/cm
)
50
0
Tension Profile avg(Pn-Pt)*slab_thickness
C16_4_8/NaCl_4/C10_30/H2O_200NPT MD at 299.15 K
-100
-50
0
50
100
150
200
-50 -40 -30 -20 -10 0 10 20 30 40 50
Slab ID
Tens
ion
(dyn
e/cm
)
0.82 wt % (12.68 ± 2.84 dyne/cm)
Tension profile
44
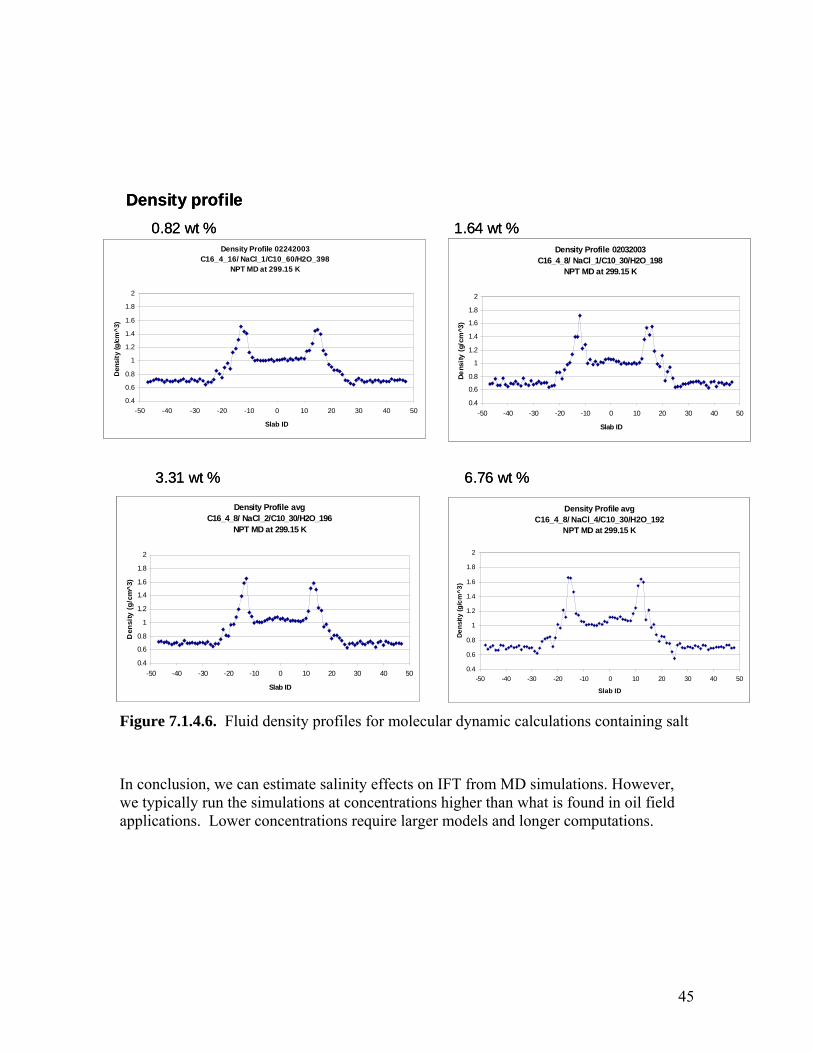
Figure 7.1.4.6. Fluid density profiles for molecular dynamic calculations containing salt
In conclusion, we can estimate salinity effects on IFT from MD simulations. However, we typically run the simulations at concentrations higher than what is found in oil field applications. Lower concentrations require larger models and longer computations.
Density Profile 02032003C16_4_8/ NaCl_1/C10_30/H2O_198
NPT MD at 299.15 K
0.4
0.6
0.8
1
1.2
1.4
1.6
1.8
2
-50 -40 -30 -20 -10 0 10 20 30 40 50
Slab ID
Dens
ity (
g/cm
^3)
Density Profile avgC16_4_8/ NaCl_2/C10_30/H2O_196
NPT MD at 299.15 K
0.4
0.6
0.8
1
1.2
1.4
1.6
1.8
2
-50 -40 -30 -20 -10 0 10 20 30 40 50
Slab ID
Den
sity
(g/
cm^3
)
Density Profile avgC16_4_8/ NaCl_4/C10_30/H2O_192
NPT MD at 299.15 K
0.4
0.6
0.8
1
1.2
1.4
1.6
1.8
2
-50 -40 -30 -20 -10 0 10 20 30 40 50
Slab ID
Dens
ity (g
/cm
^3)
Density Profile 02242003C16_4_16/ NaCl_1/C10_60/H2O_398
NPT MD at 299.15 K
1
2
-50 -40 -30 -20 -10 0 10 20 30 40 50
Slab ID
Den
sity
(g/c
m^3
)
0.4
0.6
0.8
1.2
1.4
1.6
1.8
0.82 wt % 1.64 wt %
3.31 wt % 6.76 wt %
ensity profileD
Density Profile 02032003C16_4_8/ NaCl_1/C10_30/H2O_198
NPT MD at 299.15 K
0.4
0.6
0.8
1
1.2
1.4
1.6
1.8
2
-50 -40 -30 -20 -10 0 10 20 30 40 50
Slab ID
Dens
ity (
g/cm
^3)
Density Profile avgC16_4_8/ NaCl_2/C10_30/H2O_196
NPT MD at 299.15 K
0.4
0.6
0.8
1
1.2
1.4
1.6
1.8
2
-50 -40 -30 -20 -10 0 10 20 30 40 50
Slab ID
nD
esi
ty (
g/cm
^3)
Density Profile avgC16_4_8/ NaCl_4/C10_30/H2O_192
NPT MD at 299.15 K
0.4
0.6
0.8
1
1.2
1.4
1.6
1.8
2
-50 -40 -30 -20 -10 0 10 20 30 40 50
Slab ID
Dens
ity (g
/cm
^3)
Density Profile 02242003C16_4_16/ NaCl_1/C10_60/H2O_398
NPT MD at 299.15 K
1
2
-50 -40 -30 -20 -10 0 10 20 30 40 50
Slab ID
Den
sity
(g/c
m^3
)
0.4
0.6
0.8
1.2
1.4
1.6
1.8
0.82 wt % 1.64 wt %
3.31 wt % 6.76 wt %
ensity profileD
45
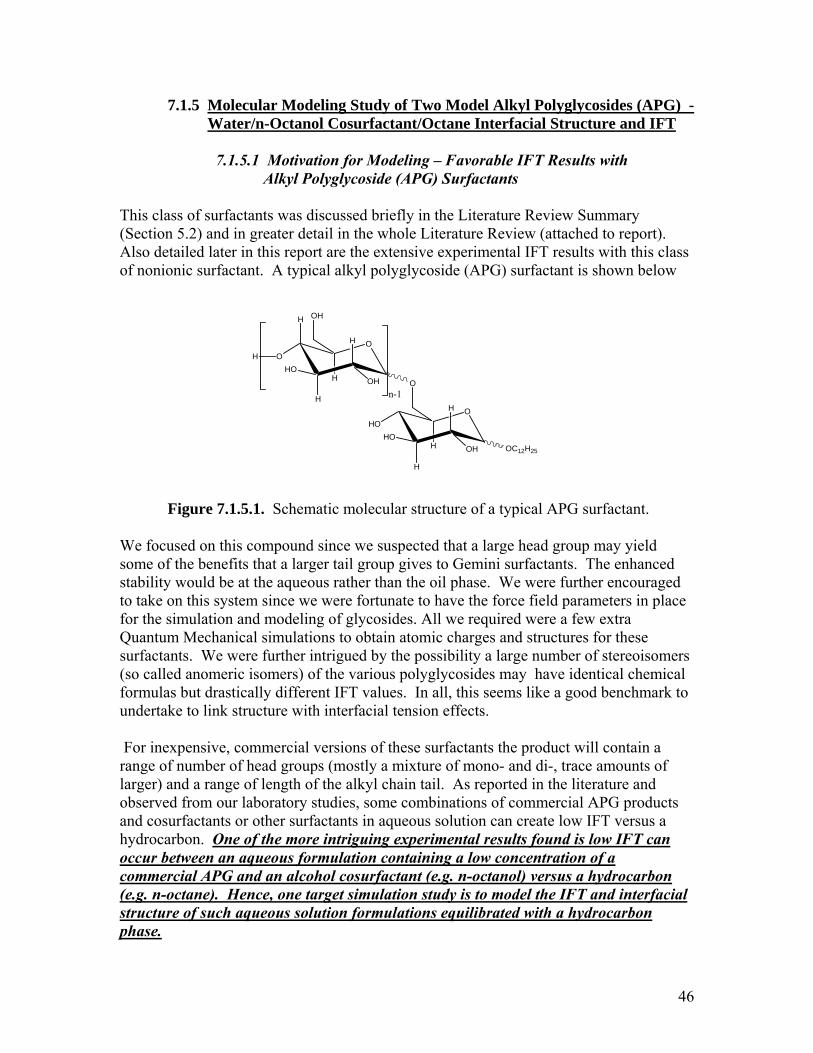
7.1.5 Molecular Modeling Study of Two Model Alkyl Polyglycosides (APG) - Water/n-Octanol Cosurfactant/Octane Interfacial Structure and IFT
7.1.5.1 Motivation for Modeling – Favorable IFT Results with Alkyl Polyglycoside (APG) Surfactants
This class of surfactants was discussed briefly in the Literature Review Summary (Section 5.2) and in greater detail in the whole Literature Review (attached to report). Also detailed later in this report are the extensive experimental IFT results with this class of nonionic surfactant. A typical alkyl polyglycoside (APG) surfactant is shown below
O
H
O
H
HO
H
OHH
OH
H
OHO
H
HO
H
OHH
O
OC12H25
n-1
Figure 7.1.5.1. Schematic molecular structure of a typical APG surfactant. We focused on this compound since we suspected that a large head group may yield some of the benefits that a larger tail group gives to Gemini surfactants. The enhanced stability would be at the aqueous rather than the oil phase. We were further encouraged to take on this system since we were fortunate to have the force field parameters in place for the simulation and modeling of glycosides. All we required were a few extra Quantum Mechanical simulations to obtain atomic charges and structures for these surfactants. We were further intrigued by the possibility a large number of stereoisomers (so called anomeric isomers) of the various polyglycosides may have identical chemical formulas but drastically different IFT values. In all, this seems like a good benchmark to undertake to link structure with interfacial tension effects. For inexpensive, commercial versions of these surfactants the product will contain a range of number of head groups (mostly a mixture of mono- and di-, trace amounts of larger) and a range of length of the alkyl chain tail. As reported in the literature and observed from our laboratory studies, some combinations of commercial APG products and cosurfactants or other surfactants in aqueous solution can create low IFT versus a hydrocarbon. One of the more intriguing experimental results found is low IFT can occur between an aqueous formulation containing a low concentration of a commercial APG and an alcohol cosurfactant (e.g. n-octanol) versus a hydrocarbon (e.g. n-octane). Hence, one target simulation study is to model the IFT and interfacial structure of such aqueous solution formulations equilibrated with a hydrocarbon phase.
46
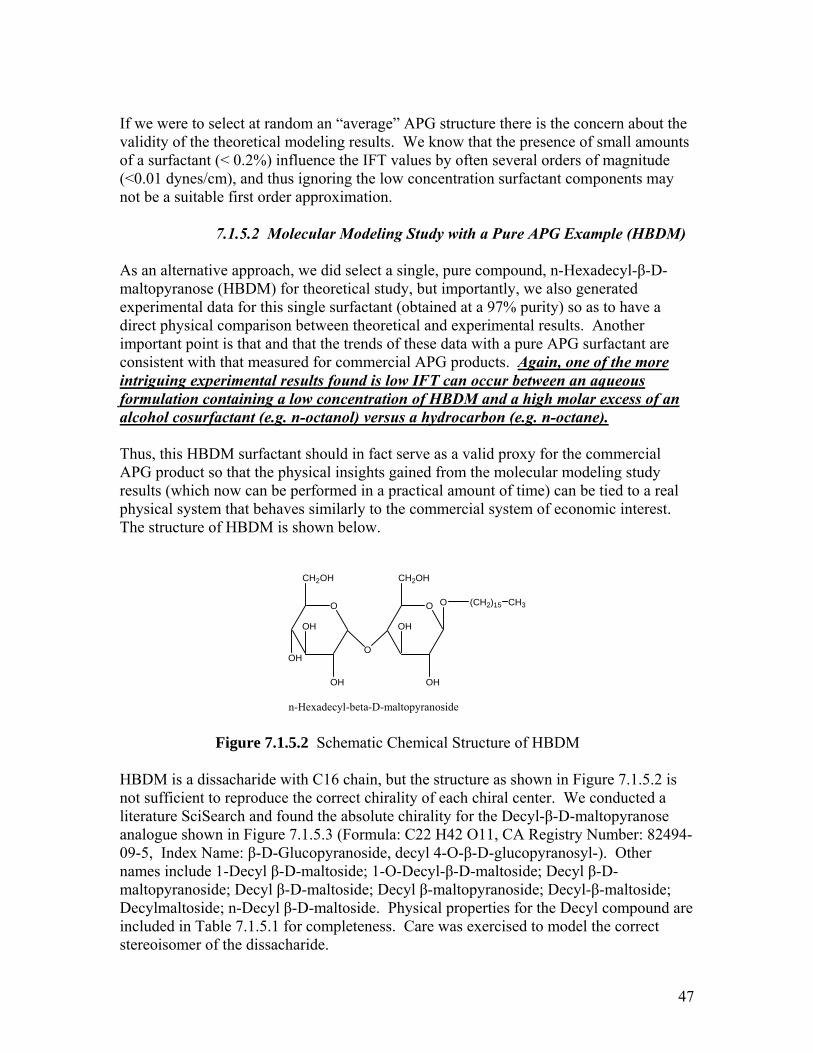
If we were to select at random an “average” APG structure there is the concern about the validity of the theoretical modeling results. We know that the presence of small amounts of a surfactant (< 0.2%) influence the IFT values by often several orders of magnitude (<0.01 dynes/cm), and thus ignoring the low concentration surfactant components may not be a suitable first order approximation. 7.1.5.2 Molecular Modeling Study with a Pure APG Example (HBDM) As an alternative approach, we did select a single, pure compound, n-Hexadecyl-β-D-maltopyranose (HBDM) for theoretical study, but importantly, we also generated experimental data for this single surfactant (obtained at a 97% purity) so as to have a direct physical comparison between theoretical and experimental results. Another important point is that and that the trends of these data with a pure APG surfactant are consistent with that measured for commercial APG products. Again, one of the more intriguing experimental results found is low IFT can occur between an aqueous formulation containing a low concentration of HBDM and a high molar excess of an alcohol cosurfactant (e.g. n-octanol) versus a hydrocarbon (e.g. n-octane). Thus, this HBDM surfactant should in fact serve as a valid proxy for the commercial APG product so that the physical insights gained from the molecular modeling study results (which now can be performed in a practical amount of time) can be tied to a real physical system that behaves similarly to the commercial system of economic interest. The structure of HBDM is shown below.
O
O
O
CH2OH
OH
OH
OH
CH2OH
OH
OH
O (CH2)15 CH3
n-Hexadecyl-beta-D-maltopyranoside
Figure 7.1.5.2 Schematic Chemical Structure of HBDM HBDM is a dissacharide with C16 chain, but the structure as shown in Figure 7.1.5.2 is not sufficient to reproduce the correct chirality of each chiral center. We conducted a literature SciSearch and found the absolute chirality for the Decyl-β-D-maltopyranose analogue shown in Figure 7.1.5.3 (Formula: C22 H42 O11, CA Registry Number: 82494-09-5, Index Name: β-D-Glucopyranoside, decyl 4-O-β-D-glucopyranosyl-). Other names include 1-Decyl β-D-maltoside; 1-O-Decyl-β-D-maltoside; Decyl β-D-maltopyranoside; Decyl β-D-maltoside; Decyl β-maltopyranoside; Decyl-β-maltoside; Decylmaltoside; n-Decyl β-D-maltoside. Physical properties for the Decyl compound are included in Table 7.1.5.1 for completeness. Care was exercised to model the correct stereoisomer of the dissacharide.
47
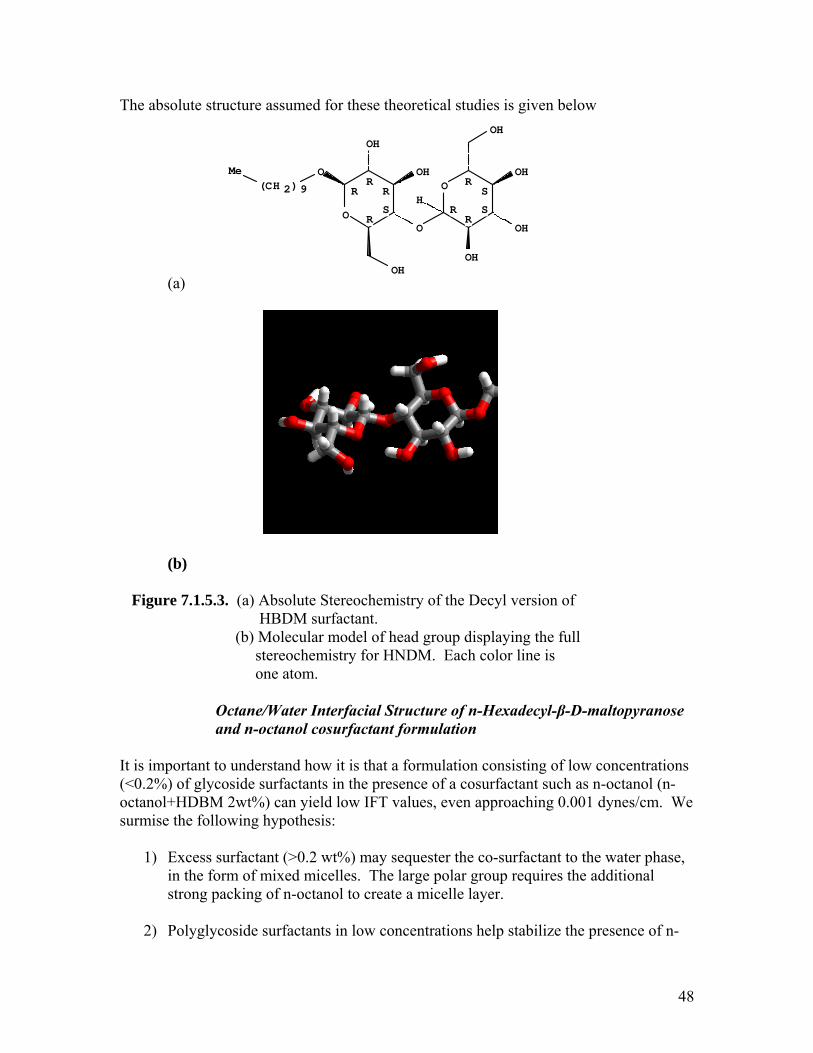
The absolute structure assumed for these theoretical studies is given below
(a)
(CH 2) 9
Me
O
O
O
OH
OHOH
OH
OH
O
OH
OH
HS R
R
R
R
R R
S
R S
(b)
Figure 7.1.5.3. (a) Absolute Stereochemistry of the Decyl version of HBDM surfactant. (b) Molecular model of head group displaying the full stereochemistry for HNDM. Each color line is one atom.
Octane/Water Interfacial Structure of n-Hexadecyl-β-D-maltopyranose and n-octanol cosurfactant formulation
It is important to understand how it is that a formulation consisting of low concentrations (<0.2%) of glycoside surfactants in the presence of a cosurfactant such as n-octanol (n-octanol+HDBM 2wt%) can yield low IFT values, even approaching 0.001 dynes/cm. We surmise the following hypothesis:
1) Excess surfactant (>0.2 wt%) may sequester the co-surfactant to the water phase, in the form of mixed micelles. The large polar group requires the additional strong packing of n-octanol to create a micelle layer.
2) Polyglycoside surfactants in low concentrations help stabilize the presence of n-
48
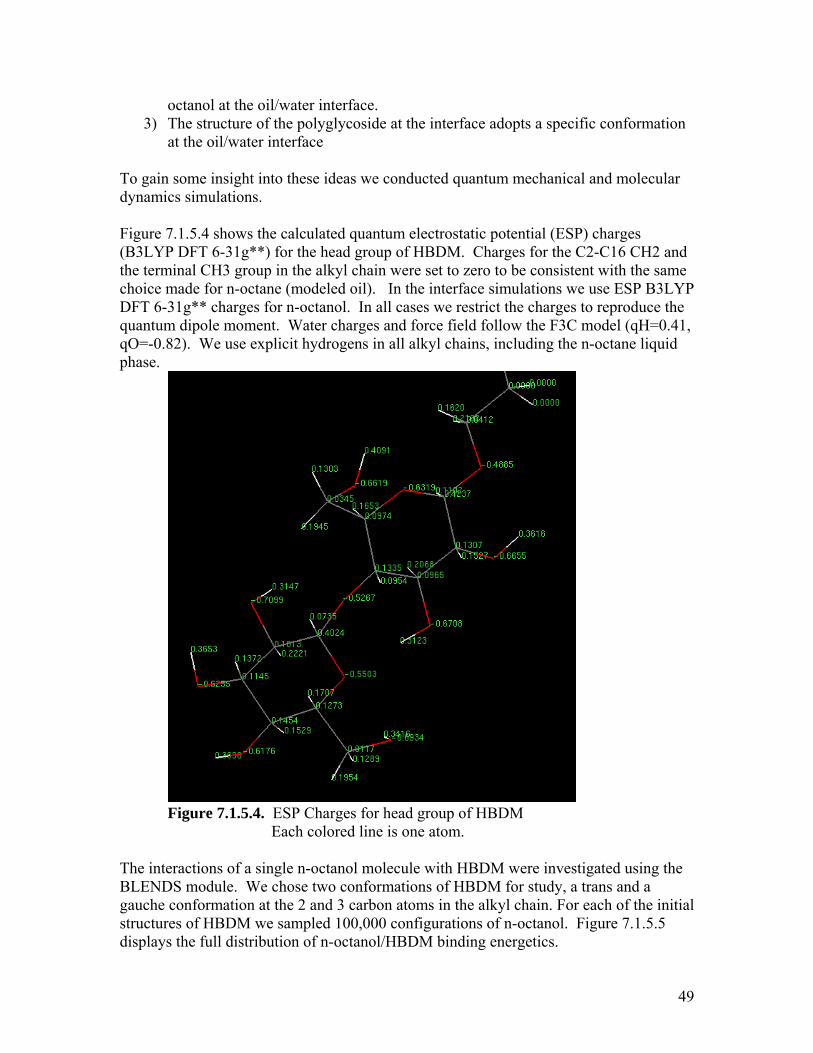
octanol at the oil/water interface. 3) The structure of the polyglycoside at the interface adopts a specific conformation
at the oil/water interface To gain some insight into these ideas we conducted quantum mechanical and molecular dynamics simulations. Figure 7.1.5.4 shows the calculated quantum electrostatic potential (ESP) charges (B3LYP DFT 6-31g**) for the head group of HBDM. Charges for the C2-C16 CH2 and the terminal CH3 group in the alkyl chain were set to zero to be consistent with the same choice made for n-octane (modeled oil). In the interface simulations we use ESP B3LYP DFT 6-31g** charges for n-octanol. In all cases we restrict the charges to reproduce the quantum dipole moment. Water charges and force field follow the F3C model (qH=0.41, qO=-0.82). We use explicit hydrogens in all alkyl chains, including the n-octane liquid phase.
Figure 7.1.5.4. ESP Charges for head group of HBDM
Each colored line is one atom. The interactions of a single n-octanol molecule with HBDM were investigated using the BLENDS module. We chose two conformations of HBDM for study, a trans and a gauche conformation at the 2 and 3 carbon atoms in the alkyl chain. For each of the initial structures of HBDM we sampled 100,000 configurations of n-octanol. Figure 7.1.5.5 displays the full distribution of n-octanol/HBDM binding energetics.
49
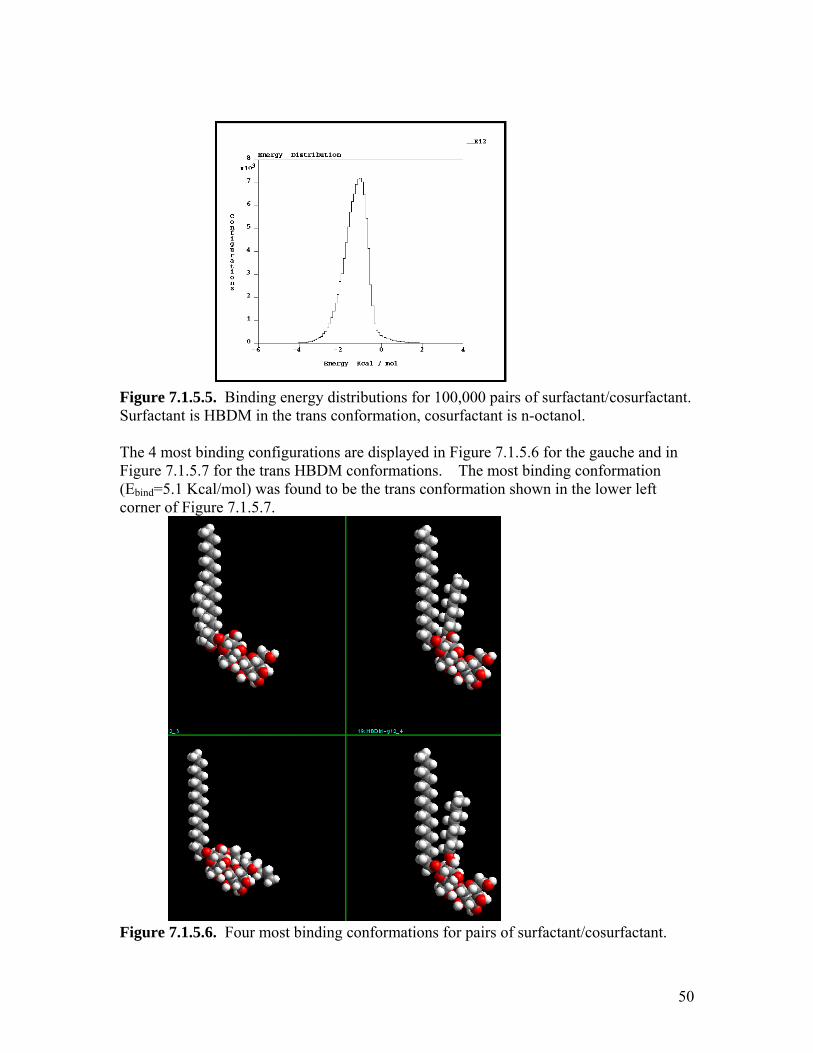
Figure 7.1.5.5. Binding energy distributions for 100,000 pairs of surfactant/cosurfactant. Surfactant is HBDM in the trans conformation, cosurfactant is n-octanol. The 4 most binding configurations are displayed in Figure 7.1.5.6 for the gauche and in Figure 7.1.5.7 for the trans HBDM conformations. The most binding conformation (Ebind=5.1 Kcal/mol) was found to be the trans conformation shown in the lower left corner of Figure 7.1.5.7.
Figure 7.1.5.6. Four most binding conformations for pairs of surfactant/cosurfactant.
50
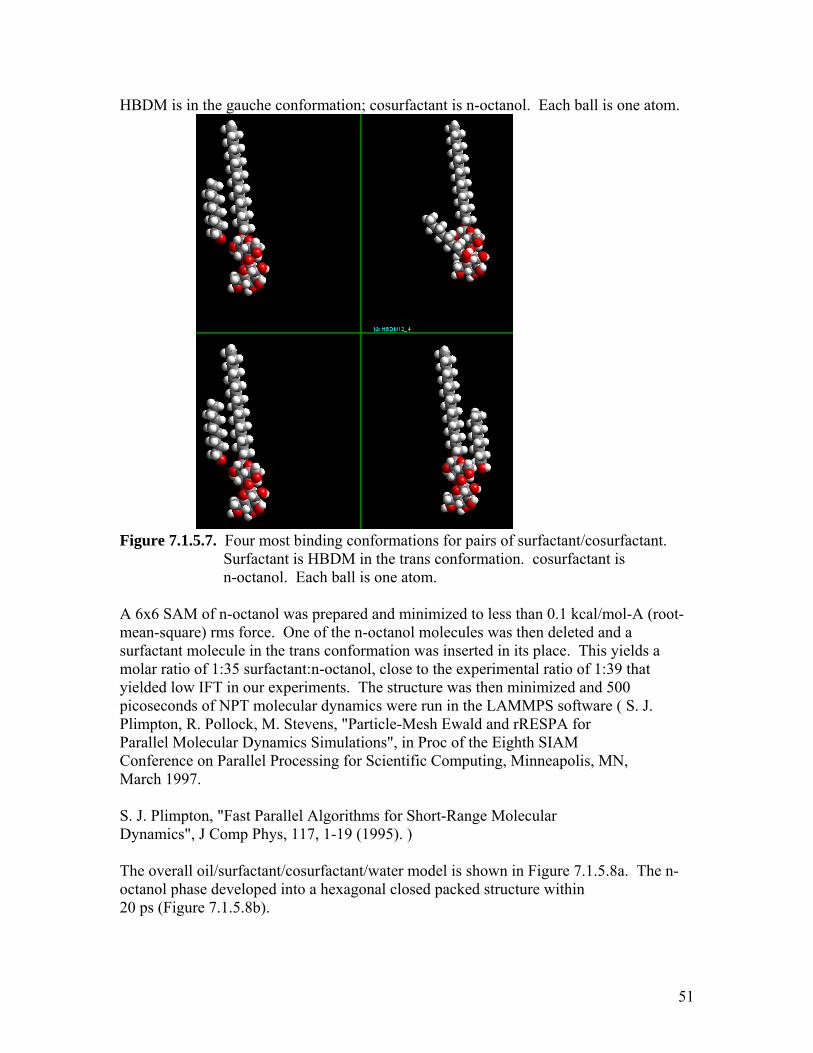
HBDM is in the gauche conformation; cosurfactant is n-octanol. Each ball is one atom.
Figure 7.1.5.7. Four most binding conformations for pairs of surfactant/cosurfactant. Surfactant is HBDM in the trans conformation. cosurfactant is n-octanol. Each ball is one atom. A 6x6 SAM of n-octanol was prepared and minimized to less than 0.1 kcal/mol-A (root-mean-square) rms force. One of the n-octanol molecules was then deleted and a surfactant molecule in the trans conformation was inserted in its place. This yields a molar ratio of 1:35 surfactant:n-octanol, close to the experimental ratio of 1:39 that yielded low IFT in our experiments. The structure was then minimized and 500 picoseconds of NPT molecular dynamics were run in the LAMMPS software ( S. J. Plimpton, R. Pollock, M. Stevens, "Particle-Mesh Ewald and rRESPA for Parallel Molecular Dynamics Simulations", in Proc of the Eighth SIAM Conference on Parallel Processing for Scientific Computing, Minneapolis, MN, March 1997. S. J. Plimpton, "Fast Parallel Algorithms for Short-Range Molecular Dynamics", J Comp Phys, 117, 1-19 (1995). ) The overall oil/surfactant/cosurfactant/water model is shown in Figure 7.1.5.8a. The n-octanol phase developed into a hexagonal closed packed structure within 20 ps (Figure 7.1.5.8b).
51
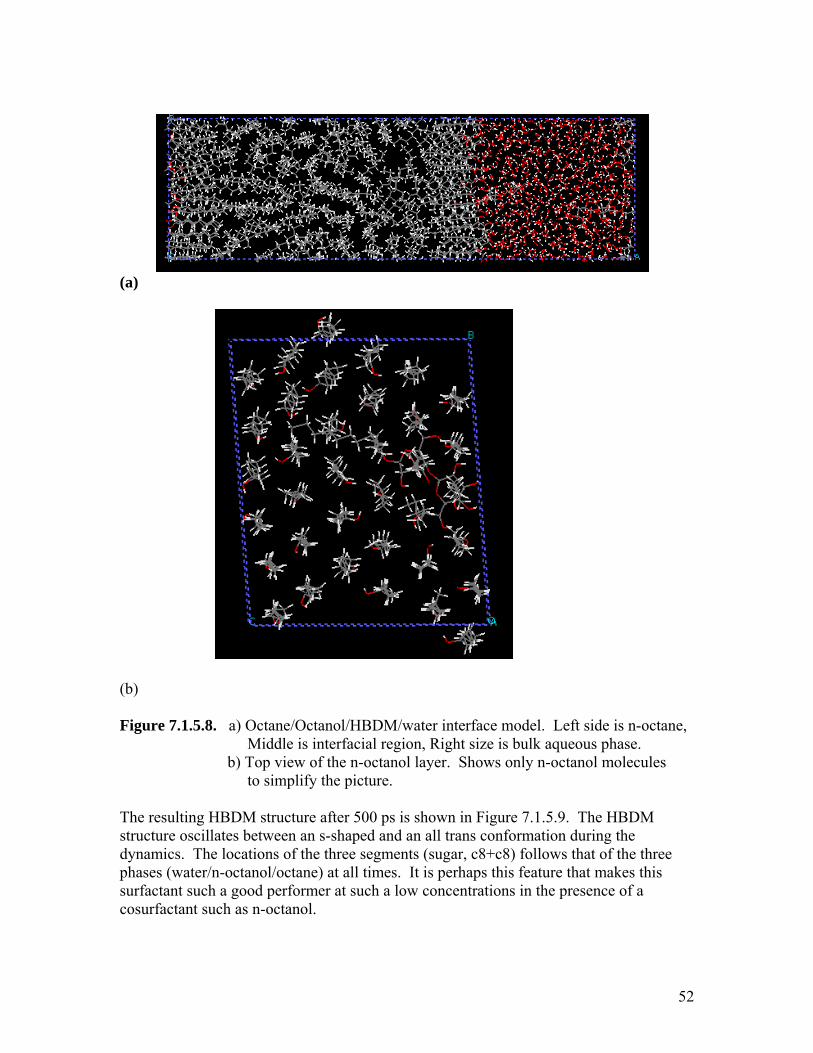
(a)
(b) Figure 7.1.5.8. a) Octane/Octanol/HBDM/water interface model. Left side is n-octane, Middle is interfacial region, Right size is bulk aqueous phase. b) Top view of the n-octanol layer. Shows only n-octanol molecules to simplify the picture. The resulting HBDM structure after 500 ps is shown in Figure 7.1.5.9. The HBDM structure oscillates between an s-shaped and an all trans conformation during the dynamics. The locations of the three segments (sugar, c8+c8) follows that of the three phases (water/n-octanol/octane) at all times. It is perhaps this feature that makes this surfactant such a good performer at such a low concentrations in the presence of a cosurfactant such as n-octanol.
52
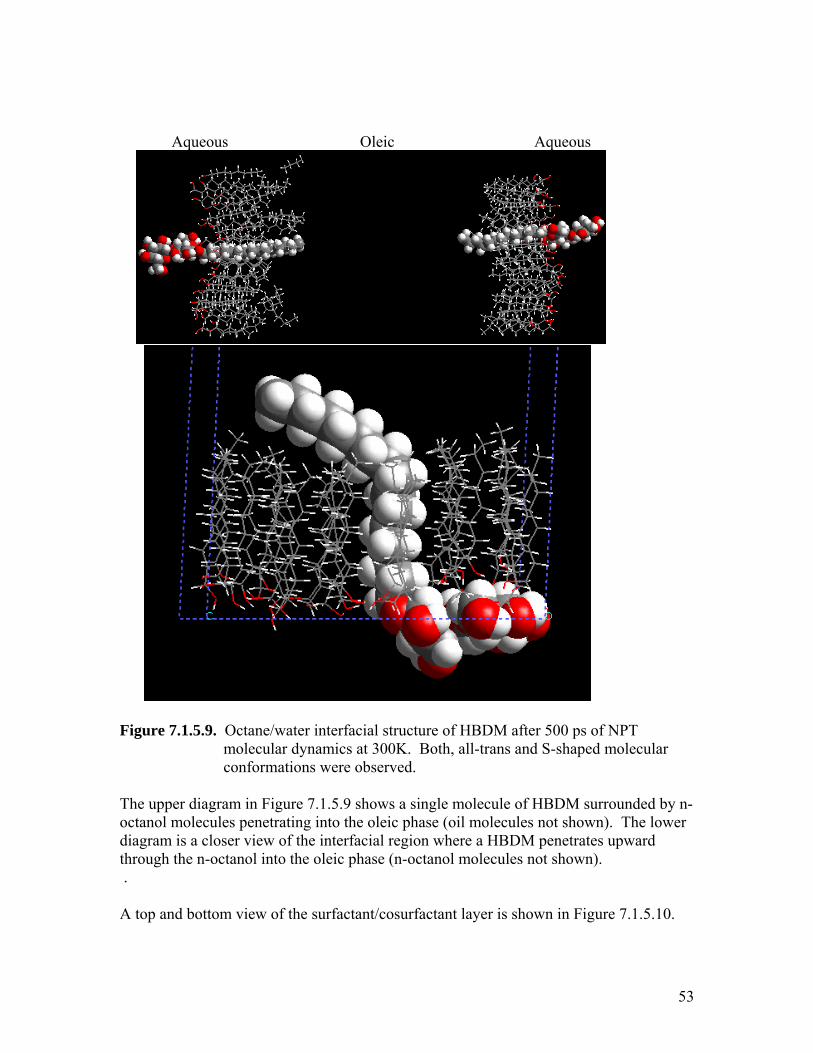
Aqueous Oleic Aqueous
Figure 7.1.5.9. Octane/water interfacial structure of HBDM after 500 ps of NPT molecular dynamics at 300K. Both, all-trans and S-shaped molecular conformations were observed. The upper diagram in Figure 7.1.5.9 shows a single molecule of HBDM surrounded by n-octanol molecules penetrating into the oleic phase (oil molecules not shown). The lower diagram is a closer view of the interfacial region where a HBDM penetrates upward through the n-octanol into the oleic phase (n-octanol molecules not shown). . A top and bottom view of the surfactant/cosurfactant layer is shown in Figure 7.1.5.10.
53
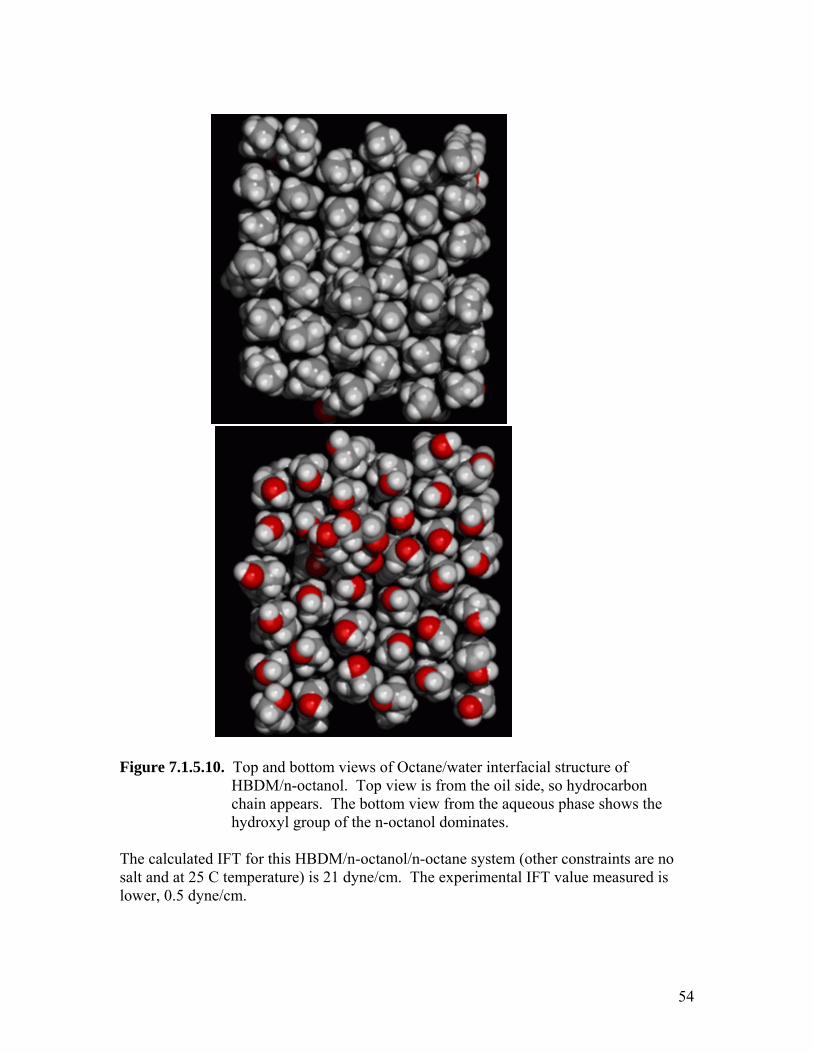
Figure 7.1.5.10. Top and bottom views of Octane/water interfacial structure of HBDM/n-octanol. Top view is from the oil side, so hydrocarbon chain appears. The bottom view from the aqueous phase shows the hydroxyl group of the n-octanol dominates. The calculated IFT for this HBDM/n-octanol/n-octane system (other constraints are no salt and at 25 C temperature) is 21 dyne/cm. The experimental IFT value measured is lower, 0.5 dyne/cm.
54
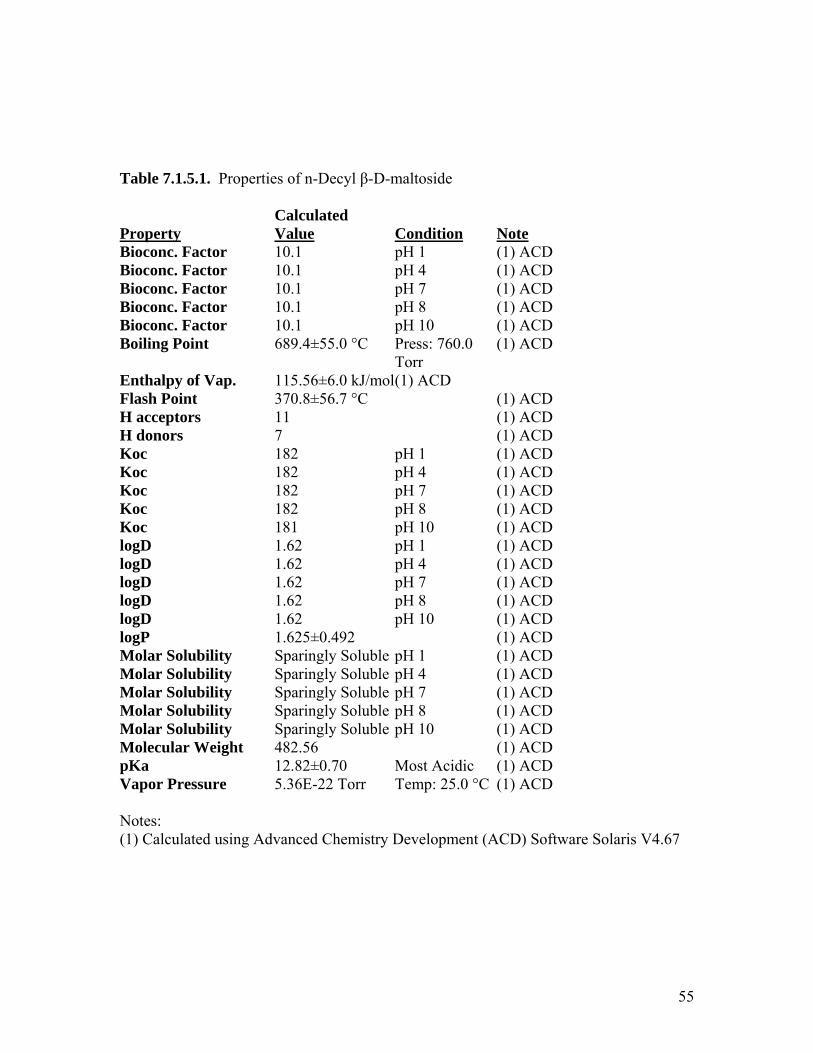
Table 7.1.5.1. Properties of n-Decyl β-D-maltoside Calculated Property Value Condition NoteBioconc. Factor 10.1 pH 1 (1) ACD Bioconc. Factor 10.1 pH 4 (1) ACD Bioconc. Factor 10.1 pH 7 (1) ACD Bioconc. Factor 10.1 pH 8 (1) ACD Bioconc. Factor 10.1 pH 10 (1) ACD Boiling Point 689.4±55.0 °C Press: 760.0 (1) ACD Torr Enthalpy of Vap. 115.56±6.0 kJ/mol (1) ACD Flash Point 370.8±56.7 °C (1) ACD H acceptors 11 (1) ACD H donors 7 (1) ACD Koc 182 pH 1 (1) ACD Koc 182 pH 4 (1) ACD Koc 182 pH 7 (1) ACD Koc 182 pH 8 (1) ACD Koc 181 pH 10 (1) ACD logD 1.62 pH 1 (1) ACD logD 1.62 pH 4 (1) ACD logD 1.62 pH 7 (1) ACD logD 1.62 pH 8 (1) ACD logD 1.62 pH 10 (1) ACD logP 1.625±0.492 (1) ACD Molar Solubility Sparingly Soluble pH 1 (1) ACD Molar Solubility Sparingly Soluble pH 4 (1) ACD Molar Solubility Sparingly Soluble pH 7 (1) ACD Molar Solubility Sparingly Soluble pH 8 (1) ACD Molar Solubility Sparingly Soluble pH 10 (1) ACD Molecular Weight 482.56 (1) ACD pKa 12.82±0.70 Most Acidic (1) ACD Vapor Pressure 5.36E-22 Torr Temp: 25.0 °C (1) ACD Notes: (1) Calculated using Advanced Chemistry Development (ACD) Software Solaris V4.67
55
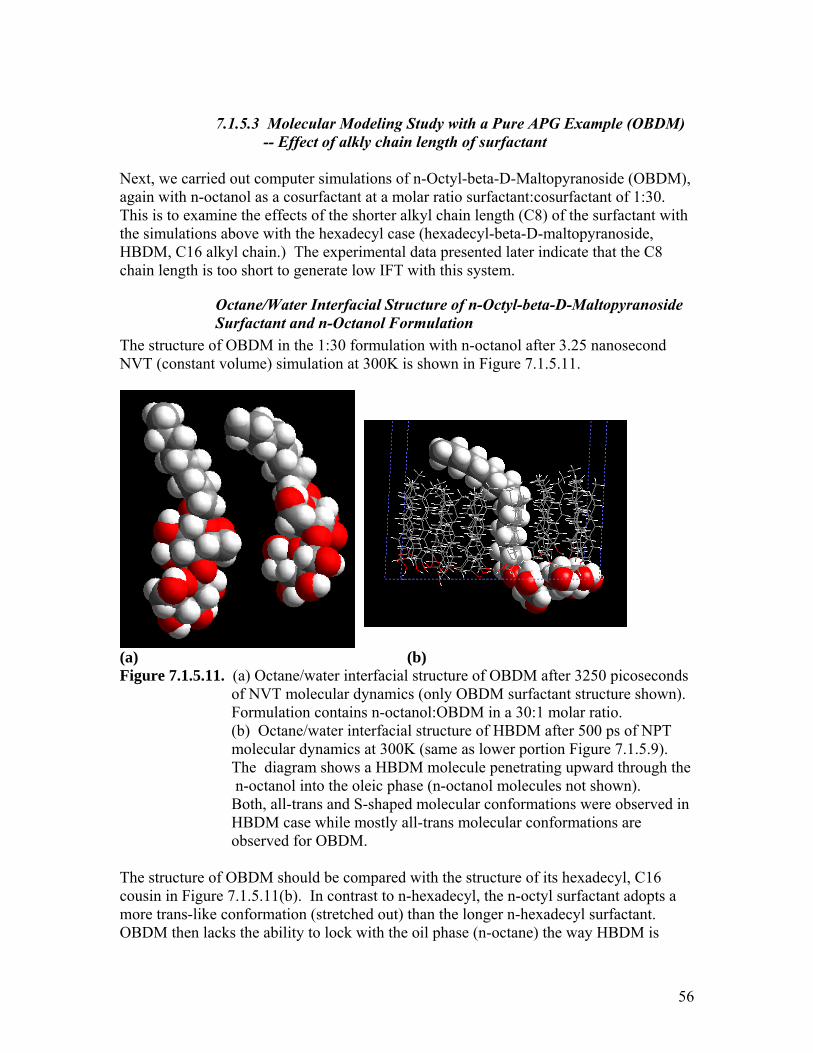
7.1.5.3 Molecular Modeling Study with a Pure APG Example (OBDM) -- Effect of alkly chain length of surfactant
Next, we carried out computer simulations of n-Octyl-beta-D-Maltopyranoside (OBDM), again with n-octanol as a cosurfactant at a molar ratio surfactant:cosurfactant of 1:30. This is to examine the effects of the shorter alkyl chain length (C8) of the surfactant with the simulations above with the hexadecyl case (hexadecyl-beta-D-maltopyranoside, HBDM, C16 alkyl chain.) The experimental data presented later indicate that the C8 chain length is too short to generate low IFT with this system.
Octane/Water Interfacial Structure of n-Octyl-beta-D-Maltopyranoside Surfactant and n-Octanol Formulation
The structure of OBDM in the 1:30 formulation with n-octanol after 3.25 nanosecond NVT (constant volume) simulation at 300K is shown in Figure 7.1.5.11. (a) (b) Figure 7.1.5.11. (a) Octane/water interfacial structure of OBDM after 3250 picoseconds of NVT molecular dynamics (only OBDM surfactant structure shown). Formulation contains n-octanol:OBDM in a 30:1 molar ratio. (b) Octane/water interfacial structure of HBDM after 500 ps of NPT
molecular dynamics at 300K (same as lower portion Figure 7.1.5.9). The diagram shows a HBDM molecule penetrating upward through the n-octanol into the oleic phase (n-octanol molecules not shown). Both, all-trans and S-shaped molecular conformations were observed in HBDM case while mostly all-trans molecular conformations are observed for OBDM.
The structure of OBDM should be compared with the structure of its hexadecyl, C16 cousin in Figure 7.1.5.11(b). In contrast to n-hexadecyl, the n-octyl surfactant adopts a more trans-like conformation (stretched out) than the longer n-hexadecyl surfactant. OBDM then lacks the ability to lock with the oil phase (n-octane) the way HBDM is
56
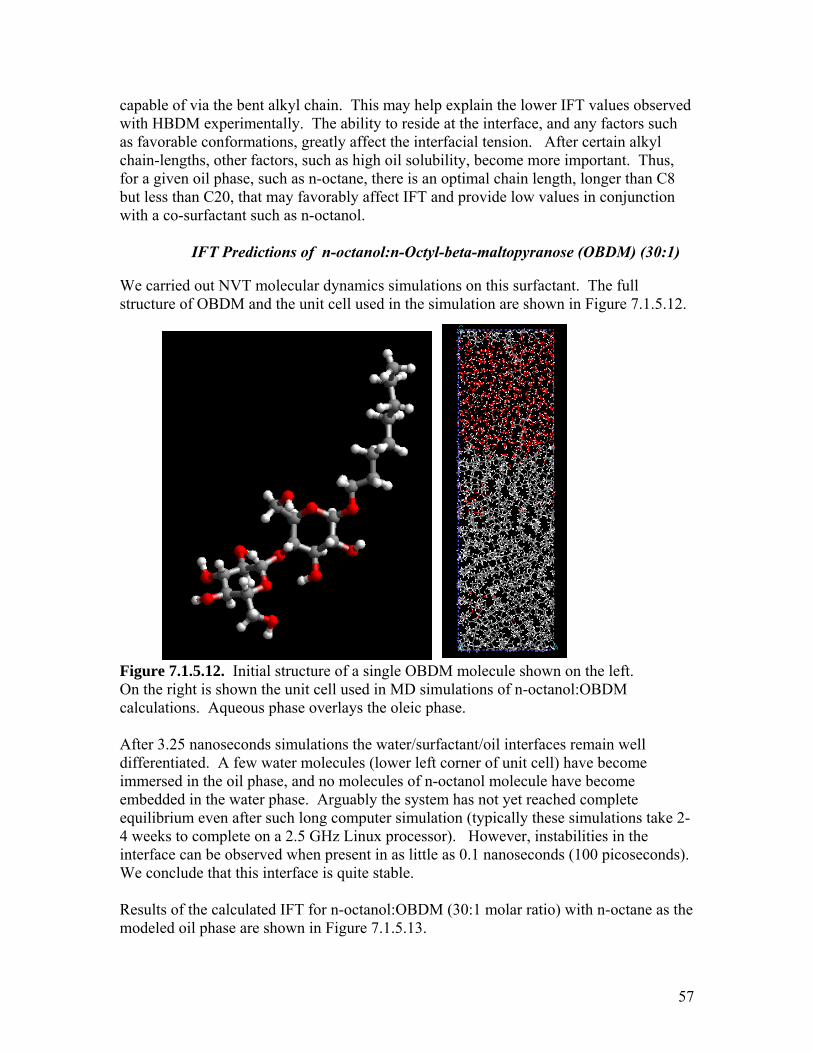
capable of via the bent alkyl chain. This may help explain the lower IFT values observed with HBDM experimentally. The ability to reside at the interface, and any factors such as favorable conformations, greatly affect the interfacial tension. After certain alkyl chain-lengths, other factors, such as high oil solubility, become more important. Thus, for a given oil phase, such as n-octane, there is an optimal chain length, longer than C8 but less than C20, that may favorably affect IFT and provide low values in conjunction with a co-surfactant such as n-octanol.
IFT Predictions of n-octanol:n-Octyl-beta-maltopyranose (OBDM) (30:1) We carried out NVT molecular dynamics simulations on this surfactant. The full structure of OBDM and the unit cell used in the simulation are shown in Figure 7.1.5.12. Figure 7.1.5.12. Initial structure of a single OBDM molecule shown on the left. On the right is shown the unit cell used in MD simulations of n-octanol:OBDM calculations. Aqueous phase overlays the oleic phase. After 3.25 nanoseconds simulations the water/surfactant/oil interfaces remain well differentiated. A few water molecules (lower left corner of unit cell) have become immersed in the oil phase, and no molecules of n-octanol molecule have become embedded in the water phase. Arguably the system has not yet reached complete equilibrium even after such long computer simulation (typically these simulations take 2-4 weeks to complete on a 2.5 GHz Linux processor). However, instabilities in the interface can be observed when present in as little as 0.1 nanoseconds (100 picoseconds). We conclude that this interface is quite stable. Results of the calculated IFT for n-octanol:OBDM (30:1 molar ratio) with n-octane as the modeled oil phase are shown in Figure 7.1.5.13.
57
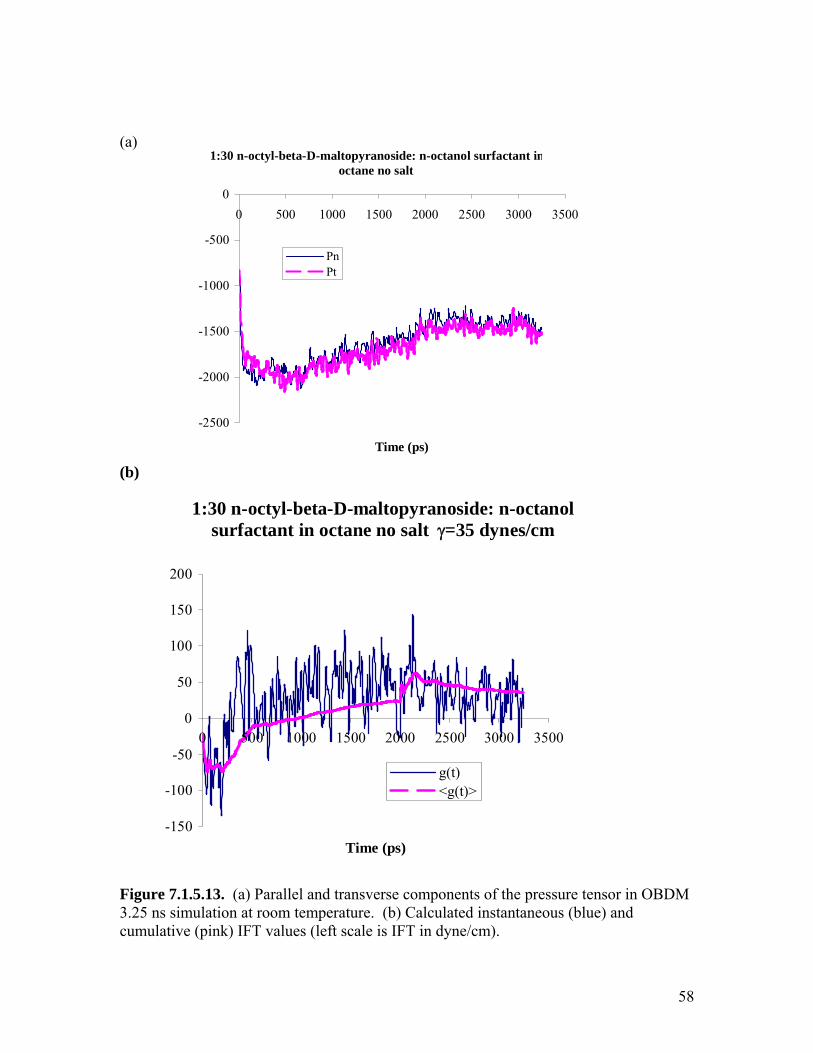
(a)
1:30 n-octyl-beta-D-maltopyranoside: n-octanol surfactant inoctane no salt
-2500
-2000
-1500
-1000
-500
00 500 1000 1500 2000 2500 3000 3500
Time (ps)
PnPt
(b)
1:30 n-octyl-beta-D-maltopyranoside: n-octanol surfactant in octane no salt γ=35 dynes/cm
-150
-100
-50
0
50
100
150
200
0 500 1000 1500 2000 2500 3000 3500
Time (ps)
g(t)<g(t)>
Figure 7.1.5.13. (a) Parallel and transverse components of the pressure tensor in OBDM 3.25 ns simulation at room temperature. (b) Calculated instantaneous (blue) and cumulative (pink) IFT values (left scale is IFT in dyne/cm).
58
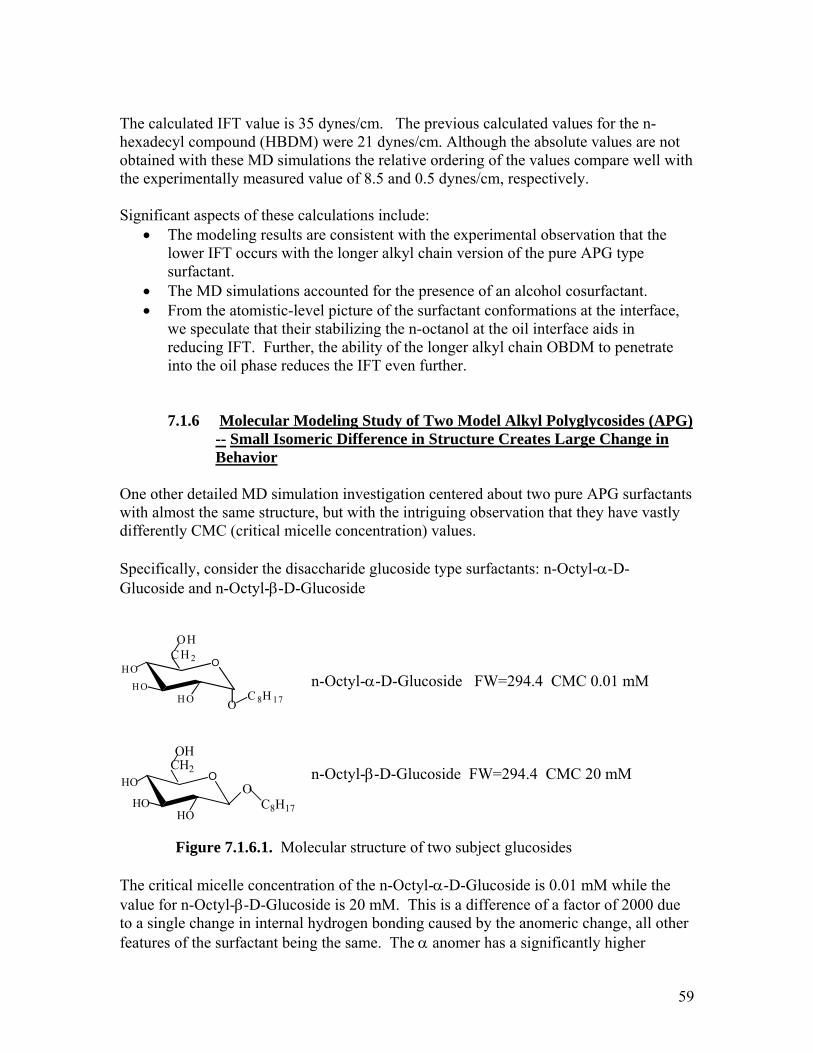
The calculated IFT value is 35 dynes/cm. The previous calculated values for the n-hexadecyl compound (HBDM) were 21 dynes/cm. Although the absolute values are not obtained with these MD simulations the relative ordering of the values compare well with the experimentally measured value of 8.5 and 0.5 dynes/cm, respectively. Significant aspects of these calculations include:
• The modeling results are consistent with the experimental observation that the lower IFT occurs with the longer alkyl chain version of the pure APG type surfactant.
• The MD simulations accounted for the presence of an alcohol cosurfactant. • From the atomistic-level picture of the surfactant conformations at the interface,
we speculate that their stabilizing the n-octanol at the oil interface aids in reducing IFT. Further, the ability of the longer alkyl chain OBDM to penetrate into the oil phase reduces the IFT even further.
7.1.6 Molecular Modeling Study of Two Model Alkyl Polyglycosides (APG) -- Small Isomeric Difference in Structure Creates Large Change in Behavior One other detailed MD simulation investigation centered about two pure APG surfactants with almost the same structure, but with the intriguing observation that they have vastly differently CMC (critical micelle concentration) values. Specifically, consider the disaccharide glucoside type surfactants: n-Octyl-α-D-Glucoside and n-Octyl-β-D-Glucoside n-Octyl-α-D-Glucoside FW=294.4 CMC 0.01 mM
OC H 2
OH
HOH O
8H 17H O OC
n-Octyl-β-D-Glucoside FW=294.4 CMC 20 mM O
CH2
OH
HOHO
OC8H17
HO
Figure 7.1.6.1. Molecular structure of two subject glucosides The critical micelle concentration of the n-Octyl-α-D-Glucoside is 0.01 mM while the value for n-Octyl-β-D-Glucoside is 20 mM. This is a difference of a factor of 2000 due to a single change in internal hydrogen bonding caused by the anomeric change, all other features of the surfactant being the same. The α anomer has a significantly higher
59
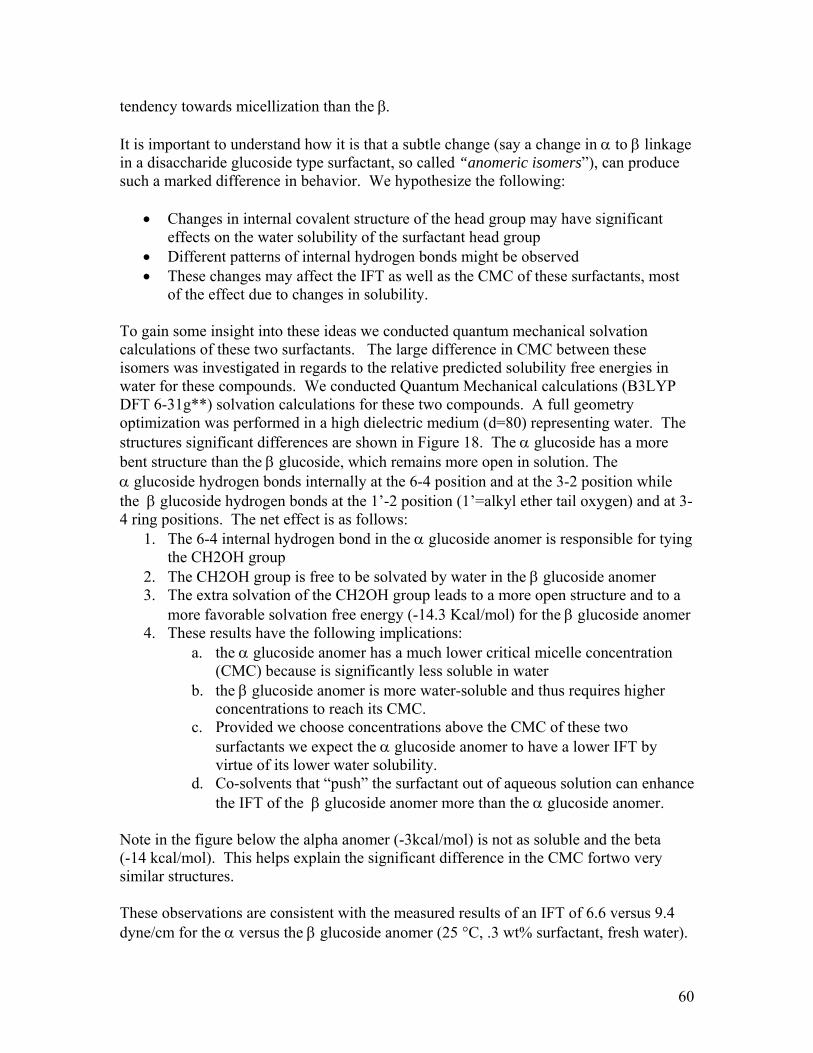
tendency towards micellization than the β. It is important to understand how it is that a subtle change (say a change in α to β linkage in a disaccharide glucoside type surfactant, so called “anomeric isomers”), can produce such a marked difference in behavior. We hypothesize the following:
• Changes in internal covalent structure of the head group may have significant effects on the water solubility of the surfactant head group
• Different patterns of internal hydrogen bonds might be observed • These changes may affect the IFT as well as the CMC of these surfactants, most
of the effect due to changes in solubility. To gain some insight into these ideas we conducted quantum mechanical solvation calculations of these two surfactants. The large difference in CMC between these isomers was investigated in regards to the relative predicted solubility free energies in water for these compounds. We conducted Quantum Mechanical calculations (B3LYP DFT 6-31g**) solvation calculations for these two compounds. A full geometry optimization was performed in a high dielectric medium (d=80) representing water. The structures significant differences are shown in Figure 18. The α glucoside has a more bent structure than the β glucoside, which remains more open in solution. The α glucoside hydrogen bonds internally at the 6-4 position and at the 3-2 position while the β glucoside hydrogen bonds at the 1’-2 position (1’=alkyl ether tail oxygen) and at 3-4 ring positions. The net effect is as follows:
1. The 6-4 internal hydrogen bond in the α glucoside anomer is responsible for tying the CH2OH group
2. The CH2OH group is free to be solvated by water in the β glucoside anomer 3. The extra solvation of the CH2OH group leads to a more open structure and to a
more favorable solvation free energy (-14.3 Kcal/mol) for the β glucoside anomer 4. These results have the following implications:
a. the α glucoside anomer has a much lower critical micelle concentration (CMC) because is significantly less soluble in water
b. the β glucoside anomer is more water-soluble and thus requires higher concentrations to reach its CMC.
c. Provided we choose concentrations above the CMC of these two surfactants we expect the α glucoside anomer to have a lower IFT by virtue of its lower water solubility.
d. Co-solvents that “push” the surfactant out of aqueous solution can enhance the IFT of the β glucoside anomer more than the α glucoside anomer.
Note in the figure below the alpha anomer (-3kcal/mol) is not as soluble and the beta (-14 kcal/mol). This helps explain the significant difference in the CMC fortwo very similar structures. These observations are consistent with the measured results of an IFT of 6.6 versus 9.4 dyne/cm for the α versus the β glucoside anomer (25 °C, .3 wt% surfactant, fresh water).
60

61
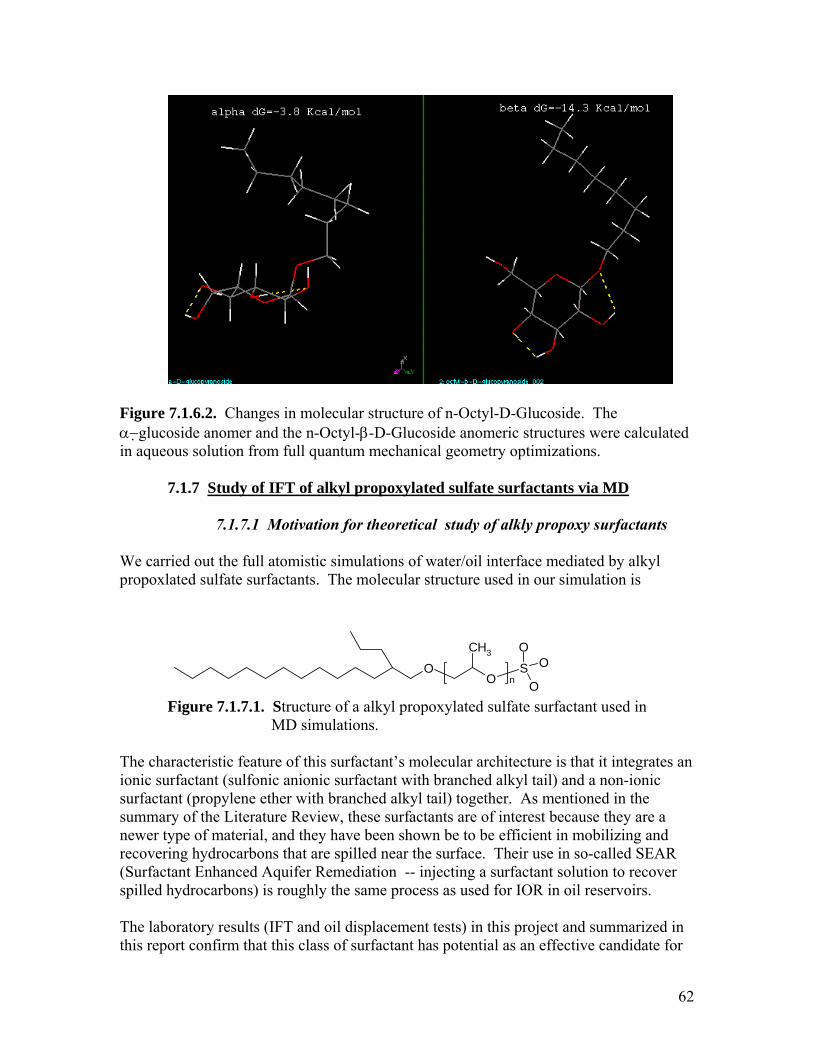
Figure 7.1.6.2. Changes in molecular structure of n-Octyl-D-Glucoside. The α− glucoside anomer and the n-Octyl-β-D-Glucoside anomeric structures were calculated in aqueous solution from full quantum mechanical geometry optimizations. 7.1.7 Study of IFT of alkyl propoxylated sulfate surfactants via MD 7.1.7.1 Motivation for theoretical study of alkly propoxy surfactants We carried out the full atomistic simulations of water/oil interface mediated by alkyl propoxlated sulfate surfactants. The molecular structure used in our simulation is
O
OS
O
O
OCH3
n
Figure 7.1.7.1. Structure of a alkyl propoxylated sulfate surfactant used in MD simulations.
The characteristic feature of this surfactant’s molecular architecture is that it integrates an ionic surfactant (sulfonic anionic surfactant with branched alkyl tail) and a non-ionic surfactant (propylene ether with branched alkyl tail) together. As mentioned in the summary of the Literature Review, these surfactants are of interest because they are a newer type of material, and they have been shown be to be efficient in mobilizing and recovering hydrocarbons that are spilled near the surface. Their use in so-called SEAR (Surfactant Enhanced Aquifer Remediation -- injecting a surfactant solution to recover spilled hydrocarbons) is roughly the same process as used for IOR in oil reservoirs. The laboratory results (IFT and oil displacement tests) in this project and summarized in this report confirm that this class of surfactant has potential as an effective candidate for
62
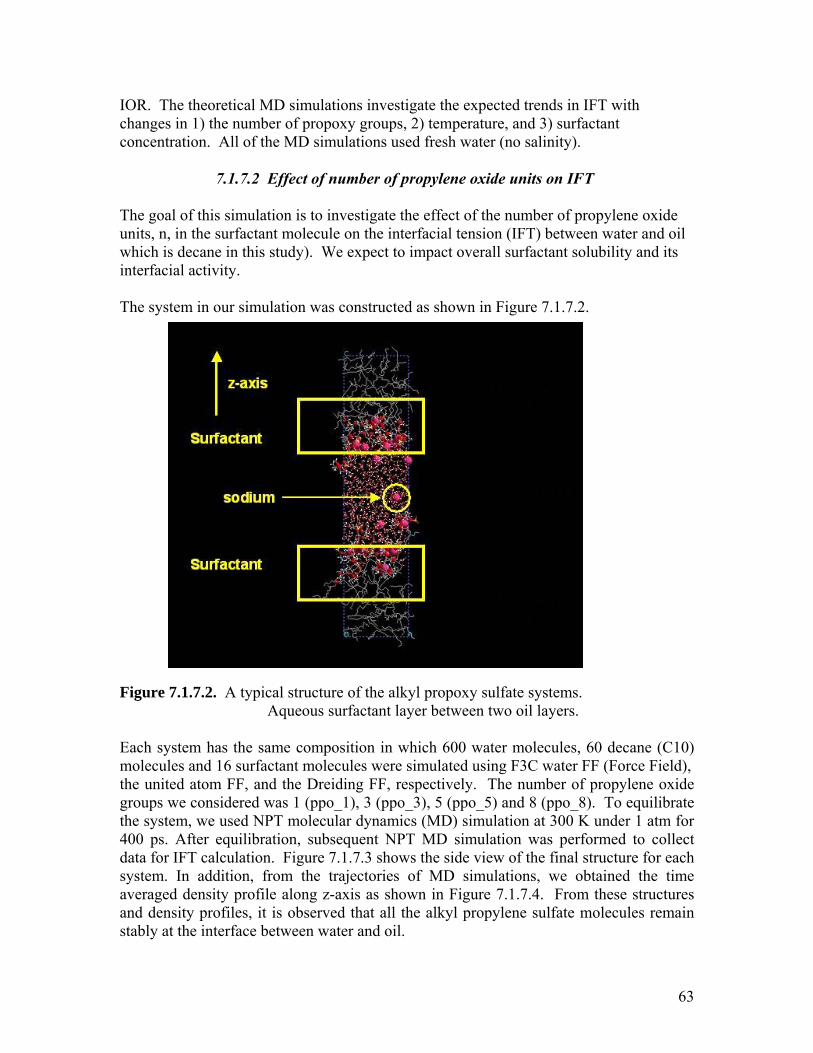
IOR. The theoretical MD simulations investigate the expected trends in IFT with changes in 1) the number of propoxy groups, 2) temperature, and 3) surfactant concentration. All of the MD simulations used fresh water (no salinity).
7.1.7.2 Effect of number of propylene oxide units on IFT
The goal of this simulation is to investigate the effect of the number of propylene oxide units, n, in the surfactant molecule on the interfacial tension (IFT) between water and oil which is decane in this study). We expect to impact overall surfactant solubility and its interfacial activity. The system in our simulation was constructed as shown in Figure 7.1.7.2.
Figure 7.1.7.2. A typical structure of the alkyl propoxy sulfate systems. Aqueous surfactant layer between two oil layers. Each system has the same composition in which 600 water molecules, 60 decane (C10) molecules and 16 surfactant molecules were simulated using F3C water FF (Force Field), the united atom FF, and the Dreiding FF, respectively. The number of propylene oxide groups we considered was 1 (ppo_1), 3 (ppo_3), 5 (ppo_5) and 8 (ppo_8). To equilibrate the system, we used NPT molecular dynamics (MD) simulation at 300 K under 1 atm for 400 ps. After equilibration, subsequent NPT MD simulation was performed to collect data for IFT calculation. Figure 7.1.7.3 shows the side view of the final structure for each system. In addition, from the trajectories of MD simulations, we obtained the time averaged density profile along z-axis as shown in Figure 7.1.7.4. From these structures and density profiles, it is observed that all the alkyl propylene sulfate molecules remain stably at the interface between water and oil.
63
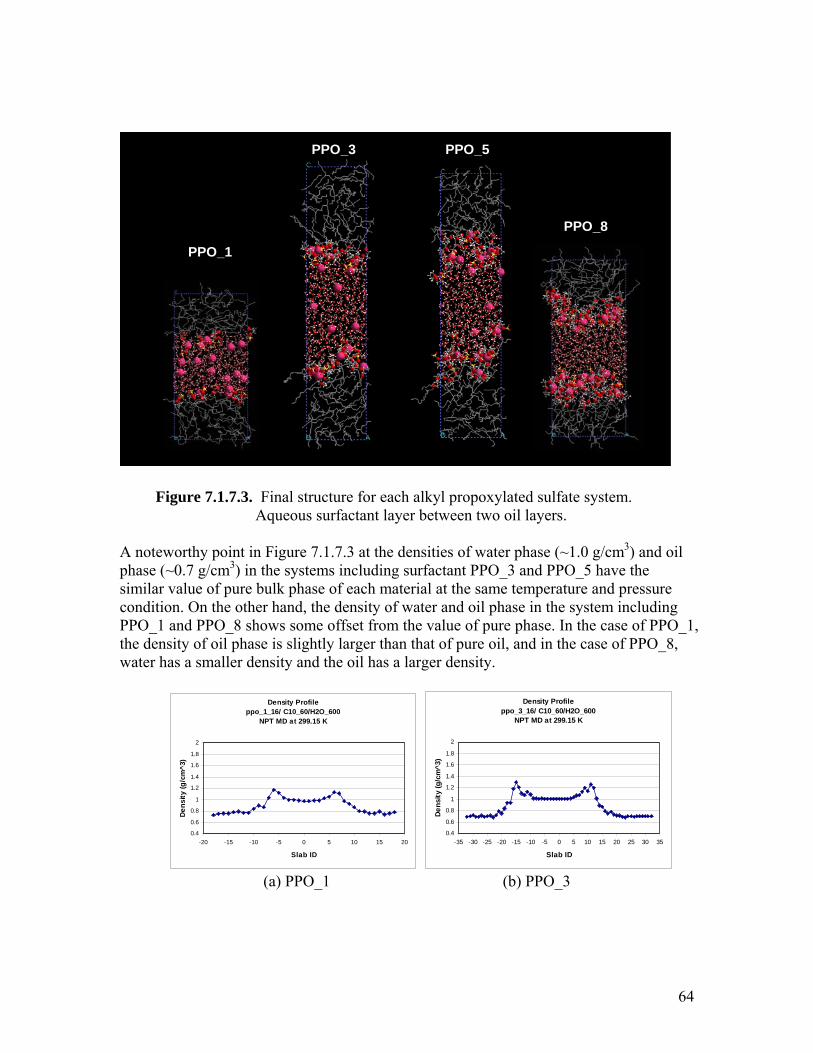
PPO_1
PPO_3 PPO_5
PPO_8
PPO_1
PPO_3 PPO_5
PPO_8
Figure 7.1.7.3. Final structure for each alkyl propoxylated sulfate system. Aqueous surfactant layer between two oil layers. A noteworthy point in Figure 7.1.7.3 at the densities of water phase (~1.0 g/cm3) and oil phase (~0.7 g/cm3) in the systems including surfactant PPO_3 and PPO_5 have the similar value of pure bulk phase of each material at the same temperature and pressure condition. On the other hand, the density of water and oil phase in the system including PPO_1 and PPO_8 shows some offset from the value of pure phase. In the case of PPO_1, the density of oil phase is slightly larger than that of pure oil, and in the case of PPO_8, water has a smaller density and the oil has a larger density.
Density Profileppo_1_16/ C10_60/H2O_600
NPT MD at 299.15 K
0.4
0.6
0.8
1
1.2
1.4
1.6
1.8
2
-20 -15 -10 -5 0 5 10 15 20
Slab ID
Dens
ity (g
/cm
^3)
Density Profileppo_3_16/ C10_60/H2O_600
NPT MD at 299.15 K
0.4
0.6
0.8
1
1.2
1.4
1.6
1.8
2
-35 -30 -25 -20 -15 -10 -5 0 5 10 15 20 25 30 35
Slab ID
Dens
ity (g
/cm
^3)
(a) PPO_1 (b) PPO_3
64
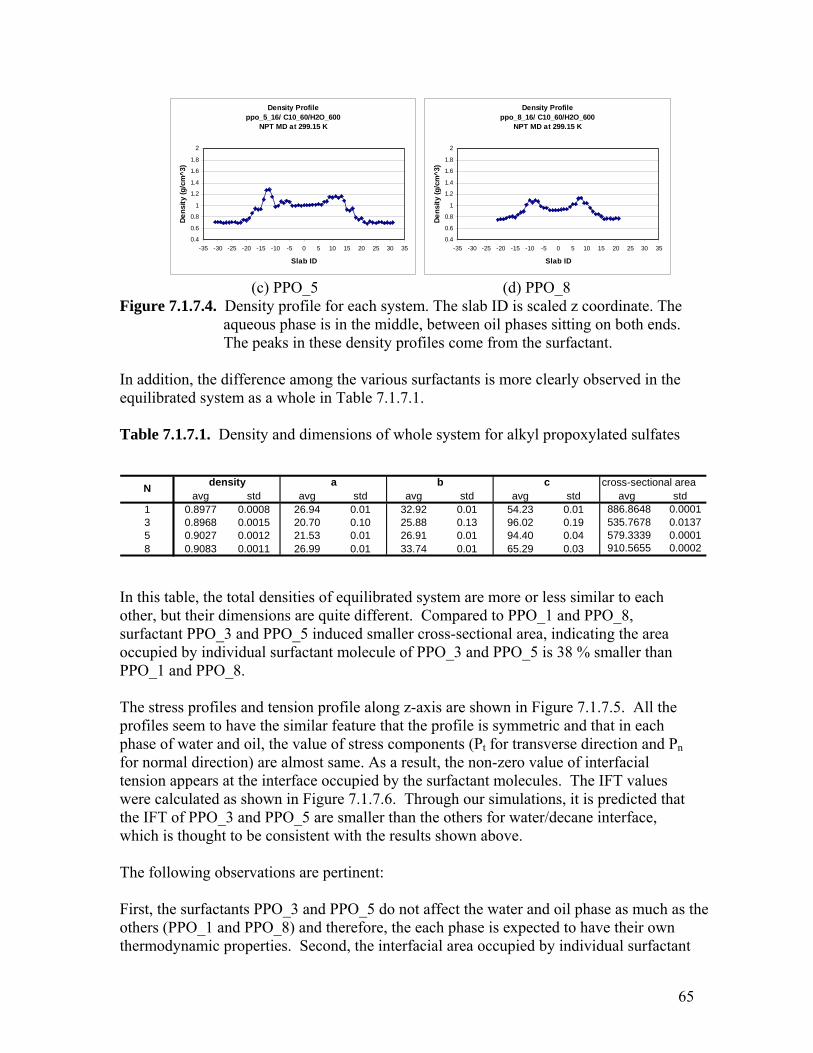
Density Profileppo_5_16/ C10_60/H2O_600
NPT MD at 299.15 K
0.4
0.6
0.8
1
1.2
1.4
1.6
1.8
2
-35 -30 -25 -20 -15 -10 -5 0 5 10 15 20 25 30 35
Slab ID
Dens
ity (g
/cm
^3)
Density Profileppo_8_16/ C10_60/H2O_600
NPT MD at 299.15 K
0.4
0.6
0.8
1
1.2
1.4
1.6
1.8
2
-35 -30 -25 -20 -15 -10 -5 0 5 10 15 20 25 30 35
Slab ID
Dens
ity (g
/cm
^3)
(c) PPO_5 (d) PPO_8 Figure 7.1.7.4. Density profile for each system. The slab ID is scaled z coordinate. The aqueous phase is in the middle, between oil phases sitting on both ends. The peaks in these density profiles come from the surfactant. In addition, the difference among the various surfactants is more clearly observed in the equilibrated system as a whole in Table 7.1.7.1. Table 7.1.7.1. Density and dimensions of whole system for alkyl propoxylated sulfates
avg std avg std avg std avg std avg std1 0.8977 0.0008 26.94 0.01 32.92 0.01 54.23 0.01 886.8648 0.00013 0.8968 0.0015 20.70 0.10 25.88 0.13 96.02 0.19 535.7678 0.01375 0.9027 0.0012 21.53 0.01 26.91 0.01 94.40 0.04 579.3339 0.00018 0.9083 0.0011 26.99 0.01 33.74 0.01 65.29 0.03 910.5655 0.0002
cross-sectional areacN density a b
In this table, the total densities of equilibrated system are more or less similar to each other, but their dimensions are quite different. Compared to PPO_1 and PPO_8, surfactant PPO_3 and PPO_5 induced smaller cross-sectional area, indicating the area occupied by individual surfactant molecule of PPO_3 and PPO_5 is 38 % smaller than PPO_1 and PPO_8. The stress profiles and tension profile along z-axis are shown in Figure 7.1.7.5. All the profiles seem to have the similar feature that the profile is symmetric and that in each phase of water and oil, the value of stress components (Pt for transverse direction and Pn for normal direction) are almost same. As a result, the non-zero value of interfacial tension appears at the interface occupied by the surfactant molecules. The IFT values were calculated as shown in Figure 7.1.7.6. Through our simulations, it is predicted that the IFT of PPO_3 and PPO_5 are smaller than the others for water/decane interface, which is thought to be consistent with the results shown above. The following observations are pertinent: First, the surfactants PPO_3 and PPO_5 do not affect the water and oil phase as much as the others (PPO_1 and PPO_8) and therefore, the each phase is expected to have their own thermodynamic properties. Second, the interfacial area occupied by individual surfactant
65
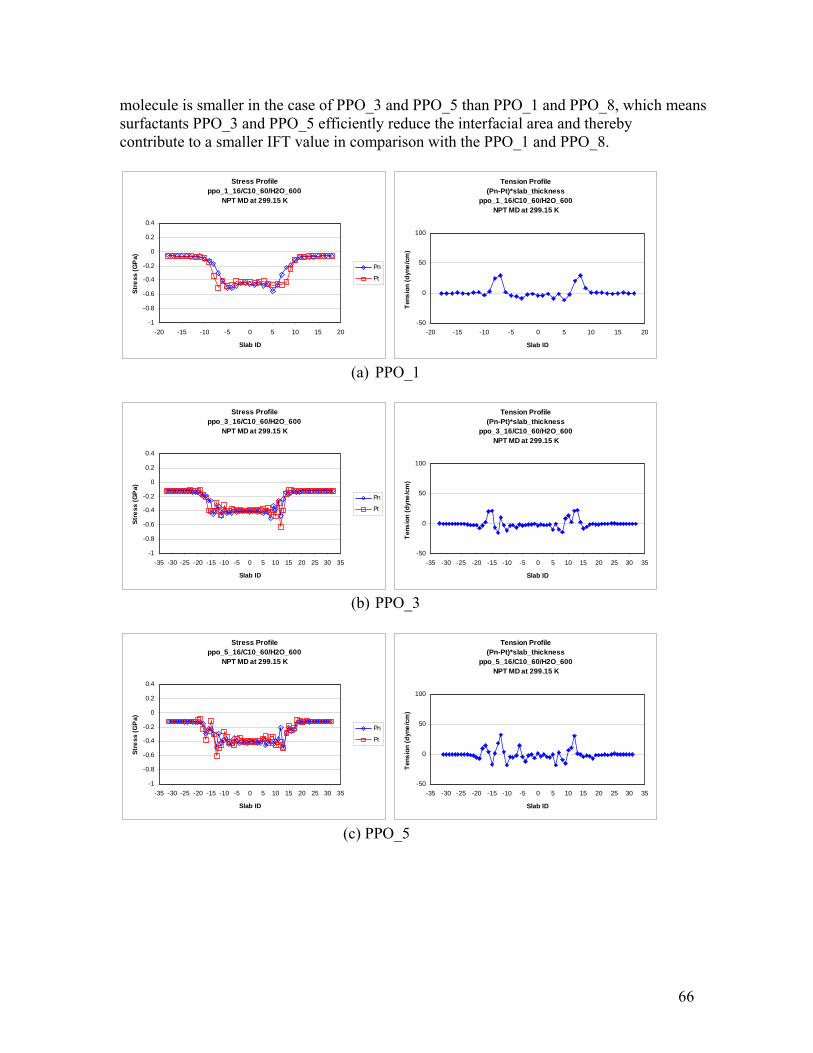
molecule is smaller in the case of PPO_3 and PPO_5 than PPO_1 and PPO_8, which means surfactants PPO_3 and PPO_5 efficiently reduce the interfacial area and thereby contribute to a smaller IFT value in comparison with the PPO_1 and PPO_8.
Stress Profileppo_1_16/C10_60/H2O_600
NPT MD at 299.15 K
-1
-0.8
-0.6
-0.4
-0.2
0
0.2
0.4
-20 -15 -10 -5 0 5 10 15 20
Slab ID
Stre
ss (G
Pa)
Pn
Pt
Tension Profile(Pn-Pt)*slab_thickness
ppo_1_16/C10_60/H2O_600NPT MD at 299.15 K
-50
0
50
100
-20 -15 -10 -5 0 5 10 15 20
Slab ID
Tens
ion
(dyn
e/cm
)
(a) PPO_1
Stress Profileppo_3_16/C10_60/H2O_600
NPT MD at 299.15 K
-1
-0.8
-0.6
-0.4
-0.2
0
0.2
0.4
-35 -30 -25 -20 -15 -10 -5 0 5 10 15 20 25 30 35
Slab ID
Stre
ss (G
Pa)
Pn
Pt
Tension Profile(Pn-Pt)*slab_thickness
ppo_3_16/C10_60/H2O_600NPT MD at 299.15 K
-50
0
50
100
-35 -30 -25 -20 -15 -10 -5 0 5 10 15 20 25 30 35
Slab ID
Tens
ion
(dyn
e/cm
)
(b) PPO_3
Stress Profileppo_5_16/C10_60/H2O_600
NPT MD at 299.15 K
-1
-0.8
-0.6
-0.4
-0.2
0
0.2
0.4
-35 -30 -25 -20 -15 -10 -5 0 5 10 15 20 25 30 35
Slab ID
Stre
ss (G
Pa)
Pn
Pt
Tension Profile(Pn-Pt)*slab_thickness
ppo_5_16/C10_60/H2O_600NPT MD at 299.15 K
-50
0
50
100
-35 -30 -25 -20 -15 -10 -5 0 5 10 15 20 25 30 35
Slab ID
Tens
ion
(dyn
e/cm
)
(c) PPO_5
66
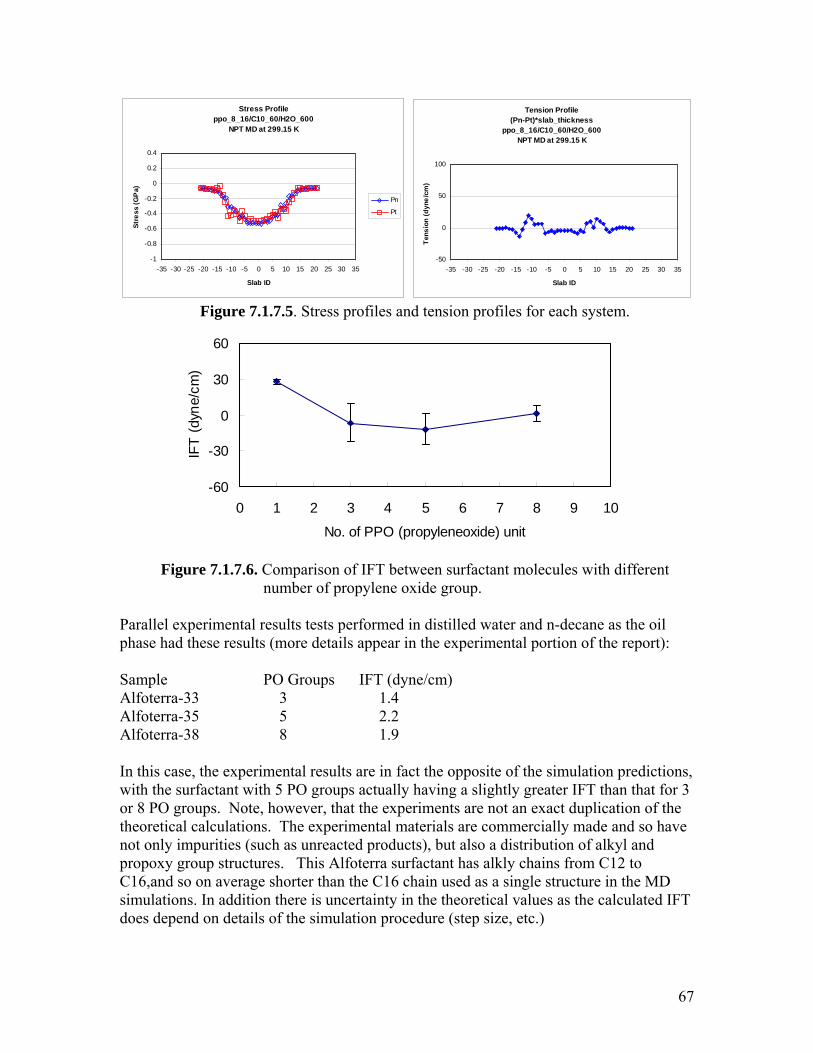
Stress Profileppo_8_16/C10_60/H2O_600
NPT MD at 299.15 K
-1
-0.8
-0.6
-0.4
-0.2
0
0.2
0.4
-35 -30 -25 -20 -15 -10 -5 0 5 10 15 20 25 30 35
Slab ID
Stre
ss (G
Pa)
Pn
Pt
Tension Profile(Pn-Pt)*slab_thickness
ppo_8_16/C10_60/H2O_600NPT MD at 299.15 K
-50
0
50
100
-35 -30 -25 -20 -15 -10 -5 0 5 10 15 20 25 30 35
Slab ID
Tens
ion
(dyn
e/cm
)
Figure 7.1.7.5. Stress profiles and tension profiles for each system.
-60
-30
0
30
60
0 1 2 3 4 5 6 7 8 9 10
No. of PPO (propyleneoxide) unit
IFT
(dyn
e/cm
)
Figure 7.1.7.6. Comparison of IFT between surfactant molecules with different
number of propylene oxide group. Parallel experimental results tests performed in distilled water and n-decane as the oil phase had these results (more details appear in the experimental portion of the report): Sample PO Groups IFT (dyne/cm) Alfoterra-33 3 1.4 Alfoterra-35 5 2.2 Alfoterra-38 8 1.9
this s, wi htly greater IFT than that for 3
r 8 PO groups. Note, however, that the experiments are not an exact duplication of the ve
ropoxy group structures. This Alfoterra surfactant has alkly chains from C12 to
n dditio re unce the theoretical values as the calculated IFT detail e mulation procedure (step size, etc.)
In case, the experimental results are in fact the opposite of the simulation prediction
th the surfactant with 5 PO groups actually having a sligotheoretical calculations. The experimental materials are commercially made and so hanot only impurities (such as unreacted products), but also a distribution of alkyl and pC16,and so on average shorter than the C16 chain used as a single structure in the MD simulations. I a n the is rtainty indoes depend on s of th si
67
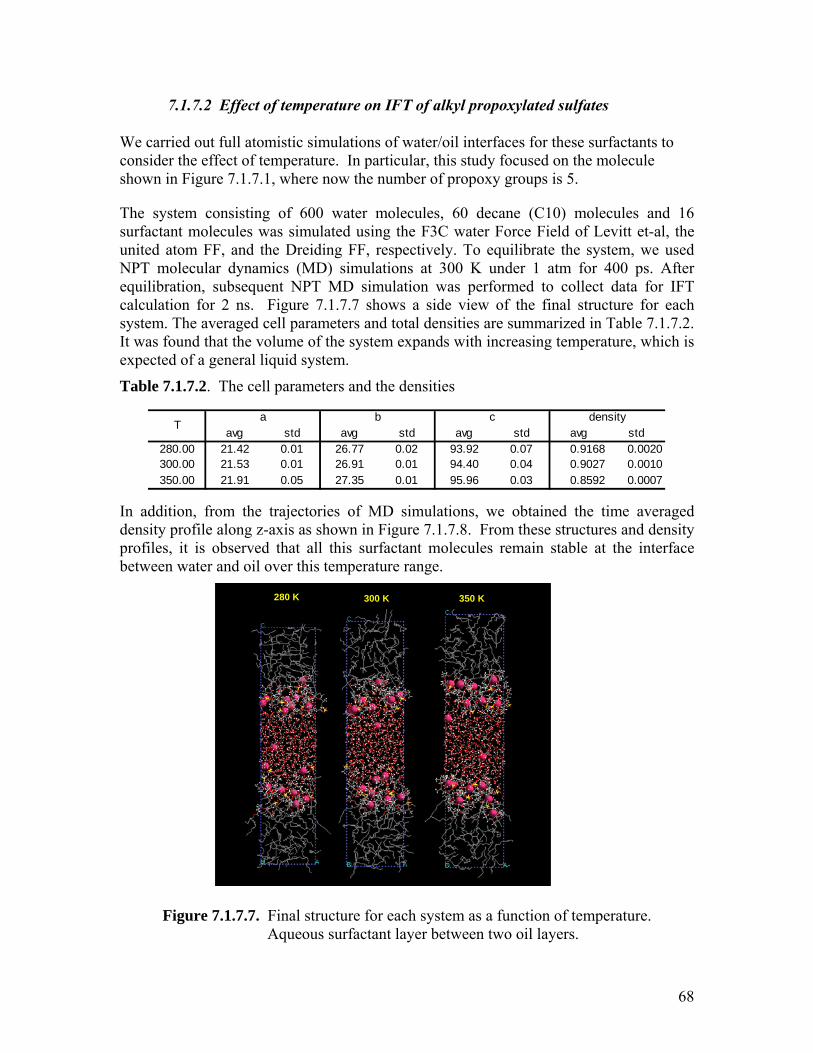
7.1.7.2 Effect of temperature on IFT of alkyl propoxylated sulfates
nd 16 he
m for 400 ps. After quilibration, subsequent NPT MD simulation was performed to collect data for IFT alcula re for each
system. The averaged cell parameters and total densities are summarized in Table 7.1.7.2. is
ature range.
We carried out full atomistic simulations of water/oil interfaces for these surfactants to consider the effect of temperature. In particular, this study focused on the molecule shown in Figure 7.1.7.1, where now the number of propoxy groups is 5.
The system consisting of 600 water molecules, 60 decane (C10) molecules asurfactant molecules was simulated using the F3C water Force Field of Levitt et-al, tunited atom FF, and the Dreiding FF, respectively. To equilibrate the system, we used NPT molecular dynamics (MD) simulations at 300 K under 1 atec tion for 2 ns. Figure 7.1.7.7 shows a side view of the final structu
It was found that the volume of the system expands with increasing temperature, which expected of a general liquid system.
Table 7.1.7.2. The cell parameters and the densities
In addition, from the trajectories of MD simulations, we obtained the time averaged density profile along z-axis as shown in Figure 7.1.7.8. From these structures and density profiles, it is observed that all this surfactant molecules remain stable at the interface between water and oil over this temper
280 K 300 K 350 K280 K 300 K 350 K
Figure 7.1.7.7. Final structure for each system as a function of temperature. Aqueous surfactant layer between two oil layers.
avg std avg std avg std avg std280.00 21.42 0.01 26.77 0.02 93.92 0.07 0.9168 0.0020300.00 21.53 0.01 26.91 0.01 94.40 0.04 0.9027 0.0010350.00 21.91 0.05 27.35 0.01 95.96 0.03 0.8592 0.0007
densitya b cT
68
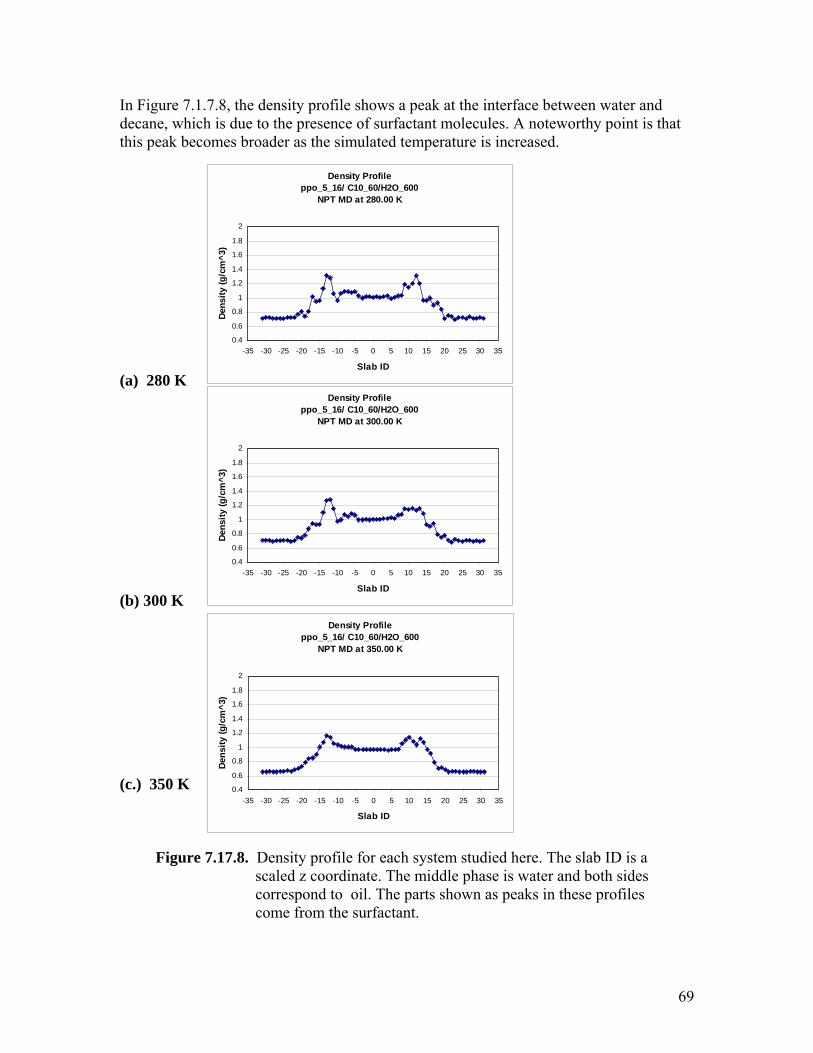
In Figure 7.1.7.8, the density profile shows a peak at the interface between water and decane, which is due to the presence of surfactant molecules. A noteworthy point is that this peak becomes broader as the simulated temperature is increased. (a) 280 K
) 300 K
.) 350 K
Figure 7.17.8. Density profile for each system studied here. The slab ID is a scaled z coordinate. The middle phase is water and both sides correspond to oil. The parts shown as peaks in these profiles come from the surfactant.
Density Profileppo_5_16/ C10_60/H2O_600
NPT MD at 280.00 K
0.4
0.6
0.8
1
1.2
1.4
1.6
1.8
2
-35 -30 -25 -20 -15 -10 -5 0 5 10 15 20 25 30 35
Slab ID
Dens
ity (g
/cm
^3)
Density Profileppo_5_16/ C10_60/H2O_
0.4
0.6
0.8
1
-35 -30 -25 -20 -15 -10 -5 0 5 10 15 20 25 30 35
Slab ID
Dens
it
600NPT MD at 300.00 K
2
1.2
1.4
1.6
1.8
y (g
/cm
^3)
(b
(c (c) 350 K
Density Profileppo_5_16/ C10_60/H2O_600
NPT MD at 350.00 K
0.4
0.6
0.8
1
1.2
1.4
1.6
1.8
2
-35 -30 -25 -20 -15 -10 -5 0 5 10 15 20 25 30 35
Slab ID
ty (g
/cm
^3)
Dens
i
69
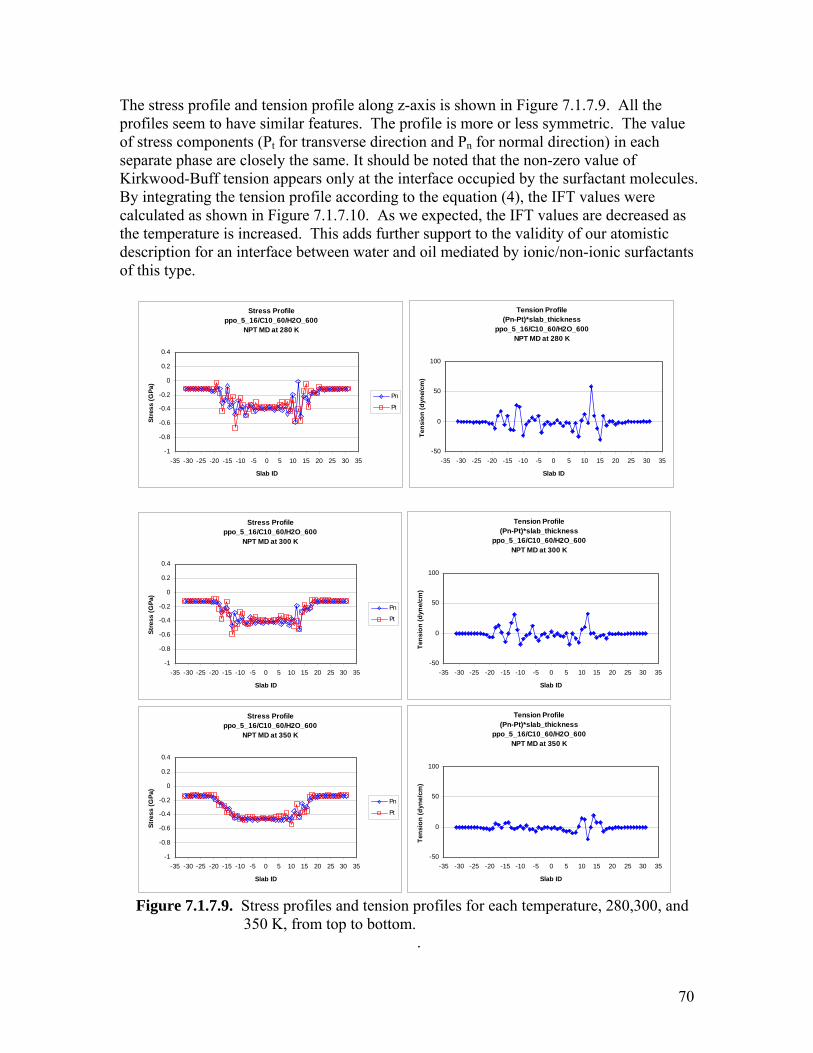
The stress profile and tension profile along z-axis is shown in Figure 7.1.7.9. All the profiles seem to have similar features. The p ore or less symmetric. The value of stress components (Pt for transverse direction and Pn for normal direction) in each separate phase are closely the same. It should be noted that the non-zero value of Kirkwood-Buff tension appears only at the interface occupied by the surfactant molecules. By integrating the tension profile according to the equation (4), the IFT values were calculated as shown in Figure 7.1.7.10. As we expected, the IFT values are decreased as the temperature is increased. This adds further support to the validity of our atomistic description for an interface between water and oil mediated by ionic/non-ionic surfactants
f this type.
Figure 7.1.7.9. Stress profiles and tension profiles for each temperature, 280,300, and 350 K, from top to bottom.
.
rofile is m
o
Tension Profile
(Pn-Pt)*slab_thicknessppo_5_16/C10_60/H2O_600
NPT MD at 350 K
0
50
100
-50-35 -30 -25 -20 -15 -10 -5 0 5 10 15 20 25 30 35
Slab ID
nsio
n (d
yne/
cm)
Te
Stress Profile ppo_5_16/C10_60/H2O_600
NPT MD at 350 K
-0.8
-0.6
-0.4
-0.2
0
0.2
0.4
Stre
ss (G
Pa)
-1-35 -30 -25 -20 -15 -10 -5 0 5 10 15 20 25 30 35
Slab ID
Pn
Pt
Tension Profile (Pn-Pt)*slab_thickness
ppo_5_16/C10_60/H2O_600NPT MD at 300 K
50
100
yne/
cm)
-50
0
-35 -30 -25 -20 -15 -10 -5 0 5 10 15 20 25 30 35
Slab ID
Tens
ion
(d
Stress Profile ppo_5_16/C10_60/H2O_600
NPT MD at 300 K
-0.4
-0.2
0
0.2
0.4
Stre
ss (G
Pa)
-1
-0.8
-0.6
-35 -30 -25 -20 -15 -10 -5 0 5 10 15 20 25 30 35
Slab ID
Pn
Pt
Tension Profile (Pn-Pt)*slab_thickness
ppo_5_16/C10_60/H2O_600NPT MD at 280 K
0Te
-50-35 -30 -25 -20 -15 -10 -5 0 5 10 15 20 25 30 35
Slab ID
50
yne/
c
100
nsio
n (d
m)
Stress Profile ppo_5_16/C10_60/H2O_600
NPT MD at 280 K
0.2
0.4
-0.8
Stre
ss (G
Pa) 0
-0.2 Pn
-0.6
-0.4
-1-35 -30 -25 -20 -15 -10 -5 0 5 10 15 20 25 30 35
Slab ID
Pt
70
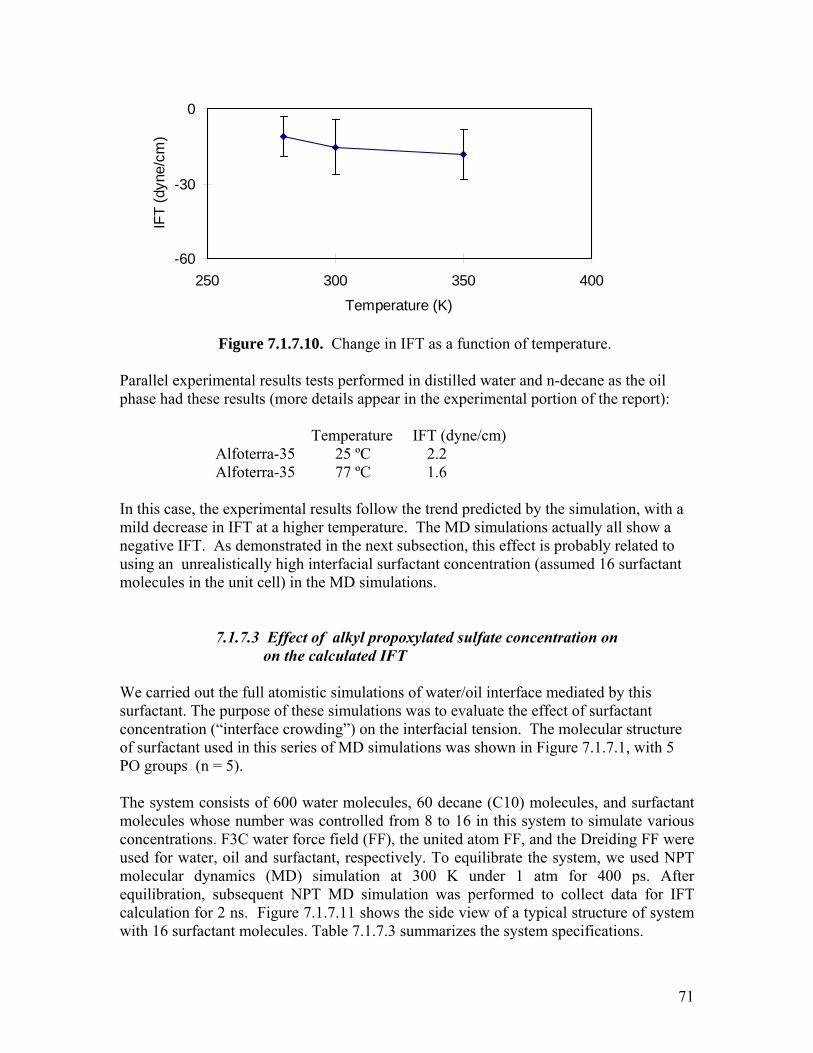
Figure 7.1.7.10. Change in IFT as a function of temperature. Parallel experimental results tests performed in distilled water and n-decane as the oil phase had these results (more details appear in the experimental portion of the report): Temperature IFT (dyne/cm) Alfoterra-35 25 ºC 2.2 Alfoterra-35 77 ºC 1.6 Inm imulations actually all show a
, this effect is probably related to tration (assumed 16 surfactant
olecules in the unit cell) in the MD simulations.
7.1.7.3 Effect of alkyl propoxylated sulfate concentration on on the calculated IFT
e carried out the full atomistic simulations of water/oil interface mediated by this rfactant. The purpose of these simulations was to evaluate the effect of surfactant
oncentration (“interface crowding”) on the interfacial tension. The molecular structure f surfactant used in this series of MD simulations was shown in Figure 7.1.7.1, with 5 O groups (n = 5).
he system consists of 600 water molecules, rfactant ous
e
olecu r dyn mics MD) 1 atm for 400 ps. After quilib tion, P ed to collect data for IFT alcula n for 7 ws iew of a typical structure of system ith 16 surfact specifications.
-60
-30
0
250 300 350 400
Temperature (K)
IFT
(dyn
e/cm
)
this case, the experimental results follow the trend pree in IFT at a higher temperature. e MD s
dicted by the simulation, with a Thild decreas
negative IFT. As demonstrated in the next subsectionsing an unrealistically high interfacial surfactant concenu
m
WsucoP
60 decane (C10) molecules, and suT
molecules whose number was controlled from 8 to 16 in this system to simulate variconcentrations. F3C water force field (FF), the united atom FF, and the Dreiding FF wer
sed for water, oil and surfactant, respectively. To equilibrate the system, we used NPT um la a ( simulation at 300 K under
ula s performe ra subsequent N T MD sim tion wac tio 2 ns. Figure .1.7.11 sho the side v
ant molecules. Table 7.1.7.3 summarizes the systemw
71
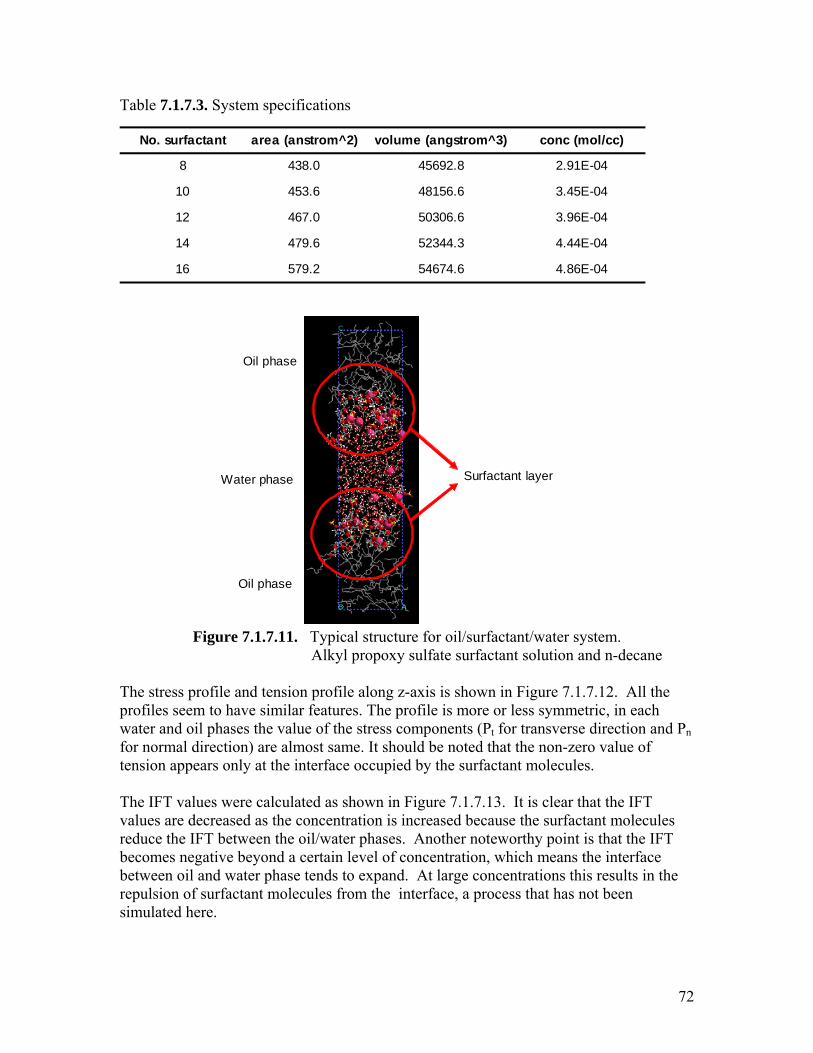
Table 7.1.7.3. System specifications
No. surfactant area (anstrom^2) volume (angstrom^3) conc (mol/cc)
8 438.0 45692.8 2.91E-04
10 453.6 48156.6 3.45E-04
12 467.0 50306.6 3.96E-04
14
16 579.2 54674.6 4.86E-04
479.6 52344.3 4.44E-04
Oi
Surfactant layerWater phase
l phase
Oil phase
Figure 7.1.7.11. Typical structure for oil/surfactant/water system.
Alkyl propoxy sulfate surfactant solution and n-decane The stress profile and tension profile along z-axis is shown in Figure 7.1.7.12. All the profiles seem to have similar features. The profile is more or less symmetric, in each water and oil phases the value of the stress components (Pt for transverse direction and Pn
r normal direction) are almost same. It should be noted that the non-zero value of nsion appears only at the interface occupied by the surfactant molecules.
The IFT values were calculated as shown in Figure 7.1.7.13. It is clear that the IFT values are decreased as the concentration is increased because the surfactant molecules reduce the IFT between the oil/water phases. Another noteworthy point is that the IFT becomes negative beyond a certain level of concentration, which means the interface between oil and water phase tends to expand. At large concentrations this results in the repulsion of surfactant molecules from the interface, a process that has not been simulated here.
fote
72
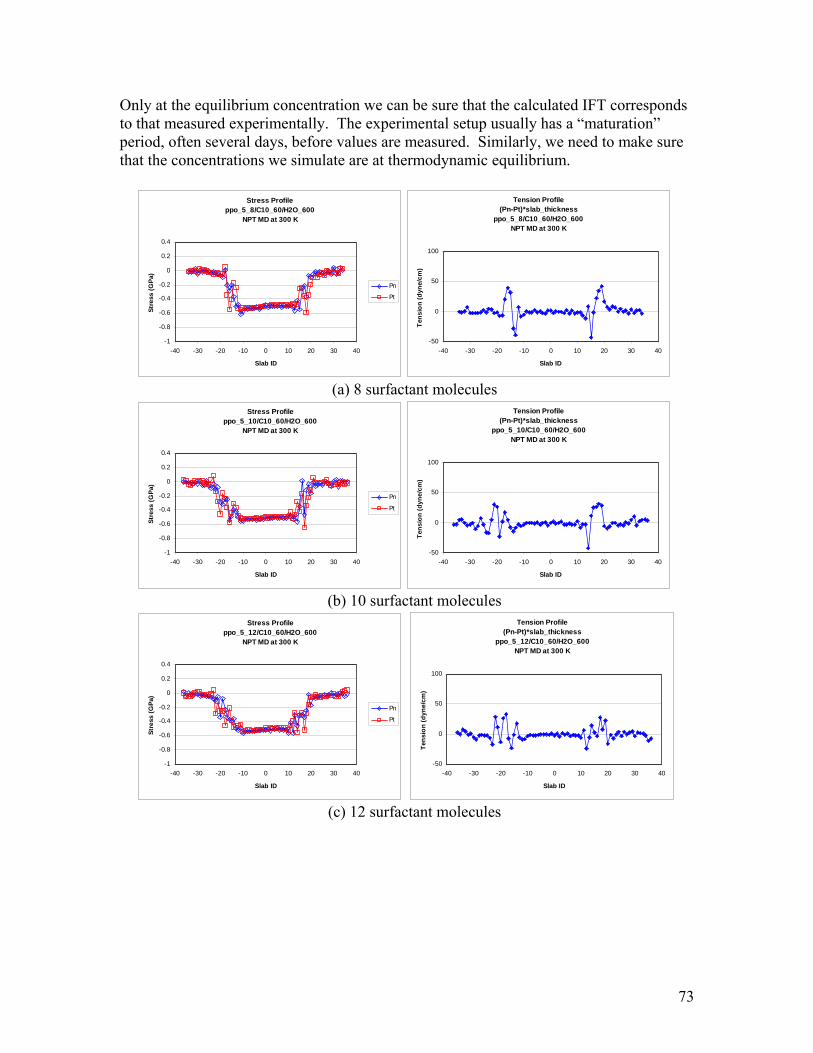
Only at the equilibrium concentration we can be sure that the calculated IFT corresponds to that measured experimentally. The experimental setup usually has a “maturation” period, often several days, before values are measured. Similarly, we need to make sure that the concentrations we simulate are at thermodynamic equilibrium.
Stress Profile
ppo_5_8/C10_60/H2O_600 NPT MD at 300 K
-1
-0.8
-0.6
-0.4
-0.2
0
0.2
0.4
-40 -30 -20 -10 0 10 20 30 40
Slab ID
Stre
ss (G
Pa)
Pn
Pt
Tension Profile (Pn-Pt)*slab_thickness
ppo_5_8/C10_60/H2O_600NPT MD at 300 K
-50
0
50
100
-40 -30 -20 -10 0 10 20 30 40
Slab ID
Tens
ion
(dyn
e/cm
)
(a) 8 surfactant molecules
Stress Profile ppo_5_10/C10_60/H2O_600
NPT M at 300 K
0.4
-40 -30 -20 -10 0 10 20 30 40
D
-1
-0.8
-0.6
-0.4
-0.2
0
0.2
Stre
ss (G
Pa)
Slab ID
Pn
Pt
Tension Profile (Pn-Pt)*slab_thickness
ppo_5_10/C10_60/H2O_600NPT MD at 300 K
-50
0
50
100
Tens
ion
(dyn
e/cm
)
-40 -30 -20 -10 0 10 20 30 40
Slab ID
(b) 10 surfactant molecules
Stress Profile ppo_5_12/C10_60/H2O_600
NPT MD at 300 K
-1
-0.8
-0.6
-0.4
Stre
ss
-0.2
(G
0
Pa)
0.2
0.4
-40 -30 -20 -10 0 10 20 30 40
Slab ID
Pn
Pt
Tension Profile (Pn-Pt)*slab_thickness
ppo_5_12/C10_60/H2O_600NPT MD at 300 K
100
50
yne/
cm)
0
Tens
ion
(d
-5010 20 30 40-40 -30 -20 -10 0
Slab ID
(c) 12 surfactant molecules
73
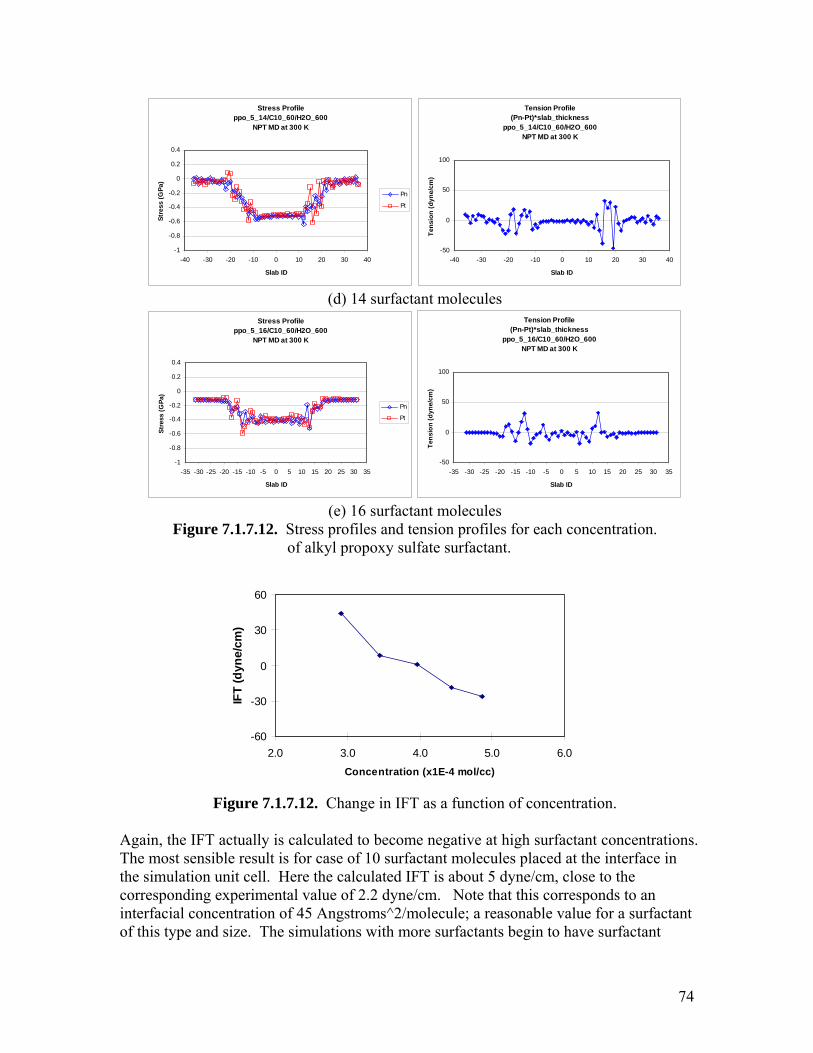
Stress Profile ppo_5_14/C10_60/H2O_600
NPT MD at 300 K
-1
-0.8
-0.6
-0.4
-0.2
0
0.2
0.4
-40 -30 -20 -10 0 10 20 30 40
Slab ID
Stre
ss (G
Pa)
Pn
Pt
Tension Profile (Pn-Pt)*slab_thickness
ppo_5_14/C10_60/H2O_600NPT MD at 300 K
-50
0
50
100
-40 -30 -20 -10 0 10 20 30 40
Slab ID
Tens
ion
(dyn
e/cm
)
(d) 14 surfactant molecules
Stress Profile ppo_5_16/C10_60/H2O_600
NPT MD at 300 K
-1
-0.8
-0.6
-0.4
-0.2
0
0.2
0.4
-35 -30 -25 -20 -15 -10 -5 0 5 10 15 20 25 30 35
Slab ID
Stre
ss (G
Pa)
Pn
Pt
Tension Profile (Pn-Pt)*slab_thickness
ppo_5_16/C10_60/H2O_600NPT MD at 300 K
-50
0
50
100
-35 -30 -25 -20 -15 -10 -5 0 5 10 15 20 25 30 35
Slab ID
Tens
ion
(dyn
e/cm
)
(e) 16 surfactant molecules
Figure 7.1.7.12. Stress profiles and tension profiles for each concentration. of alkyl propoxy sulfate surfactant.
-60
-30
0
30
60
2.0 3.0 4.0 5.0 6.0Concentration (x1E-4 mol/cc)
IFT
(dyn
e/cm
)
Figure 7.1.7.12. Change in IFT as a function of concentration.
gain, the IFT actually is calculated to become negative at high surfactant concentrations. he most sensible result is for case of 10 surfactant molecules placed at the interface in e simulation unit cell. Here the calculated IFT is about 5 dyne/cm, close to the
corresponding experimental value of 2.2 dyne/cm. Note that this corresponds to an interfacial concentration of 45 Angstroms^2/molecule; a reasonable value for a surfactant of this type and size. The simulations with more surfactants begin to have surfactant
ATth
74
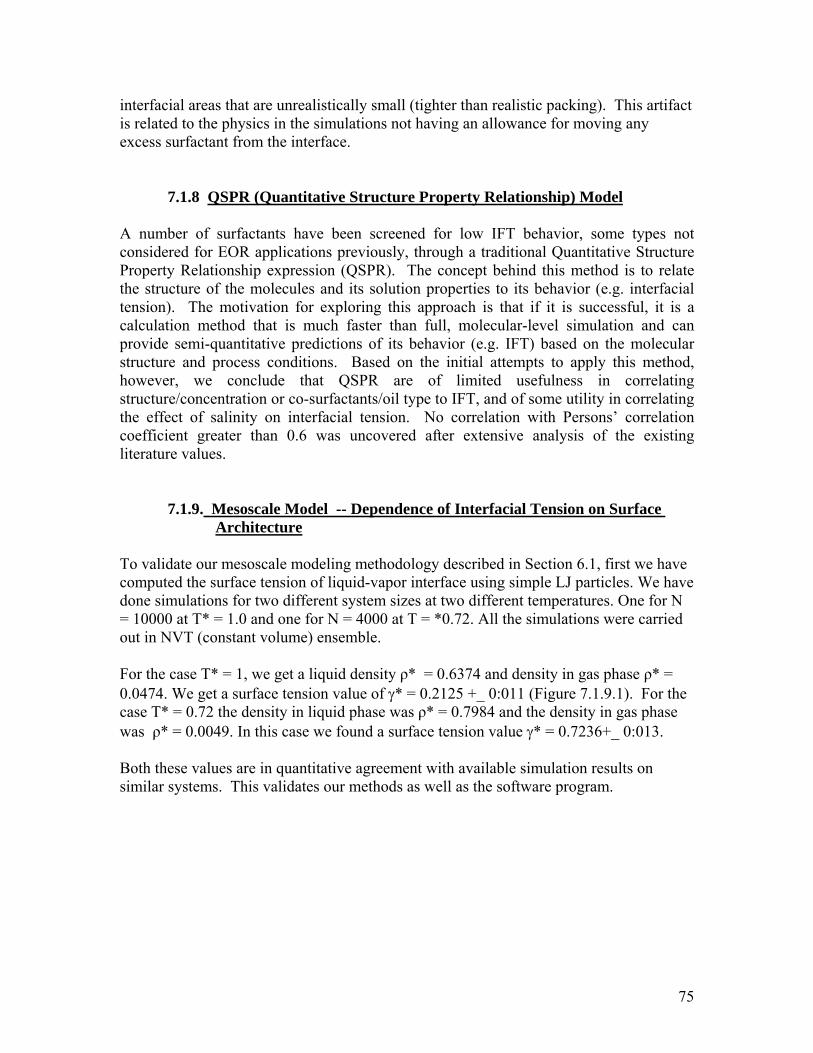
interfacial areas that are unrealistically small (tighter than realistic packing). This artifact is related to the physics in the simulations not having an allowance for moving any excess surfactant from the interface. 7.1.8 QSPR (Quantitative Structure Property Relationship) Model A number of surfactants have been screened for low IFT behavior, some types not considered for EOR applications previously, through a traditional Quantitative Structure Property Relationship expression (QSPR). The concept behind this method is to relate the structure of the molecules and its solution properties to its behavior (e.g. interfacial tension). The motivation for e at if it is successful, it is a calculation method that is much faster than full, molecular-level simulation and can provide semi-quantitative predictions of its behavior (e.g. IFT) based on the molecular structure and process conditions. Based on the initial attempts to apply this method, however, we conclude that QSPR are of limited usefulness in correlating structure/concentration or co-surfactants/oil type to IFT, and of some utility in correlating the effect of salinity on interfacial tension. No correlation with Persons’ correlation coefficient greater than 0.6 was uncovered after extensive analysis of the existing literature values. 7.1.9. Mesoscale Model -- Dependence of Interfacial Tension on Surface
xploring this approach is th
Architecture
o validate our mesoscale modeling methodology described in Section 6.1, first we have computed the surface tension of liquid-vapor interface using simple LJ particles. We have done simulations for two different system sizes at two different temperatures. One for N = 10000 at T* = 1.0 and one for N = 4000 at T = *0.72. All the simulations were carried out in NVT (constant volume) ensemble. For the case T* = 1, we get a liquid density ρ* = 0.6374 and density in gas phase ρ* = 0.0474. We get a surface tension value of γ* = 0.2125 +_ 0:011 (Figure 7.1.9.1). For the case T* = 0.72 the density in liquid phase was ρ* = 0.7984 and the density in gas phase was ρ* = 0.0049. In this case we found a surface tension value γ* = 0.7236+_ 0:013. Both these values are in quantitative agreement with available simulation results on
. This validates our methods as well as the software program.
T
similar systems
75
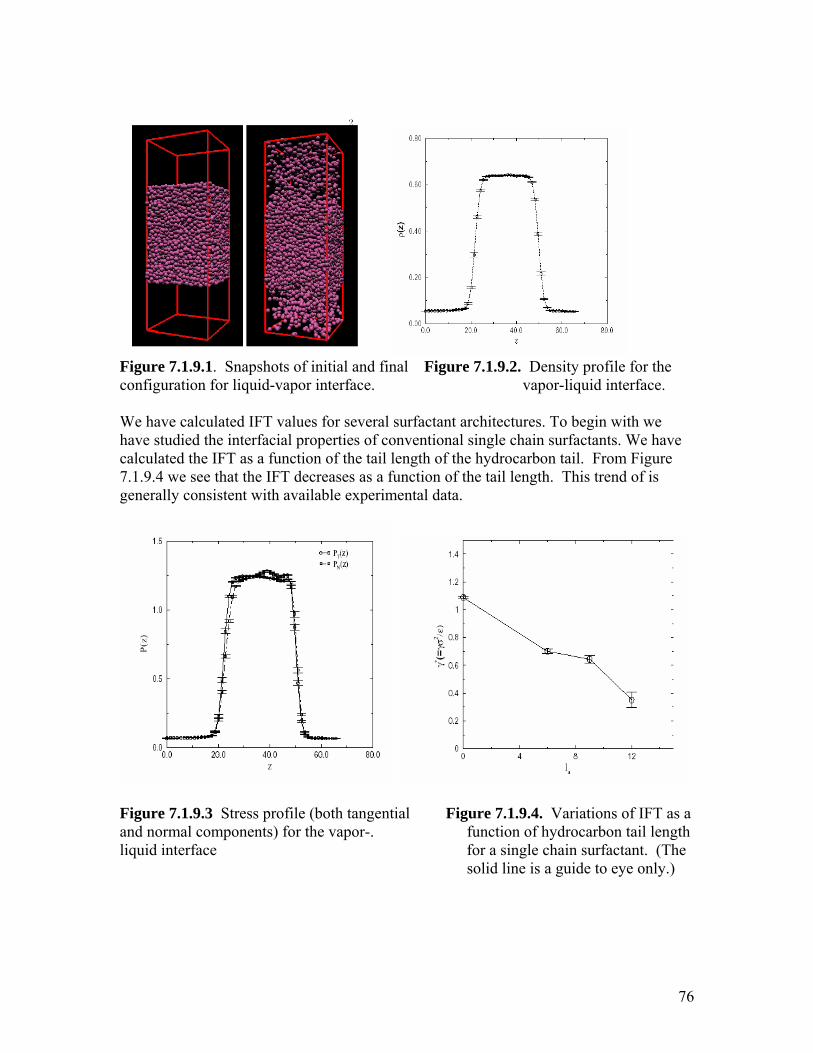
Figure 7.1.9.1. Snapshots of initial and final Figure 7.1.9.2. Density profile for the configuration for liquid-vapor interface. vapor-liquid interface. We have calculated IFT values for several surfactant architectures. To begin with we have studied the interfacial properties of conventional single chain surfactants. We have calculated the IFT as a function of the tail length of the hydrocarbon tail. From Figure
.1.9.4 we see that the IFT decreases as a function of the tail length. This trend of is 7generally consistent with available experimental data.
Figure 7.1.9.3 Stress profile (both tangential Figure 7.1.9.4. Variations of IFT as a nd normal components) for the vapor-. function of hydrocarbon tail length quid interface for a single chain surfactant. (The
solid line is a guide to eye only.)
ali
76
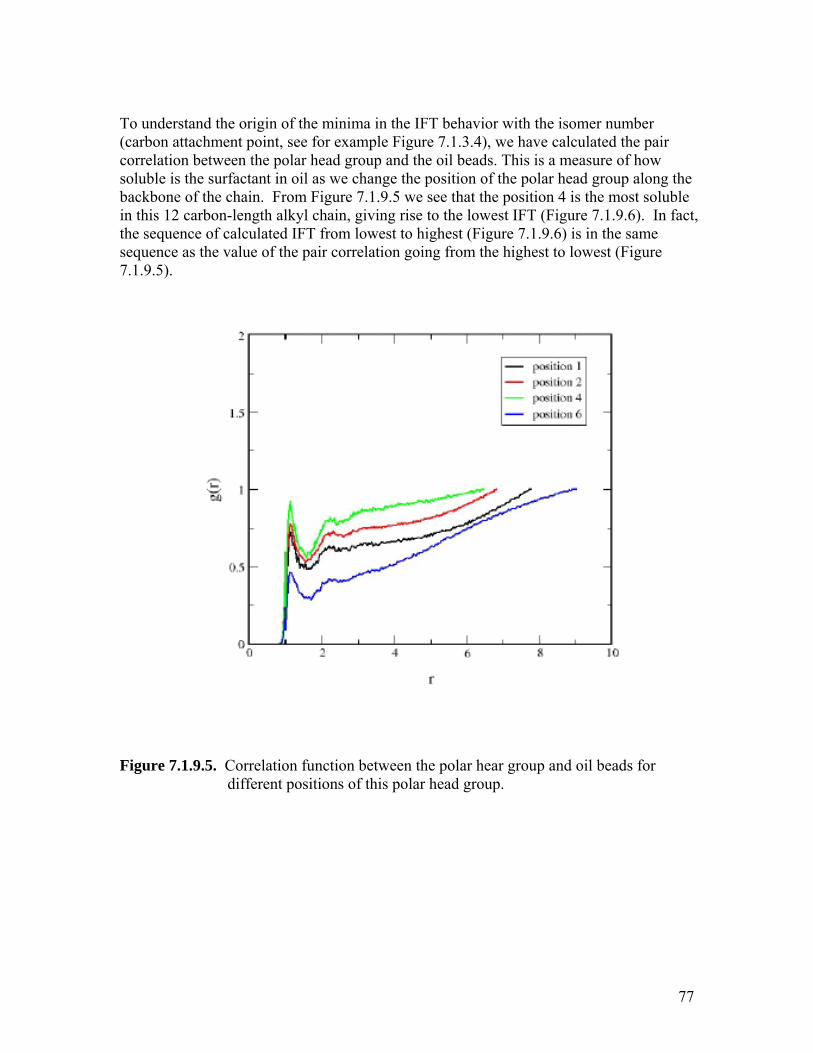
To understand the origin of the minima in the IFT behavior with the isomer number (carbon attachment point, see for example Figure 7.1.3.4), we have calculated the pair correlation between the polar head group and the oil beads. This is a measure of how soluble is the surfactant in oil as we change the position of the polar head group along the backbone of the chain. From Figure 7.1.9.5 we see that the position 4 is the most soluble in this 12 carbon-length alkyl chain, giving rise to the lowest IFT (Figure 7.1.9.6). In fact, the sequence of calculated IFT from lowest to highest (Figure 7.1.9.6) is in the same sequence as the value of the pair correlation going from the highest to lowest (Figure 7.1.9.5).
Figure 7.1.9.5. Correlation function between the polar hear group and oil beads for different positions of this polar head group.
77
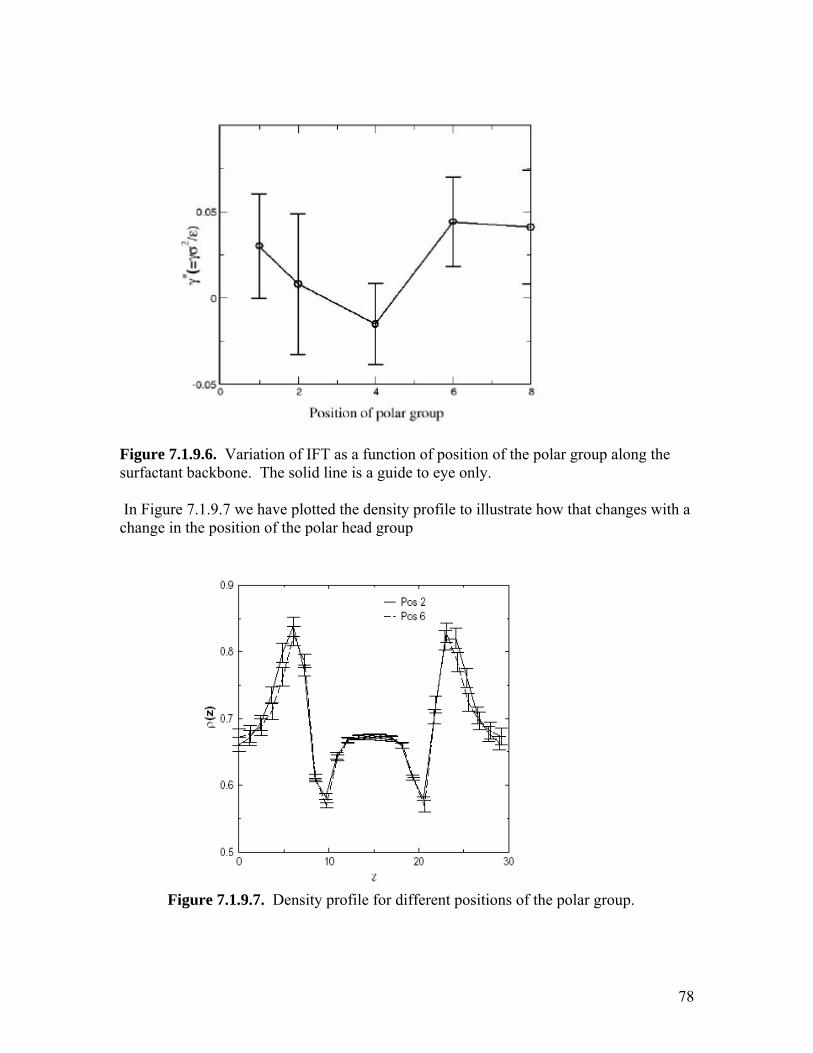
Figure 7.1.9.6. Variation of IFT as a function of position of the polar group along the surfactant backbone. The solid line is a guide to eye only. In Figure 7.1.9.7 we have plotted the density profile to illustrate how that changes with a change in the position of the polar head group
Figure 7.1.9.7. Density profile for different positions of the polar group.
78
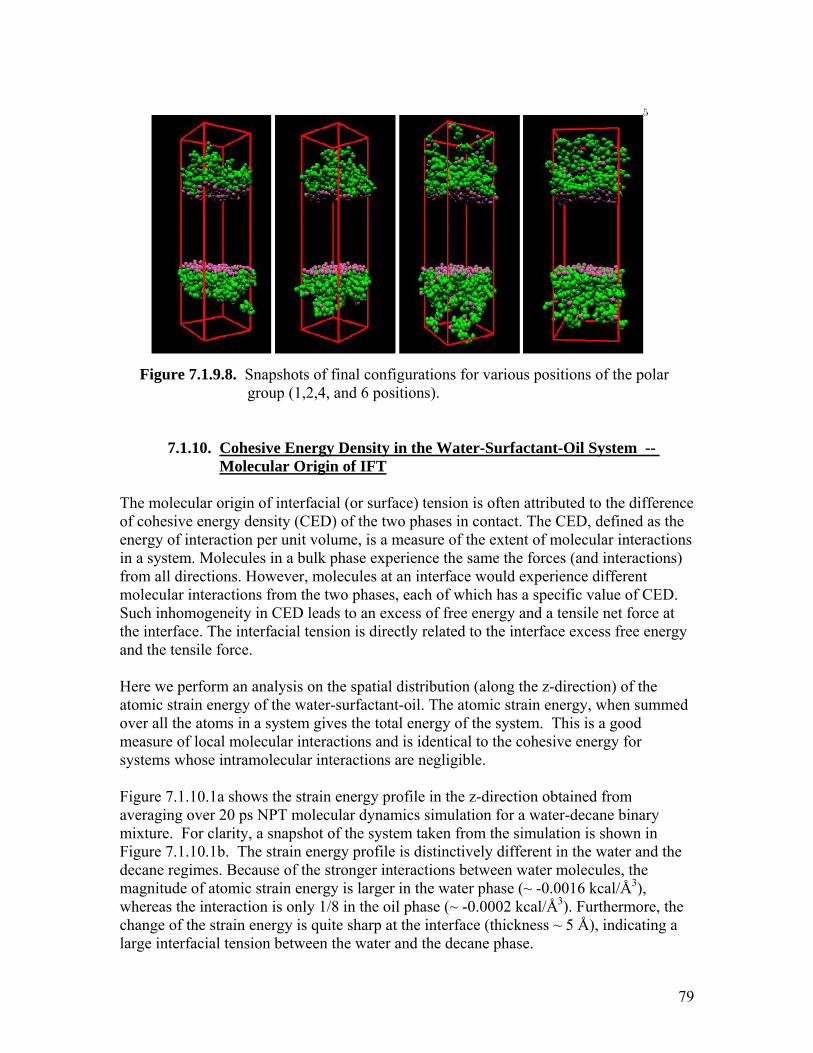
Figure 7.1.9.8. Snapshots of final configurations for various positions of the polar group (1,2,4, and 6 positions).
7.1.10. Cohesive Energy Density in the Water-Surfactant-Oil System -- Molecular Origin of IFT
The molecular origin of interfacial (or surface) tension is often attributed to the difference of cohesive energy density (CED) of the two phases in contact. The CED, defined as the nergy of interaction per unit volume, is a mease
in a systemure of the extent of molecular interactions
. Molecules in a bulk phase experience the same the forces (and interactions) from all directions. However, molecules at an interface would experience different molecular interactions from the two phases, each of which has a specific value of CED. Such inhomogeneity in CED leads to an excess of free energy and a tensile net force at the interface. The interfacial tension is directly related to the interface excess free energy and the tensile force.
Here we perform an analysis on the spatial distribution (along the z-direction) of the atomic strain energy of the water-surfactant-oil. The atomic strain energy, when summed over all the atoms in a system gives the total energy of the system. This is a good measure of local molecular interactions and is identical to the cohesive energy for systems whose intramolecular interactions are negligible.
Figure 7.1.10.1a shows the strain energy profile in the z-direction obtained from averaging over 20 ps NPT molecular dynamics simulation for a water-decane binary mixture. For clarity, a snapshot of the system taken from the simulation is shown in Figure 7.1.10.1b. The strain energy profile is distinctively different in the water and the decane regimes. Because of the stronger interactions between water molecules, the
agnitude of atom 3
wherea , the change of the strain energy is quite sharp at the interface (thickness ~ 5 Å), indicating a large interfacial tension between the water and the decane phase.
m ic strain energy is larger in the water phase (~ -0.0016 kcal/Å ), s the interaction is only 1/8 in the oil phase (~ -0.0002 kcal/Å3). Furthermore
79
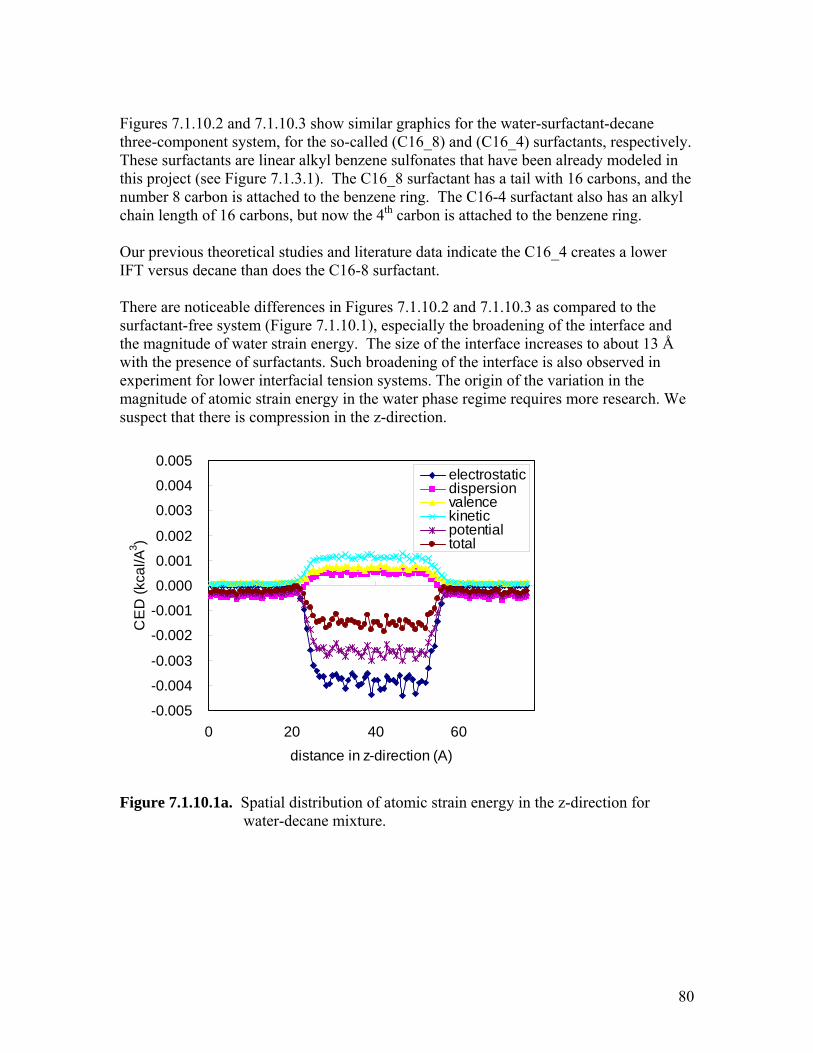
Figures 7.1.10.2 and 7.1.10.3 show similar graphics for the water-surfactant-decane three-component system, for the so-called (C16_8) and (C16_4) surfactants, respectively. These surfactants are linear alkyl benzene sulfonates that have been already modeled in this project (see Figure 7.1.3.1). The C16_8 surfactant has a tail with 16 carbons, and the number 8 carbon is attached to the benzene ring. The C16-4 surfactant also has an alkyl chain length of 16 carbons, but now the 4th carbon is attached to the benzene ring. Our previous theoretical studies and literature data indicate the C16_4 creates a lower IFT versus decane than does the C16-8 surfactant. There are noticeable differences in Figures 7.1.10.2 and 7.1.10.3 as compared to the surfactant-free system (Figure 7.1.10.1), especially the broadening of the interface and the magnitude of water strain energy. The size of the interface increases to about 13 Å with the pex
a regime requires more research. We uspect that there is compression in the z-direction.
resence of surfactants. Such broadening of the interface is also observed in periment for lower interfacial tension systems. The origin of the variation in the
ms
gnitude of atomic strain energy in the water phase
Figure 7.1.10.1a. Spatial distribution of atomic strain energy in the z-direction for
water-decane mixture.
0.005electrostaticdispersion0.004valencekineticpotentialtotal
-0. 03
-0.002
-0.001
0.000
0.001
0.002
0.003
CE
D (k
cal/A
3 )
0
-0.005
-0.004
0 20 40 60distance in z-direction (A)
80
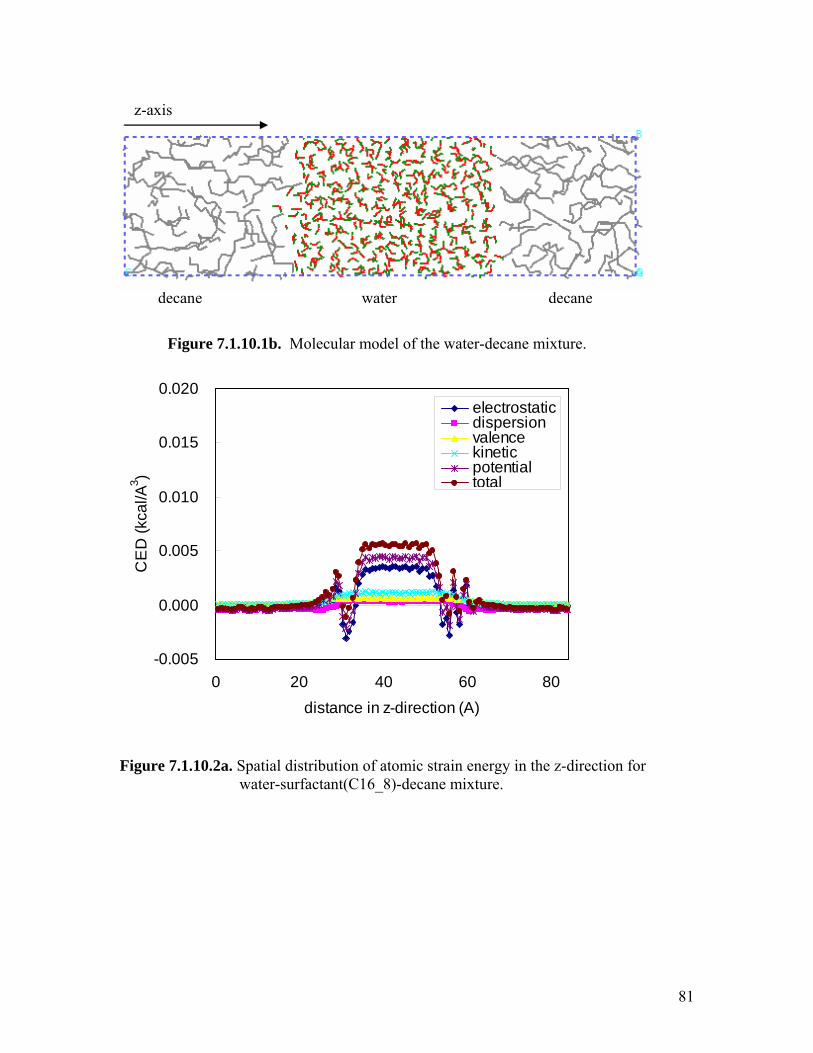
81
igure 7.1.10.2a. Spatial distribution of atomic strain energy in the z-direction for water-surfactant(C16_8)-decane mixture.
z-axis Figure 7.1.10.1b. Molecular model of the water-decane mixture.
decane water decane
-0.005
0.000
0.005
0.010
F
0.015
0.020
0 20 40 60 80distance in z-direction (A)
CE
D (k
cal/A
3 )
electrostaticdispersionvalencekineticpotentialtotal
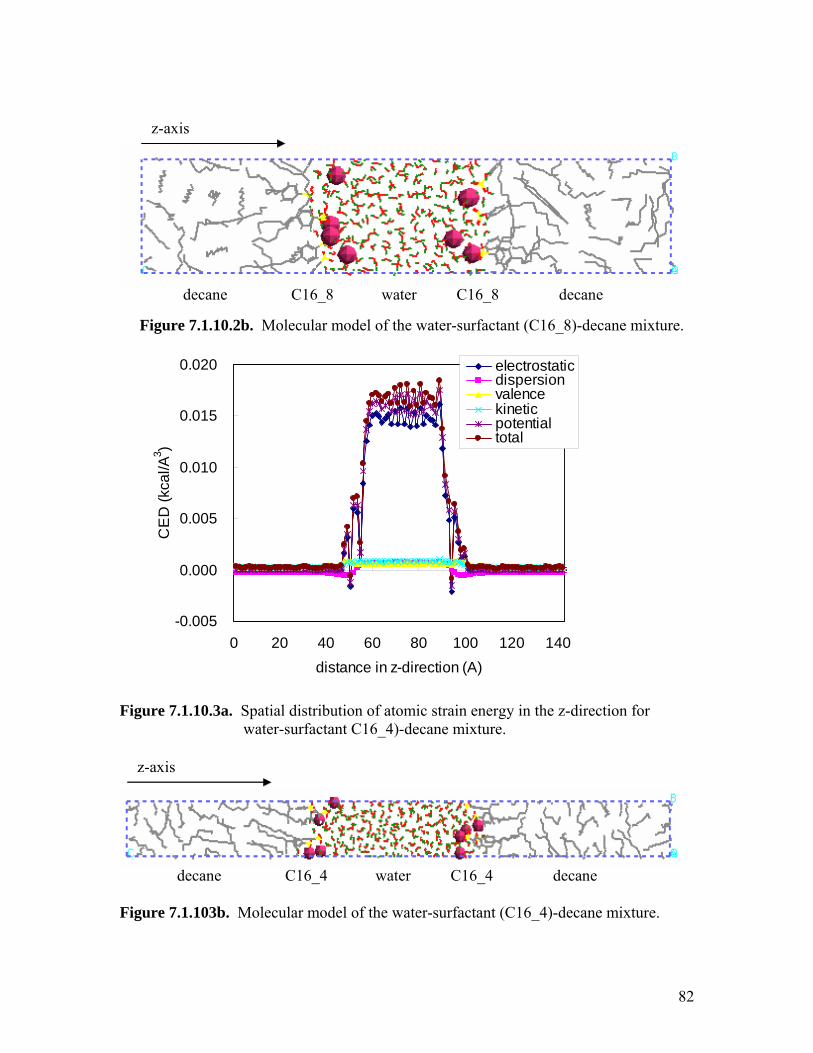
Figure 7.1.10.2b. Molecular model of the water-surfactant (C16_8)-decane mixture.
igure 7.1.10.3a. Spatial distribution of atomic strain energy in the z-direction for water-surfactant C16_4)-decane mixture.
Figure 7.1.103b. Molecular model of the water-surfactant (C16_4)-decane mixture.
z-axis
decane C16_8 water C16_8 decane
-0.005
0.000
0.005
0.010
0.015
0.020
0 20 40 60 80 100 120 140distance in z-direction (A)
CE
D (k
cal/A
3 )
electrostaticdispersionvalencekineticpotentialtotal
F
z-axis
decane C16_4 water C16_4 decane
82
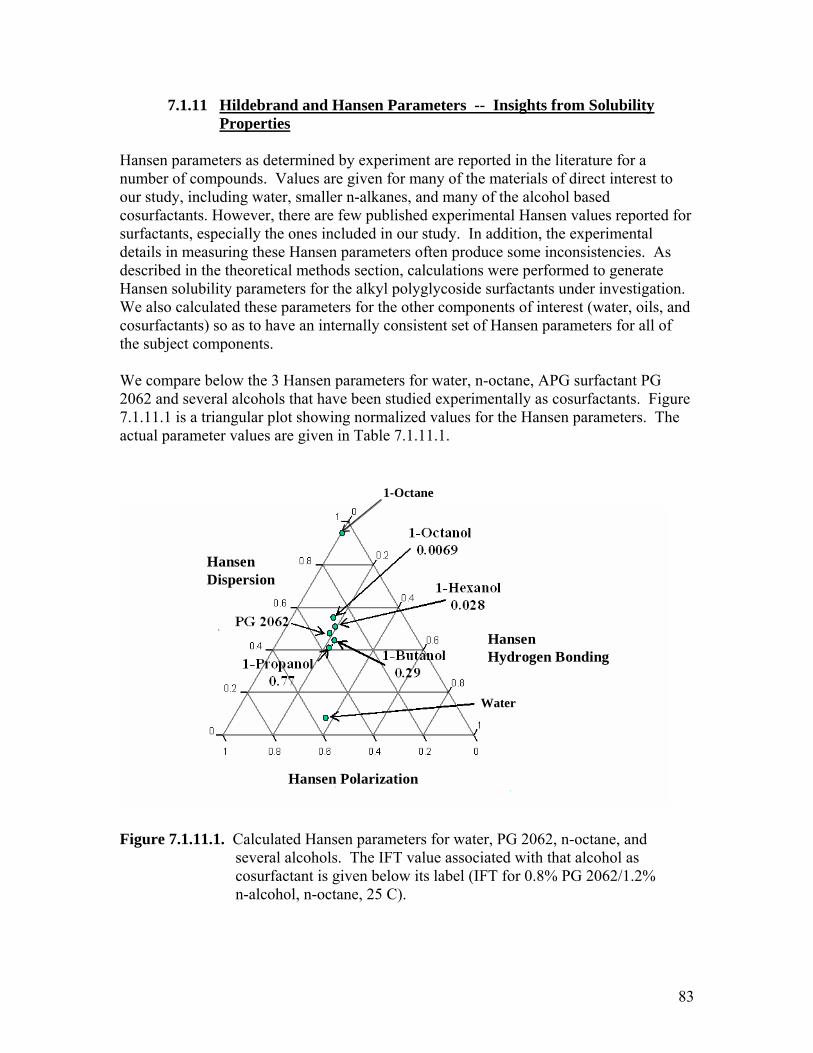
7.1.11 Hildebrand and Hansen Parameters -- Insights from Solubility Properties
Hansen parameters as determined by experiment are reported in the literature for a
umber of compounds. Values are given for many of the materials of direct interest to ur study, including water, smaller n-alkanes, and many of the alcohol based osurfactants. However, there are few published experimental Hansen values reported for rfactants, especially the ones included in our study. In addition, the experimental
etails in measuring these Hansen parameters often produce some inconsistencies. As escribed in the theoretical methods section, calculations were performed to generate ansen solubility parameters for the alkyl polyglycoside surfactants under investigation. e also calculated these parameters for the other components of interest (water, oils, and
e subject components.
low the 3 Hansen parameters for water, n-octane, APG surfactant PG 062 and several alcohols that have been studied experimentally as cosurfactants. Figure .1.11.1 is a triangular plot showing normalized values for the Hansen parameters. The ctual parameter values are given in Table 7.1.11.1.
igure 7.1.11.1. Calculated Hansen parameters for water, PG 2062, n-octane, and several alcohols. The IFT value associated with that alcohol as cosurfactant is given below its label (IFT for 0.8% PG 2062/1.2% n-alcohol, n-octane, 25 C).
nocsuddHWcosurfactants) so as to have an internally consistent set of Hansen parameters for all of th We compare be27a
Water
1-Octane
Hansen Hydrogen Bonding
Hansen Polarization
Hansen Dispersion
F
83
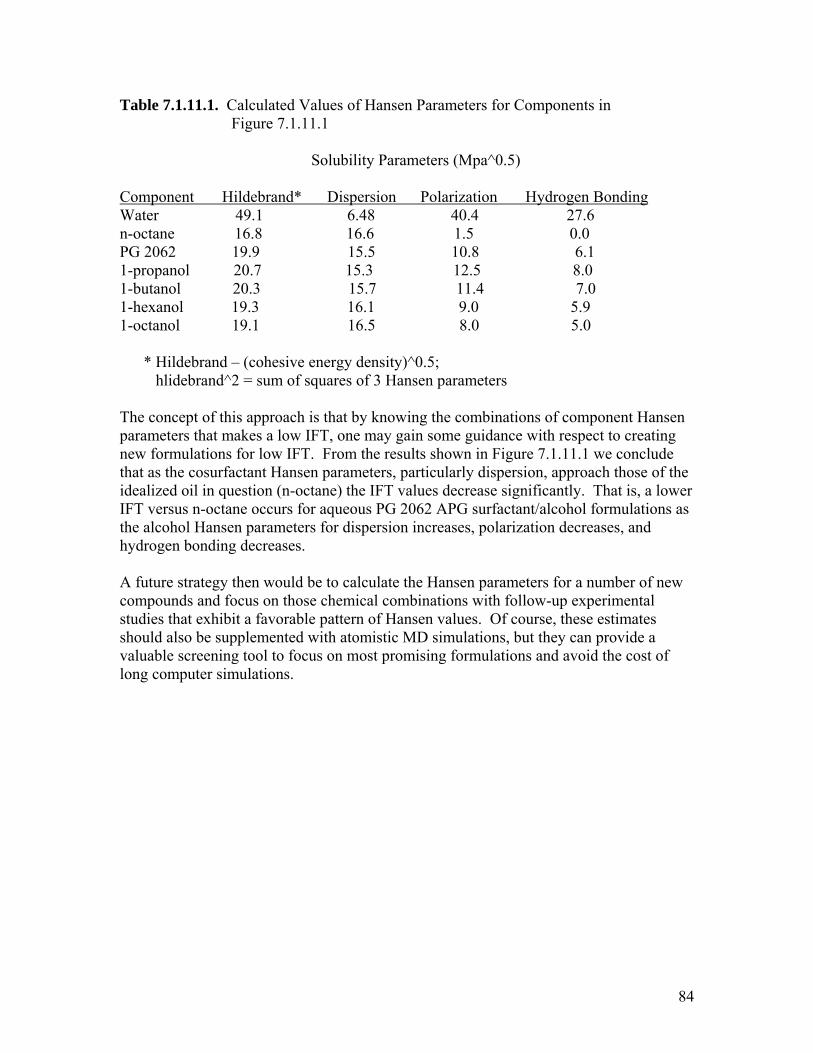
Table 7.1.11.1. Calculated Values of Hansen Parameters for Components in Figure 7.1 .11.1
ding
Solubility Parameters (Mpa^0.5) Component Hildebrand* Dispersion Polarization Hydrogen Bon
* Hildebrand – (cohesive energy density)^0.5;
guidance with respect to creating ew formulations for low IFT. From the results shown in Figure 7.1.11.1 we conclude at as the cosurfactant Hansen parameters, particularly dispersion, approach those of the
i question (n-octane) the IFT values decrease significantly. That is, a lower T versus n-octane occurs for aqueous PG 2062 APG surfactant/alcohol formulations as e alcohol Hansen parameters for dispersion increases, polarization decreases, and
ydrogen bonding decreases. future strategy then would be to calculate the Hansen parameters for a number of new
ompounds and focus on those chemical combinations with follow-up experimental udies that exhibit a favorable pattern of Hansen values. Of course, these estimates ould also be supplemented with atomistic MD simulations, but they can provide a
aluable screening tool to focus on most promising formulations and avoid the cost of ng computer simulations.
Water 49.1 6.48 40.4 27.6 n-octane 16.8 16.6 1.5 0.0 PG 2062 19.9 15.5 10.8 6.1 1-propanol 20.7 15.3 12.5 8.0 1-butanol 20.3 15.7 11.4 7.0 1-hexanol 19.3 16.1 9.0 5.9 1-octanol 19.1 16.5 8.0 5.0
hlidebrand^2 = sum of squares of 3 Hansen parameters The concept of this approach is that by knowing the combinations of component Hansen parameters that makes a low IFT, one may gain somenthdealized oil in
IFthh Acstshvlo
84
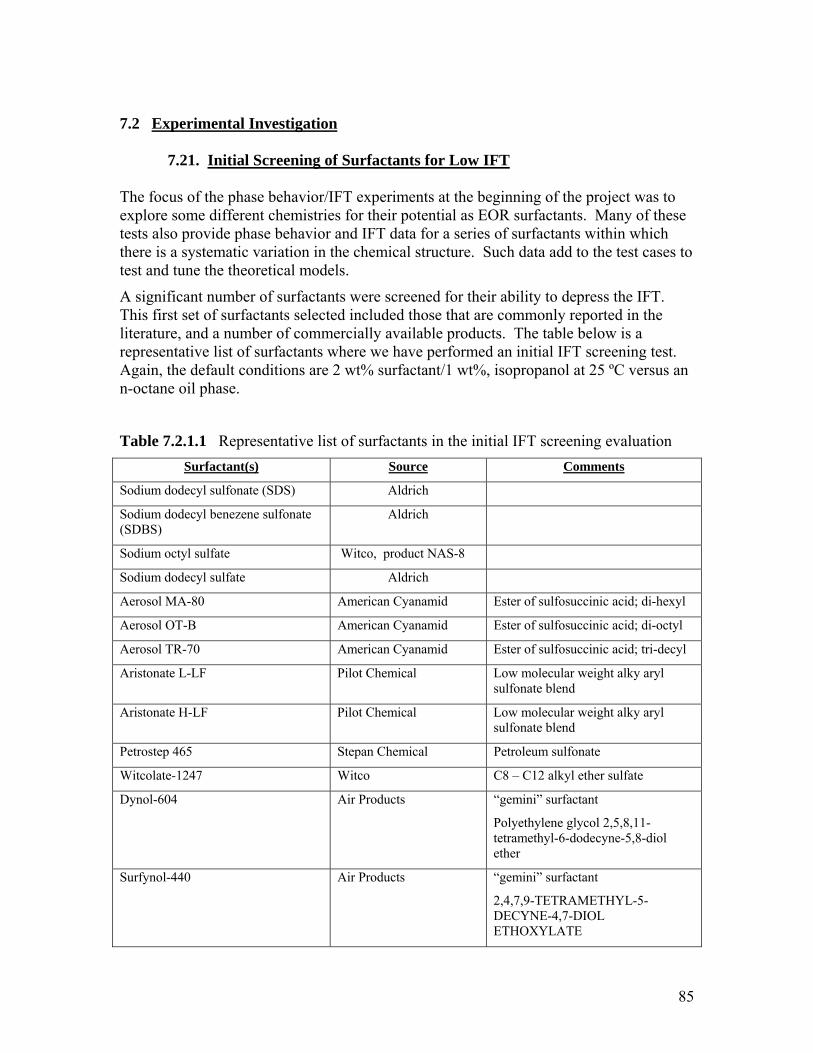
7.2 Experimental Investigation 7.21. Initial Screening of Surfactants for Low IFT The focus of the phase behavior/IFT experiments at the beginning of the project was to
ome different chemistries for their p any of these ithin which
e test cases to
the IFT. ted in the w is a
ep rmed an initial IFT screening test. Ag ropanol at 25 ºC versus an
-o
explore s otential as EOR surfactants. Mtests also provide phase behavior and IFT data for a series of surfactants wthere is a systematic variation in the chemical structure. Such data add to thtest and tune the theoretical models.
A significant number of surfactants were screened for their ability to depressThis first set of surfactants selected included those that are commonly reporiterature, and a number of commercially available products. The table belol
r resentative list of surfactants where we have perfoain, the default conditions are 2 wt% surfactant/1 wt%, isopctane oil phase. n
Table 7.2.1.1 Representative list of surfactants in the initial IFT screening evaluation
Surfactant(s) Source Comments
Sodium dodecyl sulfonate (SDS) Aldrich
Sodium dodecyl benezene sulfonate (SDBS)
Aldrich
Sodium octyl sulfate Witco, product NAS-8
Sodium dodecyl sulfate Aldrich
Aerosol MA-80 American Cyanamid Ester of sulfosuccinic acid; di-hexyl
Aerosol OT-B American Cyanamid Ester of sulfosuccinic acid; di-octyl
Aerosol TR-70 American Cyanamid Ester of sulfosuccinic acid; tri-decyl
Aristonate L-LF Pilot Chemical Low molecular weight alky aryl sulfonate blend
Aristonate H-LF Pilot Chemical Low molecular weight alky aryl sulfonate blend
Petrostep 465 Stepan Chemical Petroleum sulfonate
Witcolate-1247 Witco C8 – C12 alkyl ether sulfate
Dynol-604 Air Products “gemini” surfactant
Polyethylene glycol 2,5,8,11-tetramethyl-6-dodecyne-5,8-diol ether
Surfynol-440 Air Products “gemini” surfactant
2,4,7,9-TETRAMETHYL-5-DECYNE-4,7-DIOL ETHOXYLATE
85
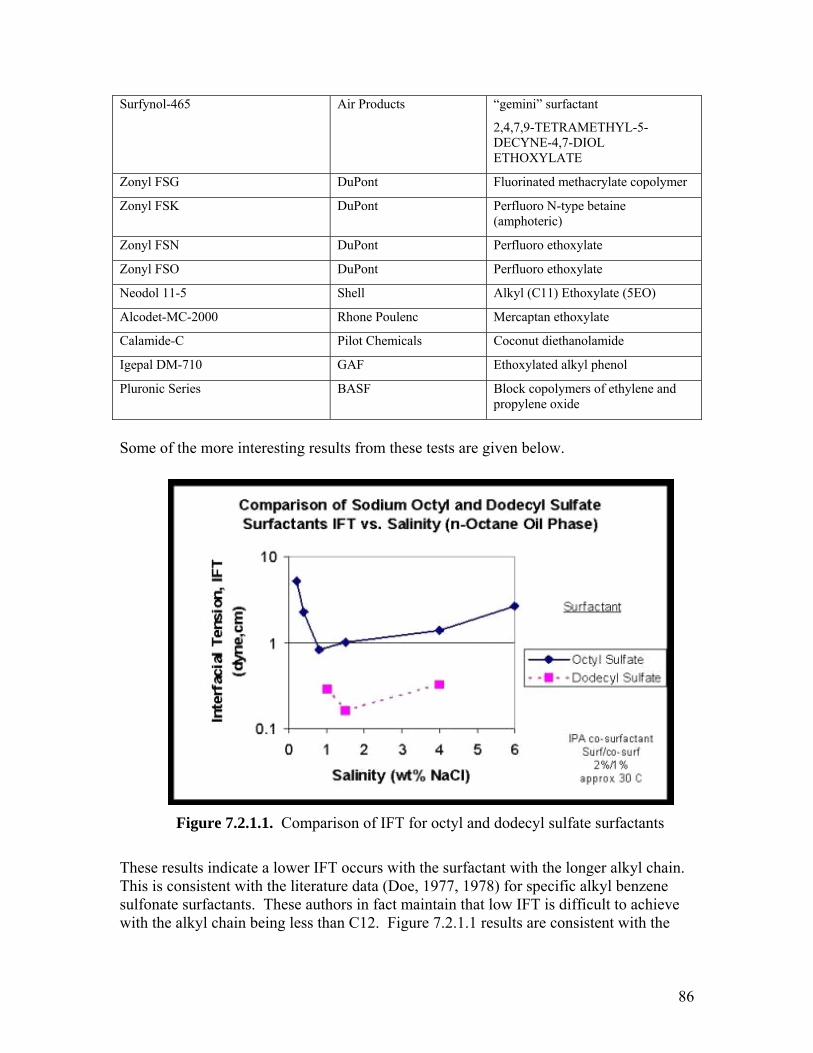
Surfynol-465 Air Products “gemini” surfactant
2,4,7,9-TETRAMETHYL-5-DECYNE-4,7-DIOL
OXYLATE ETH
Zonyl FSG DuPont Fluorinated methacrylate copolymer
Zonyl FSK DuPont Perfluoro N-type betaine (amphoteric)
Zonyl FSN DuPont Perfluoro ethoxylate
Zonyl FSO DuPont Perfluoro ethoxylate
Neodol 11-5 Shell Alkyl (C11) Ethoxylate (5EO)
Alcodet-MC-2000 Rhone Poulenc Mercaptan ethoxylate
Calamide-C Pilot Chemicals Coconut diethanolamide
Igepal DM-710 GAF Ethoxylated alkyl phenol
Pluronic Series BASF Block copolymers of ethylene and propylene oxide
Some of the more interesting results from these tests are given below.
Figure 7.2.1.1. Comparison of IFT for octyl and dodecyl sulfate surfactants
s indicate a lower IFT the surfacta alkyl chain. istent with the literatu , 1977, 1978 l benzene
sulfonate surfactants. These authors in fact maintain that l ieve with the alkyl chain being less than C12. Figure 7.2.1.1 results are consistent with the
These resultThis is cons
occurs withre data (Doe
nt with the longer) for specific alkyow IFT is difficult to ach
86
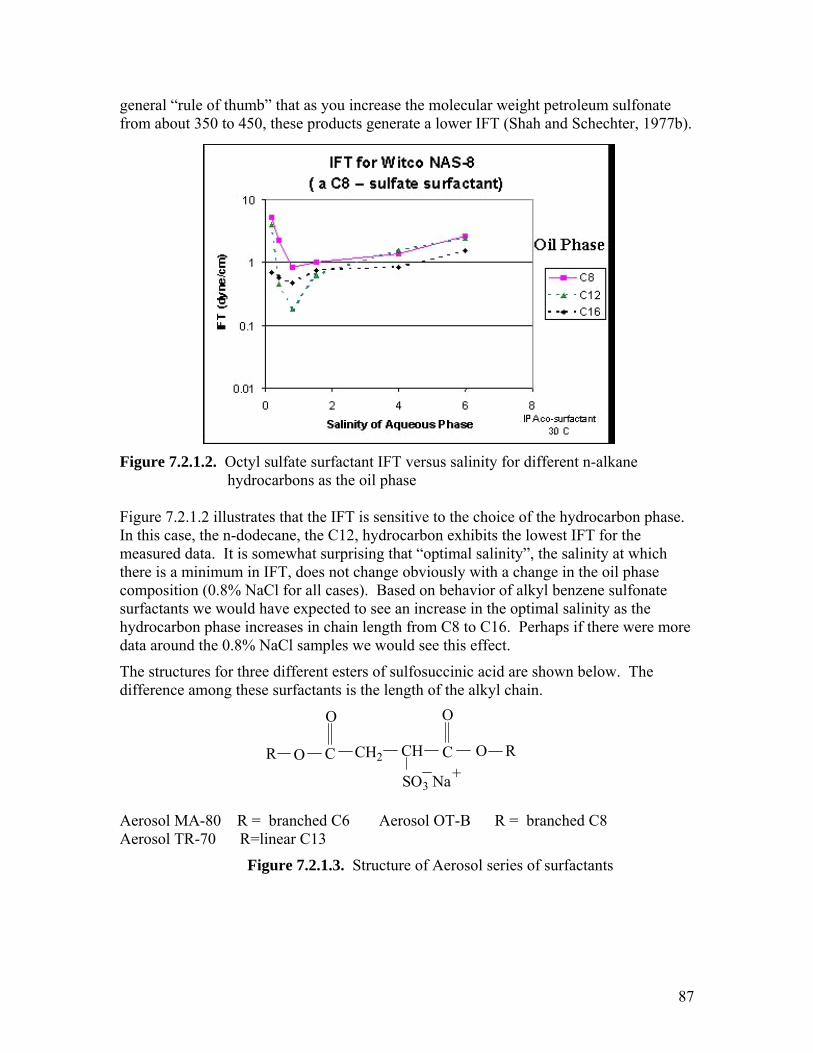
general “rule of thumb” that as yo e molecular sulfonate from about 350 to 450, these products generate a lower IFT (Shah and Schechter, 1977b).
Octyl sulfate surfactant IFT versus salinity for different n-alkane hydrocarbons as the oil phase
lustrates that the IFT is sensitive to the choice of the hydrocarbon phase. this case, the n-dodecane, the C12, hydrocarbon exhibits the lowest IFT for the
ewhat surprising that “optimal salinity”, the salinity at which ere is a minimum in IFT, does not change obviously with a change in the oil phase
omposition (0.8% NaCl for all cases). Based on behavior of alkyl benzene sulfonate rfactants we would have expected to see an increase in the optimal salinity as the
ydrocarbon phase increases in chain length from C8 to C16. Perhaps if there were more ata around the 0.8% NaCl samples we would see this effect.
he structures for three different esters of sulfosuccinic acid are shown below. The ifference among these surfactants is the length of the alkyl chain.
u increase th weight petroleum
Figure 7.2.1.2.
Figure 7.2.1.2 ilInmeasured data. It is somthcsuhd
Td
R O C
O
CH2 CH
SO3 Na
C
O
O R+
Aerosol
erosol TR-70 R=linear C13 MA-80 R = branched C6 Aerosol OT-B R = branched C8
A
Figure 7.2.1.3. Structure of Aerosol series of surfactants
87
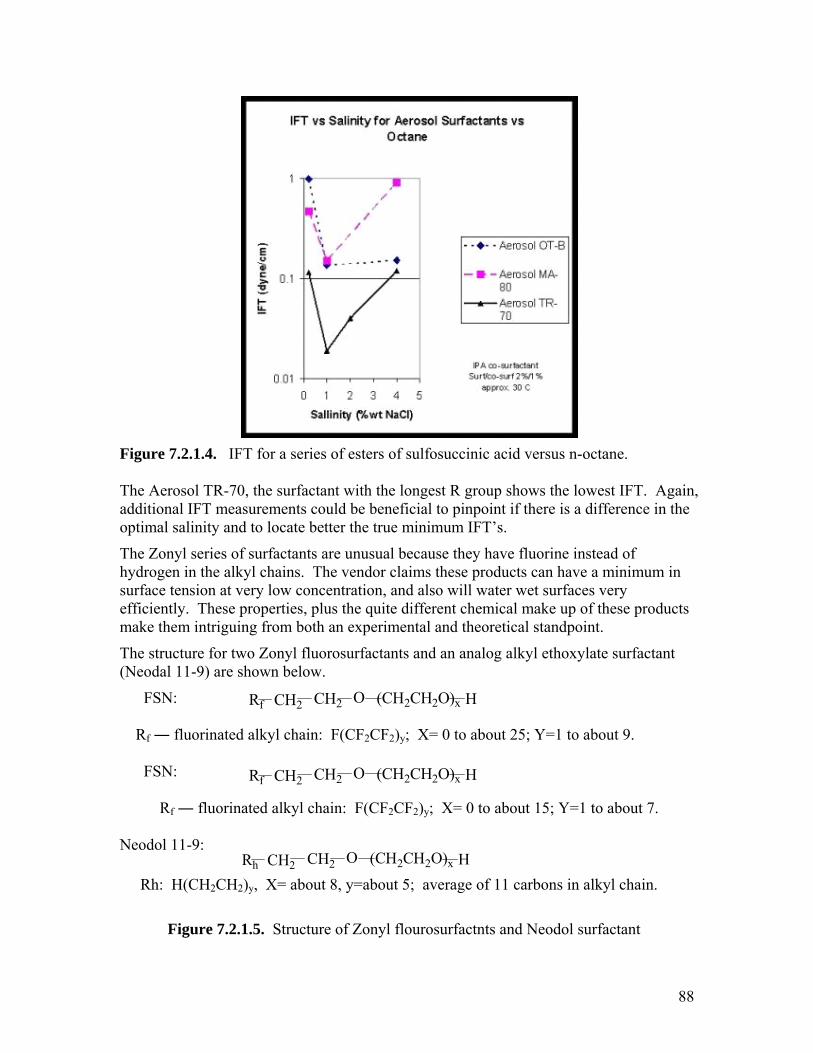
est R group shows the lowest IFT. Again,
in
ucts
la factant
Rf ― fluorinated alkyl chain: F(CF2CF2)y; X= 0 to about 25; Y=1 to about 9. FSN:
2CH2)y, X= about 8, y=about 5; average of 11 carbons in alkyl chain.
.2.1.5. Structure of Zonyl flourosurfactnts and Neodol surfactant
Figure 7.2.1.4. IFT for a series of esters of sulfosuccinic acid versus n-octane.
he Aerosol TR-70, the surfactant with the longTadditional IFT measurements could be beneficial to pinpoint if there is a difference in the optimal salinity and to locate better the true minimum IFT’s.
The Zonyl series of surfactants are unusual because they have fluorine instead of hydrogen in the alkyl chains. The vendor claims these products can have a minimum surface tension at very low concentration, and also will water wet surfaces very efficiently. These properties, plus the quite different chemical make up of these prodmake them intriguing from both an experimental and theoretical standpoint.
The structure for two Zonyl fluorosurfactants and an analog alkyl ethoxy te sur(Neodal 11-9) are shown below.
FSN: R CH CH2 (CH2CH2O)xO Hf 2
CH2 CH2 (CH2CH2O)xO HRf R ― fluorinatedf alkyl chain: F(CF2CF2)y; X= 0 to about 15; Y=1 to about 7. Neodol 11-9: Rh CH2 CH2 (CH2CH2O)xO H Rh: H(CH
Figure 7
88
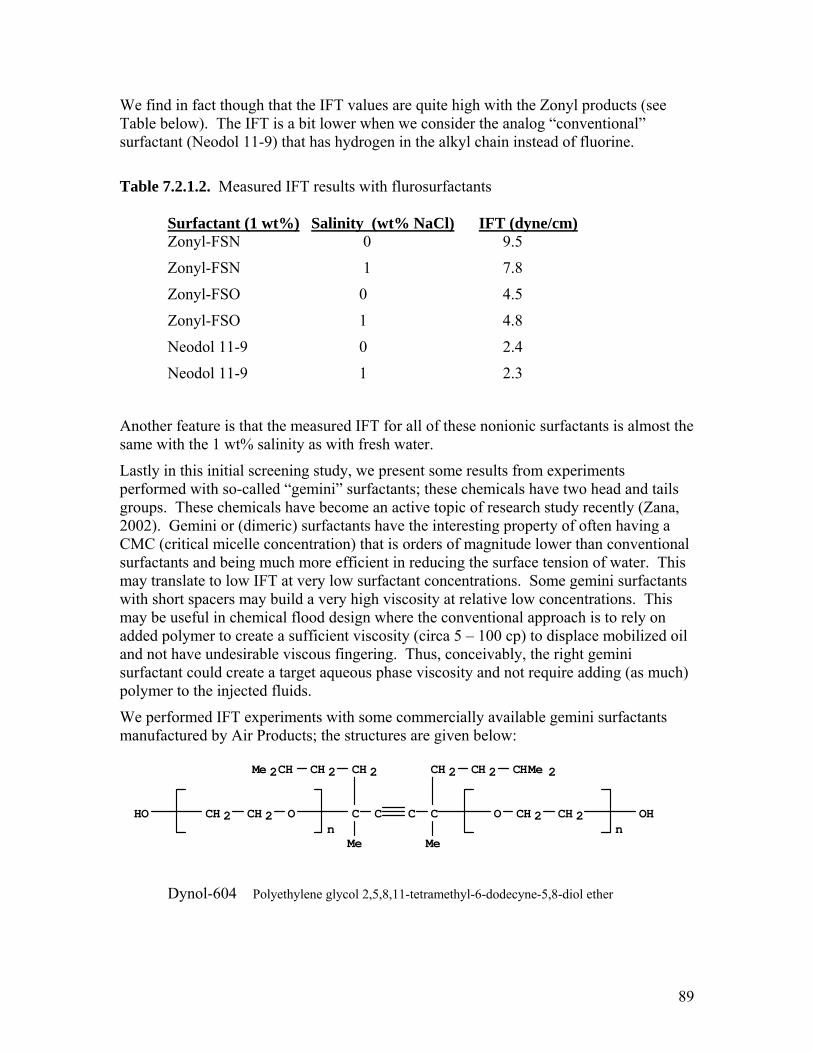
We find in fact though that the IFT values are quite high with the Zonyl products (see able below). The IFT is a bit lower when we consider the analog “conventional” rfactant (Neodol 11-9) that has hydrogen in the alkyl chain instead of fluorine.
ed IFT results with flurosurfactants
Surfactant (1 wt%)
Tsu
able 7.2.1.2. MeasurT
Salinity (wt% NaCl) IFT (dyne/cm)
Zonyl-FSN 0 9.5
Zonyl-FSN 1 7.8
Zonyl-FSO 0 4.5
Zonyl-FSO 1 4.8
Neodol 11-9 0 2.4
Neodol 11-9 1 2.3
nother feature is that the measured IFT for all of these nonionic surfactants is almost the
screening study, we present some results from experiments
perty of often having a ntional
obilized oil
ate a target aqueous phase viscosity an ding (as much) ted fluids.
e performed IFT experiments with some commercially available gemini surfactants
Asame with the 1 wt% salinity as with fresh water.
Lastly in this initialperformed with so-called “gemini” surfactants; these chemicals have two head and tails groups. These chemicals have become an active topic of research study recently (Zana, 2002). Gemini or (dimeric) surfactants have the interesting proCMC (critical micelle concentration) that is orders of magnitude lower than convesurfactants and being much more efficient in reducing the surface tension of water. This may translate to low IFT at very low surfactant concentrations. Some gemini surfactantswith short spacers may build a very high viscosity at relative low concentrations. This may be useful in chemical flood design where the conventional approach is to rely on added polymer to create a sufficient viscosity (circa 5 – 100 cp) to displace mand not have undesirable viscous fingering. Thus, conceivably, the right gemini surfactant could cre d not require adpolymer to the injec
Wmanufactured by Air Products; the structures are given below:
n nMe Me
Me 2CH CHMe 2
Dynol-604 Polyethylene glycol 2,5,8,11-tetramethyl-6-dodecyne-5,8-diol ether
C C
CH 2
O C
CH 2
CH 2 CCH 2
CH 2
OHO
CH 2
CH 2 CH 2 OH
89
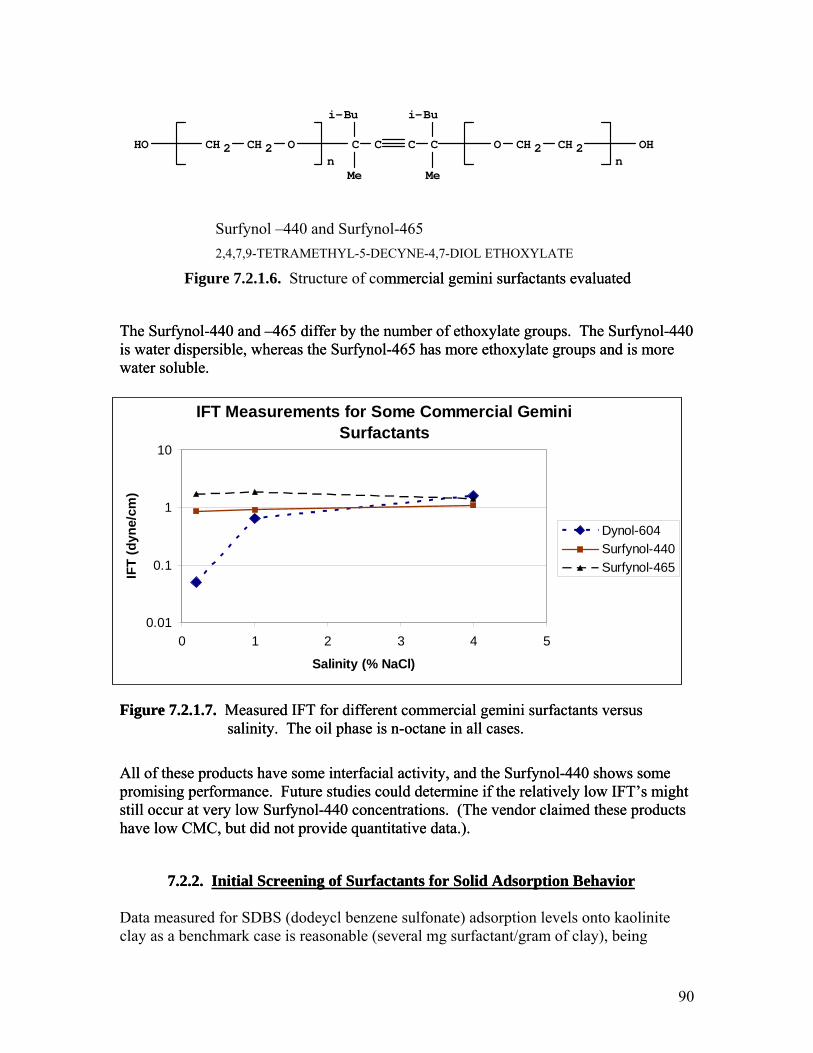
n n
i-Bu i-Bu
C CO CCH 2 CCH 2 OHO CH 2 CH 2 OH
Me Me
9-TETRA YL-5 ECYNE-4,7-D OL ETHOXYLATE
ture o mm tants evaluated
r of ethoxylate groups. The Surfynol-440 wate Surf ol-46 has m eth ate groups and is more
me interfacial activity, and the Surfynol-440 shows some romising performance. Future studies could determine if the relatively low IFT’s might ill occur at very low Surfynol-440 concentrations. (The vendor claimed these products
ovide quantitative data.).
nts for Solid Adsorption Behavior
mm tants evaluated
r of ethoxylate groups. The Surfynol-440 wate Surf ol-46 has m eth ate groups and is more
me interfacial activity, and the Surfynol-440 shows some romising performance. Future studies could determine if the relatively low IFT’s might ill occur at very low Surfynol-440 concentrations. (The vendor claimed these products
ovide quantitative data.).
nts for Solid Adsorption Behavior
Surfynol –440 and Surfynol-465 2,4,7, METH -D I
Figure 7.2.1.6. Struc f co ercial gemini surfacercial gemini surfac
The Surfynol-440 and –465 differ by the numbeThe Surfynol-440 and –465 differ by the numbeis r dispersible, whereas the yn 5 ore oxylis r dispersible, whereas the yn 5 ore oxylwater soluble. water soluble.
IFT Measurements for Some Commercial Gemini Surfactants
10
0.01
0.1
1
0 1 2 3 4 5
Salinity (% NaCl)
IFT
(dyn
e/cm
)
Dynol-604Surfynol-440Surfynol-465
Figure 7.2.1.7. Measured IFT for different commercial gemini surfactants versus salinity. The oil phase is n-octane in all cases.
Figure 7.2.1.7. Measured IFT for different commercial gemini surfactants versus salinity. The oil phase is n-octane in all cases.
All of these products have soAll of these products have soppststhave low CMC, but did not prhave low CMC, but did not pr
7.2.2. Initial Screening of Surfacta 7.2.2. Initial Screening of Surfacta Data measured for SDBS (dodeycl benzene sulfonate) adsorption levels onto kaolinite lay as a benchmark case is reasonable (several mg surfactant/gram of clay), being c
90
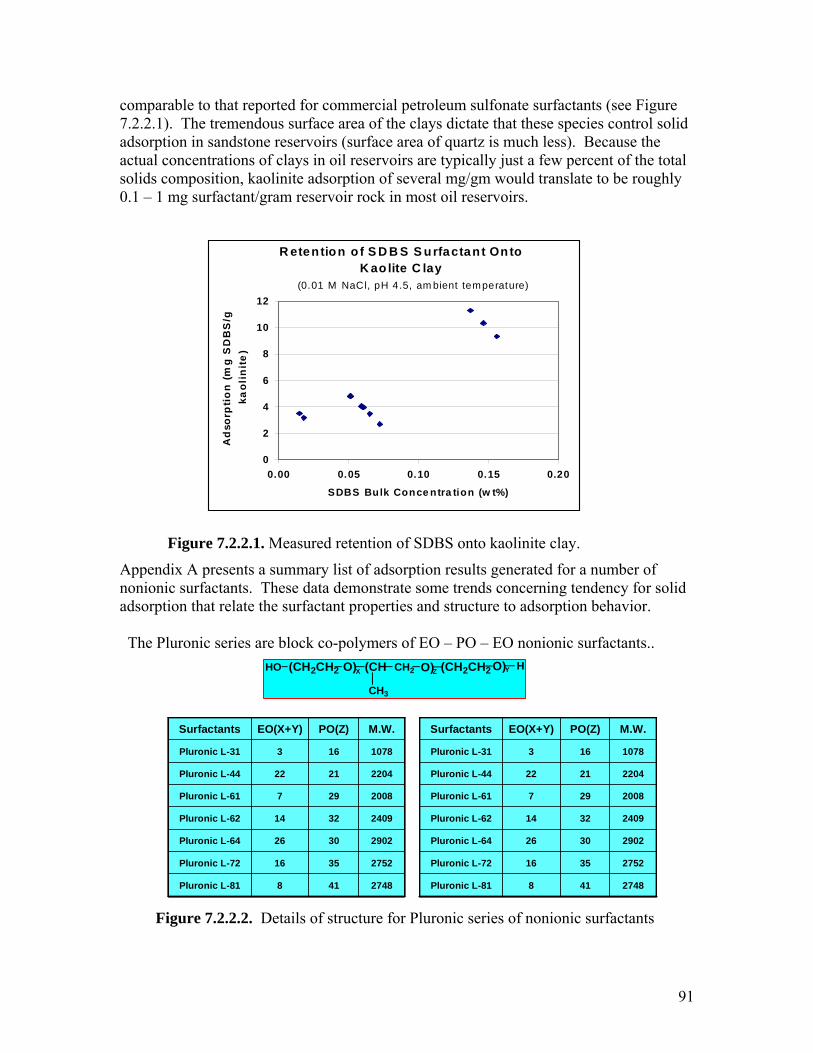
comparable to that reported for commercial petroleum sulfonate surfactants (see Figure .2.2.1). The tremendous surface area of the clays dictate that these species control solid dsorption in sandstone reservoirs (surface area of quartz is much less). Because the ctual concentrations of clays in oil reservoirs are typically just a few percent of the total lids composition, kaolinite adsorption of several mg/gm would translate to be roughly
ram reservoir rock in most oil reservoirs.
Figure 7.2.2.1. Measured retention of SDBS onto kaolinite clay.
ppendix A presents a summary list of adsorption results generated for a number of onionic surfactants. These data demonstrate some trends concerning tendency for solid dsorption that relate the surfactant properties and structure to adsorption behavior.
ers of EO – PO – EO nonionic surfactants..
7aaso0.1 – 1 mg surfactant/g R etention o f S D B S S urfactant Onto
K aolite C lay
Ana The Pluronic series are block co-polym Figure 7.2.2.2. Details of structure for Pluronic series of nonionic surfactants
0
2
4
6
12
0.00 0.05 0.10 0.15 0.20
SDBS Bulk Conce ntra tion (w t%)
Ad
sorp
tio
n (
mg
kaol
init
8
10
g S
DB
S/
e)
(0.01 M NaCl, pH 4.5, am bient temperature)
HO (CH2CH2 O)X (CH CH2 O) H(CH2CH2 O)YZ
CH3
22042122Pluronic L-44
2008297Pluronic L-61
2748418Pluronic L-81
27523516Pluronic L-72
29023026Pluronic L-64
24093214Pluronic L-62
1078163Pluronic L-31
M.W.PO(Z)EO(X+Y)Surfactants
22042122Pluronic L-44
2008297Pluronic L-61
2748418Pluronic L-81
27523516Pluronic L-72
29023026Pluronic L-64
24093214Pluronic L-62
1078163Pluronic L-31
M.W.PO(Z)EO(X+Y)Surfactants
22042122Pluronic L-44
2008297Pluronic L-61
1078163Pluronic L-31
M.W.PO(Z)EO(X+Y)Surfactants
2748418Pluronic L-81
27523516Pluronic L-72
29023026Pluronic L-64
24093214Pluronic L-62
22042122Pluronic L-44
2008297Pluronic L-61
1078163Pluronic L-31
M.W.PO(Z)
2748418Pluronic L-81
27523516Pluronic L-72
29023026Pluronic L-64
24093214Pluronic L-62
EO(X+Y)Surfactants
91
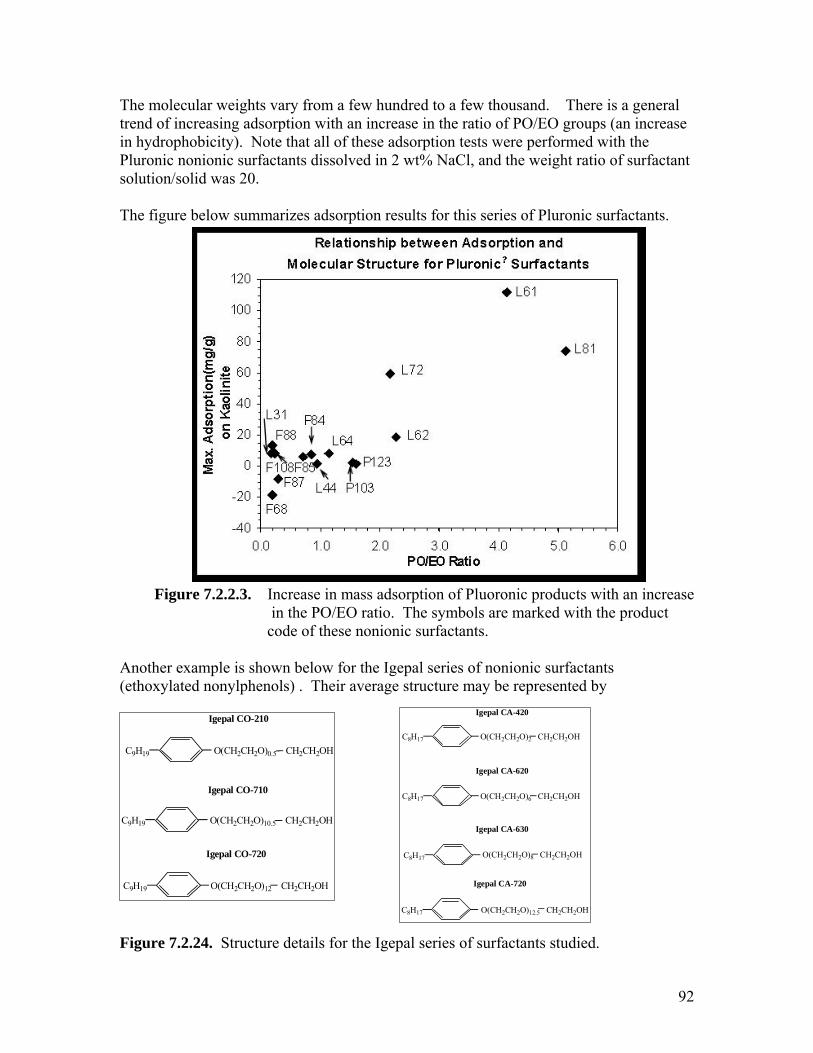
The molecular weights vary from a few hundred to a few thousand. There is a general trend of increasing adsorption with an increase in the ratio of PO/EO groups (an increase in hydrophobicity). Note that all of these adsorption tests were performed with the Pluronic nonionic surfactants dissolved in 2 wt% NaCl, and the weight ratio of surfactant solution/solid was 20. The figure below summarizes adsorption results for this series of Pluronic surfactants.
ample is shown below for the Igepal series of nonionic surfactants nonylphenols) . Their average structure may be represented by
igure 7.2.24. Structure details for the Igepal series of surfactants studied.
Figure 7.2.2.3. Increase in mass adsorption of Pluoronic products with an increase in the PO/EO ratio. The symbols are marked with the product
code of these nonionic surfactants. Another ex(ethoxylated
C8H17 O(CH2CH2O)2 CH2CH2OH
C8H17 O(CH2CH2O)6 CH2CH2OH
C8H17 O(CH2CH2O)8 CH2CH2OH
Igepal CA-620
Igepal CA-630
Igepal CA-420 F
C9H19 O(CH2CH2O)0.5 CH2CH2OH
9H19 O(CH2CH2O)10.5 CH2CH2OH
O( H2
I
C
C9H19 C CH2O)12 CH2CH2OH
gepal CO-210
Igepal CO-710
Igepal CO-720
Igep
C8H17 O(CH2CH2O)12.5 CH2CH2OH
al CA-720
92
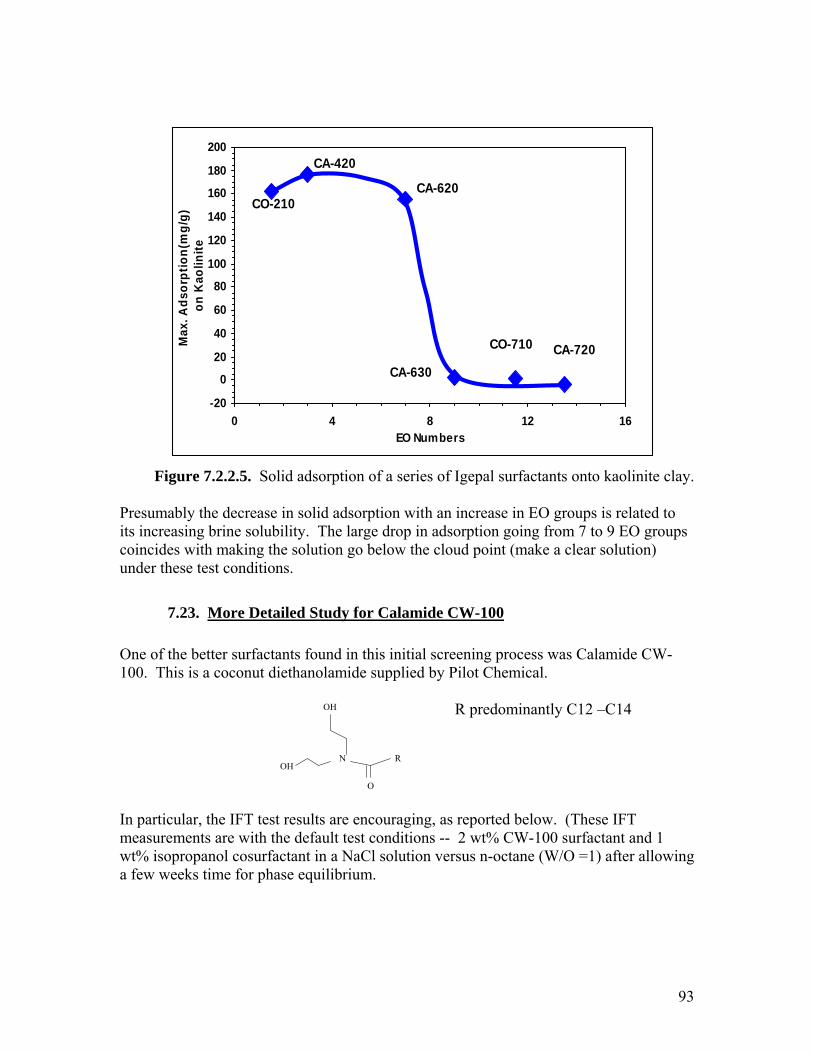
-20
0
20
40
60
80
100
120
180
200
Figure 7.2.2.5. Solid adsorption of a series of Igepal surfactants onto kaolinite clay.
resumably the decrease in solid adsorption with an increase in EO groups is related to s increasing brine solubility. The large drop in adsorption going from 7 to 9 EO groups oincides with making the solution go below the cloud point (make a clear solution) nder these test conditions.
Pitcu
7.23. More Detailed Study for Calamide CW-100
One of the better surfactants found in this initial screening process was Calam100. This is a coconut diethanolamide supplied by Pilot Chemical.
ide CW-
R predominantly C12 –C14
lar, the IFT test results are encouraging, as reported below. (These IFT easurements are with the default test conditions -- 2 wt% CW-100 surfactant and 1 t% isopropanol cosurfactant in a NaCl solution versus n-octane (W/O =1) after allowing
few weeks time for phase equilibrium.
In particumwa
140
g/g)
160
0 4 8 12 16EO Numbers
Max
. Ads
orpt
ion(
mon
Kao
linite
CA-620
CA-630
CO-710 CA-720
CA-420
CO-210
OH
OHN R
O
93
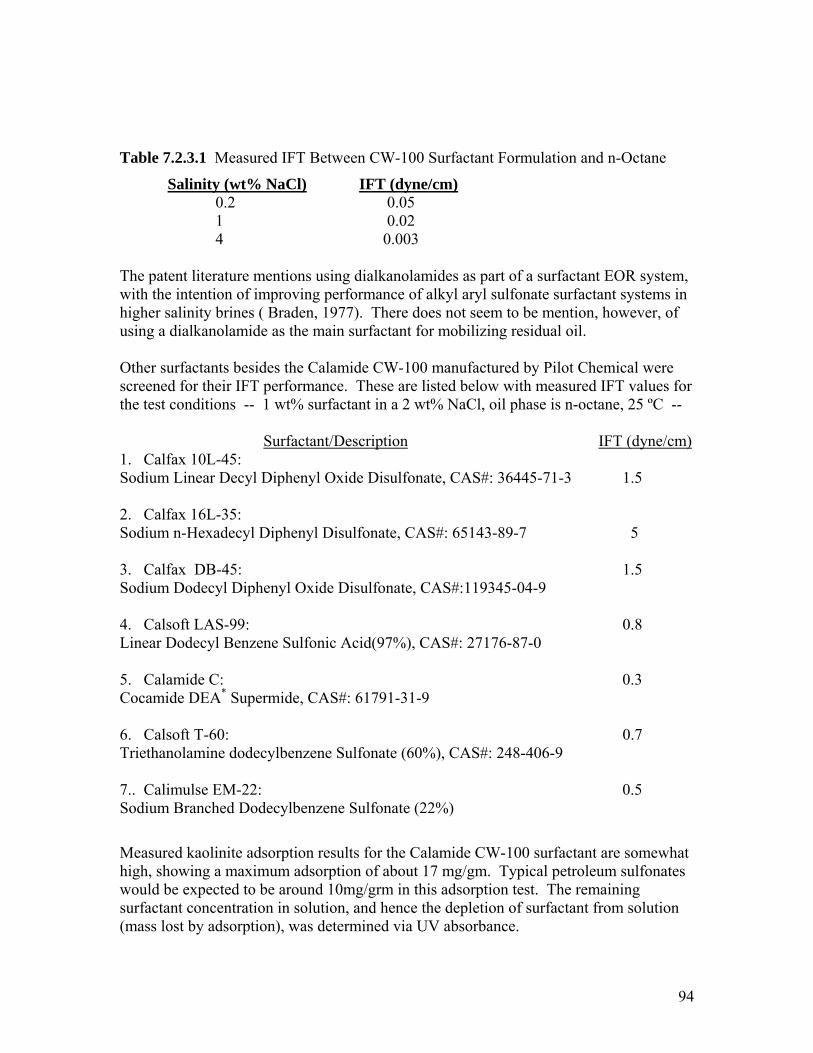
Table 7.2.3.1 Measured IFT Between CW-100 Surfactant Formulation and n-Octane
Salinity (wt% NaCl) IFT (dyne/cm) 0.2 0.05 1 0.02 4 0.003
he patent literature mentions using dialkanolamides as part of a surfactant EOR system, ith the intention of improving performance of alkyl aryl sulfonate surfactant systems in igher salinity brines ( Braden, 1977). There does not seem to be mention, however, of
anolamide as the main surfactant for mobilizing residual oil.
ther surfactants besides the Calamide CW-100 manufactured by Pilot Chemical were reened for their IFT performance. These are listed below with measured IFT values for e test conditions -- 1 wt% surfactant in a 2 wt% NaCl, oil phase is n-octane, 25 ºC --
Surfactant/Description
Twhusing a dialk Oscth IFT (dyne/cm)1. Calfax 10L-45:
1.5 odium Dodecyl Diphenyl Oxide Disulfonate, CAS#:119345-04-9
0.8
0.3
0.7 rietha lamine dodecylbenzene S lfonate (60%), CAS#: 248-406-9
.. Calimulse EM-22: 0.5
bout 17 mg/gm. Typical petroleum sulfonates ould be expected to be around 10mg/grm in this adsorption test. The remaining rfactant concentration in solution, and hence the depletion of surfactant from solution ass lost by adsorption), was determined via UV absorbance.
Sodium Linear Decyl Diphenyl Oxide Disulfonate, CAS#: 36445-71-3 1.5 2. Calfax 16L-35: Sodium n-Hexadecyl Diphenyl Disulfonate, CAS#: 65143-89-7 5 3. Calfax DB-45: S . Calsoft LAS-99: 4
Linear Dodecyl Benzene Sulfonic Acid(97%), CAS#: 27176-87-0 5. Calamide C: Cocamide DEA* Supermide, CAS#: 61791-31-9 . Calsoft T-6 : 6 0
T no u 7Sodium Branched Dodecylbenzene Sulfonate (22%)
Measured kaolinite adsorption results for the Calamide CW-100 surfactant are somewhat high, showing a maximum adsorption of awsu(m
94
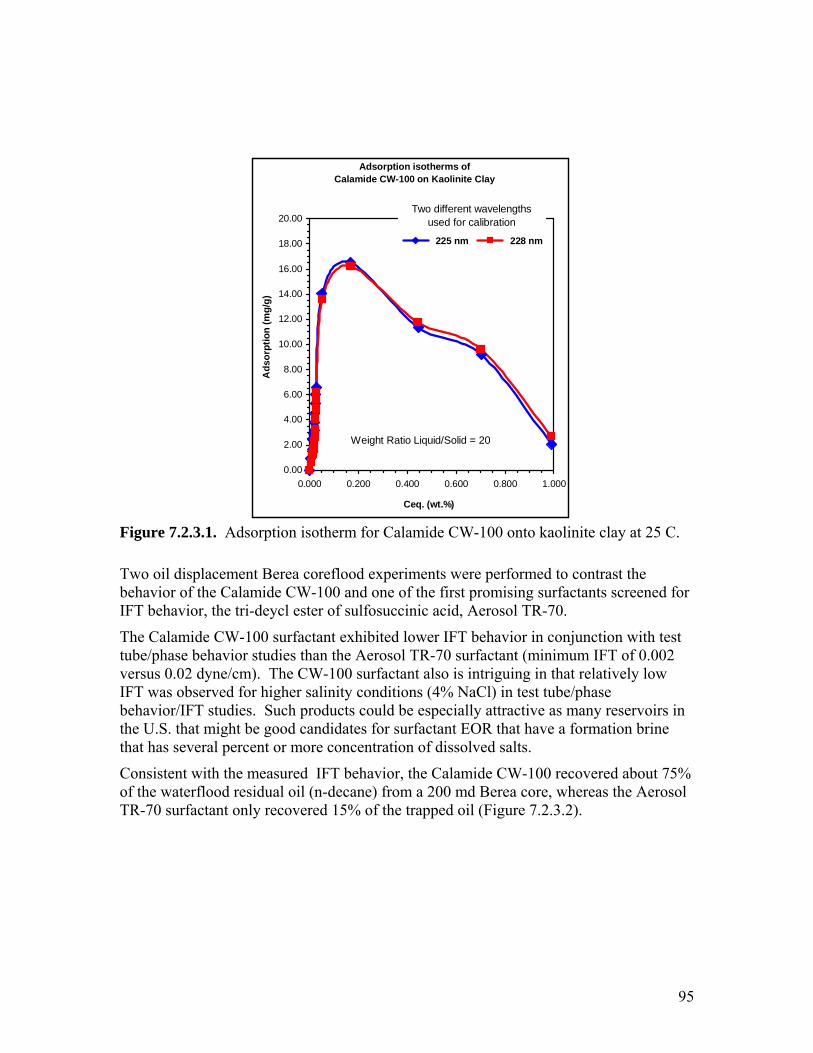
Adsorption isotherms of
Calam e Clay
4.00
18.00
20.00
Ceq. (wt.%)
rp
ide CW-100 on Kaolinit
Figure 7.2.3.1. Adsorption isotherm for Calamide CW-100 onto ao clay at 2 k linite 5 C.
o confactan eened for
T behavior, the tri-deycl ester of sulfosuccinic acid, Aerosol TR-70.
um IFT of 0.002 m). The CW-100 surfactant also is intriguing in w
% aCl) test tuany reservoirs in
t be ood candidates for surfactant EOR that have a form
onsistent with the measured IFT behavior, the Calamide CW-100 recovered about 75% d Berea core, whereas the Aerosol il (Figure 7.2.3.2).
Two oil displacement Berea co d experim t trast the refloo ents were performedbehavior of the Calamide CW-100 and one of the first promising sur ts scrIF
The Calamide CW-100 surfactant exhibited lower IFT behavior in cbe/phase behavior studies than the Aerosol TR-70 surfactant (minim
onjunction with test tuversus 0.02 dyne/c that relatively lo
N in be/phase IFT was observed for higher salinity conditions (4ehavior/IFT studies. Such products could be especially attractive as mb
the U.S. that migh g ation brine that has several percent or more concentration of dissolved salts.
Cof the waterflood residual oil (n-decane) from a 200 mTR-70 surfactant only recovered 15% of the trapped o
0.000.000 0.200 0.400 0.600 0.800 1.000
2.00
6.00
8.00Ads
o
10.00
12.00
14.00
16.00tio
n (m
g/g)
225 nm 228 nm
Weight Ratio Liquid/Solid = 20
Two
o different wavelengthsused f r calibration
95
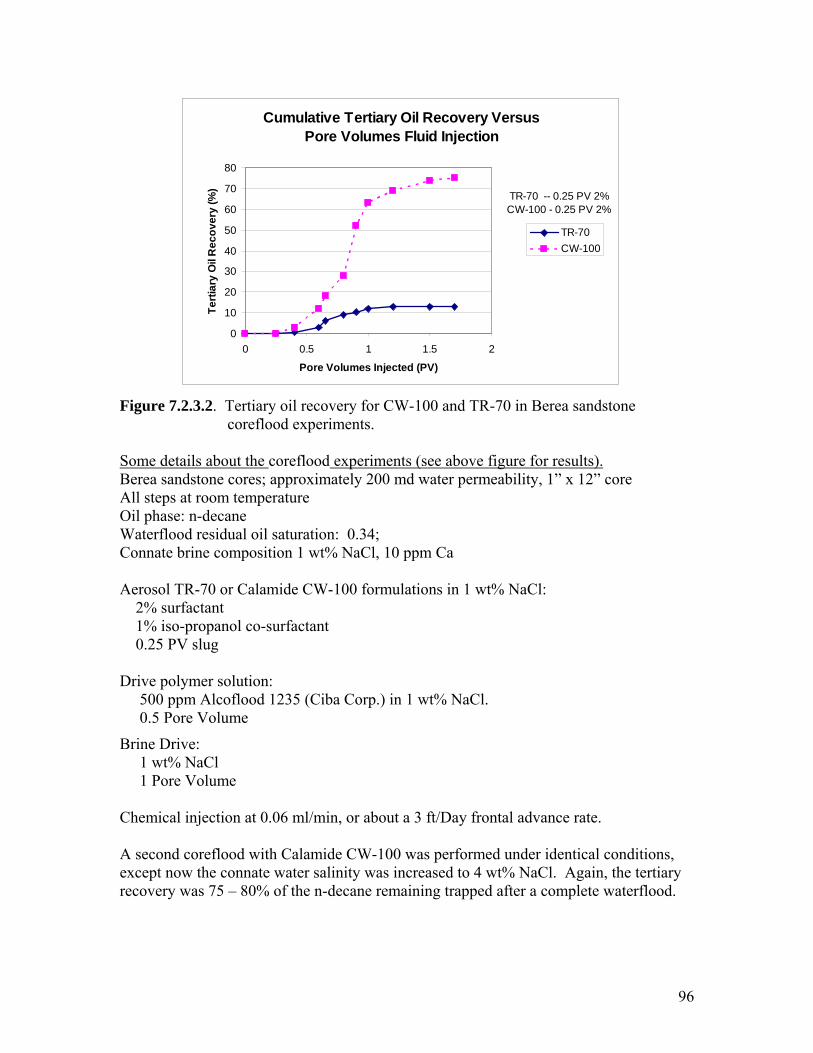
Cumulative Tertiary Oil Recovery Versus Pore Volumes Fluid Injection
0
10
20
30
40
50
60
70
80
0 0.5 1 1.5 2
Pore Volumes Injected (PV)
Terti
ary
Oil
Rec
over
y (%
)
TR-70CW-100
TR-70 -- 0.25 PV 2%CW-100 - 0.25 PV 2%
Figure 7.2.3.2. Tertiary oil recovery for CW-100 and TR-70 in Berea sandstone coreflood experiments.
ome details about the
S coreflood experiments (see above figure for results).
erea sandstone cores; approximately 200 md water permeability, 1” x 12” core ll steps at room temperature il phase: n-decane
onnate brine composition 1 wt% NaCl, 10 ppm Ca
A second coreflood with Calamide CW-100 was performed under identical conditions, except now the connate water salinity was increased to 4 wt% NaCl. Again, the tertiary recovery was 75 – 80% of the n-decane remaining trapped after a complete waterflood.
BAOWaterflood residual oil saturation: 0.34; C Aerosol TR-70 or Calamide CW-100 formulations in 1 wt% NaCl: 2% surfactant 1% iso-propanol co-surfactant 0.25 PV slug Drive polymer solution: 500 ppm Alcoflood 1235 (Ciba Corp.) in 1 wt% NaCl. 0.5 Pore Volume
Brine Drive: 1 wt% NaCl 1 Pore Volume Chemical injection at 0.06 ml/min, or about a 3 ft/Day frontal advance rate.
96
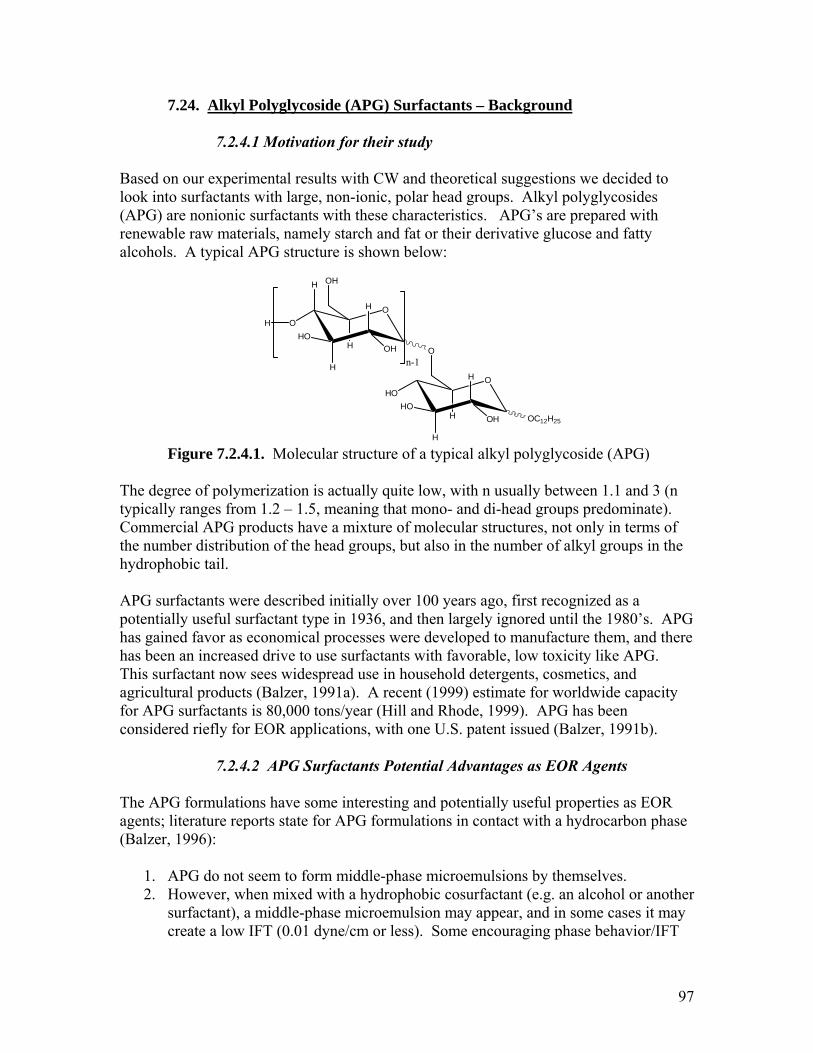
7.24. Alkyl Polyglycoside (APG) Surfactants – Background 7.2.4.1 Motivation for their study Based on our experimental results with CW and theoretical suggestions we decided to look into surfactants with large, non-ionic, polar head groups. Alkyl polyglycosides (APG) are nonionic surfactants with these characteristics. APG’s are prepared with renewable raw materials, namely starch and fat or their derivative glucose and fatty alcohols. A typical APG structure is shown below:
PG)
d 3 (n eaning that mono- and di-head groups predominate).
of molecular structures, not only in terms of the number of alkyl groups in the
936, and then largely ignored until the 1980’s. APG sses were developed to manufacture them, and there
ased drive to use surfactants with favorable, low toxicity like APG. idespread use in household detergents, cosmetics, and
ate for worldwide capacity
OR applications, with one U.S. patent issued (Balzer, 1991b).
2.4.2 APG Surfactants Potential Advantages as EOR Agents
he APG formulations have some interesting and potentially useful properties as EOR arbon phase
alzer, 1996):
r surfactant), a middle-phase microemulsion may appear, and in some cases it may create a low IFT (0.01 dyne/cm or less). Some encouraging phase behavior/IFT
O
H
O
H
HO
H
OHH
OH
H
O
Figure 7.2.4.1. Molecular structure of a typical alkyl polyglycoside (A
HOHO
H OC H
H
H
OH
O
12 25
n-1
is actually quite low, with n usually between 1.1 anThe degree of polymerization
1.2 – 1.5, mtypically ranges fromCommercial APG products have a mixturethe number distribution of the head groups, but also inydrophobic tail. h
re described initially over 100 years ago, first recognized as a APG surfactants we
potentially useful surfactant type in 1 as economical procehas gained favor
as been an increhThis surfactant now sees wagricultural products (Balzer, 1991a). A recent (1999) estim
s 80,000 tons/year (Hill and Rhode, 1999). APG has been for APG surfactants iconsidered riefly for E
7. Tagents; literature reports state for APG formulations in contact with a hydroc(B
1. APG do not seem to form middle-phase microemulsions by themselves. 2. However, when mixed with a hydrophobic cosurfactant (e.g. an alcohol or anothe
97
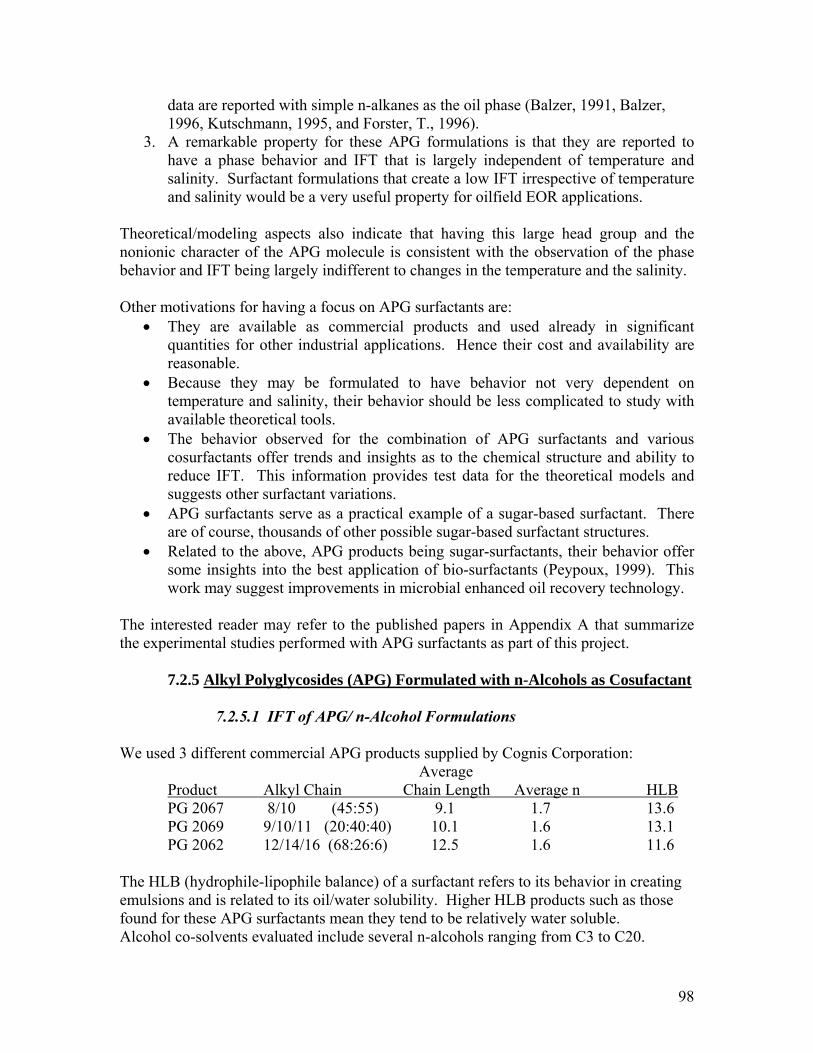
data are reported with simple n-alkanes as the oil phase (Balzer, 1991, Balzer, 1996, Kutschmann, 1995, and Forster, T., 1996).
rmulations is that they are reported to have a phase behavior and IFT that is largely independent of temperature and
re
d the nt with the observation of the phase
ehavior and IFT being largely indifferent to changes in the temperature and the salinity.
ther motivations for having a focus on APG surfactants are: • They are available as commercial products and used already in significant
s for other industrial applications. Hence their cost and availability are reasonable.
• Because they may be formulated to have behavior not very dependent on temperature and salinity, their behavior should be less complicated to study with available theoretical tools.
bserved for the combination of APG surfactants and various ity to
reduce IFT. This information provides test data for the theoretical models and
e
r ts into the best application of bio-surfactants (Peypoux, 1999). This
t
3. A remarkable property for these APG fo
salinity. Surfactant formulations that create a low IFT irrespective of temperatuand salinity would be a very useful property for oilfield EOR applications.
Theoretical/modeling aspects also indicate that having this large head group annonionic character of the APG molecule is consisteb O
quantitie
• The behavior ocosurfactants offer trends and insights as to the chemical structure and abil
suggests other surfactant variations. • APG surfactants serve as a practical example of a sugar-based surfactant. Ther
are of course, thousands of other possible sugar-based surfactant structures. • Related to the above, APG products being sugar-surfactants, their behavior offe
some insighwork may suggest improvements in microbial enhanced oil recovery technology.
The interested reader may refer to the published papers in Appendix A that summarize the experimental studies performed with APG surfactants as part of this project.
7.2.5 Alkyl Polyglycosides (APG) Formulated with n-Alcohols as Cosufactan
e used 3 diffe
7.2.5.1 IFT of APG/ n-Alcohol Formulations
W rent commercial APG products supplied by Cognis Corporation:
Average Product Alkyl Chain Chain Length Average n HLB
12/14/16 (68:26:6) 12.5 1.6 11.6 Theemfound fAlcoho
PG 2067 8/10 (45:55) 9.1 1.7 13.6 PG 2069 9/10/11 (20:40:40) 10.1 1.6 13.1 PG 2062
HLB (hydrophile-lipophile balance) of a surfactant refers to its behavior in creating ulsions and is related to its oil/water solubility. Higher HLB products such as those
or these APG surfactants mean they tend to be relatively water soluble. l co-solvents evaluated include several n-alcohols ranging from C3 to C20.
98
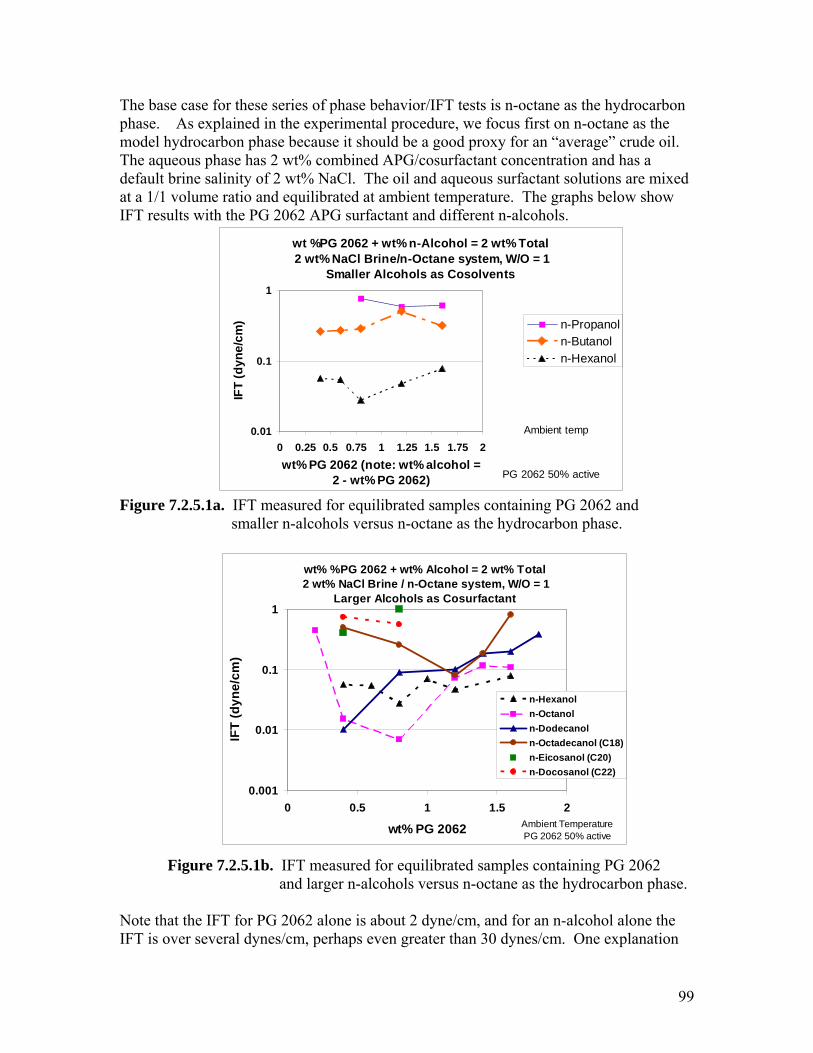
The ba n phase. focus first on n-octane as the moThe aqudefaultat a 1/1 ow
T results with the PG 2062 APG surfactant and different n-alcohols.
se case for these series of phase behavior/IFT tests is n-octane as the hydrocarbo As explained in the experimental procedure, we
del hydrocarbon phase because it should be a good proxy for an “average” crude oil. eous phase has 2 wt% combined APG/cosurfactant concentration and has a
brine salinity of 2 wt% NaCl. The oil and aqueous surfactant solutions are mixed volume ratio and equilibrated at ambient temperature. The graphs below sh
IF
wt %PG 2062 + wt% n-Alcohol = 2 wt% Total 2 wt% NaCl Brine/n-Octane system, W/O = 1
Smaller Alcohols as Cosolvents
0.1
1
dyne
/cm
) n-Propanoln-Butanol
IFT
(
0.010 0.25 0.5 0.75 1 1.25 1.5 1.75 2wt% PG 2062 (note: wt% alcohol =
2 - wt% PG 2062)
n-Hexanol
Ambient temp
PG 2062 50% active
Fig e
ur 7.2.5.1a. IFT measured for equilibrated samples containing PG 2062 and smaller n-alcohols versus n-octane as the hydrocarbon phase.
wt% %PG 2062 + wt% Alcohol = 2 wt% Total 2 wt% NaCl Brine / n-Octane system, W/O = 1
Larger Alcohols as Cosurfactant
0.
0.01
1
2
%
)
0.1
e/cm
n-Hexanoln-Octanoln-Dodecanol
0010 0.5 1 1.5
wt PG 2062
IFT
(dyn
n-Octadecanol (C18)n-Eicosanol (C20)n-Docosanol (C22)
Ambient T uremperat e 50% act e
Figure 7.2.5.1b. IFT measured for equilibrated samples containing PG 2062
one the on
PG 2062 iv
and larger n-alcohols versus n-octane as the hydrocarbon phase.
Note that the IFT for PG 2062 alone is about 2 dyne/cm, and for an n-alcohol alIFT is over several dynes/cm, perhaps even greater than 30 dynes/cm. One explanati
99
for the synergistic action of the added alcohols is that they pack at the interface so as to decrease the curvature of the interfacial layer and thereby reduce the IFT. Perhaps the notion of a “hydrophobic linker” is a good physical model for the action of these cosurfactants (Sabatini, 2001), that is, an additive for linking the oil and surfactant molecules better at the interface. Some other comments about these results:
• There is an “optimal” alcohol cosurfactant (in this system n-octanol or perhaps n-decanol) that creates the lowest IFT condition. The lowest IFT measured was less than 0.01 dyne/cm.
• Almost all of the samples indicated in Figure 7.2.5.1 had a third, middle-phase,
even if only a small volume. Even the samples with PG 2062 mixed with the most unfavorable cosurfactant (n-propanol) has at least a small middle phase.
• The IFT behavior versus the amount of APG and n-alcohol are fairly constant.
This suggests the desirable result that the low IFT condition may be attained with even a modest concentration of APG surfactant. In addition, we see that changes in the APG/cosurfactant ratio may not adversely impact the IFT. Note, for example, the results with n-dodecanol as a cosurfactant; extrapolation suggests even lower IFT might be found at a PG 2062 concentration below 0.25 wt% (less
FT onditions (PG 2062 and n-octanol formulation) had good reproducibility.
Table 7.2.5.1. Replicate Measurements at a Low IFT Condition
Sample
than 0.125 wt% on an active basis).
Replicate spinning drop measurements of these samples with one of the lowest Ic
IFT (dyne/cm) 65 0.007
142 0.004 143 0.007 Test Conditions: aqueous phase: PG 2062 0.8 wt% (as is) and 1.2 wt% n-octanol in a 2 wt% NaCl
oil phase: n-octane W/O ratio = 1; Phases equilibrated and IFT measured at room temperature Figure 7.2.5.2 summarizes data that compares the IFT measured among the 3 different commercial APG surfactants. The trend is that increasing the alkyl chain length of the f the h bic surfactant tail provides a lower IFT. That is, with regards to IFT, the
perform
PG 2062 < PG 2069 < PG 2067
o ydrophoance of APG commercial products follows the sequence (lower to higher IFT)
100
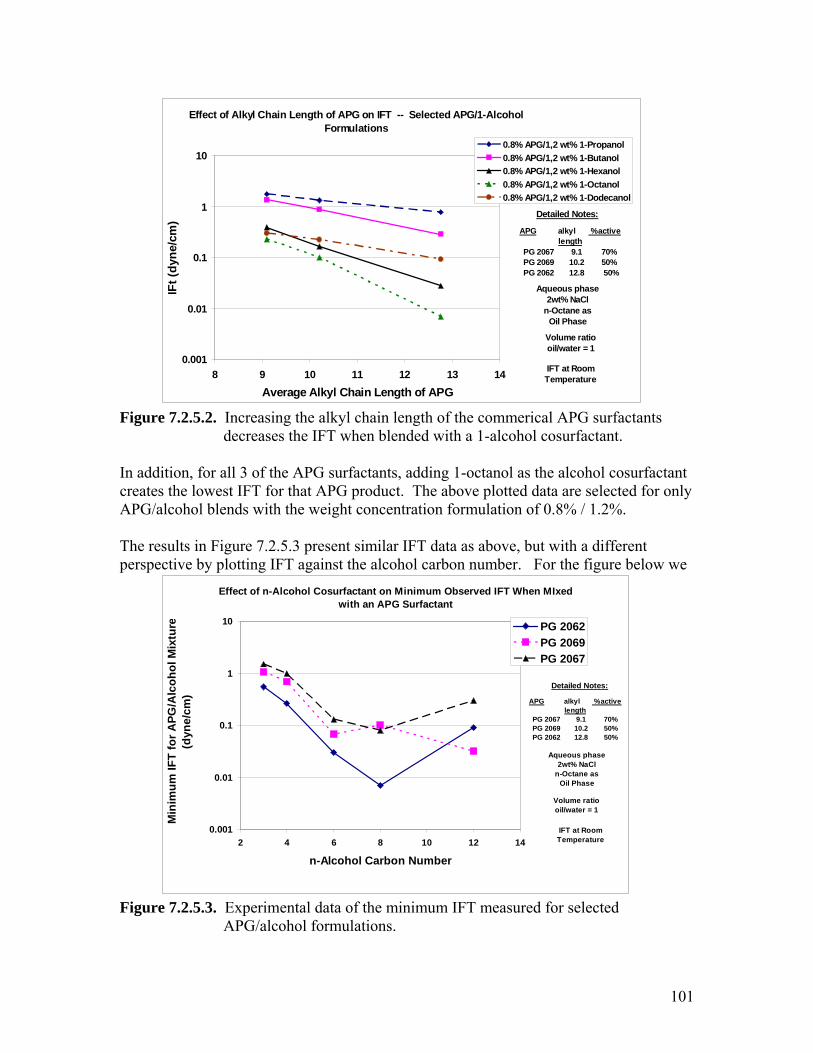
Effect of Alkyl Chain Length of APG on IFT -- Selected APG/1-Alcohol Formulations
100.8% APG/1,2 wt% 1-Propanol0.8% APG/1,2 wt% 1-Butanol0.8% APG/1,2 wt% 1-Hexanol
1
)cm
0.001
IF
0.01
0.1yne/
8 9 10 11 12 13 14Average Alkyl Chain Length of APG
t (d
0.8% APG/1,2 wt% 1-Octanol0.8% APG/1,2 wt% 1-Dodecanol
Detailed Notes:
APG alkyl %activelength
PG 2067 9.1 70%PG 2069 10.2 50% PG 2062 12.8 50%
Aqueous phase
IFT at Room
Figure In addicreates the lowest IFT for that APG product. The above plotted data are selected for only APG/alcohol blends with the weight concentration formulation of 0.8% / 1.2%.
erent erspective by plotting IFT against the alcohol carbon number. For the figure below we
2wt% NaCln-Octane as
Oil Phase
Volume ratio oil/water = 1
Temperature
7.2.5.2. Increasing the alkyl chain length of the commerical APG surfactants decreases the IFT when blended with a 1-alcohol cosurfactant.
tion, for all 3 of the APG surfactants, adding 1-octanol as the alcohol cosurfactant
The results in Figure 7.2.5.3 present similar IFT data as above, but with a diffp
Effect of n-Alcohol Cosurfactant on Minimum Observed IFT When MIxed with an APG Surfactant
1
10rel M
ixtu
oho
0.001
Min
imu
0.01m IF
0.1
or A
PG/A
lc
2 4 6 8 10 12 14
n-Alcohol Carbon Number
T f (d
yne/
cm)
PG 2062PG 2069PG 2067
Detailed Notes:
APG alkyl %activelength
PG 2067 9.1 70%PG 2069 10.2 50%PG 2062 12.8 50%
Aqueous phase 2wt% NaCl
n-Octane as Oil Phase
Figure 7.2.5.3. Exper measured for selected APG/alcohol formulations.
Volume ratio oil/water = 1
IFT at Room Temperature
imental data of the minimum IFT
101
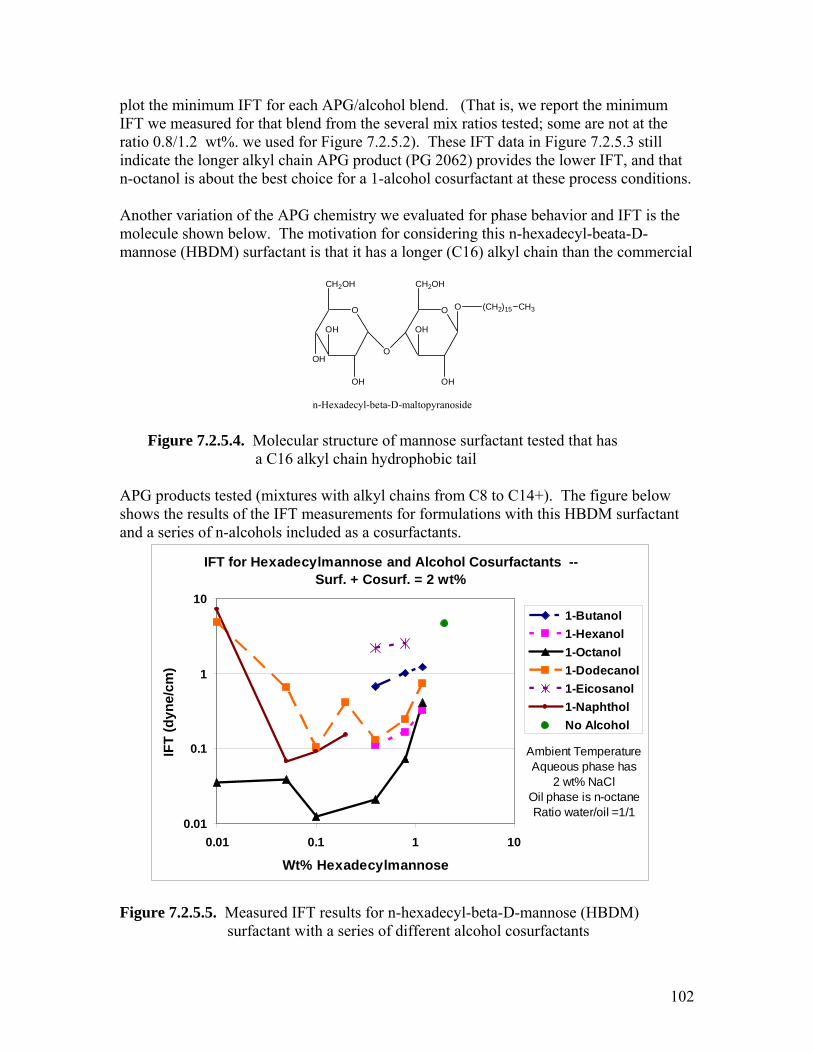
plot the minimum IFT for each APG/alcohol blend. (That is, we report the minimum IFT we measured for that blend from the several mix ratios tested; some are not at the ratio 0.8/1.2 wt%. we used for Figure 7.2.5.2). These IFT data in Figure 7.2.5.3 still indicate the longer alkyl chain APG product (PG 2062) provides the lower IFT, and that n-octanol is about the best choice for a 1-alcohol cosurfactant at these process conditions. Another variation of the APG chemistry we evaluated for phase behavior and IFT is the molecule shown below. The motivation for considering this n-hexadecyl-beata-D-mannose (HBDM) surfactant is that it has a longer (C16) alkyl chain than the commercial
O
O
O
CH2OH
OH
OH
OH
CH2OH
OH
OH
O (CH2)15 CH3
n-Hexadecyl-beta-D-maltopyranoside Figure 7.2.5.4. Molecular structure of mannose surfactant tested that has a C16 alkyl chain hydrophobic tail
factant
APG products tested (mixtures with alkyl chains from C8 to C14+). The figure below shows the results of the IFT measurements for formulations with this HBDM surand a series of n-alcohols included as a cosurfactants.
IFT for Hexadecylmannose and Alcohol Cosurfactants -- Surf. + Cosurf. = 2 wt%
0.01
0.1
1
10
0.01 0.1 1 10
Wt% Hexadecylmannose
IFT
(dyn
e/cm
)
1-Butanol1-Hexanol1-Octanol1-Dodecanol1-Eicosanol1-NaphtholNo Alcohol
Ambient TemperatureAqueous phase has
2 wt% NaClOil phase is n-octaneRatio water/oil =1/1
) ferent alcohol cosurfactants
Figure 7.2.5.5. Measured IFT results for n-hexadecyl-beta-D-mannose (HBDM surfactant with a series of dif
102
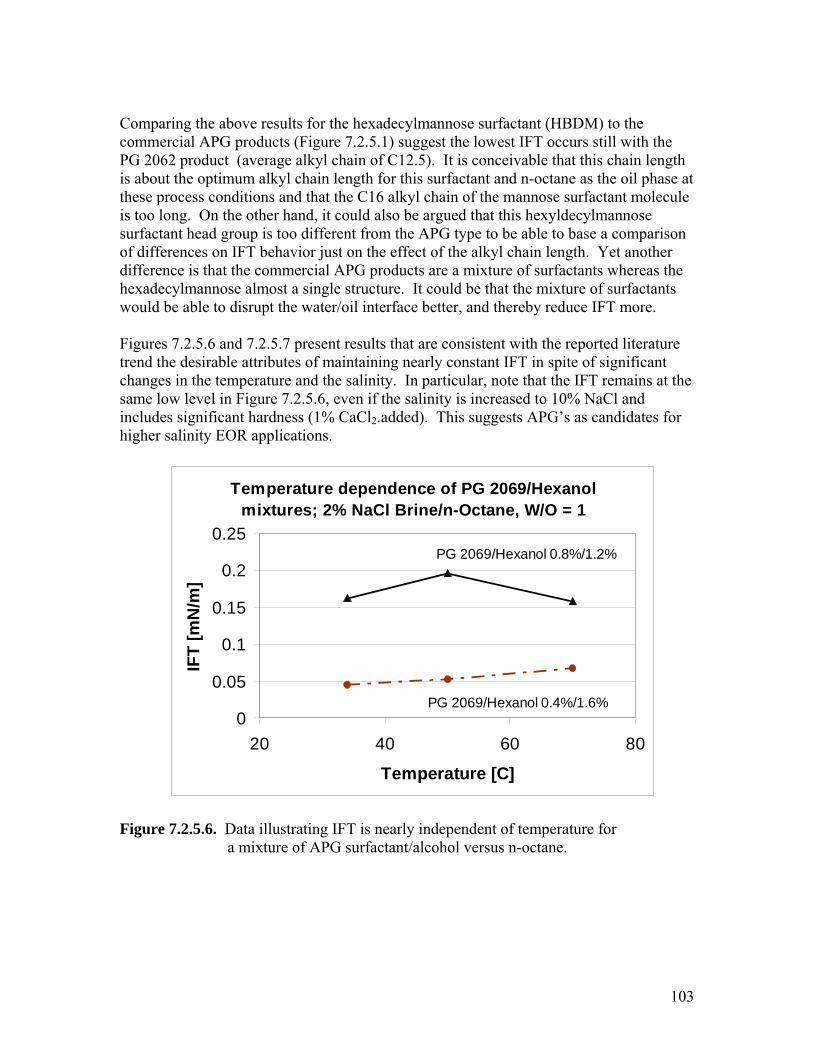
Comparing the above results for the hexadecylmannose surfactant (HBDM) to the commercial APG products (Figure 7.2.5.1) suggest the lowest IFT occurs still with thePG 2062 product (average alkyl chain of C12.5). It is conceivable that this chain length is about the optimum alkyl chain length for this surfactant and n-octane as the oil phase at
ese process conditions and that the C16 alkyl chain of the mannose surfactant molecule
ifference is that the commercial APG products are a mixture of surfactants whereas the hexadecylmannose almost a single structure. It could be that the mixture of surfactants would be able to disrupt the water/oil interface better, and thereby reduce IFT more. Figures 7.2.5.6 and 7.2.5.7 present results that are consistent with the reported literature trend the desirable attributes of maintaining nearly constant IFT in spite of significant changes in the temperature and the salinity. In particular, note that the IFT remains at the
6, even if the salinity is increased to 10% NaCl and % CaCl2.added). This suggests APG’s as candidates for
this too long. On the other hand, it could also be argued that this hexyldecylmannose surfactant head group is too different from the APG type to be able to base a comparison of differences on IFT behavior just on the effect of the alkyl chain length. Yet another d
same low level in Figure 7.2.5.ncludes significant hardness (1i
higher salinity EOR applications.
Temperature dependence of PG 2069/Hexanol mixtures; 2% NaCl Brine/n-Octane, W/O = 1
0.25
0
0.05
0.1
0.15
0.2
20 40 60 80
Temperature [C]
IFT
[mN
/m]
PG 2069/Hexanol 0.8%/1.2%
PG 2069/Hexanol 0.4%/1.6%
Figure 7.2.5.6. Data illustrating IFT is nearly independent of temperature for a mixture of APG surfactant/alcohol versus n-octane.
103
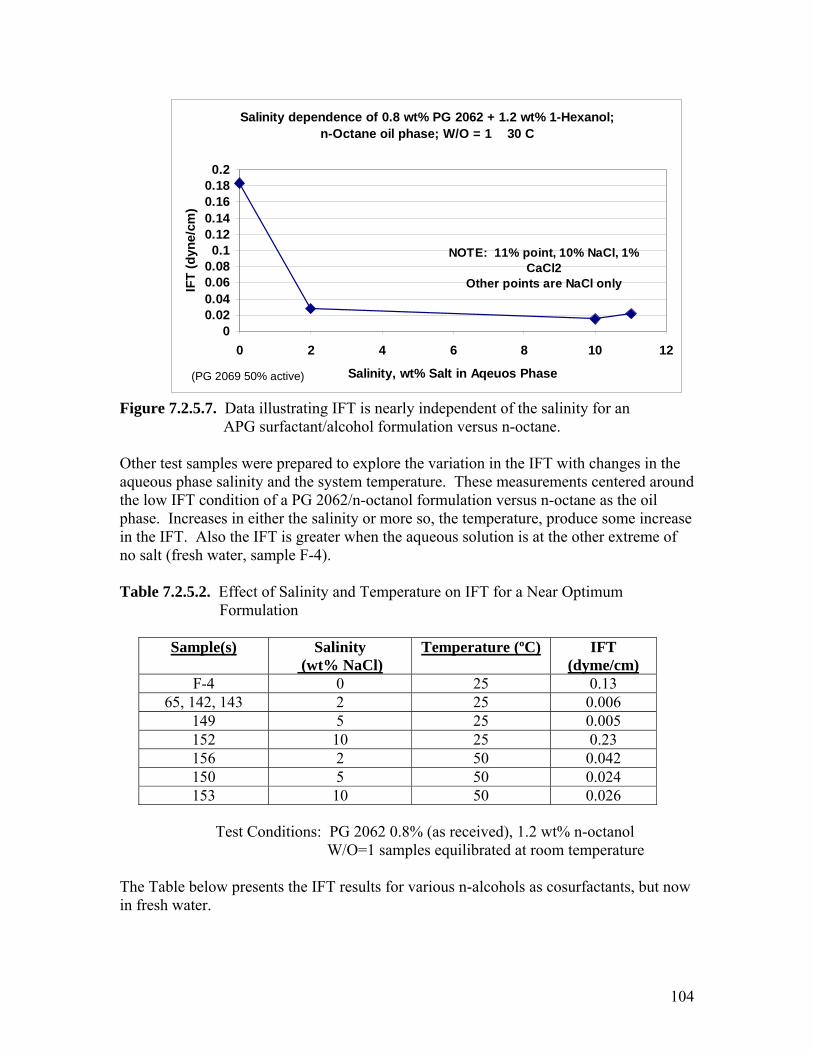
Salinity dependence of 0.8 wt% PG 2062 + 1.2 wt% 1-Hexanol;n-Octane oil phase; W/O = 1 30 C
0.020.040.060.080.1
0.120.140.160.180.2
IFT
(dyn
e/cm
)
00 2 4 6 8 10 12
Salinity, wt% Salt in Aqeuos Phase
NOTE: 11% point, 10% NaCl, 1% CaCl2
Other points are NaCl only
(PG 2069 50% active)
Figure 7.2.5.7. Data illustrating IFT is nearly independent of the salinity for an APG surfactant/alcohol formulation versus n-octane. Other test samples were prepared to explore the variation in the IFT with changes in the aqueous phase salinity and the system temperature. These measurements centered around the low IFT condition of a PG 2062/n-octanol formulation versus n-octane as the oil phase. Increases in either the salinity or more so, the temperature, produce some increase in the IFT. Also the IFT is greater when the aqueous solution is at the other extreme of no salt (fresh water, sample F-4). Table 7.2.5.2. Effect of Salinity and Temperature on IFT for a Near Optimum Formulation
Sample(s) Salinity (wt% NaCl)
Temperature (ºC) IFT (dyme/cm)
F-4 0 25 0.13 65, 142, 143 2 25 0.006
149 5 25 0.005 152 10 25 0.23 156 2 50 0.042 150 5 50 0.024 153 10 50 0.026
Test Conditions: PG 2062 0.8% (as received), 1.2 wt% n-octanol
mperature
The Table below presents the IFT results for various n-alcohols as cosurfactants, but now in fresh water.
W/O=1 samples equilibrated at room te
104
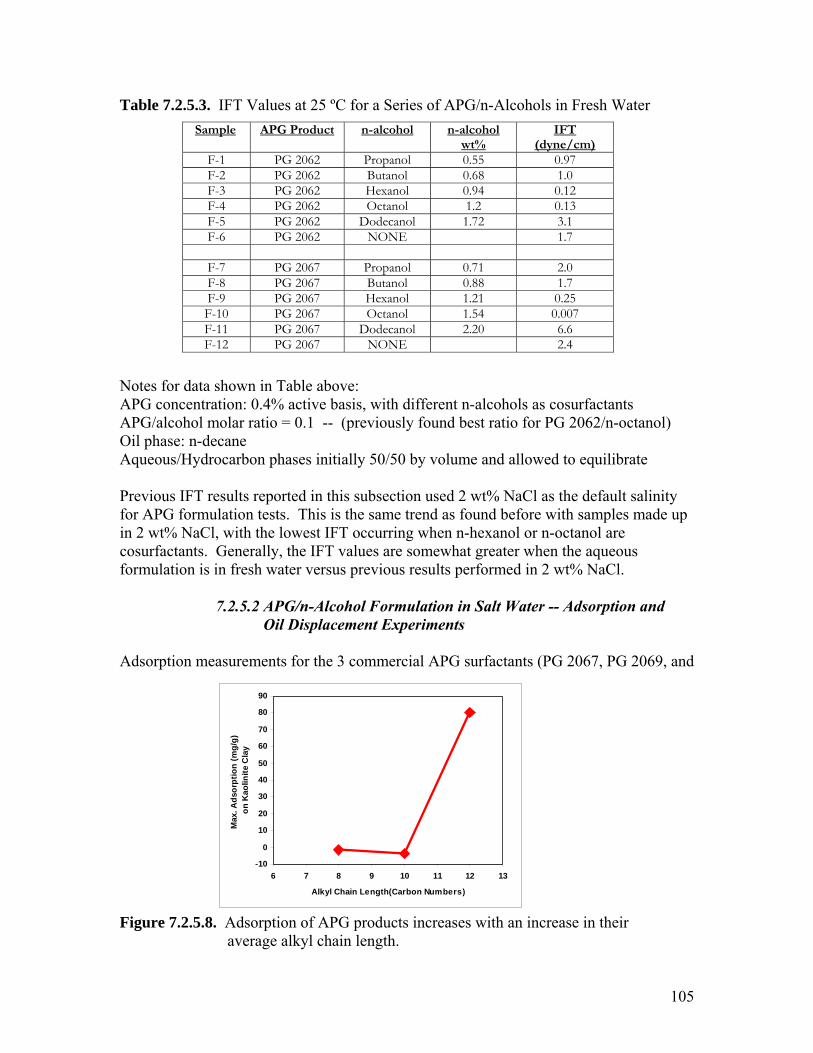
Table 7.2.5.3. IFT Values at 25 ºC for a Series of APG/n-Alcohols in Fresh Water
Sample APG Product n-alcohol n-alcohol wt%
IFT (dyne/cm)
F-1 PG 2062 Propanol 0.55 0.97 F-2 PG 2062 Butanol 0.68 1.0 F-3 PG 2062 Hexanol 0.94 0.12 F-4 PG 2062 Octanol 1.2 0.13 F-5 PG 2062 Dodecanol 1.72 3.1 F-6 PG 2062 NONE 1.7
F-7 PG 2067 Propanol 0.71 2.0 F-8 PG 2067 Butanol 0.88 1.7 F-9 PG 2067 Hexanol 1.21 0.25 F-10 PG 2067 Octanol 1.54 0.007 F-11 PG 2067 Dodecanol 2.20 6.6 F-12 PG 2067 NONE 2.4
Notes for data shown in Table above:
062/n-octanol) il phase: n-decane
lues are somewhat greater when the aqueous evious results performed in 2 wt% NaCl.
-Alcohol Formulation in Salt Water -- Adsorption and Oil Displacement Experiments
Adsorption measurements for the 3 commercial APG surfactants (PG 2067, PG 2069, and
igure 7.2.5.8. Adsorption of APG products increases with an increase in their average alkyl chain length.
APG concentration: 0.4% active basis, with different n-alcohols as cosurfactants APG/alcohol molar ratio = 0.1 -- (previously found best ratio for PG 2OAqueous/Hydrocarbon phases initially 50/50 by volume and allowed to equilibrate Previous IFT results reported in this subsection used 2 wt% NaCl as the default salinity for APG formulation tests. This is the same trend as found before with samples made up in 2 wt% NaCl, with the lowest IFT occurring when n-hexanol or n-octanol are cosurfactants. Generally, the IFT va
rmulation is in fresh water versus prfo 7.2.5.2 APG/n
-10
10Ma
20
30
40
50
60
70
80
90
x. A
dsor
ptio
n (m
g/g)
on K
aolin
ite C
lay
0
6 7 8 9 10 11 12 13
Alkyl Chain Length(Carbon Numbers)
F
105
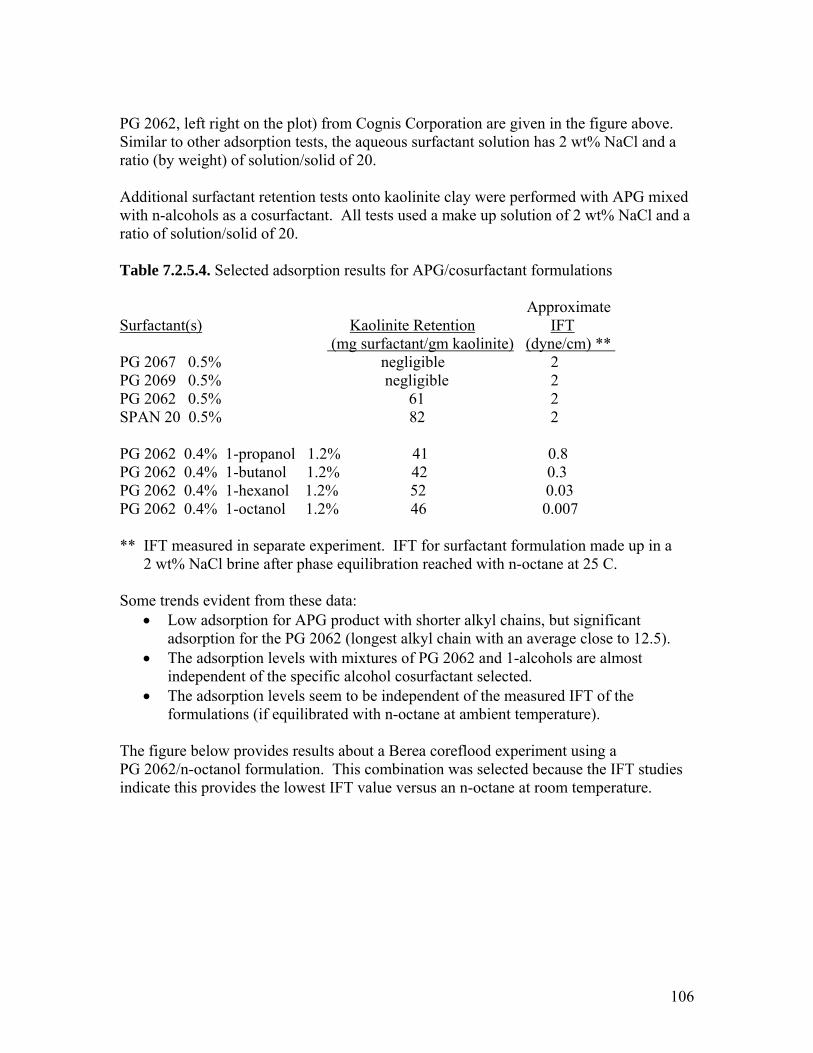
PG 2062, left right on the plot) from Cognis Corporation are given in the figure above. Similar to other adsorption tests, the aqueous surfactant solution has 2 wt% NaCl and a ratio (by weight) of solution/solid of 20. Additional surfactant retention tests onto kaolinite clay were performed with APG mixed with n-alcohols as a cosurfactant. All tests used a make up solution of 2 wt% NaCl and a ratio of solution/solid of 20. Table 7.2.5.4. Selected adsorption results for APG/cosurfactant formulations Approximate Surfactant(s) Kaolinite Retention IFT (mg surfactant/gm kaolinite) (dyne/cm) ** PG 2067 0.5% negligible 2
negligible 2
in a
Some trends ev• Low adsorption for APG product with shorter alkyl chains, but significant
adsorption for the PG 2062 (longest alkyl ch
independent of the specific alcohol cosurfactant selected. rption levels seem to be independent of the measured IFT of the
formulations (if equilibrated with n-octane at ambient temperature).
he figure below provides results about a Berea coreflood experiment using a G 2062/n-octanol formulation. This combination was selected because the IFT studies dicate this provides the lowest IFT value versus an n-octane at room temperature.
PG 2069 0.5% PG 2062 0.5% 61 2 SPAN 20 0.5% 82 2 PG 2062 0.4% 1-propanol 1.2% 41 0.8
G 2062 0.4% 1-butanol 1.2% 42 0.3 PPG 2062 0.4% 1-hexanol 1.2% 52 0.03 PG 2062 0.4% 1-octanol 1.2% 46 0.007 ** IFT measured in separate experiment. IFT for surfactant formulation made up 2 wt% NaCl brine after phase equilibration reached with n-octane at 25 C.
ident from these data:
ain with an average close to 12.5). • The adsorption levels with mixtures of PG 2062 and 1-alcohols are almost
• The adso
TPin
106
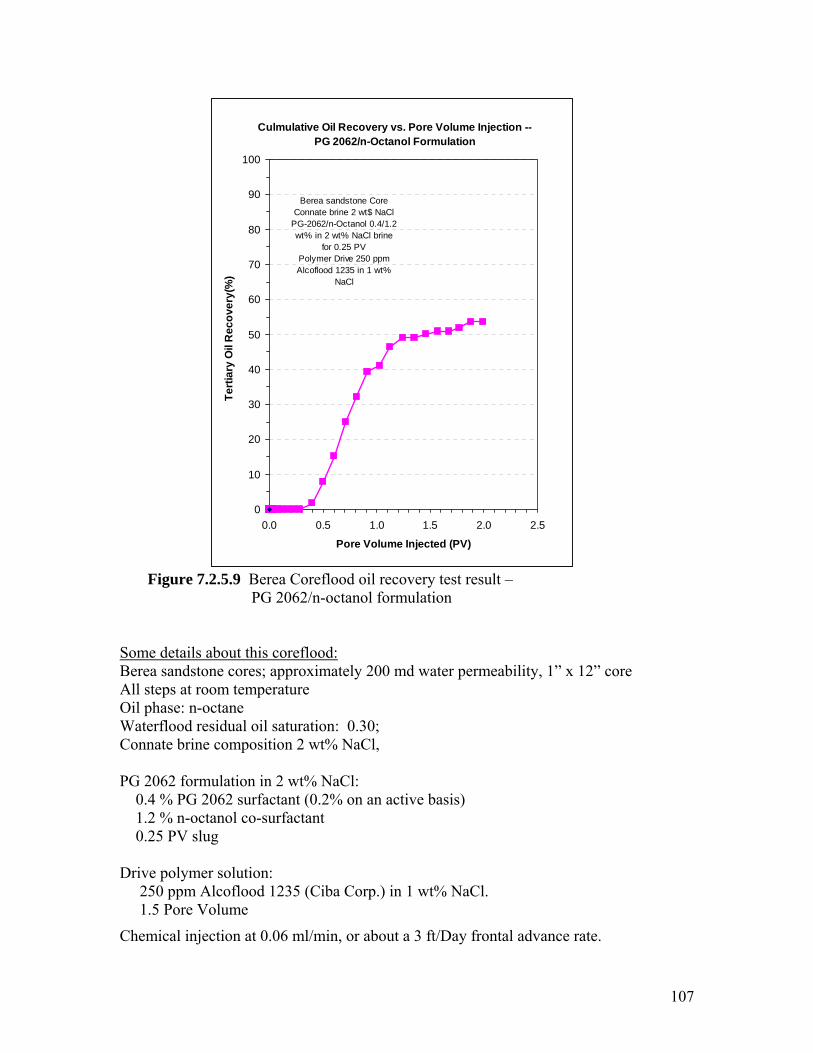
Culmulative Oil Recovery vs. Pore Volume Injection --PG 2062/n-Octanol Formulation
100
80
90
0
10
20
60
0.0 0.5 1.0 1.5 2.0 2.5
ery(
%
30Te
40
rtiar
50
il R
70
)
Pore Volume Injected (PV)
y O
ecov
Berea sandstone CoreConnate brine 2 wt$ NaCl
PG-2062/n-Octanol 0.4/1.2 wt% in 2 wt% NaCl brine
for 0.25 PV
Figure 7.2.5.9 Berea Coreflood oil recovery test result – l formulation
Som d
Polymer Drive 250 ppm Alcoflood 1235 in 1 wt%
NaCl
PG 2062/n-octano
e etails about this coreflood: a andstone cores; approximately 200 md water permeability, 1” x 12” core Bere s
All pOil a
aterfl
0.25 PV slug Drive polymer solution: 250 ppm Alcoflood 1235 (Ciba Corp.) in 1 wt% NaCl. 1.5 Pore Volume
Chemical injection at 0.06 ml/min, or about a 3 ft/Day frontal advance rate.
ste s at room temperature ph se: n-octane
ood residual oil saturation: 0.30; WConnate brine composition 2 wt% NaCl, PG 2062 formulation in 2 wt% NaCl: 0.4 % PG 2062 surfactant (0.2% on an active basis)
1.2 % n-octanol co-surfactant
107
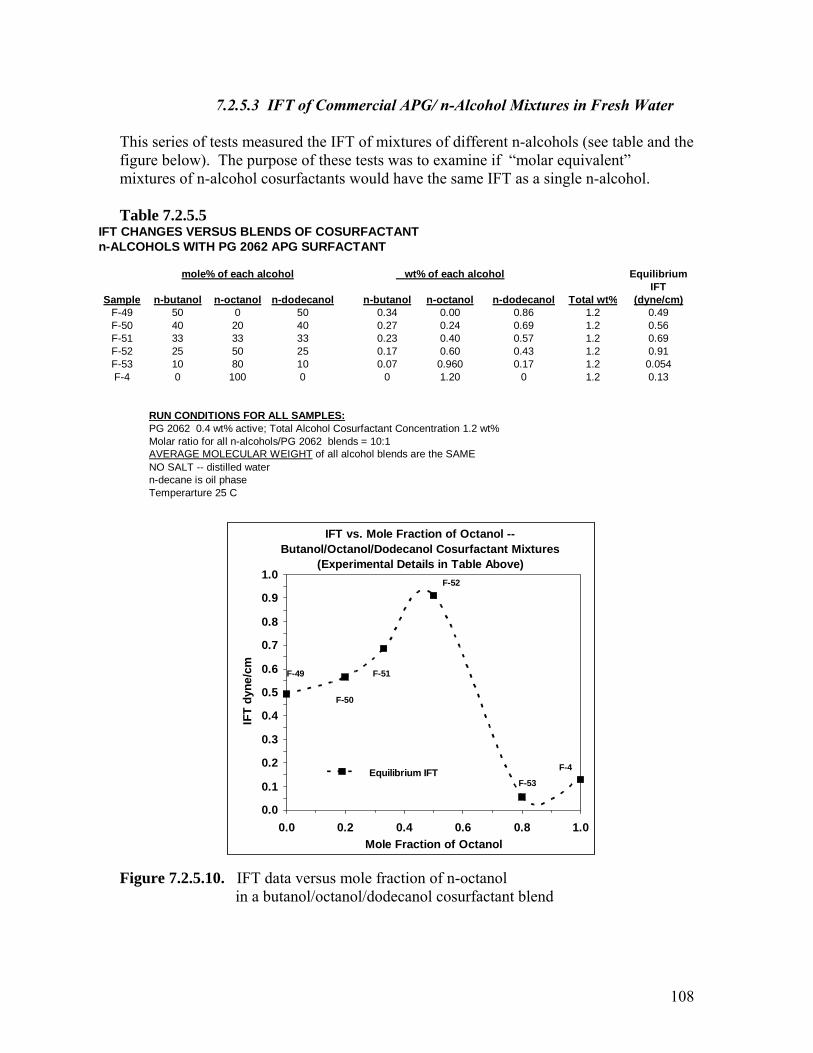
7.2.5.3 IFT of Commercial APG/ n-Alcohol Mixtures in Fresh Water This series of tests measured the IFT of mixtures of different n-alcohols (see table and the figure below). The purpose of these tests was to examine if “molar equivalent” mixtures of n-alcohol cosurfactants would have the same IFT as a single n-alcohol. Table 7.2.5.5
IFT vs. Mole Fraction of Octanol --Butanol/Octanol/Dodecanol Cosurfactant Mixtures
(Experimental Details in Table Above)
0.00.0 0.2
0.1
0.2
0.8
0.4 0.6 0.8 1.0Mole Fraction of Octanol
0.3
0.4IF
0.5yne
0.6/cm
0.7
0.9
1.0
T d
Equilibrium IFT
F-49 F-51
F-50
F-53
F-4
nt blend
IFT CHANGES VERSUS BLENDS OF COSURFACTANT n-ALCOHOLS WITH PG 2062 APG SURFACTANT
mole% of each alcohol wt% of each alcohol EquilibriumIFT
Sample n-butanol n-octanol n-dodecanol n-butanol n-octanol n-dodecanol Total wt% (dyne/cm)F-49 50 0 50 0.34 0.00 0.86 1.2 0.49F-50 40 20 40 0.27 0.24 0.69 1.2 0.56F-51 33 33 33 0.23 0.40 0.57 1.2 0.69F-52 25 50 25 0.17 0.60 0.43 1.2 0.91F-53 10 80 10 0.07 0.960 0.17 1.2 0.054F-4 0 100 0 0 1.20 0 1.2 0.13
RUN CONDITIONS FOR ALL SAMPLES:PG 2062 0.4 wt% active; Total Alcohol Cosurfactant Concentration 1.2 wt%Molar ratio for all n-alcohols/PG 2062 blends = 10:1AVERAGE MOLECULAR WEIGHT of all alcohol blends are the SAMENO SALT -- distilled watern-decane is oil phaseTemperarture 25 C
F-52
Figure 7.2.5.10. IFT data versus mole fraction of n-octanol in a butanol/octanol/dodecanol cosurfacta
108
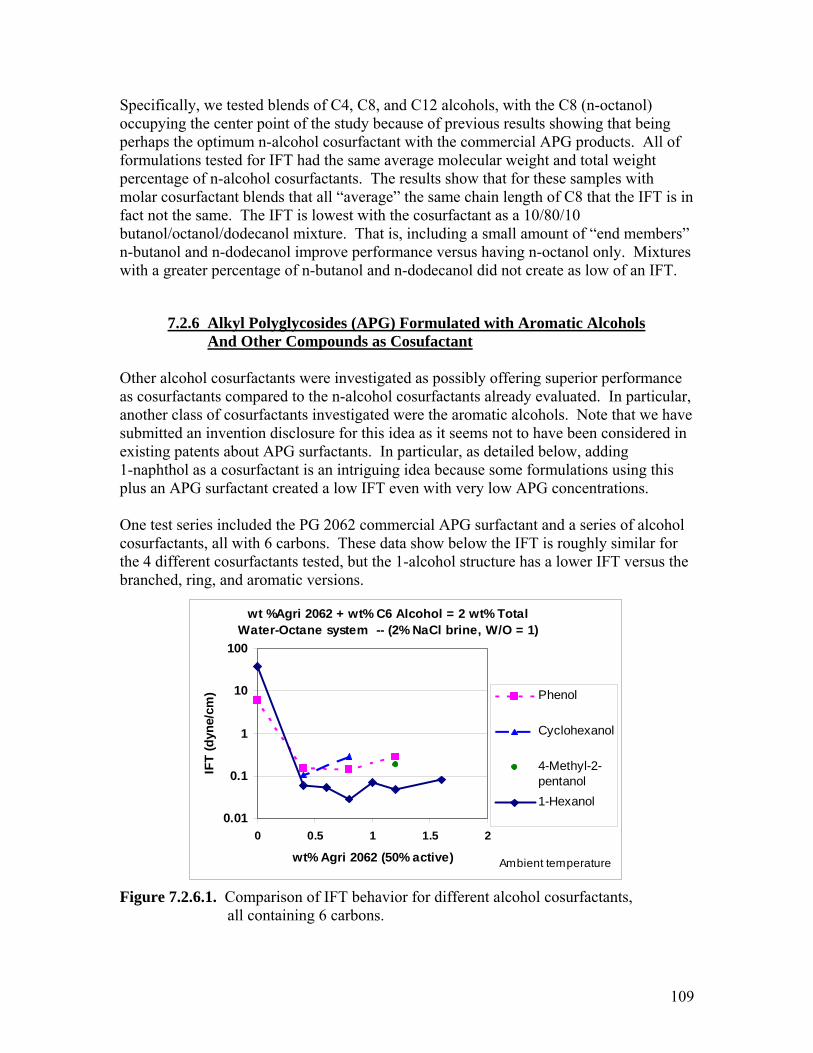
Specifi lly, wccupying the center point of the study because of previous results showing that being
ht
olar cosurfactant blends that all “average” the same chain length of C8 that the IFT is in e. The IFT is lowest with the cosurfactant as a 10/80/10
tanol/octanol/dodecanol mixture. That is, including a small amount of “end members” -butanol and n-dodecanol improve performance versus having n-octanol only. Mixtures ith a greater percentage of n-butanol and n-dodecanol did not create as low of an IFT.
7.2.6 Alkyl Polyglycosides (APG) Formulated with Aromatic Alcohols
ca e tested blends of C4, C8, and C12 alcohols, with the C8 (n-octanol) operhaps the optimum n-alcohol cosurfactant with the commercial APG products. All of formulations tested for IFT had the same average molecular weight and total weigpercentage of n-alcohol cosurfactants. The results show that for these samples with mfact not the sambunw
And Other Compounds as Cosufactant
Other alcohol cosurfactants were investigated as possibly offering superior performance s cosurfactants compared to the n-alcohol cosurfactants already evaluated. In particular, nother class of cosurfactants investigated were the aromatic alcohols. Note that we have ubmitted an invention disclosure for this idea as it seems not to have been considered in xisting patents about APG surfactants. In particular, as detailed below, adding
l as a cosurfactant is an intriguing idea because some formulations using this lus an APG surfactant created a low IFT even with very low APG concentrations.
One test series included the PG 2062 commercial APG surfactant and a series of alcohol cosurfactants, all with 6 carbons. These data show below the IFT is roughly similar for the 4 different cosurfactants tested, but the 1-alcohol structure has a lower IFT versus the branched, ring, and aromatic versions.
urfactants, all containing 6 carbons.
aase1-naphthop
wt %Agri 2062 + wt% C6 Alcohol = 2 wt% TotalWater-Octane system -- (2% NaCl brine, W/O = 1)
0.01
0.1
1
10
100
0 0.5 1 1.5 2
wt% Agri 2062 (50% active)
IFT
(dyn
e/cm
) Phenol
Cyclohexanol
4-Methyl-2-pentanol1-Hexanol
Ambient temperature Figure 7.2.6.1. Comparison of IFT behavior for different alcohol cos
109
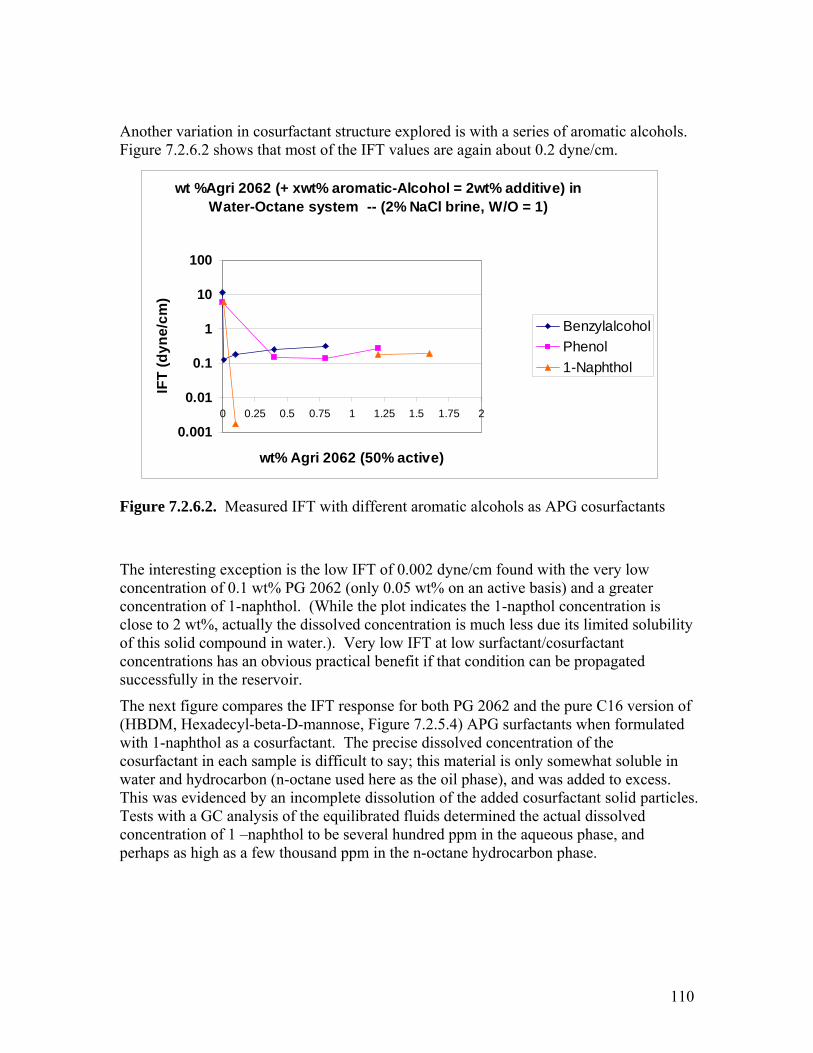
Another variation in cosurfactant structure explored is with a series of aromatic alcohols.Figure 7.2.6.2 shows that most of the IFT values are again about 0.2 dyne/cm.
igure 7.2.6.2. Measured IFT with different aromatic alcohols as APG cosurfactants
0.05 wt% on an active basis) and a greater ncentration of 1-naphthol. (While the plot indicates the 1-napthol concentration is
lose to 2 wt%, actually the dissolved concentration is much less due its limited solubility f this solid compound in water.). Very low IFT at low surfactant/cosurfactant oncentrations has an obvious practical benefit if that condition can be propagated uccessfully in the reservoir.
he next figure compares the IFT response for both PG 2062 and the pure C16 version of BDM, Hexadecyl-beta-D-mannose, Figure 7.2.5.4) APG surfactants when formulated
ith 1-naphthol as a cosurfactant. The precise dissolved concentration of the t in each sample is difficult to say; this material is only somewhat soluble in
ater and hydrocarbon (n-octane used here as the oil phase), and was added to excess. his was evidenced by an incomplete dissolution of the added cosurfactant solid particles. ests with a GC analysis of the equilibrated fluids determined the actual dissolved
f 1 –naphthol to be several hundred ppm in the aqueous phase, and as a few thousand ppm in the n-octane hydrocarbon phase.
wt %Agri 2062 (+ xwt% aromatic-Alcohol = 2wt% additive) in Water-Octane system -- (2% NaCl brine, W/O = 1)
100
F
The interesting exception is the low IFT of 0.002 dyne/cm found with the very low concentration of 0.1 wt% PG 2062 (onlycococs
T(HwcosurfactanwTTconcentration oerhaps as highp
0.001
0.010 0.25 0.5 0.75 1 1.25 1.5 1.75 2
wt% Agri 2062 (50% active)
IFT
( 0.1
10
dyne
/cm
)
1 BenzylalcoholPhenol1-Naphthol
110
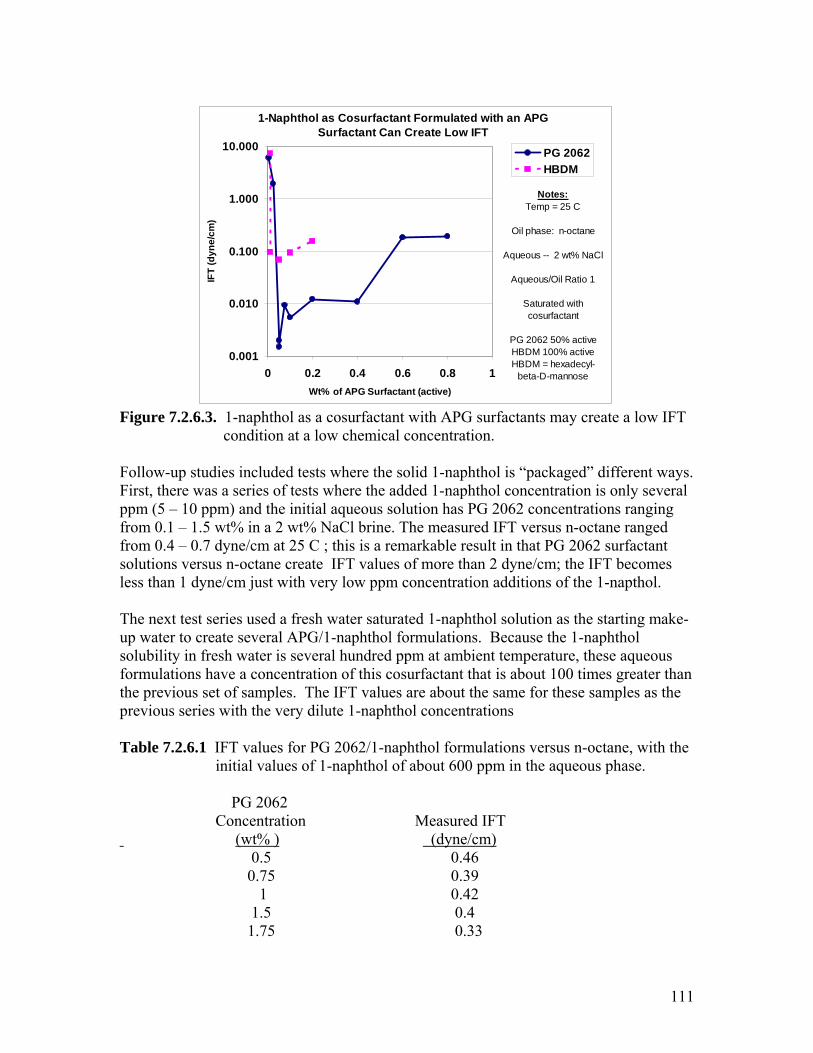
1-Naphthol as Cosurfactant Formulated with an APG
Surfactant Can Create Low IFT10.000
0.001
0.010
0.100
1.000
0 0.2 0.4 0.6 0.8 1Wt% of APG Surfactant (active)
IFT
(dyn
e/cm
)
PG 2062HBDM
Notes:Temp = 25 C
Oil phase: n-octane
Aqueous -- 2 wt% NaCl
Aqueous/Oil Ratio 1
Saturated with cosurfactant
PG 2062 50% activeHBDM 100% activeHBDM = hexadecyl-
beta-D-mannose
Figure 7.2.6.3. 1-naphthol as a cosurfactant with APG surfactants may create a low IFT condition at a low chemical concentration.
ollow-up studies included tests where the solid 1-naphthol is “packaged” different ways. irst, there was a series of tests where the added 1-naphthol concentration is only several
om 0.1 – 1.5 wt% in a 2 wt% NaCl brine. The measured IFT versus n-octane ranged om 0.4 – 0.7 dyne/cm at 25 C ; this is a remarkable result in that PG 2062 surfactant
es
us
e, with the
FFppm (5 – 10 ppm) and the initial aqueous solution has PG 2062 concentrations ranging frfrsolutions versus n-octane create IFT values of more than 2 dyne/cm; the IFT becomless than 1 dyne/cm just with very low ppm concentration additions of the 1-napthol. The next test series used a fresh water saturated 1-naphthol solution as the starting make-up water to create several APG/1-naphthol formulations. Because the 1-naphthol solubility in fresh water is several hundred ppm at ambient temperature, these aqueoformulations have a concentration of this cosurfactant that is about 100 times greater than the previous set of samples. The IFT values are about the same for these samples as the previous series with the very dilute 1-naphthol concentrations Table 7.2.6.1 IFT values for PG 2062/1-naphthol formulations versus n-octan initial values of 1-naphthol of about 600 ppm in the aqueous phase. PG 2062 Concentration Measured IFT (wt% ) (dyne/cm) 0.5 0.46
0.39 1 0.42 1.5 0.4 1.75 0.33
0.75
111
Notes: -Octane as oil phase, W/O = 1, Brine of 2 wt% NaCl, Room Temperature stimated starting concentration of added 1-naphthol is 600 ppm in the aqueous phase.
he next test series has the 1-naphthol in even higher concentrations in the aqueous rmulation; this is accomplished by first dissolving the 1-naphthol in a mutual solvent here it has very high solubility. The table below reports IFT results where the stock lution for adding the 1-naphthol is via a 90/10 by weight blend of ethanol/1-naphthol.
able 7.2.6.2. IFT for PG 2062/ethanol/1-naphthol formulations versus n-octane.
PG 2062 Ethanol/1-naphthol 1-naphthol oncentration Mixture Concentration Concentration Measured IFT (wt% )
nE
Tfowso
T C (wt%) (wt %) (dyne/cm) 0.1 1.7 0.17 0.12 0.25 1.6 0.16 0.16
0.30 1.0 0.9 0.09 0.35
oncentration Alcohol Concentration Measured IFT
0.5 1.4 0.14 0.30 0.75 1.1 0.11 1.5 0.5 0.05 0.48 Notes: n-Octane is oil phase, W/O = 1, Brine is 2 wt% NaCl, Room Temperature These results above show the IFT actually decreases with lower concentrations of PG 2062 (and where the ratio of 1-napthol/PG2062 is greater). The next series of phase behavior/IFT tests including 1-naphthol as a cosurfactant considers other alcohols as a carrier for the 1-napthol. Table 7.2.6.3. IFT for PG 2062/alcohol/1-naphthol formulations versus n-octane. Alcohol 1-naphthol C (wt% ) Diluent (wt %) (dyne/cm) 1.5 ethanol 0.5 0.017 1.5 1-propoanol 0.5 0.015
.5 cl exano 0.5 0.82 1.5 ol 0.005
s:
W Brine of 2 wt% NaCl, Room Temperature
as p rform to determine how well a very low APG concentration formulation using 1-naphthol as a cosurfactant could displace residual oil.
1 cy oh l 1-butan 0.5 NotePG 2062 is 0.1 wt% (0.05 wt% active); n-Octane as oil phase, /O = 1, A coreflood experiment w e ed
112
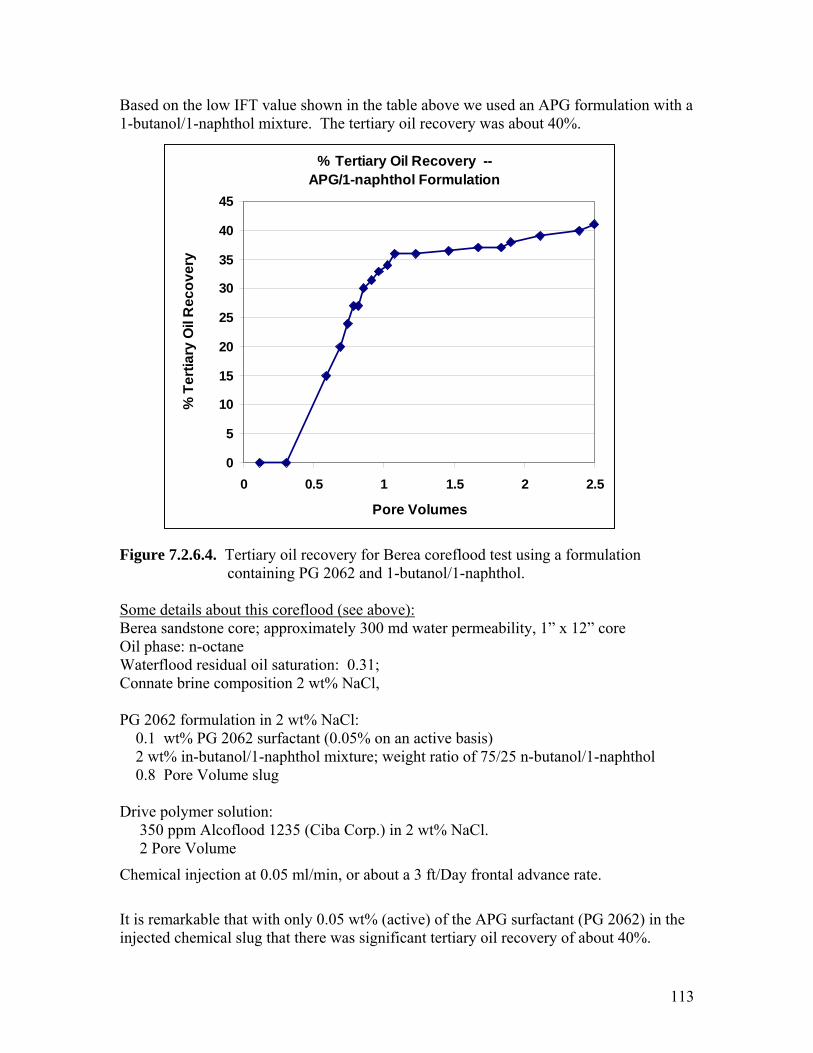
Based on the low IFT value shown in the table above we used an APG formulation with a 1-butanol/1-naphthol mixture. The tertiary oil recovery was about 40%.
% Tertiary Oil Recovery --
35
0 0.5 1 1.5 2 2.5
Pore Volumes
yAPG/1-naphthol Formulation
40
45
30
ver
20y O
25il R
15er
tiar
10%
T
5 0
eco
Figure 7.2.6.4. Tertiary oil recovery for Berea coreflood test using a formulation
containing PG 2062 and 1-butanol/1-naphthol. Some details about this coreflood (see above): Berea sandstone core; approximately 300 md water permeability, 1” x 12” core
il phase: n-octane OWaterflood residual oil saturation: 0.31;
onnat brine mpos ion 2 t% NaC e co it w Cl, PG 2062 formulation in 2 wt% NaCl: 0.1 wt% PG 2062 surfactant (0.05% on an active basis)
phthol 2 wt% in-butanol/1-naphthol mixture; weight ratio of 75/25 n-butanol/1-na
e Volume
out a 3 ft/Day frontal advance rate.
) in the
0.8 Pore Volume slug Drive polymer solution:
50 pm Alcoflood 1235 (Ciba Corp.) in 2 wt% NaCl. 3 pr 2 Po
Chemical injection at 0.05 ml/min, or ab
It is remarkable that with only 0.05 wt% (active) of the APG surfactant (PG 2062injected chemical slug that there was significant tertiary oil recovery of about 40%.
113
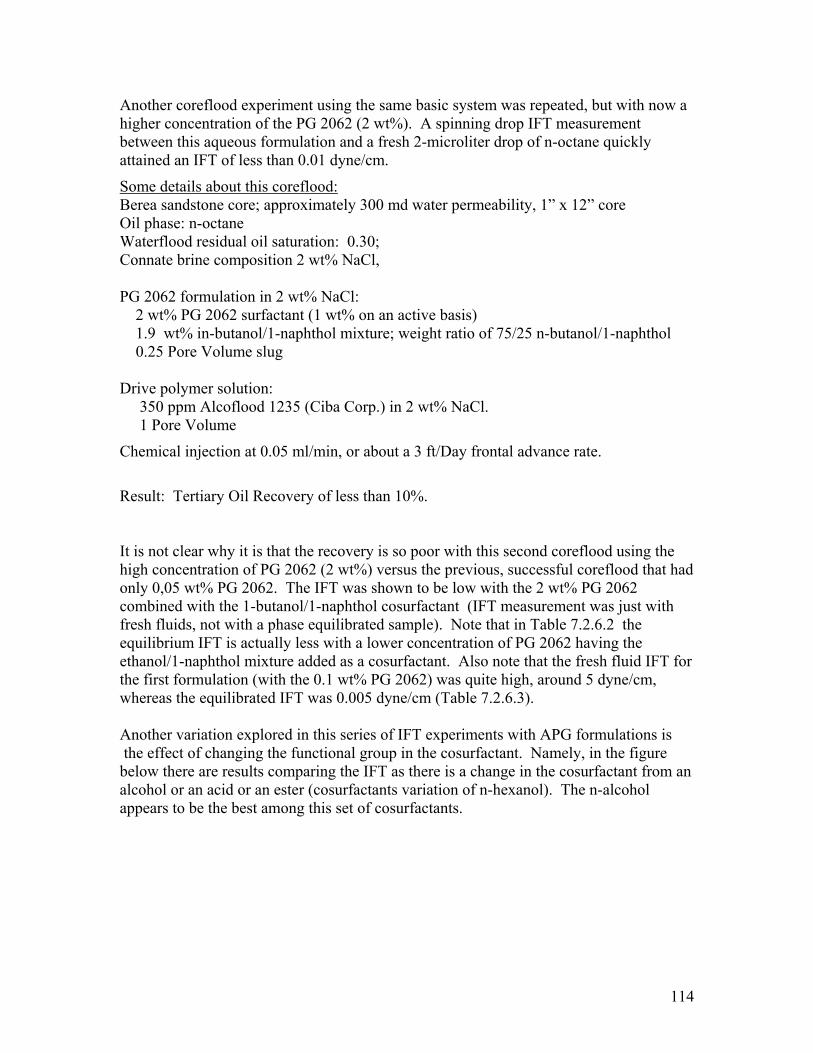
Another coreflood experiment using the same basic system was repeated, but with now a higher concentration of the PG 2062 (2 wt%). A spinning drop IFT measurement
etween this aqueous formulation and a fresh 2-microliter drop of n-octane quickly of less than 0.01 dyne/cm.
ome details about this coreflood:
battained an IFT
S erea sandstone core; approximately 300 md water permeability, 1” x 12” core il phase: n-octane
ual oil saturation: 0.30; onnate brine composition 2 wt% NaCl,
G 2062 formulation in 2 wt% NaCl: 2 wt% PG 2062 surfactant (1 wt% on an active basis) 1.9 wt% in-butanol/1-naphthol mixture; weight ratio of 75/25 n-butanol/1-naphthol 0.25 Pore Volume slug
rive polymer solution: 350 ppm Alcoflood 1235 (Ciba Corp.) in 2 wt% NaCl.
1 Pore Volume
hemical injection at 0.05 ml/min, or about a 3 ft/Day frontal advance rate.
esult: Tertiary Oil Recovery of less than 10%.
the ful coreflood that had
nly 0,05 wt% PG 2062. The IFT was shown to be low with the 2 wt% PG 2062 tant (IFT measurement was just with
e tually less with a lower concentration of PG 2062 having the
rfactant. Also note that the fresh fluid IFT for 2062) was quite high, around 5 dyne/cm,
hereas the equilibrated IFT was 0.005 dyne/cm (Table 7.2.6.3).
ith APG formulations is
paring the IFT as there is a change in the cosurfactant from an lcohol or an acid or an ester (cosurfactants variation of n-hexanol). The n-alcohol
ng this set of cosurfactants.
BOWaterflood residC P D
C
R It is not clear why it is that the recovery is so poor with this second coreflood usinghigh concentration of PG 2062 (2 wt%) versus the previous, successocombined with the 1-butanol/1-naphthol cosurfacfresh fluids, not with a phase equilibrated sample). Note that in Table 7.2.6.2 thequilibrium IFT is acethanol/1-naphthol mixture added as a cosuthe first formulation (with the 0.1 wt% PGw Another variation explored in this series of IFT experiments w the effect of changing the functional group in the cosurfactant. Namely, in the figure below there are results comaappears to be the best amo
114
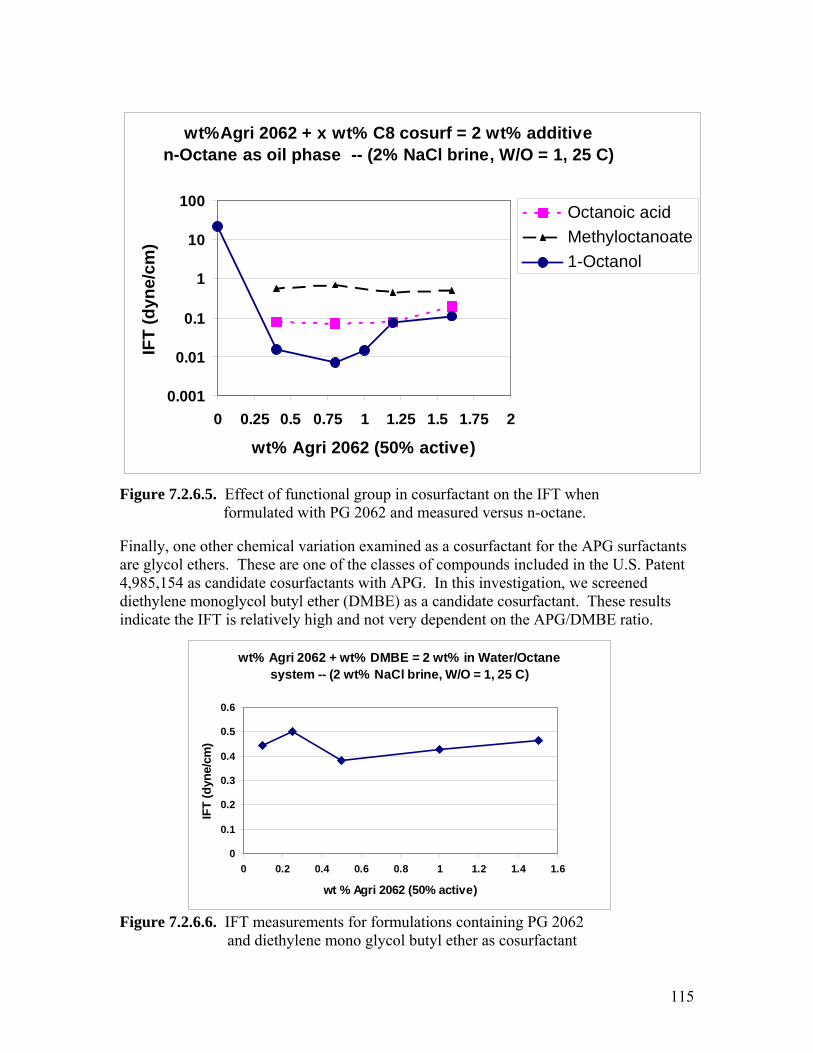
wt%Agri 2062 + x wt% C8 cosurf = 2 wt% additive n-Octane as oil phase -- (2% NaCl brine, W/O = 1, 25 C)
115
rfactant on the IFT when formulated with PG 2062 and measured versus n-octane.
igure 7.2.6.6. IFT measurements for formulations containing PG 2062 ono glycol butyl ether as cosurfactant
100
Octanoic 10)
m
Figure 7.2.6.5. Effect of functional group in cosu Finally, one other chemical variation examined as a cosurfactant for the APG surfactantsare glycol ethers. These are one of the classes of compounds included in the U.S. Patent 4,985,154 as candidate cosurfactants with APG. In this investigation, we screeneddiethylene monoglycol butyl ether (DMBE) as a candidate cosurfactant. These results indicate the IFT is relatively high and not very dependent on the APG/DMBE ratio.
F and diethylene m
wt% Agri 2062 + wt% DMBE = 2 wt% in Water/Octane system -- (2 wt% NaCl brine, W/O = 1, 25 C)
0.6
0
0.1
0 0.2 0.4 0.6 0.8 1 1.2 1.4 1.6
wt % Agri 2062 (50% active)
0.2
0.3
IFT
(dyn
0.4cm)
0.5
e/
0.001.25 0.5 0.75 1 1.25 1.5 1.75
0.01IF
0.1
1
2
e/c
ynT
(d
0 0
wt% Agri 2062 (50% active)
acidMethyloctanoate1-Octanol
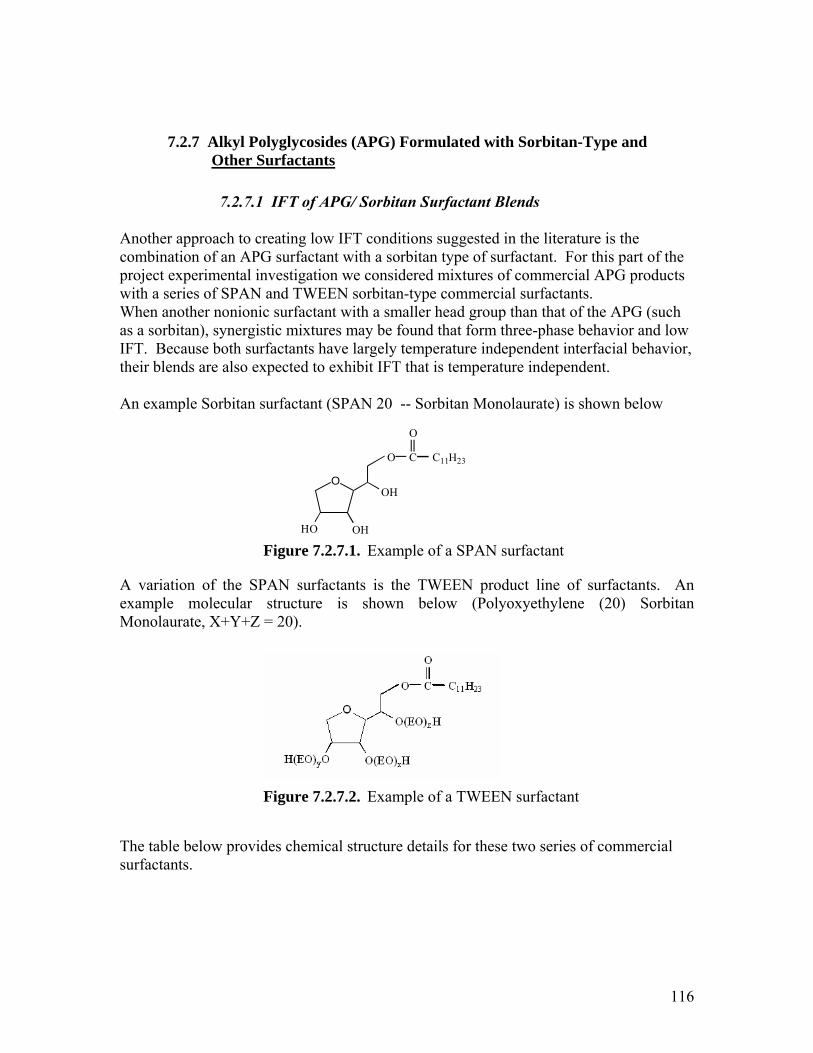
7.2.7 Alkyl Po
ther Slyglycosides (APG) Formulated with Sorbitan-Type and urfactants O
7.2.7.1 IFT of APG/ Sorbitan Surfactant Blends
nother approach to creating low IFT conditions suggested in the literature is the ombination of an APG surfactant with a sorbitan type of surfactant. For this part of the roject experimental investigation we considered mixtures of commercial APG products ith a series of SPAN and TWEEN sorbitan-type commercial surfactants. hen another nonionic surfactant with a smaller head group than that of the APG (such
s a sorbitan), synergistic mixtures may be found that form three-phase behavior and low T. Because both surfactants have largely temperature independent interfacial behavior, eir blends are also expected to exhibit IFT that is temperature independent.
n example Sorbitan surfactant (SPAN 20 -- Sorbitan Monolaurate) is shown below
. An an
AcpwWaIFth A
OOH
O
OHHO
C
O
C11H23
Figure 7.2.7.1. Example of a SPAN surfactant
A variation of the SPAN surfactants is the TWEEN product line of surfactantsexample molecular structure is shown below (Polyoxyethylene (20) SorbitMonolaurate, X+Y+Z = 20).
Figure 7.2.7.2. Example of a TWEEN surfactant
provides chemical structure details for these two series of commercial rfactants.
The table belowsu
116
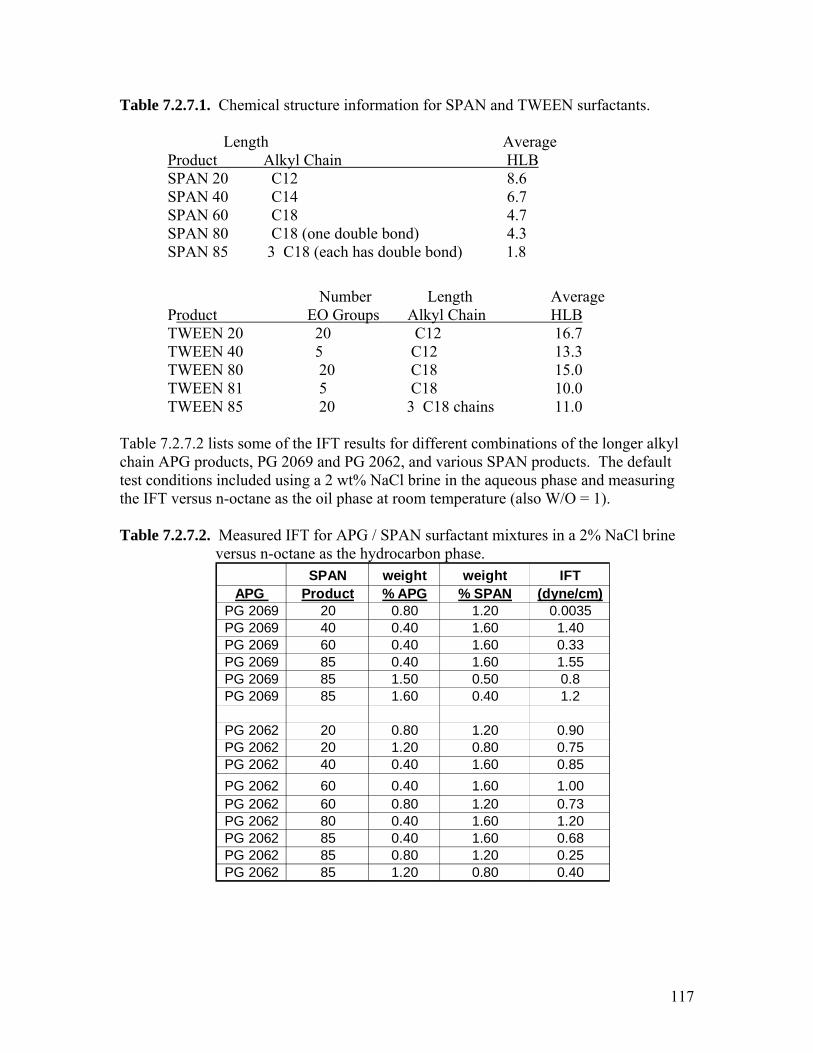
Table 7.2.7.1. Chemical structure information for SPAN and TWEEN surfactants.
HLB
Length Average Product Alkyl Chain
SPAN 20 C12 8.6
SPAN 40 C14 6.7
SPAN 60 C18 4.7 SPAN 80 C18 (one double bond) 4.3 SPAN 85 3 C18 (each has double bond) 1.8
Number Length Average Product EO Groups Alkyl Chain HLB TWEEN 20 20 C12 16.7 TWEEN 40 5 C12 13.3 TWEEN 80 20 C18 15.0 TWEEN 81 5 C18 10.0
IFT results for different combinations of the longer alkyl G 2069 and PG 2062, and various SPAN products. The default
st conditions included using a 2 wt% NaCl brine in the aqueous phase and measuring e IFT versus n-octane as the oil phase at room temperature (also W/O = 1).
Measured IFT for APG / SPAN surfactant mixtures in a 2% NaCl brine
TWEEN 85 20 3 C18 chains 11.0 Table 7.2.7.2 lists some of the chain APG products, Pteth Table 7.2.7.2. versus n-octane as the hydrocarbon phase.
SPAN weight weight IFTAPG Product % APG % SPAN (dyne/cm)
PG 2069 20 0.80 1.20 0.0035PG 2069 40 0.40 1.60 1.40PG 2069 60 0.40 1.60 0.33PG 2069 85 0.40 1.60 1.55PG 2069 85 1.50 0.50 0.8PG 2069 85 1.60 0.40 1.2
PG 2062 20 0.80 1.20 0.90PG 2062 20 1.20 0.80 0.75
62 40 0.40 1.60 0.85
PG 2062 80 0.40 1.60 1.20
PG 2062 85 1.20 0.80 0.40
PG 20PG 2062 60 0.40 1.60 1.00PG 2062 60 0.80 1.20 0.73
PG 2062 85 0.40 1.60 0.68PG 2062 85 0.80 1.20 0.25
117
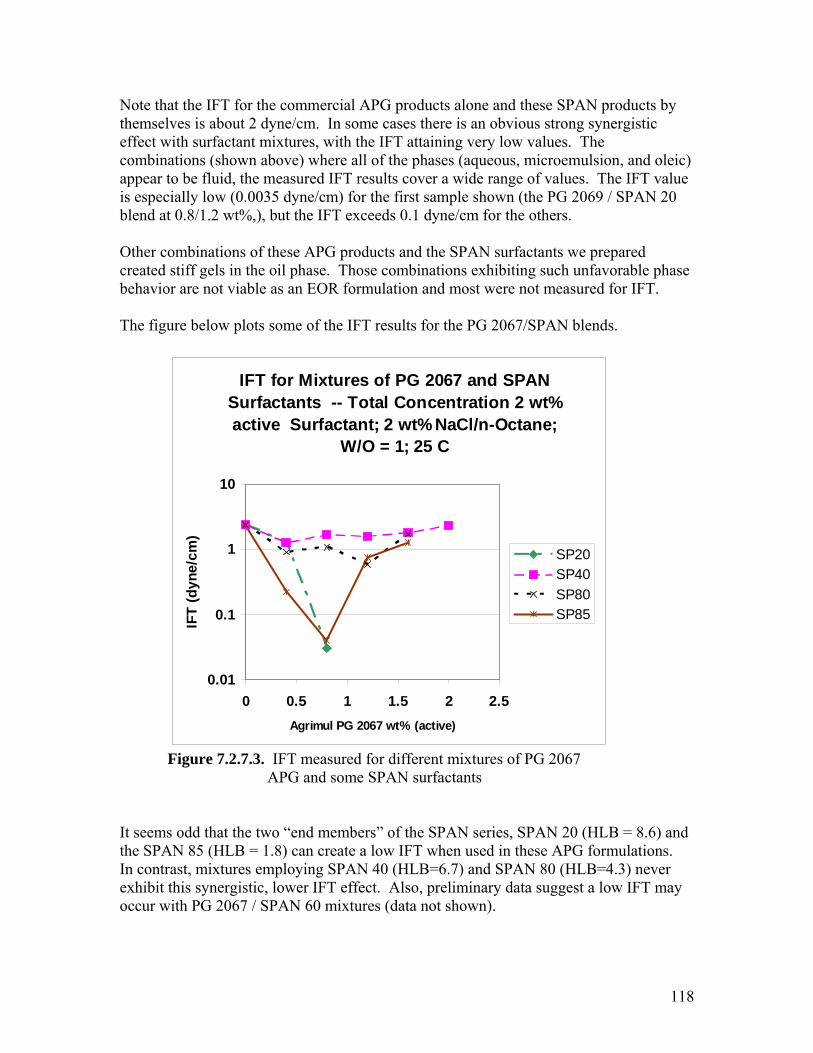
Note that the IFT for the commercial APG products alone and these SPAN products by emselves is about 2 dyne/cm. In some cases there is an obvious strong synergistic
xture with . Thombin wn a emulsion, and oleic)
ra espec .00 m) fo e show 69 / SPAN 20
m for the others.
tan s we prepared reated stiff gels in the oil phase. Those combinations exhibiting such unfavorable phase
or IFT.
t A nds.
theffect with surfactant mi s, the IFT attaining very low values e c ations (sho above) where ll of the phases (aqueous, microappear to be fluid, the measured IFT results cover a wide nge of values. The IFT value is ially low (0 35 dyne/c r the first sampl n (the PG 20blend at 0.8/1.2 wt%,), but the IFT exceeds 0.1 dyne/c Other combinations of these APG products and the SPAN surfac tcbehavior are not viable as an EOR formulation and most were not measured f
he fig ome o SPT ure below plo s s f the IFT results for the PG 2067/ N ble
IFT for ixtu s of PG 2067 and SP M ANt
active Surfactant; 2 wt% NaCl/n-Octane;
0.01
0.1
0 0.5 1 1.5 2 2.5Agrimul PG 2067 wt% (active)
IFT
(dyn
e/
reSurfactants -- Total Concentration 2 w %
W/O = 1; 25 C
10
1cm)
SP20SP40SP80SP85
Figure 7.2.7.3. IFT measured for different mixtures of PG 2067 APG and some SPAN surfactants It seems odd that the two “end members” of the SPAN series, SPAN 20 (HLB = 8.6) and the SPAN 85 (HLB = 1.8) can create a low IFT when used in these APG formulations.
(HLB=6.7) and SPAN 80 (HLB=4.3) never IFT effect. Also, preliminary data suggest a low IFT may
G 2067 / SPAN 60 mixtures (data not shown).
In contrast, mixtures employing SPAN 40 exhibit this synergistic, lower occur with P
118
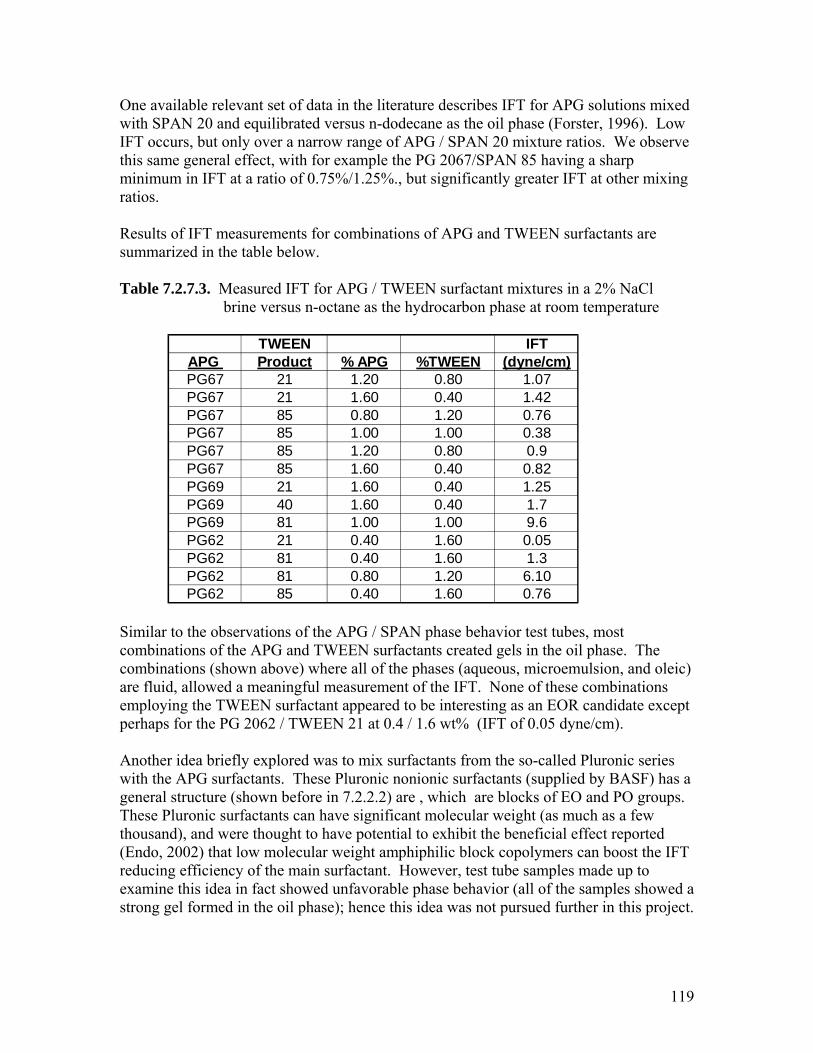
One available relevant set of data in the literature describes IFT for APG solutions mixedwith SPAN 20 and equilibrated versus n-dodecane as the oil phase (Forster, 1996). LIFT occurs, but only over a narrow range of APG / SPAN 20 mixture ratios. this same general effect, with for example the PG 2067/SPAN 85 having a sharp minimum in IFT at a ratio of 0.75%/1.25%., but significantly greater IFT at other mixing ratios.
ow
We observe
esults of IFT measurements for combinations of APG and TWEEN surfactants are
brine versus n-octane as the hydrocarbon phase at room temperature
Rsummarized in the table below. Table 7.2.7.3. Measured IFT for APG / TWEEN surfactant mixtures in a 2% NaCl
TWEEN IFTAPG Product % APG %TWEEN (dyne/cm)PG67 21 1.20 0.80 1.07PG67 21 1.60 0.40 1.42PG67 85 0.80 1.20 0.76PG67 85 1.00 1.00 0.38PG67 85 1.20 0.80 0.9PG67 85 1.60 0.40 0.82PG69 21 1.60 0.40 1.25PG69 40 1.60 0.40 1.7PG69 81 1.00 1.00 9.6PG62 21 0.40 1.60 0.05PG62 81 0.40 1.60 1.3PG62 81 0.80 1.20 6.10PG62 85 0.40 1.60 0.76
Similar to the observations of the APG / SPAN phase behavior test tubes, most combinations of the APG and TWEEN surfactants created gels in the oil phase. The combinations (shown above) where all of the phases (aqueous, microemulsion, and oleic) are fluid, allowed a meaningful measurement of the IFT. None of these combinations employing the TWEEN surfactant appeared to be interesting as an EOR candidate except perhaps for the PG 2062 / TWEEN 21 at 0.4 / 1.6 wt% (IFT of 0.05 dyne/cm).
uronic series tants (supplied by BASF) has a
eneral structure (shown before in 7.2.2.2) are , which are blocks of EO and PO groups. hese Pluronic surfactants can have significant molecular weight (as much as a few
rsued further in this project.
Another idea briefly explored was to mix surfactants from the so-called Plwith the APG surfactants. These Pluronic nonionic surfacgTthousand), and were thought to have potential to exhibit the beneficial effect reported (Endo, 2002) that low molecular weight amphiphilic block copolymers can boost the IFTreducing efficiency of the main surfactant. However, test tube samples made up to examine this idea in fact showed unfavorable phase behavior (all of the samples showed astrong gel formed in the oil phase); hence this idea was not pu
119
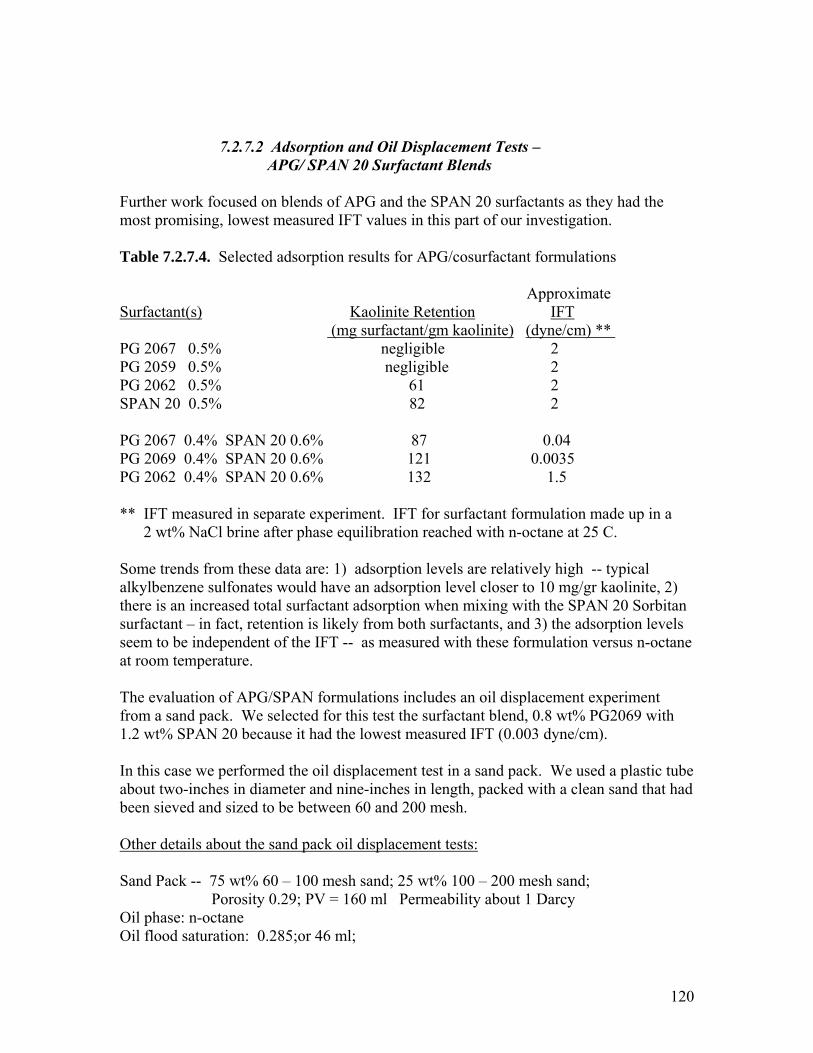
7.2.7.2 Adsorption and Oil Displacement Tests – APG/ SPAN 20 Surfactant Blends
Further work focused on blends of APG and the SPAN 20 surfactants as they had the
on results for APG/cosurfactant formulations
rfact t(s)
most promising, lowest measured IFT values in this part of our investigation. Table 7.2.7.4. Selected adsorpti Approximate Su an Kaolinite Retention IFT (mg surfactant/gm kaolinite) (dyne/cm) ** PG 2067 0.5% negligible 2 PG 2059 0.5% negligible 2 PG 2062 0.5% 61 2 SPAN 20 0.5% 82 2 PG 2067 0.4% SPAN 20 0.6% 87 0.04 PG 2069 0.4% SPAN 20 0.6% 121 0.0035 PG 2062 0.4% SPAN 20 0.6% 132 1.5 ** IFT measured in separate experiment. IFT for surfactant formulation made up in a 2 wt% NaCl brine after phase equilibration reached with n-octane at 25 C. Some trends from these data are: 1) adsorption levels are relatively high -- typical
ould have an adsorption level closer to 10 mgere is an increased total surfactant adsorption when mixing with the S AN 20 Sorbitan
n levels ane
alkylbenzene sulfonates w /gr kaolinite, 2) Pth
surfactant – in fact, retention is likely from both surfactants, and 3) the adsorptioseem to be independent of the IFT -- as measured with these formulation versus n-octat room temperature. The evaluation of APG/SPAN formulations includes an oil displacement experiment from a sand pack. We selected for this test the surfactant blend, 0.8 wt% PG2069 with .2 wt% SPAN 20 because it had the lowest measured IFT (0.003 dyne/cm). 1
In this case we performed the oil displacement test in a sand pack. We used a plastic tube about two-inches in diameter and nine-inches in length, packed with a clean sand that had been sieved and sized to be between 60 and 200 mesh. Other details about the sand pack oil displacement tests: Sand Pack -- 75 wt% 60 – 100 mesh sand; 25 wt% 100 – 200 mesh sand; Porosity 0.29; PV = 160 ml Permeability about 1 Darcy
il phase: n-octane OOil flood saturation: 0.285;or 46 ml;
120
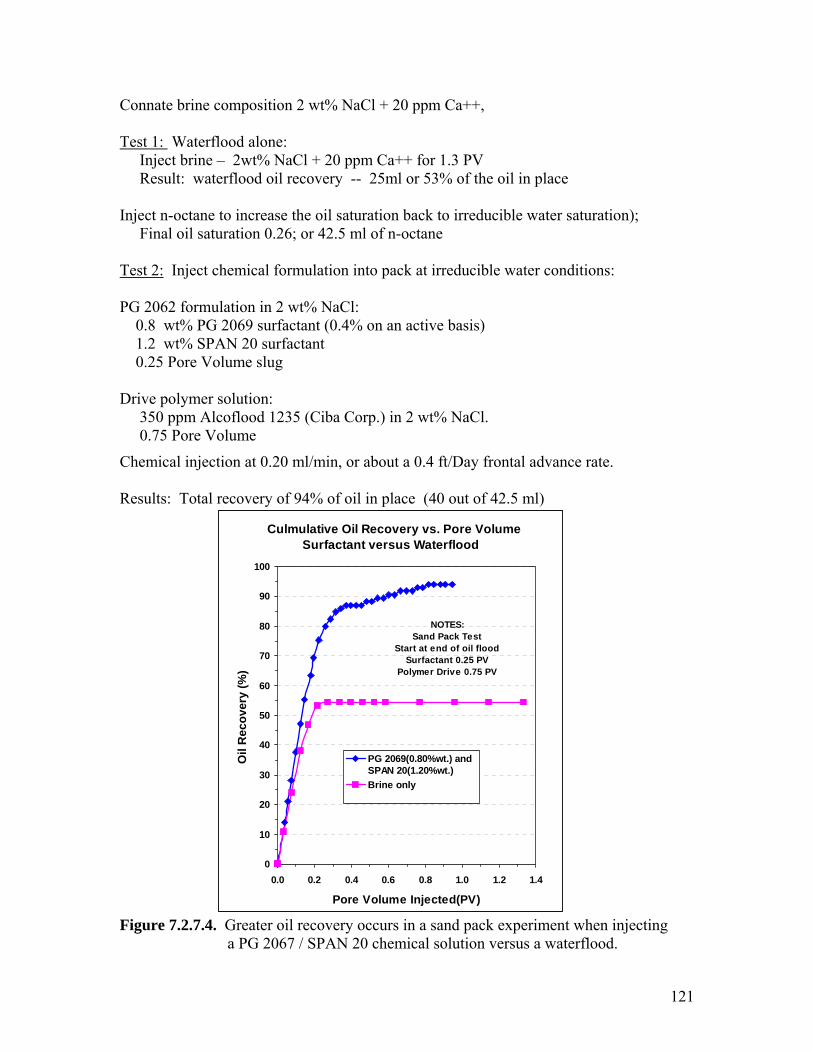
Connate brine composition 2 wt% NaCl + 20 ppm Ca++,
est 1: T W lood alone: 2wt%
aterf Inject brine Result: waterflood oil recovery -- 25ml or 53% of the oil in place
est 2:
– NaCl + 20 ppm Ca++ for 1.3 PV Inject n-octane to increase the oil saturation back to irreducible water saturation); Final oil saturation 0.26; or 42.5 ml of n-octane
T Inject chemical formulation into pack at irreducible water conditions:
rate.
esults: Total recovery of 94% of oil in place (40 out of 42.5 ml)
PG 2062 formulation in 2 wt% NaCl: 0.8 wt% PG 2069 surfactant (0.4% on an active basis) 1.2 wt% SPAN 20 surfactant 0.25 Pore Volume slug Drive polymer solution:
350 ppm Alcoflood 1235 (Ciba Corp.) in 2 wt% NaCl. 0.75 Pore Volume
Chemical injection at 0.20 ml/min, or about a 0.4 ft/Day frontal advance R
Culmulative Oil Recovery vs. Pore VolumeSurfactant versus Waterflood
0
70
80
90
100
10
20
30
40
50
60
Oil
Rec
over
y (%
)
0.0 0.2 0.4 0.6 0.8 1.0 1.2 1.4
Pore Volume Injected(PV)
PG 2069(0.80%wt.) and SPAN 20(1.20%wt.)Brine only
NOTES:Sand Pack Test
Start at end of oil floodSurfactant 0.25 PV
Polymer Drive 0.75 PV
curs in a sand pack experiment when injecting chemical solution versus a waterflood.
Figure 7.2.7.4. Greater oil recovery oc a PG 2067 / SPAN 20
121
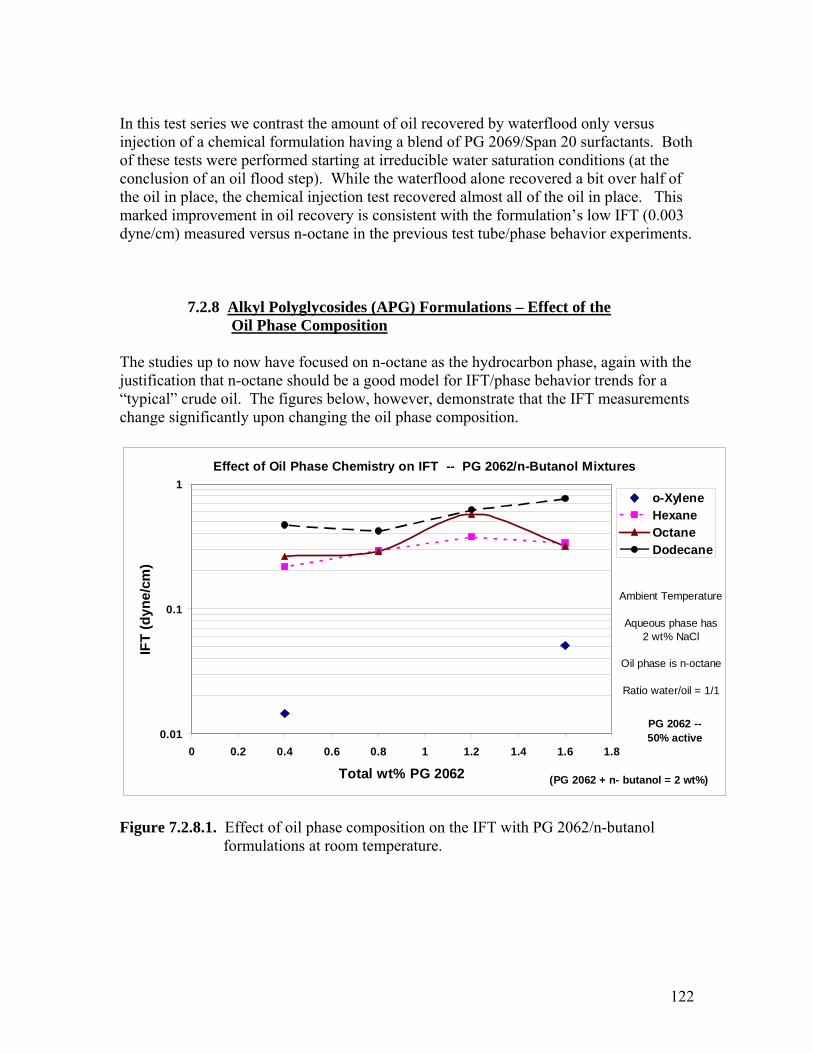
In this test series we contrast the amount of oil recovered by waterflood only versus
ulation having a blend of PG 2069/Span 20 surfactants. Both saturation conditions (at the
a b over half of e oil in place, the chemical injection test recovered almost all of the oil in place. This
.003 est tube/phase behavior experiments.
(APG) Formulations – Effect of the
injection of a chemical formof these tests were performed starting at irreducible water conclusion of an oil flood step). While the waterflood alone recovered it thmarked improvement in oil recovery is consistent with the formulation’s low IFT (0dyne/cm) measured versus n-octane in the previous t
7.2.8 Alkyl Polyglycosides Oil Phase Composition
The studies up to now have focused on n-octane as the hydrocarbon phase, again with the stification that n-octane should be a good model for IFT/phase behavior trends for a
gures below, however, demonstrate that the IFT measurements on.
ju“typical” crude oil. The fichange significantly upon changing the oil phase compositi
Effect of Oil Phase Chemistry on IFT -- PG 2062/n-Butanol Mixtures
0.01
0.1
0 0.2 0.4 0.6 0.8 1 1.2 1.4 1.6 1.8
Total wt% PG 2062
IFT
(dyn
e/cm
)
1o-XyleneHexane OctaneDodecane
PG 2062 --50% active
(PG 2062 + n- butanol = 2 wt%)
Ambient Temperature
Aqueous phase has2 wt% NaCl
Oil phase is n-octane
Ratio water/oil = 1/1
Figure 7.2.8.1. Effect of oil phase composition on the IFT with PG 2062/n-butanol formulations at room temperature.
122
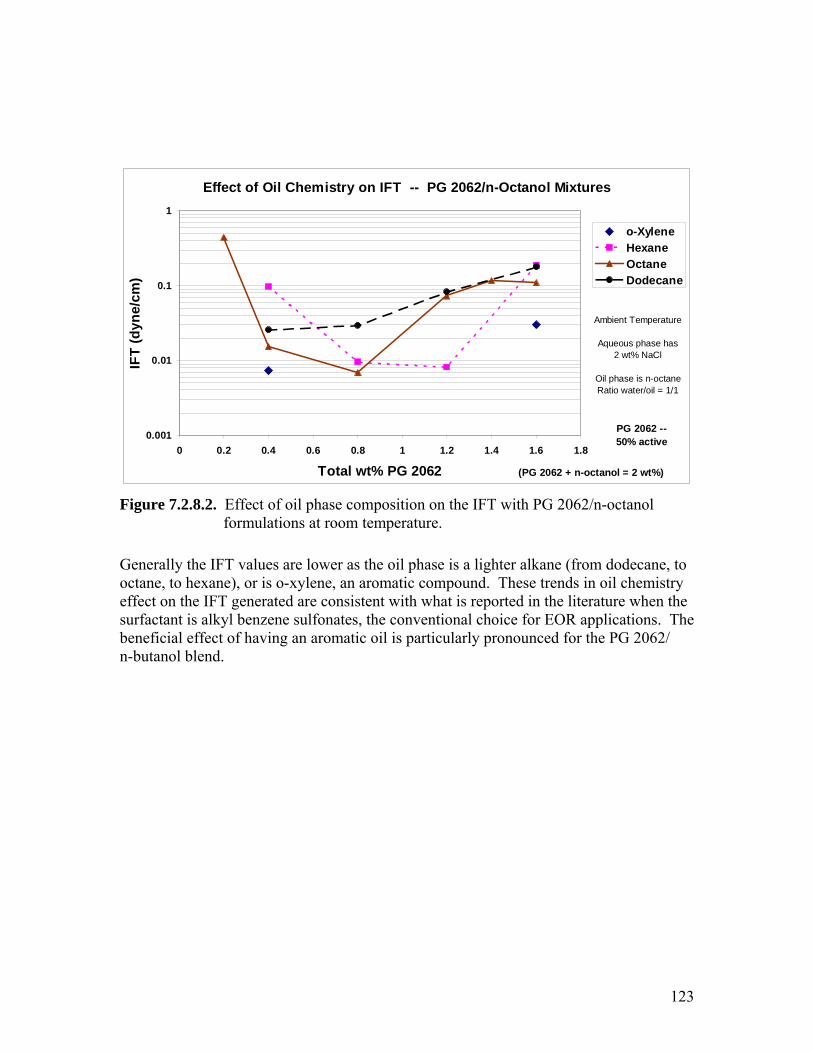
Effect of Oil Chemistry on IFT -- PG 2062/n-Octanol Mixtures1
o-Xylene
0.001
0.1
0 0.2 0.4 0.6 0.8 1 1.2 1.4 1.6 1.8
Total wt% PG 2062
(dyn
e/cm
)
0.01IFT
Hexane OctaneDodecane
PG 2062 --50% active
(PG 2062 + n-octanol = 2 wt%)
t Temperature
Aqueous phase has
Figure 7.2.8.2. Effect of oil phase composition on the IFT with PG 2062/n-octanol formulations at room temperature.
Generally the IFT values are lower as the oil phase is a lighter alkane (from dodecane, to octane, to hexane), or is o-xylene, an aromatic compound. These trends in oil chemistry effect on the IFT generated are consistent with what is reported in the literature when the surfactant is alkyl benzene sulfonates, the conventional choice for EOR applications. The beneficial effect of having an aromatic oil is particularly pronounced for the PG 2062/ n-butanol blend.
Ambien
2 wt% NaCl
Oil phase is n-octaneRatio water/oil = 1/1
123
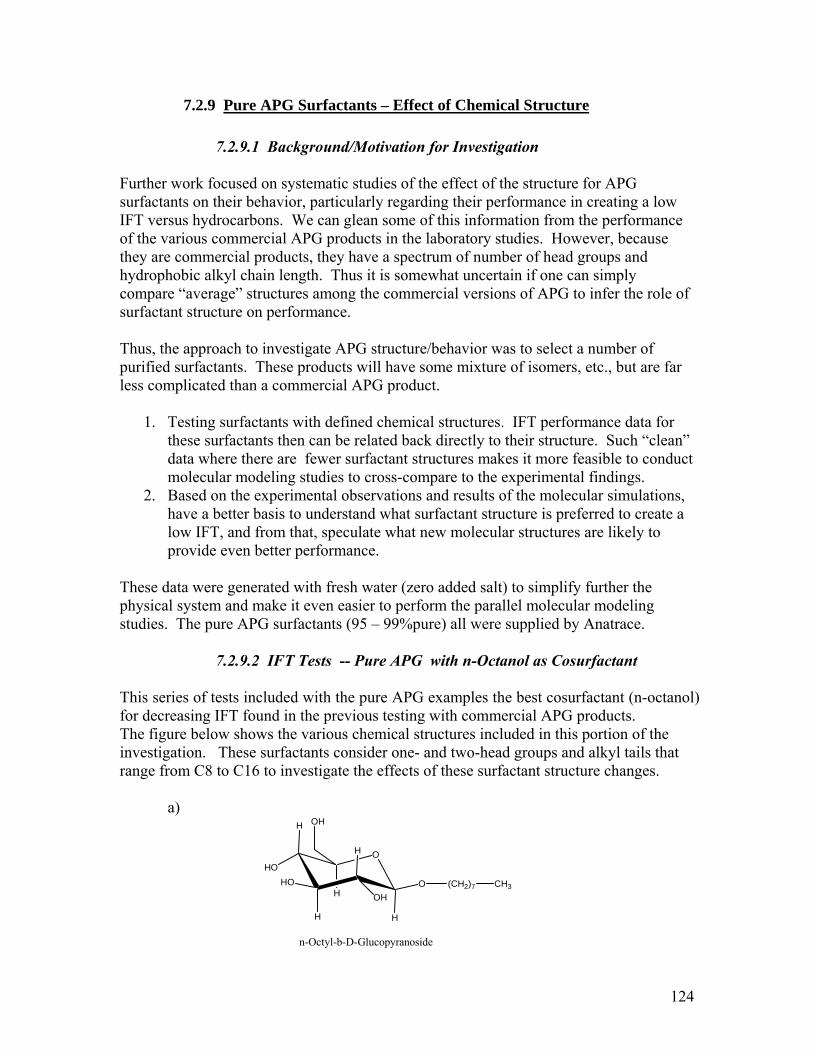
7.2.9 Pure APG Surfactants – Effect of Chemical Structure
7.2.9.1 Background/Motivation for Investigation Further work focused on systematic studies of the effect of the structure for APG surfactants on their behavior, particularly regarding their performance in creating a low IFT versus hydrocarbons. We can glean some of this information from the performance of the various commercial APG products in the laboratory studies. However, because they are commercial products, they have a spectrum of number of head groups and hydrophobic alkyl chain length. Thus it is somewhat uncertain if one can simply compare “average” structures among the commercial versions of APG to infer the role of surfactant structure on performance. Thus, the approach to investigate APG structure/behavior was to select a number of purified surfactants. These products will have some mixture of isomers, etc., but are far less complicated than a commercial APG product.
1. Testing surfactants with defined chemical structures. IFT performance data for these surfactants then can be related back directly to their structure. Such “clean” data where there are fewer surfactant structures makes it more feasible to conduct molecular modeling studies to cross-compare to the experimental findings.
ns, e a
olecular structures are likely to provide even better performance.
9.2 IFT Tests -- Pure APG with n-Octanol as Cosurfactant
This series of tests included with the pure APG examples the best cosurfactant (n-octanol) for decreasing IFT found in the previous testing with commercial APG products. The figure below shows the various chemical structures included in this portion of the investigation. These surfactants consider one- and two-head groups and alkyl tails that range from C8 to C16 to investigate the effects of these surfactant structure changes. a)
2. Based on the experimental observations and results of the molecular simulatioant structure is preferred to creathave a better basis to understand what surfact
low IFT, and from that, speculate what new m
These data were generated with fresh water (zero added salt) to simplify further the physical system and make it even easier to perform the parallel molecular modeling studies. The pure APG surfactants (95 – 99%pure) all were supplied by Anatrace.
7.2.
HOO
H
H
HO
H
H
OHHO
OH
(CH2)7 CH3
n-Octyl-b-D-Glucopyranoside
124
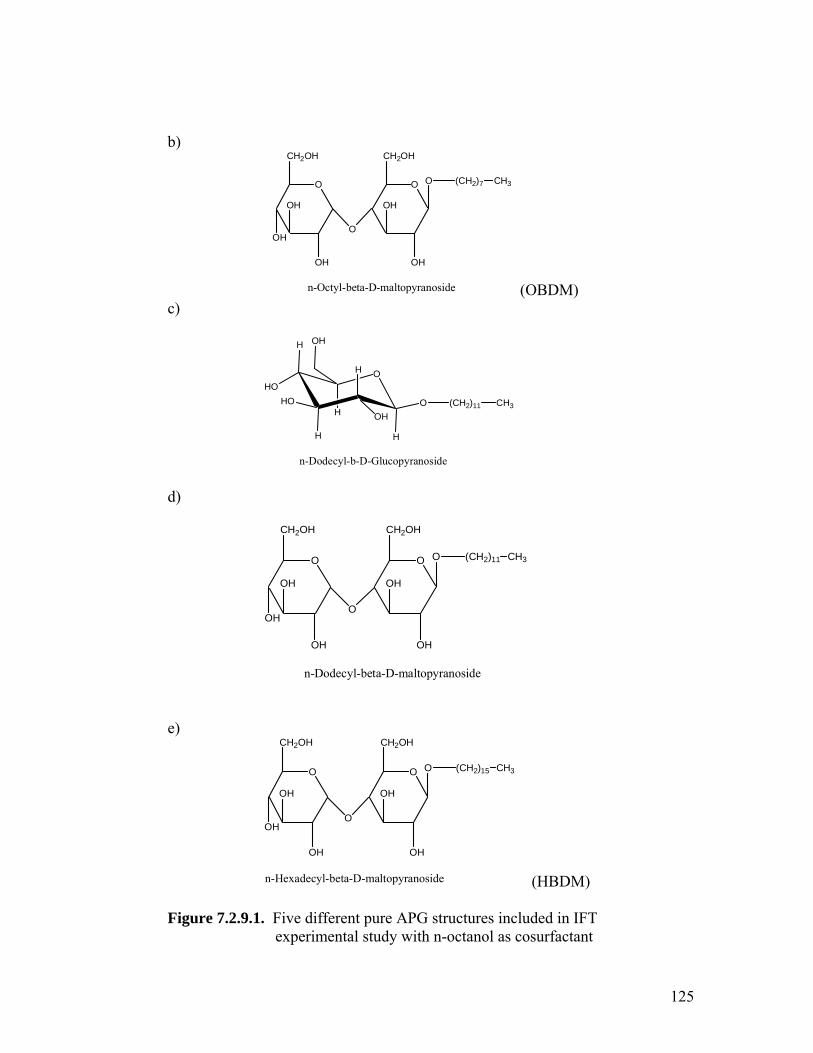
b)
CH2OH CH2OH
O
O
O
OH
OH
OH
OH
OH
O (CH2)7 CH3
n-Octyl-beta-D-maltopyranoside (OBDM) c)
HOO
H
H
OH
H H
OHH
n-Dodecyl-b-D-Glucopyranoside
HO O (CH2)11 CH3
d)
O
CH2OH CH2OH
OOH
OH OH
O
OH OH
O (CH2)11 CH3
n-Dodecyl-beta-D-maltopyranoside e)
O O
CH2OH CH2OH
O (CH2)15 CH3
OOH
OH
OH
OH
OH
n-Hexadecyl-beta-D-maltopyranoside (HBDM) Figure 7.2.9.1. Five different pure APG structures included in IFT
experimental study with n-octanol as cosurfactant
125
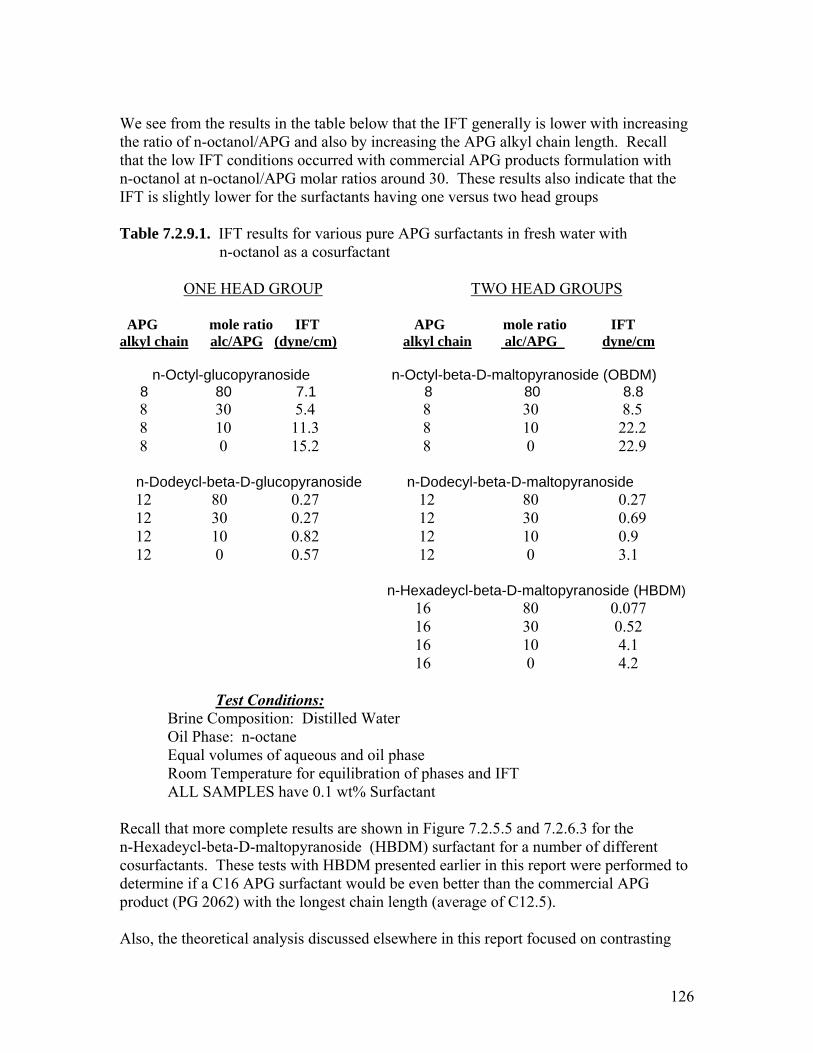
We see from the results in the table below that the IFT generally is lower with increasing
e rati -o tanol/ PG and also by increasing the APG alkyl chain length. Recall that the low IFT conditions occurred with commercial APG products formulation with n-octanol at n-octanol/APG molar ratios around 30. These results also indicate that the IFT is slightly lower for the surfactants having one versus two head groups Table 7.2.9.1. IFT results for various pure APG surfactants in fresh water with n-octanol as a cosurfactant
ONE ROUP
th o of n c A
HEAD G TWO UPSHEAD GRO APG mole ratio IFT APG mole ratio IFT alkyl chain alc/APG (dyne/cm) alkyl chain alc/APG dyne/cm n-Octyl-glucopyranoside n-Octyl-beta-D-maltopyranoside (OBDM) 8 80 7.1 8 80 8.8 8 30 5.4 8 30 8.5 8 10 11.3 8 10 22.2 8 0 15.2 8 0 22.9
n-Dodeycl-beta-D-glucopyranoside n-Dodecyl-beta-D-maltopyranoside 0.27 12 80 0.27
12 30 0.27 12 30 0.69 12 10 0.82 12 10 0.9 12 0 0.57 12 0 3.1 n-Hexadeycl-beta-D-maltopyranoside (HBDM) 16 80 0.077 16 30 0.52 16 10 4.1
Test Conditions:
12 80
16 0 4.2
position: Distilled Water
n-octane Equal volumes of aqueous and oil phase Room Temperature for equilibration of phases and IFT
ALL SAMPLES have 0.1 wt% Surfactant Recall that more complete results are shown in Figure 7.2.5.5 and 7.2.6.3 for the n-Hexadeycl-beta-D-maltopyranoside (HBDM) surfactant for a number of different cosurfactants. These tests with HBDM presented earlier in this report were performed to
surfactant would be even better than ial APG roduct (PG 2062) with the longest chain length (average of C12.5).
ontrasting
Brine ComOil Phase:
determine if a C16 APG the commercp Also, the theoretical analysis discussed elsewhere in this report focused on c
126
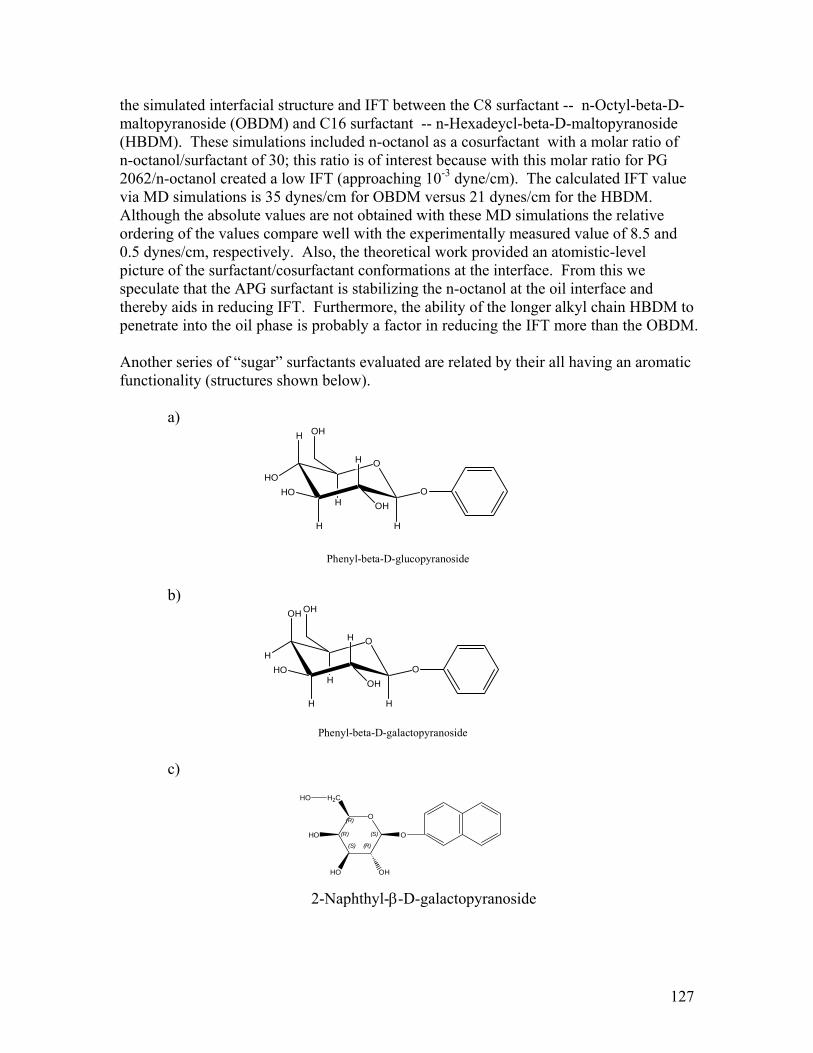
the simulated interfacial structure and IFT between the C8 surfactant -- n-Octyl-beta-D-
f
BDM.
lthough the absolute values are not obtained with these MD simulations the relative .5 and
tical work provided an atomistic-level icture of the surfactant/cosurfactant conformations at the interface. From this we
t is s lizin and educing IFT. Furthermore, the ability of the longer alkyl chain HBDM to
OBDM.
ctants evaluate atic
maltopyranoside (OBDM) and C16 surfactant -- n-Hexadeycl-beta-D-maltopyranoside (HBDM). These simulations included n-octanol as a cosurfactant with a molar ratio on-octanol/surfactant of 30; this ratio is of interest because with this molar ratio for PG 2062/n-octanol created a low IFT (approaching 10-3 dyne/cm). The calculated IFT valuevia MD simulations is 35 dynes/cm for OBDM versus 21 dynes/cm for the HAordering of the values compare well with the experimentally measured value of 80.5 dynes/cm, respectively. Also, the theorepspeculate that the APG surfactan tabi g the n-octanol at the oil interfacethereby aids in rpenetrate into the oil phase is probably a factor in reducing the IFT more than the Another series of “sugar” surfa d are related by their all having an aromfunctionality (structures shown below). a)
O
H
H
OH
HOHO
OHHO
H H
Phenyl-beta-D-glucopyranoside b)
OH
OH
HHO O
H H
OHH
O
Phenyl-beta-D-galactopyranoside
H
c)
2-Naphthyl-β-D-galactopyranoside
H2CHO
(S) (R)
HO
HO
O
OH
(S)
O(R)
(R)
127
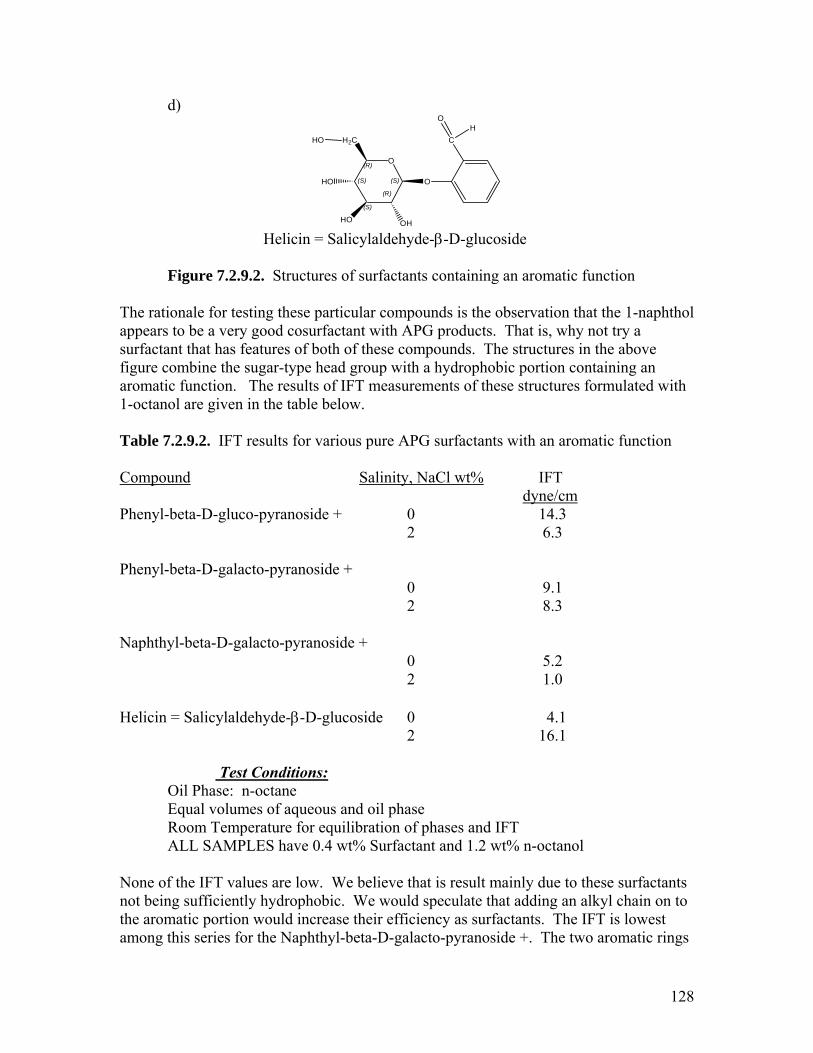
d)
(S)
(R)
(S)
O(R)
(S) O
HO
H2C
HO
OH
HO C
OH
Helicin = Salicylaldehyde-β-D-glucoside Figure 7.2.9.2. Structures of surfactants containing an aromatic function The rationale for testing these particular compounds is the observation that the 1-naphthol appears to be a very good cosurfactant with APG products. That is, why not try a surfactant that has features of both of these compounds. The structures in the above figure combine the sugar-type head group with a hydrophobic portion containing an aromatic function. The results of IFT measurements of these structures formulated with
en in the table below.
Table 7.2.9.2. IFT results for various pure APG surfactants with an aromatic function Compound
1-octanol are giv
Salinity, NaCl wt% IFT dyne/cm Phenyl-beta-D-gluco-pyranoside + 0 14.3 2 6.3
pyranoside + 0 9.1 2 8.3
Naphthyl-beta-D-galacto-pyranoside + 0 5.2 2 1.0 Helicin = Salicylaldehyde-β-D-glucoside 0 4.1
2 16.1
st Conditions:
henyl-beta-D-galacto-P
Te
Equal volumes of aqueous and oil phase Room Temperature for equilibration of phases and IFT ALL SAMPLES have 0.4 wt% Surfactant and 1.2 wt% n-octanol
one of the IFT values are low. We believe that is result mainly due to these surfactants g an alkyl chain on to
e aromatic portion would increase their efficiency as surfactants. The IFT is lowest mong this series for the Naphthyl-beta-D-galacto-pyranoside +. The two aromatic rings
Oil Phase: n-octane
Nnot being sufficiently hydrophobic. We would speculate that addintha
128
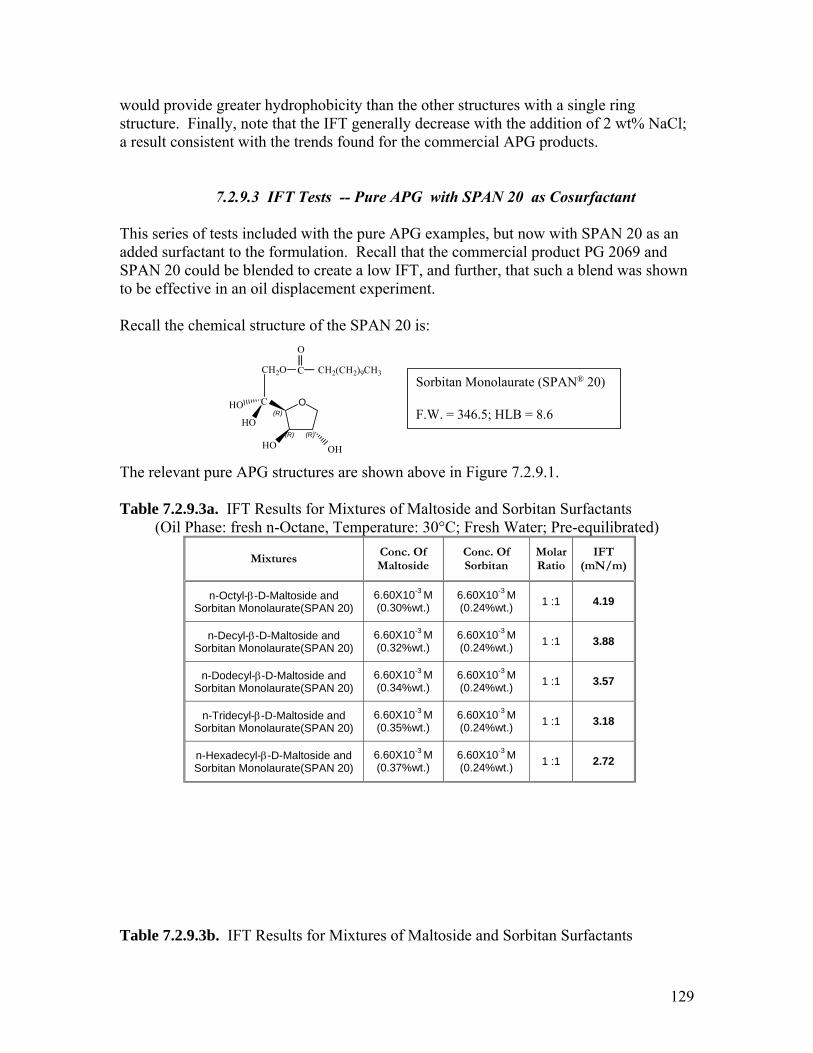
would provide greater hydrophobicity than the other structures with a single ring structure. Finally, note that the IFT generally decrease with the addition of 2 wt% NaCl; a result consistent with the trends found for the commercial APG products.
7.2.9.3 IFT Tests -- Pure APG with SPAN 20 as Cosurfactant
with SPAN 20 as an G 2069 and
shown be ef
m eratur 30°C Fresh -equilibrated)
This series of tests included with the pure APG examples, but nowdded surfactant to the formulation. Recall that the commercial product Pa
SPAN 20 could be blended to create a low IFT, and further, that such a blend wasfective in an oil displacement experiment. to
Recall the chemical structure of the SPAN 20 is:
(R)O
C
O
C
CH2O
HO
CH2(CH2)9CH3
The relevant pure APG structures are shown above in Figure 7.2.9.1.
rfactants Table 7.2.9.3a. IFT Results for Mixtures of Maltoside and Sorbitan Su(O l Phas fresh -Octa , Tei e: n ne p e: ; Water; Pre
Mixtures Conc. Of Maltoside
Conc. Of Sorbitan
Molar Ratio
IFT (mN/m)
n-Oc -M e ait olaur
0wt
6 M (0 t.) 1 :1 tyl-β-D altosid nd
Sorb an Mon ate(SPAN 20) 6.60X1 M (0.30% .)
.60X10-
.24%w 4.19 -3 3
n-Decyl-β-D-Maltoside and Sorbitan Monolaurate(SPAN 20)
6.60X10⁻³ M (0.32%
6.60X10⁻³ M (0.24%w 1 :1 3.88 wt.) t.)
n-Dodecyl-β -Maltos e and Sorb an Mon ate(SPAN 20)
6.60X1 M (0.34% .)
.60X10-
.24%w 3.57 -D idit olaur
0-3
wt6 3 M (0 t.) 1 :1
n-Tridecyl-β-D-Maltoside and Sorb tan Mono aurate(SPAN 20)
6.6 10-3
(0. %6.60X10 3 M 1 :1 i l wt (0 t.)
0X M 35 .)
-
.24%w 3.18
n-Hexadecyl-β-D-Maltoside and Sorb 20)
6.60X10⁻³ M (0.37%wt.)
6.60X10⁻³ M (0.24%wt.) 1 :1 2.72 itan Monolaurate(SPAN
Table 7.2.9.3b. IFT Results for Mixtures of Maltoside and Sorbitan Surfactants
(R) (R)
OHHO
HO
Sorbitan Monolaurate (SPAN® 20)
F.W. = 346.5; HLB = 8.6
129
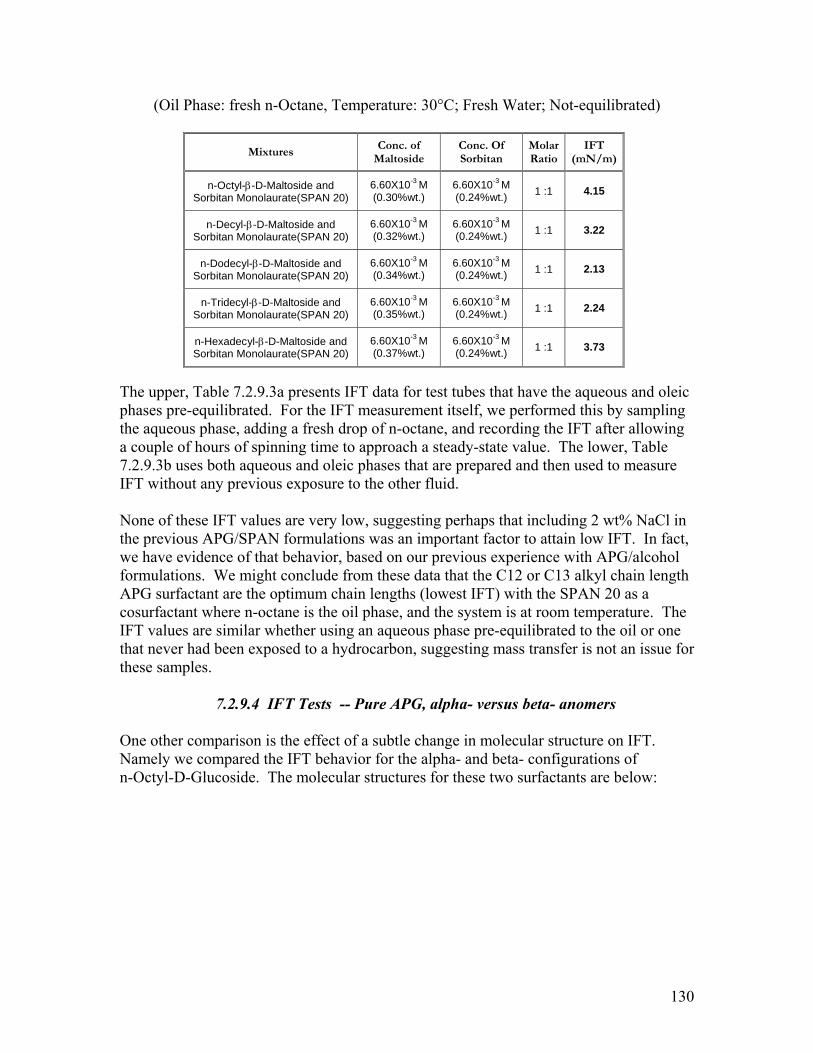
(Oil Phase: fresh n-Octane, Temperature: 30°C; Fresh Water; Not-equilibrate
Mixtures Conc. of Conc. Of Molar IFT
d)
Sorbitan Ratio
(mN/m) Maltoside
n-Sorb
-3 -3 Octyl-β-D-Maltoside and itan Monolaurate(SPAN 20)
6.60X10 M (0.30%wt.)
6.60X10 M (0.24%wt.) 1 :1 4.15
n-Decyl-β-D-Maltoside and Sorbitan Monolaurate(SPAN 20)
6.60X10⁻³ M (0.32%wt.)
6.60X10⁻³ M (0.24%wt.) 1 :1 3.22
n-Dodecyl-β-D-Maltoside and Sorbitan Monolaurate(SPAN 20)
6.60X10⁻³ M (0.34%wt.)
6.60X10⁻³ M (0.24%wt.) 1 :1 2.13
n-Tridecyl-β-D-Maltoside and 6.60X10 M 6.60X10⁻³ M (0.24%wt.) 1 :1 2.24
-3
Sorbitan Monolaurate(SPAN 20) (0.35%wt.)
n-Hexadecyl-β-Sorbitan Monolaur
D-Maltoside and ate(SPAN 20)
6.60X10 M (0.37%wt.)
6.60X10⁻³ M (0.24%wt.) 1 :1 3.73
-3
he upper, Table 7.2.9.3a presents IFT data for test tubes that have the aqueous and oleic
ent itself, we performed this by sampling ad
couple of hours of spinning time to approach a steady-state value. The lower, Table used to measure
l in the p act, we have evidence of that behavior, based on our previous experience with APG/alcohol formulations. We might conclude from these data that the C12 or C13 alkyl chain length APG surfactant are the optimum chain lengths (lowest IFT) with the SPAN 20 as a cosurfactant where n-octane is the oil phase, and the system is at room temperature. The IFT values are similar whether using an aqueous phase pre-equilibrated to the oil or one that never had been exposed to a hydrocarbon, suggesting mass transfer is not an issue for these samples.
7.2.9.4 IFT Tests -- Pure APG, alpha- versus beta- anomers
One other comparison is the effect of a subtle change in molecular structure on IFT. Namely we compared the IFT behavior for the alpha- and beta- configurations of n-Octyl-D-Glucoside. The molecular structures for these two surfactants are below:
Tphases pre-equilibrated. For the IFT measurem
e aqueous phase, ding a fresh drop of n-octane, and recording the IFT after allowing tha7.2.9.3b uses both aqueous and oleic phases that are prepared and then
T without any previous exposure to the other fluid. IF None of these IFT values are very low, suggesting perhaps that including 2 wt% NaC
revious APG/SPAN formulations was an important factor to attain low IFT. In f
130
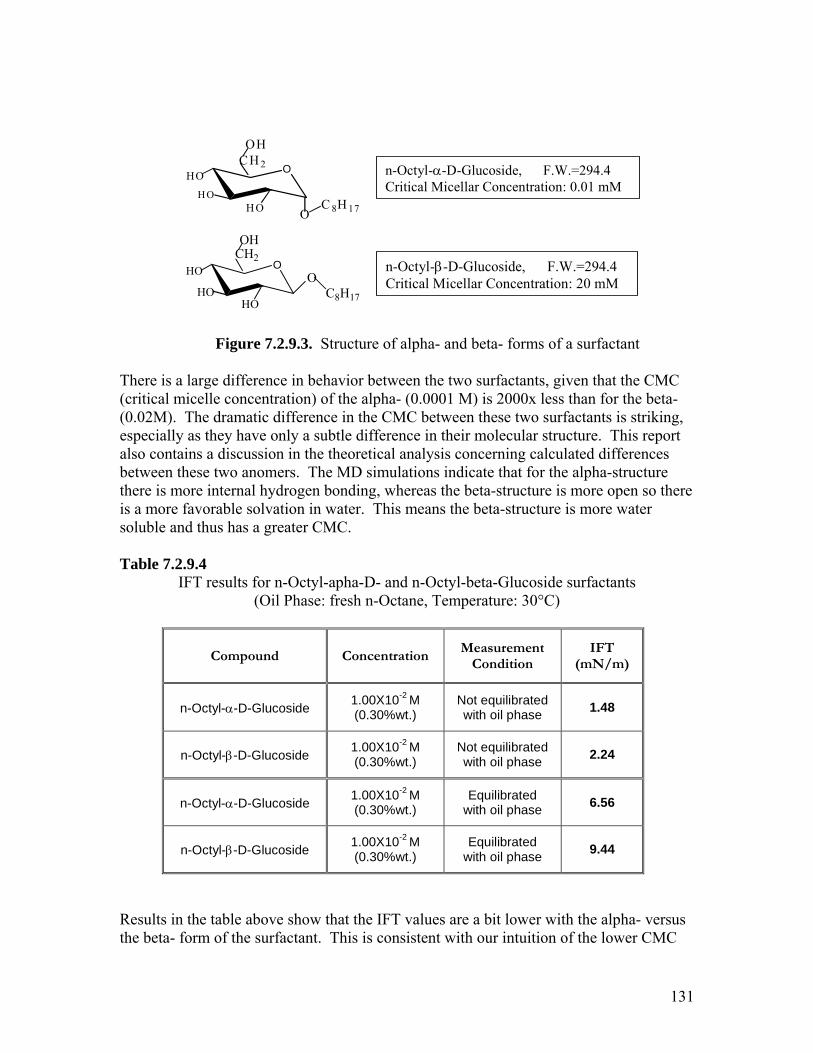
Figure 7.2.9.3. Structure of alpha- and beta- forms of a surfactant
eta-structure is more open so there
(mN/m)
OC H 2
OH
HOH O
H O OC 8H 17
n-Octyl-α-D-Glucoside, F.W.=294.4Critical Micellar Concentration: 0.01 mM
OCH2
OH
HO
HOHO
OC8H17
n-Octyl-β-D-Glucoside, F.W.=294.4Critical Micellar Concentration: 20 mM
There is a large difference in behavior between the two surfactants, given that the CMC (critical micelle concentration) of the alpha- (0.0001 M) is 2000x less than for the beta- (0.02M). The dramatic difference in the CMC between these two surfactants is striking, especially as they have only a subtle difference in their molecular structure. This report also contains a discussion in the theoretical analysis concerning calculated differences between these two anomers. The MD simulations indicate that for the alpha-structure there is more internal hydrogen bonding, whereas the bis a more favorable solvation in water. This means the beta-structure is more water soluble and thus has a greater CMC. Table 7.2.9.4
IFT results for n-Octyl-apha-D- and n-Octyl-beta-Glucoside surfactants (Oil Phase: fresh n-Octane, Temperature: 30°C)
Compound Concentration Measurement IFT
Condition
n-Octyl-α-D-Glucoside 1.00X10⁻² M (0.30%wt.)
Not equilibrated with oil phase 1.48
n-Octyl-β-D-Glucoside 1.00X10⁻² M (0.30%wt.)
Not equilibrated with oil phase 2.24
n-Octyl-α-D-Glucoside 1.00X10 M (0.30%wt.)
Equilibrated with oil phase 6.56
-2
n-Octyl-β-D-Glucoside 1.00X10⁻² M (0.30%wt.)
Equilibrated with oil phase 9.44
esults in the table above show that the IFT values are a bit lower with the alpha- versus e beta- form of the surfactant. This is consistent with our intuition of the lower CMC
Rth
131
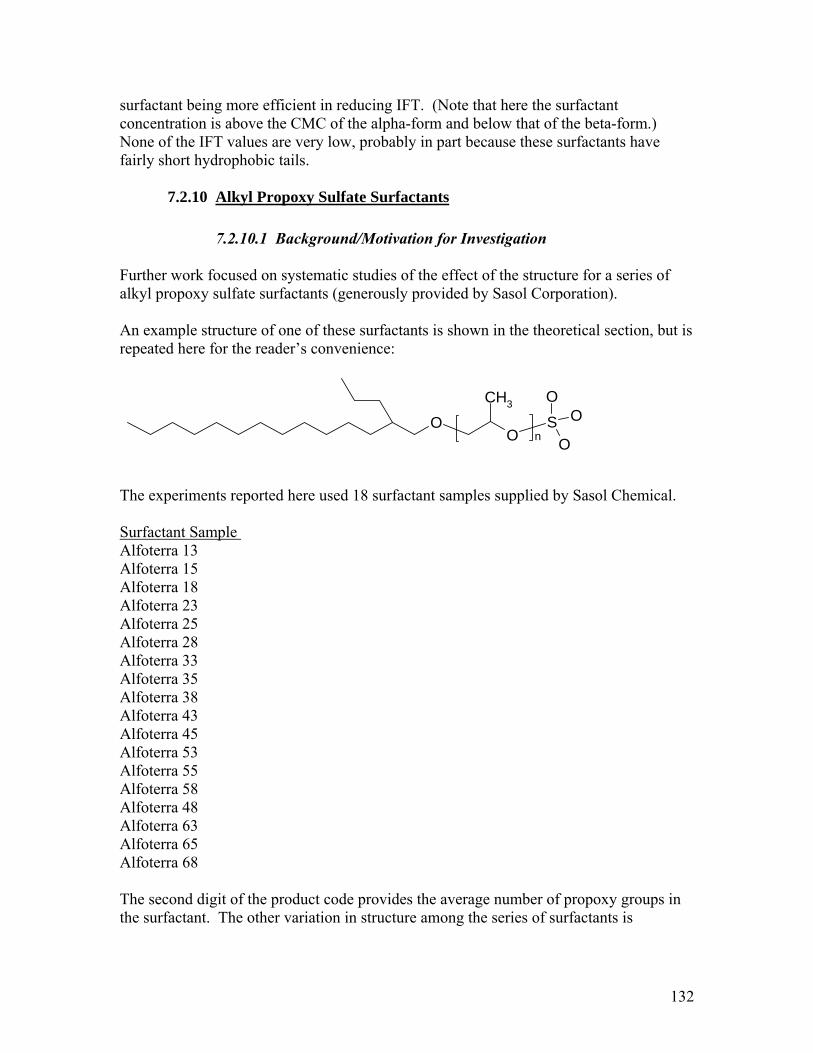
surfactant being more efficient in reducing IFT. (Note that here the surfactant oncentration is above the CMC of the alpha-form and below that of the beta-form.) one of the IFT values are very low, probably in part because these surfactants have irly short hydrophobic tails.
7.2.10 Alkyl Propoxy Sulfate Surfactants
cNfa
0. gation
rk em the effect of the structure for a series of d by Sasol Corporation).
ut is
7.2.1 1 Background/Motivation for Investi Further wo focused on syst atic studies of alkyl propoxy sulfate surfactants (generously provide An example structure of one of these surfactants is shown in the theoretical section, brepeated here for the reader’s convenience: The experiments reported here used 18 surfactant samples supplied by Sasol Chemical. Surfactant Sample
OO
SO
O
OCH3
n
Alfoterra 13 Alfoterra 15
Alfoterra
lfoterra 25 Alfoterra 28 Alfoterra 33 Alfoterra 35 Alfoterra 38 Alfoterra 43 Alfoterra 45 Alfoterra 53 Alfoterra 55 Alfoterra 58 Alfoterra 48 Alfoterra 63 Alfoterra 65 Alfoterra 68
he second digit of the product code provides the average number of propoxy groups in
18
Alfoterra 23A
Tthe surfactant. The other variation in structure among the series of surfactants is
132
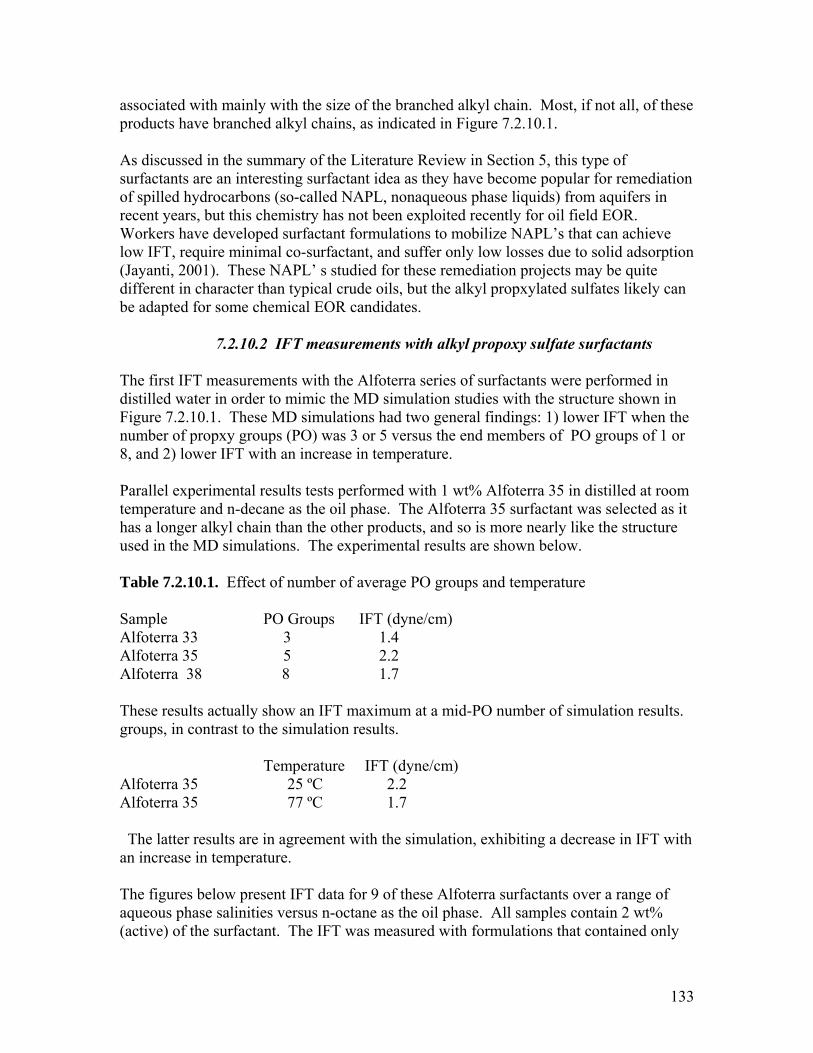
associated with mainly with the size of the branched alkyl chain. Most, if not aproducts have branched alkyl chains, as indicated in Figure 7.2.10.1. As discussed in the summary of
ll, of these
the Literature Review in Section 5, this type of rfactants are an interesting surfactant idea as they have become popular for remediation
phase liquids) from aquifers in ecent years, but this chemistry has not been exploited recently for oil field EOR.
Workers have s that can achieve w IFT, require m rption
n
with alkyl propoxy sulfate surfactants
easurements with the Alfoterra series of surfactants were performed in n order to mimic the MD simulation studies with the structure shown in
igure 7.2.10.1. These MD simulations had two general findings: 1) lower IFT when the umber of propxy groups (PO) was 3 or 5 versus the end members of PO groups of 1 or , and 2) lower IFT with an increase in temperature.
an t ther products, and so is more nearly like the structure ulations. The experimental results are shown below.
PO groups and temperature
O Groups T (dyne/cm)
1.7
tually ow an IFT m ximum ber of simulation results. st to e simu
Temperature IFT (dyne/cm) 25 ºC 2.2
s s are agreement w xhibiting a decrease in IFT with
suof spilled hydrocarbons (so-called NAPL, nonaqueousr
developed surfactant formulations to mobilize NAPL’inimal co-surfactant, and suffer only low losses due to solid adsolo
(Jayanti, 2001). These NAPL’ s studied for these remediation projects may be quite different in character than typical crude oils, but the alkyl propxylated sulfates likely cae adapted for some chemical EOR candidates. b
7.2.10.2 IFT measurements The first IFT mistilled water id
Fn8 Parallel experimental results tests performed with 1 wt% Alfoterra 35 in distilled at room
mperature and n-decane as the oil phase. The Alfoterra 35 surfactant was selected as it tehas a longer alkyl chain th he oused in the MD sim Table 7.2.10.1. Effect of number of average Sample P IFAlfoterra 33 3 1.4
5 2.2 Alfoterra 35 Alfoterra 38 8 These results ac sh a at a mid-PO numgroups, in contra th lation results. Alfoterra 35 Alfoterra 35 77 ºC 1.7
imulation, e The latter re ult in ith the san increase in temperature. The figures below present IFT data for 9 of these Alfoterra surfactants over a range of aqueous phase salinities versus n-octane as the oil phase. All samples contain 2 wt% (active) of the surfactant. The IFT was measured with formulations that contained only
133
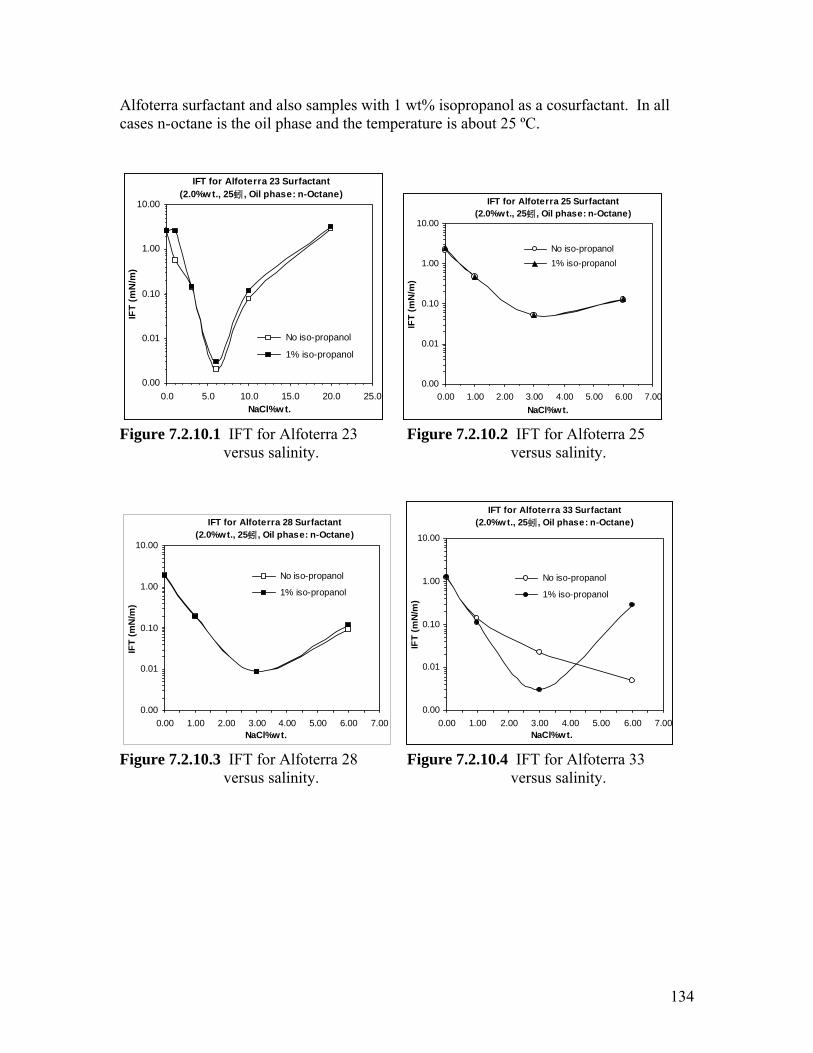
Alfoterra surfactant and also samples with 1 wt% isopropanol as a cosurfactant. In all cases n-octane is the oil phase and the temperature is about 25 ºC.
IFT for Alfoterra 23 Surfactant(2.0%w t., 25蚓 , Oil phase: n-Octane)
0.10
1.00
10.00
IFT
(mN
/m)
0.000.0 5.0 10.0 15.0 20.0 25.0
NaCl%w t.
0.01 No iso-propanol
1% iso-propanol
IFT for Alfoterra 25 Surfactant(2.0%wt., 25蚓, Oil phase: n-Octane)
0.10
1.00
10.00
FT (m
N/m
)I
No iso-propanol 1% iso-propanol
0.01
0.000.00 1.00 2.00 3.00 4.00 5.00 6.00 7.00
NaCl%wt.
Figure 7.2.10.1 IFT for Alfoterra 23 Figure 7.2.10.2 IFT for Alfoterra 25 versus salinity. versus salinity.
IFT for Alfoterra 33 Surfactant(2.0%wt., 25蚓 , Oil phase: n-Octane)
10.00
IFT for Alfoterra 28 Surfactant(2.0%wt., 25蚓 , Oil phase: n-Octane)
10.00
No iso-propanol
1% iso-propanol
0.000.00 1.00 2.00 3.00 4.00 5.00 6.00 7.00
NaCl%wt.
0.01
0.10
T (m
1.00
IFN
/m)
0.000.00 1.00 2.00 3.00 4.00 5.00 6.00 7.00
0.01
NaCl%wt.
)
No iso-propanol
1% iso-propanol1.00
0.10mN
/mIF
T (
IFT f 2.10.4 IFT for Alfoterra 33
versus salinity. Figure 7.2.10.3 or Alfoterra 28 Figure 7.
versus salinity.
134
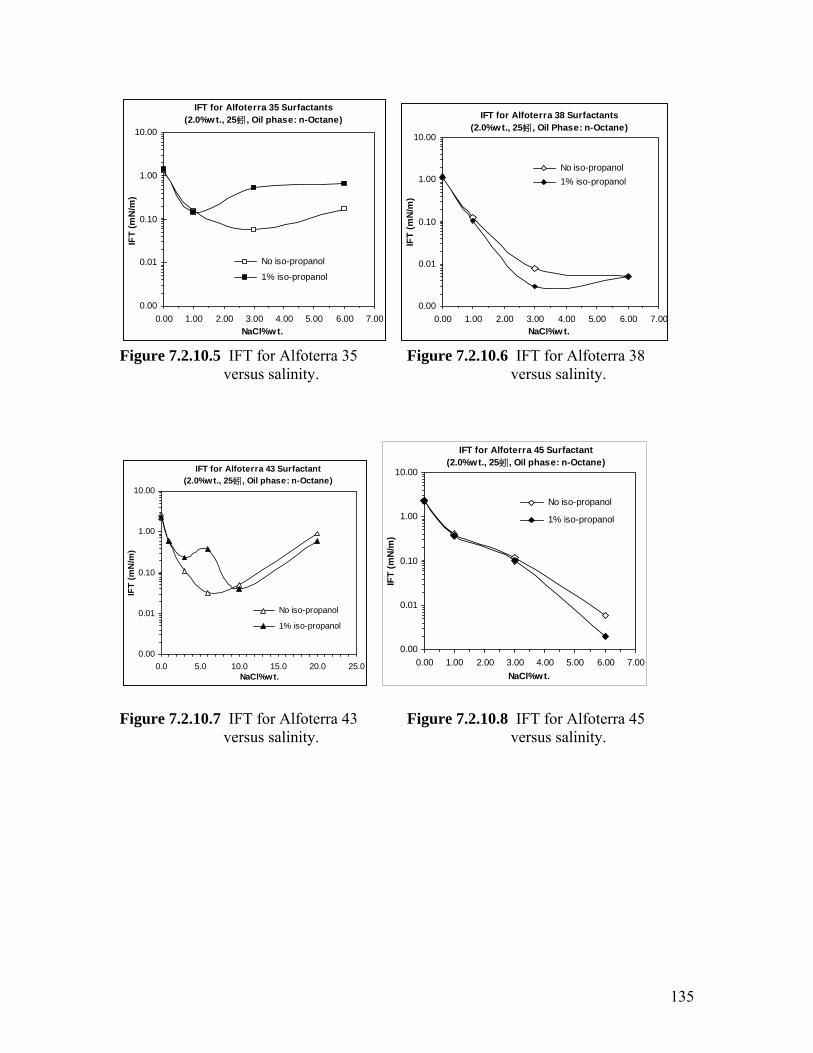
IFT for Alfoterra 35 Surfactants(2.0%wt., 25蚓 , Oil phase: n-Octane)
10.00
0.00
0.01
0.10
1.00
0.00 1.00 2.00 3.00 4.00 5.00 6.00 7.00NaCl%wt.
IFT
(mN
/m)
No iso-propanol
1% iso-propanol
IFT for Alfoterra 38 Surfactants(2.0%wt., 25蚓 , Oil Phase: n-Octane)
0.00
0.01
0.10
1.00
10.00
0.00 1.00 2.00 3.00 4.00 5.00 6.00 7.00NaCl%w t.
IFT
(mN
/m)
No iso-propanol 1% iso-propanol
Figure 7.2.10.5 IFT for Alfoterra 35 Figure 7.2.10.6 IFT for Alfoterra 38 versus salinity. versus salinity.
IFT for Alfoterra 43 Surfactant(2.0%wt., 25蚓 , Oil phase: n-Octane)
0.00
0.01
0.10
1.00
10.00
0.0 5.0 10.0 15.0 20.0 25.0NaCl%wt.
IFT
(mN
/m)
No iso-propanol
1% iso-propanol
IFT for Alfoterra 45 Surfactant(2.0%wt., 25蚓 , Oil phase: n-Octane)
0.00
0.01
0.10
1.00
10.00
0.00 1.00 2.00 3.00 4.00 5.00 6.00 7.00NaCl%wt.
IFT
(mN
/m)
No iso-propanol
1% iso-propanol
Figure 7.2.10.7 IFT for Alfoterra 43 Figure 7.2.10.8 IFT for Alfoterra 45 versus salinity. versus salinity.
135
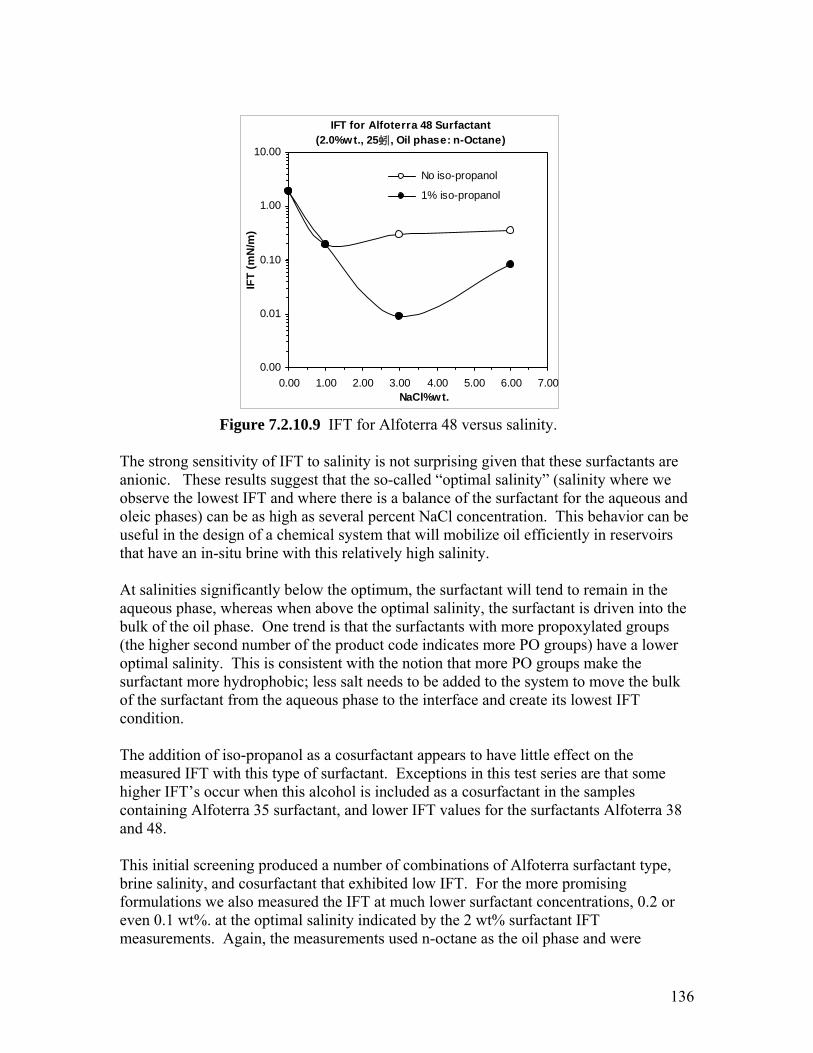
IFT for Alfoterra 48 Surfactant(2.0%wt., 25蚓 , Oil phase: n-Octane)
0.000.00 1. .0 0 4.00 5.00 6.00 7.00
0.01
0.10
1.00
10.00
00 2 0 3.0NaCl%wt.
IFT
(mN
/m)
No iso-propanol
1% iso-propanol
Figure 7.2.10.9 IFT for Alfoterra 48 versus salinity.
The strong sensitivity of IFT to salinity is not surprising given that these surfactants are anionic. These results suggest that the so-called “optimal salinity” (salinity where we observe the lowest IFT and where there is a balance of the surfactant for the aqueous and oleic phases) can be as high as several percent NaCl concentration. This behavior can be useful in the design of a chemical system that will mobilize oil efficiently in reservoirs that have an in-situ brine with this relatively high salinity. At salinities significantly below the optimum, the surfactant will tend to remain in the aqueous phase, whereas when above the optimal salinity, the surfactant is driven into the bulk of the oil phase. One trend is that the surfactants with more propoxylated groups (the higher second number of the product code indicates more PO groups) have a lower optimal salinity. This is consistent with the notion that more PO groups make the surfactant more hydrophobic; less salt needs to be added to the system to move the bulk f the surfactant from the aqueous phase to the interface and create its lowest IFT
The addition of iso-propanol as a cosurfactant appears to have little effect on the measured IFT with this type of surfactant. Exceptions in this test series are that some higher IFT’s occur when this alcohol is included as a cosurfactant in the samples containing Alfoterra 35 surfactant, and lower IFT values for the surfactants Alfoterra 38 and 48. This initial screening produced a number of combinations of Alfoterra surfactant type, brine salinity, and cosurfactant that exhibited low IFT. For the more promising formulations we also measured the IFT at much lower surfactant concentrations, 0.2 or even 0.1 wt%. at the optimal salinity indicated by the 2 wt% surfactant IFT measurements. Again, the measurements used n-octane as the oil phase and were
ocondition.
136
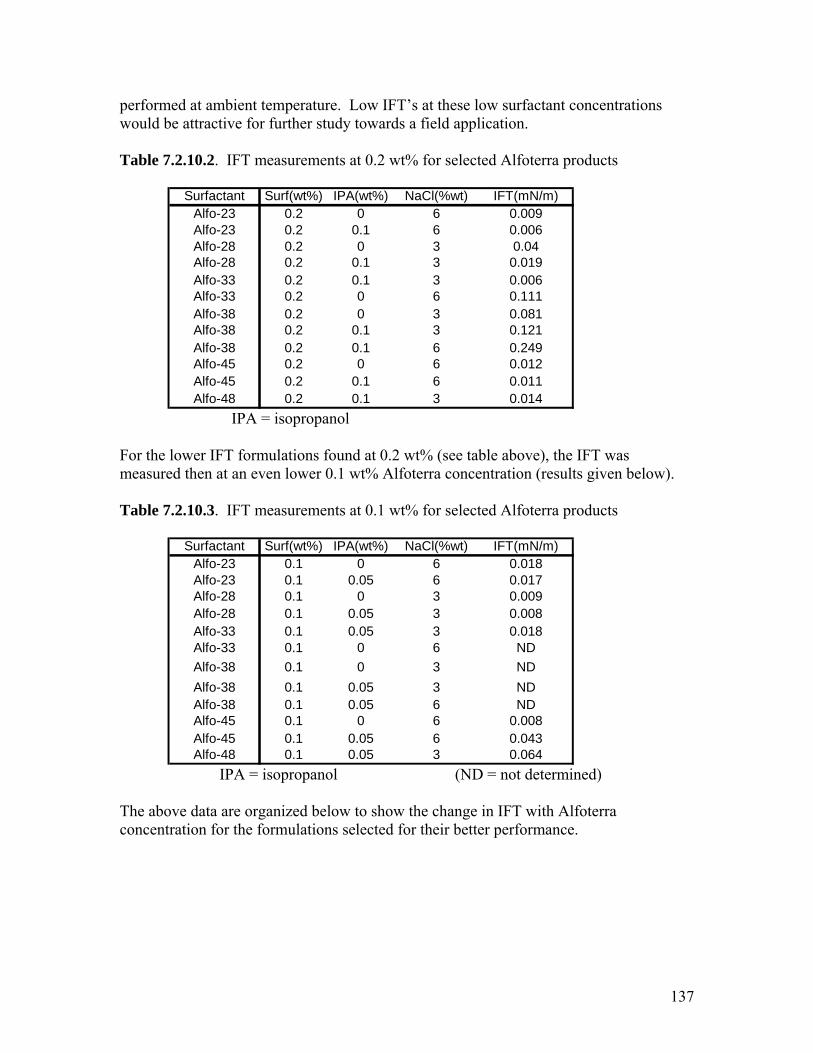
performed at ambient temperature. Low IFT’s at these low surfactant concentrations would be attractive for further study towards a field application. Table 7.2.10.2. IFT measurements at 0.2 wt% for selected Alfoterra products
Surfactant Surf(wt%) IPA(wt%) NaCl(%wt) IFT(mN/m)Alfo-23 0.2 0 6 0.009Alfo-23 0.2 0.1 6 0.006Alfo-28 0.2 0 3 0.04Alfo-28 0.2 0.1 3 0.019Alfo-33 0.2 0.1 3 0.006Alfo-33 0.2 0 6 0.111Alfo-38 0.2 0 3 0.081Alfo-38 0.2 0.1 3 0.121Alfo-38 0.2 0.1 6 0.249Alfo-45 0.2 0 6 0.012Alfo-45 0.2 0.1 6 0.011Alfo-48 0.2 0.1 3 0.014
IPA = isopropanol For the lower IFT formulations found at 0.2 wt% (see table above), the IFT was measured then at an even lower 0.1 wt% Alfoterra concentration (results given below). Table 7.2.10.3. IFT measurements at 0.1 wt% for selected Alfoterra products
Surfactant Surf(wt%) IPA(wt%) NaCl(%wt) IFT(mN/m)Alfo-23 0.1 0 6 0.018Alfo-23 0.1 0.05 6 0.017Alfo-28 0.1 0 3 0.009Alfo-28 0.1 0.05 3 0.008Alfo-33 0.1 0.05 3 0.018Alfo-33 0.1 0 6 NDAlfo-38 0.1 0 3 NDAlfo-38 0.1 0.05 3 NDAlfo-38 0.1 0.05 6 NDAlfo-
Alfo-48 0.1 0.05 3 0.064
45 0.1 0 6 0.008Alfo-45 0.1 0.05 6 0.043
IPA = isopropanol (ND = not determined) The above data are organized below to show the change in IFT with Alfoterra concentration for the formulations selected for their better performance.
137
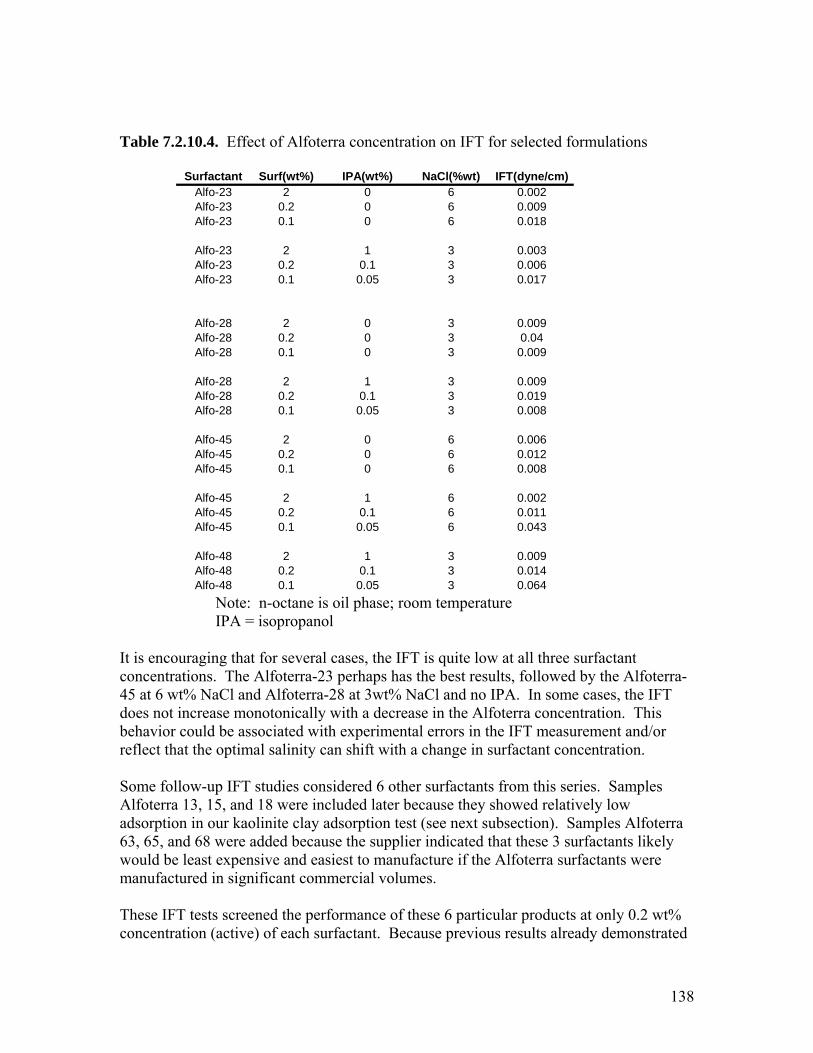
Table 7.2.10.4. Effect of Alfoterra concentration on IFT for selected formulations
0.05 3 0.008
Alfo-45 2 0 6 0.006
Alfo-45 0.1 0.05 6 0.043
Alfo-48 2 1 3 0.009Alfo-48 0.2 0.1 3 0.014Alfo-48 0.1 0.05 3 0.064
Surfactant Surf(wt%) IPA(wt%) NaCl(%wt) IFT(dyne/cm)Alfo-23 2 0 6 0.002Alfo-23 0.2 0 6 0.009Alfo-23 0.1 0 6 0.018
Alfo-23 2 1 3 0.003Alfo-23 0.2 0.1 3 0.006Alfo-23 0.1 0.05 3 0.017
Alfo-28 2 0 3 0.009Alfo-28 0.2 0 3 0.04Alfo-28 0.1 0 3 0.009
Alfo-28 2 1 3 0.009Alfo-28 0.2 0.1 3 0.019Alfo-28 0.1
Alfo-45 0.2 0 6 0.012Alfo-45 0.1 0 6 0.008
Alfo-45 2 1 6 0.002Alfo-45 0.2 0.1 6 0.011
Note: n-octane is oil phase; room temperature IPA = isopropanol It is encouraging that for several cases, the IFT is quite low at all three surfactant concentrations. The Alfoterra-23 perhaps has the best results, followed by the Alfoterra-45 at 6 wt% NaCl and Alfoterra-28 at 3wt% NaCl and no IPA. In some cases, the IFT does not increase monotonically with a decrease in the Alfoterra concentration. This behavior could be associated with experimental errors in the IFT measurement and/or
flect that the optimal salinity can shift with a change in surfactant concentration.
ome follow-up IFT studies considered 6 other surfactan ples
foterra
ould be least expensive and easiest to manufacture if the Alfoterra surfactants were anufactured in significant commercial volumes.
hese IFT tests screened the performance of these 6 particular products at only 0.2 wt% oncentration (active) of each surfactant. Because previous results already demonstrated
re
ts from this series. SamSAlfoterra 13, 15, and 18 were included later because they showed relatively lowadsorption in our kaolinite clay adsorption test (see next subsection). Samples Al3, 65, and 68 were added because the supplier indicated that these 3 surfactants likely 6
wm Tc
138
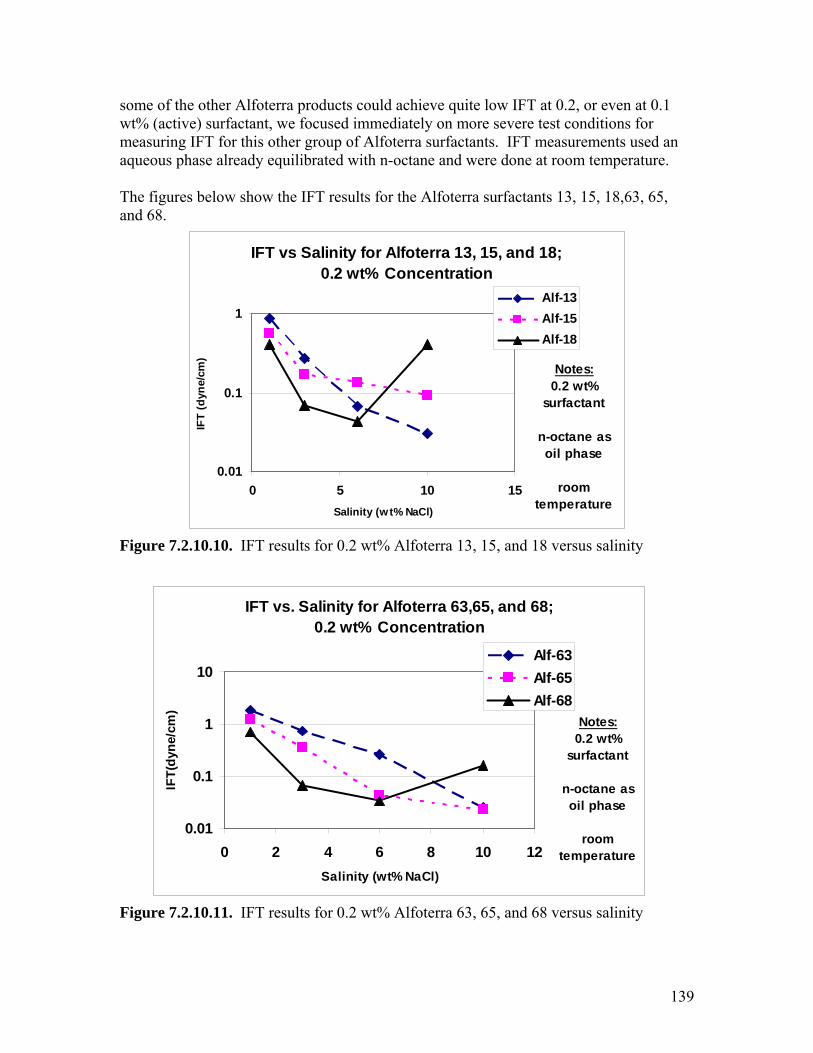
some of the other Alfoterra products could achieve quite low IFT at 0.2, or even at 0.1 t% (active) surfactant, we focused immediately on more severe test conditions for
an queous phase already equilibrated with n-octane and were done at room temperature.
The figures below show the IFT results for the Alfoterra surfactants 13, 15, 18,63, 65, and 68.
Figure 7.2.10.10. IFT results for 0.2 wt% Alfoterra 13, 15, and 18 versus salinity
wmeasuring IFT for this other group of Alfoterra surfactants. IFT measurements useda
IFT vs Salinity for Alfoterra 13, 15, and 18; 0.2 wt% Concentration
0.01
0.1
1
0 5 10 15Salinity (wt% NaCl)
IFT
(dyn
e/cm
)
Alf-13Alf-15Alf-18
Notes:0.2 wt%
surfactant
n-octane as oil phase
room temperature
IFT vs. Salinity for Alfoterra 63,65, and 68;
oncentration
(
0.2 wt% C
0.01
0.1
0 2 4 6 8 10 12Salinity (wt% NaCl)
IFT
1
10
dyne
/cm
)
Alf-63Alf-65Alf-68
Notes:0.2 wt%
surfactant
n-octane as oil phase
room temperature
Figure 7.2.10.11. IFT results for 0.2 wt% Alfoterra 63, 65, and 68 versus salinity
139
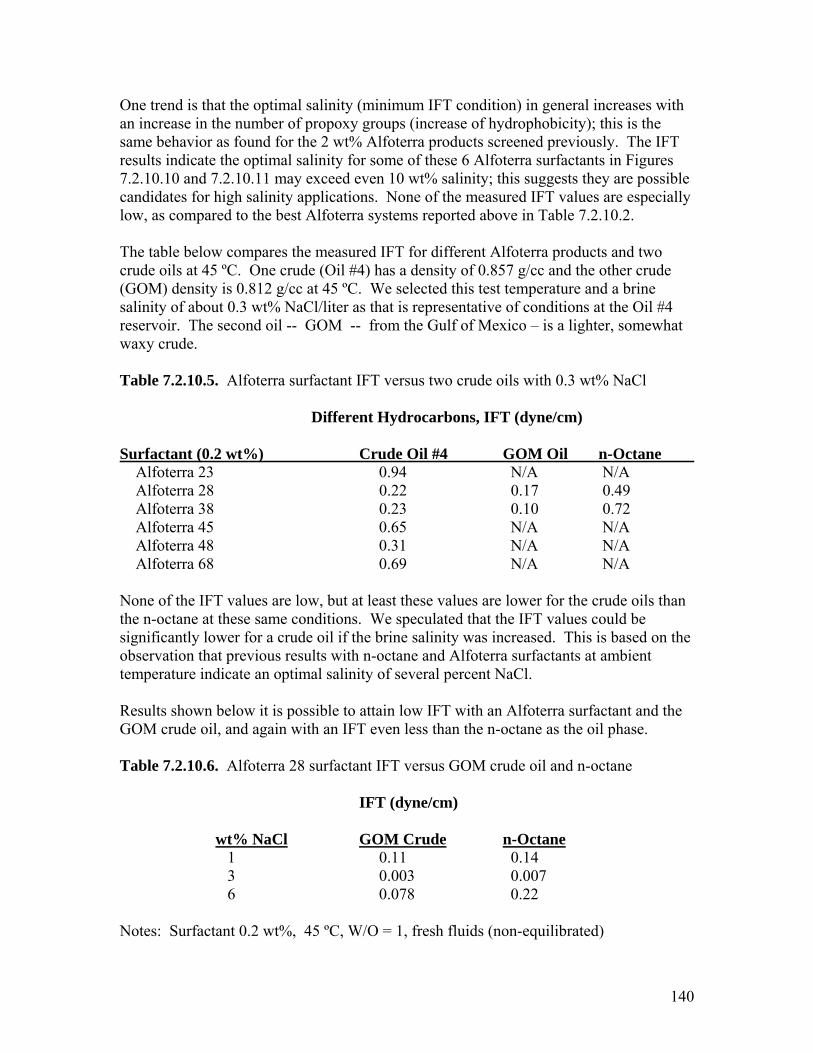
One trend is that the optimal salinity (minimum IFT condition) in general increases withan increase in the number of propoxy groups (increase of hydrophobicity); this is thesame behavior as found for the 2 wt% Alfoterra products screened previously. The IFT results indicate the optimal salinity for some of these 6 Alfoterra surfactants in Figures
.2.10.10 and 7.2.10.11 may exceed even 10 wt% salinity; this suggests they are possible ly
pared to the best Alfoterra systems reported above in Table 7.2.10.2.
pares the measured IFT for different Alfoterra products and two rude oils at 45 ºC. One crude (Oil #4) has a density of 0.857 g/cc and the other crude
OM) density is 0.812 g/cc at 45 ºC. We selected this test temperature and a brine linity of about 0.3 wt% NaCl/liter as that is representative of conditions at the Oil #4 servoir. The second oil -- GOM -- from the Gulf of Mexico – is a lighter, somewhat axy crude.
able 7.2.10.5. Alfoterra surfactant IFT versus two crude oils with 0.3 wt% NaCl
Different Hydrocarbons, IFT (dyne/cm)
urfactant (0.2 wt%) Crude Oil #4 GOM Oil n-Octane
7candidates for high salinity applications. None of the measured IFT values are especiallow, as com The table below comc(Gsarew T S Alfoterra 23 0.94 N/A N/A Alfoterra 28 0.22 0.17 0.49 Alfoterra 38 0.23 0.10 0.72 Alfoterra 45 0.65 N/A N/A
0.69 N/A N/A
ues are low, but at least these values are lower for the crude oils than e n-octane at these same conditions. We speculated that the IFT values could be gnificantly lower for a crude oil if the brine salinity was increased. This is based on the bservation that previous results with n-octane and Alfoterra surfactants at ambient mperature indicate an optimal salinity of several percent NaCl.
esults shown below it is possible to attain low IFT with an Alfoterra surfactant and the OM crude oil, and again with an IFT even less than the n-octane as the oil phase.
able 7.2.10.6. Alfoterra 28 surfactant IFT versus GOM crude oil and n-octane
IFT (dyne/cm)
wt% NaCl
Alfoterra 48 0.31 N/A N/A Alfoterra 68 None of the IFT valthsiote RG T GOM Crude n-Octane 1 0.11 0.14
3 0.003 0.007 6 0.078 0.22
otes: Surfactant 0.2 wt%, 45 ºC, W/O = 1, fresh fluids (non-equilibrated)
N
140
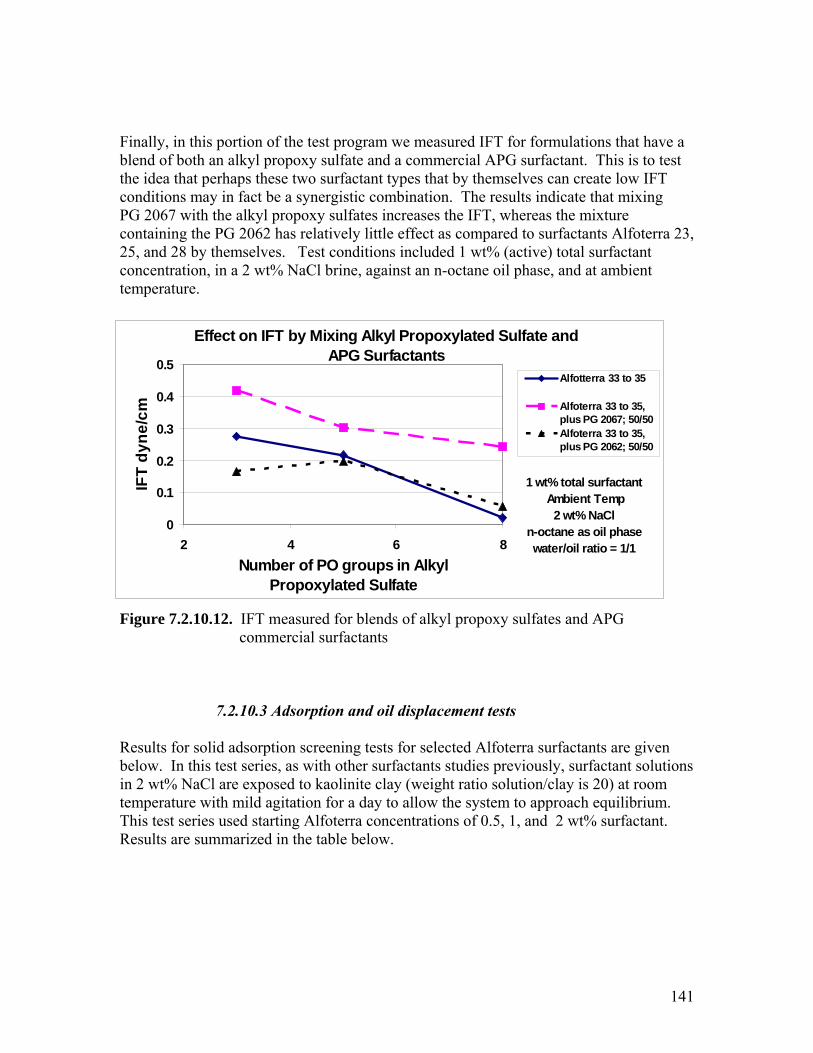
Finally, in this portion of the test program we measured IFT for formulations that have a blend of both an alkyl propoxy sulfate and a commercial APG surfactant. This is to testthe idea that perhaps these two surfactant types that by themselves can create low IFT conditions may in fact be a synergistic combination. The results indicate that mixing PG 2067 with the alkyl propoxy sulfates increases the IFT, whereas the mixture
ontaining the PG 2062 has relatively little effect as compared to surfactants Alfoterra 23,
esults for solid adsorption screening tests for selected Alfoterra surfactants are given olutions
2 wt% NaCl are exposed to kaolinite clay (weight ratio solution/clay is 20) at room system to approach equilibrium.
his test series used starting Alfoterra concentrations of 0.5, 1, and 2 wt% surfactant. e b
c25, and 28 by themselves. Test conditions included 1 wt% (active) total surfactant concentration, in a 2 wt% NaCl brine, against an n-octane oil phase, and at ambient temperature. Figure 7.2.10.12. IFT measured for blends of alkyl propoxy sulfates and APG commercial surfactants
Effect on IFT by Mixing Alkyl Propoxylated Sulfate and APG Surfactants
0.
0.4
0.5
Number o PO gr lkyl Propoxylated Sulfate
Alfotterra 33 to 35
3
cm Alfoterplus P
ra 33 to 35,G 2067; 50/50
Alfoterra 33 to 35,s PG
7.2.10.3 Adsorption and oil displacement tests
Rbelow. In this test series, as with other surfactants studies previously, surfactant sintemperature with mild agitation for a day to allow the TResults are summarized in the tabl elow.
0
0.1IFT
dyne
/
plu 2062; 50/500.2
2 4 6 8f oups in A
1 wt% total surfactan Ambient T
t
wt% Nc ne as o
r/oil rat
emp2 aCl
n-o ta il phasewate io = 1/1
141
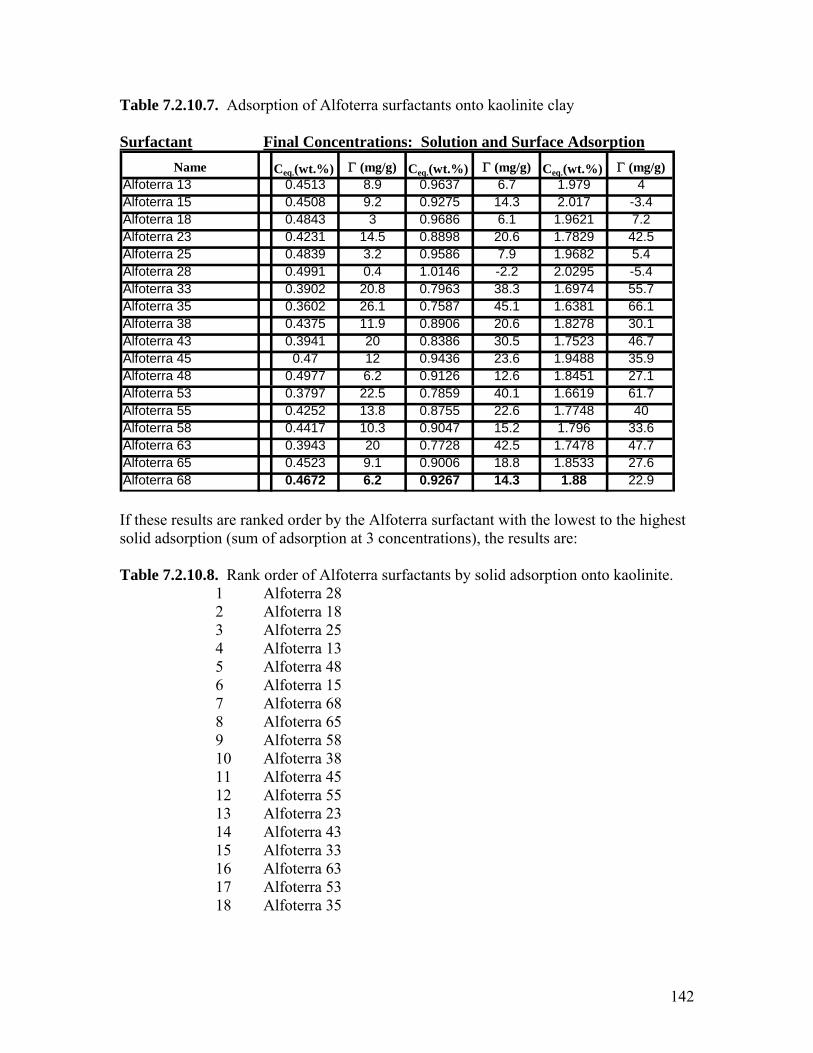
Table 7.2.10.7. Adsorption of Alfoterra surfactants onto kaolinite clay Surfactant Final Concentrations: Solution and Surface Adsorption
Name Ceq.(wt.%) Γ (mg/g) Ceq.(wt.%) Γ (mg/g) Ceq.(wt.%) Γ (mg/g)Alfoterra 13 0.4513 8.9 0.9637 6.7 1.979 4Alfoterra 15 0.4508 9.2 0.9275 14.3 2.017 -3.4Alfoterra 18 0.4843 3 0.9686 6.1 1.9621 7.2Alfoterra 23 0.4231 14.5 0.8898 20.6 1.7829 42.5Alfoterra 25 0.4839 3.2 0.9586 7.9 1.9682 5.4Alfoterra 28 0.4991 0.4 1.0146 -2.2 2.0295 -5.4Alfoterra 33 0.3902 20.8 0.7963 38.3 1.6974 55.7
oterra 35 0.3602 26.1 0.7587 45.1 1.6381 66.1oterra 38 0.4375 11.9 0.8906 20.6 1.8278 30.1
0.3941 20 0.8386 30.5 1.7523 46.7oterra 45 0.47 12 0.9436 23.6 1.9488 35.9oterra 48 0.4977 6.2 0.9126 12.6 1.8451 27.1oterra 53 0.3797 22.5 0.7859 40.1 1.6619 61.7oterra 55 0.4252 13.8 0.8755 22.6 1.7748 40oterra 58 0.4417 10.3 0.9047 15.2 1.796 33.6oterra 63 0.3943 20 0.7728 42.5 1.7478 47.7oterra 65 0.4523 9.1 0.9006 18.8 1.8533 27.6
lfoterra 68 0.4672 6.2 0.9267 14.3 1.88 22.9
AlfAlfAlfoterra 43AlfAlfAlfAlfAlfAlfAlfA
these results are ranked order by the Alfoterra surfactant with the lowest to the highest lid adsorption (sum of adsorption at 3 concentrations), the results are:
able 7.2.10.8. Rank order of Alfoterra surfactants by solid adsorption onto kaolinite. 1 Alfoterra 28
5 Alfoterra 48 6 Alfoterra 15
16 Alfoterra 63 17 Alfoterra 53 18 Alfoterra 35
Ifso T 2 Alfoterra 18 3 Alfoterra 25
4 Alfoterra 13 7 Alfoterra 68
8 Alfoterra 65 9 Alfoterra 58 10 Alfoterra 38 11 Alfoterra 45 12 Alfoterra 55 13 Alfoterra 23 14 Alfoterra 43
15 Alfoterra 33
142
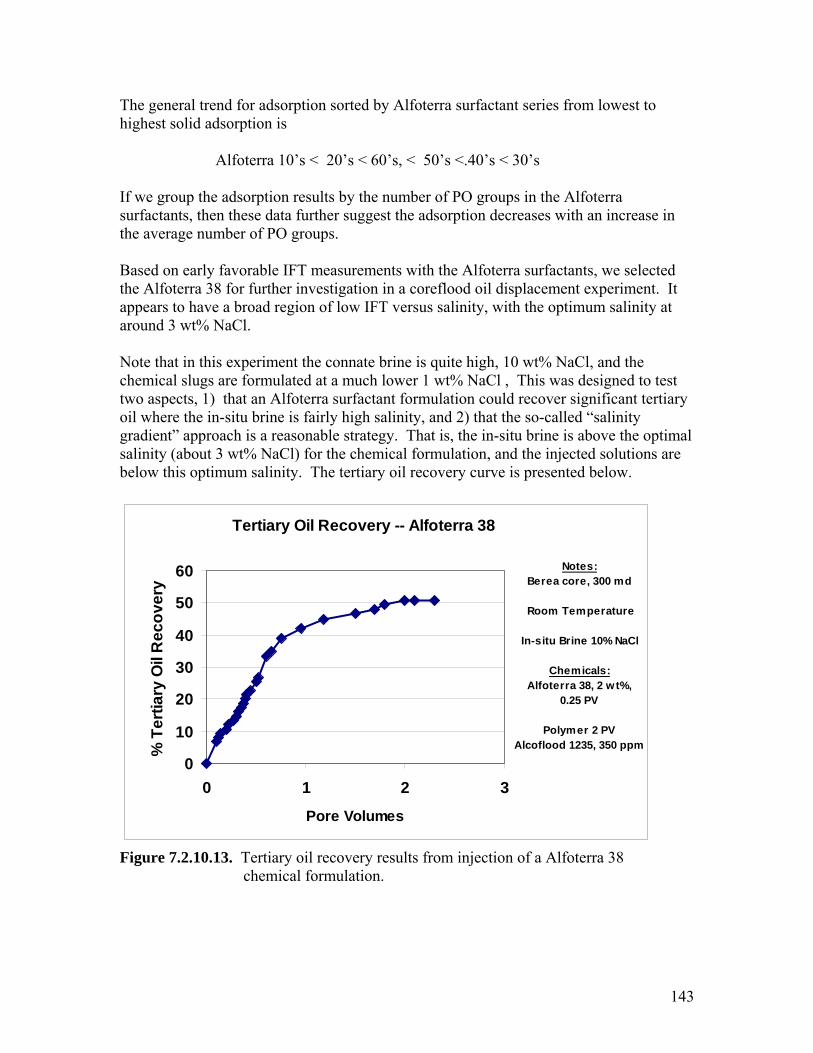
The general trend for adsorption sorted by Alfoterra surfactant series from lowest to ighest solid adsorption is
Alfoterra 10’s < 20’s < 60’s, < 50’s <.40’s < 30’s If we group the adsorption results by the number of PO groups in the Alfoterra surfactants, then these data further suggest the adsorption decreases with an increase in the average number of PO groups. Based on early favorable IFT measurements with the Alfoterra surfactants, we selected the Alfoterra 38 for further investigation in a coreflood oil displacement experiment. It appears to have a broad region of low IFT versus salinity, with the optimum salinity at around 3 wt% NaCl. Note that in this experiment the connate brine is quite high, 10 wt% NaCl, and the chemical slugs are formulated at a much lower 1 wt% NaCl , This was designed to test two aspects, 1) that an Alfoterra surfactant formulation could recover significant tertiary oil where the in-situ brine is fairly high salinity, and 2) that the so-called “salinity gradient” approach is a reasonable strategy. That is, the in-situ brine is above the optimal salinity (about 3 wt% NaCl) for the chemical formulation, and the injected solutions are below this optimum salinity. The tertiary oil recovery curve is presented below.
ults from injection of a Alfoterra 38
h
Tertiary Oil Recovery -- Alfoterra 38 Figure 7.2.10.13. Tertiary oil recovery res chemical formulation.
0
%
10 T
20iar
30 Oil
Re 40co
50ve
60
0 1 2 3
s Pore Volume
ert
yry
Notes:Berea core, 300 md
Room Temperature
Chemicals:
In-situ Brine 10% NaCl
Alfoterra 38, 2 wt%, 0.25 PV
Polymer 2 PVAlcoflood 1235, 350 ppm
143
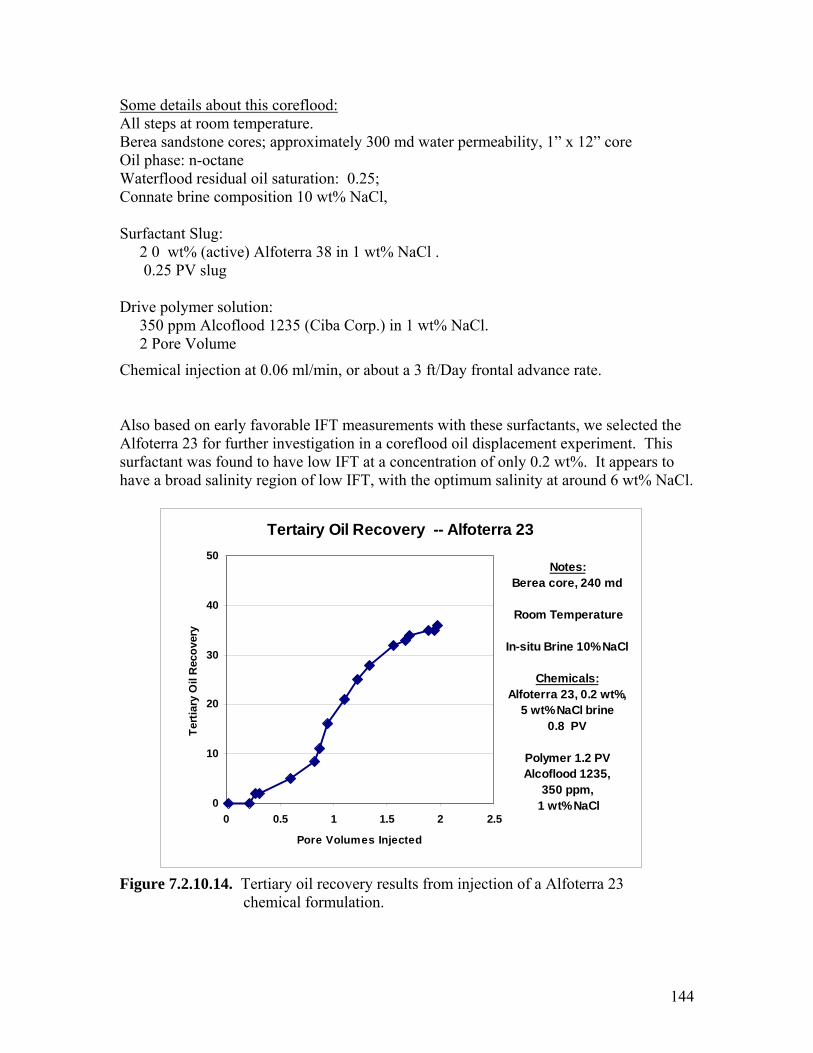
Some details about this coreflood: All steps at room temperature.
erea sandstone cores; approximately 300 md water permeability, 1” x 12” core il phase: n-ocaterflood residual oil saturation: 0.25;
2 0 wt% (active) Alfoterra 38 in 1 wt% NaCl .
1235 (Ciba Corp.) in 1 wt% NaCl. 2 Pore Volume
NaCl.
ults from injection of a Alfoterra 23 chemical formulation.
BO tane WConnate brine composition 10 wt% NaCl, Surfactant Slug: 0.25 PV slug Drive polymer solution: 350 ppm Alcoflood
Chemical injection at 0.06 ml/min, or about a 3 ft/Day frontal advance rate. Also based on early favorable IFT measurements with these surfactants, we selected the Alfoterra 23 for further investigation in a coreflood oil displacement experiment. This surfactant was found to have low IFT at a concentration of only 0.2 wt%. It appears to
ave a broad salinity region of low IFT, with the optimum salinity at around 6 wt%h
144
igure 7.2.10.14. Tertiary oil recovery res
Tertairy Oil Recovery -- Alfoterra 23
0
10
20
30
40
50
0 0.5 1 1.5 2 2.5
Pore Volumes Injected
Tert
iary
Oil
Rec
over
y
Notes:Berea core, 240 md
Room Temperature
In-situ Brine 10% NaCl
Chemicals:Alfoterra 23, 0.2 wt%,
5 wt% NaCl brine0.8 PV
Polymer 1.2 PVAlcoflood 1235,
350 ppm, 1 wt% NaCl
F
Some details about this coreflood: All steps at room temperature. Berea sandstone cores; approximately 250 md water permeability, 1” x 12” core Oil phase: n-octane Waterflood residual oil saturation: 0.25; Connate brine composition 10 wt% NaCl, Surfactant Slug: 0.2 wt% (active) Alfoterra 38 in % wt% NaCl .
linity. Finally, the chase, polymer slug, was made up in a low salinity (1 wt% NaCl) rine so as to be well below optimum and complete an overall salinity gradient design.
is only mediocre, the chemical efficiency of this coreflood xperiment is relatively good. The mass of Alfoterra 23 surfactant injected is less than at used in the previous, Alfoterra 38 coreflood test, and the percent tertiary recovery
eing somewhat less with the Alfoterra 23. As with the previous oil recovery experiment, gnificant residual oil recovery occurred even with the connate brine being a relatively igh, 10 wt% NaCl.
0.8 PV slug Drive polymer solution: 350 ppm Alcoflood 1235 (Ciba Corp.) in 1 wt% NaCl. 1.2 Pore Volume
Chemical injection at 0.06 ml/min, or about a 3 ft/Day frontal advance rate. The purpose of this coreflood was to confirm that a low concentration of Alfoterra 23 could recover significant tertiary oil. In particular, the design of the coreflood experiment was intended to have the displacement occur at a favorable, low IFT environment by having the large surfactant slug at 5 wt% NaCl, just below the optimal sab While the tertiary oil recovery ethbsih
145
7.3. Project Implications / Ideas for Improved Surfactant Formulations
tants groups in addition to the APG-type. One expectation is that these
to function relatively independently of the f making the design of the IOR process easier
nd more robust (choice of make-up and chase brine is less critical). Also, such behavior to developing chemical formulations that can create a low IFT at
related idea is the use of effective, moderately priced, surfactants that in combination nts can achieve extremely low IFT values. This was shown to
alcohol mixtures presented are able to create significantly low IFT values (0.01 dynes/cm or
.
ne theme brought out by the modeling efforts is the concept of achieving a diffuse ed
he
t.
onclusions from this project include:
he rigorous calculations of interfacial tension (IFT) via atomistic level simulations are quantitative agreement for pure component systems (e.g. water and a hydrocarbon).
Including surfactant molecules complicates the simulation significantly; so far atomistic level simulations are successful in providing semi-quantitative agreement with water/surfactant/oil systems considered. Absolute values are typically higher than found experimentally. In addition, perhaps due to the limited sample sizes and simulation times, as well as the inherit numerical approximations in the calculation of pressures from molecular dynamics, the precision of the calculations is not high enough so far to distinguish surfactants with IFT differences of less than 1 dyne/cm. In spite of the current limitations, the molecular dynamics simulations provided useful technical insights as to the molecular structure and sources of IFT water/surfactant/oil
One general research direction would be further study of yet other nonionic surfacwith large polar hearlarge-head nonionic structures are expectedsalinity. This behavior has the advantage oashould lend itselfrelatively high salinity. Awith inexpensive cosurfacabe the case with the alkylpolyglycoside (APG) surfactants /here. On average we less) with less than 20% of the customary surfactant concentration by weight Ointerface; this suggests creating longer surfactants built with a gradual transitions fromvery polar to very non polar behavior. The general idea is to create a "dumb bell" shapsurfactant to "lock" the large polar regions in water and the non-polar regions in talkane, providing a more robust interface. This is consistent with the notion and observation of improved IFT performance (but normally a downside of increasing solid adsorption) with increasing the alkyl chain length. Another idea would be to combine features of the APG and the alkyl propoxy sulfate surfactants. For example, the head group of an APG surfactant could be combined with a branched alkyl chain, perhaps thereby improving the water solubility of an APG producFurthermore, this alkyl chain could feature ethoxyl (EO) or propoxy (PO) groups that can aid in adjusting the hydrophilic and hydrophobic balance. . CONCLUSIONS 8
C Tin
146
systems that translate into recommended surfactants for laboratory evaluation. Examples f this include
. For the last surfactants, simulations also examined the teractions with a cosurfactant at an interface and found regular packing associated with
ulations, veraging step size, and thermodynamic ensembles.
newer ideas for IOR surfactants cluding: 1) sulfonated alkyl aromatics, 2) alkyl propoxylated sulfates, 3) alkyl
b
ous series of non-ionic kaolinite clay demonstrate their adsorption level generally decreases as
ater soluble.
monstrate that a non-ionic diethanolamine may e a good candidate as the main surfactant (previously considered as a cosurfactant).
the
s
PG 2062 / 1-octanol
oa) our ability to reproduce the effect of changing the substitution site for the polar (benzosulfonate) group along the alkyl backbone chain in this type of ionic surfactants, b) uncovering the correlation between a high interfacial-mixing of oil/surfactant and surfactant/water media and low surface tension c) establishing the stability of interfaces for three families of surfactants i) ionic (alkylbenzosulfonates), ii) alkyl propoxylated surfactants, and iii) non-ionic alkyl polyglucoside surfactantsina low IFT condition. Testing of various simulation parameters has provided some guidelines as to the requiredvalues of numerical parameters (e.g. number of molecules) required to achieve a converged prediction of IFT, number of integration slabs, length of time of sima The less rigorous simulation methods can aid in providing a qualitative picture of the desirable features of an effective surfactant. For example, surfactants that enhance the transition between the water and oil phases is desirable. Coulomb and van der Waalscomponent forces are important across the interface. The completed literature review suggests some of theinpolyglycosides, 4) more emphasis on formulation (synergistic cosurfactants), 5) "dumbell" surfactants, and 6) polymeric surfactants. A substantial compilation of literature and new results are included in this report. Laboratory measurements of adsorption of several homologsurfactants ontothe surfactant is more w Supporting experimental studies also deb Focused experimental studies of alkyl polyglycoside (APG) surfactant-based formulations confirm they can have the desirable attributes of creating a low IFT that is somewhat independent of salinity and temperature. Some formulations also hadbeneficial attribute of creating a low IFT even with very low APG concentrations. It also was found there is an optimum co-linker additive with an APG surfactant to generate its minimum IFT. In particular, we uncovered a new result that aromatic based alcoholmay be efficient co-linkers for APG surfactants. More specifically, the best APG formulations included: PG 2062 / 1-naphthol PG 2069 / SPAN 20
147
Detailed study wthese may create low IFT conditions, and at a low surfactant concentration. In addithese low IFT values may occur at a salinity of several percent, suggesting these
ith a series of branched alkyl propoxy sulfate surfactants demonstrate tion,
e in our testing program are
s
lycoside) or scaling up (alkylpropoxy sulfates) of promising rfactants for enhanced oil recovery. Furthermore, the advanced simulations tools
further
n
surfactants may be applicable for IOR in relatively higher salinity reservoirs. For thisclass of surfactants, those with good performancAlfoterra 23 and Alfoterra 38. The Alfoterra 28 also has promise given that It harelatively low solid adsorption, plus it can attain low IFT under certain conditions. The data presented herein can provide the needed industrial impetus for extending the application (alkyl polygsupresented here can be used to continue to uncover new types of surfactants with promising properties such as inherent low IFT and biodegradability and can be ofutility to the specialty chemical oil industry. 9. REFERENCES Balzer, D.: “Alkylpolyglcosides, their Physico-chemical Properties and their Uses”, Tenside Surf. Det., 38, 419 – 427, 1991a. Balzer, D., et. al., U.S. Patent 4,985,154, “Process for the extraction of crude oil from aunderground deposit using surfactants”, 1991b. Balzer, D., and Luders, H., editors.: Nonionic Surfactants, Alkyl Polyglycosides, Marcel Dekker, New York, p. 228 – 243, 1996.
,
II, W.A., et. al.: “Hildebrand and Hansen Solubility
ial pplications, 1977.
e Gibbs Surface Excess
Barakat, Y., et. al.: “Adsorption of alkylbenzene sulphonates onto mineral surfaces”Indian Journal of Chem. Tech., Vol. 2, 162-166, May 1995.
Belmares, M., Blanco, M., Goddard IParameters from Molecular Dynamics with Applications to Electronic Nose Polymer Sensors”, submitted for publication. Berger, P.and Lee, C.H.: “Ultra-low Concentration Surfactants for Sandstone and Limestone Floods”, paper SPE 75186, presented at SPE/DOE Symposium on Improved Oil Recovery, Tulsa, April 13-17, 2002. Cash, R.L., et. al.: “Modeling Crude Oils for Low Interfacial Tension”, paper SPE 5813, presented at the SPE Symposium on Improved Oil Recovery, 22-24 March 1976. Cayais, J.L., Schechter, R.S., and Wade, W.H.: “The Measurement of Low InterfacTension via the Spinning Drop Technique”, section 17, Surfactant A Chattoraj, D.K. and K.S. Birdi, Adsorption and th , Plenum: New York, 1984.
148
Doe, P.H.,Wade, W.H, and Schechter, R.S.: “Alkyl Benzene Sulfonates for Producing Low Interfacial Tension between Hydrocarbons and Water” , J. Coll. Int. Science, 59, 525, 1977. Doe, P.H.,El-Emary, Wade, W.H, and Schechter, R.S.: “The Influence of Surfactant
8.
,
orster, T., Guckenbiehl, B., Hensen, H., and von Rybinski.: “Physico-chemical basis of yl polyglycosides”, Progr. Colloid Polym Sci., 101, 105-112,
ansen, C.M., J. Paint Tech., 39, 511, 1967.
User’s Handbook
Structure on Low interfacial Tensions”, ACS Symposium Series 91, Chapter 2, 197
Endo, H., et. al.: “Amphiphilic block copolymers as efficiency boosters in microemulsions: a SANS investigation of the role of polymers”, Appl. Phys. A [Suppl.]S392 – S395, 2002. Forster, T., et. al.: “Physico-chemical basics of microemulsions with alkyl polyglycosides”, Progr. Colloid Polym. Sci., 101, 105 – 112, 1996. Fmicroemulsions with alk996. 1
Grest, G. S.; Lacasse, M. D.; Kremer, K., Phy. Revf. A, 33, 3628, 1986. Green, D.W. and Willhite, G.P., Enhanced Oil Recovery, pp 274-277, SPE Textbook Series Volume 6, Richardson, Texas, 1998.
H Hansen, C.M., Hansen Solubility Parameters, A , New York, CRC
ress, 2000. P Hildebrand, J.H., The Solubility of Non-Electrolytes, New York, Reinhold, 1936.
Alkylpolyglucoside Surfactants for Improved Oil Recovery, paper SPE/DOE 89472,
ng, S.S., Lin, S.T., Maita, P.K., Blanco, M., Goddard III, W.A., Shuler, P.J., and Tang, ect
Hill, K. and Rhode, O.: “Sugar-based surfactants for consumer products and technical applications”, Fett/Lipid, 10, 25 – 33, 1999. Iglauer, S., Wu, Y., Shuler, P., Tang, Y., Blanco, M., and Goddard, III, W., “The Influence of Alcohol Co-surfactants on the Interfacial Tensions of Alkylpolyglucoside Surfactant Formulations vs. n-Octane”, presented at Annual ACS meeting, Ananheim,
A, April 1, 2004. C
Iglauer, S., Wu, Y., Shuler, P, Blanco, M., Tang, Y., and Goddard, III, W., “SPE/DOE Improved Oil Recovery Symposium, Tulsa, OK, April 17 – 21, 2004. JaY.: “Molecular Dynamics Study of a Surfactant-Mediated Decane-Water Interface: Eff
149
of Molecular Architecture of Alkyl Benzene Sulfonate”, J. Phys. Chem. B, 108, 12130-
khar, et. al.: “Use of Surfactants to Recover Oils from Groundwater”, SPE 6753, presented, SPE/EPA/DOE E&P Environmental Conference, San Antonio, TX, 26-
ngwirth, P. and D.J. Tobias, D.J.: “Molecular Structure of Salt Solutions: A New View ry”, J. Phys.
ann, T., and Strey, R.: “Temperature-insensitive ial candidates
.W.: Enhanced Oil Recovery, Prentice-Hall, Inc., 1989.
muir, 18, 1908,
ecent trends in biochemistry of 3 – 563, 1999.
, urrent Opinion in Colloid and Interface Science, February, 2003.
looding, pp. 205 – 252, Academic Press, New York, 1977a.
ert, L. A. M.; van Os, N. M.; Schlijper, A. ,. Nature, 348, 624, 1990.
elo da Gama, M. M.; Gubbins, K. E. Molec. Phys., 59, 227, 1986..
April, 1996.
12140, 2004. Jayanti, She628 February 2001. Juof the Interface with Implications for Heterogeneous Atmospheric ChemistChem., 105, 10468-10472, 2001.
luge, K., Stubenrauch, C., SottmKmicroemulsions formulated from octyl monoglucoside and alcohols: potentfor practical applications”, Tenside Surf. Det., 38, 30 – 40, 2000. Kutschmann, E.M., et. al.: “Interfacial tension of alkylglucosides in different APG/oil/water systems”, Colloid Polym. Sci. 273, 565 – 571, 1995.
ake, LL
aiti, P.K., Y. Lansac, M. A. Glaser, N. A. Clark, and Y. Rouault, LangM2002. Peypoux, F., Bonmatin, J.M., and Wallach, J.: “Rsurfactin”, Appl Microbial Biotechnol, 51, 55 Sabatini, D.A., Acosta, E., and Harwell, J.H.: “Linker Molecules in Surfactant Mixtures”submitted to C Shah, D.O. and Schechter, R.S.: Improved Oil Recovery by Surfactant and Polymer F Smith, B.; Hilbers, P. A. J.; Esselink, K.; RupG Taber, J.J., Martin, F.D., and Seright, R.S.: “EOR Screening Criteia Revisited – Part 2. Application and Impact of Oil Prices”, SPE Reservoir Engineering, August 1996.
T U.S. Patent 4,985,154, “Process for the extraction of crude oil from an underground deposit using surfactants”, 1991. Wu, W., et.al.: “Design and Optimization of Low-Cost Chemical Flooding”, paper SPE/DOE 35355, presented at Symposium on Improved Oil Recovery, Tulsa, OK, 21-24
150
Wu, Y., Iglauer, S., Shuler, P., Tang, Y., Blanco, M., and Goddard, III, W., “Synergistic
ffect of Alkyl Polyglycoside and Sorbitan Mixtures on Lowering Interfacial Tension l
Eand Enhancing Oil Recovery”, presented at Annual ACS meeting, Ananheim, CA, Apri1, 2004.
Zana, R., “Dimeric (Gemini) Surfactants”, Chapter 8, Novel Surfactants, ed. K. Holmberg, Marcel Dekker, New York, 1998.
ana, R.: “Dimeric and oligomericZ surfactants. Behavior at interfaces and in aqueous
-- diethylene monoglycol butyl ether
D –- molecular dynamics
D =Not determined
on
ctyl-beta-D-maltopyranoside
solution: a review”, Advances in Colloid and Interface Science, 97, 205-253, 2002. 0. LIST OF ACRONYMS AND ABBREVIATIONS 1
APG -- alkyl polyglycoside (surfactant) CED -- cohesive energy density CMC - critical micelle concentration
MBED EOR -- enhanced oil recovery FF -- force field
BDM -- n-Hexadeycl-beta-D-maltopyranoside H HLB -- hydrophile-lipophile balance IOR –- improved oil recovery PA = isopropanol I
LJ -- Lennard Jones M N NPT -- constant pressure simulati NVT -- constant volume simulation OBDM -- n-O
151

SEAR – surfactant enhanced aquifer remediation
152
APPENDIX A. SOME DETAILS OF SURFACTANT ADSORPTION EXPERIMENTS A number of commercial nonionic surfactants were evaluated for their tendency to adsorb onto kaolinite clay. All of these tests were conducted at 25 C with a weight ratio of liquid/solid of 20, and for an exposure period of 8 hours. The gravimetric method described in the Experimental Procedure section was used. The following table summarizes the results from these adsorption tests of this study. The values reported are for 3 different initial bulk surfactant concentrations and the adsorption amounts are expressed in units of mg surfactant/gram kaolinite.
153
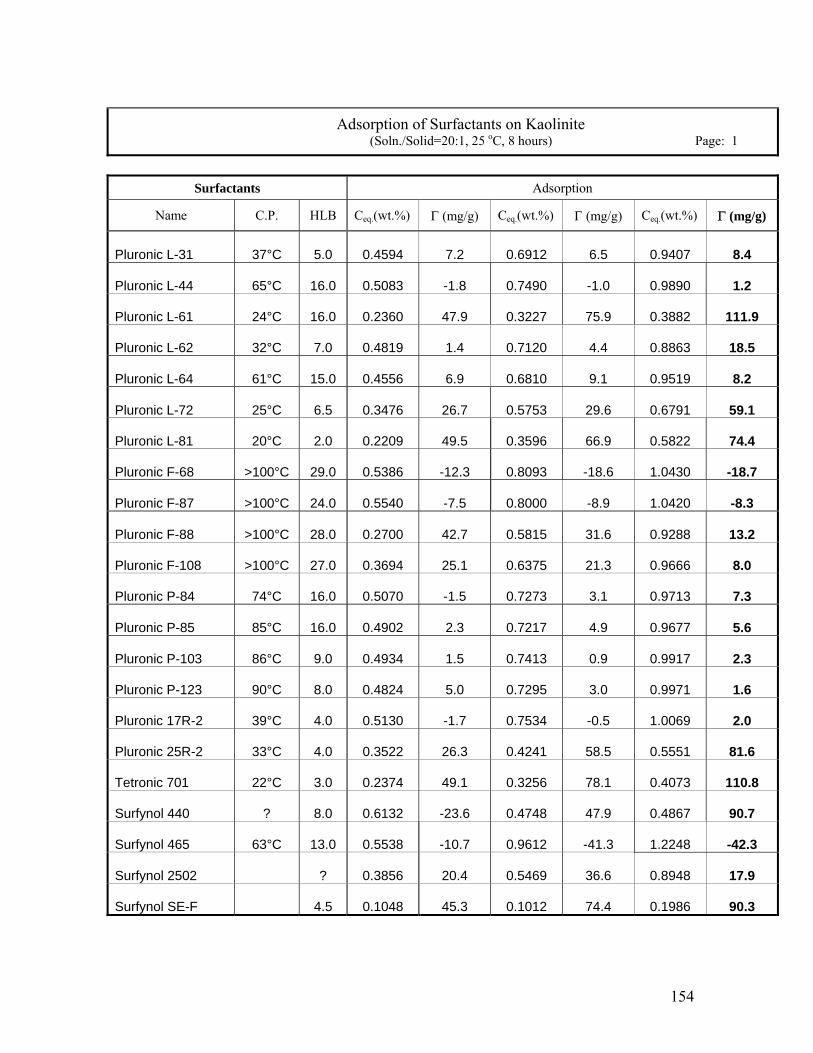
Adsorption of Surfactants on Kaolinite (Soln./Solid=20:1, 25 oC, 8 hours) Page: 1
Surfactants Adsorption
Name C.P. HLB Ceq.(wt.%) Γ (mg/g) Ceq.(wt.%) Γ (mg/g) Ceq.(wt.%) Γ (mg/g)
Pluronic L-31 37°C 5.0 0.4594 7.2 0.6912 6.5 0.9407 8.4
P 65°C 16.0 0.5083 -1.8 0.7490 -1.0 0.9890 1.2 luronic L-44
P 5.9 0.3882 111.9 luronic L-61 24°C 16.0 0.2360 47.9 0.3227 7
P 18.5 luronic L-62 32°C 7.0 0.4819 1.4 0.7120 4.4 0.8863
P 0.9519 8.2 luronic L-64 61°C 15.0 0.4556 6.9 0.6810 9.1
Pluroni 59.1 c L-72 25°C 6.5 0.3476 26.7 0.5753 29.6 0.6791
P 74.4 luronic L-81 20°C 2.0 0.2209 49.5 0.3596 66.9 0.5822
P -18.6 1.0430 -18.7 luronic F-68 >100°C 29.0 0.5386 -12.3 0.8093
Pluronic F-87 >100°C 24.0 0.5540 -7.5 0.8000 -8.9 1.0420 -8.3
Pluronic F-88 >100°C 28.0 0.2700 42.7 0.5815 31.6 0.9288 13.2
Pluronic F-108 >100°C 27.0 0.3694 25.1 0.6375 21.3 0.9666 8.0
Pluronic P-84 74°C 16.0 0.5070 -1.5 0.7273 3.1 0.9713 7.3
Pluronic P-85 85°C 16.0 0.4902 2.3 0.7217 4.9 0.9677 5.6
Pluronic P-103 86°C 9.0 0.4934 1.5 0.7413 0.9 0.9917 2.3
Pluronic P-123 90°C 8.0 0.4824 5.0 0.7295 3.0 0.9971 1.6
Pluronic 17R-2 39°C 4.0 0.5130 -1.7 0.7534 -0.5 1.0069 2.0
Pluronic 25R-2 33°C 4.0 0.3522 26.3 0.4241 58.5 0.5551 81.6
Tetronic 701 22°C 3.0 0.2374 49.1 0.3256 78.1 0.4073 110.8
Surfynol 440 ? 8.0 0.6132 -23.6 0.4748 47.9 0.4867 90.7
Surfynol 465 63°C 13.0 0.5538 -10.7 0.9612 -41.3 1.2248 -42.3
Surfynol 2502 ? 0.3856 20.4 0.5469 36.6 0.8948 17.9
Surfynol SE-F 4.5 0.1048 45.3 0.1012 74.4 0.1986 90.3
154
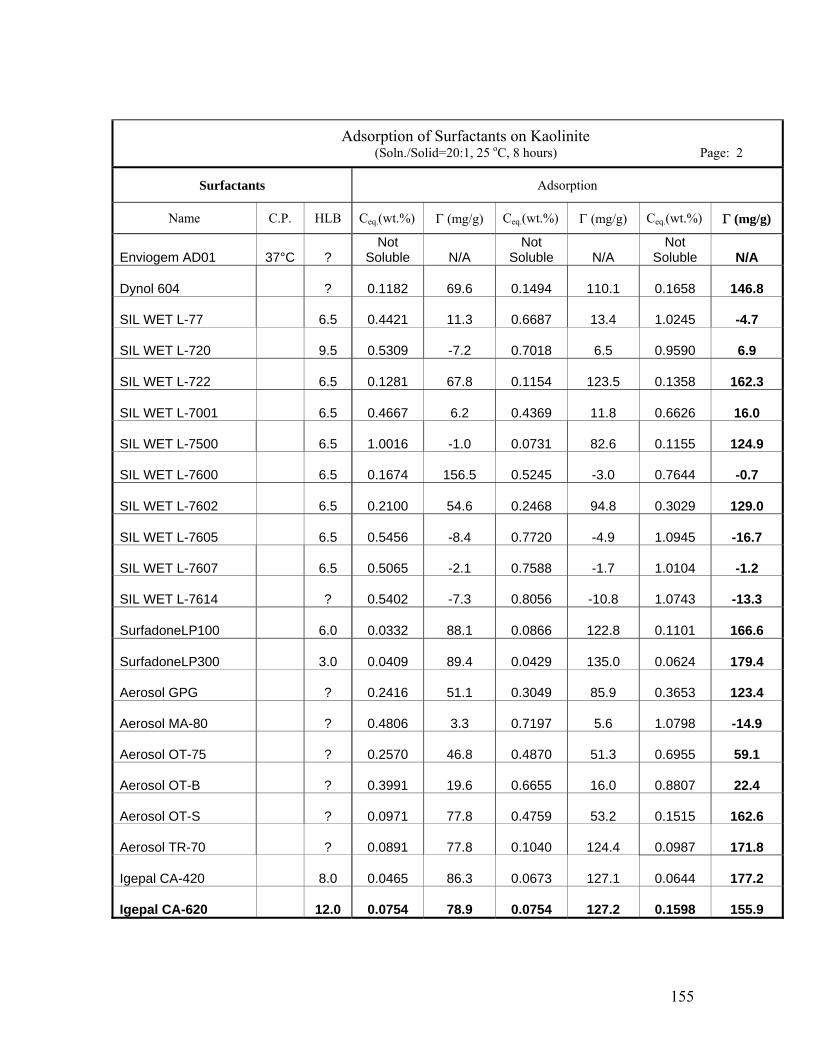
Adsorption of Surfactants on Kaolinite (Soln./Solid=20:1, 25 oC, 8 hours) Page: 2
Surfactants Adsorption
Name . C.P HLB Ceq.(wt.%) Γ (mg/g) Ceq.(wt.%) Γ (mg/g) Ceq.(wt.%) Γ (mg/g)
Enviogem AD01 37°C ? Not
Soluble N/ANot
Soluble N/ANot
Soluble N/A
Dynol 604 ? 0.1182 69.6 0.1494 110.1 0.1658 146.8
SIL WET L-77 6.5 0.4421 11.3 0.6687 13.4 1.0245 -4.7
SIL WET L-720 9.5 0.5309 -7.2 0.7018 6.5 0.9590 6.9
SIL WET L-722 6.5 0.1281 67.8 0.1154 123.5 0.1358 162.3
SIL WET L-7001 6.5 0.4667 6.2 0.4369 11.8 0.6626 16.0
SIL WET L-7500 6.5 1.0016 -1.0 0.0731 82.6 0.1155 124.9
SIL WET L-7600 6.5 0.1674 156.5 0.5245 -3.0 0.7644 -0.7
SIL WET L-7602 6.5 0.2100 54.6 0.2468 94.8 0.3029 129.0
SIL WET L-7605 6.5 0.5456 -8.4 0.7720 -4.9 1.0945 -16.7
SIL WET L-7607 6.5 0.5065 -2.1 0.7588 -1.7 1.0104 -1.2
SIL WET L-7614 ? 0.5402 -7.3 0.8056 -10.8 1.0743 -13.3
SurfadoneLP100 6.0 0.0332 88.1 0.0866 122.8 0.1101 166.6
SurfadoneLP300 3.0 0.0409 89.4 0.0429 135.0 0.0624 179.4
Aerosol GPG ? 0.2416 51.1 0.3049 85.9 0.3653 123.4
Aerosol MA-80 ? 0.4806 3.3 0.7197 5.6 1.0798 -14.9
Aerosol OT-75 ? 0.2570 46.8 0.4870 51.3 0.6955 59.1
Aerosol OT-B ? 0.3991 19.6 0.6655 16.0 0.8807 22.4
Aerosol OT-S ? 0.0971 77.8 0.4759 53.2 0.1515 162.6
Aerosol TR-70 ? 0.0891 77.8 0.1040 124.4 0.0987 171.8
Igepal CA-420 8.0 0.0465 86.3 0.0673 127.1 0.0644 177.2
Igepal CA-620 12.0 0.0754 78.9 0.0754 127.2 0.1598 155.9
155
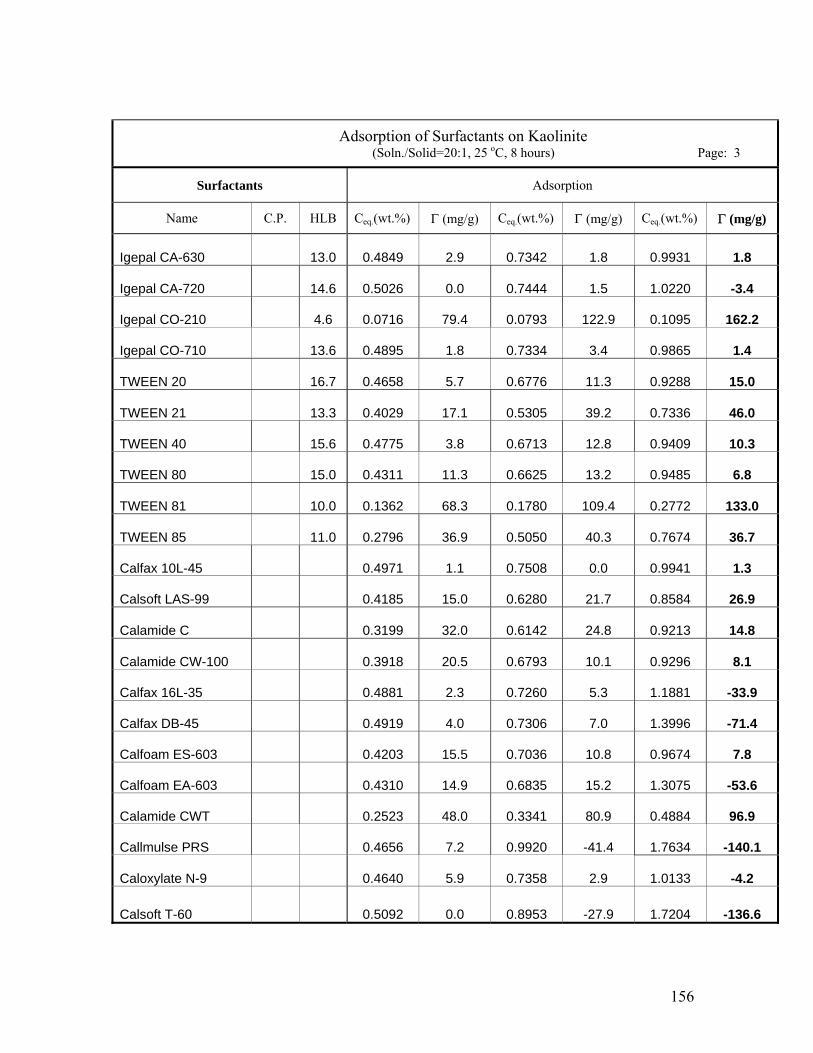
Adsorption of Surfactants on Kaolinite (Soln./Solid=20:1, 25 oC, 8 hours) Page: 3
Surfactants Adsorption
Name C.P. H C C ΓLB Ceq.(wt.%) Γ (mg/g) eq.(wt.%) Γ (mg/g) eq.(wt.%) (mg/g)
Igepal CA-630 13.0 0.4849 2.9 0.7342 1.8 0.9931 1.8
Igepal CA-720 14 0 0.7444 1.5 1.6 .5026 0.0 .0220 -3.4
Igepal CO-210 0.0716 79.4 0.0793 122.9 0.1095 14.6 62.2
Igepal CO-710 1 0 0.7334 3.4 0.9865 3.6 .4895 1.8 1.4
TWEEN 20 1 0 0.6776 11.3 0.9288 6.7 .4658 5.7 15.0
TWEEN 21 1 0 1 0 03.3 .4029 7.1 .5305 39.2 .7336 46.0
TWEEN 40 1 0 0.6713 12.8 0.9409 5.6 .4775 3.8 10.3
TWEEN 80 1 0 0 1 05.0 .4311 11.3 .6625 3.2 .9485 6.8
TWEEN 81 1 0 0 109.4 0.2772 10.0 .1362 68.3 .1780 33.0
TWEEN 85 1 0 3 0 4 01.0 .2796 6.9 .5050 0.3 .7674 36.7
Calfax 10L-45 0.4971 1.1 0.7508 0.0 0.9941 1.3
Calsoft LAS-99 0.4185 15.0 0.6280 21.7 0.8584 26.9
Calamide C 0.3199 32.0 0.6142 24.8 0.9213 14.8
Calamide CW-100 0.3918 20.5 0.6793 10.1 0.9296 8.1
Calfax 16L-35 0.4881 2.3 0.7260 5.3 1.1881 -33.9
Calfax DB-45 0.4919 4.0 0.7306 7.0 1.3996 -71.4
Calfoam ES-603 0.4203 15.5 0.7036 10.8 0.9674 7.8
Calfoam EA-603 0.4310 14.9 0.6835 15.2 1.3075 -53.6
Calamide CWT 0.2523 48.0 0.3341 80.9 0.4884 96.9
Callmulse PRS 0.4656 0.9920 -41.4 1.7634 -7.2 140.1
Caloxylate N-9 0.4640 5.9 0.7358 2.9 1.0133 -4.2
Calsoft T-60 0.5092 0.8953 -27.9 1.7204 -0.0 136.6
156
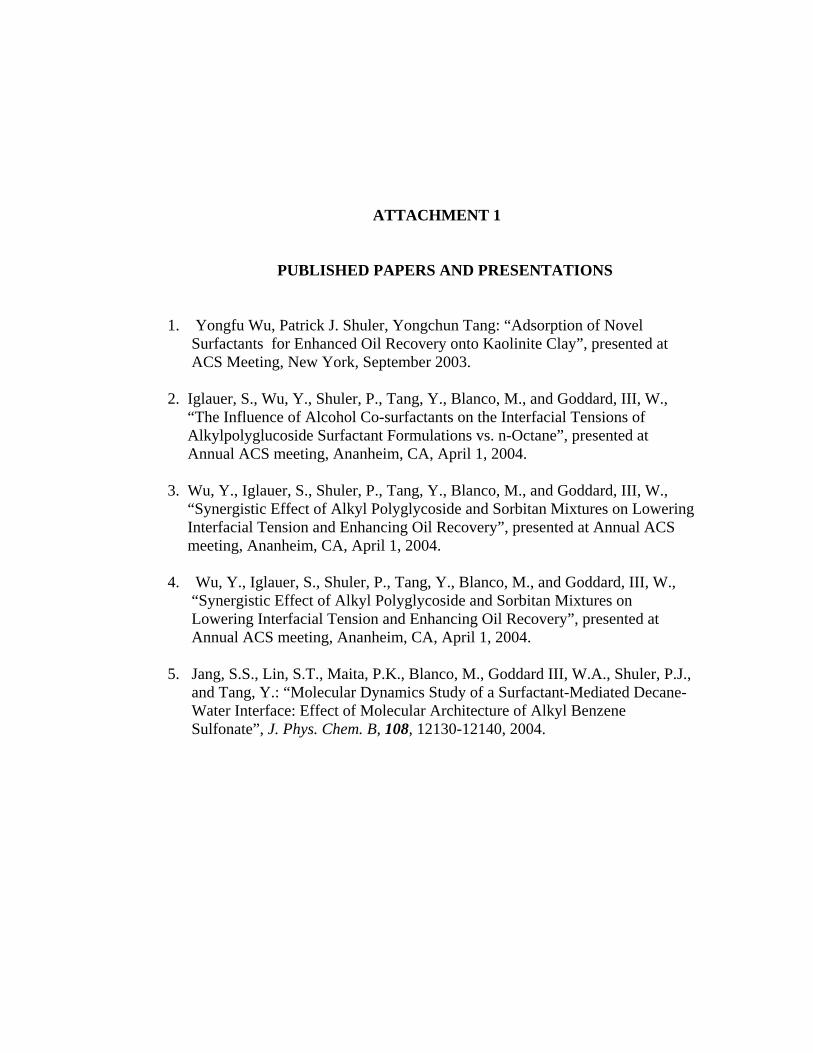
ATTACHMENT 1
PUBLISHED PAPERS AND PRESENTATIONS
1. Yongfu Wu, Patrick J. Shuler, Yongchun Tang: “Adsorption of Novel Surfactants for Enhanced Oil Recovery onto Kaolinite Clay”, presented at ACS Meeting, New York, September 2003.
2. Iglauer, S., Wu, Y., Shuler, P., Tang, Y., Blanco, M., and Goddard, III, W., “The Influence of Alcohol Co-surfactants on the Interfacial Tensions of Alkylpolyglucoside Surfactant Formulations vs. n-Octane”, presented at Annual ACS meeting, Ananheim, CA, April 1, 2004. 3. Wu, Y., Iglauer, S., Shuler, P., Tang, Y., Blanco, M., and Goddard, III, W., “Synergistic Effect of Alkyl Polyglycoside and Sorbitan Mixtures on Lowering Interfacial Tension and Enhancing Oil Recovery”, presented at Annual ACS meeting, Ananheim, CA, April 1, 2004.
4. Wu, Y., Iglauer, S., Shuler, P., Tang, Y., Blanco, M., and Goddard, III, W.,
“Synergistic Effect of Alkyl Polyglycoside and Sorbitan Mixtures on Lowering Interfacial Tension and Enhancing Oil Recovery”, presented at Annual ACS meeting, Ananheim, CA, April 1, 2004.
5. Jang, S.S., Lin, S.T., Maita, P.K., Blanco, M., Goddard III, W.A., Shuler, P.J., and Tang, Y.: “Molecular Dynamics Study of a Surfactant-Mediated Decane- Water Interface: Effect of Molecular Architecture of Alkyl Benzene Sulfonate”, J. Phys. Chem. B, 108, 12130-12140, 2004.
226th ACS National Meeting, New York, NY, September 7-11, 2003
Abstract
Adsorption of Novel Surfactants for Enhanced Oil Recovery onto Kaolinite Clay
Yongfu Wu, Patrick J. Shuler, Yongchun Tang
PEER Center, California Institute of Technology 20970 Currier Road, Walnut CA 91789
The success of a surfactant EOR process depends on: (1) creating low interfacial
tension and thereby displacing residual oil, (2) minimizing loss of surfactant. Surfactant
adsorption onto reservoir clays is a major concern because with their high surface area
they are capable of removing most of the surfactant from the injected solution, thereby
making this EOR process ineffective.
We have measured adsorption of various surfactants from 2.0% NaCl aqueous
solution onto kaolinite, a common oil reservoir clay. For block polymer surfactants
investigated, their adsorption maxima increase with an increase of the ratio of the number
of oxypropylene (PO) groups to the number of oxyethylene (EO) groups. For
ethoxylated alcohol surfactants, their adsorption maxima decrease with increase of the
number of oxyethylene (EO) groups. Relatively lower adsorption was found for some
novel EOR surfactants such as alkyl polyglucosides and their mixtures with sorbitan
carboxylic ester surfactants.
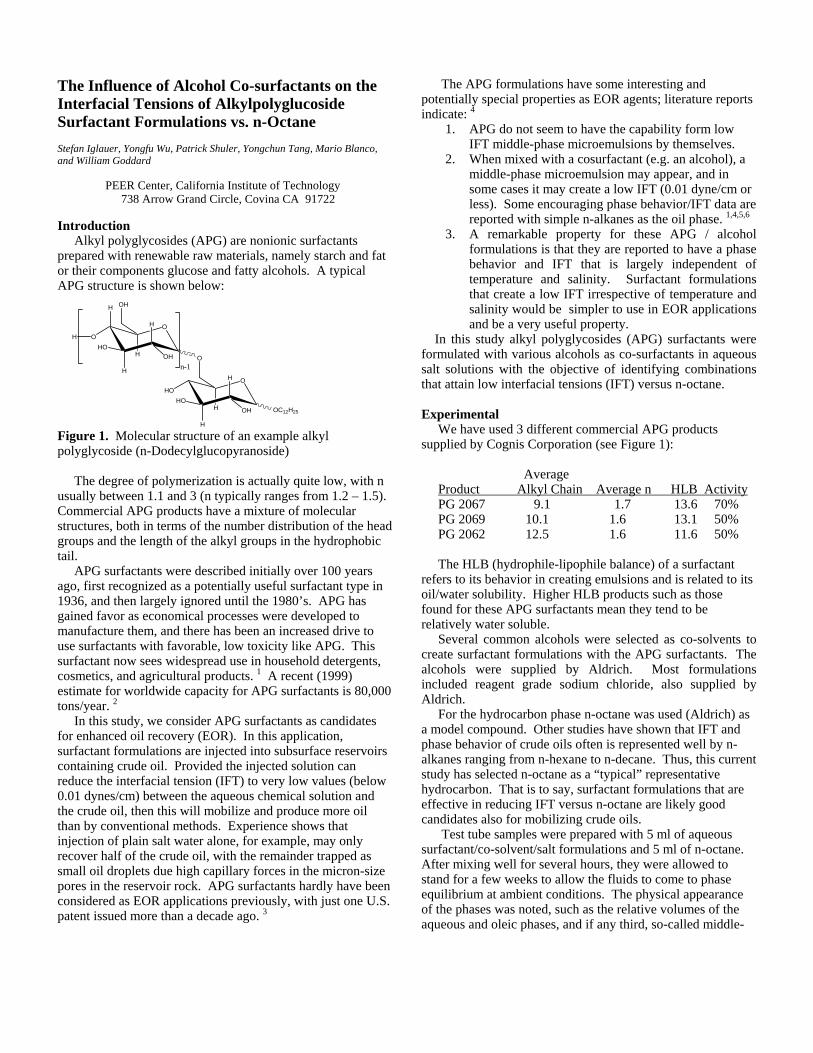
The Influence of Alcohol Co-surfactants on the Interfacial Tensions of Alkylpolyglucoside Surfactant Formulations vs. n-Octane
Stefan Iglauer, Yongfu Wu, Patrick Shuler, Yongchun Tang, Mario Blanco, and William Goddard
PEER Center, California Institute of Technology
738 Arrow Grand Circle, Covina CA 91722 Introduction Alkyl polyglycosides (APG) are nonionic surfactants prepared with renewable raw materials, namely starch and fat or their components glucose and fatty alcohols. A typical APG structure is shown below: Figure 1. Molecular structure of an example alkyl polyglycoside (n-Dodecylglucopyranoside) The degree of polymerization is actually quite low, with n usually between 1.1 and 3 (n typically ranges from 1.2 – 1.5). Commercial APG products have a mixture of molecular structures, both in terms of the number distribution of the head groups and the length of the alkyl groups in the hydrophobic tail. APG surfactants were described initially over 100 years ago, first recognized as a potentially useful surfactant type in 1936, and then largely ignored until the 1980’s. APG has gained favor as economical processes were developed to manufacture them, and there has been an increased drive to use surfactants with favorable, low toxicity like APG. This surfactant now sees widespread use in household detergents, cosmetics, and agricultural products. 1 A recent (1999) estimate for worldwide capacity for APG surfactants is 80,000 tons/year. 2 In this study, we consider APG surfactants as candidates for enhanced oil recovery (EOR). In this application, surfactant formulations are injected into subsurface reservoirs containing crude oil. Provided the injected solution can reduce the interfacial tension (IFT) to very low values (below 0.01 dynes/cm) between the aqueous chemical solution and the crude oil, then this will mobilize and produce more oil than by conventional methods. Experience shows that injection of plain salt water alone, for example, may only recover half of the crude oil, with the remainder trapped as small oil droplets due high capillary forces in the micron-size pores in the reservoir rock. APG surfactants hardly have been considered as EOR applications previously, with just one U.S. patent issued more than a decade ago. 3
The APG formulations have some interesting and potentially special properties as EOR agents; literature reports indicate: 4
1. APG do not seem to have the capability form low IFT middle-phase microemulsions by themselves.
2. When mixed with a cosurfactant (e.g. an alcohol), a middle-phase microemulsion may appear, and in some cases it may create a low IFT (0.01 dyne/cm or less). Some encouraging phase behavior/IFT data are reported with simple n-alkanes as the oil phase. 1,4,5,6
3. A remarkable property for these APG / alcohol formulations is that they are reported to have a phase behavior and IFT that is largely independent of temperature and salinity. Surfactant formulations that create a low IFT irrespective of temperature and salinity would be simpler to use in EOR applications and be a very useful property. O
H
O
H
HO
H
OHH
OH
H
OHO
H
HO
H
OHH
O
OC12H25
n-1
In this study alkyl polyglycosides (APG) surfactants were formulated with various alcohols as co-surfactants in aqueous salt solutions with the objective of identifying combinations that attain low interfacial tensions (IFT) versus n-octane. Experimental We have used 3 different commercial APG products supplied by Cognis Corporation (see Figure 1): Average Product Alkyl Chain Average n HLB Activity PG 2067 9.1 1.7 13.6 70% PG 2069 10.1 1.6 13.1 50% PG 2062 12.5 1.6 11.6 50% The HLB (hydrophile-lipophile balance) of a surfactant refers to its behavior in creating emulsions and is related to its oil/water solubility. Higher HLB products such as those found for these APG surfactants mean they tend to be relatively water soluble. Several common alcohols were selected as co-solvents to create surfactant formulations with the APG surfactants. The alcohols were supplied by Aldrich. Most formulations included reagent grade sodium chloride, also supplied by Aldrich. For the hydrocarbon phase n-octane was used (Aldrich) as a model compound. Other studies have shown that IFT and phase behavior of crude oils often is represented well by n-alkanes ranging from n-hexane to n-decane. Thus, this current study has selected n-octane as a “typical” representative hydrocarbon. That is to say, surfactant formulations that are effective in reducing IFT versus n-octane are likely good candidates also for mobilizing crude oils. Test tube samples were prepared with 5 ml of aqueous surfactant/co-solvent/salt formulations and 5 ml of n-octane. After mixing well for several hours, they were allowed to stand for a few weeks to allow the fluids to come to phase equilibrium at ambient conditions. The physical appearance of the phases was noted, such as the relative volumes of the aqueous and oleic phases, and if any third, so-called middle-
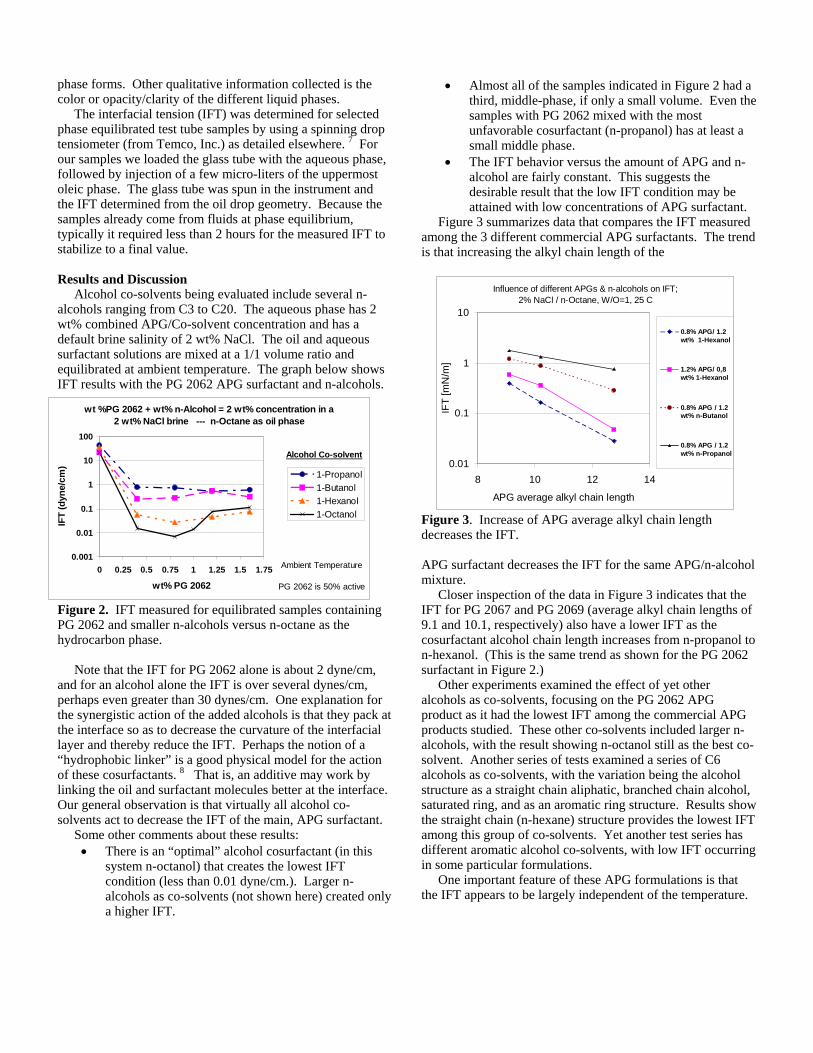
phase forms. Other qualitative information collected is the color or opacity/clarity of the different liquid phases. The interfacial tension (IFT) was determined for selected phase equilibrated test tube samples by using a spinning drop tensiometer (from Temco, Inc.) as detailed elsewhere. 7 For our samples we loaded the glass tube with the aqueous phase, followed by injection of a few micro-liters of the uppermost oleic phase. The glass tube was spun in the instrument and the IFT determined from the oil drop geometry. Because the samples already come from fluids at phase equilibrium, typically it required less than 2 hours for the measured IFT to stabilize to a final value. Results and Discussion Alcohol co-solvents being evaluated include several n-alcohols ranging from C3 to C20. The aqueous phase has 2 wt% combined APG/Co-solvent concentration and has a default brine salinity of 2 wt% NaCl. The oil and aqueous surfactant solutions are mixed at a 1/1 volume ratio and equilibrated at ambient temperature. The graph below shows IFT results with the PG 2062 APG surfactant and n-alcohols. Figure 2. IFT measured for equilibrated samples containing PG 2062 and smaller n-alcohols versus n-octane as the hydrocarbon phase. Note that the IFT for PG 2062 alone is about 2 dyne/cm, and for an alcohol alone the IFT is over several dynes/cm, perhaps even greater than 30 dynes/cm. One explanation for the synergistic action of the added alcohols is that they pack at the interface so as to decrease the curvature of the interfacial layer and thereby reduce the IFT. Perhaps the notion of a “hydrophobic linker” is a good physical model for the action of these cosurfactants. 8 That is, an additive may work by linking the oil and surfactant molecules better at the interface. Our general observation is that virtually all alcohol co-solvents act to decrease the IFT of the main, APG surfactant. Some other comments about these results:
• There is an “optimal” alcohol cosurfactant (in this system n-octanol) that creates the lowest IFT condition (less than 0.01 dyne/cm.). Larger n-alcohols as co-solvents (not shown here) created only a higher IFT.
• Almost all of the samples indicated in Figure 2 had a third, middle-phase, if only a small volume. Even the samples with PG 2062 mixed with the most unfavorable cosurfactant (n-propanol) has at least a small middle phase.
• The IFT behavior versus the amount of APG and n-alcohol are fairly constant. This suggests the desirable result that the low IFT condition may be attained with low concentrations of APG surfactant.
Figure 3 summarizes data that compares the IFT measured among the 3 different commercial APG surfactants. The trend is that increasing the alkyl chain length of the
Influence of different APGs & n-alcohols on IFT;2% NaCl / n-Octane, W/O=1, 25 C
0.01
0.1
1
10
8 10 12 14
APG average alkyl chain length
IFT
[mN
/m]
0.8% APG/ 1.2wt% 1-Hexanol
1.2% APG/ 0,8wt% 1-Hexanol
0.8% APG / 1.2wt% n-Butanol
0.8% APG / 1.2wt% n-Propanol
wt %PG 2062 + wt% n-Alcohol = 2 wt% concentration in a 2 wt% NaCl brine --- n-Octane as oil phase
0.001
0.01
0.1
1
10
100
0 0.25 0.5 0.75 1 1.25 1.5 1.75
wt% PG 2062
IFT
(dyn
e/cm
)
1-Propanol1-Butanol1-Hexanol1-Octanol
Ambient Temperature
PG 2062 is 50% active
Alcohol Co-solvent
Figure 3. Increase of APG average alkyl chain length decreases the IFT. APG surfactant decreases the IFT for the same APG/n-alcohol mixture. Closer inspection of the data in Figure 3 indicates that the IFT for PG 2067 and PG 2069 (average alkyl chain lengths of 9.1 and 10.1, respectively) also have a lower IFT as the cosurfactant alcohol chain length increases from n-propanol to n-hexanol. (This is the same trend as shown for the PG 2062 surfactant in Figure 2.) Other experiments examined the effect of yet other alcohols as co-solvents, focusing on the PG 2062 APG product as it had the lowest IFT among the commercial APG products studied. These other co-solvents included larger n-alcohols, with the result showing n-octanol still as the best co-solvent. Another series of tests examined a series of C6 alcohols as co-solvents, with the variation being the alcohol structure as a straight chain aliphatic, branched chain alcohol, saturated ring, and as an aromatic ring structure. Results show the straight chain (n-hexane) structure provides the lowest IFT among this group of co-solvents. Yet another test series has different aromatic alcohol co-solvents, with low IFT occurring in some particular formulations. One important feature of these APG formulations is that the IFT appears to be largely independent of the temperature.
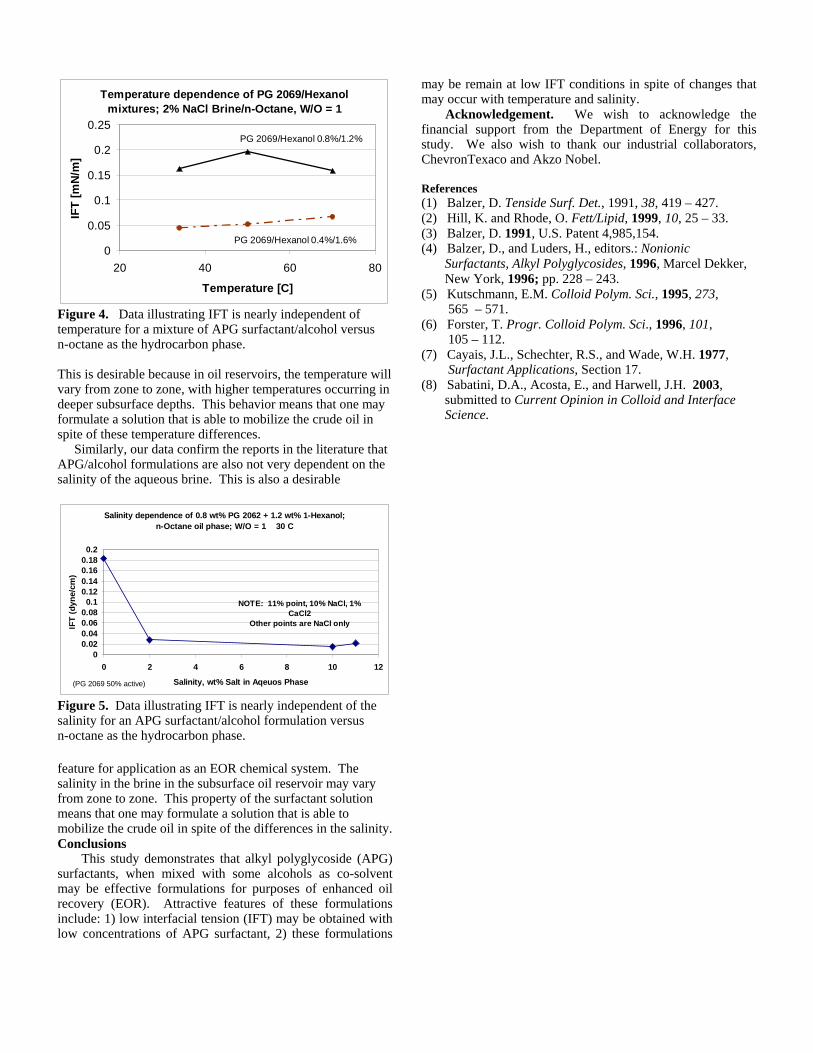
Temperature dependence of PG 2069/Hexanol mixtures; 2% NaCl Brine/n-Octane, W/O = 1
0
0.05
0.1
0.15
0.2
0.25
20 40 60 80
Temperature [C]
IFT
[mN
/m]
PG 2069/Hexanol 0.8%/1.2%
PG 2069/Hexanol 0.4%/1.6%
Figure 4. Data illustrating IFT is nearly independent of temperature for a mixture of APG surfactant/alcohol versus n-octane as the hydrocarbon phase. This is desirable because in oil reservoirs, the temperature will vary from zone to zone, with higher temperatures occurring in deeper subsurface depths. This behavior means that one may formulate a solution that is able to mobilize the crude oil in spite of these temperature differences. Similarly, our data confirm the reports in the literature that APG/alcohol formulations are also not very dependent on the salinity of the aqueous brine. This is also a desirable
Salinity dependence of 0.8 wt% PG 2062 + 1.2 wt% 1-Hexanol;n-Octane oil phase; W/O = 1 30 C
00.020.040.060.080.1
0.120.140.160.180.2
0 2 4 6 8 10
Salinity, wt% Salt in Aqeuos Phase
IFT
(dyn
e/cm
)
12
NOTE: 11% point, 10% NaCl, 1% CaCl2
Other points are NaCl only
(PG 2069 50% active)
Figure 5. Data illustrating IFT is nearly independent of the salinity for an APG surfactant/alcohol formulation versus n-octane as the hydrocarbon phase. feature for application as an EOR chemical system. The salinity in the brine in the subsurface oil reservoir may vary from zone to zone. This property of the surfactant solution means that one may formulate a solution that is able to mobilize the crude oil in spite of the differences in the salinity. Conclusions
This study demonstrates that alkyl polyglycoside (APG) surfactants, when mixed with some alcohols as co-solvent may be effective formulations for purposes of enhanced oil recovery (EOR). Attractive features of these formulations include: 1) low interfacial tension (IFT) may be obtained with low concentrations of APG surfactant, 2) these formulations
may be remain at low IFT conditions in spite of changes that may occur with temperature and salinity.
Acknowledgement. We wish to acknowledge the financial support from the Department of Energy for this study. We also wish to thank our industrial collaborators, ChevronTexaco and Akzo Nobel. References (1) Balzer, D. Tenside Surf. Det., 1991, 38, 419 – 427. (2) Hill, K. and Rhode, O. Fett/Lipid, 1999, 10, 25 – 33. (3) Balzer, D. 1991, U.S. Patent 4,985,154. (4) Balzer, D., and Luders, H., editors.: Nonionic Surfactants, Alkyl Polyglycosides, 1996, Marcel Dekker, New York, 1996; pp. 228 – 243. (5) Kutschmann, E.M. Colloid Polym. Sci., 1995, 273, 565 – 571. (6) Forster, T. Progr. Colloid Polym. Sci., 1996, 101, 105 – 112. (7) Cayais, J.L., Schechter, R.S., and Wade, W.H. 1977, Surfactant Applications, Section 17. (8) Sabatini, D.A., Acosta, E., and Harwell, J.H. 2003, submitted to Current Opinion in Colloid and Interface Science.
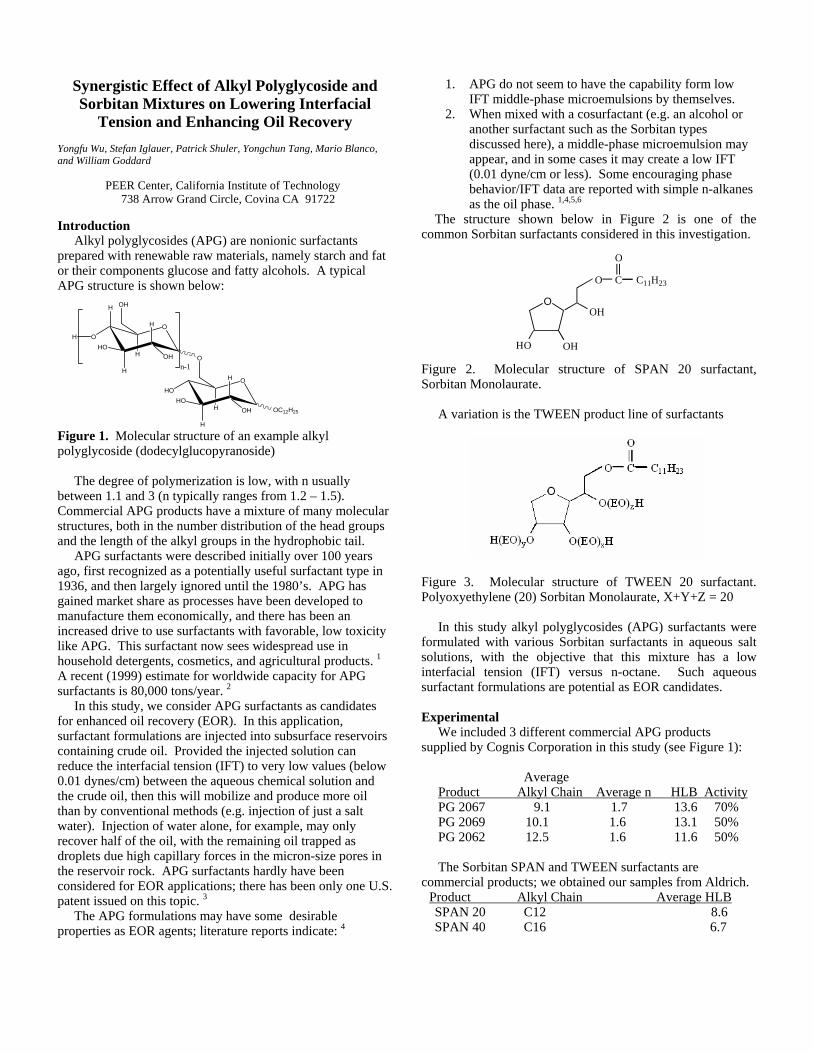
Synergistic Effect of Alkyl Polyglycoside and Sorbitan Mixtures on Lowering Interfacial
Tension and Enhancing Oil Recovery Yongfu Wu, Stefan Iglauer, Patrick Shuler, Yongchun Tang, Mario Blanco, and William Goddard
PEER Center, California Institute of Technology
738 Arrow Grand Circle, Covina CA 91722 Introduction Alkyl polyglycosides (APG) are nonionic surfactants prepared with renewable raw materials, namely starch and fat or their components glucose and fatty alcohols. A typical APG structure is shown below: Figure 1. Molecular structure of an example alkyl polyglycoside (dodecylglucopyranoside) The degree of polymerization is low, with n usually between 1.1 and 3 (n typically ranges from 1.2 – 1.5). Commercial APG products have a mixture of many molecular structures, both in the number distribution of the head groups and the length of the alkyl groups in the hydrophobic tail. APG surfactants were described initially over 100 years ago, first recognized as a potentially useful surfactant type in 1936, and then largely ignored until the 1980’s. APG has gained market share as processes have been developed to manufacture them economically, and there has been an increased drive to use surfactants with favorable, low toxicity like APG. This surfactant now sees widespread use in household detergents, cosmetics, and agricultural products. 1 A recent (1999) estimate for worldwide capacity for APG surfactants is 80,000 tons/year. 2 In this study, we consider APG surfactants as candidates for enhanced oil recovery (EOR). In this application, surfactant formulations are injected into subsurface reservoirs containing crude oil. Provided the injected solution can reduce the interfacial tension (IFT) to very low values (below 0.01 dynes/cm) between the aqueous chemical solution and the crude oil, then this will mobilize and produce more oil than by conventional methods (e.g. injection of just a salt water). Injection of water alone, for example, may only recover half of the oil, with the remaining oil trapped as droplets due high capillary forces in the micron-size pores in the reservoir rock. APG surfactants hardly have been considered for EOR applications; there has been only one U.S. patent issued on this topic. 3 The APG formulations may have some desirable properties as EOR agents; literature reports indicate: 4
1. APG do not seem to have the capability form low IFT middle-phase microemulsions by themselves.
2. When mixed with a cosurfactant (e.g. an alcohol or another surfactant such as the Sorbitan types discussed here), a middle-phase microemulsion may appear, and in some cases it may create a low IFT (0.01 dyne/cm or less). Some encouraging phase behavior/IFT data are reported with simple n-alkanes as the oil phase. 1,4,5,6
The structure shown below in Figure 2 is one of the common Sorbitan surfactants considered in this investigation.
O
O
OHHO
OH
C
O
C11H23
O
H
O
H
HO
H
OHH
OH
H
OHO
H
HO
H
OHH
O
OC12H25
n-1
Figure 2. Molecular structure of SPAN 20 surfactant, Sorbitan Monolaurate. A variation is the TWEEN product line of surfactants
Figure 3. Molecular structure of TWEEN 20 surfactant. Polyoxyethylene (20) Sorbitan Monolaurate, X+Y+Z = 20 In this study alkyl polyglycosides (APG) surfactants were formulated with various Sorbitan surfactants in aqueous salt solutions, with the objective that this mixture has a low interfacial tension (IFT) versus n-octane. Such aqueous surfactant formulations are potential as EOR candidates. Experimental We included 3 different commercial APG products supplied by Cognis Corporation in this study (see Figure 1): Average Product Alkyl Chain Average n HLB Activity PG 2067 9.1 1.7 13.6 70% PG 2069 10.1 1.6 13.1 50% PG 2062 12.5 1.6 11.6 50% The Sorbitan SPAN and TWEEN surfactants are commercial products; we obtained our samples from Aldrich. Product Alkyl Chain Average HLB SPAN 20 C12 8.6 SPAN 40 C16 6.7
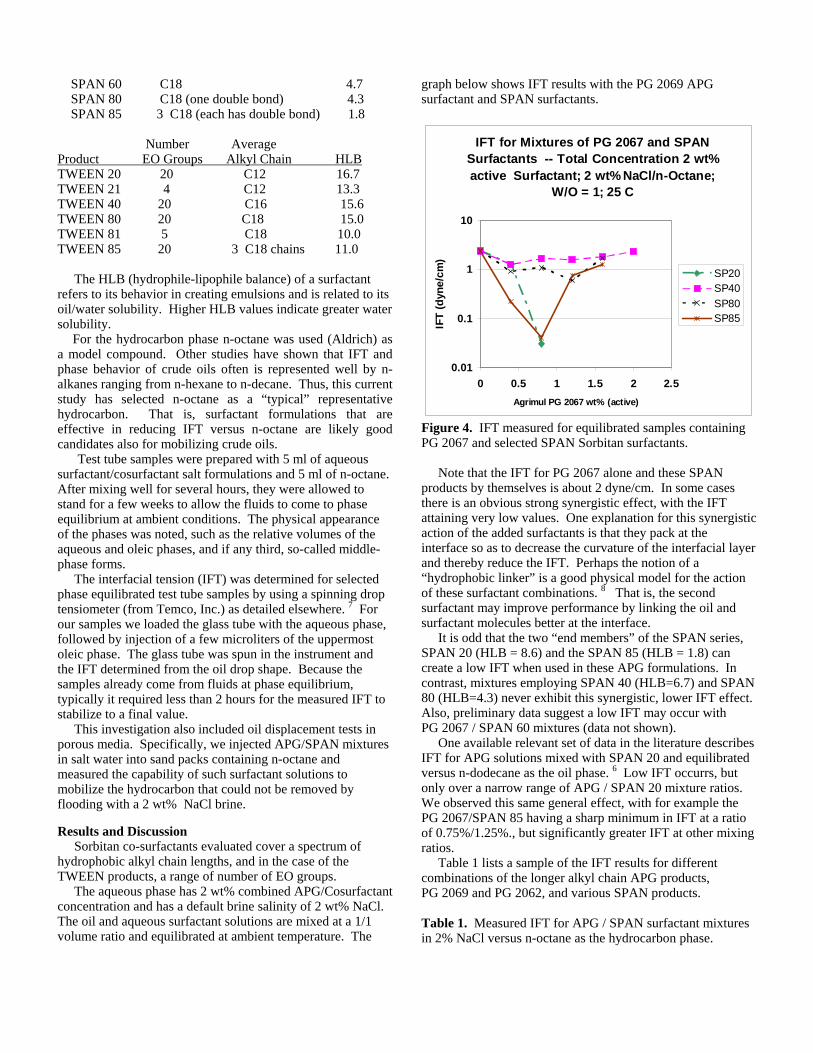
SPAN 60 C18 4.7 SPAN 80 C18 (one double bond) 4.3 SPAN 85 3 C18 (each has double bond) 1.8 Number Average Product EO Groups Alkyl Chain HLB TWEEN 20 20 C12 16.7 TWEEN 21 4 C12 13.3 TWEEN 40 20 C16 15.6 TWEEN 80 20 C18 15.0 TWEEN 81 5 C18 10.0 TWEEN 85 20 3 C18 chains 11.0 The HLB (hydrophile-lipophile balance) of a surfactant refers to its behavior in creating emulsions and is related to its oil/water solubility. Higher HLB values indicate greater water solubility. For the hydrocarbon phase n-octane was used (Aldrich) as a model compound. Other studies have shown that IFT and phase behavior of crude oils often is represented well by n-alkanes ranging from n-hexane to n-decane. Thus, this current study has selected n-octane as a “typical” representative hydrocarbon. That is, surfactant formulations that are effective in reducing IFT versus n-octane are likely good candidates also for mobilizing crude oils. Test tube samples were prepared with 5 ml of aqueous surfactant/cosurfactant salt formulations and 5 ml of n-octane. After mixing well for several hours, they were allowed to stand for a few weeks to allow the fluids to come to phase equilibrium at ambient conditions. The physical appearance of the phases was noted, such as the relative volumes of the aqueous and oleic phases, and if any third, so-called middle-phase forms. The interfacial tension (IFT) was determined for selected phase equilibrated test tube samples by using a spinning drop tensiometer (from Temco, Inc.) as detailed elsewhere. 7 For our samples we loaded the glass tube with the aqueous phase, followed by injection of a few microliters of the uppermost oleic phase. The glass tube was spun in the instrument and the IFT determined from the oil drop shape. Because the samples already come from fluids at phase equilibrium, typically it required less than 2 hours for the measured IFT to stabilize to a final value. This investigation also included oil displacement tests in porous media. Specifically, we injected APG/SPAN mixtures in salt water into sand packs containing n-octane and measured the capability of such surfactant solutions to mobilize the hydrocarbon that could not be removed by flooding with a 2 wt% NaCl brine. Results and Discussion Sorbitan co-surfactants evaluated cover a spectrum of hydrophobic alkyl chain lengths, and in the case of the TWEEN products, a range of number of EO groups. The aqueous phase has 2 wt% combined APG/Cosurfactant concentration and has a default brine salinity of 2 wt% NaCl. The oil and aqueous surfactant solutions are mixed at a 1/1 volume ratio and equilibrated at ambient temperature. The
graph below shows IFT results with the PG 2069 APG surfactant and SPAN surfactants.
IFT for Mixtures of PG 2067 and SPAN Surfactants -- Total Concentration 2 wt% active Surfactant; 2 wt% NaCl/n-Octane;
W/O = 1; 25 C
0.01
0.1
1
10
0 0.5 1 1.5 2 2.5Agrimul PG 2067 wt% (active)
IFT
(dyn
e/cm
)
SP20SP40SP80SP85
Figure 4. IFT measured for equilibrated samples containing PG 2067 and selected SPAN Sorbitan surfactants. Note that the IFT for PG 2067 alone and these SPAN products by themselves is about 2 dyne/cm. In some cases there is an obvious strong synergistic effect, with the IFT attaining very low values. One explanation for this synergistic action of the added surfactants is that they pack at the interface so as to decrease the curvature of the interfacial layer and thereby reduce the IFT. Perhaps the notion of a “hydrophobic linker” is a good physical model for the action of these surfactant combinations. 8 That is, the second surfactant may improve performance by linking the oil and surfactant molecules better at the interface. It is odd that the two “end members” of the SPAN series, SPAN 20 (HLB = 8.6) and the SPAN 85 (HLB = 1.8) can create a low IFT when used in these APG formulations. In contrast, mixtures employing SPAN 40 (HLB=6.7) and SPAN 80 (HLB=4.3) never exhibit this synergistic, lower IFT effect. Also, preliminary data suggest a low IFT may occur with PG 2067 / SPAN 60 mixtures (data not shown). One available relevant set of data in the literature describes IFT for APG solutions mixed with SPAN 20 and equilibrated versus n-dodecane as the oil phase. 6 Low IFT occurrs, but only over a narrow range of APG / SPAN 20 mixture ratios. We observed this same general effect, with for example the PG 2067/SPAN 85 having a sharp minimum in IFT at a ratio of 0.75%/1.25%., but significantly greater IFT at other mixing ratios. Table 1 lists a sample of the IFT results for different combinations of the longer alkyl chain APG products, PG 2069 and PG 2062, and various SPAN products. Table 1. Measured IFT for APG / SPAN surfactant mixtures in 2% NaCl versus n-octane as the hydrocarbon phase.
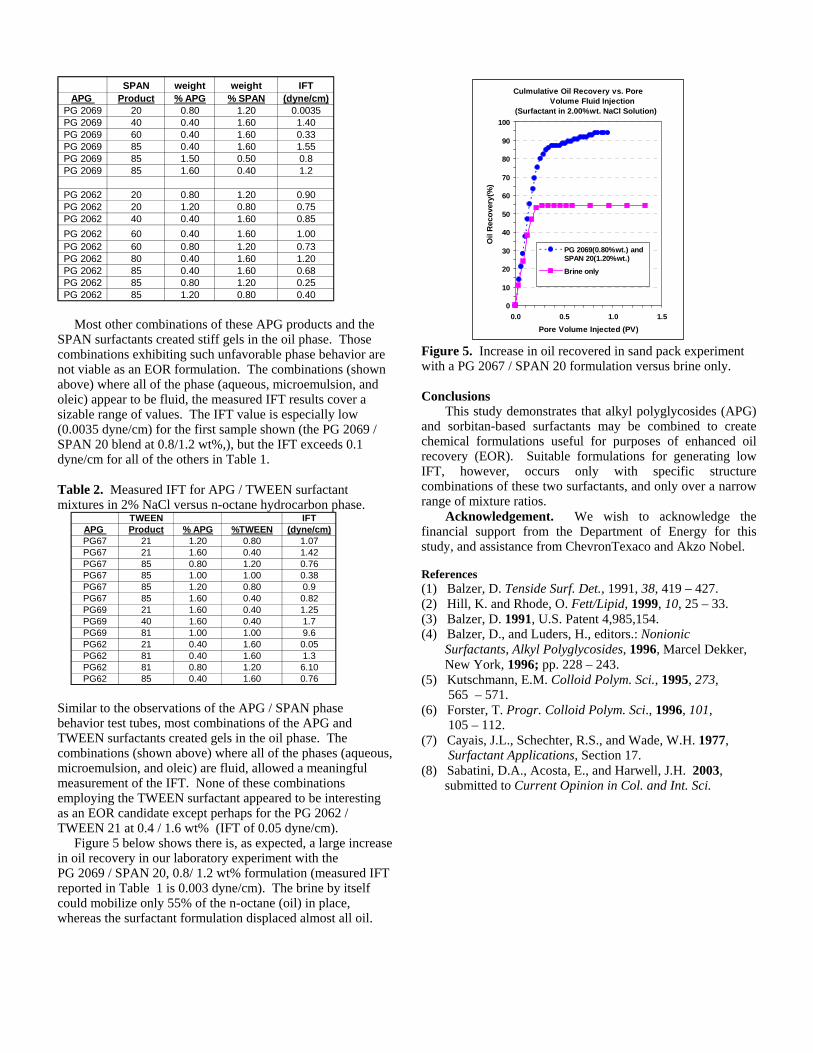
SPAN weight weight IFTAPG Product % APG % SPAN (dyne/cm)
PG 2069 20 0.80 1.20 0.0035PG 2069 40 0.40 1.60 1.40PG 2069 60 0.40 1.60 0.33PG 2069 85 0.40 1.60 1.55PG 2069 85 1.50 0.50 0.8PG 2069 85 1.60 0.40 1.2
PG 2062 20 0.80 1.20 0.90PG 2062 20 1.20 0.80 0.75PG 2062 40 0.40 1.60 0.85PG 2062 60 0.40 1.60 1.00PG 2062 60 0.80 1.20 0.73PG 2062 80 0.40 1.60 1.20PG 2062 85 0.40 1.60 0.68PG 2062 85 0.80 1.20 0.25PG 2062 85 1.20 0.80 0.40
Most other combinations of these APG products and the SPAN surfactants created stiff gels in the oil phase. Those combinations exhibiting such unfavorable phase behavior are not viable as an EOR formulation. The combinations (shown above) where all of the phase (aqueous, microemulsion, and oleic) appear to be fluid, the measured IFT results cover a sizable range of values. The IFT value is especially low (0.0035 dyne/cm) for the first sample shown (the PG 2069 / SPAN 20 blend at 0.8/1.2 wt%,), but the IFT exceeds 0.1 dyne/cm for all of the others in Table 1. Table 2. Measured IFT for APG / TWEEN surfactant mixtures in 2% NaCl versus n-octane hydrocarbon phase.
TWEEN IFTAPG Product % APG %TWEEN (dyne/cm)PG67 21 1.20 0.80 1.07PG67 21 1.60 0.40 1.42PG67 85 0.80 1.20 0.76PG67 85 1.00 1.00 0.38PG67 85 1.20 0.80 0.9PG67 85 1.60 0.40 0.82PG69 21 1.60 0.40 1.25PG69 40 1.60 0.40 1.7PG69 81 1.00 1.00 9.6PG62 21 0.40 1.60 0.05PG62 81 0.40 1.60 1.3PG62 81 0.80 1.20 6.10PG62 85 0.40 1.60 0.76
Similar to the observations of the APG / SPAN phase behavior test tubes, most combinations of the APG and TWEEN surfactants created gels in the oil phase. The combinations (shown above) where all of the phases (aqueous, microemulsion, and oleic) are fluid, allowed a meaningful measurement of the IFT. None of these combinations employing the TWEEN surfactant appeared to be interesting as an EOR candidate except perhaps for the PG 2062 / TWEEN 21 at 0.4 / 1.6 wt% (IFT of 0.05 dyne/cm). Figure 5 below shows there is, as expected, a large increase in oil recovery in our laboratory experiment with the PG 2069 / SPAN 20, 0.8/ 1.2 wt% formulation (measured IFT reported in Table 1 is 0.003 dyne/cm). The brine by itself could mobilize only 55% of the n-octane (oil) in place, whereas the surfactant formulation displaced almost all oil.
Culmulative Oil Recovery vs. Pore Volume Fluid Injection
(Surfactant in 2.00%wt. NaCl Solution)
0
10
20
30
40
50
60
70
80
90
100
0.0 0.5 1.0 1.5
Pore Volume Injected (PV)
Oil
Rec
over
y(%
)
PG 2069(0.80%wt.) and SPAN 20(1.20%wt.)
Brine only
Figure 5. Increase in oil recovered in sand pack experiment with a PG 2067 / SPAN 20 formulation versus brine only. Conclusions
This study demonstrates that alkyl polyglycosides (APG) and sorbitan-based surfactants may be combined to create chemical formulations useful for purposes of enhanced oil recovery (EOR). Suitable formulations for generating low IFT, however, occurs only with specific structure combinations of these two surfactants, and only over a narrow range of mixture ratios.
Acknowledgement. We wish to acknowledge the financial support from the Department of Energy for this study, and assistance from ChevronTexaco and Akzo Nobel. References (1) Balzer, D. Tenside Surf. Det., 1991, 38, 419 – 427. (2) Hill, K. and Rhode, O. Fett/Lipid, 1999, 10, 25 – 33. (3) Balzer, D. 1991, U.S. Patent 4,985,154. (4) Balzer, D., and Luders, H., editors.: Nonionic Surfactants, Alkyl Polyglycosides, 1996, Marcel Dekker, New York, 1996; pp. 228 – 243. (5) Kutschmann, E.M. Colloid Polym. Sci., 1995, 273, 565 – 571. (6) Forster, T. Progr. Colloid Polym. Sci., 1996, 101, 105 – 112. (7) Cayais, J.L., Schechter, R.S., and Wade, W.H. 1977, Surfactant Applications, Section 17. (8) Sabatini, D.A., Acosta, E., and Harwell, J.H. 2003, submitted to Current Opinion in Col. and Int. Sci.
SPE/DOE 89472
Alkyl Polyglycoside Surfactants for Improved Oil Recovery S. Iglauer, Y. Wu, P.J. Shuler, SPE, M. Blanco, Y. Tang, and W. A. Goddard III, California Institute of Technology
Copyright 2004, Society of Petroleum Engineers Inc. This paper was prepared for presentation at the 2004 SPE/DOE Fourteenth Symposium on Improved Oil Recovery held in Tulsa, Oklahoma, U.S.A., 17–21 April 2004. This paper was selected for presentation by an SPE Program Committee following review of information contained in a proposal submitted by the author(s). Contents of the paper, as presented, have not been reviewed by the Society of Petroleum Engineers and are subject to correction by the author(s). The material, as presented, does not necessarily reflect any position of the Society of Petroleum Engineers, its officers, or members. Papers presented at SPE meetings are subject to publication review by Editorial Committees of the Society of Petroleum Engineers. Electronic reproduction, distribution, or storage of any part of this paper for commercial purposes without the written consent of the Society of Petroleum Engineers is prohibited. Permission to reproduce in print is restricted to a proposal of not more than 300 words; illustrations may not be copied. The proposal must contain conspicuous acknowledgment of where and by whom the paper was presented. Write Librarian, SPE, P.O. Box 833836, Richardson, TX 75083-3836, U.S.A., fax 01-972-952-9435.
Abstract Many surfactants have been evaluated for their ability to recover incremental oil; this paper focuses on alkyl polyglycosides (APG) as candidates for this IOR application. These nonionic carbohydrate-based surfactants have become in recent years a large, significant volume (over 80,000 tons/year) commercial product that sees widespread use in household and agricultural products. This laboratory study determined the characteristics of many APG surfactant formulations, in particular for their capability to create low interfacial tensions (IFT) with n-alkane hydrocarbons. Formulations explored included a wide range of alcohol and Sorbitan-based surfactants as cosurfactants with these APG surfactants. Some APG-cosurfactant combinations did exhibit low IFT values of 0.01 dyne/cm or less versus n-octane. Laboratory testing did confirm the useful properties that the IFT for these APG formulations can be largely independent of both salinity and temperature. Preliminary studies also suggest some APG products will have only modest adsorption onto kaolinite clay. Introduction Background. Surfactant enhanced oil recovery (EOR) has been for many years, particularly in the 1970’s and 1980’s when the technology was put on a sound scientific basis. Unfortunately, the economic reality of the process performance in field trials has precluded widespread deployment of this technology, at least in the United States. This study considers alkly polyglycosides (APG), one class of surfactants largely ignored as candidates for EOR applications. This is due at least in part because APG surfactants were not available as a large volume commercial product during this earlier period of intense interest in chemical EOR in the United States. APG were described initially over 100 years ago, first recognized as a potentially useful surfactant type in 1936, and
then largely ignored until the 1980’s. APG has gained favor as economical processes were developed to manufacture them on a large scale, ands also because there has been an increased drive to use surfactants with favorable, low toxicity characteristics like APG for many purposes. This surfactant now sees widespread use in household detergents, cosmetics, and agricultural products. 1 A recent (1999) estimate for worldwide capacity for APG surfactants is 80,000 tons/year. 2 APG has been considered only briefly for EOR applications, with one U.S. patent issued on this topic. 3 Potential Advantages of APG Formulations. The APG formulations have some interesting and potentially useful properties as EOR agents; literature reports state for APG formulations in contact with a hydrocarbon phase: 4
1. When mixed with a hydrophobic cosurfactant (e.g. an alcohol or some other surfactants), a middle-phase microemulsion may appear, and in some cases it can create a low IFT (0.01 dyne/cm or less). Some encouraging phase behavior/IFT data are reported with simple n-alkanes as the oil phase 1, 3, 4, 5, 6
2. A remarkable property for these APG formulations is that they are reported to have a phase behavior and IFT that is largely independent of temperature and salinity. Surfactant formulations that create a low IFT irrespective of temperature and salinity would be a very useful property for oilfield EOR applications.
Theoretical/modeling aspects also indicate that having this large head group and the nonionic character of the APG molecule is consistent with the observation of the phase behavior and IFT being largely indifferent to changes in the temperature and the salinity. Other motivations for focusing on APG surfactants:
• They are available already as commercial products and used already in significant quantities for other industrial applications.
• These are manufactured from renewable resources and so their cost is largely uncoupled from the current price of crude oil.
• APG surfactants serve as a practical example of a sugar-based surfactant; there are thousands of other possible sugar-based surfactant structures. A related point is that the behavior of the APG products may offer insights into better applying bio-surfactants.7
This work may suggest then improvements in microbial enhanced oil recovery technology.
• The APG surfactants are non-toxic.
2 S. IGLAUER, Y. FU, P.J. SHULER, M. BLANCO, Y.TANG, AND W.A. GODDARD III SPE 89472
Experimental Methods Materials. The study focused on the behavior of 3 different commercial alkyl polyglycoside surfactant products. These products supplied by the Cognis Corporation (PG 2067, PG 2069, and PG 2062) are shown in Figure 1. The difference among these 3 products is in their distribution in number of head groups and the alkyl chain length (Table 1). We obtained from Aldrich the various alcohols and SPAN and TWEEN products used as cosurfactants. Examples of these SPAN and TWEEN sorbitan surfactants are shown in Figures 2 and 3, respectively. Table 2 has more details. The HLB (hydrophile-lipophile balance) values of all of these surfactants are given by the suppliers. The HLB is a measure of the molecules ability in creating emulsions and is related to its oil/water solubility. Higher HLB indicates greater water solubility. For the hydrocarbon phase n-octane was used (Aldrich) as a model compound. Other studies have shown that IFT and phase behavior of crude oils often can be represented well by n-alkanes ranging from n-hexane to n-decane. Thus, this current study has selected n-octane as a “typical” representative hydrocarbon. That is to say, surfactant formulations that are effective in reducing IFT versus n-octane are likely good candidates also for mobilizing crude oils. Interfacial Tension (IFT) and Phase Behavior. Test tube samples were prepared with 5 ml of aqueous surfactant/co-solvent/salt formulations and 5 ml of n-octane. After mixing well for several hours, they were allowed to stand for a few weeks to allow the fluids to come to phase equilibrium at ambient conditions. The physical appearance of the phases was noted, such as the relative volumes of the aqueous and oleic phases, and if any third, so-called middle-phase forms. The interfacial tension (IFT) was determined for selected phase equilibrated test tube samples by using a spinning drop tensiometer (from Temco, Inc.). A glass tube was loaded with the aqueous phase, followed by injection of a few micro-liters of the uppermost, oleic phase. The glass tube was spun in the instrument at a know speed and the IFT determined from the oil drop geometry. Because the samples already come from fluids at phase equilibrium, typically it required less than 2 hours for the measured IFT to stabilize to a final value. Surfactant Solid Adsorption. APG surfactant adsorption from 2 wt% NaCl brines was measured onto kaolinite clay. All of these tests were conducted at 25 °C with a weight ratio of liquid/solid of 20, and for a mixing exposure period of 8 hours. Kaolinite is selected (obtained from the University of Missouri) as the adsorbant of choice because 1) it is among the most common clays found in oil reservoirs, 2) it may be obtained in a fairly reproducible form, and 3) it is a stable material (e.g., will not swell when immersed in water). The composition provided by the supplier for the kaolinite has the following major components (weight percents): SiO2 44.2, Al2O3 39.7, TiO2 1.39, Fe2O3 0.13 with trace amounts of sodium, manganese, calcium, potassium, phosphorous, and fluorine. The specific surface area is about 10 square meter/gram. After the 8-hour exposure period, the sample is centrifuged and the supernatant analyzed for residual surfactant concentration via a gravimetric method. Knowing the activity of the starting surfactant material and brine salinity, one can
calculate the mass of surfactant that is left in the supernatant solution after evaporating off the water solvent. Theoretical Methods Hansen Parameters. The relative solubility among the system components (brine, surfactant, co-surfactant, and hydrocarbon) is one determining factor in the phase behavior exhibited in these multi-phase liquid systems. Because the IFT is in turn related to the phase behavior, it would seem that having values of parameters that quantify the relative solubility of each component could be useful. In 1936 Joel H. Hildebrand proposed a simple definition for a “solubility parameter” that would provide a systemic description of the miscibility behavior of solvents and which subsequently has found multiple uses in chemistry. 8 System components with similar solubility parameters are expected to be miscible with one another. This solubility parameter δ is defined as square root of the cohesive energy density, that is, the heat of vaporization divided by the molar volume. δ = [ (∆Hv – RT) / Vm] 1/2 (1) where 1 hildebrand = 1 cal 1/2 cm -3/2 = 2.0455 x MPa 1/2
Hansen went one step further, and developed individual solubility parameters that when taken together their squares ad up to the Hildebrand parameter squared:
δ2 = δd2 + δp
2 + δh
2 (2)
where δd , δp , and δh are the dispersion, electrostatic (or polar), and hydrogen bond components of δ, respectively. 9. Solvents with similar Hansen solubilities are miscible in most proportions; dissimilar values yield limited solubilities. Hildebrand and Hansen solubility parameters are useful for selecting solvents and additives in chemical formulations. We are testing the idea that these parameters when taken together could provide some insights related to the miscibility/phase behavior and thereby the IFT of aqueous based chemical mixture formulations versus hydrocarbons. One caveat is that these parameters, or their equivalent measurements i.e., heats of vaporization and molar volumes, are usually available at a single temperature. Another potential problem relates to the large number of experimental techniques used to estimate the Hansen solubility parameters. These values are often inconsistent and spread a wide range of values. By estimating these values by temperature and pressured controlled (NPT) Molecular Dynamics computer simulations we hope to overcome all of these shortcomings. The Hildebrand parameter can be calculated easily for compounds with known heats of vaporization and densities. The Hansen parameters may be measured, only with great difficulty. Often the hydrogen bond Hansen parameters are not measured but fitted to reproduce a broad range of miscibility and solubility data, losing its physical meaning. Thus, our strategy is to calculate these Hansen parameters for the relevant compounds from first principles MD calculations. Recent work at the California Institute of Technology has developed such molecular modeling approaches to calculate
SPE 89472 ALKYL POLYGLYCOSIDE SURFACTANTS FOR IMPROVED OIL RECOVERY 3
Hansen parameters. 10 A Cohesive Energy Density (CED) computational method was used that offers consistency (precision) throughout the various organic compounds of interest in formulation work. CED is a multiple sampling Molecular Dynamics method that estimates Hildebrand and Hansen solubility parameters with good precision (ca. 0.44 hildebrands). The CED method, when combined with a generic force field and quantum mechanically determined atomic charges yields first-principles hildebrand parameter predictions in good agreement with experiment (accuracy is 1. hildebrand or better). Results and Discussion Interfacial Tension (IFT) versus Cosurfactant Type. Alcohol co-solvents being evaluated include several n-alcohols ranging from C3 to C20. The aqueous phase has 2 wt% combined APG/Co-solvent concentration and has a default brine salinity of 2 wt% NaCl. The oil and aqueous surfactant solutions are mixed at a 1/1 volume ratio and equilibrated at ambient temperature. Figure 4 shows IFT results with the PG 2062 APG surfactant and the smaller n-alcohols investigated. Note that the IFT for PG 2062 alone is about 2 dyne/cm, and for an alcohol alone the IFT is over several dynes/cm, perhaps even greater than 30 dynes/cm. One explanation for the synergistic action of the added alcohols is that they pack at the interface so as to decrease the curvature of the interfacial layer and thereby reduce the IFT. Perhaps the notion of a “hydrophobic linker” is a good physical model for the action of these cosurfactants 11 That is, an additive may work by linking the oil and surfactant molecules better at the interface. Our general observation is that virtually all alcohol co-solvents act to decrease the IFT of the main, APG surfactant. Some other comments about these results:
• There is an “optimal” alcohol cosurfactant (in this system n-octanol) that creates the lowest IFT condition (less than 0.01 dyne/cm.). Larger n-alcohols than n-octanol as co-solvents (data not shown here) created only a higher IFT.
• Almost all of the samples indicated in Figure 4 had a third, middle-phase, if only a small volume. Even the samples with PG 2062 mixed with the most unfavorable cosurfactant (n-propanol) has at least a small middle phase.
• The IFT behavior versus the amount of APG and n-alcohol are fairly constant. This suggests the desirable result that the low IFT condition may be attained with low concentrations of APG surfactant.
Figure 5 summarizes data that compares the IFT measured among 3 different commercial APG surfactants. The trend is that increasing the alkyl chain length of the APG surfactant decreases the IFT, all other things being equal. Closer inspection of the data in Figure 5 indicates that the IFT for PG 2067 and PG 2069 (average alkyl chain lengths of 9.1 and 10.1, respectively) also have a lower IFT as the cosurfactant alcohol chain length increases from n-propanol to n-hexanol. (This is the same trend as shown for the PG 2062 surfactant in Figure 4.) Experiments examine the effect of other alcohols as co-solvents focused on the PG 2062 APG product because its
formulations with small n- alcohols gave the lowest IFT values (Figure 4 and 5). These other alcohol co-solvents included larger n-alcohols, with the result showing n-octanol still as the best co-solvent. Another series of tests (Figure 6) examined a series of C6 alcohols as co-solvents, with the variation being the alcohol structure as a straight chain aliphatic (n-hexanol), branched chain alcohol (4-methyl-2-pentanol), saturated ring (cyclohexanol), and as an aromatic ring structure (phenol). Results show the straight chain (n-hexane) structure provides the lowest IFT among this group of co-solvents. Figure 7 presents measured IFT results for surfactant formulations containing PG 2067 and different SPAN products. Note that the IFT for PG 2067 alone and these SPAN products by themselves is about 2 dyne/cm. In some cases there is an obvious strong synergistic effect, with the IFT attaining very low values. It seems odd that the two “end members” of the SPAN series, SPAN 20 (HLB = 8.6) and the SPAN 85 (HLB = 1.8) can create a low IFT when used in these APG formulations. In contrast, mixtures employing SPAN 40 (HLB=6.7) and SPAN 80 (HLB=4.3) never exhibit this synergistic, lower IFT effect. Also, preliminary data suggest a low IFT may occur with PG 2067 / SPAN 60 mixtures (data not shown). One available relevant set of data in the literature describes IFT for APG solutions mixed with SPAN 20 and equilibrated versus n-dodecane as the oil phase. 6. Low IFT occurrs, but only over a narrow range of APG / SPAN 20 mixture ratios. We observe this same general effect, with for example the PG 2067/SPAN 85 having a sharp minimum in IFT at a ratio of 0.75%/1.25%., but significantly greater IFT at other mixing ratios. Other IFT results for APG and sorbitan surfactant mixtures are shown in Tables 3 and 4. Most other combinations of these APG products and the SPAN or TWEEN surfactants created stiff gels in the oil phase. Those combinations exhibiting such unfavorable phase behavior are not viable as an EOR formulation. The combinations (shown above) where all of the phases (aqueous, microemulsion, and oleic) appear to be fluid, the measured IFT results encompass a wide range of values. The IFT value is especially low (0.0035 dyne/cm) for the first sample shown (the PG 2069 / SPAN 20 blend at 0.8/1.2 wt%,), and a moderately low IFT of 0.05 dyne/cm Otherwise, the IFT exceeds 0.1 dyne/cm for the other combinations presented in Tables 3 and 4. Interfacial Tension (IFT) versus Temperature and Salinity. Measured IFT results in this study confirm that APG/alcohol formulations may be largely indifferent to both changes in the temperature (Figure 8) and the salinity (Figure 9). This is desirable because in oil reservoirs, the temperature will vary from zone to zone, with higher temperatures occurring in deeper subsurface depths. This behavior means that one may formulate just a single aqueous based surfactant solution that is able to mobilize the crude oil as efficiently in spite of these temperature differences. The salinity in the brine in the subsurface oil reservoir of course may vary both in an areal and vertical extent. Mature fields that have been subjected to years of waterflood (the primary targets for surfactant EOR) often have substantial differences in salinity, for example, due to contrasts between
4 S. IGLAUER, Y. FU, P.J. SHULER, M. BLANCO, Y.TANG, AND W.A. GODDARD III SPE 89472
the injected and original formation brine. A common approach in surfactant EOR is the so-called “salinity-gradient” design whereby the salinity is reduced step-wise from the formation water, surfactant slug, and polymer/water drive. The motivation for this design is to generate a low IFT, middle-phase microemulsion condition in-situ, with the following drive solutions designed to put the surfactant back into the aqueous phase in order to avoid excessive chemical loss by phase trapping. One problem with this approach is that it may be difficult to locate sufficient fresh water sources to cause this gradual reduction in salinity. Also, maintaining target salinities both in-situ and in the chemical solutions becomes more difficult as the chemical project continues. This is important because the performance of most (anionic) surfactant systems is sensitive to salinity. Having a single surfactant formulation that is indifferent to salinity should be an advantage in the EOR design. With APG/cosurfactant formulations, one might accomplish the same objectives of having low IFT in-situ and avoiding surfactant phase trapping by changing the ratio of the APG/cosurfactant during chemical injection. In addition, per Figure 9, there is the possibility of formulating for a low IFT for reservoirs containing high salinity, high hardness brines. . Surfactant Adsorption. Maximum adsorption measured for the 3 commercial APG surfactants (PG 2067, PG 2069, and PG 2062) are shown, left to right in Figure 10. Other surfactant retention tests onto kaolinite clay were performed with APG mixed with alcohol and a SPAN product (Table 5). Tests were in 2 wt% NaCl and a ratio of solution/solid of 20:1. Some trends evident from these data:
• Low adsorption for APG product with shorter alkyl chains, but significant adsorption for the PG 2062
• Increased total surfactant adsorption when mixing with the SPAN 20 sorbitan surfactant.
• The adsorption levels with mixtures of PG 2062 and 1-alcohols are almost independent of the specific alcohol cosurfactant selected.
The anticipated surfactant adsorption in a sandstone rock would be less (estimate by an order of magnitude) because the clay content would be only a few percent in a typical reservoir. Roughly speaking, adsorption levels of 10 mg/gram kaolinite (perhaps 0.1 – 1 mg/gram sandstone) are typical for alkyl aryl sulfonate surfactants used for EOR. This suggests the adsorption of the PG 2062 may be greater than that for common EOR surfactants, but that the PG 2067 and PG 2069 adsorption levels are much less. Hansen Parameters. We compare the 3 Hansen parameters for some of the components of the APG/alcohol formulations discussed in the previous section. Figures 11 is a plot of normalized values for the 3 Hansen parameters for several pure substances. These values for the PG 2062 APG surfactant, water, n-octane, and several alcohol cosurfactants are calculated as described earlier. These plots have a notation about the measured IFT value underneath each alcohol. This IFT is for a PG 2062 (0.8%) and alcohol cosurfactant (1.2%) formulation in a 2 wt% NaCl brine versus n-octane at room temperature. From the observed pattern of component Hansen parameters that makes a low IFT, one may gain guidance with respect to creating new formulations for low IFT. Our future
approach would be to calculate the Hansen parameters for a number of new compounds, and focus on those with follow-up experimental studies that exhibit the observed successful pattern of Hansen values. For these results we do find that the IFT is lower for PG 2062/ alcohol formulations when the alcohol Hansen dispersion parameter increases, polarization parameter decreases, and hydrogen bonding parameter decreases. As the Hansen parameters for this alcohol series become more similar to the values for n-octane, the model oil phase, the PG 2062/alcohol formulation reduces the interfacial tension to its lowest measured values in this study. Conclusions Key findings from this study include:
1. Alkyl polyglycoside surfactants may be formulated in brine solutions that can create IFT (interfacial tension) approaching 0.01 dyne/cm, or less, versus simple alkane hydrocarbons.
2. Some of these APG formulations may generate a low IFT that is largely independent of both salinity and temperature effects.
3. Some APG surfactants (shorter alkyl chain products) exhibit relatively low adsorption on kaolinite clay.
4. Solubility parameters estimated from first principles offer another perspective to guide the formulation of APG with cosurfactants that will create low IFT.
Acknowledgments The authors wish to thank the Department of Energy for their financial support for this project, and the technical assistance of ChevronTexaco and Akzo Nobel. We also wish to thank the Cognis Corporation for supplying APG surfactant samples. References 1. Balzer, D.: “Alkylpolyglcosides, their Physico-chemical Properties and their Uses”, Tenside Surf. Det., 38, 419 – 427, 1991. 2. Hill, K. and Rhode, O.: “Sugar-based surfactants for consumer products and technical applications”, Fett/Lipid, 10, 25–33, 1999. 3.. Balzer,D.: “Process for the extraction of crude oil from an underground deposit using surfactants”, U.S. Patent 4,985,154, 1991. 4. Balzer, D., and Luders, H., editors.: Nonionic Surfactants, Alkyl Polyglycosides, Marcel Dekker, New York, p. 228 – 243, 1996. 5 . Kutschmann, E.M., et. al.: “Interfacial tension of alkylglucosides in different APG/oil/water systems”, Colloid Polym. Sci. 273, 565 – 571, 1995. 6. Forster, T., et. al.: “Physico-chemical basics of microemulsions with alkyl polyglycosides”, Progr. Colloid Polym. Sci., 101, 105 – 112, 1996. 7. Peypoux, F., Bonmatin, J.M., and Wallach, J.: “Recent trends in biochemistry of surfactin”, Appl. Microbial. Biotechno.l, 51, 553 – 563, 1999. 8. Hildebrand, J.H., The Solubility of Non-Electrolytes, New York, Reinhold, 1936.
SPE 89472 ALKYL POLYGLYCOSIDE SURFACTANTS FOR IMPROVED OIL RECOVERY 5
with Applications to Electronic Nose Polymer Sensors”, 9. Hansen, C.M., Hansen Solubility Parameters, A User’s submitted 2003.
Handbook, New York, CRC Press, 2000. . 11. Sabatini, D.A., Acosta, E., and Harwell, J.H.: “Linker Molecules in Surfactant Mixtures”, submitted to Current Opinion in Colloid and Interface Science, February, 2003.
10. Belmares, M., Blanco, M., Goddard III, W.A.et. al.: “Hildebrand and Hansen Solubility P:arameters from Molecular Dynamics
Table 1. Chemical structure information for Alkyl Polyglycosides (APG) investigated Average Product Alkyl Chains Distribution Chain Length Average n HLB PG 2067 8/10 (45:55) 9.1 1.7 13.6 PG 2069 9/10/11 (20:40:40) 10.1 1.6 13.1 PG 2062 12/14/16 (68:26:6) 12.5 1.6 11.6 Table 2. Chemical structure information for SPAN and TWEEN surfactants. Length Average Number Length Average Product Alkyl Chain HLB Product EO Groups Alkyl Chain HLBSPAN 20 C12 8.6 TWEEN 20 20 C12 16.7 SPAN 40 C14 6.7 TWEEN 40 5 C12 13.3 SPAN 60 C18 4.7 TWEEN 80 20 C18 15.0 SPAN 80 C18 (one double bond) 4.3 TWEEN 81 5 C18 10.0 SPAN 85 3 C18 (each has double bond) 1.8 TWEEN 85 20 3 C18 chains 11.0
Table 3. Selected measured IFT for formulations of APG / SPAN surfactants versus n-octane.
SPAN weight weight IFTAPG Product % APG % SPAN (dyne/cm)
PG 2069 20 0.80 1.20 0.0035PG 2069 40 0.40 1.60 1.40PG 2069 60 0.40 1.60 0.33PG 2069 85 0.40 1.60 1.55PG 2069 85 1.50 0.50 0.8PG 2069 85 1.60 0.40 1.2
PG 2062 20 0.80 1.20 0.90PG 2062 20 1.20 0.80 0.75PG 2062 40 0.40 1.60 0.85PG 2062 60 0.40 1.60 1.00PG 2062 60 0.80 1.20 0.73PG 2062 80 0.40 1.60 1.20PG 2062 85 0.40 1.60 0.68PG 2062 85 0.80 1.20 0.25PG 2062 85 1.20 0.80 0.40
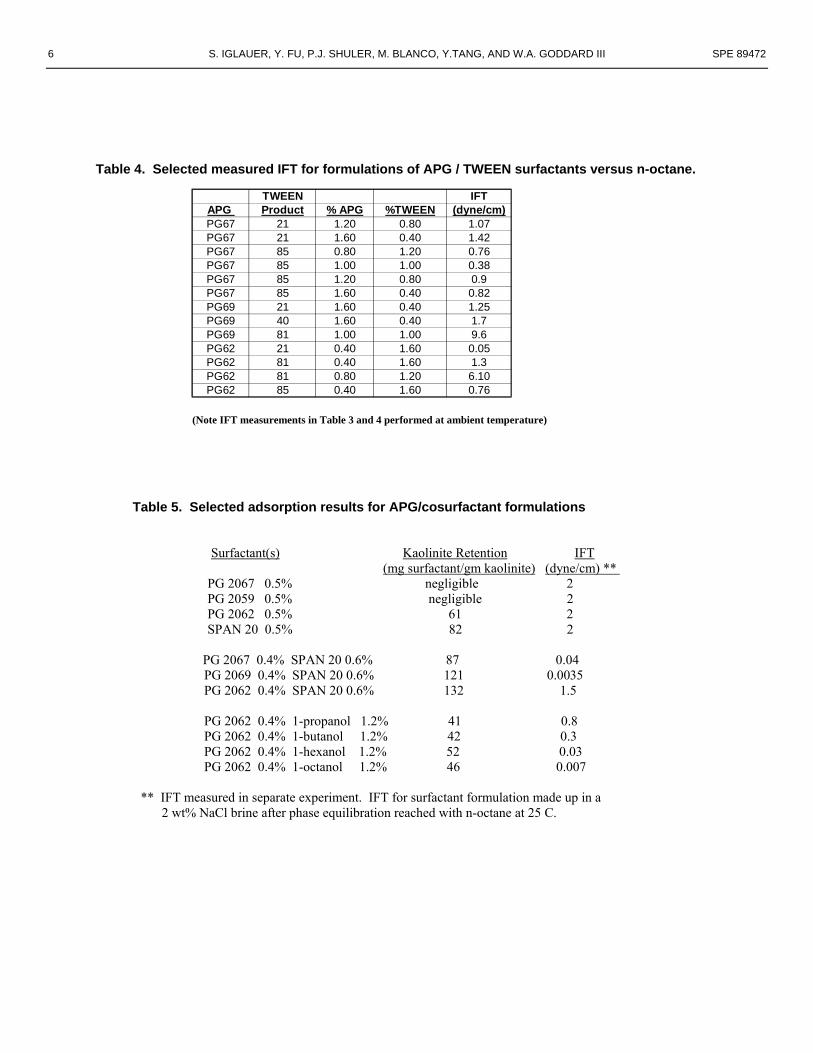
6 S. IGLAUER, Y. FU, P.J. SHULER, M. BLANCO, Y.TANG, AND W.A. GODDARD III SPE 89472
Table 4. Selected measured IFT for formulations of APG / TWEEN surfactants versus n-octane.
TWEEN IFTAPG Product % APG %TWEEN (dyne/cm)PG67 21 1.20 0.80 1.07PG67 21 1.60 0.40 1.42PG67 85 0.80 1.20 0.76PG67 85 1.00 1.00 0.38PG67 85 1.20 0.80 0.9PG67 85 1.60 0.40 0.82PG69 21 1.60 0.40 1.25PG69 40 1.60 0.40 1.7PG69 81 1.00 1.00 9.6PG62 21 0.40 1.60 0.05PG62 81 0.40 1.60 1.3PG62 81 0.80 1.20 6.10PG62 85 0.40 1.60 0.76
(Note IFT measurements in Table 3 and 4 performed at ambient temperature) Table 5. Selected adsorption results for APG/cosurfactant formulations Surfactant(s) Kaolinite Retention IFT (mg surfactant/gm kaolinite) (dyne/cm) ** PG 2067 0.5% negligible 2 PG 2059 0.5% negligible 2 PG 2062 0.5% 61 2 SPAN 20 0.5% 82 2 PG 2067 0.4% SPAN 20 0.6% 87 0.04 PG 2069 0.4% SPAN 20 0.6% 121 0.0035 PG 2062 0.4% SPAN 20 0.6% 132 1.5 PG 2062 0.4% 1-propanol 1.2% 41 0.8 PG 2062 0.4% 1-butanol 1.2% 42 0.3 PG 2062 0.4% 1-hexanol 1.2% 52 0.03 PG 2062 0.4% 1-octanol 1.2% 46 0.007 ** IFT measured in separate experiment. IFT for surfactant formulation made up in a 2 wt% NaCl brine after phase equilibration reached with n-octane at 25 C.
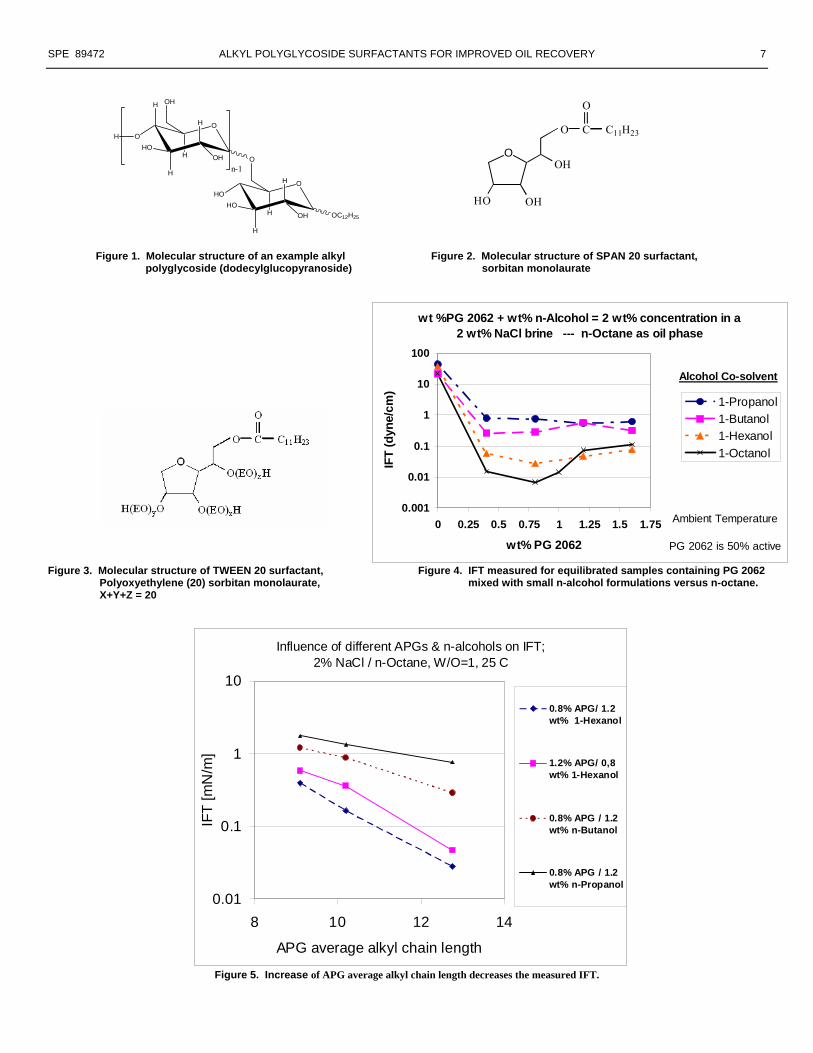
SPE 89472 ALKYL POLYGLYCOSIDE SURFACTANTS FOR IMPROVED OIL RECOVERY 7
Figure 1. Molecular structure of an example alkyl Figure 2. Molecular structure of SPAN 20 surfactant, polyglycoside (dodecylglucopyranoside) sorbitan monolaurate
Figure 3. Molecular structure of TWEEN 20 surfactant, Figure 4. IFT measured for equilibrated samples containing PG 2062
Polyoxyethylene (20) sorbitan monolaurate, mixed with small n-alcohol formulations versus n-octane. X+Y+Z = 20
Influence of different APGs & n-alcohols on IFT;2% NaCl / n-Octane, W/O=1, 25 C
0.01
0.1
1
10
8 10 12 14
APG average alkyl chain length
IFT
[mN
/m]
0.8% APG/ 1.2wt% 1-Hexanol
1.2% APG/ 0,8wt% 1-Hexanol
0.8% APG / 1.2wt% n-Butanol
0.8% APG / 1.2wt% n-Propanol
Figure 5. Increase of APG average alkyl chain length decreases the measured IFT.
OH
H
O
H
HOOHH
OH
H
OHO
H
HO
H
OHH
O
OC12H25
n-1
O
O
OHHO
OH
C
O
C11H23
wt %PG 2062 + wt% n-Alcohol = 2 wt% concentration in a 2 wt% NaCl brine --- n-Octane as oil phase
0.001
0.01
0.1
1
10
100
0 0.25 0.5 0.75 1 1.25 1.5 1.75
wt% PG 2062
IFT
(dyn
e/cm
)1-Propanol1-Butanol1-Hexanol1-Octanol
Ambient Temperature
PG 2062 is 50% active
Alcohol Co-solvent
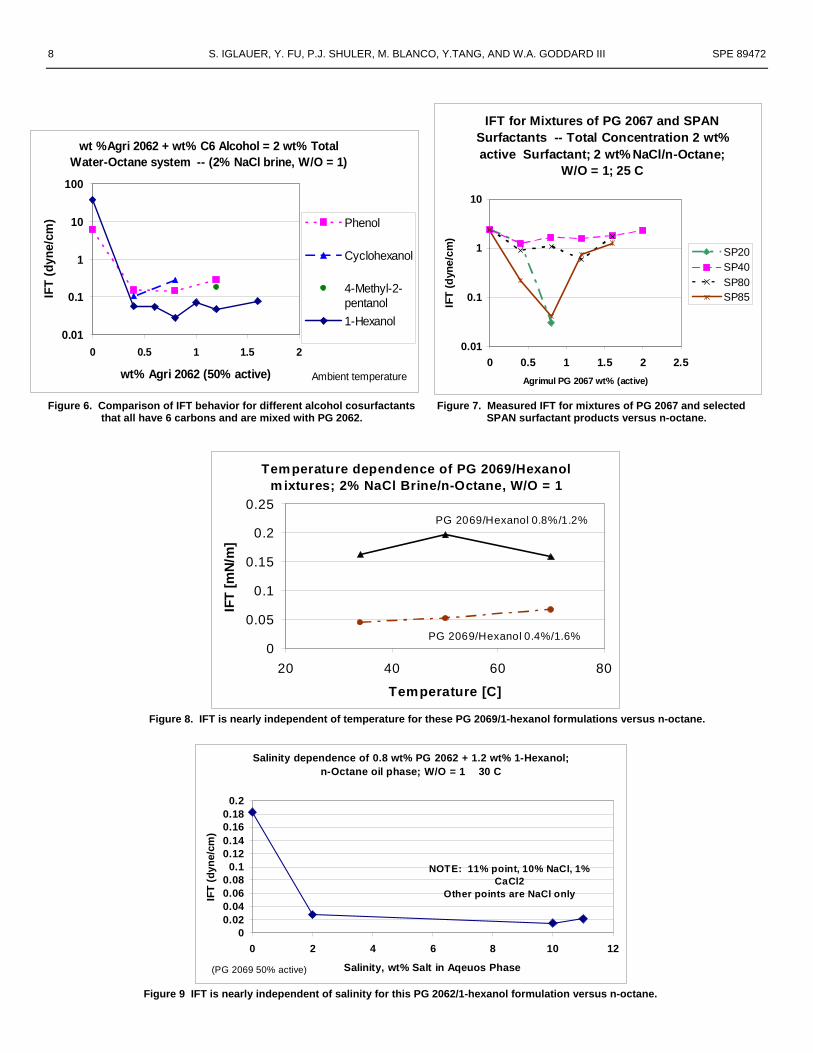
8 S. IGLAUER, Y. FU, P.J. SHULER, M. BLANCO, Y.TANG, AND W.A. GODDARD III SPE 89472
IFT for Mixtures of PG 2067 and SPAN Surfactants -- Total Concentration 2 wt% active Surfactant; 2 wt% NaCl/n-Octane;
W/O = 1; 25 C
0.01
0.1
1
10
0 0.5 1 1.5 2 2.5Agrimul PG 2067 wt% (active)
IFT
(dyn
e/cm
)
SP20SP40SP80SP85
wt %Agri 2062 + wt% C6 Alcohol = 2 wt% Total
Water-Octane system -- (2% NaCl brine, W/O = 1)
0.01
0.1
1
10
100
0 0.5 1 1.5 2
wt% Agri 2062 (50% active)
IFT
(dyn
e/cm
) Phenol
Cyclohexanol
4-Methyl-2-pentanol1-Hexanol
Ambient temperature
Figure 6. Comparison of IFT behavior for different alcohol cosurfactants Figure 7. Measured IFT for mixtures of PG 2067 and selected that all have 6 carbons and are mixed with PG 2062. SPAN surfactant products versus n-octane.
Temperature dependence of PG 2069/Hexanol m ixtures; 2% NaCl Brine/n-Octane, W/O = 1
0
0.05
0.1
0.15
0.2
0.25
20 40 60 80
Temperature [C]
IFT
[mN
/m]
PG 2069/Hexanol 0.8%/1.2%
PG 2069/Hexanol 0.4%/1.6%
Figure 8. IFT is nearly independent of temperature for these PG 2069/1-hexanol formulations versus n-octane.
Salinity dependence of 0.8 wt% PG 2062 + 1.2 wt% 1-Hexanol;n-Octane oil phase; W/O = 1 30 C
00.020.040.060.08
0.10.120.140.160.18
0.2
0 2 4 6 8 10
Salinity, wt% Salt in Aqeuos Phase
IFT
(dyn
e/cm
)
12
NOTE: 11% point, 10% NaCl, 1% CaCl2
Other points are NaCl only
(PG 2069 50% active)
Figure 9 IFT is nearly independent of salinity for this PG 2062/1-hexanol formulation versus n-octane.
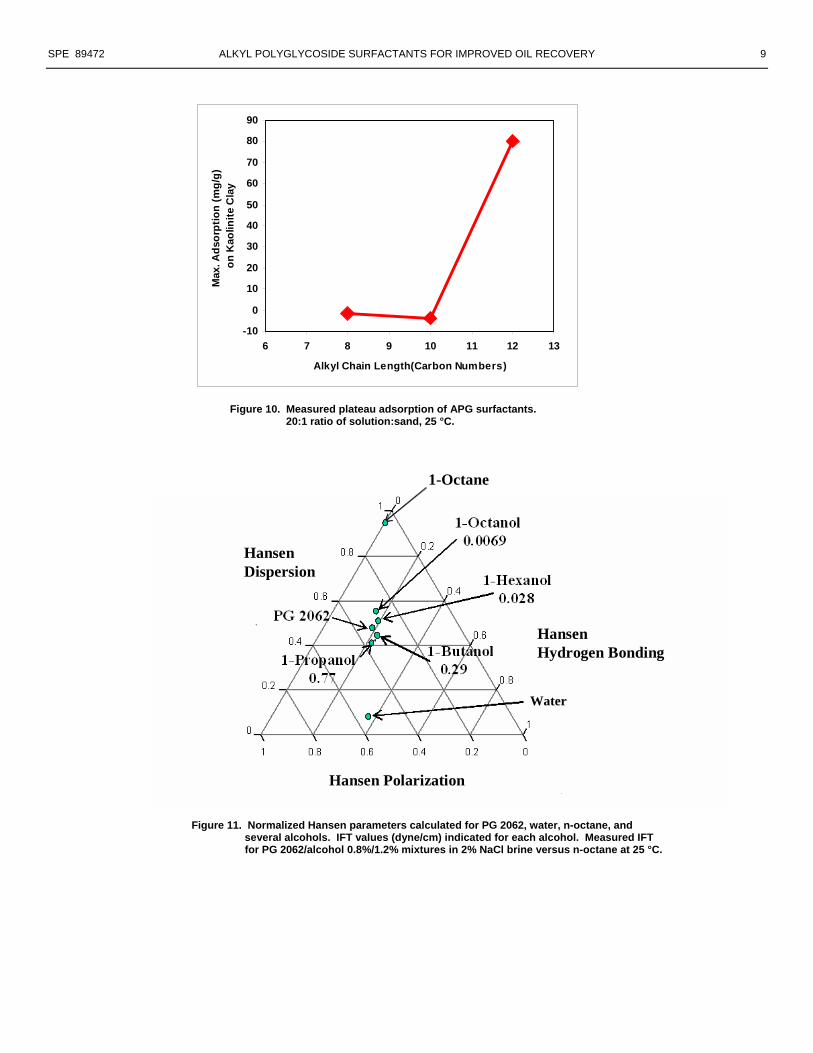
SPE 89472 ALKYL POLYGLYCOSIDE SURFACTANTS FOR IMPROVED OIL RECOVERY 9
-10
0
10
20
30
40
50
60
70
80
90
6 7 8 9 10 11 12 13
Alkyl Chain Length(Carbon Numbers)
Max
. Ads
orpt
ion
(mg/
g)on
Kao
linite
Cla
y
Figure 10. Measured plateau adsorption of APG surfactants.
20:1 ratio of solution:sand, 25 °C.
Water
1-Octane
Hansen Hydrogen Bonding
Hansen Polarization
Hansen Dispersion
Figure 11. Normalized Hansen parameters calculated for PG 2062, water, n-octane, and
several alcohols. IFT values (dyne/cm) indicated for each alcohol. Measured IFT for PG 2062/alcohol 0.8%/1.2% mixtures in 2% NaCl brine versus n-octane at 25 °C.
Molecular Dynamics Study of a Surfactant-Mediated Decane-Water Interface: Effect ofMolecular Architecture of Alkyl Benzene Sulfonate
Seung Soon Jang, Shiang-Tai Lin, Prabal K. Maiti, Mario Blanco, andWilliam A. Goddard III*Materials and Process Simulation Center, Beckman Institute, California Institute of Technology,Pasadena, California 91125
Patrick Shuler and Yongchun TangPower, Energy & EnVironmental Research Center, California Institute of Technology,CoVina, California 91722
ReceiVed: March 18, 2004; In Final Form: May 25, 2004
The effect of molecular architecture of a surfactant, particularly the attachment position of benzene sulfonateon the hexadecane backbone, at the decane-water interface was investigated using atomistic MD simulations.We consider a series of surfactant isomers in the family of alkyl benzene sulfonates, denoted bym-C16,indicating a benzene sulfonate group attached to themth carbon in a hexadecane backbone. The equilibratedmodel systems showed a well-defined interface between the decane and water phases. We find that surfactant4-C16 has a more compact packing, in terms of the interfacial area and molecular alignment at the interface,than other surfactants simulated in this study. Furthermore, surfactant 4-C16 leads to the most stable interfaceby having the lowest interface formation energy. The interfacial thickness is the largest in the case of surfactant4-C16, with the thickness decreasing when the benzene sulfonate is located farther from the attachment positionof 4-C16 (the 4th carbon). The interfacial tension profile was calculated along the direction perpendicular tothe interface using the Kirkwood-Buff theory. From the comparison of the interfacial tension obtained fromthe interfacial tension profile, we found that surfactant 4-C16 induces the lowest interfacial tension and thatthe interfacial tension increases with decreasing interfacial thickness as a function of the attachment positionof benzene sulfonate. Such a relationship between the interfacial thickness and interfacial tension is rationalizedin terms of the miscibility of the alkyl tail of surfactantm-C16 with decane by comparing the “effective”length of the alkyl tail with the average end-to-end length of decane. Among the surfactants, the effectivelength of the 4-C16 alkyl tail (9.53( 1.36 Å) was found to be closest to that of decane (9.97( 1.03 Å),which is consistent with the results from the density profile and the interfacial tension profile.
1. Introduction
Surfactants are amphiphilic molecules which have one partthat is more soluble in water and another part that is moresoluble in oil. When added to an oil-water mixture, surfactantmolecules are preferentially adsorbed into the interface, leadingto a modification of the interfacial properties such as a decreaseof interfacial tension. Surfactants are widely employed inhousehold uses such as detergents, food, and cosmetic technol-ogy and in large-scale operations in petroleum recovery.1-4 Itis important to understand the underlying principle governinginterfacial properties of a given system and, thereby, to designthe system or the molecular architecture of surfactants for thepurpose of optimizing the performance in which we areinterested.
Most thermodynamic models based on the Langmuir adsorp-tion have been developed to describe the equilibrium adsorptionof surfactants at the oil-water interface.5-19 In particular, therehave been efforts made to link the given thermodynamic modelsand molecular information, such as the conformation andintermolecular interaction. Fainerman and co-workers11,12havestudied the influence of the molecular reorientation of surfactantson the adsorption isotherms by taking into account the confor-mational dependency of surface area. Blankschtein and co-
workers developed a molecular thermodynamic theory forpredicting the interfacial behavior of surfactant mixtures thatare adsorbed at the air-water17,18 or the oil-water interface19
by combining the two-dimensional nonideal gas model20 withspecific molecular properties such as the number of carbons inthe surfactant hydrocarbon tail and the molecular cross-sectionalarea. In these models, knowledge of the molecular structure andinteraction is essential for the quantitative prediction anddescription of the properties of the interface.
Molecular modeling approaches such as the moleculardynamics (MD) and Monte Carlo (MC) simulations have beenextensively used for studying the liquid-vapor21-34 and liquid-liquid35-51 interfaces. These methods, performed on the basisof the molecular interaction and molecular structures, provideatomistic or molecular details of the interface that are potentiallyuseful for the thermodynamic models mentioned previously.However, among these studies, only a few40,43,47,49,50havespecifically considered the role of the surfactant at the oil-water interface. Although there have been studies attemptingto investigate the dependence of dynamics and morphology ofsurfactant aggregates on the surfactant structure using coarse-grained modeling techniques,43,52-56 to our knowledge, therehas been no systematic study investigating the effect of
12130 J. Phys. Chem. B2004,108,12130-12140
10.1021/jp048773n CCC: $27.50 © 2004 American Chemical SocietyPublished on Web 07/10/2004
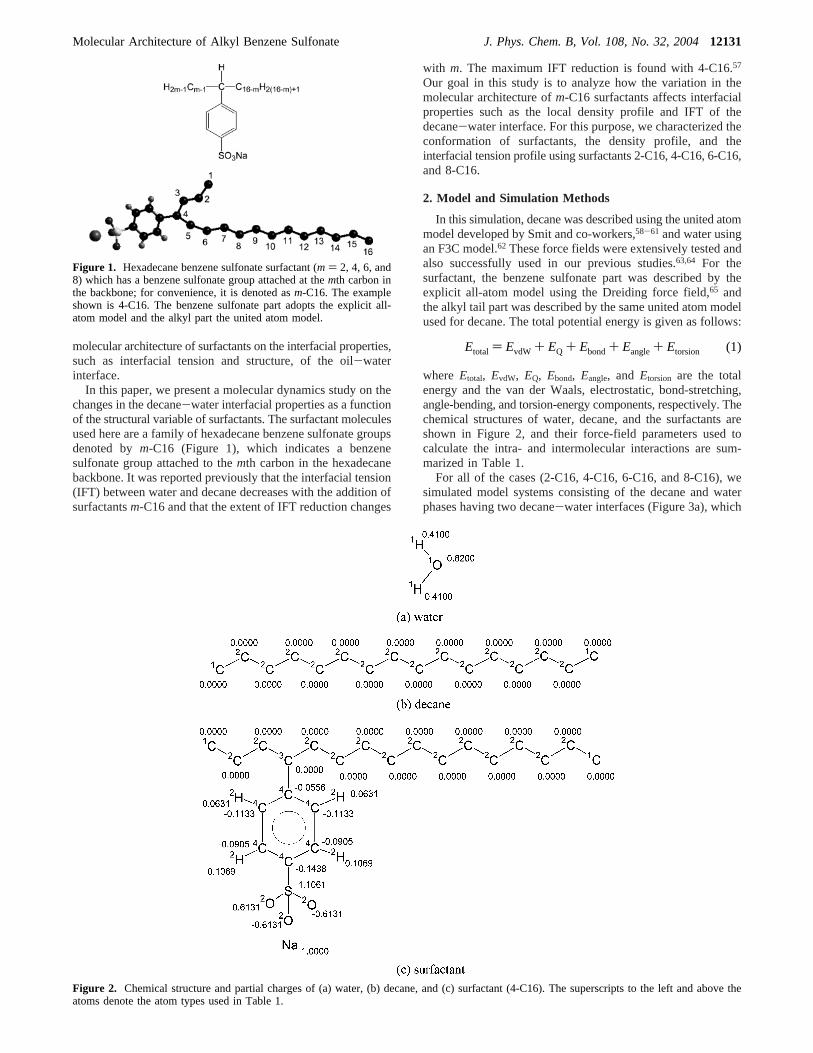
molecular architecture of surfactants on the interfacial properties,such as interfacial tension and structure, of the oil-waterinterface.
In this paper, we present a molecular dynamics study on thechanges in the decane-water interfacial properties as a functionof the structural variable of surfactants. The surfactant moleculesused here are a family of hexadecane benzene sulfonate groupsdenoted bym-C16 (Figure 1), which indicates a benzenesulfonate group attached to themth carbon in the hexadecanebackbone. It was reported previously that the interfacial tension(IFT) between water and decane decreases with the addition ofsurfactantsm-C16 and that the extent of IFT reduction changes
with m. The maximum IFT reduction is found with 4-C16.57
Our goal in this study is to analyze how the variation in themolecular architecture ofm-C16 surfactants affects interfacialproperties such as the local density profile and IFT of thedecane-water interface. For this purpose, we characterized theconformation of surfactants, the density profile, and theinterfacial tension profile using surfactants 2-C16, 4-C16, 6-C16,and 8-C16.
2. Model and Simulation Methods
In this simulation, decane was described using the united atommodel developed by Smit and co-workers,58-61 and water usingan F3C model.62 These force fields were extensively tested andalso successfully used in our previous studies.63,64 For thesurfactant, the benzene sulfonate part was described by theexplicit all-atom model using the Dreiding force field,65 andthe alkyl tail part was described by the same united atom modelused for decane. The total potential energy is given as follows:
where Etotal, EvdW, EQ, Ebond, Eangle, and Etorsion are the totalenergy and the van der Waals, electrostatic, bond-stretching,angle-bending, and torsion-energy components, respectively. Thechemical structures of water, decane, and the surfactants areshown in Figure 2, and their force-field parameters used tocalculate the intra- and intermolecular interactions are sum-marized in Table 1.
For all of the cases (2-C16, 4-C16, 6-C16, and 8-C16), wesimulated model systems consisting of the decane and waterphases having two decane-water interfaces (Figure 3a), which
Figure 1. Hexadecane benzene sulfonate surfactant (m ) 2, 4, 6, and8) which has a benzene sulfonate group attached at themth carbon inthe backbone; for convenience, it is denoted asm-C16. The exampleshown is 4-C16. The benzene sulfonate part adopts the explicit all-atom model and the alkyl part the united atom model.
Figure 2. Chemical structure and partial charges of (a) water, (b) decane, and (c) surfactant (4-C16). The superscripts to the left and above theatoms denote the atom types used in Table 1.
Etotal ) EvdW + EQ + Ebond+ Eangle+ Etorsion (1)
Molecular Architecture of Alkyl Benzene Sulfonate J. Phys. Chem. B, Vol. 108, No. 32, 200412131
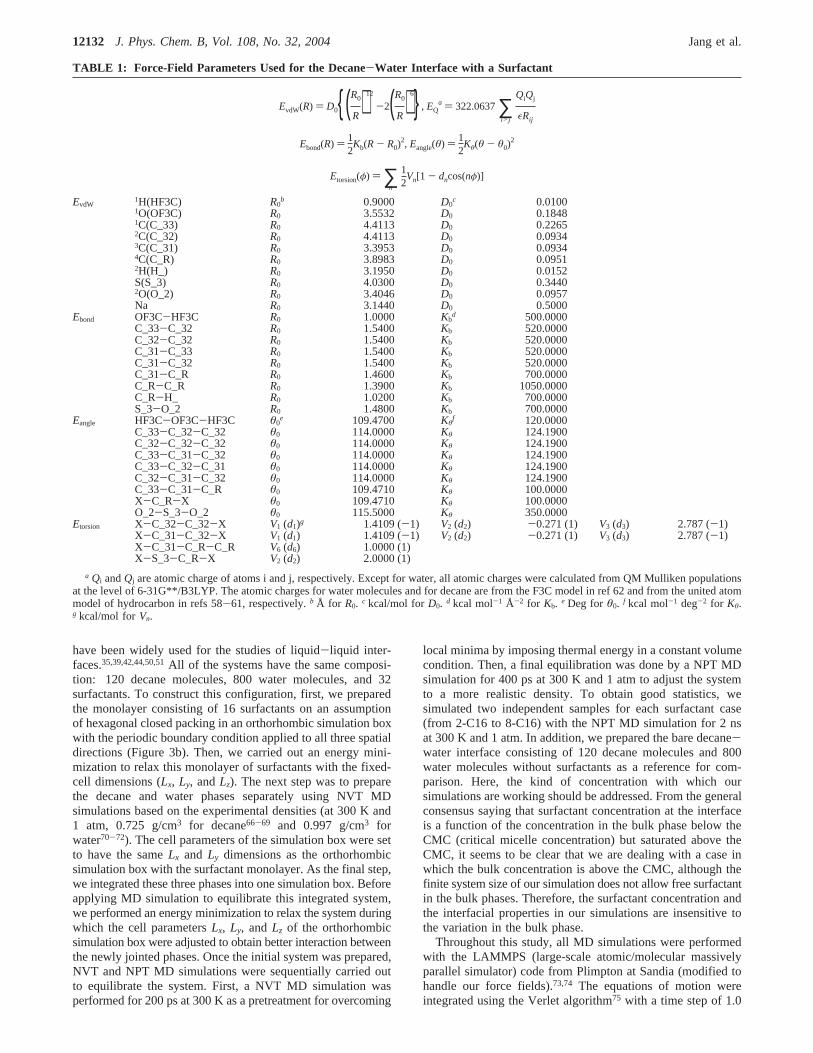
have been widely used for the studies of liquid-liquid inter-faces.35,39,42,44,50,51All of the systems have the same composi-tion: 120 decane molecules, 800 water molecules, and 32surfactants. To construct this configuration, first, we preparedthe monolayer consisting of 16 surfactants on an assumptionof hexagonal closed packing in an orthorhombic simulation boxwith the periodic boundary condition applied to all three spatialdirections (Figure 3b). Then, we carried out an energy mini-mization to relax this monolayer of surfactants with the fixed-cell dimensions (Lx, Ly, andLz). The next step was to preparethe decane and water phases separately using NVT MDsimulations based on the experimental densities (at 300 K and1 atm, 0.725 g/cm3 for decane66-69 and 0.997 g/cm3 forwater70-72). The cell parameters of the simulation box were setto have the sameLx and Ly dimensions as the orthorhombicsimulation box with the surfactant monolayer. As the final step,we integrated these three phases into one simulation box. Beforeapplying MD simulation to equilibrate this integrated system,we performed an energy minimization to relax the system duringwhich the cell parametersLx, Ly, andLz of the orthorhombicsimulation box were adjusted to obtain better interaction betweenthe newly jointed phases. Once the initial system was prepared,NVT and NPT MD simulations were sequentially carried outto equilibrate the system. First, a NVT MD simulation wasperformed for 200 ps at 300 K as a pretreatment for overcoming
local minima by imposing thermal energy in a constant volumecondition. Then, a final equilibration was done by a NPT MDsimulation for 400 ps at 300 K and 1 atm to adjust the systemto a more realistic density. To obtain good statistics, wesimulated two independent samples for each surfactant case(from 2-C16 to 8-C16) with the NPT MD simulation for 2 nsat 300 K and 1 atm. In addition, we prepared the bare decane-water interface consisting of 120 decane molecules and 800water molecules without surfactants as a reference for com-parison. Here, the kind of concentration with which oursimulations are working should be addressed. From the generalconsensus saying that surfactant concentration at the interfaceis a function of the concentration in the bulk phase below theCMC (critical micelle concentration) but saturated above theCMC, it seems to be clear that we are dealing with a case inwhich the bulk concentration is above the CMC, although thefinite system size of our simulation does not allow free surfactantin the bulk phases. Therefore, the surfactant concentration andthe interfacial properties in our simulations are insensitive tothe variation in the bulk phase.
Throughout this study, all MD simulations were performedwith the LAMMPS (large-scale atomic/molecular massivelyparallel simulator) code from Plimpton at Sandia (modified tohandle our force fields).73,74 The equations of motion wereintegrated using the Verlet algorithm75 with a time step of 1.0
TABLE 1: Force-Field Parameters Used for the Decane-Water Interface with a Surfactant
EvdW(R) ) D0{(R0
R)12
-2(R0
R)6}, EQa ) 322.0637∑
i>j
QiQj
εRij
Ebond(R) ) 12Kb(R - R0)
2, Eangle(θ) ) 12Kθ(θ - θ0)
2
Etorsion(φ) ) ∑n
12Vn[1 - dncos(nφ)]
EvdW1H(HF3C) R0
b 0.9000 D0c 0.0100
1O(OF3C) R0 3.5532 D0 0.18481C(C_33) R0 4.4113 D0 0.22652C(C_32) R0 4.4113 D0 0.09343C(C_31) R0 3.3953 D0 0.09344C(C_R) R0 3.8983 D0 0.09512H(H_) R0 3.1950 D0 0.0152S(S_3) R0 4.0300 D0 0.34402O(O_2) R0 3.4046 D0 0.0957Na R0 3.1440 D0 0.5000
Ebond OF3C-HF3C R0 1.0000 Kbd 500.0000
C_33-C_32 R0 1.5400 Kb 520.0000C_32-C_32 R0 1.5400 Kb 520.0000C_31-C_33 R0 1.5400 Kb 520.0000C_31-C_32 R0 1.5400 Kb 520.0000C_31-C_R R0 1.4600 Kb 700.0000C_R-C_R R0 1.3900 Kb 1050.0000C_R-H_ R0 1.0200 Kb 700.0000S_3-O_2 R0 1.4800 Kb 700.0000
Eangle HF3C-OF3C-HF3C θ0e 109.4700 Kθ
f 120.0000C_33-C_32-C_32 θ0 114.0000 Kθ 124.1900C_32-C_32-C_32 θ0 114.0000 Kθ 124.1900C_33-C_31-C_32 θ0 114.0000 Kθ 124.1900C_33-C_32-C_31 θ0 114.0000 Kθ 124.1900C_32-C_31-C_32 θ0 114.0000 Kθ 124.1900C_33-C_31-C_R θ0 109.4710 Kθ 100.0000X-C_R-X θ0 109.4710 Kθ 100.0000O_2-S_3-O_2 θ0 115.5000 Kθ 350.0000
Etorsion X-C_32-C_32-X V1 (d1)g 1.4109 (-1) V2 (d2) -0.271 (1) V3 (d3) 2.787 (-1)X-C_31-C_32-X V1 (d1) 1.4109 (-1) V2 (d2) -0.271 (1) V3 (d3) 2.787 (-1)X-C_31-C_R-C_R V6 (d6) 1.0000 (1)X-S_3-C_R-X V2 (d2) 2.0000 (1)
a Qi andQj are atomic charge of atoms i and j, respectively. Except for water, all atomic charges were calculated from QM Mulliken populationsat the level of 6-31G**/B3LYP. The atomic charges for water molecules and for decane are from the F3C model in ref 62 and from the united atommodel of hydrocarbon in refs 58-61, respectively.b Å for R0. c kcal/mol for D0. d kcal mol-1 Å-2 for Kb. e Deg for θ0. f kcal mol-1 deg-2 for Kθ.g kcal/mol for Vn.
12132 J. Phys. Chem. B, Vol. 108, No. 32, 2004 Jang et al.
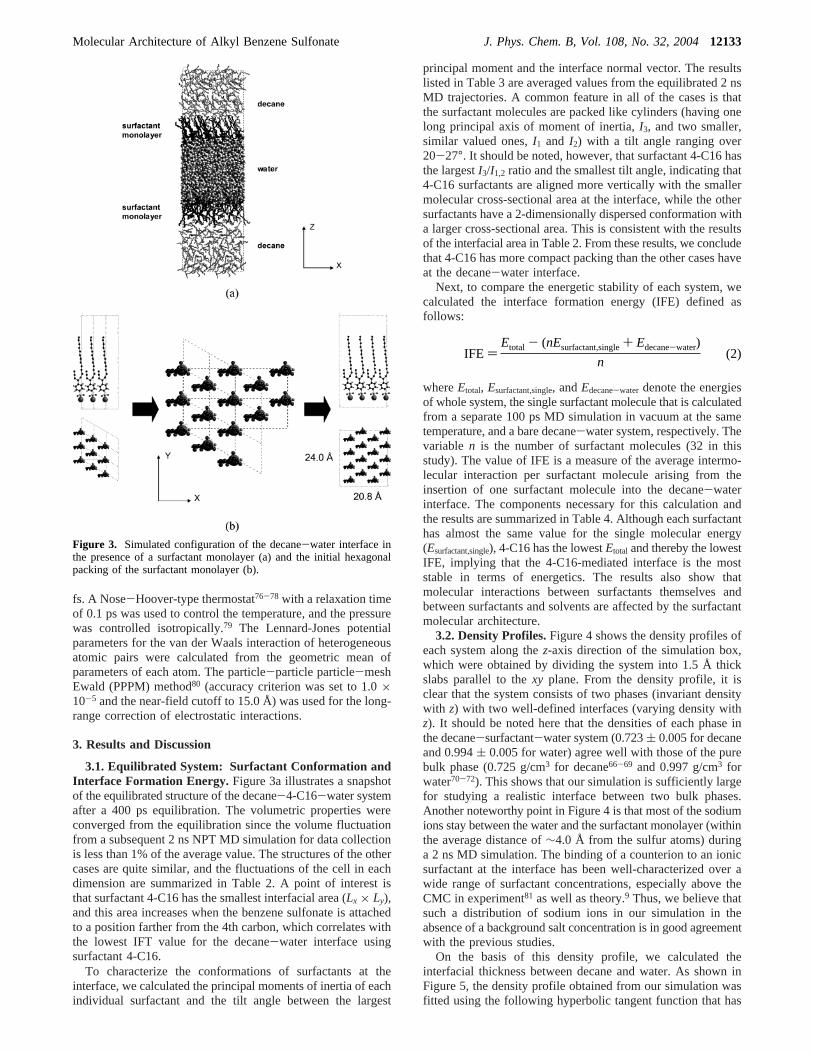
fs. A Nose-Hoover-type thermostat76-78 with a relaxation timeof 0.1 ps was used to control the temperature, and the pressurewas controlled isotropically.79 The Lennard-Jones potentialparameters for the van der Waals interaction of heterogeneousatomic pairs were calculated from the geometric mean ofparameters of each atom. The particle-particle particle-meshEwald (PPPM) method80 (accuracy criterion was set to 1.0×10⁻⁵ and the near-field cutoff to 15.0 Å) was used for the long-range correction of electrostatic interactions.
3. Results and Discussion
3.1. Equilibrated System: Surfactant Conformation andInterface Formation Energy. Figure 3a illustrates a snapshotof the equilibrated structure of the decane-4-C16-water systemafter a 400 ps equilibration. The volumetric properties wereconverged from the equilibration since the volume fluctuationfrom a subsequent 2 ns NPT MD simulation for data collectionis less than 1% of the average value. The structures of the othercases are quite similar, and the fluctuations of the cell in eachdimension are summarized in Table 2. A point of interest isthat surfactant 4-C16 has the smallest interfacial area (Lx × Ly),and this area increases when the benzene sulfonate is attachedto a position farther from the 4th carbon, which correlates withthe lowest IFT value for the decane-water interface usingsurfactant 4-C16.
To characterize the conformations of surfactants at theinterface, we calculated the principal moments of inertia of eachindividual surfactant and the tilt angle between the largest
principal moment and the interface normal vector. The resultslisted in Table 3 are averaged values from the equilibrated 2 nsMD trajectories. A common feature in all of the cases is thatthe surfactant molecules are packed like cylinders (having onelong principal axis of moment of inertia,I3, and two smaller,similar valued ones,I1 and I2) with a tilt angle ranging over20-27°. It should be noted, however, that surfactant 4-C16 hasthe largestI3/I1,2 ratio and the smallest tilt angle, indicating that4-C16 surfactants are aligned more vertically with the smallermolecular cross-sectional area at the interface, while the othersurfactants have a 2-dimensionally dispersed conformation witha larger cross-sectional area. This is consistent with the resultsof the interfacial area in Table 2. From these results, we concludethat 4-C16 has more compact packing than the other cases haveat the decane-water interface.
Next, to compare the energetic stability of each system, wecalculated the interface formation energy (IFE) defined asfollows:
whereEtotal, Esurfactant,single, andEdecane-water denote the energiesof whole system, the single surfactant molecule that is calculatedfrom a separate 100 ps MD simulation in vacuum at the sametemperature, and a bare decane-water system, respectively. Thevariablen is the number of surfactant molecules (32 in thisstudy). The value of IFE is a measure of the average intermo-lecular interaction per surfactant molecule arising from theinsertion of one surfactant molecule into the decane-waterinterface. The components necessary for this calculation andthe results are summarized in Table 4. Although each surfactanthas almost the same value for the single molecular energy(Esurfactant,single), 4-C16 has the lowestEtotal and thereby the lowestIFE, implying that the 4-C16-mediated interface is the moststable in terms of energetics. The results also show thatmolecular interactions between surfactants themselves andbetween surfactants and solvents are affected by the surfactantmolecular architecture.
3.2. Density Profiles.Figure 4 shows the density profiles ofeach system along thez-axis direction of the simulation box,which were obtained by dividing the system into 1.5 Å thickslabs parallel to thexy plane. From the density profile, it isclear that the system consists of two phases (invariant densitywith z) with two well-defined interfaces (varying density withz). It should be noted here that the densities of each phase inthe decane-surfactant-water system (0.723( 0.005 for decaneand 0.994( 0.005 for water) agree well with those of the purebulk phase (0.725 g/cm3 for decane66-69 and 0.997 g/cm3 forwater70-72). This shows that our simulation is sufficiently largefor studying a realistic interface between two bulk phases.Another noteworthy point in Figure 4 is that most of the sodiumions stay between the water and the surfactant monolayer (withinthe average distance of∼4.0 Å from the sulfur atoms) duringa 2 ns MD simulation. The binding of a counterion to an ionicsurfactant at the interface has been well-characterized over awide range of surfactant concentrations, especially above theCMC in experiment81 as well as theory.9 Thus, we believe thatsuch a distribution of sodium ions in our simulation in theabsence of a background salt concentration is in good agreementwith the previous studies.
On the basis of this density profile, we calculated theinterfacial thickness between decane and water. As shown inFigure 5, the density profile obtained from our simulation wasfitted using the following hyperbolic tangent function that has
Figure 3. Simulated configuration of the decane-water interface inthe presence of a surfactant monolayer (a) and the initial hexagonalpacking of the surfactant monolayer (b).
IFE )Etotal - (nEsurfactant,single+ Edecane-water)
n(2)
Molecular Architecture of Alkyl Benzene Sulfonate J. Phys. Chem. B, Vol. 108, No. 32, 200412133
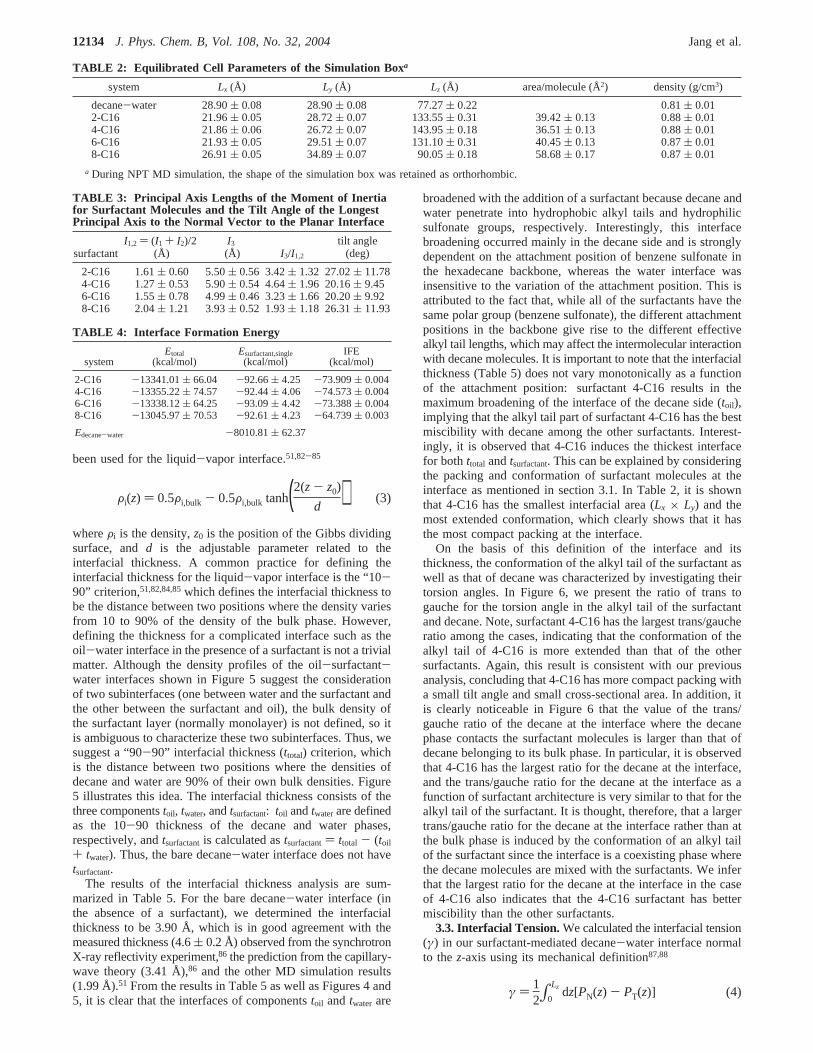
been used for the liquid-vapor interface.51,82-85
whereFi is the density,z0 is the position of the Gibbs dividingsurface, andd is the adjustable parameter related to theinterfacial thickness. A common practice for defining theinterfacial thickness for the liquid-vapor interface is the “10-90” criterion,51,82,84,85which defines the interfacial thickness tobe the distance between two positions where the density variesfrom 10 to 90% of the density of the bulk phase. However,defining the thickness for a complicated interface such as theoil-water interface in the presence of a surfactant is not a trivialmatter. Although the density profiles of the oil-surfactant-water interfaces shown in Figure 5 suggest the considerationof two subinterfaces (one between water and the surfactant andthe other between the surfactant and oil), the bulk density ofthe surfactant layer (normally monolayer) is not defined, so itis ambiguous to characterize these two subinterfaces. Thus, wesuggest a “90-90” interfacial thickness (ttotal) criterion, whichis the distance between two positions where the densities ofdecane and water are 90% of their own bulk densities. Figure5 illustrates this idea. The interfacial thickness consists of thethree componentstoil, twater, andtsurfactant: toil andtwaterare definedas the 10-90 thickness of the decane and water phases,respectively, andtsurfactantis calculated astsurfactant) ttotal - (toil
+ twater). Thus, the bare decane-water interface does not havetsurfactant.
The results of the interfacial thickness analysis are sum-marized in Table 5. For the bare decane-water interface (inthe absence of a surfactant), we determined the interfacialthickness to be 3.90 Å, which is in good agreement with themeasured thickness (4.6( 0.2 Å) observed from the synchrotronX-ray reflectivity experiment,86 the prediction from the capillary-wave theory (3.41 Å),86 and the other MD simulation results(1.99 Å).51 From the results in Table 5 as well as Figures 4 and5, it is clear that the interfaces of componentstoil andtwater are
broadened with the addition of a surfactant because decane andwater penetrate into hydrophobic alkyl tails and hydrophilicsulfonate groups, respectively. Interestingly, this interfacebroadening occurred mainly in the decane side and is stronglydependent on the attachment position of benzene sulfonate inthe hexadecane backbone, whereas the water interface wasinsensitive to the variation of the attachment position. This isattributed to the fact that, while all of the surfactants have thesame polar group (benzene sulfonate), the different attachmentpositions in the backbone give rise to the different effectivealkyl tail lengths, which may affect the intermolecular interactionwith decane molecules. It is important to note that the interfacialthickness (Table 5) does not vary monotonically as a functionof the attachment position: surfactant 4-C16 results in themaximum broadening of the interface of the decane side (toil),implying that the alkyl tail part of surfactant 4-C16 has the bestmiscibility with decane among the other surfactants. Interest-ingly, it is observed that 4-C16 induces the thickest interfacefor bothttotal andtsurfactant. This can be explained by consideringthe packing and conformation of surfactant molecules at theinterface as mentioned in section 3.1. In Table 2, it is shownthat 4-C16 has the smallest interfacial area (Lx × Ly) and themost extended conformation, which clearly shows that it hasthe most compact packing at the interface.
On the basis of this definition of the interface and itsthickness, the conformation of the alkyl tail of the surfactant aswell as that of decane was characterized by investigating theirtorsion angles. In Figure 6, we present the ratio of trans togauche for the torsion angle in the alkyl tail of the surfactantand decane. Note, surfactant 4-C16 has the largest trans/gaucheratio among the cases, indicating that the conformation of thealkyl tail of 4-C16 is more extended than that of the othersurfactants. Again, this result is consistent with our previousanalysis, concluding that 4-C16 has more compact packing witha small tilt angle and small cross-sectional area. In addition, itis clearly noticeable in Figure 6 that the value of the trans/gauche ratio of the decane at the interface where the decanephase contacts the surfactant molecules is larger than that ofdecane belonging to its bulk phase. In particular, it is observedthat 4-C16 has the largest ratio for the decane at the interface,and the trans/gauche ratio for the decane at the interface as afunction of surfactant architecture is very similar to that for thealkyl tail of the surfactant. It is thought, therefore, that a largertrans/gauche ratio for the decane at the interface rather than atthe bulk phase is induced by the conformation of an alkyl tailof the surfactant since the interface is a coexisting phase wherethe decane molecules are mixed with the surfactants. We inferthat the largest ratio for the decane at the interface in the caseof 4-C16 also indicates that the 4-C16 surfactant has bettermiscibility than the other surfactants.
3.3. Interfacial Tension.We calculated the interfacial tension(γ) in our surfactant-mediated decane-water interface normalto thez-axis using its mechanical definition87,88
TABLE 2: Equilibrated Cell Parameters of the Simulation Boxa
system Lx (Å) Ly (Å) Lz (Å) area/molecule (Å2) density (g/cm3)
decane-water 28.90( 0.08 28.90( 0.08 77.27( 0.22 0.81( 0.012-C16 21.96( 0.05 28.72( 0.07 133.55( 0.31 39.42( 0.13 0.88( 0.014-C16 21.86( 0.06 26.72( 0.07 143.95( 0.18 36.51( 0.13 0.88( 0.016-C16 21.93( 0.05 29.51( 0.07 131.10( 0.31 40.45( 0.13 0.87( 0.018-C16 26.91( 0.05 34.89( 0.07 90.05( 0.18 58.68( 0.17 0.87( 0.01
a During NPT MD simulation, the shape of the simulation box was retained as orthorhombic.
TABLE 3: Principal Axis Lengths of the Moment of Inertiafor Surfactant Molecules and the Tilt Angle of the LongestPrincipal Axis to the Normal Vector to the Planar Interface
surfactantI1,2 ) (I1 + I2)/2
(Å)I3
(Å) I3/I1,2
tilt angle(deg)
2-C16 1.61( 0.60 5.50( 0.56 3.42( 1.32 27.02( 11.784-C16 1.27( 0.53 5.90( 0.54 4.64( 1.96 20.16( 9.456-C16 1.55( 0.78 4.99( 0.46 3.23( 1.66 20.20( 9.928-C16 2.04( 1.21 3.93( 0.52 1.93( 1.18 26.31( 11.93
TABLE 4: Interface Formation Energy
systemEtotal
(kcal/mol)Esurfactant,single(kcal/mol)
IFE(kcal/mol)
2-C16 -13341.01( 66.04 -92.66( 4.25 -73.909( 0.0044-C16 -13355.22( 74.57 -92.44( 4.06 -74.573( 0.0046-C16 -13338.12( 64.25 -93.09( 4.42 -73.388( 0.0048-C16 -13045.97( 70.53 -92.61( 4.23 -64.739( 0.003
Edecane-water -8010.81( 62.37
Fi(z) ) 0.5Fi,bulk - 0.5Fi,bulk tanh(2(z - z0)
d ) (3)
γ ) 12∫0
Lz dz[PN(z) - PT(z)] (4)
12134 J. Phys. Chem. B, Vol. 108, No. 32, 2004 Jang et al.
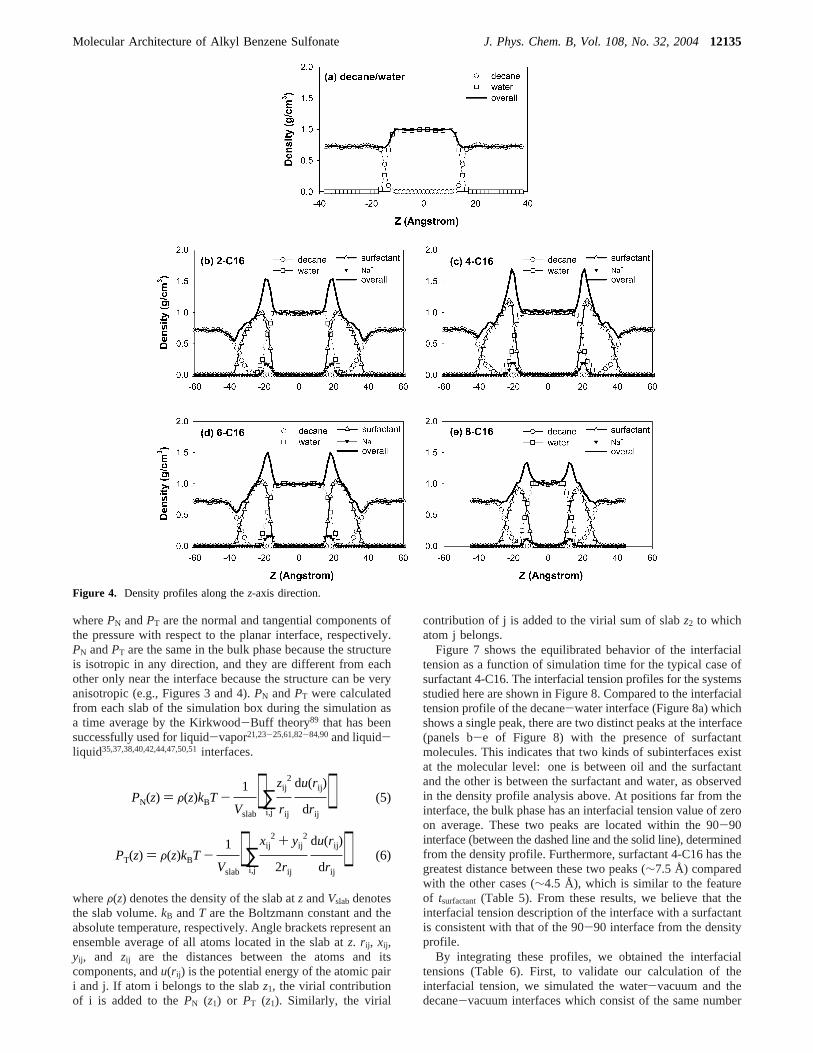
wherePN andPT are the normal and tangential components ofthe pressure with respect to the planar interface, respectively.PN andPT are the same in the bulk phase because the structureis isotropic in any direction, and they are different from eachother only near the interface because the structure can be veryanisotropic (e.g., Figures 3 and 4).PN andPT were calculatedfrom each slab of the simulation box during the simulation asa time average by the Kirkwood-Buff theory89 that has beensuccessfully used for liquid-vapor21,23-25,61,82-84,90and liquid-liquid35,37,38,40,42,44,47,50,51interfaces.
whereF(z) denotes the density of the slab atz andVslabdenotesthe slab volume.kB andT are the Boltzmann constant and theabsolute temperature, respectively. Angle brackets represent anensemble average of all atoms located in the slab atz. r ij , xij ,yij , and zij are the distances between the atoms and itscomponents, andu(r ij ) is the potential energy of the atomic pairi and j. If atom i belongs to the slabz1, the virial contributionof i is added to thePN (z1) or PT (z1). Similarly, the virial
contribution of j is added to the virial sum of slabz2 to whichatom j belongs.
Figure 7 shows the equilibrated behavior of the interfacialtension as a function of simulation time for the typical case ofsurfactant 4-C16. The interfacial tension profiles for the systemsstudied here are shown in Figure 8. Compared to the interfacialtension profile of the decane-water interface (Figure 8a) whichshows a single peak, there are two distinct peaks at the interface(panels b-e of Figure 8) with the presence of surfactantmolecules. This indicates that two kinds of subinterfaces existat the molecular level: one is between oil and the surfactantand the other is between the surfactant and water, as observedin the density profile analysis above. At positions far from theinterface, the bulk phase has an interfacial tension value of zeroon average. These two peaks are located within the 90-90interface (between the dashed line and the solid line), determinedfrom the density profile. Furthermore, surfactant 4-C16 has thegreatest distance between these two peaks (∼7.5 Å) comparedwith the other cases (∼4.5 Å), which is similar to the featureof tsurfactant(Table 5). From these results, we believe that theinterfacial tension description of the interface with a surfactantis consistent with that of the 90-90 interface from the densityprofile.
By integrating these profiles, we obtained the interfacialtensions (Table 6). First, to validate our calculation of theinterfacial tension, we simulated the water-vacuum and thedecane-vacuum interfaces which consist of the same number
Figure 4. Density profiles along thez-axis direction.
PN(z) ) F(z)kBT -1
Vslab⟨∑
i,j
zij2
r ij
du(r ij )
dr ij⟩ (5)
PT(z) ) F(z)kBT -1
Vslab⟨∑
i,j
xij2 + yij
2
2r ij
du(r ij )
dr ij⟩ (6)
Molecular Architecture of Alkyl Benzene Sulfonate J. Phys. Chem. B, Vol. 108, No. 32, 200412135
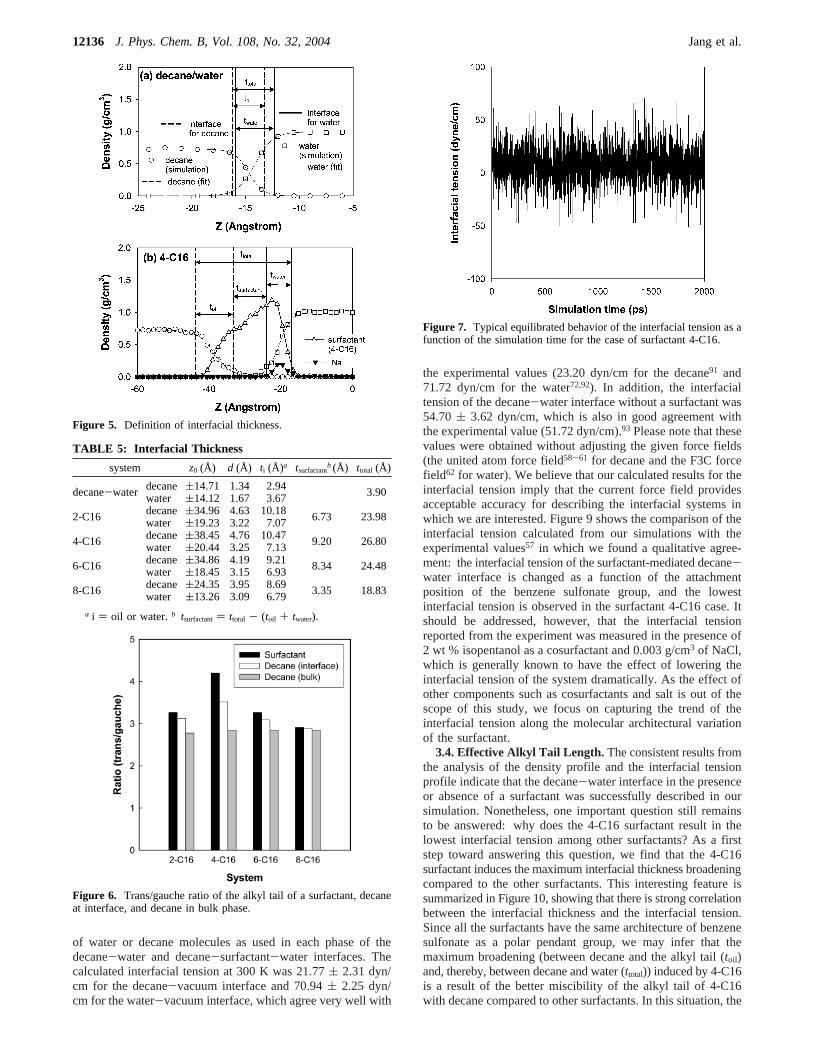
of water or decane molecules as used in each phase of thedecane-water and decane-surfactant-water interfaces. Thecalculated interfacial tension at 300 K was 21.77( 2.31 dyn/cm for the decane-vacuum interface and 70.94( 2.25 dyn/cm for the water-vacuum interface, which agree very well with
the experimental values (23.20 dyn/cm for the decane91 and71.72 dyn/cm for the water72,92). In addition, the interfacialtension of the decane-water interface without a surfactant was54.70( 3.62 dyn/cm, which is also in good agreement withthe experimental value (51.72 dyn/cm).93 Please note that thesevalues were obtained without adjusting the given force fields(the united atom force field58-61 for decane and the F3C forcefield62 for water). We believe that our calculated results for theinterfacial tension imply that the current force field providesacceptable accuracy for describing the interfacial systems inwhich we are interested. Figure 9 shows the comparison of theinterfacial tension calculated from our simulations with theexperimental values57 in which we found a qualitative agree-ment: the interfacial tension of the surfactant-mediated decane-water interface is changed as a function of the attachmentposition of the benzene sulfonate group, and the lowestinterfacial tension is observed in the surfactant 4-C16 case. Itshould be addressed, however, that the interfacial tensionreported from the experiment was measured in the presence of2 wt % isopentanol as a cosurfactant and 0.003 g/cm3 of NaCl,which is generally known to have the effect of lowering theinterfacial tension of the system dramatically. As the effect ofother components such as cosurfactants and salt is out of thescope of this study, we focus on capturing the trend of theinterfacial tension along the molecular architectural variationof the surfactant.
3.4. Effective Alkyl Tail Length. The consistent results fromthe analysis of the density profile and the interfacial tensionprofile indicate that the decane-water interface in the presenceor absence of a surfactant was successfully described in oursimulation. Nonetheless, one important question still remainsto be answered: why does the 4-C16 surfactant result in thelowest interfacial tension among other surfactants? As a firststep toward answering this question, we find that the 4-C16surfactant induces the maximum interfacial thickness broadeningcompared to the other surfactants. This interesting feature issummarized in Figure 10, showing that there is strong correlationbetween the interfacial thickness and the interfacial tension.Since all the surfactants have the same architecture of benzenesulfonate as a polar pendant group, we may infer that themaximum broadening (between decane and the alkyl tail (toil)and, thereby, between decane and water (ttotal)) induced by 4-C16is a result of the better miscibility of the alkyl tail of 4-C16with decane compared to other surfactants. In this situation, the
Figure 5. Definition of interfacial thickness.
TABLE 5: Interfacial Thickness
system z0 (Å) d (Å) ti (Å)a tsurfactantb (Å) ttotal (Å)
decane-water decane (14.71 1.34 2.94 3.90water (14.12 1.67 3.67
2-C16 decane (34.96 4.63 10.18 6.73 23.98water (19.23 3.22 7.07
4-C16 decane (38.45 4.76 10.47 9.20 26.80water (20.44 3.25 7.13
6-C16 decane (34.86 4.19 9.21 8.34 24.48water (18.45 3.15 6.93
8-C16 decane (24.35 3.95 8.69 3.35 18.83water (13.26 3.09 6.79
a i ) oil or water.b tsurfactant) ttotal - (toil + twater).
Figure 6. Trans/gauche ratio of the alkyl tail of a surfactant, decaneat interface, and decane in bulk phase.
Figure 7. Typical equilibrated behavior of the interfacial tension as afunction of the simulation time for the case of surfactant 4-C16.
12136 J. Phys. Chem. B, Vol. 108, No. 32, 2004 Jang et al.
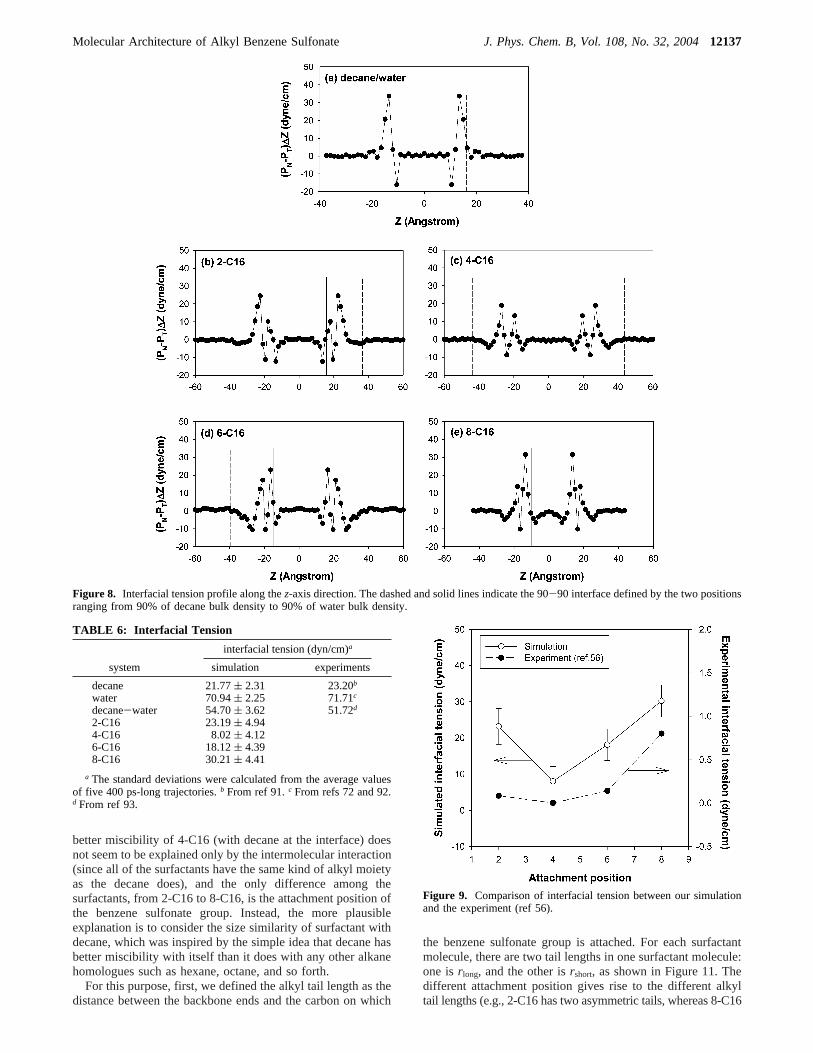
better miscibility of 4-C16 (with decane at the interface) doesnot seem to be explained only by the intermolecular interaction(since all of the surfactants have the same kind of alkyl moietyas the decane does), and the only difference among thesurfactants, from 2-C16 to 8-C16, is the attachment position ofthe benzene sulfonate group. Instead, the more plausibleexplanation is to consider the size similarity of surfactant withdecane, which was inspired by the simple idea that decane hasbetter miscibility with itself than it does with any other alkanehomologues such as hexane, octane, and so forth.
For this purpose, first, we defined the alkyl tail length as thedistance between the backbone ends and the carbon on which
the benzene sulfonate group is attached. For each surfactantmolecule, there are two tail lengths in one surfactant molecule:one isr long, and the other isrshort, as shown in Figure 11. Thedifferent attachment position gives rise to the different alkyltail lengths (e.g., 2-C16 has two asymmetric tails, whereas 8-C16
Figure 8. Interfacial tension profile along thez-axis direction. The dashed and solid lines indicate the 90-90 interface defined by the two positionsranging from 90% of decane bulk density to 90% of water bulk density.
TABLE 6: Interfacial Tension
interfacial tension (dyn/cm)a
system simulation experiments
decane 21.77( 2.31 23.20b
water 70.94( 2.25 71.71c
decane-water 54.70( 3.62 51.72d
2-C16 23.19( 4.944-C16 8.02( 4.126-C16 18.12( 4.398-C16 30.21( 4.41
a The standard deviations were calculated from the average valuesof five 400 ps-long trajectories.b From ref 91.c From refs 72 and 92.d From ref 93.
Figure 9. Comparison of interfacial tension between our simulationand the experiment (ref 56).
Molecular Architecture of Alkyl Benzene Sulfonate J. Phys. Chem. B, Vol. 108, No. 32, 200412137

has almost symmetric ones). Next, we define the “effective”length (Figure 11) to be the difference betweenr long andrshort.This is because the effective tail length of the surfactant whichcontacts the decane molecules may not be necessarily the sameas r long or rshort. In other words, in the surfactant layer at theinterface, a certain space of longer alkyl tails close to theattachment point (Cattach in Figure 11) may not be accessibledue to the steric hindrance from the shorter tail. Therefore, theeffective tail length (reffective) is closer to the true length of thealkyl tail that is accessible for decane (solvent) although itsdegree of freedom is not completely the same as the free alkanemolecule.
Table 7 summarizes the statistical values of the alkyl taillengths. It should be mentioned that for the case of 8-C16 whichhas nearly symmetric tail lengths,r long and rshort are suitablefor comparison with other cases because the two tails havesimilar length and neither of them has a dominant role formixing with decane. Remarkably,reffective of surfactant 4-C16is almost the same as the end-to-end length of decane, and allof the other lengths are farther from the length of decane. Webelieve that this argument rationalizes the reason that surfactant4-C16 has the lowest interfacial tension and the largestinterfacial thickness. This argument seems to be related to the
influence of the alkyl tail length on the mixing entropy at theinterface, and we leave its quantitative assessment for futurestudy.
4. Summary
Using MD simulations, we studied the effect of moleculararchitecture of a surfactant at the decane-water interface as afunction of the attachment position of benzene sulfonate on thehexadecane backbone. For this purpose, we prepared theequilibrated model systems which consist of decane, water bulkphases, plus a surfactant layer at the interface.
The system with surfactant 4-C16 is found to have thesmallest interfacial area (Lx × Ly) compared with the othersurfactants, and the equilibrated molecular conformation of4-C16 was aligned more vertically with the largest ratio ofprincipal axis length of moments of inertia (I3/I1,2). These resultsshow that 4-C16 has more compact packing at the decane-water interface than do the other cases. The interface formationenergy was the lowest for the 4-C16-mediated interface.
The density profiles show that the decane and water bulkphases have their own bulk density, indicating that the systemsize is fairly large enough to describe the interface between bulkphases. Using the 90-90 interface, the interfacial thickness ofthe bare decane-water interface is found to be in goodagreement with experimental observation. It is also observedthat the interface thickness of decane (toil) varies as a function
Figure 10. Relationship between the interfacial thickness and theinterfacial tension. The solid line in (b) is the least-squares fit of thegiven results.
Figure 11. Effective length of the alkyl tail (reffective) of the surfactantthat is defined as the difference between the average length of the longtail (r long) and that of the short tail (rshort).
TABLE 7: Alkyl Tail Length of the Surfactant
system end-to-end length (Å)
decane 9.97( 1.03
r long (Å) rshort (Å) reffective ()r long - rshort) (Å)
2-C16 14.79( 1.43 1.54( 0.03 13.25( 1.434-C16 13.37( 1.35 3.84( 0.19 9.53( 1.366-C16 10.92( 0.96 5.75( 0.46 5.17( 1.078-C16 8.97( 0.76 8.01( 0.60 0.96( 0.97
12138 J. Phys. Chem. B, Vol. 108, No. 32, 2004 Jang et al.
of the attachment position of benzene sulfonate, while the waterinterface was not affected by such structural variation. Fromsuch thickness analysis, we found that surfactant 4-C16 resultsin the maximum interfacial broadening effect among thesurfactants, and the interfacial thickness decreases as theattachment position is located farther from the fourth carbon.The reason might be that the alkyl tail of 4-C16 has bettermiscibility with decane than the other surfactants since theinterfacial thickness is broadened as the miscibility increases.
The interfacial tension profile was calculated along thez-axisdirection (perpendicular to the interface) using the Kirkwood-Buff theory. In each bulk phase for decane and water, theinterfacial tension profile showed a value of zero, indicatingthat the pressure difference (PN - PT) exists only at the interfacebecause of the structural anisotropy. On the contrary, wherethe decane-water interface has a single peak, the surfactant-mediated interface has double peaks, which means that the actualinterface consists of two subinterfaces at the molecular level:one for the decane-surfactant and the other for the surfactant-water. The values of interfacial tension were calculated byintegrating the profiles along thez-axis direction. Through thecomparison among the surfactants, we found that surfactant4-C16 induces the lowest interfacial tension, and the IFTincreases as the attachment position is located farther from thefourth carbon. Therefore, there is a correlation between theinterfacial thickness and the interfacial tension: the interfacialtension decreases as the interfacial thickness (or the miscibility)increases.
To rationalize the difference in the miscibility ofm-C16 withdecane in terms of the size similarity, we introduced the effectivelength of the alkyl tail of each surfactant as the differencebetween the average length of the long tail and of the short tailand compared with the end-to-end length of decane. Theeffective length of the 4-C16 alkyl tail (9.53( 1.36 Å) wasremarkably closer to that of decane (9.97( 1.03 Å) than tothose of the other surfactants, which is consistent with the resultsfrom the density profile and the IFT profile.
Acknowledgment. This research was supported in part bythe Department of Energy (DE-FC26-01BC15362, Paul West).The facilities of the Materials and Process Simulation Centerused for these studies are supported by DURIP-ARO, DURIP-ONR, IBM-SUR, and NSF (MRI), and other support for theMSC comes from MURI-ARO, MURI-ONR, DOE, ONR, NSF-CSEM, NIH, General Motors, ChevronTexaco, Seiko-Epson,Beckman Institute, and Asahi Kasei.
References and Notes
(1) Myers, D.Surfactant Science and Technology; VCH: New York,1946.
(2) Dickinson, E.; Euston, S. R.; Woskett, C. M.Prog. Colloid Polym.Sci.1990, 82, 65.
(3) Interfacial Phenomena in Petroleum RecoVery; Morrow, N. M.,Ed.; Dekker: New York, 1991.
(4) Liquid-Liquid Interface: Theory and Methods; Volkov, A. G.,Deamer, D. W., Eds.; CRC: Boca Raton, FL, 1996.
(5) Rosen, M. J.; Murphy, D. S.Langmuir1991, 7, 2630.(6) Liggieri, L.; Ravera, F.; Passerone, A.J. Colloid Interface Sci.1995,
169, 238.(7) Ferrari, M.; Liggieri, L.; Ravera, F.; Amodio, C.; Miller, R.J.
Colloid Interface Sci.1997, 186, 40.(8) Hansen, F. K.; Fagerheim, H.Colloids Surf., A 1998, 137, 217.(9) Kalinin, V. V.; Radke, C. J.Colloids Surf., A 1996, 114, 337.
(10) Vaughn, M. W.; Slattery, J. C.J. Colloid Interface Sci.1997, 195,1.
(11) Fainerman, V. B.; Miller, R.; Wuestneck, R.; Makievski, A. V.J.Phys. Chem.1996, 100, 7669.
(12) Fainerman, V. B.; Miller, R.; Wuestneck, R.J. Phys. Chem. B1997,101, 6479.
(13) Fainerman, V. B.; Zholob, S. A.; Miller, R.Langmuir 1997, 13,283.
(14) Fainerman, V. B.; Makievski, A. V.; Miller, R.ReV. Chem. Eng.1998, 14, 373.
(15) Ravera, F.; Ferrari, M.; Liggieri, L.; Miller, R.; Passerone, A.Langmuir1997, 13, 4817.
(16) Ravera, F.; Ferrari, M.; Liggieri, L.AdV. Colloid Interface Sci.2000,88, 129.
(17) Mulqueen, M.; Blankschtein, D.Langmuir1999, 15, 8832.(18) Mulqueen, M.; Blankschtein, D.Langmuir2000, 16, 7640.(19) Mulqueen, M.; Blankschtein, D.Langmuir2002, 18, 365.(20) Nikas, Y. J.; Puvvada, S.; Blankschtein, D.Langmuir1992, 8, 2680.(21) Freeman, K.-S. C.; McDonald, I. R.Mol. Phys.1973, 26, 529.(22) Liu, K. S.J. Chem. Phys.1974, 60, 4226.(23) Rao, M.; Levesque, D.J. Chem. Phys.1976, 65, 3233.(24) Miyazaki, J.; Barker, J. A.; Pound, G. M.J. Chem. Phys.1976,
64, 3364.(25) Rao, M.; Berne, B. J.Mol. Phys.1979, 37, 455.(26) Croxton, C. A. Statistical Mechanics of the Liquid Surface;
Wiley: New York, 1980.(27) Lee, C. Y.; Scott, H. L.J. Chem. Phys.1980, 73, 4591.(28) Townsend, R. M.; Gryko, J.; Rice, S. A.J. Chem. Phys.1985, 82,
4391.(29) Wilson, M. A.; Pohorille, A.; Pratt, L. R.J. Phys. Chem.1987, 91,
4873.(30) Brodskaya, E. N.; Rusanov, A. I.Mol. Phys.1987, 62, 251.(31) Matsumoto, M.; Kataoka, J.J. Chem. Phys.1988, 88, 3233.(32) Benjamin, I.J. Chem. Phys.1991, 94, 662.(33) Pohorille, A.; Benjamin, I.J. Chem. Phys.1991, 94, 5599.(34) Harris, J. G.J. Phys. Chem.1992, 96, 5077.(35) Linse, P.J. Chem. Phys.1987, 86, 4177.(36) Gao, J.; Jorgensen, W. L.J. Phys. Chem.1988, 92, 5813.(37) Smit, B.Phys. ReV. A 1988, 37, 3431.(38) Meyer, M.; Mareschal, M.; Hayoun, M.J. Chem. Phys.1988, 89,
1067.(39) Carpenter, I. L.; Hehre, W. J.J. Phys. Chem.1990, 94, 531.(40) Smit, B.; Hilbers, P.-A. J.; Esselink, K.; Rupert, L.-A. M.; van Os,
N. M.; Schlijper, A. G.J. Phys. Chem.1991, 95, 6361.(41) Benjamin, I.J. Chem. Phys.1992, 97, 1432.(42) van Buuren, A. R.; Marrink, S.-J.; Berendsen, H.-J. C.J. Phys.
Chem.1993, 97, 9206.(43) Esselink, K.; Hilbers, P.-A. J.; van Os, N. M.; Smit, B.; Karaborni,
S. Colloids Surf., A 1994, 91, 155.(44) Zhang, Y.; Feller, S. E.; Brooks, B. R.; Pastor, R. W.J. Chem.
Phys.1995, 103, 10252.(45) Michael, D.; Benjamin, I.J. Phys. Chem.1995, 99, 1530.(46) Benjamin, I.Annu. ReV. Phys. Chem.1997, 48, 407.(47) Panhuis, M.-I. H.; Karaborni, S.Philos. Mag. B1999, 79, 9.(48) Diaz-Herrera, E.; Alejandre, J.; Ramirez-Santiago, G.; Forstmann,
F. J. Chem. Phys.1999, 110, 8084.(49) Kuhn, H.; Rehage, H.Colloid Polym. Sci.2000, 278, 114.(50) Nicolas, J. P.Biophys. J.2003, 85, 1377.(51) Rivera, J. L.; McCabe, C.; Cummings, P. T.Phys. ReV. E 2003,
67, 011603.(52) Karaborni, S.; Esselink, K.; Hilbers, P.-A. J.; Smit, B.; Karthauser,
J.; van Os, N. M.; Zana, R.Science1994, 266, 254.(53) Maiti, P. K.; Chowdhury, D.Europhys. Lett.1998, 41, 183.(54) Maiti, P. K.; Chowdhury, D.J. Chem. Phys.1998, 109, 5126.(55) Maiti, P. K.; Kremer, K.; Flimm, O.; Chowdhury, D.; Stauffer, D.
Langmuir2000, 16, 3784.(56) Maiti, P. K.; Lansac, Y.; Glaser, M. A.; Clark, N. A.; Rouault, Y.
Langmuir2002, 18, 1908.(57) Doe, P. H.; Wade, W. H.; Schechter, R. S.J. Colloid Interface
Sci.1977, 59, 525.(58) Siepmann, J. I.; Karaborni, S.; Smit, B.Nature1993, 365, 330.(59) Smit, B.; Karaborni, S.; Siepmann, J. I.J. Chem. Phys.1995, 102,
2126.(60) Martin, M. G.; Siepmann, J. I.J. Am. Chem. Soc.1997, 119, 8921.(61) Nicolas, J. P.; Smit, B.Mol. Phys.2002, 100, 2471.(62) Levitt, M.; Hirshberg, M.; Sharon, R.; Laidig, K. E.; Daggett, V.
J. Phys. Chem. B1997, 101, 5051.(63) Jang, S. S.; Cagin, T.; Goddard, W. A., IIIJ. Chem. Phys.2003,
119, 1843.(64) Jang, S. S.; Molinero, V.; Cagin, T.; Goddard, W. A., IIIJ. Phys.
Chem. B2004, 108, 3149.(65) Mayo, S. L.; Olafson, B. D.; Goddard, W. A., IIIJ. Phys. Chem.
1990, 94, 8897.(66) Calvo, E.; Brocos, P.; Bravo, R.; Pintos, M.; Amigo, A.; Roux, A.
H.; Roux-Desgranges, G.J. Chem. Eng. Data1998, 43, 105.(67) Sastry, N. V.; Valand, M. K.J. Chem. Thermodyn.1998, 30, 929.(68) Trenzado, J. L.; Matos, J. S.; Segade, L.; Carballo, E.J. Chem.
Eng. Data2001, 46, 974.
Molecular Architecture of Alkyl Benzene Sulfonate J. Phys. Chem. B, Vol. 108, No. 32, 200412139
(69) Bjola, B. S.; Siddiqi, M. A.; Fornefeld-Schwarz, U.; Svejda, P.J.Chem. Eng. Data2002, 47, 250.
(70) Kell, G. S.; Haar, L.; Gallagher, J. S.NBS/NRC Steam Tables;Hemisphere Publishing Corp.: Washington, DC, 1984.
(71) Pai, Y. H.; Chen, L. J.J. Chem. Eng. Data1998, 43, 665.(72) Tsierkezos, N. G.; Molinou, I. E.J. Chem. Eng. Data1998, 43,
989.(73) Plimpton, S. J.J. Comput. Phys.1995, 117, 1.(74) Plimpton, S. J.; Pollock, R.; Stevens, M. The Eighth SIAM
Conference on Parallel Processing for Scientific Computing; Minneapolis,MN, 1997.
(75) Verlet, L.Phys. ReV. 1967, 159, 98.(76) Nose, S.; Klein, M. L.J. Chem. Phys.1983, 78, 6928-6939.(77) Nose, S.J. Chem. Phys.1984, 81, 511-519.(78) Hoover, W. G.Phys. ReV. A 1985, 31, 1695.(79) Melchionna, S.; Ciccotti, G.; Holian, B. L.Mol. Phys.1993, 78,
533.(80) Hockney, R. W.; Eastwood, J. W.Computer Simulation using
Particles; McGraw-Hill: New York, 1981.(81) Yoshida, T.; Taga, K.; Okabayashi, H.; Matsushita, K.; Kamaya,
H.; Ueda, I.J. Colloid Interface Sci.1986, 109, 336.
(82) Chapela, G. A.; Saville, G.; Thompson, S. M.; Rowlinson, J. S.J.Chem. Soc., Faraday Trans. 21977, 73, 1133-1144.
(83) Walton, J. P. R. B.; Tildesley, D. J.; Rowlinson, J. S.; Henderson,J. R.Mol. Phys.1983, 48, 1357.
(84) Alejandre, J.; Tildesley, D. J.; Chapela, G. A.J. Chem. Phys.1995,102, 4574.
(85) Rivera, J. L.; Predota, M.; Chialvo, A. A.; Cummings, P. T.Chem.Phys. Lett.2002, 357, 189.
(86) Mitrinovic, D. M.; Tikhonov, A. M.; Li, M.; Huang, Z.; Schlossman,M. L. Phys. ReV. Lett. 2000, 85, 582.
(87) Ono, S.; Kondo, S. InEncyclopedia of Physics; Flugge, S., Ed.;Springer: Berlin, 1960; Vol. 10.
(88) Hill, T. L. Introduction to Statistical Mechanics; Dover: New York,1986.
(89) Kirkwood, J. G.; Buff, F. P.J. Chem. Phys.1949, 17, 338.(90) Chen, L.-J.J. Chem. Phys.1995, 103, 10214.(91) Jasper, J. J.J. Phys. Chem. Ref. Data1972, 1, 841.(92) Alvarez, E.; Rendo, R.; Sanjurjo, B.; Sanchez-Vilas, M.; Navaza,
J. M. J. Chem. Eng. Data1998, 43, 1027-1029.(93) Zeppieri, S.; Rodriguez, J.; de Ramos, A.-L. L.J. Chem. Eng. Data
2001, 46, 1086.
12140 J. Phys. Chem. B, Vol. 108, No. 32, 2004 Jang et al.
Last Revised 9/15/03
C A L I F O R N I A I N S T I T U T E O F T E C H N O L O G Y
D O E C O N T R A C T D E - F C 2 6 - 0 1 B 1 5 3 6 2
D R . W I L L I A M G O D D A R D I I I , P R I N C I P A L
I N V E S T I G A T O R , C A L T E C H
DOE Project: DE-FC26-01BC15362
LOWER COST METHODS FOR IMPROVED OIL RECOVERY (IOR) VIA SURFACTANT FLOODING
ATTACHMENT 2 -- FOR FINAL PROJECT REPORT
LITERATURE REVIEW (Originally Issued as a Supplement to 2nd Annual Report)
PI: William A. Goddard III Co-PI: Yongchun Tang
Senior Staff: Patrick Shuler, Mario Blanco
Postdoctoral Scholars: Seung Soon Jang, Shiang-Tai Lin, Prabal Maiti,
Yongfu Wu, Stefan Iglauer
Sections written by Mario Blanco, Seung Soon Jang, Shiang-Tai Lin, and Patrick Shuler.
Originally issued September, 2003.
California Institute of Technology
September, 2004
DOE SURFACTANT PROJECT -- DE-FC26-01BC15362 ATTACHMENT 2 -- LITERATURE REVIEW OUTLINE A. Introduction to Literature Study B. Background/Historical Overview of Surfactant EOR Processes C. General Comments About Phase Behavior/IFT (Interfacial Tension) D. General Comments About Surfactant Adsorption E. Background on Different Types of Surfactant Candidates F. Selected Literature Data Concerning Chemical Structure and IFT G. Selected Literature Data and Trends About Chemical Structure and Solid Adsorption H. References APPENDIX A. FURTHER LITERATURE IFT DATA APPENDIX B. DETAILS OF ASSEMBLED LITERATURE SURFACTANT ADSORPTION DATA (done as a separate electronic file)
2
A. Introduction to Literature Study This study supported by the Department of Energy is an integrated theoretical and experimental program that seeks to identify chemicals to improve the economics of surfactant flooding enhanced oil recovery. The objective is to identify surfactant chemical formulations that have one or more of these desirable characteristics:
• Need only low concentration to produce ultra-low interfacial tension (IFT), and/or maintain low IFT over a wide span of surfactant concentrations and salinities
• Have lower adsorption to clay/mineral surfaces • Cost less that conventional petroleum sulfonates and work as well • Require little or no co-surfactants • Are “robust” and maintain high efficiency if injected into multiple zones
that vary a bit in temperature, oil properties, brine composition. etc. We focus on the generation of low IFT and having low solid adsorption in these studies as the primary surfactant performance parameters of interest. The overall study approach is to use both literature and generated laboratory experimental IFT and solid adsorption data to provide test cases to tune and challenge the theoretical models being development. The literature review also serves as a guide for systems already investigated, and may suggest some surfactant types not yet considered actively for EOR, but perhaps have attributes that warrant further study for this application. B. Background/Historical Overview of Surfactant EOR Processes Standard Micellar Flood Process “Traditional” surfactant flooding involves the injection of a chemical solution that has water, surfactant, co-surfactant, and salt. Some surfactant formulations include a polymer to build viscosity in the surfactant slug. Normally polymer is included at least as a tapered polymer solution pushing the surfactant slug in order to maintain favorable mobility control and hence achieve good sweep efficiency. One variation of this process was the so-called “Uniflood” process developed by Unocal in the 1960’s and 70’s added oil to the surfactant formulation so to create an oil-external microemulsion. The most common practice in the late 1970’s and early 1980’s was to inject water-external micro-emulsions (no added oil). Results from several field tests have demonstrated that in fact the designed surfactant formulations could produce incremental oil beyond that from a mature waterflood (for example, Borah, 1988 and Cole 1988). This experience has validated laboratory experiments where waterflood residual oil is recovered in controlled conditions. The most common design for these micellar floods to use the so-called “salilnity gradient” approach in which the salinity of the surfactant slug is somewhat lower than that of the oil reservoir, and the salinity of the following polymer drive solution is tapered to be even less. The rationale for this design (discussed further in the next section with reference to phase behavior) is to guarantee that the injected
3
surfactant solution is forced to go through its minimum IFT condition. The lower salinity in the polymer drive slugs aids in remobilizing any surfactant that may be trapped in the reservoir as a higher-salinity microemulsion. Care must be exercised in selecting the make-up brines for the various chemical solutions in order to maintain compatibility and not have any unintended side-effects. For example, if the salinity of the injected polymer solutions is very low, there is the risk of having the reservoir clays swell or migrate and cause some near wellbore plugging (Shuler et. al., 1987) However, the overall economics of this process as first implemented in that time period was not sufficient to warrant wide implementation by the industry, even with crude oil process well over $20/barrel. With the collapse of oil prices in 1986, the interest in surfactant flooding (and most all EOR methods) greatly diminished for some time. More Advanced Variations on the Standard Micellar Flooding Process One interesting and a potentially significant variation in the “traditional” surfactant flooding design is to add alkali to the surfactant formulation. This process has been called ASP (Alkaline-Surfactant-Polymer) flooding, among other things, and came into prominence beginning in the early 1980’s (Shuler, et al., 1989). Increasing the pH of the injected slug(s) can be beneficial towards increasing surfactant efficiency by 1) extracting acidic components (e.g. aliphatic or naphthenic acids) from the crude oil that then act as “natural” surfactants that supplement the injected surfactants, and/or 2) reducing the adsorption of the injected surfactant. The net effect, when properly designed, is to recover as much oil as with the traditional micellar process, but now with less surfactant required. Most commonly, for ASP projects having been implemented in recent field applications, the injected surfactant is a petroleum sulfonate or an alkyl aryl sulfonate surfactant (Meyers, 1992). As explained in more detail later, the increase in pH from adding an alkali creates a net negative charge on the clay surfaces thereby reducing the electrostatic attraction of the main anionic surfactant to be adsorbed onto the clays. There are several possible disadvantages of operating with now a more complicated chemical system because of the addition of an alkaline agent, including: 1) reduced thickening efficiency of (polyacrylamide) polymers, 2) requirement for make-up water to have essentially no hardness (expensive softening needed for injection water), 3) increased chance of inorganic scale deposition for the higher pH conditions, especially calcium carbonate scale, and 4) safety/environmental concerns for handling and applying the alkali chemical, especially if NaOH is selected. Currently, and in the last few years, the most significant (largest volume) chemical flooding projects have been associated with countries outside of the U.S., namely China and Indonesia. Small chemical flooding field projects (predominantly ASP process) have been performed and continue to be applied in the Mid-Continent and Rocky Mountain areas of the U.S. and Canada (Pitts, 2001). One other approach to reduce the cost of chemical EOR has been to consider dilute surfactant flooding. For example, a process developed for North Sea reservoirs has the
4
design of using only low concentrations of surfactant and not include polymer for mobility control (Taugbol et. al., 1995, Austad, 1993). The philosophy is to have a design that will be much less expensive as compared to a conventional surfactant flood process, with the realization that the oil recovery efficiency also will be less. Skauge and Palgren (1989) discuss a series of different types of ethoxylated anionic surfactants that they claim would be suitable for formulation in sea water as a dilute surfactant solution and be suitable for enhanced oil recovery from typical North Sea reservoirs. The more recent application of surfactants for remediation of oil-contaminated soils (removal of NAPL -- nonaqueous phase liquids) may offer some new ideas for EOR applications. Different surfactants have been studied and developed for this particular environmental application (SEAR – Surfactant Enhanced Aquifer Remediation). For example, Jayanti (2001) report research on developing branched alcohol propoxy sulfate surfactants to remove gasoline and diesel from contaminated groundwater. Another approach investigated in recent years has been the development of anionic surfactant formulations that have included a small amount of cationic surfactant, not only for EOR (Wellington, 1993), but also to improve the performance of systems for groundwater clean up (Jayanti, 2001). The paper by Wellington reports significant oil recovery in laboratory tests with much less than the customary amounts of surfactant used in formulations developed up to the mid-1980’s. Kalpakci (1990) is another author who claims obtaining very good efficiency in their surfactant flood designs. Ruan, et. al. (2002) discuss how low IFT may be achieved with a mixture of cationic and anionic s surfactants. They considered DoTEAB/SDS and OTEAB/SDS systems (showed the dodecyltriethylammonium bromide, octyltriethylenammonium bromide, and sodium dodecylsulfate, respectively). The behavior was explained in terms of the change of the mixed micelles composition and symmetry of hydrophobic chains of cationic and anionic surfactants. In a similar vein, there is the suggestion for the addition of a so-called linker molecule to the surfactant formulation (Sabatini, et. al., 2003). Linker molecules are amphiplies that segregate near the microemulsion membrane near the surfactant tail (lipophilic linkers) or the surfactant head group (hydrophilic linkers). The concept of lipophilic linkers was first introduced by Graciaa et al. in 1993. They observed that isooctane microemulsions formulated with ethoxylated octyl phenols mixtures containing 1 or 2 ethoxy groups showed significantly higher oil solubilization capacity than those formulated with more homogeneous mixtures of octylphenols. They proposed that octylphenols with one or two ethoxy groups did not participate at the interface, but rather segregated near the oil/water interface and between the tails of the nonylpnenol surfactants with a higher number of ethoxy groups. The thought is that by these components “linking” the oil molecules and the surfactant tails, that this promotes better solubilization of the excess oil by the main surfactant. Benefits from this action are lower IFT and improved microemulsion fluidity. In addition, Sabatini et. al. (2003) discuss hydrophilic linkers, especially for SEAR type applications. These linkers (for example shorter alkyl chain surfactants) are thought to
5
coadsorb with the surfactant at the oil/water interface, thereby promoting the surfactant-water interaction, but have a poor interaction with the oil phase. The thought is that the hydrophilic linker may open “holes” in the interface (Acosta, 2002). They observed a synergistic effect when combining the lipophilic and hydrophilioc linkers, which further allows an increase in oil solubilization by the surfactant. Yet another tact is to investigate more creative and more cost-effective ways to provide necessary mobility control for surfactant flooding. For example, the concept of using foam for mobility control is attractive. It is conceivable to have a surfactant blend that can provide both improved oil displacement and foam. More fundamental understanding of foam flow would be required to exploit this approach (Radke, 2001) to combine improved water-soluble polymers may become available as well. Yet another idea is to combine the function of a polymer with a surfactant. For example, Cao (2002) reports about polymeric surfactants based on carboxymethyl cellulose and alkyl poly(etheroxy) acrylate were synthesized by ultrasonic irradiation. They report that these solutions can achieve low IFT (approaching 0.001 dyne/cm) if alkali is added, presumably mostly by the action versus the crude oil. C. General Comments About Phase Behavior/IFT (Interfacial Tension) The basics of surfactant phase behavior and IFT is well established, at least for “conventional” EOR surfactants (Morgan 1977). Previous studies (described below) establish several general trends. (1). Pseudoternary Phase Diagrams (Nelson, 1978), Borrel and Schechter, 1988, Kahlweit, et. al., 1989) - Surfactant systems are conveniently displayed on ternary diagrams, with the three compositions considered as brine, oil, and surfactant. Following the nomenclature of Nelson, there may be a Type (II-), Type (III), or Type (II+) phase behavior. For Type (II-) systems the surfactant is predominantly in the water phase in equilibrium with oil (water external microemulsion), whereas in Type (II+) systems, the surfactant partitions predominantly into the oil phase in equilibrium with the brine (oil external microemulsion). The Type (III) condition refers to adding a third, surfactant-rich middle phase that is in equilibrium with external water and oil phases. The lowest overall IFT occurs usually in the Type (III) phase environment. Furthermore, to a first approximation, the minimum overall IFT will occur where there is an equal volume of brine and oil solubilized into this middle phase. This minimum IFT attained is expected to decrease with an increase in the ratio of the volume of solubilized water and oil to the volume of surfactant. That is, all things being equal, the more the uptake volume of water and oil into the middle-phase per volume of surfactant, the lower we expect the IFT. One model envisions the middle phase to consist of alternating layers of oil and water with surfactant at the interfaces (Huh 1979, 1983). Huh offers a theoretical relationship between the solubilization parameter (SP) and the IFT for a middle-phase microemulsion. In particular, there is an expression at “optimal
6
conditions” where the IFT is the same between the microemulsion and water phase, and the microemulsion and the oil phase. IFT = aH cos(π /4) / (SP*2) (1) where aH = a constant SP* = volume of water (or oil)/volume of surfactant in middle phase This condition of equal solubilization of oil and water, or minimum IFT is referred to as an “optimum” condition. For example, if salinity is a variable whose impact on phase behavior/IFT is being examined, when we reach this condition it is called the “optimal salinity” (Lake, 1984). Per above, the larger the SP (the more excess oil and water solubilized by the surfactant), the lower is the IFT. (2). EACN (Equivalent Alkane Carbon Number, Cash 1976) – If one measures the IFT for a surfactant system (at fixed salinity and temperature) versus the chain length of a series of alkanes as the hydrocarbon phase, there is only one hydrocarbon that exhibits desirable ultra-low IFT (of the order of 0.001 dyne/cm). The EACN principle is that molar mixtures of hydrocarbons that produce that same average chain length will also have this very low IFT behavior. The EACN concept is especially useful in surfactant flood design because most crude oils have a unique EACN. One way to use this knowledge, for example, is that one may then screen a number of surfactants using a simple n-alkane (or appropriate mixture) as a good proxy for that crude oil. D. General Comments About Surfactant Adsorption Surfactant retention in the reservoir is perhaps the most significant barrier to the commercial application of this IOR technique (Wu 1996, Taber 1996). The basic problem is that surfactants require good selectivity at oil-water interfaces to generate required IFT, but it is difficult to find the same molecules that then have poor affinity to move to fluid-solid interfaces. There is at least one encouraging field example of low surfactant adsorption; Reppert et. al. (1990) claim less than 0.08 mg/g surfactant retention in the second Ripley surfactant flood test. Four important mechanisms for surfactant adsorption include (Lake, 1989 p. 400): (1). On metal oixide surfaces the surfactant monomer will physically adsorb through hydrogen bonding and ionically bond with cationic surface sites. At and above the CMC the supply of monomer becomes constant, as does the retention. This produces a Langmuir-type isotherm shape and should be reversible with surfactant concentration. (2) In hard brines, the prevalence of divalent cations creates surfactant-divalent complexes. Some complexes such as calcium and sulfonate have a relatively low solubility in the brine and may cause surfactant retention via precipitation (Somasundran 1979).
7
(3) At levels below those required for precipitation, the multivalent cations can complex with surfactant and become a monovalent aqueous complex cation. This monovalent surfactant complex can chemically exchange with cations already bound to the reservoir clays (Hill 1978). (4). If the phase behavior becomes Type (II+), then the surfactant will partition preferentially into the oil phase. Because this is above optimal salinity, the IFT will be relatively high and this surfactant-rich oil phase can become trapped in the pore spaces. The “salinity gradient” design is the common approach to overcome this potential problem; the salinity of the chase polymer is low enough to shift the phase behavior to Type (II-) in the reservoir, thus preventing the phase trapping loss of surfactant. Various factors such as pH, temperature, brine composition, and the type of clay or mineral and surfactant structure all impact adsorption. Increasing pH, for example, can change the surface charge from positive to a negative charge. Thus adding a base to a sulfonate (anionic) surfactant solution, for example, can be beneficial by reducing the adsorption due to electrostatic attraction (mechanism (1)) for sulfonate surfactants. Increasing salinity increases adsorption for all of these mechanisms. Not surprisingly, the surfactant retention on mineral surfaces in sandstone reservoirs is roughly proportional to the weight fraction of clay. In addition, the difference in lab- and field-measured mineral retention is not significant (Goldburg 1983). Thus, there is the prospect that a molecular model (tuned with the right laboratory data) can provide a first-order calculated estimate of retention for surfactant candidates for a specific field condition. Section G has some further discussion about the factors that control surfactant adsorption in conjunction with some examples of literature data. E. Background on Diferent Types of Surfactant Candidates Overview of Types of Surfactant Chemistries Evaluated for EOR A wide variety of surfactants already have been studied as prospects for surfactant flooding. Examples include petroleum sulfonates (Knaggs 1976), alpha-olefin sulfonates (Barakat 1982), dodecyl-o-xylene sulfonate (Austad 1996), diphenyl ether sulfonate (Mannhardt 1987), alkyl propoxy ethoxy glyceryl sulfonate (Michels 1996), alkyl ethoxylated sulfates and sulfonates (Bansal 1978), sulfonated fatty acid esters (Baviere 1991), alkyl aryl ether sulfate and alkyl aryl ether acetate (Andrews 1981), alkyl-propoxy-ethoxy sulfate (Austad 1997), nonyl phenol carboxymethylates, and betain and sulfo-betaine. More recently researchers report propoxylated tridecyl alcohol sodium sulfates and guebert alcohol hydrophobes (Wu 1996). Some further details about different classes of surfactant for improved oil recovery are discussed below.
8
Crude Oil and Petroleum Sulfonates The predominant type of surfactant investigated for EOR has been sulfonated hydrocarbons. “Crude oil sulfonates” refer to products created when a lighter fraction of a crude oil is sulfonated (minimal separation of the crude). The term “petroleum sulfonates” are sulfonates produced when an intermediate molecular-weight refinery stream is sulfonated, whereas “synthetic sulfonates” refers to products when a relatively pure organic compound is sulfonated. Crude oil and petroleum sulfonates have been used for low-salinity situations (less than say sea water salinity, < 3% salt). Of course a particular advantage of these rough cut petroleum-based feedstock materials are that they are lower cost versus using a custom-designed synthetic organic molecule. In addition, petroleum sulfonates certainly can attain low IFT versus common crude oils, and are reported to be chemically stable (Salter 1986). Disadvantages of using these “natural” feedstocks is that quality control becomes a major issue as the detailed composition of the crude oil or refinery cut may change with time. In most particular, for a large EOR project, it would be difficult to supply a large volume of consistent surfactant material. Reasonable EOR candidates have some water solubility, which is imparted by the ionic sulfonate group. The hydrocarbon tail also affects the solubility. As a rough approximation, compounds with 16 or fewer carbons on the hydrocarbon chain are soluble, whereas those with even longer alkyl chains have marginal or no water solubility (Ottewill 1984). Of course the solubility depends not only upon the total salinity, but also its ionic composition. In particular, “hard water” (calcium and magnesium) creates oil soluble components. The characteristics and structure of petroleum sulfonates suitable for EOR depends upon the chemical composition of the feedstock, degree of sulfonation, and the average number of sulfonate groups attached to each molecule. Example feedstocks present in refineries and then sulfonated to create EOR surfactants include white oil, fractionated gas oil, vacuum gas oil, and lube-oil extract. Typical petroleum sulfonates contain unreacted oil, the sodium salt of the sulfonated hydrocarbon (provided it is neutralized with sodium hydroxide), and sodium sulfate from the neutralization of the excess sulfuric acid used in the sulfonation process (Salter 1986). Molecular weights of the feedstocks range from 350 to 450, but may vary from these values, with significant outliers on both ends. When the feedstock contain polyaromatics (more than one ring per molecule), these materials often are polysulfonated. The parameters of interest to characterize these materials include the equivalent weight (molecular weight divided by the number of sulfonate groups), and the percentage of the sulfonated material that is polysulfonate. As a rule of thumb, petroleum sulfonates with equivalent weights above 450 are not easily water soluble, whereas those smaller are water soluble (Gale and Sandvik 1973).
9
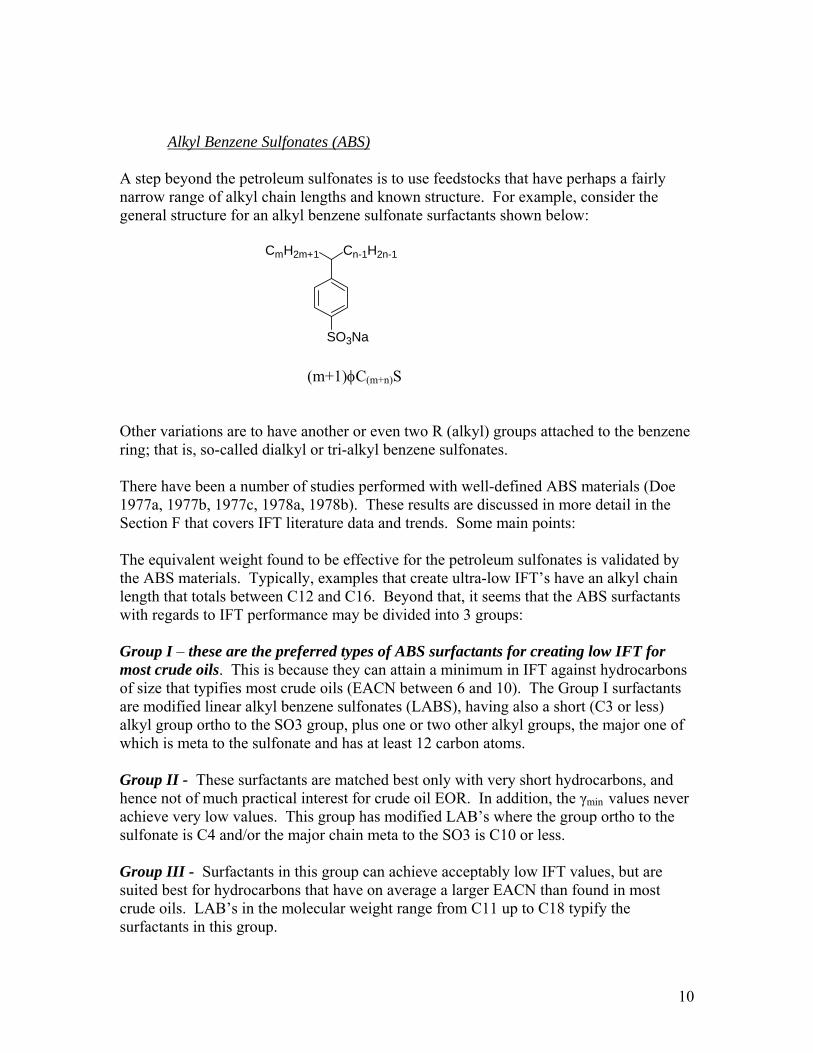
Alkyl Benzene Sulfonates (ABS) A step beyond the petroleum sulfonates is to use feedstocks that have perhaps a fairly narrow range of alkyl chain lengths and known structure. For example, consider the general structure for an alkyl benzene sulfonate surfactants shown below:
Cn-1H2n-1CmH2m+1
SO3Na (m+1)φC(m+n)S
Other variations are to have another or even two R (alkyl) groups attached to the benzene ring; that is, so-called dialkyl or tri-alkyl benzene sulfonates. There have been a number of studies performed with well-defined ABS materials (Doe 1977a, 1977b, 1977c, 1978a, 1978b). These results are discussed in more detail in the Section F that covers IFT literature data and trends. Some main points: The equivalent weight found to be effective for the petroleum sulfonates is validated by the ABS materials. Typically, examples that create ultra-low IFT’s have an alkyl chain length that totals between C12 and C16. Beyond that, it seems that the ABS surfactants with regards to IFT performance may be divided into 3 groups: Group I – these are the preferred types of ABS surfactants for creating low IFT for most crude oils. This is because they can attain a minimum in IFT against hydrocarbons of size that typifies most crude oils (EACN between 6 and 10). The Group I surfactants are modified linear alkyl benzene sulfonates (LABS), having also a short (C3 or less) alkyl group ortho to the SO3 group, plus one or two other alkyl groups, the major one of which is meta to the sulfonate and has at least 12 carbon atoms. Group II - These surfactants are matched best only with very short hydrocarbons, and hence not of much practical interest for crude oil EOR. In addition, the γmin values never achieve very low values. This group has modified LAB’s where the group ortho to the sulfonate is C4 and/or the major chain meta to the SO3 is C10 or less. Group III - Surfactants in this group can achieve acceptably low IFT values, but are suited best for hydrocarbons that have on average a larger EACN than found in most crude oils. LAB’s in the molecular weight range from C11 up to C18 typify the surfactants in this group.
10
More recently, Bolsman and Daane (1986) report a systematic study of the effect surfactant structure for a series of alkylxylenesulfonates on phase behavior. These materials are from the Enordet LXS series of surfactants manufactured by Shell, with products containing linear alkylxylenesulfonates with a 1,2,-dimethyl-4-alkylbenzenesulfonate isomer content of approximately 93%. They noted several parameters all contributed to the phase behavior: especially the MWD (molecular weight distribution), the aromatic substitution pattern, and the presence of a particular cosurfactant, Enordet 3ES. The Enordet 3ES was included to boost salt tolerance, and is represented by: CnH2n+1 (O-CH2-CH2)3OSO3Na Where n=12 through 15. They found that the SP (solubilization parameter) can be increased by making the MWD of the surfactant wider and by adding the Enordet 3ES cosurfactant. (Recall that increasing the SP is expected to decrease the IFT, and hence is a desirable outcome). Another desirable feature is the reduced sensitivity of the optimal salinity to changes in the temperature. A disadvantage of this strategy, however, is that the very low IFT region may occur only a narrow range of conditions. They conclude that while certain phase behavior/IFT performance parameters can be influenced more or less independently of each other, translation into the efficiency of oil recovery with such blends required further study. Adsorption losses of the surfactant of course is another important operating parameter. One of the generalizations is that the adsorption of the sodium alkylbenzenesulfonates is dependent upon the molecular structure; it is a common observation that the plateau in adsorption can be roughly related to the molecular weight. For example, Li (1996) presents data showing the greater maximum adsorption for a series of alkylbenzenesulfonates for those surfactants having a longer alkyl chain length.
Apha-Olefin Sulfonates One variation from the more common surfactants alkylbenzenesulfonates (ABS) are alpha-olefin sulfonates which do not contain an aromatic ring (Barakat, 1982). One investigation considered the use of alpha-olefins at high temperatures and in brines with elevated salinity (Baviere, 1988). The use of cosolvent enables aqueous solutions to be prepared with concentrated brine, even at high divalent cation levels. But the chemical stability of some solutions can be affected by their sensitivity to the oxidation of unsaturated components, resulting in a decrease of the pH. Precautionary measures to stabilize the solutions are stressed – i.e. maintain an anaerobic environment, provide an alkaline pH, or addition of the correct alcohol. These surfactants can achieve low interfacial tensions (IFT’s) and high solubilization parameters at high salinity and divalent cation content. Properties of optimal formulations have been investigated as a function of surfactant and cosolvent molecular weight and brine composition.
11
The study by Baviere also inclided measurements of adsorption of these surfactants onto Na- and Ca- kaolinite. In NaCl solutions, the amount of sulfonate adsorbed increased slightly with salinity. Preliminary measurements in hard water are shown to bring out the specific effects of calcium ions. From these results the authors concluded that the alpha-olefin sulfonates are viable candidates for enhanced oil recovery applications.
Alkene Sulfonic Acids -- One-Step Alkylation and Sulfonation Sulfonated alkyl aromatics have been reported as being suitable for EOR just recently, and in fact these have seen use in some small field projects (Berger, 2000 and 2002). These are different structures in that the sulfonate group is attached to the alkyl chain as opposed to the benzene ring. In contrast, the usual alkyl benzene sulfonates, the alkyl group is coupled to an aromatic ring which now has an attached sulfonate group. One advantage claimed for this newer type of surfactant is that it is easier and therefore perhaps cheaper to make, and still can achieve low IFT (U.S. Patent 6,043,391). This newer family of anionic surfactants are derived from the reaction of benzene or its alkyl substituted forms, with olefin sulfonic acid. This becomes a one step process to accomplish the alkylation and sulfonation without using conventional alkylation processes and catalysts. This approach also has the advantage of allowing manufacture of some different molecules such as disulfonated alkylaromatics of the gemini-type structure can be produced. In addition, sulfonates of very viscous, high molecular weight aromatics may be prepared.
Ethoxylated and Propoxylated Anionic Surfactants Alkylbenzene- Ethoxylated Sulfonates:: Skauge and Palgren (1989) describe detailed phase behavior and solution properties of 46 different ethoxylated anionic surfactants. In particular, they conduct these tests in mixtures of NaCl brine and heptane at a water/oil ratio of 2. The influence of changes in the lipophilic structure or degree of ethoxylation on the formation of multi-phase microemulsions was studied. Specifically, they studied alkyl- and alkylbenzene- ethoxy sulfonates with different chain length, branching and degree of ethoxylation. Nonylbenzene and dodeylbenzene surfactants are tested with both ethoxy sulfonate and ethyl methylcarboxylate as the hydrophilic head group. They focused on the solubility of the ethoxylated anionics in brine equivalent to seawater salinity, is characterized at 22 C (of interest since typical of injection water conditions for a North Sea application). Phase behavior studies were performed at 90 C, again with the idea of mimicking a North Sea application.
12
Some key findings include: 1) the width of the salinity window and the gel free area are inversely proportional to the solubilization parameter, 2) branching of the alkyl chain reduces the optimal salinity and also the solubilization parameter, 3) sulfonates show higher solubilization than the methylcarcoxylates with a similar lipophilic group, 4) at a low degree of ethoxylation the solubilization parameter increases, while the optimal salinity decreases. Further ethoxylation lowers the degree of solubiliozation and increases the optimal salinity.
Alcohol Ethoxylated Sulfonates: One study (Michels, 1996) examined the possibility of using sulfonate instead of sulfate versions of propoxy ethoxy types of surfactants. These have shown promise for EOR applications (Gale, 1981, 1992). Their study had the objective to demonstrate the viability of surfactant systems for application for North Sea reservoirs. In this case the requirements are a bit different; namely the objective was to develop low IFT with a low concentration of surfactant in order to decrease the cost, and also perform at North Sea elevated reservoir temperatures and seawater salinities. This requirement for stability at elevated temperatures in these reservoirs (perhaps 100 C or even more). Thus Michels et. al. investigated changing from a sulfate to a sulfonate head group. This change required adding a spacer in the molecule between the ethoxy and the sulfonate group for which a glycerol was selected, thus ending up with an alkyl propoxy ethoxy glycerol sulfonate surfactant. The strategy they further developed was not to include a polymer for mobility, but include some sacrificial agents to mitigate against excess adsorption losses. A theoretical economic analysis indicated that this process potentially could have favorable economics. Another study (Austad, 1993) focused on the retention of ethoxylated sulfonate surfactants during a Norwegian supported research program about enhanced oil recovery. Thus, the focus of these studies are for applications for North Sea reservoirs. In particular, they considered nonylphenyl-type surfactants
C9-Ph-(EO)x-SO3-
where x = 2 – 9 Another loss mechanism considered is the stability of these surfactants to exposure to typical reservoir conditions for some months. Tests indicated no significant degradation at 80 C during a period of 150 days in a anaerobic sea-water solution. The plateau adsorption on kaolinite was found to decrease as the degree of ethoxylation increases, except at very low concentrations where that trend is reversed (Austad, 1991). Another observation is a decrease in the plateau adsorption level with an increase in the pH.
13
Wang et. al.(2001) propose the use of a surfactant structure with both nonionic and anionic hydrophilic groups. Specifically, they examined the characteristics of ether caxhoxylated surfactants. The structure formula is as follows: C9H19-Ph-O- (CH2CH2O)8 – CH2COONa The notion is that this combination will overcome some of the deficiencies of either surfactant type by itself. Nonionic surfactants and anionic surfactants will salt out because of cloud point phenomena and high salinity, respectively. They claim this surfactant type is soluble in 30% NaCl brine and shows good surface activity in brine with 100,000 mg/l salinity that includes 5,000 mg/l of calcium. These workers found that by itself, the ether caxhoxylated surfactants (LF) was not able to create a low IFT. Similarly, the petroleum sulfonates tried did not make a low IFT with a brine/n-decane test system. By adjusting the proportion of the LF and petroleum sulfonate in a combined system, water/n-decane IFT’s could be low, even with high salinity systems. Luciani et. al.(2001) studied the adsorption tendencies for three anionic surfactants of the sodium nonylphenolpolyethoxy sulfate type: nonylphenol ethoxy(4) sulfate (NPE4S), nonylphenol ethoxy(10) sulfate (NPE10S), and nonylphenol ethoxy(25) sulfate (NPE25S). Three adsorbents examined were alumina, kaolinite, and a natural, crushed quartz. As would perhaps be expected, the adsorption decreases with an increase in the number of ethoxy groups (as increase water solubility/HLB). For kaolinite, as the pH increases above the 4 – 5 range for NaCl the adsorption is quite low because the kaolinite has a net negative charge. In contrast in the presence of calcium chloride solutions, the adsorption occurs at even these lower pH conditions because it changes the zeta potential of the kaolinite surfaces. The adsorption of these anionic surfactants seem to be mainly driven by the interaction of the anionic group with the surface; adsorption occurs only if the surface charge is positive. On the other hand, the final structure of the adsorbed phase at saturation is governed by the ethoxy chain length, as for non-ionic surfactants. In particular, the apparent area per molecule at the plateau adsorption level follows the same trends (as a function of ethoxy number) as that followed by non-ionic surfactants. Alcohol Ethoxylated and Propoxylated Sulfates: Sumwoo and Wade (1992) report about a series of alkyl ethoxylate surfactants that they claim are superior with respect to the requirement for minimal cosurfactant, or even the elimination of the need for a cosurfactant. This points out of the general advantages of was the alkyl ethoxylated (EO) or propoxylated (PO) anionic surfactants is that the same molecule with multiple hydrophobic and hydrophilic groups has some chance of being effective as a stand alone surfactant. In particular, Sunwoo and Wade examined C14 and C16 Guerbet alcohol sulfates. These investigators found the C14 Guerbet alcohol sulfates in fact functioned well without
14
cosurfactant whereas the C16 type was more restrictive in its use by itself. The Guerbet alcohols (the R alkyl chain portion of the surfactant) are branched approximately at the mid-carbon location. Note the expected trends with regards to hydrophobe structure (Abe, 1986, and Graciaa, 1981): Twin tail surfactants 1) prefer to micellize in the oil phase. 2) produce low values of SP at optimum salinity. 3) do not have particularly low IFT at optimum conditions 4) have minimal cosurfactant requirements. Single tail surfactants 1) prefer to micellize in the aqueous phase 2) produce high values of SP at optimum conditions 3) can have low values of IFT at optimal conditions 4) have high cosurfactant requirements to avoid forming liquid
crystal phases in the microemulsion phase. Another interesting feature with these surfactants is that their anionic character seems to control the phase with shorter EO chains, whereas with perhaps 3 or more EO groups, the nonionic behavior begins to dominate. In addition, for the C14(PO) sulfate surfactant evaluated, these molecules all showed more of anionic character. Thus EO units function as hydrophiles and PO units function as hydrophobes. The difference between linear and branched hydrocarbon chains carries over to other surfactant systems as well. For example, Chattopadhyay (1993) considers surfactant molecules that have similar head groups and chain lengths of which one is comprised of linear alkyl chains and the other of branched hydrocarbon chains (diethanolamine derivatives of n-alkyl as well as polyisobutylene succinic anhydride). Measurements of a deep channel surface viscometer showed that contrary to the surfactants with linear hydrocarbon chains, the monolayers of the surfactants with branched hydrocarbon chains were more liquid like. The surfactants with linear hydrocarbon chains exhibited increased viscosity in the presence of NaCl in the aqueous sub-phase whereas a significant drop in viscosity was observed with the surfactant comprising branched hydrocarbon chains. This is consistent with the general idea that using surfactants that are more branched are less likely to have problems with regards to forming undesirable liquid crystals and thus viscous microemulsion phases that are difficult to transport in porous media. One study (Osterioh, 1992) reports the results of laboratory experiments designed to test the efficacy of polyethylene glycols, PEG’s, in reducing the adsorption of optimized PO/EO surfactants onto clays. Their results show the addition of PEG-1000 to such a microemulsion could reduce the measured surfactant adsorption onto Berea sandstone by a factor of four. PEG-1000 is a polyethylene glycol with an average molecular weight of 1000 manufactured by Union Carbide. In addition, oil recoveries were the same or improved with smaller volumes of injected surfactant. Another interesting feature is that this was designed for a high salinity connate brine (almost 200,000 mg/l total dissolved
15
solids). The authors claim that the economics for including the polyethylene glycol is a net favorable approach. Branched alcohol propoylated sulfates have emerged as an effective type of surfactant for the removal of nonaqueous phase liquids (NAPLs) from near surface, contaminated sites (Jayanti et. al., 2002). This application to remediate shallow subsurface aquifers (so-called SEAR -- surfactant-enhanced aquifer remediation) by injecting a surfactant solution is a relatively recent spin-off technology from conventional surfactant EOR. These propoxylated sulfate surfactants also may be tailored to achieve middle-phase micoemulsions versus crude oils, and presumably low interfacial tension (Aoudia, 1995). Minana-Perez et. al. (1995) found they could custom design surfactants as mixtures of ethoxylated and propoxylated products to provide optimum performance versus a given oil and process conditions. The addition of an intermediate polarity polypropylene oxide chain inserted between conventional lipophilic and hydrophilic groups makes an “extended” surfactant that may improve solubilization of water and oil. Jayanti et. al. (2002) claims there are special advantages of the alcohol propoxylated sulfates in terms of having acceptable environmental properties, low viscosity middle-phases, excellent solubilization of the NAPL contaminants, and fast coalescence times. In addition, the starting materials such as the branched alcohols may be fairly common, relatively low cost materials. These authors also recommend branched chain molecules versus straight chain ones. Straight chain surfactants are more prone to form liquid crystals and thus require higher cosolvent concentrations in order to break these relatively rigid structures. In contrast, branched chain molecules require less cosolvent and also increase the range of electrolyte concentrations over which Type III, middle-phase microemulsion behavior is observed.
Carboxymethyl Ethoxylates Carboxymethyl ethoxylate (CME) surfactants have the general structure of
R-O-(CH2CH2O)n-CH2COONa It is expected that the proper choice of R and n would result in good surfactant performance in enhanced oil recovery. Huls Chemical Co. of Germany is one commercial source of these surfactants. These surfactant generally have good thermal stability and high electrolyte tolerance, and have been demonstrated to have moderate potential for use in EOR (Balzer and Kosswig, 1979, and Balzer 1982) One DOE report (Stryker, 1990) discusses an investigation of six ethoxylated methylcarboxylates in which the salinities tested were at the high range (10 – 30% sodium chloride) of what is expected in oil reservoirs. Temperatures in this study ranged from about 25 – 100 C, and hydrocarbon phases ranged from hexane to dodecane. Only one product (code name J-6) was found that could produce consistent three-phase behavior at these test conditions without including a cosurfactant. It created oil/water IFT values as low as 0.1 dyne/cm. Other surfactants where a co-surfactant was included
16
managed to make somewhat lower IFT values, with the lowest reported value of about 0.05 dyne/cm. One interesting and useful feature is that if the pH is near the pKa, of the CME surfactant, it may maintain its lower IFT value over a wider salinity range. One study (Chiu and Hwang, 1987) indicated that oil solubilization (an indicator of IFT is proportional to the surfactant micellar size. An electrode measurement showed significant interaction between the surfactant and counter-ions, that did in fact indicate a large surfactant micelle. A commercial sample from Huls with an R group of C9H19 – (C6H4) and n=4 ethoxy groups showed good oil recovery capability. One important parameter affecting the properties of the behavior of these carboxylate-containing surfactants is the pH. At low pH, these surfactants will be as a carboxylic acid, whereas at slightly acid conditions or higher pH, this becomes an anionic carboxylate surfactant. Phase behavior studies with branched tail ethoxylated carboxylated surfactants did show a considerable effect of pH on the salinity requirement to create middle-phase microemulsions (Masahiko, 1987). At 60 and 70 C, alcohol-free optimal three-phase microemulsion systems could be formed with all of alkanes studied over the entire pH range of 6 – 12. At lower temperatures and higher pH values, liquid crystals were found to form in systems which contained lower molecular weight alkanes. For example, with branched tail EO sulfonates at 40 C, liquid crystals form with tetradecane and hexadecane, but are absent with the presence of octane, decane, and dodecane. The shift in optimal salinity observed with a pH of below 9 is due to the change in the ratio of the acid form to salt form of the carboxylate head group increases with a decrease in pH, especially at pH values close to pKa of the acid. The acid form being more oil soluble, while the salt form is more water soluble, causes the mixture to alter dramatically the a greater overall water solubility of the surfactant. This has the effect of increasing the salinity required to create a middle phase microemulsion. The solubilization parameters are almost independent of the pH, although slight increases are observed with decreases in pH.
Ligonsulfonates Ligonsulfonates are a broad class of wood-based chemicals made from the spent liquor generated in the sulfite pukping process. Thermal degradation and sulfonmation reactions that take place during the cooking of wood convert high molecular weight native lignion into a water-soluble polydisperse anionic polyelectrolyte with molecular weight varying from 1000 to 20,000. The functional groups that provide a high content of different polar groups make it miscible in all proportions with water. Experiments have demonstrated that ligonsulfonates either alone (Bansel, 1979) or with petroleum sulfonates (Kumar, 1984) can improve oil recovery. Further improvements in the performance of these products has been explored, such as modifying the ligonsulfonates by copolymerization with propylene oxide (Hornof, 1990). They demonstrated a marked increase in interfacial activity with increasing degree of propxylation, to the order of 0.1 dyne/cm. One useful feature is the increase in the
17
optimal salinity with the propxylated products versus a ligonsulfonate/petroleum sulfonate synergistic mixture (Son, 1982).
N-acyl-N-methylamide and Carboxylate Groups
The simultaneous presence of N-acyl-N-methylamide and carboxylate groups in the surfactant molecule produces some unique interfacial properties in aqueous media (Tsubone, 2001). They are ascribed to the steric effect of hydrogen bonding between the two groups. Evidence for this includes trend of increasing pH in the vicinity of the cmc and observing greater cmc values by conductance than by surface tension. The motivation for this study is that there some surfactants with both groups that are used in cosmetic products because of their good foaming power and mildness to skin. Phosphate Surfactants Other types of potential surfactant would be those containing phosphorous. In particular, some work already has been done to examine the inclusion of phosphate ester surfactants (Halbert, 1971) for EOR applications. This author was able to make some formulations containing 4 – 8 percent surfactant concentration solutions (using BASF Wyandotte, KLEARFAC AA-420 phosphate ester). One advantage of this anionic product is that it is a biodegradable liquid. Other experiments also have examined phosphate ester surfactants as possible cosurfactants to increase the salt tolerance of petroleum sulfonate surfactants (Shankar, 1982). These authors considered a petroleum sulfonate blend (Stepan Chemical Petrostep 465/420) then combined with commercially available ethoxylated and other cosurfactants. The petroleum sulfonates may exhibit a salinity tolerance of only about 1 – 2% NaCl. Adding phosphate esters (Wayfos systems) in creased significantly the maximum allowable salinity for clear microemulsion solutions. Another potential advantage of phosphate ester or similar chemistries for an EOR surfactant is that the adsorption may be decreased. Previous studies point in particular to the decrease in petroleum sulfonates and “normal” surfactants in the presence of phosphate ions (adding phosphate salts) can be beneficial (Somasundaran, 1979). Bis(ethylhexyl) hydrogen phosphate (HDEHP) and sodium bis(2-ethylhexyl)phosphate (SDEHP) have been recently as agents to create microemulsions (Steytler, 1996 and Kurumada,1995). These authors note that this phosphate has some similarity to AOT (sodium bis(2-ethylhexyl) sulfosuccinate), a surfactant that is known to be very efficient in stabilizing water-in-oil microemulsions (Tapas, 1995). The ammonium salt of HDEHP has been found to stabilize water-in-oil emulsions producing, for most oils, a single-phase region which is more extended than that usually obtained with AOT. NH4DEHP is more stable than AOT and may be a better choice for applications at elevated pH. The studies by Steytler and Kurumada focused mostly on the structure of the microemulsions created and did not consider the potential application of these phosphate surfactants as EOR agents.
18
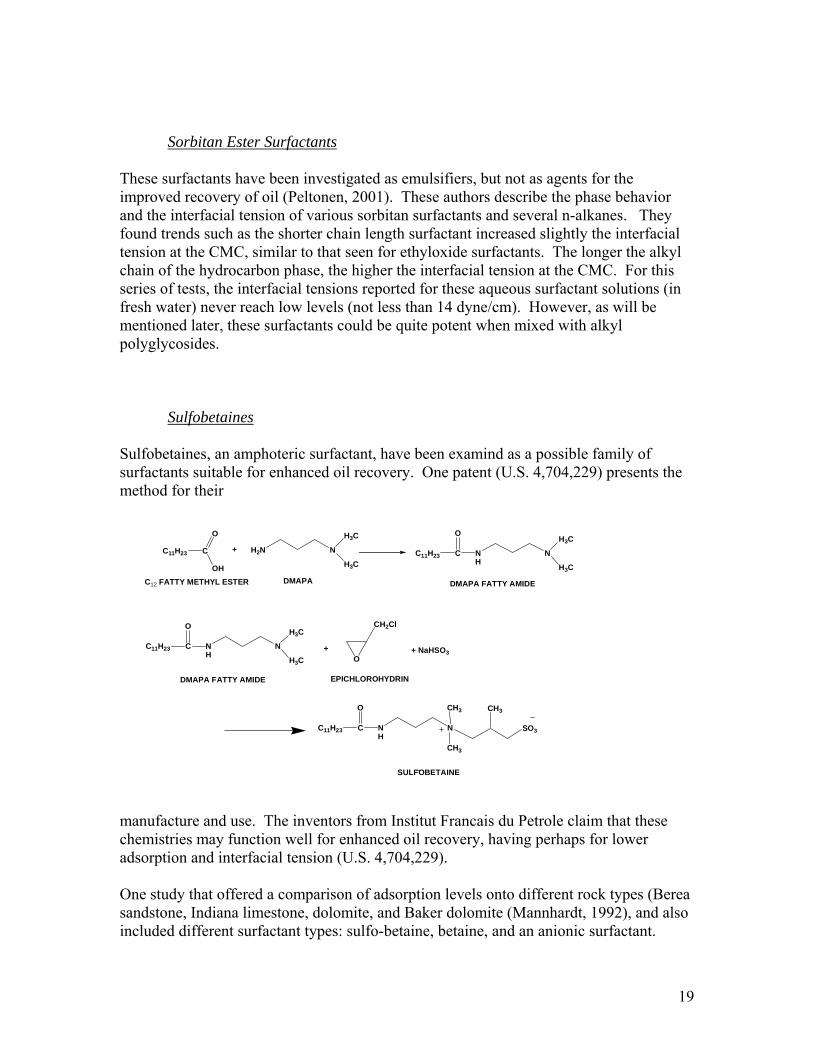
Sorbitan Ester Surfactants
These surfactants have been investigated as emulsifiers, but not as agents for the improved recovery of oil (Peltonen, 2001). These authors describe the phase behavior and the interfacial tension of various sorbitan surfactants and several n-alkanes. They found trends such as the shorter chain length surfactant increased slightly the interfacial tension at the CMC, similar to that seen for ethyloxide surfactants. The longer the alkyl chain of the hydrocarbon phase, the higher the interfacial tension at the CMC. For this series of tests, the interfacial tensions reported for these aqueous surfactant solutions (in fresh water) never reach low levels (not less than 14 dyne/cm). However, as will be mentioned later, these surfactants could be quite potent when mixed with alkyl polyglycosides.
Sulfobetaines Sulfobetaines, an amphoteric surfactant, have been examind as a possible family of surfactants suitable for enhanced oil recovery. One patent (U.S. 4,704,229) presents the method for their
C11H23 C
OH
O
NNH
H3C
H3C
CC11H23
O
DMAPA
NH2N
H3C
H3C
O
CH2Cl
NNH
CC11H23
O
SO3
CH3CH3
CH3
NNH
H3C
H3C
CC11H23
O
C12 FATTY METHYL ESTER DMAPA FATTY AMIDE
+
DMAPA FATTY AMIDE
+ + NaHSO3
EPICHLOROHYDRIN
SULFOBETAINE
manufacture and use. The inventors from Institut Francais du Petrole claim that these chemistries may function well for enhanced oil recovery, having perhaps for lower adsorption and interfacial tension (U.S. 4,704,229). One study that offered a comparison of adsorption levels onto different rock types (Berea sandstone, Indiana limestone, dolomite, and Baker dolomite (Mannhardt, 1992), and also included different surfactant types: sulfo-betaine, betaine, and an anionic surfactant.
19
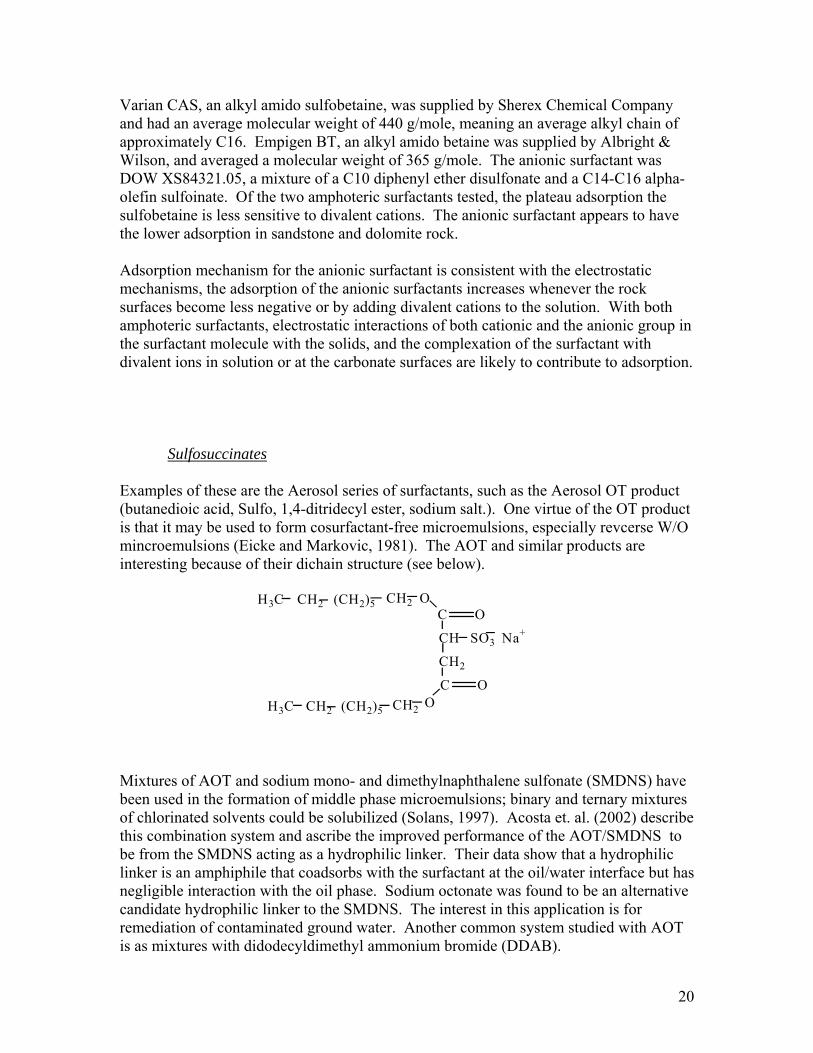
Varian CAS, an alkyl amido sulfobetaine, was supplied by Sherex Chemical Company and had an average molecular weight of 440 g/mole, meaning an average alkyl chain of approximately C16. Empigen BT, an alkyl amido betaine was supplied by Albright & Wilson, and averaged a molecular weight of 365 g/mole. The anionic surfactant was DOW XS84321.05, a mixture of a C10 diphenyl ether disulfonate and a C14-C16 alpha-olefin sulfoinate. Of the two amphoteric surfactants tested, the plateau adsorption the sulfobetaine is less sensitive to divalent cations. The anionic surfactant appears to have the lower adsorption in sandstone and dolomite rock. Adsorption mechanism for the anionic surfactant is consistent with the electrostatic mechanisms, the adsorption of the anionic surfactants increases whenever the rock surfaces become less negative or by adding divalent cations to the solution. With both amphoteric surfactants, electrostatic interactions of both cationic and the anionic group in the surfactant molecule with the solids, and the complexation of the surfactant with divalent ions in solution or at the carbonate surfaces are likely to contribute to adsorption. Sulfosuccinates Examples of these are the Aerosol series of surfactants, such as the Aerosol OT product (butanedioic acid, Sulfo, 1,4-ditridecyl ester, sodium salt.). One virtue of the OT product is that it may be used to form cosurfactant-free microemulsions, especially revcerse W/O mincroemulsions (Eicke and Markovic, 1981). The AOT and similar products are interesting because of their dichain structure (see below).
H3C (CH2)5CH2 CH2 OC O
CH2
CH SO3
CH2 OC O
Na+
H3C (CH2)5CH2 Mixtures of AOT and sodium mono- and dimethylnaphthalene sulfonate (SMDNS) have been used in the formation of middle phase microemulsions; binary and ternary mixtures of chlorinated solvents could be solubilized (Solans, 1997). Acosta et. al. (2002) describe this combination system and ascribe the improved performance of the AOT/SMDNS to be from the SMDNS acting as a hydrophilic linker. Their data show that a hydrophilic linker is an amphiphile that coadsorbs with the surfactant at the oil/water interface but has negligible interaction with the oil phase. Sodium octonate was found to be an alternative candidate hydrophilic linker to the SMDNS. The interest in this application is for remediation of contaminated ground water. Another common system studied with AOT is as mixtures with didodecyldimethyl ammonium bromide (DDAB).
20
Sulfonated Fatty Acid Esters Baviere et al. (1991) present a study of various sulfonated fatty esters as candidates for EOR. Their general formula are CH3 – (CH2)n-3 –CH(SO3Na)-COOR where n=16 (palmitic acid), 18 (stearic acid) or 22 (behenic acid) and R is usually a short alkyl group. The particular emphasis is on designing micellar chemical systems that are suited for oil recovery in reservoirs typical of the North Sea conditions. One limitation of these surfactants is due to their chemical structure, as these are subject to hydrolysis, which increases rapidly above 50 C. The pH sensitivity of the reaction is much less pronounced around neutral pH. In addition, the rate of hydrolysis is perhaps slower in sea water because of the buffering effect of its substantial bicarbonate concentration. As expected, increasing the molecular weight of both the hydrophobic part and the alcohol group creates a decrease of optimal salinity. The highest solubilization of excess oil and water at optimal conditions is associated with a combination of the longest fatty acid chains with the shortest alcohol groups. The IFT follows the relationship of Huh (1979 and 1983), Equation (1), whereby the IFT is inversely proportion to the solubilization ratio. The constant calculated by Baviere (1991) for this relationship is 0.41 mN/m, which is very close to the value of 0.48 mN/m reported for alkylbenzene sulfonates, 0.34 mN/m for ethoxlated alkylphenols, and 0.40 mN/m for alpha-olefin sulfonates (Barakat, 1982). Adsorption studies with various sulfonated fatty esters were conducted on kaolinite clay (Baviere, 1991). The plateau value of surfactant adsorption is moderate with low and medium NaCl salinities, but increases in the presence of calcium and magnesium ions. Assuming a linear variation of adsorption with salinity, the influence of the divalent ion cannot be explained by the ionic-strength effect alone. The adsorption at the plateau has been shown to increase with the surfactant hydrophilicity, expressed in terms of optimal salinity or critical micelle concentration, decreases. Taurates These products have appeared in the literature for use in enhanced oil recovery, at least at
21
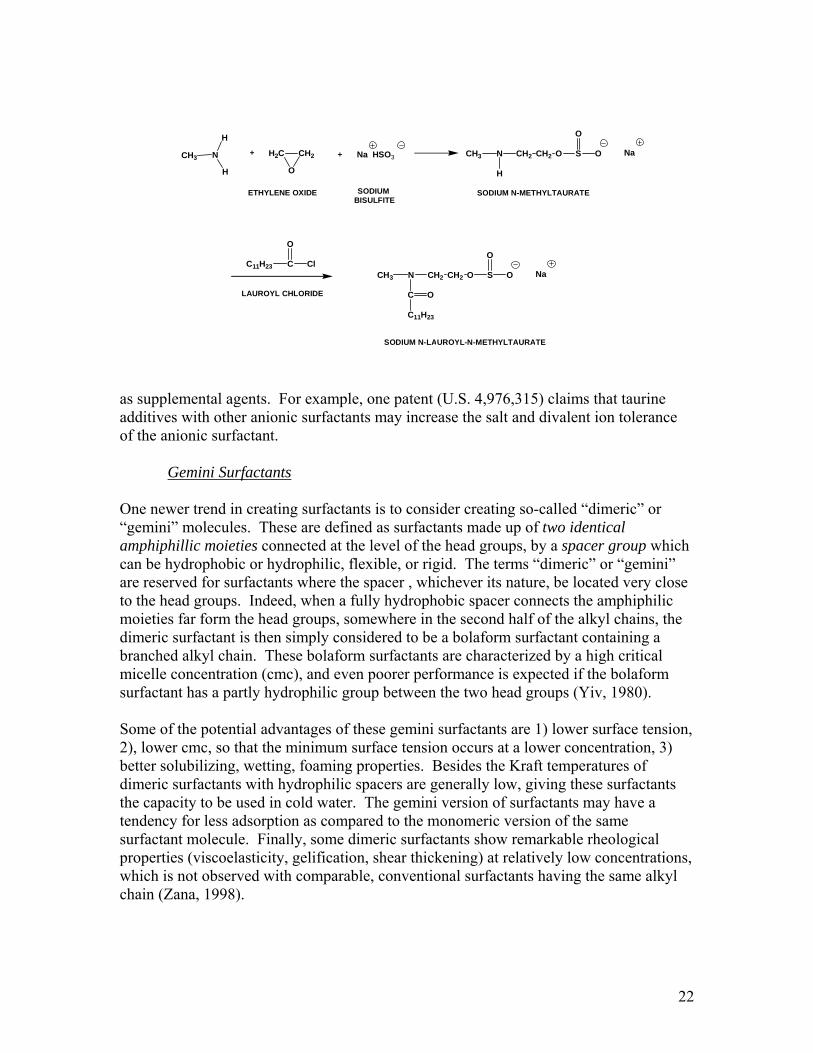
CH3 N
H
H
C11H23 C Cl
O
H2C
O
CH2 Na HSO3
CH3 N CH2
C
CH2 O S O
O
C11H23
O
CH3 N CH2
H
CH2 O S O
O
Na
Na
ETHYLENE OXIDE SODIUM BISULFITE
+ +
LAUROYL CHLORIDE
SODIUM N-LAUROYL-N-METHYLTAURATE
SODIUM N-METHYLTAURATE
as supplemental agents. For example, one patent (U.S. 4,976,315) claims that taurine additives with other anionic surfactants may increase the salt and divalent ion tolerance of the anionic surfactant.
Gemini Surfactants
One newer trend in creating surfactants is to consider creating so-called “dimeric” or “gemini” molecules. These are defined as surfactants made up of two identical amphiphillic moieties connected at the level of the head groups, by a spacer group which can be hydrophobic or hydrophilic, flexible, or rigid. The terms “dimeric” or “gemini” are reserved for surfactants where the spacer , whichever its nature, be located very close to the head groups. Indeed, when a fully hydrophobic spacer connects the amphiphilic moieties far form the head groups, somewhere in the second half of the alkyl chains, the dimeric surfactant is then simply considered to be a bolaform surfactant containing a branched alkyl chain. These bolaform surfactants are characterized by a high critical micelle concentration (cmc), and even poorer performance is expected if the bolaform surfactant has a partly hydrophilic group between the two head groups (Yiv, 1980). Some of the potential advantages of these gemini surfactants are 1) lower surface tension, 2), lower cmc, so that the minimum surface tension occurs at a lower concentration, 3) better solubilizing, wetting, foaming properties. Besides the Kraft temperatures of dimeric surfactants with hydrophilic spacers are generally low, giving these surfactants the capacity to be used in cold water. The gemini version of surfactants may have a tendency for less adsorption as compared to the monomeric version of the same surfactant molecule. Finally, some dimeric surfactants show remarkable rheological properties (viscoelasticity, gelification, shear thickening) at relatively low concentrations, which is not observed with comparable, conventional surfactants having the same alkyl chain (Zana, 1998).
22
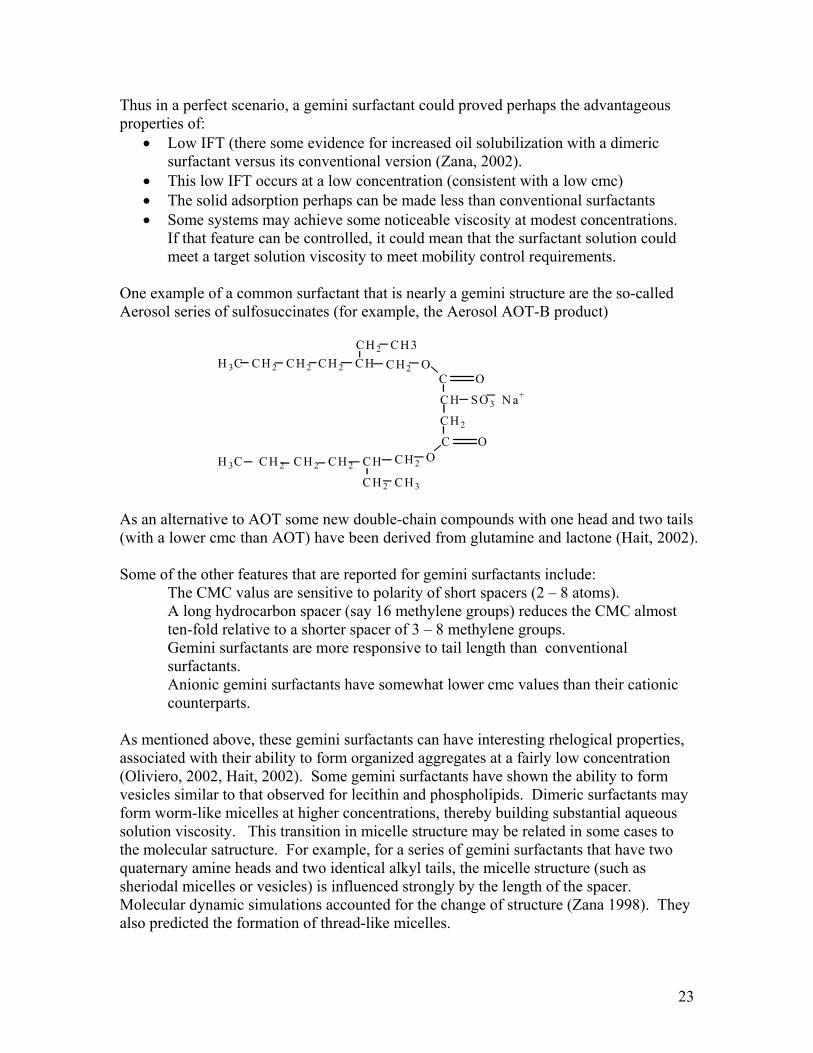
Thus in a perfect scenario, a gemini surfactant could proved perhaps the advantageous properties of:
• Low IFT (there some evidence for increased oil solubilization with a dimeric surfactant versus its conventional version (Zana, 2002).
• This low IFT occurs at a low concentration (consistent with a low cmc) • The solid adsorption perhaps can be made less than conventional surfactants • Some systems may achieve some noticeable viscosity at modest concentrations.
If that feature can be controlled, it could mean that the surfactant solution could meet a target solution viscosity to meet mobility control requirements.
One example of a common surfactant that is nearly a gemini structure are the so-called Aerosol series of sulfosuccinates (for example, the Aerosol AOT-B product)
H 3C CH 2CH 2 CH 2 CHCH 2 CH3
CH 2 OC O
CH 2
CH SO 3
H 3C CH 2CH 2 CH 2 CH
CH 2
CH 2 OC O
CH 3
N a+
As an alternative to AOT some new double-chain compounds with one head and two tails (with a lower cmc than AOT) have been derived from glutamine and lactone (Hait, 2002). Some of the other features that are reported for gemini surfactants include: The CMC valus are sensitive to polarity of short spacers (2 – 8 atoms). A long hydrocarbon spacer (say 16 methylene groups) reduces the CMC almost
ten-fold relative to a shorter spacer of 3 – 8 methylene groups. Gemini surfactants are more responsive to tail length than conventional
surfactants. Anionic gemini surfactants have somewhat lower cmc values than their cationic counterparts.
As mentioned above, these gemini surfactants can have interesting rhelogical properties, associated with their ability to form organized aggregates at a fairly low concentration (Oliviero, 2002, Hait, 2002). Some gemini surfactants have shown the ability to form vesicles similar to that observed for lecithin and phospholipids. Dimeric surfactants may form worm-like micelles at higher concentrations, thereby building substantial aqueous solution viscosity. This transition in micelle structure may be related in some cases to the molecular satructure. For example, for a series of gemini surfactants that have two quaternary amine heads and two identical alkyl tails, the micelle structure (such as sheriodal micelles or vesicles) is influenced strongly by the length of the spacer. Molecular dynamic simulations accounted for the change of structure (Zana 1998). They also predicted the formation of thread-like micelles.
23
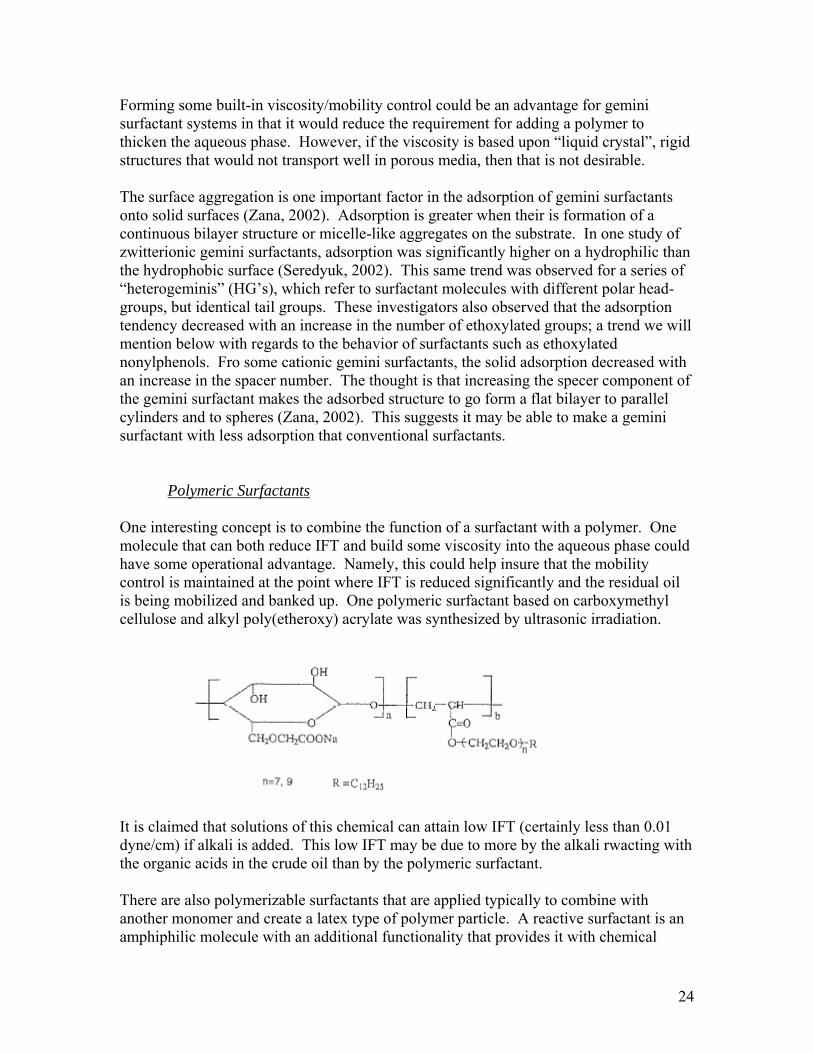
Forming some built-in viscosity/mobility control could be an advantage for gemini surfactant systems in that it would reduce the requirement for adding a polymer to thicken the aqueous phase. However, if the viscosity is based upon “liquid crystal”, rigid structures that would not transport well in porous media, then that is not desirable. The surface aggregation is one important factor in the adsorption of gemini surfactants onto solid surfaces (Zana, 2002). Adsorption is greater when their is formation of a continuous bilayer structure or micelle-like aggregates on the substrate. In one study of zwitterionic gemini surfactants, adsorption was significantly higher on a hydrophilic than the hydrophobic surface (Seredyuk, 2002). This same trend was observed for a series of “heterogeminis” (HG’s), which refer to surfactant molecules with different polar head-groups, but identical tail groups. These investigators also observed that the adsorption tendency decreased with an increase in the number of ethoxylated groups; a trend we will mention below with regards to the behavior of surfactants such as ethoxylated nonylphenols. Fro some cationic gemini surfactants, the solid adsorption decreased with an increase in the spacer number. The thought is that increasing the specer component of the gemini surfactant makes the adsorbed structure to go form a flat bilayer to parallel cylinders and to spheres (Zana, 2002). This suggests it may be able to make a gemini surfactant with less adsorption that conventional surfactants.
Polymeric Surfactants One interesting concept is to combine the function of a surfactant with a polymer. One molecule that can both reduce IFT and build some viscosity into the aqueous phase could have some operational advantage. Namely, this could help insure that the mobility control is maintained at the point where IFT is reduced significantly and the residual oil is being mobilized and banked up. One polymeric surfactant based on carboxymethyl cellulose and alkyl poly(etheroxy) acrylate was synthesized by ultrasonic irradiation.
It is claimed that solutions of this chemical can attain low IFT (certainly less than 0.01 dyne/cm) if alkali is added. This low IFT may be due to more by the alkali rwacting with the organic acids in the crude oil than by the polymeric surfactant. There are also polymerizable surfactants that are applied typically to combine with another monomer and create a latex type of polymer particle. A reactive surfactant is an amphiphilic molecule with an additional functionality that provides it with chemical
24
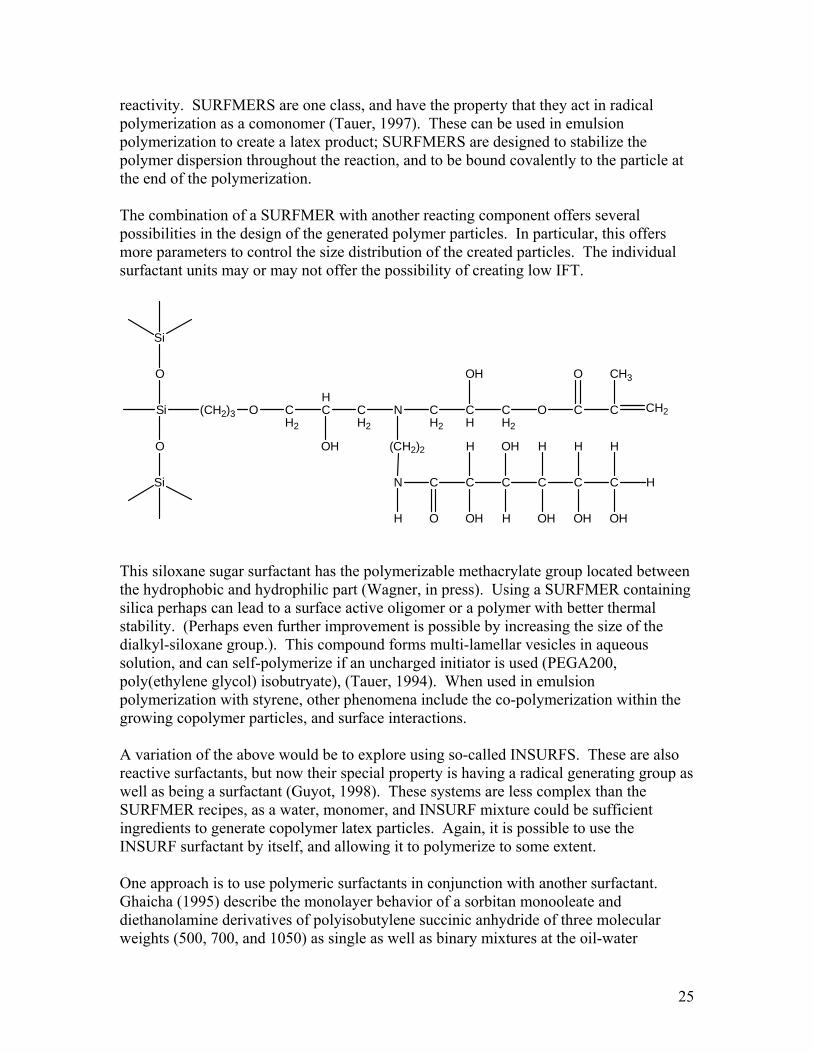
reactivity. SURFMERS are one class, and have the property that they act in radical polymerization as a comonomer (Tauer, 1997). These can be used in emulsion polymerization to create a latex product; SURFMERS are designed to stabilize the polymer dispersion throughout the reaction, and to be bound covalently to the particle at the end of the polymerization. The combination of a SURFMER with another reacting component offers several possibilities in the design of the generated polymer particles. In particular, this offers more parameters to control the size distribution of the created particles. The individual surfactant units may or may not offer the possibility of creating low IFT.
Si
O
O
(CH2)3
Si
Si
O CH2
HC
OH
CH2
N
(CH2)2
CH2
N
H
C C
CH
O
H
OH
C
OH
CH2
O
OH
H
C
C
H
C
OH
C
H
OH
O
C
CH3
CH2
H
H
OH This siloxane sugar surfactant has the polymerizable methacrylate group located between the hydrophobic and hydrophilic part (Wagner, in press). Using a SURFMER containing silica perhaps can lead to a surface active oligomer or a polymer with better thermal stability. (Perhaps even further improvement is possible by increasing the size of the dialkyl-siloxane group.). This compound forms multi-lamellar vesicles in aqueous solution, and can self-polymerize if an uncharged initiator is used (PEGA200, poly(ethylene glycol) isobutryate), (Tauer, 1994). When used in emulsion polymerization with styrene, other phenomena include the co-polymerization within the growing copolymer particles, and surface interactions. A variation of the above would be to explore using so-called INSURFS. These are also reactive surfactants, but now their special property is having a radical generating group as well as being a surfactant (Guyot, 1998). These systems are less complex than the SURFMER recipes, as a water, monomer, and INSURF mixture could be sufficient ingredients to generate copolymer latex particles. Again, it is possible to use the INSURF surfactant by itself, and allowing it to polymerize to some extent. One approach is to use polymeric surfactants in conjunction with another surfactant. Ghaicha (1995) describe the monolayer behavior of a sorbitan monooleate and diethanolamine derivatives of polyisobutylene succinic anhydride of three molecular weights (500, 700, and 1050) as single as well as binary mixtures at the oil-water
25
interface. Two oils were used in the study, heptane and paraffin oil. The observed differences in packing features revealed the significance of oil penetration and cohesive interactions in the aliphatic layer of the surfactant film. At the condition of the chain length compatibility, the mixed surfactant system produced emulsions with maximum stability. Chattopadhyay (1992) reported about similar chemistry, with a focus on double tailed surfactants. The primary hydrocarbon chain of the surfactants comprised polyisobutylene of approximately 34 backbone carbon number and the secondary hydrocarbon chain comprises n-alkyl groups from C8 to C20. The results indicate the surface properties at the water-oil interface correlate well with chain length compatibility effects in the mixed surfactant and cosurfactant systems. Polymers as Efficiency Boosters for Microemulsions Recently, there are study results where the addition of amphiphilic block copolymers are reported to provide a boost in the efficiency of microemulsions (see for example, Enco (2002), Jakobs (1999), and Mihailescu (2001). Specifically, block copolymers with the structure (PEPx – PEOy) have this effect; that is, poly(ethylenepropylene)-co-poly(ethylene oxide). The surfactant-oil system studied is an alkyl ethoxylate surfactant (CxEy) and simple alkanes as the hydrocarbon phase. The observations are that the “efficiency” of the surfactant is improved with respect to an increase in the volume of oil solubilized into a middle-phase microemulsion. Consistent with that behavior is in fact a decrease in the IFT with the inclusion of the block co-polymer. For example, Jakobs (1999) reports that adding the polymer can decrease the IFT by a factor of 5; in one particular formulation they found it possible to go from a 13.2 wt% surfactant concentration to create a single-phase microemulsion to just requiring 3.08% and 0.42 wt$ of polymer. The observation that the efficiency increase can be accomplished by increasing either block size or both block sizes symmetrically points to the direction that the origin of the efficiency boosting can not be from regular mixing effects. The effect is felt to be related to the ability of the block copolymer to extend further into the adjacent subphases. Furthermore, analysis of high-precision neutron scattering data and theoretical calculation of the phase diagram researchers (Endo (2002)) deduce that these block copolymers are incorporated into the surfactant layer where they form mushroom conformations. One speculated beneficial effect is that the copolymer modifies the elastic moduli of the layer such that the formation of passages between neighboring membranes is hindered. Nonionic Surfactants One option is to consider nonionic surfactants as the main agent for IFT reduction. One advantage of this choice is that these may have superior tolerance to very saline water.
26
On the other hand, many of these surfactants can be sensitive to temperature; as the temperature increases the solution can change from a clear to turbid. This phenomenon is termed the “cloud point’ for a given surfactant, and can limits is application. Alcohol Ethoxylated Ethers One common series of surfactants are based on the general formula of R- EOn – OH where R is usually a linear alkyl chain Commercial examples would include the Neodol series of surfactants manufactured by Shell. Another common abbreviation is CiEj where i refers to the alkyl chain length and j refers to the number of ethyoxlated groups. Aveyard (1998) report on a study of the aggregate structures with microemulsions containing these surfactants, water, and an oil phase (heptane and tetradecane). They interpret solubilization phase boundaries in terms of spontaneous curvature of the surfactant monolayer and a critical concentration of surfactant required for microemulsion droplet formation. The measured droplet sizes are proportional to the molar ratio of dispersed component to surfactant within the droplets. Aveyard (1998) also presents IFT data for these systems, where they focused on a C12E5 surfactant (dodeecyl pentaethylene glycol ether). They observed the IFT going to a deep minimum as the system approaches the PIT (Phase Inversion Temperature) from either a colder or a hotter temperature. The PIT (and the minimum IFT condition) occurs at a lower temperature for the case of a hexane (IFT = 10-3 dyne/cm) than the larger, tetradecane hydrocarbon phase (IFT = 10-2 dyne/cm). This transition from hydrophilic to lipophilic with a rise in temperature produces a middle-phase to appear. Furthermore the HLB (hydrophile-lipophile-balancd) temperature is defined as the temperature at which the middle-phase contains equal weights of water and oil. This is a condition of maximum solubilization of excess phases, and note that is analogous to the concept of an “optimal salinity” for the case of using anionic surfactants. Kunieda (1993, 1995) examined this behavior where there are mixtures of these alkyl polyethylene glycol ethers involved, each with its own HLB temperature. They conclude that the weight additivity of the three-phase (HLB) temperatures of each surfactant holds for the mixed surfactant systems. Sottmann (1996) reports there is a similarity in the shape of the IFT curves for these surfactants versus the temperature. (They used only one oil phase, n-octane in this studyt.) There is a sharp minimum in the IFT at the PIT. The difference is that as the molecular weight increases, the minimum IFT achieved becomes lower and the PIT increases. These authors were able to normalize the results versus a reduced temperature, and further, could arrive at a single IFT versus T curve by normalizing the IFT by the interfacial surfactant volume squared.
27
Ethoxylated Alkyl Phenols The common commercial examples of this type of nonionic surfactants include the Igepal, Tritons, and Tergitol series of products. These are different from the above section, where now the molecule includes a phenyl group. R – Ph – EO(n-1) – CH2CH2OH where R is an alkyl chain, Ph represents a phenyl group, and there are n EO ethoxylate groups. Graciaa et. al. (1981) performed a rather detailed study of the Igepal series of surfactants for their phase behavior and ability to create a low IFT. The phase behavior of these nonionic surfactants having the same HLB but differing molecular weights was studied. It is shown that the optimum ACN (Alkane Carbon Number, the equivalent carbon length of the hydrocarbon phase) depends on the HLB, but that increasing the hydrophobe molecular weight narrows the middle phase region, increases the solubilization parameter and decreases the interfacial tension. That is to say that increasing the alkyl chain length can provide a lower IFT at its optimal conditions, but that the optimal conditions will occur over a more narrow range of process conditions. The width of the three phase region is found to be in simple inverse proportion to the solubilization parameter at optimum salinity and the multiple of the interfacial tension times the square of the solubilization is constant. In addition, the solubilization (minimum achievable IFT) is diminished by increasing the size of the hydrocarbon (increasing ACN) and diminished surfactant molecular weight. . Besides the commercial type products, the authors found it was also found possible to synthesize nonionics which rival anionics in the above mentioned properties. Results form this study indicate it may be possible to create low IFT values and solubilization performance. A separate study (Nevskaia, 1996) measured the adsorption of several polyxyethylenic surfactants. In general, the plateau adsorption became less with an increase in the number of ethoxylate groups (an increase in the surfactant HLB). The analogous surfactants which are sulfates and thus anionic in nature, show less adsorption than the nonionic (Triton series) onto silica. On the other hand, the adsorbed amounts of Tritons and sulfated Tritons on kaolin are similar, probably due to the positive changes on the edges of this material. Alkyl Polyglycosides
Alkyl polyglycosides (APG) are a relatively untested surfactant idea with respect to creating a formulation for enhanced oil recovery. An example structure is shown below:
28
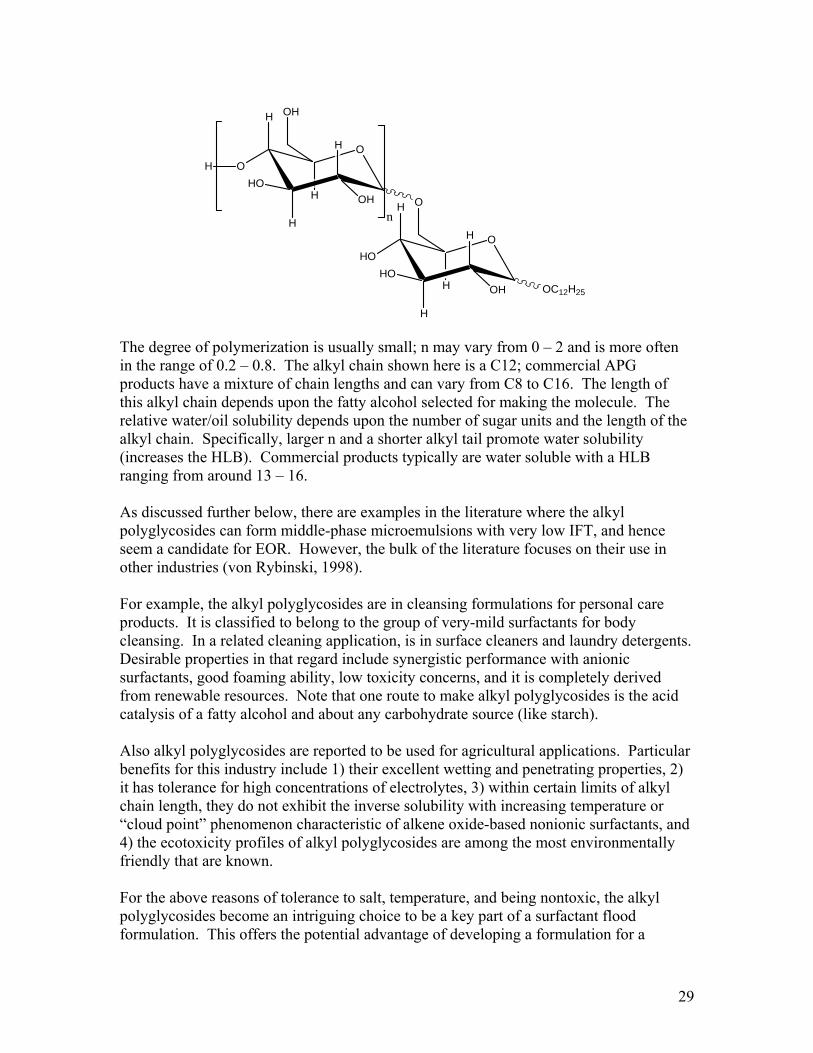
O
H
O
H
HO
H
OHH
OH
H
O
H
HO
H
HO
H
OHH
O
OC12H25
n
The degree of polymerization is usually small; n may vary from 0 – 2 and is more often in the range of 0.2 – 0.8. The alkyl chain shown here is a C12; commercial APG products have a mixture of chain lengths and can vary from C8 to C16. The length of this alkyl chain depends upon the fatty alcohol selected for making the molecule. The relative water/oil solubility depends upon the number of sugar units and the length of the alkyl chain. Specifically, larger n and a shorter alkyl tail promote water solubility (increases the HLB). Commercial products typically are water soluble with a HLB ranging from around 13 – 16. As discussed further below, there are examples in the literature where the alkyl polyglycosides can form middle-phase microemulsions with very low IFT, and hence seem a candidate for EOR. However, the bulk of the literature focuses on their use in other industries (von Rybinski, 1998). For example, the alkyl polyglycosides are in cleansing formulations for personal care products. It is classified to belong to the group of very-mild surfactants for body cleansing. In a related cleaning application, is in surface cleaners and laundry detergents. Desirable properties in that regard include synergistic performance with anionic surfactants, good foaming ability, low toxicity concerns, and it is completely derived from renewable resources. Note that one route to make alkyl polyglycosides is the acid catalysis of a fatty alcohol and about any carbohydrate source (like starch). Also alkyl polyglycosides are reported to be used for agricultural applications. Particular benefits for this industry include 1) their excellent wetting and penetrating properties, 2) it has tolerance for high concentrations of electrolytes, 3) within certain limits of alkyl chain length, they do not exhibit the inverse solubility with increasing temperature or “cloud point” phenomenon characteristic of alkene oxide-based nonionic surfactants, and 4) the ecotoxicity profiles of alkyl polyglycosides are among the most environmentally friendly that are known. For the above reasons of tolerance to salt, temperature, and being nontoxic, the alkyl polyglycosides become an intriguing choice to be a key part of a surfactant flood formulation. This offers the potential advantage of developing a formulation for a
29
particular reservoir application where the performance is largely indifferent to changes in reservoir temperature or salinity. One system discussed (Forster, 1996) shows that the IFT approaches 0.001 dyne/cm versus dodecane as the hydrocarbon phase. The formulation also included sorbitan monolaurate, SML as well as an APG with alkyl chain length of C12 – C14 (ratio of SML:APG is 1:1 at the optimum conditions). These authors attribute the high interfacial activity to the fact that the hydrophilic alkyl polyglycoside with its large polyglcoside head group is present in exactly the right mixing ratio with the hydrophobic coemulsifier SML with its small head group at the oil-water interface. In contrast to ethoxylated nonionic surfactants, hydration and hence the effective size of the head group are hardly dependent on the temperature (Fukuda, 1993). Data do suggest that by themselves, the common glycosides do not have ability to reduce the IFT to ultra-low levels (Nickel, 1996). For example, the IFT is a bit less than 1 dyne/cm with a C12 monoglycoside aqueous solution versus n-decane, but the lowest IFT is greater than 1 dyne/cm for the C10 monoglycoside, and is about 3 dyne/cm for the C8 monoglycoside. The trend in the decrease in IFT and the cmc with an increase in alkyl chain length is not unusual. One interesting feature is that the IFT appears to be independent of temperature (or at least IFT measurements are almost the same at 40 and 60 C. This study also includes data about solid adsorption of these type of surfactants. One interesting benchmark is that the adsorption levels on graphitized carbon black of C8 monglycoside is comparable with a C10 ethoxylated surfactant. Another example reported is for the decane-water-alkyl polyglcoside system (Balzer, 1991). By adding iso-butanol to the formulation it was possible to generate a third-phase and a drastic reduction in the IFT. In addition, the range where the middle-phase microemulsion is observed is only slightly dependent on the temperature and the electrolyte concentration. Yet one other example is the decyl beta- D-glucoside in hydrocarbon/salt water (Aveyard, 1988). These authors report how toluene and cyclohexane as the hydrocarbon phase can produce a normal Winsor phase behavior, which includes the formation of a middle-phase microemulsion. One patent claims alkyl polyglucosides as a useful component for a micellar/flood. The particular advantage claimed in a U.S patent from 1991 for using these surfactants is to provide good performance over a wide range of both temperature and salinity (U.S. patent 4,985,154). Due to the inherent high water solubility of the alkyl polyglcosides, it is expected that in fact another surfactant or co-surfactant (more oil soluble) component needs to be added in order to form a three phase microemulsion (Solans, 1997). This is particularly true for hydrocarbons like n-alkanes, but perhaps less so for polar oils. The quite different partitioning between the alkyl polyglycosides and a co-surfactant leads to the invariance of the three phase region with temperature. Besides simple alcohols as co-surfactants, diols are another choice which have the advantage of being a nontoxic alternative (Kahlweit, 1996). A presentation about sugar-based surfactants (n-octyl-β-D-glucoside and n-dodecyl-β-D-maltoside) also provides some encouragement to investigate the APG surfactants further as EOR candidates (Somansundaran, 2001). Laboratory measurements of the surface
30
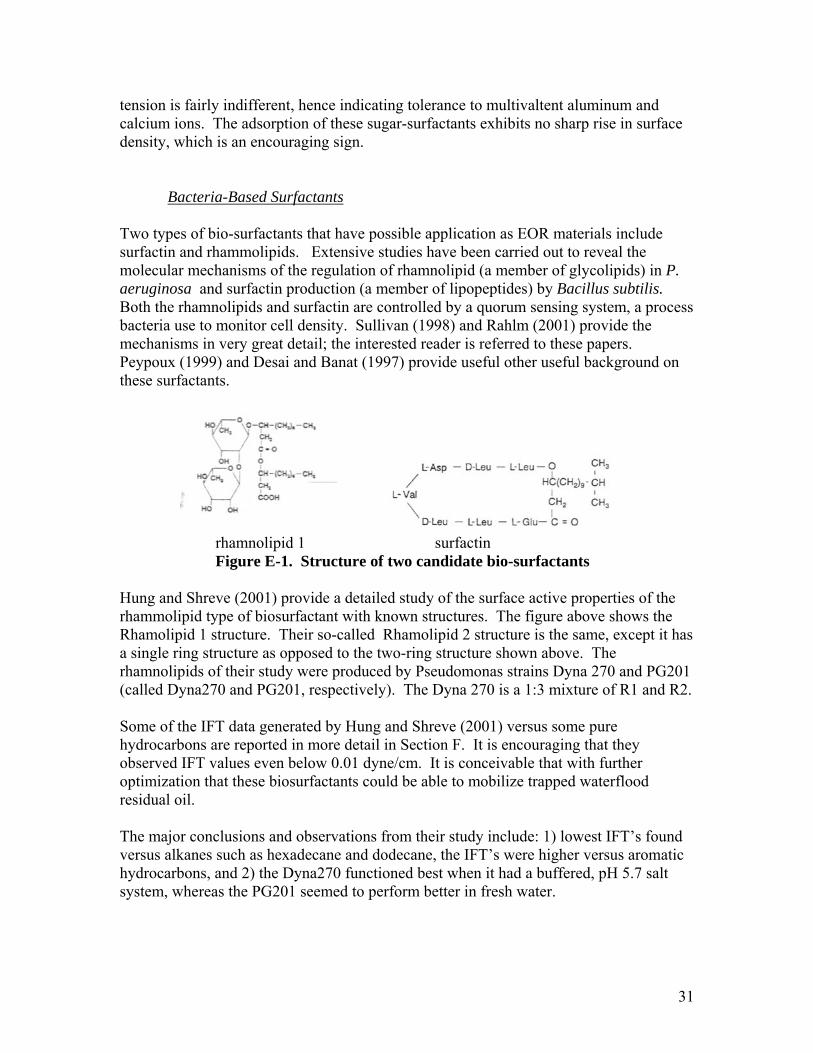
tension is fairly indifferent, hence indicating tolerance to multivaltent aluminum and calcium ions. The adsorption of these sugar-surfactants exhibits no sharp rise in surface density, which is an encouraging sign.
Bacteria-Based Surfactants
Two types of bio-surfactants that have possible application as EOR materials include surfactin and rhammolipids. Extensive studies have been carried out to reveal the molecular mechanisms of the regulation of rhamnolipid (a member of glycolipids) in P. aeruginosa and surfactin production (a member of lipopeptides) by Bacillus subtilis. Both the rhamnolipids and surfactin are controlled by a quorum sensing system, a process bacteria use to monitor cell density. Sullivan (1998) and Rahlm (2001) provide the mechanisms in very great detail; the interested reader is referred to these papers. Peypoux (1999) and Desai and Banat (1997) provide useful other useful background on these surfactants.
rhamnolipid 1 surfactin Figure E-1. Structure of two candidate bio-surfactants Hung and Shreve (2001) provide a detailed study of the surface active properties of the rhammolipid type of biosurfactant with known structures. The figure above shows the Rhamolipid 1 structure. Their so-called Rhamolipid 2 structure is the same, except it has a single ring structure as opposed to the two-ring structure shown above. The rhamnolipids of their study were produced by Pseudomonas strains Dyna 270 and PG201 (called Dyna270 and PG201, respectively). The Dyna 270 is a 1:3 mixture of R1 and R2. Some of the IFT data generated by Hung and Shreve (2001) versus some pure hydrocarbons are reported in more detail in Section F. It is encouraging that they observed IFT values even below 0.01 dyne/cm. It is conceivable that with further optimization that these biosurfactants could be able to mobilize trapped waterflood residual oil. The major conclusions and observations from their study include: 1) lowest IFT’s found versus alkanes such as hexadecane and dodecane, the IFT’s were higher versus aromatic hydrocarbons, and 2) the Dyna270 functioned best when it had a buffered, pH 5.7 salt system, whereas the PG201 seemed to perform better in fresh water.
31
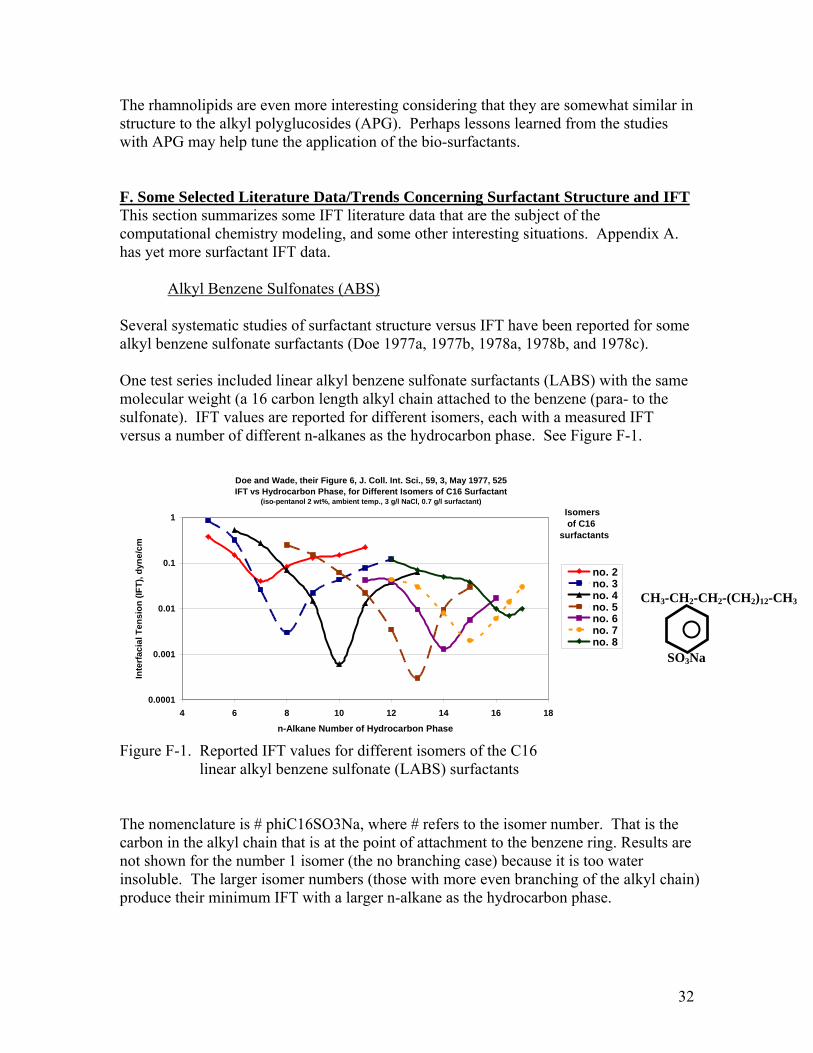
The rhamnolipids are even more interesting considering that they are somewhat similar in structure to the alkyl polyglucosides (APG). Perhaps lessons learned from the studies with APG may help tune the application of the bio-surfactants. F. Some Selected Literature Data/Trends Concerning Surfactant Structure and IFT This section summarizes some IFT literature data that are the subject of the computational chemistry modeling, and some other interesting situations. Appendix A. has yet more surfactant IFT data. Alkyl Benzene Sulfonates (ABS) Several systematic studies of surfactant structure versus IFT have been reported for some alkyl benzene sulfonate surfactants (Doe 1977a, 1977b, 1978a, 1978b, and 1978c). One test series included linear alkyl benzene sulfonate surfactants (LABS) with the same molecular weight (a 16 carbon length alkyl chain attached to the benzene (para- to the sulfonate). IFT values are reported for different isomers, each with a measured IFT versus a number of different n-alkanes as the hydrocarbon phase. See Figure F-1.
Doe and Wade, their Figure 6, J. Coll. Int. Sci., 59, 3, May 1977, 525IFT vs Hydrocarbon Phase, for Different Isomers of C16 Surfactant
(iso-pentanol 2 wt%, ambient temp., 3 g/l NaCl, 0.7 g/l surfactant)
0.0001
0.001
0.01
0.1
1
4 6 8 10 12 14 16 18
n-Alkane Number of Hydrocarbon Phase
Inte
rfac
ial T
ensi
on (I
FT),
dyne
/cm
no. 2no. 3no. 4no. 5no. 6no. 7no. 8
Isomers of C16surfactants
CH3-CH2-CH2-(CH2)12-CH3
SO3Na
Figure F-1. Reported IFT values for different isomers of the C16 linear alkyl benzene sulfonate (LABS) surfactants The nomenclature is # phiC16SO3Na, where # refers to the isomer number. That is the carbon in the alkyl chain that is at the point of attachment to the benzene ring. Results are not shown for the number 1 isomer (the no branching case) because it is too water insoluble. The larger isomer numbers (those with more even branching of the alkyl chain) produce their minimum IFT with a larger n-alkane as the hydrocarbon phase.
32
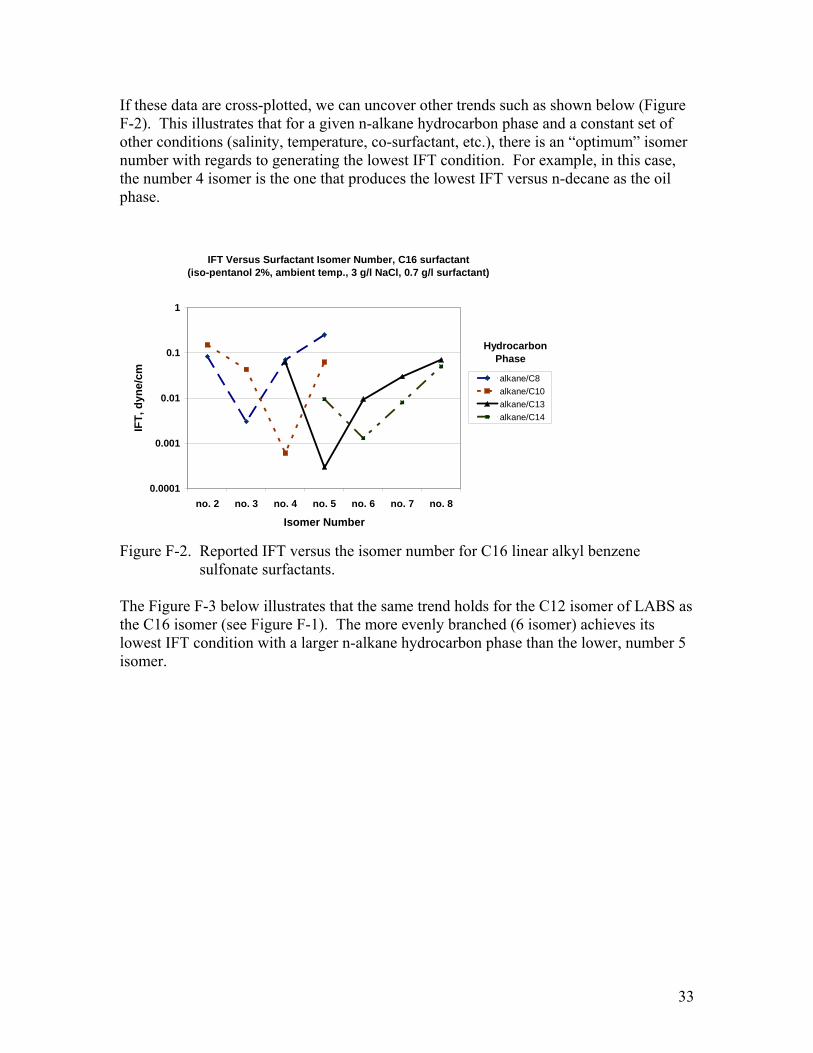
If these data are cross-plotted, we can uncover other trends such as shown below (Figure F-2). This illustrates that for a given n-alkane hydrocarbon phase and a constant set of other conditions (salinity, temperature, co-surfactant, etc.), there is an “optimum” isomer number with regards to generating the lowest IFT condition. For example, in this case, the number 4 isomer is the one that produces the lowest IFT versus n-decane as the oil phase.
IFT Versus Surfactant Isomer Number, C16 surfactant(iso-pentanol 2%, ambient temp., 3 g/l NaCl, 0.7 g/l surfactant)
0.0001
0.001
0.01
0.1
1
no. 2 no. 3 no. 4 no. 5 no. 6 no. 7 no. 8
Isomer Number
IFT,
dyn
e/cm alkane/C8
alkane/C10alkane/C13alkane/C14
Hydrocarbon Phase
Figure F-2. Reported IFT versus the isomer number for C16 linear alkyl benzene sulfonate surfactants. The Figure F-3 below illustrates that the same trend holds for the C12 isomer of LABS as the C16 isomer (see Figure F-1). The more evenly branched (6 isomer) achieves its lowest IFT condition with a larger n-alkane hydrocarbon phase than the lower, number 5 isomer.
33
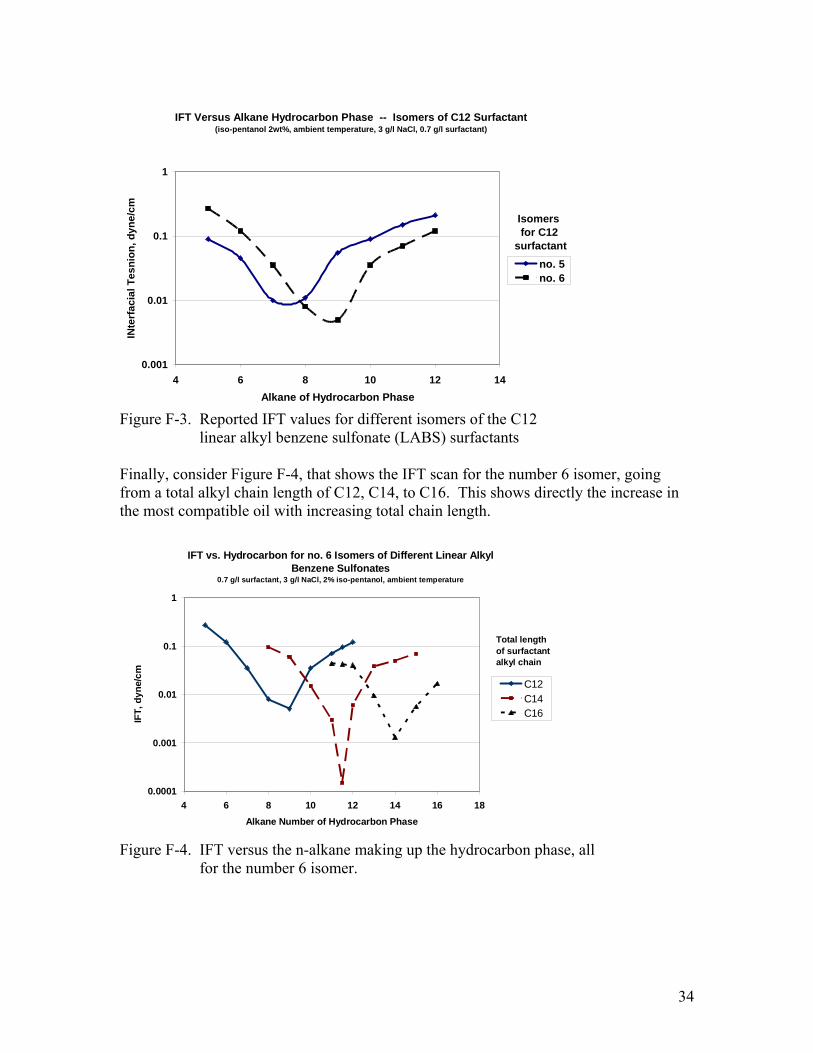
IFT Versus Alkane Hydrocarbon Phase -- Isomers of C12 Surfactant(iso-pentanol 2wt%, ambient temperature, 3 g/l NaCl, 0.7 g/l surfactant)
0.001
0.01
0.1
1
4 6 8 10 12 14Alkane of Hydrocarbon Phase
INte
rfac
ial T
esni
on, d
yne/
cm
no. 5no. 6
Isomers for C12surfactant
Figure F-3. Reported IFT values for different isomers of the C12 linear alkyl benzene sulfonate (LABS) surfactants Finally, consider Figure F-4, that shows the IFT scan for the number 6 isomer, going from a total alkyl chain length of C12, C14, to C16. This shows directly the increase in the most compatible oil with increasing total chain length.
IFT vs. Hydrocarbon for no. 6 Isomers of Different Linear Alkyl Benzene Sulfonates
0.7 g/l surfactant, 3 g/l NaCl, 2% iso-pentanol, ambient temperature
0.0001
0.001
0.01
0.1
1
4 6 8 10 12 14 16 18Alkane Number of Hydrocarbon Phase
IFT,
dyn
e/cm
C12C14C16
Total lengthof surfactant alkyl chain
Figure F-4. IFT versus the n-alkane making up the hydrocarbon phase, all for the number 6 isomer.
34
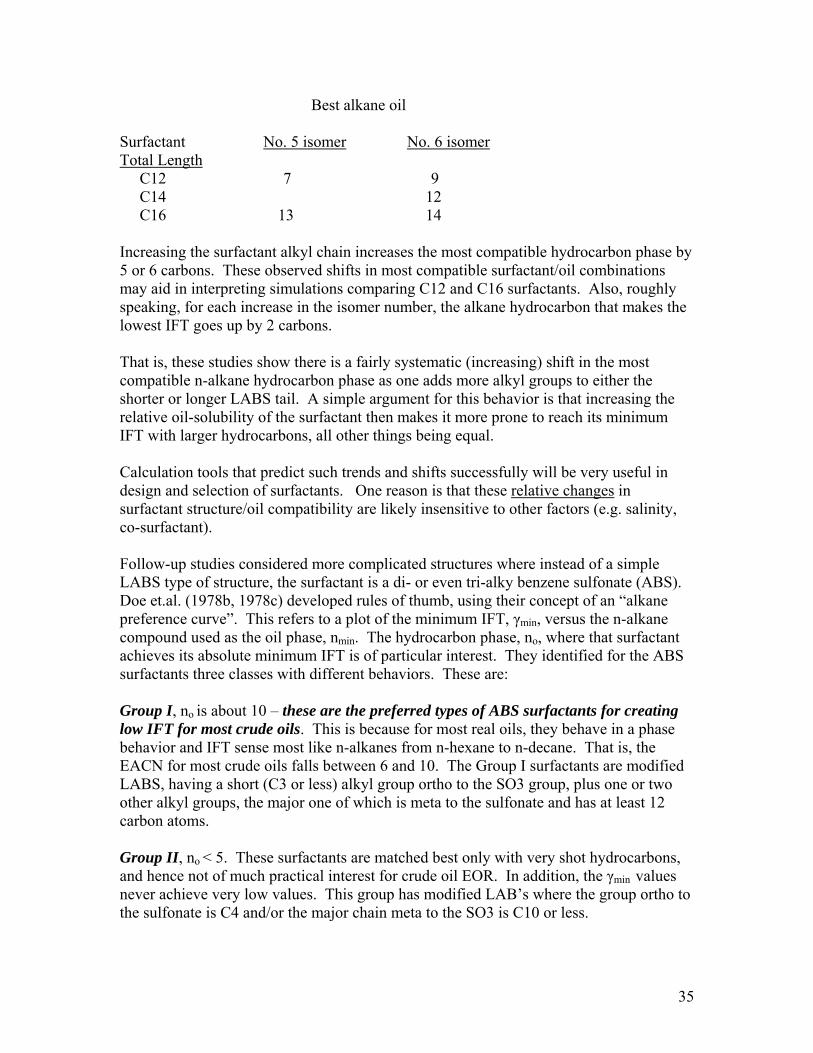
Best alkane oil Surfactant No. 5 isomer No. 6 isomer Total Length C12 7 9 C14 12 C16 13 14 Increasing the surfactant alkyl chain increases the most compatible hydrocarbon phase by 5 or 6 carbons. These observed shifts in most compatible surfactant/oil combinations may aid in interpreting simulations comparing C12 and C16 surfactants. Also, roughly speaking, for each increase in the isomer number, the alkane hydrocarbon that makes the lowest IFT goes up by 2 carbons. That is, these studies show there is a fairly systematic (increasing) shift in the most compatible n-alkane hydrocarbon phase as one adds more alkyl groups to either the shorter or longer LABS tail. A simple argument for this behavior is that increasing the relative oil-solubility of the surfactant then makes it more prone to reach its minimum IFT with larger hydrocarbons, all other things being equal. Calculation tools that predict such trends and shifts successfully will be very useful in design and selection of surfactants. One reason is that these relative changes in surfactant structure/oil compatibility are likely insensitive to other factors (e.g. salinity, co-surfactant). Follow-up studies considered more complicated structures where instead of a simple LABS type of structure, the surfactant is a di- or even tri-alky benzene sulfonate (ABS). Doe et.al. (1978b, 1978c) developed rules of thumb, using their concept of an “alkane preference curve”. This refers to a plot of the minimum IFT, γmin, versus the n-alkane compound used as the oil phase, nmin. The hydrocarbon phase, no, where that surfactant achieves its absolute minimum IFT is of particular interest. They identified for the ABS surfactants three classes with different behaviors. These are: Group I, no is about 10 – these are the preferred types of ABS surfactants for creating low IFT for most crude oils. This is because for most real oils, they behave in a phase behavior and IFT sense most like n-alkanes from n-hexane to n-decane. That is, the EACN for most crude oils falls between 6 and 10. The Group I surfactants are modified LABS, having a short (C3 or less) alkyl group ortho to the SO3 group, plus one or two other alkyl groups, the major one of which is meta to the sulfonate and has at least 12 carbon atoms. Group II, no < 5. These surfactants are matched best only with very shot hydrocarbons, and hence not of much practical interest for crude oil EOR. In addition, the γmin values never achieve very low values. This group has modified LAB’s where the group ortho to the sulfonate is C4 and/or the major chain meta to the SO3 is C10 or less.
35
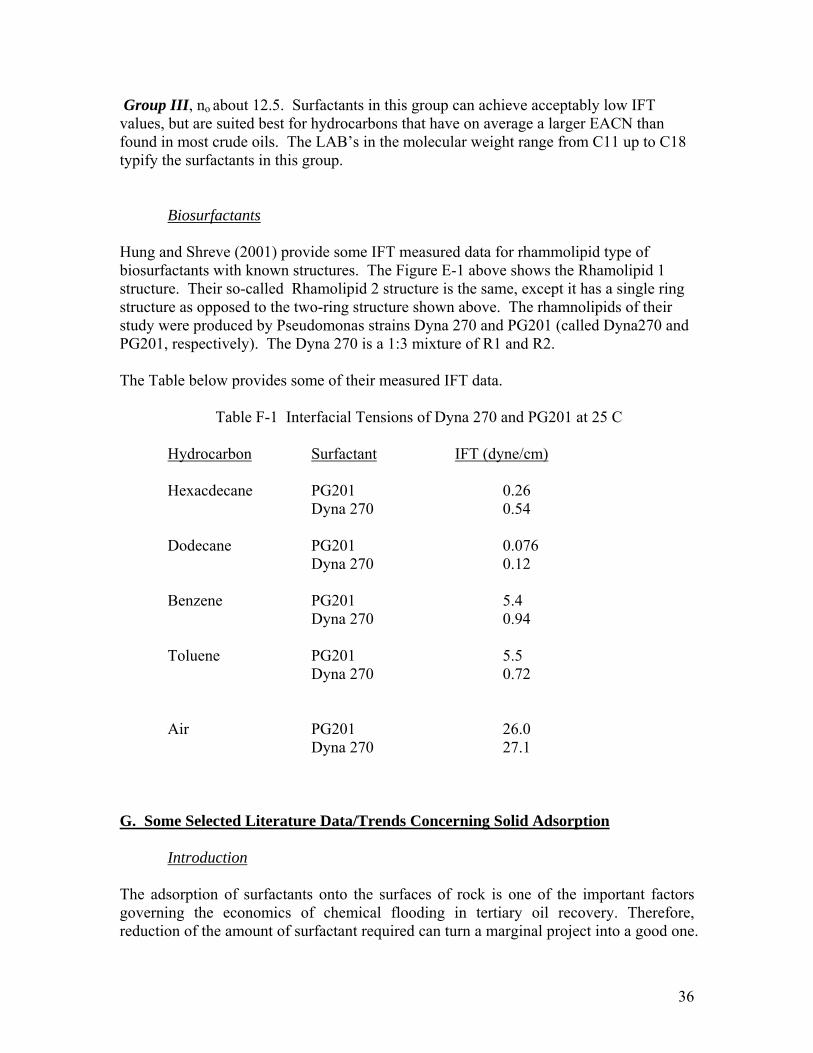
Group III, no about 12.5. Surfactants in this group can achieve acceptably low IFT values, but are suited best for hydrocarbons that have on average a larger EACN than found in most crude oils. The LAB’s in the molecular weight range from C11 up to C18 typify the surfactants in this group. Biosurfactants Hung and Shreve (2001) provide some IFT measured data for rhammolipid type of biosurfactants with known structures. The Figure E-1 above shows the Rhamolipid 1 structure. Their so-called Rhamolipid 2 structure is the same, except it has a single ring structure as opposed to the two-ring structure shown above. The rhamnolipids of their study were produced by Pseudomonas strains Dyna 270 and PG201 (called Dyna270 and PG201, respectively). The Dyna 270 is a 1:3 mixture of R1 and R2. The Table below provides some of their measured IFT data. Table F-1 Interfacial Tensions of Dyna 270 and PG201 at 25 C
Hydrocarbon Surfactant IFT (dyne/cm) Hexacdecane PG201 0.26 Dyna 270 0.54 Dodecane PG201 0.076 Dyna 270 0.12 Benzene PG201 5.4 Dyna 270 0.94 Toluene PG201 5.5 Dyna 270 0.72
Air PG201 26.0 Dyna 270 27.1 G. Some Selected Literature Data/Trends Concerning Solid Adsorption
Introduction The adsorption of surfactants onto the surfaces of rock is one of the important factors governing the economics of chemical flooding in tertiary oil recovery. Therefore, reduction of the amount of surfactant required can turn a marginal project into a good one.
36
The emphasis here I on kaolinite clay as the adsorbant because 1) it is a common reservoir clay, 2) its structure is more well-defined than other clays, and 3) we focus on kaolinite in the experimental adsorption work for this project. Composition of Kaolinite Clay(wt%)
SiO2 Al2O3 TiO2 Fe2O3 FeO MnO CaO Na2O K2O P2O5 F
44.2 39.7 1.39 0.13 0.08 0.002 trace 0.013 0.05 0.034 0.013
Loss on heating: 12.6%(~550 °C); 1.18% (550~1100 °C). Mechanism of the Adsorption
Since 1980, the mechanism of surfactant adsorption at the kaolinite clay solid/liquid interface has been intensively studied and a great deal of literature has been published. It is now admitted that two steps, more or less separated, can describe the formation of the adsorption layer along the adsorption isotherm. In the case of minerals, adsorption at low equilibrium concentration is generally due to the interaction between the polar head of the amphiphile molecule and some specific sites of the surface, e.g., H-bonds, electrostatic forces. For higher concentration, aggregates are formed at the interface as a result of lateral interactions between hydrophobic chains. This aggregation is due to the same forces as those responsible for bulk micelle formation. The concentration at which aggregation appears on the surface, their lateral extent and their thickness depends on: 1.) the normal interaction between the polar head and the surface; 2.) the lateral interaction between hydrophobic chains; 3.) the spatial and energetic distribution of adsorbing sites. Cases and Villieras (1992) have classified systems as a function of the strength of the normal adsorbent/adsorbate bond. The formation of hydrophobic monolayers at low concentration (useful for example in floatation) followed by bilayers at higher concentration would occur in the case of a strong bond. When the bond is weak, the formation of surface micelles ( aggregates of finite size) would be more frequently observed, such conditions are interesting for enhanced oil recovery applications. Nevertheless, recent studies by ellipsometry (Tiberg, 1994, Luciani, 1997), neutron reflectivity (Thomas, 1997), or atomic force microscopy (Manne, 1995) on model substrates suggeste that surfactants with the same polar group but different hydrophobic chain length can form either bilayers or surface micelles.
Main Factors Affecting the Adsorption
Several physicochemical processes can be expected to take place when clays are contacted with ionic surfactant aqueous solutions and to contribute toward determining the overall behavior of the resulting suspensions. Major among such processes are recognized to be hydrolysis of surface species, ion-exchange, electrostatic adsorptions and dissolution of the clay constitute, and adsorption or precipitation of resultant complexes. Each of the factors described above is discussed below.
37
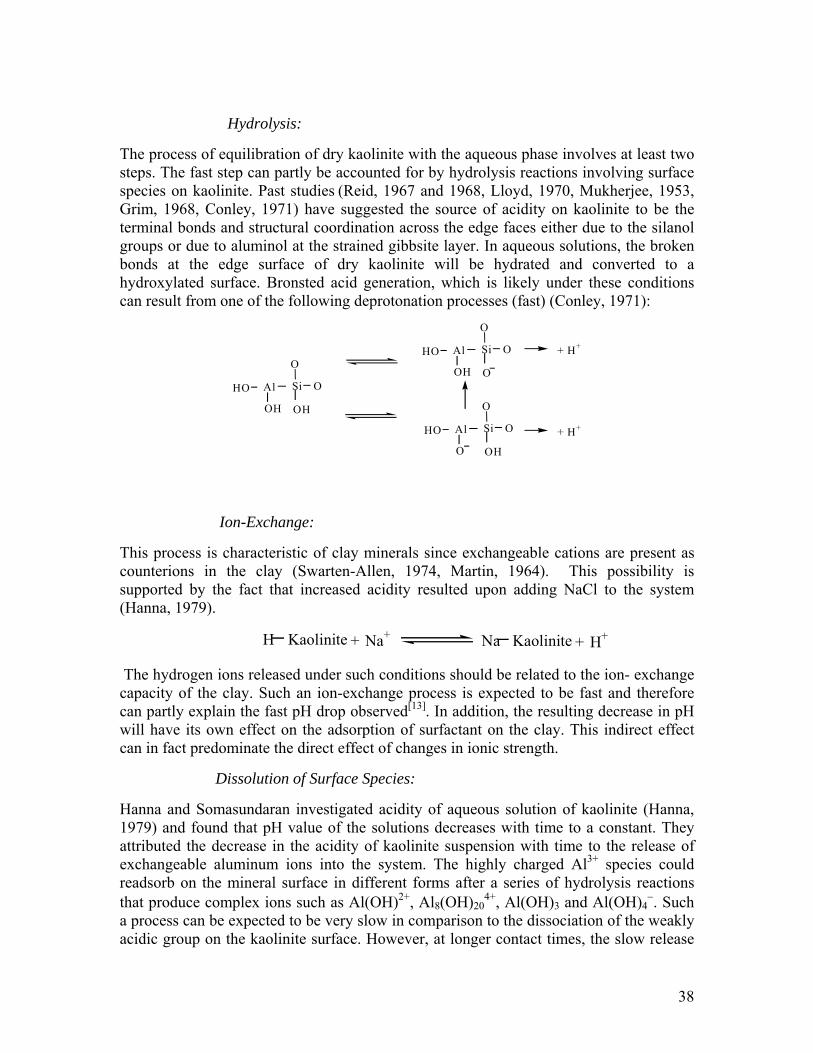
Hydrolysis:
The process of equilibration of dry kaolinite with the aqueous phase involves at least two steps. The fast step can partly be accounted for by hydrolysis reactions involving surface species on kaolinite. Past studies (Reid, 1967 and 1968, Lloyd, 1970, Mukherjee, 1953, Grim, 1968, Conley, 1971) have suggested the source of acidity on kaolinite to be the terminal bonds and structural coordination across the edge faces either due to the silanol groups or due to aluminol at the strained gibbsite layer. In aqueous solutions, the broken bonds at the edge surface of dry kaolinite will be hydrated and converted to a hydroxylated surface. Bronsted acid generation, which is likely under these conditions can result from one of the following deprotonation processes (fast) (Conley, 1971):
HO Al Si O
OH OH
OHO Al Si O
OH O
O
HO Al Si O
O OH
O
+ H+
+ H+
Ion-Exchange:
This process is characteristic of clay minerals since exchangeable cations are present as counterions in the clay (Swarten-Allen, 1974, Martin, 1964). This possibility is supported by the fact that increased acidity resulted upon adding NaCl to the system (Hanna, 1979).
H Kaolinite + Na+ Na Kaolinite + H+ The hydrogen ions released under such conditions should be related to the ion- exchange capacity of the clay. Such an ion-exchange process is expected to be fast and therefore can partly explain the fast pH drop observed[13]. In addition, the resulting decrease in pH will have its own effect on the adsorption of surfactant on the clay. This indirect effect can in fact predominate the direct effect of changes in ionic strength.
Dissolution of Surface Species:
Hanna and Somasundaran investigated acidity of aqueous solution of kaolinite (Hanna, 1979) and found that pH value of the solutions decreases with time to a constant. They attributed the decrease in the acidity of kaolinite suspension with time to the release of exchangeable aluminum ions into the system. The highly charged Al3+ species could readsorb on the mineral surface in different forms after a series of hydrolysis reactions that produce complex ions such as Al(OH)2+, Al8(OH)20
4+, Al(OH)3 and Al(OH)4−. Such
a process can be expected to be very slow in comparison to the dissociation of the weakly acidic group on the kaolinite surface. However, at longer contact times, the slow release
38
of increasing amounts of charged aluminum species from the basal kaolinite surfaces into the solution followed by their adsorption on the kaolinite surface will be an important process particularly in the acidic and basic pH ranges where concentration of dissolved aluminum species is considerably higher than in the neutral range. This will increase the affinity of the negatively charged sulfonate toward kaolinite and hence an increase in adsorption, especially at low pH values.
Ionic Strength:
In tertiary oil recovery, there are many kinds of cations in the aqueous solution. So it is necessary to understand the effect of ionic strength on adsorption of surfactants on kaolinite clay. For example, adsorption of petroleum sulfonate, e.g., TRS-80, increases with ionic strength (Baviere, 1991).
This can be explained by a salting-out effect on the surfactant, and also because the thickness of the electric double layer at the surface of the kaolinite diminishes with salt, hence reducing the repulsion against sulfonate anions.
Effect of pH:
As discussed earlier, exchange between Na+ and H+ ions is an important process that may affect adsorption of surfactant on kaolinite clay. Therefore, it is expected that adsorption of dodecyl benzenesulfonate on Na-kaolinite is highly sensitive to hydrogen ion concentration (Hanna, 1979) . It was found that sulfonate adsorption increases markedly with increase in hydrogen ion concentration, particularly in the acidic pH range. In addition, a maximum adsorption of sodium dodecyl benzenesulfonate (SDDBS) on kaolinite was found in the acidic pH range, which corresponds to a compact monolayer with a molecular area of 33.7 Å2 per SDDBS molecule. However, the adsorption densities in the neutral and alkaline pH range were found to be only 25% and 12% of close packed monolayer, respectively. Ionic Environment: To compare effect of ionic environment on adsorption of surfactant on kaolinite clay, Bavière and co-workers investigated the effects of sodium carbonate and sodium hydroxide in NaCl brines on the adsorption of petroleum sulfonate on kaolinite clay (Baviere, 1991). It was found that at a constant ionic strength (I=0.448 M), from pure NaCl brine (pH=7) to pure Na2CO3 brine (pH=11.3), the effect of carbonates is pronounced only above pH=11. At low carbonate concentration, the pH increases strongly but does not decrease adsorption. The decrease of adsorption above a pH of about 10.8 seems to be due to the quantitative replacement of Cl- ions by CO3
2- ions. This replacement at constant ionic strength also contributes to a decrease in sodium ions concentration, and then to a decrease in sulfonate activity, that may partially explain the decrease in the adsorption. On the other hand, it was found that sodium hydroxide is much less effective than carbonate in decreasing adsorption of petroleum sulfonate on kaolinite. It is worth noting that adsorption in the presence of carbonate (pH=11.3) is about only one tenth of that in the presence of sodium hydroxide (pH=12.2).
39
Effect of Adsorption Temperature:
Xu and co-workers investigated the effect of temperature on adsorption of sodium oleate on kaolinite. It was found that there are adsorption plateaus at different temperatures (25, 35 and 40 °C) (Xu, 2001). Although adsorbed amount of the first plateau are almost constant at different temperatures, a decrease of adsorbed amounts of the second plateau and absorbed equilibrium concentrations of sodium oleate at the surface of kaolinite is observed with increase of the adsorption temperature under the same experimental conditions.
Nevshaia and co-workers (1996) determined adsorption of octylphenoxypoly(ethyleneoxy) ethanol (TX-114) on kaolinite at different temperatures (273, 298 and 308 K). It was found that, at low Ceq. or a low degree of coverage θ ( θ = Γ/Γmax), the monomers are adsorbed on the solid surface, displacing water molecules. This kind process has an exothermic nature. When the adsorption temperature increases, the adsorbed surfactant amount decreases. When the majority of the adsorption sites are covered by surfactant molecules, interactions take place between the adsorbed surfactant molecules to form micelles at the solid surface. This process is endothermic. Thus, at high Ceq. or a high degree of coverage, when the adsorption temperature is increased, the adsorption amount also rises. According to modern polymer adsorption theory (Scheutjens, 1979), this kind behavior is expected since the Flory-Huggins parameter χ for the oxyethylenic (EO) part increases with temperature (T) and it can be calculated by the equation:
χ(T) = (5.879 × 10 −3 )T − 1.6538 (1)
It means that an increase in adsorption temperature favors contacts between polyoxyethylenic chains over water−polyoxyethylenic chain interactions. Or, on other words, micelle formation is favored when the temperature increases. Effect of the Ratio of Liquid/Solid: Xu and co-workers (2001) measured adsorption amount of sodium oleate at the kaolinite/aqueous solution interface at different liquid/solid ratio(w/w) under the same experimental conditions. It was found that the adsorbed amount increases with increase of the ratio until it reached a steady and constant value, Γmax, i.e. the plateau was attained within 24 hours when the ratio was no less than 9.
Theoretically, the ratio of liquid/solid should not affect adsorption isotherm of a disperse system. However, in some cases, the ratio may affect the adsorbed amount at water/solid interface. For some Al3+ ions of the Al−O bond in kaolinite, substituted by some Si4+ ions, under natural condition, the surface of kaolinite shows a positive charge determined by the structure of kaolinite. However, surfactant solution may affect the charge on the surface. And the charged ions of kaolinite are ion-exchanged with the cations and anions in sodium oleate solution. Thus, the concentration of ions in the solution would change
40
when increasing the ratio of liquid/solid. Another cause is that the ion-exchange occurs easily between the solid surface and the solution phase due to the positive charge on the surface of kaolinite. Consequently, the concentration of ions would change when increasing the ratio of liquid/solid. The smaller the ratio is, the stronger is the interaction iof double layers at the interface of solution/kaolinite, and the less the adsorption amount. The general observation is that for anionic surfactants that the solid adsorption will decrease with an increase in temperature. In contrast, for nonionic surfactants the adsorption increases with an increase in temperature (Lewis, 1986). The key to understanding the adsorption of nonionic surfactants is related to the phase behavior. In particular, the adsorption increases markedly as the cloud point is approached. In fact, these authors show a correlation of adsorption to the difference between the use temperature and the cloud point. Generally, they recommend using nonionic molecules with larger molecular weight (both a larger lipophilic and a larger hydrophilic group); they found such molecules had less adsorption and Interpretation of Adsorption Maxima In studies of surfactant adsorption from aqueous solutions onto kaolinite clay surface, a number of investigators have reported finding of adsorption maxima. Hanna et al. (1976) suggested that the maximum may be an experimental artifact, arising from precipitation accompanying adsorption, surfactant trapping in dead end pores, or loss of adsorbed surfactant during the washing step sometimes taken to remove nonadsorbed surfactant. It seems unlikely that any one of these mechanisms could be the general explanation for all of the observations. Mukerjee and Anavil (19) have both suggested that micellar exclusion may be the cause of the maximum. This basic concept, not supported by quantitative arguments, proposes that a double layer reples micelles from pores in the substrate, thereby reducing the total adsorption at high concentration. Recently, Yang and coworkers (2002) proposed a mechanism responsible for the adsorption maximum. When aqueous surfactant solution contacts with kaolinite clay, the concentration of Ca2+ and Mg2+ in the solution increases due to the ion-exchange process. At low surfactant concentration, surfactant molecules exist in the solution as monomers. Meanwhile, the adsorption of surfactant increases with increase in the concentration. At high concentration, when the adsorption density of surfactant on kaolinite surface is high enough to make the concentration product of adsorbed surfactant anion piece and Ca2+ and Mg2+ greater than their solubility products, precipitate will be formed on the kaolinite surface. However, for further increase in surfactant concentration in aqueous solution, surfactant molecules aggregate and micelles are formed in the bulk solution, which have a strong ability to enhance the solubility of the precipitate. Consequently, the micelles compete with the surface of kaolinie for the adsorbed molecules and dissolve some of the precipitate on the surface. As a result, the adsorption decreases after a maximum.
41
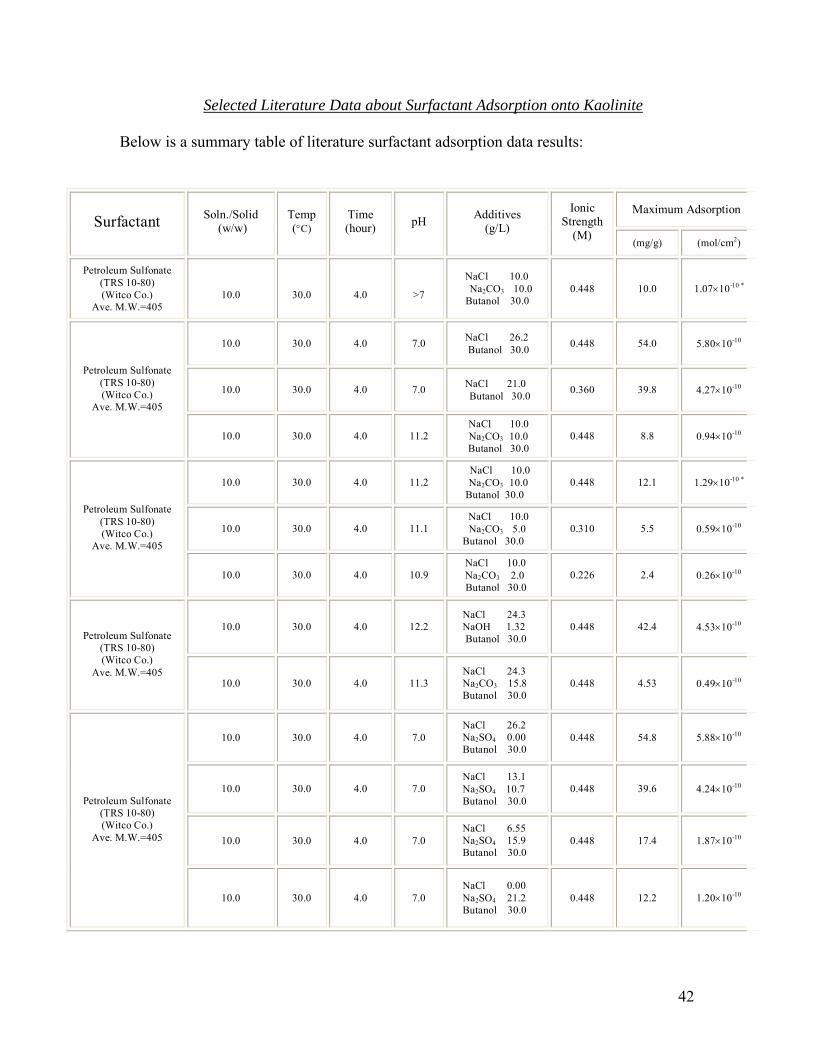
Selected Literature Data about Surfactant Adsorption onto Kaolinite Below is a summary table of literature surfactant adsorption data results:
Maximum AdsorptionSurfactant Soln./Solid
(w/w) Temp (°C)
Time (hour) pH Additives
(g/L)
Ionic Strength
(M) (mg/g) (mol/cm2)
Petroleum Sulfonate (TRS 10-80) (Witco Co.)
Ave. M.W.=405
10.0
30.0
4.0
>7
NaCl 10.0 Na2CO3 10.0
Butanol 30.0 0.448 10.0 1.07×10-10 *
10.0 30.0 4.0 7.0 NaCl 26.2 Butanol 30.0 0.448 54.0 5.80×10⁻¹⁰
10.0 30.0 4.0 7.0 NaCl 21.0 Butanol 30.0 0.360 39.8 4.27×10⁻¹⁰
Petroleum Sulfonate (TRS 10-80) (Witco Co.)
Ave. M.W.=405
10.0 30.0 4.0 11.2 NaCl 10.0 Na2CO3 10.0 Butanol 30.0
0.448 8.8 0.94×10⁻¹⁰
10.0 30.0 4.0 11.2 NaCl 10.0 Na2CO3 10.0
Butanol 30.0 0.448 12.1 1.29×10-10 *
10.0 30.0 4.0 11.1 NaCl 10.0 Na2CO3 5.0
Butanol 30.0 0.310 5.5 0.59×10⁻¹⁰
Petroleum Sulfonate (TRS 10-80) (Witco Co.)
Ave. M.W.=405
10.0 30.0 4.0 10.9 NaCl 10.0 Na2CO3 2.0 Butanol 30.0
0.226 2.4 0.26×10⁻¹⁰
10.0 30.0 4.0 12.2 NaCl 24.3 NaOH 1.32 Butanol 30.0
0.448 42.4 4.53×10⁻¹⁰
Petroleum Sulfonate (TRS 10-80) (Witco Co.)
Ave. M.W.=405 10.0 30.0 4.0 11.3
NaCl 24.3 Na2CO3 15.8 Butanol 30.0
0.448 4.53 0.49×10⁻¹⁰
10.0 30.0 4.0 7.0 NaCl 26.2 Na2SO4 0.00 Butanol 30.0
0.448 54.8 5.88×10⁻¹⁰
10.0 30.0 4.0 7.0 NaCl 13.1 Na2SO4 10.7 Butanol 30.0
0.448 39.6 4.24×10⁻¹⁰
10.0 30.0 4.0 7.0 NaCl 6.55 Na2SO4 15.9 Butanol 30.0
0.448 17.4 1.87×10⁻¹⁰
Petroleum Sulfonate (TRS 10-80) (Witco Co.)
Ave. M.W.=405
10.0 30.0 4.0 7.0 NaCl 0.00 Na2SO4 21.2 Butanol 30.0
0.448 12.2 1.20×10⁻¹⁰
42
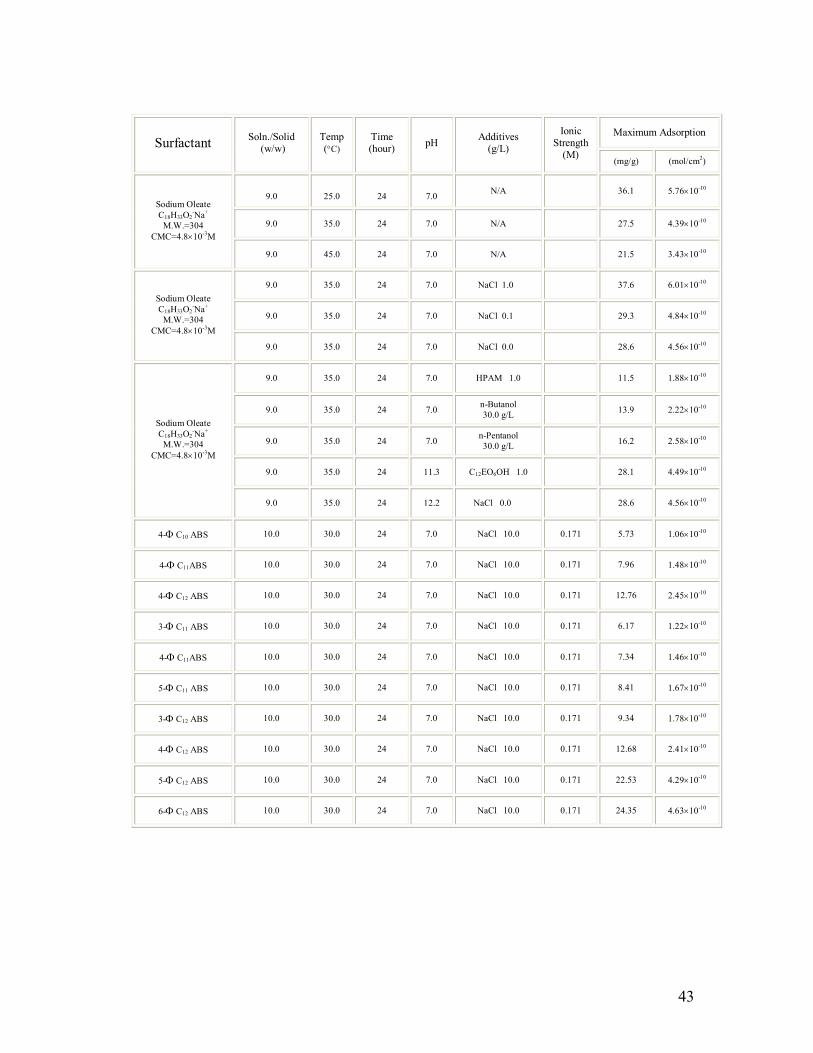
Maximum Adsorption
Surfactant Soln./Solid (w/w)
Temp (°C)
Time (hour) pH Additives
(g/L)
Ionic Strength
(M) (mg/g) (mol/cm2)
9.0
25.0
24
7.0 N/A 36.1 5.76×10⁻¹⁰
9.0 35.0 24 7.0 N/A 27.5 4.39×10⁻¹⁰
Sodium Oleate C18H33O2
-Na+ M.W.=304
CMC=4.8×10⁻³M
9.0 45.0 24 7.0 N/A 21.5 3.43×10⁻¹⁰
9.0 35.0 24 7.0 NaCl 1.0 37.6 6.01×10⁻¹⁰
9.0 35.0 24 7.0 NaCl 0.1 29.3 4.84×10⁻¹⁰
Sodium Oleate C18H33O2
-Na+ M.W.=304
CMC=4.8×10⁻³M
9.0 35.0 24 7.0 NaCl 0.0 28.6 4.56×10⁻¹⁰
9.0 35.0 24 7.0 HPAM 1.0 11.5 1.88×10⁻¹⁰
9.0 35.0 24 7.0 n-Butanol 30.0 g/L 13.9 2.22×10⁻¹⁰
9.0 35.0 24 7.0 n-Pentanol 30.0 g/L 16.2 2.58×10⁻¹⁰
9.0 35.0 24 11.3 C12EO6OH 1.0 28.1 4.49×10⁻¹⁰
Sodium Oleate C18H33O2
-Na+ M.W.=304
CMC=4.8×10⁻³M
9.0 35.0 24 12.2 NaCl 0.0 28.6 4.56×10⁻¹⁰
4-Φ C10 ABS 10.0 30.0 24 7.0 NaCl 10.0 0.171 5.73 1.06×10⁻¹⁰
4-Φ C11ABS 10.0 30.0 24 7.0 NaCl 10.0 0.171 7.96 1.48×10⁻¹⁰
4-Φ C12 ABS 10.0 30.0 24 7.0 NaCl 10.0 0.171 12.76 2.45×10⁻¹⁰
3-Φ C11 ABS 10.0 30.0 24 7.0 NaCl 10.0 0.171 6.17 1.22×10⁻¹⁰
4-Φ C11ABS 10.0 30.0 24 7.0 NaCl 10.0 0.171 7.34 1.46×10⁻¹⁰
5-Φ C11 ABS 10.0 30.0 24 7.0 NaCl 10.0 0.171 8.41 1.67×10⁻¹⁰
3-Φ C12 ABS 10.0 30.0 24 7.0 NaCl 10.0 0.171 9.34 1.78×10⁻¹⁰
4-Φ C12 ABS 10.0 30.0 24 7.0 NaCl 10.0 0.171 12.68 2.41×10⁻¹⁰
5-Φ C12 ABS 10.0 30.0 24 7.0 NaCl 10.0 0.171 22.53 4.29×10⁻¹⁰
6-Φ C12 ABS 10.0 30.0 24 7.0 NaCl 10.0 0.171 24.35 4.63×10⁻¹⁰
43
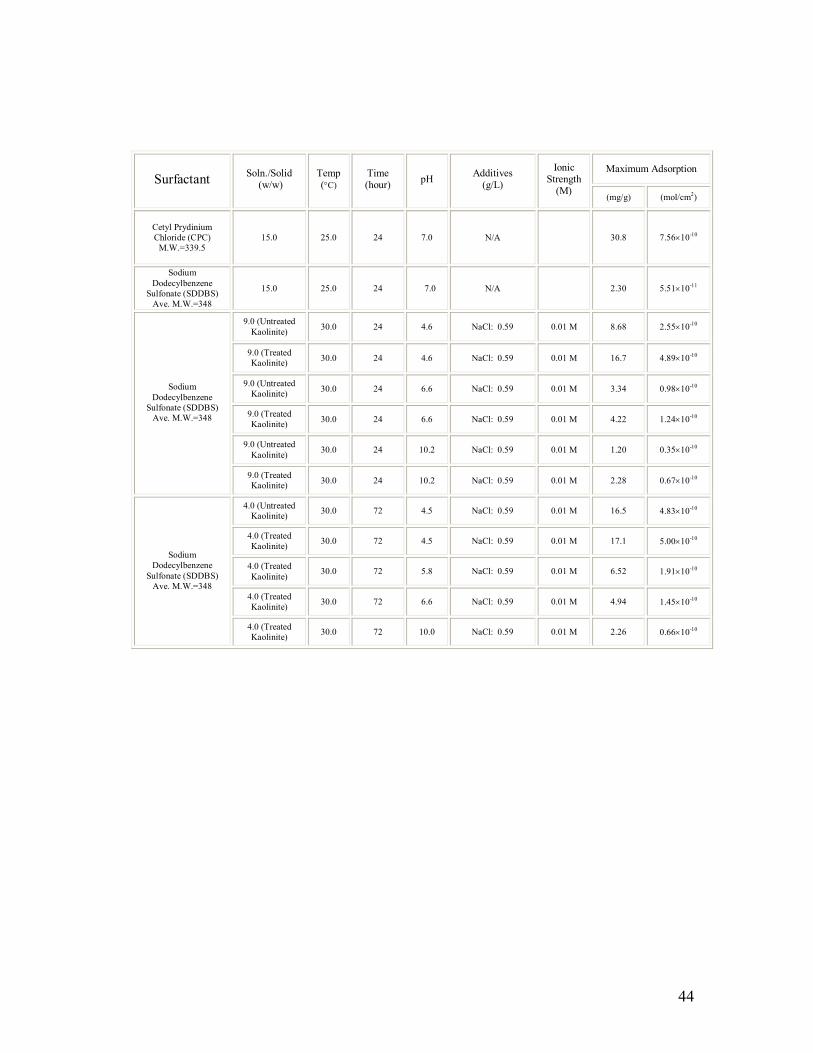
Maximum Adsorption Surfactant Soln./Solid
(w/w) Temp (°C)
Time (hour) pH Additives
(g/L)
Ionic Strength
(M) (mg/g) (mol/cm2)
Cetyl Prydinium Chloride (CPC)
M.W.=339.5
15.0 25.0 24 7.0 N/A 30.8 7.56×10⁻¹⁰
Sodium Dodecylbenzene
Sulfonate (SDDBS) Ave. M.W.=348
15.0 25.0 24 7.0 N/A 2.30 5.51×10⁻¹¹
9.0 (Untreated Kaolinite) 30.0 24 4.6 NaCl: 0.59 0.01 M 8.68 2.55×10⁻¹⁰
9.0 (Treated Kaolinite) 30.0 24 4.6 NaCl: 0.59 0.01 M 16.7 4.89×10⁻¹⁰
9.0 (Untreated Kaolinite) 30.0 24 6.6 NaCl: 0.59 0.01 M 3.34 0.98×10⁻¹⁰
9.0 (Treated Kaolinite) 30.0 24 6.6 NaCl: 0.59 0.01 M 4.22 1.24×10⁻¹⁰
9.0 (Untreated Kaolinite) 30.0 24 10.2 NaCl: 0.59 0.01 M 1.20 0.35×10⁻¹⁰
Sodium Dodecylbenzene
Sulfonate (SDDBS) Ave. M.W.=348
9.0 (Treated Kaolinite) 30.0 24 10.2 NaCl: 0.59 0.01 M 2.28 0.67×10⁻¹⁰
4.0 (Untreated Kaolinite) 30.0 72 4.5 NaCl: 0.59 0.01 M 16.5 4.83×10⁻¹⁰
4.0 (Treated Kaolinite) 30.0 72 4.5 NaCl: 0.59 0.01 M 17.1 5.00×10⁻¹⁰
4.0 (Treated Kaolinite) 30.0 72 5.8 NaCl: 0.59 0.01 M 6.52 1.91×10⁻¹⁰
4.0 (Treated Kaolinite) 30.0 72 6.6 NaCl: 0.59 0.01 M 4.94 1.45×10⁻¹⁰
Sodium Dodecylbenzene
Sulfonate (SDDBS) Ave. M.W.=348
4.0 (Treated Kaolinite) 30.0 72 10.0 NaCl: 0.59 0.01 M 2.26 0.66×10⁻¹⁰
44
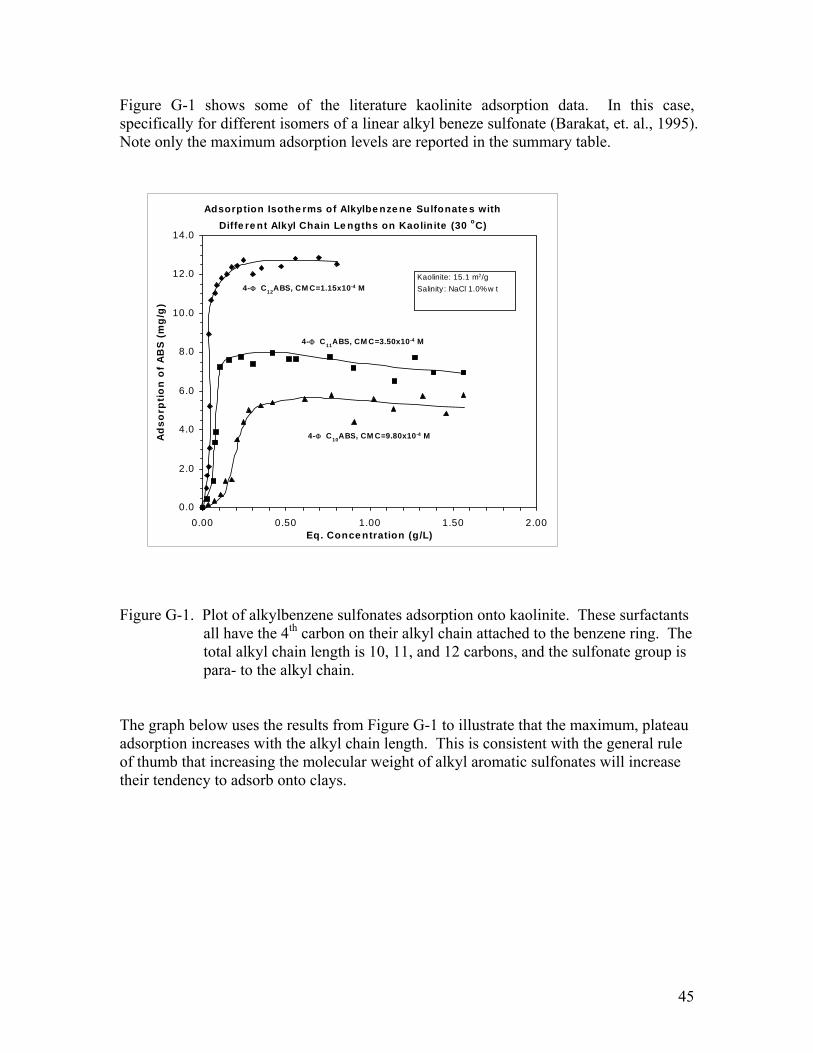
Figure G-1 shows some of the literature kaolinite adsorption data. In this case, ecifically for different isomers of a linear alkyl beneze sulfonate (Barakat, et. al., 1995). ote only the maximum adsorption levels are reported in the summary table.
Figure G-1. Plot of alkylbenzene sulfonates adsorption onto kaolinite. These surfactants all have the 4th carbon on their alkyl chain attached to the benzene ring. The total alkyl chain length is 10, 11, and 12 carbons, and the sulfonate group is
para- to the alkyl chain.
he graph below uses the results from Figure G-1 to illustrate that the maximum, plateau dsorption increases with the alkyl chain length. This is consistent with the general rule f thumb that increasing the molecular weight of alkyl aromatic sulfonates will increase eir tendency to adsorb onto clays.
spN
Adsorption Isothe rms of Alkylbe nze ne Sulfonate s with Diffe re nt Alkyl Chain Le ngths on Kaolinite (30 oC)
0.0
2.0
4.0
6.0
8.0
10.0
12.0
14.0
0.00 0.50 1.00 1.50 2.00Eq. Conce ntration (g/L)
Ad
sorp
tio
n o
f A
BS
(m
g/g
)
4-Φ C12ABS, CM C=1.15x10⁻⁴ M
4-Φ C11ABS, CM C=3.50x10⁻⁴ M
4-Φ C10ABS, CM C=9.80x10⁻⁴ M
Kaolinite: 15.1 m2/gSalinity : NaCl 1.0%w t
Taoth
45
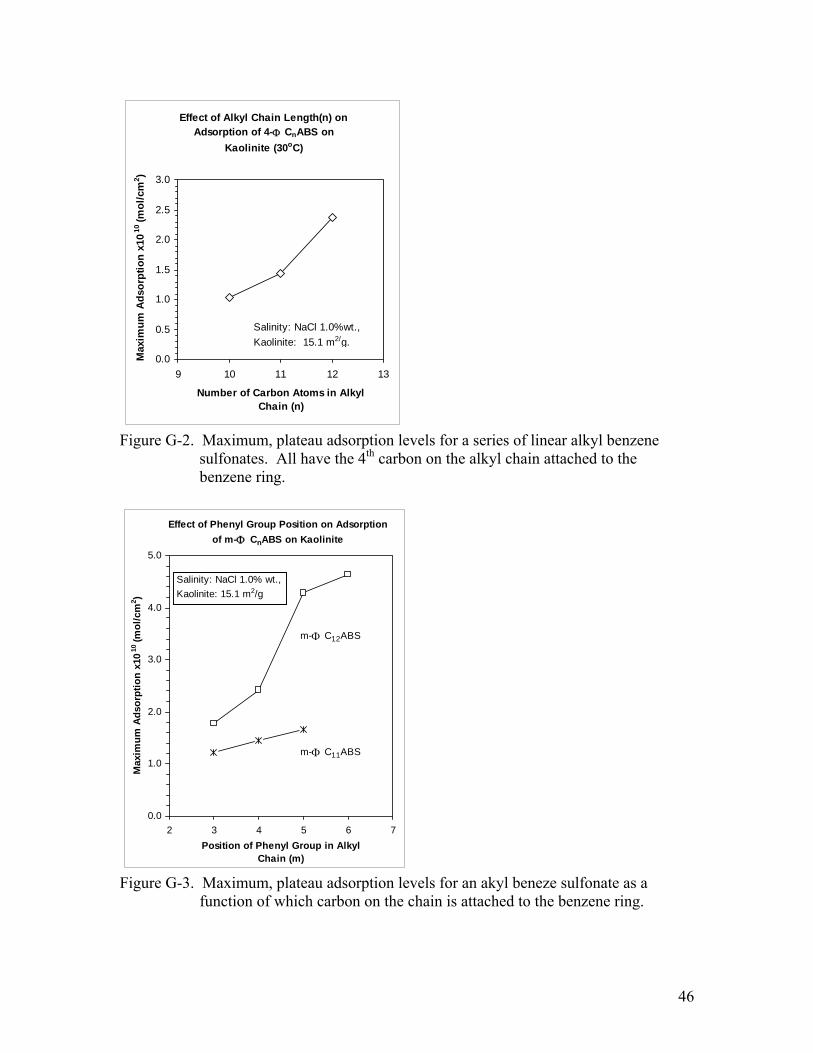
Effect of Alkyl Chain Length(n) on Adsorption of 4-Φ CnABS on
Kaolinite (30oC)
0.0
0.5
1.0
1.5
2.0
2.5
3.0
9 10 11 12 13
Number of Carbon Atoms in Alkyl Chain (n)
Max
imum
Ads
orpt
ion
x1010
(mol
/cm
2 )
Salinity: NaCl 1.0%wt.,Kaolinite: 15.1 m2/g.
Figure G-2. Maximum, plateau adsorption levels for a series of linear alkyl benzene sulfonates. All have the 4th carbon on the alkyl chain attached to the benzene ring.
Effect of Phenyl Group Position on Adsorption of m-Φ CnABS on Kaolinite
0.0
4.0
l/cm
1.0
2.0
Max
imum
Ad
3.0
x10
10
5.0
2 3 4 5 6 7Position of Phenyl Group in Alkyl
Chain (m)
sorp
tion
2 )(m
o
Salinity: NaCl 1.0% wt.,Kaolinite: 15.1 m2/g
Figure G-3. Maximum, plateau adsorption levels for an akyl beneze sulfonate as a function of which carbon on the chain is attached to the benzene ring.
m-Φ C12ABS
m-Φ C11ABS
46
Appendix B presents graphs of the surfactant adsorption data taken from various literature sources. H. References
Abe, M., et. al. J. Colloid Interface Sci., 119 422, 1987. Acosta, E., Uchiyama, H., Sabatini, D.A., and Harwell, J.H.: “The role of hydrophilic linkers”, J. Surfactants and Detergents, 5, 151-157, April 2002. Alami, E., Holmberg, K., and Eastoe, J.: “Adsorption Properties of Novel Gemini Surfactants with Nonidentical Head Groups”, J. Coll. Inter. Sci., 247, 447 – 455, 2002. Andrews, C., et. al.: “Preliminary Studies of the Behavior of Some Commercially Available Surfactants in Hydrocarbon-Brine-Mineral Systems”, Proceedings of the third European Symposium on Enhanced Oil Recovery, in Bournemouth, U.K., edited by F. John Fayers 62-80, 1981.
5, 1996.
petitive Adsorption of Mixtures of Ethoxylated ite and Quartz”, J. Pet. Sci. Eng., 6, 107-124, 1991.
Austad, T.: “A Review of Retention Mechanisms of Ethoxylated Sulfonates in Reservoir Cores”, paper SPE 25174, presented at SPE Symposium on Oilfield Chemistry, New Orleans, 2-5 March 1993. Austad, T. and Strand, S.: “Chemical Flooding of Oil Reservoirs 4. Effects of temperature and pressure on the middle phase solubilization parameters close to optimum flood conditions”, Colloids and Science A. Physiochemical and Engineering Aspects, 108, 243-252, 1996. Austad, T., et. al.: “Chemical Flooding of Oil Reservoirs Part 9. Dynamic Adsorption of Surfactant onto Sandstone cores from Injection Water with and Without Polymer Present”, Colloids and Science A. Physiochemical and Engineering Aspects, 127, 69-82, 1997. Aveyard, R., et. al.: “Surface and colloid chemistry of systems containing pure sugar surfactant”, Langmuir, 14, 4699-4709, August 18, 1998. Aveyard, R., Binks, B.P., and Fletcher, P.D.: “Interfacial Tension and Aggregate
989).
Aoudia, M., Wade, W., and Weerasooriya, J. Dispersion Sci. Technol., 16, 115-13
ustad, T., et. al.: “Adsorption I. ComASurfactants onto Kaolin
Structure in C12E5/Oil/Water Microemulsion Systems”, Langmuir, 5, 1210-1217 (1
alzer, D. and Kosswig, Tenside Surf. Det., 16 256 1979. B
47
Balzer, D., Proceedings 2nd Eurpoean Meeting, p.21, 1982. Balzer, D., Tenside Surf. Det., 28, 419, 1991.
Shah, D.O., J. Colloid Interface Science, 85, 451, 1978.
. Eng., 57, 203-210, 1979.
aviěre, M.; Ruaux, E.; Defives, D., paper SPE 21031, 327, 1991.
aviere, M., Bazin, B., Nolk, C.: “Surfactants for EOR: Olefin Sulfonate Behavior at
991.
PE 75186, presented at SPE/DOE Symposium on Improved il Recovery, Tulsa, 13-17 April 2002.
oek, E.S.; Coveney, P.V.; Skipper, N.T.; Langmuir, 11, 4629, 1995a.
an, T.A.B.M. and Daane, G.J.R.: “Effect of Surfactant Structure on Phase Behavior f Alkylxylenesulfonate/Crude-Oil/Brine Systems”, SPE Res. Eng., 53-60, January 1986.
Muddy Field Low-Tension lood Demonstration Project”, paper SPE 17536 presented at the Rocky Mountain
ou-Mikael, Sami, et. al.: “Minas Surfactant Field Trial Tests Two Newly Designed nted at SPE Asia Pacific Oil
onference, Brisbane, Australia, 16-18 October, 2000.
Bansel, V.K. and
Bansel, B.B., Hornof, V., and Neale, G.H., Can. J. Chem Barakat, Y, et.al.: “Apha Olefin Sulfonates for Enhanced Oil Recovery”, 2nd European Symposium on EOR”, Paris, 5-10 November, 1982. Barakat, Y., et. al., Indian J. of Chem. Tech., 2, May 1995. B Baviěre, M, Bazin, B., and Mileo, J.C.: “Physicochemical propertie of sulfonated fattyacid esters for oil recovery by surfactant flooding”, Coll. and Sci., 52, 301-313, 1991. BHigh Temperature and Hardness”, paper 14933, Soc. Pet. Eng. J., 1988. Baviere, M., Bazin, B., Mileo, J.C.: “Physicochemical Properties of Sulfonated Fatty Acid Ester for Oil Recovery of Surfactant Flooding”, Colloids and Surfaces, 52, 301-313, 1 Berger, P. and Lee, C.H.: “Ultra-low Concentration Surfactants for Sandstone and Limestone Floods”, paper SO Berger, P.D. and C.H. Lee: “New Anionic Alkylaryl Surfactants Based on Olefin Sulfonic Acids”, J. Surfactants, 45, 345, 2000. B Boek, E.S.; Coveney, P.V.; Skipper, N.T.; J. Am. Chem. Soc., 117,12608, 1995b. Bolsmo Borah, M.T. and Gregory, M.D.: “A Summary of the Big FRegional Meeting, Casper, WY, 11-13 May, 1988. BSurfactants with High EOR Potential”, paper 62488, preseC
48
Bourrel, M., and Schechter, R.S.: Microemulsions and Related Systems, Marcel
surfactants”, uropean Polymer J., 38, 1457-1463, 2002.
ases, J. M.; Villieras, F. Langmuir, 8, 1251, 1992.
erfacial Tension”, paper SPE 5813, resented at the SPE Symposium on Improved Oil Recovery, 22-24 March, 1976.
hattopadahyay, A.K., Shah, D.O., and Ghaicha, L.: “Double-Tailed Surfactants and gmuir, 8, 27-30,
nuary 1992.
.: Some Anomalies Between the Surfactants Comprising Linear and Branched
hiu, Y.C. and Hwang, H.J.: “The Use of Carboxymethyl Ethoxylates in Enhanced Oil
.L.: “An Evaluation of the Robinson M-1 Commercial Scale Demonstration roject of Enhanced Oil Recovery by Micellar-Polymer Flood”, Report DOE/BC/10830-
& Interface Sci., 37(1), 186, 1971.
esai, J.D. and Banat, I.M.: “Microbial Production of Surfactants and Their Commercial 1997.
cial ensions Between Hydrocarbons and Water”, J. Colloid Interface Sci. 59, 525-531,
oe, P.H., El-Emary, M., Wade, W.H., and Schechter, R.S.: “Surfactants for producing i.
oe, P.H., El-Emary, M., and Wade, W.H.: “Surfactants for Producing Low Interfacial Am.
Dekker, New York, 1988. Cao, Y. and Huilin, L.: “Interfacial activity of a novel family of polymericE C Cash, R.L., et. al.: “Modeling Crude Oils for Low Intp CTheir Chain-Length Compatibility in Water-in-Oil Emulsions”, LanJa Chattopadahyay, A.K., Ghaicha, L, Oh, S.G., Knight, J., Moaddel, T., and Frieberg, S.E“Hydrocarbon Chains”, J. Indian Chemical Society, 70, 353-364, April-May 1993. CRecovery”, Colloids and Surfaces, 28, 53-65, 1987. Cole, EP10, U.S. DOE, Bartlesville, OK, December, 1988. Conley, R. F.; Althoff, A. C., J. Colloid Delville, A.; Langmuir, 7, 547, 1997. DPotential”, Microbiology and Molecular Biology Reviews, 47-64, March Doe, P.H. and Wade, W.H.: “Alkyl Benzene Sulfonates for Producing Low InterfaT1977a. DLow Interfacial Tensions I: Linear Alkyl Benzene Sulfonates”, J. Colloid Interface Sc59, 570-577 1977b. DTensions II: Linear Alkyl Benzene Sulfonates with Additional Alkyl Substituents”, J.Chem Oil Chem Soc, 55, 505-512, 1978a.
49
Doe, P.H., El-Emary, M., Wade, W.H., and Schechter, R.S.: “Surfactants for Producing il
78b.
ions”, from Chemistry of Oil Recovery
Low Interfacial Tensions III: Di and Tri n-Alkylbenzenesulfonates”, J. Am. Chem OChem Soc, 55, 513-520, 19 Doe, P.H., El-Emary, M., Wade, W.H., and Schechter, R.S.: Chapter 2 “The Influence ofSurfactant Structure on Low Interfacial Tens ,
hansen and Berg, ed., American Chemical Society, 1978c.
onaldson, E.C., Chilingarian, G.V., and Yen, T.F., enhanced oil recovery, II processes
owd, Timothy, Improved Oil Recovery, Interstate Oil Compact Commission, March,
arkovic, Z., J. Colloid Interface Sci., 76, 151, 1981.
[Suppl.],
Flooding: Petroleum Sulfonate omposition Efficacy Studies”, SPEJ 191-199, August, 1973.
ale, W.W., Puerto, M.C., and Aschcraft, T.L.: “Propoxylated ethoxylated surfactants Exxon, U.S. Patent, No. 4,293,4289, October.6,
981.
Feb. y
haicha, L., et. al.: “Monolayers of Mixed Surfactants at the Oil-Water Interface,
oldburg, A., Price, H., and Paul, G.W.: “Selection of Reservoirs Ameneable to Micellar
Jo Dand operations, Elsevier, New York, 1989. D1983. Eicke, H. and M Endo, H., et. al.: “Amphiphilic block copolymers as efficiency boosters in microemulsions: a SANS investigation of the role of polymers”, Appl. Phys. AS392 – S395, 2002. Forster, T., Gucjenbiehl, B., Hensen, H., and von Rybinski, W., Progr, Colloid Polym. Sci. 101, 105, 1996. Fukuda, K., Soderman, O., Lindman, B., and Shinoda, Langmuir, 9, 2921, 1993. Gale, W.W. and Sandvik, E.I.: “Tertiary SurfactantC Gand method of recovery oil therewith”, 1 Gale, Maerker, J.W. and Gale, W.W.: “Design for Loudon”, SPE Res. Eng., 36, Gao, S., et. al.: “Alkaline/Surfactant/Polymer Pilot Performance of the West Central Daqing Oil Field”, SPE Reservoir Engineering, August 1996. GHydrophobic interactions, and Stability of Water-in-Oil Emulsions”, Langmuir, 11, 585-590, 1995. GFlooding”, EngDOE/BC/00048 and 00051-29, August, 1985.
50
Graciaa A, et. al.: “Criteria for Structuring Surfactants to Maximize Solubilization of Oiland Water I: Commercial Non-ionics”, SPE/DOE paper 9815, presented at the Joint Symposium on EOR, Tulsa, OK,
April 5-8, 1981.
3.
raciaa A, Lachaise J, Cucuphat C, Bourrel M, Salager JL.:” Improving Solubilization in ,
uyot, A., “Polymerizable Surfactants”, Chapter 10 from Novel Surfactants
Graciaa A, Lachaise J, Cucuphat C, Bourrel M, Salager JL.: “Improving Solubilization in Microemulsions with Additives.1. The Lipophilic Linker Role.” Langmuir, 9, 669, 199 GMicroemulsions With Additives.2. Long chain alcohol as lipophilic linkers:, Langmuir. 93371, 1993. Grim, R. E. “Clay Mineralogy” McGraw-Hill, New York, 2nd Ed. p. 193, 1968.
, ed. K.
embling
anna, H. S.; Goyal, A.; Somasundaran, P. Paper No. 239, Presented at VII 8,
697, November, 1971.
ki, G.J., et. al.: “Evaluation of the Salinity Gradient Concept in Surfactant
GHolmberg, Marcel Dekker, New York, 1998. Hait, S.K. and Moulik, S.P.: “Gemini surfactants: a distinct class of self-assmolecules”, Current Science, 82, 1101 – 1111, May, 2002. HInternational Congress on Surface Active Substrances, Moscow, Russia, Sept. 12-11976. Hanna, H. S.; Somasundaran, P. J. Colloid & Interface Sci., 70(1), 181, 1979. Halbert, W.G.: “Miscible Waterflooding Using a Phosphate Ester Solubilizer”, paper SPE 3presented at SPE the California Regional Meeting, Los Angeles, 4-5 Hill, H.J. and Lake, L.W.: “Cation Exchange in Chemical Flooding: Part 3 – Experimental”, Soc. Pet. Eng. J., 18, 445-456 (1978).
irasaHFlooding”, Soc. Pet. Eng. J., 23, 486-500 (1983). Holmberg, K., Novel Surfactants, Marcel Dekker, New York, 1998.
ornof, V. and R. Hombek, R.: “Surface Active Agents Based on Propoxylated HLigonsulfonate”, J. App. Polym. Sci., 41, 2391-2398, 1990. Hung, H. and Shreve, G.S.: “Effect of Hydrocarbon Phase on interfacial and
hermodynaT mic Properties of Two Anionic Glyycolipid Biosurfactants in
ulsion Phase that ine”, J. Coll. Interface Sci., 71, 408-426, May 1979.
Hydrocarbon/Water Systems”, J. Phys. Chem B 105, 12596-12600, 2001.
uh, C.: “Interfacial Tensions and Stabilizing Ability of a MicroemHCoexists with Oil and Br
51
Huh, C.: “Equilibrium of a Microemulsion That Coexists With Oil or Brine”, Soc. Pet. Eng. J., 829 – 860, October 1983. Jacobson, J.K., et. al.: “Low Interfacial Tensions Involving Mixtures of Surfactants”,
kobs, B., et. al.: “Amphiphillic Block Copolymers as Efficiency Boosters for
har, et. al.: “Use of Surfactants to Recover Oils from Groundwater”, SPE 6753, presented, SPE/EPA/DOE E&P Environmental Conference, San Antonio, TX, 26-
iate , 36, 5491-5497, 2002.
OR,
ahlweit, M., Busse, G., and Faulhaber, B: “Preparing Nontoxic Microemulsions with 2, 861-
62, 1996.
y
an., 85, T180-T183, 1984.
terfaces 93.
Surfactants on
and structure of
d at Enhanced
Paper SPE 6002, SPE Annual Meeting, New Orleans, LA, 3-6 October, 1976. JaMicroemulsions”, Langmuir, 15, 6707-6711, 1999. Jayanti, Shek628 February 2001. Jayanti, S., et. al.: “Laboratory Evaluation of Custom-Designed Surfactants to RemedNAPL Source Zones”, Environ. Sci. Technol. Kalpakci, B., et. al., paper SPE/DOE 20220, presented at SPE/DOE Symposium on ETulsa, 1990. Kahlweit, M.,: “General Patterns of the Phase Behavior of Mixtures of Water, Nonpolar Solvents, Amphiphiles, and Electrolytes, 2”, Langmuir, 5, 305-315, 1989. KAlkyl Monoglucosides and the Role of Alkanediols as Cosolvents”, Langmuir, 18 Knagga, E.A., et. al.: “Petroleum Sulfonate Utilization in Enhanced Oil RecoverSystems”, SPE Paper 6006, New Orleans, LA, 3-6 October, 1976. Kumar, A., Neale, G.H., and Hornof, V., Pulp Paper C Kunieda, H. and Yamagata, M.: “Mixing of Nonionic Surfactants at Water-Oil Inin Miocroemulsions”, Langmuir, 9, 3345-3351, 19 Kunieda, H., Nakano, A., and Akimaru, M.: “The Effect of Mixing ofSolubilization in a Microemulsion System”, J. Coll. and Int. Sci., 170, 78-84, 1995. Kurumanda, K., Shoi, A., Harada, M.: “Dynamical behaviorcoincentrated water-in-oil microemulsions in the sodium bis(2-ethylhexyl)phosphate systems”, J. Phys. Chem.., 99, 16982-16990, 1995. Lake, L.W.: “A Technical Survey of Micellar Polymer Flooding”, presenteOil Recovery, Southern Methodist University, Dallas, Texas, November, 1984. Lake, L.W.: Enhanced Oil Recovery, Prentice-Hall, Inc., 1989.
52
Lewis, S.J.,Verkruyse, L.A., and Salter, S.J.: “Selection of Nonionic Surfactants for Minimal Adsorption and Maximized Solubilization”, paper SPE/DOE 14910, presented t SPE/DOE Symposium on EOR, Tulsa, OK, April 20-23, 1986.
urfaces om Aqueous Solutions”, Langmuir, 12, 5052-5063, 1996.
loyd, M. K.; Conley, R. F. Clays Clay Miner., 18, 37, 1970.
uciani, L., Denoyel, R., and Rouquerol, J.: “Poly(ethoxy) anionic surfactants:
Proc. 9 Natl. Conf. On Clay and Clay Mineralogy, Pergamon Press, ew York, p.36, 1964.
nd amphoteric am-forming surfactants on different rock types”, Coll. and Surf., 68, 37 – 53, 1992.
te ectrolyte/Alkane Systems”, J. Disp. Sci. and Tech., 8, 157-172, 1987.
and ngineering Aspects,
07, 57-75 (1996).
eyers, J.J., Pitts, M.J., and Wyatt, K.: “Alkaline-Surfactant-Polymer Flood of the
.
h and
inana-Perez, M., Graciaa, A., Lachaise, J., and Salager, J., J. Colloids Surf. A, 100,
organ, J.C., Schechter, R.S., and W.H. Wade: “Improved Oil Recovery by Surfactant Acad. Press, Inc, N.Y.
977).
a Li, B. and Ruckenstein, E.: “Adsorption of Ionic Surfactants on Charged Solid Sfr L Luciani, L.; Denoyel, R. J. Colloid & Interface Sci., 88, 75, 1997. Lmicellization and adsorption at the solid/liquid interface”, Colloids and Surfaces A: Physiochemical and Engineering Aspects, 178, 297-312, 2001. Manne, S.; Gaub, H. E. Science, 270, 1480, 1995. Martin, R. T. th
N Mannhardt, K, Schramm, L.L., and Novosad, J.J.: “Adsorption of anionic afo Masahiko, A., et. al.: “Phase Behavior of Branched Tail Ethoxylated CarboxylaSurfactant/El Maurice, P.A.: “Application of atomic-force microscopy to environmental colloid surface chemistry”, Colloids and Science A: Physiochemical and E1 MWest/Kiehl, Minnelusa Unit”, paper SPE 24144 presented at the SPE/DOE Enhanced Oil Recovery Symposium, Tulsa, OK, 22-24 April, 1992. Michels, A.M., et. al.: “Enhanced Waterflooding Design with Dilute Surfactant Concentration for North Sea Conditions”, SPE Reservoir Engineering, (August 1996) Mihailescu, M., et. al.: “Dynamics of bicontinuous microemulsion phases witwithout amphiphilic block-coplymers”, J. Chem. Phys., 115, 9563 – 9577, 2001. M217-224, 1995. Mand Polymer Flooding”, D.O. Shan and R.S. Schechter, editors, (1
53
Mukherjee, S. K.; Gangully, A. K. Ind. J. Phys., 24, 223, 1953. Mukerjee, P.; Anavil, A. in “Adsorption at Interfaces” Mittal, K. L. Ed. P.107,
elson, R.C., and Pope, G.A.: “Phase Relationships in Chemical Flooding”, Transactions, IME, 265, 325-338 (1976).
evskaia, D. M.; Guerrero-Ruĩz, A.; “Adsorption of Polyoxyethylenic Surfactants on Structure and Solid
urface Nature”, López-GonzÁlez, J. D., Colloid & Interface Sci., 181, 571, 1996.
f Alkyl Polyglcosides for pplications in Detergent and Cleaning Agents”, Fett/Lipid, 98, 363-369, 1996.
ns Containing Polyethylene Glycol Additives”, paper SPE/DOE 4151, presented the SPE/DOE Enhanced Oil Recovery Symposium, Tulsa, 22-24 April,
ttewill, R.H.: “Introduction” Surfactants. T.F. Tadros (ed.), Academic Press, San
eltonen, L., Hirvonen, J., and Yliruusi, J.:, “The Behavior of Sorbitan Surfactants at the
itts, M.J.: “Recent Field Work in the United States with Alkali-Surfactant”, presented at ctober,
eypoux, F., et. al.: “Recent trends in the biochemistry of surfactin”, Appl. Microbiol
adke, C..: ”Fundamentals of Foam Flow in Porous Media”, NSF Workshop report, Use
ahlm, R., Ochesner, U.A., Olvera, C., Braninger, M., Messner, P., Lam, J.S., and
gene that encodes rhamnosyltransferase 2, an enzyme responsible for di-amnolipid biosynthesis”, Mol. Microbio., 40:708-718 (2001)
at E 7 Symposium on Enhanced Oil Recovery, Tulsa, OK, 22-25 April, 1990.
Amer. Chem. Soc. Symp. Ser. No. 8, ACS, Washington, D. C. 1975 NA NQuartz, Kaolin, and Dolomite: a Correlation between Surfactant S Nickel, D., von Rybinski, W., Kutschmann, E.M., Stubenrauch, C., and Findenegg, G.H.: “The Importance of the Emulsifying and Dispersing Capacity oA Osterioh, W.T. and Jante, M.J.: “Surfactant-Polymer Flooding with Anionic PO/EO Surfactant Microemulsio21992. OFrancisco, 1-18 (1984). PWater-Oil Interface: Straight-Chained Hydrocarbons from Pentanes to Dodecane as an Oil Phase”, J, Coll. Interface Sci., 240, 272-276, 2001. Pthe NSF Workshop, Use of Surfactants for Improved Petroleum Recovery, 22-23 O2001. PBiotechanol (51) 533-563 (1999). Rof Surfactants for Improved Petroleum Recovery”, Houston, October 22-23, 2001. RSoberon-chavez, G., “Cloning and function characterization of the Pseudomonas aeruginosa rhlC th Reppert, T.R.: “Second Ripley Surfactant Flood Pilot Test, SPE/DOE 20219, presented SPE/DO th
54
Reid, V. M.; Longman, G. E.; Heinech, E. Tenside, 4(9), 292, 1967; 5(3), 90, 1968.
cta
abatini, D.A., Acosta, E., and Harwell, J.H.: “Linker Molecules in Surfactant Mixtures”,
06, PE Intl. Meeeting on Petroleum Engineering, Beijing, March 17-20, 1986.
eredyuk, V., et. al., : “Adsorption of zwitterionnic gemini surfactants at the air-water 258,
t. R.: ”Mobility Control by Polymers”, NSF Workshop report, Use of Surfactants r Improved Petroleum Recovery”, Houston, October 22-23, 2001.
r, R.S.: Improved Oil Recovery by Surfactant and Polymer looding, Academic Press, New York (1977).
s”, paper SPE 10600, presented t SPE Symposium on Oilfield and Geothermal Chemistry, Dallas, 25-27 January 1982.
servoir Engineering, 271-280 (August 1987).
ocesses”, J. Pet. Tech., 41, 80-88 (January, 1989).
osium, ouston, February 8-10, 1989.
inion
omasundaran, P. and Hanna, H.S.: “Adsorption of Sulfonates on Reservoir Rocks”,
Ruan, K., et. al.: “Interfacial properties of aqueous surfactant two-phase systems”, AChimica Sinica”, 60, 961-963, June 2002. Russell, S.T. and A. Warshel, J. Mol. Biol., 185, 389, 1985 Ssubmitted to Current Opinion and Interface Science, February 15, 2003. Salter, S.J.: “Criteria for Surfactant Selection in Micellar Flooding”, paper SPE 141S Scheutjens, J. M. H. M.; Fleer, G. J., J. Phys. Chem., 83, 1619, 1979. Sand solid-water interfaces”, Coll. and Surf. A; Physiochem. Eng. Aspects, 203, 245 –2002. Serighfo Shah, D.O. and SchechteF Shankar, P.K., Bae, J.H., and Enick, R.M.: “Salinity Tolerance and Solution Property Correlations of Petroleum Sulfonate-Cosurfactant Blenda Shuler, P.J., et. al.: “Improving Polymer Injectivity at West Coyote Field, California”, SPE Re Shuler, P.J., Kuehne, D.L., and Lerner, R.M.: “Improving Chemical Flood Efficiency with Micellar/Alkaline/Polymer Pr Skauge, A. and Palmgren, O.: “Phase Behavior and Solution Properties of Ethoxylated Anionic Surfactants”, paper SPE 18499, presented at SPE Oilfield Chemistry SympH Solans, C. and Garcia-Celma, M.J.: “Surfactants for Microemulsions”, Current Opin Coll. & Int. Sci., 2, 464-471, 1997. Spaper SPE 7059, Soc. Pet. Eng. J., 1979.
55
Somasundran, M.C., et. al.: “The Role of Surfactant Precipitation and Redissolution in s,
V, (1979)
R: Elucidation of echanism for Minimum Loss”, NSF Workshop report, Use of Surfactants for Improved
ottmann, T. and Stry, R.: “Shape Similarities of Ultra-Low Interfacial Tension Curves in .
R.K.: Ammonium bis(ethylhexyl) phosphate: a new surfactant for microemulsions”, Langmuir,
A.: “Seelction and Design of Ethoxylated Carboxylates for Chemical Flooding”, ork performed for DOE under agreement FC22-83FE60149, NIPER-449, DE90000213,
ullivan, E.R., “Molecular genetics of biosurfactant production”, Current Opinion in
unwoo, C.K. and Wade, W.: “Optimal Surfactant Structures for Cosurfactant-Free
Engineering (August 1996).
auer, K.: “Reactive Surfactants”, Polymeric Dispersions: Principles and Applications
the Adsorption of Sulfonate on Minerals”, SPE 8263, SPE Annual Meeting, Las VegaN Somasundaran, P., :”Adsorption of Surfactant Mixtures in IOMPetroleum Recovery”, Houston, October 22-23, 2001. Son, J.E., Neale, G.H., and Hornof, V., Can. J. Chem. Eng., 60, 684-691, 1982. STernary Microemulsion Systems of the Water-Alkane-CiEj Type”, Ber. Bunsemges PhysChem., 100, 237-241, 1996. Steytler, D.C., Sargeant, L., Welsh, G.E., Robinson, B.H., and Heenan,“12, 5312-5318, 1996. Strker,wJanuary, 1990. SBiotechnology, 9:263-269 (1998). SMicroemulsion Systems”, J. Dispersion Sci. and Tech., 13 (5), 491-514, 1992. Swartzen-Allen, S. L.; Matijević, E, Chem. Rev., 74(3), 385, 1974.
Taber, J.J., Martin, F.D., and Seright, R.S.: “EOR Screening Criteia Revisited – Part 2. Application and Impact of Oil Prices”, SPE Reservoir Tapas, K.D., Adv. Colloid Interface Sci., 59, 95-98, 1995. T ,
repared by emulsion polymerization with poly(ethylene xide azo-initiators”, Polym. Adv. Technol. 6, 435-440, 1994.
.: “Chemical flooding of oil reservoirs. 2. issociative surfactant-polymer interaction with a positive effect on oil recovery”,
eppen, B.J.; Rasmussen, K.; Bertsch, P.M.; Miller, D.M.; Schafer, L.; J. Phys. Chem.B,
463-476, Klaver Academic Publishers, Netherlands, 1997. Tauer, K.: “Block copolymers po Taugbol, K., van Ly, T., and Austad, TDColloids and Science A, 103, 83, 1995. T
56
101, 1579, 1997. Teppen, B.J.; Yu, C.H.; Miller, D.M.; Schafer, L.; J. Comp. Chem.; 19, 144, 1998.
uir, 10, 2294, 1994.
urfactants Having N-acyl-N-methylamide and Carboxylate Groups”, J. Coll. Inter. Sci.,
ce active compounds of the sulfobetaines family, their anufacture and use, particularly for enhanced oil recovery”, November 3, 1987.
r 11, 1990.
.S. Patent 6,043, 391: “Anionic surfactants based on alkene sulfonic acid”,
on Rybinski, W. and Hill, K.: “Alkyl Polyglycosides”, from Novel Surfactants
Thomas, R. K.; Progre. Colloid & Polymer Sci.,103, 216, 1997. Tiberg, F.; Jősson, B.; Tang, J. A.; Lindman, B. Langm
Tsubone, K. and Rosen, M.: “Structural Effect on Surface Activities of Anionic S244, 394-398, 2001. U.S. Patent 4,704,229, “Surfam U.S. Patent 4,976,315, “Use of taurine additives in enhanced oil recovery with anionic surfactants”, Decembe U.S. Patent 4,985,154, “Process for the extraction of crude oil from an underground deposit using surfactants”, January 15, 1991. UMarch 28, 2000. v , ed. K.
on Rybinski, W., Guckenbiehl, W., and Tesmann, H.: “Influence of co-surfactants on 333-342, 1998..
ang, D., et. al.: “An Alkaline/Surfactant/Polymer Field Test in a Reservoir with a E Annual Meeting, New
rleans, 27-30, September (1998).
High Salinity Formations: esearch and Application”, paper 70047, presented at SPE Permian Basin Oil and Gas
arshel, A. and S.T. Russell, Quart. Rev. Biophy., 17, 3, 1984
ellington, S.L. and Richardson, E.A.: “Low Surfactant Concentration Waterflooding”,
Holmberg, Mercel Dekker, 1998. vmicroemulsions with alkyl polyglycosides”, Coll. And Surf. A, 142,
Warner, R., et. al., Appl. Organaomet. Chem., in press. WLong-Term 100% Water Cut”, SPE 49018, presented at SPO Wang, Y., et. al.: “Surfactants Oil Displacement System in RRecovery Confernece, Midland, Texas, 15-16 May 2001. W
Warshel, A. . Aquist, Ann. Rev., Biophys. Chem., 20, 267, 1991 Wpaper SPE 30748, presented at SPE Fall Meeting, Dallas, 22-25 October 1995.
57
Wu, W., et.al.: “Design and Optimization of Low-Cost Chemical Flooding”, paper
1-24 pril, 1996.
u, G.-Y.; Yuan, S.-L.; Wang, Y.-B. J. Dispersion Sci. & Tech., 22(4), 355, 2001.
Yalamanchili, M.R., et. al.: “Use of atomic force microscopy in particle science and spects,
ang, C.-Z.; Yan, H.-K.; Li, G.-Z.; Cui, G.-Z.; Yuan, H. in “Fundamental and Advances hina
iv, S. and Zana, R., J. Colloid Interface Sci., 77, 449, 1980.
urfactants”, Chapter 8, Novel Surfactants
SPE/DOE 35355, presented at Symposium on Improved Oil Recovery, Tulsa, OK, 2A X
technology research”, Colloids and Science A: Physiochemical and Engineering A133, 77-88 (1998). Yin Combined Chemical Flooding” (in Chinese), p. 174, Yu, G.-Y. et al. Ed. CPetroleum Press, Beijing, 2002. Y Zana, R., “Dimeric (Gemini) S , ed. K.
olmberg, Marcel Dekker, New York, 1998.
lution: a review”, Adv. Coll. Interface Sci., 97, 205-253, 2002.
H Zana, R.: “Dimeric and oligomeric surfactants. Behavior at interfaces and in aqueous so
58
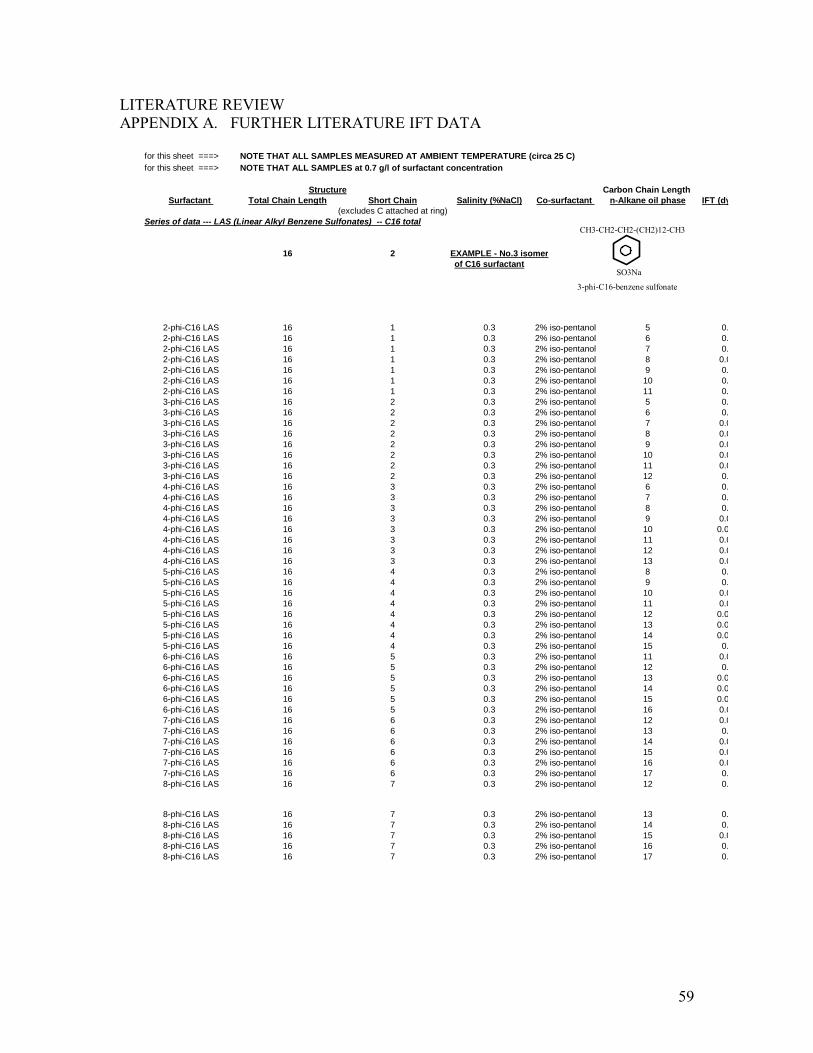
LITERATURE REVIEW APPENDIX A. FURTHER LITERATURE IFT DATA
for this sheet ==for this sheet ==
=> NOTE THAT ALL SAMPLES MEASURED AT AMBIENT TEMPERATURE (circa 25 C)=> NOTE THAT ALL SAMPLES at 0.7 g/l of surfactant concentration
Structure Carbon ChainSurfactant
LengthTotal Chain Length Short Chain Salinity (%NaCl) Co-surfactant n-Alkane oil phase IFT (dy
(excludes C attached at ring)Series of data --- LAS (Linear Alkyl Benzene Sulfonates) -- C16 total
16 2 EXAMPLE - No.3 isomerof C16 surfactant
2-phi-C16 LAS 16 1 0.3 2% iso-pentanol 52-phi-C16 LAS 16 1 0.3 2% iso-pentanol 62-phi-C16 LAS 16
0.0.
2% iso-pentanol 7 0.2% iso-pentanol 8 0.
1 0.32-phi-C16 LAS 16 1 0.3 02-phi-C16 LAS 16 1 0.3 2% iso-pentanol 9 0.2-phi-C16 LAS 16 1 0.3 2% iso-pentanol 10 0.
0.0.
0.3 2% iso-pentanol 6 0.0.3 2% iso-pentanol 7 0.
2-phi-C16 LAS 16 1 0.3 2% iso-pentanol 113-phi-C16 LAS 16 2 0.3 2% iso-pentanol 53-phi-C16 LAS 16 23-phi-C16 LAS 16 2 03-phi-C16 LAS 16 2 0.3 2% iso-pentanol 8 0.03-phi-C16 LAS 16 2 0.3 2% iso-pentanol 9 0.03-phi-C16 LAS 16 2 0.3 2% iso-pentanol 10 0.03-phi-C16 LAS 16 2 0.3 2% iso-pentanol 11 0.03-phi-C16 LAS 16 2 0.3 2% iso-pentanol 12 0.4-phi-C16 LAS 16 3 0.3 2% iso-pentanol 6 0.4-phi-C16 LAS 16 3 0.3 2% iso-pentanol 7 0.4-phi-C16 LAS 16 3 0.3 2% iso-pentanol 8 0.4-phi-C16 LAS 16 3 0.3 2% iso-pentanol 9 0.04-phi-C16 LAS 16 3 0.3 2% iso-pentanol 10 0.04-phi-C16 LAS 16 3 0.3 2% iso-pentanol 11 0.04-phi-C16 LAS 16 3 0.3 2% iso-pentanol 12 0.04-phi-C16 LAS 16 3 0.3 2% iso-pentanol 13 0.05-phi-C16 LAS 16 4 0.3 2% iso-pentanol 8 0.5-phi-C16 LAS 16 4 0.3 2% iso-pentanol 9 0.5-phi-C16 LAS 16 4 0.3 2% iso-pentanol 10 0.05-phi-C16 LAS 16 4 0.3 2% iso-pentanol 11 0.05-phi-C16 LAS 16 4 0.3 2% iso-pentanol 12 0.05-phi-C16 LAS 16 4 0.3 2% iso-pentanol 13 0.05-phi-C16 LAS 16 4 0.3 2% iso-pentanol 14 0.05-phi-C16 LAS 16 4 0.3 2% iso-pentanol 15 0.6-phi-C16 LAS 16 5 0.3 2% iso-pentanol 11 0.06-phi-C16 LAS 16 5 0.3 2% iso-pentanol 12 0.6-phi-C16 LAS 16 5 0.3 2% iso-pentanol 13 0.06-phi-C16 LAS 16 5 0.3 2% iso-pentanol 14 0.06-phi-C16 LAS 16 5 0.3 2% iso-pentanol 15 0.06-phi-C16 LAS 16 5 0.3 2% iso-pentanol 16 0.07-phi-C16 LAS 16 6 0.3 2% iso-pentanol 12 0.07-phi-C16 LAS 16 6 0.3 2% iso-pentanol 13 0.7-phi-C16 LAS 16 6 0.3 2% iso-pentanol 14 0.07-phi-C16 LAS 16 6 0.3 2% iso-pentanol 15 0.07-phi-C16 LAS 16 6 0.3 2% iso-pentanol 16 0.07-phi-C16 LAS 16 6 0.3 2% iso-pentanol 17 0.8-phi-C16 LAS 16 7 0.3 2% iso-pentanol 12 0.
-CH3CH3-CH2-CH2-(CH2)12
SO3Na
3-phi-C16-benzene sulfonate
8-phi-C16 LAS 16 7 0.3 2% iso-pentanol 13 0.8-phi-C16 LAS 16 7 0.3 2% iso-pentanol 14 0.8-phi-C16 LAS 16 7 0.3 2% iso-pentanol 15 0.08-phi-C16 LAS 16 7 0.3 2% iso-pentanol 16 0.8-phi-C16 LAS 16 7 0.3 2% iso-pentanol 17 0.
59
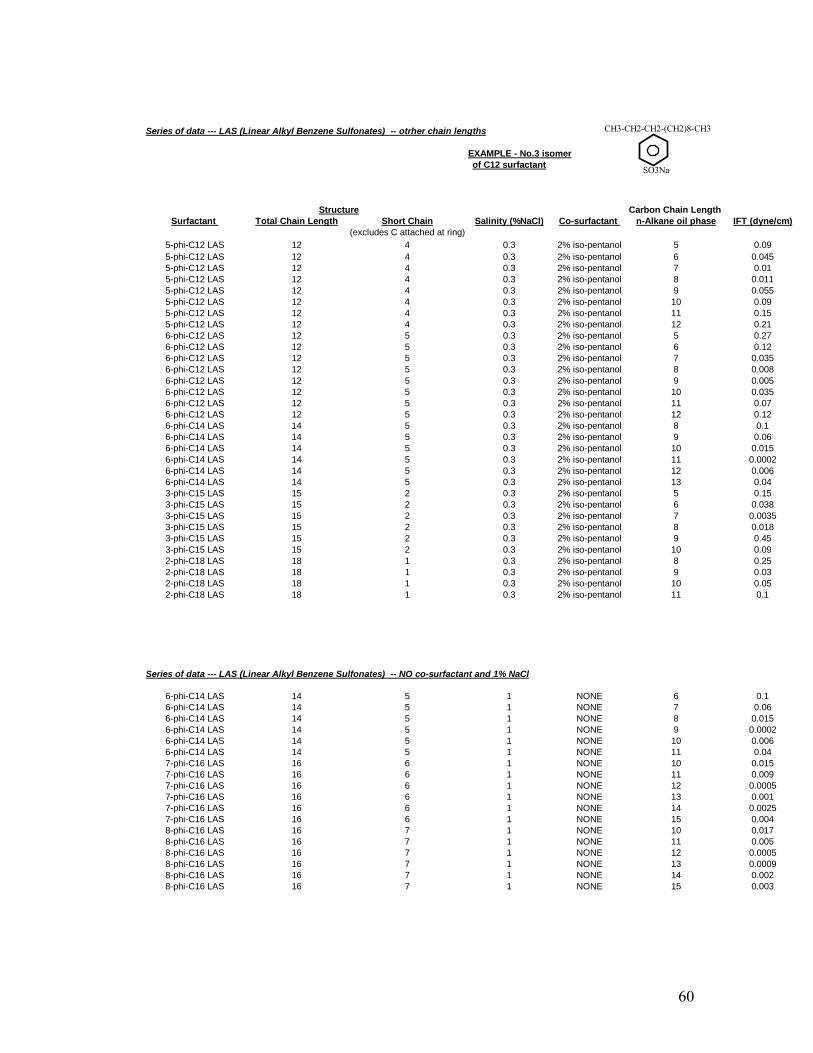
Series of data --- LAS (Linear Alkyl Benzene Sulfonates) -- otrher chain lengths
EXAMPLE - No.3 isomerof C12 surfactant
Structure Carbon Chain LengthSurfactant Total Chain Length Short Chain Salinity (%NaCl) Co-surfactant n-Alkane oil phase IFT (dyne/cm)
(excludes C attached at ring)5-phi-C12 LAS 12 4 0.3 2% iso-pentanol 5 0.095-phi-C12 LAS 12 4 0.3 2% iso-pentanol 6 0.0455-phi-C12 LAS 12 4 0.3 2% iso-pentanol 7 0.015-phi-C12 LAS 12 4 0.3 2% iso-pentanol 8 0.0115-phi-C12 LAS 12 4 0.3 2% iso-pentanol 9 0.0555-phi-C12 LAS 12 4 0.3 2% iso-pentanol 10 0.095-phi-C12 LAS 12 4 0.3 2% iso-pentanol 11 0.155-phi-C12 LAS 12 4 0.3 2% iso-pentanol 12 0.216-phi-C12 LAS 12 5 0.3 2% iso-pentanol 5 0.276-phi-C12 LAS 12 5 0.3 2% iso-pentanol 6 0.126-phi-C12 LAS 12 5 0.3 2% iso-pentanol 7 0.0356-phi-C12 LAS 12 5 0.3 2% iso-pentanol 8 0.0086-phi-C12 LAS 12 5 0.3 2% iso-pentanol 9 0.0056-phi-C12 LAS 12 5 0.3 2% iso-pentanol 10 0.0356-phi-C12 LAS 12 5 0.3 2% iso-pentanol 11 0.076-phi-C12 LAS 12 5 0.3 2% iso-pentanol 12 0.126-phi-C14 LAS 14 5 0.3 2% iso-pentanol 8 0.16-phi-C14 LAS 14 5 0.3 2% iso-pentanol 9 0.066-phi-C14 LAS 14 5 0.3 2% iso-pentanol 10 0.0156-phi-C14 LAS 14 5 0.3 2% iso-pentanol 11 0.00026-phi-C14 LAS 14 5 0.3 2% iso-pentanol 12 0.0066-phi-C14 LAS 14 5 0.3 2% iso-pentanol 13 0.043-phi-C15 LAS 15 2 0.3 2% iso-pentanol 5 0.153-phi-C15 LAS 15 2 0.3 2% iso-pentanol 6 0.0383-phi-C15 LAS 15 2 0.3 2% iso-pentanol 7 0.00353-phi-C15 LAS 15 2 0.3 2% iso-pentanol 8 0.0183-phi-C15 LAS 15 2 0.3 2% iso-pentanol 9 0.453-phi-C15 LAS 15 2 0.3 2% iso-pentanol 10 0.092-phi-C18 LAS 18 1 0.3 2% iso-pentanol 8 0.252-phi-C18 LAS 18 1 0.3 2% iso-pentanol 9 0.032-phi-C18 LAS 18 1 0.3 2% iso-pentanol 10 0.052-phi-C18 LAS 18 1 0.3 2% iso-pentanol 11 0.1
CH3-CH2-CH2-(CH2)8-CH3
SO3Na
Series of data --- LAS (Linear Alkyl Benzene Sulfonates) -- NO co-surfactant and 1% NaCl
6-phi-C14 LAS 14 5 1 NONE 6 0.16-phi-C14 LAS 14 5 1 NONE 7 0.066-phi-C14 LAS 14 5 1 NONE 8 0.0156-phi-C14 LAS 14 5 1 NONE 9 0.00026-phi-C14 LAS 14 5 1 NONE 10 0.0066-phi-C14 LAS 14 5 1 NONE 11 0.047-phi-C16 LAS 16 6 1 NONE 10 0.0157-phi-C16 LAS 16 6 1 NONE 11 0.0097-phi-C16 LAS 16 6 1 NONE 12 0.00057-phi-C16 LAS 16 6 1 NONE 13 0.0017-phi-C16 LAS 16 6 1 NONE 14 0.00257-phi-C16 LAS 16 6 1 NONE 15 0.0048-phi-C16 LAS 16 7 1 NONE 10 0.0178-phi-C16 LAS 16 7 1 NONE 11 0.0058-phi-C16 LAS 16 7 1 NONE 12 0.00058-phi-C16 LAS 16 7 1 NONE 13 0.00098-phi-C16 LAS 16 7 1 NONE 14 0.0028-phi-C16 LAS 16 7 1 NONE 15 0.003
60
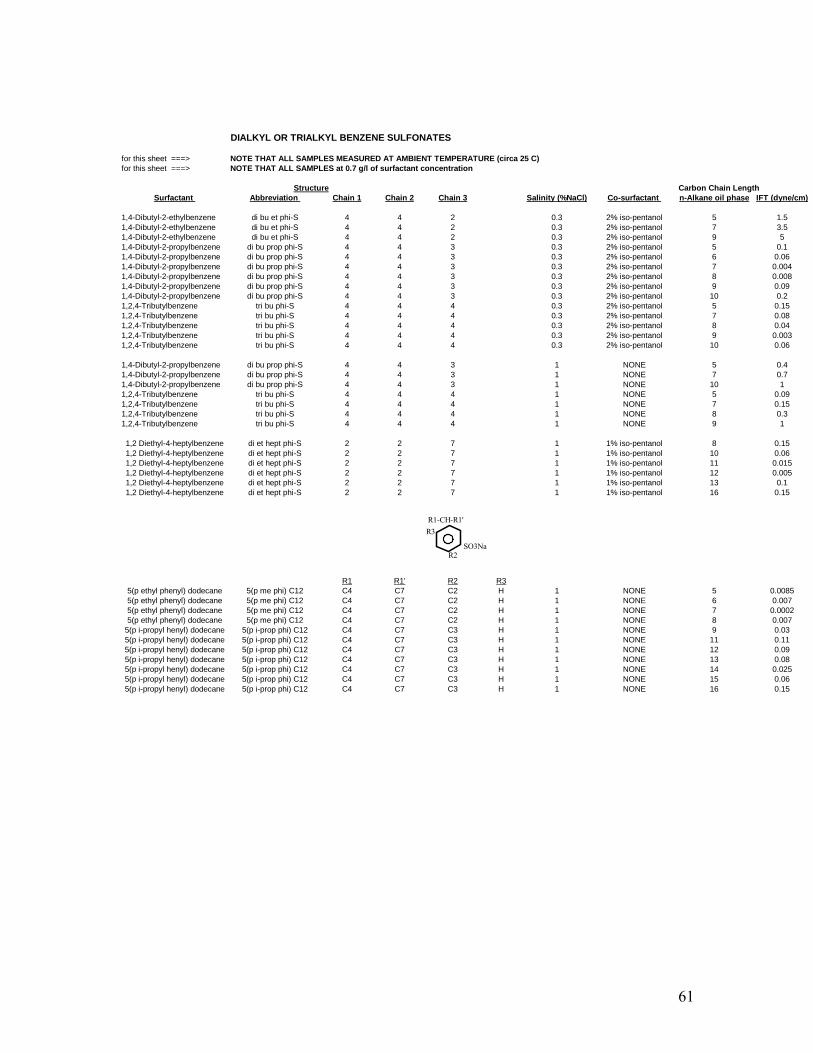
DIALKYL OR TRIALKYL BENZENE SULFONATES
for this sheet ===> NOTE THAT ALL SAMPLES MEASURED AT AMBIENT TEMPERATURE (circa 25 C)for this sheet ===> NOTE THAT ALL SAMPLES at 0.7 g/l of surfactant concentration
Structure Carbon Chain LengthSurfactant Abbreviation Chain 1 Chain 2 Chain 3 Salinity (%NaCl) Co-surfactant n-Alkane oil phase IFT (dyne/cm)
1,4-Dibutyl-2-ethylbenzene di bu et phi-S 4 4 2 0.3 2% iso-pentanol 5 1.51,4-Dibutyl-2-ethylbenzene di bu et phi-S 4 4 2 0.3 2% iso-pentanol 7 3.51,4-Dibutyl-2-ethylbenzene di bu et phi-S 4 4 2 0.3 2% iso-pentanol 9 51,4-Dibutyl-2-propylbenzene di bu prop phi-S 4 4 3 0.3 2% iso-pentanol 5 0.11,4-Dibutyl-2-propylbenzene di bu prop phi-S 4 4 3 0.3 2% iso-pentanol 6 0.061,4-Dibutyl-2-propylbenzene di bu prop phi-S 4 4 3 0.3 2% iso-pentanol 7 0.0041,4-Dibutyl-2-propylbenzene di bu prop phi-S 4 4 3 0.3 2% iso-pentanol 8 0.0081,4-Dibutyl-2-propylbenzene di bu prop phi-S 4 4 3 0.3 2% iso-pentanol 9 0.091,4-Dibutyl-2-propylbenzene di bu prop phi-S 4 4 3 0.3 2% iso-pentanol 10 0.21,2,4-Tributylbenzene tri bu phi-S 4 4 4 0.3 2% iso-pentanol 5 0.151,2,4-Tributylbenzene tri bu phi-S 4 4 4 0.3 2% iso-pentanol 7 0.081,2,4-Tributylbenzene tri bu phi-S 4 4 4 0.3 2% iso-pentanol 8 0.041,2,4-Tributylbenzene tri bu phi-S 4 4 4 0.3 2% iso-pentanol 9 0.0031,2,4-Tributylbenzene tri bu phi-S 4 4 4 0.3 2% iso-pentanol 10 0.06
1,4-Dibutyl-2-propylbenzene di bu prop phi-S 4 4 3 1 NONE 5 0.41,4-Dibutyl-2-propylbenzene di bu prop phi-S 4 4 3 1 NONE 7 0.71,4-Dibutyl-2-propylbenzene di bu prop phi-S 4 4 3 1 NONE 10 11,2,4-Tributylbenzene tri bu phi-S 4 4 4 1 NONE 5 0.091,2,4-Tributylbenzene tri bu phi-S 4 4 4 1 NONE 7 0.151,2,4-Tributylbenzene tri bu phi-S 4 4 4 1 NONE 8 0.31,2,4-Tributylbenzene tri bu phi-S 4 4 4 1 NONE 9 1
1,2 Diethyl-4-heptylbenzene di et hept phi-S 2 2 7 1 1% iso-pentanol 8 0.151,2 Diethyl-4-heptylbenzene di et hept phi-S 2 2 7 1 1% iso-pentanol 10 0.061,2 Diethyl-4-heptylbenzene di et hept phi-S 2 2 7 1 1% iso-pentanol 11 0.0151,2 Diethyl-4-heptylbenzene di et hept phi-S 2 2 7 1 1% iso-pentanol 12 0.0051,2 Diethyl-4-heptylbenzene di et hept phi-S 2 2 7 1 1% iso-pentanol 13 0.11,2 Diethyl-4-heptylbenzene di et hept phi-S 2 2 7 1 1% iso-pentanol 16 0.15
R1 R1' R2 R35(p ethyl phenyl) dodecane 5(p me phi) C12 C4 C7 C2 H 1 NONE 5 0.00855(p ethyl phenyl) dodecane 5(p me phi) C12 C4 C7 C2 H 1 NONE 6 0.0075(p ethyl phenyl) dodecane 5(p me phi) C12 C4 C7 C2 H 1 NONE 7 0.00025(p ethyl phenyl) dodecane 5(p me phi) C12 C4 C7 C2 H 1 NONE 8 0.007
5(p i-propyl henyl) dodecane 5(p i-prop phi) C12 C4 C7 C3 H 1 NONE 9 0.035(p i-propyl henyl) dodecane 5(p i-prop phi) C12 C4 C7 C3 H 1 NONE 11 0.115(p i-propyl henyl) dodecane 5(p i-prop phi) C12 C4 C7 C3 H 1 NONE 12 0.095(p i-propyl henyl) dodecane 5(p i-prop phi) C12 C4 C7 C3 H 1 NONE 13 0.085(p i-propyl henyl) dodecane 5(p i-prop phi) C12 C4 C7 C3 H 1 NONE 14 0.0255(p i-propyl henyl) dodecane 5(p i-prop phi) C12 C4 C7 C3 H 1 NONE 15 0.065(p i-propyl henyl) dodecane 5(p i-prop phi) C12 C4 C7 C3 H 1 NONE 16 0.15
R1-CH-R1'
SO3Na R2
R3
61
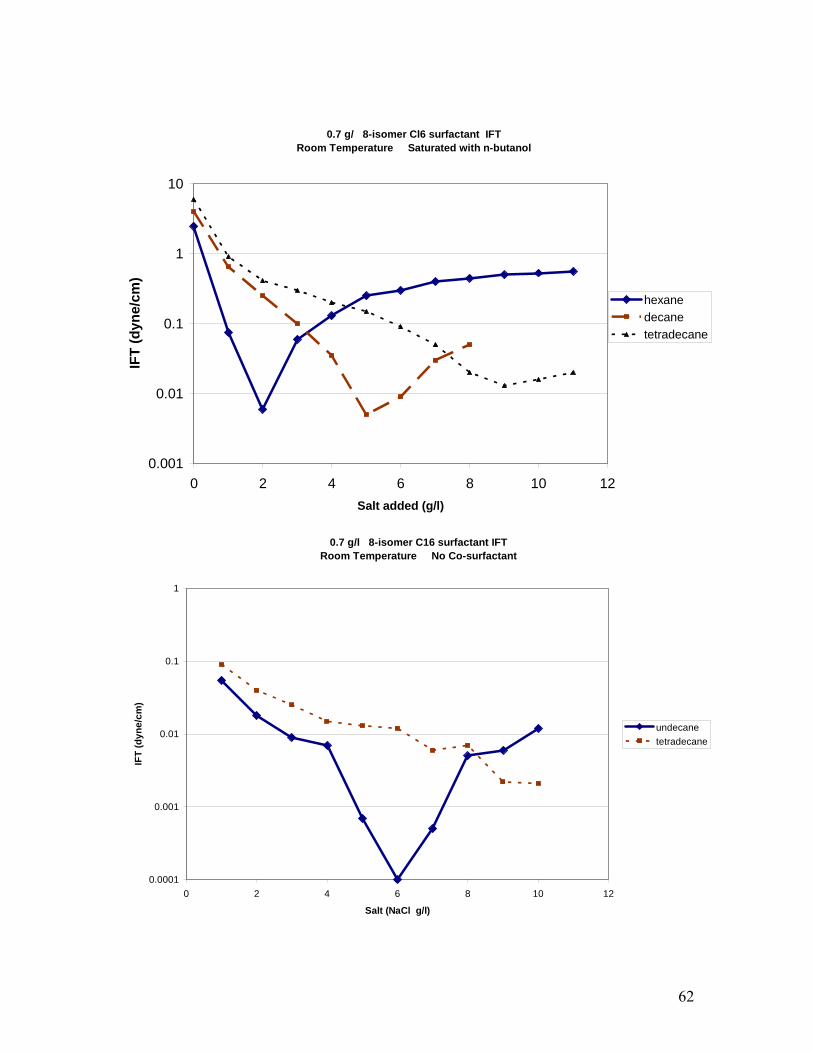
0.7 g/ 8-isomer Cl6 surfactant IFTRoom Temperature Saturated with n-butanol
0.001
0.01
0.1
1
10
0 2 4 6 8 10 12Salt added (g/l)
IFT
(dyn
e/cm
)
hexanedecanetetradecane
0.7 g/l 8-isomer C16 surfactant IFTRoom Temperature No Co-surfactant
0.0001
0.001
0.01
0.1
1
0 2 4 6 8 10 12
Salt (NaCl g/l)
IFT
(dyn
e/cm
)
undecanetetradecane
62
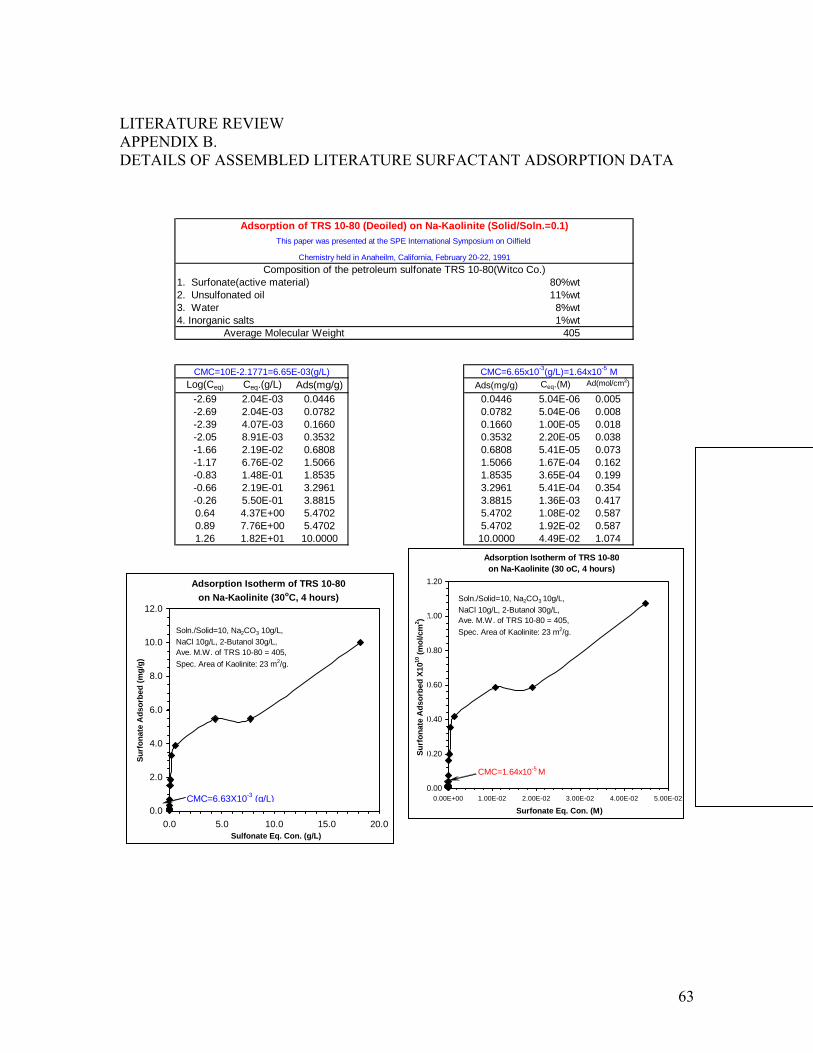
LITERATURE REVIEW APPENDIX B. DETAILS OF ASSEMBLED LITERATURE SURFACTANT ADSORPTION DATA
1. Surfonate(active material) 80%wt2. Unsulfonated oil 11%wt3. Water 8%wt4. Inorganic salts 1%wt Average Molecular Weight 405
Log(Ceq) Ceq.(g/L) Ads(mg/g) Ads(mg/g) Ceq.(M) Ad(mol/cm2)
-2.69 2.04E-03 0.0446 0.0446 5.04E-06 0.005-2.69 2.04E-03 0.0782 0.0782 5.04E-06 0.008-2.39 4.07E-03 0.1660 0.1660 1.00E-05 0.018-2.05 8.91E-03 0.3532 0.3532 2.20E-05 0.038-1.66 2.19E-02 0.6808 0.6808 5.41E-05 0.073-1.17 6.76E-02 1.5066 1.5066 1.67E-04 0.162-0.83 1.48E-01 1.8535 1.8535 3.65E-04 0.199-0.66 2.19E-01 3.2961 3.2961 5.41E-04 0.354-0.26 5.50E-01 3.8815 3.8815 1.36E-03 0.4170.64 4.37E+00 5.4702 5.4702 1.08E-02 0.5870.89 7.76E+00 5.4702 5.4702 1.92E-02 0.5871.26 1.82E+01 10.0000 10.0000 4.49E-02 1.074
CMC=6.65x10⁻³(g/L)=1.64x10-5 MCMC=10E-2.1771=6.65E-03(g/L)
Composition of the petroleum sulfonate TRS 10-80(Witco Co.)
Adsorption of TRS 10-80 (Deoiled) on Na-Kaolinite (Solid/Soln.=0.1)This paper was presented at the SPE International Symposium on Oilfield
Chemistry held in Anaheilm, California, February 20-22, 1991
Adsorption Isotherm of TRS 10-80 on Na-Kaolinite (30oC, 4 hours)
0.0
2.0
4.0
6.0
8.0
10.0
12.0
0.0 5.0 10.0 15.0 20.0Sulfonate Eq. Con. (g/L)
Surf
onat
e A
dsor
bed
(mg/
g)
Soln./Solid=10, Na2CO3 10g/L,NaCl 10g/L, 2-Butanol 30g/L, Ave. M.W. of TRS 10-80 = 405, Spec. Area of Kaolinite: 23 m2/g.
CMC=6.63X10⁻³ (g/L)
Adsorption Isotherm of TRS 10-80 on Na-Kaolinite (30 oC, 4 hours)
0.00
0.20
0.40
0.60
0.80
1.00
1.20
0.00E+00 1.00E-02 2.00E-02 3.00E-02 4.00E-02 5.00E-02
Surfonate Eq. Con. (M)
Surf
onat
e A
dsor
bed
X1010
(mol
/cm
2 )
Soln./Solid=10, Na2CO3 10g/L,NaCl 10g/L, 2-Butanol 30g/L, Ave. M.W. of TRS 10-80 = 405, Spec. Area of Kaolinite: 23 m2/g.
CMC=1.64x10⁻⁵ M
63
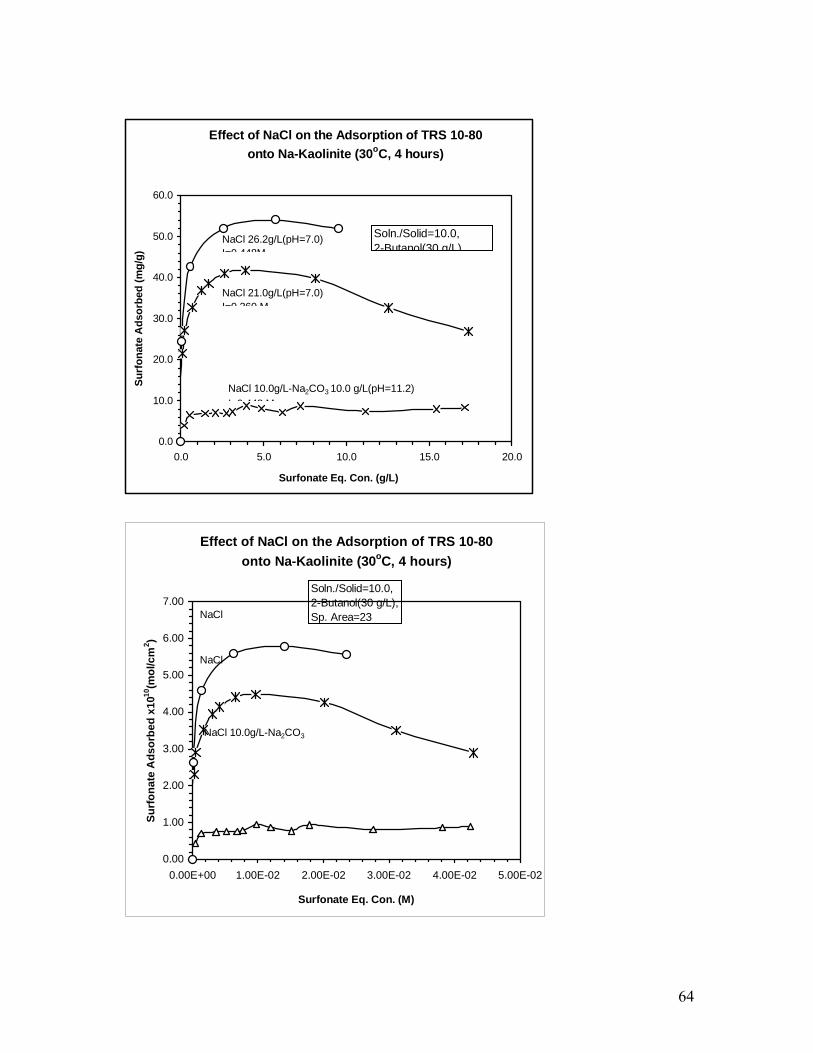
Effect of NaCl on the Adsorption of TRS 10-80
0.0
10.0
20.0
30.0
40.0
50.0
60.0
0.0 5.0 10.0 15.0 20.0
Surfonate Eq. Con. (g/L)
Surf
onat
e A
dsor
bed
(mg/
g)onto Na-Kaolinite (30oC, 4 hours)
NaCl 26.2g/L(pH=7.0)I=0 448M
NaCl 21.0g/L(pH=7.0)I=0 360 M
NaCl 10.0g/L-Na2CO3 10.0 g/L(pH=11.2)I=0 448 M
Soln./Solid=10.0,2-Butanol(30 g/L)
Effect of NaCl on the Adsorption of TRS 10-80 onto Na-Kaolinite (30oC, 4 hours)
0.00
1.00
2.00
3.00
4.00
5.00
6.00
7.00
0.00E+00 1.00E-02 2.00E-02 3.00E-02 4.00E-02 5.00E-02
Surfonate Eq. Con. (M)
Surf
onat
e A
dsor
bed
x1010
(mol
/cm
2 )
Soln./Solid=10.0,2-Butanol(30 g/L),Sp. Area=23 NaCl
NaCl
NaCl 10.0g/L-Na2CO3
64
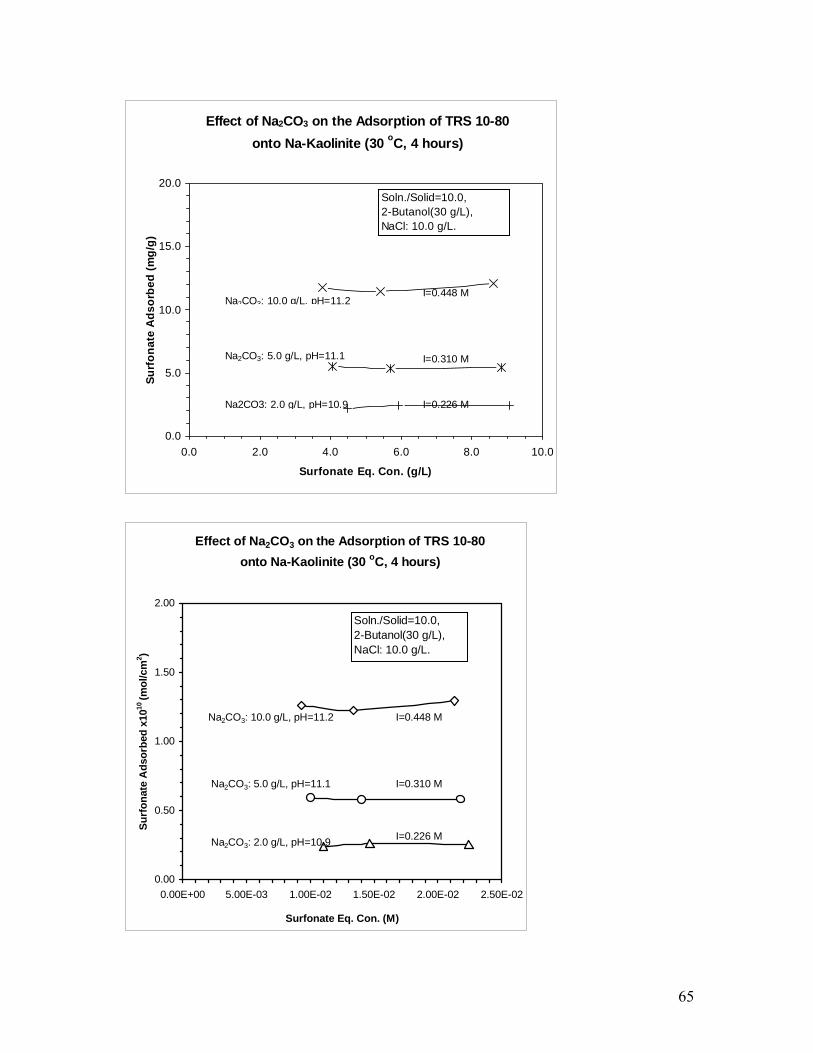
Effect of Na2CO3 on the Adsorption of TRS 10-80 onto Na-Kaolinite (30 oC, 4 hours)
0.0
5.0
10.0
15.0
20.0
0.0 2.0 4.0 6.0 8.0 10.0
Surfonate Eq. Con. (g/L)
Surf
onat
e A
dsor
bed
(mg/
g)
Na2CO3: 10.0 g/L, pH=11.2
Na2CO3: 5.0 g/L, pH=11.1
Na2CO3: 2.0 g/L, pH=10.9
I=0.448 M
I=0.310 M
I=0.226 M
Soln./Solid=10.0,2-Butanol(30 g/L),NaCl: 10.0 g/L.
Effect of Na2CO3 on the Adsorption of TRS 10-80 onto Na-Kaolinite (30 oC, 4 hours)
0.00
0.50
1.00
1.50
2.00
0.00E+00 5.00E-03 1.00E-02 1.50E-02 2.00E-02 2.50E-02
Surfonate Eq. Con. (M)
Surf
onat
e A
dsor
bed
x1010
(mol
/cm
2 )
Soln./Solid=10.0,2-Butanol(30 g/L),NaCl: 10.0 g/L.
Na2CO3: 10.0 g/L, pH=11.2 I=0.448 M
Na2CO3: 5.0 g/L, pH=11.1
Na2CO3: 2.0 g/L, pH=10.9
I=0.310 M
I=0.226 M
65
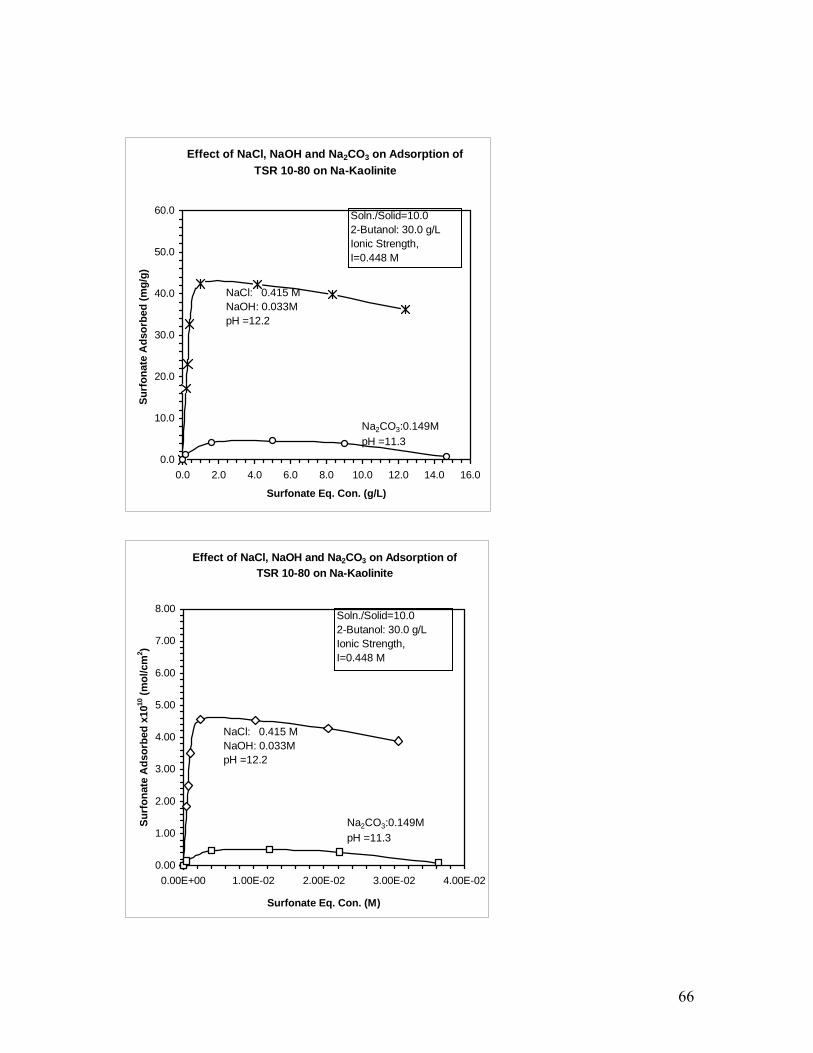
Effect of NaCl, NaOH and Na2CO3 on Adsorption of TSR 10-80 on Na-Kaolinite
0.0
10.0
20.0
30.0
40.0
50.0
60.0
0.0 2.0 4.0 6.0 8.0 10.0 12.0 14.0 16.0
Surfonate Eq. Con. (g/L)
Surf
onat
e A
dsor
bed
(mg/
g)
NaCl: 0.415 MNaOH: 0.033MpH =12.2
Na2CO3:0.149MpH =11.3
Soln./Solid=10.02-Butanol: 30.0 g/LIonic Strength,I=0.448 M
Effect of NaCl, NaOH and Na2CO3 on Adsorption of TSR 10-80 on Na-Kaolinite
0.00
1.00
2.00
3.00
4.00
5.00
6.00
7.00
8.00
0.00E+00 1.00E-02 2.00E-02 3.00E-02 4.00E-02
Surfonate Eq. Con. (M)
Surf
onat
e A
dsor
bed
x1010
(mol
/cm
2 )
Soln./Solid=10.02-Butanol: 30.0 g/LIonic Strength,I=0.448 M
NaCl: 0.415 MNaOH: 0.033MpH =12.2
Na2CO3:0.149MpH =11.3
66
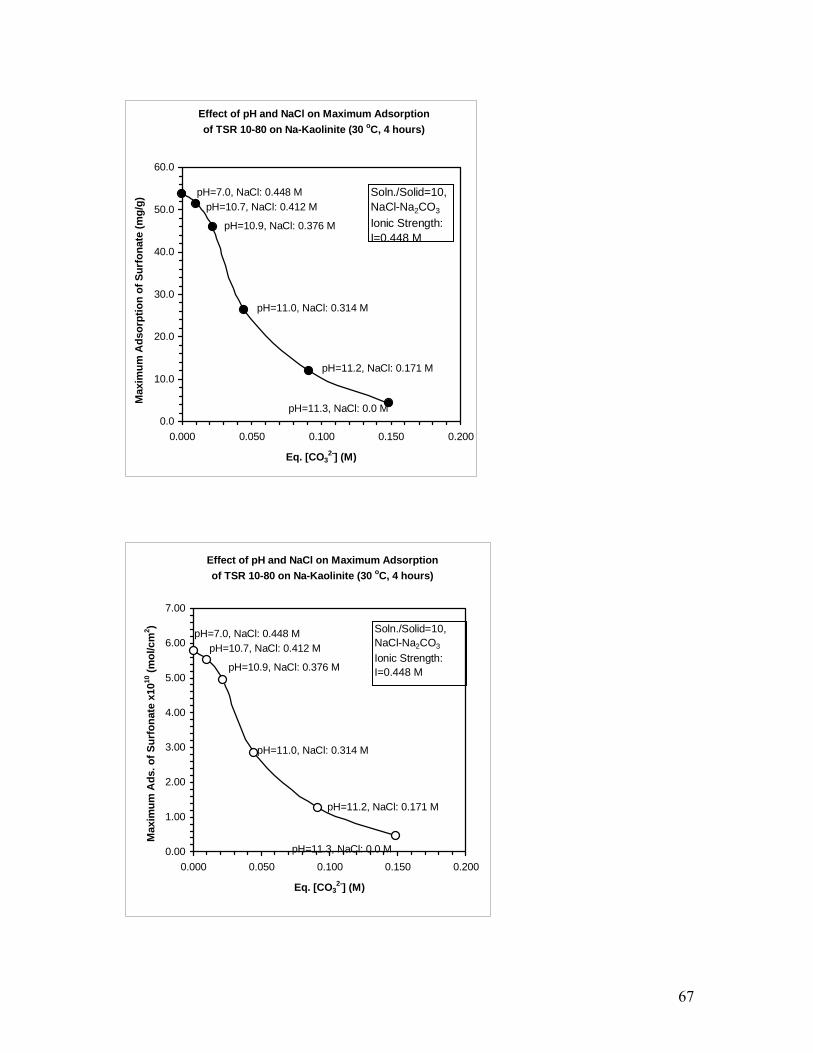
Effect of pH and NaCl on Maximum Adsorption of TSR 10-80 on Na-Kaolinite (30 oC, 4 hours)
0.0
10.0
20.0
30.0
40.0
50.0
60.0
0.000 0.050 0.100 0.150 0.200
Eq. [CO32-] (M)
Max
imum
Ads
orpt
ion
of S
urfo
nate
(mg/
g)
pH=7.0, NaCl: 0.448 MpH=10.7, NaCl: 0.412 M
pH=10.9, NaCl: 0.376 M
pH=11.0, NaCl: 0.314 M
pH=11.2, NaCl: 0.171 M
pH=11.3, NaCl: 0.0 M
Soln./Solid=10,NaCl-Na2CO3
Ionic Strength: I=0.448 M
Effect of pH and NaCl on Maximum Adsorption of TSR 10-80 on Na-Kaolinite (30 oC, 4 hours)
0.00
1.00
2.00
3.00
4.00
5.00
6.00
7.00
0.000 0.050 0.100 0.150 0.200
Eq. [CO32-] (M)
Max
imum
Ads
. of S
urfo
nate
x10
10 (m
ol/c
m2 ) Soln./Solid=10,
NaCl-Na2CO3
Ionic Strength: I=0.448 M
pH=7.0, NaCl: 0.448 MpH=10.7, NaCl: 0.412 M
pH=10.9, NaCl: 0.376 M
pH=11.0, NaCl: 0.314 M
pH=11.2, NaCl: 0.171 M
pH=11.3, NaCl: 0.0 M
67
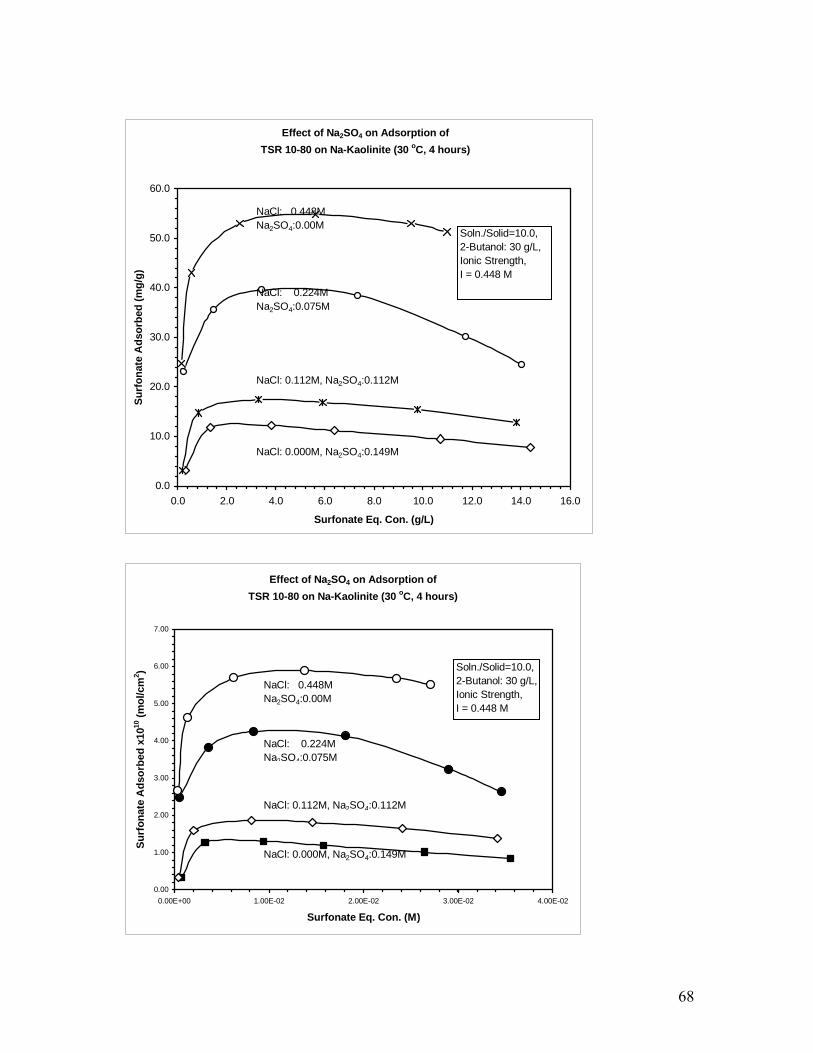
Effect of Na2SO4 on Adsorption of
TSR 10-80 on Na-Kaolinite (30 oC, 4 hours)
0.0
10.0
20.0
30.0
40.0
50.0
60.0
0.0 2.0 4.0 6.0 8.0 10.0 12.0 14.0 16.0
Surfonate Eq. Con. (g/L)
Surf
onat
e A
dsor
bed
(mg/
g)
NaCl: 0.448MNa2SO4:0.00M
NaCl: 0.224MNa2SO4:0.075M
NaCl: 0.112M, Na2SO4:0.112M
NaCl: 0.000M, Na2SO4:0.149M
Soln./Solid=10.0,2-Butanol: 30 g/L,Ionic Strength,I = 0.448 M
Effect of Na2SO4 on Adsorption of TSR 10-80 on Na-Kaolinite (30 oC, 4 hours)
0.00
1.00
2.00
3.00
4.00
5.00
6.00
7.00
0.00E+00 1.00E-02 2.00E-02 3.00E-02 4.00E-02
Surfonate Eq. Con. (M)
Surf
onat
e A
dsor
bed
x1010
(mol
/cm
2 ) Soln./Solid=10.0,2-Butanol: 30 g/L,Ionic Strength,I = 0.448 M
NaCl: 0.448MNa2SO4:0.00M
NaCl: 0.224MNa2SO4:0.075M
NaCl: 0.112M, Na2SO4:0.112M
NaCl: 0.000M, Na2SO4:0.149M
68
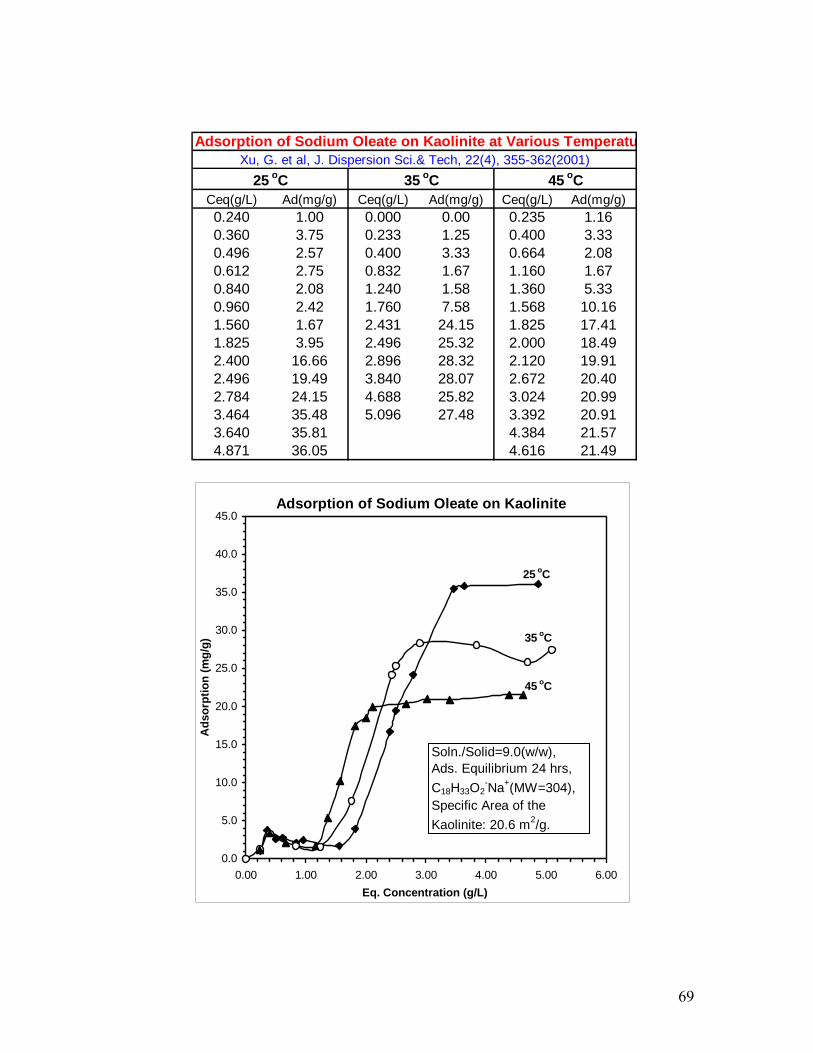
Ceq(g/L) Ad(mg/g) Ceq(g/L) Ad(mg/g) Ceq(g/L) Ad(mg/g)0.240 1.00 0.000 0.00 0.235 1.160.360 3.75 0.233 1.25 0.400 3.330.496 2.57 0.400 3.33 0.664 2.080.612 2.75 0.832 1.67 1.160 1.670.840 2.08 1.240 1.58 1.360 5.330.960 2.42 1.760 7.58 1.568 10.161.560 1.67 2.431 24.15 1.825 17.411.825 3.95 2.496 25.32 2.000 18.492.400 16.66 2.896 28.32 2.120 19.912.496 19.49 3.840 28.07 2.672 20.402.784 24.15 4.688 25.82 3.024 20.993.464 35.48 5.096 27.48 3.392 20.913.640 35.81 4.384 21.574.871 36.05 4.616 21.49
Adsorption of Sodium Oleate on Kaolinite at Various Temperatu
25 oC 35 oC 45 oCXu, G. et al, J. Dispersion Sci.& Tech, 22(4), 355-362(2001)
Adsorption of Sodium Oleate on Kaolinite
0.0
5.0
10.0
15.0
20.0
25.0
30.0
35.0
40.0
45.0
0.00 1.00 2.00 3.00 4.00 5.00 6.00Eq. Concentration (g/L)
Ads
orpt
ion
(mg/
g)
25 oC
45 oC
35 oC
Soln./Solid=9.0(w/w),Ads. Equilibrium 24 hrs,C18H33O2
-Na+(MW=304),Specific Area of theKaolinite: 20.6 m2/g.
69
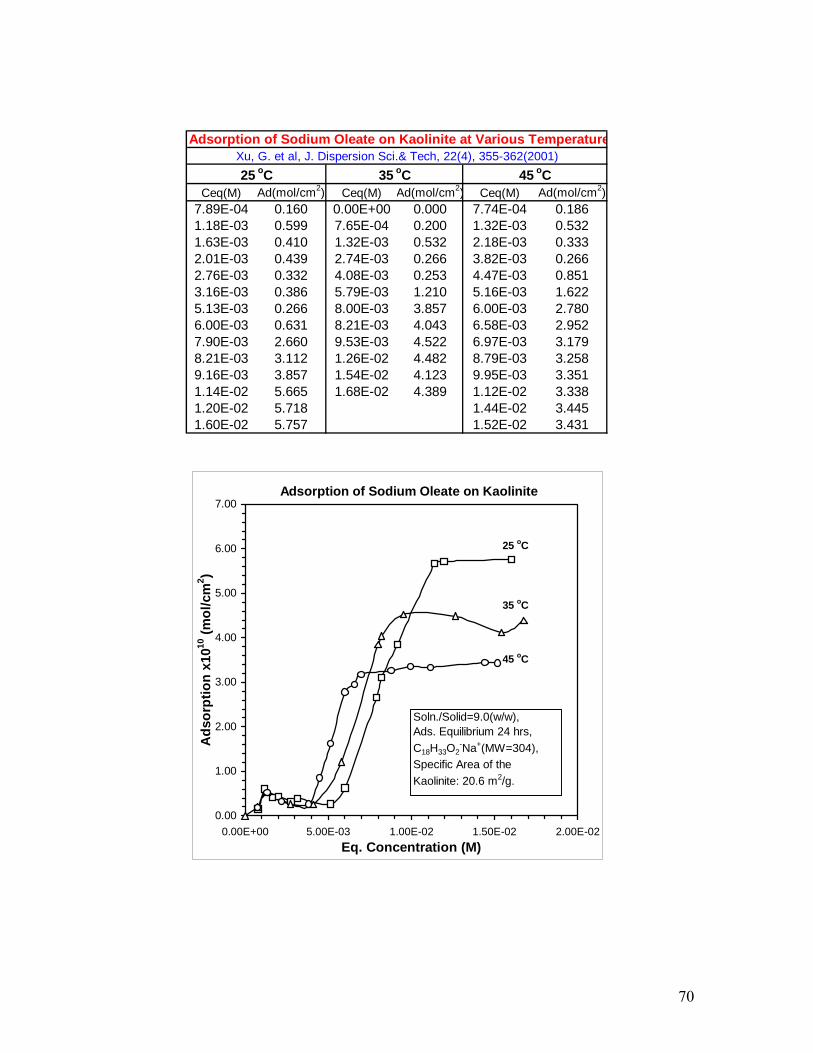
Ceq(M) Ad(mol/cm2) Ceq(M) Ad(mol/cm2) Ceq(M) Ad(mol/cm2)7.89E-04 0.160 0.00E+00 0.000 7.74E-04 0.1861.18E-03 0.599 7.65E-04 0.200 1.32E-03 0.5321.63E-03 0.410 1.32E-03 0.532 2.18E-03 0.3332.01E-03 0.439 2.74E-03 0.266 3.82E-03 0.2662.76E-03 0.332 4.08E-03 0.253 4.47E-03 0.8513.16E-03 0.386 5.79E-03 1.210 5.16E-03 1.6225.13E-03 0.266 8.00E-03 3.857 6.00E-03 2.7806.00E-03 0.631 8.21E-03 4.043 6.58E-03 2.9527.90E-03 2.660 9.53E-03 4.522 6.97E-03 3.1798.21E-03 3.112 1.26E-02 4.482 8.79E-03 3.2589.16E-03 3.857 1.54E-02 4.123 9.95E-03 3.3511.14E-02 5.665 1.68E-02 4.389 1.12E-02 3.3381.20E-02 5.718 1.44E-02 3.4451.60E-02 5.757 1.52E-02 3.431
Xu, G. et al, J. Dispersion Sci.& Tech, 22(4), 355-362(2001)Adsorption of Sodium Oleate on Kaolinite at Various Temperature
25 oC 35 oC 45 oC
Adsorption of Sodium Oleate on Kaolinite
0.00
1.00
2.00
3.00
4.00
5.00
6.00
7.00
0.00E+00 5.00E-03 1.00E-02 1.50E-02 2.00E-02Eq. Concentration (M)
Ads
orpt
ion
x1010
(mol
/cm
2 )
25 oC
35 oC
45 oC
Soln./Solid=9.0(w/w),Ads. Equilibrium 24 hrs,C18H33O2
-Na+(MW=304),Specific Area of theKaolinite: 20.6 m2/g.
70
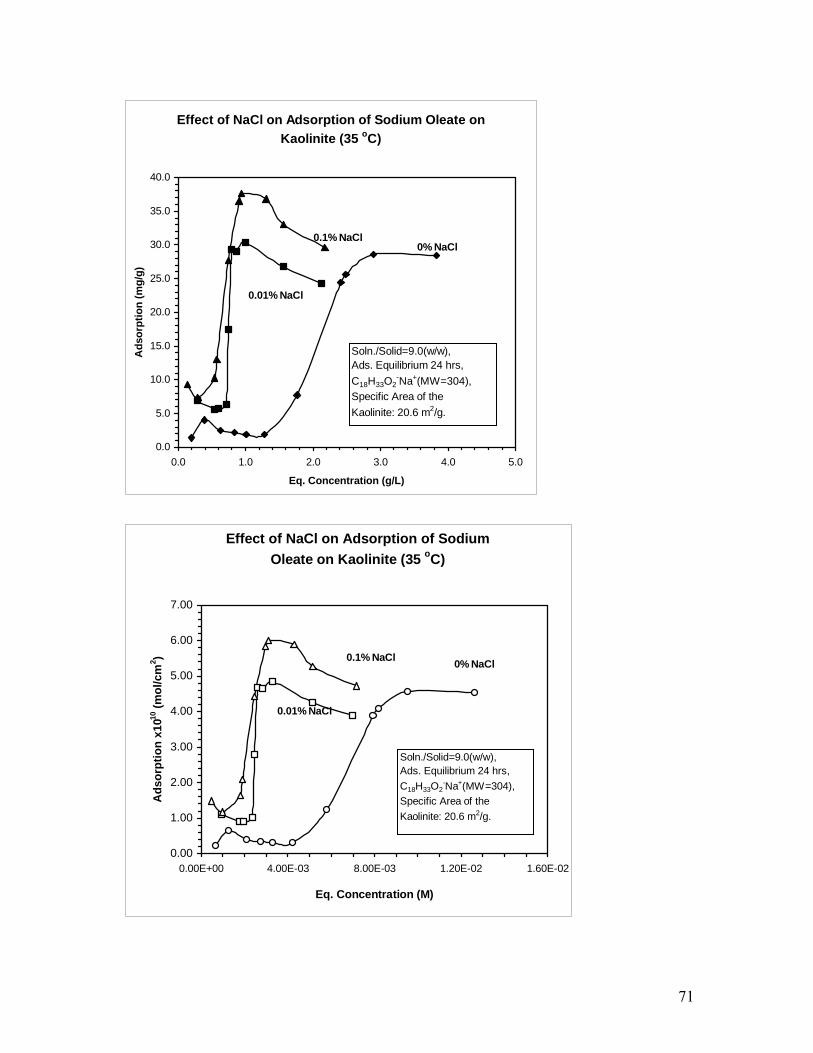
Effect of NaCl on Adsorption of Sodium Oleate on Kaolinite (35 oC)
0.0
5.0
10.0
15.0
20.0
25.0
30.0
35.0
40.0
0.0 1.0 2.0 3.0 4.0 5.0
Eq. Concentration (g/L)
Ads
orpt
ion
(mg/
g)
0% NaCl0.1% NaCl
0.01% NaCl
Soln./Solid=9.0(w/w),Ads. Equilibrium 24 hrs,C18H33O2
-Na+(MW=304),Specific Area of theKaolinite: 20.6 m2/g.
Effect of NaCl on Adsorption of Sodium Oleate on Kaolinite (35 oC)
0.00
1.00
2.00
3.00
4.00
5.00
6.00
7.00
0.00E+00 4.00E-03 8.00E-03 1.20E-02 1.60E-02
Eq. Concentration (M)
Ads
orpt
ion
x1010
(mol
/cm
2 ) 0.1% NaCl
0.01% NaCl
0% NaCl
Soln./Solid=9.0(w/w),Ads. Equilibrium 24 hrs,C18H33O2
-Na+(MW=304),Specific Area of theKaolinite: 20.6 m2/g.
71
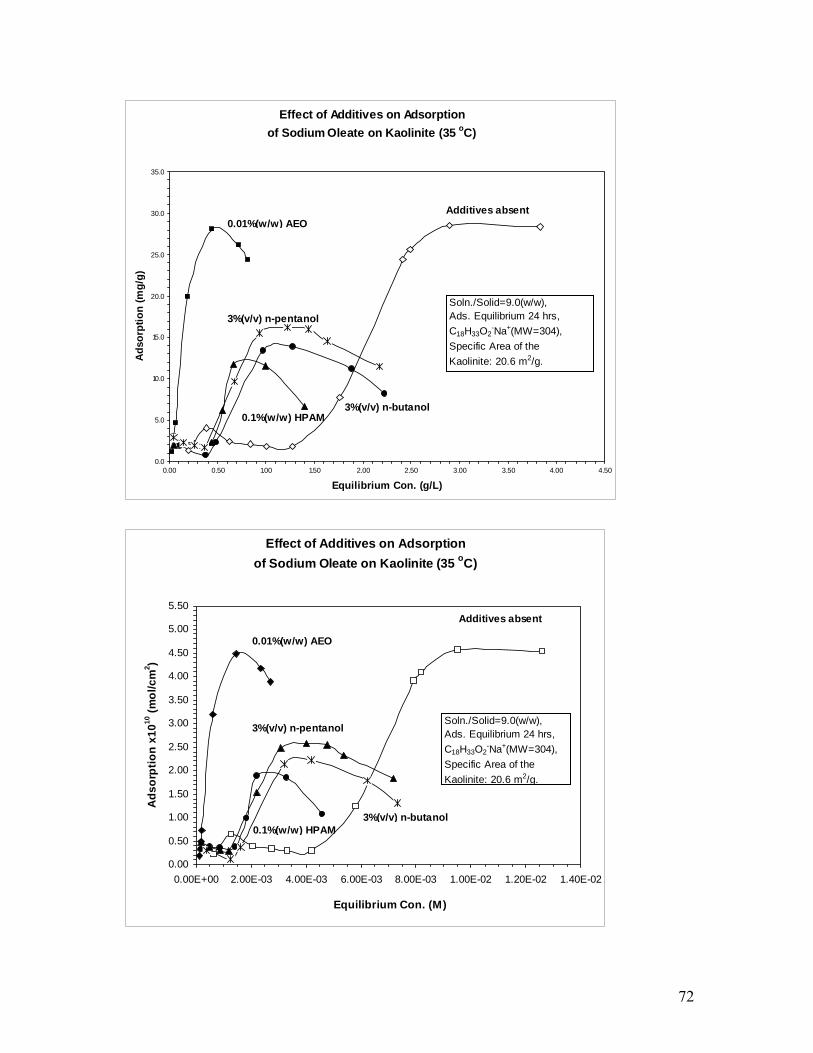
Effect of Additives on Adsorption of Sodium Oleate on Kaolinite (35 oC)
0.0
5.0
10.0
15.0
20.0
25.0
30.0
35.0
0.00 0.50 1.00 1.50 2.00 2.50 3.00 3.50 4.00 4.50
Equilibrium Con. (g/L)
Adso
rptio
n (m
g/g)
Additives absent0.01%(w/w) AEO
0.1%(w/w) HPAM3%(v/v) n-butanol
3%(v/v) n-pentanolSoln./Solid=9.0(w/w),Ads. Equilibrium 24 hrs,C18H33O2
-Na+(MW=304),Specific Area of theKaolinite: 20.6 m2/g.
Effect of Additives on Adsorption of Sodium Oleate on Kaolinite (35 oC)
0.00
0.50
1.00
1.50
2.00
2.50
3.00
3.50
4.00
4.50
5.00
5.50
0.00E+00 2.00E-03 4.00E-03 6.00E-03 8.00E-03 1.00E-02 1.20E-02 1.40E-02
Equilibrium Con. (M)
Ads
orpt
ion
x1010
(mol
/cm
2 )
Additives absent
0.01%(w/w) AEO
3%(v/v) n-pentanol
3%(v/v) n-butanol0.1%(w/w) HPAM
Soln./Solid=9.0(w/w),Ads. Equilibrium 24 hrs,C18H33O2
-Na+(MW=304),Specific Area of theKaolinite: 20.6 m2/g.
72
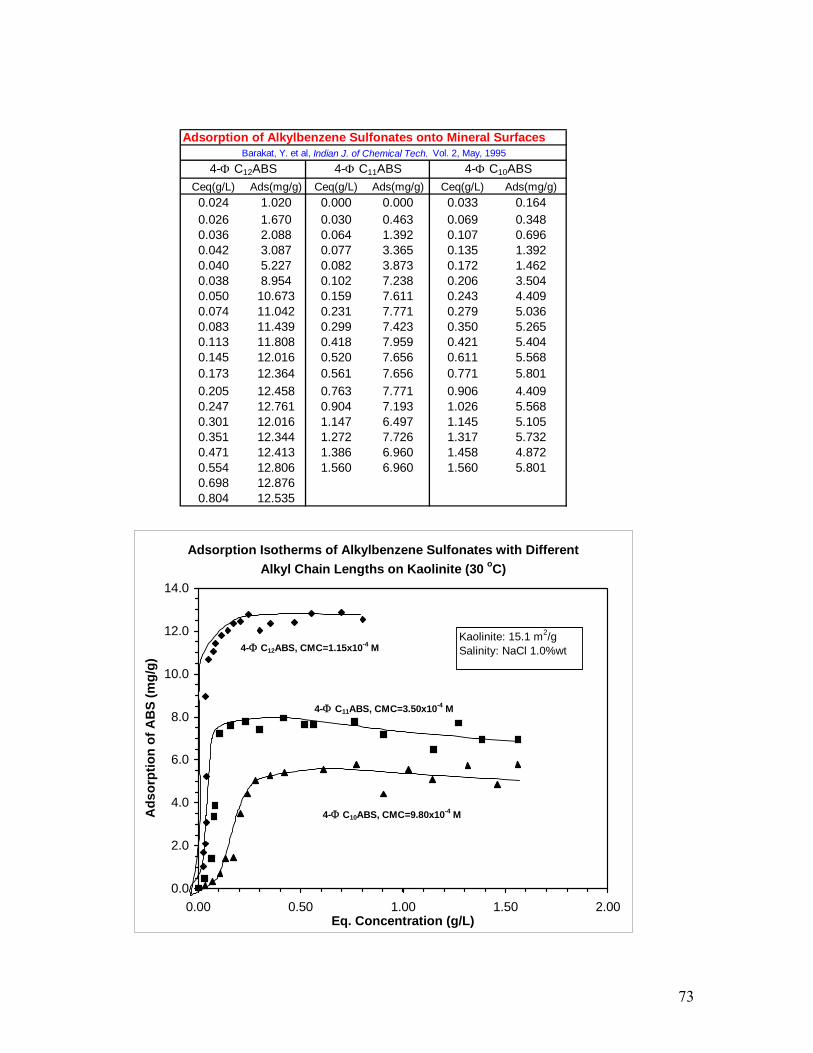
Ceq(g/L) Ads(mg/g) Ceq(g/L) Ads(mg/g) Ceq(g/L) Ads(mg/g)0.024 1.020 0.000 0.000 0.033 0.1640.026 1.670 0.030 0.463 0.069 0.3480.036 2.088 0.064 1.392 0.107 0.6960.042 3.087 0.077 3.365 0.135 1.3920.040 5.227 0.082 3.873 0.172 1.4620.038 8.954 0.102 7.238 0.206 3.5040.050 10.673 0.159 7.611 0.243 4.4090.074 11.042 0.231 7.771 0.279 5.0360.083 11.439 0.299 7.423 0.350 5.2650.113 11.808 0.418 7.959 0.421 5.4040.145 12.016 0.520 7.656 0.611 5.5680.173 12.364 0.561 7.656 0.771 5.8010.205 12.458 0.763 7.771 0.906 4.4090.247 12.761 0.904 7.193 1.026 5.5680.301 12.016 1.147 6.497 1.145 5.1050.351 12.344 1.272 7.726 1.317 5.7320.471 12.413 1.386 6.960 1.458 4.8720.554 12.806 1.560 6.960 1.560 5.8010.698 12.8760.804 12.535
Adsorption of Alkylbenzene Sulfonates onto Mineral SurfacesBarakat, Y. et al, Indian J. of Chemical Tech. Vol. 2, May, 1995
4-Φ C12ABS 4-Φ C11ABS 4-Φ C10ABS
Adsorption Isotherms of Alkylbenzene Sulfonates with Different Alkyl Chain Lengths on Kaolinite (30 oC)
0.0
2.0
4.0
6.0
8.0
10.0
12.0
14.0
0.00 0.50 1.00 1.50 2.00Eq. Concentration (g/L)
Ads
orpt
ion
of A
BS
(mg/
g)
4-Φ C12ABS, CMC=1.15x10⁻⁴ M
4-Φ C11ABS, CMC=3.50x10⁻⁴ M
4-Φ C10ABS, CMC=9.80x10⁻⁴ M
Kaolinite: 15.1 m2/gSalinity: NaCl 1.0%wt
73
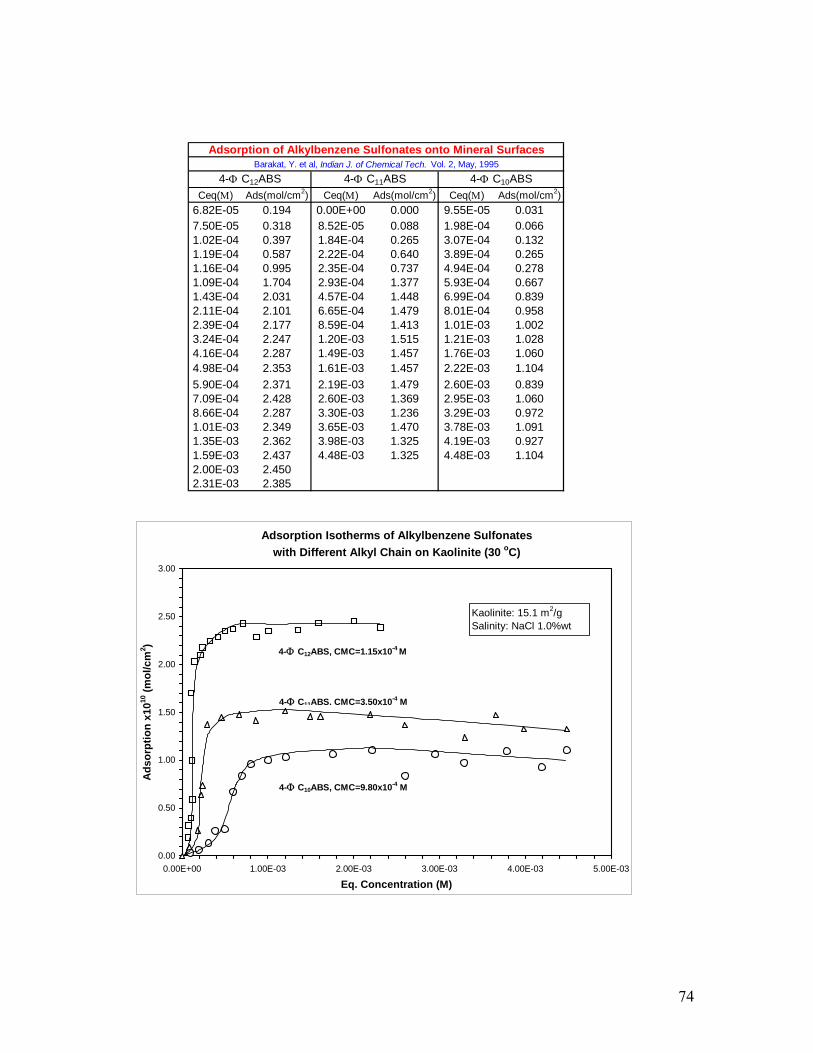
Ceq(Μ) Ads(mol/cm2) Ceq(Μ) Ads(mol/cm2) Ceq(Μ) Ads(mol/cm2)6.82E-05 0.194 0.00E+00 0.000 9.55E-05 0.0317.50E-05 0.318 8.52E-05 0.088 1.98E-04 0.0661.02E-04 0.397 1.84E-04 0.265 3.07E-04 0.1321.19E-04 0.587 2.22E-04 0.640 3.89E-04 0.2651.16E-04 0.995 2.35E-04 0.737 4.94E-04 0.2781.09E-04 1.704 2.93E-04 1.377 5.93E-04 0.6671.43E-04 2.031 4.57E-04 1.448 6.99E-04 0.8392.11E-04 2.101 6.65E-04 1.479 8.01E-04 0.9582.39E-04 2.177 8.59E-04 1.413 1.01E-03 1.0023.24E-04 2.247 1.20E-03 1.515 1.21E-03 1.0284.16E-04 2.287 1.49E-03 1.457 1.76E-03 1.0604.98E-04 2.353 1.61E-03 1.457 2.22E-03 1.1045.90E-04 2.371 2.19E-03 1.479 2.60E-03 0.8397.09E-04 2.428 2.60E-03 1.369 2.95E-03 1.0608.66E-04 2.287 3.30E-03 1.236 3.29E-03 0.9721.01E-03 2.349 3.65E-03 1.470 3.78E-03 1.0911.35E-03 2.362 3.98E-03 1.325 4.19E-03 0.9271.59E-03 2.437 4.48E-03 1.325 4.48E-03 1.1042.00E-03 2.4502.31E-03 2.385
4-Φ C12ABS 4-Φ C11ABS
Adsorption of Alkylbenzene Sulfonates onto Mineral SurfacesBarakat, Y. et al, Indian J. of Chemical Tech. Vol. 2, May, 1995
4-Φ C10ABS
Adsorption Isotherms of Alkylbenzene Sulfonates with Different Alkyl Chain on Kaolinite (30 oC)
0.00
0.50
1.00
1.50
2.00
2.50
3.00
0.00E+00 1.00E-03 2.00E-03 3.00E-03 4.00E-03 5.00E-03
Eq. Concentration (M)
Ads
orpt
ion
x1010
(mol
/cm
2 )
4-Φ C12ABS, CMC=1.15x10⁻⁴ M
4-Φ C11ABS, CMC=3.50x10⁻⁴ M
4-Φ C10ABS, CMC=9.80x10⁻⁴ M
Kaolinite: 15.1 m2/gSalinity: NaCl 1.0%wt
74
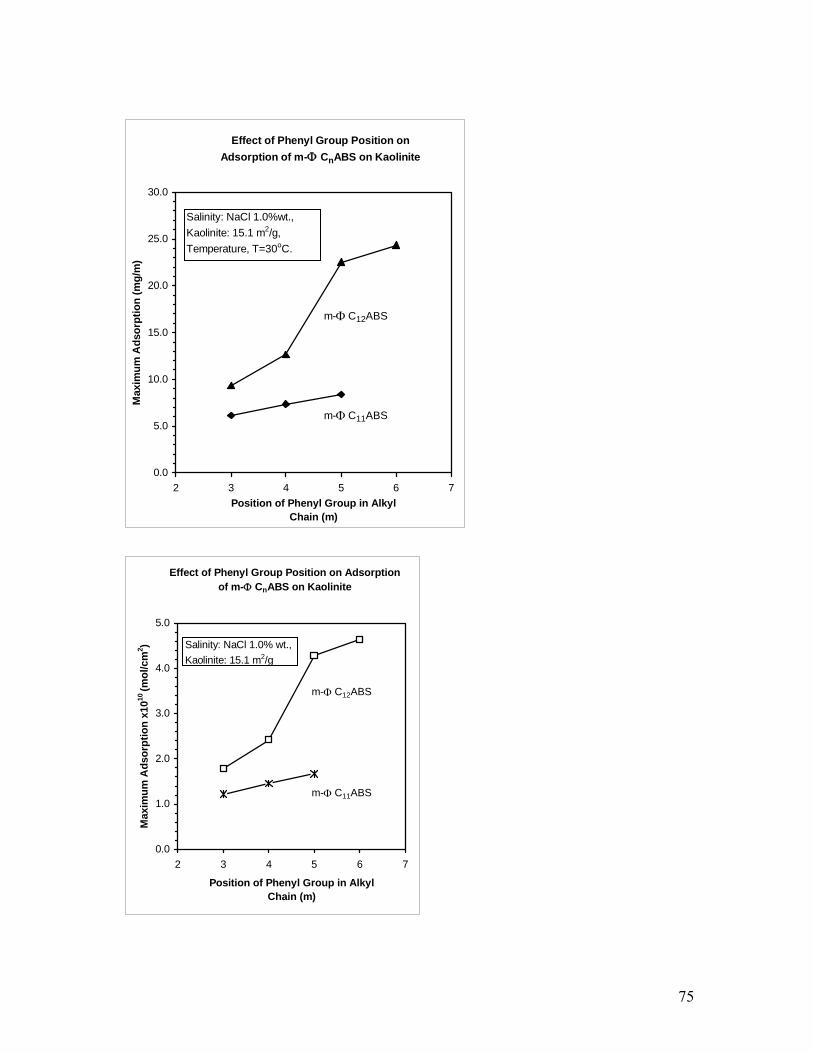
Effect of Phenyl Group Position on Adsorption of m-Φ CnABS on Kaolinite
0.0
5.0
10.0
15.0
20.0
25.0
30.0
2 3 4 5 6 7Position of Phenyl Group in Alkyl
Chain (m)
Max
imum
Ads
orpt
ion
(mg/
m)
m-Φ C12ABS
m-Φ C11ABS
Salinity: NaCl 1.0%wt.,Kaolinite: 15.1 m2/g,Temperature, T=30oC.
Effect of Phenyl Group Position on Adsorption of m-Φ CnABS on Kaolinite
0.0
1.0
2.0
3.0
4.0
5.0
2 3 4 5 6 7
Position of Phenyl Group in Alkyl Chain (m)
Max
imum
Ads
orpt
ion
x1010
(mol
/cm
2 ) Salinity: NaCl 1.0% wt.,Kaolinite: 15.1 m2/g
m-Φ C12ABS
m-Φ C11ABS
75
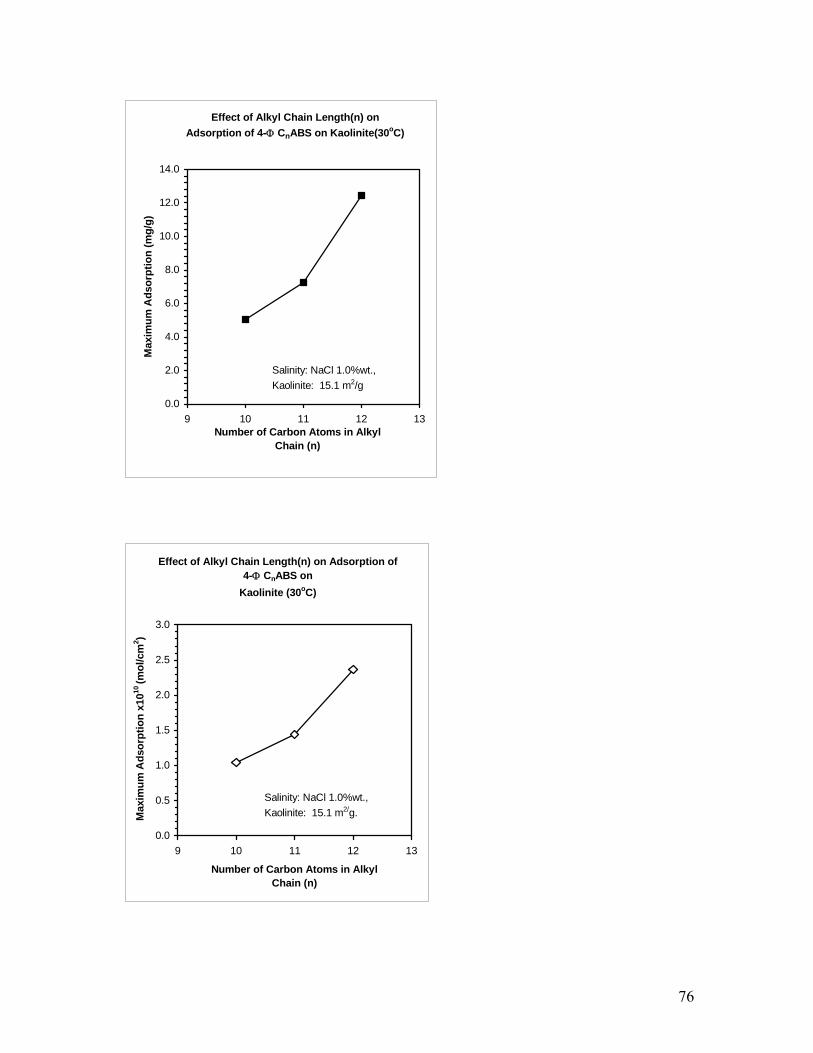
Effect of Alkyl Chain Length(n) on Adsorption of 4-Φ CnABS on Kaolinite(30oC)
0.0
2.0
4.0
6.0
8.0
10.0
12.0
14.0
9 10 11 12 13Number of Carbon Atoms in Alkyl
Chain (n)
Max
imum
Ads
orpt
ion
(mg/
g)
Salinity: NaCl 1.0%wt.,Kaolinite: 15.1 m2/g
Effect of Alkyl Chain Length(n) on Adsorption of 4-Φ CnABS on
Kaolinite (30oC)
0.0
0.5
1.0
1.5
2.0
2.5
3.0
9 10 11 12 1
Number of Carbon Atoms in Alkyl Chain (n)
Max
imum
Ads
orpt
ion
x1010
(mol
/cm
2 )
3
Salinity: NaCl 1.0%wt.,Kaolinite: 15.1 m2/g.
76
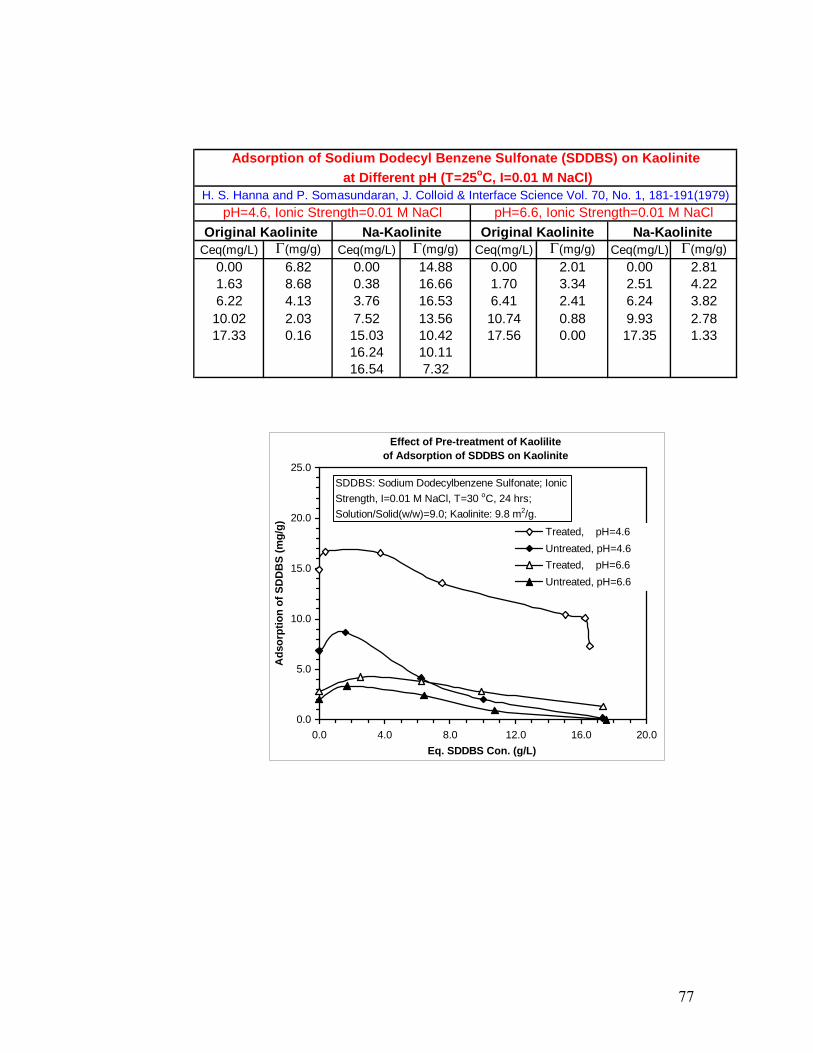
Ceq(mg/L) Γ(mg/g) Ceq(mg/L) Γ(mg/g) Ceq(mg/L) Γ(mg/g) Ceq(mg/L) Γ(mg/g)0.00 6.82 0.00 14.88 0.00 2.01 0.00 2.811.63 8.68 0.38 16.66 1.70 3.34 2.51 4.226.22 4.13 3.76 16.53 6.41 2.41 6.24 3.82
10.02 2.03 7.52 13.56 10.74 0.88 9.93 2.7817.33 0.16 15.03 10.42 17.56 0.00 17.35 1.33
16.24 10.1116.54 7.32
Original Kaolinite
H. S. Hanna and P. Somasundaran, J. Colloid & Interface Science Vol. 70, No. 1, 181-191(1979) at Different pH (T=25oC, I=0.01 M NaCl)
Adsorption of Sodium Dodecyl Benzene Sulfonate (SDDBS) on Kaolinite
pH=4.6, Ionic Strength=0.01 M NaCl pH=6.6, Ionic Strength=0.01 M NaClNa-Kaolinite Original Kaolinite Na-Kaolinite
Effect of Pre-treatment of Kaolilite of Adsorption of SDDBS on Kaolinite
0.0
5.0
10.0
15.0
20.0
25.0
0.0 4.0 8.0 12.0 16.0 20.0Eq. SDDBS Con. (g/L)
Ads
orpt
ion
of S
DD
BS
(mg/
g) Treated, pH=4.6Untreated, pH=4.6Treated, pH=6.6Untreated, pH=6.6
SDDBS: Sodium Dodecylbenzene Sulfonate; Ionic Strength, I=0.01 M NaCl, T=30 oC, 24 hrs;Solution/Solid(w/w)=9.0; Kaolinite: 9.8 m2/g.
77
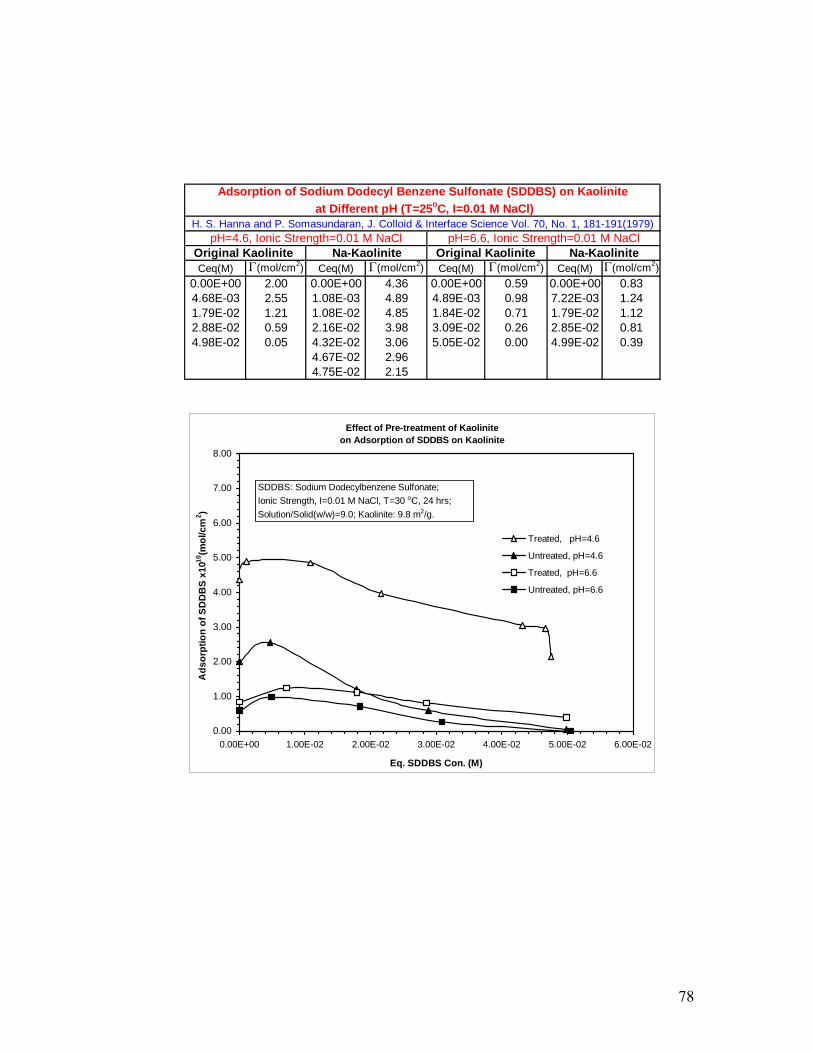
Ceq(M) Γ(mol/cm2) Ceq(M) Γ(mol/cm2) Ceq(M) Γ(mol/cm2) Ceq(M) Γ(mol/cm2)0.00E+00 2.00 0.00E+00 4.36 0.00E+00 0.59 0.00E+00 0.834.68E-03 2.55 1.08E-03 4.89 4.89E-03 0.98 7.22E-03 1.241.79E-02 1.21 1.08E-02 4.85 1.84E-02 0.71 1.79E-02 1.122.88E-02 0.59 2.16E-02 3.98 3.09E-02 0.26 2.85E-02 0.814.98E-02 0.05 4.32E-02 3.06 5.05E-02 0.00 4.99E-02 0.39
4.67E-02 2.964.75E-02 2.15
H. S. Hanna and P. Somasundaran, J. Colloid & Interface Science Vol. 70, No. 1, 181-191(1979)pH=4.6, Ionic Strength=0.01 M NaCl pH=6.6, Ionic Strength=0.01 M NaCl
Original Kaolinite Na-Kaolinite Original Kaolinite Na-Kaolinite
at Different pH (T=25oC M NaCl), I=0.01 Adsorption of Sodium Dodecyl Benzene Sulfonate (SDDBS) on Kaolinite
Effect of Pre-treatment of Kaolinite on Adsorption of SDDBS on Kaolinite
0.00
1.00
2.00
3.00
4.00
5.00
6.00
7.00
8.00
0.00E+00 1.00E-02 2.00E-02 3.00E-02 4.00E-02 5.00E-02 6.00E-02
Eq. SDDBS Con. (M)
Ads
orpt
ion
of S
DD
BS
x1010
(mol
/cm
2 )
Treated, pH=4.6
Untreated, pH=4.6
Treated, pH=6.6
Untreated, pH=6.6
SDDBS: Sodium Dodecylbenzene Sulfonate;Ionic Strength, I=0.01 M NaCl, T=30 oC, 24 hrs;Solution/Solid(w/w)=9.0; Kaolinite: 9.8 m2/g.
78

Effect of pH on Adsorption of SDDBS on Kaolinite (30oC, 72 hrs.)(Solution/Solid(w/w)=4.0, Ionic Strength:0.01 M NaCl)
(SDDBS: Sodium Dodecylbemzene Sulfonate, M.W.=348)
0.0
5.0
10.0
15.0
20.0
0.0 2.0 4.0 6.0 8.0 10.0 12.0 14.0 16.0 18.0 20.0
Eq. SDDBS Con. (g/L)
Ads
orpt
ion
of S
DD
BS
(mg/
g)
pH=4.5, Fresh KaolinitepH=4.5, Treated KaolinitepH=5.8, Treated KaolinitepH=6.6, Treated KaolinitepH=10.0,Treated Kaolinite
Kaolinite: 9.8 m2/g.
Effect of pH on Adsorption of SDDBS on Kaolinite (30oC, 72 hrs.)(Solution/Solid(w/w)=4.0, Ionic Strength:0.01 M NaCl)
(SDDBS: Sodium Dodecylbemzene Sulfonate, M.W.=348)
0.00
1.00
2.00
3.00
4.00
5.00
6.00
0.00E+00 1.00E-02 2.00E-02 3.00E-02 4.00E-02 5.00E-02 6.00E-02
Eq. SDDBS Con. (M)
Ads
orpt
ion
of S
DD
BS
X1010
(mol
/cm
2 )
pH=4.5, Fresh KaolinitepH=4.5, Treated KaolinitepH=5.8, Treated KaolinitepH=6.6, Treated KaolinitepH=10.0,Treated Kaolinite
Kaolinite: 9.8 m2/g.
79
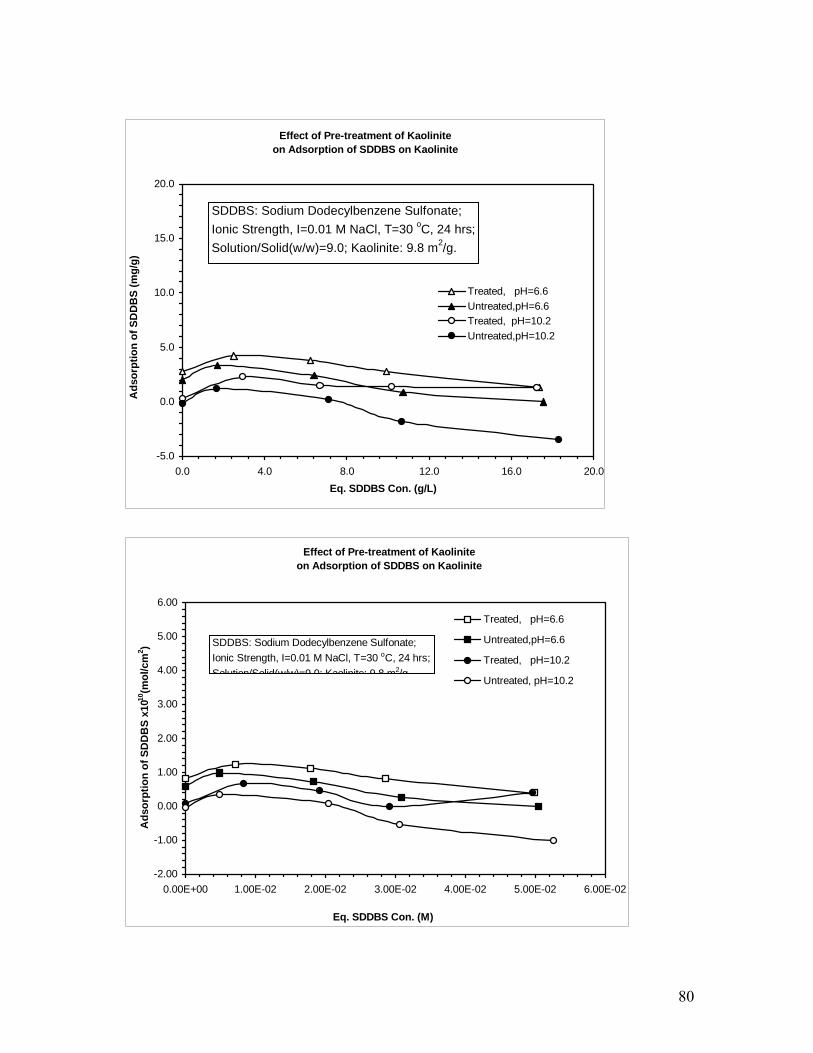
Effect of Pre-treatment of Kaolinite on Adsorption of SDDBS on Kaolinite
-5.0
0.0
5.0
10.0
15.0
20.0
0.0 4.0 8.0 12.0 16.0 20.0Eq. SDDBS Con. (g/L)
Ads
orpt
ion
of S
DD
BS
(mg/
g)
Treated, pH=6.6Untreated,pH=6.6Treated, pH=10.2Untreated,pH=10.2
SDDBS: Sodium Dodecylbenzene Sulfonate; Ionic Strength, I=0.01 M NaCl, T=30 oC, 24 hrs;Solution/Solid(w/w)=9.0; Kaolinite: 9.8 m2/g.
Effect of Pre-treatment of Kaolinite on Adsorption of SDDBS on Kaolinite
-2.00
-1.00
0.00
1.00
2.00
3.00
4.00
5.00
6.00
0.00E+00 1.00E-02 2.00E-02 3.00E-02 4.00E-02 5.00E-02 6.00E-02
Eq. SDDBS Con. (M)
Ads
orpt
ion
of S
DD
BS
x1010
(mol
/cm
2 )
Treated, pH=6.6
Untreated,pH=6.6
Treated, pH=10.2
Untreated, pH=10.2
SDDBS: Sodium Dodecylbenzene Sulfonate;Ionic Strength, I=0.01 M NaCl, T=30 oC, 24 hrs;Solution/Solid(w/w)=9 0; Kaolinite: 9 8 m2/g
80
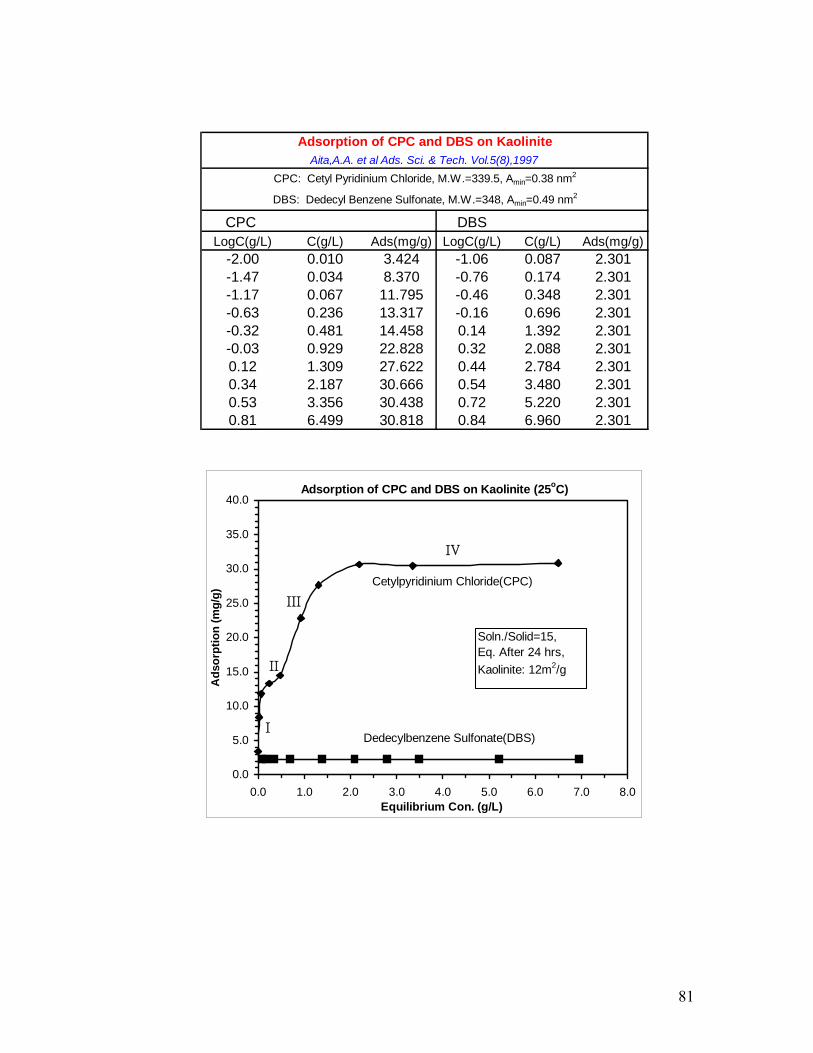
CPC DBSLogC(g/L) C(g/L) Ads(mg/g) LogC(g/L) C(g/L) Ads(mg/g)
-2.00 0.010 3.424 -1.06 0.087 2.301-1.47 0.034 8.370 -0.76 0.174 2.301-1.17 0.067 11.795 -0.46 0.348 2.301-0.63 0.236 13.317 -0.16 0.696 2.301-0.32 0.481 14.458 0.14 1.392 2.301-0.03 0.929 22.828 0.32 2.088 2.3010.12 1.309 27.622 0.44 2.784 2.3010.34 2.187 30.666 0.54 3.480 2.3010.53 3.356 30.438 0.72 5.220 2.3010.81 6.499 30.818 0.84 6.960 2.301
Aita,A.A. et al Ads. Sci. & Tech. Vol.5(8),1997CPC: Cetyl Pyridinium Chloride, M.W.=339.5, Amin=0.38 nm2
DBS: Dedecyl Benzene Sulfonate, M.W.=348, Amin=0.49 nm2
Adsorption of CPC and DBS on Kaolinite
Adsorption of CPC and DBS on Kaolinite (25oC)
0.0
5.0
10.0
15.0
20.0
25.0
30.0
35.0
40.0
0.0 1.0 2.0 3.0 4.0 5.0 6.0 7.0 8.0Equilibrium Con. (g/L)
Ads
orpt
ion
(mg/
g)
Cetylpyridinium Chloride(CPC)
Dedecylbenzene Sulfonate(DBS)I
II
III
IV
Soln./Solid=15,Eq. After 24 hrs,Kaolinite: 12m2/g
81
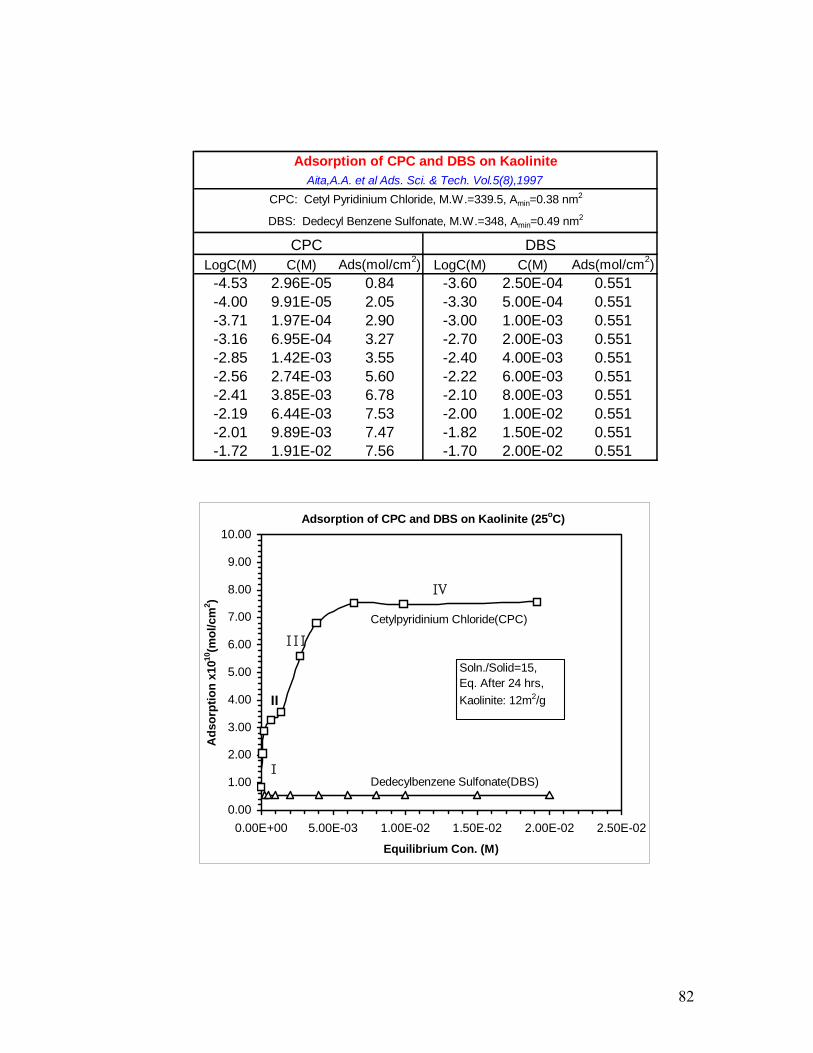
LogC(M) C(M) Ads(mol/cm2) LogC(M) C(M) Ads(mol/cm2)-4.53 2.96E-05 0.84 -3.60 2.50E-04 0.551-4.00 9.91E-05 2.05 -3.30 5.00E-04 0.551-3.71 1.97E-04 2.90 -3.00 1.00E-03 0.551-3.16 6.95E-04 3.27 -2.70 2.00E-03 0.551-2.85 1.42E-03 3.55 -2.40 4.00E-03 0.551-2.56 2.74E-03 5.60 -2.22 6.00E-03 0.551-2.41 3.85E-03 6.78 -2.10 8.00E-03 0.551-2.19 6.44E-03 7.53 -2.00 1.00E-02 0.551-2.01 9.89E-03 7.47 -1.82 1.50E-02 0.551-1.72 1.91E-02 7.56 -1.70 2.00E-02 0.551
CPC DBS
Adsorption of CPC and DBS on KaoliniteAita,A.A. et al Ads. Sci. & Tech. Vol.5(8),1997
CPC: Cetyl Pyridinium Chloride, M.W.=339.5, Amin=0.38 nm2
DBS: Dedecyl Benzene Sulfonate, M.W.=348, Amin=0.49 nm2
Adsorption of CPC and DBS on Kaolinite (25oC)
0.00
1.00
2.00
3.00
4.00
5.00
6.00
7.00
8.00
9.00
10.00
0.00E+00 5.00E-03 1.00E-02 1.50E-02 2.00E-02 2.50E-02
Equilibrium Con. (M)
Ads
orpt
ion
x1010
(mol
/cm
2 )
IV
III
II
I
Cetylpyridinium Chloride(CPC)
Dedecylbenzene Sulfonate(DBS)
Soln./Solid=15,Eq. After 24 hrs,Kaolinite: 12m2/g
82