Embed Size (px)
Citation preview
nutrients
Article
Lower Levels of Vitamin D Are Associated with an Increase inInsulin Resistance in Obese Brazilian Women
Minna F. Schleu 1,†, Beatriz Barreto-Duarte 2,3,4,5,†, Maria B. Arriaga 2,3,6,† , Mariana Araujo-Pereira 2,3,6,†,Ana Marice Ladeia 1, Bruno B. Andrade 1,2,3,4,5,6,*,‡ and Maria L. Lima 1,‡
�����������������
Citation: Schleu, M.F.;
Barreto-Duarte, B.; Arriaga, M.B.;
Araujo-Pereira, M.; Ladeia, A.M.;
Andrade, B.B.; Lima, M.L. Lower
Levels of Vitamin D Are Associated
with an Increase in Insulin Resistance
in Obese Brazilian Women. Nutrients
2021, 13, 2979. https://doi.org/
10.3390/nu13092979
Academic Editor: Caterina Conte
Received: 20 July 2021
Accepted: 24 August 2021
Published: 27 August 2021
Publisher’s Note: MDPI stays neutral
with regard to jurisdictional claims in
published maps and institutional affil-
iations.
Copyright: © 2021 by the authors.
Licensee MDPI, Basel, Switzerland.
This article is an open access article
distributed under the terms and
conditions of the Creative Commons
Attribution (CC BY) license (https://
creativecommons.org/licenses/by/
4.0/).
1 Programa de Pós-Graduação em Medicina e Saúde Humana, Escola Bahiana de Medicina e SaúdePública (EBMSP), Salvador 40290-000, Brazil; [email protected] (M.F.S.);[email protected] (A.M.L.); [email protected] (M.L.L.)
2 Laboratório de Inflamação e Biomarcadores, Instituto Gonçalo Moniz, Fundação Oswaldo Cruz,Salvador 40296-710, Brazil; [email protected] (B.B.-D.); [email protected] (M.B.A.);[email protected] (M.A.-P.)
3 Multinational Organization Network Sponsoring Translational and Epidemiological Research (MONSTER)Initiative, Salvador 41810-710, Brazil
4 Curso de Medicina, Universidade Salvador (UNIFACS), Laureate Universities, Salvador 41720-200, Brazil5 Programa de Pós-Graduação em Clínica Médica, Universidade Federal do Rio de Janeiro,
Rio de Janeiro 21941-617, Brazil6 Faculdade de Medicina, Universidade Federal da Bahia, Salvador 40110-100, Brazil* Correspondence: [email protected]; Tel.:+55-71-3176-2279† These authors contribute equality to this work (co-first authors).‡ These authors contribute equality to this work (co-last authors).
Abstract: Adult women are more likely to be obese than men. Moreover, there is evidence that obesityis a risk factor for increased insulin resistance (IR) and hypovitaminosis D (VITD), conditions relatedto metabolic and endocrinologic disturbance. We performed a cross-sectional study with 103 womendiagnosed with obesity, recruited between 2009 and 2013, in an obesity referral outpatient clinic inBahia, Brazil. Laboratory and clinical characteristics were compared between the groups accordingto the degree of obesity (I, II and III), and levels of 25-hydroxyvitamin D [25(OH)D] were used todefine the VITD status (insufficiency and no insufficiency). We calculated the homeostatic modelassessment-IR (HOMA-IR) index to assess insulin resistance in the groups. Our analyses revealed thatHOMA-IR values and VITD levels were inversely correlated. Furthermore, we observed a distinctexpression profile of values of laboratory markers according to 25(OH)D levels. Negative correlationswere found between HOMA-IR and body mass index (BMI) in VITD insufficient participants butnot in those with the sufficiency. Furthermore, multivariate regression demonstrated independentassociations between lower levels of 25(OH)D and increased values of HOMA-IR. These findingssuggests that lower levels of VITD are strongly associated with the increased IR in obese women.
Keywords: vitamin D; obesity; women; insulin resistance; HOMA-IR
1. Introduction
Obesity is a worldwide public health problem, with an average prevalence reaching13% of adult individuals, with women being more affected [1]. In Brazil, according tothe Brazilian Institute of Geography and Statistics (Instituto Brasileiro de Geografia eEstatística, IBGE), approximately 30% of Brazilians are obese, with female individualsrepresenting 60% of this population [2]. This disease has been defined by the World HealthOrganization (WHO) as a body mass index (BMI) equal to or greater than 30 kg/m2 [1].Several studies have linked obesity to the deficiency of essential vitamins and minerals [3],including vitamin D (VITD) [4,5]. VITD deficiency has a direct impact on the productionand signaling of insulin pathways which may accelerate and contribute to the establishmentof insulin resistance (IR) [6,7]. Importantly, women are often a target of study, since in
Nutrients 2021, 13, 2979. https://doi.org/10.3390/nu13092979 https://www.mdpi.com/journal/nutrients
Nutrients 2021, 13, 2979 2 of 12
addition to the risks of obesity observed in the general population [8,9], there is also anegative impact of VITD deficiency on both fertility and contraception [10]. Recent studieshave shown that VITD has an important role in the risk of glucose intolerance [11–13]. Thisvitamin exhibits a hypoglycemic function, which is justified by stimulating the expressionof insulin receptors on the cell membrane and through increasing insulin secretion bypancreatic cells. Whether by improving the response or increasing insulin secretion, theassociation between low VITD levels and dysglycemia is the goal of studies aiming at abetter understanding of the pathogenesis of diabetes, with supplementation of this vitaminbeing considered as a potential adjunctive therapy.
Furthermore, due to the fat-soluble characteristic of VITD, in obese patients, 25hy-droxyvitamin D (25(OH)D) is sequestered by the abundant adipose tissue resulting in lowlevels of VITD in the peripheral blood of this population [14–16]. This makes obesity arisk factor for hypovitaminosis D and a possible risk factor for insulin resistance. In thepresent study, we investigated the presence of VITD deficiency in obese women as a riskfactor for increased insulin resistance through an evaluation of laboratory, clinical andepidemiological variables of this population.
2. Materials and Methods2.1. Study Design and Participants
In this cross-sectional study, performed between 2009 and 2013, blood samples werecollected from 103 women diagnosed with obesity, enrolled and followed up at the obesityclinic in the city of Salvador in the state of Bahia. The aforementioned institution is areferral center in the care and treatment of obesity diseases in the state of Bahia, Brazil.
We only use baseline data from patients who entered the specialized service. Compar-isons within the obese group were performed between participants stratified based on useof BMI considering: Obesity I: BMI = 30.0–34.9 kg/m2; Obesity II: BMI = 35.0–39.9 kg/m2;Obesity III: BMI ≥ 40.0 kg/m2 [17]. In addition, comparisons were performed stratifyingthe participants according with the level of 25(OH)D: participants were considered VITDdeficient (25(OH)D level: >20 or ≤30 ng/mL), insufficient (25(OH)D level: <20 ng/mL) andnormal (25(OH)D level: >30 ng/mL). Additionally, we compared the status of 25(OH)D asinsufficient (25(OH)D level < 20 ng/mL) and not insufficient, which includes insufficientand normal levels (25(OH)D level > 20 mg/mL) [18]. Participants included in the studywere also interviewed by filling out a questionnaire including data such as age, ethnicity(self-reported), diabetes, hypertension, use of obesity medication and smoking. Some pa-tients were diagnosed as diabetics or hypertensive with the measurements of the referencecenter. The anthropometric measurements obtained were weight, height, BMI and waistcircumference. The analyses were performed stratifying the status of VITD as insufficientand not insufficient.
Inclusion and Exclusion Criteria
Women with BMI ≥ 30 kg/m2 over 18 years were included. Patients receiving currentsupplementation or in the last 3 months with calcium and vitamin D, such as, patients withchronic renal failure and pregnancy, were excluded from the analyses.
2.2. Laboratory Measurements
Blood samples were obtained after a fasting period of at least 12 h. The followingparameters were assessed in a reference laboratory: C-reactive protein (CRP), thyroidstimulating hormone (TSH), fasting plasma glucose (FPG) (mg/dL), glycated hemoglobin(HbA1C) (%), fasting insulin with HOMA-IR calculation, creatinine(mg/dL), blood urea ni-trogen (BUN) (mg/dL), serum calcium (mg/dL), albumin (mg/dL) and 25(OHD)(ng/mL).The measurements of triglycerides, total cholesterol and high-density lipoprotein choles-terol (HDL) were performed according to the specifications of the manufacturers. TheFriedewald formula was used to calculate low-density lipoprotein cholesterol (LDL)
Nutrients 2021, 13, 2979 3 of 12
from total cholesterol, triglycerides and HDL. ELISA commercial kits from R&D Systems(Minneapolis, MN, USA) were used to quantify concentrations of 25(OH)D.
2.3. Statistical Analysis
Descriptive statistics were performed to characterize the study population. Kolmo-gorov–Smirnoff test was used to evaluate the Gaussian distribution of the quantitativevariables. Categorical variables were presented as frequency and proportions and com-pared using a two-sided Pearson’s chi-squared test or Fisher’s two-tailed test in 2 × 3 or2 × 2 tables, respectively. Quantitative variables were presented as median and interquar-tile range (IQR) values and compared using the Mann–Whitney U (between 2 groups) orKruskal–Wallis test (between >2 groups).
Hierarchical cluster analyses (Ward’s method) of log10 transformed values and z-scorenormalized data were employed to depict the overall expression profile of biomarkersin the study subgroups. Correlations between the different parameters were evaluatedwith the Spearman test. A linear regression model was performed to evaluate the inde-pendent associations between clinical and biochemical characteristics of the patients andthe increased HOMA-IR. Only relevant parameters in the literature were included in themultivariable model; p-values of <0.05 were considered statistically significant.
3. Results3.1. Characteristics of the Study Population
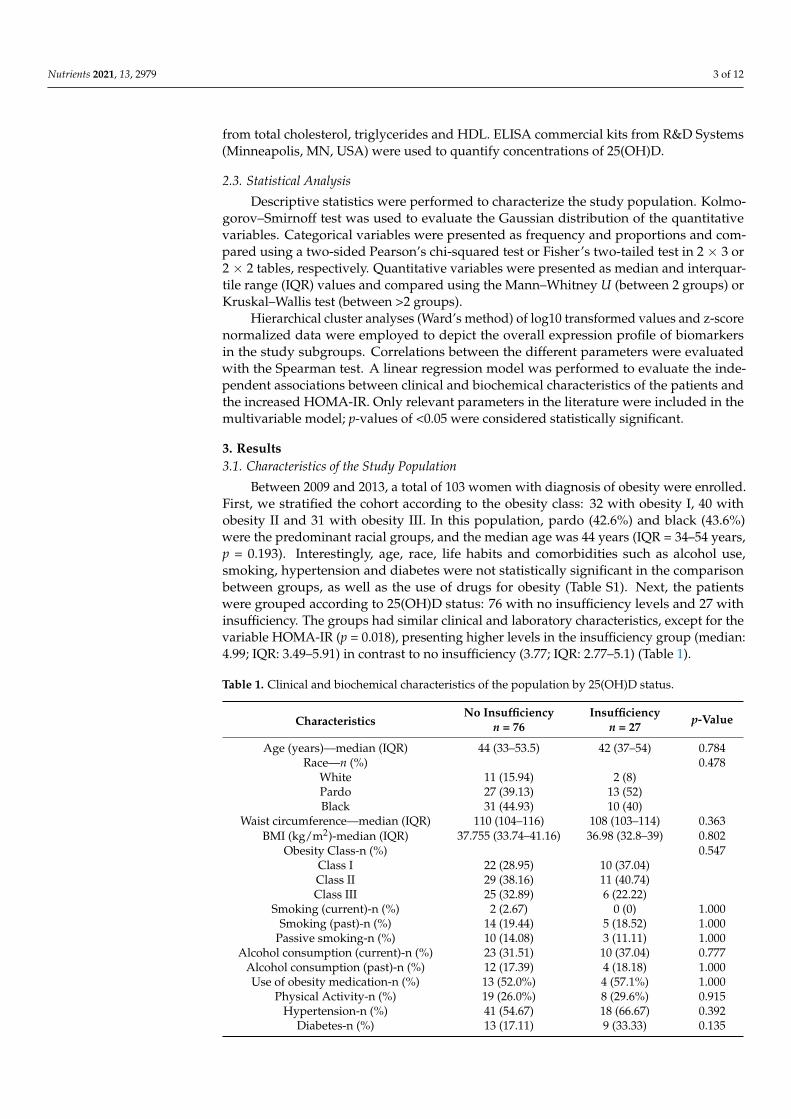
Between 2009 and 2013, a total of 103 women with diagnosis of obesity were enrolled.First, we stratified the cohort according to the obesity class: 32 with obesity I, 40 withobesity II and 31 with obesity III. In this population, pardo (42.6%) and black (43.6%)were the predominant racial groups, and the median age was 44 years (IQR = 34–54 years,p = 0.193). Interestingly, age, race, life habits and comorbidities such as alcohol use,smoking, hypertension and diabetes were not statistically significant in the comparisonbetween groups, as well as the use of drugs for obesity (Table S1). Next, the patientswere grouped according to 25(OH)D status: 76 with no insufficiency levels and 27 withinsufficiency. The groups had similar clinical and laboratory characteristics, except for thevariable HOMA-IR (p = 0.018), presenting higher levels in the insufficiency group (median:4.99; IQR: 3.49–5.91) in contrast to no insufficiency (3.77; IQR: 2.77–5.1) (Table 1).
Table 1. Clinical and biochemical characteristics of the population by 25(OH)D status.
CharacteristicsNo Insufficiency Insufficiency p-Value
n = 76 n = 27
Age (years)—median (IQR) 44 (33–53.5) 42 (37–54) 0.784Race—n (%) 0.478
White 11 (15.94) 2 (8)Pardo 27 (39.13) 13 (52)Black 31 (44.93) 10 (40)
Waist circumference—median (IQR) 110 (104–116) 108 (103–114) 0.363BMI (kg/m2)-median (IQR) 37.755 (33.74–41.16) 36.98 (32.8–39) 0.802
Obesity Class-n (%) 0.547Class I 22 (28.95) 10 (37.04)Class II 29 (38.16) 11 (40.74)Class III 25 (32.89) 6 (22.22)
Smoking (current)-n (%) 2 (2.67) 0 (0) 1.000Smoking (past)-n (%) 14 (19.44) 5 (18.52) 1.000
Passive smoking-n (%) 10 (14.08) 3 (11.11) 1.000Alcohol consumption (current)-n (%) 23 (31.51) 10 (37.04) 0.777
Alcohol consumption (past)-n (%) 12 (17.39) 4 (18.18) 1.000Use of obesity medication-n (%) 13 (52.0%) 4 (57.1%) 1.000
Physical Activity-n (%) 19 (26.0%) 8 (29.6%) 0.915Hypertension-n (%) 41 (54.67) 18 (66.67) 0.392
Diabetes-n (%) 13 (17.11) 9 (33.33) 0.135
Nutrients 2021, 13, 2979 4 of 12
Table 1. Cont.
CharacteristicsNo Insufficiency Insufficiency p-Value
n = 76 n = 27
Biochemistry parametersCholesterol (mg/dL)-median (IQR) 190.5 (172–216) 209 (160–227) 0.429
Triglycerides (mg/dL)-median (IQR) 124 (90–166) 134 (94–173) 0.534LDL (mg/dL)-median (IQR) 122.4 (104.4–141.2) 126.2 (103–161) 0.372HDL (mg/dL)-median (IQR) 42 (38–48) 39 (35–48) 0.380
TSH (mUI/mL)-median (IQR) 1.99 (1.28–2.98) 1.67 (1.27–2.51) 0.424CRP (mg/L)-median (IQR) 5.05 (2.87–8.98) 4.57 (2.26–11) 0.672
FPG (mg/dL)-median (IQR) 96 (92–106) 94 (85–108) 0.896HbA1c (%)-median (IQR) 5.9 (5.5–6.6) 5.7 (5.4–6.4) 0.663
Insulin (mUI/mL)-median (IQR) 14.45 (10.9–20.2) 16.8 (13.2–22.9) 0.254HOMA-IR-median (IQR) 3.77 (2.77–5.1) 4.99 (3.49–5.91) 0.018
Data represent no. (%), except for age and BMI, which are presented as median and interquartile range (IQR). All:Obesity was classified in class I: BMI 30.0–34.9 kg/m2; II: BMI = 35.0–39.9 kg/m2; and III: BMI = ≥ 40.0 kg/m2.Physical activity was defined as at least 30 min of activity at least 3 times a week. Continuous variables werecompared between obesity class using Kruskal–Wallis test. Diabetes and hypertension were self-reported anddiagnosed. Abbreviations: BMI = Body mass index; LDH = Low-density lipoproteins; HDL: High-densitylipoprotein; TSH = Thyroid-stimulating hormone; CRP = C-reactive protein; FPG = Fasting plasma glucose;HbA1c = Glycated hemoglobin; 25(OH)D = 25-hydroxyvitamin D.
3.2. Laboratory Evaluation between the Clinical Groups
Laboratory information was assessed and compared between the groups (Table 1).The lipid profile of the study patients was similar, but, in contrast, the values of thyroid-stimulating hormone (TSH) (p = 0.024) and C-reactive protein (CRP) (p = 0.040) weresignificantly different between the study groups. Of note, TSH and CRP levels were higherin patients with obesity III. These findings suggest a more pronounced proinflammatorystatus in patients with a more severe degree of obesity.
The levels of FPG and HbA1c were similar between groups, whereas the values ofHOMA-IR (p = 0.031) and insulin (p = 0.006) were different, so that the group of patientswith obesity III exhibited the highest HOMA-IR value, and the group of patients withobesity II had the highest insulin value. Of note, the level (p = 0.891) and status of 25(OH)D(p = 0.531) were similar in the study population.
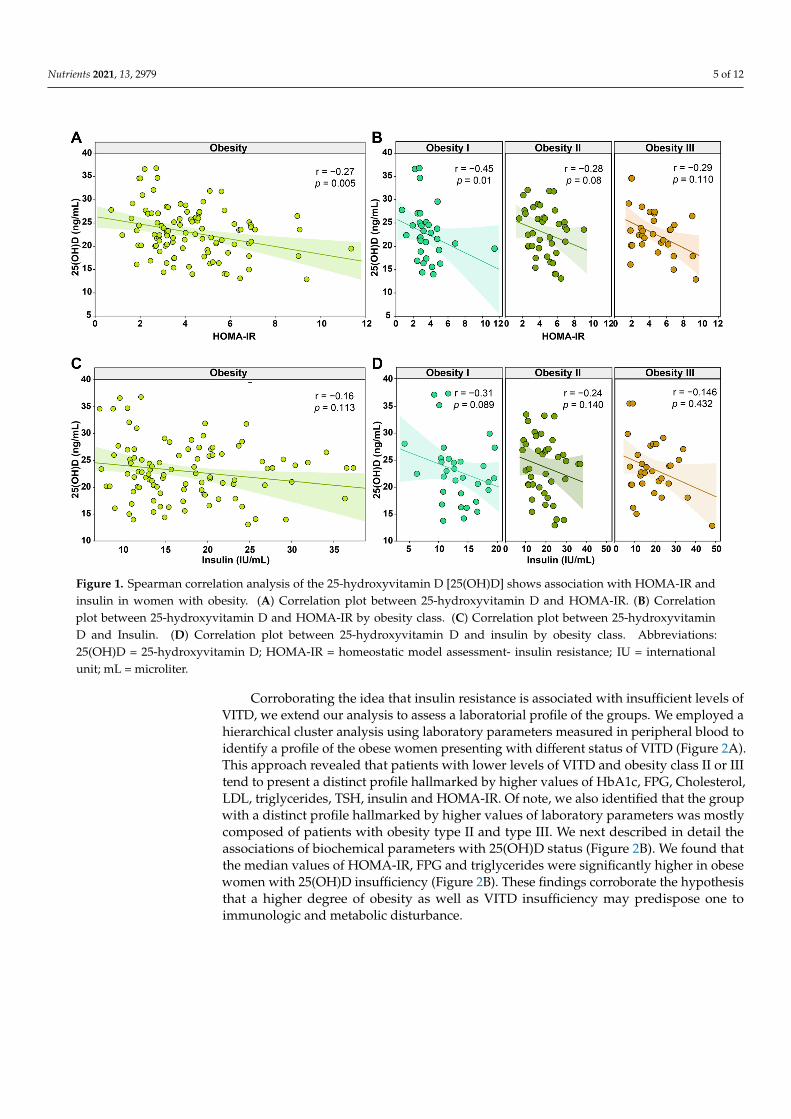
3.3. Lower Levels of 25 (OH)D Were Associated with Higher Insulin Resistance in Obese Women
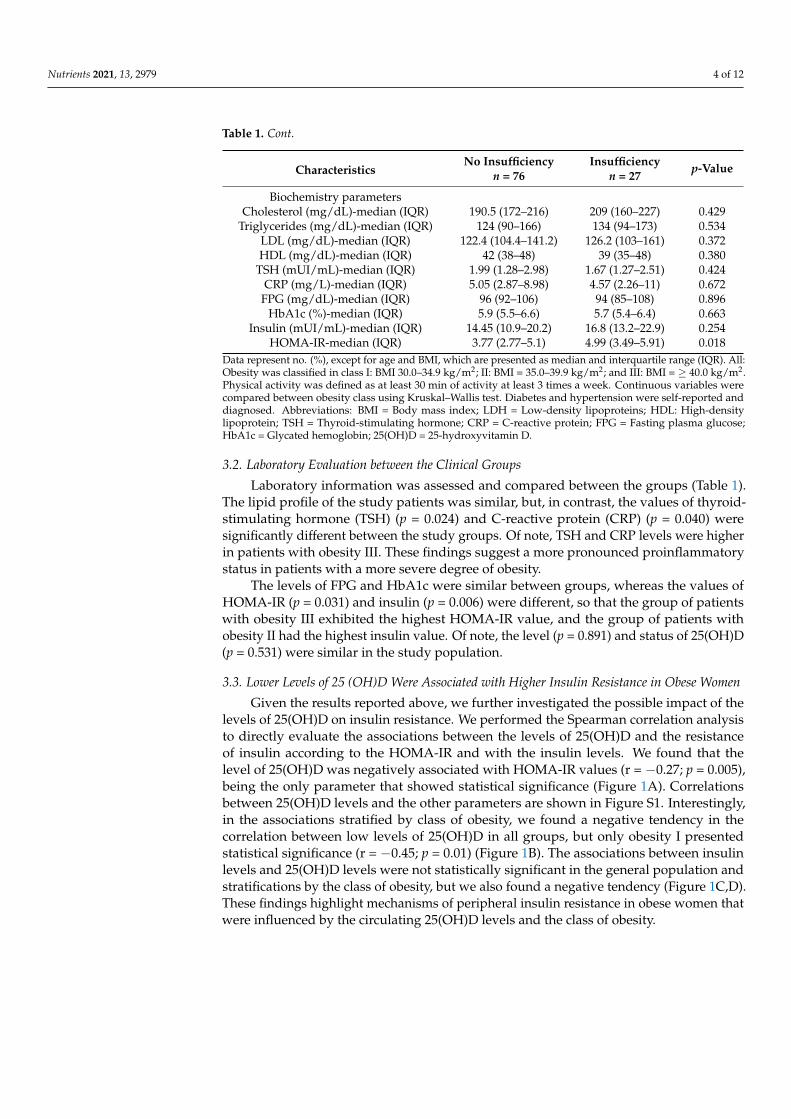
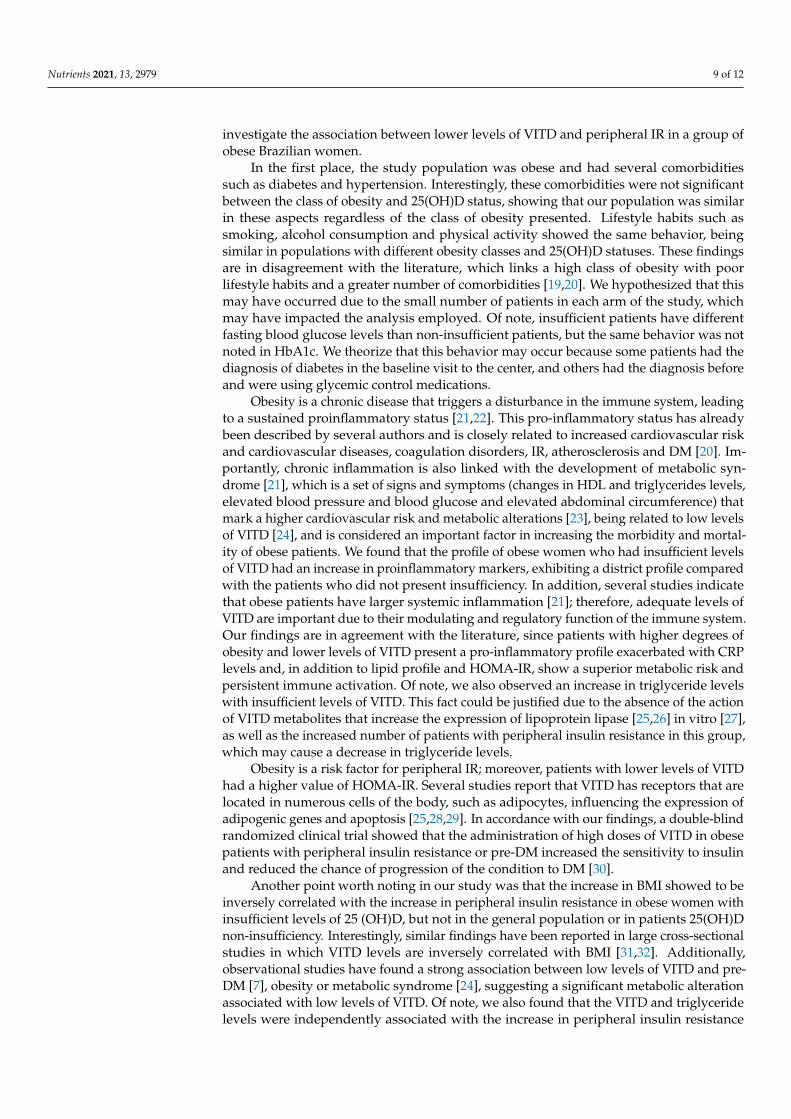
Given the results reported above, we further investigated the possible impact of thelevels of 25(OH)D on insulin resistance. We performed the Spearman correlation analysisto directly evaluate the associations between the levels of 25(OH)D and the resistanceof insulin according to the HOMA-IR and with the insulin levels. We found that thelevel of 25(OH)D was negatively associated with HOMA-IR values (r = −0.27; p = 0.005),being the only parameter that showed statistical significance (Figure 1A). Correlationsbetween 25(OH)D levels and the other parameters are shown in Figure S1. Interestingly,in the associations stratified by class of obesity, we found a negative tendency in thecorrelation between low levels of 25(OH)D in all groups, but only obesity I presentedstatistical significance (r = −0.45; p = 0.01) (Figure 1B). The associations between insulinlevels and 25(OH)D levels were not statistically significant in the general population andstratifications by the class of obesity, but we also found a negative tendency (Figure 1C,D).These findings highlight mechanisms of peripheral insulin resistance in obese women thatwere influenced by the circulating 25(OH)D levels and the class of obesity.
Nutrients 2021, 13, 2979 5 of 12
Nutrients 2021, 13, x FOR PEER REVIEW 5 of 12
25(OH)D levels were not statistically significant in the general population and
stratifications by the class of obesity, but we also found a negative tendency (Figure 1C,D).
These findings highlight mechanisms of peripheral insulin resistance in obese women that
were influenced by the circulating 25(OH)D levels and the class of obesity.
Figure 1. Spearman correlation analysis of the 25‐hydroxyvitamin D [25(OH)D] shows association with HOMA‐IR and
insulin in women with obesity. (A) Correlation plot between 25‐hydroxyvitamin D and HOMA‐IR. (B) Correlation plot
between 25‐hydroxyvitamin D and HOMA‐IR by obesity class. (C) Correlation plot between 25‐hydroxyvitamin D and
Insulin. (D) Correlation plot between 25‐hydroxyvitamin D and insulin by obesity class. Abbreviations: 25(OH)D = 25‐
hydroxyvitamin D; HOMA‐IR = homeostatic model assessment‐ insulin resistance; IU = international unit; mL = microliter.
Corroborating the idea that insulin resistance is associated with insufficient levels of
VITD, we extend our analysis to assess a laboratorial profile of the groups. We employed
a hierarchical cluster analysis using laboratory parameters measured in peripheral blood
to identify a profile of the obese women presenting with different status of VITD (Figure
2A). This approach revealed that patients with lower levels of VITD and obesity class II
or III tend to present a distinct profile hallmarked by higher values of HbA1c, FPG,
Cholesterol, LDL, triglycerides, TSH, insulin and HOMA‐IR. Of note, we also identified
that the group with a distinct profile hallmarked by higher values of laboratory
parameters was mostly composed of patients with obesity type II and type III. We next
described in detail the associations of biochemical parameters with 25(OH)D status
(Figure 2B). We found that the median values of HOMA‐IR, FPG and triglycerides were
significantly higher in obese women with 25(OH)D insufficiency (Figure 2B). These
findings corroborate the hypothesis that a higher degree of obesity as well as VITD
insufficiency may predispose one to immunologic and metabolic disturbance.
Figure 1. Spearman correlation analysis of the 25-hydroxyvitamin D [25(OH)D] shows association with HOMA-IR andinsulin in women with obesity. (A) Correlation plot between 25-hydroxyvitamin D and HOMA-IR. (B) Correlationplot between 25-hydroxyvitamin D and HOMA-IR by obesity class. (C) Correlation plot between 25-hydroxyvitaminD and Insulin. (D) Correlation plot between 25-hydroxyvitamin D and insulin by obesity class. Abbreviations:25(OH)D = 25-hydroxyvitamin D; HOMA-IR = homeostatic model assessment- insulin resistance; IU = internationalunit; mL = microliter.
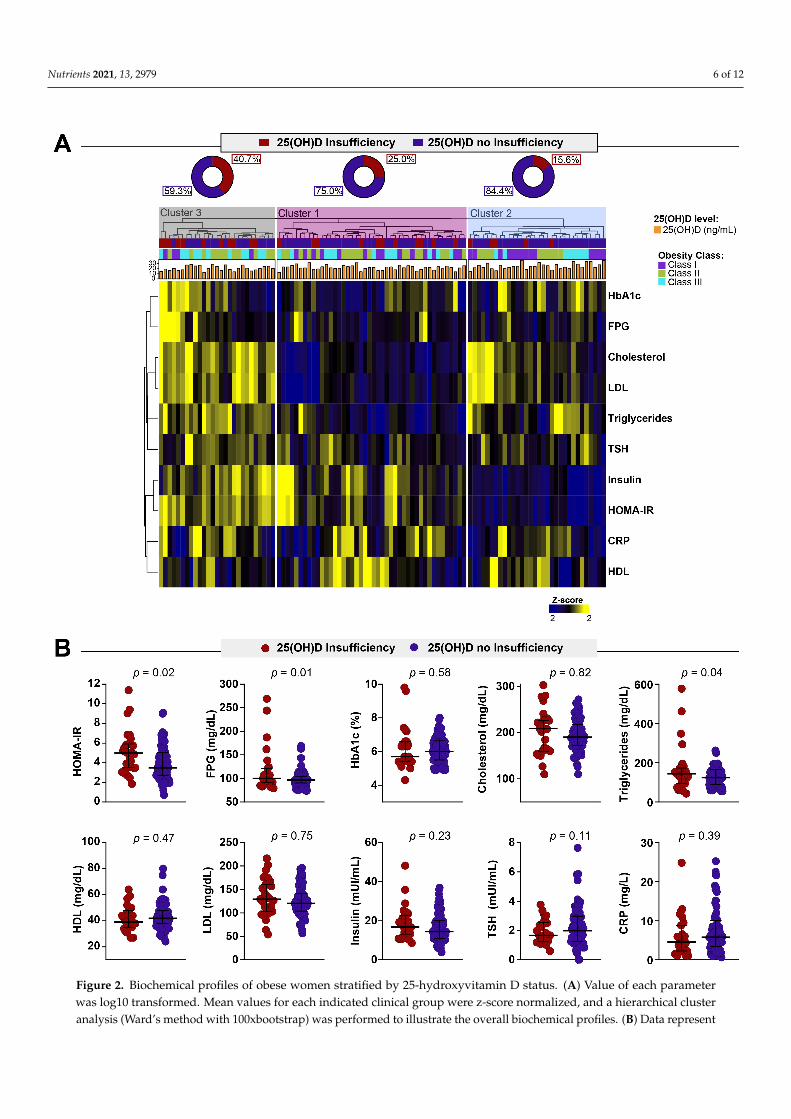
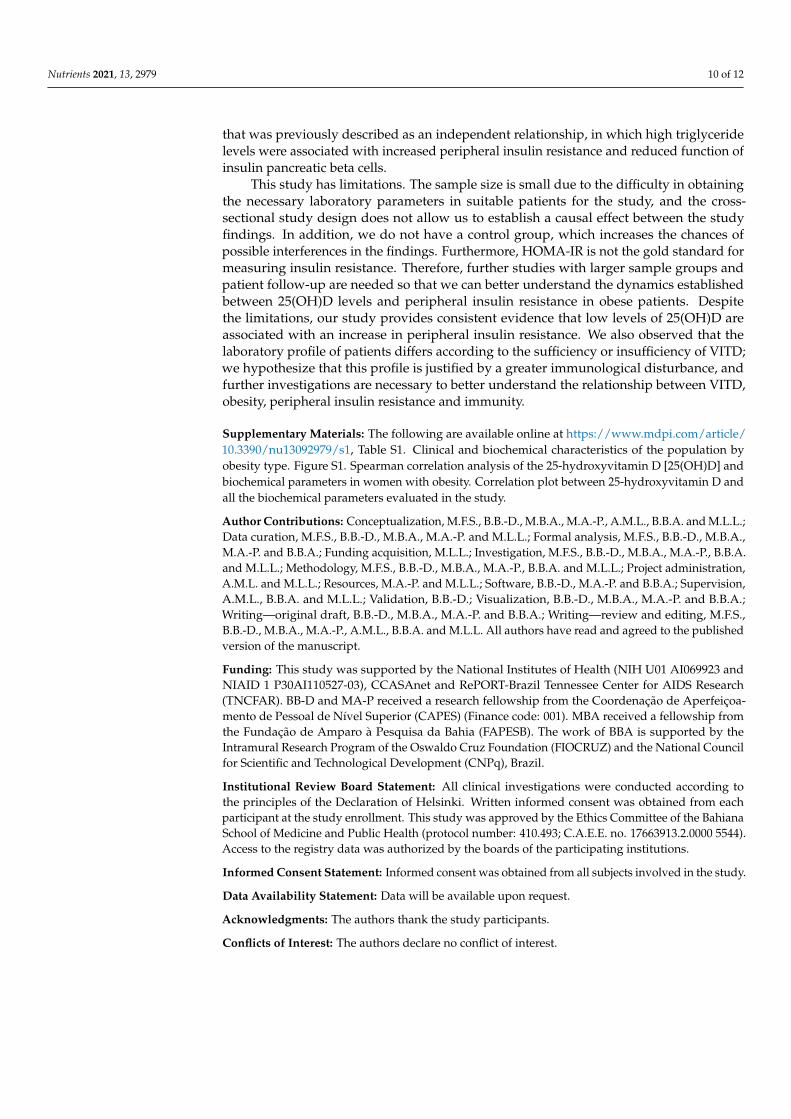
Corroborating the idea that insulin resistance is associated with insufficient levels ofVITD, we extend our analysis to assess a laboratorial profile of the groups. We employed ahierarchical cluster analysis using laboratory parameters measured in peripheral blood toidentify a profile of the obese women presenting with different status of VITD (Figure 2A).This approach revealed that patients with lower levels of VITD and obesity class II or IIItend to present a distinct profile hallmarked by higher values of HbA1c, FPG, Cholesterol,LDL, triglycerides, TSH, insulin and HOMA-IR. Of note, we also identified that the groupwith a distinct profile hallmarked by higher values of laboratory parameters was mostlycomposed of patients with obesity type II and type III. We next described in detail theassociations of biochemical parameters with 25(OH)D status (Figure 2B). We found thatthe median values of HOMA-IR, FPG and triglycerides were significantly higher in obesewomen with 25(OH)D insufficiency (Figure 2B). These findings corroborate the hypothesisthat a higher degree of obesity as well as VITD insufficiency may predispose one toimmunologic and metabolic disturbance.
Nutrients 2021, 13, 2979 6 of 12Nutrients 2021, 13, x FOR PEER REVIEW 6 of 12
Figure 2. Biochemical profiles of obese women stratified by 25‐hydroxyvitamin D status. (A) Value of each parameter was
log10 transformed. Mean values for each indicated clinical group were z‐score normalized, and a hierarchical cluster anal‐
ysis (Ward’s method with 100xbootstrap) was performed to illustrate the overall biochemical profiles. (B) Data represent
median and interquartile ranges. The Mann–Whitney U test was employed to compare the values detected between the
Figure 2. Biochemical profiles of obese women stratified by 25-hydroxyvitamin D status. (A) Value of each parameterwas log10 transformed. Mean values for each indicated clinical group were z-score normalized, and a hierarchical clusteranalysis (Ward’s method with 100xbootstrap) was performed to illustrate the overall biochemical profiles. (B) Data represent
Nutrients 2021, 13, 2979 7 of 12
median and interquartile ranges. The Mann–Whitney U test was employed to compare the values detected betweenthe study subgroups. Abbreviations: FPG = Fasting plasma glucose; HbA1c = Glycated hemoglobin; HDL: High-density lipoprotein; LDL = Low-density Lipoproteins; TSH = Thyroid-stimulating hormone; C-RP = C-reactive protein;25(OH)D = 25-hydroxyvitamin D.
3.4. VITD Insufficiency Was Independently Associated with an Increase in HOMA-IR
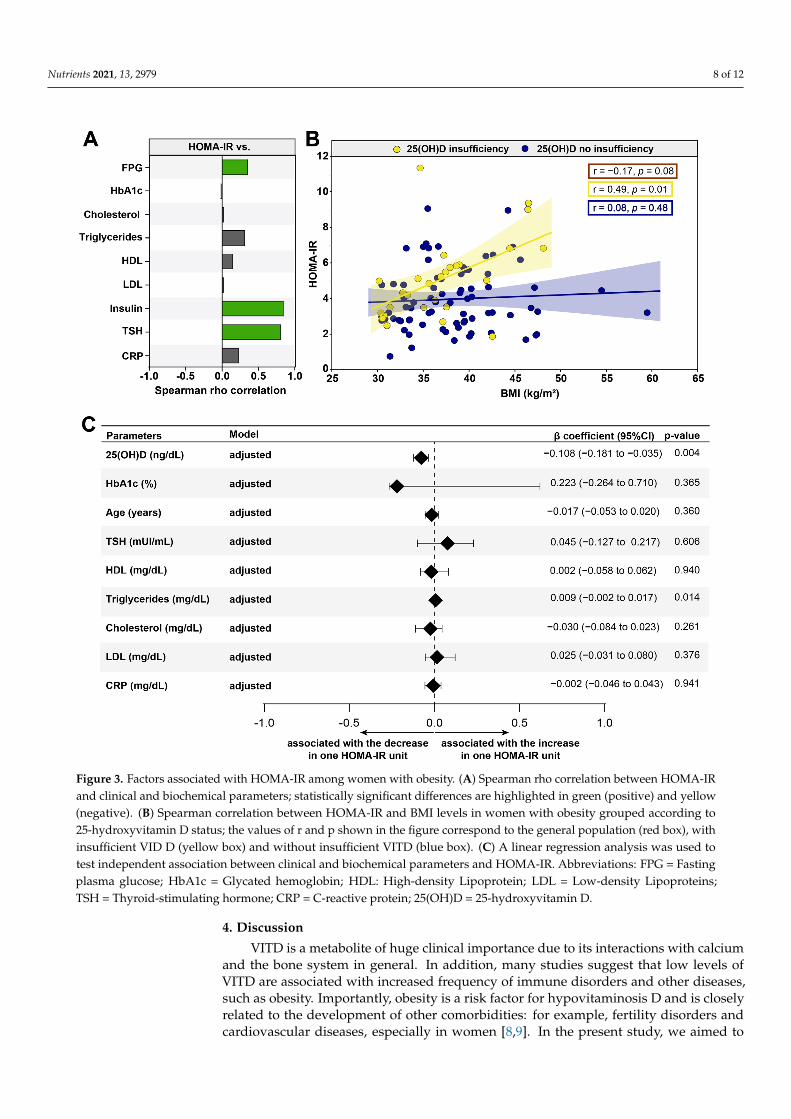
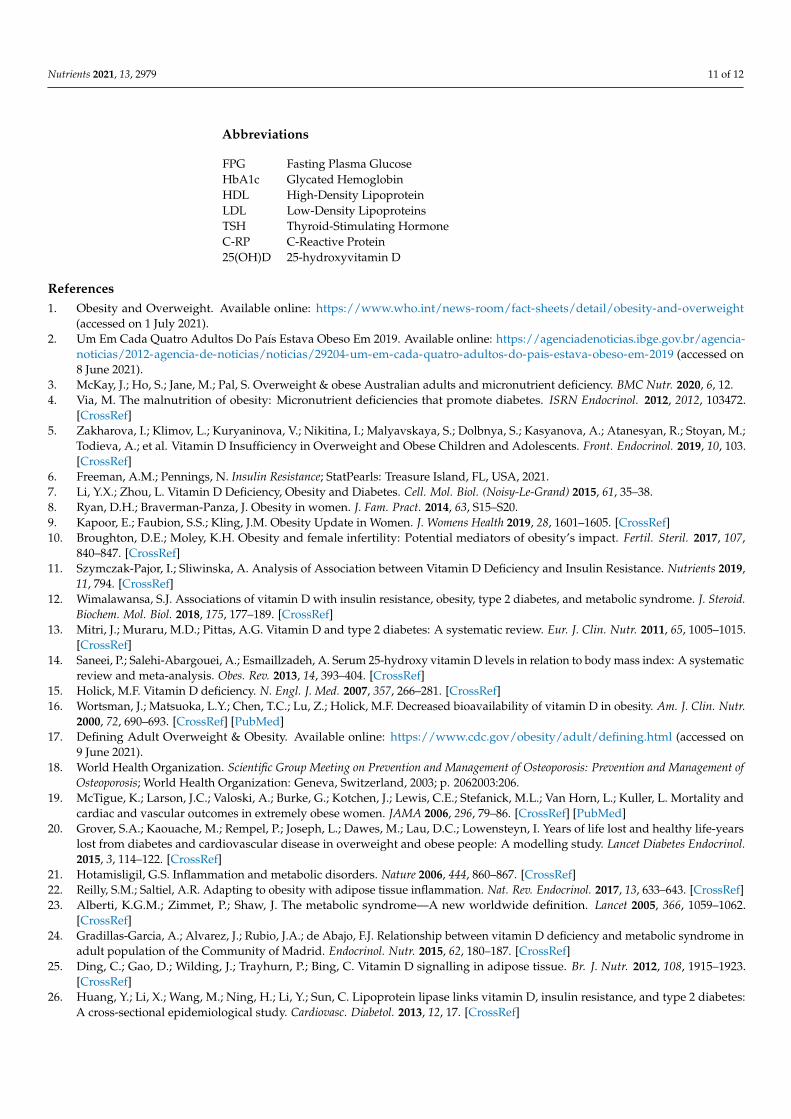
Furthermore, we described which laboratory exams had relationships with HOMA-IRand contributed to insulin resistance. As expected, FPG (r = 0.20; p = 0.047) and insulin(r = 0.85; p < 0.001) values were directly correlated with elevations in HOMA-IR values(Figure 3A). Interestingly, the levels of TSH (r = 0.81; p = 0.024) were associated with anincrease in peripheral insulin resistance (Figure 3A). We also evaluated the relationshipsbetween 25(OH)D sufficiency and insufficiency according to the HOMA-IR and BMI in thepatients (Figure 3B). We observed that gradual increases in HOMA-IR values were relatedto remarkable increases in values of BMI in obese women with 25(OH)D insufficiency(r = 0.49; p = 0.01); the same behavior was not observed in the population in general(r = −0.17; p = 0.08) as well as in the obese women without 25(OH)D insufficiency(r = 0.08; p = 0.48) (Figure 3B). These findings indicate that the VITD insufficiency wasdirectly associated with substantial changes in concentrations of laboratorial parametersthat relate to an insulin resistance.
Finally, a linear regression analysis was performed to test independent associationsbetween the parameters analyzed and the higher values of the HOMA-IR value (Figure 3C).We found that a decreased 25(OH)D (β coefficient = −0.108; 95%CI: −0.181 to −0.035;p = 0.004) was associated with an increase in the HOMA-IR value. Additionally, an increaseof one unit in triglyceride levels (β coefficient = 0.009; 95% CI: −0.002 to 0.017; p = 0.014)was associated with an increase of one unit in the HOMA-IR, consequently impacting theinsulin resistance (Figure 3C). Importantly, the significantly stronger correlation with TSHand HOMA-IR disappears when we apply the adjusted model. These results highlight theimportance of 25(OH)D insufficiency as a risk factor in obese women to develop and/oraggravate insulin resistance.
Nutrients 2021, 13, 2979 8 of 12Nutrients 2021, 13, x FOR PEER REVIEW 8 of 12
Figure 3. Factors associated with HOMA‐IR among women with obesity. (A) Spearman rho correlation between HOMA‐
IR and clinical and biochemical parameters; statistically significant differences are highlighted in green (positive) and
yellow (negative). (B) Spearman correlation between HOMA‐IR and BMI levels in women with obesity grouped according
to 25‐hydroxyvitamin D status; the values of r and p shown in the figure correspond to the general population (red box),
with insufficient VID D (yellow box) and without insufficient VITD (blue box). (C) A linear regression analysis was used
to test independent association between clinical and biochemical parameters and HOMA‐IR. Abbreviations: FPG = Fasting
plasma glucose; HbA1c = Glycated hemoglobin; HDL: High‐density Lipoprotein; LDL = Low‐density Lipoproteins; TSH
= Thyroid‐stimulating hormone; CRP = C‐reactive protein; 25(OH)D = 25‐hydroxyvitamin D.
Finally, a linear regression analysis was performed to test independent associations
between the parameters analyzed and the higher values of the HOMA‐IR value (Figure
3C). We found that a decreased 25(OH)D (β coefficient = −0.108; 95%CI: −0.181 to −0.035;
p = 0.004) was associated with an increase in the HOMA‐IR value. Additionally, an in‐
crease of one unit in triglyceride levels (β coefficient = 0.009; 95% CI: −0.002 to 0.017; p =
0.014) was associated with an increase of one unit in the HOMA‐IR, consequently impact‐
ing the insulin resistance (Figure 3C). Importantly, the significantly stronger correlation
with TSH and HOMA‐IR disappears when we apply the adjusted model. These results
Figure 3. Factors associated with HOMA-IR among women with obesity. (A) Spearman rho correlation between HOMA-IRand clinical and biochemical parameters; statistically significant differences are highlighted in green (positive) and yellow(negative). (B) Spearman correlation between HOMA-IR and BMI levels in women with obesity grouped according to25-hydroxyvitamin D status; the values of r and p shown in the figure correspond to the general population (red box), withinsufficient VID D (yellow box) and without insufficient VITD (blue box). (C) A linear regression analysis was used totest independent association between clinical and biochemical parameters and HOMA-IR. Abbreviations: FPG = Fastingplasma glucose; HbA1c = Glycated hemoglobin; HDL: High-density Lipoprotein; LDL = Low-density Lipoproteins;TSH = Thyroid-stimulating hormone; CRP = C-reactive protein; 25(OH)D = 25-hydroxyvitamin D.
4. Discussion
VITD is a metabolite of huge clinical importance due to its interactions with calciumand the bone system in general. In addition, many studies suggest that low levels ofVITD are associated with increased frequency of immune disorders and other diseases,such as obesity. Importantly, obesity is a risk factor for hypovitaminosis D and is closelyrelated to the development of other comorbidities: for example, fertility disorders andcardiovascular diseases, especially in women [8,9]. In the present study, we aimed to
Nutrients 2021, 13, 2979 9 of 12
investigate the association between lower levels of VITD and peripheral IR in a group ofobese Brazilian women.
In the first place, the study population was obese and had several comorbiditiessuch as diabetes and hypertension. Interestingly, these comorbidities were not significantbetween the class of obesity and 25(OH)D status, showing that our population was similarin these aspects regardless of the class of obesity presented. Lifestyle habits such assmoking, alcohol consumption and physical activity showed the same behavior, beingsimilar in populations with different obesity classes and 25(OH)D statuses. These findingsare in disagreement with the literature, which links a high class of obesity with poorlifestyle habits and a greater number of comorbidities [19,20]. We hypothesized that thismay have occurred due to the small number of patients in each arm of the study, whichmay have impacted the analysis employed. Of note, insufficient patients have differentfasting blood glucose levels than non-insufficient patients, but the same behavior was notnoted in HbA1c. We theorize that this behavior may occur because some patients had thediagnosis of diabetes in the baseline visit to the center, and others had the diagnosis beforeand were using glycemic control medications.
Obesity is a chronic disease that triggers a disturbance in the immune system, leadingto a sustained proinflammatory status [21,22]. This pro-inflammatory status has alreadybeen described by several authors and is closely related to increased cardiovascular riskand cardiovascular diseases, coagulation disorders, IR, atherosclerosis and DM [20]. Im-portantly, chronic inflammation is also linked with the development of metabolic syn-drome [21], which is a set of signs and symptoms (changes in HDL and triglycerides levels,elevated blood pressure and blood glucose and elevated abdominal circumference) thatmark a higher cardiovascular risk and metabolic alterations [23], being related to low levelsof VITD [24], and is considered an important factor in increasing the morbidity and mortal-ity of obese patients. We found that the profile of obese women who had insufficient levelsof VITD had an increase in proinflammatory markers, exhibiting a district profile comparedwith the patients who did not present insufficiency. In addition, several studies indicatethat obese patients have larger systemic inflammation [21]; therefore, adequate levels ofVITD are important due to their modulating and regulatory function of the immune system.Our findings are in agreement with the literature, since patients with higher degrees ofobesity and lower levels of VITD present a pro-inflammatory profile exacerbated with CRPlevels and, in addition to lipid profile and HOMA-IR, show a superior metabolic risk andpersistent immune activation. Of note, we also observed an increase in triglyceride levelswith insufficient levels of VITD. This fact could be justified due to the absence of the actionof VITD metabolites that increase the expression of lipoprotein lipase [25,26] in vitro [27],as well as the increased number of patients with peripheral insulin resistance in this group,which may cause a decrease in triglyceride levels.
Obesity is a risk factor for peripheral IR; moreover, patients with lower levels of VITDhad a higher value of HOMA-IR. Several studies report that VITD has receptors that arelocated in numerous cells of the body, such as adipocytes, influencing the expression ofadipogenic genes and apoptosis [25,28,29]. In accordance with our findings, a double-blindrandomized clinical trial showed that the administration of high doses of VITD in obesepatients with peripheral insulin resistance or pre-DM increased the sensitivity to insulinand reduced the chance of progression of the condition to DM [30].
Another point worth noting in our study was that the increase in BMI showed to beinversely correlated with the increase in peripheral insulin resistance in obese women withinsufficient levels of 25 (OH)D, but not in the general population or in patients 25(OH)Dnon-insufficiency. Interestingly, similar findings have been reported in large cross-sectionalstudies in which VITD levels are inversely correlated with BMI [31,32]. Additionally,observational studies have found a strong association between low levels of VITD and pre-DM [7], obesity or metabolic syndrome [24], suggesting a significant metabolic alterationassociated with low levels of VITD. Of note, we also found that the VITD and triglyceridelevels were independently associated with the increase in peripheral insulin resistance
Nutrients 2021, 13, 2979 10 of 12
that was previously described as an independent relationship, in which high triglyceridelevels were associated with increased peripheral insulin resistance and reduced function ofinsulin pancreatic beta cells.
This study has limitations. The sample size is small due to the difficulty in obtainingthe necessary laboratory parameters in suitable patients for the study, and the cross-sectional study design does not allow us to establish a causal effect between the studyfindings. In addition, we do not have a control group, which increases the chances ofpossible interferences in the findings. Furthermore, HOMA-IR is not the gold standard formeasuring insulin resistance. Therefore, further studies with larger sample groups andpatient follow-up are needed so that we can better understand the dynamics establishedbetween 25(OH)D levels and peripheral insulin resistance in obese patients. Despitethe limitations, our study provides consistent evidence that low levels of 25(OH)D areassociated with an increase in peripheral insulin resistance. We also observed that thelaboratory profile of patients differs according to the sufficiency or insufficiency of VITD;we hypothesize that this profile is justified by a greater immunological disturbance, andfurther investigations are necessary to better understand the relationship between VITD,obesity, peripheral insulin resistance and immunity.
Supplementary Materials: The following are available online at https://www.mdpi.com/article/10.3390/nu13092979/s1, Table S1. Clinical and biochemical characteristics of the population byobesity type. Figure S1. Spearman correlation analysis of the 25-hydroxyvitamin D [25(OH)D] andbiochemical parameters in women with obesity. Correlation plot between 25-hydroxyvitamin D andall the biochemical parameters evaluated in the study.
Author Contributions: Conceptualization, M.F.S., B.B.-D., M.B.A., M.A.-P., A.M.L., B.B.A. and M.L.L.;Data curation, M.F.S., B.B.-D., M.B.A., M.A.-P. and M.L.L.; Formal analysis, M.F.S., B.B.-D., M.B.A.,M.A.-P. and B.B.A.; Funding acquisition, M.L.L.; Investigation, M.F.S., B.B.-D., M.B.A., M.A.-P., B.B.A.and M.L.L.; Methodology, M.F.S., B.B.-D., M.B.A., M.A.-P., B.B.A. and M.L.L.; Project administration,A.M.L. and M.L.L.; Resources, M.A.-P. and M.L.L.; Software, B.B.-D., M.A.-P. and B.B.A.; Supervision,A.M.L., B.B.A. and M.L.L.; Validation, B.B.-D.; Visualization, B.B.-D., M.B.A., M.A.-P. and B.B.A.;Writing—original draft, B.B.-D., M.B.A., M.A.-P. and B.B.A.; Writing—review and editing, M.F.S.,B.B.-D., M.B.A., M.A.-P., A.M.L., B.B.A. and M.L.L. All authors have read and agreed to the publishedversion of the manuscript.
Funding: This study was supported by the National Institutes of Health (NIH U01 AI069923 andNIAID 1 P30AI110527-03), CCASAnet and RePORT-Brazil Tennessee Center for AIDS Research(TNCFAR). BB-D and MA-P received a research fellowship from the Coordenação de Aperfeiçoa-mento de Pessoal de Nível Superior (CAPES) (Finance code: 001). MBA received a fellowship fromthe Fundação de Amparo à Pesquisa da Bahia (FAPESB). The work of BBA is supported by theIntramural Research Program of the Oswaldo Cruz Foundation (FIOCRUZ) and the National Councilfor Scientific and Technological Development (CNPq), Brazil.
Institutional Review Board Statement: All clinical investigations were conducted according tothe principles of the Declaration of Helsinki. Written informed consent was obtained from eachparticipant at the study enrollment. This study was approved by the Ethics Committee of the BahianaSchool of Medicine and Public Health (protocol number: 410.493; C.A.E.E. no. 17663913.2.0000 5544).Access to the registry data was authorized by the boards of the participating institutions.
Informed Consent Statement: Informed consent was obtained from all subjects involved in the study.
Data Availability Statement: Data will be available upon request.
Acknowledgments: The authors thank the study participants.
Conflicts of Interest: The authors declare no conflict of interest.
Nutrients 2021, 13, 2979 11 of 12
Abbreviations
FPG Fasting Plasma GlucoseHbA1c Glycated HemoglobinHDL High-Density LipoproteinLDL Low-Density LipoproteinsTSH Thyroid-Stimulating HormoneC-RP C-Reactive Protein25(OH)D 25-hydroxyvitamin D
References1. Obesity and Overweight. Available online: https://www.who.int/news-room/fact-sheets/detail/obesity-and-overweight
(accessed on 1 July 2021).2. Um Em Cada Quatro Adultos Do País Estava Obeso Em 2019. Available online: https://agenciadenoticias.ibge.gov.br/agencia-
noticias/2012-agencia-de-noticias/noticias/29204-um-em-cada-quatro-adultos-do-pais-estava-obeso-em-2019 (accessed on8 June 2021).
3. McKay, J.; Ho, S.; Jane, M.; Pal, S. Overweight & obese Australian adults and micronutrient deficiency. BMC Nutr. 2020, 6, 12.4. Via, M. The malnutrition of obesity: Micronutrient deficiencies that promote diabetes. ISRN Endocrinol. 2012, 2012, 103472.
[CrossRef]5. Zakharova, I.; Klimov, L.; Kuryaninova, V.; Nikitina, I.; Malyavskaya, S.; Dolbnya, S.; Kasyanova, A.; Atanesyan, R.; Stoyan, M.;
Todieva, A.; et al. Vitamin D Insufficiency in Overweight and Obese Children and Adolescents. Front. Endocrinol. 2019, 10, 103.[CrossRef]
6. Freeman, A.M.; Pennings, N. Insulin Resistance; StatPearls: Treasure Island, FL, USA, 2021.7. Li, Y.X.; Zhou, L. Vitamin D Deficiency, Obesity and Diabetes. Cell. Mol. Biol. (Noisy-Le-Grand) 2015, 61, 35–38.8. Ryan, D.H.; Braverman-Panza, J. Obesity in women. J. Fam. Pract. 2014, 63, S15–S20.9. Kapoor, E.; Faubion, S.S.; Kling, J.M. Obesity Update in Women. J. Womens Health 2019, 28, 1601–1605. [CrossRef]10. Broughton, D.E.; Moley, K.H. Obesity and female infertility: Potential mediators of obesity’s impact. Fertil. Steril. 2017, 107,
840–847. [CrossRef]11. Szymczak-Pajor, I.; Sliwinska, A. Analysis of Association between Vitamin D Deficiency and Insulin Resistance. Nutrients 2019,
11, 794. [CrossRef]12. Wimalawansa, S.J. Associations of vitamin D with insulin resistance, obesity, type 2 diabetes, and metabolic syndrome. J. Steroid.
Biochem. Mol. Biol. 2018, 175, 177–189. [CrossRef]13. Mitri, J.; Muraru, M.D.; Pittas, A.G. Vitamin D and type 2 diabetes: A systematic review. Eur. J. Clin. Nutr. 2011, 65, 1005–1015.
[CrossRef]14. Saneei, P.; Salehi-Abargouei, A.; Esmaillzadeh, A. Serum 25-hydroxy vitamin D levels in relation to body mass index: A systematic
review and meta-analysis. Obes. Rev. 2013, 14, 393–404. [CrossRef]15. Holick, M.F. Vitamin D deficiency. N. Engl. J. Med. 2007, 357, 266–281. [CrossRef]16. Wortsman, J.; Matsuoka, L.Y.; Chen, T.C.; Lu, Z.; Holick, M.F. Decreased bioavailability of vitamin D in obesity. Am. J. Clin. Nutr.
2000, 72, 690–693. [CrossRef] [PubMed]17. Defining Adult Overweight & Obesity. Available online: https://www.cdc.gov/obesity/adult/defining.html (accessed on
9 June 2021).18. World Health Organization. Scientific Group Meeting on Prevention and Management of Osteoporosis: Prevention and Management of
Osteoporosis; World Health Organization: Geneva, Switzerland, 2003; p. 2062003:206.19. McTigue, K.; Larson, J.C.; Valoski, A.; Burke, G.; Kotchen, J.; Lewis, C.E.; Stefanick, M.L.; Van Horn, L.; Kuller, L. Mortality and
cardiac and vascular outcomes in extremely obese women. JAMA 2006, 296, 79–86. [CrossRef] [PubMed]20. Grover, S.A.; Kaouache, M.; Rempel, P.; Joseph, L.; Dawes, M.; Lau, D.C.; Lowensteyn, I. Years of life lost and healthy life-years
lost from diabetes and cardiovascular disease in overweight and obese people: A modelling study. Lancet Diabetes Endocrinol.2015, 3, 114–122. [CrossRef]
21. Hotamisligil, G.S. Inflammation and metabolic disorders. Nature 2006, 444, 860–867. [CrossRef]22. Reilly, S.M.; Saltiel, A.R. Adapting to obesity with adipose tissue inflammation. Nat. Rev. Endocrinol. 2017, 13, 633–643. [CrossRef]23. Alberti, K.G.M.; Zimmet, P.; Shaw, J. The metabolic syndrome—A new worldwide definition. Lancet 2005, 366, 1059–1062.
[CrossRef]24. Gradillas-Garcia, A.; Alvarez, J.; Rubio, J.A.; de Abajo, F.J. Relationship between vitamin D deficiency and metabolic syndrome in
adult population of the Community of Madrid. Endocrinol. Nutr. 2015, 62, 180–187. [CrossRef]25. Ding, C.; Gao, D.; Wilding, J.; Trayhurn, P.; Bing, C. Vitamin D signalling in adipose tissue. Br. J. Nutr. 2012, 108, 1915–1923.
[CrossRef]26. Huang, Y.; Li, X.; Wang, M.; Ning, H.; Li, Y.; Sun, C. Lipoprotein lipase links vitamin D, insulin resistance, and type 2 diabetes:
A cross-sectional epidemiological study. Cardiovasc. Diabetol. 2013, 12, 17. [CrossRef]

Nutrients 2021, 13, 2979 12 of 12
27. Querfeld, U.; Hoffmann, M.M.; Klaus, G.; Eifinger, F.; Ackerschott, M.; Michalk, D.; Kern, P.A. Antagonistic effects of vitamin Dand parathyroid hormone on lipoprotein lipase in cultured adipocytes. J. Am. Soc. Nephrol. 1999, 10, 2158–2164. [CrossRef]
28. Abbas, M.A. Physiological functions of Vitamin D in adipose tissue. J. Steroid Biochem. Mol. Biol. 2017, 165, 369–381. [CrossRef]29. Nimitphong, H.; Park, E.; Lee, M.-J. Vitamin D regulation of adipogenesis and adipose tissue functions. Nutr. Res. Pract. 2020,
14, 553. [CrossRef]30. Niroomand, M.; Fotouhi, A.; Irannejad, N.; Hosseinpanah, F. Does high-dose vitamin D supplementation impact insulin resistance
and risk of development of diabetes in patients with pre-diabetes? A double-blind randomized clinical trial. Diabetes Res. Clin.Pract. 2019, 148, 1–9. [CrossRef]
31. Lagunova, Z.; Porojnicu, A.C.; Lindberg, F.; Hexeberg, S.; Moan, J. The Dependency of Vitamin D Status on Body Mass Index,Gender, Age and Season. Anticancer. Res. 2009, 29, 3713–3720. [CrossRef]
32. Vanlint, S. Vitamin D and Obesity. Nutrients 2013, 5, 949–956. [CrossRef]