Embed Size (px)
Citation preview

ACTAUNIVERSITATISUPSALIENSISUPPSALA2006
Digital Comprehensive Summaries of Uppsala Dissertationsfrom the Faculty of Medicine 156
Lower Urinary Tract Symptomsin Swedish Male Population
Prevalence, Distress and Quality of Life
GABRIELLA ENGSTRÖM
ISSN 1651-6206ISBN 91-554-6590-0urn:nbn:se:uu:diva-6931


List of Papers
This thesis is based on the following papers, referred by their Roman numerals:
I Engström G, Walker-Engström M-L, Lööf L, Leppert J. Prevalence of Three Lower Urinary Tract Symptoms in Men – a Population-Based Study. Family Practice 2003; 20: 7-10
II Engström G, Henningsohn L, Walker-Engström M-L, Lööf L, Leppert J. Prevalence of Distress and Symptom Severity from Lower Urinary Tract in Men - a Population-Based Study with the DAN-PSS Questionnaire. Family Practice 2004; 21: 617-22
III Engström G, Henningsohn L, Walker-Engström M-L, Leppert J. The Impact on Quality of Life Measured by the SF-36 in Men with Different Symptoms from the Lower Urinary Tract.
Accepted for publication in Scand J Urol Nephro
IV Engström G, Henningsohn L, Steineck G, Leppert J. Self-Assessed Health, Sadness and Happiness in Relation to Total Burden of Symptoms from the Lower Urinary Tract. BJU International 2005; 95: 810-15
Papers , II and IV are reprinted with the permission of the publishers.


Contents
Introduction.....................................................................................................9Normal bladder and Lower Urinary Tract Function...................................9Lower Urinary Tract Symptoms...............................................................11
Assessment of Lower Urinary Tract Symptoms..................................11Lower Urinary Tract Function of Ageing............................................12Prevalence of Lower Urinary Tract Symptoms ...................................13
Seeking Help for Lower Urinary Tract Symptoms ..................................20Quality of Life..........................................................................................20
SF-36 questionnaire and Lower Urinary Tract Symptoms ..................21
Aims..............................................................................................................22
Methods ........................................................................................................23Study Population ......................................................................................23Study Design and Data Collection ...........................................................23
Paper ..................................................................................................25Paper II, III and IV...............................................................................26DAN-PSS questionnaire ......................................................................26SF-36 questionnaire .............................................................................27
Statistical Analysis ...................................................................................28
Results...........................................................................................................30Paper ......................................................................................................30Paper II .....................................................................................................33
Symptoms ............................................................................................33Distress ................................................................................................36
Paper III....................................................................................................40Storage symptoms and SF-36 measurements ......................................41Voiding symptoms and post micturition symptoms and SF-36 measurements ......................................................................................45
Paper IV ...................................................................................................48
Methodological Considerations ....................................................................58Confounding factors .................................................................................58Misrepresentations ...................................................................................59Misclassifications .....................................................................................60
Discussion.....................................................................................................62Lower Urinary Tract Symptoms...............................................................62Seeking Help for Lower Urinary Tract Symptoms ..................................63Quality of Life..........................................................................................65
Conclusions - Remarks .................................................................................69
Implications .................................................................................................70
Swedish summary .........................................................................................71
Acknowledgments.........................................................................................74
References.....................................................................................................76
Appendix.......................................................................................................87International Continence Society definition of LUTSFrågeformulär 1DAN-PSS frågeformulärHälsoenkät (SF-36)

Abbreviations
AHCPRAUA
Agency for Health Care Policy and Researc American Urological Association
BPH Benign Prostatic Hyperplasia DAN-PSS Danish Prostatic Symptom Score ICS International Continence Society IQOLA International Quality of Life Assessment LUTS Lower Urinary Tract Symptoms NHP Nottingham Health Profile SBU Statens Beredning för medicinsk Utvärdering
The Swedish Council on Technology Assessment in Health Care
SD Standard Deviation SF-36 Short Form-36 SIP Sickness Impact Profile WHO World Health Organization


9
Introduction
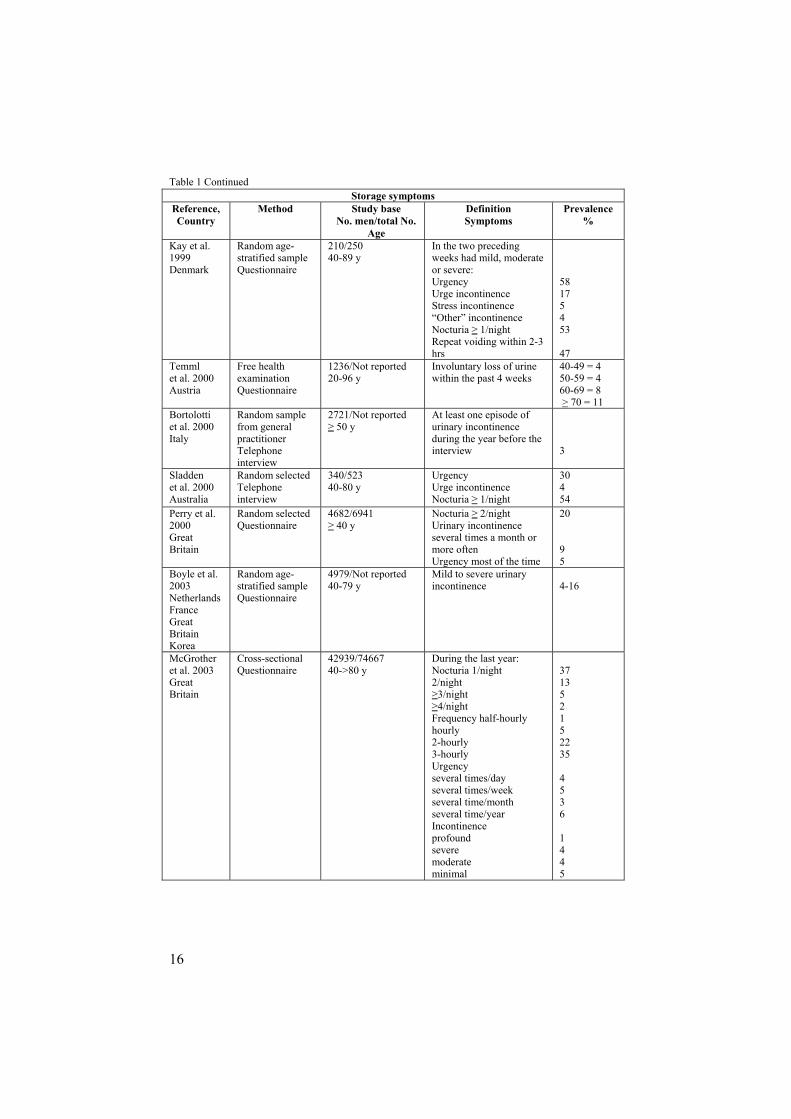
Lower Urinary Tract Symptoms (LUTS) is a prevalent condition and occurs in men (Table 1-3) and women of all ages (Hellström et al. 1990, Rekers et al. 1992, Samuelsson et al. 1997, Hägglund et al. 1999, Nuotio et al. 2003, Andersson et al. 2004a, Stenzelius et al. 2004, Nørby et al. 2005). Lower urinary tract symptoms increase with age (Hunter et al. 1996, Malmsten et al. 1997, Temml et al. 2000, Haidinger et al. 2000, Bortolotti et al. 2000, Perry et al. 2000, Molander et al. 2002, TuncayAki et al. 2003, Andersson et al. 2004b, Nørby et al. 2005, Logie et al. 2005, Seim et al. 2005, Yukio et al. 2005, Li et al. 2005, Tikkinen et al. 2006) and have become a public health problem with the progressive ageing of the population. The interest in studying the lower urinary tract symptoms has increased substantially in recent years. However, lower urinary tract symptoms in men has not been investigated to the same extent as it has in women. Until recently, urinary leakage was seen as a “women’s problem”. When planning care and treatment strategy for individual male patients it is essential to have knowledge about men’s symptoms, the distress they cause and their impact on perceived quality of life. However, there is little information about the distress caused by the symptoms in the male population. The studies in the present thesis were conducted to increase general knowledge about the prevalence of symptoms from the lower urinary tract in a population-based sample of men, and determine to what extent these symptoms distress the men and affect their quality of life.
Normal bladder and Lower Urinary Tract Function The bladder and lower urinary tract have two functions: storage of the urine and periodic elimination of urine (Getliffe, Dolman 2003).
Urine is produced continuously by the kidneys. Each day, approximately 180 liters primary urine is reduced by concentration processes in the kidneys to 1-2 liters of urine. The total urine volume depends on many factors(Brooker 1998, Hayes Engelberg 2000). The urine is transported in the 2 ureters by peristaltic waves to the urinary bladder. The 2 ureters run obliquely through the bladder wall in order to prevent urine reflux through a valve-like mechanism of the intrinsic part of the ureter (lying within the bladder wall). The ureters enter the bladder inferiodorsal landmarking in the

10
upper corners of the trigonum (together with the internal urethral orifice) at the bladder base, the most sensitive part of the bladder (Chiras 2002, Brooker 1998, Getliffe, Dolman 2003).
The bladder acts as a reservoir for urine and lies in the anterior part of the pelvic, behind the symphysis pubis, under the peritoneum and the abdominal cavity resting on the pelvic floor. During filling, the bladder rises into the abdominal cavity. The wall of the highly distensible bladder consists of several muscle layers. The detrusor muscle is mainly controlled by the parasympathetic nervous system. As the bladder fills, the detrusor muscle is relaxed and pressure remains nearly constant. Contraction of the detrusor muscle causes the bladder to reduce in length and diameter so that it is emptied effectively. The bladder neck is mainly controlled by the sympathetic nervous system. In men, there is a circular layer of smooth muscle (internal sphincter) around the bladder neck which extends down into the prostatic capsule. The internal sphincter prevents retrograde ejaculation into the bladder (Chiras 2002, Brooker 1998, Getliffe, Dolman 2003, Edlund et al. 2006).
The male urethra has an “S” shaped form and is approximately 18-22 cm long and consists of four parts. The prostatic urethra is attached to the bladder base and passes through the prostate gland. The membranous urethra is surrounded by the external sphincter (controlled by somatomotoric sacral nerves) and passes through the pelvic floor. The bulbar urethra is surrounded by the bulbospongiosus muscle which assists in emptying of the urethra at the end of voiding. The penile (spongy) urethra which passes through the penis to open at the external urethral orifice (Getliffe, Dolman 2003).
An awareness of mild desire to void is experienced when urine reach a level at 150-250 ml in the bladder. When urine is present at 400-500 ml, involuntary contractions of the detrusor muscle and bladder neck relaxation force the internal sphincter in the urethra to open, which allows urine into the urethra. The external sphincter in the urethra is controlled until a suitable opportunity for voiding occurs (Gertliffe, Dolman 2003, Brooker 1998, Chiras 2002). The voiding is affected by contraction of the abdominal muscles and by increased intra-abdominal pressure (Brooker 1998). After completed emptying the bladder the external sphincter closes. Any urine above the level of the external sphincter is forced back to the bladder (Gertliffe, Dolman 2003).

11
Lower Urinary Tract Symptoms Lower urinary tract symptoms has become the preferred term for urinary symptoms, replacing “symptoms of benign prostatic hyperplasia” and “prostatism” which were previously used to describe lower urinary tract symptoms (Abrams 1994). According to the International Continence Society (ICS), lower urinary tract symptoms denote three things: a symptom, perceived by the patient; a sign, observed by the physician; and a condition, defined by urodynamic observations (Abrams et al. 2003).
In the present definition, ICS divides lower urinary tract symptoms into three groups: storage symptoms experienced when urine is stored in the bladder, voiding symptoms experienced during the voiding phase and postmicturition symptoms experienced immediately after micturition (Abrams et al. 2003) (see Appendix).
Assessment of Lower Urinary Tract Symptoms For assessment of lower urinary tract symptoms several instruments have been developed. Describing the frequency of the symptoms is a first basic step toward understanding their impact (Barry 2001).
The Boyarsky Score (Boyarsky et al. 1977) is the first published questionnaire to assess lower urinary tract symptoms. The questionnaire is designed to be completed by the physician and has never been validated. The symptom scoring system evaluates the severity of nocturia, frequency, hesitancy, intermittency, terminal dribbling, urgency, reduction of the size and force of the stream, dysuria and incomplete voiding.
The Madsen-Iversen Score (Madsen, Iversen 1983) is another unvalidated questionnaire, also designed for completion by the physician. The questionnaire assesses urinary stream, straining to void, hesitancy, intermittency, bladder emptying, stress incontinence or post void dribbling, urgency, frequency and nocturia.
The importance of the patient’s perception of the symptoms has been recognized and new instruments for assessing severity, frequency and quality of life of lower urinary tract symptoms have been designed. Health measurements or scales can be used to directly inquire about the impact of the symptoms or the distress they cause (Barry 2001).
The International Prostate Symptom Score (IPSS) questionnaire (Cockett et al. 1991) is a validated instrument that measures the occurrence of seven symptoms from the lower urinary tract (incomplete emptying, frequency, urgency, nocturia, straining, weak stream, hesitancy). The IPSS questionnaire includes one separate question concerning the quality of life, graded on a scale from 0 to 6.

12
The American Urological Association (AUA) symptom index is a validated questionnaire and includes seven questions covering frequency, nocturia, weak urinary stream, hesitancy, intermittence, incomplete emptying and urgency and two questions on quality of life (Barry et al. 1992).
The ICSmaleSF questionnaire includes 11 questions on lower urinary tract symptoms (hesitancy, straining, decreased stream, intermittency, incomplete emptying, urgency, urge incontinence, stress incontinence, unpredictable incontinence, nocturia, post-void dribbling) and one question on quality of life (Donovan et al. 2000).
The Danish Prostatic Symptom Score (DAN-PSS) (Hald et al. 1991) measures the occurrence of 12 symptoms. Moreover, it evaluates the symptoms both quantitatively and qualitatively, using both a symptom score and a distress score. This instrument has a sensitivity of 92% and a specificity of 94% (Hansen et al. 1995, Hansen et al. 1997). The DAN-PSS questionnaire also measures the occurrence of dysuria, post micturition dribbling and urinary incontinence, as well as measuring activities of daily living, none of which are covered by the IPSS questionnaire (Teillac 1998).
The DAN-PSS questionnaire is well understood by men 40 years or older (Brasso et al. 1994) and is reliable and valid for the same purposes as the IPSS questionnaire (Hansen et al. 1998). At the ICS conference in Tampere 2000, Koskimäki and co-workers presented data showing that the Spearman correlation coefficient between the prevalence as measured with DAN-PSS and IPSS was 0.75 and that the correlation coefficient between total DAN-PSS score and total IPSS score was 0.70 (Koskimäki et al. 2000).
Lower Urinary Tract Function of Ageing Age-related changes in the central nervous system and adjacent organs to the bladder increase the risk for lower urinary tract symptoms (Gray 2000, Reilly 2000, Dubeau 2006). Alterations in nervous system e.g. Parkinson’s disease, often associated with aging, places the elderly individuals at risk for develop lower urinary tract symptom (Araki, Kuno et al. 2000, Lemack et al. 2003, Winge et al. 2005, Edlund et al. 2006). Lower urinary tract symptoms is common in elderly individuals with dementia often because memory loss (forget the way to the toilet, forgetting they were on the way to the toilet) (Gray 2000).
Enlargement of the prostate through age-associated changes can, due to the prostate position affect the transport of urine through the urethra leading to obstruction of the outflow of urine. The severity of the obstruction symptoms does not correlate with the degree to which the prostate gland is enlarged. For some men, the obstruction remains mild, and the detrusor muscle is able to compensate by increasing the power of contraction. For other men, a more significant obstruction causes decompensation of the
13
detrusor muscle leading to emptying symptoms e.g. weak stream, dribbling, increase frequency, hesitancy and/or urgency (Heath, Watson 2003).
Drug treatment also affects the functional status of the elderly individual. The drug treatment may lead to lower urinary tract symptoms in some individuals with an otherwise health lower urinary tract (Reilly 2000).
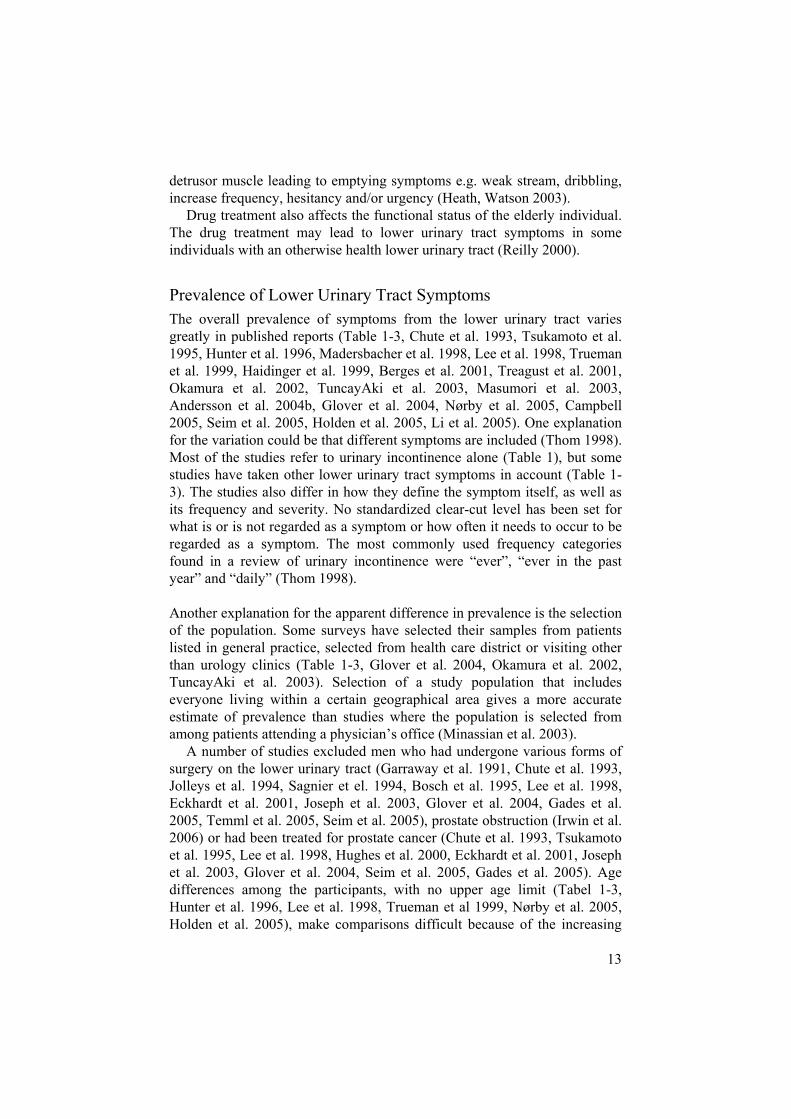
Prevalence of Lower Urinary Tract Symptoms The overall prevalence of symptoms from the lower urinary tract varies greatly in published reports (Table 1-3, Chute et al. 1993, Tsukamoto et al. 1995, Hunter et al. 1996, Madersbacher et al. 1998, Lee et al. 1998, Trueman et al. 1999, Haidinger et al. 1999, Berges et al. 2001, Treagust et al. 2001, Okamura et al. 2002, TuncayAki et al. 2003, Masumori et al. 2003, Andersson et al. 2004b, Glover et al. 2004, Nørby et al. 2005, Campbell 2005, Seim et al. 2005, Holden et al. 2005, Li et al. 2005). One explanation for the variation could be that different symptoms are included (Thom 1998). Most of the studies refer to urinary incontinence alone (Table 1), but some studies have taken other lower urinary tract symptoms in account (Table 1-3). The studies also differ in how they define the symptom itself, as well as its frequency and severity. No standardized clear-cut level has been set for what is or is not regarded as a symptom or how often it needs to occur to be regarded as a symptom. The most commonly used frequency categories found in a review of urinary incontinence were “ever”, “ever in the past year” and “daily” (Thom 1998).
Another explanation for the apparent difference in prevalence is the selection of the population. Some surveys have selected their samples from patients listed in general practice, selected from health care district or visiting other than urology clinics (Table 1-3, Glover et al. 2004, Okamura et al. 2002, TuncayAki et al. 2003). Selection of a study population that includes everyone living within a certain geographical area gives a more accurate estimate of prevalence than studies where the population is selected from among patients attending a physician’s office (Minassian et al. 2003).
A number of studies excluded men who had undergone various forms of surgery on the lower urinary tract (Garraway et al. 1991, Chute et al. 1993, Jolleys et al. 1994, Sagnier et el. 1994, Bosch et al. 1995, Lee et al. 1998, Eckhardt et al. 2001, Joseph et al. 2003, Glover et al. 2004, Gades et al. 2005, Temml et al. 2005, Seim et al. 2005), prostate obstruction (Irwin et al. 2006) or had been treated for prostate cancer (Chute et al. 1993, Tsukamoto et al. 1995, Lee et al. 1998, Hughes et al. 2000, Eckhardt et al. 2001, Joseph et al. 2003, Glover et al. 2004, Seim et al. 2005, Gades et al. 2005). Age differences among the participants, with no upper age limit (Tabel 1-3, Hunter et al. 1996, Lee et al. 1998, Trueman et al 1999, Nørby et al. 2005, Holden et al. 2005), make comparisons difficult because of the increasing

14
symptom prevalence with age (Hunter et al. 1996, Malmsten et al. 1997, Temml et al. 2000, Bortolotti et al. 2000, TuncayAki et al. 2003, Andersson et al. 2004b, Nørby et al. 2005, Molander et al. 2002).
Reported symptom prevalence also differs between countries (Witjes et al. 1997, Tsukamoto et al. 1995, Scarpa 2001, Li et al. 2005).
In studies based on men, with the IPSS questionnaire or AUA symptom index, the prevalence rates for moderate or severe symptoms (score >7), vary between 11 and 72% (Chute et al. 1993, Tsukamoto et al. 1995, Hunter et al. 1996, Madersbacher et al. 1998, Lee et al. 1998, Trueman et al. 1999, Haidinger et al. 1999, Berges et al. 2001, Treagust et al. 2001, Okamura et al. 2002, TuncayAki et al. 2003, Masumori et al. 2003, Andersson et al. 2004b, Glover et al. 2004, Nørby et al. 2005, Campbell 2005, Seim et al. 2005, Holden et al. 2005, Li et al. 2005).

15
Table 1. Prevalence of storage symptoms in men; reports published 1993 to 2006 Storage symptoms
Reference, Country
Method Study base No. men/total No.
Age
Definition Symptoms
Prevalence%
Brocklehurst 1993Great Britain
Random sample Interview at home
1883/4007 > 30 y
Urinary incontinence -ever
-in preceding year
-in the preceding 2 months
- in preceding week
30-49 = 2 50-59 = 5 > 60 = 13 30-49 = 1 50-59 = 2 > 60 = 7 30-49 = 1 50-59 = 2 > 60 = 5 30-49 = 1 50-59 = 2 > 60 = 2
Lagace et al. 1993USA
Visited a primary care office Questionnaire
922 men/3638 men and women > 20 y
Any urine loss in the last 12 months 11
Norman et al. 1994 Canada
Random sample Telephone interview
508/19359 telephone calls 50-70+ y
Nocturia, once a night In the last week have you…. rarely, sometimes or often experienced Urgency
62
18Hunter et al. 1994Great Britain
Registered within a general practice Questionnaire
1480/2000 > 55 y
In the past month, how often have you …… Frequency: hardly ever < half half> half alwaysUrgency hardly ever < half half> half always
34181054
239535
Borgen et al. 1997Sweden
Selected from health care districtQuestionnaire
219/233 65 y
Urinary incontinence 9
Malmsten et al. 1997 Sweden
Random sample Questionnaire
7763/10458 > 45 y
Urinary incontinence Nocturia
956
Koskimäki et al. 1998 Finland
All men born 1924, 1934, 1944 in a city Questionnaire
2128/3143 50, 60, 70 y
Reported mild, moderate or severe Urgency Urge incontinence Stress incontinence “Other” incontinence Nocturia > 1/nightRepeat voiding within 2-3 hrs
341791056
47Stenzeliuset al. 2004 Sweden
Random age-stratified sample Questionnaire
1642 men /8500 men and women >75 y
Have you had problems controlling urine during the last 3 months? Yes, a little Yes, rater or very much
75-79 = 26 75-79 = 5
16
Table 1 Continued Storage symptoms
Reference, Country
Method Study base No. men/total No.
Age
Definition Symptoms
Prevalence%
Kay et al. 1999Denmark
Random age-stratified sample Questionnaire
210/250 40-89 y
In the two preceding weeks had mild, moderate or severe: Urgency Urge incontinence Stress incontinence “Other” incontinence Nocturia 1/nightRepeat voiding within 2-3 hrs
58175453
47Temml et al. 2000 Austria
Free health examination Questionnaire
1236/Not reported 20-96 y
Involuntary loss of urine within the past 4 weeks
40-49 = 4 50-59 = 4 60-69 = 8 > 70 = 11
Bortolottiet al. 2000 Italy
Random sample from general practitionerTelephone interview
2721/Not reported 50 y
At least one episode of urinary incontinence during the year before the interview 3
Sladdenet al. 2000 Australia
Random selected Telephone interview
340/523 40-80 y
Urgency Urge incontinenceNocturia 1/night
30454
Perry et al. 2000GreatBritain
Random selected Questionnaire
4682/6941 40 y
Nocturia 2/night Urinary incontinence several times a month or more often Urgency most of the time
20
95
Boyle et al. 2003NetherlandsFranceGreatBritainKorea
Random age-stratified sample Questionnaire
4979/Not reported 40-79 y
Mild to severe urinary incontinence 4-16
McGrother et al. 2003 GreatBritain
Cross-sectionalQuestionnaire
42939/74667 40->80 y
During the last year: Nocturia 1/night 2/night
3/night4/night
Frequency half-hourly hourly 2-hourly 3-hourly Urgency several times/day several times/week several time/month several time/year Incontinenceprofound severemoderate minimal
371352152235
4536
1445

17
Table 1 Continued Storage symptoms
Reference, Country
Method Study base No. men/total No.
Age
Definition Symptoms
Prevalence%
Nuotio et al. 2003Finland
Population-based cross-sectional study
171/Not reported > 70 y
Stress incontinence: answered Yes to: “Having urinary leakage during exertion, for example coughing or lifting” Urge incontinence: answered Yes to: “Having urinary leakage associated with a strong urge to urinate”
2
17Teunissen et al. 2004 Netherlands
Registered within a general practice Questionnaire
2137men/5278 men and women > 60 y
Involuntary loss of urine twice or more a month 9
Moorthy et al. 2004 Asia
Random sample of men visiting other than urology clinics Questionnaire
2369/Not reported 18-70+ y
Frequency 8 times/day Urgency: a strong desire to voidUrge incontinence: involuntary loss of urine
37
34
13Andersson et al. 2004a Sweden
Population-based study Random selected Questionnaire
Not reported/7680 18-79 y
Stress incontinence: answered Yes to: “Do you have involuntary urine loss in relation to physical strain”Urge incontinence: answered Yes to: “Do you have involuntary urine loss in relation to a sense of urgency or a sudden need to urinate”
35-49 = 13 50-64 = 11 65-79 = 13
35-49 = 37 50-64 = 43 65-79 = 59
Nørby et al. 2005Denmark
Population-based study Random selected Questionnaire
5350/8700 > 50 y
Nocturia: 2/night
Frequency:
Urgency
50-59 = 30 60-69 = 37 70-79 = 51 50-59 = 16 60-69 = 20 70-79 = 27 50-59 = 6 60-69 = 17 70-79 = 21
Liew et al 2006Singapore
Population-based study Stratifiedrandom sample Interview
1139 men/3000 men and women 20-92 y
Nocturia: > 1/night Total 53 > 70 years 75
Gourova et al. 2006 Netherlands
Registered within a general practice Questionnaire
2934/3048 55-75 y
Nocturia: 1/night 2/night3/night4/night> 5/night
4621723

18
Table 2. Prevalence of voiding symptoms in men; reports published 1993 to 2005 Voiding symptoms
Reference, Country
Method Study base No. men/total No.
Age
Definition Symptoms
Prevalence%
Norman et al. 1994 Canada
Population based sample Telephone interview
508/19359 > 50 y
In the last week have you…. rarely, sometimes or often experienced: Weak stream Hesitancy
6113
Wolfs et al. 1994Netherlands
Registered within a general practice Questionnaire
1692/2734 > 55 y
In the last week have you…. less than half the time, half the time, more than half the time, or always experiencedHesitancyStraining
276
Jolleys et al. 1994Great Britain
Registered within a general practice Questionnaire
423/649 > 40 y
Hesitancy Weak stream Straining
513523
Hunter et al. 1994Great Britain
Registered within a general practice Questionnaire
1480/2000 > 55 y
In the past month, how often have you …… Hesitancy:hardly ever < half half> half alwaysPoor flow hardly ever < half half>half always
155311
2110644
Malmsten et al. 1997 Sweden
Random sample Questionnaire
7763/10458 > 45 y
HesitancyWeak stream
931
Roberts et al. 1998USA
Random sample in thecommunity Questionnaire
775 men /2337 men and women > 50 y
In the last year: slow leakage/ dribbling of urine throughout the day 24
Koskimäki et al. 1998 Finland
All men born 1924, 1934, 1944 in a city Questionnaire
2128/3143 50, 60, 70 y
Reported mild, moderate or severe: Hesitancy 46
Kay1999Denmark
Random age-stratified sample Questionnaire
210/250 40-89 y
In the two previous weeks had mild, moderate or severe:HesitancyWeak stream Straining
172919
Perry et al. 2000Great Britain
Random selected Questionnaire
4682/6941 > 40 y
Straining 1
Nørby et al. 2005Denmark
Population-based study Random selected Questionnaire
5350/8700 > 50 y
Weak stream 50-59 = 14 60-69 = 25 70-79 = 31

19
Table 3. Prevalence of post micturition symptoms in men; reports published from 1993 to 2005 Post micturition symptoms
Reference, Country
Method Study base No. men/total No.
Age
Definition Symptoms
Prevalence%
Wolfs et al. 1994Netherlands
Registered within a general practice Questionnaire
1692/2734 > 55 y
In the last week have you…. less than half the time, half the time, more than half the time, or always experienced:Dribbling 49
Norman et al. 1994 Canada
Random sample Telephone interview
508/19359 50-70+ y
In the past week have you rarely, sometimes or often experiencedIncomplete emptying 23
Koskimäki et al. 1998 Finland
All men born 1924, 1934, 1944 in a city Questionnaire
2128/3143 50, 60, 70 y
Reported mild, moderate or severe Post micturition dribbling Incomplete emptying
6330
Malmsten et al. 1997 Sweden
Random sample Questionnaire
7763/10458 > 45 y
Incomplete emptying Dribbling
2634
Kay et al. 1999Denmark
Random age-stratified sample Questionnaire
210/250 40-89 y
In the two previous weeks had mild, moderate or severePost micturition dribbling Incomplete empting
4021
Sladdenet al. 2000 Australia
Random selected Telephone interview
340/523 40-80 y
Sometimes or frequently experiencedTerminal dribbling 47
Hughes et al. 2000Australia
Random selected Telephone interview
305/425 40-80 y
Post micturition dribbling rarely sometimes frequently
18287
Nørby et al. 2005Denmark
Population-based study Random selected Questionnaire
5350/8700 > 50 y
Incomplete emptying 50-59 = 9 60-69 = 15 70-79 = 20

20
Seeking Help for Lower Urinary Tract Symptoms The percentage of men reported to have sought medical help for lower urinary tract symptoms ranges from 5 to 10% (Malmsten et al. 1997, Pinnock, Marshall 1997, Nørby et al. 2005). Among men with self-reported symptoms from the lower urinary tract, 4 to 46% had sought medical care (Lagace et al. 1993, Roberts et al. 1998, Malmsten et al. 1997, Teunissen et al. 2005, Homma et al. 2005). The percentage of men seeking help increases with increasing age (MacFarlane et al. 1995, Wolfs et al. 1994, Homma et al. 2005), with the severity (Andersson et al. 2005) and the frequency (MacFarlane et al. 1995, Andersson et al. 2005) of the symptoms and with the man’s degree of dissatisfaction with the symptoms (MacFarlane et al.1995, Pinnock, Marshall 1997, Scarpa 2001, Wolters et al. 2002, Boyle et al.2003). Other reasons why men seek help are that they have read about prostate problems, discussed symptoms of the lower urinary tract with a physician or have been encouraged by their partner to seek help for their symptoms (Scarpa 2001). Social influences such as advice from other people or from the media are also important factors in the decision to seek medical care (Wolters et al. 2002).
Quality of Life The International Consultations on Benign Prostatic Hyperplasia (BPH) and International Continence Society (ICS) have recommended that quality of life should be considered as an important factor in future research (Cockett et al. 1993a, Cockett et al. 1993b, Abrams et al. 2003). Moreover, the Agency for Health Care Policy and Research (AHCPR) guidelines for BPH declare that an examination of quality of life should be incorporated into clinical trials (Agency for Health Care Policy and Research 1994)
Data on quality of life can be collected by questionnaires or interviews. Questionnaires are usually used because they are relatively easy to administer to large populations, whereas interviews are time-consuming and expensive. The majority of the quality of life instruments are based on the WHO’s definition of health as a “state of complete physical, mental and social well-being and not merely the absence of disease and infirmity” (World Health Organization 1948). It is important to select an instrument appropriate to a specific group of individuals (Symonds 2003).
There are two basic types of quality of life questionnaires, generic and disease-specific quality of life instruments.
Generic instruments have been designed to cover the spectrum of function, disability and distress and are not specifically designed for a particular disease. Some of the most widely used generic instruments are the

21
Sickness Impact Profile (SIP) (Bergner et al. 1981), the Nottingham Health Profile (NHP) (Hunt et al. 1981, Hunt et al. 1985), and the Short-Form 36 health survey questionnaire (SF-36) (Ware, Sherbourne 1992, Ware et al. 1993). The SF-36 questionnaire was designed for use in clinical practice, health policy evaluations, medical research and general population surveys (Ware, Sherbourne 1992). It has been translated and developed for use in more than 60 countries (IQOLA) and permits comparisons with normative populations (Sullivan, Karlsson 1998) and different groups of people with specific diseases or disabilities. The questionnaire has been validated for use in primary health care (Brazier et al. 1992) and it takes about five minutes to complete the 36 questions covering eight dimensions. Despite these advantages, Nordling and co-workers found that little scientific work with generic quality of life instruments had been done in men with lower urinary tract symptoms (Nordling et al. 1998).
Disease-specific instruments have been designed to focus on physical problems, functional limitations and emotional consequences of a specific disease. These instruments are useful in clinical studies, especially for evaluating a specific therapeutic intervention and comparing different treatments.
During the past decade, the traditional way of measuring lower urinary tract symptoms (frequency, severity) has been supplemented with various instruments including an index or single questions to assess the quality of life (Cockett et al. 1991, Hald et al. 1991, Barry et al. 1992, Donovan et al. 2000).
SF-36 questionnaire and Lower Urinary Tract Symptoms Hunter and co-workers asked men over 55 years, known to have lower urinary tract symptoms (fullness, frequency, intermittency, urgency, poor flow, hesitancy) to fill in the SF-36 questionnaire (Hunter et al. 1995). Increasing symptom severity was significantly associated with decreasing median SF-36 scores for physical role (PR), social functioning (SF), mental health (MH) and general health (GH).
Welch and co-workers asked men who 12 months earlier reported lower urinary tract symptoms (Welch et al. 2002). Increased symptom severity (from none/mild symptoms through severe symptoms) decreased the mean score for all eight dimensions.
Stewart and co-workers interviewed men over 18 years by telephone (Stewart et al. 2003). Men who had overactive bladder with or without urge incontinence had significantly lower mean scores on all SF-36 dimensions compared with men without overactive bladder.
Mozes and co-workers interviewed men 45 to 75 years (Mozes et al.1999). Men who experienced “very” distressful urinary symptoms scored worse for each of the eight dimensions than men who were “not distressed at all”, or who reported “mild” distress.

22
Aims
The specific aims were:
I To investigate the prevalence of three common urinary symptoms (urgency, stress incontinence and post micturition dribbling) and health-care seeking behaviors in men aged 40-80 years in a defined population.
II To examine symptom severity and different levels of distress using the DAN-PSS questionnaire in men affected by storage, voiding and/or post micturition symptoms.
III To describe how different symptoms from the lower urinary tract in men affect the quality of life measured with the SF-36 questionnaire.
IV To evaluate the self-assessed health, sadness and happiness of men with reported symptoms from the lower urinary tract.

23
Methods
Study Population The study took place in the community of Surahammar, which is situated in the County of Västmanland in Sweden. The County is north of Lake Mälaren and is about 110 km west of Swedish capital, Stockholm. The community covers an area of 345 km2 and had a total population of 11,200 residents in 1996. At the time of the study, there were four acute-care hospitals and 36 primary health care centers in the County of Västmanland. According to the population registry that covers the entire Swedish population, 2571 men aged 40 to 80 were residents in the Surahammar community on 1 January 1996. These men comprised the study population.
Study Design and Data CollectionThe studies presented in this thesis are based on two different data collections. The general design, response rates and data collection methods are presented in Figure 1.

24
Not respondingn = 354
Moved/died
n = 32
Not responding
n = 117
Responding n = 387
DAN-PSSSF-36
n = 504
LUTS
n = 504
Post-micturition dribbling,stress incontinence or urgency
n = 536
Age-matched Randomly selected
n = 504
No symptoms
n = 1681
Total responding n = 2217
Questionnaire sent to all men aged 40-80 yearsin the community of Surahammar
n = 2571
DAN-PSSSF-36
n = 504
Not responding
n = 143
Responding n = 361
Total responding n = 748
I
II-IV
Figure 1. Flow chart

25
PaperIn January 1996, all men 40-80 years old (n=2571) living in the community of Surahammar, Sweden, received a postal questionnaire (see Appendix) with a letter explaining the objectives of the study and an invitation to participate. They were asked to return the questionnaires by mail and a prepaid envelope was provided. Those who did not reply within six weeks were sent two reminders by mail, including new questionnaires.
The questionnaire consisted of eight questions. Five of the questions covered urinary tract infection during the preceding
12 months (yes/no), previous consultations for voiding problems (yes/no), present full-time or part-time work (yes/no), physical exercise more than twice a week (yes/no), and current smoking (yes/no). The characteristics of the participating men are presented in Table 4.
In order to screen for symptoms from the lower urinary tract, three questions were used. A man was considered to have lower urinary tract symptom if he experienced the presence of one or more of these three symptoms.
Urgency: Respondents were asked if they experienced a sudden, violent need to urinate.
Stress incontinence: Respondents were asked if they had experienced involuntary loss of urine in association with, e.g., sneezing, lifting or coughing.
Post micturition dribbling: Respondents were asked if they experienced dribbling after having completed urination.
The questions about urgency and post micturition dribbling were adopted from a previous population study in an urban population in Denmark (Beier-Holgersen, Brunn 1990). The question about stress incontinence was developed from a previous population-based study on urinary incontinence among women in the same community (Hägglund et al. 1999). The three questions were chosen in collaboration with an urologist familiar with the condition decribed in the referral letter that is sent to the urology department from the primary health centres. The usual way to measure urine symptoms in the primary health centres at the time of the study was to ask the men if the symptom occurred or not.
A pilot study was performed prior to the main study in order to determine if the participants understood the questions.

26
Paper II, III and IV Of the 2571 men in the first study, 1008 were invited to take part in the following study after 12 months. Of these 1008 men, 504 had reported one or more of the lower urinary tract symptoms investigated in study 1 and 504 had not reported such symptoms. Men without symptoms were matched by age with men with symptoms from the same community population. All men received a letter of invitation where we explained the objectives of the study.
All the 1008 men were asked to complete a questionnaire booklet containing the self-administered questionnaires, DAN-PSS (Hald et al. 1991) (see Appendix) and the Swedish version of the SF-36 questionnaire (Sullivan et al. 1994) (see Appendix). Questions about socioeconomic status, level of education, marital status, smoking habits, physical activity and history of urinary tract infections during the preceding 12 months were also included in the questionnaire booklet. There were four levels of occupation: working, unemployed, retired or on sick leave and there were three levels of education: elementary school, higher secondary school or college/university education. A man was defined as a smoker if he answered “Yes” to the question “Do you smoke?”. The characteristics of the men included in Paper II, III and IV are presented in Table 4.
The questionnaires were returned by mail in a prepaid envelope. A postal reminder including a new questionnaire was sent twice to those who did not reply within six weeks.
DAN-PSS questionnaire The DAN-PSS questionnaire (Hald et al. 1991, Hansen et al. 1995) contains 12 questions on symptoms from the lower urinary tract as well as on the perceived distress corresponding to each specific symptom. Each question contains two parts: symptom score and distress score. The first part (symptom score) involves assessing the severity or frequency on a four stage scale (none, mild, moderate, severe) of each symptom separately. The second part (distress score) measured the extent to which a particular symptom distressed the men on a four stage scale (none, small, moderate, major).
A total symptom score ranging from 0 to 36 was obtained by adding the symptom scores from the 12 symptom questions. The total distress score was obtained in the same way. The total DAN-PSS score ranging from 0 to 108 was obtained by multiplying the symptom score and the distress score for each of the 12 questions and then adding the results.
Urge incontinence, stress incontinence, “other” incontinence, hesitancy, incomplete emptying, straining, dysuria and urgency were classified as mild when the symptom was reported to occur rarely, moderate when the symptom occurred often, and severe when the symptom occurred always.

27
Weak stream was classified as a mild symptom when the urinary stream was weak, moderate when the urinary stream was very weak and severe when the urinary stream was described as “dribbling”.
Daytime frequency symptoms were classified as mild when the interval between two urinations was two to three hours, moderate when the interval was one to two hours and severe when the interval was less than one hour.
Nocturia was classified as mild when it occurred once to twice during the night, moderate when it occurred three to four times at night and severe when it occurred more than five times during the night.
Post-micturition dribbling was classified as mild when the dribbling was reported only to take place in the lavatory, moderate when the dribbling was reported to occur in small amounts, and severe when it occurred in large amounts in the person’s trousers.
SF-36 questionnaire The SF-36 questionnaire contains 36 questions: 35 questions deal with quality of life distributed among eight dimensions, and one single question measures the changes in reported health over the past year. The eight dimensions were:
Physical Functioning (PF): 10 questions about limitations in physical activity because of health problems
Role limitations due to Physical problems (RP): four questions about limitations in usual role activities because of physical health problems
Role limitations due to Emotional problems (RE): three questions about limitations in usual role activities because of emotional problems
Social Functioning (SF): two questions about limitations in social activities because of physical or emotional problems
Body Pain (BP): two questions about presence of pain and limitations due to pain
Vitality (VT): four questions about energy and fatigue Mental Health (MH): five questions concerning psychological distress
and well-beingGeneral perception of Health (GH): five questions involving self
evaluation of personal health According to the instructions in the Swedish manual (Sullivan et al. 1994)
each question was coded, and the responses added together into a scale from 0 to 100, with 0 representing the worst possible perceived quality of life and 100 representing the best possible perceived quality of life.

28
Statistical Analysis All the calculations were performed with the Statistical Package for the Social Sciences 12.0 (SPSS). A p-value of <0.05 was considered as significant.
In paper , we calculated the percentage of men with self-reported symptoms. Student’s t test was performed to compare mean age between men with and without symptoms and also between respondents and the total population. Chi-square was used to test for statistical differences between proportions of symptoms.
In paper , Spearman Ranks test was used to study correlations between the total distress score and the total symptom score. Mann-Whitney U-test was performed to test differences between the age groups: 41-50, 51-60, 61-70 and 71-81 years. Values are presented as mean and SD.
In paper II, the SF-36 questionnaire was analyzed according to the instructions of the manual questionnaire (Sullivan et al. 1994). Each of the eight SF-36 dimensions is presented as the mean for storage symptoms, voiding symptoms and post-micturition symptoms combined a total of 12 symptoms. The Mann-Whitney U-test was used to compare the mean SF-36 score for men with no specific lower urinary tract symptoms versus men with mild or moderate/severe symptom severity; men with mild symptoms versus men with moderate/severe symptom severity; and men aged 40-65 years versus 66-80 years, for each of the 12 symptoms from the lower urinary tract.
In paper IV, the five and six graded questions measuring health, sadness and happiness were dichotomized. The responses relating to health were classified as low if the answer was “moderate” or “bad”. Sadness was classified as high if the answer was “all of the time”, “most of the time” “some of the time” and “part of the time”. Happiness was classified as high if the answer was “all of the time” and “most of the time”.
The four graded symptom scales of the DAN-PSS questionnaire was dichotomized into a no/mild group classified as the “no symptom”- group versus moderate/severe severity as the “symptom”-group. The total symptom burden was then categorized into four levels; no LUTS, 1-4 LUTS, 5-8 LUTS and 9-12 LUTS.
In order to evaluate the full spectra of a symptom from the lower urinary tract, all levels of symptom severity were included in the calculations concerning the specific symptom in relation to health, sadness and happiness.

29
Another dichotomization was used in the calculation concerning the complex of symptoms from the lower urinary tract, the total LUTS burden. In these calculations the symptoms classified by the men as “mild” were dichotomized into the “no/mild”-group in order to harmonize with our clinical experienced indicating that patients with a mild symptom severity hesitate seeking medical advice.
To compare groups, we calculated relative risks (RR): the percentage of men reporting a specific symptom at any level (mild, moderate, severe) from the lower urinary tract divided by the percentage of men who did not report having the same symptom at any level. For specific background factors, the relative risks were calculated as the percentage of men with moderate/severe symptoms from the lower urinary tract reporting a specific background factor divided by the percentage of men with no/mild symptoms from the lower urinary tract who reported the same background factor. Proportions were used to describe the number and percentage of men with specific symptoms from the lower urinary tract.
The ethics committee at Uppsala University approved the study.

30
Results
PaperThe total response rate was 86% (2217/2571), and in the age groups 40-49, 50-59, 60-69 and 70-80 years the response rate was 88, 86, 89 and 85%, respectively. The characteristics of the study population are shown in Table 4. The mean age (95% CI) among the symptomatic responders was 57.7 (56.8-58.6), which was significantly higher than 55.9 (55.4-56.4) for the asymptomatic respondents. No significant difference in the mean age (95%CI) between respondents and the total population (56.0 CI 55.6-56.4) of the men aged 40-80 years in the community were found.
Overall, 24% of the men reported that they had post micturition dribbling, urgency or stress incontinence either individually or in combination (Table 5). The prevalence increased from 20% in the 40-49 years age group to 28% in the group aged 70-80. Post micturition dribbling was the most frequently reported symptom: 21% of the men stated that they experienced post micturition dribbling, 6% reported urgency and 2% reported stress incontinence.
The prevalence of urgency and stress incontinence increase with age, but the prevalence of post micturition dribbling was independent of age.
In the 12 months preceding the study, 4% (96/2217) of the men had sought health care for voiding difficulties. Of the 96 who had sought help, 49 men reported urgency, stress incontinence or post micturition dribbling. The proportion of the men who seek help increased with an increasing number of reported symptoms. Among men with one, two or three symptoms, 6% (26/433), 19% (15/80) and 35% (8/23) had sought health care, respectively. Men in the age-group of 60-80 years had sought health care significantly more often than men in the age-group 40-59 years (16% and 6%, respectively).
The proportion of the men who reported having had urinary tract infection at least once during the preceding year was 2%, 3%, 3%, and 7% in the four age classes. Urinary tract infection was more common among men who reported urgency, stress incontinence or post micturition dribbling than among men without these symptoms.

31
Table 4. Characteristics of the men in the rural community of Surahammar.
Paper
n = 536
Paper n = 1681
Paper
n = 387
Paper III, IV
n = 748 Descriptive statistics
LUTS No. (%)
No LUTS No. (%) No. (%) No. (%)
Age:Mean (95%CI)
57.7 (56.8-58.6)
55.9(55.4-56.4)
59.6 (58.4-60.6)
59.8(59.0-60.5)
Social status: Employed 306 (57) 1009 (60) 197 (51) 393 (53) Unemployed 19 (5) 25 (3) Retired 120 (31) 229 (31) On sick leave 43 (11) 76 (10) Missing 8 (2) 25 (3)
Education: Primary school 244 (63) 456 (61) Secondary school 77 (20) 155 (21) University studies
58 (15) 107 (14)
Missing 8 (2) 30 (4) Marital status:
Married/living together
329 (85) 618 (83)
Single/widower 57 (15) 113 (15) Missing 1 (0) 17 (2) Other:
Smoker 113 (21) 420 (25) 77 (20) 146 (20) Non-smoker 423 (79) 1261 (75) 309 (80) 585 (78) Missing - - 1 (0) 17 (2) Physical activity, more than twice a week
306 (57) 992 (59) 188 (49) 354 (47)
Physical activity, twice a week or less
230 (43) 689 (41) 196 (51) 376 (51)
Missing - - 2 (0) 18 (2) Urinary tract infection 1 during the last year
34 (6) 37 (2) 30 (8) 48 (6)
No urinary tract infection during the last year
502 (94) 1644 (98) 354 (92) 680 (91)
Missing - - 3 (0) 20 (3)

32
Table 5. Prevalence of urinary tract symptoms (urgency, stress incontinence or post micturition dribbling) in different age groups.
Symptom *40-49n=687No. (%)
50-59n=717No. (%)
60-69n=465No. (%)
70-80n=348No. (%)
All agesn=2217No. (%)
Reporting1 to 3 symptoms
136 (20) 176 (25) 126 (27) 98 (28) 536 (24)
Urgency 7 (1) 39 (5) 42 (9) 52 (15) 140 (6) Stressincontinence
7 (1) 11 (2) 17 (4) 18 (5) 53 (2)
Post micturition dribbling
134 (20) 159 (23) 103 (22) 73 (21) 469 (21)
*Any individual may have reported up to three symptoms.
33
Paper II Among the men who had reported stress incontinence, urgency or post micturition dribbling in Paper I, 77 % (387/504) answered the DAN-PSS questionnaire. The response rate increased from 71% among men 41-50 years to 88% among men 71-81 years. The characteristics of the study population are shown in Table 4.
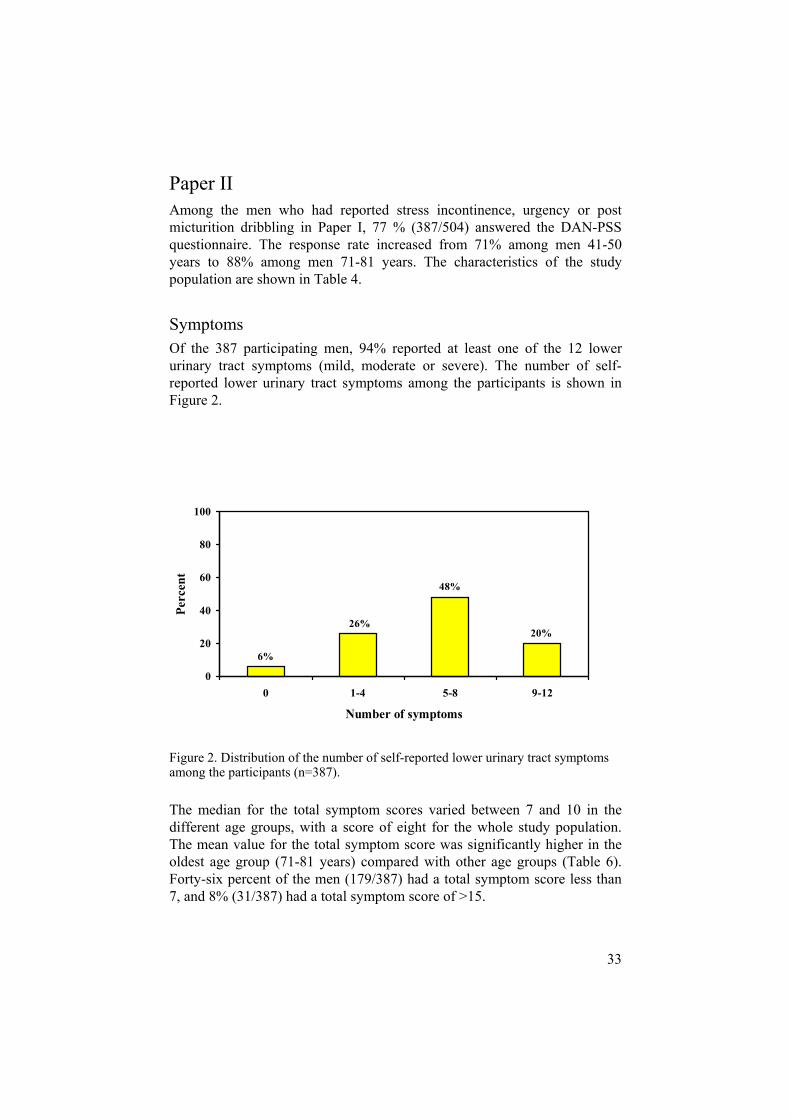
Symptoms Of the 387 participating men, 94% reported at least one of the 12 lower urinary tract symptoms (mild, moderate or severe). The number of self-reported lower urinary tract symptoms among the participants is shown in Figure 2.
Figure 2. Distribution of the number of self-reported lower urinary tract symptoms among the participants (n=387).
The median for the total symptom scores varied between 7 and 10 in the different age groups, with a score of eight for the whole study population. The mean value for the total symptom score was significantly higher in the oldest age group (71-81 years) compared with other age groups (Table 6). Forty-six percent of the men (179/387) had a total symptom score less than 7, and 8% (31/387) had a total symptom score of >15.
6%
26%20%
48%
0
20
40
60
80
100
0 1-4 5-8 9-12
Number of symptoms
Perc
ent

34
Table 6. Symptoms, distress and DAN-PSS median scores (q1, q3) by age group in men 41-81 years old.
Median scores (q1,q3)41-50(n=79)
51-60(n=123)
61-70(n=101)
71-81(n=84)
All ages(n=387)
Symptom score (min 0 max 36)
7 (4,10) 7 (4,10) 8 (5,11) 10 (7,13) 8 (5,11)
Distress score (min 0 max 36)
3 (1,9) 5 (1,9) 5 (1,10) 7 (3,13) 5 (1,10)
DAN-PSS score (min 0 max 108)
5 (2,12) 6 (2,13) 6 (2,12) 8 (4,20) 6 (2,14)
The distribution of reported symptoms at different levels of severity during the storage phase, voiding phase or immediately after micturition is shown in Table 7. Post-micturition dribbling was the most common symptom, reported by 86% of the men. Sixty-three percent (209/332) of these men reported a small amounts of urinary leakage in the trousers (score 2) or large amounts of leakage of in the trousers (score 3).
Among storage symptoms, urgency was reported by 69% of the men and 34% (91/265) of these men had a score of 2 (daily) or 3 (always). Nocturia, was reported by 60% of the men. Eighty-four percent (194/232) of these men had nocturia once to twice during the night and 16% (38/232) had it more than twice per night.
Urge incontinence was reported by 35% of the men. The corresponding figures were 18% for men with “other” incontinence and 15% with stress incontinence. Seventy-three percent (99/134) of the men with urge incontinence, 79% (55/70) of the men with “other” incontinence and 80% (47/59) of the men with stress incontinence reported mild symptoms. None of the 387 men reported severe symptoms of stress or “other” incontinence.
Of the symptoms experienced during the voiding phase, hesitancy was most common, reported by 61% of the men. Twenty-six percent (61/237) of the men reported that the symptom hesitancy occurred often or always (score 2-3). The proportion reporting straining at severity class 2 to 3 was 36% (75/209).

35
Table 7. Proportion (%) of the participants reporting no, mild, or moderate to severe lower urinary tract symptoms (n=387).
Symptom Number of men per score level No
Score 0
Mild,Moderate,
Severe
Score 1-3
Mild
Score 1
Moderate/ Severe
Score 2-3 Storage symptoms
Urgency 122 (31) 265 (69) 174 (45) 91 (24)
Nocturia 155 (40) 232 (60) 194 (50) 38 (10)
Frequency 172 (44) 215 (56) 160 (42) 55 (14)
Urge incontinence 253 (65) 134 (35) 99 (26) 35 (9)
Other incontinence 317 (82) 70 (18) 55 (14) 15 (4)
Stress incontinence 328 (85) 59 (15) 47 (12) 12 (3)
Voiding symptoms
Hesitancy 150 (39) 237 (61) 176 (46) 61 (15)
Straining 178 (46) 209 (54) 134 (35) 75 (29)
Weak stream 188 (49) 199 (51) 166 (43) 33 (8)
Dysuria 298 (77) 89 (23) 81 (21) 8 (2) Post micturition Symptoms
Post micturation dribbling 55 (14) 332 (86) 123 (32) 209 (54)
Incomplete emptying 137 (35) 250 (65) 169 (44) 81 (21)

36
DistressOf the men with at least one reported symptom from the lower urinary tract, 80% reported that they experienced some degree of distress (small, moderate, major) related to the symptoms. The total median distress score ranged from three to seven in the different age groups, with a score of five for the whole study population (Table 6). Fifty two percent of the men (201/387) had a total symptom score less than 6, and 5% (19/387) had a total symptom score of >20. The distress scores increased as symptom scores increased (r = 0,85 p<0.001).
Men with self reported urge incontinence, “other” incontinence or stress incontinence had the highest mean distress score (1.86, 1.53 and 1.29, respectively) (Table 8). These symptoms also show the highest correlation between symptom severity and the degree of distress among symptoms experienced during the storage phase of the bladder (Table 9).
Table 8. Distribution of the mean distress scores (SD) for storage, voiding and post micturition symptoms among the participants.
Symptom Mean distress score (SD) Storage symptoms
Urge incontinence 1.86 (1.1)
Other incontinence 1.53 (1.0)
Stress incontinence 1.29 (0.9)
Urgency 1.09 (0.9)
Frequency 0.89 (0.9)
Nocturia 0.84 (0.9)
Voiding symptoms
Dysuria 1.17 (0.8)
Weak stream 0.85 (0.8)
Hesitancy 0.79 (0.8)
Straining 0.74 (0.8) Post micturition symptoms
Post micturation dribbling 1.26 (1.0)
Incomplete emptying 0.92 (0.8)

37
Table 9. Correlation between total symptom score and total distress score for storage, voiding and post micturition symptoms.
Symptom CorrelationStorage symptoms
Urge incontinence 0.834
Other incontinence 0.807
Stress incontinence 0.784
Urgency 0.737
Nocturia 0.582
Frequency 0.503
Voiding symptoms
Straining 0.835
Weak stream 0.685
Dysuria 0.661
Hesitancy 0.645 Post micturition symptoms
Post micturation dribbling 0.664
Incomplete emptying 0.636
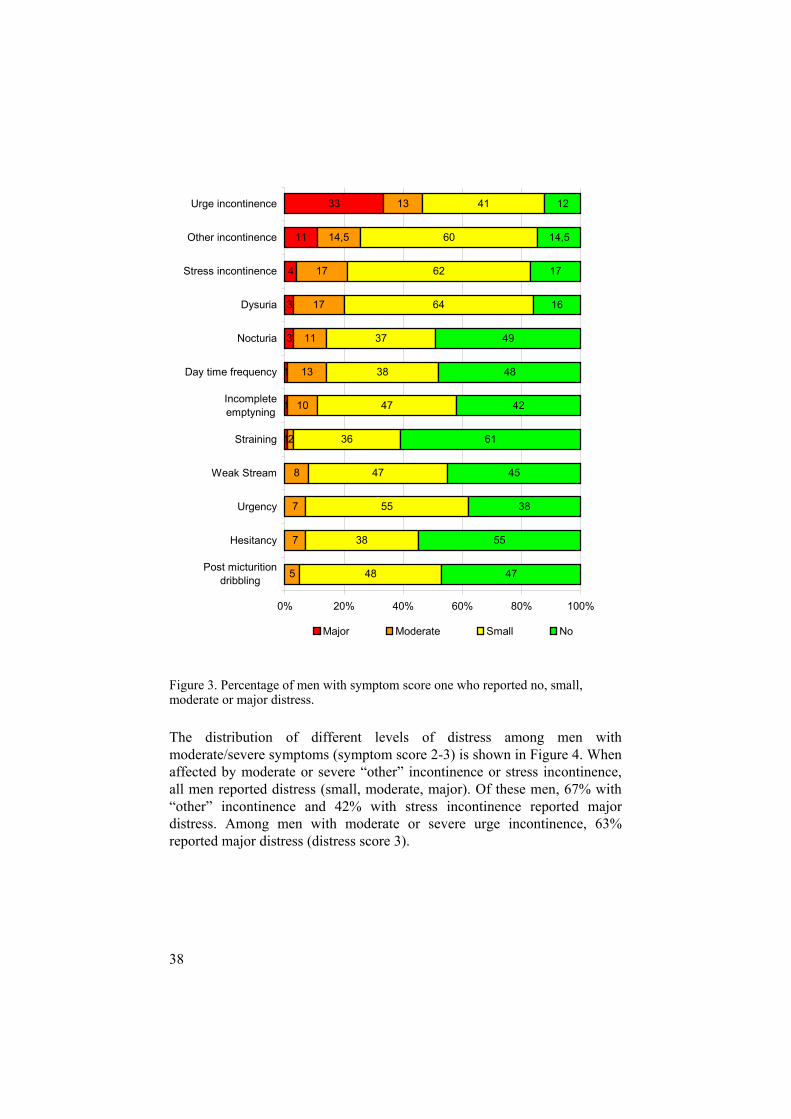
The distribution of different levels of distress for men with mild symptoms (symptom score 1) is shown in Figure 3. Among men with urge incontinence, 88% reported the symptoms to be distressful to some degree. Among men reporting “other” incontinence and stress incontinence, 85.5% and 83%, respectively, reported some degree of distress.
38
1
1
1
3
3
4
11
33
5
7
7
8
2
10
13
11
17
17
14,5
13
48
38
55
47
36
47
38
37
64
62
60
41
47
55
38
45
61
42
48
49
16
17
14,5
12
0% 20% 40% 60% 80% 100%
Post micturitiondribbling
Hesitancy
Urgency
Weak Stream
Straining
Incompleteemptyning
Day time frequency
Nocturia
Dysuria
Stress incontinence
Other incontinence
Urge incontinence
Major Moderate Small No
Figure 3. Percentage of men with symptom score one who reported no, small, moderate or major distress.
The distribution of different levels of distress among men with moderate/severe symptoms (symptom score 2-3) is shown in Figure 4. When affected by moderate or severe “other” incontinence or stress incontinence, all men reported distress (small, moderate, major). Of these men, 67% with “other” incontinence and 42% with stress incontinence reported major distress. Among men with moderate or severe urge incontinence, 63% reported major distress (distress score 3).

39
6
10
13
21
22
24
25
26
42
50
63
32
28
38
58
24
25
38
34
25
25
20
45
52
37
21
36
44
33
21
33
25
11
16
10
12
18
7
3
18
6
67 33
0% 20% 40% 60% 80% 100%
Straining
Incomplete emptyning
Hesitancy
Weak Stream
Day time frequency
Post micturition dribbling
Urgency
Nocturia
Stress incontinence
Dysuria
Urge incontinence
Other incontinence
Major Moderate Small No
Figure 4. Percentage of men with symptom score 2 or 3 who reported no, small, moderate or major distress.

40
Paper III The response rate was 74% (748/1008). Of these men, 694 men answered both the DAN-PSS and SF-36 questionnaires and 54 men answered only the SF-36 questionnaire. The mean age (95% CI) of all the participants at the time of answering the questionnaire was 59.8 (59.0-60.5) years, range 40-80 years. The demographic characteristics of the men are presented in Table 4. The distribution of the number of men with different levels of lower urinary tract symptoms are shown in Table 10.
Table 10. Distribution of the number (%) of men reporting severity divided into no, mild moderate or severe lower urinary tract symptoms among the participants n= 694.
Symptom Number of men per score level (%)No
Score 0
Mild
Score 1
Moderate
Score 2
Severe
Score 3 Storage symptoms
Urgency 313 (45) 270 (39) 106 (15) 5 (1)
Nocturia 307 (44) 338 (49) 47 (7) 2 (-)
Frequency 356 (51) 258 (37) 73 (11) 7 (1)
Urge incontinence 524 (76) 131 (19) 35 (5) 4 (-)
Other incontinence 612 (88) 66 (10) 16 (2) -
Stress incontinence 617 (89) 64 (9) 13 (2) -
Voiding symptoms
Hesitancy 330 (48) 272 (39) 75 (11) 17 (2)
Straining 368 (53) 226 (32) 81 (12) 19 (3)
Weak stream 389 (56) 262 (38) 37 (5) 6 (1)
Dysuria 576 (83) 109 (16) 8 (1) 1 (-) Post micturition symptoms
Post micturation dribbling 202 (29) 227 (33) 258 (37) 7 (1)
Incomplete emptying 345 (50) 249 (36) 88 (2) 12 (2)

41
Storage symptoms and SF-36 measurements The distribution of the mean SF-36 scores in men 40-80 years with mild and moderate/severe and no storage symptoms are shown in Figure 5.
When it came to urinary incontinence, the mean SF-36 scores were significantly lower in all the dimensions evaluated among men who experienced mild, moderate, severe urge incontinence, stress incontinence or other incontinence than among men without these symptoms. Furthermore, moderate or severe urge incontinence significantly reduced the mean scores on role physical (RP) and role emotional (RE) scales compared with men with mild urge incontinence.
For stress incontinence, the mean SF-36 scores were higher for body pain (BP) in men with moderate or severe symptoms than in men with mild symptoms. Men with moderate or severe (score 2-3) stress incontinence reported almost equal mean SF-36 scores on physical functioning (PF), role physical (RP), role emotional (RE) and general health (GH) scales to those reported by men with mild (score 1) stress incontinence. For “other” incontinence, there were differences in the mean SF-36 scores for role physical (RP) and role emotional (RE) between men with moderate or severe (score 2-3) symptoms and men with mild (score 1) symptoms.
Men with nocturia at least once a night (score 1-3) reported lower mean SF-36 mean scores for physical functioning (PF), role physical (RP), vitality (VT) and general health (GH) scales then men without nocturia. Men with nocturia at least three times a night (score 2-3) reported lower scores in all the evaluated dimensions than men who have to urinate once or twice per night (score 1).
The mean SF-36 scores were significantly lower for role physical (RP) functioning, among the men who reported the interval between each daytime urination to be three hours or less (score 1-3) compared with the mean SF-36 scores of men who had a voiding interval of more than three hours. Menwho reported the interval between daytime urinations to be two hours or less (score 2-3) scored lower on role physical (RP), role emotional (RE) and vitality (VT) scales than men who had a voiding interval of two to three hours (score 1).
Men with mild, moderate or severe (score 1-3) urgency reported lower mean SF-36 scores for physical functioning (PF), role physical (RP), body pain (BP), vitality (VT) and general health (GH) than men without urgency. Furthermore, moderate or severe (score 2-3) urgency significantly reduced the mean SF-36 scores for physical functioning (PF), role physical (RP), role emotional (RE), body pain (BP), vitality (VT) and general health (GH) compared with men with mild (score 1) urgency.

42
Figure 5. Mean SF-36 scores (0-100) in men 40-80 years with mild and moderate/severe and no stress incontinence, urge incontinence, nocturia, other incontinence, daytime frequency and urgency.

43
Comparisons of the mean SF-36 scores of men 40-65 years and men 66-80 years (Figure 6) showed that among men with mild, moderate or severe (score 1-3) urge incontinence the scores were equal in all evaluated dimensions except physical functioning (PF). For mild, moderate or severe (score 1-3) “other” incontinence, men 66-80 years reported lower scores for all the evaluated dimensions, with the exception of vitality (VT), mental health (MH) and general health (GH) compared with men 40-65 years.
A lower mean score for physical functioning (PF) and role physical (RP) was showed in men aged 66-80 years with mild, moderate or severe (score 1-3) stress incontinence compared with men 40-65 years with the same symptom. Furthermore, men 66-80 years with mild, moderate or severe (score 1-3) nocturia, daytime frequency or urgency, reported lower scores for physical functioning (PF) compared with men 40-65 years with the same symptom.

44
Figure 6. Mean SF-36 scores (0-100) in men 40-65 years and 66-80 years with the storage symptoms; stress incontinence, urge incontinence, other incontinence nocturia, daytime frequency, urgency. Black-boxes display the mean SF-36 scores in men 40-80 years without the storage symptoms.

45
Voiding symptoms and post micturition symptoms and SF-36 measurementsThe distribution of the mean SF-36 scores in men with different levels of symptoms experienced during the voiding phase and immediately after micturition and men without voiding or post micturition symptoms are shown in Figure 7.
Men with post micturition dribbling of any degree (mild, moderate/severe) reported significantly lower mean SF-36 scores for role physical (RP), role emotional (RE), body pain (BP), vitality (VT) and mental health (MH) scales than men without post micturition dribbling.
For dysuria, significantly lower mean SF-36 scores for all the evaluated dimensions with the exception of physical functioning (PF) were observed for men with mild, moderate or severe (score 1-3) dysuria compared with men without dysuria. Men with moderate/severe (score 2-3) dysuria reported lower scores for physical functioning (PF) body pain (BP) and general health (GH) than with men with mild (score 1) dysuria.
Men who reported mild, moderate or severe (score 1-3) symptoms of hesitancy, straining and incomplete emptying had significantly lower mean SF-36 scores on the role physical (RP), vitality (VT) and general health (GH) scales than men who did not. Men who felt that they rarely or never (score 2-3) completely emptied the bladder reported lower SF-36 scores for physical functioning (PF), role physical (RP), role emotional (RE), social functioning (SF), body pain (BP), mental health (MH) and general health (GH) than men who felt that they occasionally (score 1) emptied the bladder completely.
For the symptom weak stream, the mean SF-36 scores were significantly lower in all evaluated dimensions with the exception of social functioning (SF) and mental health (MH) among men who reported that their urinary stream was weak, very weak or dribbling (score 1-3) compared with men with a normal urinary stream. Men with very weak or dribbling urinary stream (score 2-3) reported lower mean SF-36 score in all evaluated dimensions compared with men with weak urinary stream (score 1).

46
Figure 7. Mean SF-36 scores (0-100) in men 40-80 years with mild and moderate/severe and no weak stream, hesitancy, straining, emptyning, post micturition dribbling and dysuria.
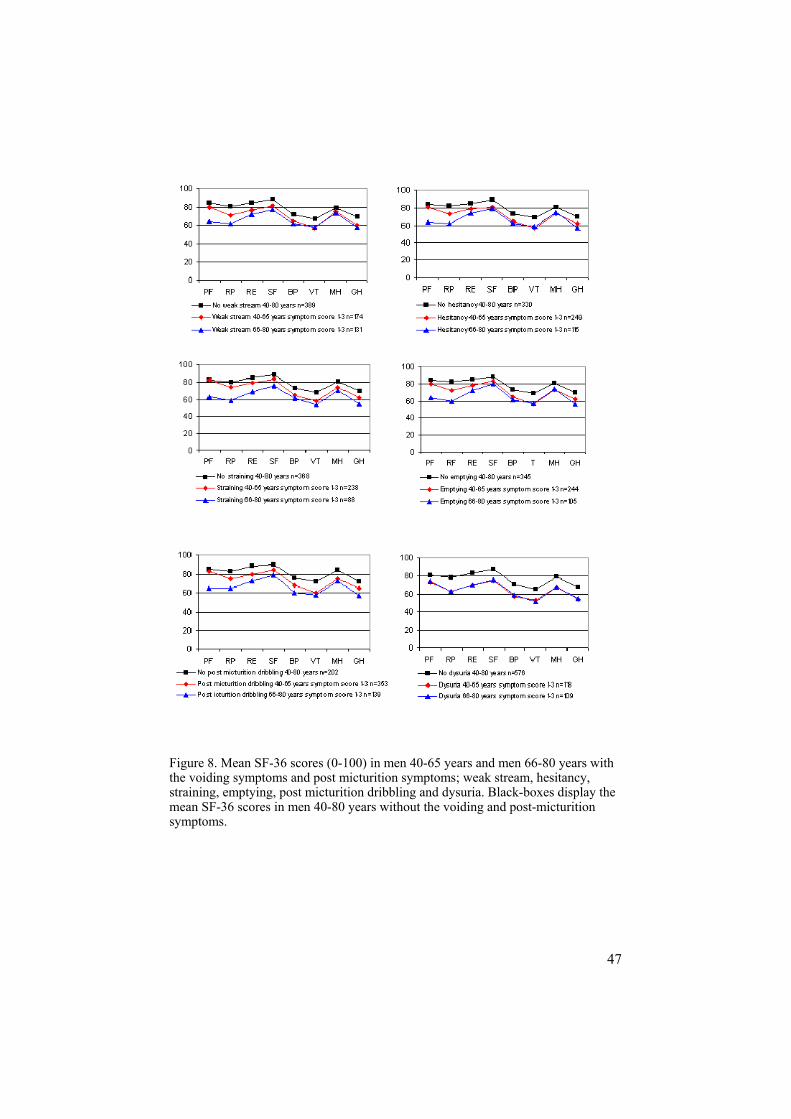
Comparisons of the mean SF-36 score between men 40-65 years and men 66-80 years are shown in (Figure 8). Differences in the dimensions were observed between the age-groups 40-65 and 66-80 years: for physical functioning (PF) in men with weak stream; for physical functioning (PF) and role physical (RP) in men with hesitancy, incomplete emptying or post micturition dribbling; and for physical functioning (PF), role physical (RP) and role emotional (RE) in men with straining.
47
Figure 8. Mean SF-36 scores (0-100) in men 40-65 years and men 66-80 years with the voiding symptoms and post micturition symptoms; weak stream, hesitancy, straining, emptying, post micturition dribbling and dysuria. Black-boxes display the mean SF-36 scores in men 40-80 years without the voiding and post-micturition symptoms.

48
Paper IV The population contained the same men as in Paper III (Figure 1). The characteristics of the study population are shown in Table 4.
Self-assessed health correlates with the total symptom burden; 39% (157/402) of men with at least one moderate/severe symptom from the lower urinary tract reported moderate or bad health (low score for health) compared with 18% (52/290) of the men unaffected or with mild symptoms from the lower urinary tract (Figure 9). These figures differ to a statistically significant degree, with a relative risk of 2.2 (CI=1.7-2.9).
3.7 (2.7-5.1) 4.2 (2.6-6.7)1.9 (1.4-2.5)Ref. 1.0
52/29018%
6/875%34/51
67%
117/34334%
0
20
40
60
80
100
0 1-4 5-8 9-12
Number of symptoms
Perc
ent
Figure 9. The prevalence and Relative Risk (95%CI)) of a low score for health in men with different numbers of symptoms from the lower urinary tract.
In all, 19% (128/662) of the men felt sadness part of the time to all of the time (high sadness score). A high score for sadness was reported by 12% of the men unaffected or with mild symptoms from the lower urinary tract. For comparison, 22% of the men with one to four moderate/severe symptoms and 43% of the men with five to eight moderate/severe symptoms had high sadness scores (Figure 10). The relative risk of a high score for sadness in men with one or more moderate/severe symptoms from the lower urinary tract was 2.0 (CI=1.4-2.8) compared with men unaffected or with mild symptoms from the lower urinary tract.

49
Ref. 1.0 1.8 (1.2-2.6) 3.4 (2.2-5.4) 1.6 (0.3-9.6)
73/33522%
1/520%34/275
12%
20/4743%
0
20
40
60
80
100
0 1-4 5-8 9-12
Number of symptoms
Perc
ent
Figure 10. The prevalence and Relative Risk with 95% (CI) of a high score for sadness in men with different numbers of symptoms from the lower urinary tract.
A feeling of happiness “all of the time” or “most of the time” (high score for happiness) was reported by 50% (332/665) of the men (Figure 11). The self-assessed feeling of happiness correlates with the total symptom burden. Men unaffected or with mild symptoms from the lower urinary tract reported a higher score for happiness compared with men with at least one moderate/severe symptom from the lower urinary tract, (64 vs. 40%).

50
Ref 1.0 0.7 (0.6-0.8) 0.3 (0.0-1.6)0.3 (0.2-0.6)
178/27864%
144/33543%
9/4620%
1/617%
0
20
40
60
80
100
0 1-4 5-8 9-12
Number of symptoms
Perc
ent
Figure 11. The prevalence and Relative Risk with 95% (CI) of a high score for happiness in men with different numbers of symptoms from the lower urinary tract.
As seen in Table 11, the risk of obtaining a low score for health was significantly greater in men with moderate/severe lower urinary tract symptoms compared with men with no/mild symptoms for all the evaluated characteristics, with the exception of unemployed men, men on sick leave and men with self-reported urinary tract infection. Also, all of the men with moderate/severe symptom, with the exception of men on sick leave, reported a significant effect on their happiness score compared with men with no/mild symptoms (Table 12). A statistically significant relative risk of obtaining a high sadness score was observed for men with moderate/severe lower urinary tract symptoms in combination with a wide range of other characteristics (Table 13).

51
Table 11. The number (%) and the relative risk (95% CI) of a low (moderate or bad) score for health, subdivided by social status, education, marital status, smoking, physical activity and urinary tract infection (UTI) with moderate/severe lower urinary tract symptoms vs. no/mild lower urinary tract symptoms.
LOW SCORE FOR HEALTH
Characteristic
Moderate/severe LUTS No. low health /total (%)
No/mild LUTS
No. low health /total (%)
Relative Risk (95% CI)
Social status: Employed 45/198 (23) 14/172 (8) 2.8 (1.6-4.9) Retired 64/135 (47) 21/81 (26) 1.8 (1.2-2.7) Unemployed 8/17 (47) 0/6 (0) On sick leave 35/45 (78) 16/27 (59) 1.3 (0.9-1.9)
Education: Primary school 110/256 (43) 45/131 (26) 1.6 (1.3-2.2) Secondary school 24/79 (30) 2/65 (3) 9.9 (2.4-40.2) University studies 16/58 (28) 4/42 (10) 2.9 (1.0-8.0)
Marital status: Single/widower 31/64 (48) 8/40 (20) 2.4 (1.2-4.7) Married/living together 125/336 (37) 44/249 (17) 2.1 (1.5-2.8)
Other: Smoker 38/81 (47) 12/58 (21) 2.2 (1.3-3.9) Non-smoker 117/319 (37) 40/231 (17) 2.1 (1.5-2.9) No physical activity 93/218 (43) 31/142 (22) 1.9 (1.4-2.8)
Physical activity 62/181 (34) 21/147 (14) 2.4 (1.5-3.7) UTI 27/41 (66) 2/7 (29) 2.3 (0.7-7.5) No UTI 128/358 (36) 49/281 (17) 2.1 (1.5-2.7)

52
Table 12. The number (%) and the relative risk (95% CI) of a high (all the time or most of the time) score for happiness, subdivided by social status, education, marital status, smoking, physical activity and urinary tract infection (UTI) with moderate/severe lower urinary tract symptoms vs. no/mild lower urinary tract symptoms.
HIGH SCORE FOR HAPPINESS
Characteristic
Moderate/severe LUTS No. high happiness
/total (%)
No/mild LUTS
No. high happiness /total (%)
Relative Risk (95% CI)
Social status: Employed 93/196 (47) 113/170 (66) 0.7 (0.6-0.8) Retired 48/123 (39) 50/74 (68) 0.6 (0.4-0.7) Unemployed 3/16 (19) 5/6 (83) 0.2 (0.1-0.6) On sick leave 9/45 (20) 8/25 (32) 0.6 (0.3-1.4)
Education: Primary school 105/245 (43) 109/166 (66) 0.6 (0.5-0.8) Secondary school 31/77 (40) 43/65 (66) 0.6 (0.4-0.8) University studies 18/56 (32) 23/41 (56) 0.6 (0.3-0.9)
Marital status: Single/widower 16/63 (25) 24/39 (61) 0.4 (0.2-0.7) Married/living together 138/322 (43) 154/239 (64) 0.7 (0.6-0.8)
Other: Smoker 32/76 (42) 13/20 (65) 0.6 (0.5-0.9) Non-smoker 122/309 (39) 140/220 (64) 0.6 (0.5-0.7) No physical activity 75/208 (36) 82/138 (59) 0.6 (0.5-0.7)
Physical activity 79/176 (45) 96/140 (69) 0.6 (0.5-0.8) UTI 7/38 (18) 4/7 (57) 0.3 (0.1-0.8) No UTI 147/346 (42) 174 /271 (64) 0.7 (0.6-0.8)

53
Table 13. The number (%) and the relative risk (95% CI) of a high (all the time to part of the time) score for sadness, subdivided by social status, education, marital status, smoking, physical activity and urinary tract infection (UTI) with moderate/severe lower urinary tract symptoms vs. no/mild lower urinary tract symptoms.
HIGH SCORE FOR SADNESS
Characteristic
Moderate/severe LUTS No. high sadness /total (%)
No/mild LUTS No. high sadness /total (%)
Relative Risk (95% CI)
Social status: Employed 35/196 (18) 19/170 (11) 1.6 (0.9-2.7) Retired 28/122 (23) 9/71 (13) 1.8 (0.9-3.6) Unemployed 9/17 (53) 1/6 (17) 3.1 (0.5-20.1) On sick leave 20/46 (43) 5/25 (20) 2.2 (0.9-5.1)
Education: Primary school 63/246 (26) 24/164 (15) 1.7 (1.1-2.7) Secondary school 11/76 (14) 5/65 (8) 1.8 (0.7-5.1) University studies 16/56) (29) 4/41 (10) 2.9 (1.1-8.1)
Marital status: Single/widower 26/62 (42) 6/38 (16) 2.6 (1.2-5.8) Married/living together 66/323 (20) 28/237 (12) 1.7 (1.1-2.6)
Other: Smoker 27/77 (35) 6/58 (10) 3.5 (1.5-7.7) Non-smoker 66/308 (21) 28/217 (13) 1.6 (1.1-2.5) No physical activity 50/209 (24) 20/137 (15) 1.6 (1.0-2.6)
Physical activity 41/175 (23) 14/138 (10) 2.3 (1.3-4.0) UTI 13/38 (34) 0/6 (0) No UTI 80/346 (23) 34/269 (13) 1.8 (1.3-2.6)

54
The risk of having a low score for health, a high score for sadness and a high score for happiness was significantly greater among men with mild, moderate or severe lower urinary tract symptoms than among those without symptoms in all twelve evaluated symptoms from the lower urinary tract (Table 14-16). The relative risk of getting a low score for health was 2.2 (CI=1.8-2.8) among men who experienced “other” incontinence rarely (mild), daily (moderate) or every time (severe) compared with men who were not affected by “other incontinence”. The corresponding relative risk was 0.5 (CI=0.3-0.7) for a high score for happiness and 2.3 (CI=1.7-3.3) for a high score for sadness. The relative risk of obtaining a low score for health was 2.1 (CI=1.7-2.6), 1.9 (CI=1.4-2.7) for obtaining a high score for sadness and 0.6 (CI=0.4-0.7) for a high score for happiness for men with mild, moderate or severe urge incontinence compared with men without urge incontinence. When men with stress incontinence at any level were compared with men without stress incontinence, the relative risk for a low score for health was 1.8 (1.4-2.4), whereas that for a high score for happiness was 0.5 (CI=0.3-0.7) and the risk of obtaining a high score for sadness was 2.1 (CI=1.5-3.0).

55
Table 14. The number (%) and the relative risk (95% CI) of a low score (moderate or bad) for health and mild/moderate/severe lower urinary tract symptoms vs. men with low score for health and no specific lower urinary tract symptoms.
LOW SCORE FOR HEALTH
DAN-PSS item
Mild/moderate/severe symptom
No. low health /total (%)
No symptom
No. low health /total (%)
Relative Risk (95% CI)
Storage symptoms Other incontinence 48/82 (59) 159/606 (26) 2.2 . (1.8-2.8) Stress incontinence 37/77 (49) 169/610 (27) 1.8 (1.4-2.4) Urge incontinence 85/170 (50) 123/519 (24) 2.1 (1.7-2.6) Urgency 148/380 (39) 59/309 (19) 2.0 (1.6-2.7) Nocturia 149/385 (39) 60/305 (20) 2.0 (1.5-2.6) Daytime frequency 112/337 (36) 68/327 (21) 1.7 (1.4-2.3)
Voiding symptoms Dysuria 51/117 (44) 156/571 (27) 1.6 (1.3-2.0) Hesitancy 137/363 (38) 72/328 (22) 1.7 (1.3-2.2) Weak Stream 122/203 (40) 85/386 (22) 1.8 (1.4-2.3) Straining 119/324 (37) 89/367 (24) 1.5 (1.2-1.9)
Post micturition symptoms
Post micturition dribbling 166/491 (34) 42/199 (21) 1.6 (1.2-2.2) Incomplete emptying 131/348 (38) 75/336 (22) 1.7 (1.3-2.1)

56
Table 15. The number (%) and the relative risk (95% CI) of a high score (all the time or most of the time) for happiness and mild/moderate/severe lower urinary tract symptoms vs. high score for happiness and no lower urinary tract symptoms.
HIGH SCORE FOR HAPPINESS
DAN-PSS item
Mild/moderate/severe symptom
No. high hapiness /total (%)
No symptom
No. high happiness /total (%)
Relative Risk (95% CI)
Storage symptoms Other incontinence 20/77 (26) 311/584 (53) 0.5 (0.3-0.7) Stress incontinence 18/72 (25) 314/589 (53) 0.5 (0.3-0.7) Urge incontinence 50/160 (31) 282/502 (56) 0.6 (0.4-0.7) Urgency 145/365 (40) 186/297 (63) 0.6 (0.5-0.7) Nocturia 153/366 (42) 178/297 (60) 0.7 (0.6-0.8) Daytime frequency 139/321 (43) 187/318 (59) 0.7 (0.6-0.9)
Voiding symptoms Dysuria 32/109 (29) 229/552 (54) 0.5 (0.4-0.7) Hesitancy 135/345 (39) 197/319 (62) 0.6 (0.5-0.7) Weak Stream 121/286 (42) 209/377 (55) 0.8 (0.7-0.9) Straining 120/309 (39) 212/355 (60) 0.7 (0.6-0.8)
Post micturition symptoms
Post micturition dribbling 199/472 (42) 132/192 (69) 0.6 (0.5-0.8) Incomplete emptying 132/330 (40) 196/328 (60) 0.7 (0.6-0.8)

57
Table 16. The number (%) and the relative risk (95% CI) of a high score (all the time to part of the time) for sadness and mild/moderate/severe lower urinary tract symptoms vs. high score for sadness and no lower urinary tract symptoms.
HIGH SCORE FOR SADNESS
DAN-PSS item
Mild/moderate/severe symptom
No. high sadness /total (%)
No symptom
No. high sadness /total (%)
Relative Risk (95% CI)
Storage symptoms Other incontinence 29/75 (39) 96/583 (17) 2.3 (1.7-3.3) Stress incontinence 26/71 (37) 101/587 (17) 2.1 (1.5-3.0) Urge incontinence 48/159 (30) 78/500 (16) 1.9 (1.4-2.7) Urgency 90/364 (25) 37/295 (13) 1.9 (1.4-2.8) Nocturia 82/365 (23) 46/295 (16) 1.4 (1.0-2.0) Daytime frequency 68/230 (21) 51/316 (16) 1.3 (1.0-1.8)
Voiding symptoms Dysuria 37/110 (34) 90/548 (16) 2.0 (1.5-2.8) Hesitancy 88/343 (25) 42/318 (13) 1.9 (1.4-2.7) Weak Stream 64/286 (22) 64/375 (17) 1.3 (1.0-1.8) Straining 70/308 (23) 58/353 (16) 1.4 (1.0-1.9)
Post micturition symptoms
Post micturition dribbling 107/471 (23) 21/189 (11) 2.0 (1.3-3.2) Incomplete emptying 77/330 (23) 46/325 (14) 1.7 (1.2-2.3)

58
Methodological Considerations
Confounding factors A confounding factor is a factor other than that being studied, which appears with varying frequency and affects the results in the groups that are being compared (Steineck, Ahlbom 1992, Steineck et al. 2002). In our study, we have taken account of educational level, social status, marital status, smoking, physical activity and urinary tract infections. In Paper , there were no differences between men with lower urinary tract symptoms and men without symptoms when it came to physical activity, smoking and employment. Conflicting data have been presented concerning the impact of cigarette smoking on the risk of lower urinary tract symptoms. No significant difference between lower urinary tract symptoms in current cigarette smokers and non-smokers has been found (Haidinger et al. 2000, Muscatello et al. 2001, Rohrmann et al. 2005). These data are in contrast to those reported by Koskimäki and co-workers when using the DAN-PSS symptom score: they found that smoking is associated with an increased risk of lower urinary tract symptoms (Koskimäki et al. 1998).
Since development lower urinary tract symptoms can bee a result e.g. diseases or pattern of behaviours, we cannot exclude the possibility that we may have neglected some confounding factors that could affect the results. However, marital status, educational level, coffee consumption, sexual activity, alcohol consumption (Tubaro et al. 2004), BMI and diabetes (Tubaro et al. 2004, Seim et al. 2005) have no significant association with lower urinary tract symptoms as measured by the IPSS questionnaire.
If a control group is used, the group should be chosen so that they resemble the intervention group, with the exception of the characteristic that is actually being studied. In Questionnaire 2, men who had stated that they had had symptoms from the lower urinary tract 12 months earlier were included, while men who stated that they had not experienced symptoms from the lower urinary tract 12 months earlier were matched for age and included in the control group. Selecting an age-matched control group from the same municipality means that the control group has access to the same health care services that are offered to the study group.

59
In Paper III and IV, the control group resembled the intervention group, with the exception of the specific symptom from the lower urinary tract currently under study. This procedure of selecting the control group means that in addition to the symptom being studied, the men could have had other symptoms from the lower urinary tract. However, we have no suspicion that additional symptoms in the control group could result in the loss of the strength of the result as the asymptomatic men (men without any of the 12 lower urinary tract symptoms we enquired about in our study) showed no significant differences in the mean SF-36 scores from any of the eight SF-36 dimensions compared with an age-matched Swedish normative population. Moreover, these men did not differ in the mean SF-36 scores compared with men without a specific symptom from the lower urinary tract.
Misrepresentations Misrepresentation exists when the people who were invited to participate, but do not participate in the study differ from the participants, or when the response rate is low (Steineck, Ahlbom 1992, Steineck et al. 2002). To prevent misrepresentation in Questionnaire 1, all the men aged 40-80 living in one community were asked to participate, thus giving every man the same probability to participate, and no exclusions were made. An advantage of a community-based study design is that it is not affected by the potential selection bias arising from other methods of selection e.g. among men visiting the hospital or general practice. The Swedish Population Registry, which includes all the people living in Sweden, was used to locate the men.
To obtain a high response rate, an accompanying letter explaining the design of the study was sent with each questionnaire and the participants were also offered telephone contact information in the event of uncertainty or questions. A prepaid envelope was included. To increase the response rate, a reminder with another copy of the questionnaire was sent to the participants after four and six weeks. In Questionnaire survey 1 and 2, the response rate was 86% and 74% respectively and must be considered as high. However, we cannot exclude the possibility that men who did not respond biased the study results in some direction. Maybe men with lower urinary tract symptoms find the questions relevant and are therefore more likely to respond. On the other hand, men with symptoms may deny the symptoms because of embarrassment and not answer the questions.
In Paper , no difference in terms of mean age was noted between participating men and the total population of men 40-80 years of age in the community of Surahammar. Higher mean ages were observed in Paper I among men who reported symptoms than among men without symptoms. In

60
Paper II, the mean age 59.6 of the responders was slightly higher compared with the mean age 56.1 of the non-responders.
Misclassifications Misclassification exists when the participants are classified as having a symptom, when they do not, or being classified as not having a symptom when they do (Steineck, Ahlbom 1992, Steineck et al. 2002).
To prevent misclassifications, the men themselves stated whether they had or did not have symptoms from the lower urinary tract. In accordance with ICS recommendations, no objectification of the symptoms was done (Abrams et al. 2002). Abdel-fattah and co-workers found that asking a woman if she has urinary leakage or not is just as good as doing the pad test (Abdel-fattah et al. 2004). The ICS has also changed the definition from “the involuntary loss of urine that is a social or hygienic problem and is objectively demonstrable” (Bates et al. 1979) to “complaint of any involuntary leakage of urine” (Abrams et al. 2002).
To harmonize with the questions that were asked in conjunction with visits to primary health care, dichotomous response alternatives (Yes/No) were used in Questionnaire 1. In Questionnaire 2 (DAN-PSS), there were four alternative answers (none, mild, moderate, severe) to choose among. One problem is knowing how much more information a questionnaire with four alternative answers provides compared with a questionnaire with two alternative answers. Maybe the severity/frequency of a symptom needs to reach a certain level to be reported as a symptom. Men who responded “No” in questionnaire 1 may have responded “Yes” in questionnaire 2 where low severity/frequent alternatives were available. This could mean that the results for the prevalence of the three symptoms we asked about in Paper are lower than they would have been if the prevalence had been based on questions from the DAN-PSS questionnaire.
In the recommendations relating to DAN-PSS questionnaire, only those men who responded “I have no symptoms” should been classified as symptom free.
The question about post micturition dribbling “Do you experience dribbling after you finish urinating?” had the following response alternatives: 1) No dribbling at all 2) Dribbling occurs in the lavatory, 3) Dribbling occurs in small quantities in my underpants and 4) Dribbling occurs in large quantities in my underpants. In 1991, when the DAN-PSS questionnaire was introduced (Hald et al. 1991) the ICS wrote that “post micturition dribbling denotes other symptomatic forms of incontinence” (Abrams et al. 1989) and no recommendations about the severity were given. Today, the recommendation has been changed to “post micturition dribble is
61
the involuntary loss of urine immediately after finished passing urine, usually after leaving the toilet in men” (Abrams et al. 2003).
Since “Dribbling takes place in the lavatory” is normal according to the recommendations from ICS, 123 men in Paper II and 227 men in Paper III should have been classified as asymptomatic. Also the third alternative, “Dribbling occurs in small quantities in my underpants” may be regarded as normal since Hauskaar and co-workers reported that a few drops of urine after finishing urinating should not be regarded as a symptom (Hunskaar 1992).
The DAN-PSS question about “other” incontinence “Do you experience leakage of urine without urge or physical activity?” is hard to interpret not only for professionals but also for laymen, reducing the validity of the question. For a professional, an affirmative answer to the DAN-PSS question might indicate the very serious condition of overflow incontinence or the less serious condition of minimal enuresis. It is hard to explain the high prevalence noted in Paper II by “other” incontinence so it is reasonable to believe that the figure stands for a mixture of overflow incontinence and minimal enuresis.
In Paper IV, we dichotomised the alternative responses relating to general health and the ability to feel happy and pleased or sad and depressed to facilitate an understanding of a symptom at any level in a clinical setting. At the same time, however, dichotomisation could result in the loss of some of the strength of the material as a whole. We also dichotomised med with mild symptom severity into the group “no/mild” in order to harmonize with our clinical experienced. In this way a few men with highly distressing but mild severity symptom are misclassified into the “no/mild”-group.

62
Discussion
Lower Urinary Tract Symptoms In Paper , one of four men between the ages of 40 and 80 reported a lower urinary tract symptom. Other population-based reports on the prevalence of lower urinary tract symptoms in Swedish men confirm our finding (Malmsten et al. 1997, Andersson et al. 2004b, Stenzelius et al 2004). Twenty percent of the men in the age group 40-49 years reported at least one symptom from the lower urinary tract wich indicate the importance of include men age 40-49 years in the studies (Hunter et al. 1994, Hunter et al.1996).
The most prevalent and independent of age symptom was post-micturition dribbling (Paper I). Post-micturition dribbling is believed to be caused by incomplete emptying of the bulbous urethra (Beier-Holgersen, Brunn 1990) and therefore it is not excluded that this “symptom” might occur with same prevalence in different age groups, if one believes that this part of the urethra remains unchanged throughout life. Increased tolerance of this symptom with increased age could be explained by other approaching lower urinary tract symptoms overriding the significance of post-micturition dribbling despite its prevalence being the same.
Our prevalence rates for stress incontinence (1-5%) (Paper I) are similar to what other authors have found (2-5%) (Kay et al. 1999, Nuotio et al. 2003). Like Perry et al. 2000 and Mc Grother et al. 2003 we found that totally 6% of the men reported urgency. Our prevalence rate for urgency in the age group 50-59 years (5%) are almost identical that found in a population-based study among men 50-59 years (6%) living in Denmark (Nørby et al. 2005). Higher prevalence rates of urgency (18-58%) than ours have been found in other international studies (Norman et al. 1994, Koskimäki et al. 1998, Kay et al. 1999, Sladden et al. 2000, Hughes et al. 2000, Moorthy et al. 2004). A possible explanation may be that some of the respondents misunderstood the question about urgency “Do you experience a sudden, violent need for urination” and therefore their responses may have included both urgency and urge incontinence. Sagnier and co-workers has also discussed the possibility that differences in the reported prevalence between countries reflect the perception of, or willingness to report symptoms (Sagnier et al. 1996). Therefore, prevalence results in one country may not be generally applicable to other countries (Witjes et al. 1997).

63
Among the men who had reported symptoms in Questionnaire 1 (Paper I), 94% reported at least one symptom from the lower urinary tract in Questionnaire 2 (Paper II). Questionnaire 2 was distributed 12 months after Questionnaire 1 and, as a result of the passage of time, new symptoms may have occurred in some men, whereas other symptoms disappeared (Temml et al. 2003). Hakkinen and co-workers found when studying changes in the prevalence of lower urinary tract symptoms with the DAN-PSS questionnaire that 46-77% of the men who were symptomatic at baseline reported no changes, 16-52% reported improvement and 2-19% reported deterioration after 5 years (Hakkinen et al. 2004). Even though Questionnaire 2 was distributed 12 months later, the proportion of men with at least one symptom from the lower urinary tract in our study is almost identical to that found in population-based studies using the DAN-PSS questionnaire, (84-89%) (Koskimäki et al. 1998, Kay et al. 1999).
Like Koskimäki and co-workers, (Koskimäki et al. 1998) we found that the proportion of men with mild symptom was much higher than that of men with moderate or severe symptoms (Paper II). Even though the majority of the men reported mild symptoms, 80% of them experienced some form of distress (Paper II) which indicates the importance of considering the distress caused by the symptoms. The Clinical Practice Guidelines of the Agency for Health Care Policy and Research also indicates that intervention may make more sense for a patient with moderate symptoms who experiences major distress, than for a patient with severe symptoms but with less distress (Agency for Health Care Policy and Research 1994).
Seeking Help for Lower Urinary Tract Symptoms Despite the distress caused by lower urinary tract symptoms (Paper II) and the reduced quality of life among men with reported symptoms (Paper III, IV), the percentage of men who sought health care for symptoms was low (Paper ) as in another Swedish study (Malmsten et al. 1997). The reasons why men refrain from seeking help despite having symptoms may be: that they feel symptoms related to the lower urinary tract are part of the normal aging process (Branch et al. 1994, Borgen et al. 1997, Minassian et al. 2003, Gannon et al. 2004, Homma et al. 2005); that they are embarrassed to seek help (Malmsten et al. 1997, Homma et al. 2005); that they don’t perceive the symptom as distressful and affecting their daily life (Andersson et al. 2005); that they believed it is not a disease (Homma et al. 2005) or that they believe that no effective treatment is available (Milsom et al. 2001, Homma et al. 2005). People are not informed about available treatment (Minassian et al.2003). Lagace et al. (1993) found that of the men with symptoms who had not been in contact with the health service, 37% would seek and 42% might seek help if they knew that some effective treatment were available.

64
According to Kirby (2004), men need to be informed that help for lower urinary tract symptoms is available and that treatment is effective. The men in our study had easy access to medical facilities and treatment in the community, so the lack of access should not have affected the help seeking behavior.
People also adapt their lifestyle to overcome their symptoms by restricting their fluid intake, e.g., they avoid fluid intake during the evening (Garraway et al. 1993, Hunter et al. 1995, Bertaccini et al. 2001, Milsom et al. 2001, Scarpa 2001, Shvartzman et al. 2001). Another coping strategy is to take control of the symptoms, rather than being controlled by them, e.g., emptying the bladder before going out (Gannon et al. 2004).
The propensity to seek help increased with an increased number of reported symptoms (Paper ). Many of the symptoms from the lower urinary tract start slowly and fluctuate for a considerable time before they become fully established. In Paper II, men with rare (mild) symptoms reported less distress compared to men with symptoms they experienced daily (moderate) or every time (severe). In Paper III, men with mild nocturia or weak stream reported higher mean scores in all dimensions compared to men with moderate or severe degree of the same symptoms. Maybe the symptom has to be perceived as permanent or have reached a certain level before the men decide to seek help (Logie et al. 2005). Scarpa found that only 28% of the men saw a physician within 6 months after the symptom started and 44% of the men postponed the first visit to more than one year (Scarpa 2001).
A key factor that influences whether or not the men see a physician is how seriously the symptoms affect their quality of life (MacFarlane et al.1995, Pinnock, Marshall 1997, Scarpa 2001, Wolters et al. 2002, Boyle et al.2003, Andersson et al. 2004a).
In the first questionnaire administered to all men living in the community, men 60-80 years with symptoms from the lower urinary tract hade sought health care providers more often compared with men 40-59 years with symptoms (Paper I). Other studies have also shown that the percentage of men seeking help increases with increasing age (Wolfs et al. 1994, Koskimäki et al. 1998, McDonnell et al. 2001). With a changing demographic profile as a consequence of the general increases in the elderly population (SBU 2000) the expenses for lower urinary tract symptoms place a substantial economic burden on the healthcare system (Ekelund et al. 1993, Wagner, Hu 1998, McDonnell et al. 2001, Hu et al. 2003). In 1996, the Swedish Council on Technology Assessment in Health Care estimated the expenses associated with urinary incontinence to 2.8-4.4 billion SKR; indirect expenses (e.g. sick-leave) were not included, nor were expenses for treating infections related to urinary incontinence. The majority of the expenses (90%) were related to elderly care and supplies for dealing with

65
urinary incontinence; the rest (10%) of the expenses were related to investigations and different medical treatments (SBU 2000). The total cost of incontinence aids in Sweden was estimated to 925 million SKR in 1999 (Samuelsson et al. 2001).
Quality of Life Our results make clear that urge incontinence, stress incontinence and “other” incontinence cause a high level of distress, even if the symptoms do not occur very often (Paper II). Urge incontinence, stress incontinence and “other” incontinence were the only symptoms that affected all the evaluated dimensions measured by the SF-36 questionnaire (Paper III).
In order to improve the situation for the men it is also important to assess symptoms with a mild symptom severity because it may have a great impact on the affected men. It is also important to consider the degree of distress caused by the symptoms and not only their frequency (Peters et al. 1997) The patients often focus on the impact on their quality of life and on the interruption of activities, whereas providers focus more on the functional impact (DuBeau et al. 1998). The main objective in the choice of treatment strategy is to ameliorate the symptoms and improve quality of life and to prevent severe complications for the individual (Djavan 2003, Madersbacher et al. 2004). The choice of treatment should provide rapid relief from the distress caused by the symptom and restore the quality of life (Djavan 2003).
We found that being affected by mild, moderate, severe “other” incontinence and urge incontinence appear to have a greater impact on low score for health than being affected by mild, moderate or severe stress incontinence (Paper IV).
The more distressful, non-preventable urge incontinence (Paper II) appears to have a greater impact on the quality of life than stress incontinence (Paper III). These results are consistent with the previous findings indicating that urge incontinence has a greater impact on quality of life than stress incontinence (Lenderking et al. 1996, Shaw 2001, Coyne et al. 2003). It is reasonable to assume that stress incontinence is less distressful due to its preventability. The experience of distress has shown to be a related to beliefs of reactions from other people (Gannon et al. 2005). In order to ensure other people do not become aware of the symptoms men with stress incontinence can adjust their activities and take control of their symptoms. The affected person adjusts his activities in a positive way, without affecting his quality of life. The adjustment of activities is confirmed by Andersson et al. (2004a) who reported that 10% of the men and women with urinary incontinence refrained from social activities and 8% of the respondents gave

66
up gymnastics and sports activities because of urinary incontinence. It is, however, unclear how this action affected the quality of life.
On the other hand, the more distressful, non-preventable urge incontinence can appear suddenly in any situation. The affected person has no opportunity to adjust his activities, so the symptom leaves the person with a feeling of an upcoming negative event, “a small disaster” that can be very distressful. The adjustments of activities may also explain why men with moderate/severe stress incontinence reported less body pain compared with men with mild stress incontinence (Paper III). Maybe men who experience pain of an intensity that influences their daily activities adjust by excluding activities often associated with stress incontinence, such as jumping or heavy lifting, thereby avoiding the symptom.
Weak stream of any degree correlated significantly to a lower level of self-assessed health and happiness, as well as to a higher level of self-assessed sadness (Paper IV). Changes in the urinary stream usually occur gradually and are not experienced as distressful until a certain level of the symptom has been reached. Almost half of the men with reported “weak” urinary stream experienced no distress whereas all men with “very weak” or “dribbling” urinary stream experienced distress (Paper II). A reduced mean SF-36 score in all evaluated dimensions was also seen in men with “very weak” or “dribbling” compared with men with “weak” urinary stream (Paper III). A possible explanation for this “sudden” increase of distress and reduction in quality of life may be an awareness or fear of a potentially malignant disease (Tsang, Garraway 1993, Brown et al. 2003, Gannon et al.2004, Holden et al. 2005). Weak stream could therefore be an important symptom to mention and pedagogically discuss with the patient.
In our study, half of the men need to void one or twice during the night (Paper II-III). The frequencies of nocturia given in this study are similar to those reported elsewhere (Koskimäki et al. 1998, Kay et al. 1999, Sladden et al. 2000, Liew et al 2006). Koskimäki et al. have discussed if nocturia once during the night may reflect a poor primary sleeping pattern or a habit without previous urinary pathology/condition (Koskimäki et al. 1998). It is possible that men are tempted to go to the bathroom when they are awake during the night. Also ICS discusses if some patients will be categorized as having nocturia although their real problem is related to sleep disturbance (van Kerrebroeck et al. 2002). Unfortunately, we have no information on whether the men have been awake for other reasons than micturition, but Asplund, Aberg (1992) found that most awakenings at night occur in association with micturition. Therefore, physicians should routinely ask if patients with sleep problems also have nocturia (van Dijk et al. 2004).

67
To wake up at least once per night to urinate decreases the mean SF-36 scores for physical functioning (PF), role physical (RP), vitality (VT) and general health (GH) (Paper III). Men with nocturia at least once a night had also a higher risk of a low score for health, a higher risk for a high score for sadness and a lower risk of a high score for happiness compared with men without nocturia (Paper IV).
This study supports the findings of a previous study (Haltbakk et al. 2005) that the number of voids during the night is decisive for the impact on the men’s quality of life. A majority of the men with nocturia once or twice per night were unaffected or only affected to a minor degree, but among the men who have to get up two or more times per night the distress was obvious (Paper II). The differences between nocturia once or twice per night and nocturia at least three times per night were also observed for all the eight SF-36 dimensions (Paper III).
A serious omission is that SF-36 questionnaire does not include questions on sleep behavior (Hunt 1993, Chapple et al. 2006, Chartier-Kastler, Tubaro 2006), so conclusions about this cannot be made. Today, the Nocturia Quality-of-life questionnaire (N-QOL) is available to measure the impact of nocturia on quality of life (Abraham et al. 2004).
Post micturition dribbling was the most common symptom reported by the men, but perceived distress from post micturition dribbling was surprisingly low (Paper II). One potential explanation may be that the distinction between different degrees of severity of this specific symptom is not well defined in the DAN-PSS questionnaire. This was confirmed by the findings that the association between symptom severity and degree of distress was differentiated (Paper II).
An increased symptom burden among men with moderate/severe symptoms negatively affects self-assessed health, happiness and sadness (Paper IV).
The prevalence of a low score for health continues to increase up to eight moderate/severe symptoms. There was no statistically significant difference between eight moderate/severe symptoms and more than eight, probably because only eight men reported more than eight moderate/severe symptoms. The prevalence of a high score for happiness decreased in the same way, with an increased symptom burden among the studied men with moderate/severe symptoms (Paper IV). Henningsohn et al. (2001) reported a correlation between the number of chronic symptoms after treatment for urinary bladder cancer and the self-assessed well-being. In another study based with the DAN-PSS questionnaire, Koskimäki et al. also reported reduced health with an increased LUTS score (Koskimäki et al. 2001). It was also clear that the score for sadness increased with increased moderate/severe symptom burden and that the risk of obtaining a high score for sadness was statistically higher among men who reported

68
moderate/severe symptoms from the lower urinary tract than among men with no/mild symptoms who did not (Paper IV).
According to World Health Organization’s report “Men Ageing and health”, depression is a common disorder in men over 65 years of age (WHO 2001). Depressions are more frequent among persons with urinary incontinence compared with persons without such symptoms (Stewart et al. 2003, Nuotio et al. 2003, Ko et al. 2005). The incidence of depression also increases after stroke and Alzheimer’s disease (WHO 2001). Lower urinary tract symptoms are also commonly associated with stroke and other neurological conditions (Borrie et al. 1986, Gray et al. 1995, Nakanishi et al. 1997, Brittain et al.1998). Unfortunately, our questionnaire does not include questions on the respondents’ possible other specific diseases, making analyses of possible confounding due to this factor impossible.

69
Conclusions – Remarks
The conclusions of the study:
One in every four men in the 40-80 age group reports urgency, stress incontinence or post micturition dribbling. One out of five men age 40-49 years reported post micturition dribbling. Most of the men with symptoms from the lower urinary tract are not known to the health service. The number of symptoms plays a decisive role in whether or not men seek help for their symptoms.
Urinary incontinence causes high a level of distress even to individuals who experience this symptom rarely. The majority of the men with symptoms from the lower urinary tract find the symptoms distressful. The distress scores increased as symptom scores increased.
Lower urinary tract symptoms have a negative impact on the quality of life, and different symptoms seem to have different impact on the men’s life. Storage symptoms seem to decrease the quality of life to a greater extent than voiding and post micturition symptoms.
The total burden of moderate/severe symptoms from the lower urinary tract is related to self-assessed health, sadness and happiness. Men who have symptoms from the lower urinary tract have a poorer quality of life compared with men who do not have these symptoms, and elderly men with lower urinary tract symptoms have a poorer quality of life in several dimensions than younger men.
70
Implications
To increase professional awareness of lower urinary tract symptoms in the general population to face the growing number of elderly in the population.
To inform the public and raise professional awareness that lower urinary tract symptom also occurs among relatively young people.
A standardized routine evaluation of lower urinary tract symptoms in the primary health care may bring about that symptoms that have not been discussed earlier will be recognized.
It is important to gather information about distress already at the first visit in primary health care for the future management of patients with symptoms from the lower urinary tract.
A focus on lower urinary tract symptoms that cause major distress, even if they only occur rarely, will influence the choice of treatment alternatives.
Identification of the impact of lower urinary tract symptoms is necessary to optimise the treatment in order to improve the patient’s quality of life.

71
Swedish summary
Symptom från de nedre urinvägarna (LUTS) klassificeras som: Lagringssymptom, vilket kännetecknas av trängningar, ökad miktion på
dagen respektive natten samt stress-, trängnings- och ”övrig” inkontinens. Tömningssymptom; vilket kännetecknas av svag stråle samt
startsvårigheter.Symptom efter avslutad miktion; vilket kännetecknas av efterdropp samt
ofullständig tömning av urinblåsan.
Syftet med denna avhandling är att kartlägga hur många män som uppger efterdropp, trängning eller stress inkontinens samt hur många män har sökt hjälp från sjukvården de senaste 12 månaderna för symptom från de nedre urinvägarna. Vidare beskriver avhandlingen hur stora besvär olika symptom från de nedre urinvägarna medför samt hur livskvalitén påverkas för de män som uppger symptom.
För kartläggning av hur många män som uppger efterdropp, trängning eller stressinkontinens tillfrågades samtliga män i åldern 40 - 80 år (n= 2571) boende i Surahammars kommun. Samtliga män erhöll en postenkät som skulle besvaras i hemmet och returneras. Enkäten besvarades av 2217 män.
Av de män som besvarade enkäten uppgav 536 män (24%) att de hade efterdropp, trängning eller stressinkontinens (antingen var för sig eller tillsammans). Det i särklass vanligaste symptomet var efterdropp, 21% av männen oberoende av ålder uppgav att de hade efterdropp. Motsvarande siffra för stressinkontinens var 2% och för trängning 6%. För symptomen: trängning och stress inkontinens steg förekomsten med åldern, och i den äldsta åldersgruppen 70-80 år uppgav 15% av männen trängning och 5% av männen stressinkontinens.
Fyra procent av de tillfrågade männen hade sökt hjälp hos sjukvården för sina symptom under de senaste 12 månaderna. Benägenheten att söka hjälp ökade med åldern och med antalet symptom som männen uppgav (Artikel I).
Tolv månader efter att männen besvarat enkäten med symptomen efterdropp, trängning eller stressinkontinens identifierades de män som uppgivit symptom (n=536). Trettio-två av dessa män hade antingen flyttat eller avlidit under denna 12 månaders period.

72
Till de resterande 504 männen samt till ytterligare 504 män bosatta i samma kommun men som tidigare inte uppgivit efterdropp, trängning eller stressinkontinens sändes en postenkät innehållande frågeformulären DAN-PSS och SF-36.
Frågeformuläret DAN-PSS innehåller 12 symptomfrågor samt 12 besvärsfrågor kopplat till varje specifikt symptom. Frågeformuläret SF-36 består av 36 frågor som bildar åtta dimensioner, fysisk funktion, rollfunktion-fysiska orsaker, rollfunktion-emotionella orsaker, social funktion, smärta, vitalitet, psykiskt välbefinnande samt allmän hälsa.
Av de 504 männen som tidigare uppgivit efterdropp, trängning eller stressinkontinens besvarade 387 män (77%) frågeformuläret DAN-PSS.
Åttio procent av dessa 387 män upplevde någon form av besvär av symptom från de nedre urinvägarna. De mest besvärande symptomen var relaterad till olika former av urininkontinens. Nio av tio män som uppgav att stress-, trängnings- eller ”övrig” inkontinens förekom sällan upplevde besvär relaterade till symptomen. Samtliga män som uppgav att de hade mycket svag eller droppande urinstråle och eller att de hade sveda vid vattenkastning besvärades av detta (Artikel II).
Sjuhundrafyrtioåtta män av de 1008 män som tillfrågades besvarade frågeformulären DAN-PSS och SF-36.
Trängnings inkontinens, stress inkontinens och ”övrig” inkontinens är de symptom som orsakar störst sänkning av livskvalitén mätt med frågeformuläret SF-36. För samtliga av de åtta dimensionerna förekom en lägre livskvalités poäng för de män som uppgav trängnings-, stress- eller ”övrig” inkontinens jämfört med de män utan symptom.
Yngre män (40-65 år) med symptom från de nedre urinvägarna upplevde en bättre livskvalité i jämförelse med äldre män (66-80 år) med samma symptom.
Män som uppgav att de urinerade tre gånger eller mer under en natt upplevde sämre livskvalité (i samtliga åtta dimensioner) i jämförelse med män som uppgav att de urinerade en till två gånger under en natt (Artikel III).
Symptom från de nedre urinvägarna påverkade den allmänna hälsan. Trettionio procent av männen som uppgav minst ett av de 12 symptomen i frågeformuläret DAN-PSS upplevde låg allmän hälsa, motsvarande siffra för män utan symptom var 18 %. Den upplevda allmänna hälsan sjunker när antalet symptom ökar. Av de män som uppgav 1-4 symptom upplevde 34% av männen låg allmän hälsa. Motsvarande siffra för 5-8 symptom samt över 9 symptom uppgick till 67% respektive 75%.
73
Totalt upplevde 19% av männen att de var dystra och ledsna hela tiden eller delar av tiden. Upplevelsen av att känna sig dyster och ledsen tilltog när antalet symptom ökade. Av de män som uppgav 1-4 symptom upplevde 12% av männen att de kände sig dystra och ledsna: Motsvarande siffra för män med 5-8 symptom uppgick till 43%. Någon ytterligare ökning av att känna sig dyster och ledsen framgick inte bland männen som uppgav 9-12 symptom. Femtio procent av samtliga män upplevde att de var glada och lycklig hela tiden eller delar av tiden. Män utan symptom från de nedre urinvägarna var gladare och lyckligare än män med symptom. Bland männen utan symptom upplevde 64% att de var glada och lyckliga medan 17% av männen med 9-12 symptom upplevde att de var glada och lyckliga (Artikel IV).
Slutsatserna av studierna visar att var fjärde man i åldern 40 till 80 år har efterdropp, stressinkontinens eller trängningar. Trots att många män uppger symptom från de nedre urinvägarna så söker de inte hjälp från sjukvården för sina symptom. Antalet symptom som männen uppger avgör om de söker hjälp. De flesta män med symptom upplever symptomen som besvärande. Besvären från symptomen ökar när svårighetsgraden av symptomen tilltar. För urininkontinens förekommer stora besvär även när symptomen förekommer sällan. Livskvalitén är försämrad hos män med symptom från de nedre urinvägarna och män med symptom är mindre glada och lyckliga och uppskattar sin allmänna hälsa som sämre jämfört med män utan symptom.
Förhoppningen med avhandlingen är att öka förståelsen både hos allmänheten men även bland vårdpersonal om att symptom från de nedre urinvägarna är vanligt förekommande hos män och då framförallt hos de yngre männen. En ökad förståelse kan innebära att vårdpersonalen frågar männen som de kommer i kontakt med om de har symptom från de nedre urinvägarna men även hur stora besvär symptomen medför. Kunskap om männens upplevelse av symptomen samt hur symptomen påverkar livskvalitén är avgörande för vilken behandling som ska erbjudas.

74
Acknowledgments
I would like to express my sincere gratitude to all colleagues and friends who encouraged me to undertake, continue and finish this project. I would like to express my gratitude to all those who helped me:
First I wish to thank all the men for their participation, which made this project possible
Jerzy Leppert, my main-supervisor, for introducing me to this project and for his constant flow of ideas and interest and never failing support in all these years.
Marie-Louise Walker-Engström, co-supervisor, for her statistical help and for her never-ending enthusiasm and support when I needed it the most.
Lars Henningsohn, co-supervisor, for his constructive advice and for his optimistic attitude and exceptional knowledge of the lower urinary tract symptoms.
Gunnar Steineck, co-author, for scientific teaching and enthusiastic support.
Lars Lööf, co-author, for generous advice and valuable comments.
Henny Olsson, for bringing me into the field of scientific research and for introducing me to Professor Jerzy Leppert.
Erik Onelöv, for his pedagogic explanations and for always being available for consultations.
John Öhrvink, for advice regarding the statistical analyses.
Peter Hedberg for library help.
All my colleagues at the Department of Caring and Public Health Sciences, Mälardalens University for all their support and a pleasant working environment. Special thanks to Margareta Asp, Ingegerd Fagerberg and
75
Ingela Rådestad for their scientific discussions and interest in this work and to Per Andersson for friendship and encouragement during the project.
Lesley Shaps, and Jeanette Klinger, for linguistic revisions of the English manuscript.
The County of Västmanland, for providing financial support for this project.
The Department of Caring and Public Health Sciences, Mälardalens University, for giving me the opportunity to undertake my education at the Department of Public Health and Caring Sciences, Uppsala University.
Finally, I want to thank my husband Roger for love and for understanding my interest in research, and my son Albin who at the age of 2 understood the difference between post micturition dribbling and urge incontinence.

76
References
Abdel-fattah M, Barrington JW, Youssef M. The standard 1-hour pad test: Does it have any value in clinical practice? Eur Urol 2004;46:377-380.
Abraham L, Hareendran A, Mills IW, Martin ML, Abrams P, Drake MJ, MacDonagh RP, Noble JG. Development and validation of a quality-of-life measure for men with nocturia. Urology 2004;63(3):481-486.
Abrams P. New words for old: lower urinary tract symptoms for “prostatism”. BMJ1994;308:929-930.
Abrams P, Blaivas JG, Stanton S, Andersen JT. The standardisation of terminology of lower urinary tract function. Produced by the International Continence Society Committee on Standardisation of Terminology. World J Urol1989;6:233-245.
Abrams P, Cardozo L, Fall M, Griffiths D, Rosier P, Ulmsten U, van Kerrebroeck P, Victor A, Wein A. The Standardisation of terminology of lower urinary tract function: Report from the Standardisation Sub-committee of international Continence Society. Neurourol Urodyn 2002;21:167-178.
Abrams P, Cardozo L, Fall M, Griffiths D, Rosier P, Ulmsten U, van Kerrebroeck P, Victor A, Wein A. The Standardisation of terminology of lower urinary tract function: Report from the Standardisation Sub-committee of international Continence Society. Urology 2003;61:37-49.
Agency for Health Care Policy and Research: Benign Prostatic Hyperplasia: Diagnosis and treatment. Rockvill, Maryland, U.S. Department of Health and Human Services, 1994.
Andersson G, Johansson JE, Garpenholt O, Nilsson K. Urinary incontinence—prevalence, impact on daily living and desire for treatment. Scand J Urol Nephrol 2004;38:125-130a.
Andersson G, Johansson JE, Sahlber-Blom E, Pettersson N, Nilsson K. Urinary incontinence- why refraining from treatment? A population based study Scand J Urol Nephrol 2005;39:301-307.
Andersson S-O, Rashidkhani B, Karlberg L, Wolk A, Johansson J-E. Prevalence of lower urinary tract symptoms in men aged 45-79 years: a population-based study of 40 000 Swedish men. BJU Int 2004;94:327-331b.
Araki I, Kuno S. Assessment of voiding dysfunction in Parkinson´s disease by the international prostate symptom score. J Neurol Neurosurg Psychiatry 2000;68:429-433.
Asplund R, Aberg H. Health of the elderly with regard to sleep and nocturnal micturition. Scand J Prim Health Care 1992;10:98-104.
Barry MJ, Fowler FJ JR, O´Leary MP, Bruskewitz RC, Holtgrewe HL, Medbust WK, Cockett ATK and the measurement committee of the American Urological Association. The American Urological Association symptom index for Benign Prostatic Hyperplasia. J Urol 1992;148:1549-1575.
Barry MJ. Evaluation of symptoms and quality of life in men with benign Prostatic hyperplasia. Urology 2001;58(6 suppl 1):25-32.

77
Bates P, Bradley WE, Glen E, Griffiths D, Melchior H, Rowan D, Sterling A, Zinner N, Hald T. The standardization of terminology of lower urinary tract function. J Urol. 1979 May;121(5):551-4.
Beier-Holgersen R, Brunn J. Voiding pattern of men 60 to 70 years old: Population study in an urban population. J Urol 1990;143:531-532.
Berges RR, Pientka L, Hofner K, Senge T Jonas U. Male lower urinary tract symptoms and related health care seeking in Germany. Eur Urol 2001;39:682-687.
Bergner M, Bobbitt RA, Carter WB, Gilson BS. The Sickness Impact Profile: development and final revision of a health state measure. Med Care1981;19(8):787-805.
Bertaccini A, Vassallo F, Ferdinando M, Luzzi L, Rossetti SR, Di Silverio F, Comunale L. Symptoms, bothersomeness and quality of life in patients with LUTS suggestive of BPH. Eur Urol 2001;40(suppl 1):13-18.
Borgen MA, Hvarfwen E, Fridlund B. Urinary incontinence among 65-years old Swedish population: medical history and psychosocial consequences. Vard Nord Utveckl Forsk 1997;17(3):21-24.
Borrie MJ, Campbell AJ, Caradoc-DaviesTH, Spears GFS. Urinary incontinence after stroke a prospective study. Age and Ageing 1986;15:177-181.
Bortolotti A, Bernardini B, Colli E, Di Benedetto P, Giocoli Nacci G, Landoni M, Lavezzari M, Pagliarulo A, Salvatore S, von Heland M, Parazzini F, Artibani W. Prevalence and risk factors for urinary incontinence in Italy. Eur Urol2000;37(1):30-35.
Bosch JL, Hop WC, Kirkels WJ, Schroder FH. Natural history of benign prostatic hyperplasia: Appropriate case definition and estimation of its prevalence in the community. Urology 1995;46(3 suppl A):34-40.
Boyarsky S, Jones G, Paulson DF, Prount GR, Jr. New look at bladder neck obstruction by the Food and Drug Administration regulators: guidelines for investigation of benign prostatic hypertrophy. Trans Am Assoc Genitourin. Surg1977;68:29-32.
Boyle P, Robertson C, Mazzetta C, Keech M, Hobbs FD, Fourcade R, Kiemeney L, Lee C; UrEpik Study Group. The prevalence of male urinary incontinence in four centres: The UPEPIK Study. BJU Int 2003;92:943-947.
Branch LG, Walker LA, Wetle TT, DuBeau CE, Resnick NM. Urinary Incontinence knowledge among community-dwelling People 65 years of age and older. J Am Geriatr Soc 1994;42:1257-1262.
Brasso K, Stigsby B, Pilsgard B, Nordling J. Precision of a patient-weighted symptom score in prostatism. The DAN-PSS-1 questionnaire. Scand J Urol Nephrol 1994;28(1):71-75.
Brazier JE, Harper R, Jones NMB, O´Cathain A, Thomas KJ, Usherwood T, Westlake L. Validating the SF-36 health survey questionnaire: new outcome measure for primary care. BMJ 1992;305:160-164.
Brittain KR, Peet SM, Castleden CM. Stroke and incontinence. Stroke 1998;29:524-528.
Brocklehurst JC. Urinary incontinence in the community—analysis of a MORIpoll. BMJ 1993;27:832-834.
Brooker, C. (1996). Human Structure and Function (2nd ed.). London: Mosby. Brown C.T, O´Flynn E, van der Meulen J, Newman S, Mundy A.R, Emberton M.
The fear of prostate cancer in men with lower urinary tract symptoms: should symptomatic men be screened? BJU Int 2003;91:30-32.
Campbell B. High rate of prostate symptoms among Ariaal men from Northen Kenya. Prostate 2005;62:83-90.

78
Chapple CR, Batista JE, Berges R, Chartier-Kastler E, Tubaro A, van Kerrebroeck, Stoevelaar H. The impact of nocturia in patient with LUTS/BPH: Need for new recommendations. Eur Urol Suppl 2006; 5:12-18.
Chartier-Kastler E, Tubaro A. The measurement of nocturia and its impact on quality of sleep and quality of life in LUTS/BPH. Eur Urol Suppl 2006;5:3-11.
Cheater FM, Castleden CM. Epidemiology and classification of urinary incontinence. Baillieres Best Pract Res Clin Obstet Gynaecol 2000;14(2):183-205.
Chute CG, Panser LA, Girman CJ, Oesterling JE, Guess HA, Jacobsen SJ, Lieber MM. The prevalence of prostatism: A population-based survey of urinary symptoms. J Urol 1993;150(1):85-89.
Cockett ATK, Khoury S, Aso Y, Chatelain C, Denis L, Griffiths K, Murphy G. Proceedings of the First International Consultation on Benign Prostatic Hyperplasia. Jersey: Scientific Communication International Ltd. 1991.
Cockett ATK, Khoury S, Aso Y, Chatelain C, Denis L, Griffiths K, Murphy G. Proceedings of the Second WHO International Consultation on Benign Prostatic Hyperplasia. Jersey: Scientific Communication International Ltd. 1993a.
Cockett ATK, Khoury S, Aso Y Chatelain C, Denis L, Griffiths K, Murphy G. Proceedings of the Third WHO International Consultation on BPH. Jersy: Scientific Communication International Ltd. 1993b.
Coyne KS, Zhou Z, Thompson C, Versi E. The impact on health-related quality of life of stress, urge and mixed urinary incontinence. BJU Int 2003;92:731-735.
Djavan B. Lower urinary tract symptoms/benign prostatic hyperplasia: fast control of the patient’s quality of life. Urology 2003;62(3 suppl 1):6-14.
Donovan JL, Peters TJ, Abrams P, Brookes ST, de la Rosette JJ. Scoring the short form ICSmaleSF questionnaire. J Urol 2000;164(6):1948-1955.
DuBeau CE. The aging lower urinary tract. J Urol 2006;175(3Pt2):11-15. DuBeau CE, Levy B, Mangione CM, Resnick NM. The impact of urge urinary
incontinence on quality of life: Importance of patient’s perspective and explanatory style. J Am Geriatr Soc 1998;46:683-692.
Eckhardt MD, van Venrooij PM, van Melick HE, Boom TA. Prevalence and bothersomeness of lower urinay tract symptoms in benign prostatic hyperplasia and their impact on well-being. J Urol 2001;166:563-568.
Edlund, C., Fall, M., Peeker, R. (2006). Funktionella störningar av nedre urinvägarna. I J-E. Damber, R. Peeker. (Red.), Urologi (s 275-302). Lund: Studentlitteratur.
Ekelund P, Grimby A, Milsom I. Urinary incontinence: Social and financial costs high. BMJ 1993;306:1344. Comment on BMJ 1993;306(6881):832-834.
Gades NM, Jacobson DJ, Girman CJ, Roberts RO, Lieber MM, Jacobsen SJ. Prevalence of conditions potentially associated with lower urinary tract symptoms in men. BJU Int 2005;95:549-553.
Gannon K, Glover L, O´Neill M, Emberton M. Lower urinary tract symptoms in men: self-perceptions and the concept of bother. BJU Int 2005;96:823-827.
Gannon K, Glover L, O´Neill M, Emberton M. Men and chronic illness: A qualitative study of LUTS. J Health Psychol 2004;9(3):411-420.
Garraway WM, Collins GN, Lee RJ. High prevalence of benign prostatic hypertroph in the community. Lancet 1991;338:469-471.
Garraway WM, Russell EB, Lee RJ, Collins GN, Mckelvie GB, Hehir M, Rogers CAN, Simpson RJ. Impact of previously unrecognized benign prostatic hyperplasia on the daily activities of middle-age and elderly men. Br J Gen Pract 1993 Aug;43(373):318-321.

79
Gertliffe, K., & Dolman, M. (2003). Normal and abnormal bladder function. In K. Gertliffe, M. Dolman (Red.), Promoting Continence (pp. 21-51). Edingburg, UK: Elsevier Science Ltd.
Glover L, Gannon K, McLoughlin J, Emberton M. Men’s experiences of having lower urinary tract symptoms: factors relating to bother. BJU Int 2004;94:563-567.
Gourova LW, van de Beek C, Spigt MG, Nieman FH, van Kerrebroeck PE. Predictive factors for nocturia in elderly men: a cross-sectional study in 21 general practices. BJU Int 2006;97(3):528-532.
Gray, M. I. (2000). Physiology of voiding. In D. B. Doughty (Red.), Urinary & Fecal Incontinence (2nd ed.) (pp. 1-28). St. Lousi, USA. Mosby.
Gray R, Stern G, Malone-Lee J. Lower urinary tract dysfunction in Parkinson´s disease: changes relate to age and not disease. Age and Ageing 1995;24:499-504.
Haidinger G, Madersbacher S, Waldhoer T, Lunglmayr G, Vutuc C. The prevalence of lower urinary tract symptoms in Austrian males and associations with sociodemographic variables. Eur J Epidemiol 1999;15(8):717-722.
Haidinger G, Temml C, Schatzl G, Brössner C, Roehlich M, Schmidbauer C.P, Madersbacher S, Prostate Study Group of the Austrian Society of Urology. Risk factors for lower urinary tract symptoms in elderly men. Eur Urol 2000;37:413-420.
Hald T, Nordling J, Andresen JT, Blide T, Meyhoff H, Walter S. A patient weighted symptom score system in the evaluation of uncomplicated benign prostatic hyperplasia. Scand J Urol Nephrol Suppl 1991;138:59-62.
Haltbakk J,Hanestad BR, Hunskaar S. Relevance and variability of the severity of incontinence, and increased day and night-time voiding frequency, associated with quality of life in men with lower urinary tract symptoms. BJU Int2005;96:83-87.
Hansen B J, Mortensen S, Mensink HJ, Flyger H, Riehmann M, Hendolin N, Nordling j, Hald T. Comparison of the Danish Prostatic Symptom Score With the International Prostatic Symptom Score, the Madsen-Iversen and Boyarsky symptom indexes. ALFECH Study Group. Br J Urol 1998;81(1):36-41.
Hansen BJ, Flyger H, Brasso K, Schou J, Nordling J, Andersen JT, Mortensen S, Meyhoff HH, Walter S, Hald T. Validation of the self-administered Danish Prostate Symptom Score (DAN-PSS-1) system for use in benign prostatic hyperplasia. Br J Urol 1995;76:451-458.
Hansen BJ, Flyger HL, Brasso K, Schou J, Nordling J, Andersen JT, Mortensen SO, Meyhoff HH, Walter S, Hald T. Validation of the patient-administered Danish Prostate Symptom Score Schedule. Ugeskr Laeger 1997 Jan 27;159(5):591-597.
Hayes Engelberg, S.J., McDowell, B.J., Lovell, A. (2000). Urinary function. In A.G. Lueckenotte (Red.), Gerontologic Nursing. (pp 586-614). St.Louis, USA: Mosby.
Heath, T., & Watson, R. (2003). Mostly men. In K. Gertliffe, M. Dolman (Red.), Promoting Continence (pp 81-106). Edingburg, UK: Elsevier Science Ltd.
Hellström L, Ekelund P, Milsom I, Mellström D. The prevalence of urinary incontinence and use of incontinence aids in 85-year-old men and women. Age Ageing 1990;19:383-389.
Henningsohn L, Wijkström H, Dickman P, Bergman K Steineck G. Distressful symptoms after radical cystectomy with urinary diversion for urinary bladder cancer: A Swedish population-based study. Eur Urol 2001;40:151-162.
80
Holden CA, McLachlan RI, Pitts M, Cumming R, Wittert G, Agius Pa, Handelsman DJ, de Kretser DM. Men in Australia Telephone Survey (MATeS): a national survey of the reproductive health and concerns of middle-aged and older Australian men. Lancet 2005;366:218-224.
Homma Y, Yamaguchi O, Hayashi K and The members of the neurogenic bladder society committee. An epidemiological survey of overactive bladder symptoms in Japan. BJU Int 2005;96:1314-1318.
Hu T-W, Wagner TH, Bentkover JD, Lebblanc K, Piancentini A, Stewart WF, Steve Z Zhou RC, Hunt TL. Estimated economic costs of overactive bladder in the United States. Urology 2003;61:1123-1128.
Hughes A, Sladden M, Hirst GHL, Ward J. Community study of uncomplicated lower urinary tract symptoms among male Italien immigrants in Sydney, Australia. Eur Urol 2000;37:191-198.
Hunskaar S. One hundred and fifty men with urinary incontinence. II. Help seeking and self care. Scand J Prim Health Care 1992;10:21-25.
Hunt S, McKenna S. Measuring patient’s views of their health. BMJ 1993;307: 125. Hunt SM, McEwen J, McKenna SP. Measuring health status: a new tool for
clinicians and epidemiologists. J R Coll Gen Pract 1985;35:185-188. Hunt SM, McKenna SP, McEwen J, Williams J, Papp E. The Nottinghem health
profile: subjective health status and medical consultations. Soc Sci Med 1981; 15A:221-229.
Hunter D J W, Berra-Unamuno A, Martin-Gordo A. Prevalence of urinary symptoms and other urological conditions in Spanish men 50 years old or older. J Urol 1996;155:1965-1970.
Hunter DJ, McKee M, Black NA, Sanderson CF. Health status and quality of life of British men with lower urinary tract symptoms: results from the SF-36. Urology1995;45(6):962-971.
Hunter DJW, McKee CM, Black NA, Sanderson CFB. Urinary symptoms: prevalence and severity in British men aged 55 and over. J Epidemiol Community Health 1994;48:569-575.
Hägglund D, Olsson H, Leppert J. Urinary incontinence: an unexpected large problem among younger females. Results from a population-based study. Fam Pract 1999;16:506-509.
Häkkinen J, Koskimäki J, Huhtala TL, Hakaman M, Auvinen A. Changes in prevalence of urinary symptoms in Finnish men—a population-based 5-year follow-up study. Scand J Urol Nephrol 2004;38:378-84.
IQOLA www.iqola.org/instruments.aspxIrwin DE, Milsom I, Kopp Z, Abrams P, Cardozo L. Impact of overactive bladder
symptoms on employment, social interactions and emotional well-being in six European countries. BJU Int 2006;97(1):96-100.
Jolleys JV, Donavan JL, Nanchahal K, Peters TJ, Abrams P. Urinary symptoms in the community: how bothersome are they? Br J Urol 1994;74:551-555.
Joseph MA, Harlow SD, Wei JT, Sarma AV, Dunn RL, Taylor JM, James SA, Cooney KA, Doerr KM, Montie JE, Schottenfeld D. Risk factors for lower urinary tract symptoms in a population-based sample of African-American men. Am J Epidemiol 2003;157:906-914.
Kay L, Stigsby B, Brasso K, Mortensen SO, Munkgaard S. Lower urinary tract symptoms—a population survey using the Danish Prostatic Symptom Score (DAN-PSS) questionnaire. Scand J Urol Nephro 1999;33(2):94-99.
Kirby M. A review of the role of primary care in the diagnosis and management of stress urinary incontinence. Health Serv J 2004;16:144(5923):suppl 1:3-7.

81
Ko Y, Lin S-J, Salmon W, Bron MS. The impact of urinary incontinence on quality of life of the elderly. Am J Manag Care 2005;11:103-111.
Koskimäki J, Hakama M, Huhtala H, Tammela TL. Is reduced quality of life in men with lower urinary tract symptoms due to concomitant diseases? Eur Urol2001;40(6):661-665.
Koskimäki J, Hakama M, Huhtala H, Tammela TL. Prevalence of lower urinary tract symptoms in Finnish men: population-based study. Br J Urol1998;81(3):364-369a.
Koskimäki J, Hakama M, Huhtala H, Tammela TLJ. Association of smoking with lower urinary tract symptoms. J Urol 1998;159:1580-1582b.
Koskimäki J, Streng T, Santti R, Lahdes-Vasama T, Nilsson A, Tammela TLJ. Correlation of Danish Prostatic Symptom Score and International Prostate Symptom Score among men aged 33-54. ICS 2000 Conference in Tampere.
Lagace EA, Hansen W, Hickner JM. Prevalence and severity of urinary incontinence in ambulatory adults: an UPRNet study. J Fam Pract 1993;36:610-614.
Larsson U, Karlsson J, Sullivan M, Impact of overweight and obesity on health-related quality of life-a Swedish population study. Int J Obes 2002;26:417-424.
Lee E, Yoo K-Y, Kim Y, Shin Y, Lee C. Prevalence of Lower Urinary Tract Symptoms in Korean Men in a Community-Based Study. Eur Urol 1998;33:17-21.
Lemack GE, Dewey RB, Roehrborn CG, O´Suilleabhain PE, Zimmern PE. Questionaire-based assessment of bladder dysfunction in patients with mild to moderate Parkinson´s disease. Urology 2000;56:250-254.
Lenderking WR, Nackley JF, Anderson RB, Testa MA. A review of the quality-of-life aspects of urinary urge incontinence. Pharmacoeconomics 1996;9(1):11-23.
Liew LC, Tiong HY, Wong ML, Png DC, Tan JK. A population study of nocturia in Singapore. BJU Int 2006;97:109-112.
Li MK, Garcia LA, Rosen R. Lower urinary tract symptoms and male sexual dysfunction in Asia: a survey of ageing men from five Asian Countries. BJU Int 2005;96:1339-1354.
Logie J, Clifford GM, Farmer RD.T. Incidence, prevalence and management of lower urinary tract symptoms in men in the UK. BJU Int 2005;95:557-562.
MacFarlane GJ, Sagnier PP, Richard F, Teillac P, Botto H, Boyle P. Determinants of treatment-seeking behavior for urinary symptoms in older men. Br J Urol1995;76:714-718.
Madersbacher S, Alivizatos G, Nordling J, Sanz CR, Emberton M, de la Rosette JJ. EAU 2004 guidelines on assessment, therapy and follow-up of men with lower urinary tract symptoms suggestive of benign prostatic obstruction (BPH guidelines). EurUrol 2004;46:547-554.
Madersbacher S, Haidinger G, Temml C, Schmidbauer CP. Prevalence of lower urinary tract symptoms in Austria as assessed by an open survey of 2,096 men. EurUrol 1998;34:136-141.
Madsen PO, Iversen P. A point system for selecting operative candidates. In Hinman F Jr.editor, Benign Prostatic Hypertrophy. New York: Springer Verlag. 1983;763-765.
Malmsten UGH, Milsom I, Molander U, Norlén L J. Urinary incontinence and lower urinary tract symptoms. An epidemiological study of men aged 45 to 99 years. JUrol 1997;158:1733-1737.
Masumori N, Tanaka Y, Takahashi A, Itoh N, Ogura H, Furuya S, Tsukamoto T. Lower urinary tract symptoms of men seeking medical care-comparison of symptoms found in the clinical setting and in a community study. Urology2003;62:266-272.

82
McDonnell J, Busschbach JJV, Kok E, van Exel J, Stolk E, Koopmanschap M, Rutten FFH. Lower urinary tract symptoms Suggestive of benign prostatic obetruction- Triumph: health-economical analysis. Eur Urol 2001;39(suppl 3):37-41.
McGrother C.W, Donaldson M.M.K, Shaw C, Matthewes R.J, Hayward T.A, Dallosso H.M, Jagger C, Clarke M, Castleden C.M, MCR incontinence Study Team. Storage symproms of the bladder: prevalence, incidence and need for services in the UK. BJU Int 2003;93:763-769.
Milsom I, Abrams P, Cardozo L, Roberts RG, Thuroff J, Wein AJ. How widespread are the symptoms of an overactive bladder and how are they managed? A population-based prevalence study. BJU Int 2001;87(9):760-766.
Minassian V.A, Drutz H.P, Al-Badr A. Urinary incontinence as a worldwide problem. Int J Gynecol Obstet 2003;82:327-338.
Molander U, Sundh V, Steen B. Urinary incontinence and related symptoms in older men and women studied longitudinally between 70 and 97 years of age. A population study. Arch Gerontol Geriatr 2002;35:237-244.
Moorthy P, Lapitan MC, Quek PL, Lim PH. Prevalence of overactive bladder in Asian men: an epidemiological survey. BJU Int 2004;93:528-531.
Mozes B, Maor Y, Shmueli A. The competing effects of diseases states on quality of life of the elderly: the case of urinary symptoms in men. Qual Life Res1999;8(1-2):93-99.
Muscatello DJ, Rissel C, Szonyi G. Urinary symptoms and incontinence in an urban community: prevalence and associated factors in older men and women. Intern Med J 2001;31:151-160.
Nakanishi N, Tatara K, Naramura H, Fujiwara H, Takashima Y, Fukuda H. Urinary and fecal incontinence in a community-residing older population in Japan. J Am Geriatr Soc 1997 Feb;45(2):215-219.
Nordling J, Abrams P, Ameda K, Andersen T.J, Donovan J, Griffiths D, Kobayashi S, Koyanagi W, Schäfer W, Yalla S, Mattiasson A. Outcome measures for research in treatment af adult males with symptoms of lower urinary tract dysfunction. Neurourol Urodyn 1998;17:263-271.
Norman RW, Nickel JC, Fish D, Pickett SN. 'Prostate-related symptoms' in Canadian men 50 years of age or older: prevalence and relationships among symptoms. Br J Urol 1994;74(5):542-550.
Nuotio M, Jylha M, Luukkaala T, Tammela TL. Urinary incontinence in a Finnish population aged 70 and over. Prevalence of types, associated factors and self-reported treatments. Scand J Prim Health Care 2003;21:182-187.
Nørby B, Nordling J, Mortensen S. Lower urinary tract symptoms in the Danish population: a population-based study of symptom prevalence, health-care seeking behavior and prevalence of treatment in elderly males and females. Eur Urol 2005;47:817-823.
Okamura K, Takatoshi U, Katsushi N, Satoshi M, Eiji M. ”Quality of life” Assessment of urination in elderly Japanese men and women with some medical problems using International Prostate symptom score and King’s health questionnaire. Eur Urol 2002:41:411-419.
Perry S, Shaw C, Assassa P, Dallosso H, Williams K, Brittain KR, Mensah F, Smith N, Clarke M, Jagger C, Mayne C, Castleden CM, Jones J, McGrother C, Leicestershire MRC Incontinence Study Team. An epidemiological study to establish the prevalence of urinary symptoms and felt need in the community: the Leicestershire MRC Incontinence study. J Public Health Med2000;22(3):427-434.

83
Peters TJ, Donovan JL, Kay HE, Abrams P, de la Rosette JJ, Porru D, Thurroff JW. The international continence society ”Benign prostatic hyperplasia” Study: the bothersomeness of urinary symptoms. J Urol 1997;157(3):885-889.
Pinnock C, Marshall VR. Troublesome lower urinary tract symptoms in the community: a prevalence study. Med J Aust 1997;167:72-75.
Reilly, N. J. (2000). Assessment and management of acute or transient urinary incontinence In D. B. Doughty (Red.), Urinary & Fecal Incontinence. (2nd ed.). (pp. 47-61). St. Lousi, USA. Mosby.
Rekers H, Drogendijk A.C, Valkenburg H, Ribhagen F. Urinary incontinence in women from 35 to 79 years of age: prevalence and consequences. Eur J Obstet Gynecol Reprod Biol 1992;43:229-234.
Roberts RO, Jacobsen SJ, Rhodes T, Reilly WT, Girman CJ, Talley NJ, Lieber MM. Urinary incontinence in a community-based cohort: prevalence and healthcare-seeking. J Am Geriatr Soc 1998 Apr;46(4):467-472.
Rohrmann S, Crespo CJ, Weber JR, Smith E, Giovannucci E, Platz EA. Association of cigarette smoking, alcohol consumption and physical activity with lower urinary tract symptoms in older American men: findings from the third National Health And Nutrition Examination Survey. BJU Int 2005;96:77-82.
Sagnier PP, Girman CJ, Garraway M, Kumanoto Y, Lieber MM, Richard F, MacFarlane G, Guess HA, Jacobsen SJ, Tsukamota T, Boyle P. International comparison of the community prevalence of symptoms of prostatism in four countries. EurUrol 1996;29(1):15-20.
Sagnier PP, MacFarlane G, Richard F, Botto H, Teillac P, Boyle P. Results of an epidemiological survey using a modified American Urological Association Symptom index for benign prostatic hyperplasia in France. J Urol1994;151:1266-1270.
Samuelsson E, Månsson L, Milsom I. Incontinence aids in Sweden: users and costs. BJU Int 2001;88:893-898.
Samuelsson E, Victor A, Tibblin G. A population study of urinary incontinence and nocturia among women aged 20-59 years. Acta Obstet Gynecol Scand 1997;76:74-80.
SBU, Statens beredning för medicinsk utvärdering. The Swedish Council on Technology Assessment in Health Care. Behandling av urininkontinens. Rapport nr 143. Stockholm 2000.
Scarpa RM. Lower Urinary Tract Symptoms: What Are the Implications for the Patients? EurUrol 2001;40(suppl 1):12-20.
Seim A, Hoyo C, Østbye T, Vatten L. The prevalence and correlates of urinary tract symptoms in Norwegian men: The HUNT study. BJU Int 2005;96:88-92.
Shaw C. A review of the psychosocial predictors of help-seeking behaviour and impact on quality of life in people with urinary incontinence. J Clin Nurs 2001 Jan;10(1):15-24.
Shvartzman P, Tandeter H, Peleg A, Tabenkin H, Sasson N, Borkan J. Lower urinary tract symptoms in primary care-a multicenter community-based study in Israel. Isr Med Assoc J 2001 Jul;3(7):497-500.
Sladden MJ, Hughes AM, Hirst GH, Ward JE. A community study of lower urinary tract symptoms in older men in Sydney, Australia. Aust N Z J Surg2000;70:322-328.
SPSS Inc. 233.S Wacker Drive 11th floor Chicago, Illinois 60606. Steineck G, Ahlbom A. A definition of bias founded on the concept of the study
base. Epidemiology 1992;3:477-482.

84
Steineck G, Bergmark K, Henningsohn L, al-Abany M, Dickman P, Helgason A. Symptom documentation in cancer survivors as a basis for therapy modifications. Acta Oncol 2002;41(3):244-252.
Stenzelius K, Mattiasson A, Rahm-Hallberg I, Westergren A. Symptom of urinary and faecal incontinence among men and women 75+ in relation to health complaints and quality of life. Neurourol Urodyn 2004;23:211-222.
Stewart WF, van Rooyen JB, Cundiff GW, Abrams P, Herzog AR, Corey R, Hunt TL, Wein AJ. Prevalence and burden of overactive bladder in the United States. World J Urol 2003;20:327-336.
Sullivan M, Karlsson J, Ware J E. 1994. SF-36 Hälsoenkät. Svensk manual och tolkningsguide. (SF 36 Health survey. Swedish manual and interpretation guide). Gothenburg: Sahlgrenska University Hospital.
Sullivan M, Karlsson J. The Swedish SF-36 health survey III. Evaluation of criterion-based validity: Results from normative population. J Clin Epidemiol1998;51(11):1105-1113.
Symonds T. A review of condition-specific instruments to assess the impact of urinary incontinence on health-related quality of life. EurUrol 2003;43(3):219-225.
Teillac P. Relief of BPO or improvement in quality of life? Eur Urol 1998;34:3-9. Temml C, Brössner C, Schatzl G, Ponholzer A, Knoepp L, Madersbacher S, Prostate
Study Group of the Austrian Society of Urology. The natural history of lower urinary tract symptoms over five years. Eur Urol 2003;43(4):374-380.
Temml C, Haidinger G, Schmidbauer J, Schatzl G, Madersbacher S. Urinary incontinence in both sexes: Prevalence rates and impact on quality of life and sexual life. Neurourol Urodyn 2000;19:259-271.
Temml C, Heidler S, Ponholzer A, Madersbacher S. Prevalence of the overactive bladder syndrome by applying the International Continence Society Definition. Eur Urol 2005;48:622-627.
Teunissen D, van Weel C, Lagro-Janssen T. Urinary incontinence in older people living in the community: examining help-seeking behaviour. Br J Gen Pract2005;55:776-782.
Teunissen TAM, van den Bosch WJHM, van den Hoogen HJM, Largo-Lanssen ALM. Prevalence of urinary, fecal and double incontinence in the elderly living at home. Int Urogynecol J 2004 Jan-Feb;15(1):10-13.
Thom D. Variation in estimates of urinary incontinence prevalence in community: effects of differences in definition, population characteristics, and study type. JAm Geriatr Soc 1998 Apr;46(4):473-480.
Tikkinen KA, Tammela TL, Huhtala H, Auvinen A. Is nocturia equally common among men and women? A population based study in Finland. J Urol 2006; 175(2):596-600.
Treagust J, Morkane T, Speakman M. Estimating a population´s needs for treatment of lower urinary tract symptoms in men: what is the extent of unmet need? JPublic Health Med 2001 Jun;23(2):141-147.
Trueman P, Hood SC, Nayak US, Mrazek MF. Prevalence of lower urinary tract symptoms and self-reported diagnosed “benign prostatic hyperplasia” and their effect on quality of life in a community-based survey of men in the UK. BJU Int1999 Mar;83(4):410-415.
Tsang KK, Garraway WM. Impact of benign prostatic hyperplasia on well-being of men. Prostate 1993;23(1):1-7.

85
Tsukamoto T, Kumamoto Y, Masumori N, Miyake H, Rhodes T, Girman CJ, Guess HA, Jacobsen SJ, Lieber MM. Prevalence of prostatism in Japanese men in a community-based study with comparison to a similar American study. J Urol1995 Aug;154(2 Pt1):391-395.
Tubaro A, La Vecchia C, Uroscreening Study Group. The relation of lower urinary tract symptoms with life-style factors and objective measures of benign prostatic enlargement and obstruction: An Italian Survey. Eur Urol 2004;45:767-772.
TuncayAki F, Aygun C, Bilir N, Erkan I, Ozen H. Prevalence of lower urinary tract symptoms in a community-survey of men in Turkey. Int J Urol 2003;10(7):364-370.
Wagner TH, Hu T-W. Economic costs of urinary incontinence in 1995. Urology 1998;51:355-361.
van Dijk L, Kooij DG, Schellevis FG, Kaptein AA, Boon TA, Wooning M. Nocturia: Impact on quality of life in a Dutch adult population. BJU Int2004;93:1001-1004.
van Kerrebroeck P, Abrams P, Chaikin D, Donovan J, Fonda D, Jackson S, Jennum P, Johnson T, Lose GR, Mattiasson A, Robertson GL, Weiss J, International Continence Society. The standardization of terminology in nocturia: Report from the standardization subcommittee in the International Continence Society. BJU Int 2002;90(Suppl.3):11-15.
Ware JE Jr, Snow KK, Kosinski M, Gandek B. SF-36 Health Survey. Manual and interpretation guide. Boston: The Health institute, New England Medical Center, 1993.
Ware JE, Sherbourne CD. The MOS 36-item short form health survey (SF-36). Med Care 1992;30(6):473-483.
Welch G, Weinger K, Barry M.J. Quality-of-life impact of lower urinary tract symptoms: results from the health professionals follow-up study. Urology2002;59:245-250.
Winge K, Friberg L, Werdelin L, Nielsen KK, Stimple H. Relationship between nigrostriatal dopaminergic degeneration, urinary symptoms, and bladder control in Parkinson´s disease. Eur J Neurol 2005;12:842-850.
Witjes WP, de la Rosette JJ, Donovan JL, Peters TJ, Abrams P, Kay HE, Höfner K, Kinn A-C, Walter S, The international Continence Society “Benign Prostatic Hyperplasia” study group. The international Continence Society “Benign Prostatic Hyperplasia” study: International differences in lower urinary tract symptoms and related bother. J Urol 1997 Apr;157(4):1295-1300.
Wolfs GGM C, Knottnerus JA, Janknegt RA. Prevalence and detection of micturition problems among 2734 elderly men. J Urol 1994;152:1467-1470.
Wolters R, Wensing M, van Weel C, van der Wilt GJ, Grol RP. Lower urinary tract symptoms: Social influence is more important than symptoms in seeking medical care. BJU Int 2002;90:655-661.
World Health Organization. 2001. Men Ageing and health. Achieving health across the life span. World Health Organization (WHO).
World Health Organization. WHO definition of health, 7 April 1948. http://who.int/about/definition 2005-06-30.


Appendix


89
International Continence Society definition of LUTS
Storage symptoms are experienced during the storage phase of the bladder.
Increased daytime frequency is the complaint by the patient who considers that he/she voids too often by day.
Nocturia is the complaint that the individual has to wake at night one or more times to void.
Urgency is the complaint of a sudden compelling desire to pass urine which is difficult to defer.
Urinary incontinence is the complaint of any involuntary leakage of urine.
Stress urinary incontinence is the complaint of involuntary leakage on effort or exertion, or on sneezing or coughing.
Urge urinary incontinence is the complaint of involuntary leakage accompanied by or immediately preceded by urgency. Urge incontinence can present in different symptomatic forms; for example, as frequent small losses between micturitions or as a catastrophic leak with complete bladder emptying.
Voiding symptoms are experienced during the voiding phase.
Weak stream is reported by the individual as his or her perception of reduced urine flow, usually compared to previous performance or in comparison to others.
Hesitancy is the term used when an individual describes difficulty in initiating micturition resulting in a delay in the onset of voiding after the individual is ready to pass urine.
Straining to void describes the muscular effort used to initiate, maintain or improve the urinary stream.
Post micturition symptoms are experienced immediately after micturition.
Feeling of incomplete emptying is a self-explanatory term for a feelingexperienced by the individual after passing urine.
Post micturition dribble is the term used when an individual describes the involuntary loss of urine immediately after he has finished passing urine, usually after leaving the toilet in men.

90
Frågeformulär 1
1. Ålder.............................år.
2. Förvärvsarbetar Du Ja Nej 3. Motionerar Du? (inomhus/utomhus minst 2 ggr/vecka) Ja Nej
4. Röker Du? Ja Nej
5. Har Du senaste året haft urinvägsinfektion/er Ja Nej
6a. Har Du under 1996 haft svårigheter med vattenkastning? Ja Nej
6b. Om Ja på fråga 6a har Du sökt läkare för Dina vattenkastnings svårigheter? Ja Nej
7. Har Du efterdropp efter Du varit på toaletten? Ja Nej
8. Har Du svårigheter med att hinna till toaletten i tid
för att kasta vatten? Ja Nej
9. Har Du för närvarande besvär med ofrivilligt urinläckage? (tex. när du lyfter, hostar, hoppar, skrattar, nyser) Ja Nej
Egna kommentarer:...................................................... ......................................................................................... ......................................................................................... .........................................................................................

91
DAN-PSS frågeformulär
1a Måste Du vänta på att urinstrålen kommer igång? Nej, aldrig Sällan Ofta Alltid
1b Om Du måste vänta på att urinstrålen kommer igång, hur stort obehag är detta för dig?
Inget obehag Lite obehagligt Måttligt obehagligt Mycket obehagligt
2a Tycker Du att urinstrålen är: Normal Lite svag Mycket svag Droppande
2b Om urinstrålen är svag, hur stort obehag är detta för dig? Inget obehag Lite obehagligt Måttligt obehagligt Mycket obehagligt
3a Känner Du att blåsan töms helt när Du kastar vatten? Ja, alltid Ofta Sällan
Aldrig

92
3b Om Du känner att blåsan inte töms helt när Du kastar vatten, hur stort obehag är detta för Dig?
Inget obehag Lite obehagligt Måttligt obehagligt
Mycket obehagligt
4a Måste Du trycka på för att sätta igång vattenkastningen och /eller för att hålla vattenkastningen igång?
Nej, aldrig Sällan Ofta Alltid
4b Om Du måste trycka på, hur stort obehag är detta för dig? Inget obehag Lite obehagligt Måttligt obehagligt Mycket obehagligt
5a Hur lång tid går det högst mellan varje gång Du kastar vatten, från att Du vaknar tills Du går till sängs?
Mer än 3 timmar 2-3 timmar 1-2 timmar Mindre än 1 timme
5b Om Du måste kasta vatten ofta, hur stort obehag är detta för Dig? Inget obehag Lite obehagligt Måttligt obehagligt Mycket obehagligt

93
6a Hur många gånger måste Du kasta vatten om natten? 0 gånger 1-2 gånger 3-4 gånger 5 gånger eller fler
6b Om Du måste kasta vatten om natten, hur stort obehag är detta för Dig?
Inget obehag Lite obehagligt Måttligt obehagligt
Mycket obehagligt
7a Upplever Du en tvingande (stark) urinträngning? Nej, aldrig Sällan Ofta Alltid
7b Om Du har tvingande (stark) urinträngning, hur stort obehag är detta för Dig?
Inget obehag Lite obehagligt Måttligt obehagligt Mycket obehagligt
8a Är urinträngningen så kraftig, att Du inte kan hålla urinen tills Du når toaletten?
Nej, aldrig Sällan Ofta Alltid

94
8b Om urinen kommer innan Du når toaletten, hur stort obehag är detta för Dig?
Inget obehag Lite obehagligt Måttligt obehagligt Mycket obehagligt
9a Gör det ont eller svider när Du kastar vatten? Nej, aldrig Sällan Ofta Alltid
9b Om det gör ont eller svider när Du kastar vatten, hur stort obehag är detta för Dig?
Inget obehag Lite obehagligt Måttligt obehagligt Mycket obehagligt
10a Droppar det urin när Du tror att Du kastat vatten färdigt (efterdropp)? Nej, aldrig I toaletten Lite i kalsongerna Mycket i kalsongerna
10b Om det droppar urin när Du tror att Du kastat vatten färdigt, hur stort obehag är detta för Dig?
Inget obehag Lite obehagligt Måttligt obehagligt Mycket obehagligt

95
11a Får du ofrivillig urinavgång vid fysisk ansträngning (t.ex. hosta, nysning, lyft)?
Nej, aldrig Sällan Ofta Alltid
11b Om Du får ofrivillig urinavgång vid fysisk ansträngning, hur stort obehag är detta för Dig?
Inget obehag Lite obehagligt Måttligt obehagligt Mycket obehagligt
12a Får Du ofrivillig urinavgång utan fysisk ansträngning och utan trängning (sipprande)?
Nej, aldrig Sällan Ofta Alltid
12b Om urinen sipprar ut utan fysiskt ansträngning och utan trängning, hur stort obehag är detta för Dig?
Inget obehag Lite obehagligt Måttligt obehagligt
Mycket obehagligt

96
Hälsoenkät (SF-36)
Instruktion: Detta frågeformulär innehåller frågor om hu Du ser på Din hälsa. Informationen skall hjälpa till att följa hur Du mår och fungerar i Ditt dagliga liv. Besvara frågorna genom att sätta ett kryss i den ruta som Du tycker stämmer bäst in på Dig. Om Du är osäker, kryssa i den ruta som känns riktigast.
1. I allmänhet skulle du vilja säga att Din hälsa är.Utmärkt
Mycket god God Någorlunda Dålig
2. Jämför med för ett år sedan, hur skulle Du vilja bedöma Ditt allmänna hälsotillstånd nu?
Mycket bättre nu än för ett år sedan Något bättre nu än för ett år sedan Ungefär detsamma Något sämre nu än för ett år sedan
De följande frågorna handlar om aktiviteter som Du kan utföra under en vanlig dag.
3. Är Du på grund av Ditt hälsotillstånd begränsad i dessa aktiviteter nu?Om så är fallet, hur mycket?
Ja, mycket Ja, lite Nej, inte begränsad begränad alls begränsad
Ansträngande aktiviteter, som att
springa, lyfta tunga saker, delta i
ansträngande sporter
Måttligt ansträngande aktiviteter,
som att flytta ett bord, dammsuga,
skogspromenader eller
trädgårdsarbete

97
Lyfta eller bära matkassar Gå uppför flera trappor
Gå uppför en trappa
Böja dig eller gå ner på knä
Gå mer än två kilometer
Gå några hundra meter
Gå hundra meter
Bada eller klä på Dig
4. Under de senaste fyra veckorna, har Du haft något av följande problem i Ditt arbete eller med andra regelbundna dagliga aktiviteter som en följd av Ditt kroppsliga hälsotillstånd?
Ja Nej Skurit ned den tid Du normaltägnat åt arbete eller andra aktiviteter
Uträttat mindre än Du skulle önskat
Varit hindrad att utföra vissa arbetsuppgifter eller andra aktiviteter
Haft svårigheter att utföra Ditt arbete eller andra aktiviteter (t. ex. genom att det krävde extra ansträngning)

98
5. Under de senaste fyra veckorna, har Du haft något av följande pro- blem i ditt arbete eller med andra regelbundna dagliga aktiviteter som en följd av känslomässiga problem (som t.ex. nedstämdhet eller ängslan)?
Ja Nej Skurit ned den tid Du normalt ägnat
åt arbete eller andra aktiviteter
Uträttat mindre än Du skulle önskat Inte utfört arbete eller andra aktiviteter så noggrant som vanligt
Inte utfört arbete eller andra aktiviteter så noggrant som vanligt
6. Under de senaste fyra veckorna, i vilken utsträckning har ditt kropps liga hälsotillstånd eller Dina känslomässiga problem stört det vanliga umgänget med anhöriga, vänner, grannar eller andra?
Inte alls Lite Måttligt Mycket Väldigt mycket
7. Hur mycket värk eller smärta har Du haft under de senaste fyra veckorna?
Ingen Mycket lätt Lätt Måttlig Svår Mycket svår
8. Under de senaste fyra veckorna, hur mycket har värken eller smärtanstört ditt normala arbete (innefattar både arbete utanför hemmet och hushållssysslor)?
Inte alls Lite Måttligt Mycket Väldigt mycket

99
9. Frågorna här handlar om hur Du känner Dig och hur Du haft det under de senaste fyra veckorna. Ange för varje fråga det svarsalternativ som bäst beskriver hur Du känt Dig.
Hur stor del av tiden under de senaste fyra veckorna.
Hela Största En hel En del Lite av Inget tiden delen del av av tiden av av tiden av tiden tiden tiden tiden ..har Du känt Dig riktigt pigg och stark?
..har du känt Dig mycket nervös?
..har Du känt Dig så nedstämd att ingenting kunnat muntra upp Dig?
..har Du känt Dig lugn och harmonisk?
..har Du varit full av energi?
..har Du känt Dig dyster och ledsen?
..har Du känt Dig utsliten?
..har Du känt Dig glad och lycklig?
..har Du känt Dig trött?

100
10. Under de senaste fyra veckorna, hur stor del av tiden har Ditt kropps- liga hälsotillstånd eller Dina känslomässiga problem stört Dina möjligheter att umgås (t.ex. hälsa på släkt, vänner, etc.)?
Hela tiden Största delen av tiden En del av tiden Lite av tiden Inget av tiden
11. Välj det svarsalternativ som bäst beskriver hur mycket vart och ett av följande påståenden STÄMMER eller INTE STÄMMER in på Dig.
Stämmer Stämmer Osäker Stämmer Stämmer precis ganska bra inte särskilt inte alls bra Jag verkar ha lite lättare att bli sjuk än andra människor
Jag är lika frisk som vem som helst av dem jag känner
Jag tror min hälsa kommer att bli sämre
Min hälsa är utmärkt

101
Nedanstående information kommer att ligga till grund för beskrivning av hälsoprofiler i olika undergrupper.
12. Yrke/sysselsättning: 13. Utbildningsnivå: Förvärvsarbete Grundskola eller
motsvarande Ålderspensionär Gymnasial utbildning
Arbetslös Eftergymnasial utbildning
Sjukpensionär
14. Civilstånd: 15. Röker Du? Ensam/änkling Ja Gift/Sambo Nej
16. Motionerar Du? 17. Har Du senaste året haft urin- (inomhus/utomhus vägs infektion? minst 2ggr/vecka)
Ja Ja Nej Nej

Acta Universitatis UpsaliensisDigital Comprehensive Summaries of Uppsala Dissertationsfrom the Faculty of Medicine 156
Editor: The Dean of the Faculty of Medicine
A doctoral dissertation from the Faculty of Medicine, UppsalaUniversity, is usually a summary of a number of papers. A fewcopies of the complete dissertation are kept at major Swedishresearch libraries, while the summary alone is distributedinternationally through the series Digital ComprehensiveSummaries of Uppsala Dissertations from the Faculty ofMedicine. (Prior to January, 2005, the series was publishedunder the title “Comprehensive Summaries of UppsalaDissertations from the Faculty of Medicine”.)
Distribution: publications.uu.seurn:nbn:se:uu:diva-6931
ACTAUNIVERSITATISUPSALIENSISUPPSALA2006