Embed Size (px)
Citation preview
LSP 121
Normal Distributions
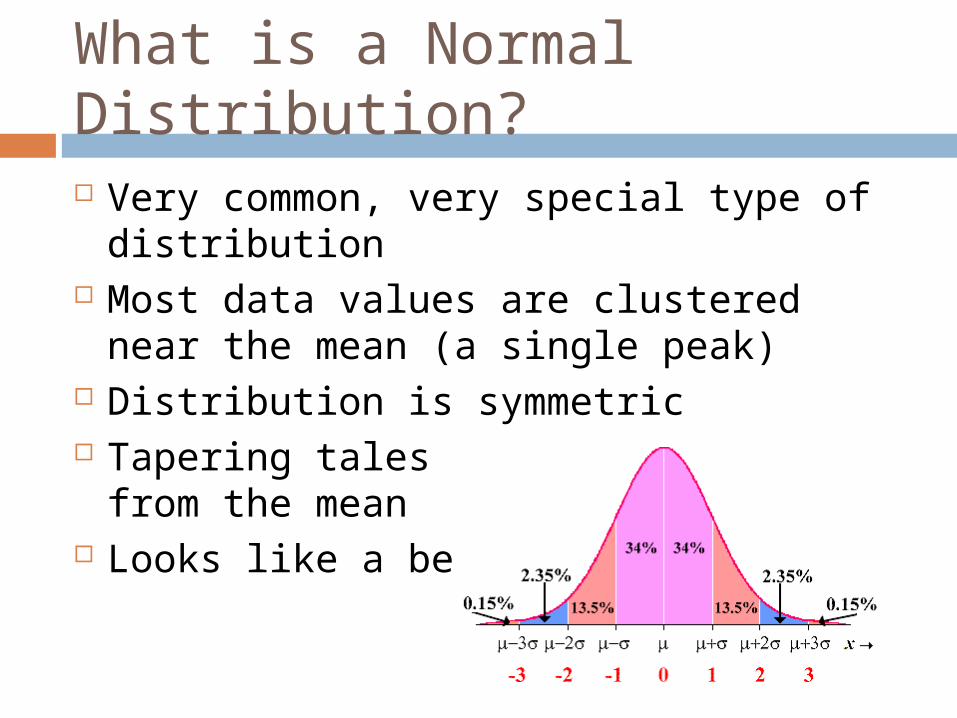
What is a Normal Distribution? Very common, very special type of
distribution Most data values are clustered near the
mean (a single peak) Distribution is symmetric Tapering tales as you move away from
the mean Looks like a bell curve
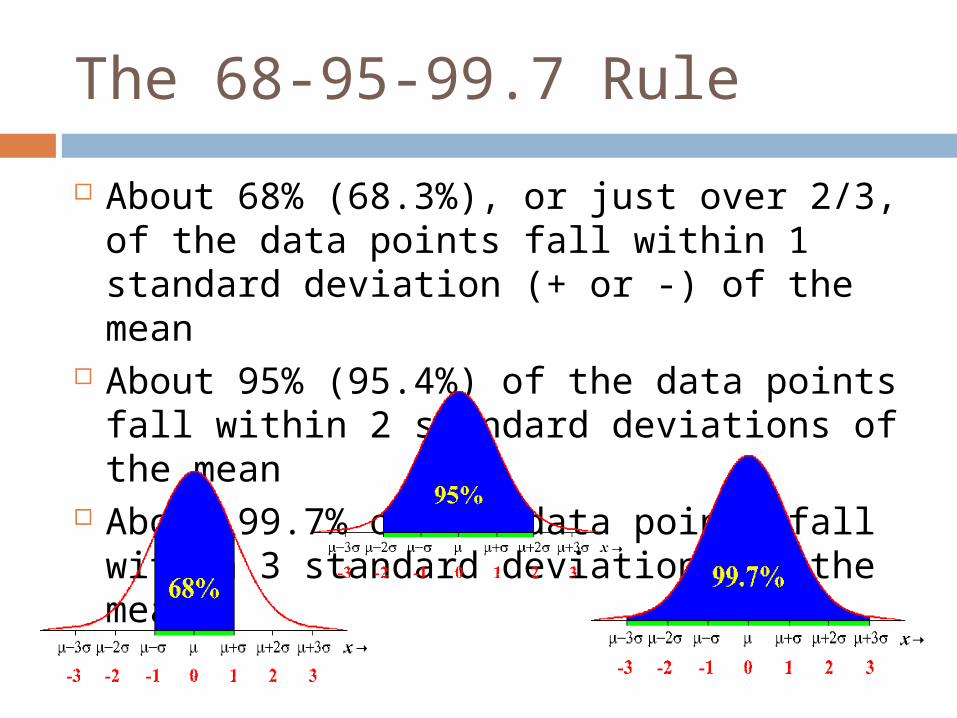
The 68-95-99.7 Rule
About 68% (68.3%), or just over 2/3, of the data points fall within 1 standard deviation (+ or -) of the mean
About 95% (95.4%) of the data points fall within 2 standard deviations of the mean
About 99.7% of the data points fall within 3 standard deviations of the mean
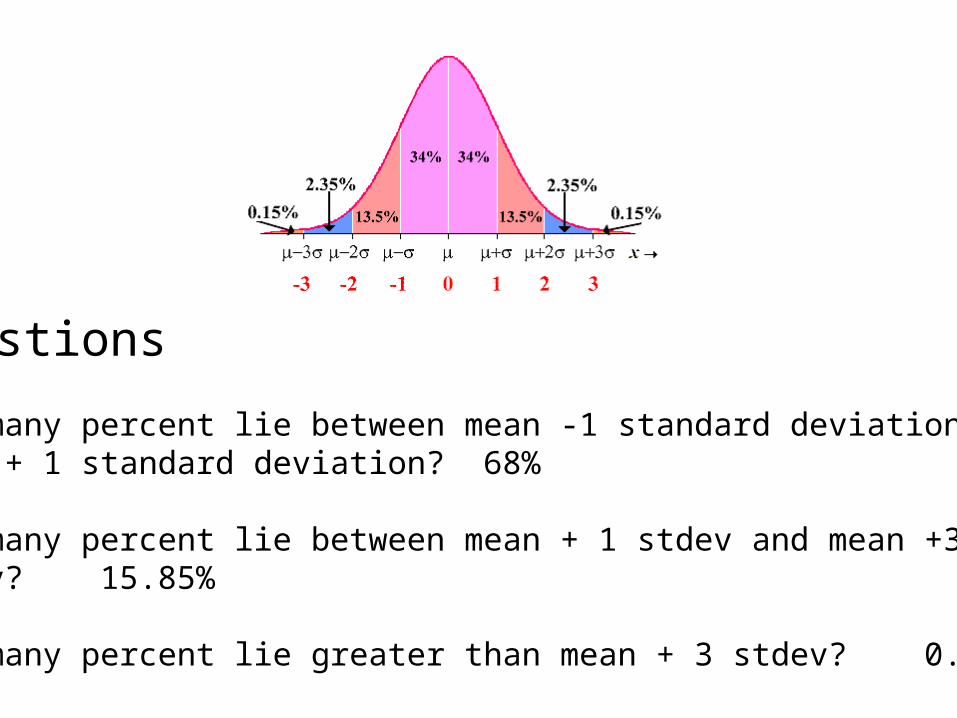
Questions
How many percent lie between mean -1 standard deviation and mean + 1 standard deviation? 68%
How many percent lie between mean + 1 stdev and mean +3 stdev? 15.85%
How many percent lie greater than mean + 3 stdev? 0.15%
Example SAT exams were designed to produce normal
distributions with a mean of 500 and a standard deviation of 100.
Thus, 68% of the students scored between 400 and 600
95% of the students scored between 300 and 700 99.7% scored between 200 and 800 What if someone scored 720 on the SAT? What
percentage of students scored less than or equal to 720? Use Excel’s NORMDIST function (see next slide) =NORMDIST(x, mean, stdev, true) For our problem: =NORMDIST(720, 500, 100, TRUE) Answer = 0.986097, or 98.6097%
What percentage scored greater than 720?
Normal Dstn and its Inverse
In Excel, the normal distribution function is given by NORMDIST and takes four arguments:NORMDIST(x,mean,SD,true),where x is a value, mean is the average of all values, SD is the standard deviation of all values, and true is a constant. NORMDIST returns the cumulative probability that a value is ≤ x.
In Excel, the inverse of the normal distribution function is given by NORMINV and it takes three arguments:NORMINV(p,mean,SD),where p is a probability, mean and SD are as before. NORMINV returns a value x, with the property that p% of the values are ≤ x.
Another Example
A survey finds that prices paid for two-year-old Ford Explorers are normally distributed with a mean of $16,500 and a standard deviation of $500. Consider a sample of 10,000 people who bought two-year-old Ford Explorers. How many people paid between $16,000 and
$17,000? =NORMDIST(16000,16500,500,true) yields 0.158655 =NORMDIST(17000, 16500, 500, true) yields
0.841345 Subtract: 0.841345 – 0.158655 yields 0.682689 Therefore, 0.682689*10000 or 6827 people paid
between $16000 and $17000.
Another Example
How many paid less than $16,000? =NORMDIST(16000, 16500, 500, true)
yields 0.158655, or 15.8655 % Or use the graph
What is another way of saying “What percentage of values are less than or equal to some value X?” (see next slide)
Percentiles
• The pth percentile of a data set is the smallest value, x, in the set with the property that at least p% of the data values are less than or equal x.
• In a normal distribution, a z score of 0 is the mean. At the mean, 50% (or 0.50) of all the values are less than or equal to the mean. The mean is the 50th percentile.
Example
Cholesterol levels in men 18 to 24 years of age are normally distributed with a mean of 178 and a standard deviation of 41. In what percentile is a man with a
cholesterol level of 190?
Using Excel’s Normal Distribution function:=NORMDIST(190,178,41,true) returns 0.61,
or 61st percentile
Standard Scores
The number of standard deviations a data value lies above or below the mean is called its Standard Score, or z-score, or simply z.
The standard score of the mean is z=0 The standard score of a data value 1.5
standard deviations above the mean is z=1.5
Standard Scores
The standard score of a data value 2.4 standard deviations below the mean is z = -2.4
In general:
z = (data value – mean) / standard deviation
Example
The Stanford-Binet IQ test is designed so that scores are normally distributed with a mean of 100 and a standard deviation of 16. What are the z-scores for IQ scores of 95 and 125?z = (95 - 100) / 16 = -0.31z = (125 - 100) / 16 = 1.56 Thus, an IQ score of
125 lies 1.56 standard deviations above the mean.
Inverse Normal Distribution Function What if you know the mean and standard
deviation of a set of data and you want to know a particular percentile, x?
We use Excel’s NORMINV For example, if a set of scores has a
mean of 76, a standard deviation of 12, what is the 66th percentile?
Answer: x = NORMINV(0.66,76,12) = 80.95