Embed Size (px)
DESCRIPTION
EPC deployment as overlayKey aspects for EPC deploymentNetwork deployment and topology
Citation preview
Soc Classification level 1 © Nokia Siemens Networks Presentation / Author / Date
LTE EPC Dimensioning
Soc Classification level 2 © Nokia Siemens Networks Presentation / Author / Date
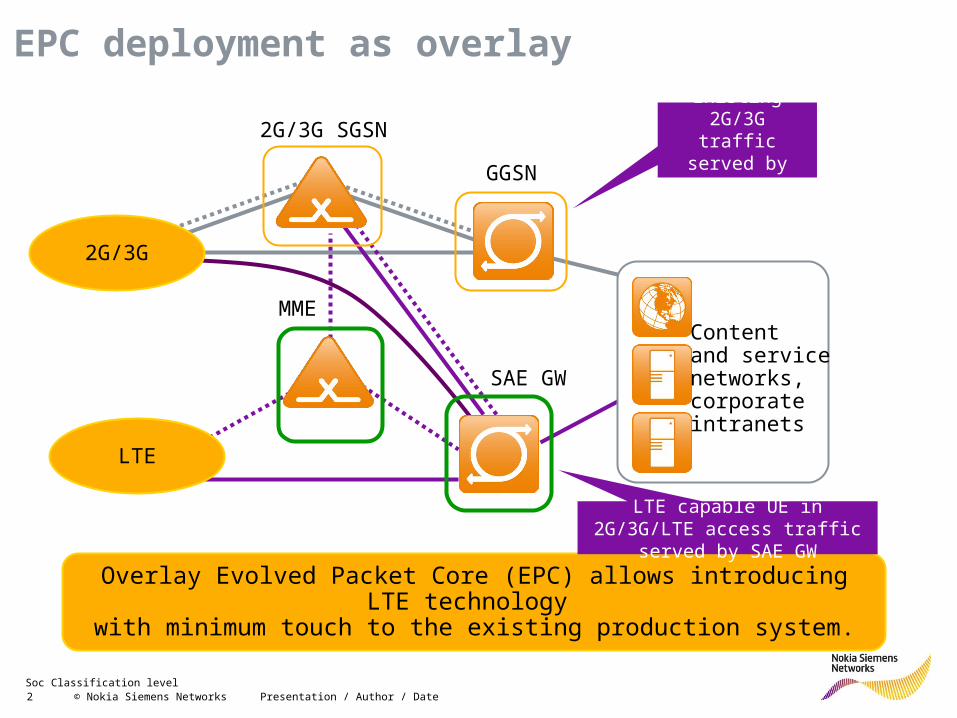
EPC deployment as overlay
LTE
2G/3G SGSN
GGSN
MME
SAE GW
Overlay Evolved Packet Core (EPC) allows introducing LTE technology with minimum touch to the existing production system.
Content and service networks,corporate intranets
2G/3G
Existing 2G/3G traffic served by
GGSN
LTE capable UE in 2G/3G/LTE access traffic served by SAE GW
Soc Classification level 3 © Nokia Siemens Networks Presentation / Author / Date
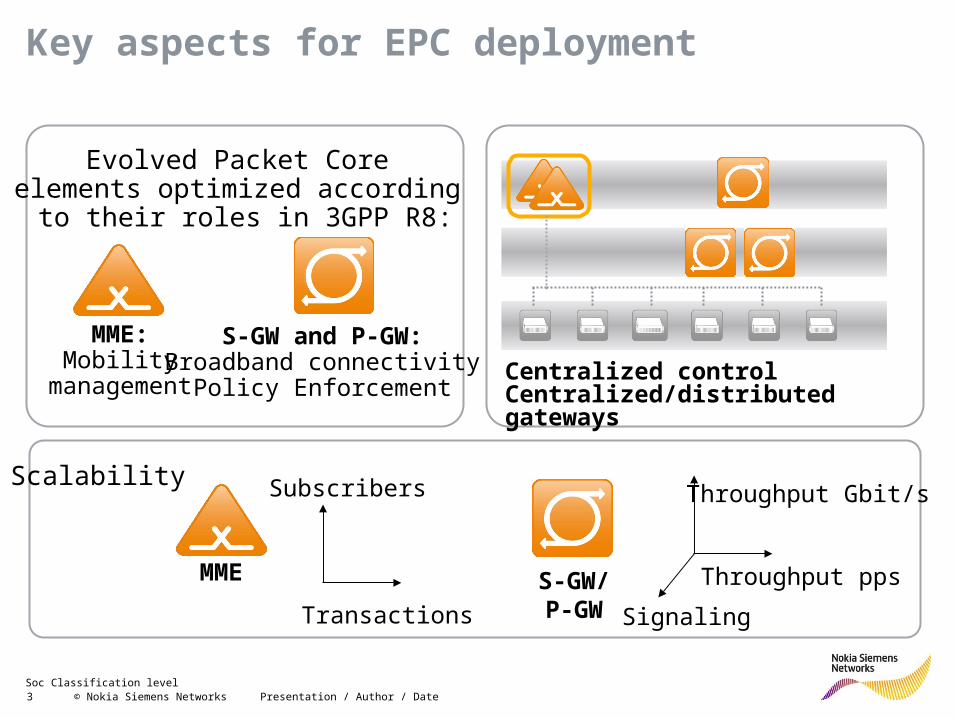
Key aspects for EPC deployment
Centralized controlCentralized/distributed gateways
Evolved Packet Core elements optimized according
to their roles in 3GPP R8:
MME:Mobility
management
S-GW and P-GW:Broadband connectivity
Policy Enforcement
Scalability
MME
Subscribers
Transactions
S-GW/P-GW
Throughput Gbit/s
Throughput pps
Signaling
Soc Classification level 4 © Nokia Siemens Networks Presentation / Author / Date
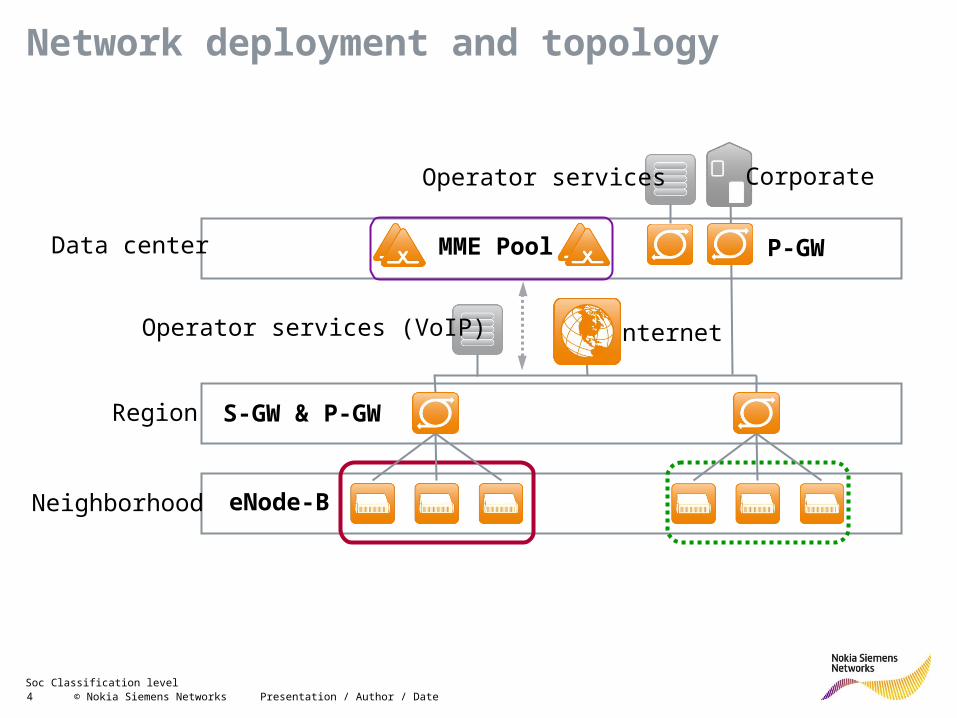
Network deployment and topology
Neighborhood eNode-B
Region S-GW & P-GW
P-GWMME Pool
Internet
CorporateOperator services
Operator services (VoIP)
Data center
Soc Classification level 5 © Nokia Siemens Networks
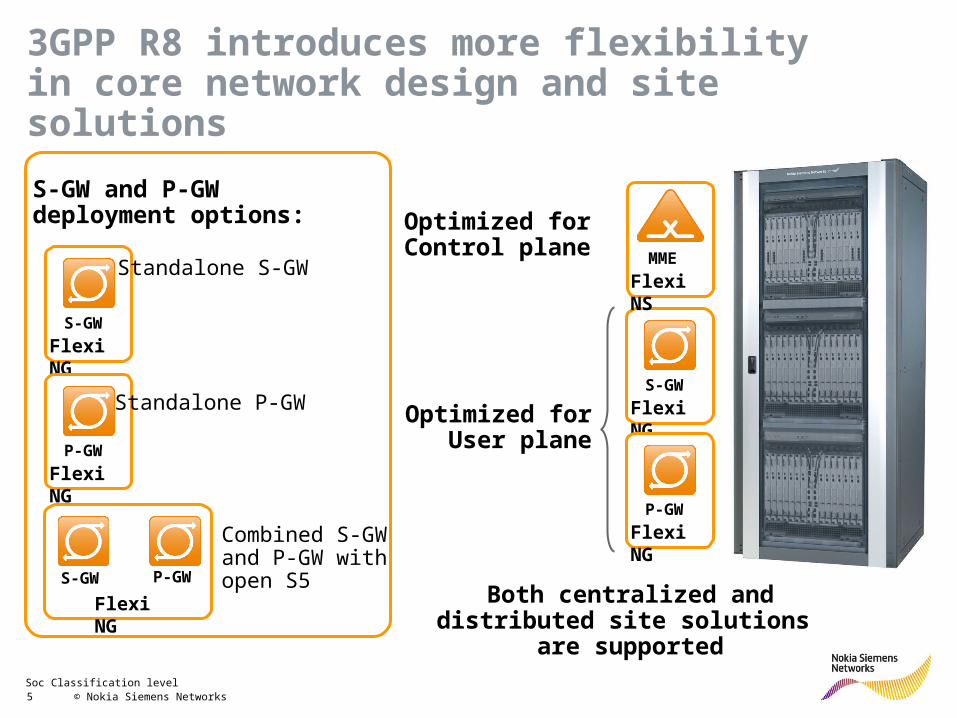
3GPP R8 introduces more flexibilityin core network design and site solutions
S-GW
Flexi NG
Standalone S-GW
P-GW
Flexi NG
Standalone P-GW
S-GW
Flexi NG
P-GW
Combined S-GW and P-GW with open S5
S-GW and P-GW deployment options:
S-GW
Flexi NG
P-GW
Flexi NG
MME
Flexi NS
Optimized forControl plane
Optimized forUser plane
Both centralized anddistributed site solutions
are supported
Soc Classification level 6 © Nokia Siemens Networks Presentation / Author / Date
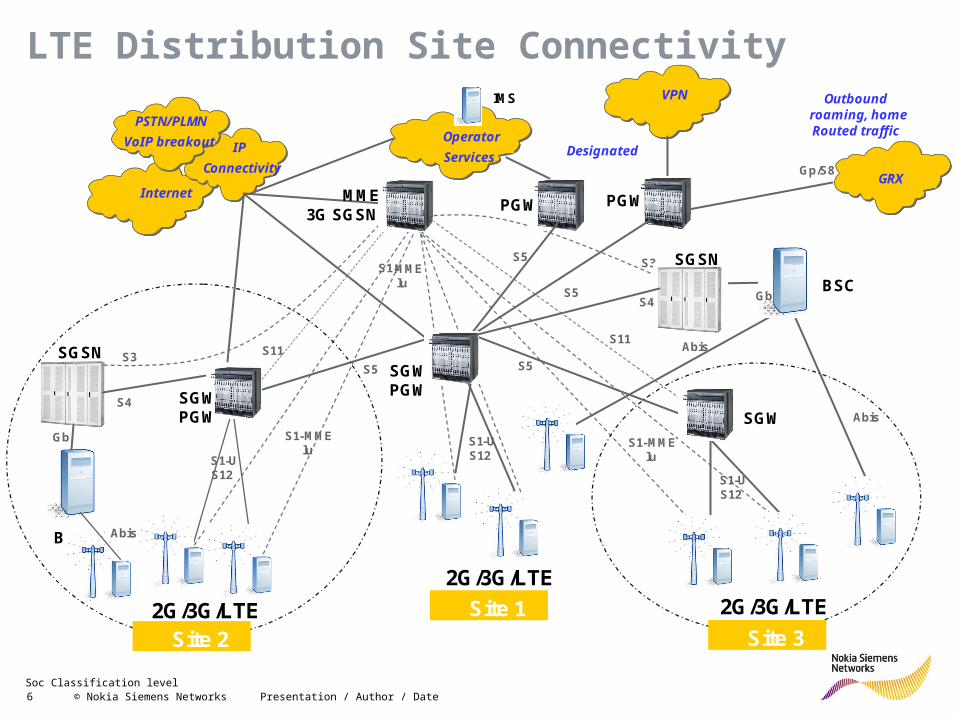
LTE Distribution Site Connectivity
3G SGSN
2G/3G/LTE
Internet
VPN
PGW
Operator
Services
IMS
BSC
SGSN
S1-US12
IP
ConnectivityDesignated
S1- MMElu
S3
Gb
S4
S5
PSTN/PLMN
VoIP breakout
GRX
Outbound roaming, home Routed traffic
Gp/S8
PGW
PGW
SGW
2G/3G/LTE
Site 3Site 2
Site 1
2G/3G/LTE
S3
SGSNS5
S5S5
S4 Gb
S1- MMElu
S1-US12
S1-MMElu
S1-US12
BSC
Abis
Abis
SGW
MME
AbisS11
SGWPGW
S11
Soc Classification level 7 © Nokia Siemens Networks Presentation / Author / Date
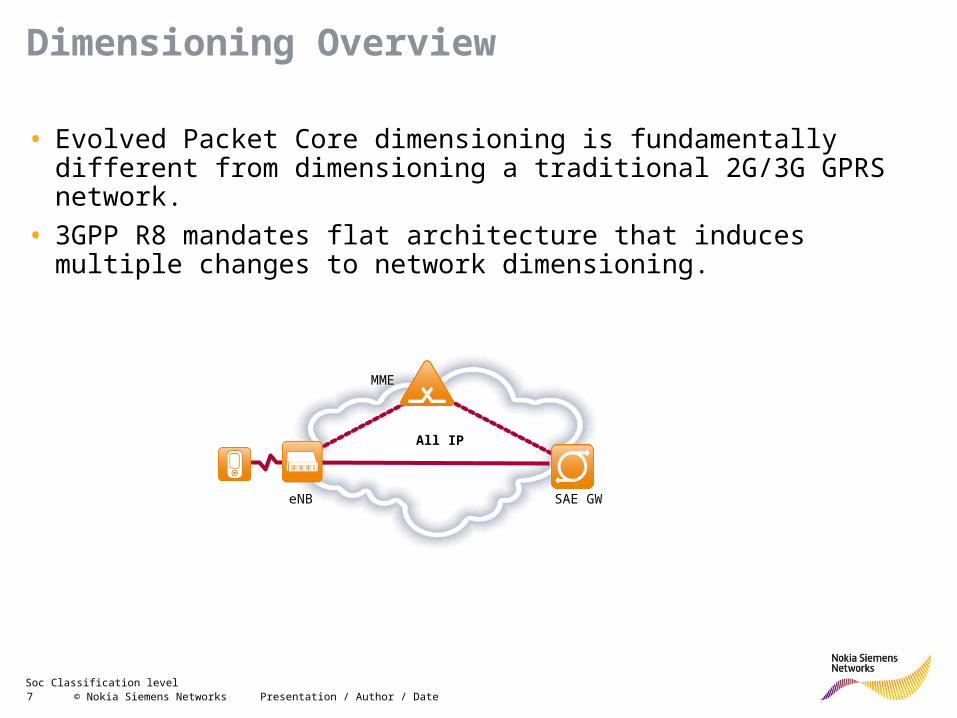
Dimensioning Overview
• Evolved Packet Core dimensioning is fundamentally different from dimensioning a traditional 2G/3G GPRS network.
• 3GPP R8 mandates flat architecture that induces multiple changes to network dimensioning.
SAE GW
All IP
eNB
MME
Soc Classification level 8 © Nokia Siemens Networks Presentation / Author / Date
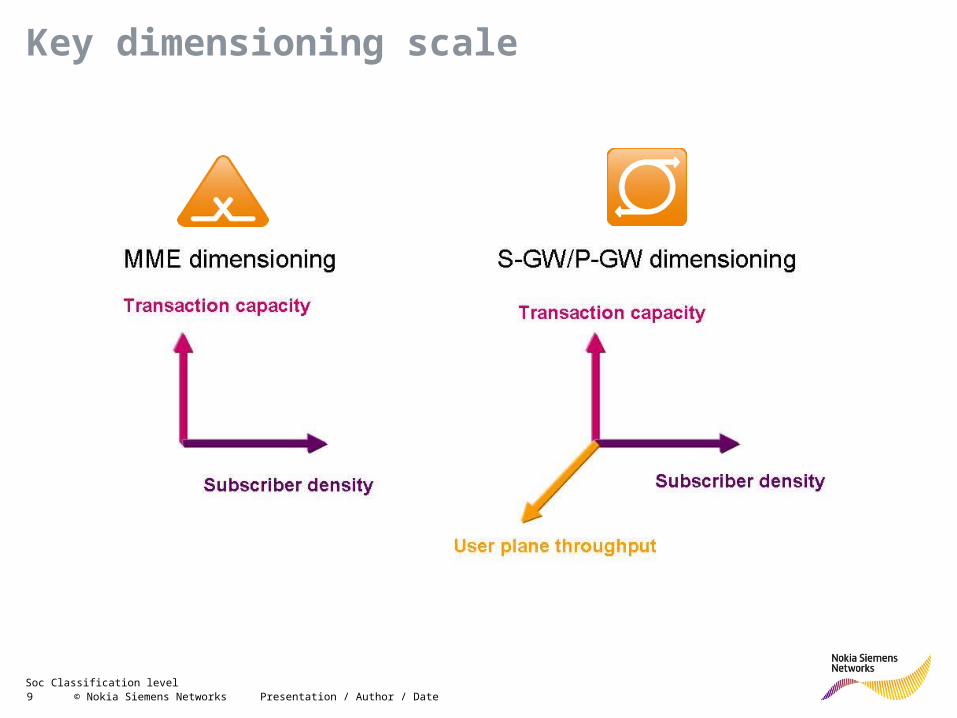
Key dimensioning parameters
• MME dimensioning is simplified as it is a pure control element dimensioned according to– Number of subscribers / bearers
– Transactions without user plane traffic burden
• Gateway dimensioning as user plane gateway elements able to optimally adapt to the changes in usage patterns and traffic load in network dimensioned according to– Throughput in Gbit/s to support non-real-time services and packets per
second to support real-time services
– Number of subscribers to allow high subscriber density
– Number of transactions per second to support subscriber mobility
Soc Classification level 9 © Nokia Siemens Networks Presentation / Author / Date
Key dimensioning scale
Soc Classification level 10 © Nokia Siemens Networks Presentation / Author / Date
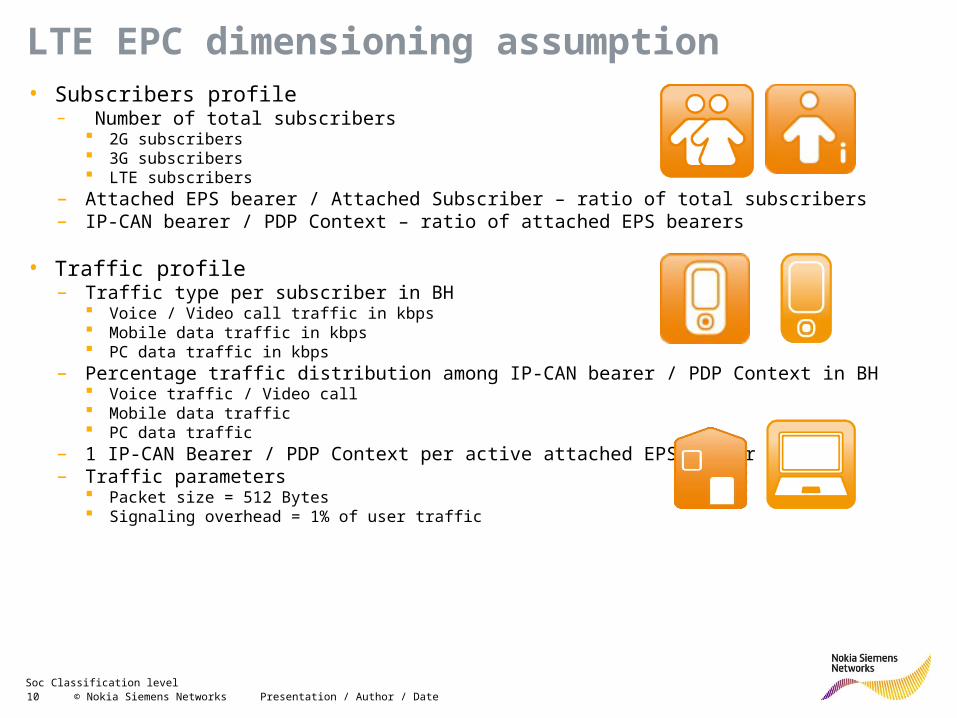
LTE EPC dimensioning assumption• Subscribers profile
– Number of total subscribers 2G subscribers 3G subscribers LTE subscribers
– Attached EPS bearer / Attached Subscriber – ratio of total subscribers– IP-CAN bearer / PDP Context – ratio of attached EPS bearers
• Traffic profile– Traffic type per subscriber in BH
Voice / Video call traffic in kbps Mobile data traffic in kbps PC data traffic in kbps
– Percentage traffic distribution among IP-CAN bearer / PDP Context in BH Voice traffic / Video call Mobile data traffic PC data traffic
– 1 IP-CAN Bearer / PDP Context per active attached EPS bearer– Traffic parameters
Packet size = 512 Bytes Signaling overhead = 1% of user traffic
Soc Classification level 11 © Nokia Siemens Networks Presentation / Author / Date
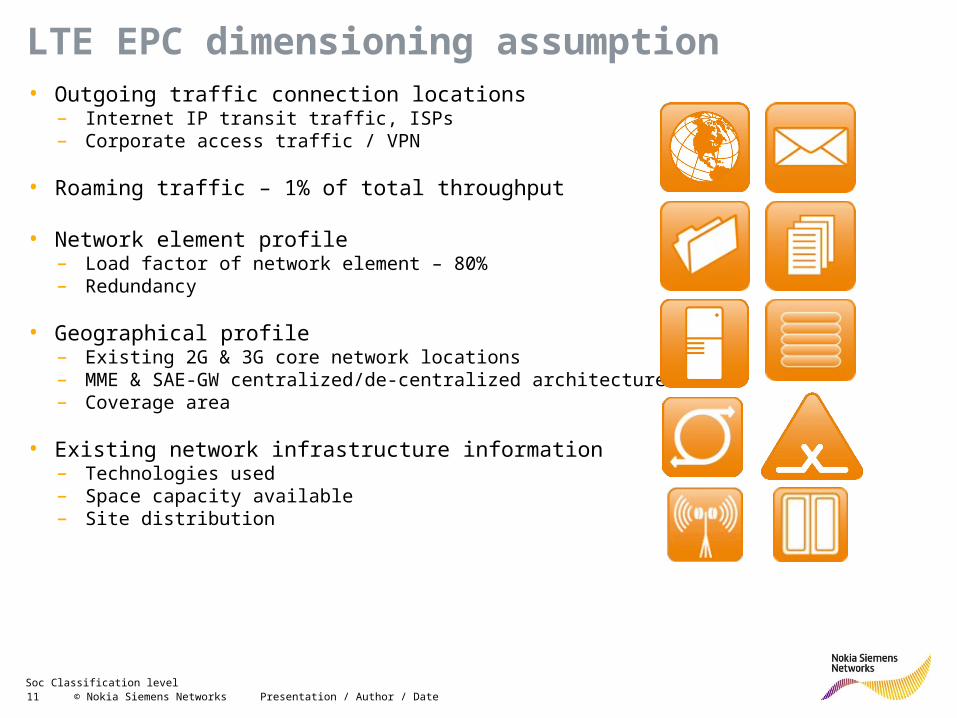
LTE EPC dimensioning assumption• Outgoing traffic connection locations
– Internet IP transit traffic, ISPs– Corporate access traffic / VPN
• Roaming traffic – 1% of total throughput
• Network element profile– Load factor of network element – 80%– Redundancy
• Geographical profile– Existing 2G & 3G core network locations– MME & SAE-GW centralized/de-centralized architecture– Coverage area
• Existing network infrastructure information– Technologies used– Space capacity available– Site distribution
Soc Classification level 12 © Nokia Siemens Networks Presentation / Author / Date
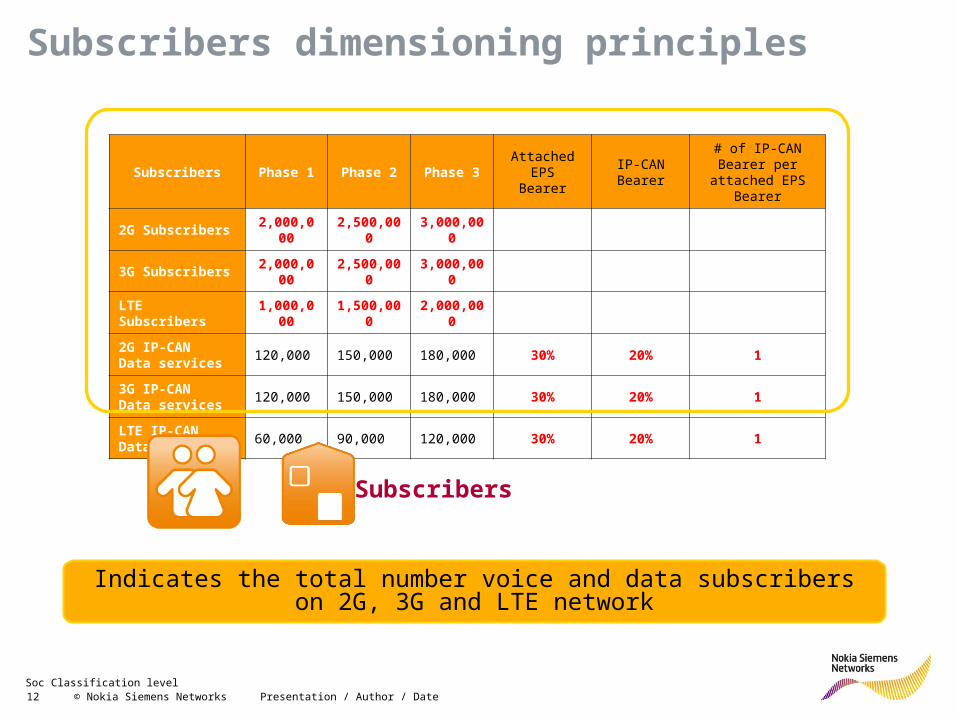
Subscribers dimensioning principles
Subscribers Phase 1 Phase 2 Phase 3Attached
EPS BearerIP-CAN Bearer
# of IP-CAN Bearer per attached EPS
Bearer
2G Subscribers 2,000,000 2,500,000 3,000,000
3G Subscribers 2,000,000 2,500,000 3,000,000
LTE Subscribers 1,000,000 1,500,000 2,000,000
2G IP-CAN Data services
120,000 150,000 180,000 30% 20% 1
3G IP-CAN Data services
120,000 150,000 180,000 30% 20% 1
LTE IP-CAN Data services
60,000 90,000 120,000 30% 20% 1
Indicates the total number voice and data subscribers on 2G, 3G and LTE network
Subscribers
Soc Classification level 13 © Nokia Siemens Networks Presentation / Author / Date
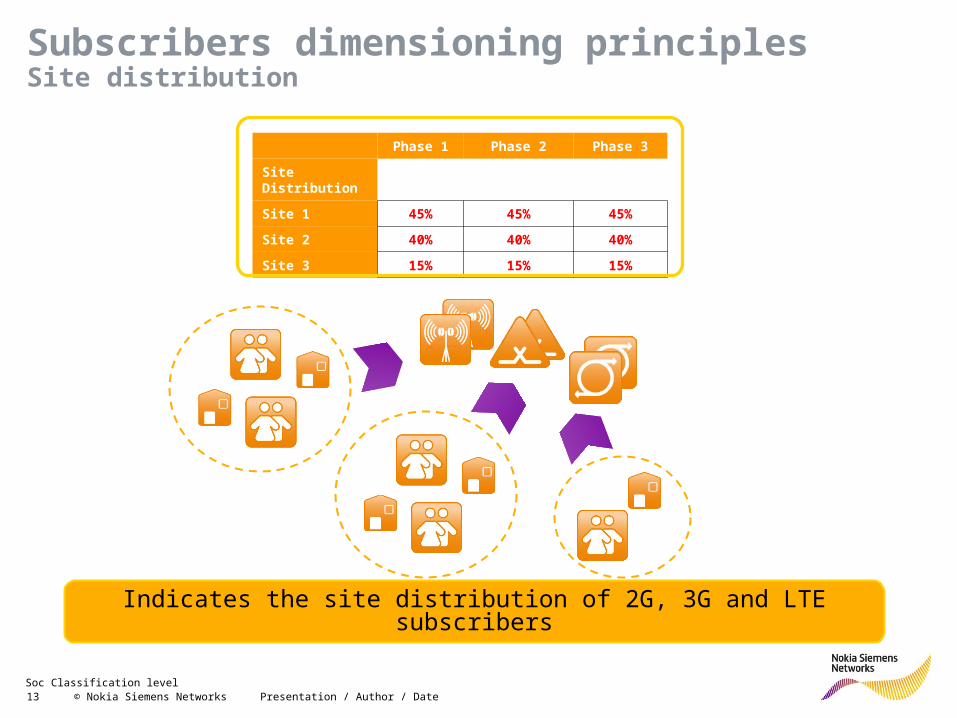
Subscribers dimensioning principles Site distribution
Phase 1 Phase 2 Phase 3
Site Distribution 100% 100% 100%
Site 1 45% 45% 45%
Site 2 40% 40% 40%
Site 3 15% 15% 15%
Indicates the site distribution of 2G, 3G and LTE subscribers
Soc Classification level 14 © Nokia Siemens Networks Presentation / Author / Date
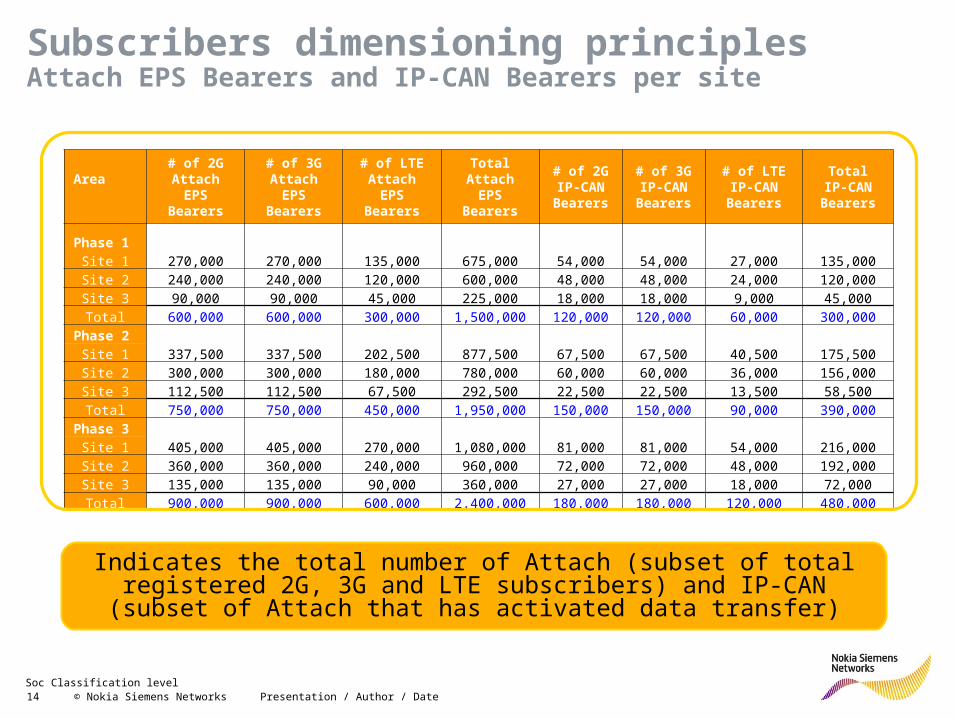
Subscribers dimensioning principles Attach EPS Bearers and IP-CAN Bearers per site
Area
# of 2G Attach EPS
Bearers
# of 3G Attach EPS
Bearers
# of LTE Attach EPS
Bearers
Total Attach EPS Bearers
# of 2G IP-CAN Bearers
# of 3G IP-CAN Bearers
# of LTE IP-CAN
Bearers
Total IP-CAN
Bearers
Phase 1
Site 1 270,000 270,000 135,000 675,000 54,000 54,000 27,000 135,000
Site 2 240,000 240,000 120,000 600,000 48,000 48,000 24,000 120,000
Site 3 90,000 90,000 45,000 225,000 18,000 18,000 9,000 45,000
Total 600,000 600,000 300,000 1,500,000 120,000 120,000 60,000 300,000
Phase 2
Site 1 337,500 337,500 202,500 877,500 67,500 67,500 40,500 175,500
Site 2 300,000 300,000 180,000 780,000 60,000 60,000 36,000 156,000
Site 3 112,500 112,500 67,500 292,500 22,500 22,500 13,500 58,500
Total 750,000 750,000 450,000 1,950,000 150,000 150,000 90,000 390,000
Phase 3
Site 1 405,000 405,000 270,000 1,080,000 81,000 81,000 54,000 216,000
Site 2 360,000 360,000 240,000 960,000 72,000 72,000 48,000 192,000
Site 3 135,000 135,000 90,000 360,000 27,000 27,000 18,000 72,000
Total 900,000 900,000 600,000 2,400,000 180,000 180,000 120,000 480,000
Indicates the total number of Attach (subset of total registered 2G, 3G and LTE subscribers) and IP-CAN (subset of Attach that has activated data
transfer)
Soc Classification level 15 © Nokia Siemens Networks Presentation / Author / Date
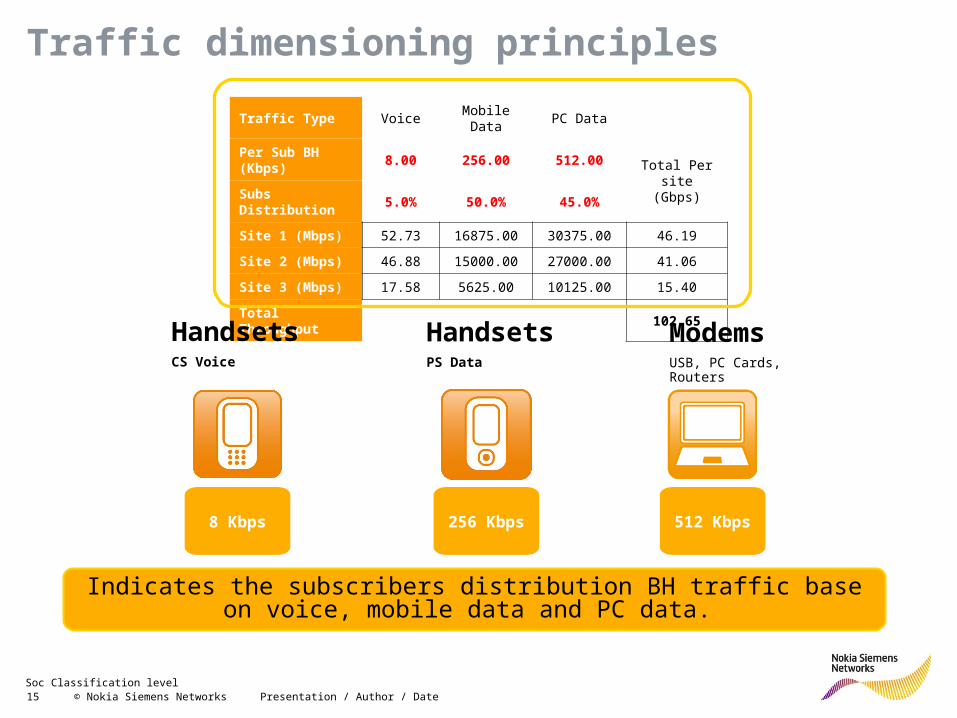
Traffic dimensioning principles
Traffic Type Voice Mobile Data PC Data
Per Sub BH (Kbps)
8.00 256.00 512.00 Total Per site(Gbps)
Subs Distribution 5.0% 50.0% 45.0%
Site 1 (Mbps) 52.73 16875.00 30375.00 46.19
Site 2 (Mbps) 46.88 15000.00 27000.00 41.06
Site 3 (Mbps) 17.58 5625.00 10125.00 15.40
Total Throughput 234.38 37125.00 74250.00 102.65
Indicates the subscribers distribution BH traffic base on voice, mobile data and PC data.
ModemsUSB, PC Cards, Routers
HandsetsPS Data
512 Kbps
HandsetsCS Voice
256 Kbps8 Kbps
Soc Classification level 16 © Nokia Siemens Networks Presentation / Author / Date
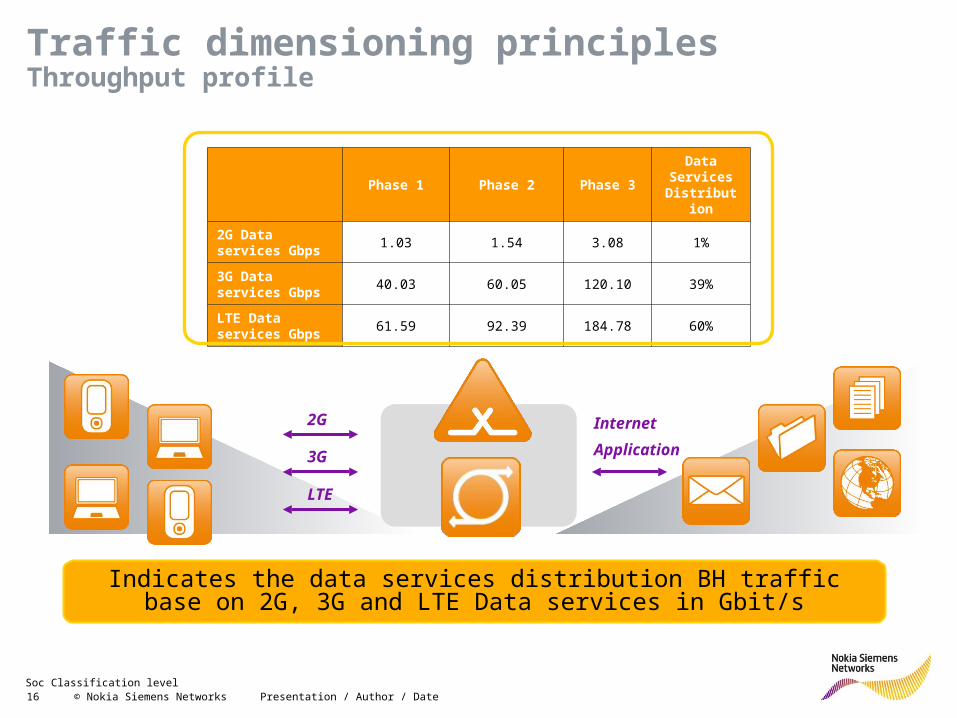
Traffic dimensioning principles Throughput profile
Phase 1 Phase 2 Phase 3Data
Services Distribution
2G Data services Gbps
1.03 1.54 3.08 1%
3G Data services Gbps
40.03 60.05 120.10 39%
LTE Data services Gbps
61.59 92.39 184.78 60%
Indicates the data services distribution BH traffic base on 2G, 3G and LTE Data services in Gbit/s
2G 3G LTE
Internet
Application
Soc Classification level 17 © Nokia Siemens Networks Presentation / Author / Date
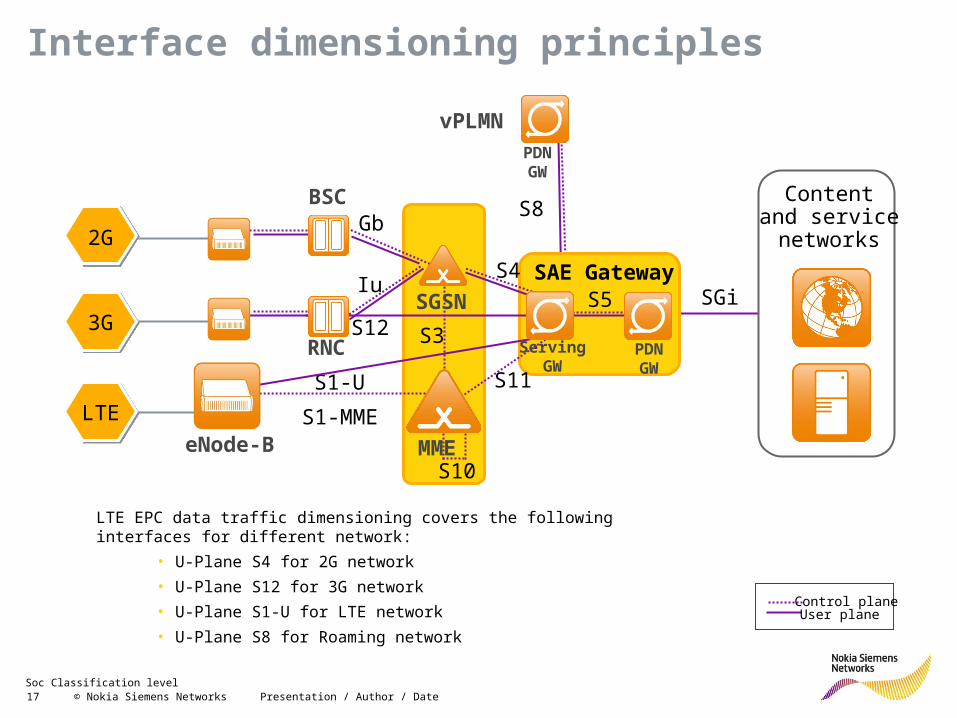
Interface dimensioning principles
2G
3G
Gb
IuS4
S1-MME
S1-U S11
S5 SAE Gateway
LTE
S3
SGSN
BSC
RNC
S10eNode-B
S12
MME
ServingGW
PDNGW
S8
PDNGW
vPLMN
LTE EPC data traffic dimensioning covers the following interfaces for different network:
• U-Plane S4 for 2G network
• U-Plane S12 for 3G network
• U-Plane S1-U for LTE network
• U-Plane S8 for Roaming network
User planeControl plane
SGi
Contentand service
networks
Soc Classification level 18 © Nokia Siemens Networks Presentation / Author / Date
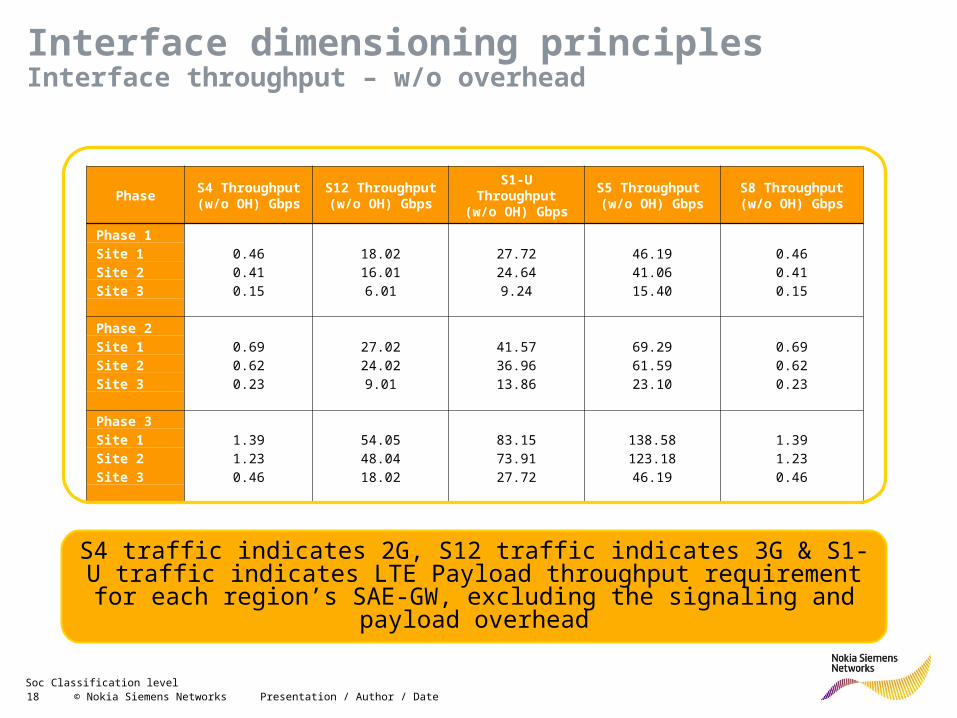
Interface dimensioning principles Interface throughput – w/o overhead
PhaseS4 Throughput (w/o OH) Gbps
S12 Throughput (w/o OH) Gbps
S1-U Throughput (w/o OH) Gbps
S5 Throughput (w/o OH) Gbps
S8 Throughput (w/o OH) Gbps
Phase 1
Site 1 0.46 18.02 27.72 46.19 0.46
Site 2 0.41 16.01 24.64 41.06 0.41
Site 3 0.15 6.01 9.24 15.40 0.15
Phase 2
Site 1 0.69 27.02 41.57 69.29 0.69
Site 2 0.62 24.02 36.96 61.59 0.62
Site 3 0.23 9.01 13.86 23.10 0.23
Phase 3
Site 1 1.39 54.05 83.15 138.58 1.39
Site 2 1.23 48.04 73.91 123.18 1.23
Site 3 0.46 18.02 27.72 46.19 0.46
S4 traffic indicates 2G, S12 traffic indicates 3G & S1-U traffic indicates LTE Payload throughput requirement for each region’s SAE-GW, excluding the
signaling and payload overhead
Soc Classification level 19 © Nokia Siemens Networks Presentation / Author / Date
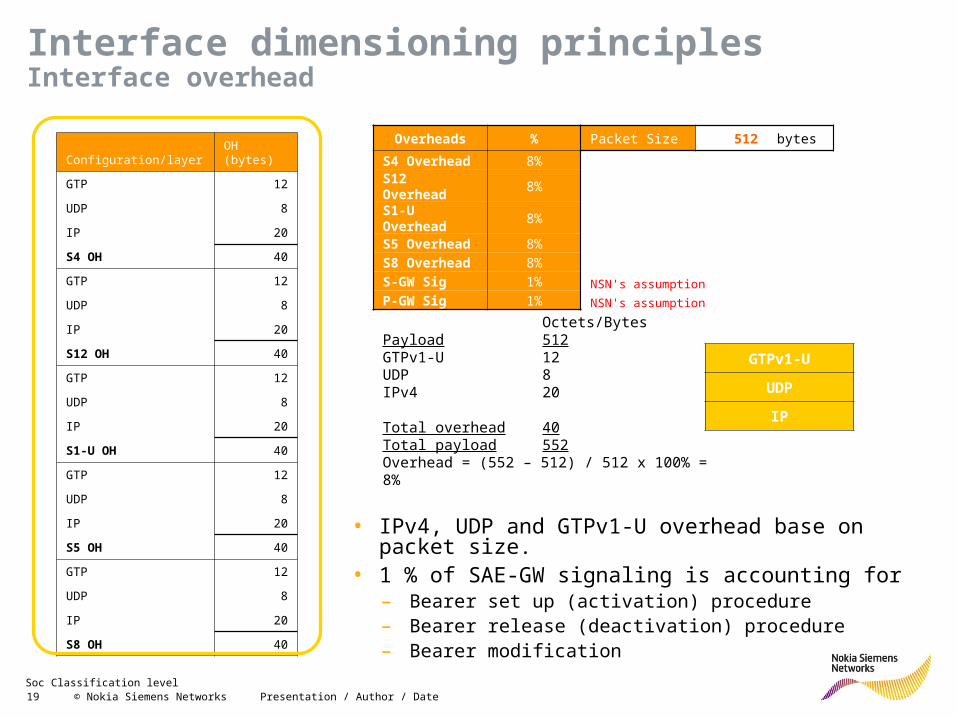
Interface dimensioning principles Interface overhead
Overheads % Packet Size 512 bytes
S4 Overhead 8%
S12 Overhead 8%
S1-U Overhead 8%
S5 Overhead 8%
S8 Overhead 8%
S-GW Sig 1% NSN's assumption
P-GW Sig 1% NSN's assumption
Configuration/layer OH (bytes)
GTP 12
UDP 8
IP 20
S4 OH 40
GTP 12
UDP 8
IP 20
S12 OH 40
GTP 12
UDP 8
IP 20
S1-U OH 40
GTP 12
UDP 8
IP 20
S5 OH 40
GTP 12
UDP 8
IP 20
S8 OH 40
• IPv4, UDP and GTPv1-U overhead base on packet size.• 1 % of SAE-GW signaling is accounting for
– Bearer set up (activation) procedure– Bearer release (deactivation) procedure– Bearer modification
Octets/BytesPayload 512GTPv1-U 12UDP 8IPv4 20
Total overhead 40Total payload 552Overhead = (552 – 512) / 512 x 100% = 8%
GTPv1-U
UDP
IP
Soc Classification level 20 © Nokia Siemens Networks Presentation / Author / Date
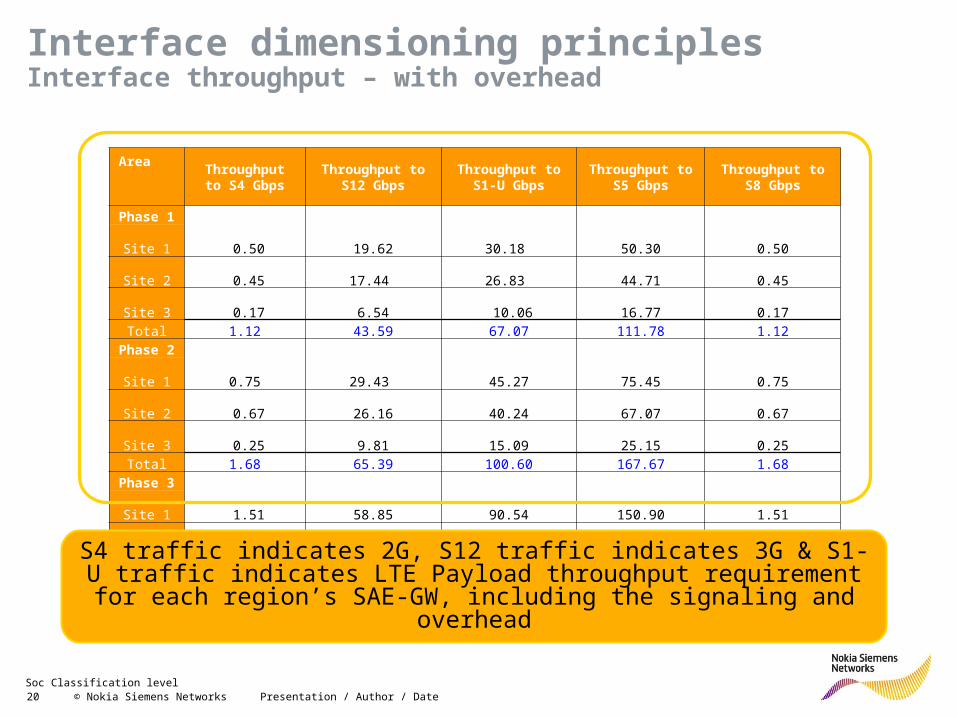
Interface dimensioning principles Interface throughput – with overhead
Area
Throughput to S4 Gbps
Throughput to S12 Gbps
Throughput to S1-U Gbps
Throughput to S5 Gbps
Throughput to S8 Gbps
Phase 1
Site 1 0.50 19.62 30.18 50.30 0.50
Site 2 0.45 17.44 26.83 44.71 0.45
Site 3 0.17 6.54 10.06 16.77 0.17
Total 1.12 43.59 67.07 111.78 1.12
Phase 2
Site 1 0.75 29.43 45.27 75.45 0.75
Site 2 0.67 26.16 40.24 67.07 0.67
Site 3 0.25 9.81 15.09 25.15 0.25
Total 1.68 65.39 100.60 167.67 1.68
Phase 3
Site 1 1.51 58.85 90.54 150.90 1.51
Site 2 1.34 52.31 80.48 134.14 1.34
Site 3 0.50 19.62 30.18 50.30 0.50
Total 3.35 130.78 195.83 335.34 3.35
S4 traffic indicates 2G, S12 traffic indicates 3G & S1-U traffic indicates LTE Payload throughput requirement for each region’s SAE-GW, including the
signaling and overhead