Embed Size (px)
Citation preview
CHAPTER FIVE
Luminescence properties of SrS:Dy,CI phosphor
5.1 Abstract
The fundamental optical properties of dysprosium (Dy) doped strontium
sultlde bulk samples for various dopant concentrations from (0.1-1.0a1. %)
were investigated by electron paramagnetic resonance spectroscopy (EPR),
room temperature photoluminescence (PL), photoluminescence excitation
(PLE) and diffuse reflectance spectroscopy (DRS). Investigations by
electron paramab'Iletic resonance yielded the state of Dy in the sample as
Dy31. An additional EPR line due to F+ centre was also observed. The PL
emission spectrum consisted of several intense lines and a number of weaker
ones which were identified as transitions between energy levels of D/+. The
optimum doping concentration for maximum intensity was found to be
0.25at.%. Blue shift of the band gap energy and red shift of the PLE
spectrum were observed with increasing doping concentration. The fonner is
due to Burstein-Moss (BM) effect and the latter is attributed due to the
presence of band tailing. The yellow-to-blue intensity ratios(Y/B) of Dy31
emission in SrS lattice for different concentrations were also evaluated.
5.2 Introduction
Alkaline earth sulfide phosphors have aroused much interest after the
discovery of infrared stimulation and sensitized luminescence [1,2] because
of their potential as host materials for device applications, such as
multicolour thin film e1ectroluminescent [3] and magneto optical devices
(4,5J. Non- toxic sulfides are most commonly used as a host lattice for
phosphors. Due to the wide variety of emission wavelength possible from 4f-
4f transitions of rare earth ions in the visible spectrum, rare earth doped
alkaline earth phosphors are widely being investigated [6]. The close match
of the ionic radii of rare earth ions and cation of SrS host material, allow the
rare earths to fully incorporate in these lattices. In the case of ZnS lattice it is
difficult to fully incorporate the rare earth ions because of large difference in
ionic radii. The electroluminescent emission spectra of the lanthanide
luminescent impurity in SrS and ZnS show a difference in relative peak
intensities [7,8]. This has been attributed to the differences in the branching
ratio of the emitting level due to crystal field.
SrS:Dy is a promising phosphor for yellow electrolumincscence. Although
considerable attention has been paid to the study of PL of SrS phosphors
activated with dysprosium, not much quantitative data are available relating
to the influence of concentration of Dy on the PL and bancL gap of SrS:Dy
phosphors. In this chapter, a detailed study on the dependence of doping
concentration of Dy on the photoluminescence, band gap and excitation
energy of SrS host matrix is presented.
109
5.3 Experimental
SrS:Dy,CI phosphor was prepared by solid state reaction of SrS (99.9%.Alfa
Aesar) with DyCI} (99.99%, Indian Rare Earths Ltd.). The mixture was fired
at 900°C for 1 hour in hydrogen sulfide atmosphere. This powder was
pulverized in a dry atmosphere and stored, keeping in view of the extreme
purity as the main consideration in the preparation. The crystal structure of
the synthesized phosphors were studied using a Rigaku x-ray diffractometer
with Cu Ka x-ray. The PI. and PLE spectra were recorded with Jobin Yvon
Fluoromax-3 Flourimeter. The optical band gaps of the samples were
estimated from the diffuse reflectance spectra recorded with .1asco-V-570 uv
vis-nir spectrophotometer. The nature ofthe luminescent impurity in the host
was studied by recording the EPR spectra using Varian E-112 E-line Century
series X- band EPR spectrometer. The electrical conductivity of the samples
pelletized at a pressure of 2 tonnes was measured using a keithley source
measure unit (SMU 236). Silver paste was used as the electrode on either
side of the pellets having a diameter of 1 cm.
5.4 Results and discussion
5.4.1 EPR measurements
EPR measurements were carried out on a VarianE-112 E-line Century series
X-band EPR spectrometcr at room temperature for the concentrations of Dy
concentration varying from O.lat.% to 1 at.%. Tetracyc10ethelene (TCNE,
g = 2.00277) was used as a standard for g-factor measurements. EPR yielded
site-selective information on Dy impurities in the SrS lattice. The spectrum
of the powder sampJes showed a symmetric signal at a g value of 2.08 and 109
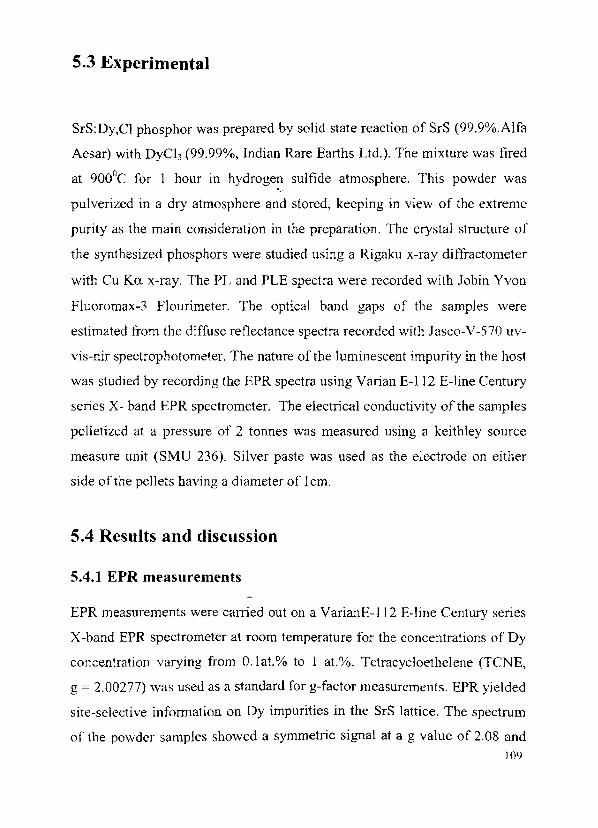
another signal at a g value 2.00587 with a line width 20 gauss close to the
left of the TCNE marker. The line adjacent to the marker (Fig.5.1) is due to
the F+ centre [9, 10] produced by sulfur vacancy. The symmetric signal with
six lines is due to the hyperfine splitting of oY+ (1=5/2). The relative
intensity of the EPR signal corresponding to the Dl+ ions increased with
doping concentration. Dr+ is introduced by doping DyCl3 which is
incorporated as oY+ on Sr sites. To maintain charge neutrality, defect
complexes like [Dr+ Sr V Sr r or [Cls· V srrare possible. Chlorine ions can
... _~~. __ .. ___ "'_ .. H_.·._',J.....~"_.'H ..... ___ _ __
2730 3230 3730
magnetic field (gauss)
Figure5.1. EPR spectrum ofSrS:Dy,Cl phosphor for 0.25 at.% ofDy doping concentration
occupy sulfur vacancies and also donate free electrons. Sulphur vacancies
trap these electrons fonning F+ centres. The EPR signal intensity
110
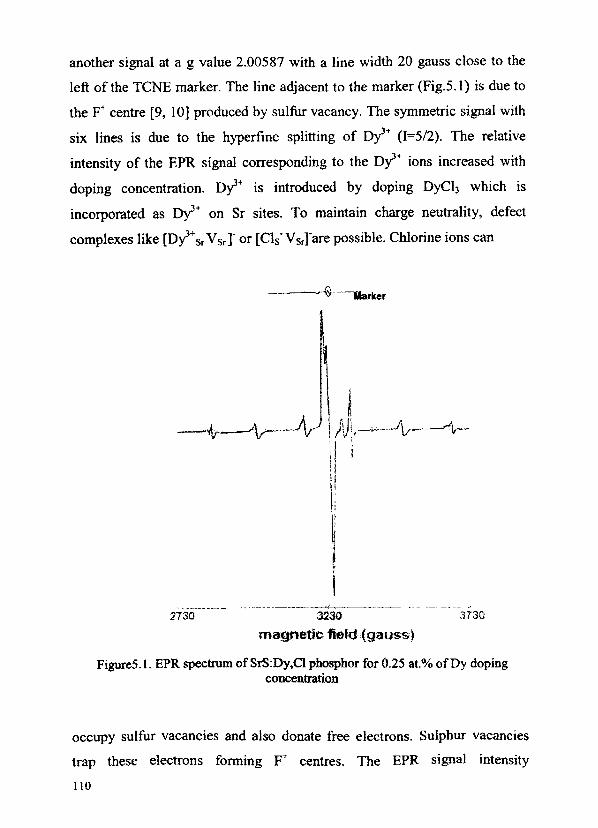
corresponding to the F+ cent er also increased with doping concentration of
Dy3' ions (Figure 5.2).
* 278
:>~. -~ c:: :J
276 .Q "-CO - -E ~ ~ c
'-Aex en -)( c::
c<.CD 274 ~ EPR Intensity .s c::
Q:: a. w
272
0.0 0.2 0.4 0.6 0.8 1.0
Doping concentration (at.%)
FigureS.2. EPR intensity ofF+ centre and excitation peak wavelength as a function
of doping concentration
5.4.2 Photoluminescence spectra of SrS:Dy,CI
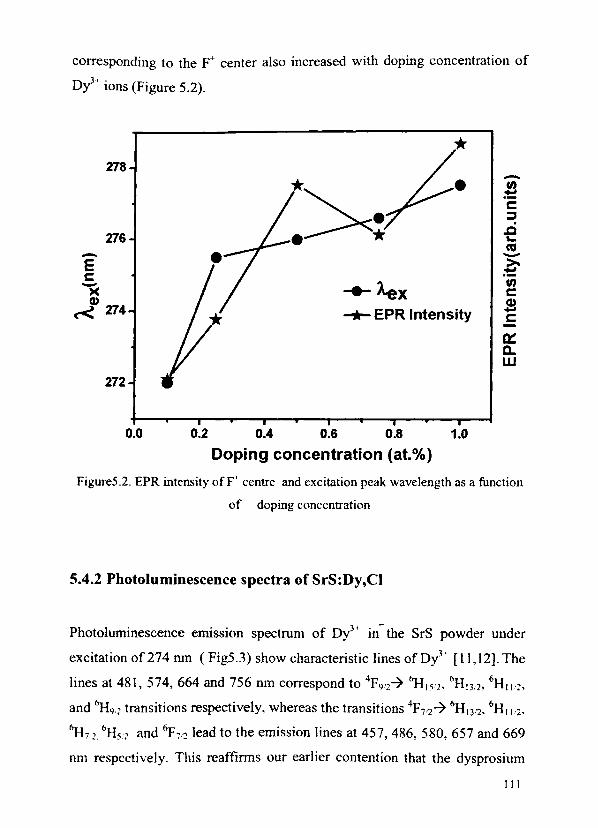
Photoluminescence emission spectrum of Dl· in- the SrS powder under
excitation of274 run (Fig5.3) show characteristic lines ofD/' [11,12]. The
lines at 481,574,664 and 756 run correspond to 4F9'27 ('H1~2. "HJ3c2' 6HII~.
and 1-1<).2 transitions respectively, whereas the transitions 4Fn7 6H 13i2, 6H 112,
~7'c. bHs.2 and 6F7<~ lead to the emission lines at 457, 486,580,657 and 669
nm respectively. This reaffirms our earlier contention that the dysprosium
III
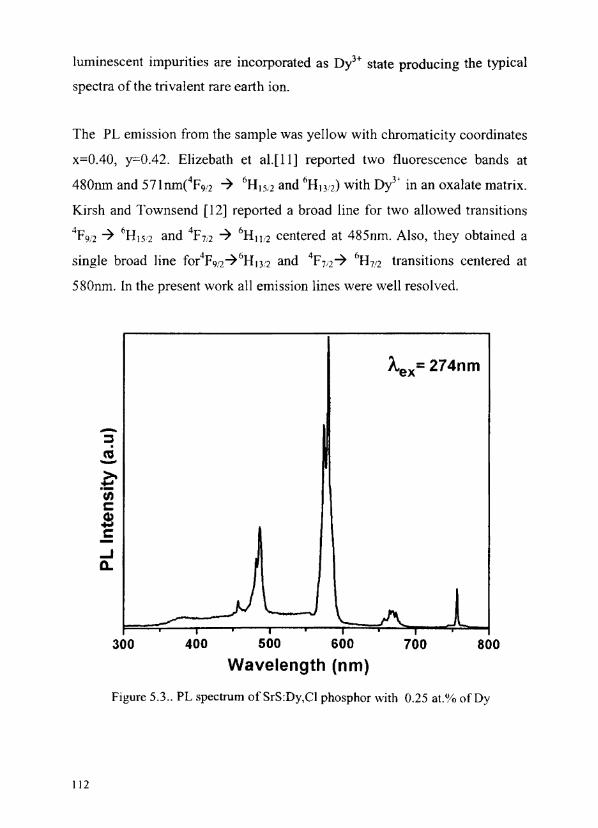
luminescent impurities are incorporated as Dy3+ state producing the typical
spectra of the trivalent rare earth ion.
The PL emission from the sample was yellow with chromaticity coordinates
x=0.40, y=0.42. Elizebath et a1.[11] reported two fluorescence bands at
480nm and S71nm(4F9!2 -7 °H J5,2 and 6H 13/2) with D/' in an oxalate matrix.
Kirsh and Townsend [12] reported a broad line for two allowed transitions
4F9!2 -7 °H J5 '2 and 4Pn -7 °HJI!2 centered at 485nm. Also, they obtained a
single broad line for4F9/2-76HJ3/2 and 4Fn-7 °H712 transitions centered at
580nm. In the present work all emission lines were well resolved.
Aex= 274nm
-::::J CO -
\ \ A
I I
300 400 500 600 700 800
Wavelength (nm)
Figure 5.3 .. PL spectrum ofSrS:Dy,CI phosphor with 0.25 at.% ofDy
112
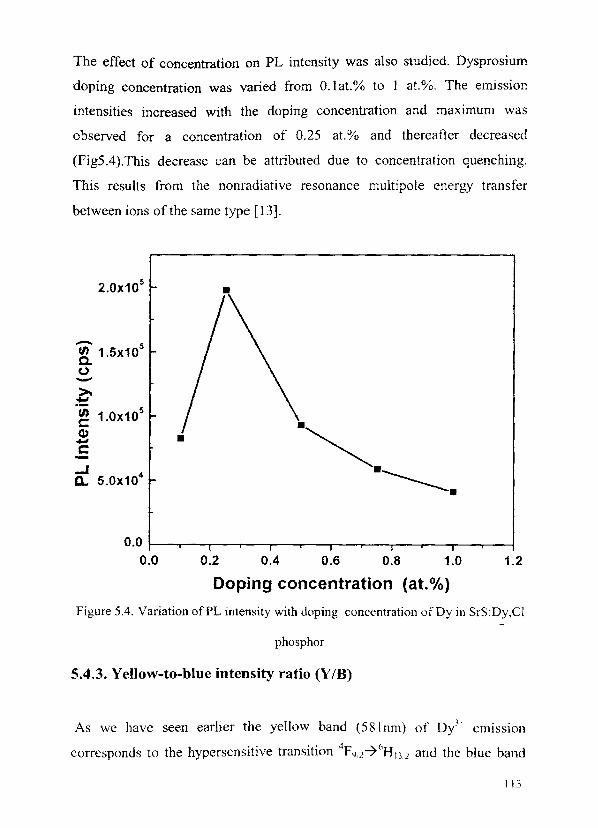
The effect of concentration on PL intensity was also studied. Dysprosium
doping concentration was varied from 0.1 at. % to I at. %. The emission
intensities increased with the doping concentration and maximum was
observed for a concentration of 0.25 at.% and thereafter decreased
(FigS.4).This decrease can be attributed due to concentration quenching.
This results from the nonradiative resonance multi pole energy transfer
between ions of the same type [13].
•
- 5 ~ 1.5x10 0 -~ ~ tn 1.0x10⁵
C Cl) • -C
..J 5.0x10⁴ a..
.~
.------•
0.0 r--_,..--r----r--~_,..--,.--.,......-_r_~-~-_r_~ 0.0 0.2 0.4 0.6 0.8 1.0 1.2
Doping concentration (at.%)
Figure 5.4. Variation ofPL intensity with doping concentration ofDy in SrS:DY,Cl
phosphor
5.4.3. Yellow-to-blue intensity ratio (Y/B)
As we have seen earlier the yellow band (581 nm) of 0/' emission
corresponds to the hypersensitive transition 4F<J2-7°Hu 2 and the blue band
113
corresponds to 4F9!2 --7 6H !5!2 transition. The yellow-to-blue intensity ratio of
Dy3 i emission depends upon the environment. When Dy3+ i.s substituted for
an element with the same valency in the matrix (e.g. trivalent rare earths),
the value of Y IB generally does not vary much with variation in the
concentration of Dy3+. When Dlf is substituted for an element with a
different valency, defects will be formed, and the surrounding and local
symmetry of of Dl' will change with increasing concentration of Dy3~.
Hence the value ofYIB vary with variation in the concentration ofDy3'[14].
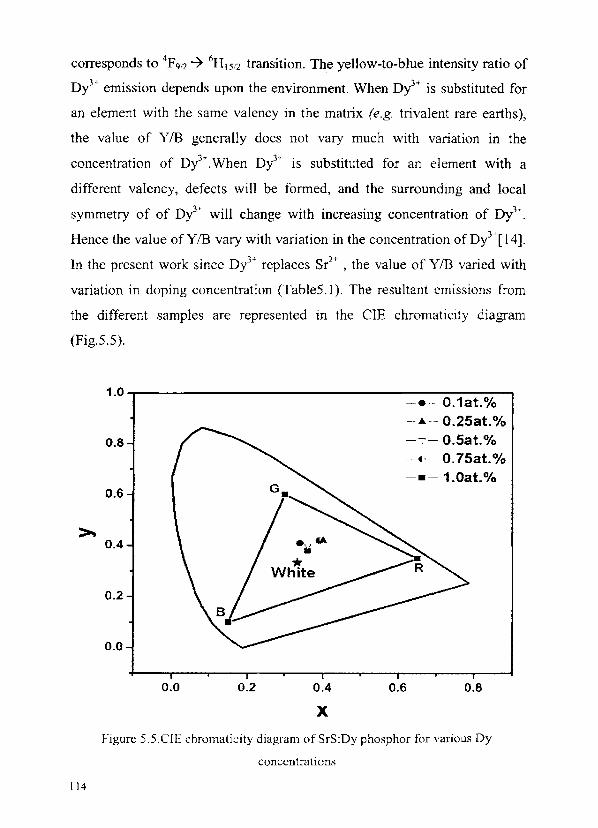
In the present work since Dy3+ replaces Sr2+ , the value of Y/B varied with
variation in doping concentration (Table5.1). The resultant emissions from
the different samples are represented in the ClE chromaticity diagram
(Fig.5.5).
114
1.0~--------------------------------------------,
0.8
0.6
0.4
0.2
0.0
0.0 0.2 0.4
X
-e- O.1at.% -- .It.-- O.25at. % ---;- O.5at.%
(. O.75at.% -.-1.0at.%
0.6 0.8
Figure 5SCIE chromaticity diagram ofSrS:Dy phosphor for various Dy
concentrations
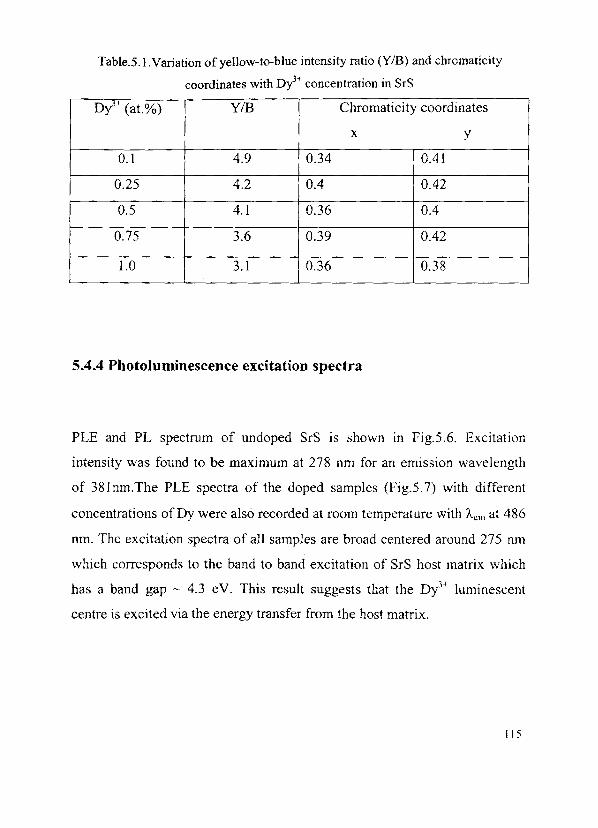
TableSI.Variation of yellow-to-blue intensity ratio (Y/B) and chromaticity
coordinates with DY?+ concentration in SrS
Dy-" (at.%) YIB Chromaticity coordinates
x y
0.] 4.9 0.34 0.41
0.25 4.2 0.4 0.42
0.5 4.1 0.36 0.4
0.75 3.6 0.39 0.42
1.0 3.1 0.36 0.38
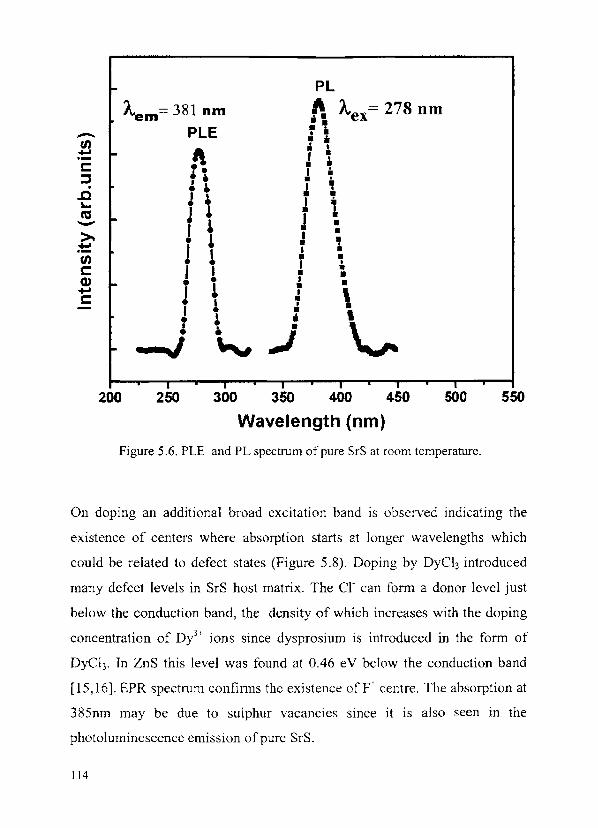
5.4.4 Photoluminescence excitation spectra
PLE and PL spectrum of un doped SrS is shown in Fig.5.6. Excitation
intensity was found to be maximum at 278 nm for an emission wavelength
of 38Jnm.The PLE spectra of the doped samples (Fig.S.7) with different
concentrations ofDy were also recorded at room temperature with "ClIl at 486
nm. The excitation spectra of all samples are broad centered around 275 nm
which corresponds to the band to band excitation of SrS host matrix which
has a band gap ~ 4.3 cV. This result suggests that the Dl' luminescent
centre is excited via the energy transfer from the host matrix.
! 15
-!l t: ::::s . .c ~
ctS -
200
Aem= 381 nm
PLE
PL
~ Aex= 278 urn • • • • • • • • " , .. , ,
:~ . . ~, J ; • , I , • • • • it 1 1 ! 1 J: 1 1 T; I I .;
I 1 i \ f 1 ",
1 • I ."" ; \.,. --I ~ ~
• • • , • 250 300 350 400 450
Wavelength (nm)
I
500
Figure 5.6. PLE and PL spectrum of pure SrS at room temperature.
550
On doping an additional broad excitation band is observed indicating the
existence of centers where absorption starts at longer wavelengths which
could be related to defect states (Figure 5.8). Doping by Dyel3 introduced
many defect levels in SrS host matrix. The er can form a donor level just
below the conduction band, the density of which increases with the doping
concentration of Di' ions since dysprosium is introduced in the form of
Dyel3. In ZnS this level was found at 0.46 eV below the conduction band
[15,16]. EPR spectrum confinns the existence of F I centre. The absorption at
385nm may be due to sulphur vacancies since it is also seen in the
photoluminescence emission of pure SrS.
114
-:::s ns -~ (f) c: Cl> -C -
W ...J 0..
240
b A ==486ruu
em
280
V\evefength (rm)
320 340
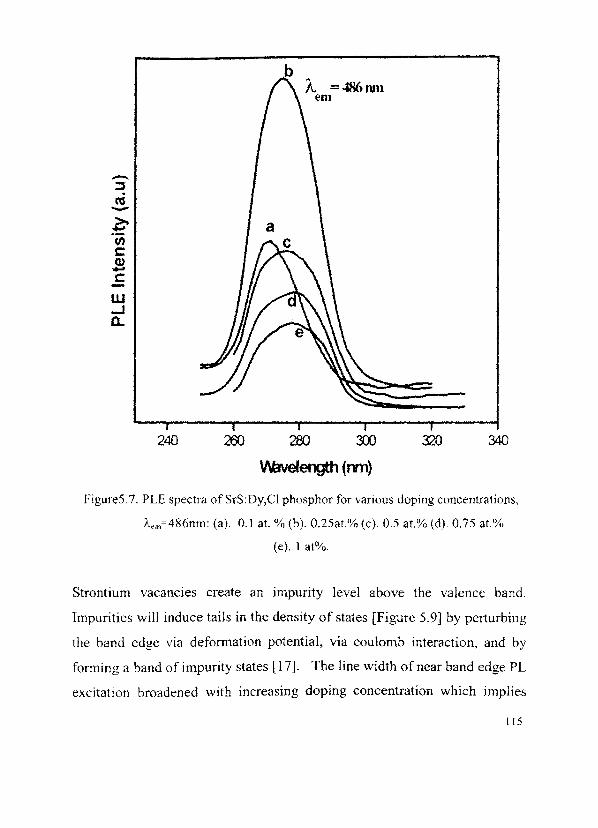
Figure5.7. PLE spectra ofSrS:Dy,Cl phosphor for various doping concentrations,
Acm=4S6nm: (a). 0.1 at. % (b). 0.25at.% (c). 0.5 at.% (d). 0.75 at.%
(e). I at%.
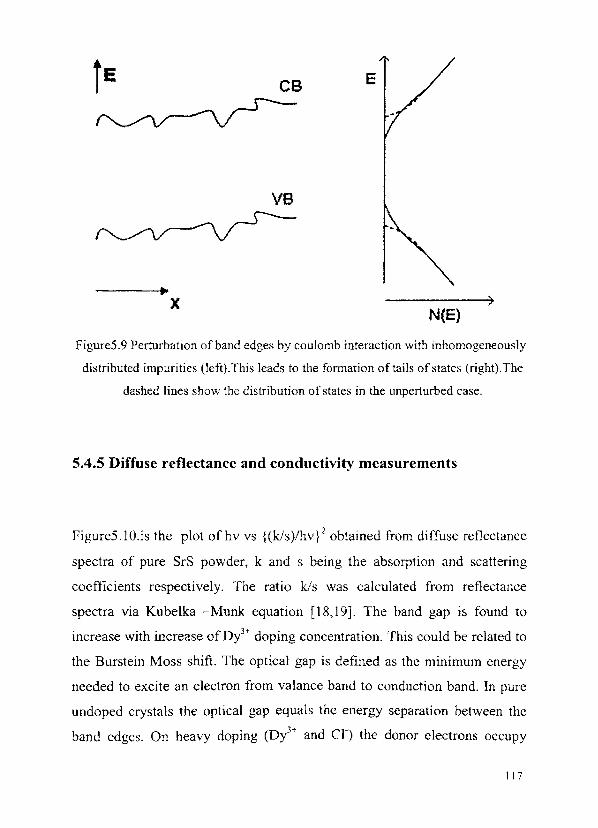
Strontium vacancies create an impurity level above the valence band.
Impurities will induce tails in the density of states [Figure 5.9] by pel1urbing
the band edge via defonnation potential, via coulomb interaction, and by
forming a band of impurity states [17]. The line width of near band edge PL
excitation broadened with increasing doping concentration which implies
115
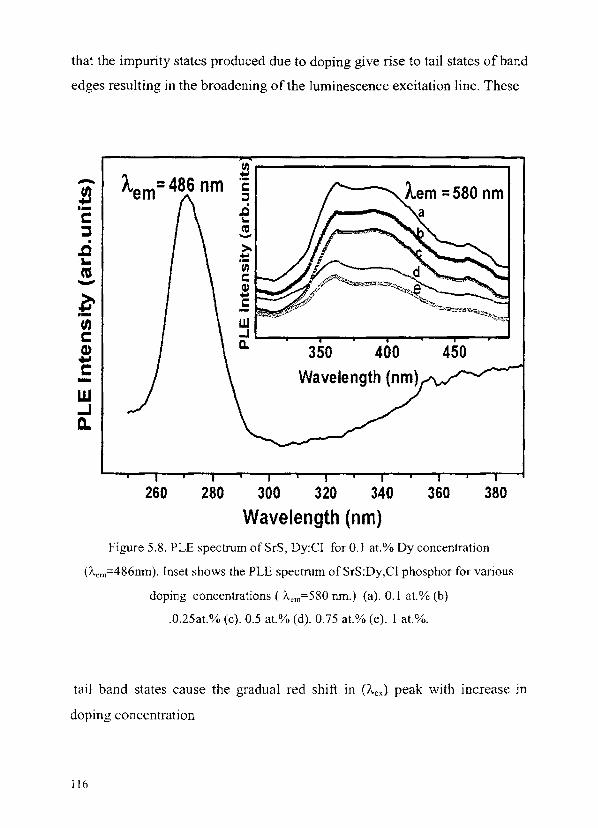
that the impurity states produced due to doping give rise to tail states of band
edges resulting in the broadening of the luminescence excitation line. These
tI) - Aem=486 nm ~
£J c :J .- .0 C ~
::2 CO -. .c >-... :t:: CU tI)
c - Q)
~ .... C .-
tn w C .J Cl) Q. 350 400 450 .... C -W .J C.
260 280 300 320 340 360 380
Wavelength (nm) Figure 5.8. PLE spectrum of SrS, Dy:CI for 0.1 at. % Dy concentration
(f.em=486nm). Inset shows the PLE spectrum ofSrS:Dy,Cl phosphor for various
doping concentrations ( Aem=580 nm.) (a). 0.1 at.% (b)
.0.25al.% (c). 0.5 at.% (d). 0.75 al.% (e). 1 al.%.
tail band states cause the gradual red shift in (I'ex) peak with increase in
doping concentration
116
CB E
VB
x )
NeE)
Figure5.9 Perturbation of band edges by coulomb interaction with inhomogeneously
distributed impurities (Ieft).This leads to the fonnation of tails of states (right).The
dashed lines show the distribution of states in the unperturbed case.
5.4.5 Diffuse reflectance and conductivity measurements
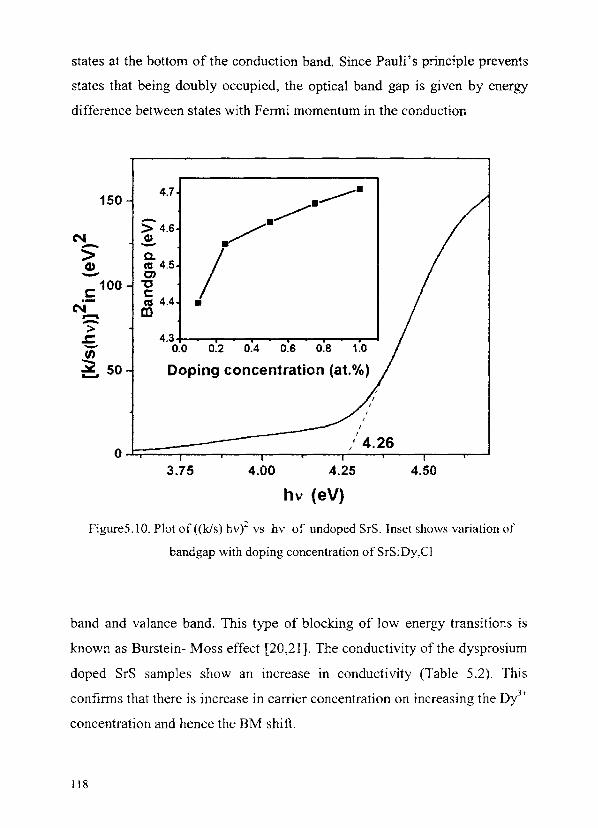
Pigure5.l0.is the plot ofhv vs {(k/s)/hv} 2 obtained from diffuse reflectance
spectra of pure SrS powder, k and s being the absorption and scattering
coefficients respectively. The ratio kls was calculated from reflectance
spectra via Kubelka -Munk equation [18,19]. The band gap is found to
increase with increase ofDy'+ doping concentration. This could be related to
the Burstein Moss shift. The optical gap is defined as the minimum energy
needed to excite an electron from valance band to conduction band. In pure
undoped crystals the optical gap equals the energy separation between the
band edges. On heavy doping (Dy}+ and en the donor electrons occupy
117
states at the bottom of the conduction band. Since Pauli's principle prevents
states that being doubly occupied, the optical band gap is given by energy
difference between states with Fermi momentum in the conduction
150 4.7
--------- ~-> 4.6 ./-
N ~ - - -> Q. (I) Cl:! 4.5 - 0) / t: 100 '0
C Cl:! 4.4 .-
N .--:> .::::. -~ .-
-m 4.3
0.0 0.2 0.4 0.6 0.8 1.0
50 Doping concentration (at.%)
1~==~~ __ ~ __ ~ __ ~,'~!4~.~2~6 __ ~ __ ~ o 3.75 4.00 4.25 4.50
hv (eV)
Figure5.1O. Plot of «k/s) hvf vs hv of un doped SrS. Inset shows variation of
band gap with doping concentration ofSrS:Dy,CI
band and valance band. This type of blocking of low energy transitions is
known as Burstein- Moss effect [20,21]. The conductivity of the dysprosium
doped SrS samples show an increase in conductivity (Table 5.2). This
confirms that there is increase in carrier concentration on increasing the D/+
concentration and hence the BM shift.
118
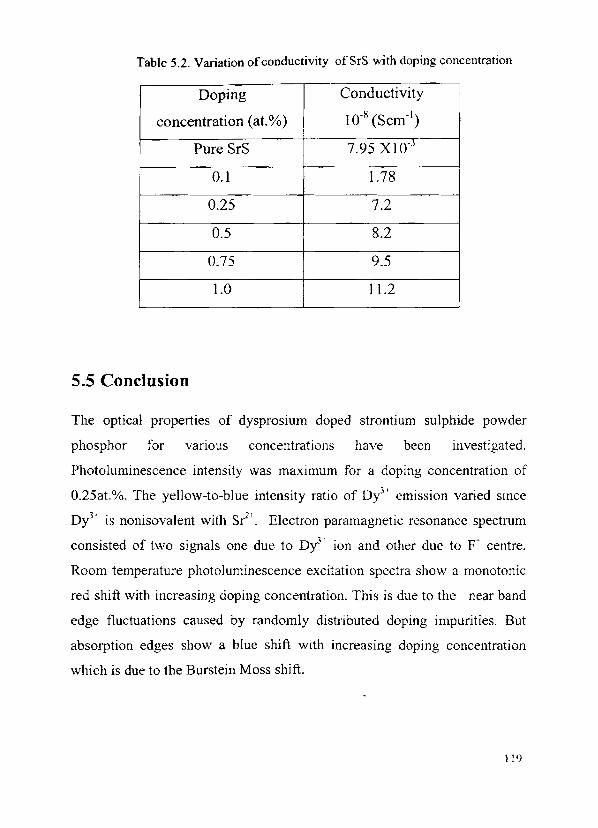
Table 5.2. Variation of conductivity ofSrS with doping concentration
Doping Conductivity
concentration (at.%) 10-8 (Scm-1)
Pure SrS 7.95 XlO-J
0.1 1.78
0.25 7.2
0.5 8.2
0.75 9.5
1.0 11.2
5.5 Conclusion
The optical properties of dysprosium doped strontium sulphide powder
phosphor for vanous concentrations have been investigated.
Photoluminescence intensity was maximum for a doping concentration of
0.25at.%. The yellow-to-blue intensity ratio of Dy3+ emission varied since
oi' is nonisovalent with S?!. Electron paramagnetic resonance spectrum
consisted of two signals one due 10 Di' ion and other duc to p+ centre,
Room temperature photoluminescence excitation spectra show a monotonic
red shift with increasing doping concentration. This is due to the near band
edge fluctuations caused by randomly distributed doping impurities. But
absorption edges show a blue shift with increasing doping concentration
which is due to the Burstein Moss shift.
119
5.6 References
120
I. AY.Cabezas and B.L.Deshazer, Appl. phys. Lett. 4 (1964) 37
2. J.Daslot., P.Braunlich and J.P.Fillard., Appl. Phys. Lett. 40 (J 982)
376.
3. D.A. Davies, J.Silver, AVecht, P..TMarsh, and A. Rose, J.
Electrochem.Soc. 148 (2001)HI43.
4. R.N.Dubey, O.N.Awasthi, V.Singh, and M.Tiwari, Indian J. Pure
&Appl. Phys.40 (2002a) 54.
5. R.N.Dubey, M.S.Qureshi, V.Singh. M.Tiwari, and S.J Dhoble,
Indian J .Phys.A 76 (2002b )591
6. P.D.Keir, C.Maddix, B.ABaukol, J.F.Wager, B.L.Clark, and
D.A.Keszler, J.AppL Phys. 86 (1999) 6810.
7. S.Okamato and E Nakazawa Jpn. J. AppI. Phys. 34 (1995) 521
8. S.Okamoto, E.Nakazawa, and Y.Tsuchiya, Jpn. J .Appl. Phys 28
(1989)406
9. V. Singh, M. Tiwari, T.K.GunduRao, and S..T.Dhoble, Bull. Mater.
Sci 28(2005)31.
10. P K Ghosh and V. Shankar, J. Lumin.20 (1979) 139
11. A.Elizebeth, V.Thomas, G.Jose, N.V.Unnikrishnan, C.Joseph, and
M.A Ittyachan, Cryst. Res .Techno1.39, (2004) 105
12. Y Kirsh and P D Townsend J. Phys. C 20 (1987) 967
13. Spectroscopy, Luminescence and Radiation Centers in Minerals,
AS,Marfunin, Translated by V.V. Schiffer, Springer-Verlag,Berlin
Heidelberg, New York( 1979)
14. Qiang Su, Zhiwu Pei, Lisheng Chi, Hongjie Zhang, Zhongyi Zhang
and Feng Zou,J.of Alloys and Compounds, 192( 1993)25
15. S.M.Pillai and C.P.G.Vallabhan, Solid State Commun. 47 (1982)
909.
16. A.J.Freeman and R.E.Watson, Phys.Rev.127 (1962) 2058
17. J .I.Pankove, Optical Processes in Semiconductors, Dover
publications, Inc.New York (1971)
18. P. Kubelka and F.Munk, Zh. Tekh. Fiz 12 (1931) 593
19. P.Kubelka, J. Opt. Soc. Am. 38 (1948) 448.
20. A.P.Roth, J.B.Webb, and D.F.Williams, Phys. Rev B. 25 (1982)
7836.
21. RE Sernelius, K.F.Beggren, Z C lin, I Hamberg, and C.Granguvist,
Phys. Rev. B. 37 (1988) 10244.
121