Embed Size (px)
Citation preview

Sentinel Sites Evaluation
Final Report- Appendices
February 2013
Paper-based publications
© Commonwealth of Australia 2013
This work is copyright. You may reproduce the whole or part of this work in unaltered form for your own personal use or, if you are part of an organisation, for internal use within your organisation, but only if you or your organisation do not use the reproduction for any commercial purpose and retain this copyright notice and all disclaimer notices as part of that reproduction. Apart from rights to use as permitted by the Copyright Act 1968 or allowed by this copyright notice, all other rights are reserved and you are not allowed to reproduce the whole or any part of this work in any way (electronic or otherwise) without first being given the specific written permission from the Commonwealth to do so. Requests and inquiries concerning reproduction and rights are to be sent to the Online, Services and External Relations Branch, Department of Health, GPO Box 9848, Canberra ACT 2601, or via e-mail to [email protected].
Internet sites
© Commonwealth of Australia 2013
This work is copyright. You may download, display, print and reproduce the whole or part of this work in unaltered form for your own personal use or, if you are part of an organisation, for internal use within your organisation, but only if you or your organisation do not use the reproduction for any commercial purpose and retain this copyright notice and all disclaimer notices as part of that reproduction. Apart from rights to use as permitted by the Copyright Act 1968 or allowed by this copyright notice, all other rights are reserved and you are not allowed to reproduce the whole or any part of this work in any way (electronic or otherwise) without first being given the specific written permission from the Commonwealth to do so. Requests and inquiries concerning reproduction and rights are to be sent to the Online, Services and External Relations Branch, Department of Health, GPO Box 9848, Canberra ACT 2601, or via e-mail to [email protected].
This report has been independently prepared for the Australian Government Department of Health by Menzies School of Health Research and does not necessarily represent the views of the Australian Government
Contents
Abbreviations......................................................................................... 1
Appendix A. National Framework.........................................................2Program logic - ICDP wide..................................................................................................2
Program logic - tackling chronic disease risk factors..........................................................4
Program logic - earlier detection, management and follow-up of chronic disease...............................................................................................................................7
Program logic - workforce expansion and support...........................................................13
Appendix B. Sentinel Site description and maps..................................17Data sources.....................................................................................................................17
Bairnsdale [Case study site]..............................................................................................21
Barkly [Enhanced tracking site]........................................................................................27
Brisbane South [Case study site]......................................................................................34
Cairns [Enhanced tracking site]........................................................................................41
Campbelltown [Case study site].......................................................................................48
Canberra [Tracking site]...................................................................................................55
Dandenong [Tracking site]................................................................................................62
Darwin [Enhanced tracking site].......................................................................................69
Derby [Enhanced tracking site]........................................................................................76
Dubbo [Enhanced tracking site].......................................................................................84
East Pilbara [Case study site]............................................................................................91
Elizabeth [Enhanced tracking site]...................................................................................98
Geraldton [Tracking site]................................................................................................105
Gladstone [Tracking site]................................................................................................112
Grafton [Tracking site]....................................................................................................118
Hobart [Tracking site].....................................................................................................125
Kalgoorlie [Tracking site]................................................................................................131
Katherine West [Case study site]....................................................................................138
Logan/Woodridge [Case study site]...............................................................................145
Newcastle [Enhanced tracking site]...............................................................................152
North Lakes/Caboolture [Tracking site]..........................................................................159
Port Augusta [Case study site]........................................................................................166
Swan Hill/Mildura [Enhanced tracking site]...................................................................173
Tamworth [Case study site]............................................................................................180
Appendix C. Evaluation process and methods...................................187Introduction...................................................................................................................187
Program data..................................................................................................................187
Administrative data........................................................................................................188
Community focus group data.........................................................................................205
Key informant interview data.........................................................................................209
Clinical indicator data.....................................................................................................214
SSE overall analysis processes........................................................................................216
Appendix D. Interview and community focus group numbers............224Interviews.......................................................................................................................224
Community focus groups...............................................................................................227
Appendix E. Clinical indicators...........................................................231Introduction and methods.............................................................................................231
Numbers of Health Services that provided clinical indicator data..................................232
Types of reports/software systems used by Health Services..........................................235
Capability of services to provide clinical indicator data.................................................236
Numbers of patients (overall, on disease registers, and identified as Aboriginal and Torres Strait Islanders) in Health Services..............................................241
Assessment of data from Aboriginal Health Services.....................................................242
Assessment of data from General Practices...................................................................246
Potential for use of clinical indicator data to monitor impact of ICDP on service performance.......................................................................................................252
Conclusion......................................................................................................................254
Appendix F. PBS Co-payments...........................................................262
Appendix G. Medicare Benefits Schedule..........................................275
Appendix H. PIP Indigenous Health Incentive....................................286
Appendix I. Relationships between use of ICDP related services and intensity of intervention and contextual factors...........................293
Introduction and methods.............................................................................................293
Findings and interpretation............................................................................................294

Figures
Figure B1: Bairnsdale site boundary map...................................................................................23Figure B2: ICDP funded positions and service developments (March 2010 - August
2012) and trends in administrative data, Bairnsdale (March 2009 - May 2012).........................................................................................................................26
Figure B3: Barkly site boundary map..........................................................................................29Figure B4: ICDP funded health promotion positions, projects and events, Barkly
(March 2009 - August 2012)......................................................................................32Figure B5: ICDP funded positions and service developments (March 2010 - August
2012) and trends in administrative data, Barkly (March 2009 - May 2012)..............33Figure B6: Brisbane South site boundary map...........................................................................36Figure B7: ICDP funded health promotion positions, projects and events, Brisbane
South (March 2009 - August 2012)...........................................................................39Figure B8: ICDP funded positions and service developments (March 2010 - August
2012) and trends in administrative data, Brisbane South (March 2009 - May 2012).................................................................................................................40
Figure B9: Cairns site boundary map..........................................................................................43Figure B10: ICDP funded health promotion positions, projects and events, Cairns
(March 2009 - August 2012)......................................................................................46Figure B11: ICDP funded positions and service developments (March 2010 - August
2012) and trends in administrative data, Cairns (March 2009 - May 2012)..............47Figure B12: Campbelltown site boundary map..........................................................................50Figure B13: ICDP funded health promotion positions, projects and events,
Campbelltown (March 2009 - August 2012).............................................................53Figure B14: ICDP funded positions and service developments (March 2010 - August
2012) and trends in administrative data, Campbelltown (March 2009 - May 2012).................................................................................................................54
Figure B15: Canberra site boundary map...................................................................................57Figure B16: Trends in administrative data, Canberra (March 2009 - May 2012)........................61Figure B17: Dandenong site boundary map...............................................................................64Figure B18: Trends in administrative data, Dandenong (March 2009 - May 2012)....................68Figure B19: Darwin site boundary map......................................................................................71Figure B20: ICDP funded health promotion positions, projects and events, Darwin
(March 2009 - August 2012)......................................................................................74Figure B21: ICDP funded positions and service developments (March 2010 - August
2012) and trends in administrative data, Darwin (March 2009 - May 2012).........................................................................................................................75
Figure B22: Derby site boundary map........................................................................................78Figure B23: ICDP funded health promotion positions, projects and events, Derby
(March 2009 - August 2012)......................................................................................81Figure B24: ICDP funded positions and service developments (March 2010 - August
2012) and trends in administrative data, Derby (March 2009 - May 2012)..............82Figure B25: Dubbo site boundary map.......................................................................................85Figure B26: ICDP funded health promotion positions, projects and events, Dubbo
(March 2009 - August 2012)......................................................................................88
Figure B27: ICDP funded positions and service developments (March 2010 - August 2012) and trends in administrative data, Dubbo (March 2009 - May 2012).............89
Figure B28: East Pilbara site boundary map...............................................................................92Figure B29: ICDP funded health promotion positions, projects and events, East
Pilbara (March 2009 - August 2012)..........................................................................95Figure B30: ICDP funded positions and service developments (March 2010 - August
2012) and trends in administrative data, East Pilbara (March 2009 - May 2012).........................................................................................................................96
Figure B31: Elizabeth site boundary map...................................................................................99Figure B32: ICDP funded health promotion positions, projects and events, Elizabeth
(March 2009 - August 2012)....................................................................................102Figure B33: ICDP funded positions and service developments (March 2009 - August
2012), and trends in administrative data, Elizabeth (March 2009 - May 2012).......................................................................................................................103
Figure B34: Geraldton site boundary map...............................................................................106Figure B35: Trends in administrative data, Geraldton (March 2009 - May 2012)....................110Figure B36: Gladstone site boundary map...............................................................................112Figure B37: Trends in administrative data, Gladstone (March 2009 - May 2012)....................116Figure B38: Grafton site boundary map...................................................................................119Figure B39: Trends in administrative data, Grafton (March 2009 - May 2012)........................123Figure B40: Hobart site boundary map....................................................................................125Figure B41: Trends in administrative data, Hobart (March 2009 - May 2012).........................129Figure B42: Kalgoorlie site boundary map................................................................................132Figure B43: Trends in administrative data, Kalgoorlie (March 2009 - May 2012).....................136Figure B44: Katherine West site boundary map.......................................................................139Figure B45: ICDP funded health promotion positions, projects and events, Katherine
West (March 2009 - August 2012)..........................................................................142Figure B46: ICDP funded positions and service developments (March 2010 - August
2012) and trends in administrative data, Katherine West (March 2009 - May 2012)...............................................................................................................143
Figure B47: Logan/Woodridge site boundary map...................................................................146Figure B48: ICDP funded health promotion positions, projects and events,
Logan/Woodridge (March 2009 - August 2012)......................................................149Figure B49: ICDP funded positions and service developments (March 2010 - August
2012) and trends in administrative data, Logan/Woodridge (March 2009 - May 2012)...............................................................................................................150
Figure B50: Newcastle site boundary map...............................................................................153Figure B51: ICDP funded health promotion positions, projects and events, Newcastle
(March 2009 - August 2012)....................................................................................156Figure B52: ICDP funded positions and service developments (March 2010 - August
2012) and trends in administrative data, Newcastle (March 2009 - May 2012).......................................................................................................................157
Figure B53: North Lakes/Caboolture site boundary map.........................................................160Figure B54: Trends in administrative data, North Lakes/Caboolture (March 2009 -
May 2012)...............................................................................................................164Figure B55: Port Augusta site boundary map...........................................................................167

Figure B56: ICDP funded health promotion positions, projects and events, Port Augusta (March 2009 - August 2012)......................................................................170
Figure B57: ICDP funded positions and service developments (March 2009 - August 2012), and trends in administrative data, Port Augusta (March 2009 - May 2012)...............................................................................................................171
Figure B58: Swan Hill/Mildura site boundary map...................................................................174Figure B59: ICDP funded health promotion positions, projects and events, Swan
Hill/Mildura (March 2009 - August 2012)...............................................................177Figure B60: ICDP funded positions and service developments (March 2010 - August
2012) and trends in administrative data, Swan Hill/Mildura (March 2009 - May 2012)...............................................................................................................178
Figure B61: Tamworth site boundary map...............................................................................181Figure B62: ICDP funded health promotion positions, projects and events, Tamworth
(March 2009 - August 2012)....................................................................................184Figure B63: ICDP funded positions and service developments (March 2010 - August
2012) and trends in administrative data, Tamworth (March 2009 - May 2012).......................................................................................................................185
Figure C1: Framework for data collection and analysis............................................................215Figure C2: Steps in the data collection and analysis process....................................................217Figure C3: Outline of the Sentinel Sites evaluation process from commencement to
finalisation of each report.......................................................................................220Figure E1: Number of patients on clinical information systems identified as
Aboriginal and Torres Strait Islander for remote Aboriginal Health Services (final evaluation cycle)..............................................................................254
Figure E2: Number of patients on clinical information systems identified as Aboriginal and Torres Strait Islander for regional Aboriginal Health Services (final evaluation cycle)..............................................................................255
Figure E3: Number of patients on the clinical information systems identified as Aboriginal and Torres Strait Islander for urban Aboriginal Health Services (final evaluation cycle)............................................................................................255
Figure E4: Number of Aboriginal and Torres Strait Islander people on the diabetes registers for remote Aboriginal Health Services (final evaluation cycle).................256
Figure E5: Number of Aboriginal and Torres Strait Islander people on the diabetes registers for regional Aboriginal Health Services (final evaluation cycle)................256
Figure E6: Number of Aboriginal and Torres Strait Islander people on the diabetes registers of urban Aboriginal Health Services (final evaluation cycle).....................257
Figure E7: Number of Aboriginal and Torres Strait Islander people on the CHD registers in Aboriginal Health Services (final evaluation cycle)...............................257
Figure E8: Number of patients on the clinical information systems identified as Aboriginal and Torres Strait Islander for regional General Practices (final evaluation cycle).....................................................................................................258
Figure E9: Number of patients on the clinical information systems identified as Aboriginal and Torres Strait Islander for urban General Practices (final evaluation cycle).....................................................................................................258
Figure E10: Number of Aboriginal and Torres Strait Islander people on the diabetes registers for regional General Practices (final evaluation cycle).............................259
Figure E11: Number of Aboriginal and Torres Strait Islander people on the diabetes registers for urban General Practices (final evaluation cycle).................................259
Figure E12: Number of Aboriginal and Torres Strait Islander people on the CHD registers for regional General Practices (final evaluation cycle).............................260
Figure E13: Number of Aboriginal and Torres Strait Islander people on the CHD registers for urban General Practices (final evaluation cycle).................................260
Figure F1: PBS Co-payment measure prescriptions per 100 Aboriginal and Torres Strait Islander people aged 15-54 years in Sentinel Sites and the rest of Australia, by Anatomical Therapeutic Chemical category (anti-psychotic, cardiac, diabetes and obstructive airway disease) and quarter, September 2010 - May 2012...................................................................................272
Figure F2: PBS Co-payment measure prescriptions per 100 Aboriginal and Torres Strait Islander people aged ≥55 years in Sentinel Sites and the rest of Australia, by Anatomical Therapeutic Chemical category (anti-psychotic, cardiac, diabetes and obstructive airway disease) and quarter, September 2010 - May 2012...................................................................................272
Figure F3: PBS Co-payment measure prescriptions per 100 Aboriginal and Torres Strait Islander people aged 15-54 years in Sentinel Sites and the rest of Australia, by Anatomical Therapeutic Chemical category (anti-bacterial for systemic use and others) and quarter, September 2010 - May 2012................273
Figure F4: PBS Co-payment measure prescriptions per 100 Aboriginal and Torres Strait Islander people aged ≥55 years in Sentinel Sites and the rest of Australia, by Anatomical Therapeutic Chemical category (anti-bacterial for systemic use and others) and quarter, September 2010 - May 2012................273
Figure G1: Number of GPs who claimed an adult health assessment (MBS items 704, 706, 710 to 1 May 2010 thereafter 715) per 100 Aboriginal and Torres Strait Islander people aged ≥15 years for urban Sentinel Sites and the rest of urban Australia, by quarter, March 2009 - May 2012.........................................282
Figure G2: Number of GPs who claimed an adult health assessment (MBS items 704, 706, 710 to 1 May 2010 thereafter 715) per 100 Aboriginal and Torres Strait Islander people aged ≥15 years in regional Sentinel Sites and the rest of regional Australia, by quarter, March 2009 - May 2012..............................282
Figure G3: Number of GPs who claimed an adult health assessment (MBS items 704, 706, 710 to 1 May 2010 thereafter 715) per 100 Aboriginal and Torres Strait Islander people aged ≥15 years for remote Sentinel Sites and the rest of remote Australia, by quarter, March 2009 - May 2012...............................283
Figure G4: Average number of adult health assessments (MBS items 704, 706, 710 to 1 May 2010 thereafter 715) claimed per GP in urban Sentinel Sites and the rest of urban Australia, by quarter, March 2009 - May 2012............................283
Figure G5: Average number of adult health assessments (MBS items 704, 706, 710 to 1 May 2010 thereafter 715) claimed per GP in regional Sentinel Sites and the rest of regional Australia, by quarter, March 2009 - May 2012.................284
Figure G6: Average number of adult health assessments (MBS items 704, 706, 710 to 1 May 2010 thereafter 715) claimed per GP in remote Sentinel Sites and the rest of remote Australia, by quarter, March 2009 - May 2012..................284
Figure I1: Follow-up allied health services (MBS items 81300-81360) per 100 Aboriginal and Torres Strait Islander people aged ≥15 years March - May 2012 quarter in relation to the number of ICDP workers by end of June 2011........................................................................................................................294
Figure I2: Tier 1 payments per 100 Aboriginal and Torres Strait Islander people (December 2011 - May 2012) in relation to the number of ICDP workers by end of June 2011................................................................................................295
Tables
Table A1: Program logic - ICDP wide............................................................................................2Table A2: Program logic A1 - National action to reduce Indigenous smoking rates.....................4Table A3: Program logic A2 - Helping Indigenous people reduce their risk of chronic
disease........................................................................................................................5Table A4: Program logic A3 - Local Indigenous community campaigns to promote
better health...............................................................................................................6Table A5: Program logic B1 - Subsidising PBS Medicine Co-payments.........................................7Table A6: Program logic B3 (part A) - Supporting primary care providers to
coordinate chronic disease management...................................................................8Table A7: Program logic B3 (part B) - Supporting primary care providers to
coordinate chronic disease management...................................................................9Table A8: Program logic B4 - Helping Indigenous people self-manage their chronic
disease......................................................................................................................10Table A9: Program logic B5 (part A) - Increasing access to specialist and
multidisciplinary team care.......................................................................................11Table A10: Program logic B5 (part B) - Increasing access to specialist and
multidisciplinary team care.......................................................................................12Table A11: Program logic C1 - Workforce support, education and training...............................13Table A12: Program logic C2 - Expanding the outreach and service capacity of
Indigenous Health Services.......................................................................................14Table A13: Program logic C3 - Engaging Divisions of General Practice to improve
Indigenous access to mainstream primary care........................................................15Table A14: Program logic C5 - Clinical practice and decision support guidelines.......................16Table B1: Data sources for site characteristics...........................................................................17Table B8: ICDP funded allocations and recruitment, Canberra, February 2011 –
October 2012............................................................................................................60Table B10: ICDP funded allocations and recruitment, Dandenong, June 2011 -
October 2012............................................................................................................67Table B17: ICDP funded allocations and recruitment, Geraldton, February 2011 –
October 2012..........................................................................................................109Table B19: ICDP funded allocations and recruitment, Gladstone, June 2011 –
October 2012..........................................................................................................115Table B21: ICDP funded allocations and recruitment, Grafton, February 2011–
October 2012..........................................................................................................122Table B23: ICDP funded allocations and recruitment, Hobart, February 2011 –
October 2012..........................................................................................................128Table B25: ICDP funded allocations and recruitment, Kalgoorlie, June 2011 - October
2012........................................................................................................................135Table B30: ICDP funded allocations and recruitment, North Lakes/Caboolture, June
2011 - October 2012...............................................................................................163Table C1: Population size projections for Sentinel Sites and the rest of Australia by
age and gender and urban, regional and remote locations, 2009-2012.................189Table C2: Components of the focus group framework.............................................................205Table C3: Interview tools..........................................................................................................209
Table C4: Types of key informant interviews...........................................................................210Table D1: Number of evaluation visits to case study sites, overall and by rurality...................223Table D2: Number of respondents to key informant interviews held in case study
sites, by interview type, position, sector and evaluation cycle...............................223Table D3: Number of interviews held in case study sites, by rurality and evaluation
cycle........................................................................................................................224Table D4: Interview implementation methods in case study sites, by evaluation cycle...........224Table D5: Number of Outreach Workers, Healthy Lifestyle Workers, Tobacco Action
Workers and Regional Tobacco Coordinators interviewed, by rurality and positions recruited, across evaluation cycles..........................................................224
Table D6: Number of individuals from case study sites interviewed over successive cycles.......................................................................................................................225
Table D7: Number of focus groups and participants from case study sites, overall and by rurality and gender......................................................................................226
Table D8: Number of individual community focus group participants from case study sites over successive cycles.....................................................................................226
Table D9: Number of focus groups for each domain/ICDP measure, by evaluation cycle and rurality.....................................................................................................227
Table E1: Numbers of Health Services that provided clinical indicator data, and numbers of Aboriginal and/or Torres Strait Islander patients, overall and by sector.................................................................................................................232
Table E2: Number of individual Health Services that provided clinical indicator data over the course of the Sentinel Sites Evaluation, overall and by sector..................233
Table E3: Report type, by sector and evaluation cycle.............................................................234Table E4: Numbers of Aboriginal and Torres Strait Islander patients on diabetes
registers, by Aboriginal Health Service and evaluation cycle..................................243Table E5: Number of Aboriginal and Torres Strait Islander patients on diabetes
registers, by General Practice and evaluation cycle................................................248Table F1: Number of people aged ≥15 years accessing medicines through the PBS
Co-payment measure for Aboriginal and Torres Strait Islander people aged ≥15 for Sentinel Sites and the rest of Australia, by age, September 2010 - May 2012.....................................................................................................261
Table F2: Number of people aged ≥15 years accessing medicines through the PBS Co-payment measure per 100 Aboriginal and Torres Strait Islander people aged ≥15 for Sentinel Sites and the rest of Australia, by age, September 2010 - May 2012...................................................................................262
Table F3: Anatomical Therapeutic Chemical Classification.......................................................263Table F4: Number of prescriptions for Aboriginal and Torres Strait Islander people
aged ≥15 years for medicines supplied through the PBS Co-payment measure for Sentinel Sites and the rest of Australia, by Anatomical Therapeutic Chemical category, September 2010 - May 2012...............................265
Table F5: Number of prescriptions for people aged ≥15 years for medicines supplied through the PBS Co-payment measure per 100 Aboriginal and Torres Strait Islander people aged ≥15 for Sentinel Sites and the rest of Australia, by Anatomical Therapeutic Chemical category, September 2010 - May 2012..............................................................................................................267
Table F6: Percentage of prescriptions for Aboriginal and Torres Strait Islander people aged ≥15 years for medicines supplied through the PBS Co-payment measure for Sentinel Sites and the rest of Australia, by Anatomical Therapeutic Chemical category, September 2010 - May 2012............269
Table F7: Percentage of people aged ≥15 years in Ordinary, Concessional and Repatriation Pharmaceutical Benefits Scheme categories accessing medicines through the PBS Co-payment measure for Sentinel Sites and the rest of Australia, by age, September 2010 - May 2012.....................................271
Table G1: Adult health assessments (MBS items 704, 706, 710 to 1 May 2010 thereafter 715) claimed per 100 Aboriginal and Torres Strait Islander people aged ≥15 years for Sentinel Sites and the rest of Australia, by gender, age, rurality and quarter, March 2009 - May 2012....................................274
Table G2: Number of adult health assessments (MBS items 704, 706, 710 to 1 May 2010 thereafter 715) claimed for Aboriginal and Torres Strait Islander people aged ≥15 years, for Sentinel Site and the rest of Australia by, gender, age, rurality and quarter, March 2009 - May 2012....................................275
Table G3: Number of GPs who claimed an adult health assessment (MBS items 704, 706, 710 to 1 May 2010 thereafter 715) per 100 Aboriginal and Torres Strait Islander people aged ≥15 years for Sentinel Sites and the rest of Australia, by quarter, March 2009 - May 2012.......................................................276
Table G4: Number of GPs who claimed an adult health assessment (MBS items 704, 706, 710 to 1 May 2010 thereafter 715) per 100 Aboriginal and Torres Strait Islander people aged ≥15 years for urban Sentinel Sites and the rest of urban Australia, by quarter, March 2009 - May 2012.........................................276
Table G5: Number of GPs who claimed an adult health assessment (MBS items 704, 706, 710 to 1 May 2010 thereafter 715) per 100 Aboriginal and Torres Strait Islander people aged ≥15 years for regional Sentinel Sites and the rest of regional Australia, by quarter, March 2009 - May 2012..............................276
Table G6: Number of GPs who claimed an adult health assessment (MBS items 704, 706, 710 to 1 May 2010 thereafter 715) per 100 Aboriginal and Torres Strait Islander people aged ≥15 years for remote Sentinel Sites and the rest of remote Australia, by quarter, March 2009 - May 2012...............................276
Table G7: Average number of adult health assessments (MBS items 704, 706, 710 to 1 May 2010 thereafter 715) claimed per GP in Sentinel Sites and the rest of Australia, by quarter, March 2009 - May 2012...................................................277
Table G8: Average number of adult health assessments (MBS items 704, 706, 710 to 1 May 2010 thereafter 715) claimed per GP in urban Sentinel Sites and the rest of urban Australia, by quarter, March 2009 - May 2012............................277
Table G9: Average number of adult health assessments (MBS items 704, 706, 710 to 1 May 2010 thereafter 715) claimed per GP in regional Sentinel Sites and the rest of regional Australia, by quarter, March 2009 - May 2012........................277
Table G10: Average number of adult health assessments (MBS items 704, 706, 710 to 1 May 2010 thereafter 715) claimed per GP in remote Sentinel Sites and the rest of remote Australia, by quarter, March 2009 - May 2012..................277
Table G11: Follow-up by a practice nurse or registered Aboriginal Health Worker (MBS item 10987) per 100 Aboriginal and Torres Strait Islander people aged ≥15 years, for Sentinel Site and the rest of Australia by, gender, age, rurality and quarter, March 2009 - May 2012.........................................................278
Table G12: Numbers of follow-up by a practice nurse or registered Aboriginal Health Worker (MBS item 10987), claimed for Aboriginal and Torres Strait Islander people aged ≥15 years, for Sentinel Site and the rest of Australia by, gender, age, rurality and quarter, March 2009 - May 2012..............................279
Table G13: Follow-up by allied health professionals (MBS items 81300–81360) per 100 Aboriginal and Torres Strait Islander people aged ≥15 years, for Sentinel Site and the rest of Australia by, gender, age, rurality and quarter, March 2009 - May 2012............................................................................280
Table G14: Number of follow-up by allied health professionals (MBS items 81300–81360), claimed for Aboriginal and Torres Strait Islander people aged ≥15 years, for Sentinel Site and the rest of Australia by, gender, age, rurality and quarter, March 2009 - May 2012.....................................................................281
Table H1: Registration for the PBS Co-payment measure among PIP Indigenous Health Incentive registrants in 2010 for Sentinel Sites and the rest of Australia, by rurality, age and gender.....................................................................285
Table H2: Number of patients registered (PIP Indigenous Health Incentive patient registration payment) in the Sentinel Sites and the rest of Australia by rurality, sector and quarter, March 2010 - May 2012.............................................286
Table H3: Number of people registered (PIP Indigenous Health Incentive patient registration payment) per 100 Aboriginal and Torres Strait Islander people aged ≥15 years in the Sentinel Sites and the rest of Australia by rurality, sector and quarter, March 2010 - May 2012.............................................287
Table H4: Number of people for whom Tier 1 and Tier 2 PIP Indigenous Health Incentive payments were made, by sector in 2010 and 2011.................................288
Table H5: Percentage of people for whom Tier 1 and Tier 2 PIP Indigenous Health Incentive payments were made by sector in 2010 and 2011..................................289
Table H6: Three quarter rolling averages of Tier 1 payments for Sentinel Sites and the rest of Australia, by rurality and sector, 2010-2012..........................................290
Table H7: Three quarter rolling averages of Tier 1 payments per 100 Aboriginal and Torres Strait Islander people for Sentinel Sites and the rest of Australia, by rurality and sector 2010-2012............................................................................291
Sentinel Sites Evaluation: Final Report – Appendices – February 2013
Table I1: Correlations between services use variables.............................................................298
Abbreviations
The following abbreviations are used in this document:
ABS Australian Bureau of Statistics
ACCHS Aboriginal Community Controlled Health Service
AGPN Australian General Practice Network
AHS Aboriginal Health Service
AHW Aboriginal Health Worker
ASGC-RA Australian Standard Geographical Classification - Rurality Areas
CCSS Care Coordination & Supplementary Services
DGP Division of General Practice
DoHA Department of Health and Ageing
FTE Full Time Equivalent
GP General Practitioner
HLW Healthy Lifestyle Workers
ICDP Indigenous Chronic Disease Package
IHPO Indigenous Health Project Officer
MBS Medicare Benefits Schedule
ML Medicare Local
MSOAP-ICD Medical Specialist Outreach Assistance Program – Indigenous Chronic Disease
NACCHO National Aboriginal Community Controlled Health Organisation
OW Outreach Worker
PBS Pharmaceuticals Benefit Scheme
PIP Practice Incentives Program
QUMAX Quality Use of Medicines Maximised for Aboriginal and Torres Strait Islander People
RTC Regional Tobacco Coordinator
SBO State-Based Organisations
SLA Statistical Local Area
SSE Sentinel Sites Evaluation
TAW Tobacco Action Worker
USOAP Urban Specialist Outreach Assistance Program
1
Sentinel Sites Evaluation: Final Report – Appendices – February 2013
Appendix A. National Framework
A National Monitoring and Evaluation Framework (referred to in the Final Report as the ‘National Framework’) for the ICDP was developed by Urbis to guide the implementation and subsequently the monitoring and evaluation of the ICDP.1 This appendix includes the program logics as described in the National Framework. These program logics define the internal logic of the measure, and link the individual measure’s aims, inputs and activities to intended results over the different periods of implementation for each of the measures and for the overall ICDP. Within the National Framework there is additional information and detail for each measure on key evaluation questions, indicators, data sources and the appropriate data collection frequency.
Program logic - ICDP wide
Table A1: Program logic - ICDP wide
Closing the Gapultimate outcome
The gap in life expectancy between Indigenous and non-Indigenous Australians is closed within a generation.
ICDP Long term outcome (year10+)
The rates of chronic disease morbidity and mortality among Indigenous Australians are reduced. The disparities in chronic disease morbidity and mortality between Indigenous and non-Indigenous
Australians are reduced. There is continuing reduction in the incidence of preventable chronic disease risk factors among
Indigenous Australians.
Med
ium
term
resu
lts Late
-med
ium
term
(yea
rs 5
-10)
There is a reduction in the incidence of preventable chronic disease risk factors among Indigenous Australians.
Smoking rates amongst Indigenous Australians are reduced. More Indigenous Australians with or at risk of chronic disease adopt healthy lifestyle choices relating to
smoking, nutrition and exercise.
Early
-med
ium
term
(yea
r 4+)
ICDP funded health care services deliver a comprehensive and coordinated approach to chronic disease management, including increased and earlier access to primary health care, specialist and allied health services, affordable care and medicines.
More Indigenous Australians with or at risk of chronic disease actively participate in their own health care. Health outcomes are improved amongst Indigenous Australians with or at risk of chronic disease who
participate in ICDP measures. More health care providers are equipped to assist Indigenous Australians with or at risk of chronic
disease to make healthy lifestyle choices and to manage their condition. More health care providers are accessed by and provide quality care to Indigenous Australians with or at
risk of chronic disease. There is an increase in the workforce providing primary health care and other health services to
Indigenous Australians.
1 Urbis, ICDP Monitoring and Evaluation Framework, September 2010, ICDP Monitoring and Evaluation Framework, September 2010 (accessed 23 January 2013).
2
Sentinel Sites Evaluation: Final Report – Appendices – February 2013
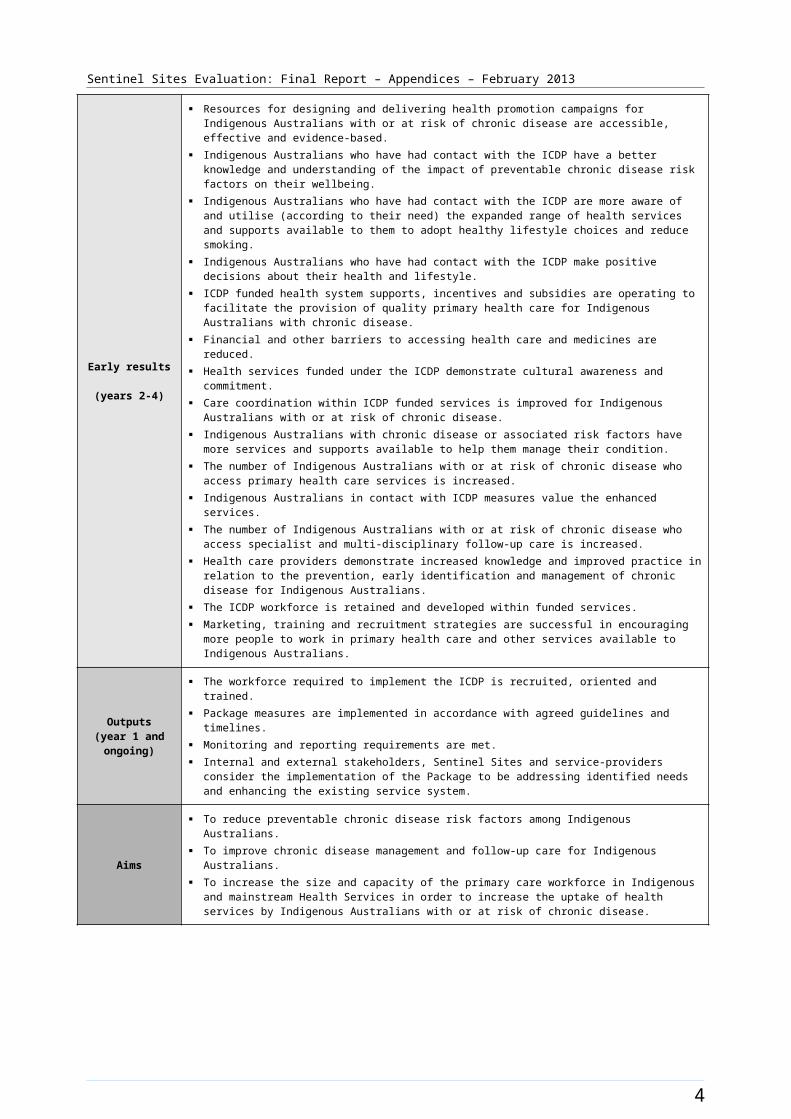
Early results (years 2-4)
Resources for designing and delivering health promotion campaigns for Indigenous Australians with or at risk of chronic disease are accessible, effective and evidence-based.
Indigenous Australians who have had contact with the ICDP have a better knowledge and understanding of the impact of preventable chronic disease risk factors on their wellbeing.
Indigenous Australians who have had contact with the ICDP are more aware of and utilise (according to their need) the expanded range of health services and supports available to them to adopt healthy lifestyle choices and reduce smoking.
Indigenous Australians who have had contact with the ICDP make positive decisions about their health and lifestyle.
ICDP funded health system supports, incentives and subsidies are operating to facilitate the provision of quality primary health care for Indigenous Australians with chronic disease.
Financial and other barriers to accessing health care and medicines are reduced. Health services funded under the ICDP demonstrate cultural awareness and commitment. Care coordination within ICDP funded services is improved for Indigenous Australians with or at risk of
chronic disease. Indigenous Australians with chronic disease or associated risk factors have more services and supports
available to help them manage their condition. The number of Indigenous Australians with or at risk of chronic disease who access primary health care
services is increased. Indigenous Australians in contact with ICDP measures value the enhanced services. The number of Indigenous Australians with or at risk of chronic disease who access specialist and multi-
disciplinary follow-up care is increased. Health care providers demonstrate increased knowledge and improved practice in relation to the
prevention, early identification and management of chronic disease for Indigenous Australians. The ICDP workforce is retained and developed within funded services. Marketing, training and recruitment strategies are successful in encouraging more people to work in
primary health care and other services available to Indigenous Australians.
Outputs(year 1 and ongoing)
The workforce required to implement the ICDP is recruited, oriented and trained. Package measures are implemented in accordance with agreed guidelines and timelines. Monitoring and reporting requirements are met. Internal and external stakeholders, Sentinel Sites and service-providers consider the implementation of
the Package to be addressing identified needs and enhancing the existing service system.
Aims
To reduce preventable chronic disease risk factors among Indigenous Australians. To improve chronic disease management and follow-up care for Indigenous Australians. To increase the size and capacity of the primary care workforce in Indigenous and mainstream Health
Services in order to increase the uptake of health services by Indigenous Australians with or at risk of chronic disease.
3
Sentinel Sites Evaluation: Final Report – Appendices – February 2013
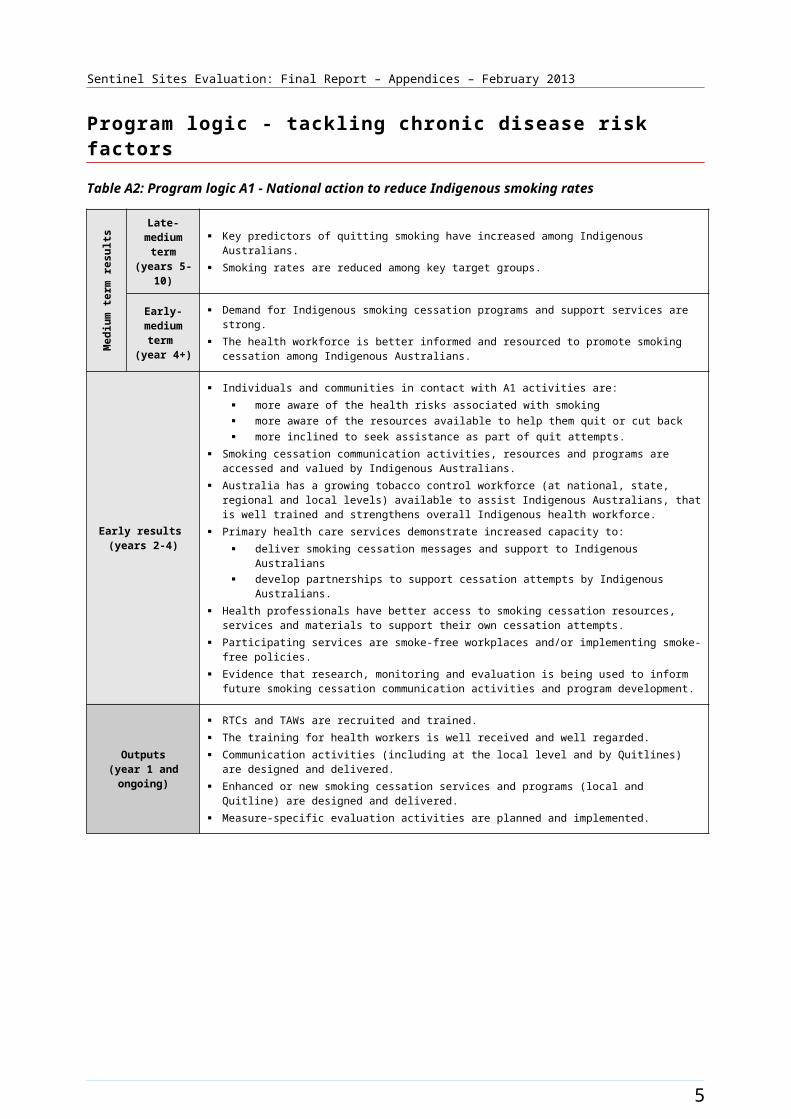
Program logic - tackling chronic disease risk factors
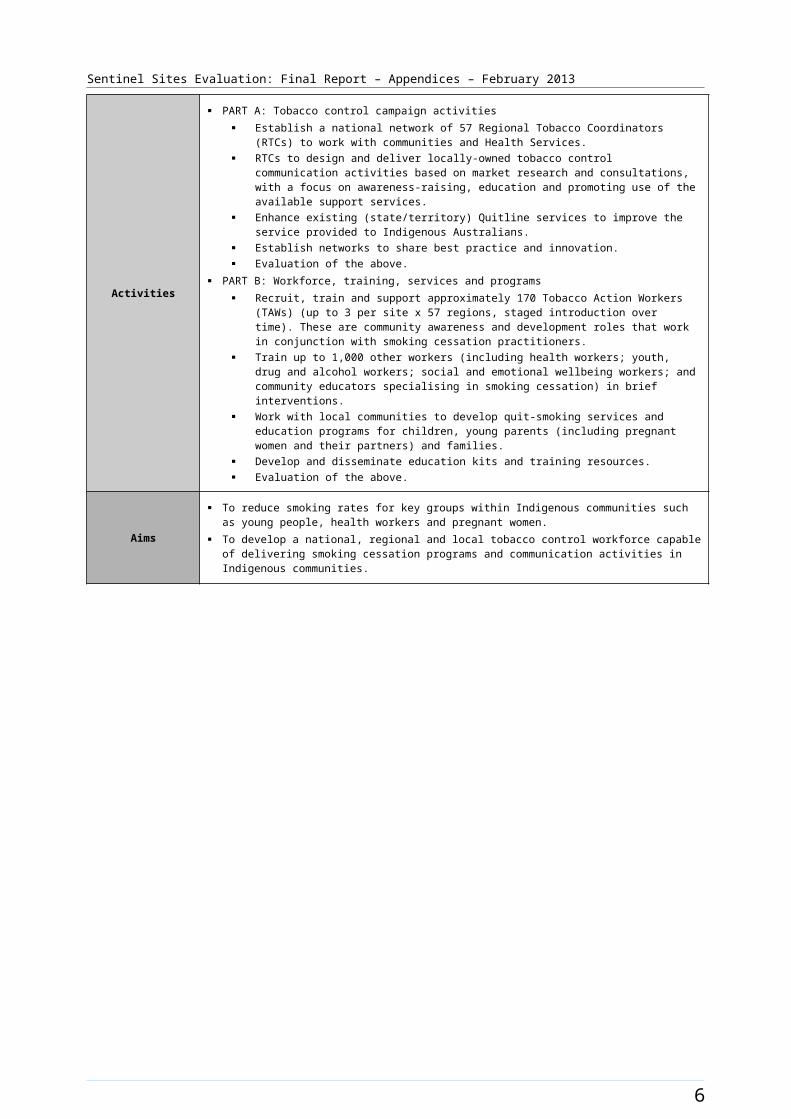
Table A2: Program logic A1 - National action to reduce Indigenous smoking rates
Med
ium
term
resu
lts Late-medium
term (years 5-10)
Key predictors of quitting smoking have increased among Indigenous Australians. Smoking rates are reduced among key target groups.
Early-medium
term (year 4+)
Demand for Indigenous smoking cessation programs and support services are strong. The health workforce is better informed and resourced to promote smoking cessation among
Indigenous Australians.
Early results (years 2-4)
Individuals and communities in contact with A1 activities are: more aware of the health risks associated with smoking more aware of the resources available to help them quit or cut back more inclined to seek assistance as part of quit attempts.
Smoking cessation communication activities, resources and programs are accessed and valued by Indigenous Australians.
Australia has a growing tobacco control workforce (at national, state, regional and local levels) available to assist Indigenous Australians, that is well trained and strengthens overall Indigenous health workforce.
Primary health care services demonstrate increased capacity to: deliver smoking cessation messages and support to Indigenous Australians develop partnerships to support cessation attempts by Indigenous Australians.
Health professionals have better access to smoking cessation resources, services and materials to support their own cessation attempts.
Participating services are smoke-free workplaces and/or implementing smoke-free policies. Evidence that research, monitoring and evaluation is being used to inform future smoking cessation
communication activities and program development.
Outputs(year 1 and ongoing)
RTCs and TAWs are recruited and trained. The training for health workers is well received and well regarded. Communication activities (including at the local level and by Quitlines) are designed and delivered. Enhanced or new smoking cessation services and programs (local and Quitline) are designed and
delivered. Measure-specific evaluation activities are planned and implemented.
Activities
PART A: Tobacco control campaign activities Establish a national network of 57 Regional Tobacco Coordinators (RTCs) to work with
communities and Health Services. RTCs to design and deliver locally-owned tobacco control communication activities based on
market research and consultations, with a focus on awareness-raising, education and promoting use of the available support services.
Enhance existing (state/territory) Quitline services to improve the service provided to Indigenous Australians.
Establish networks to share best practice and innovation. Evaluation of the above.
PART B: Workforce, training, services and programs Recruit, train and support approximately 170 Tobacco Action Workers (TAWs) (up to 3 per site
x 57 regions, staged introduction over time). These are community awareness and development roles that work in conjunction with smoking cessation practitioners.
Train up to 1,000 other workers (including health workers; youth, drug and alcohol workers; social and emotional wellbeing workers; and community educators specialising in smoking cessation) in brief interventions.
Work with local communities to develop quit-smoking services and education programs for children, young parents (including pregnant women and their partners) and families.
Develop and disseminate education kits and training resources. Evaluation of the above.
Aims
To reduce smoking rates for key groups within Indigenous communities such as young people, health workers and pregnant women.
To develop a national, regional and local tobacco control workforce capable of delivering smoking cessation programs and communication activities in Indigenous communities.
4
Sentinel Sites Evaluation: Final Report – Appendices – February 2013
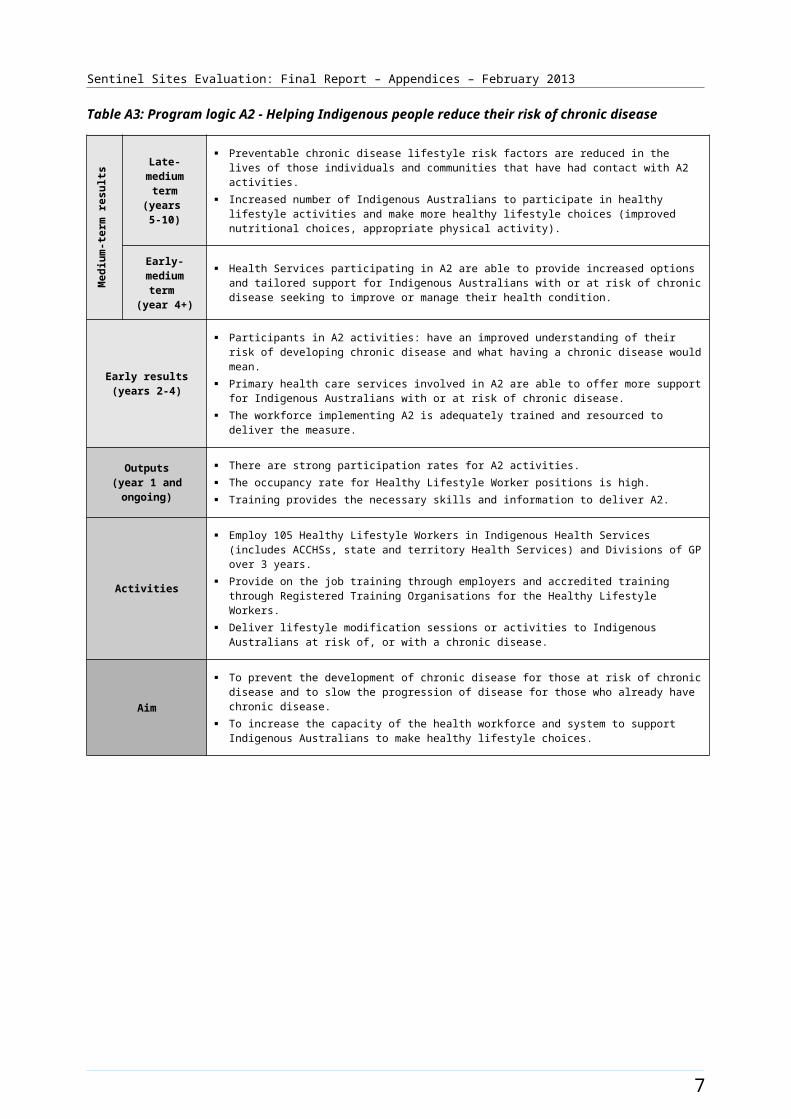
Table A3: Program logic A2 - Helping Indigenous people reduce their risk of chronic diseaseM
ediu
m-te
rm re
sults Late-medium
term (years 5-10)
Preventable chronic disease lifestyle risk factors are reduced in the lives of those individuals and communities that have had contact with A2 activities.
Increased number of Indigenous Australians to participate in healthy lifestyle activities and make more healthy lifestyle choices (improved nutritional choices, appropriate physical activity).
Early-medium term
(year 4+)
Health Services participating in A2 are able to provide increased options and tailored support for Indigenous Australians with or at risk of chronic disease seeking to improve or manage their health condition.
Early results(years 2-4)
Participants in A2 activities: have an improved understanding of their risk of developing chronic disease and what having a chronic disease would mean.
Primary health care services involved in A2 are able to offer more support for Indigenous Australians with or at risk of chronic disease.
The workforce implementing A2 is adequately trained and resourced to deliver the measure.
Outputs(year 1 and ongoing)
There are strong participation rates for A2 activities. The occupancy rate for Healthy Lifestyle Worker positions is high. Training provides the necessary skills and information to deliver A2.
Activities
Employ 105 Healthy Lifestyle Workers in Indigenous Health Services (includes ACCHSs, state and territory Health Services) and Divisions of GP over 3 years.
Provide on the job training through employers and accredited training through Registered Training Organisations for the Healthy Lifestyle Workers.
Deliver lifestyle modification sessions or activities to Indigenous Australians at risk of, or with a chronic disease.
Aim
To prevent the development of chronic disease for those at risk of chronic disease and to slow the progression of disease for those who already have chronic disease.
To increase the capacity of the health workforce and system to support Indigenous Australians to make healthy lifestyle choices.
5
Sentinel Sites Evaluation: Final Report – Appendices – February 2013
Table A4: Program logic A3 - Local Indigenous community campaigns to promote better health
Medium term results(years 4+)
Increased evidence base to inform future investments in communications that promote chronic disease prevention and management in Aboriginal and Torres Strait Islander communities
Participants sustain healthy lifestyle choices Participants have reduction in the incidence and prevalence of clinical risk factors
associated with chronic disease Participants increase their use of primary health care services Communities have increased and have sustainable capacity to undertake community level
campaigns
Early results(years 2-4)
Local community based campaigns are ‘evidence’ based. Enhanced community understanding of health risks and benefits associated with lifestyle
choices Participants increasingly make more healthy lifestyle choices Participants have increased awareness of importance of accessing primary health care Funds for grants and events are spent efficiently Local organisations share knowledge about campaigns and actively participate in forums Enhanced networking across communities Action packs are beneficial to the design and implementation of community campaigns Enhanced community capacity to initiate local campaigns Sustained participation of community members in the community campaign activities
Key Outputs(year 1 and ongoing)
Research report that enables improved program design & enhances knowledge base of chronic disease strategy options
Local indigenous media organisations and/or community groups involved in local or regional campaigns
Implemented community campaigns Events undertaken Functional and resourced website that is maintained Level and nature of participation in forums Community Health Action Packs
Activities
Consult Indigenous communities on appropriate practices for local social marketing Conduct literature research on better practices in social marketing in Indigenous
communities Grant application assessed and funding provided across Australia according to service
delivery principles Community participates in the design of local projects Expressions of interest assessed and funding provided across Australia according to
service delivery principles. Develop website Organise and facilitate information sharing e.g. forums Develop and distribute Community Health Action Packs
Aim To deliver locally generated and relevant health promotion initiatives that target Indigenous
Australians at risk of chronic disease, including groups who have low engagement with Health Services.
Note: This is the updated program logic for Measure A3 undertaken by KMPG and has been provided by DoHA.
6
Sentinel Sites Evaluation: Final Report – Appendices – February 2013
Program logic - earlier detection, management and follow-up of chronic disease
Table A5: Program logic B1 - Subsidising PBS Medicine Co-payments
Medium-term results(year 4+)
The utilisation of Pharmaceutical Benefits Scheme (PBS) medicines by Indigenous Australians with or at risk of chronic disease is increased.
Early results(years 2-4)
The financial barrier to using PBS medicines is reduced or removed for eligible Indigenous Australians with or at risk of chronic disease who participate in the program.
Outputs(year 1 and ongoing)
Indigenous Health Services participate in the program. General practices participate in the program (after first satisfying the requirements of the Practice
Incentives Program and Indigenous Health Incentive Program). Eligible Indigenous Australians with or at risk of chronic disease participate in the program. Updated prescriber and pharmacy software products are used by prescribers and dispensers.
Activities
Reduce or eliminate Co-payments for eligible patients when purchasing PBS medicines at community pharmacies and other PBS access points (reflected in legislation).
Consult with stakeholders and provide information on the measure to Indigenous Health Services, General Practices, community pharmacies and other PBS access points.
Provide incentive payments to providers of pharmacy and prescriber software to update software products to accommodate the measure.
Aim To improve access to PBS medicines for eligible Indigenous Australians with or at risk of chronic disease.
7

Sentinel Sites Evaluation: Final Report – Appendices – February 2013
Table A6: Program logic B3 (part A) - Supporting primary care providers to coordinate chronic disease management
Medium-term results(year 4+)
Registered practices (General Practices and Indigenous Health Services) are better equipped to provide an enhanced standard of care for Indigenous Australians with chronic disease.
Participating patients are more satisfied with their care.
Early results(years 2-4)
Participating patients receive the target level of care. Practices offer care management plans and team care coordination as per the requirements of the
measure. General Practice staff to demonstrate increased knowledge and cultural awareness. Participating patients receive additional and complementary health services. Participating patients value the enhanced services.
Outputs(year 1 and ongoing)
Eligible practices (General Practices and Indigenous Health Services) are aware of the Practice Incentives Program (PIP) Indigenous Health Incentive (IHI) and the level of care they are to provide.
Eligible practices (General Practices and Indigenous Health Services) register for the measure (i.e. access one-off payment).
Registered practices have measures in place to encourage the registration of eligible Indigenous Australians.
Eligible Indigenous Australians consent to participate. Registered General Practices attend cultural awareness training within 12 months.
Activities
Introduce an Indigenous Health Incentive under the Practice Incentives Program (PIP): A one-off payment to eligible practices (General Practices and Indigenous Health Services)
that agree to undertake specified activities to improve provision of care for Indigenous Australians with a chronic disease, including establishing and using a mechanism to follow-up their Indigenous patients, and undertaking cultural awareness training (Sign-on payment).
Practice payments for every eligible Indigenous Australian aged 15 years and over registered with the practice for chronic disease management each calendar year (Patient registration payment)
Practice payment for each registered patient for whom a target level of care is provided by the practice in a calendar year (Tier 1 outcome payment).
Payment to practices for providing the majority of care for a registered patient in a calendar year (Tier 2 outcome payment).
Communicate the intent of the measure and the availability of practice payments.
Aim To support General Practices and Indigenous Health Services to provide better health care for Indigenous Australians, including best practice management of chronic disease.
8
Sentinel Sites Evaluation: Final Report – Appendices – February 2013
Table A7: Program logic B3 (part B) - Supporting primary care providers to coordinate chronic disease management
Medium-term results(year 4+)
The barriers to accessing services necessary in the management of chronic diseases are overcome. There is increased capacity in local networks of health professionals to provide coordinated care for
Indigenous Australians with chronic disease.
Early results(years 2-4)
Indigenous Australians with chronic disease are able to obtain the health services recommended in care plans.
Appropriate referral to the Care Coordination and Supplementary Services becomes normal practice in the management of chronic disease by General Practitioners.
Outputs(year 1 and ongoing)
There is collaborative development of local CCSS arrangements (including funds management), strengthening linkages between General Practices, Indigenous Health Services, Divisions, specialists and allied health services.
Care Coordinators are trained and established in their roles. Effective local CCSS referral mechanisms are established (and appropriate referrals are made by
GP clinics and Indigenous Health Services). Assistance is provided by the CCSS in line with measure guidelines.
Activities
Employ new Care Coordinators and augment existing care coordination structures to: arrange the services identified in care plans ensure there are arrangements in place for patients to get to appointments transfer and update patients’ medical records assist patients to participate in regular reviews by their primary care provider
Assist Indigenous Australians referred to the Program to: access services in accordance with their care plans and in consultation with their home
practice adhere to treatment regimens develop chronic condition self-management skills connect with appropriate community based services.
Provide a flexible pool of funds to assist patients in the CCSS to access medical specialist and allied health services in accordance with their care plan.
Provide guidelines for the development and negotiation of local arrangements for implementing the CCSS.
Aims
To support General Practices, Indigenous Health Services and allied health professionals to provide coordinated, quality health care for Indigenous Australians with chronic disease.
To improve the patient journey through improved coordination between and within health organisations.
To remove or reduce barriers to meeting the aims of chronic disease care plans.
9

Sentinel Sites Evaluation: Final Report – Appendices – February 2013
Table A8: Program logic B4 - Helping Indigenous people self-manage their chronic disease
Medium-term results(year 4+)
Indigenous Australians with chronic disease in contact with B4 activities are better able to self-manage their health condition.
Participating Health Services have more information, staff, and resources available to support Indigenous Australians with chronic disease to self-manage their condition.
Early results(years 2-4)
Participants in B4 activities have an improved understanding of their health condition and of chronic disease.
Participants in B4 activities are better able to plan for and implement personal health goals. Primary health care services involved in B4 are able to offer more support services for Indigenous
Australians with chronic disease. The workforce implementing B4 is adequately trained and resourced to deliver the measure.
Outputs(year 1 and ongoing)
There are strong participation rates for B4 activities. Accredited courses successfully provide the necessary skills and information to deliver B4.
Activities
Train 400 existing health professionals, over 4 years, (e.g. nurses and Aboriginal Health Workers) to deliver Chronic Disease Self-Management programs to Indigenous Australians who have an established chronic disease.
Support Health Services to address a greater range of health needs, assist them to better manage specific Indigenous needs at a local level and increase collaboration between Health Services.
Aims To slow the progression of chronic disease for those with established chronic disease. To support individuals with chronic disease to self-manage their condition more effectively.
10

Sentinel Sites Evaluation: Final Report – Appendices – February 2013
Table A9: Program logic B5 (part A) - Increasing access to specialist and multidisciplinary team care
Medium-term results(year 4+)
Indigenous Australians with or at risk of chronic disease are able to access a wider range of on-going specialist care in urban locations.
The care coordination for patients that benefit from B5 services is improved.
Early results(years 2-4)
Indigenous Australians with chronic disease who are in contact with B5 services utilise and value the enhanced services.
An increasing number of specialists are able to provide services for Indigenous Australians with or at risk of chronic disease in urban primary health care locations.
Outputs(year 1 and ongoing)
Effective fundholding arrangements are in place in priority locations (as per work plan). Potential outreach service host organisations are informed about the Urban Specialist Outreach
Assistance Program (USOAP). Medical specialists are identified who are able to provide services in underserviced urban areas. Participating medical specialists demonstrate increased cultural awareness. Increased specialist services are available to urban communities.
Activities
Establish new medical specialist outreach services for Indigenous Australians living in urban locations, particularly those with or at risk of chronic disease.
Increase access to specialist medical care in urban primary care settings for the management and treatment of chronic disease.
Ensure that all participating clinicians have undertaken appropriate cultural awareness training.
Aim To contribute to better health outcomes for Indigenous Australians through increasing access to medical specialist services in urban areas.
11
Sentinel Sites Evaluation: Final Report – Appendices – February 2013
Table A10: Program logic B5 (part B) - Increasing access to specialist and multidisciplinary team care
Medium-term results(year 4+)
Indigenous Australians with or at risk of chronic disease are able to access on-going specialist and multi-disciplinary care in rural and remote locations.
Care coordination for patients that benefit from B5 services is improved.
Early results(years 2-4)
Indigenous Australians with chronic disease who are in contact with B5 services utilise and value the enhanced services.
An increasing number of specialists and allied health professionals provide services for Indigenous Australians in rural and remote locations.
Care coordination systems and relationships between specialists, allied health professionals and primary health providers are strengthened.
Outputs(year 1 and ongoing)
Effective fundholding arrangements are in place in each state and the Northern Territory. Advisory Forums have allied health and Indigenous health representation. Potential outreach service hosts and the broader medical community are informed of the MSOAP-
ICD. Medical specialists and allied health professionals are identified who are able to provide services in
underserviced rural and remote areas. Participating health professionals demonstrate cultural awareness. More specialist and allied health professionals are available to deliver services to rural and remote
communities.
Activities
Expand provision of medical specialist outreach services for Indigenous Australians living in rural and remote locations, particularly those with or at risk of chronic disease.
Encourage multi-disciplinary working arrangements and skill sharing with rural and remote health professionals.
Ensure that all participating clinicians have undertaken cultural awareness training.
Aim To increase access to a range of Health Services, including expanded primary health care, provided
to people in rural and remote Indigenous communities for the treatment and management of chronic disease.
12
Sentinel Sites Evaluation: Final Report – Appendices – February 2013
Program logic - workforce expansion and support
Table A11: Program logic C1 - Workforce support, education and training
Medium-term results(year 4+)
There are more people working in the health workforce who are trained to provide quality primary health care to Indigenous Australians.
Participants in C1 activities intend to continue working in primary health care and other services assisting Indigenous Australians.
Primary health care services improve their capacity to identify and provide quality care for Indigenous Australians with or at risk of chronic disease.
Early results(years 2 - 4)
Participants in C1 activities are effectively oriented, trained and supported to provide quality care to Indigenous Australians.
Participants in C1 activities value and benefit from the training and the placements.
Outputs(year 1 and ongoing)
The measure is implemented in accordance with the workplan: the workforce required to implement C1, C2 and C3 is oriented and trained 38 additional GP registrar training posts in Indigenous Health Services are allocated 50 additional nursing scholarships per year and 50 additional nursing placement s per year
are allocated.
Activities
Provide orientation and training to Aboriginal and Torres Strait Islander Outreach Workers (ATSIOWs) including:
orientation and training of 166 ATSIOWs appointed through C2 and C3 measures support and monitoring of the ATSIOWs through collaborative networks two national ATSIOW workshops/conferences.
Fund additional GP registrar training posts in Indigenous Health Services, building on and managed by the GP Education and Training (GPET) Program.
Fund 50 additional nursing scholarships per year and 50 additional nursing placement scholarships per year administered through the Nursing Scholarship and Placement Program.
Aims
To expand the primary health care workforce assisting Indigenous Australians, through employment, education and training initiatives.
To increase the capacity of Indigenous and mainstream health organisations to provide continuity of care for Indigenous Australians with chronic and complex health conditions.
To encourage trainee health professionals to work in primary health care services assisting Indigenous Australians.
13
Sentinel Sites Evaluation: Final Report – Appendices – February 2013
Table A12: Program logic C2 - Expanding the outreach and service capacity of Indigenous Health Services
Medium-term results(year 4+)
Access to Aboriginal Community Controlled Health Services (ACCHSs) for Indigenous Australians with or at risk of chronic disease is improved.
ACCHSs enhance their system and workforce capacity to respond to increased service demand. Aboriginal and Torres Strait Islander Outreach Workers (ATSIOWs) have established effective
community links to increase access to ACCHSs and other Health Services by Indigenous Australians.
Early results (years 2-4)
Practice managers have developed or enhanced practice systems to ensure effective recall, referral and follow-up for Indigenous Australians with or at risk of chronic disease.
Stronger links are forged between ACCHSs and other health service providers to improve continuity of care for Indigenous Australians with or at risk of chronic disease.
Collaboration is improved between participating ACCHSs and other health providers to identify and address barriers to the provision of primary health care to Indigenous Australians.
Indigenous Australians in contact with participating primary health care providers utilise and value the enhanced services.
Outputs(year 1 and ongoing)
The measure is implemented in accordance with the workplan, e.g.: 86 ATSIOWs, 43 practice managers and 33 additional health workforce positions are
recruited and retained capital infrastructure works relevant to this measure are undertaken.
Activities
Fund 86 full-time equivalent ATSIOW positions to be filled by local Indigenous Australians in Aboriginal Community Controlled Health Services.
Fund 43 practice managers. Fund 33 additional health workforce positions to support rural and remote services meet expected
increase in service demand. Fund capital infrastructure to house/accommodate expanded workforce and fund clinic upgrades
due to service expansion.
Aims
To increase the service capacity of ACCHSs to provide care for Indigenous Australians with chronic disease.
To improve the accessibility of ACCHSs for the communities they service. To generate interest and encourage more people to work in primary health care services assisting
Indigenous Australians.
14
Sentinel Sites Evaluation: Final Report – Appendices – February 2013
Table A13: Program logic C3 - Engaging Divisions of General Practice to improve Indigenous access to mainstream primary care
Medium term results (year 4+)
Access to mainstream primary health care for Indigenous Australians with or at risk of chronic disease is increased.
General Practices deliver better quality primary health care to Indigenous Australians. Aboriginal and Torres Strait Islander Outreach Workers (ATSIOWs) have established effective
community links to increase access to mainstream primary health care by Indigenous Australians.
Early results(years 2-4)
Stronger links are forged between primary health care services to assist Indigenous Australians. Collaboration is improved between participating General Practice networks and Indigenous Health
Services to identify and address barriers to the provision of primary health care to Indigenous Australians.
General Practices have a greater understanding of Indigenous Australians’ health needs and improved capacity to provide quality care.
The State-Based Organisations (SBOs) and the Australian General Practice Network (AGPN) provide effective leadership and coordination on Indigenous health activities within the Divisions’ network.
Specific initiatives addressing the needs of local Indigenous people are developed and implemented.
Indigenous Australians in contact with participating primary health care providers value the enhanced services.
Outputs(year 1 and ongoing)
The measure is implemented in accordance with the workplan: 80 ATSIOWs and 80 IHPOs positions are recruited and retained.
Activities
Funding for over 80 full-time equivalent ATSIOW positions to be filled by local Indigenous Australians, spread across Divisions of General Practice.
Funding for 80 full-time equivalent Indigenous Health Project Officers (IHPOs) in SBOs and the AGPN.2
Funding for the AGPN and SBOs to provide state/territory and national leadership and coordination of the ATSIOWs and IHPOs.
Aims
To generate interest and encourage more people to work in primary health care services assisting Indigenous Australians.
To enhance the service capacity of mainstream primary health care providers to provide care for Indigenous Australians with chronic disease.
To improve the accessibility and quality of General Practice for Indigenous Australians.
2 This is an error in the framework and it should read ‘funding for 80 FTE IHPOs in Divisions of General Practice’.
15
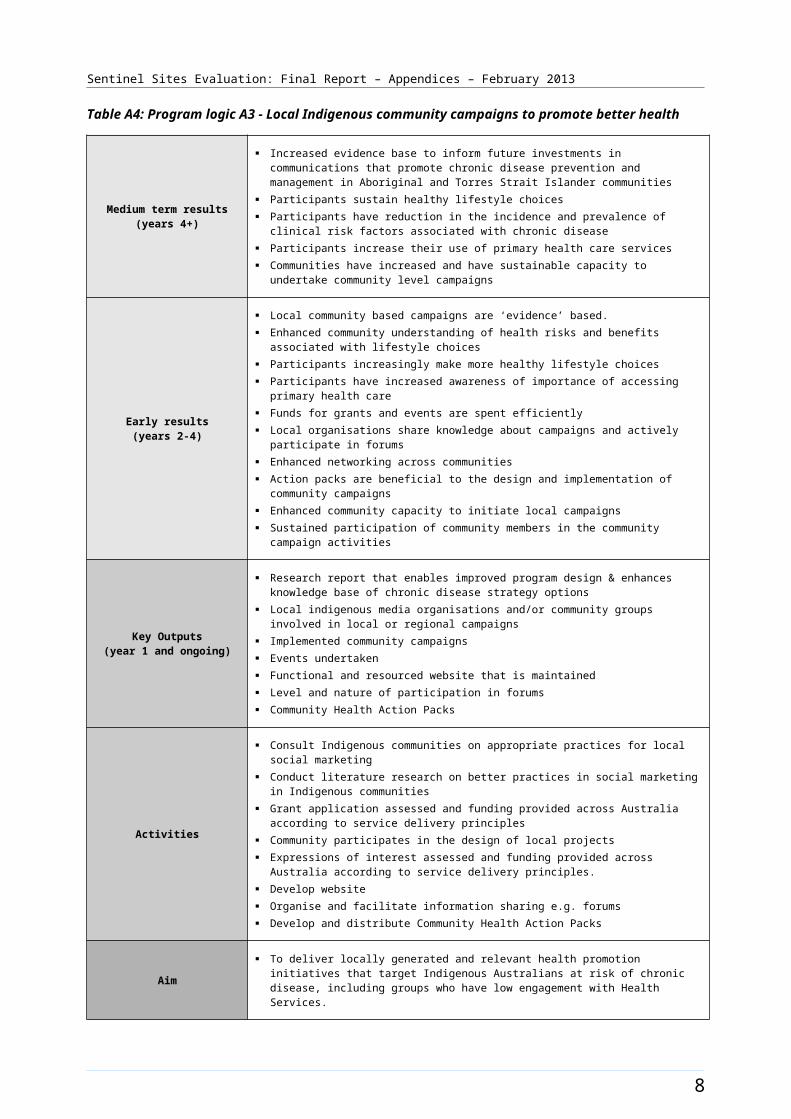
Sentinel Sites Evaluation: Final Report – Appendices – February 2013
Table A14: Program logic C5 - Clinical practice and decision support guidelines
Early results(year 2 and ongoing)
Primary health care providers have easy access to a comprehensive and useful resource which contributes to the provision of quality clinical care for Indigenous Australians with or at risk of chronic disease.
Sustainable mechanisms for maintaining resources are in place. The web-based platform for the resource is developed. The resource is piloted and adapted as required for wider dissemination. An implementation strategy is developed and applied.
Outputs(year 1)
Processes for ongoing review and updating of publicly available resources have been explored. Inclusion/exclusion criteria are developed and applied, and a body of appropriate resources
approved.
Activities
Review the literature and current resources, and identify guidelines, tools and resources which are available.
Employ a contractor to develop the web-based platform for the resource. Conduct ongoing consultation with stakeholders, including focus groups during development and
piloting of the resource.
Aim To support and promote individual primary health care providers to prevent and manage chronic disease in Indigenous Australians in an appropriate and timely manner.
16

Sentinel Sites Evaluation: Final Report – Appendices – February 2013
Appendix B. Sentinel Site description and maps
This appendix contains detailed information about individual Sentinel Sites. The description for each site contains:
a text description of the site
a map of the site boundary
a description of the site characteristics
a figure displaying ICDP funded health promotion positions, projects and events (for case study and enhanced tracking site)
a figure displaying ICDP funded positions and service developments (March 2010 - August 2012) and trends in administrative data (for case study and enhanced tracking study sites)
a table displaying all ICDP funded positions as reported, with a separate figure displaying trends in administrative data (for tracking sites).
Data sources
Site characteristics
Table B1 lists the common sources of data for the site characteristics and provides notes on interpretation of site characteristics data. All data on site characteristics were derived from the sources listed in this table; unless otherwise specified.
Table B1: Data sources for site characteristics
Reference item (in table)
Source
Site boundary (Statistical Local Area)
Australian Bureau of Statistics, Statistical Local Area (SLA) 2006.
Rurality The Australian Standard Geographical Classification – Rurality Areas (ASGC-RA) definitions. RA1 = Urban, RA2 and 3 = Regional, RA4 and 5 = Remote.
Geographic area Australian Bureau of Statistics, National Regional Profile 2006 – 2010. Australian Bureau of Statistics, National Regional Profile 2006 – 2010 (accessed 04 September 2012).
Population characteristics
Australian Bureau of Statistics, Census 2006 & 2011.
ICDP funded workforce allocation and recruitment that cover the Sentinel Site (final evaluation cycle)
DoHA program data provides workforce allocation and recruitment in Sentinel Sites, up to 30 June 2012. The site tables present the recruitment status of these ICDP positions at the time of the final evaluation. Evaluation interview data and further supplements from DoHA have been used to update these data during the evaluation period. Trends in allocation and recruitment over the evaluation period have been reflected in the measure chapters.While the allocated ICDP positions may include responsibility for the Sentinel Site, they generally cover an area that extends beyond the Sentinel Site boundaries.
Workforce allocation The population denominator is based on the whole DGP population as this is expected to be the combined reach of the Outreach Workers (OW), Indigenous Health Project
17
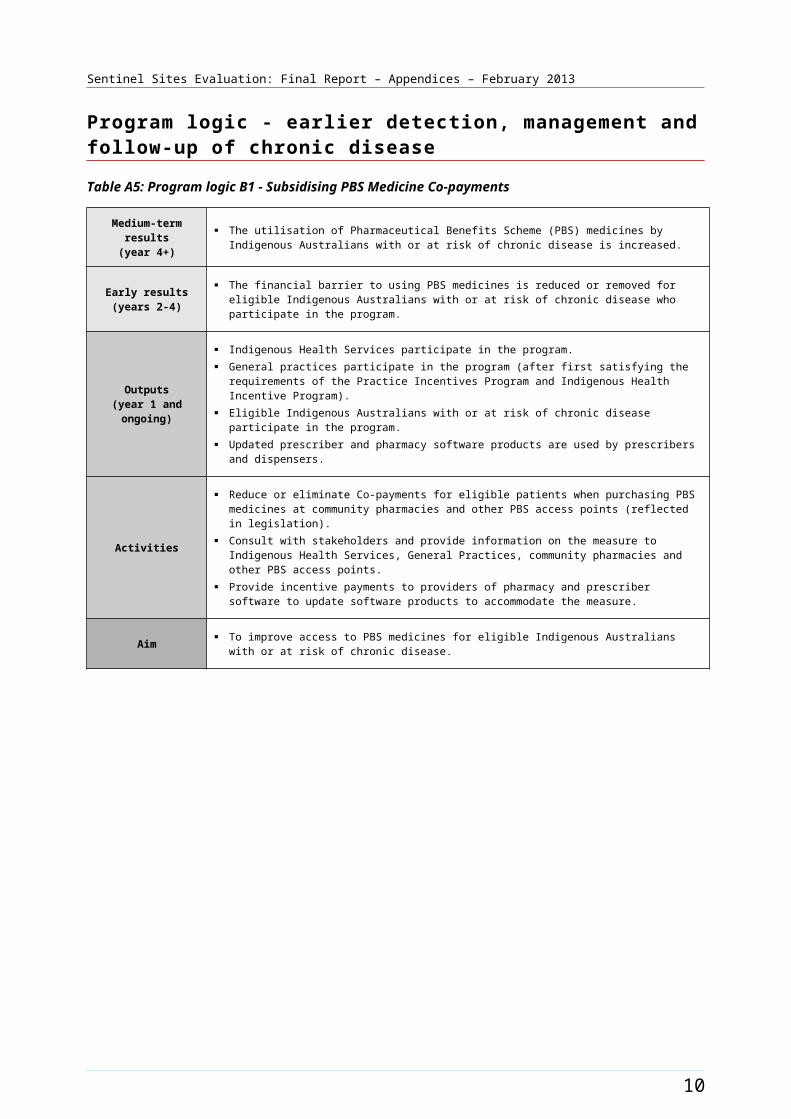
Sentinel Sites Evaluation: Final Report – Appendices – February 2013
Reference item (in table)
Source
and recruitment per10 000 Aboriginal and Torres Strait Islander people within the boundary of the DGP
Officers (IHPO), and Care Coordinators funded by the ICDP.The numerators for the workforce allocation data are based on information provided by DoHA. These data are for a period up to 25 Feb 2011 for evaluation cycle 2, up to 30 June 2011 for evaluation cycle 3, up to 31 December 2011 for evaluation cycle 4, and up to 30 June 2012 for final evaluation cycle. Where applicable other sources of information including personal communication with DGPs and AHSs and evaluation visit updates were also used to determine actual recruitment status of the ICDP funded positions during the period of the evaluation.Per 10 000 workforce allocation and recruitment calculations used the following rules: (IHPO &/or OW &/or Care Coordinator @ DGP + OW &/or Care Coordinator @ AHS) divided by Aboriginal and Torres Strait Islander population in the DGP coverage, multiplied by 10 000.There are exceptions to the population denominator and workforce numerator data used for Katherine West, Darwin, and Barkly site. For Katherine West and Barkly site the site level population data and workforce allocation for the AHS only have been used. Whereas, for Darwin, the site level population data and workforce allocation to both AHS and DGP (for Darwin only) have been used. These best reflect the workforce activities at the sites.
GP characteristics GP characteristics are for the whole of the DGP 2010-2011. There were no similarly comprehensive data available for each of the specific areas covered by the Sentinel Sites. PHCRIS Key Divisions of General Practice Characteristics 2010 - 2011 (accessed 04 September 2012).
Fulltime Working Equivalent GPs
FWE (Fulltime working equivalent) is a measure of GP workforce supply that takes into account the differing working patterns of GPs. FWE reported in place of Fulltime Equivalence (FTE) as the former is considered to be a more accurate measure. <PHCRIS Key Division of General Practice Characteristics 2010- 2011> (accessed 04 September 2012).
Healthy for Life program
Healthy for Life [website] (accessed 04 September 2012).
Medicare Local tranche
Medicare Locals Profiles- The first of Australia’s new network of primary health care organisations – Medicare Locals – commenced from 1 July 2011 (accessed 04 September 2012).
Section 100 supply arrangement
DoHA Alternative Arrangements for Medicines S100 Information Sheet (accessed 04 September 2012).
18
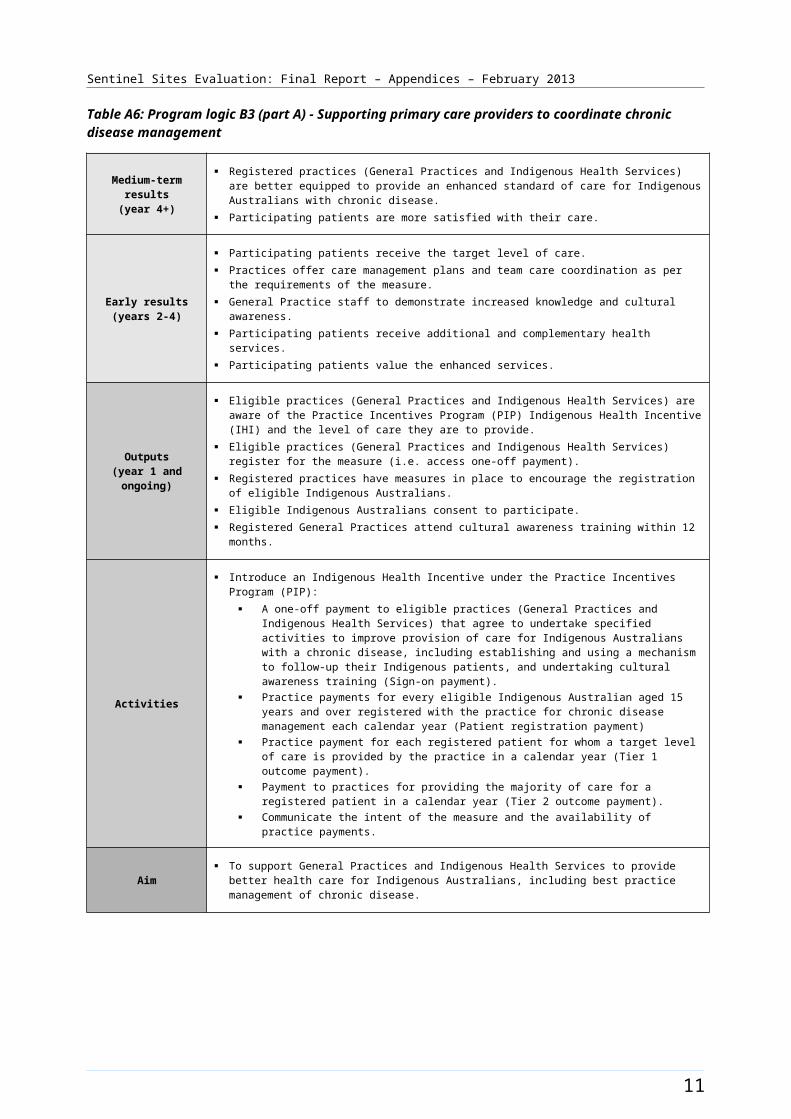
Sentinel Sites Evaluation: Final Report – Appendices – February 2013
Figures displaying ICDP funded health promotion positions, projects and events
These figures show the ICDP workers that were primarily responsible for the uptake of the ICDP funded chronic disease risk factor activity. These workers include the Tobacco Action Worker (TAW), Regional Tobacco Coordinator (RTC), Healthy Lifestyle Workers (HLW) and HLW trainees. Only workers able to be identified as having had a direct role within the Sentinel Site boundary area are displayed. Figures of this type are included for case study and enhanced tracking sites where relevant positions were allocated.
In many Sentinel Sites ICDP funded health promotion projects and events (Local Community Campaign community grants and National Healthy Community Day activities) occurred during the evaluation period. These events are marked on the timeline below the worker information where information was available and activity occurred during the evaluation period.
Each horizontal line represents the length of time an ICDP funded position has been filled.
Positions located outside the site boundary are not shown unless they had a direct role within the site. Positions that are vacant are not shown. Positions are 1.0 FTE unless otherwise specified.
Where there is more than one position of the same type, positions are numbered (e.g. pos 1, pos 2).
A discontinued line indicates a person left the position. A continued line at a lower level indicates a new person was recruited in the role.
Workers were located at Aboriginal Health Services (AHS) or at Divisions of General Practice (DGP) unless otherwise specified.
Figures displaying ICDP funded positions, service developments and trends in administrative data
These figures (with service developments and ICDP funded positions included) are provided for case study and enhanced tracking sites. The figures display trends in the uptake of various measures (as reflected by administrative data) in relation to the presence of ICDP funded workers relevant to chronic disease management and follow-up care and workforce expansion and support activity under the package. Only workers able to be identified as having had a direct role for enhancing the uptake of the ICDP measures at the site level are included in figures. These workers included the ICDP funded Indigenous Health Project Officer (IHPO), Outreach Worker (OW), Practice Manager (PM), Care Coordinator (CC) and additional health staff. Workers were located at Aboriginal Health Services (AHS) or at Divisions of General Practice (DGP) unless otherwise specified.
In a number of sites there were new service developments (such as the opening of a new facility) that may have had an influence on trends in the administrative data. Relevant service developments identified by the SSE are also marked on the timeline below the worker information where information was available.
The top section of the figure displays the ICDP funded positions and the major service developments that have occurred in the site from March 2010 – August 2012.
19
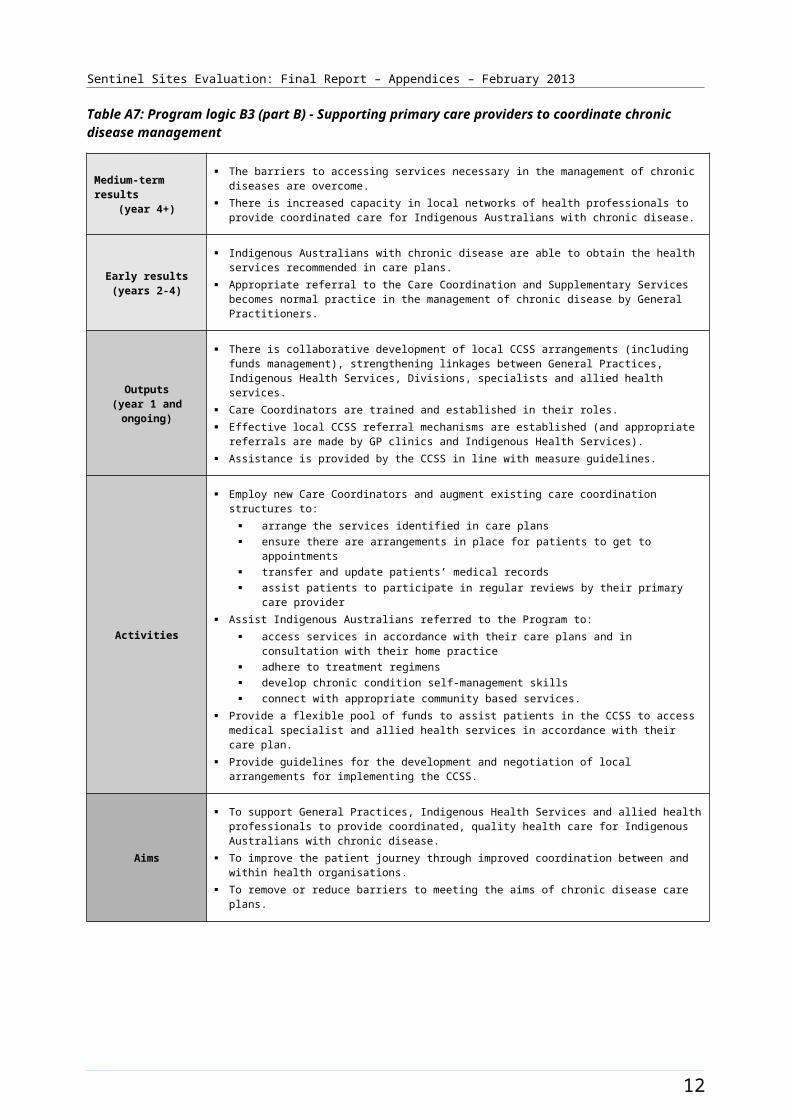
Sentinel Sites Evaluation: Final Report – Appendices – February 2013
Each horizontal line represents the length of time an ICDP funded position has been filled.
Positions located outside of site are not shown unless they have a direct role within the site. Positions that are vacant are not shown. Positions are 1.0 FTE unless otherwise specified.
Where there is more than one position of the same type, positions are numbered [e.g. position (pos) 1, position (pos) 2].
A discontinued line indicates a person left the position. A continued line at a lower level indicates a new person was recruited in the role.
The lower part of the figure displays the administrative data from March 2009 - May 2012 (unless otherwise specified). The graph in the lower part of the figure shows the uptake of various ICDP related items through payments per 100 Aboriginal and Torres Strait Islander people aged ≥15 years per quarter (except for the PBS Co-payment):
PIP Indigenous Health Incentive registrations. The PIP Indigenous Health Incentive data are shown quarter by quarter in these timelines and not as cumulative data over the year (as shown in other chapters of the report).
Tier 1 PIP Indigenous Health Incentive items.
Tier 2 PIP Indigenous Health Incentive items (annual payments).
PBS Co-payment measure data reflect the number of people who had prescriptions dispensed under the PBS Co-payment per 100 Aboriginal and Torres Strait Islander people per quarter. PBS Co-payment measure data have been divided by four for the purpose of these figures to be more comparable with other data that were analysed on a quarterly basis. This is because people may have prescriptions dispensed through the PBS Co-payment multiple times in a year, whereas the other services with substantial uptake shown in these figures can only be provided once per year. The first full quarter of data is September - November 2010 and the final quarter is March - May 2012.
Adult health assessments (MBS items 704, 706, 708, 710 to 1 May 2010 thereafter 715 for people aged ≥15 years).
Follow-up by nurse or AHW (MBS item 10987). The follow-up data have been displayed as per 100 people as opposed to per 100 adult health assessments (as shown in other chapters of the report), to demonstrate population coverage.
Follow-up allied health services (MBS items 81300-81360). The follow-up data have been displayed as per 100 people as opposed to per 100 adult health assessments (as shown in other chapters of the report), to demonstrate population coverage.
For tracking sites, a table displaying ICDP funded allocations and recruitment to positions as reported by DoHA and interview data is provided, with a separate figure displaying trends in administrative data.
Further information is available on the interpretation of administrative data in the chapters of the report that relate to various items (e.g. PBS Co-payment measure, PIP Indigenous Health Incentive).
20
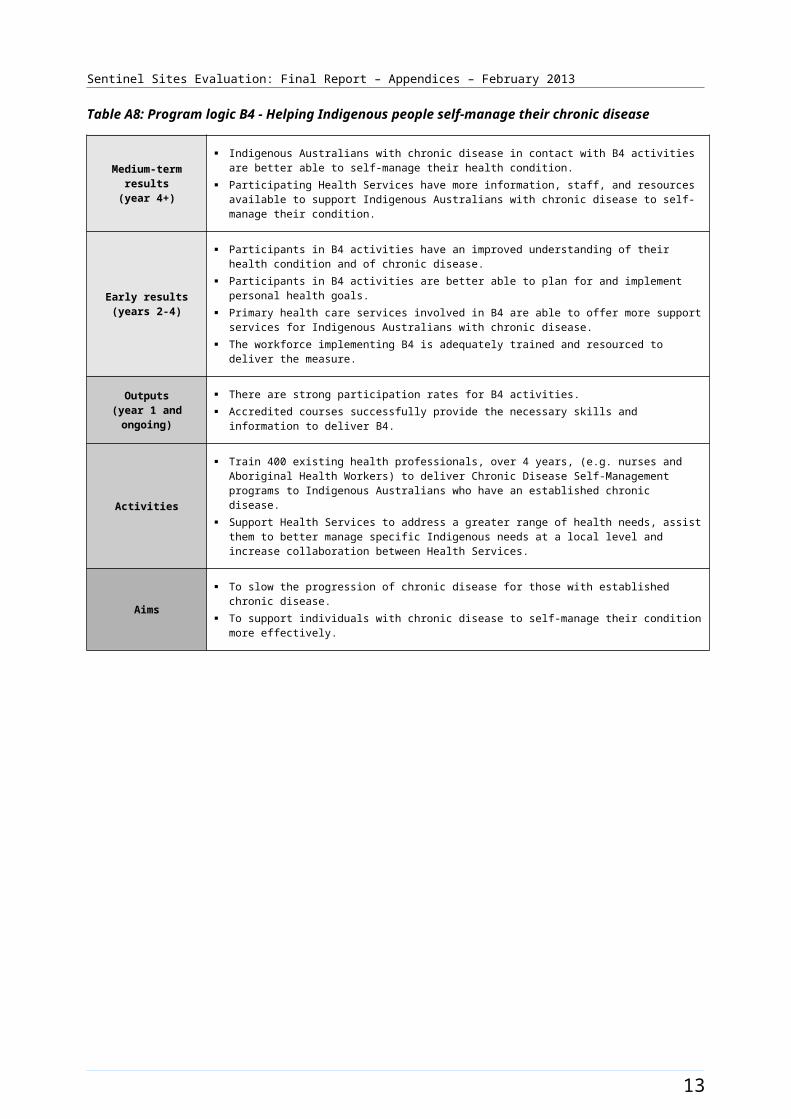
Sentinel Sites Evaluation: Final Report – Appendices – February 2013
Bairnsdale [Case study site]
The Bairnsdale site covered the East Gippsland SLA and was located within the East Gippsland region of Victoria. The SLA included the town of Bairnsdale and several smaller towns (Figure B1). Bairnsdale had a population of about 13 000 people in 20113 and the total population of the SLA was approximately 25 400 in 2006 and about 27 100 in 2011 (Table B2).
About 3.0% of the total population of the site identified as Aboriginal and Torres Strait Islander people in the 2006 Census. The 2011 Census showed an increase of approximately 0.2% with about 3.2% identifying in 2011 (a population of about 800 and 900 respectively) (Table B2).
Health Service organisations and other key site characteristics and service developments
The DGP (East Gippsland Primary Health Alliance formerly the East Gippsland Division of General Practice) covered a larger area than the Sentinel Site servicing a population of about 85 000 people which included the towns of Sale to the south west of Bairnsdale and Orbost to the north east. The DGP office was located in Bairnsdale. Both the AHS (Gippsland and East Gippsland Aboriginal Co-operative Ltd) and the DGP were key stakeholder organisations for the site. The Bairnsdale site now falls within the region of the Gippsland Medicare Local, which became operational on 1 July 2012.4
There was one regional hospital and two General Practices (with around 20 GPs) located in the site. A number of GPs from General Practice also consulted from the AHS. A community controlled service, managed through the Lakes Entrance Aboriginal Health Association (established in 2008)5 operated just outside the site boundary.
Bairnsdale was not classed as a district of workforce shortage for GPs during 2012, based on the information accessed in April 2012 and October 2012.6
The AHS had QUMAX funding and was part of an established regional consortium for the state-based Aboriginal Health Promotion and Chronic Care program.7
The AHS also participated in the Healthy for Life program.
There was an existing state-run tobacco cessation program in the site until June 2012.
Workforce expansion
No workforce allocations for Regional Tackling Smoking and Healthy Lifestyle teams were reported in the site during the evaluation period (Table B2).
Workforce allocations for OW (0.8 FTE) and additional health staff (0.8 FTE increasing to 1.0 FTE) positions at the AHS were filled during the evaluation. The 0.8 FTE OW AHS commenced in June - August quarter 2011, left the position at end of July 2012, and returned to it in September 2012. The additional health staff allocation was split across three positions; a dietitian, a nurse and an Aboriginal
3 Living in Victoria [Website], Live in Melbourne - Bairnsdale (accessed 6 November 2012).4 DoHA, My Medicare Local (accessed 24 October 2012).5 Weekly update EGPCP [website] East Gippsland Primary Care Partnership - Weekly Update 12 (accessed 12 November 2012).6 DoHA, Doctor Connect [website] (accessed 26 April 2012 and 31 October 2012).7 AHPACC - Aboriginal Health Promotion and Chronic Care, [website] (accessed 24 October 2012).
21
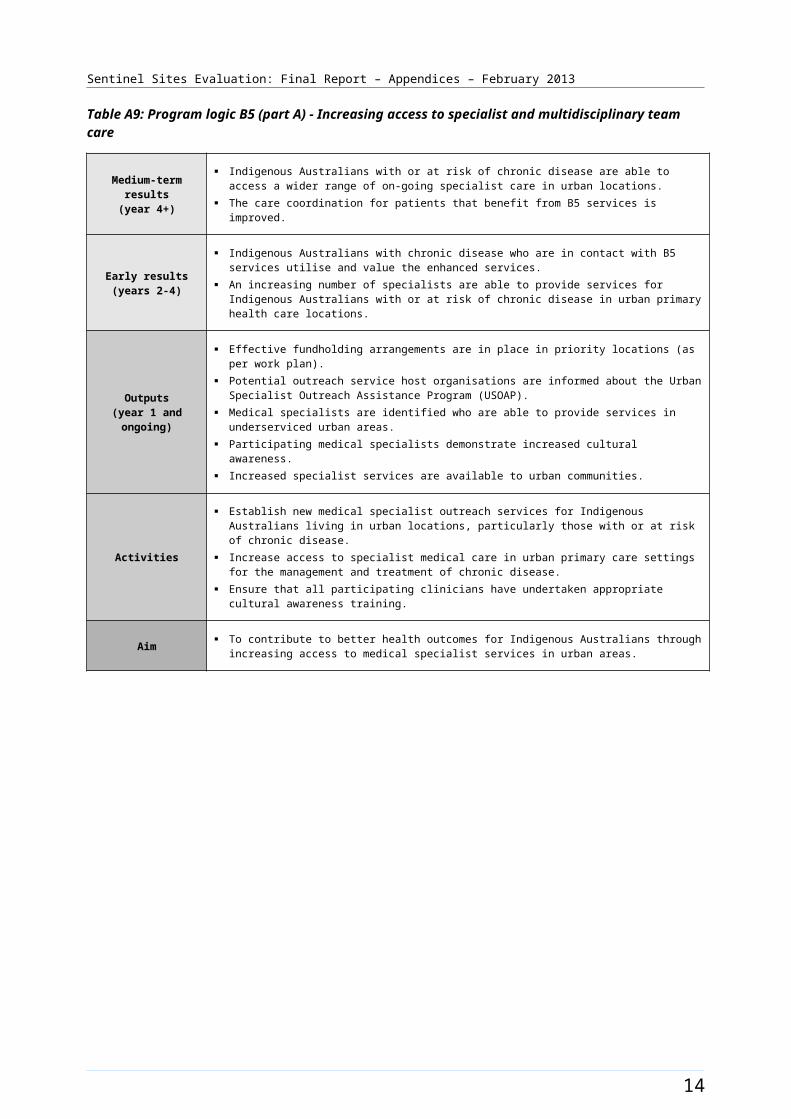
Sentinel Sites Evaluation: Final Report – Appendices – February 2013
Health Worker. Additional health staff positions commenced in June - August 2012 and remained filled at the end of the evaluation. The increase to a full-time allocation occurred in the final evaluation cycle.
Allocations for OW and IHPO (0.75 FTE) positions at the DGP were also filled. The OW DGP position was filled in the December - February quarter 2011 and was vacant from end of May 2012. This position was refilled at the time of the SSE site visit in October 2012. The IHPO DGP position commenced December - February quarter 2011 and became vacant from March - May 2012. Recruitment was being undertaken in the final stage of the evaluation.
The recruitment pattern to these allocations and trends in the uptake of various measures (as reflected by administrative data) throughout the SSE are shown in Figure B2.
22
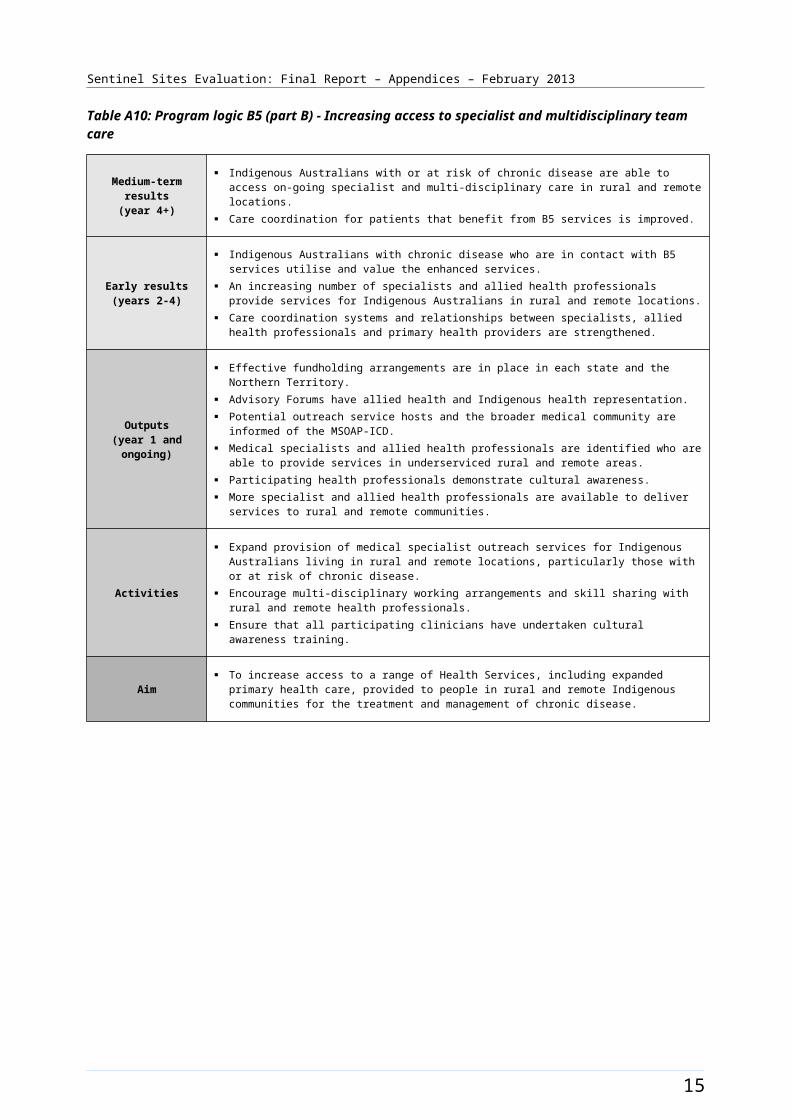
Sentinel Sites Evaluation: Final Report – Appendices – February 2013
Figure B1: Bairnsdale site boundary map
23
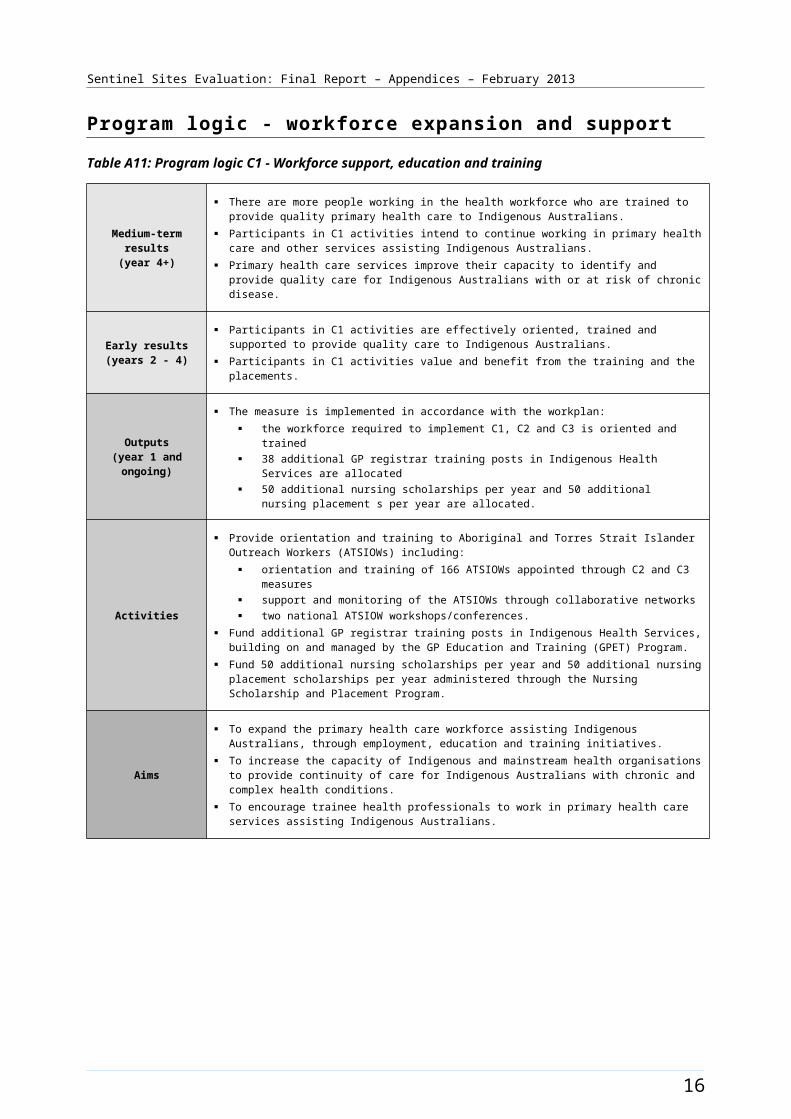
Sentinel Sites Evaluation: Final Report – Appendices – February 2013
Bairnsdale site characteristics
Bairnsdale, Victoria; case study site, stage 2
Key stakeholder organisations:
Gippsland and East Gippsland Aboriginal Co-operative Ltd
East Gippsland Primary Health Alliance
Geographical characteristics
Site boundary The Bairnsdale Sentinel Site consists of 1 SLA.
Community focus groups were held in Bairnsdale township during the evaluation period.
Rurality Regional
Geographic area 627.7 km²
Postcodes 3875, 3878, 3880, 3882, 3885, 3902, 3904, 3909
Population characteristics
Population 2006 2011 Difference %
Total population 25 368 27 105 + 6.85
Aboriginal and Torres Strait Islander population 764 871 + 14.01
% of total population identified as Aboriginal and Torres Strait Islander people
3.0 3.2 + 0.2a
Workforce expansion
ICDP workforce Evaluation cycleTotal FTE allocated Total FTE recruited
ICDP workforce allocation and recruitment per 10 000 Aboriginal and Torres Strait Islander population within the boundary of the DGP.
2 18.2 11.6
3 18.2 18.2
4 18.2 13.3
5 16.9 11.9
24
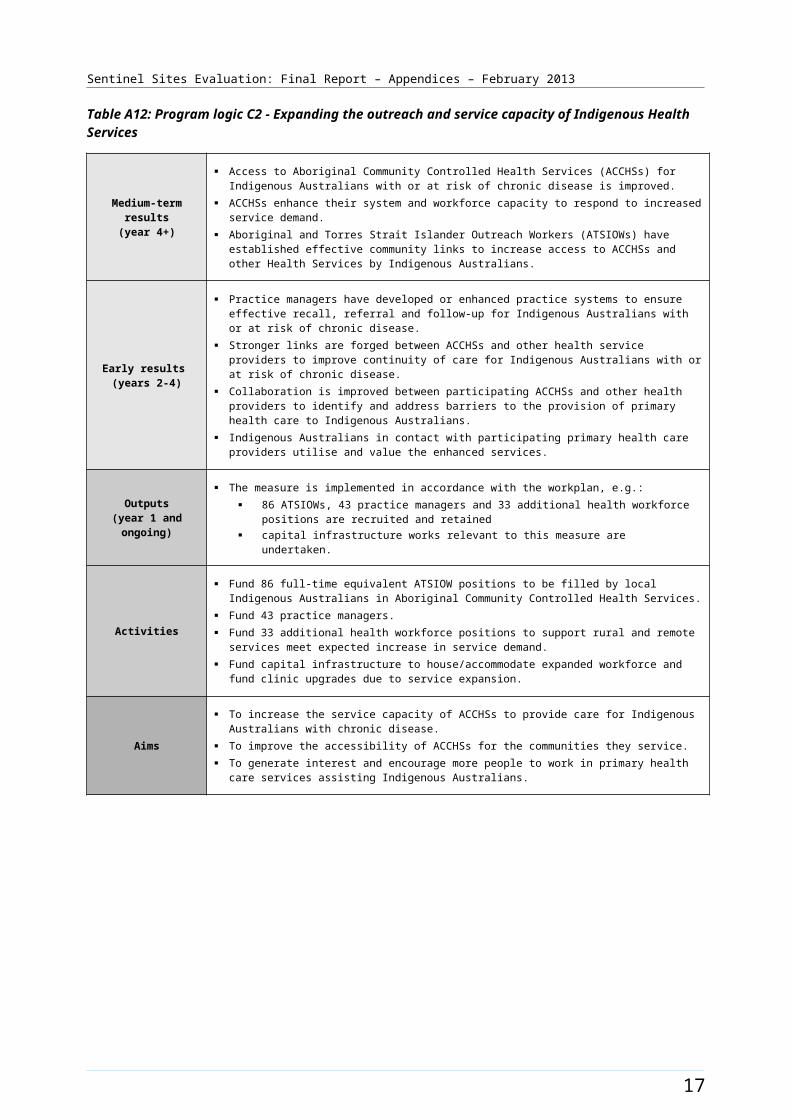
Sentinel Sites Evaluation: Final Report – Appendices – February 2013
ICDP workforce Role Total FTE allocated Total FTE recruited
ICDP workforce allocation and
recruitment (for final evaluation cycle) – positions with responsibility of covering the Sentinel Site. Actual area of responsibility may be substantially larger than the Sentinel Site.
Indigenous Health Project Officer
0.75 0
Outreach Workerb 1.8 1.8
Additional Health Staff 1.0 1.0
25
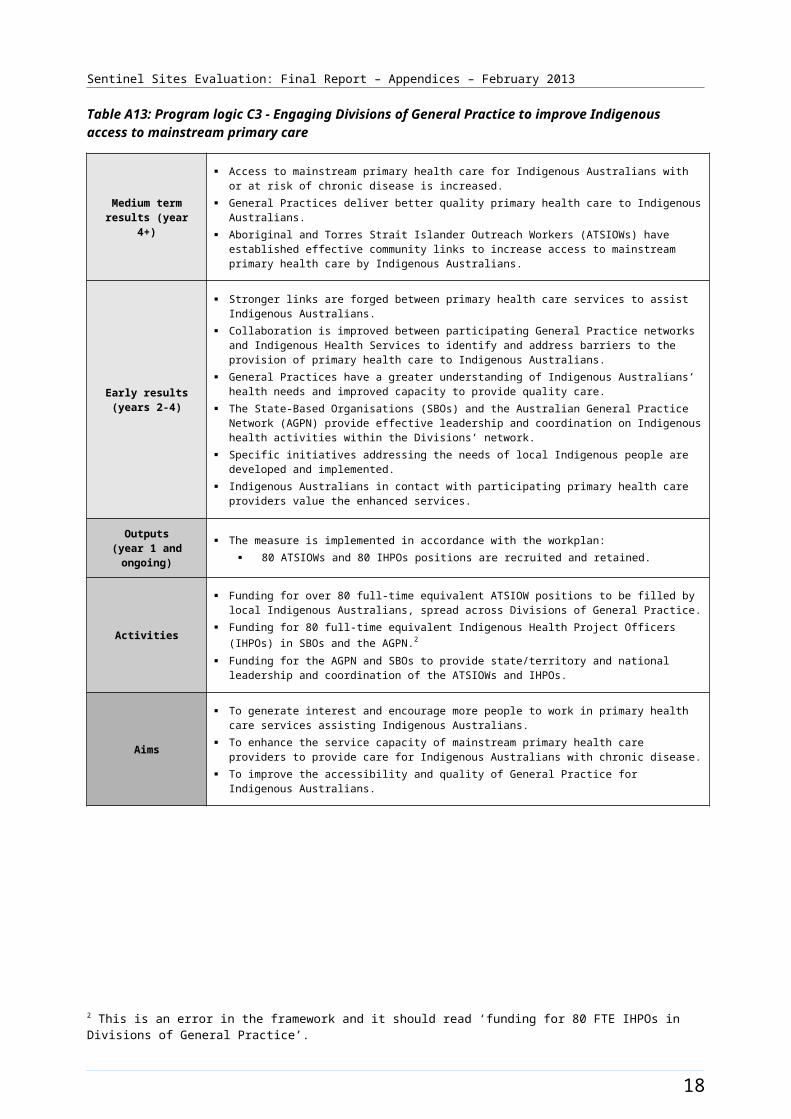
Sentinel Sites Evaluation: Final Report – Appendices – February 2013
General Practitioner characteristics for the whole Division of General Practice
Total number of General Practices31
Proportion of practices which are solo GP practices48%
Full-time working equivalent GP: population 2010 ratio1194
a The figures shown in the row for % of total population identified as Aboriginal and Torres Strait Islander people represent the difference in percentages between two census periods.b Evaluation visit information differs to DoHA source data, position found to be recruited.
26
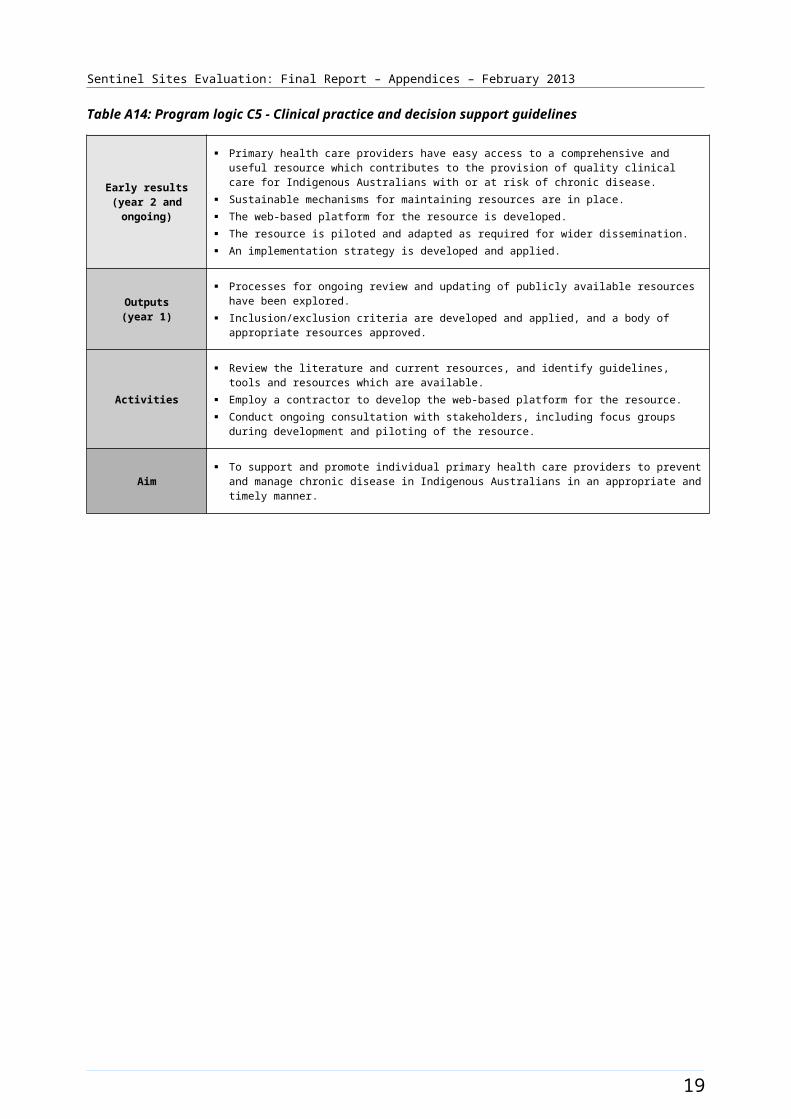
Sentinel Sites Evaluation: Final Report – Appendices – February 2013
Figure B2: ICDP funded positions and service developments (March 2010 - August 2012) and trends in administrative data, Bairnsdale (March 2009 - May 2012)
Note: The additional health staff allocation increased to full-time in the final evaluation cycle. Please refer to the explanatory text when reviewing this figure. In particular, note that PBS Co-payment measure data refer to number of people who have had at least one prescription dispensed in each quarter per 100 Aboriginal and Torres Strait Islander people in the site. The PBS Co-payment measure data have been divided by four to facilitate comparison with other data shown in the figure.
27
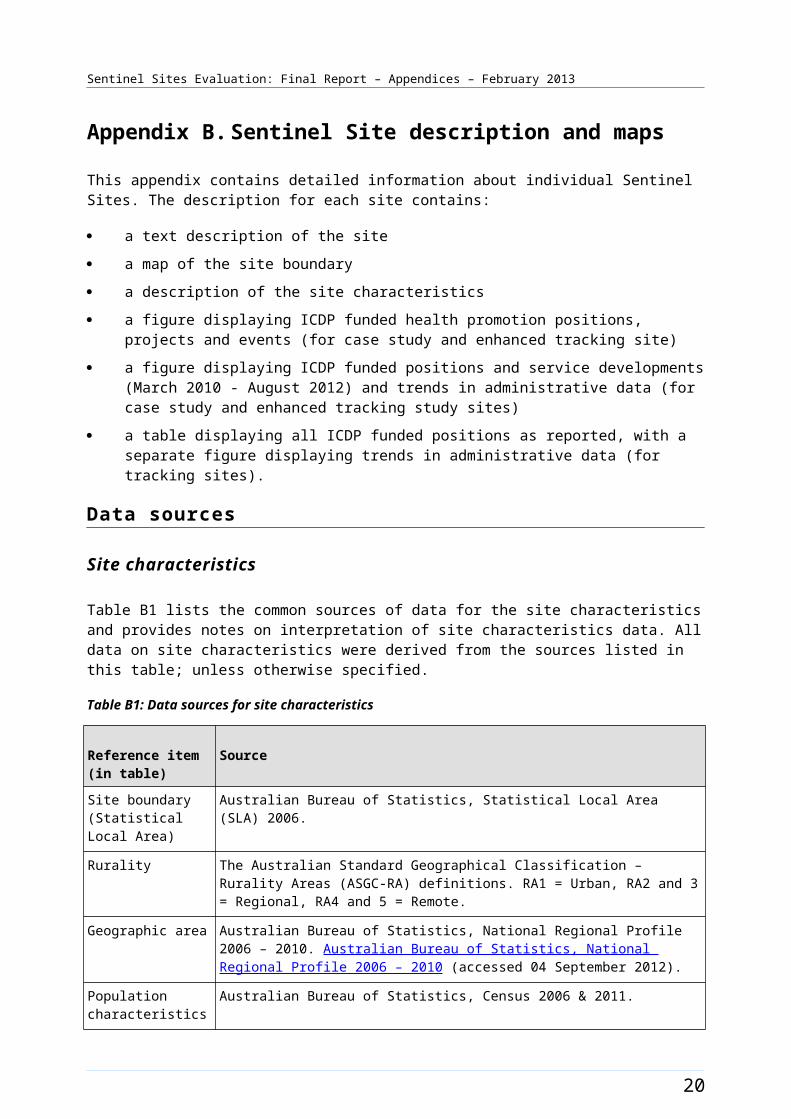
Sentinel Sites Evaluation: Final Report – Appendices – February 2013
Barkly [Enhanced tracking site]
The Barkly site included the town of Tennant Creek; located on the Stuart Highway approximately 500 kms north of Alice Springs and 1000 kms south of Darwin.
The site included the SLA of Tennant Creek (which includes the town and immediate surrounds) as well as the Elliot District (Figure B3). The town of Tennant Creek had a population of about 3300 people in 2006 and about 3400 in 2011 (Table B3). The town of Elliot is about 250 kms north of Tennant Creek and also located on the Stuart highway. It had a population of 650 hundred people in 2011. 8 These towns serviced the pastoral industry of the Barkly region.
Approximately 53% of the total site population identified as Aboriginal and Torres Strait Islander people in the 2006 Census (a population of about 1800). The 2011 Census showed an increase of approximately 2% with about 55% identifying in 2011 (a population of about 1900) (Table B3). The broader Barkly region covers a large area extending east to the Queensland border and to the west of the Stuart highway. The total population for the Barkly region was about 8200 people in 2011. 9
Health Service organisations and other key site characteristics and service developments
The key stakeholder organisations for the site included the DGP (General Practice Network NT, with the closest office based in Alice Springs) and the AHS (Anyinginyi Health Aboriginal Corporation) that was located in Tennant Creek. The Barkly site now falls within the region of the single Northern Territory Medicare Local which became operational on 1 July 2012.10
The AHS provided an outreach service to several communities in the region. A health facility at the Royal Flying Doctor Service in Tennant Creek also provided primary health care services to residents and visitors through a fly-in-fly-out GP service. This service addressed the lack of a resident private GP. 11
There was a pharmacist and a small public hospital in Tennant Creek; with the next closest hospitals being in Alice Springs or Darwin.
Several communities in the region (Elliott, Ali Curung, Canteen Creek and Epenarra) were served by NT government run Health Clinics.
Barkly was classed as a district of workforce shortage for GPs during 2012, based on the information accessed in November 2012.12
The AHS received Healthy for Life funding. Pharmaceuticals were supplied under S100 supply arrangements.
Local Community Campaign to Promote Better Health activity was reported in the site during the evaluation period (Chapter 4, Table 4.1). The Hoops 4 Health program conducted an activity in May 2012. The program used basketball to raise awareness of the benefits of regular check-ups to detect, prevent chronic disease (Figure B4).
8 Barkly Shire Council [website] (accessed 13 November 2012).9 Ibid.10 DoHA, My Medicare Local [website], op cit.11 Royal Flying Doctor Service [website] (accessed 5 October 2012).12 DoHA, Doctor Connect [website], op cit.
28
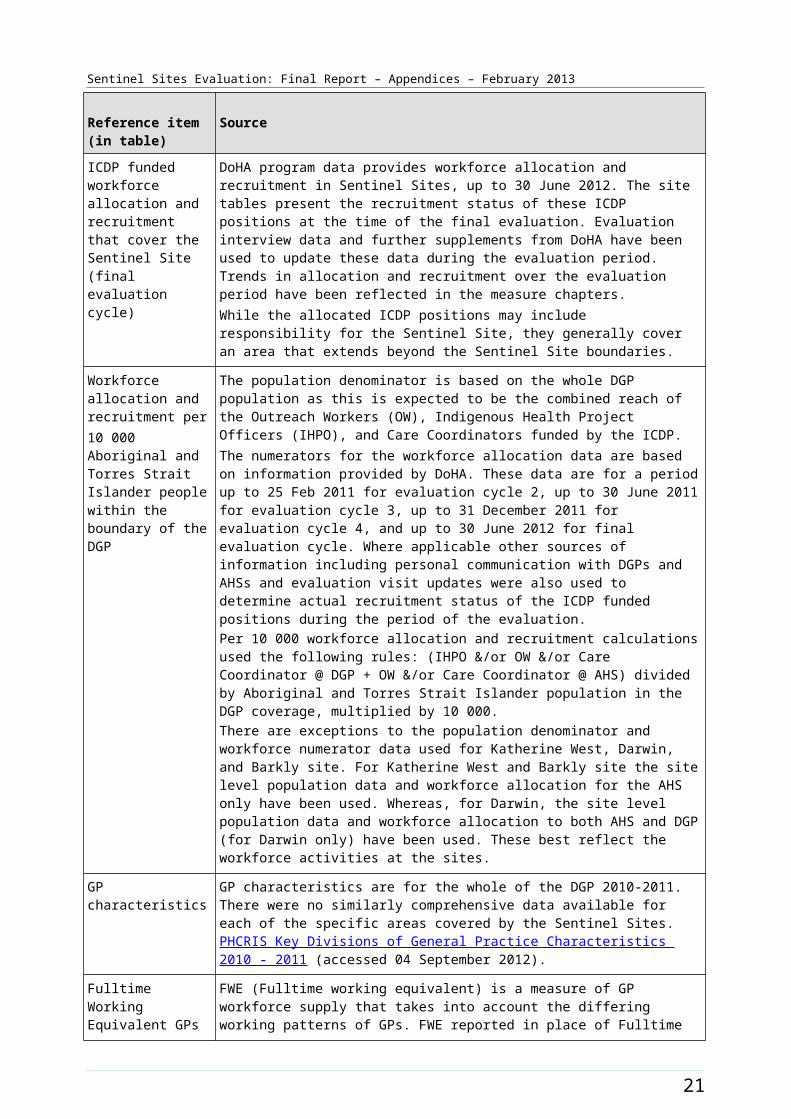
Sentinel Sites Evaluation: Final Report – Appendices – February 2013
Workforce expansion
Workforce allocations for two TAWs, one RTC and two HLWs positions at the AHS were filled during the evaluation. The TAW position 1 was filled in the March - May 2011 quarter and remained filled at the end of the evaluation period. The TAW position 2 commenced in the March - May 2012 quarter and became vacant from June - August 2012 quarter. The RTC position was filled in the March - May 2012. The HLW positions 1 and 2 were filled from March - May 2012. The recruitment pattern for these allocations throughout the SSE is depicted in Figure B4.
Workforce allocations for a Practice Manager position at the AHS, and an allocation for a full-time additional health staff position were filled during the evaluation. The Practice Manager position became filled from the March - May 2011 quarter. The Additional Health staff position was filled part-time (0.5 FTE) by recruitment of a Diabetes Educator, commencing in the June - August 2012 quarter; the remaining allocation was not filled.
A 1.5 FTE OW allocation for the site was funded but not filled during the evaluation period. The recruitment pattern to these allocations, together with trends in the uptake of various measures (as reflected by administrative data) throughout the SSE, is depicted in Figure B5.
29
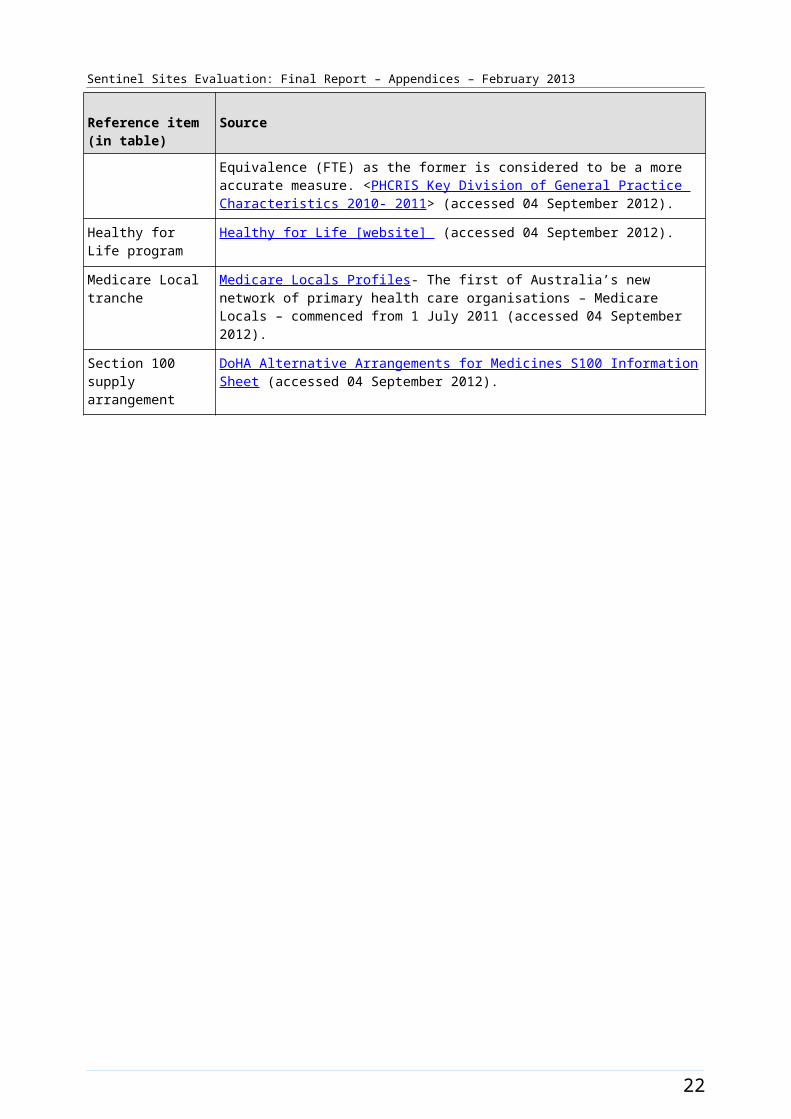
Sentinel Sites Evaluation: Final Report – Appendices – February 2013
Figure B3: Barkly site boundary map
30
Sentinel Sites Evaluation: Final Report – Appendices – February 2013
Barkly site characteristics
Barkly, Northern Territory; enhanced tracking site, stage 2
Key stakeholder organisations:
Anyinginyi Health Aboriginal Corporation
General Practice Network NT
Geographical characteristics
Site boundary Barkly Sentinel Site consists of 2 SLAs.
RuralityRemote
Geographic area47.6 km²
Postcodes0862, 0860
Population characteristics
Population 2006 2011 Difference %
Total population 3333 3410 + 2.3
Aboriginal and Torres Strait Islander population 1770 1879 + 6.2
% of total population identified as Aboriginal and Torres Strait Islander people
53.1 55.1 + 2.0a
Workforce expansion
ICDP workforce Evaluation cycle Total FTE allocated Total FTE recruited
ICDP workforce allocation and recruitment per 10 000 Aboriginal and Torres Strait Islander population within the boundary of the DGP.b
2 - -
3 - -
4 8.5 -
5 8.5 -
ICDP workforce Role Total FTE allocated Total FTE recruited
ICDP workforce allocation and recruitment (for final evaluation cycle) – positions with responsibility of covering the Sentinel Site. Actual area of
Outreach Workers 1.5 0
Practice manager 1 1
Additional Health Staff 1.5 1
31
Sentinel Sites Evaluation: Final Report – Appendices – February 2013
ICDP workforce Role Total FTE allocated Total FTE recruited
responsibility may be substantially larger than the Sentinel Site.
Regional Tobacco Coordinator
1 1
Tobacco Action Worker 2 1
Healthy Lifestyle Worker 2 2
32
Sentinel Sites Evaluation: Final Report – Appendices – February 2013
General Practitioner characteristics for the whole Division of General Practice
Total number of General Practices105
Proportion of practices which are solo GP practices71%
Full-time working equivalent GP: population 2010 ratio1721
a The figures shown in the row for % of total population identified as Aboriginal and Torres Strait Islander people represent the difference in percentages between two census periods.b ICDP workforce allocation and recruitment per 10 000 Aboriginal and Torres Strait Islander population within the Sentinel Site is based on workforce allocated to and recruited by AHS only as the DGP staff have not had a focus on the site.
33

Sentinel Sites Evaluation: Final Report – Appendices – February 2013
Figure B4: ICDP funded health promotion positions, projects and events, Barkly (March 2009 - August 2012)
34
Sentinel Sites Evaluation: Final Report – Appendices – February 2013
Figure B5: ICDP funded positions and service developments (March 2010 - August 2012) and trends in administrative data, Barkly (March 2009 - May 2012)
Note: Please refer to the explanatory text when reviewing this figure. In particular, note that PBS Co-payment measure data refer to number of people who have had at least one prescription dispensed in each quarter per 100 Aboriginal and Torres Strait Islander people in the site. The PBS Co-payment measure data have been divided by four to facilitate comparison with other data shown in the figure.
35
Sentinel Sites Evaluation: Final Report – Appendices – February 2013
Brisbane South [Case study site]
The Brisbane South site covered a large area of metropolitan Brisbane to the south and west of the city centre which included a total population of about 302 400 people in 2006, living in forty-five SLAs and one state suburb (Figure B6). This population increased to about 323 700 in 2011.
Between 2006 and 2011 the Aboriginal and Torres Strait Islander population in the site increased by about 11% (a population of about 4800 increasing to 5300 respectively) (Table B4). About 1.6% of the total population of the site identified as Aboriginal and Torres Strait Islander people in both the 2006 and 2011 Census) (Table B4).
Health Service organisations and other key site characteristics and service developments
The DGP (operating as Accoras, formerly known as Brisbane South Division of General Practice) and the AHS (Inala Indigenous Health Service) were key stakeholder organisations and were located within the Brisbane South site. The site now spans the boundary between the Greater Metro South Brisbane (approximately 60%) and the West-Moreton Oxley (approximately 40%) Medicare Locals, which both became operational on 1 July 2011.
The AHS was state-managed and was a major health service provider to Aboriginal and Torres Strait Islander people within the site and across Brisbane. A nearby AHS, the Aboriginal and Torres Strait Islander Community Health Service (ATSICHS) (based outside the site boundary in Woolloongabba), also provided some health services accessible to the Brisbane South Aboriginal and Torres Strait Islander population in the site. The ATSICHS also operated a part-time medical clinic, which fell within the Brisbane South site boundary, from an independent Aboriginal school in Acacia Ridge. This clinic was refurbished during the evaluation period and began increasing its services from October 2012.13, 14
There were many General Practices in the site, including a large medical service that opened for extended hours and bulk-billed.15 The Institute for Urban Indigenous Health (IUIH) also provided services within the site (see Workforce Expansion section below). The IUIH supported Aboriginal and Torres Strait Islander Health Service development and coordination of health service delivery in South East Queensland, and also aimed to support effective implementation of COAG Closing the Gap initiatives and other strategic development in the region.16
There were four hospitals within the site, one of which was a public hospital. Two private hospitals and one public hospital were within close proximity, but outside the site boundary.
The majority of the SLAs within Brisbane South site (33/45) were not classed as districts of workforce shortage for GPs during 2012, based on the information accessed in April 2012 and October 2012.17
The AHS participated in the Healthy for Life program.
Local Community Campaign to Promote Better Health activities were reported in the site during the evaluation (Chapter 4, Table 4.1). A Smoking Cessation program was held as workshops at the Southbank TAFE. The Murri Big Bash was an indoor Cricket Day supported by Inala Wangarra community with a health promotion focus (held in March 2012). The Murri Knockout Carnival (IUIH)
13 Evaluation site visit – August 2012.14 ATSICHS [website] (accessed 9 October 2012).15 AllCare Medical [website] (accessed 24 October 2012).16 IUIH [website] (accessed 5 November 2012).17 DoHA, Doctor Connect [website], op cit.
36
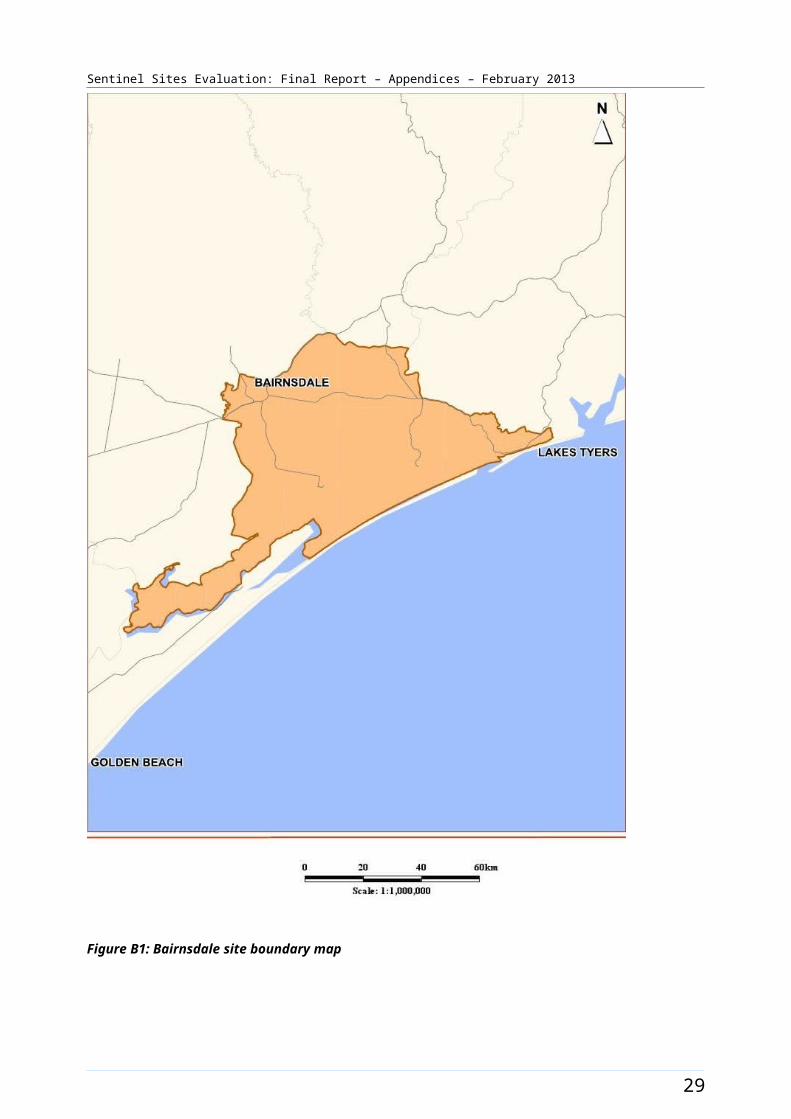
Sentinel Sites Evaluation: Final Report – Appendices – February 2013
(September 2011) was a rugby league knockout competition where adult health assessments were required to participate. The Murri Place Smoke-free Spaces program was implemented at the AHSs to support these organisations to become smoke-free. The Move project (commencing development in August 2011 with messages going to air from October 2011) was implemented through the Brisbane Indigenous Media Association Inc. It aimed to raise awareness of the benefits of physical activity among Aboriginal and Torres Strait Islander people aged 18 and over through regular on air messaging, a website and community comedy events. The Inala Indigenous Youth Sports program held two sports and education week programs as a school holiday program for young Indigenous people aged 10 – 15 years (January 2011 and 2012 respectively). These programs consisted of a minimum of two hours physical activity each day in addition to education sessions about the risks and implications of chronic disease, traditional craft and games, and health checks for participants. Families were invited to attend graduation ceremonies, in order to help extend the health messages to the community as a whole. The program was developed by the IUIH with the Inala Indigenous Health Service and other stakeholders. The timing of these events and activities is displayed in Figure B7.
Workforce expansion
Workforce allocations for the Regional Tackling Smoking and Healthy Lifestyle teams (based at the IUIH) were filled during the evaluation, amounting to a team of 12 positions. This included three TAW positions, one RTC position, four HLW positions, three trainee HLW positions and a HLW team manager position. This team’s area of responsibility was all of South East Queensland, which included the Brisbane South site. The IUIH team’s area of responsibility also included two other Sentinel Sites: Logan/Woodridge and North Lakes/Caboolture. The TAW position 1 was filled from the March – May 2011 quarter until the end of the evaluation period. It had two incumbents during this time. The TAW position 2 was filled from the December 2011 - February 2012 quarter and the TAW position 3 was filled from the March – May 2012 quarter. The HLW position 1 was filled from the June – August 2010 quarter, the position 2 was filled from the March – May 2011 quarter and positions 3 and 4 were filled from the June – August 2012 quarter. The HLW trainee position 1 had two incumbents. It was filled from the March – May 2011 quarter for 12 months, with a new incumbent commencing from June – August 2012. The HLW trainee position 2 was filled from March – May 2011 until June – August 2011, and again from June – August 2012. It had two incumbents over this time. The HLW position three was filled from June – August 2012. The HLW team manager position was filled from June – August 2010 and remained filled at the end of the evaluation period. The pattern of recruitment for these allocations throughout the SSE is depicted in Figure B7.
Workforce allocations for OW and IHPO positions at the DGP were filled during the evaluation. The OW DGP and the IHPO DGP positions increased from 0.5 FTE to full-time during the evaluation. The OW at the DGP position was filled in June – August 2010 until March – May 2012 and the IHPO DGP position was filled in June – August 2010 quarter until the same quarter. The positions were not refilled during the final evaluation period. From 1 July 2012 a contracting arrangement was made through the Medicare Local for the OW and IHPO DGP positions to be deployed through the IUIH.18 The DGP was funded for a Care Coordinator in early 2012 but that position did not cover the site and funding was transferred to the Medicare Local. The IUIH had an allocation for Care Coordination and Supplementary Services funding early in the evaluation and, at the time of the final evaluation, workers did not have direct responsibilities within the Brisbane South site. The pattern of recruitment to these allocations, together with trends in the uptake of various measures (as reflected by administrative data) over the evaluation, is shown in Figure B8.
18 SSE Evaluation site visit – August 2012.
37
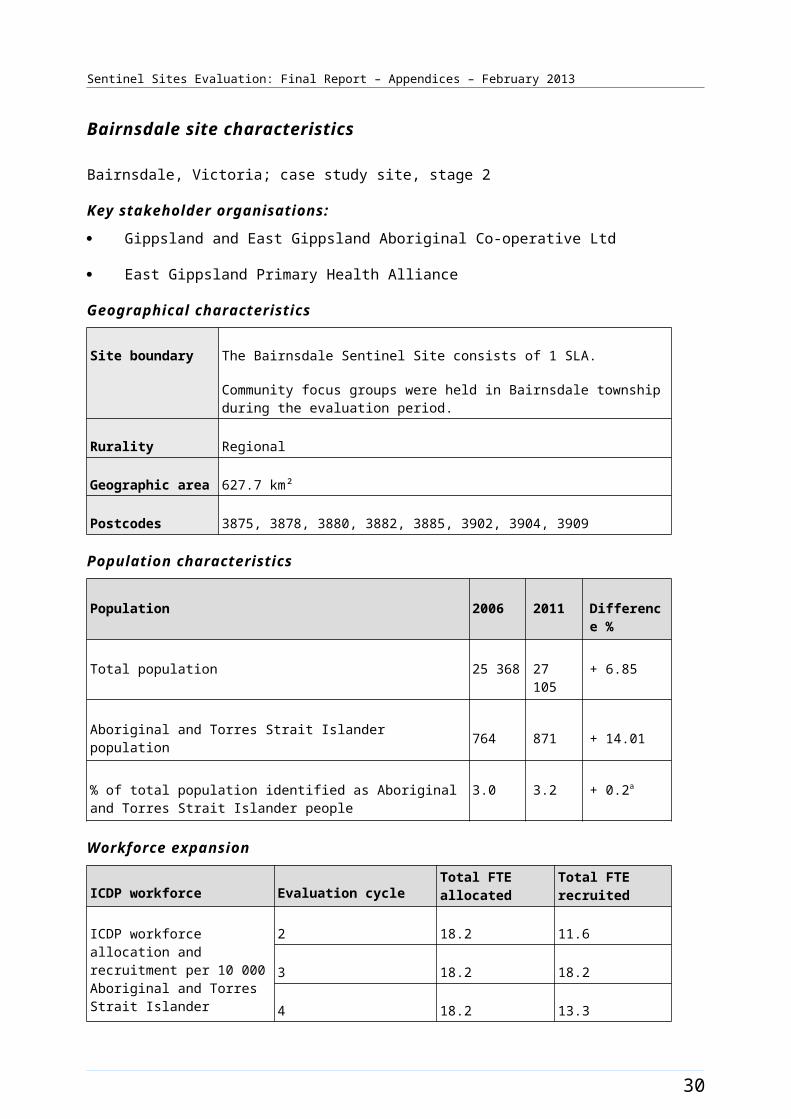
Sentinel Sites Evaluation: Final Report – Appendices – February 2013
Figure B6: Brisbane South site boundary map
38
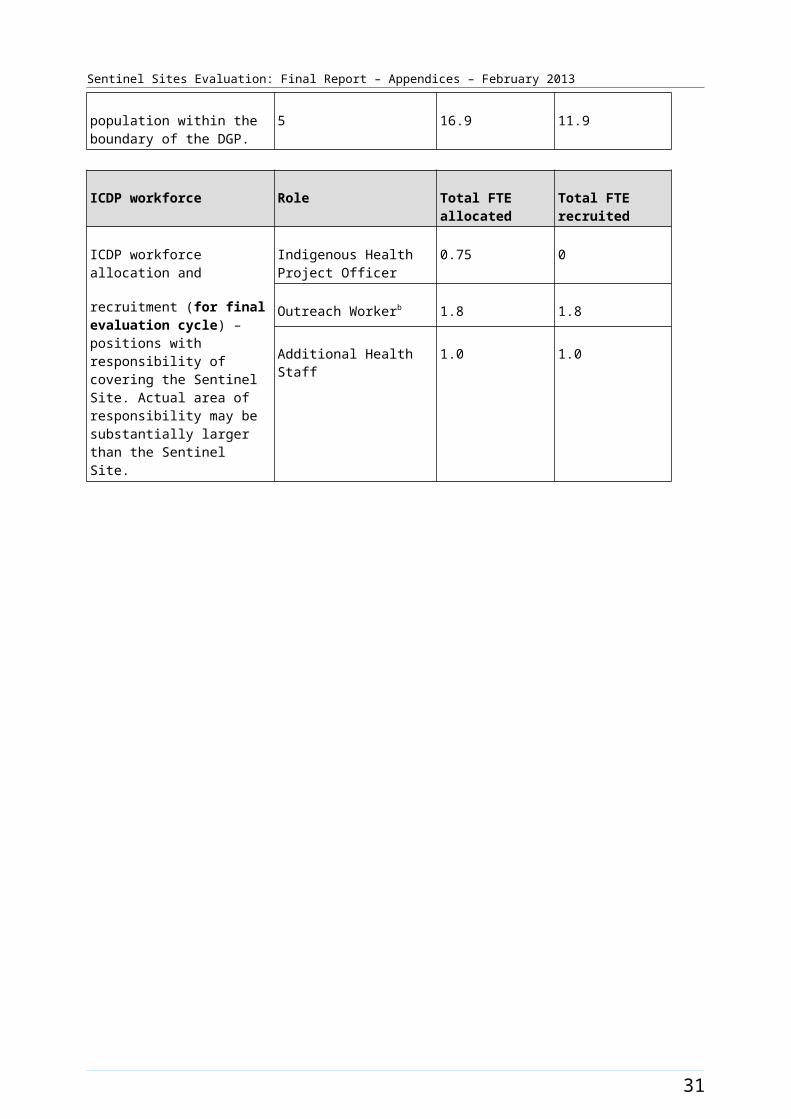
Sentinel Sites Evaluation: Final Report – Appendices – February 2013
Brisbane South site characteristics
Brisbane South, Queensland; case study site, stage 1
Key stakeholder organisations
Inala Indigenous Health Service
Brisbane South Division of General Practice (Currently operating as Accoras)
Geographical characteristics
Site boundary The Brisbane South Sentinel Site closely maps the boundaries of Brisbane South Division of General Practice. There are 45 SLAs and 1 state suburb
RuralityUrban
Geographic area242 km²
Postcodes4073, 4074, 4075, 4076, 4077, 4078, 4106, 4107, 4108, 4109, 4110, 4111, 4112, 4113, 4121, 4122, 4151, 4152,
Population characteristics
Population 2006 2011 Difference %
Total population 302 382 323 680 + 7.04
Aboriginal and Torres Strait Islander population 4768 5296 + 11.07
% of total population identified as Aboriginal and Torres Strait Islander people
1.6 1.6 0a
Workforce expansion
ICDP workforce Evaluation cycle Total FTE allocated Total FTE recruited
ICDP workforce allocation and recruitment per 10 000 Aboriginal and Torres Strait Islander population within the boundary of the DGP.
2 4.5 4.5
3 4.5 4.5
4 6.8 6.8
5 4.5 4.5
ICDP workforce Role Total FTE allocated Total FTE recruited
ICDP workforce allocation and recruitment (for final evaluation cycle) – positions with responsibility of covering the
Indigenous Health Project Officer
1 1b
Outreach Worker 1 1 b
39
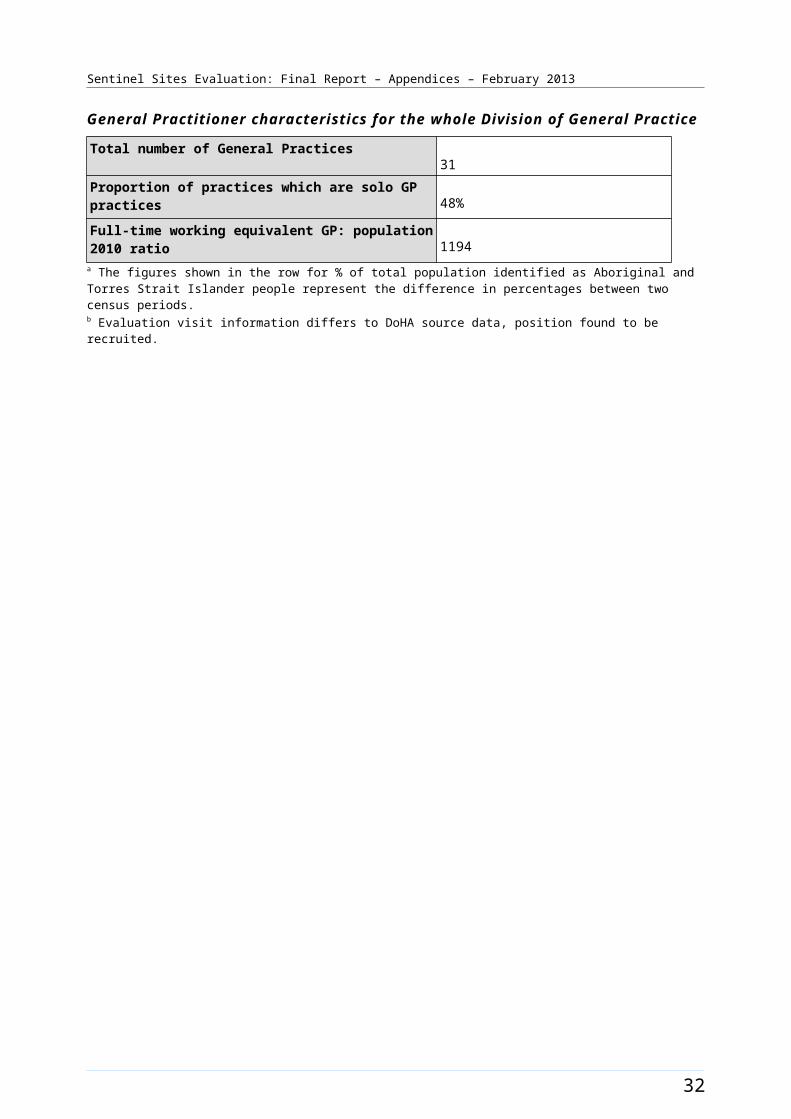
Sentinel Sites Evaluation: Final Report – Appendices – February 2013
ICDP workforce Role Total FTE allocated Total FTE recruited
Sentinel Site. Actual area of responsibility may be substantially larger than the Sentinel Site. d
Regional Tobacco Coordinator
2c 2c
Tobacco Action Worker 5c 4c
Healthy Lifestyle Worker 4c 4c
40
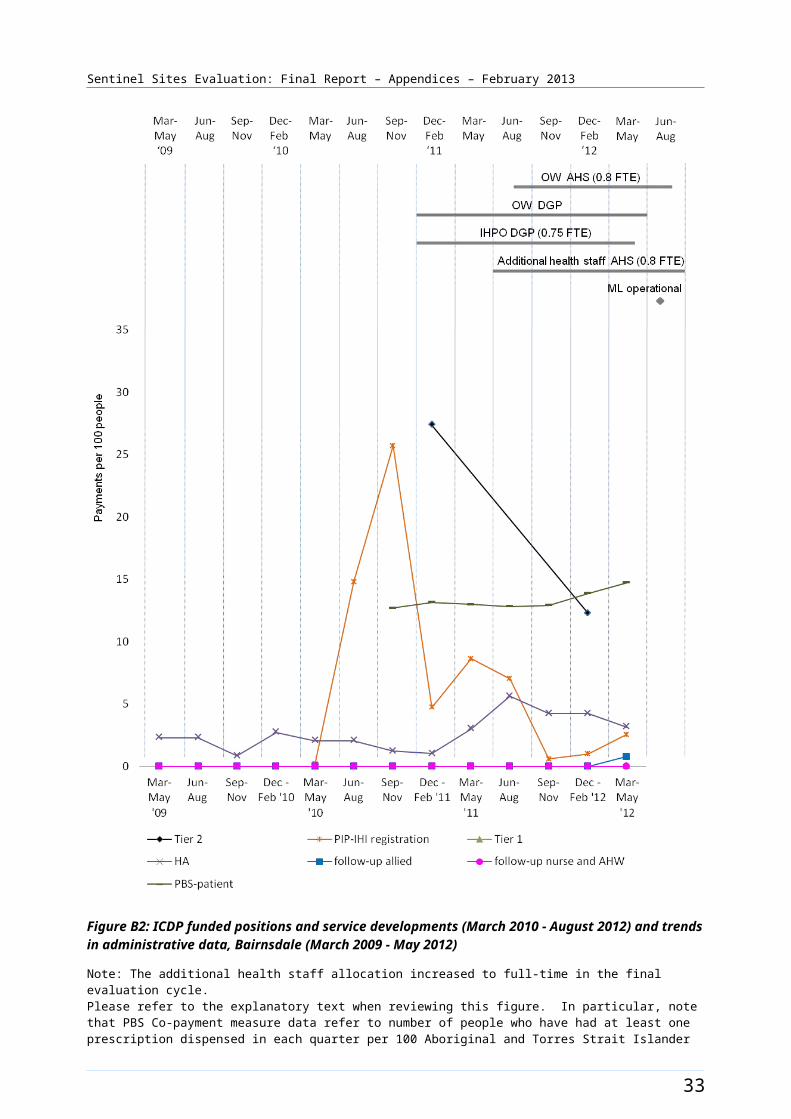
Sentinel Sites Evaluation: Final Report – Appendices – February 2013
General Practitioner characteristics for the whole Division of General Practice
Total number of General Practices87
Proportion of practices which are solo GP practices30%
Full Time working equivalent GP: population 2010 ratio1077
a The figures shown in the row for % of total population identified as Aboriginal and Torres Strait Islander people represent the difference in percentages between two census periods.b Brisbane South site is covered by Greater Metro South Brisbane Medicare Local (GMSBML) (60% of the site boundary) and the West Moreton Oxley Medicare Local (WMOML) (40% of the site boundary). Number of ICDP funded OW and IHPO attributed to the site has been based on the proportional workforce deployment estimate through GMSBML and the Institute for Urban Indigenous Health subcontracted from WMOML.c The IUIH have an allocation of staff for the Regional Tackling Smoking and Healthy Lifestyle team that cover all of SE QLD. The same workers are attributed for three Sentinel Sites around Brisbane.
41
Sentinel Sites Evaluation: Final Report – Appendices – February 2013
Figure B7: ICDP funded health promotion positions, projects and events, Brisbane South (March 2009 - August 2012)
42
Sentinel Sites Evaluation: Final Report – Appendices – February 2013
Figure B8: ICDP funded positions and service developments (March 2010 - August 2012) and trends in administrative data, Brisbane South (March 2009 - May 2012)
Note: Please refer to the explanatory text when reviewing this figure. In particular, note that PBS Co-payment measure data refer to number of people who have had at least one prescription dispensed in each quarter per 100 Aboriginal and Torres Strait Islander people in the site. The PBS Co-payment measure data have been divided by four to facilitate comparison with other data shown in the figure.
43
Sentinel Sites Evaluation: Final Report – Appendices – February 2013
Cairns [Enhanced tracking site]
The Cairns site covered the area between the Kuranda State Forest and the coast, from the sugar town of Gordonvale (population about 5000, and lying about 23 kms to the south of the city of Cairns) to the beach resort of Palm Cove (25 kms to the north of Cairns). The city of Cairns had a population in excess of 100 000 in 2011. The site area covered one Statistical Subdivision comprising seven SLAs (Figure B9). The total population of the site was approximately 122 200 in 2006, increasing to about 137 200 in 2011 (Table B5). The Aboriginal and Torres Strait Islander population increased by about 28.9% between 2006 and 2011 (a population of about 9600 increasing to 12 300 respectively) (Table B5).
Approximately 7.8% of the total site population identified as Aboriginal and Torres Strait Islander people in the 2006 Census. The 2011 Census showed an increase of approximately 1.2% with about 9% identifying in 2011 (a population of 9600 and 12 300 respectively). This growth was seen locally as a result of the Tableland region growing by about 12% or 13 800 people, from 116 300 to 130 100 over this period.
Health Service organisations and other key site characteristics and service developments
The key site stakeholder organisations were the AHS (WuChopperen Health Service Limited) and the DGP (Far North Queensland Rural Division of General Practice) both based in Cairns. The Cairns site now falls within the region covered by the Far North Queensland Medicare Local, which became operational on 1 July 2012.19
Within Cairns there were a number of large primary health care services including a GP super clinic (opened in July 2012),20 a 24 hour medical centre and several General Practices. Some of these services provided allied health care services, as well as primary medical care. There were three hospitals located within the site, including Cairns Base Hospital; which was an important referral centre for North Queensland. The AHS had its main premises in the site and also operated a clinic outside the Sentinel Site boundary, at Atherton.
Cairns was not classed as a district of workforce shortage for GPs during 2012, based on the information accessed in November 2012.21
The AHS participated in the Healthy for Life Program and QUMAX.
Local Community Campaign to Promote Better Health activity occurred in the region during the evaluation (Chapter 4, Table 4.1). The Men’s Health Community day, organised by Wuchopperen Health Service, was conducted in November 2011 (Figure B10).
19 DoHA, My Medicare Local [website], op cit.20 Edmonton GP Super Clinic [website] (accessed 19 October 2012).21 DoHA, Doctor Connect [website], op cit.
44
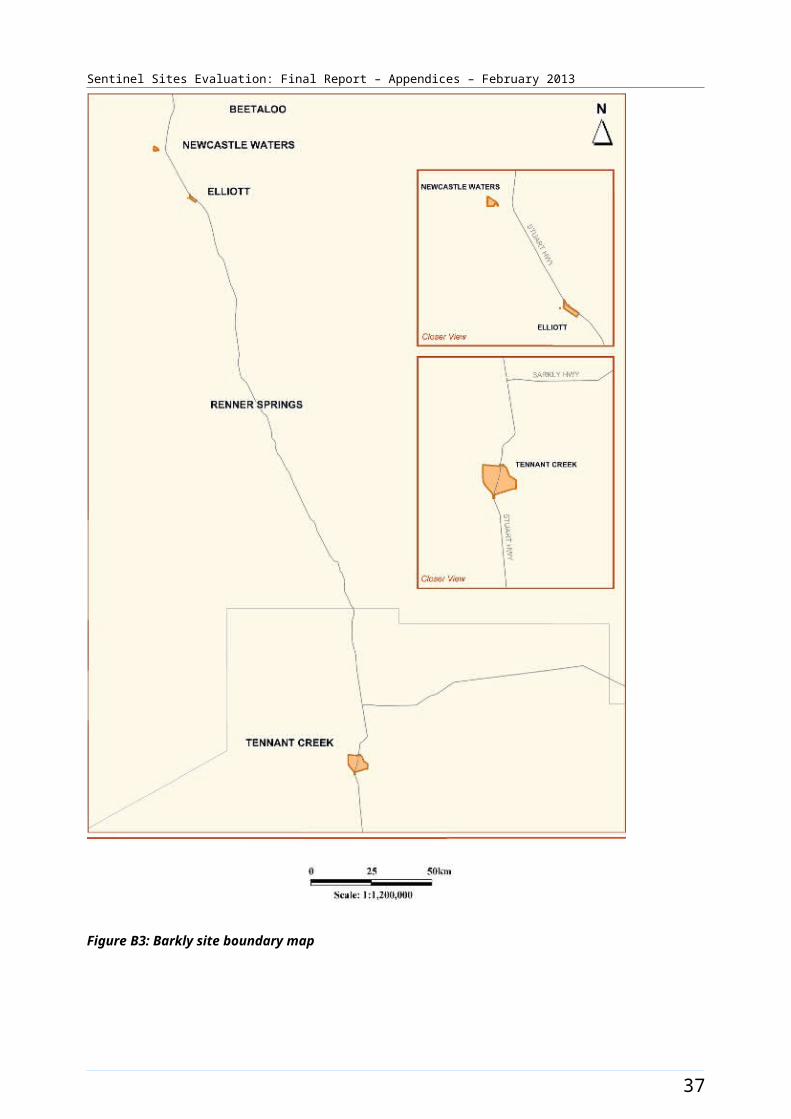
Sentinel Sites Evaluation: Final Report – Appendices – February 2013
Workforce expansion
The majority of workforce allocations for the Regional Tackling Smoking and Healthy Lifestyle team positions were filled during the evaluation. These allocations included up to three TAWs, one RTC and two HLW positions at the AHS. TAW position 1 was filled from March – May quarter 2011. It had two incumbents over the evaluation. TAW position 2 was filled from September – November 2011. The RTC position was filled from September – November 2011 quarter. The HLW positions 1 and 2 were filled from September – November 2010. The pattern of recruitment to these allocations throughout the SSE is depicted in Figure B10.
Workforce allocations for one OW position and a Practice Manager position at the AHS were filled during the evaluation. The OW AHS position was filled from the June – August 2011 quarter and the Practice Manager position was filled from June – August 2011. This position had two incumbents during the evaluation period. Five Care Coordinator allocations at the AHS were provided in mid-2012, and filled late in the evaluation period. Allocations for two OW positions and an IHPO position at the DGP were also filled. Both OW DGP positions 1 and 2 were filled from the June – August 2010 quarter. The OW DGP position 2 had two incumbents during the evaluation period. The IHPO DGP position was filled from the June – August 2010 quarter. The pattern of recruitment to these allocations, and trends in the uptake of various measures (as reflected by administrative data) throughout the SSE, is shown in Figure B11.
45
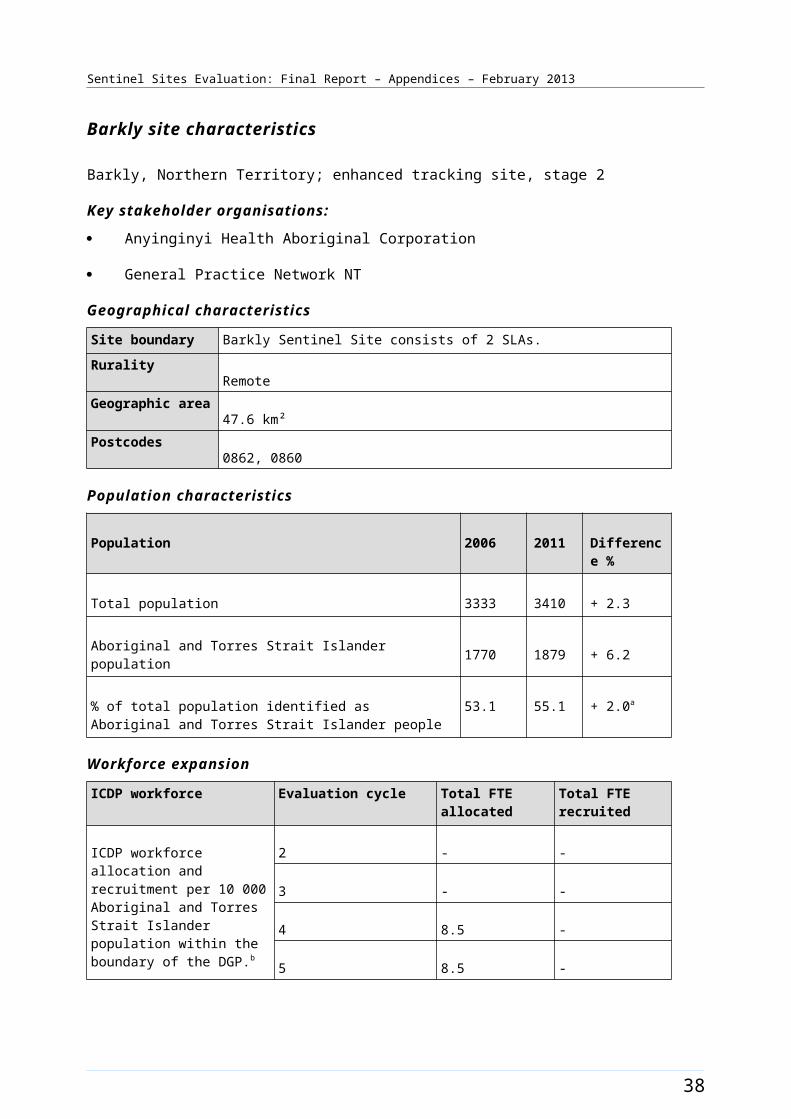
Sentinel Sites Evaluation: Final Report – Appendices – February 2013
Figure B9: Cairns site boundary map
46
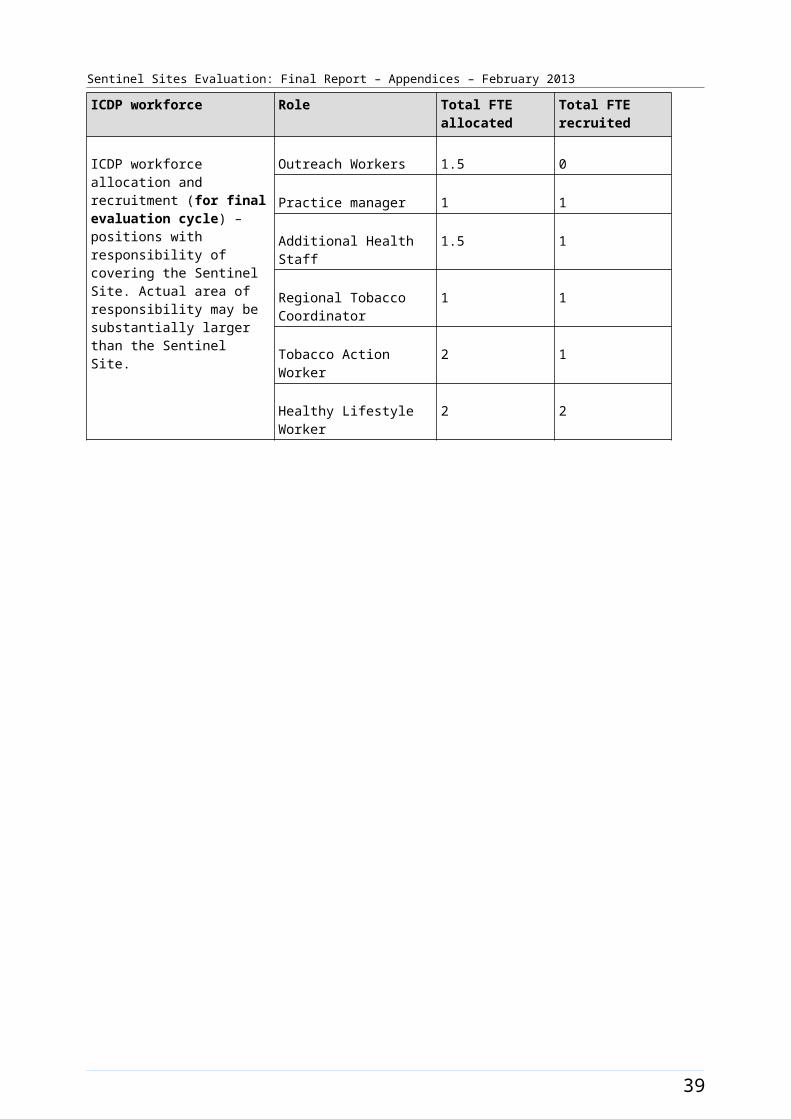
Sentinel Sites Evaluation: Final Report – Appendices – February 2013
Cairns site characteristics
Cairns, Queensland; enhanced tracking site, stage 1
Key stakeholder organisations
Wuchopperen Health Service Limited
Far North Queensland Rural Division of General Practice
Geographical characteristics
Site boundary Cairns site boundary covers 1 Statistical Subdivision comprising 7 SLAs. Area of East Trinity needed to be excluded (postcode 4871) from Cairns Trinity SLA as this postcode covers a large area of inland Far North Queensland and would not be representatives of the Cairns city region
RuralityRegional
Geographic area489.9 km²
Postcode4878, 4870, 4879, 4865, 4869, 4868
Population characteristics
Population 2006 2011 Difference %
Total population 122 234 137 248 + 12.3
Aboriginal and Torres Strait Islander population 9558 12 319 + 28.9
% of total population identified as Aboriginal and Torres Strait Islander people
7.8 9.0 + 1.2a
Workforce expansion
ICDP workforce Evaluation cycle Total FTE allocated Total FTE recruited
ICDP workforce allocation and recruitment per 10 000 Aboriginal and Torres Strait Islander population within the boundary of the DGP.
2 1.2 0.9
3 1.2 1.2
4 1.2 1.2
5 2.6 2.6
ICDP workforce Role Total FTE allocated Total FTE recruited
ICDP workforce allocation and recruitment (for final evaluation
Indigenous Health Project Officer
1 1
47

Sentinel Sites Evaluation: Final Report – Appendices – February 2013
ICDP workforce Role Total FTE allocated Total FTE recruited
cycle) – positions with responsibility of covering the Sentinel Site. Actual area of responsibility may be substantially larger than the Sentinel Site.
Outreach Worker 3 3
Regional Tobacco Coordinator
1 1
Tobacco Action Worker 3 2
Health Lifestyle Worker 2 2
Practice manager 1 1
Care Coordinatorb 4.7 4.7
General Practitioner characteristics for the whole Division of General Practice
Total number of General Practices66
Proportion of practices which are solo GP practices23%
Full-time working equivalent GP: population 2010 ratio1212
a The figures shown in the row for % of total population identified as Aboriginal and Torres Strait Islander people represent the difference in percentages between two census periods.b Evaluation visit update, Care Coordinator commenced in April 2012, no DoHA recruitment data received.
48
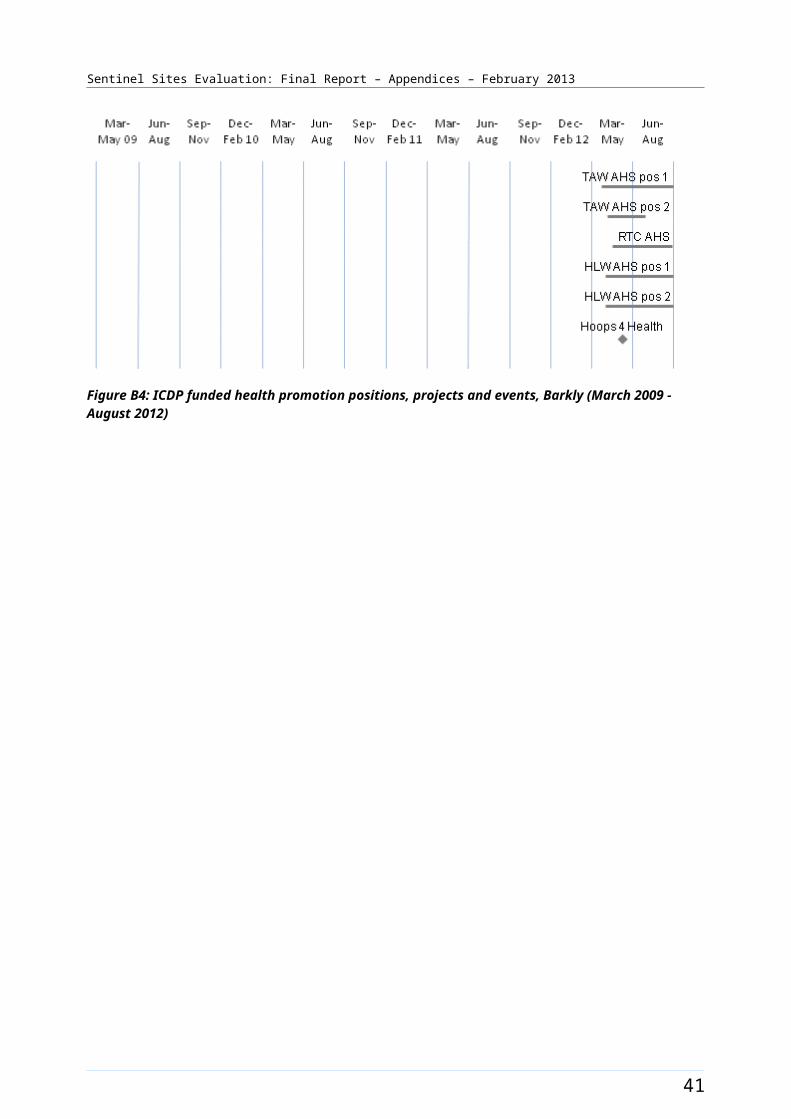
Sentinel Sites Evaluation: Final Report – Appendices – February 2013
Figure B10: ICDP funded health promotion positions, projects and events, Cairns (March 2009 - August 2012)
49
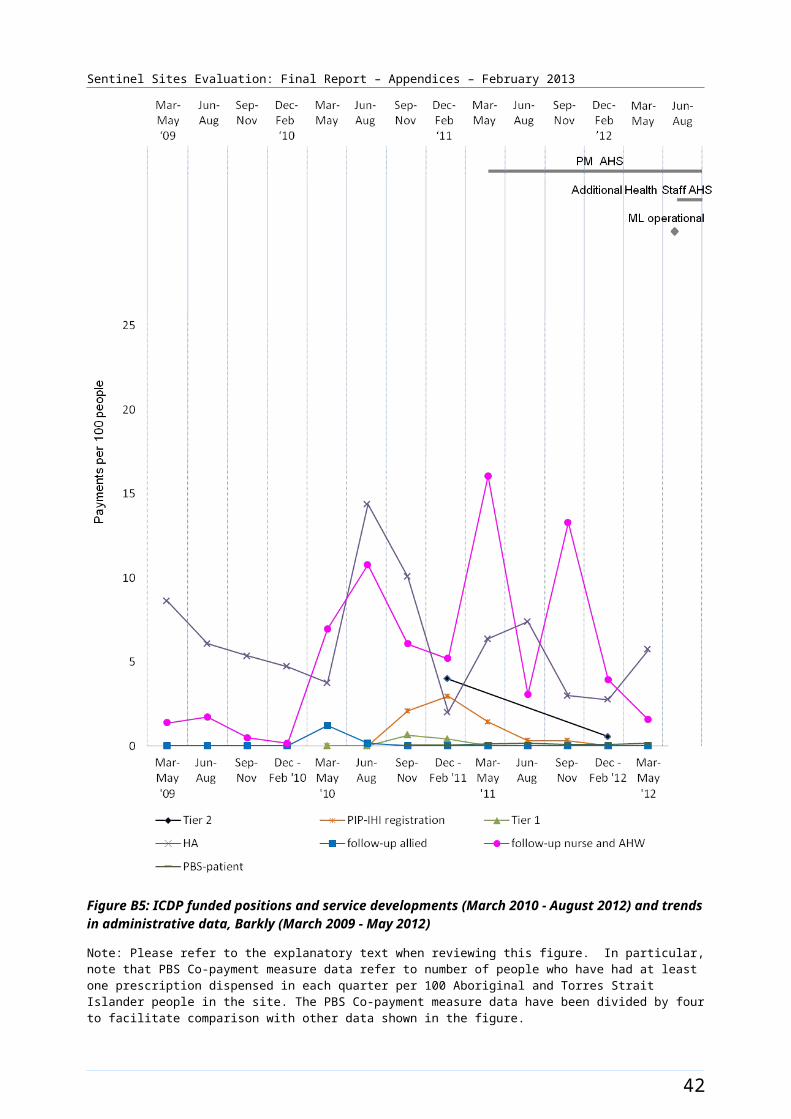
Sentinel Sites Evaluation: Final Report – Appendices – February 2013
Figure B11: ICDP funded positions and service developments (March 2010 - August 2012) and trends in administrative data, Cairns (March 2009 - May 2012)
Note: Please refer to the explanatory text when reviewing this figure. In particular, note that PBS Co-payment measure data refer to number of people who have had at least one prescription dispensed in each quarter per 100 Aboriginal and Torres Strait Islander people in the site. The PBS Co-payment measure data have been divided by four to facilitate comparison with other data shown in the figure.
50
Sentinel Sites Evaluation: Final Report – Appendices – February 2013
Campbelltown [Case study site]
The Campbelltown site was located in South Western Sydney approximately 50 kms southwest of the Sydney central business district (Figure B12). The site covered two SLAs with a total population of about 143 100 in 2006 and 145 600 in 2011 (Table B6). Between 2006 and 2011 the Aboriginal and Torres Strait Islander population increased by about 23% (a population of about 3800 increasing to 4700 respectively) (Table B6).
Approximately 2.7% of the total site population identified as Aboriginal and Torres Strait Islander people in 2006. The 2011 Census showed an increase of approximately 0.5% with approximately 3.2% identifying in 2011.
Health Service organisations and other key site characteristics and service developments
The DGP (Sydney South West GP Link Ltd, formerly known as Macarthur Division of General Practices Ltd) and the AHS (Tharawal Aboriginal Corporation) were key stakeholder organisations. Both were located in the city of Campbelltown. The site now falls within the region covered by the South Western Sydney Medicare Local, which became operational on 1 July 2012.22
There was one AHS and a number of General Practices located within the site. There were two non-government Health Services that operated just outside the site boundary and worked in collaboration. These were Marumali, which was established prior to 2010 and 114 Family Practice Health Service, which was established in June in 2010. Marumali provided a medical brokerage service. 23 Both Health Services could be utilised by Aboriginal and Torres Strait Islander patients from within the site. The AHS adopted the Communicare clinical information management system in September 2011.
The DGP employed a large team including dietitians and exercise physiologists. A large care coordination team, funded through NSW Health24 was also based at the DGP. There were two hospitals within the site.
Campbelltown site was classed as a district of workforce shortage for GPs during 2012, based on the information accessed in April 2012 and October 2012.25
The AHS participated in the QUMAX program.
Local Community Campaign to Promote Better Health activity occurred in the site during the evaluation (Chapter 4, Table 4.1). The Djurali program was a healthy lifestyle program where funding was received in early 2011 and the program was launched in June 2011. The Get Active, Anytime, Anywhere project funding was used to expand the existing Djurali program. The AHSs Community Health Expo (held 24 June 2011) engaged the local community in conversations about the contributing factors in developing chronic disease, and how making simple changes helps minimise the chances of developing disease. The Campbelltown City Council, NAIDOC Week Touch Football Competition – Football for Fitness (held 6 July 2011) was hosted by Tharawal Aboriginal Corporation and Tharawal Land Council. Participants were encouraged to get active and eat healthily, with a range of healthy catering options provided on the day. The Good Tucker All Round project was a fruit and vegetable delivery program launched in August 2012 The timing of events is depicted in Figure B13.
22 DoHA, My Medicare Local [website], op cit. 23 Marumali (accessed 5 October 2012).24 NSW Health, Connecting Care [website] (accessed 5 October 2012).25 DoHA, Doctor Connect [website], op cit.
51
Sentinel Sites Evaluation: Final Report – Appendices – February 2013
Workforce expansion
Workforce allocations for the Regional Tackling Smoking and Healthy Lifestyle team were filled during the evaluation period. These allocations included up to three TAW positions, one RTC and two HLW positions at the AHS (Table B6). One TAW position was filled in December 2010 – February 2011 quarter until June – August 2011 and refilled from March – May 2012. The position was vacant for six months over this time. The position has had one incumbent. The RTC position was filled in December 2010 – February 2011 quarter until June – August 2011. It was refilled in December 2011 – February 2012 quarter for approximately four months and then became vacant again. The HLW position 1 was filled from September – November 2010 quarter, the HLW position 2 was filled from the December 2010 - February 2011 quarter until June – August 2011. The position was refilled in early 2012. It had two incumbents over the evaluation period. The pattern of recruitment to these allocations throughout the SSE is depicted in Figure B13.
A workforce allocation for one OW position at the AHS was filled during the evaluation. The OW AHS position was filled from the December 2010 – February 2011 quarter. Allocations for two OW positions, one IHPO and one Care Coordinator position at the DGP were also filled. The OW DGP position 1 was filled during the December 2010 – February 2011 quarter until the December 2011 – February 2012 quarter. OW DGP position 2 was filled during the March – May 2011 quarter. The IHPO DGP (0.5 FTE) and the Care Coordination DGP positions were filled during December 2010 – February 2011 quarter and remained filled at the end of the evaluation period. One OW DGP allocation and 0.5 FTE of the second IHPO DGP allocation support positions that work in locations outside the site. The pattern of recruitment to these allocations, together with trends in the uptake of various measures (as reflected by administrative data) throughout the SSE, is shown in Figure B14.
52
Sentinel Sites Evaluation: Final Report – Appendices – February 2013
Figure B12: Campbelltown site boundary map
53
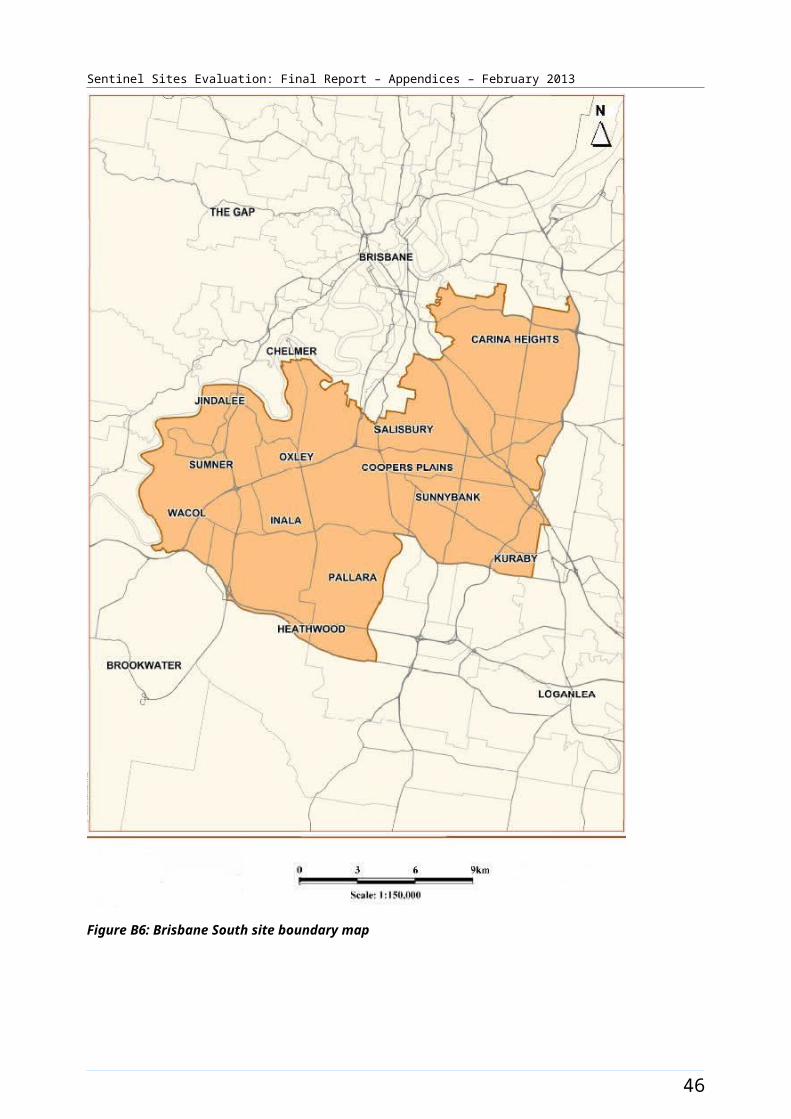
Sentinel Sites Evaluation: Final Report – Appendices – February 2013
Campbelltown site characteristics
Campbelltown, New South Wales; case study site, stage 2
Key stakeholder organisations
Tharawal Aboriginal Corporation
Sydney South West GP Link Ltd (formerly known as Macarthur Division of General Practice Ltd)
Geographical characteristics
Site boundary There are 2 SLAs within the Campbelltown site.
RuralityUrban
Geographic area312.3 km²
Postcode2167, 2558, 2559, 2560, 2563, 2564, 2565, 2566
Population characteristics
Population 2006 2011 Difference %
Total population 143 076 145 569 + 1.7
Aboriginal and Torres Strait Islander population 3834 4729 + 23.3
% of total population identified as Aboriginal and Torres Strait Islander people
2.7 3.2 + 0.5a
Workforce expansion
ICDP workforce Evaluation cycle Total FTE allocated Total FTE recruited
ICDP workforce allocation and recruitment per 10 000 Aboriginal and Torres Strait Islander population within the boundary of the DGP.
2 7.9 5.9
3 9.9 9.9
4 9.9 7.9
5 9.9 7.9
ICDP workforce Role Total FTE allocated Total FTE recruited
ICDP workforce allocation and recruitment (for final evaluation cycle) – positions with responsibility of covering the Sentinel Site. Actual area of responsibility may be substantially larger than the
Indigenous Health Project Officer
1 1
Outreach Worker 3 2b
Regional Tobacco Coordinator
1 0
54
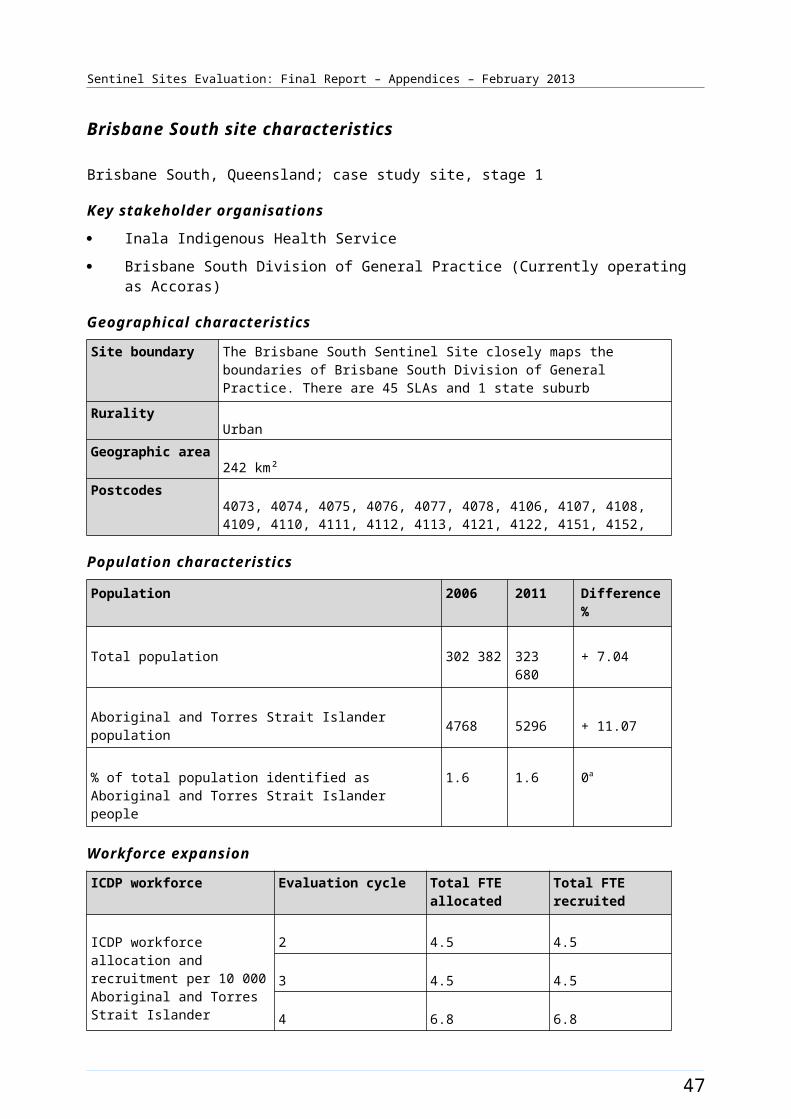
Sentinel Sites Evaluation: Final Report – Appendices – February 2013
ICDP workforce Role Total FTE allocated Total FTE recruited
Sentinel Site. Tobacco Action Worker 3 1
Healthy Lifestyle Worker 2 2
Care Coordinator 1 1
55
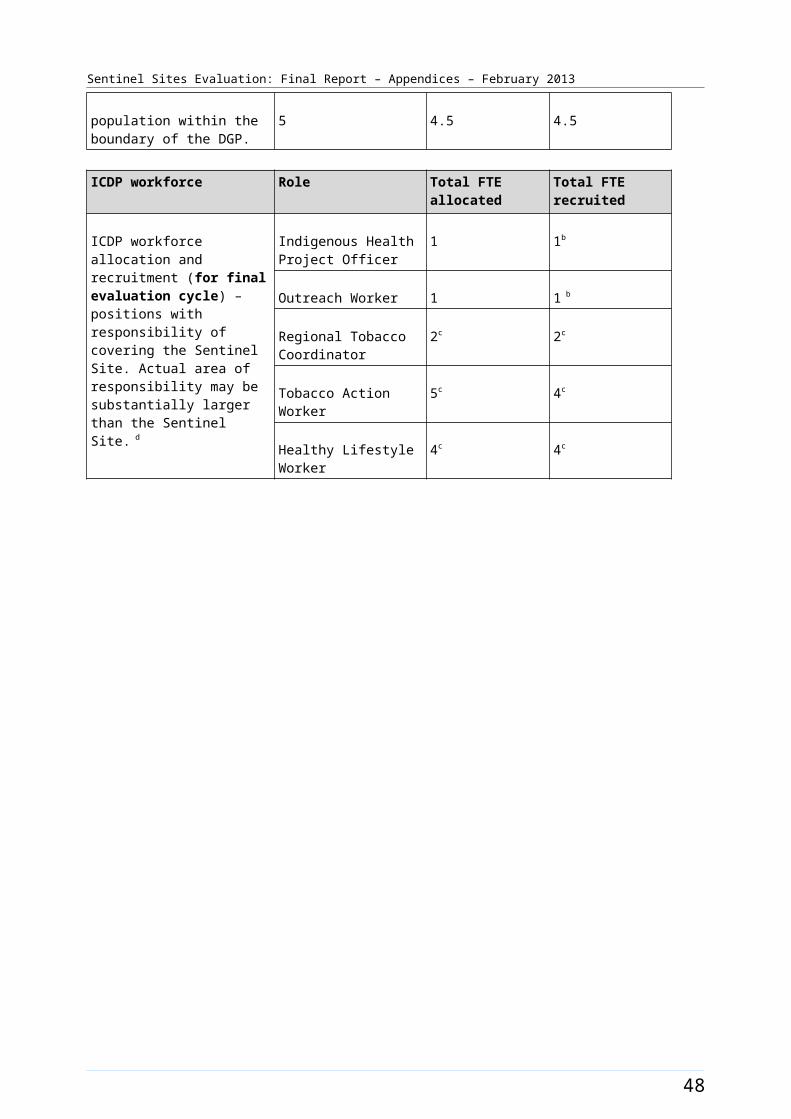
Sentinel Sites Evaluation: Final Report – Appendices – February 2013
General Practitioner characteristics for the whole Division of General Practice c
Total number of General Practices84
Proportion of practices which are solo GP practices54%
Full-time working equivalent GP: population 2010 ratio939
a The figures shown in the row for % of total population identified as Aboriginal and Torres Strait Islander people represent the difference in percentages between two census periods.b Two OWs are allocated to DGP, one was based within the site, one outside the site. Both assisted patients with GP access within the site. One OW position within the site remained vacant at the evaluation visits in February 2012 and August 2012.c MacArthur DGP (215) became Sydney South West GP link and amalgamated with another Division 210 Macarthur Division of General Practice Ltd – Fairfield Liverpool region. For Sentinel Sites boundary purposes the Division 215 data was more reflective for Campbelltown and has been used.
56

Sentinel Sites Evaluation: Final Report – Appendices – February 2013
Figure B13: ICDP funded health promotion positions, projects and events, Campbelltown (March 2009 - August 2012)
57
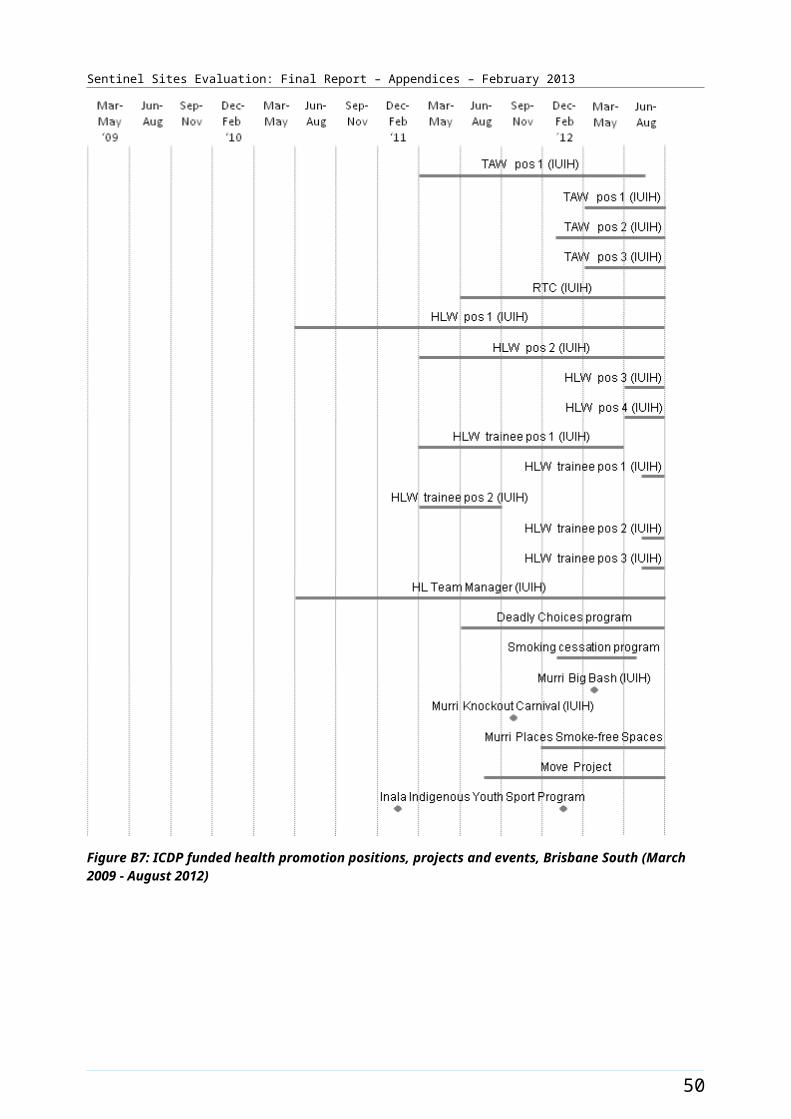
Sentinel Sites Evaluation: Final Report – Appendices – February 2013
Figure B14: ICDP funded positions and service developments (March 2010 - August 2012) and trends in administrative data, Campbelltown (March 2009 - May 2012)
Note: Please refer to the explanatory text when reviewing this figure. In particular, note that PBS Co-payment measure data refer to number of people who have had at least one prescription dispensed in each quarter per 100 Aboriginal and Torres Strait Islander people in the site. The PBS Co-payment measure data have been divided by four to facilitate comparison with other data shown in the figure.
58

Sentinel Sites Evaluation: Final Report – Appendices – February 2013
Canberra [Tracking site]
The Canberra site covered the Australian Capital Territory which included eight Statistical Sub-divisions (114 SLAs) (Figure B15), with a total population of about 323 300 in 2006 and about 355 000 in 2011 (Table B7).
The Aboriginal and Torres Strait Islander population increased by about 32% between 2006 and 2011 (a population of about 3800 increasing to about 5100 respectively). Approximately 1.2% of the total site population identified as Aboriginal and Torres Strait Islander people in the 2006 Census. The 2011 Census showed an increase of approximately 0.2% to about 1.4% identifying in 2011 (Table B7). There were about 46 000 people within the Queanbeyan Statistical Sub Division in 2006, which lay adjacent to the ACT border, many of whom are reported to access services in the ACT. Aboriginal and Torres Strait Islander people made up about 2.3% of the total population of the Queanbeyan Statistical Sub-Divisions. In the 2011 Census Queanbeyan Statistical Local Area 3 recorded approximately 54 000 people. Aboriginal and Torres Strait Islander people made up about 2.6% of the total population of the Queanbeyan Statistical Local Area 3.
Health Service organisations and other key site characteristics and service developments
Both the DGP (ACT Division of General Practice) and the AHS (Winnunga Nimmityjah Aboriginal Health Service) were key stakeholder organisations and were located within the site. The DGP covered the whole of the ACT. The ACT Medicare Local, which commenced on 1 July 2011, now covers the same area.26
Within the site there were numerous General Practices, a GP super clinic and four hospitals.
The majority of the site area within Canberra was classed as a district of workforce shortage for GPs during 2012, based on the information accessed in November 2012.27
The AHS participated in the Healthy for Life program and QUMAX.
Local Community Campaign to Promote Better Health activity was occurring in the site late in the evaluation (Chapter 4, Table 4.1). The Solid Young Fulla’s Aboriginal Corporation was funded from September 2012 to work in collaboration with other local services to undertake the Chronic Disease Self-Management project. This aimed to increase skills and knowledge of community leaders running physical and social activities, including adapting local resources so that they were culturally appropriate.28
Workforce expansion
Workforce allocations for a Regional Tackling Smoking and Healthy Lifestyle team were filled during the evaluation. This included one TAW and one HLW position. The TAW position was filled during the second evaluation cycle and the HLW position was filled during the third evaluation cycle (Table B8).
26 DoHA, My Medicare Local [website], op cit.27 DoHA, Doctor Connect [website], op cit.28 DoHA [website] Live Longer! (accessed 15 January 2013).
59
Sentinel Sites Evaluation: Final Report – Appendices – February 2013
Workforce allocations for one OW and a Practice Manager position (0.5 FTE) at the AHS were partly filled during the evaluation. The Practice Manager allocation reduced from full-time to 0.5 FTE over the evaluation period (Table B8). Allocations for one OW and one IHPO at the DGP were also filled. As were allocations for Care Coordinator positions. The Care Coordinator allocation increased over time from one to four positions with one position based at the AHS and three at the DGP. The pattern of allocations and recruitment for these allocations throughout the SSE (based on reported data) is presented in Table B8.
60
Sentinel Sites Evaluation: Final Report – Appendices – February 2013
The trends in administrative data for Canberra are displayed in Figure B16.
Figure B15: Canberra site boundary map
61
Sentinel Sites Evaluation: Final Report – Appendices – February 2013
Canberra site characteristics
Canberra, Australian Capital Territory; tracking site, stage 2
Key stakeholder organisations:
Winnunga Nimmityjah Aboriginal Health Service
ACT Division of General Practice
Geographical characteristics
Site boundary Canberra Sentinel Sites include 8 Statistical Sub Divisions comprising 114 SLAs.
RuralityUrban
Geographic area2351.7 km²
Postcode2600, 2601, 2602, 2603, 2604, 2605, 2606, 2607, 2609, 2611, 2612, 2614, 2615, 2617, 2618, 2630, 2900, 2902, 2903, 2904, 2905, 2906, 2911, 2912, 2913, 2914
Population characteristics
Population 2006 2011 Difference %
Total population 323 326 354 960 + 9.8
Aboriginal and Torres Strait Islander population 3847 5085 + 32.2
% of total population identified as Aboriginal and Torres Strait Islander people
1.2 1.4 + 0.2a
Workforce expansion
ICDP workforce Evaluation cycle Total FTE allocated Total FTE recruited
ICDP workforce allocation and recruitment per 10 000 Aboriginal and Torres Strait Islander population within the boundary of the DGP.
2 7.8 5.2
3 10.4 10.4
4 10.4 10.4
5 18.2 18.2
ICDP workforce Role Total FTE allocated Total FTE recruited
ICDP workforce allocation and recruitment (for final evaluation cycle) – positions with responsibility of covering the
Indigenous Health Project Officer
1 1
Outreach Worker 2 2
62

Sentinel Sites Evaluation: Final Report – Appendices – February 2013
ICDP workforce Role Total FTE allocated Total FTE recruited
Sentinel Site. Actual area of responsibility may be substantially larger than the Sentinel Site.
Practice manager 0.5 0
Tobacco Action Worker 1 1
Healthy Lifestyle Worker 1 1
Care Coordinator 4 4
63
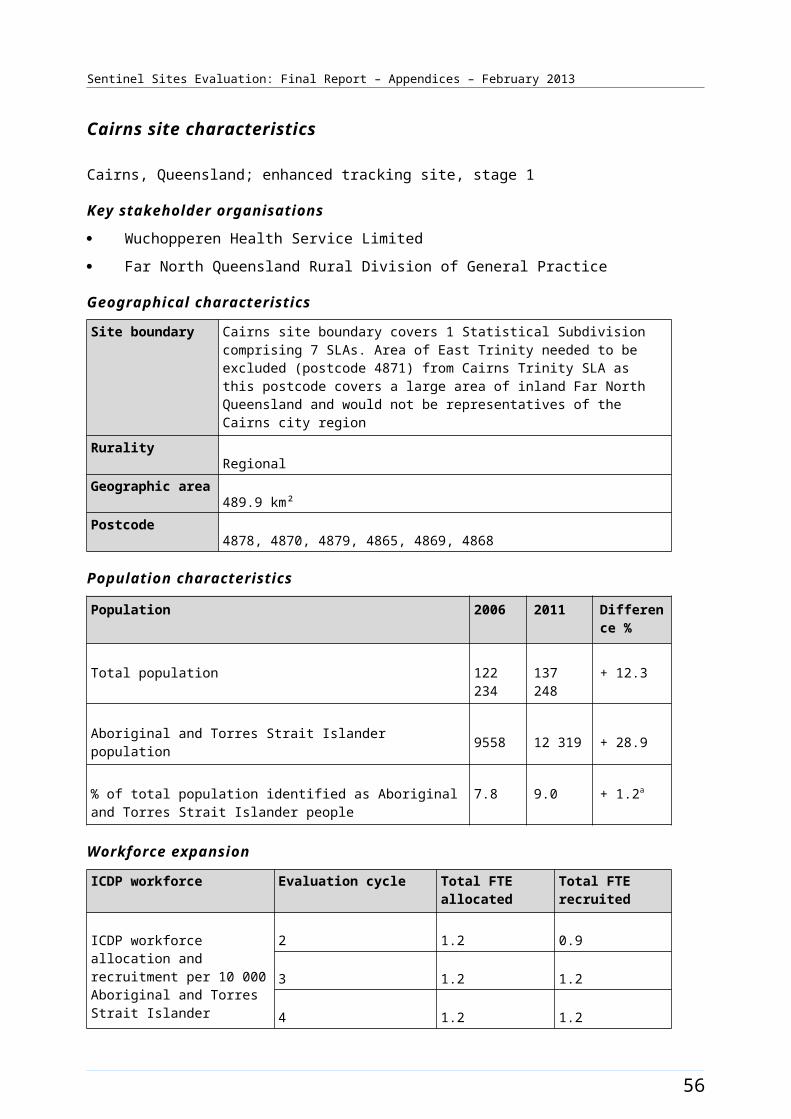
Sentinel Sites Evaluation: Final Report – Appendices – February 2013
General Practitioner characteristics for the whole Division of General Practice
Total number of General Practices84
Proportion of practices which are solo GP practices24%
Full-time working equivalent GP: population 2010 ratio1525
a The figures shown in the row for % of total population identified as Aboriginal and Torres Strait Islander people represent the difference in percentages between two census periods.
64
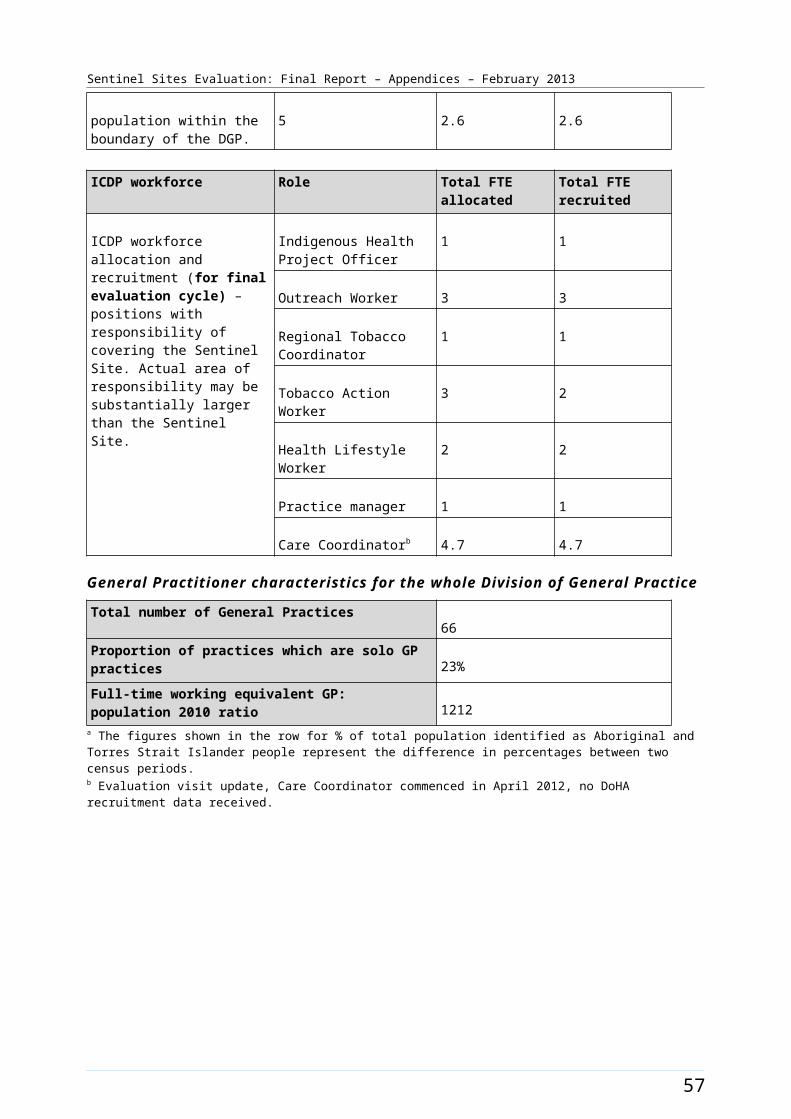
Sentinel Sites Evaluation: Final Report – Appendices – February 2013
Table B8: ICDP funded allocations and recruitment, Canberra, February 2011 – October 2012
Position Allocated FTE/
Recruitment FTE
Evaluation cycle two
Evaluation
cycle three
Evaluation
cycle four
Evaluation cycle five
Indigenous Health Project Officer (DGP)
Allocated 1.0 1.0 1.0 1.0
Recruited 1.0 1.0 1.0 1.0
Outreach Worker (DGP) Allocated 1.0 1.0 1.0 1.0
Recruited 0.0 1.0 1.0 1.0
Outreach Worker (AHS) Allocated 1.0 1.0 1.0 1.0
Recruited 1.0 1.0 1.0 1.0
Tobacco Action Worker (AHS)
Allocated 1.0 1.0 1.0 1.0
Recruited 1.0 1.0 1.0 1.0
Healthy Lifestyle Worker (AHS)
Allocated - 1.0 1.0 1.0
Recruited - 1.0 1.0 1.0
Care Coordinator (DGP) Allocated - 1.0 3.0 4.0
Recruited - 1.0 3.0 4.0
Practice Manager (AHS) Allocated - - 1.0 0.5
Recruited - - 0.0 0.0
Notes: Site implementation was a staged process, subsequently data available from the second evaluation cycle only in this site. All DoHA sources have been updated to reflect interview findings up to four months following the DoHA data source.Source: DoHA Program data - Data for evaluation cycle two as at 25 February 2011; evaluation cycle three as at 30 June 2011; evaluation cycle four as at 31 December 2011 and evaluation cycle five as at 30 June 2012 and interview data (up to October 2012).
65
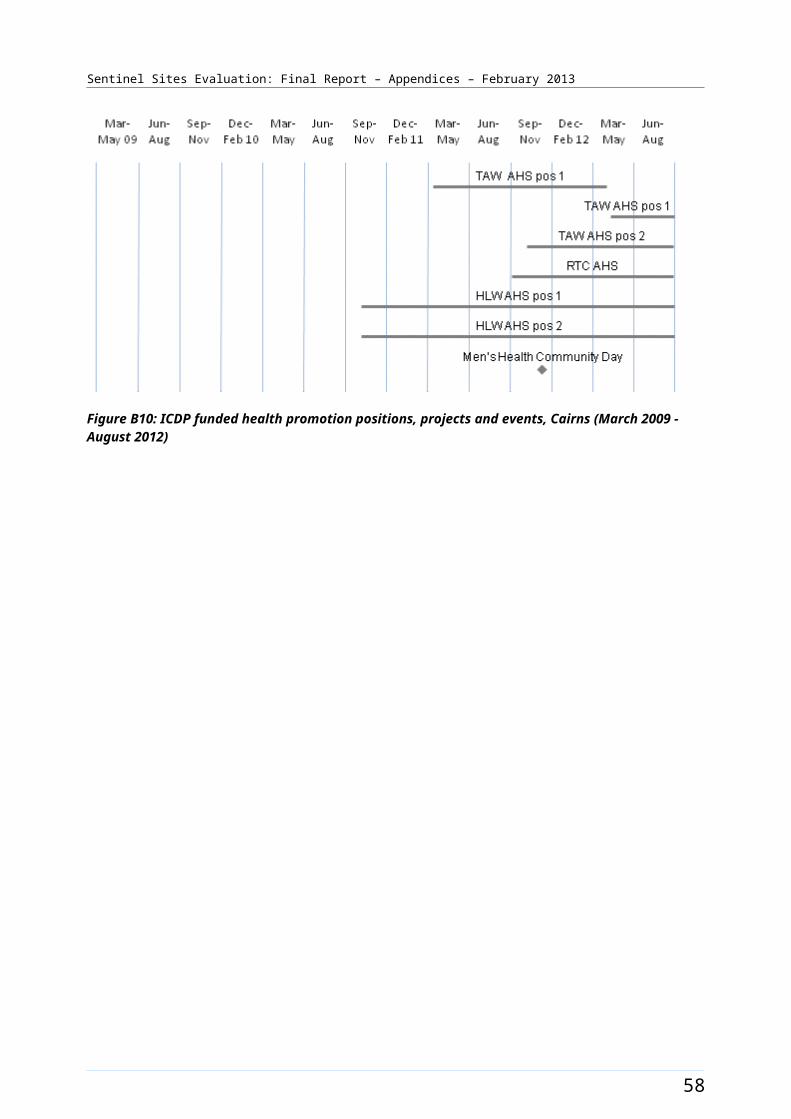
Sentinel Sites Evaluation: Final Report – Appendices – February 2013
Figure B16: Trends in administrative data, Canberra (March 2009 - May 2012)
Note: Please refer to the explanatory text when reviewing this figure. In particular, note that PBS Co-payment measure data refer to number of people who have had at least one prescription dispensed in each quarter per 100 Aboriginal and Torres Strait Islander people in the site. The PBS Co-payment measure data have been divided by four to facilitate comparison with other data shown in the figure.
66
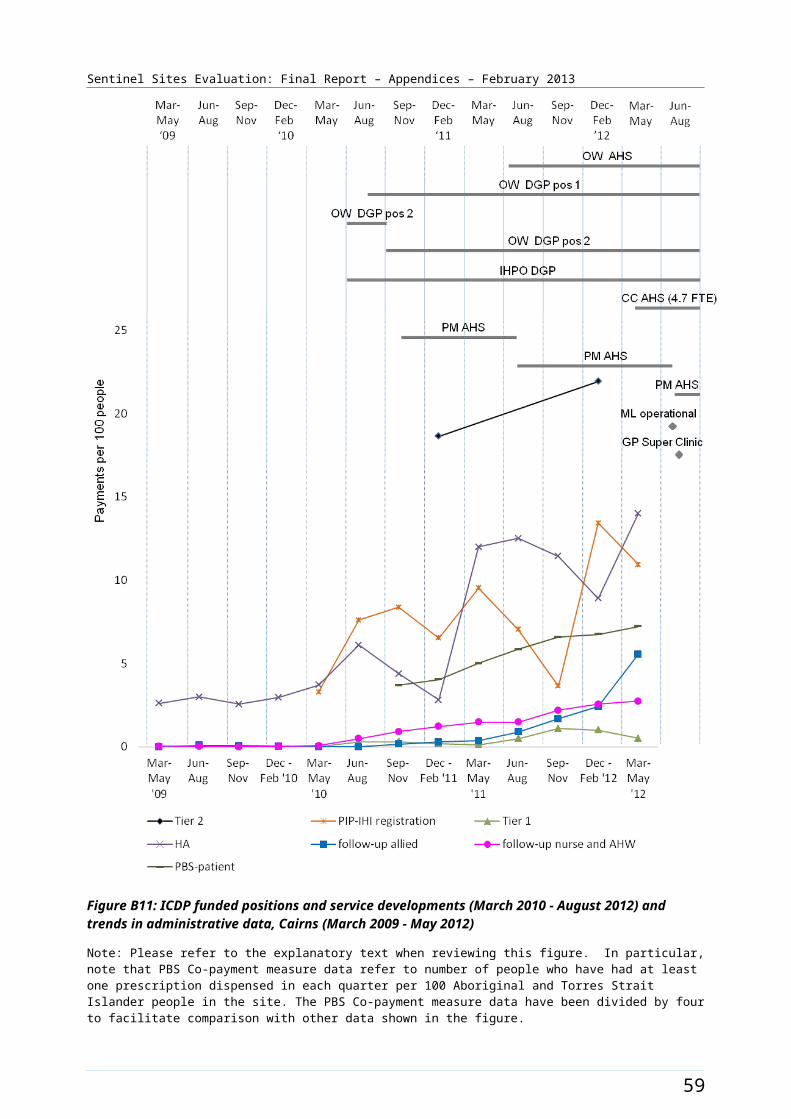
Sentinel Sites Evaluation: Final Report – Appendices – February 2013
Dandenong [Tracking site]
The Dandenong site in Victoria was located south-east of Melbourne and covered 10 SLAs in the Dandenong, Frankston and Mornington Peninsula areas (Figure B17). The City of Greater Dandenong had an estimated population of about 142 000 people in 2012,29 and the City of Frankston had a population of about 127 000 in 2011.30 These two major outer urban centres are between 30 and 40 kms from the Melbourne CBD. Part of the site was rural with farmland, coastal areas and tourism, but it also covered an area of urban growth.
The total population of the site was approximately 581 200 in 2006 increasing to about 640 800 in 2011 (Table B9). Between 2006 and 2011 the Aboriginal and Torres Strait Islander population increased by about 27% (a population of about 3000 increasing to about 3800 respectively) (Table B9).
Approximately 0.5% of the total site population identified as Aboriginal and Torres Strait Islander people in both the 2006 and 2011 Census.
Health Service organisations and other key site characteristics and service developments
Two DGPs (Dandenong and Casey General Practice Association & Peninsula GP Network) and one AHS (Dandenong and District Aboriginal Cooperative Ltd) were key stakeholder organisations for the site. The site now falls within the entire region covered by the Frankston-Mornington Peninsula Medicare Local and the western part of the South Eastern Melbourne Medicare Local, which both commenced on 1 January 2012.31
Greater Dandenong is the most culturally diverse municipality in Victoria;32 however, this cultural variation is not represented throughout the site.
The AHS was based in Dandenong and operated a relatively new outreach clinic in Hastings in the north east of the Mornington Peninsula. For Aboriginal and Torres Strait Islander people of this area the next closest AHS was near the centre of Melbourne. The Willum Warrain Gathering Place also opened in Hastings in the evaluation period.33 There were four public hospitals in the site and a GP super clinic in Berwick; which commenced on 10 October 2011.34 A large medical service, five private hospitals and many General Practices were also within the site boundary.
The majority of the SLAs within Dandenong site (6/10) were not classed as a district of workforce shortage for GPs during 2012, based on the information accessed in November 2012.35
The AHS participated in the QUMAX program.
Workforce expansion
Workforce allocations for a Regional Tackling Smoking and Healthy Lifestyle team were filled during the evaluation. This included up to three TAW positions, one RTC and two HLW positions at the AHS. One TAW position, the RTC and both HLW positions were filled from the third evaluation cycle. The TAW
29 City of Greater Dandenong Council [website] (accessed 13 November 2012).30 Australian Bureau Of Statistics, Quick Stats [Website] (accessed 13 November 2012).31 DoHA, My Medicare Local [website], op cit. 32 City of Greater Dandenong [website], op cit. 33 Mornington Peninsula Shire [website] (accessed 13 November 2012).34 DoHA, GP Super Clinics [website] (accessed 19 October 2012).35 DoHA, Doctor Connect [website], op cit.
67
Sentinel Sites Evaluation: Final Report – Appendices – February 2013
allocations increased from one position to three positions over the evaluation period. The pattern of allocation and recruitment to these positions over the evaluation are presented in Table B10.
A workforce allocation for one OW position at the AHS was filled during the evaluation. This allocation was filled during the third evaluation cycle and reduced from full-time to 0.7 FTE over the evaluation period (Table B10). Allocations for one OW and up to 1.5 FTE IHPO positions at the DGP were also filled. The IHPO allocation reduced from 1.5 FTE to 1.35 FTE over the evaluation period (Table B10). An allocation for one Care Coordinator position was also filled. This allocation commenced as full-time and reduced to 0.8 FTE over the evaluation period. The pattern of allocation and recruitment to these positions over the evaluation are presented in Table B10.
The trends in administrative data for Dandenong are displayed in Figure B18.
68
Sentinel Sites Evaluation: Final Report – Appendices – February 2013
Figure B17: Dandenong site boundary map
69
Sentinel Sites Evaluation: Final Report – Appendices – February 2013
Dandenong site characteristics
Dandenong, Victoria; tracking site, stage 2
Key stakeholder organisations
Dandenong and District Aboriginal Cooperative Ltd
Dandenong Casey General Practice Association
Peninsula GP Network
Geographical characteristics
Site boundary There are 10 SLAs within the Sentinel Site.
RuralityUrban
Geographic area1189.9 km²
Postcodes3156, 3171, 3172, 3173, 3174, 3175, 3177, 3198, 3199, 3200, 3201, 3802, 3803, 3804, 3805, 3806, 3910, 3911, 3912, 3913, 3915, 3916, 3918, 3919, 3920, 3926, 3927, 3928, 3929, 3930, 3931, 3933, 3934, 3936, 3937, 3938, 3939, 3940, 3941, 3942, 3943, 3944, 3975, 3976, 3977
Population characteristics
Population 2006 2011 Difference %
Total population 581 191 640 809 + 10.3
Aboriginal and Torres Strait Islander population 2996 3812 + 27.2
% of total population identified as Aboriginal and Torres Strait Islander people
0.5 0.6 + 0.1a
Workforce expansion
ICDP workforce Evaluation cycle Total FTE allocated Total FTE recruited
ICDP workforce allocation and recruitment per 10 000 Aboriginal and Torres Strait Islander population within the boundary of the DGP.
2 - -
3 11.7 11.7
4 15.1 9.7
5 13.1 8.6
ICDP workforce Role Total FTE allocated Total FTE recruited
ICDP workforce allocation and recruitment (for final evaluation
Indigenous Health Project Officer
1.35 0.8b
70
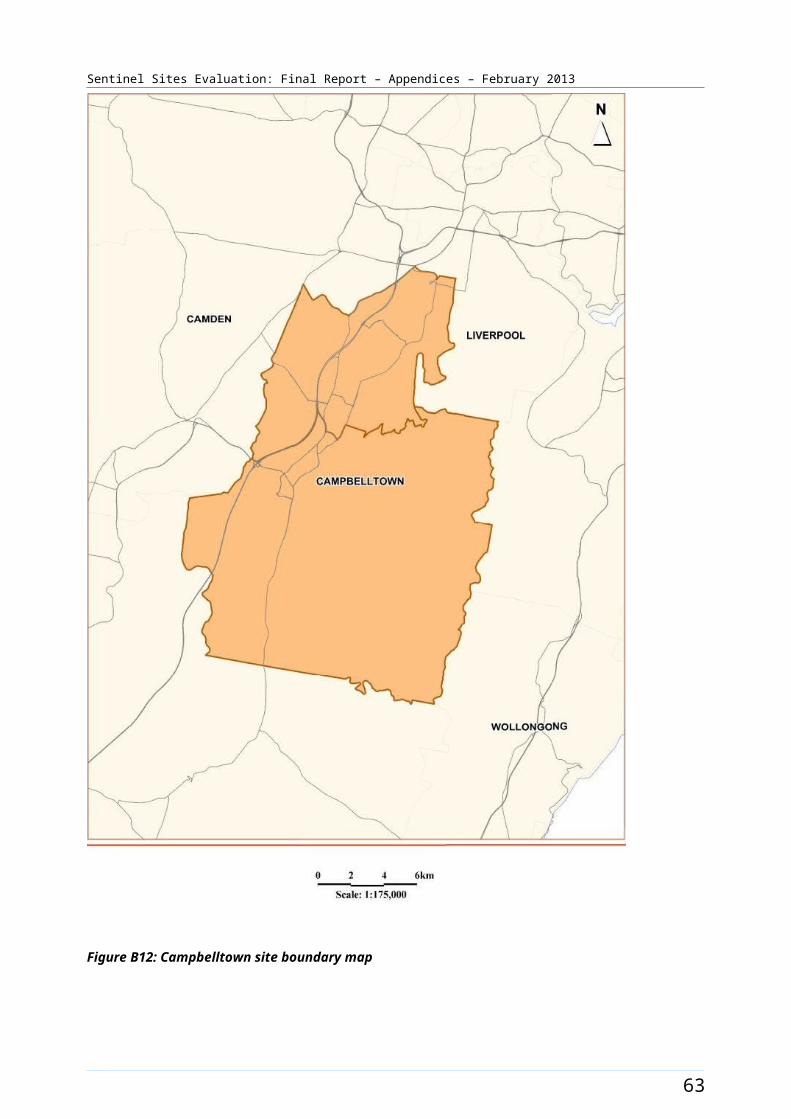
Sentinel Sites Evaluation: Final Report – Appendices – February 2013
ICDP workforce Role Total FTE allocated Total FTE recruited
cycle) – positions with responsibility of covering the Sentinel Site. Actual area of responsibility may be substantially larger than the Sentinel Site.
Outreach Worker 1.75 1c
Regional Tobacco Coordinator
1 1
Tobacco Action Worker 3 1
Healthy Lifestyle Worker 2 2
Care Coordinator 0.8 0.8
GP characteristics for the whole Division of General Practice d
Total number of General Practices164
Proportion of practices which are solo GP practices26.8%
Full-time working equivalent GP: population 2010 ratio1107
a The figures shown in the row for % of total population identified as Aboriginal and Torres Strait Islander people represent the difference in percentages between two census periods.b There are two Medicare Locals (South Eastern Melbourne Medicare Local and Frankston-Mornington Peninsula Medicare Local) now covering this site and both were in tranche 2. Both have IHPO positions, one is not filled.c The AHS OW allocation had decreased FTE and was vacant. There was only one Medicare Local with OW fundingd Includes both DGPs.
71

Sentinel Sites Evaluation: Final Report – Appendices – February 2013
Table B10: ICDP funded allocations and recruitment, Dandenong, June 2011 - October 2012
Position Allocated FTE/
Recruitment FTE
Evaluation
cycle three
Evaluation
cycle four
Evaluation cycle five
Indigenous Health Project Officer (DGP)
Allocated 1.5 1.5 1.35
Recruited 1.5 0.9 0.8
Outreach Worker (DGP) Allocated 1.0 1.0 1.0
Recruited 1.0 1.0 1.0
Outreach Worker (AHS) Allocated 1.0 1.0 0.75
Recruited 1.0 1.0 0.0
Regional Tobacco Coordinator (AHS)
Allocated 1.0 1.0 1.0
Recruited 1.0 0.0 1.0
Tobacco Action Worker (AHS) Allocated 1.0 2.0 3.0
Recruited 1.0 1.0 1.0
Healthy Lifestyle Worker (AHS) Allocated 2.0 2.0 2.0
Recruited 2.0 2.0 2.0
Care Coordinator (DGP) Allocated Unknown 1.0 0.8
Recruited 0.0 0.0 0.8
Notes: Site implementation was a staged process, subsequently data available from the third evaluation cycle only in this site. All DoHA sources have been updated to reflect interview findings up to four months following the DoHA data source.Source: DoHA Program data - Data for evaluation cycle three as at 30 June 2011; evaluation cycle four as at 31 December 2011 and evaluation cycle five as at 30 June 2012 and interview data (up to October 2012).
72

Sentinel Sites Evaluation: Final Report – Appendices – February 2013
Figure B18: Trends in administrative data, Dandenong (March 2009 - May 2012)
Note: Please refer to the explanatory text when reviewing this figure. In particular, note that PBS Co-payment measure data refer to number of people who have had at least one prescription dispensed in each quarter per 100 Aboriginal and Torres Strait Islander people in the site. The PBS Co-payment measure data have been divided by four to facilitate comparison with other data shown in the figure
73

Sentinel Sites Evaluation: Final Report – Appendices – February 2013
Darwin [Enhanced tracking site]
The Darwin site included the city of Darwin, covering the Darwin Statistical Sub-Division (Figure B19). The Statistical Sub-Division had an estimated population of almost 66 300 in 2006 and included 30 SLAs. The estimated population of this area in 2011 was about 73 200 (Table B11). The site did not include the city of Palmerston (which lies about 20 kms to the south of Darwin city centre) or any of the rural area surrounding Darwin. The Greater Darwin area (including the areas referred to above) had a population of approximately 121 000 in 2011.36
About 9.4% of the total population of the site identified as Aboriginal and Torres Strait Islander people in the 2006 Census. The 2011 Census showed a decrease of approximately 1% with about 8.4% identifying (a population of about 6200 in both periods) (Table B11).
Health Service organisations and other key site characteristics and service delivery
The AHS (Danila Dilba Health Service) was located within the site. The DGP (General Practice Network NT) had an office in both Darwin and Alice Springs and led and coordinated a territory-wide Primary Health Care Network. Both the AHS and the DGP were the key stakeholder organisations in the site. The Darwin site now falls within the region covered by the single Northern Territory Medicare Local, which commenced 1 July 2012.37
In addition to the AHS, there were numerous General Practices and one public and one private hospital located within the site. There was also a Community Health Centre which serviced an Aboriginal community located on Aboriginal land within the bounds of Darwin city. This community had a resident population of about 400 people though out the evaluation period. A GP super clinic opened in the city of Palmerston (in close proximity but outside the site) on 4 October 2012. The AHS based in Darwin ran a ‘family clinic’ in Palmerston in addition to outreach services within the site boundary.
Darwin is the major centre for remote and rural communities across the Top End, and health care services provide for many Aboriginal and Torres Strait Islander people who reside outside the site boundary and for people visiting Darwin.
Darwin site was classed as a district of workforce shortage for GPs during 2012, based on the information accessed in November 2012.38
The AHS participated in both the Healthy for Life program and QUMAX.
Local Community Campaign to Promote Better Health activity occurred in the site during the evaluation (Chapter 4, Table 4.1). The Hoops 4 Health program commenced in October 2011 using basketball to raise awareness around the benefits of regular check-ups to detect, prevent and manage chronic disease (Figure B20). Activity occurred in Darwin and other sites in remote Northern Territory.
Workforce expansion
Workforce allocations for the Regional Tackling Smoking and Healthy Lifestyle team were filled during the evaluation. This included funding for up to three TAW positions, one RTC and two HLW positions at the AHS. One TAW position was filled by two people during the March – May 2011 quarter. The RTC
36 Australian Bureau Of Statistics, Quick Stats [website], op cit.37 DoHA, My Medicare Local [website], op cit. 38 DoHA, Doctor Connect [website], op cit.
74
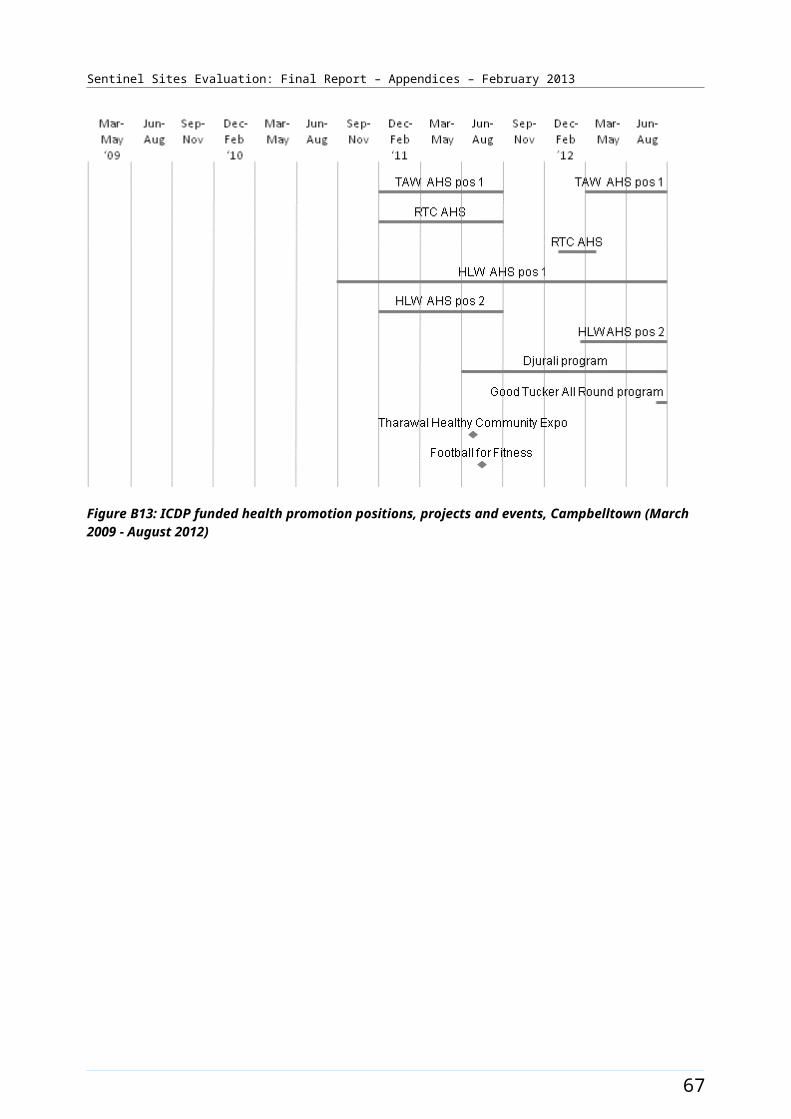
Sentinel Sites Evaluation: Final Report – Appendices – February 2013
position was filled during the June – August 2011 quarter. The HLW position 1 was filled during the June – August 2010 quarter and the HLW position 2 was filled initially during the September – November 2010 quarter becoming vacant in the December 2010 – February 2011 quarter. The position was refilled in the March – May 2011 quarter. All positions except two TAW positions were filled at the end of the evaluation period. The pattern of recruitment to these allocations throughout the SSE is depicted in Figure B20.
Workforce allocations for at least two OW positions, a Practice Manager (0.8 FTE) and additional health staff (1.6 FTE) at the AHS were filled during the evaluation. The OW AHS positions 1 and 2 were filled both during the September – November 2010 quarter. The Practice Manager position was filled during the June – August 2010 quarter and the additional health staff positions were filled from the same time. This allocation was used to recruit an Aboriginal Health Worker, with the remainder used discretionally by the AHS to employ a Diabetes Educator, and sessional GPs as required. Allocations for up to three Care Coordinator positions (based at the AHS) were also filled, with some positions covering Palmerston (outside the site). It was unclear how many positions covered the Sentinel Site. Care Coordinator positions 1 and 2 commenced during the March – May 2012 quarter. A third position was filled in October 2012 (outside the reporting period). All DGP positions were placed at the integrated DGP/GPNT SBO. An allocation for one IHPO at the DGP was filled during the evaluation. The IHPO DGP position was filled from the March – May 2010 quarter and had three incumbents over the evaluation period. The OW position DGP was filled to 1.0 FTE during the evaluation period, with the position split between Alice Springs and Darwin (0.5 FTE each). Only the Darwin based OW worked within the site, position was filled during the December 2011 – February 2012 quarter until March – May 2012. The pattern of recruitment to these allocations, together with trends in the uptake of various measures (as reflected by administrative data) throughout the SSE, is shown in Figure B21.
75
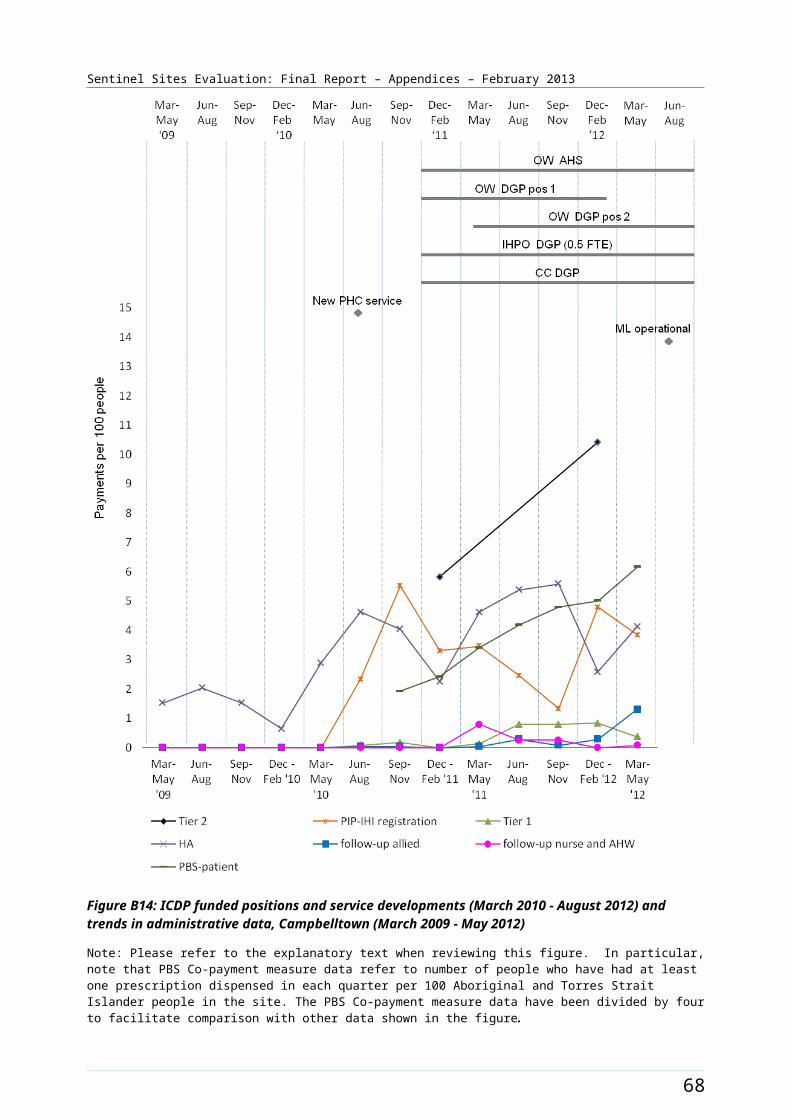
Sentinel Sites Evaluation: Final Report – Appendices – February 2013
Figure B19: Darwin site boundary map
76
Sentinel Sites Evaluation: Final Report – Appendices – February 2013
Darwin site characteristics
Darwin, Northern Territory; enhanced tracking site, stage 2
Key stakeholder organisations
Danila Dilba Health Service
General Practice Network NT
Geographical characteristics
Site boundary Darwin site covers 1 Statistical Subdivision which consists of 30 SLAs within the site.
RuralityRegional
Geographic area111.9 km²
Postcodes0810, 0812, 0820, 0909, 0800, 0828
Population characteristics
Population 2006 2011 Difference %
Total population 66 291 73 216 + 10.4
Aboriginal and Torres Strait Islander population 6233 6172 - 1.0
% of total population identified as Aboriginal and Torres Strait Islander people
9.4 8.4 - 1.0a
Workforce expansion
ICDP workforce Evaluation cycle Total FTE allocated Total FTE recruited
ICDP workforce allocation and recruitment per 10 000 Aboriginal and Torres Strait Islander population within the boundary of the DGP. d
2 7.2 6.4
3 7.2 6.4
4 8.8 8.8
5 12.0 11.2
ICDP workforce Role Total FTE allocated Total FTE recruited
ICDP workforce allocation and recruitment (for final evaluation cycle) – positions with responsibility of covering the Sentinel Site. Actual area of responsibility may be
Indigenous Health Project Officer
1 1
Outreach Worker 3.5 3.0
Regional Tobacco 1 1
77
Sentinel Sites Evaluation: Final Report – Appendices – February 2013
ICDP workforce Role Total FTE allocated Total FTE recruited
substantially larger than the Sentinel Site.b
Coordinator
Tobacco Action Worker 3 1
Healthy Life Style Worker 2 2
Care Coordinator 3 3c
Practice manager 0.8 0.8
Additional Health Staff 1.6 1.6
78
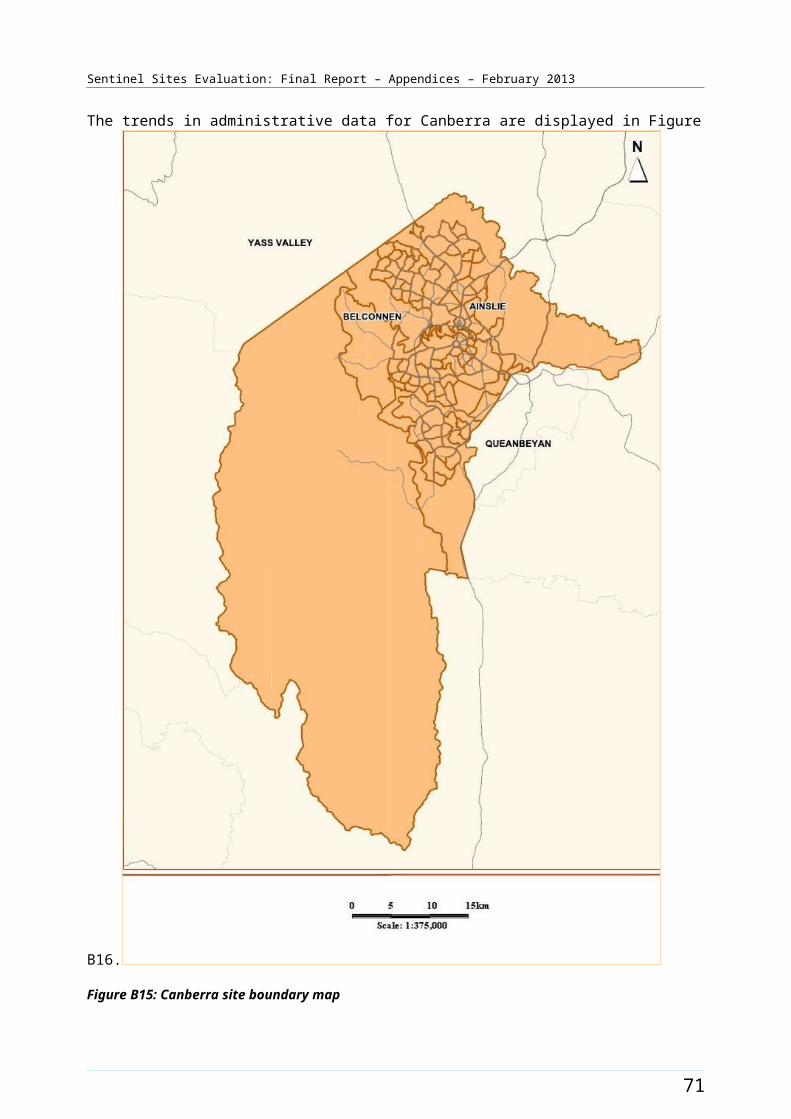
Sentinel Sites Evaluation: Final Report – Appendices – February 2013
General Practitioner characteristics for the whole Division of General Practice
Total number of General Practices105
Proportion of practices which are solo GP practices71%
Full-time working equivalent GP: population 2010 ratio1721
a The figures shown in the row for % of total population identified as Aboriginal and Torres Strait Islander people represent the difference in percentages between two census periods.b DoHA report the General Practice Network NT workforce allocation for both Darwin and Alice Springs. Only the Darwin allocation has been included in this table.c DoHA reported 3 Care Coordinator positions for Darwin and Palmerston for the AHS, It is unclear how many positions cover the Sentinel Site. d ICDP workforce allocation and recruitment per 10 000 Aboriginal and Torres Strait Islander people within the Sentinel Site is based on workforce allocated to and recruited for Danila Dilba and General Practice Network NT for Darwin only.
79
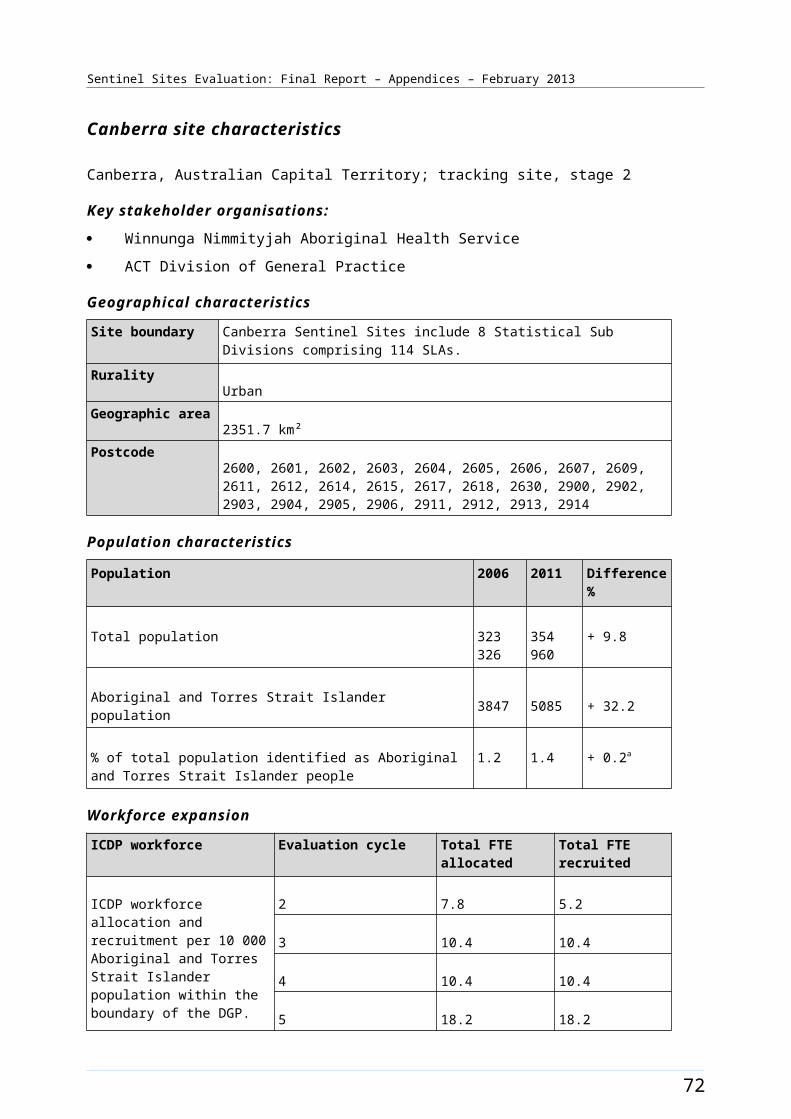
Sentinel Sites Evaluation: Final Report – Appendices – February 2013
Figure B20: ICDP funded health promotion positions, projects and events, Darwin (March 2009 - August 2012)
80
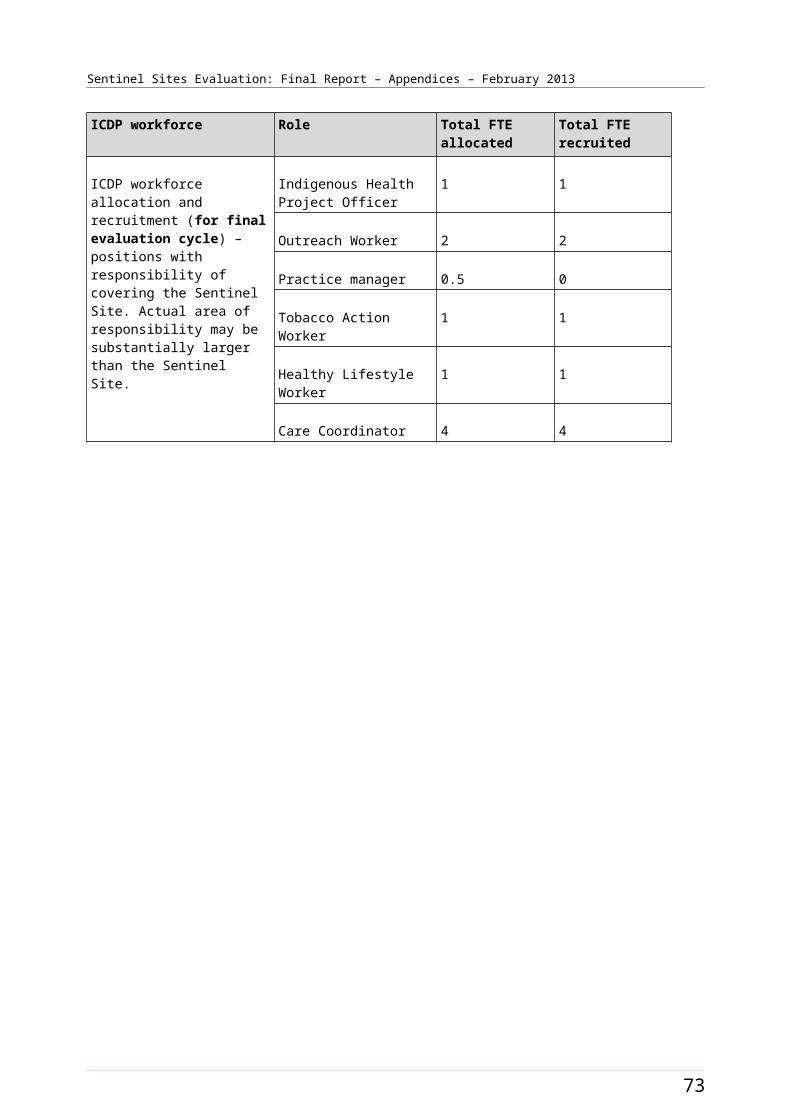
Sentinel Sites Evaluation: Final Report – Appendices – February 2013
Figure B21: ICDP funded positions and service developments (March 2010 - August 2012) and trends in administrative data, Darwin (March 2009 - May 2012)
Note: Please refer to the explanatory text when reviewing this figure. In particular, note that PBS Co-payment measure data refer to number of people who have had at least one prescription dispensed in each quarter per 100 Aboriginal and Torres Strait Islander people in the site. The PBS Co-payment measure data have been divided by four to facilitate comparison with other data shown in the figure.
81
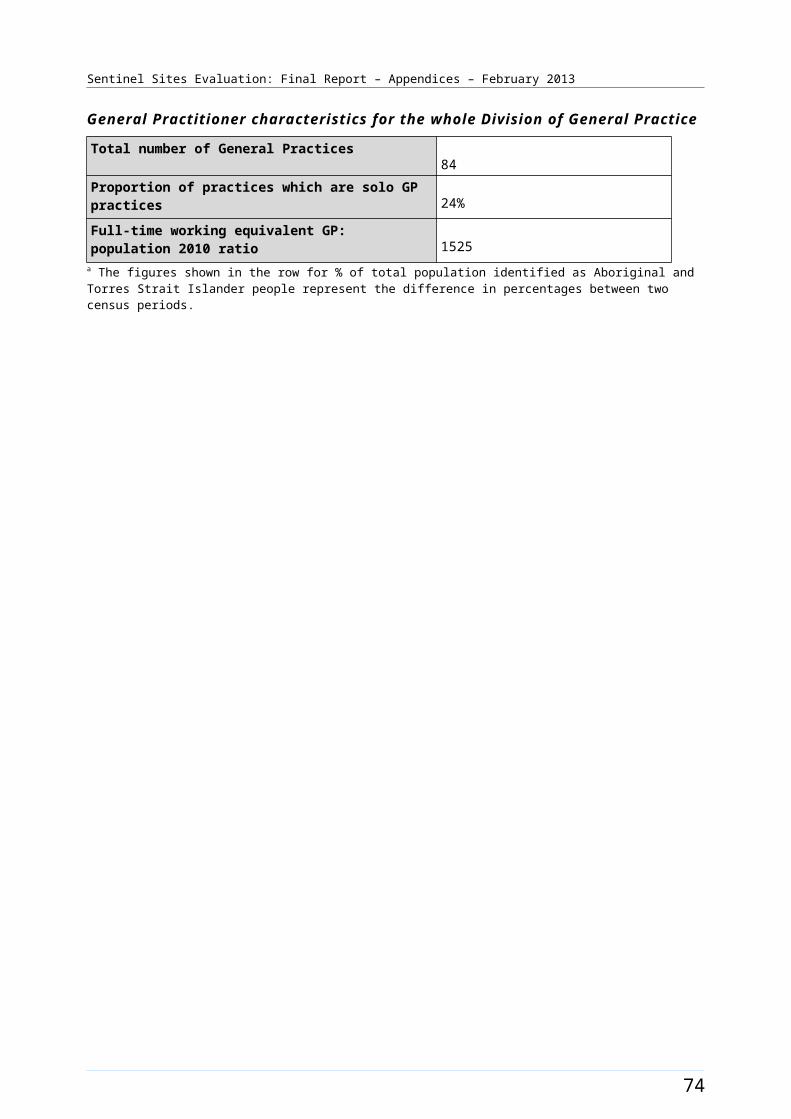
Sentinel Sites Evaluation: Final Report – Appendices – February 2013
Derby [Enhanced tracking site]
The Derby site was within the West Kimberly area of Western Australia and included the town of Derby (Figure B22). At the time of the evaluation, the town had a population of some 4500 people. 39 Derby lies about two hours’ drive to the east of Broome. The site comprised one SLA which covered a large and sparsely populated region extending to the west of King Sound, east to Fitzroy Crossing, north to the coast and south beyond the Great Northern Highway.
The total population of the site was about 6500 in 2006 and increased by about 30% to about 8400 in 2011 (Table B12). Around 61.9% of the total population of the site identified as Aboriginal and Torres Strait Islander people in the 2006 Census (a population of about 4000). The 2011 Census showed a decrease of approximately 13.8% with about 48% identifying in 2011 (a population of about 4100) (Table B12).
Health Service organisations and other key site characteristics and service developments
Both the AHS (Derby Aboriginal Health Service) and the DGP (Boab Health Services, formerly Kimberly Division of General Practice) were key stakeholder organisations. The DGP office was located in Broome, which was outside the site boundary. The area covered by the DGP had a population of over 36 000 people in 2010,40 and extended from Broome to the Northern Territory border. In addition to Broome and Derby the Boab Health Services region included the towns of Kununurra, Halls Creek, Fitzroy Crossing and Wyndham. The ICDP funded positions based at Boab Health Services largely focused on the town of Broome and the Health Service had a limited role in the Derby site. The Derby site now falls within the region of the Kimberley Pilbara Medicare Local, which commenced from 1 July 2012.41 Boab Health Service continues to operate in the area.42
The AHS provided services to all town residents (Aboriginal and non-Aboriginal) and outreach clinics in seven remote communities along the Gibb River Road. The AHS was a member of Kimberley Aboriginal Medical Services Council (KAMSC), which provided some additional support services. There was a regional approach to service planning and delivery, such as specialist outreach. The AHS provided most of the specialist, outpatient and allied health clinics at the Health Service facility and ran a transport service for patients. An online collaborative e-health platform, the Medical Message Exchange (MMEx), was operating to enable communication across AHSs.43
The hospital in Derby operated a clinic that provided services mainly to residents of Derby and surrounding areas. This clinic had been granted a Section 19(2) exemption during 2011/2012 that allowed it to claim Medicare despite being on hospital grounds.
Derby was a base for the Royal Flying Doctor Service (RFDS). The RFDS worked closely with the AHS and hospital. In addition to the hospital in Derby, there was a small public hospital in Fitzroy Crossing (Fitzroy Valley Health Services)44 (inside the site boundary) and a hospital in Broome (outside the site boundary). There were a number of GPs in Fitzroy Crossing who consulted either from the Fitzroy Valley
39 Boab Health [website] (accessed 9 November 2012). 40 PHCRIS [website] - Division and SBO Key Characteristics (accessed 30 October 2012). 41 <Kimberly Pilbara Medicare Local (accessed 23 October 2012).42 SSE [Evaluation site visit] July/August 2012.43 Medical Message Exchange (MMEx) [website] (accessed 20 October 2012).44 Health WA [website] (accessed 5 December 2012.
82
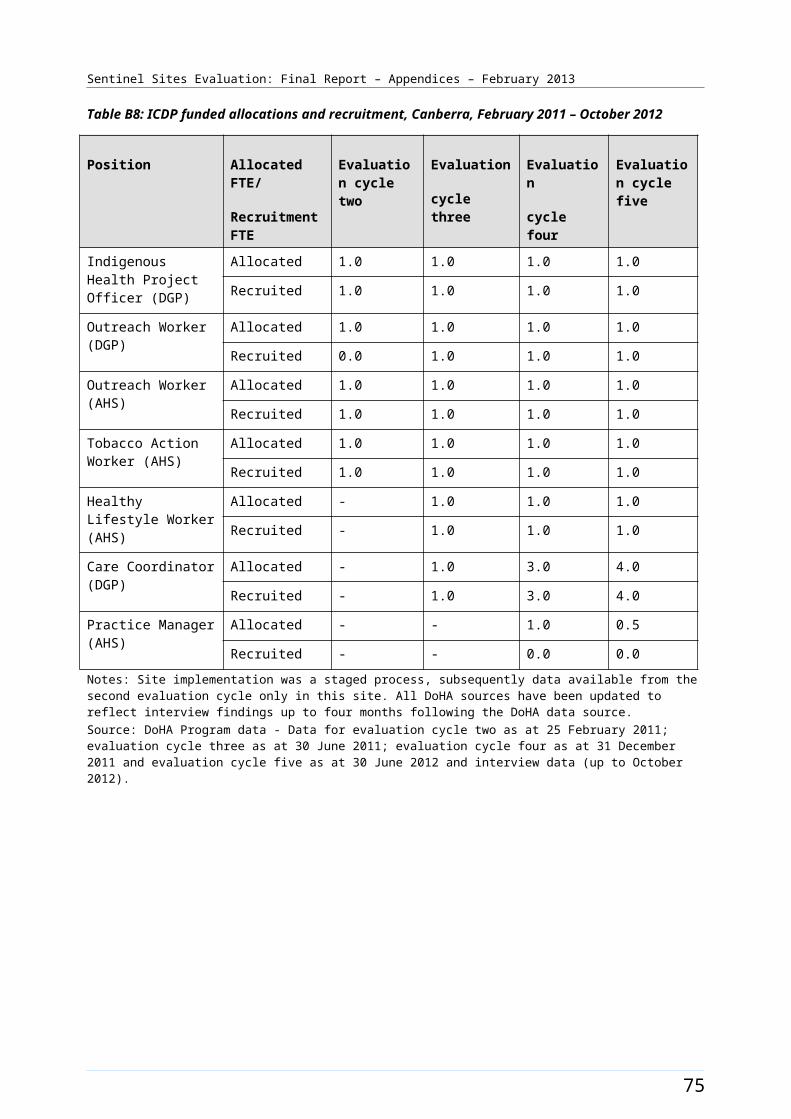
Sentinel Sites Evaluation: Final Report – Appendices – February 2013
Health Services or from the Fitzroy Crossing Health Centre (medical practice)45 which is based at Fitzroy Valley Health Services. There was also a cultural Health Service at Fitzroy Crossing (Nindilingarri Cultural Health Services) that focused on providing health promotion, environmental health and community services.46 Fitzroy Crossing, and surrounding communities, had been chosen as one of 29 priority locations across Australia to participate in implementing reforms envisaged in the Remote Service Delivery National Partnership.47
Derby was classed as a district of workforce shortage for GPs during 2012, based on the information accessed in November 2012.48
Pharmaceuticals were provided under S100 supply arrangements and there was one pharmacy in the town of Derby. There was no private pharmacist in Fitzroy Crossing. The AHS received Healthy for Life funding.49
Local Community Campaign to Promote Better Health activity occurred in the site during the evaluation (Chapter 4, Table 4.1). The EON Thriving Communities program aimed to promote healthy lifestyle choices to reduce chronic disease. The Bran Nue Leg program addressed the issue of limb amputation due to complications from chronic diseases such as diabetes. The Catch and Cook program targeted children and families, and focused on delivering good nutrition through bush tucker and other traditional foods. The project also involved the production and promotion of an educational DVD for broadcast on community networks, the Goolgarri website and YouTube. The Skutta Girls program was an extension of a previous pilot program targeting at-risk young women aged 12-18 years in the Fitzroy Crossing region to provide a safe space where participants could become engaged in fun activities and receive important health education information. The timing of these activities is presented in Figure B23.
Workforce expansion
Some workforce allocations for the Regional Tackling Smoking and Healthy Lifestyle team had been filled during the evaluation. The overall allocations included up to three TAW positions, one RTC and two HLW positions at the AHS. Two allocations had direct responsibility for work within the site, one TAW position and one HLW position; these were filled in the September – November 2010 quarter. The pattern of recruitment to these positions throughout the SSE is depicted in Figure B23.
Workforce allocations for one OW position and an additional health staff position at the AHS were filled during the evaluation. The OW AHS position was filled during the March – May 2011 quarter, and was used to manage the MSOAP-ICD clinic. The additional health staff allocation was used to support a sessional GP, spread between seven outreach clinics on the Gibb River Road. This activity commenced during the March – May 2011 quarter. Allocations were also filled for one OW, one IHPO and a Care Coordinator position at the DGP; however workers did not have direct responsibility within the site as the these positions was focused on Broome (outside the site). The pattern of recruitment to these allocations, where they had direct responsibility for the site, together with trends in the uptake of various measures (as reflected by administrative data) throughout the SSE, is shown in Figure B24.
45 Doctoralia [website] (accessed 5 December 2012). 46 Nindilingarri [website] (accessed 5 December 2012). 47 FAHCSIA [Local Implementation Plan – Fitzroy Crossing] (accessed 5 December 2012). 48 DoHA, Doctor Connect [website], op. cit. 49 DoHA, Healthy for Life [website] (accessed 5 October 2012).
83
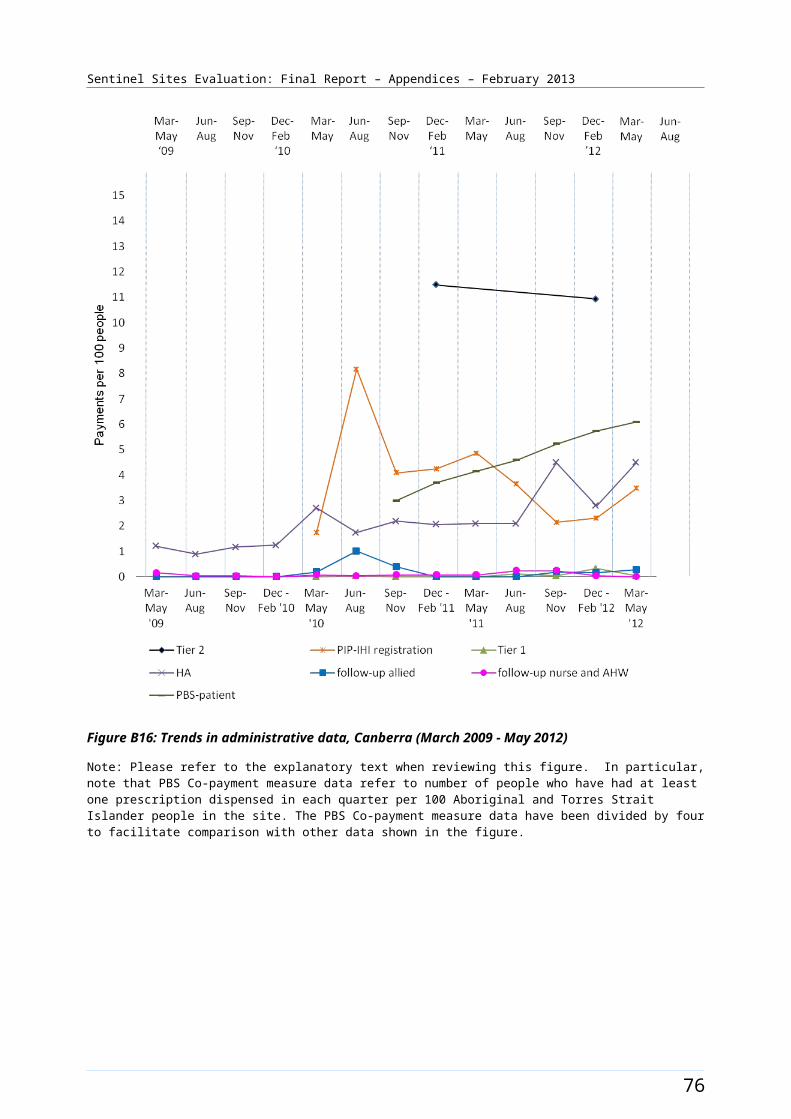
Sentinel Sites Evaluation: Final Report – Appendices – February 2013
Figure B22: Derby site boundary map
84
Sentinel Sites Evaluation: Final Report – Appendices – February 2013
Derby site characteristics
Derby, Western Australia; enhanced tracking site, stage 1
Key stakeholder organisations
Derby Aboriginal Health Service
Boab Health Services (formerly known as Kimberley Division of General Practice)
Geographical characteristics
Site boundary Derby site boundary consists of 1 SLA.
RuralityRemote
Geographic area120 227.2 km²
Postcodes6728, 6731, 6733, 6765
Population characteristics
Population 2006 2011 Difference %
Total population 6507 8435 + 29.6
Aboriginal and Torres Strait Islander population 4031 4055 + 0.6
% of total population identified as Aboriginal and Torres Strait Islander people
61.9 48.1 - 13.8a
Workforce expansion
ICDP workforce Evaluation cycle Total FTE allocated Total FTE recruited
ICDP workforce allocation and recruitment per 10 000 Aboriginal and Torres Strait Islander population within the boundary of the DGP.
2 2.4 2.3
3 2.4 2.3
4 2.8 2.8
5 3.2 2.4
ICDP workforce Role Total FTE allocated Total FTE recruited
ICDP workforce allocation and recruitment (for final evaluation cycle) – positions with responsibility of covering the Sentinel Site. Actual area of responsibility may be
Indigenous Health Project Officer
1 0c
Outreach Worker 2 2c
Regional Tobacco 1 0
85
Sentinel Sites Evaluation: Final Report – Appendices – February 2013
ICDP workforce Role Total FTE allocated Total FTE recruited
substantially larger than the Sentinel Site.b
Coordinator
Tobacco Action Worker 3 1
Healthy Lifestyle Worker 2 1
Care Coordinator 1 1d
Additional Health Staff 1 1
86
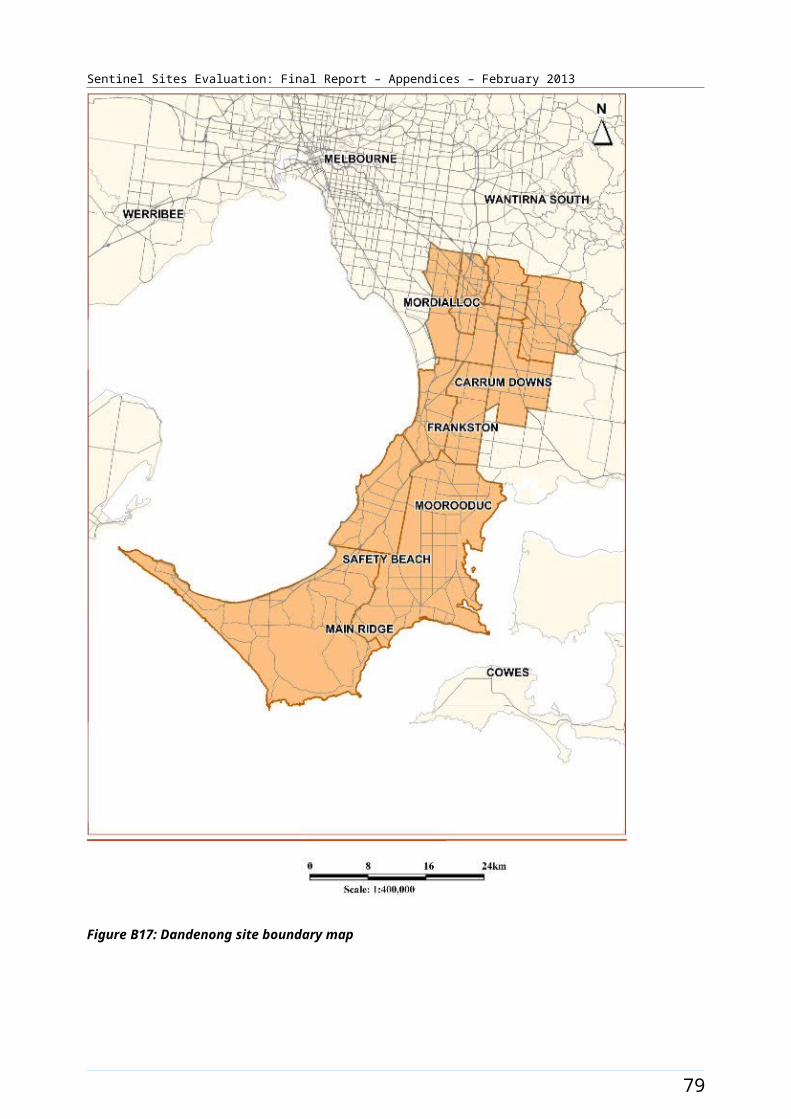
Sentinel Sites Evaluation: Final Report – Appendices – February 2013
General Practitioner characteristics for the whole Division of General Practice
Total number of General Practices8
Proportion of practices which are solo GP practices12.5%
Full-time working equivalent GP: population 2010 ratio1689
a The figures shown in the row for % of total population identified as Aboriginal and Torres Strait Islander people represent the difference in percentages between two census periods.b Kimberley Aboriginal Medical Services Council (KAMSC) is included above (in regards to the Tackling Smoking and Healthy Lifestyle team) but is based outside the site. It has ICDP workers allocated that may have some responsibility to cover Derby site boundaries in the West Kimberley Region.c IHPO & OW at DGP do not work in the Derby site boundary but focus on Broome.d Care Coordinator does not cover Derby site.
87
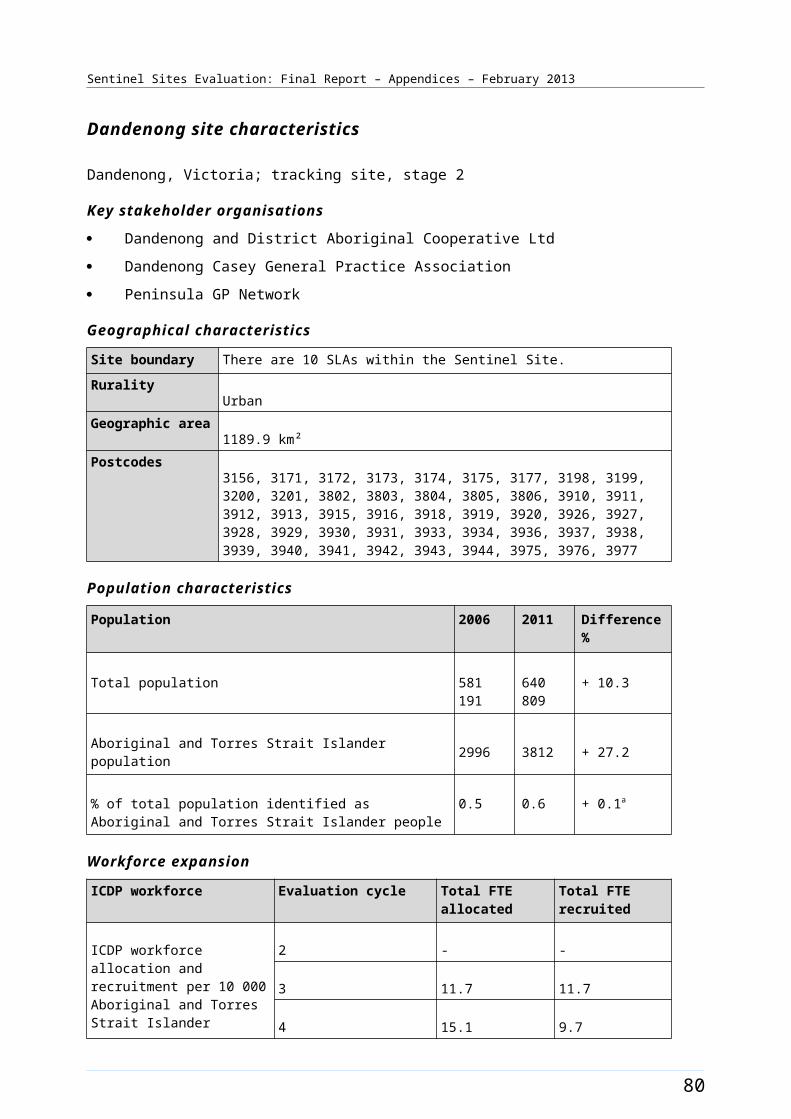
Sentinel Sites Evaluation: Final Report – Appendices – February 2013
Figure B23: ICDP funded health promotion positions, projects and events, Derby (March 2009 - August 2012)
88
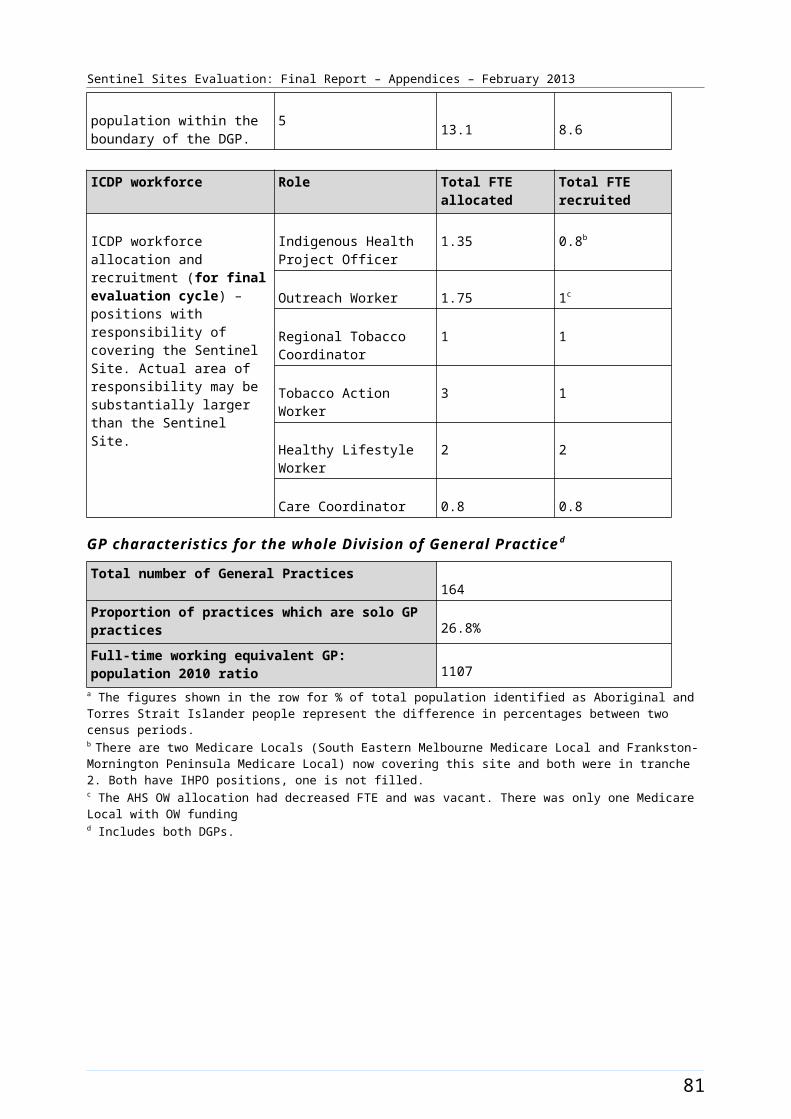
Sentinel Sites Evaluation: Final Report – Appendices – February 2013
Figure B24: ICDP funded positions and service developments (March 2010 - August 2012) and trends in administrative data, Derby (March 2009 - May 2012)
Note: Please refer to the explanatory text when reviewing this figure. In particular, note that PBS Co-payment measure data refer to number of people who have had at least one prescription dispensed in each quarter per 100 Aboriginal and Torres Strait Islander people in the site. The PBS Co-payment measure data have been divided by four to facilitate comparison with other data shown in the figure.
89
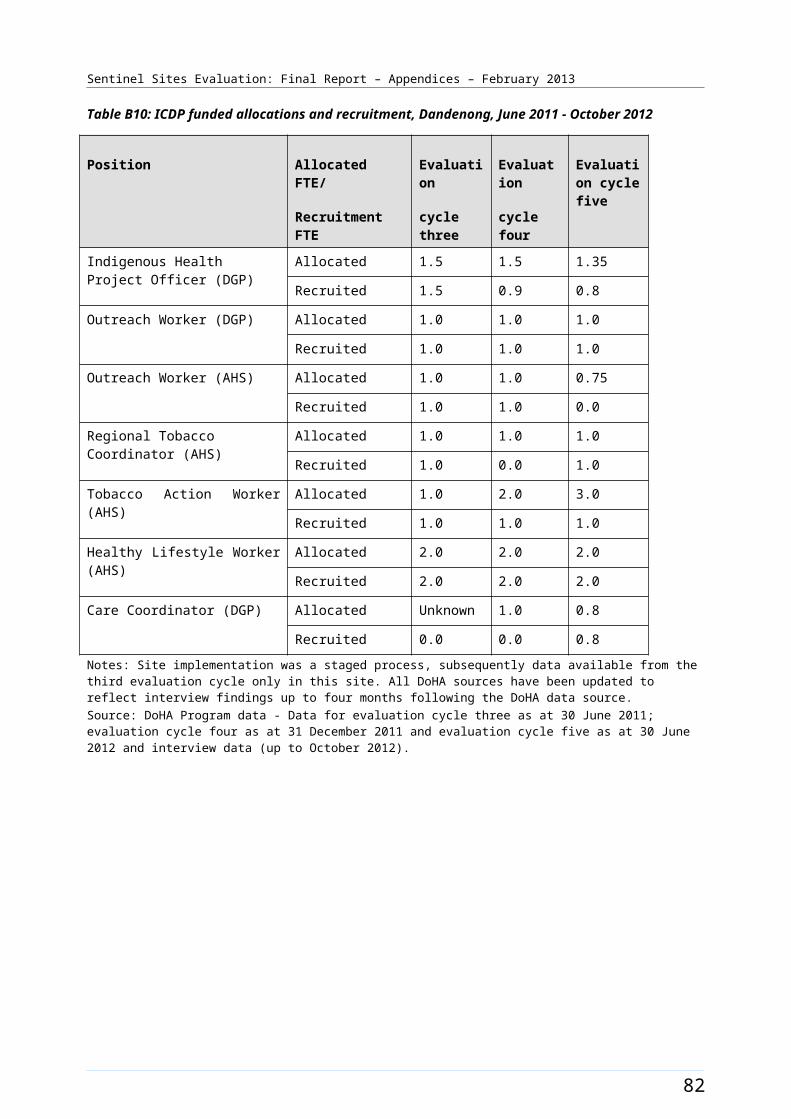
Sentinel Sites Evaluation: Final Report – Appendices – February 2013
Dubbo [Enhanced tracking site]
The Dubbo site included the city of Dubbo, the town of Wellington and the surrounding rural areas (Figure B25). The town of Dubbo lies 400 kms to the north west of Sydney and was a major road and rail freight hub. The city had a population of over 41 000 in 2008,50 and serviced a larger region with a population of about 130 000 in 2008. Wellington (population approximately 5000 in 2006) is about 40 kms to the southeast of Dubbo. The site covered three SLAs. The total population of the site was approximately 46 000 in 2006 and about 47 300 in 2011 (Table B13). About 11% of the total site population identified as Aboriginal and Torres Strait Islander people in the 2006 Census (a population of about 5100). The 2011 Census showed an increase of approximately 2.9% with about 14% identifying in 2011 (a population of about 6700) (Table B13).
Health Service organisations and other key site characteristics and service developments
Two AHSs (Thubbo Aboriginal Medical Co-operative Ltd. and Wellington Aboriginal Corporation Health Service) and the DGP (Dubbo Plains Division of General Practice) were located in the site and were the key stakeholder organisations. The Dubbo site now falls within the region covered by the Western NSW Medicare Local, which commenced from 1 January 2012.51
In addition to the two AHSs, the site included an ‘Indigenous owned not-for-profit community managed organisation’ [a PHC service] which delivered care targeting Aboriginal and Torres Strait Islander patients (opened December 2010),52 and the Western Plains Medical Centre, opened in March 2012.
Dubbo was not classed as a district of workforce shortage for GPs during 2012, based on the information accessed in November 2012. However, part of the site, Wellington, was classed as a district of workforce shortage in this period.53
There were two hospitals within the site. One was the major hospital for the region.
Both AHSs participated in the Healthy for Life Program and QUMAX.
Local Community Campaign to Promote Better Health activity occurred in the site during the evaluation Chapter 4, Table 4.1). The Red Ochre Festival was a healthy community day held on 18 September 2011 offering free adult health assessments (Figure B26). The Arts OutWest Spread the Word program was funded late in the evaluation period (from September 2012). The program aimed to develop a publicity campaign that used various art forms to allow local Aboriginal and Torres Strait Islander people to create localised publicity material aimed at increasing awareness of chronic disease.
50 Dubbo City Council [website] (accessed 30 October 2012).51 DoHA, My Medicare Local [website], op. cit.52 <Bawrunga [website]> (accessed 9 October 2012).53 DoHA, Doctor Connect [website], op. cit.
90
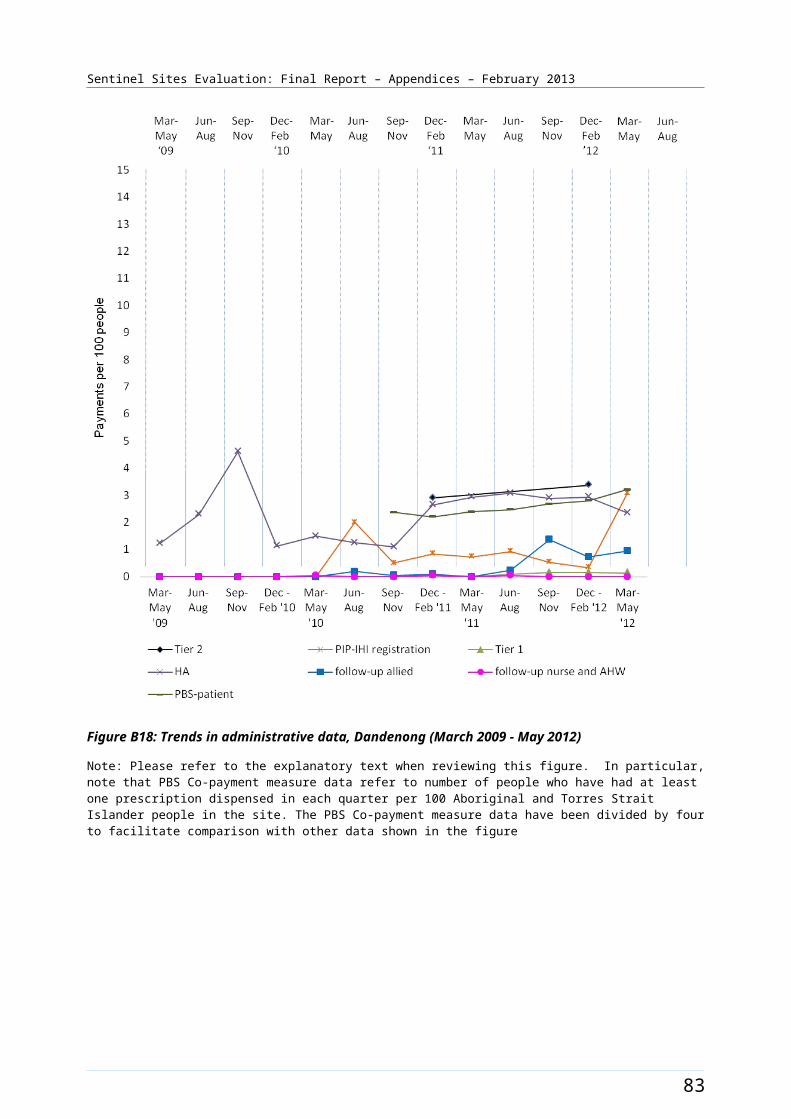
Sentinel Sites Evaluation: Final Report – Appendices – February 2013
Workforce expansion
There was no Regional Tackling Smoking and Healthy Lifestyle team allocation in this site during the evaluation (Table B13).
A new workforce allocation for one OW at the AHS was announced in 2012. It was unclear when this allocation was filled during the evaluation period. Allocations for one OW and one IHPO at the DGP were filled during the evaluation period. These positions were both filled during the March – May 2011 quarter. The IHPO DGP position had two incumbents during the evaluation period. While there were a number of Care Coordinators funded in the region, only one was working directly in the Dubbo site at the time of the evaluation. The pattern of recruitment to these allocations, where they had direct responsibility within the site, together with trends in the uptake of various measures (as reflected by administrative data) throughout the SSE, is shown in Figure B27.
91
Sentinel Sites Evaluation: Final Report – Appendices – February 2013
Figure B25: Dubbo site boundary map
92
Sentinel Sites Evaluation: Final Report – Appendices – February 2013
Dubbo site characteristics
Dubbo, New South Wales; enhanced tracking site, stage 1
Key stakeholder organisations
Thubbo Aboriginal Medical Co-operative
Wellington Aboriginal Corporation Health Service
Dubbo Plains Division of General Practice
Geographical characteristics
Site boundary A total of 3 SLAs cover the sites boundaries of Dubbo.
RuralityRegional
Geographic area7540.9 km²
Postcodes2820, 2830,2866, 2867, 2868
Population characteristics
Population 2006 2011 Difference %
Total population 45 964 47 298 + 2.9
Aboriginal and Torres Strait Islander population 5147 6683 + 29.8
% of total population identified as Aboriginal and Torres Strait Islander people
11.2 14.1 + 2.9a
Workforce expansion
ICDP workforce Evaluation cycle Total FTE allocated Total FTE recruited
ICDP workforce allocation and recruitment per 10 000 Aboriginal and Torres Strait Islander population within the boundary of the DGP.
2 2.0 2.0
3 2.0 2.0
4b 3.9 3.0
5 b 3.9 3.9
ICDP workforce Role Total FTE allocated Total FTE recruited
ICDP workforce allocation and recruitment (for final evaluation cycle) – positions with responsibility of covering the
Indigenous Health Project Officer
1 1
Outreach Worker 2 2
93
Sentinel Sites Evaluation: Final Report – Appendices – February 2013
ICDP workforce Role Total FTE allocated Total FTE recruited
Sentinel Site. Actual area of responsibility may be substantially larger than the Sentinel Site.
Care Coordinator 1 1
94
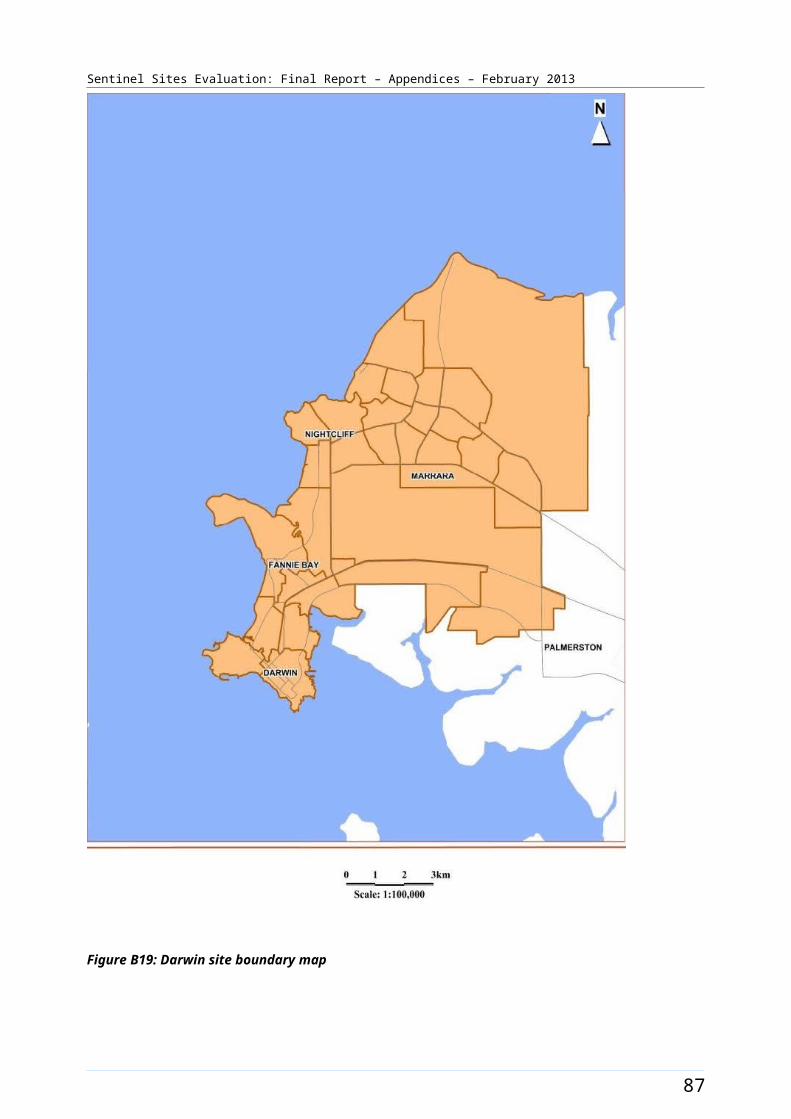
Sentinel Sites Evaluation: Final Report – Appendices – February 2013
General Practitioner characteristics for the whole Division of General Practice
Total number of General Practices36
Proportion of practices which are solo GP practices53%
Full-time working equivalent GP: population 2010 ratio1112
a The figures shown in the row for % of total population identified as Aboriginal and Torres Strait Islander people represent the difference in percentages between two census periods.b Evaluation cycles four and five include 1 FTE Care Coordinator position for this analysis. Prior to this the IHPO and OW positions were the only inclusions..
95
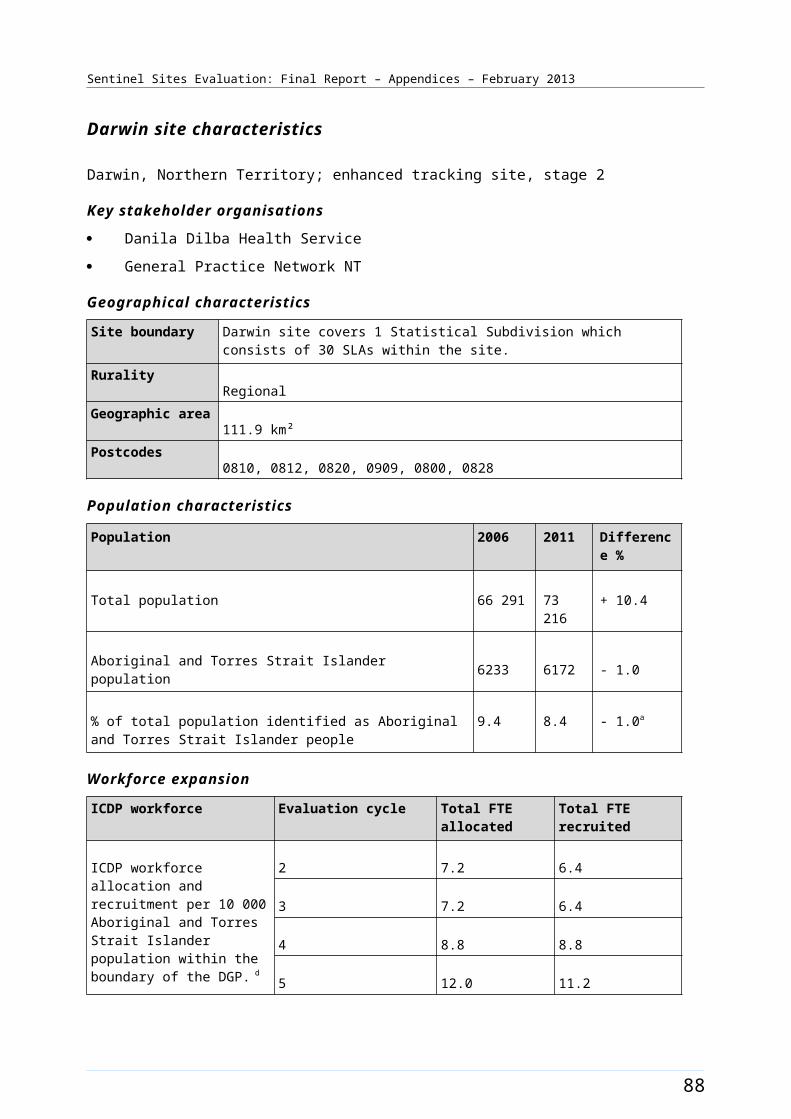
Sentinel Sites Evaluation: Final Report – Appendices – February 2013
Figure B26: ICDP funded health promotion positions, projects and events, Dubbo (March 2009 - August 2012)
96
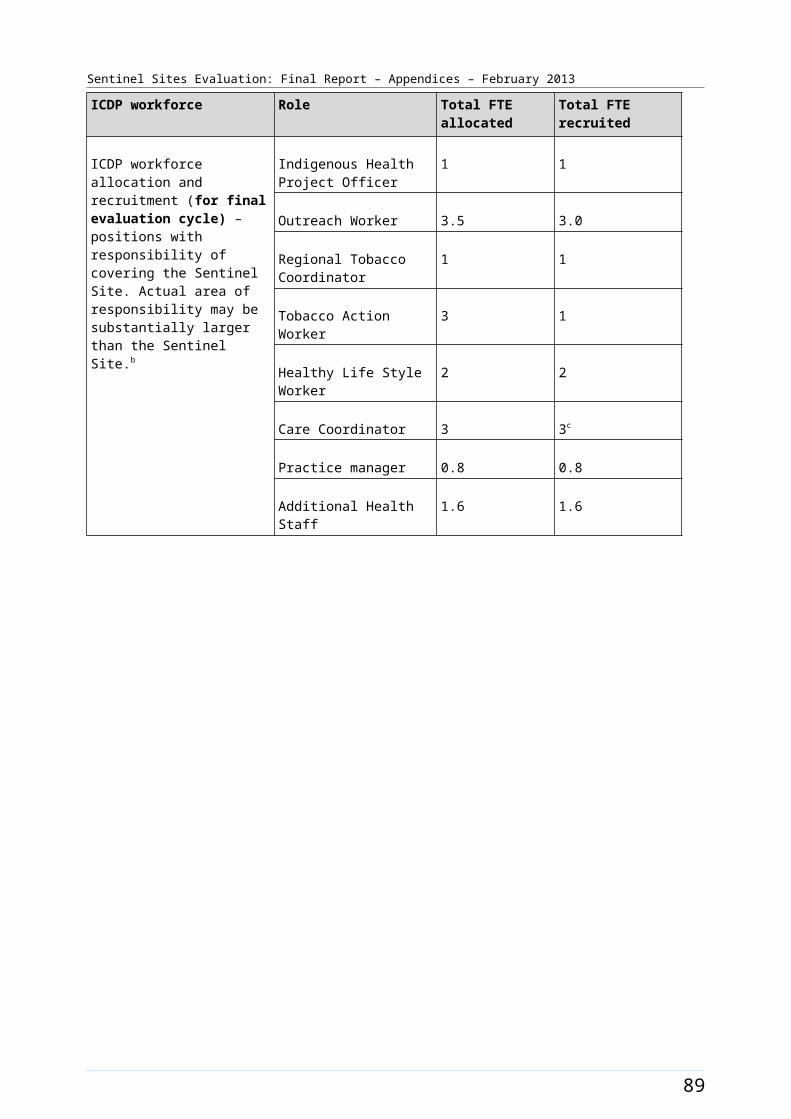
Sentinel Sites Evaluation: Final Report – Appendices – February 2013
Figure B27: ICDP funded positions and service developments (March 2010 - August 2012) and trends in administrative data, Dubbo (March 2009 - May 2012)
Note: Please refer to the explanatory text when reviewing this figure. In particular, note that PBS Co-payment measure data refer to number of people who have had at least one prescription dispensed in each quarter per 100 Aboriginal and Torres Strait Islander people in the site. The PBS Co-payment measure data have been divided by four to facilitate comparison with other data shown in the figure.
97
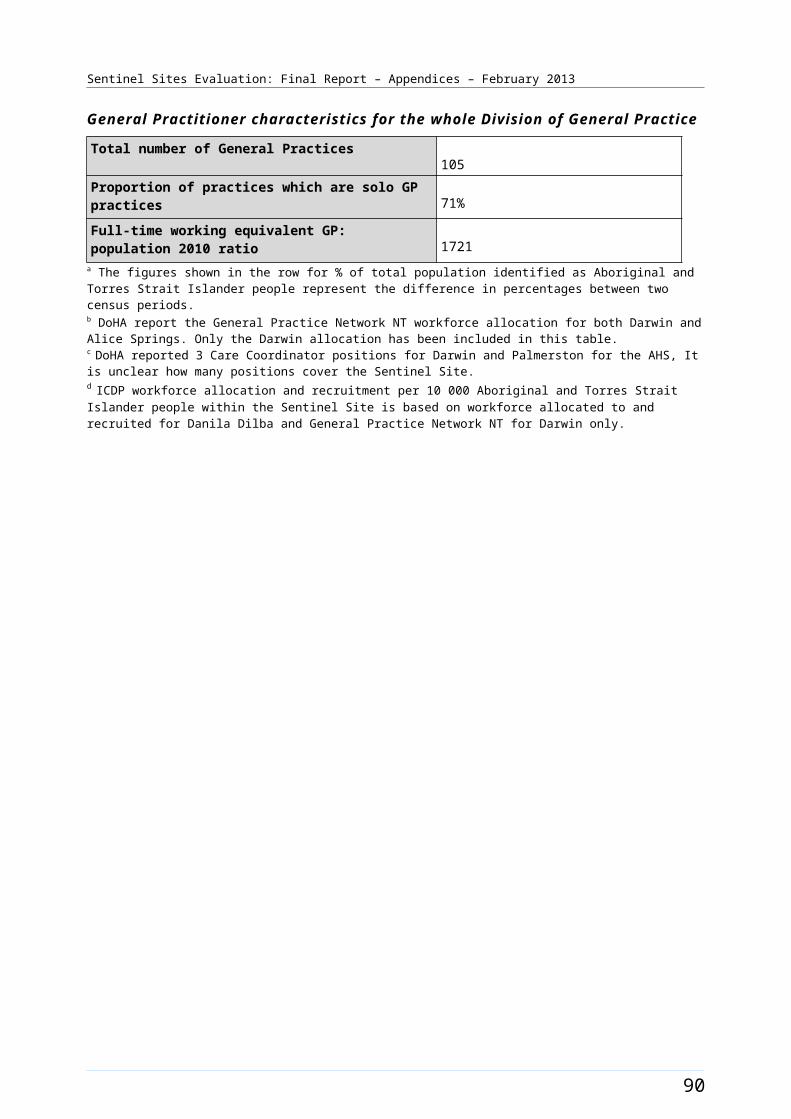
Sentinel Sites Evaluation: Final Report – Appendices – February 2013
East Pilbara [Case study site]
The East Pilbara site was located within the Pilbara region of Western Australia. The site covered the SLA of East Pilbara, which extended north of the town of Newman to the coast and east to the border of the Northern Territory. The site included the town of Newman and several remote Aboriginal communities (Figure B28).
The total population of the site was about 6500 in 2006 and increased by about 83% to about 11 900 in 2011 (Table B14). Around 22% of the total population of the site identified as Aboriginal and Torres Strait Islander people in the 2006 Census (a population of about 1400). The 2011 Census showed a decrease of about 4.8% with about 17% identifying in 2011 (a population of about 2000) (Table B14).
Health Service organisations and other key site characteristics and service developments
Both the AHS (Puntukurnu Aboriginal Medical Service) and the DGP (Pilbara Health Network) were key stakeholder organisations. The administrative office of the AHS was in the town of Newman (within the site). The DGP office was in Karratha (outside the Sentinel Site boundary). The area covered by the Pilbara Health Network was significantly larger than the East Pilbara site and included the towns of Karratha, Roebourne, Dampier, Wickham and Port Hedland; covering a total population of almost 50 000 in 2010.54 The East Pilbara site now falls within the region of the Kimberley Pilbara Medicare Local, which commenced 1 July 2012.55 The Pilbara Health Network continues to operate in the region.56
The township of Newman is almost 1200 kms north of Perth and lies on the Great Northern Highway. The town had a population of about 7000 people in 2009,57 and is a mining service and tourism centre. Karratha is one of the closest major service centres to Newman. It is about seven hours by road from Newman; however lies well outside the site boundary.
The site included a regional hospital and one General Practice in Newman. This practice was part of a network of General Practices, mostly based in mining towns in WA. There were larger hospitals in Karratha and Port Hedland and major referral hospitals in Perth. The Royal Flying Doctor Service provided a visiting GP service to Newman.
The AHS provided services to the community of Jigalong and to three other clinics in the outlying communities of Parnngurr, Punmu and Kunawarritji. Jigalong lies about 165 kms east of Newman. The 2011 Census recorded the population of Jigalong as 427 people, of which 76.1% were Aboriginal. 58 The AHS staff included a full-time GP, who resided in Jigalong and provided a visiting service to the outlying communities across an area of approximately 90 000 square kms. The four AHS clinics accessed the same Communicare server located in Newman,59 which was part of a web-based clinical information system, Medical Messaging Exchange (MMEx) installed in 2011. Until mid 2012 the AHS did not provide clinical services in the town of Newman or nearby Parnpajinya Community. A temporary clinic was established by the AHS at Parnpajinya in August 2012. This clinic would operate at the temporary site until the new AHS building was constructed close to the AHS’ existing administration offices in Newman.60
54 PHCRIS [website], PHCRIS - Key Divisions of General Practice Characteristics 2010 -2011 (accessed 30 October 2012).55 KPML [website], Medicare Local - Kimberly and Pilbara (accessed 23 October 2012).56 SSE evaluation site visit August 2012. 57 Newman (accessed 13 November 2012).58 Australian Bureau Of Statistics, Quick Stats [Website] op. cit. 59 Puntukurnu Aboriginal Medical Service (accessed 24 October 2012).60 SSE evaluation site visit August 2012.
98
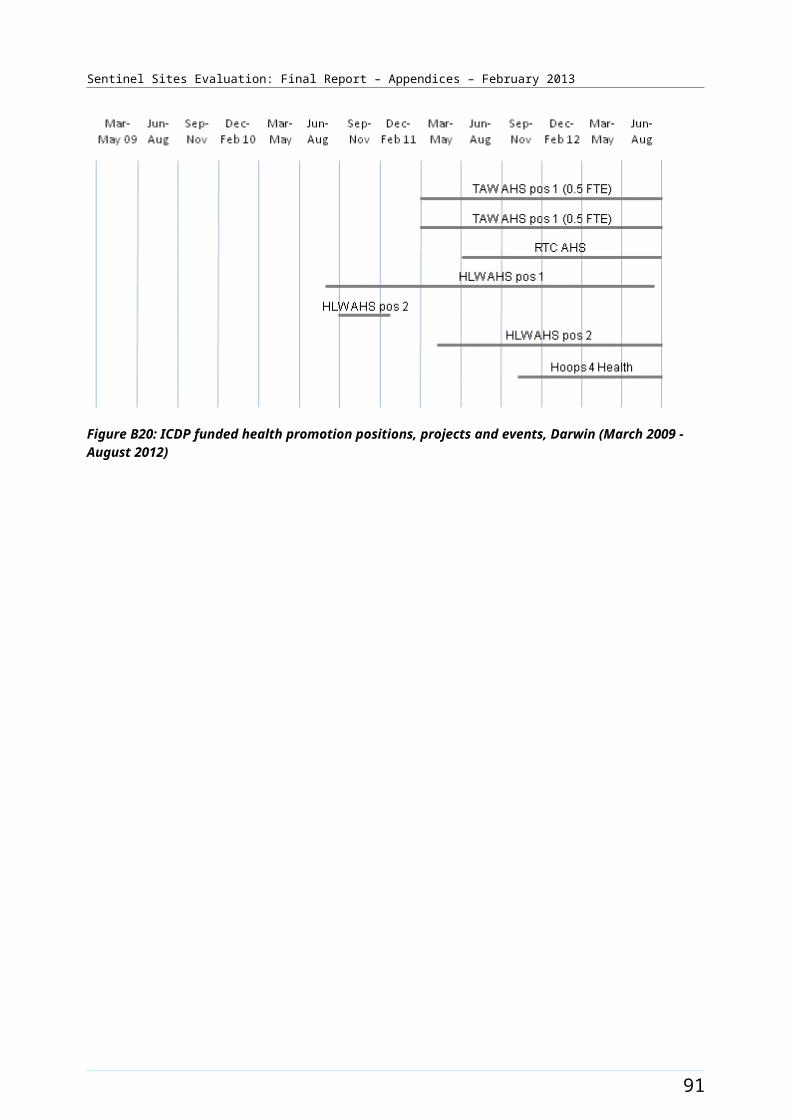
Sentinel Sites Evaluation: Final Report – Appendices – February 2013
East Pilbara was classed as a district of workforce shortage for GPs during 2012, based on the information accessed in April 2012 and October 2012.61
Pharmaceuticals were provided under S100 supply arrangements in East Pilbara. A private pharmacist also serviced the township of Newman.62
Workforce expansion
Workforce allocations for two TAW positions, two HLW and one RTC position at the AHS were filled during the evaluation. The TAW and HLW allocations were used to create combined or generalist health promotion positions. Over the evaluation period, the configuration of these positions appeared to change, based on reviewed service delivery arrangements. In the latter part of the evaluation one TAW/HLW AHS position was located at Newman, one in Jigalong and the third was located at Punmu. A fourth TAW/HLW position was located in Port Hedland (outside the site). The RTC position was located in Newman (inside the site). The pattern of recruitment to these allocations over the SSE is depicted in Figure B29.
A workforce allocation for one OW position at the AHS was filled during the evaluation. This position was filled during the September – November 2010 quarter and remained filled throughout the evaluation period. Workforce allocations for the OW and IHPO positions at the DGP were also filled. The DGP was located in Karratha (outside the site) and these OW and IHPO positions did not have any direct responsibility within the site during the SSE. The Care Coordinator position was also working outside the site. The pattern of recruitment to these allocations, where positions had direct responsibility for the site, together with trends in the uptake of various measures (as reflected by administrative data) throughout the SSE, is depicted in Figure B30.
61 DoHA, Doctor Connect [website], op. cit.62 Directory [website], <True Local - Chemists in Newman WA> (accessed 2 November 2012).
99
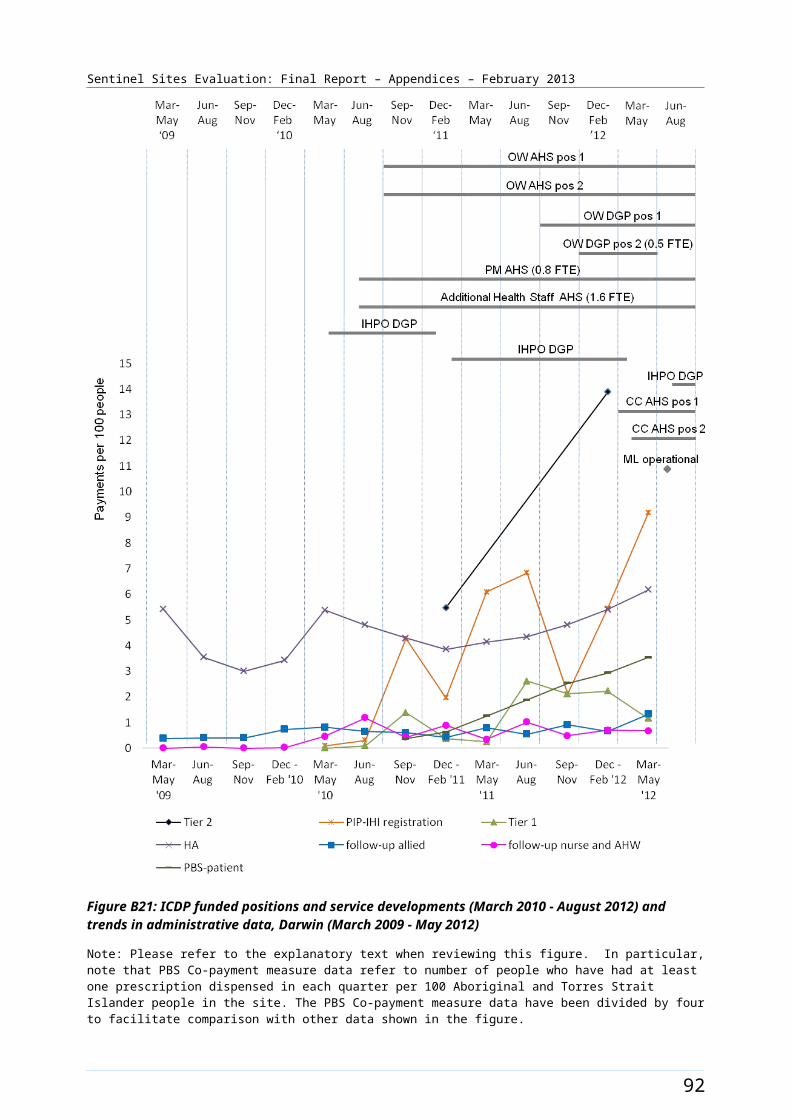
Sentinel Sites Evaluation: Final Report – Appendices – February 2013
Figure B28: East Pilbara site boundary map
100
Sentinel Sites Evaluation: Final Report – Appendices – February 2013
East Pilbara site characteristics
East Pilbara, Western Australia; case study site, stage 2
Key stakeholder organisations
Puntukurnu Aboriginal Medical Service
Pilbara Health Network
Geographical characteristics
Site boundary The East Pilbara site consists of 1 SLA
RuralityRemote
Geographic area371 603.9 km²
Postcodes6753, 6758, 6760, 6762
Population characteristics
Population 2006 2011 Difference %
Total population 6543 11 950 + 82.6
Aboriginal and Torres Strait Islander population 1429 2028 + 41.9
% of total population identified as Aboriginal and Torres Strait Islander people
21.8 17.0 - 4.8a
Workforce expansion
ICDP workforce Evaluation cycle Total FTE allocated Total FTE recruited
ICDP workforce allocation and recruitment per 10 000 Aboriginal and Torres Strait Islander population within the boundary of the DGP.
2 5.3 5.3
3 5.3 5.3
4 7.0 7.0
5 7.0 5.3
ICDP workforce Role Total FTE allocated Total FTE recruited
ICDP workforce allocation and recruitment (for final evaluation cycle) – positions with responsibility of covering the Sentinel Site. Actual area of responsibility may be
Indigenous Health Project Officerb
1 1
Outreach Workerb, 2 2
Regional Tobacco 1 1
101
Sentinel Sites Evaluation: Final Report – Appendices – February 2013
ICDP workforce Role Total FTE allocated Total FTE recruited
substantially larger than the Sentinel Site.
Coordinator
Tobacco Action Worker 2 1.5
Healthy Lifestyle Worker 2 0.5
Care Coordinatorc 1 0
102
Sentinel Sites Evaluation: Final Report – Appendices – February 2013
General Practitioner characteristics for the whole Division of General Practice
Total number of General Practices13
Proportion of practices which are solo GP practices39%
Full-time working equivalent GP: population 2010 ratio1946
a The figures shown in the row for % of total population identified as Aboriginal and Torres Strait Islander people represent the difference in percentages between two census periods.b IHPO and one OW positions funded are based in Karratha and do not cover the site.c The Care Coordinator was based in Karratha outside the site. Position was under consideration to be moved to an area of higher need within the Medicare Local.
103
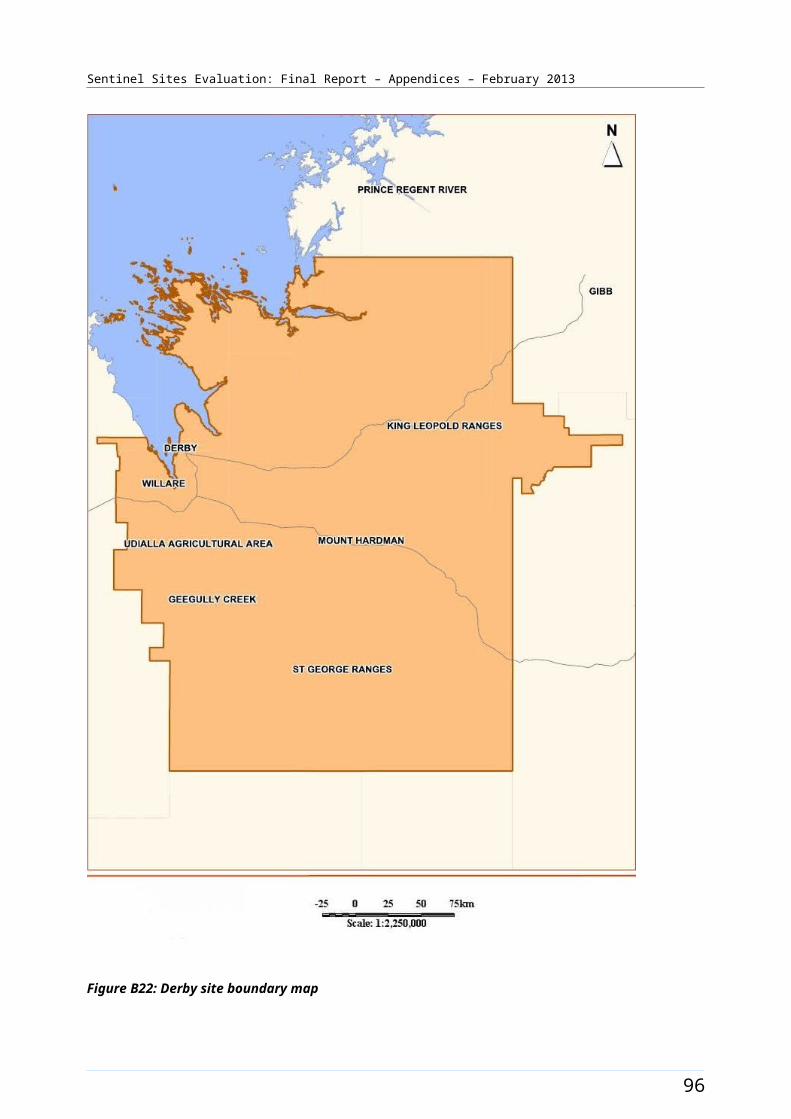
Sentinel Sites Evaluation: Final Report – Appendices – February 2013
Figure B29: ICDP funded health promotion positions, projects and events, East Pilbara (March 2009 - August 2012)
104
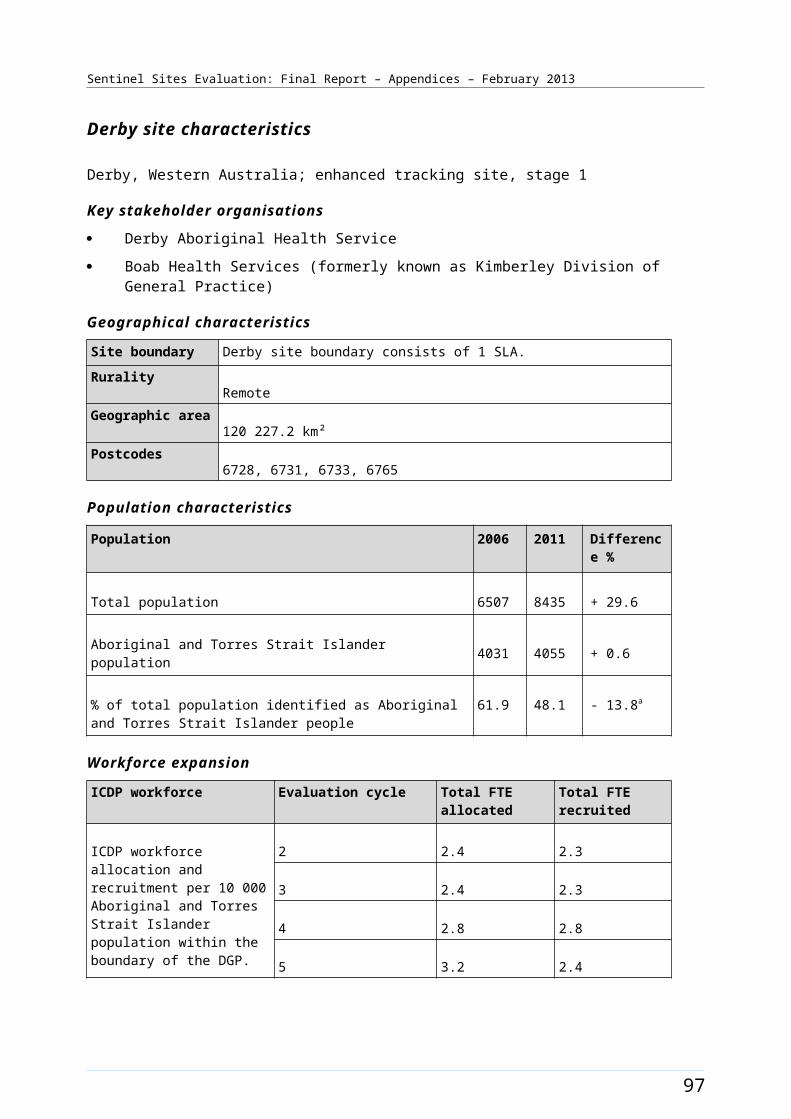
Sentinel Sites Evaluation: Final Report – Appendices – February 2013
Figure B30: ICDP funded positions and service developments (March 2010 - August 2012) and trends in administrative data, East Pilbara (March 2009 - May 2012)
Note: Please refer to the explanatory text when reviewing this figure. In particular, note that PBS Co-payment measure data refer to number of people who have had at least one prescription dispensed in each quarter per 100 Aboriginal and Torres Strait Islander people in the site. The PBS Co-payment measure data have been divided by four to facilitate comparison with other data shown in the figure.
105

Sentinel Sites Evaluation: Final Report – Appendices – February 2013
Elizabeth [Enhanced tracking site]
The Elizabeth site comprised a suburb of northern Adelaide of the same name. Adelaide is a city of 1.2 million people, with about 1.2% being Aboriginal and Torres Strait Islander people.63 The site covered eight SLAs (Figure B31) with a total population of about 126 700 in 2006, which increased to about 144 100 in 2011 (Table B15).
Between 2006 and 2011 the Aboriginal and Torres Strait Islander population increased by about 27% (a population of about 2800 increasing to 3500 respectively). Approximately 2.2% of the total site population identified as Aboriginal and Torres Strait Islander people in the 2006 Census. The 2011 Census showed an increase of about 0.2% to 2.4% identifying in 2011 (Table B15).
Health Service organisations and other key site characteristics and service developments
Both the DGP (Adelaide Northern Division of General Practice) and the AHS (Nunkuwarrin Yunti of South Australia Inc.) were key stakeholder organisations. The site now falls within the region covered by the Northern Adelaide Medicare Local, which commenced 1 January 2012.64
The AHS in the Elizabeth site was a branch clinic of Nunkuwarrin Yunti, which is located in Adelaide CBD. There were also numerous General Practices, a GP super clinic (established in July 2011) and two hospitals within the site. A government run Health Service for Aboriginal people, Muna Paiendi Primary Health Care Service, which was established prior to 2010, also operated in the site. Muna Paiendi provided a range of services including clinical services.65 In close proximity, but outside the site boundary, was a government hospital based Health Service that offered a range of clinical, allied, specialist and community services that were used by many site residents. This hospital-based Health Service was located in Gawler. A partnership agreement with the DGP, AHS and other local service providers had been established to support provision of traditional healing services at this service.
Elizabeth site was not classed as a district of workforce shortage for GPs during 2012, based on the information accessed in November 2012.66
The AHS participated in both the Healthy for Life and QUMAX programs.
Local Community Campaign to Promote Better Health activity occurred in the site during the evaluation (Chapter 4, Table 4.1). A Healthy Community day, the Aboriginal Golf Championship, was held on 29 April 2011. A further event, the Live Longer Tee Off was held in 24 June 2011. The Live Longer! Mobile Training Van project was launched late in the evaluation period (September 2012). The project aimed to deliver reputable and free healthy eating, nutrition, hospitality, fitness and horticultural training in a culturally appropriate, flexible manner to communities across SA including northern Adelaide. The timing of events and activity is depicted in Figure B32.
63 Australian Bureau Of Statistics, Quick Stats, [Website], op. cit. 64 DoHA, My Medicare Local [website], op. cit. 65 SA Community [website] (accessed 24 October 2012).66 DoHA, Doctor Connect,[website], op. cit.
106
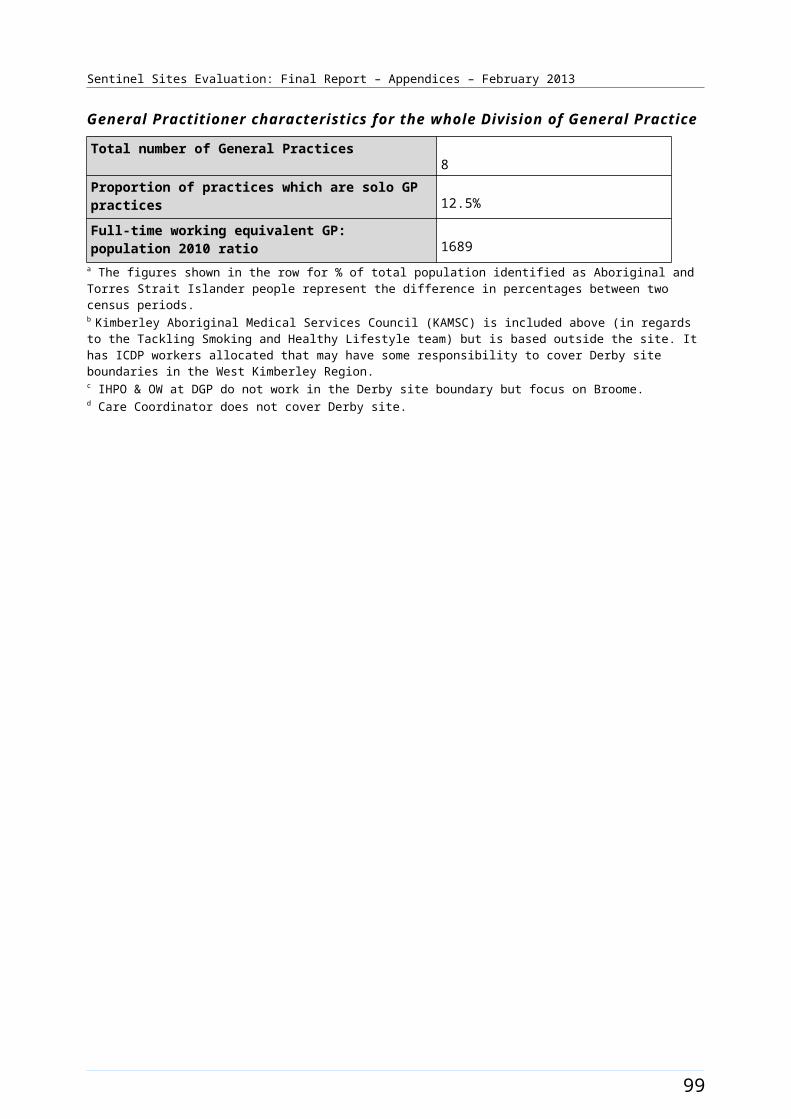
Sentinel Sites Evaluation: Final Report – Appendices – February 2013
Workforce expansion
There was no Regional Tackling Smoking and Healthy Lifestyle team within the site during the evaluation period (Table B15).
107
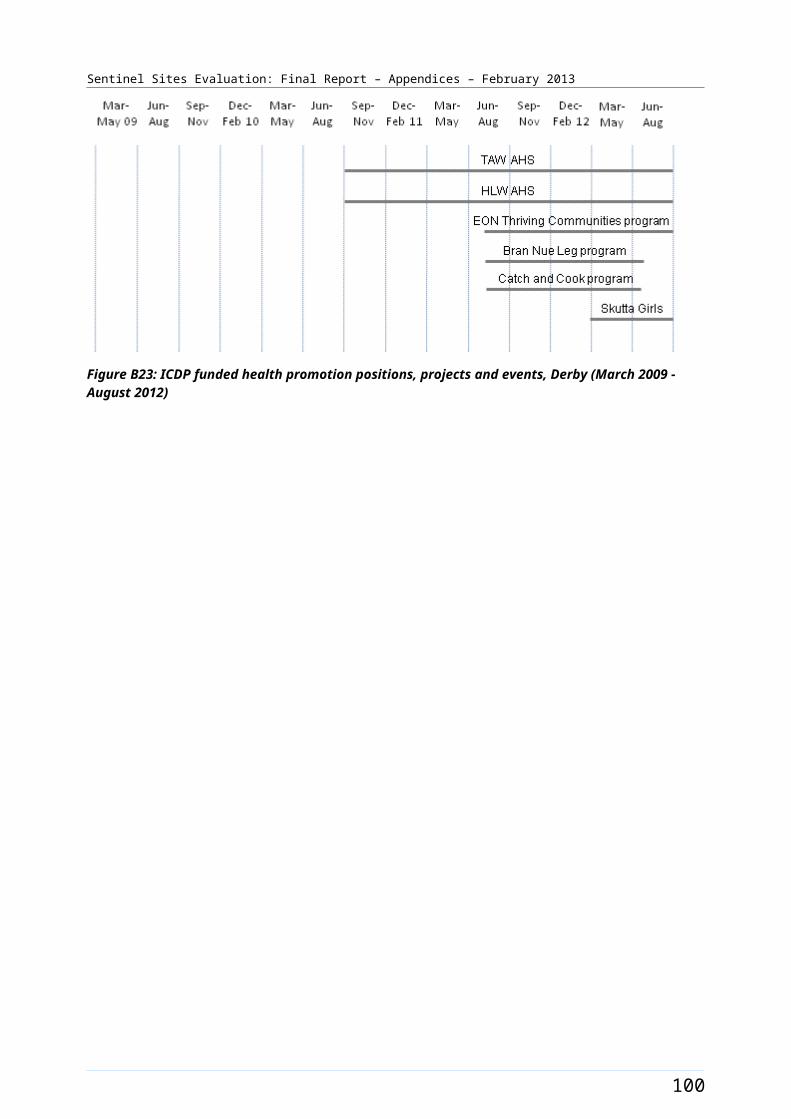
Sentinel Sites Evaluation: Final Report – Appendices – February 2013
A workforce allocation for one OW position at the AHS was filled during the evaluation. This position was filled during the June – August 2010 quarter. Workforce allocations for one OW and one IHPO position at the DGP were also filled. The OW DGP position was filled during the June – August 2010 quarter. This position had two incumbents during the evaluation period. A second OW position operated at the DGP but this was not ICDP funded. The IHPO DGP position was filled during the June – August 2011 quarter. The Care Coordinator allocation (0.6 FTE) was filled in the later stage of the evaluation (during the June – August 2012 quarter). The pattern of recruitment to these allocations, where they had direct responsibility for the site, together with trends in the uptake of various measures
108
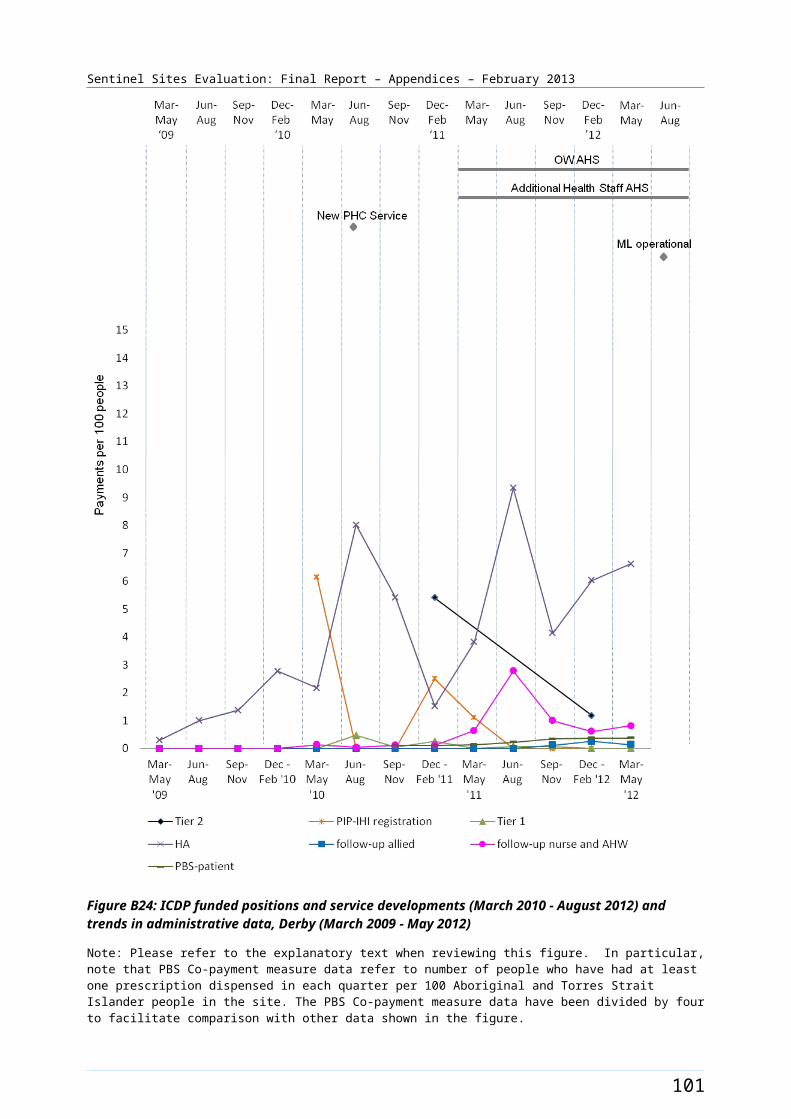
Sentinel Sites Evaluation: Final Report – Appendices – February 2013
(as reflected by administrative data) throughout the SSE, is shown in Figure B33.
Figure B31: Elizabeth site boundary map
109
Sentinel Sites Evaluation: Final Report – Appendices – February 2013
Elizabeth site characteristics
Elizabeth, South Australia; enhanced tracking site, stage 2
Key stakeholder organisations
Nunkuwarrin Yunti of South Australia Inc
Adelaide Northern Division of General Practice
Geographical characteristics
Site boundary There are 8 SLAs within the site.
RuralityUrban
Geographic area461.3 km²
Postcodes5094, 5095, 5096, 5107, 5108, 5109, 5110, 5111, 5112, 5113, 5114, 5115, 5117, 5118, 5120, 5121
Population characteristics
Population 2006 2011 Difference %
Total population 126 717 144 077 + 13.7
Aboriginal and Torres Strait Islander population 2777 3527 + 27.0
% of total population identified as Aboriginal and Torres Strait Islander people
2.2 2.4 + 0.2a
Workforce expansion
ICDP workforce Evaluation cycle Total FTE allocated Total FTE recruited
ICDP workforce allocation and recruitment per 10 000 Aboriginal and Torres Strait Islander population within the boundary of the DGP.
2 7.7 7.7
3 7.7 7.7
4 10.3 10.3
5 9.3 9.3
ICDP workforce Role Total FTE allocated Total FTE recruited
ICDP workforce allocation and recruitment (for final evaluation cycle) – positions with responsibility of covering the
Indigenous Health Project Officer
1 1
Outreach Worker 2 2b
110
Sentinel Sites Evaluation: Final Report – Appendices – February 2013
ICDP workforce Role Total FTE allocated Total FTE recruited
Sentinel Site. Actual area of responsibility may be substantially larger than the Sentinel Site.
Care Coordinator 0.6 0.6
111
Sentinel Sites Evaluation: Final Report – Appendices – February 2013
General Practitioner characteristics for the whole Division of General Practice
Total number of General Practices67
Proportion of practices which are solo GP practices33%
Full-time working equivalent GP: population 2010 ratio994
a The figures shown in the row for % of total population identified as Aboriginal and Torres Strait Islander people represent the difference in percentages between two census periods.b There are two OWs at the Medicare Local for this site –only one is ICDP funded.
112
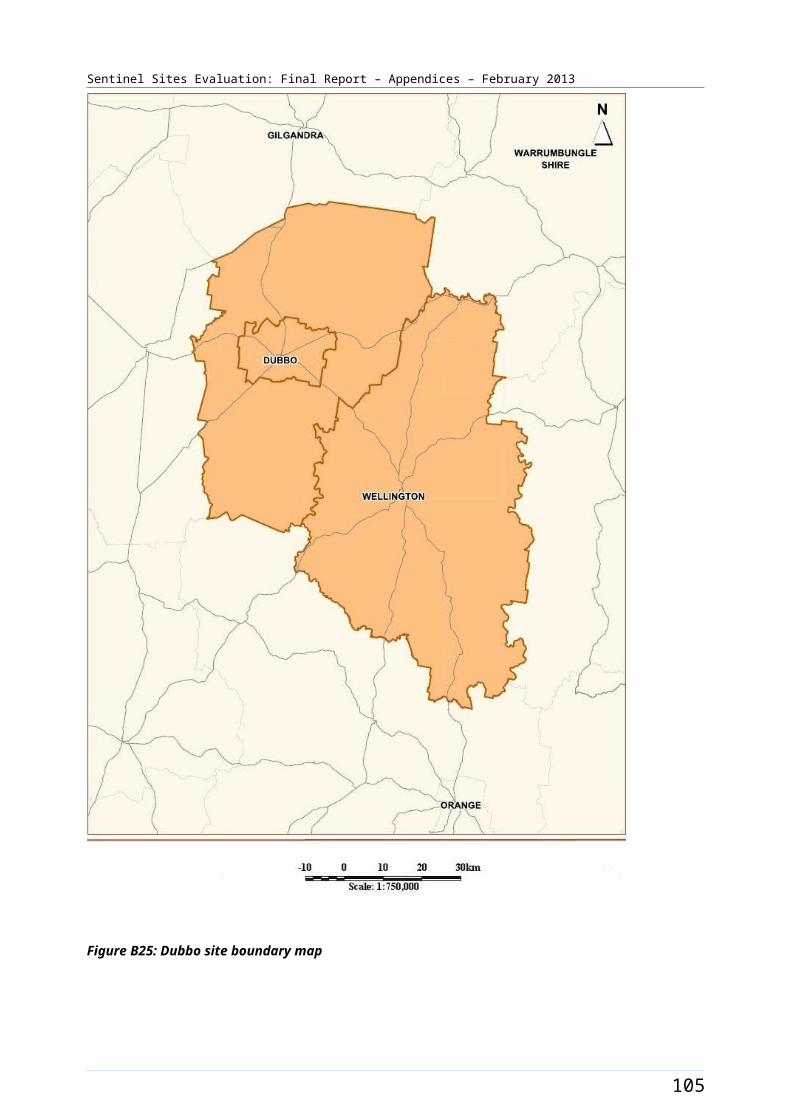
Sentinel Sites Evaluation: Final Report – Appendices – February 2013
Figure B32: ICDP funded health promotion positions, projects and events, Elizabeth (March 2009 - August 2012)
113

Sentinel Sites Evaluation: Final Report – Appendices – February 2013
Figure B33: ICDP funded positions and service developments (March 2009 - August 2012), and trends in administrative data, Elizabeth (March 2009 - May 2012)
Note: Please refer to the explanatory text when reviewing this figure. In particular, note that PBS Co-payment measure data refer to number of people who have had at least one prescription dispensed in each quarter per 100 Aboriginal and Torres Strait Islander people in the site. The PBS Co-payment measure data have been divided by four to facilitate comparison with other data shown in the figure. The PIP Indigenous Health Incentive data for this site does not included AHS data.
114

Sentinel Sites Evaluation: Final Report – Appendices – February 2013
Geraldton [Tracking site]
The Geraldton site included the city of Geraldton and covered one SLA (Figure B34). Geraldton is located about 420 kms north of Perth in the Mid-West region of Western Australia. The city was an important centre for mining, fishing, agriculture and tourism. The City of Greater Geraldton was formed during the evaluation, in July 2011, through an amalgamation of the City of Geraldton-Greenough and Shire of Mullewa.67 The estimated population of the city was 40 000 in 2011.
The population of the Geraldton SLA was about 18 900 in 2006 and 19 100 in 2011 (Table B16). About 9.7% of the total population of the site identified as Aboriginal and Torres Strait Islander people in the 2006 Census. The 2011 Census showed an increase of approximately 1.7% with about 11.4% identifying in 2011 (a population of about 1800 and 2200 respectively) (Table B16).
Health Service organisations and other key site characteristics and service developments
The AHS (Geraldton Regional Aboriginal Medical Service) and the DGP (Midwest General Practice Network) were key stakeholder organisations and both were located in the city of Geraldton. The AHS provided outreach services to the remote areas of Meekatharra and Mt Magnet. The Geraldton site now falls within the region covered by the Goldfields Midwest Medicare Local.68 This Medicare Local covers a vast area of WA, extending from the west coast to the NT and South Australian borders north to the Pilbara and south to the south coast of WA, but excludes the southwest corner of WA (including the major population centres of Perth and cities to the south of Perth).
Also based within the site were a Community Health Service69 and a number of General Practices; including a large PHC Practice that provided after hours care. There were two hospitals within the site, one with a visiting specialist centre.
Geraldton was not classed as a district of workforce shortage for GPs during 2012, based on the information accessed in November 2012.70
The AHS participated in both the Healthy for Life program and QUMAX.
Local Community Campaign to Promote Better Health activity occurred in the site during the evaluation (Chapter 4, Table 4.1). The Geraldton Regional Aboriginal Medical Service (GRAMS) hosted a child health day, Yamatji Kids are Healthy Kids, (6 May 2011). The event focused on children aged from birth to five years and offered a free health check and healthy lunch to participants. The GRAMS also hosted a Men’s Healthy Community Day, Yamatji Men, Healthy Men (12 August 2011) with the aim of supporting and encouraging local Yamatji men to come in for a health check. The Goldfields Midwest Medicare Locals implemented the ‘Reach for your goals’ Hip Hop Youth Anti Smoking Program late in the evaluation period. This aimed to continue the development and promotion of an existing anti-smoking DVD. Activity under the program included airing the DVD at local schools and on TV stations.
67 City of Greater Geraldton Shire [website] (accessed 6 November 2012).68 Ibid.69 Health Directory Service [website] (accessed 24 October 2012). 70 DoHA, Doctor Connect, [website], op. cit.
115
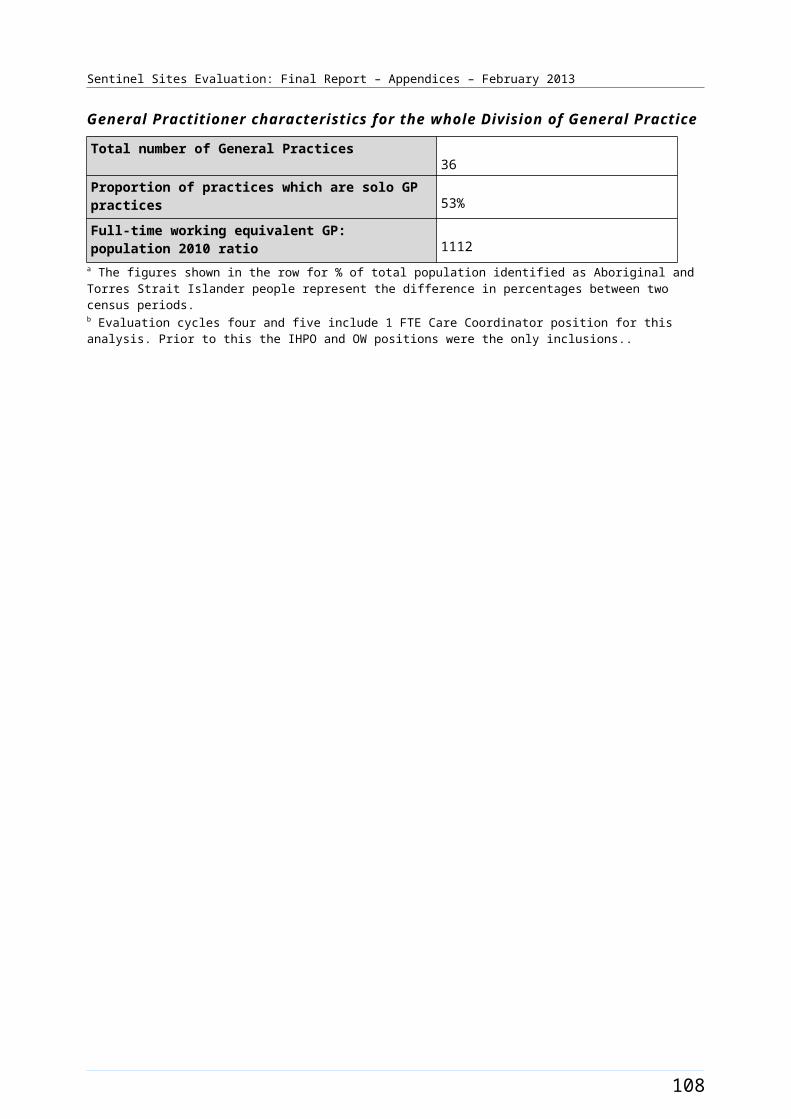
Sentinel Sites Evaluation: Final Report – Appendices – February 2013
Workforce expansion
The allocations for Regional Tackling Smoking and Healthy Lifestyle team positions did not occur till the latter part of the evaluation (the fifth evaluation cycle). The allocations included two TAW positions, two HLW positions and one RTC position at the AHS. Some allocations within the site were filled during the evaluation period. This included the RTC position. The pattern of allocations and recruitment for this team is presented in Table B17.
A workforce allocation for one OW position at the AHS was filled during the evaluation. Workforce allocations for one OW and one IHPO position at the DGP were also filled. These positions were all filled during the second evaluation cycle. Allocations for Care Coordinator position at the DGP commenced midway through the evaluation (third evaluation cycle); increasing from 0.8 FTE to 1.8 FTE by the end of the evaluation period. This allocation was filled 0.8 FTE from the third evaluation cycle. The pattern of recruitment to these allocations throughout the SSE is presented in Table B17.
The trends in administrative data for Geraldton are displayed in Figure B35.
116
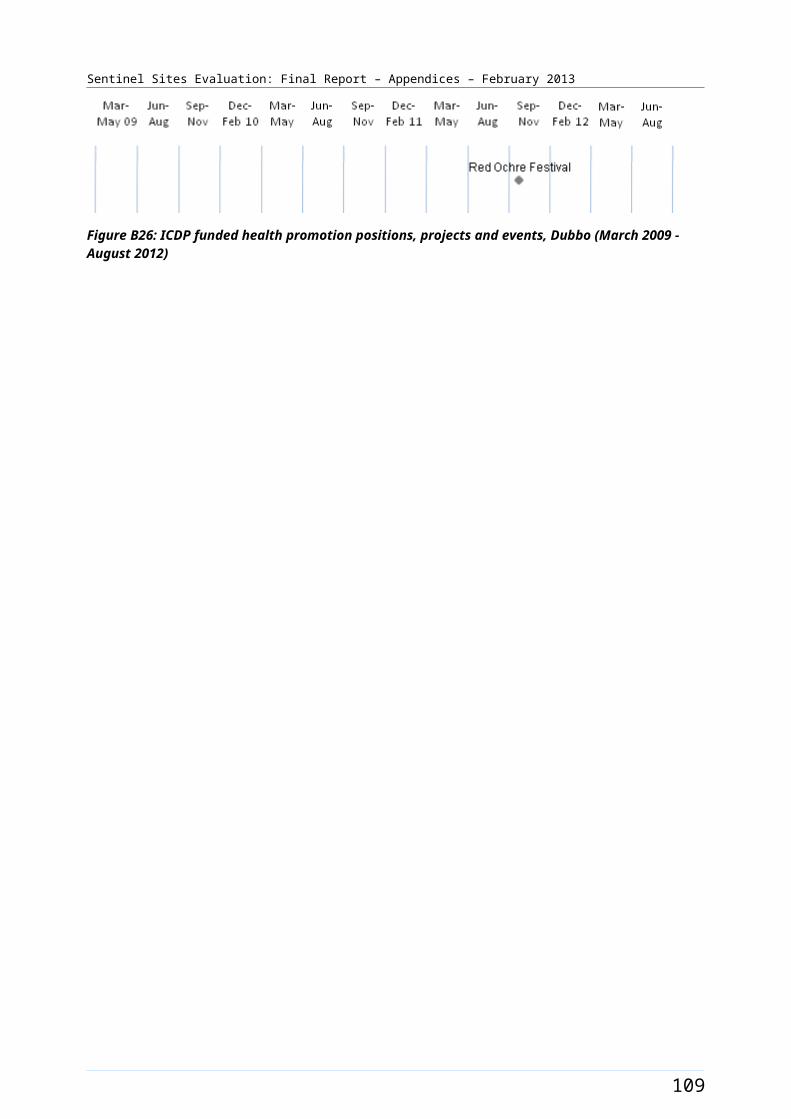
Sentinel Sites Evaluation: Final Report – Appendices – February 2013
Figure B34: Geraldton site boundary map
117
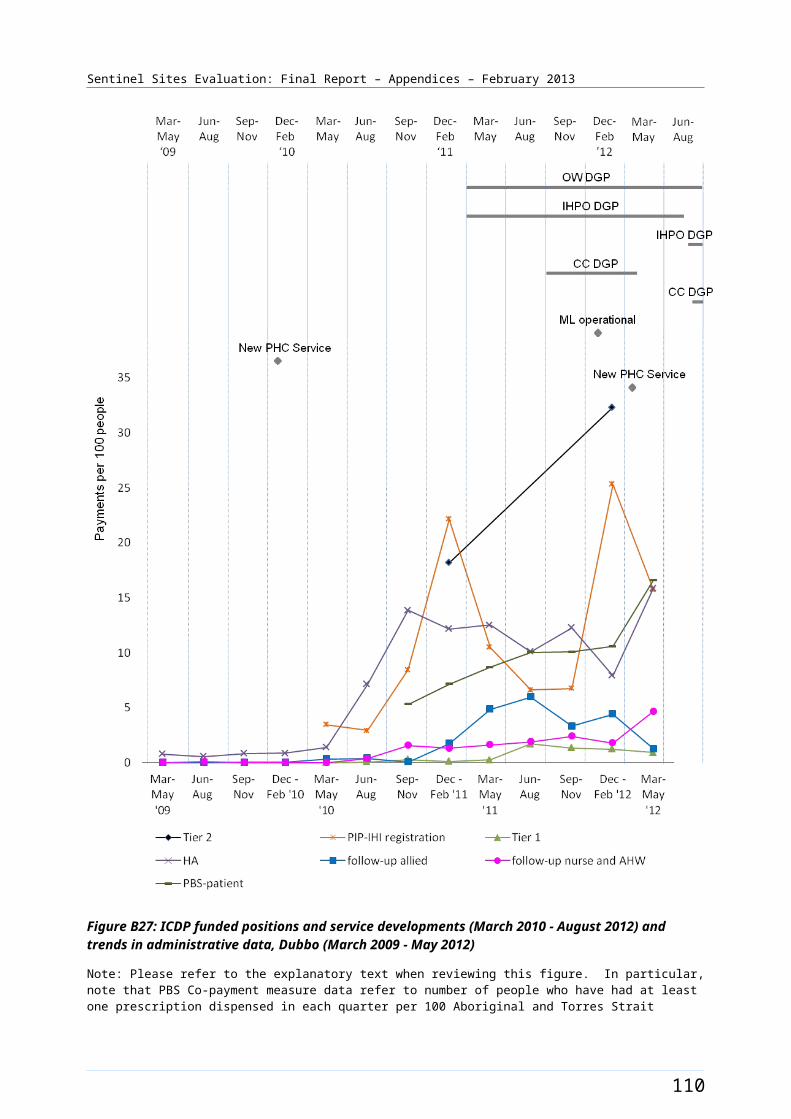
Sentinel Sites Evaluation: Final Report – Appendices – February 2013
Geraldton site characteristics
Geraldton, Western Australia; tracking site, stage 2
Key stakeholder organisations
Geraldton Regional Aboriginal Medical Service
Mid West General Practice Network
Geographical characteristics
Site boundary Geraldton site consists of 1 SLA.
RuralityRegional
Geographic area29.5 km²
Postcodes6530
Population characteristics
Population 2006 2011 Difference %
Total population 18 916 19 132 + 1.1
Aboriginal and Torres Strait Islander population 1836 2187 + 19.1
% of total population identified as Aboriginal and Torres Strait Islander people
9.7 11.4 + 1.7a
Workforce expansion
ICDP workforce Evaluation cycle Total FTE allocated Total FTE recruited
ICDP workforce allocation and recruitment per 10 000 Aboriginal and Torres Strait Islander population within the boundary of the DGP.
2 5.3 5.3
3 6.8 6.8
4 7.1 6.8
5b 8.5 6.8
ICDP workforce Role Total FTE allocated Total FTE recruited
ICDP workforce allocation and recruitment (for final evaluation cycle only) – positions with responsibility of covering the Sentinel Site. Actual area of responsibility may be
Indigenous Health Project Officer
1 1
Outreach Worker 2 1
Care Coordinator 1.8 0.8
118

Sentinel Sites Evaluation: Final Report – Appendices – February 2013
ICDP workforce Role Total FTE allocated Total FTE recruited
substantially larger than the Sentinel Site.
Regional Tobacco Coordinator
1 1
Tobacco Action Worker 2 0
Healthy Lifestyle Worker 2 0
119
Sentinel Sites Evaluation: Final Report – Appendices – February 2013
General Practitioner characteristics for the whole Division of General Practice
Total number of General Practices21
Proportion of practices which are solo GP practices48%
Full-time working equivalent GP: population 2010 ratio1298
a The figures shown in the row for % of total population identified as Aboriginal and Torres Strait Islander people represent the difference in percentages between two census periods.b Includes 1.8 FTE Care Coordinator position for this analysis due to the impact of the position up to August 2012 when the 1.0 FTE position became vacant.
120
Sentinel Sites Evaluation: Final Report – Appendices – February 2013
Table B17: ICDP funded allocations and recruitment, Geraldton, February 2011 – October 2012
Position Allocated FTE/
Recruitment FTE
Evaluation cycle two
Evaluation
Cycle three
Evaluation
Cycle four
Evaluation cycle five
Indigenous Health Project Officer (DGP)
Allocated 1.0 1.0 1.0 1.0
Recruited 1.0 1.0 1.0 1.0
Outreach Worker (DGP)
Allocated 1.0 1.0 1.0 1.0
Recruited 1.0 1.0 1.0 1.0
Outreach Worker (AHS) Allocated 1.0 1.0 1.0 1.0
Recruited 1.0 1.0 1.0 0.0
Regional Tobacco Coordinator (AHS)
Allocated - - - 1.0
Recruited - - - 1.0
Tobacco Action Worker (AHS)
Allocated - - - 2.0
Recruited - - - 0.0
Healthy Lifestyle Worker (AHS)
Allocated - - - 2.0
Recruited - - - 0.0
Care Coordinator (DGP) Allocated - 0.8 1.0 1.8
Recruited - 0.8 0.8 0.8
Notes: Site implementation was a staged process, subsequently data available from the second evaluation cycle only in this site. All DoHA sources have been updated to reflect interview findings up to four months following the DoHA data source.Source: DoHA Program data - Data for evaluation cycle two as at 25 February 2011; evaluation cycle three as at 30 June 2011; evaluation cycle four as at 31 December 2011 and evaluation cycle five as at 30 June 2012 and interview data (up to October 2012).
121
Sentinel Sites Evaluation: Final Report – Appendices – February 2013
Figure B35: Trends in administrative data, Geraldton (March 2009 - May 2012)
Note: Please refer to the explanatory text when reviewing this figure. In particular, note that PBS Co-payment measure data refer to number of people who have had at least one prescription dispensed in each quarter per 100 Aboriginal and Torres Strait Islander people in the site. The PBS Co-payment measure data have been divided by four to facilitate comparison with other data shown in the figure.
122
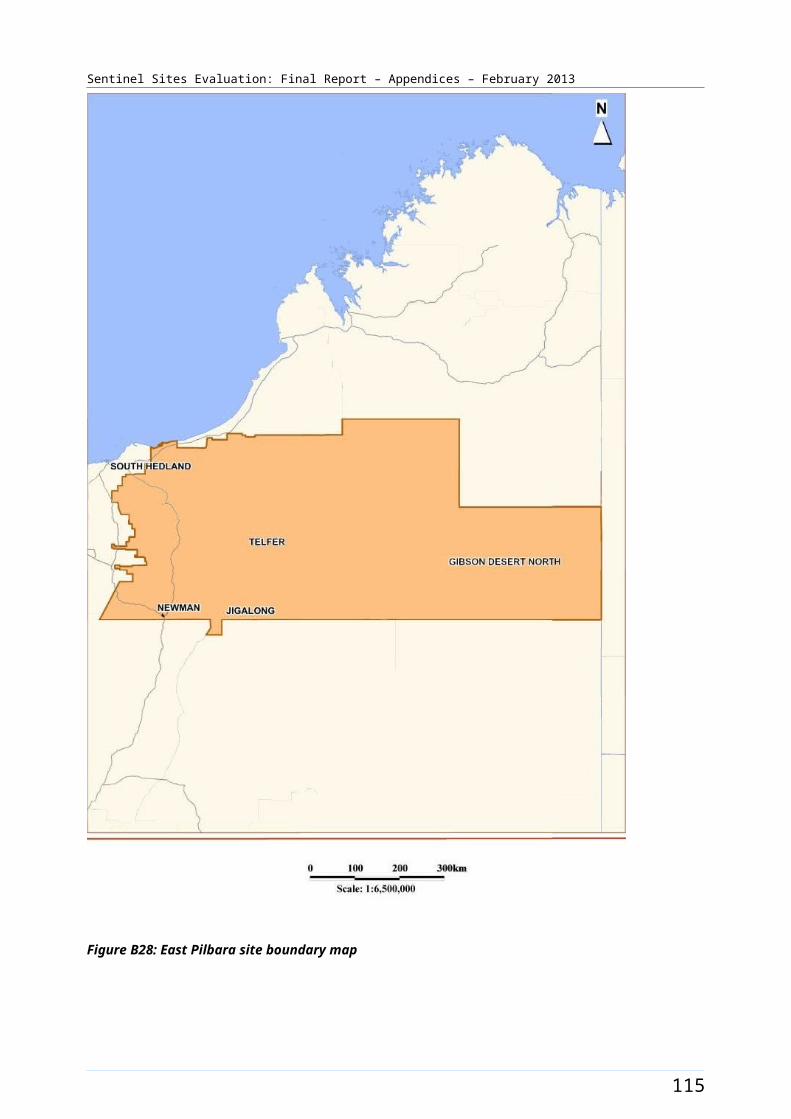
Sentinel Sites Evaluation: Final Report – Appendices – February 2013
Gladstone [Tracking site]
The Gladstone site in Queensland covered the city of Gladstone and the surrounding rural area (Figure B36); including a population of about 45 600 people in 2006 increasing to about 52 300 in 2011 (Table B18). The site covered three SLAs. The city of Gladstone had a population of almost 30 000 people in 200671 and lies approximately 550 kms north of Brisbane and 100 kms southeast of Rockhampton. The city was a major port and agricultural and mining service centre.
Between 2006 and 2011 the Aboriginal and Torres Strait Islander population increased by about 29% (a population of about 1500 increasing to 1900 respectively) (Table B18). Approximately 3.2% of the total site population identified as Aboriginal and Torres Strait Islander people in the 2006 Census. The 2011 Census showed a slight increase of approximately 0.4% with about 3.6% identifying (Table B18).
Health Service organisations and other key site characteristics and service developments
The AHS (Nhulundu Wooribah Health Organisation) and the DGP (Capricornia Division of General Practice) were key stakeholder organisations. Within the site there was one AHS and a number of General Practices. There was also a GP super clinic, which commenced July 2011, and a public hospital.
The DGP office was based in Rockhampton (outside of the site boundary). The DGP covered a population of about 160 000 people, and included the cities of Gladstone and Rockhampton, a number of smaller centres and a large rural area. The area covered by the DGP now falls within the region covered by the Central Queensland Medicare.72
Gladstone was not classed as a district of workforce shortage for GPs during 2012, based on the information accessed in November 2012.73
The AHS participated in the QUMAX program.
Workforce expansion
Workforce allocations for the Regional Tackling Smoking and Healthy Lifestyle team positions within the site were filled during the evaluation period. This included one TAW position, one RTC position and two HLW positions. All positions were filled during the third evaluation cycle (Table B19).
Workforce allocations for one OW position and a Practice Manager position at the AHS were filled during the evaluation. Both positions were filled during the third evaluation cycle. Allocations for one OW and one IHPO position at the DGP were also filled, also during the third evaluation cycle. Allocations for Care Coordinator positions at the DGP commenced in the latter part of the evaluation period (fourth Evaluation cycle); increasing from one full-time position to 1.5 FTE by the end of the evaluation. The pattern of recruitment to these allocations throughout the SSE is shown in Table B19.
The trends in administrative data for Gladstone are displayed in Figure B37.
71 Australian Bureau Of Statistics, Quick Stats, [Website], op. cit. 72 DoHA, My Medicare Local [website], op. cit. 73 DoHA, Doctor Connect, [website] op. cit. Status of the GP workforce shortage for part of the site Calliope (S) - Part B SLA was unknown.
123
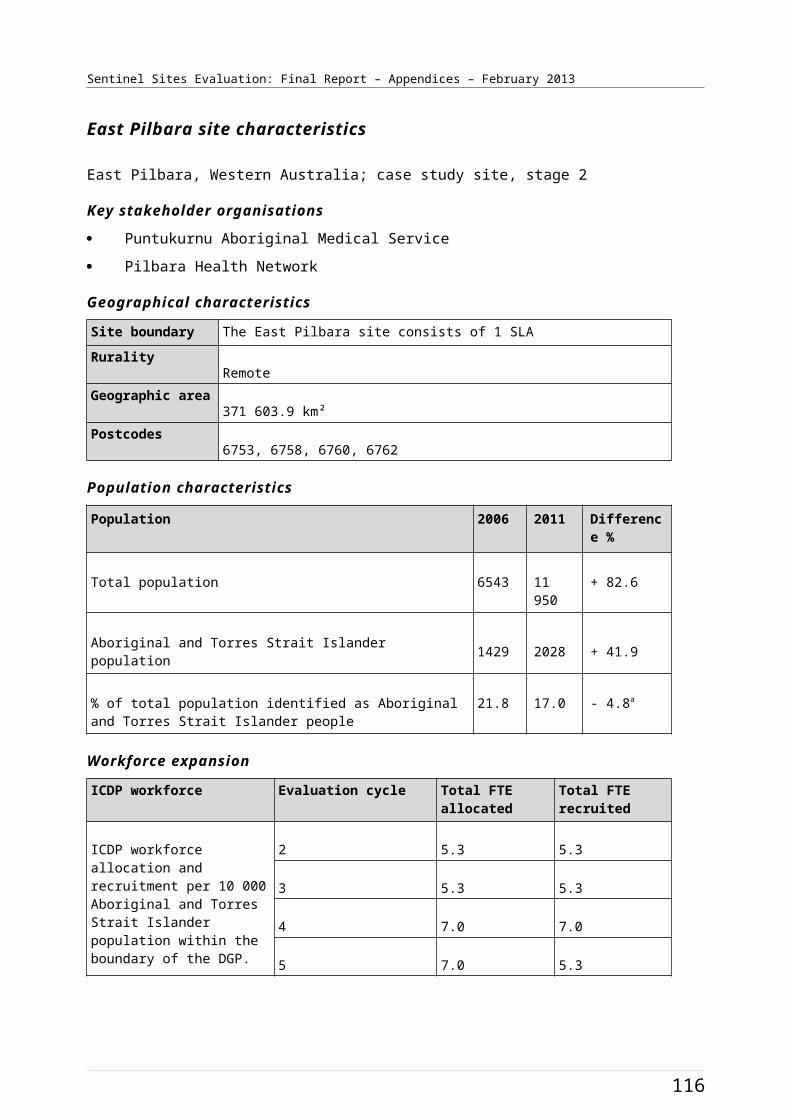
Sentinel Sites Evaluation: Final Report – Appendices – February 2013
Figure B36: Gladstone site boundary map
124
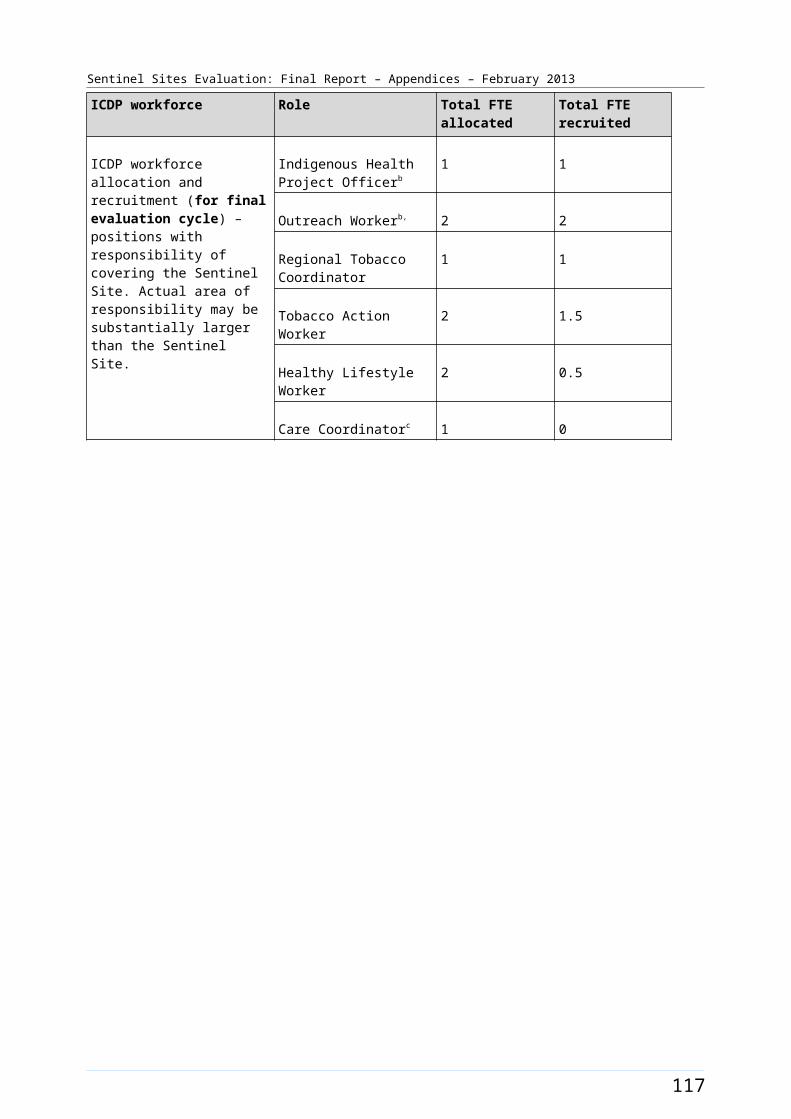
Sentinel Sites Evaluation: Final Report – Appendices – February 2013
Gladstone site characteristics
Gladstone, Queensland; tracking site, stage 2
Key stakeholder organisations
Nhulundu Wooribah Indigenous Health Organisation
Capricornia Division of General Practice
Geographical characteristics
Site boundary Gladstone site consists of 3 SLAs.
RuralityRegional
Geographic area6711.4 km²
Postcodes4680, 4694, 4695, 4697
Population characteristics
Population 2006 2011 Difference %
Total population 45 626 52 348 + 14.7
Aboriginal and Torres Strait Islander population 1481 1906 + 28.7
% of total population identified as Aboriginal and Torres Strait Islander people
3.2 3.6 + 0.4a
Workforce expansion
ICDP workforce Evaluation cycle Total FTE allocated Total FTE recruited
ICDP workforce allocation and recruitment per 10 000 Aboriginal and Torres Strait Islander population within the boundary of the DGP.
2 - -
3 4.6 4.6
4 6.1 6.1
5 6.9 6.9
ICDP workforce Role Total FTE allocated Total FTE recruited
ICDP workforce allocation and recruitment (for final evaluation cycle) – positions with responsibility of covering the Sentinel Site. Actual area of responsibility may be
Indigenous Health Project Officer
1 1
Outreach Worker 2 2
Regional Tobacco 1 1
125
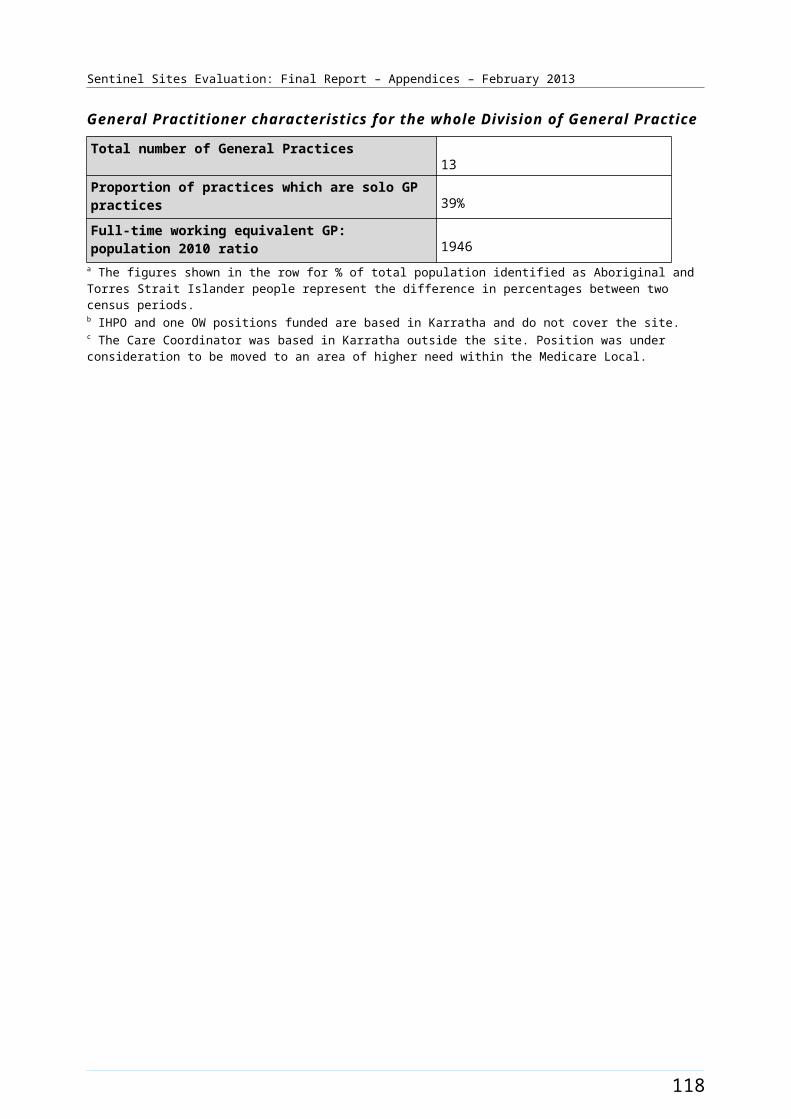
Sentinel Sites Evaluation: Final Report – Appendices – February 2013
ICDP workforce Role Total FTE allocated Total FTE recruited
substantially larger than the Sentinel Site.
Coordinator
Tobacco Action Worker 3 2
Healthy Lifestyle Worker 2 2
Practice manager 1 1
Care Coordinator 1.5 1.5b
126
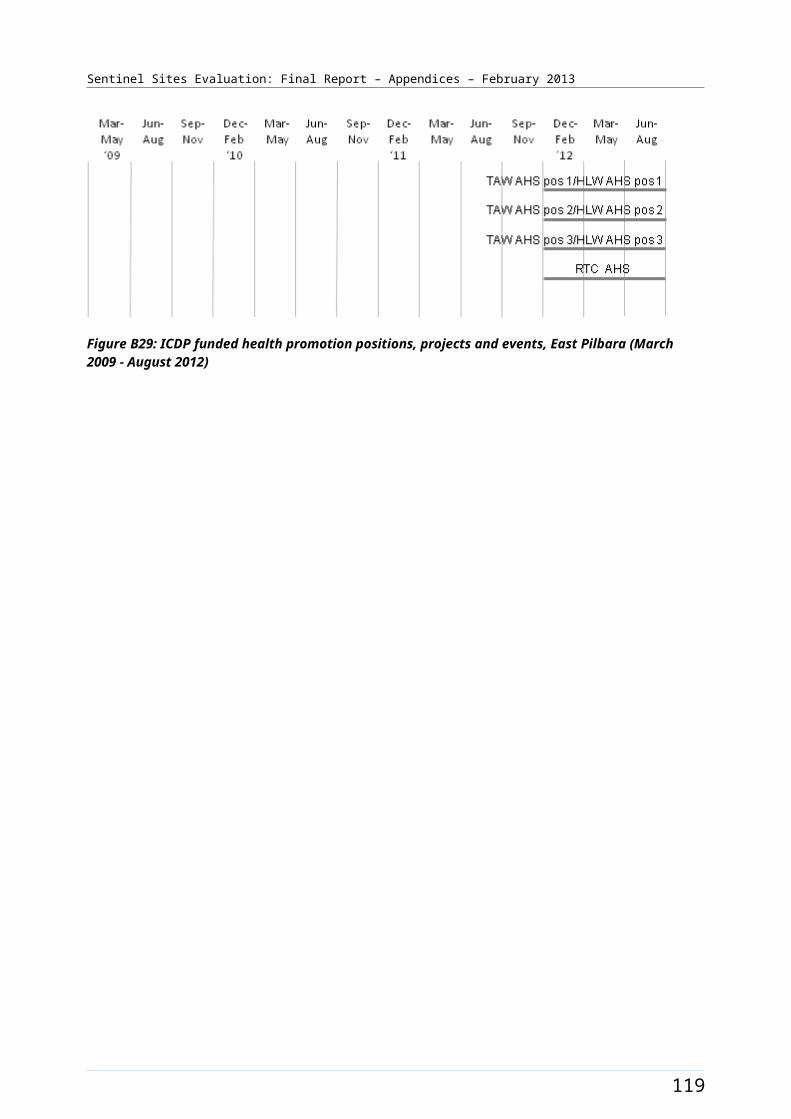
Sentinel Sites Evaluation: Final Report – Appendices – February 2013
General Practitioner characteristics for the whole Division of General Practice
Total number of General Practices41
Proportion of practices which are solo GP practices22%
Full-time working equivalent GP: population 2010 ratio1145
a The figures shown in the row for % of total population identified as Aboriginal and Torres Strait Islander people represent the difference in percentages between two census periods.b DoHA lists 1.0 FTE for Rockhampton and 0.5 FTE for Gladstone. Evaluation visit confirms both services the site.
127
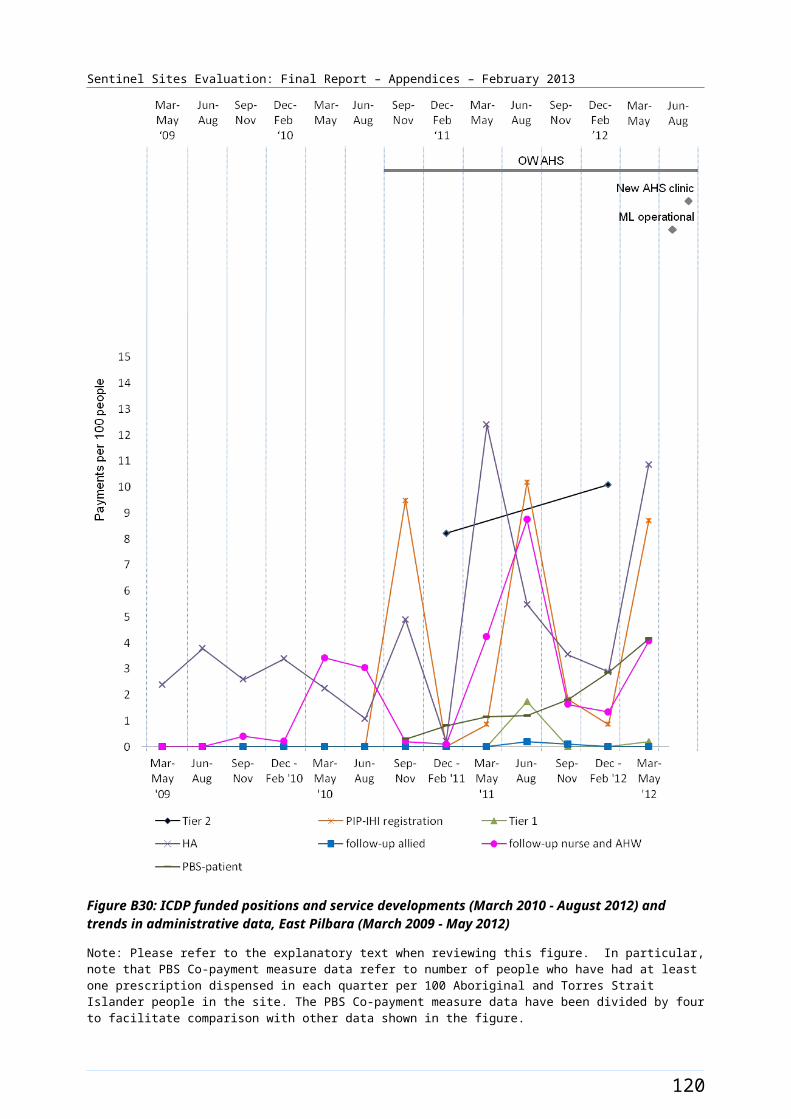
Sentinel Sites Evaluation: Final Report – Appendices – February 2013
Table B19: ICDP funded allocations and recruitment, Gladstone, June 2011 – October 2012
Position Allocated FTE/
Recruitment FTE
Evaluation
cycle three
Evaluation
cycle four
Evaluation cycle five
Indigenous Health Project Officer (DGP)
Allocated 1.0 1.0 1.0
Recruited 1.0 1.0 1.0
Outreach Worker (DGP) Allocated 1.0 1.0 1.0
Recruited 1.0 1.0 1.0
Outreach Worker (AHS) Allocated 1.0 1.0 1.0
Recruited 1.0 1.0 1.0
Regional Tobacco Coordinator (AHS)
Allocated 1.0 1.0 1.0
Recruited 1.0 1.0 1.0
Tobacco Action Worker (AHS)
Allocated 1.0 2.0 3.0
Recruited 1.0 2.0 2.0
Healthy Lifestyle Worker (AHS)
Allocated 2.0 2.0 2.0
Recruited 2.0 2.0 2.0
Care Coordinator (DGP) Allocated - 1.0 1.5
Recruited - 1.0 1.5
Practice Manager (AHS) Allocated 1.0 1.0 1.0
Recruited 1.0 1.0 1.0
Notes: Site implementation was a staged process, subsequently data available from the third evaluation cycle only in this site. All DoHA sources have been updated to reflect interview findings up to four months following the DoHA data source.Source: DoHA Program data - Data for evaluation cycle three as at 30 June 2011; evaluation cycle four as at 31 December 2011 and evaluation cycle five as at 30 June 2012 and interview data (up to October 2012).
128
Sentinel Sites Evaluation: Final Report – Appendices – February 2013
Figure B37: Trends in administrative data, Gladstone (March 2009 - May 2012)
Note: Please refer to the explanatory text when reviewing this figure. In particular, note that PBS Co-payment measure data refer to number of people who have had at least one prescription dispensed in each quarter per 100 Aboriginal and Torres Strait Islander people in the site. The PBS Co-payment measure data have been divided by four to facilitate comparison with other data shown in the figure.
129
Sentinel Sites Evaluation: Final Report – Appendices – February 2013
Grafton [Tracking site]
The Grafton site was located on the Mid North Coast of New South Wales, over 600 kms north of Sydney and about 340 kms south of Brisbane (Figure B38). The site covered the city of Grafton and the surrounding rural area; including a total population of about 22 800 people in 2006 and about 23 200 in 2011 (Table B20). The city had an estimated population of approximately 18 000 people in 2006. 74 The site was defined geographically by the Grafton SLA of Clarence Valley.
About 5.4% of the total population of the site identified as Aboriginal and Torres Strait Islander people in the 2006 Census. The 2011 Census showed an increase of approximately 1.4% with about 7% identifying (a population of about 1200 and 1600 respectively) (Table B20).
Health Service organisations and other key site characteristics and service developments
Both the AHS (Bulgarr Ngaru Medical Aboriginal Corporation) and the DGP (Mid North Coast Division of General Practice) were key stakeholder organisations. The area covered by the DGP included a population of about 140 000 people, and extended to Coffs Harbour. The DGP now falls within the region covered by the North Coast NSW Medicare Local, which commenced 1 January 2012.75
In addition to one AHS, there was a GP super clinic, which commenced on 17 October 2011, and about five other General Practices within the site. A regional hospital was also located in the site.
Grafton was classed as a district of workforce shortage for GPs during 2012, based on the information accessed in November 2012.76
A funding agreement was executed in mid-2011 with the AHS for a health administration facility at Grafton; as part of the ICDP capital works funding.
The AHS participated in the QUMAX program and was part of a Healthy for Life consortium with other AHSs located on the North Coast of NSW.
Workforce expansion
Workforce allocations for the Regional Tackling Smoking and Healthy Lifestyle team within the site were provided during the evaluation period. These included allocations for two TAW positions, two HLW positions and one RTC position. These allocations did not occur till the latter part of the evaluation period (the fifth evaluation cycle) and none of the positions were reported as filled during the evaluation (Table B21).
Workforce allocations for one OW position and a Practice Manager position at the AHS were filled during the evaluation. Both positions were filled during the second evaluation cycle (Table A21). Allocations for one OW and one IHPO position at the DGP were also filled during the same evaluation cycle. An allocation for a Care Coordinator at the DGP commenced mid evaluation (third Evaluation cycle). The pattern of recruitment to these allocations throughout the SSE is shown in Table B21.
The trends in administrative data for Grafton are displayed in Figure B39.
74 Australian Bureau Of Statistics, Quick Stats, [Website], op. cit. 75 DoHA, My Medicare Local [website], op cit. 76 DoHA, Doctor Connect [website], op. cit.
130

Sentinel Sites Evaluation: Final Report – Appendices – February 2013
Figure B38: Grafton site boundary map
131
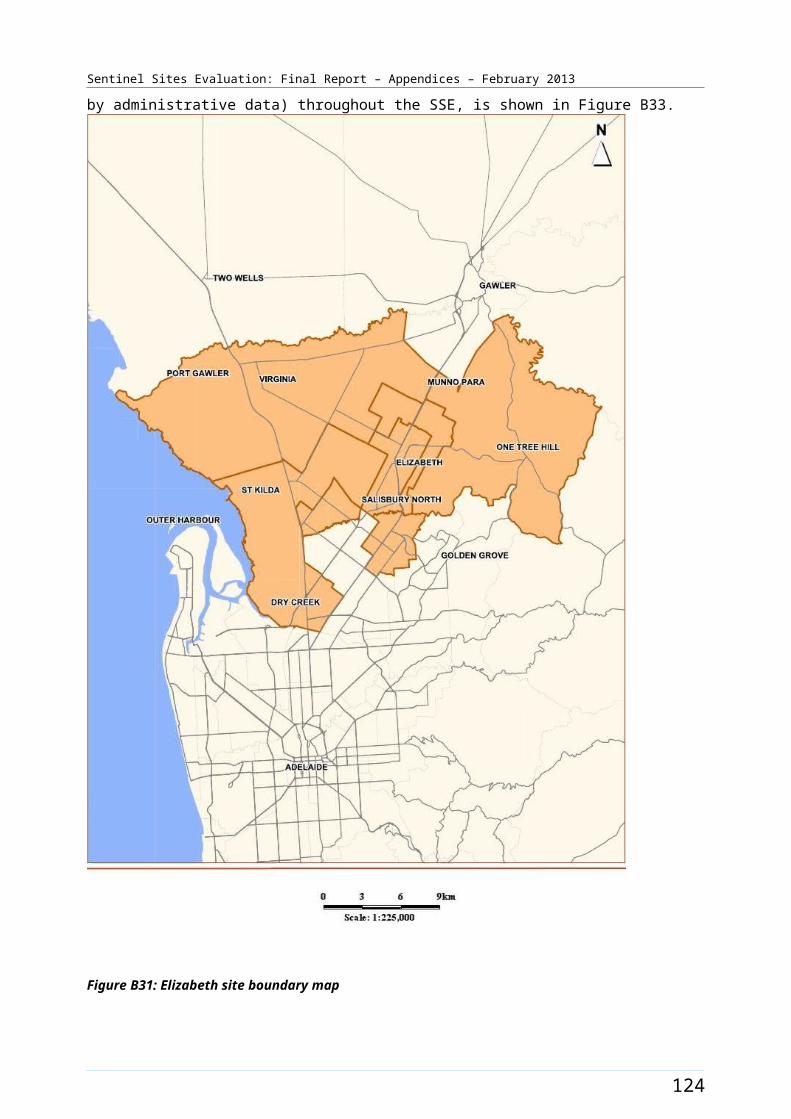
Sentinel Sites Evaluation: Final Report – Appendices – February 2013
Grafton site characteristics
Grafton, New South Wales; tracking site, stage 2
Key stakeholder organisations
Bulgarr Ngaru Medical Aboriginal Corporation
Mid North Coast Division of General Practice
Geographical characteristics
Site boundary Grafton site consists of 1 SLA.
RuralityRegional
Geographic area487.9 km²
Postcodes2460, 2462
Population characteristics
Population 2006 2011 Difference %
Total population 22 812 23 242 + 1.9
Aboriginal and Torres Strait Islander population 1238 1578 + 27.5
% of total population identified as Aboriginal and Torres Strait Islander people
5.4 6.8 + 1.4a
Workforce expansion
ICDP workforce Evaluation cycle Total FTE allocated Total FTE recruited
ICDP workforce allocation and recruitment per 10 000 Aboriginal and Torres Strait Islander population within the boundary of the DGP.
2 5.5 5.5
3 7.4 7.4
4 7.4 7.4
5 7.4 7.4
ICDP workforce Role Total FTE allocated Total FTE recruited
ICDP workforce allocation and recruitment (for final evaluation cycle) – positions with responsibility of covering the Sentinel Site. Actual area of responsibility may be
Indigenous Health Project Officer
1 1
Outreach Worker 2 2
Practice manager 1 1
132
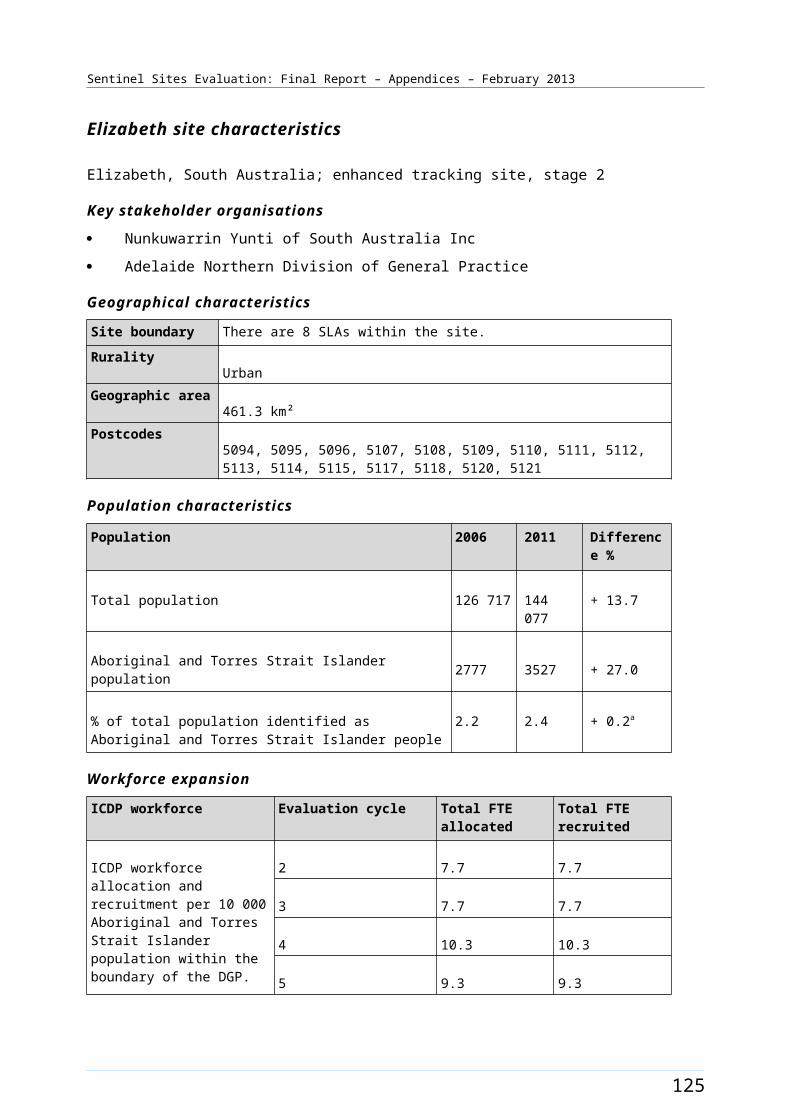
Sentinel Sites Evaluation: Final Report – Appendices – February 2013
ICDP workforce Role Total FTE allocated Total FTE recruited
substantially larger than the Sentinel Site.
Regional Tobacco Coordinator
1 0b
Tobacco Action Worker 2 0 b
Healthy Lifestyle Worker 2 0 b
Care Coordinator 1 1 c
133
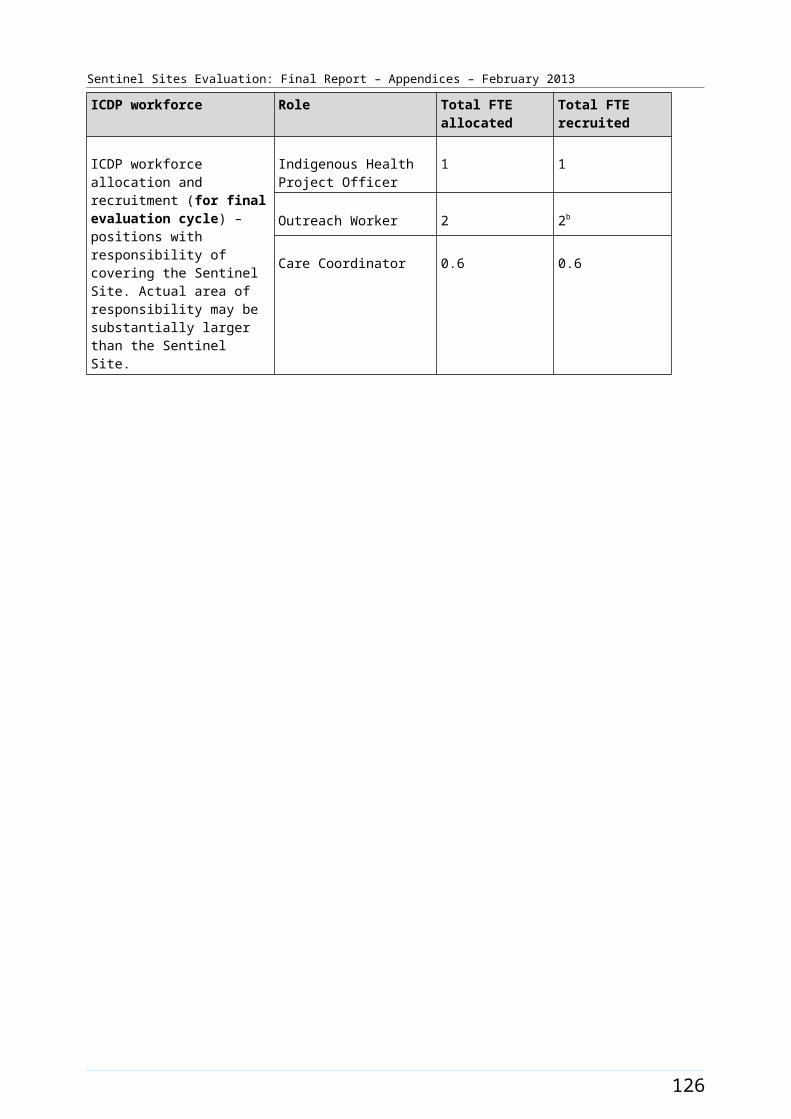
Sentinel Sites Evaluation: Final Report – Appendices – February 2013
General Practitioner characteristics for the whole Division of General Practice
Total number of General Practices44
Proportion of practices which are solo GP practices25%
Full-time working equivalent GP: population 2010 ratio1094
a The figures shown in the row for % of total population identified as Aboriginal and Torres Strait Islander represent the difference in percentages between two census periods.b Workforce based outside the site at Bullinah Aboriginal Medical Centre, will have coverage of the site.c Care Coordinator based outside the site but covers the site.
134
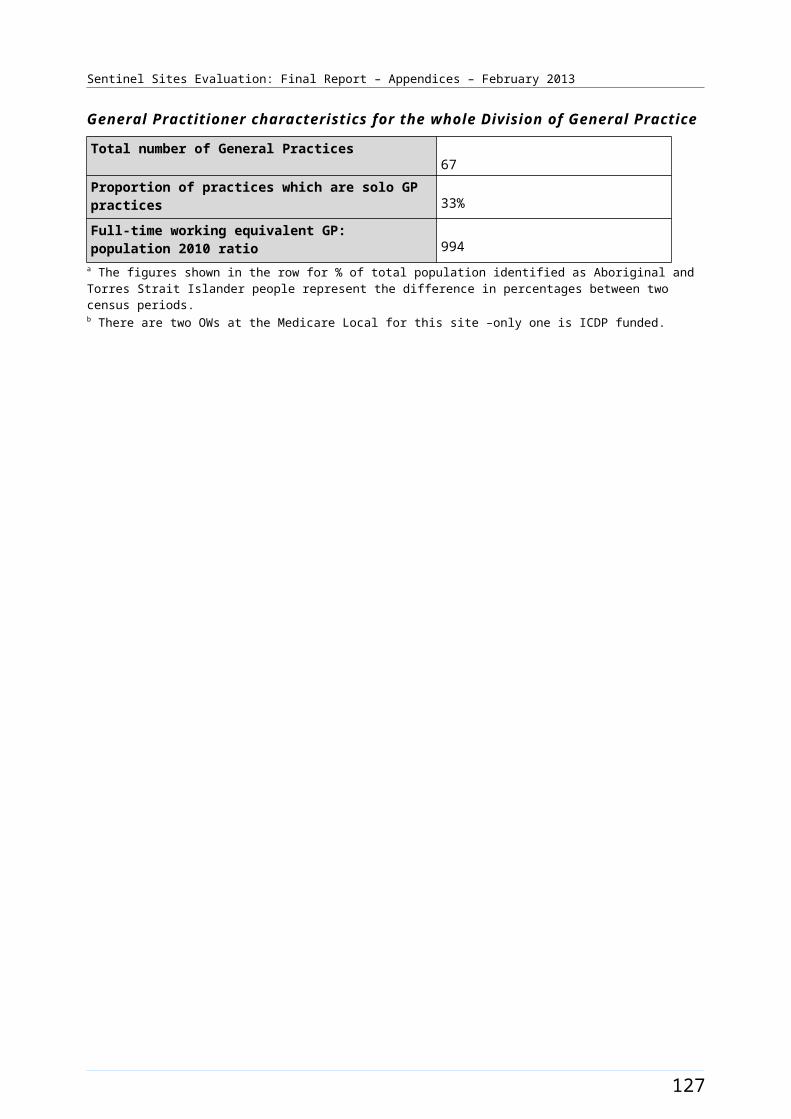
Sentinel Sites Evaluation: Final Report – Appendices – February 2013
Table B21: ICDP funded allocations and recruitment, Grafton, February 2011– October 2012
Position Allocated FTE/
Recruitment FTE
Evaluation cycle two
Evaluation
cycle three
Evaluation
cycle four
Evaluation cycle five
Indigenous Health Project Officer (DGP)
Allocated 1.0 1.0 1.0 1.0
Recruited 1.0 1.0 1.0 1.0
Outreach Worker (DGP)
Allocated 1.0 1.0 1.0 1.0
Recruited 1.0 1.0 1.0 1.0
Outreach Worker (AHS) Allocated 1.0 1.0 1.0 1.0
Recruited 1.0 1.0 1.0 1.0
Regional Tobacco Coordinator (AHS)
Allocated - - - 1.0
Recruited - - - 0.0
Tobacco Action Worker (AHS)
Allocated - - - 2.0
Recruited - - - 0.0
Healthy Lifestyle Worker (AHS)
Allocated - - - 2.0
Recruited - - - 0.0
Care Coordinator (DGP) Allocated - 1.0 1.0 1.0
Recruited - 1.0 1.0 1.0
Practice Manager (AHS) Allocated 1.0 1.0 1.0 1.0
Recruited 1.0 1.0 1.0 1.0
Notes: Site implementation was a staged process, subsequently data available from the second evaluation cycle only in this site. All DoHA sources have been updated to reflect interview findings up to four months following the DoHA data source.Source: DoHA Program data - Data for evaluation cycle two as at 25 February 2011; evaluation cycle three as at 30 June 2011; evaluation cycle four as at 31 December 2011 and evaluation cycle five as at 30 June 2012 and interview data (up to October 2012).
135
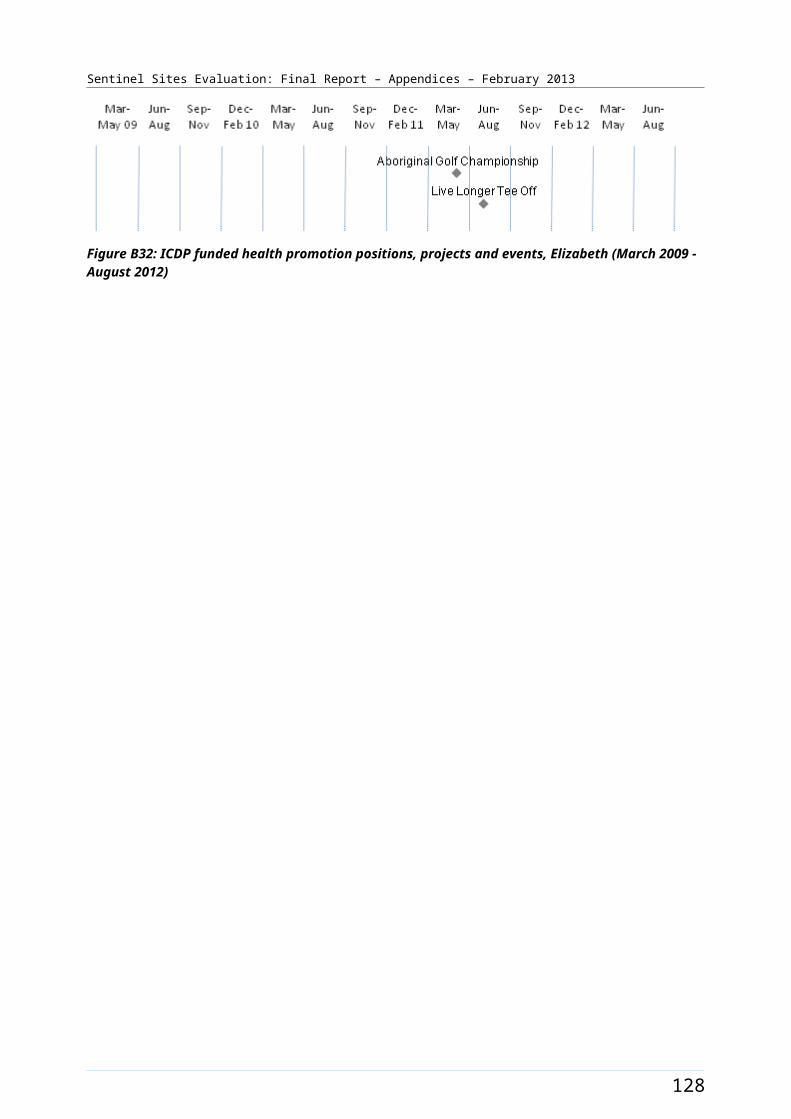
Sentinel Sites Evaluation: Final Report – Appendices – February 2013
Figure B39: Trends in administrative data, Grafton (March 2009 - May 2012)
Note: Please refer to the explanatory text when reviewing this figure. In particular, note that PBS Co-payment measure data refer to number of people who have had at least one prescription dispensed in each quarter per 100 Aboriginal and Torres Strait Islander people in the site. The PBS Co-payment measure data have been divided by four to facilitate comparison with other data shown in the figure.
136
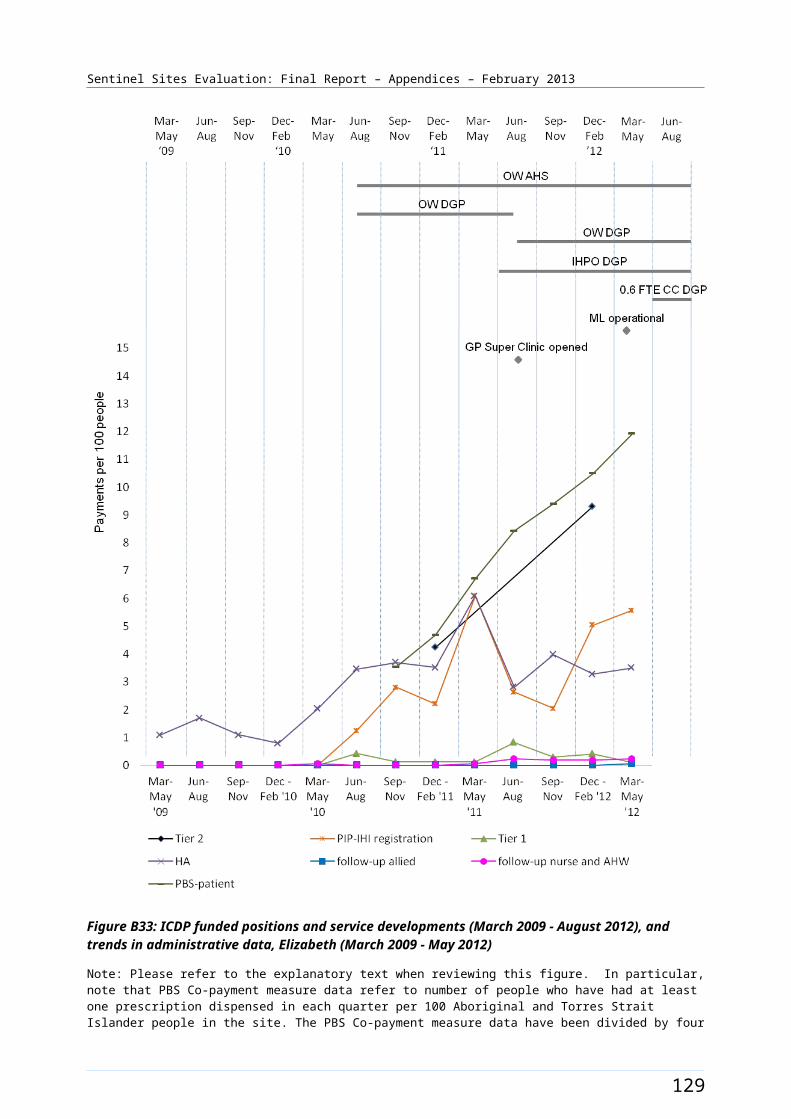
Sentinel Sites Evaluation: Final Report – Appendices – February 2013
Hobart [Tracking site]
The Hobart site covered a large part of Greater Hobart including a population of about 189 600 people in 2006 and about 198 300 in 2011. The site incorporated seven SLAs (Figure B40).
About 2.9% of the total population of the site identified as Aboriginal and Torres Strait Islander people in the 2006 Census (Table B22). The 2011 Census showed an increase of approximately 0.3% with about 3.2%, identifying in 2011 (a population of about 5400 and 6400 respectively) (Table B22).
Health Service organisations and other key site characteristics
Both the AHS [Tasmanian Aboriginal Centre Inc (TAC)] and the DGP (General Practice South) were key stakeholder organisations. TAC had three service locations: Hobart in the south and, Launceston and Burnie in the north of Tasmania. The TAC was co-located with the NACCHO affiliate office in Hobart. There were seven other OATSIH funded Aboriginal and Torres Strait Islander services around the state that were not part of the TAC. The Hobart site now falls within the region covered by the single Tasmania Medicare Local, referred to as Tasmanian Medicare Local (South), which commenced from 1 July 2011.77
The site also included numerous General Practices and a new GP super clinic at Clarence, which commenced on 4 July 2011.78 This clinic was attached to the community health centre. Three hospitals, including a major public hospital, were located in the site.
The majority of the Hobart site area was not classed as a district of workforce shortage for GPs during 2012, based on the information accessed in November 2012. However, part of the site area, Brighton (M) SLA, was classed a district of workforce shortage in this period.79
The AHS participated in both the Healthy for Life program and QUMAX.
Workforce expansion
There were no Regional Tackling Smoking and Healthy Lifestyle team allocations reported within the site during the evaluation period (Table B23).
A workforce allocation for an OW position (0.5 FTE) at the AHS was filled during the evaluation (commencing during the third evaluation cycle). DoHA data lists an allocation for a Practice Manager; however the position was based outside the site (Table B22 – note d). Allocations for one IHPO and one OW position at the DGP were also filled. Recruitment to these positions occurred in the second and third evaluation cycles respectively. The allocation for IHPO position(s) increased to 1.2 FTE by the end of the evaluation (Table B23). The allocation for the OW position decreased to 0.8 FTE by the end of the evaluation (Table B23). An allocation for a Care Coordinator position at the DGP commenced in the latter part of the evaluation period (fourth evaluation cycle) (Table B23), reducing to 0.4 FTE by the end of the evaluation. The pattern of recruitment to these allocations throughout the SSE is shown in Table B23. The trends in administrative data for Hobart are displayed in Figure B41.
77 DoHA, My Medicare Local [website], op. cit. 78 DoHA GP Super Clinics [website], op. cit. 79 DoHA, Doctor Connect, [website], op. cit.
137
Sentinel Sites Evaluation: Final Report – Appendices – February 2013
Figure B40: Hobart site boundary map
138
Sentinel Sites Evaluation: Final Report – Appendices – February 2013
Hobart site characteristics
Hobart, Tasmania; tracking site, stage 2
Key stakeholder organisations
Tasmanian Aboriginal Centre Inc
General Practice South
Geographical characteristics
Site boundary There are 7 SLAs within the Hobart Sentinel Site.
RuralityRegional
Geographic area1 100.4 km²
Postcodes7000, 7004, 7005, 7007, 7008, 7009, 7010, 7011, 7012, 7015, 7016, 7017, 7018, 7019, 7020, 7021, 7022, 7023, 7024, 7025, 7030, 7050, 7052, 7053, 7054, 7055, 7140, 7150, 7170
Population characteristics
Population 2006 2011 Difference %
Total population 189 637 198 304 + 4.6
Aboriginal and Torres Strait Islander population 5413 6369 + 17.7
% of total population identified as Aboriginal and Torres Strait Islander people
2.9 3.2 + 0.3a
Workforce expansion
ICDP workforce Evaluation cycle Total FTE allocated Total FTE recruited
ICDP workforce allocation and recruitment per 10 000 Aboriginal and Torres Strait Islander population within the boundary of the DGP.
2 3.2 1.9
3 3.2 3.2
4 4.5 3.2
5 3.7 3.7
ICDP workforce Role Total FTE allocated Total FTE recruited
ICDP workforce allocation and recruitment (for final evaluation cycle only) – positions with responsibility of covering the
Indigenous Health Project Officer
1.2 1.2b
Outreach Worker 1.3 1.3
139
Sentinel Sites Evaluation: Final Report – Appendices – February 2013
ICDP workforce Role Total FTE allocated Total FTE recruited
Sentinel Site. Actual area of responsibility may be substantially larger than the Sentinel Site.b, d
Care Coordinator 0.4 0.4c
140
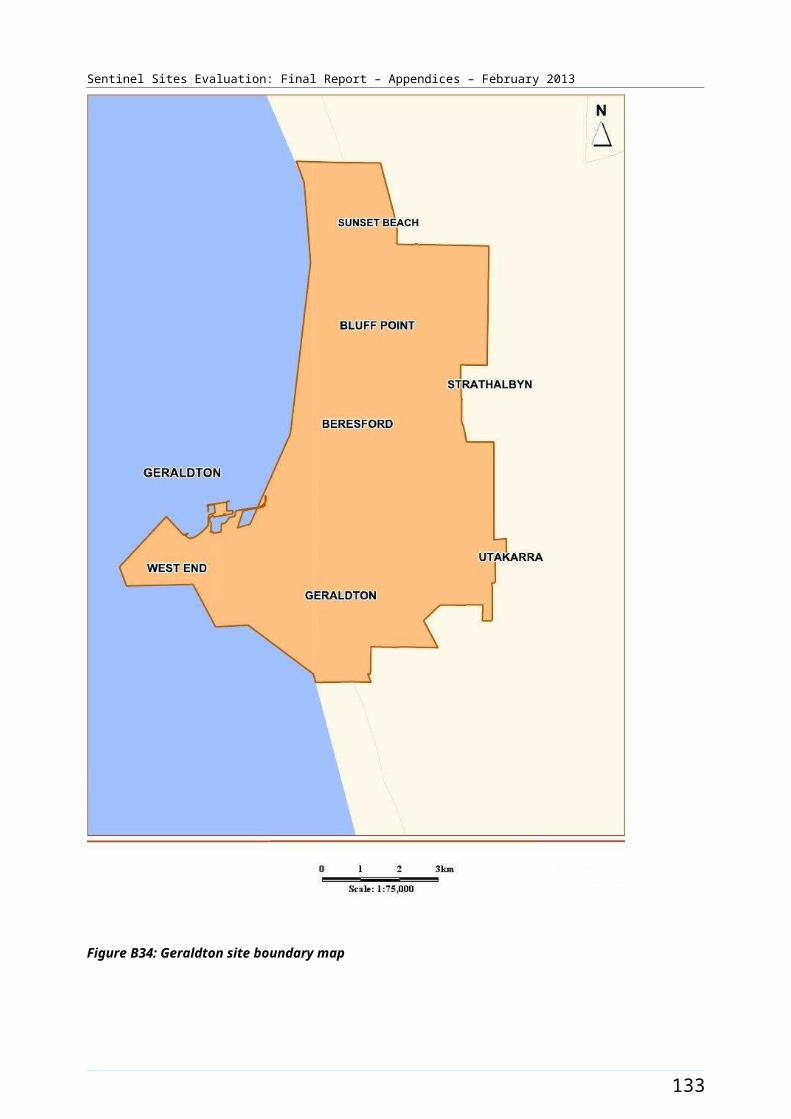
Sentinel Sites Evaluation: Final Report – Appendices – February 2013
General Practitioner characteristics for the whole Division of General Practice
Total number of General Practices85
Proportion of practices which are solo GP practices27%
Full-time working equivalent GP: population 2010 ratio1150
a The figures shown in the row for % of total population identified as Aboriginal and Torres Strait Islander represent the difference in percentages between two census periods.b The IHPO allocated to the NACCHO affiliate is not included in the workforce allocation for the site.c Tasmania has a total of 2.6 FTE Care Coordinator positions, mostly with direct responsibility outside the site. d DoHA data list s 1.0 FTE practice manager for Hobart but further updates confirm the position is based outside the site.
141
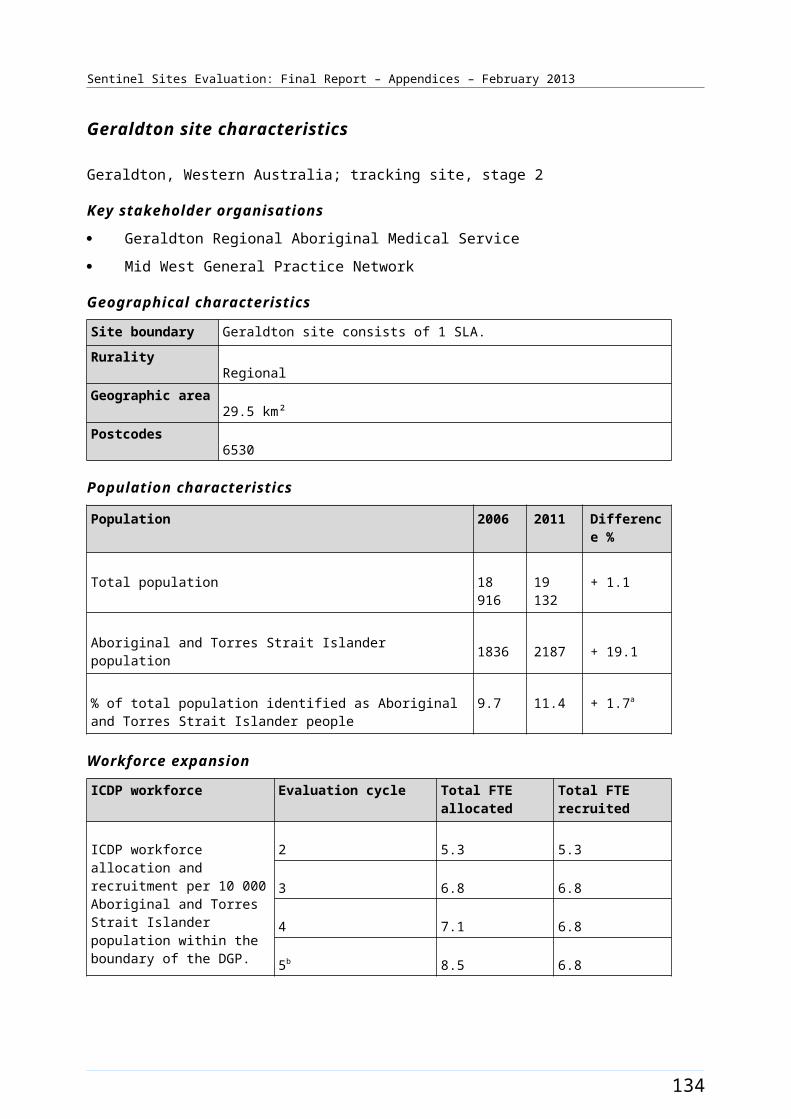
Sentinel Sites Evaluation: Final Report – Appendices – February 2013
Table B23: ICDP funded allocations and recruitment, Hobart, February 2011 – October 2012
Position Allocated FTE/
Recruitment FTE
Evaluation cycle two
Evaluation
cycle three
Evaluation
cycle four
Evaluation cycle five
Indigenous Health Project Officer (DGP)
Allocated 1.0 1.0 1.0 1.2
Recruited 1.0 1.0 0.0 1.2
Outreach Worker (DGP)
Allocated 1.0 1.0 1.0 0.8
Recruited 0.0 1.0 1.0 0.8
Outreach Worker (AHS)
Allocated 0.5 0.5 0.5 0.5
Recruited 0.5 0.5 0.5 0.5
Care Coordinator (DGP)
Allocated - - 1.0 0.4
Recruited - - 1.0 0.4
Notes: Site implementation was a staged process, subsequently data available from the second evaluation cycle only in this site. All DoHA sources have been updated to reflect interview findings up to four months following the DoHA data source.Source: DoHA Program data - Data for evaluation cycle two as at 25 February 2011; evaluation cycle three as at 30 June 2011; evaluation cycle four as at 31 December 2011 and evaluation cycle five as at 30 June 2012 and interview data (up to October 2012).
142
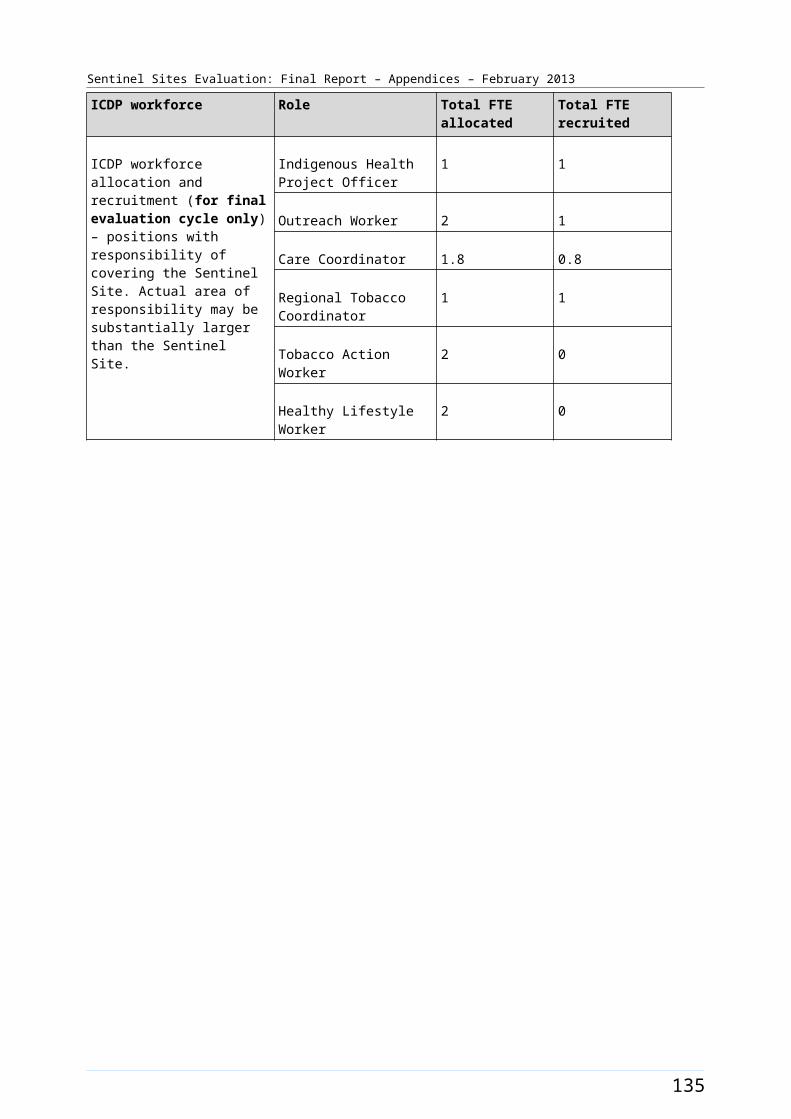
Sentinel Sites Evaluation: Final Report – Appendices – February 2013
Figure B41: Trends in administrative data, Hobart (March 2009 - May 2012)
Note: Please refer to the explanatory text when reviewing this figure. In particular, note that PBS Co-payment measure data refer to number of people who have had at least one prescription dispensed in each quarter per 100 Aboriginal and Torres Strait Islander people in the site. The PBS Co-payment measure data have been divided by four to facilitate comparison with other data shown in the figure.
143

Sentinel Sites Evaluation: Final Report – Appendices – February 2013
Kalgoorlie [Tracking site]
The Kalgoorlie site in Western Australia included the city of Kalgoorlie and a large remote area extending from Kalgoorlie to the South Australian border. The site was defined by the two SLAs of Kalgoorlie/Boulder Part A and Part B (Figure B42). The city had a population of about 30 000 people in 2006 (approximately 99% of the total site population)80 and is located about 600 kms east of Perth and about 400 kms north of Esperance (population about 13 000 in 2006).81
The total site population was 28 400 in 2006 and had increased to about 31 100 in 2011 (Table B24). Kalgoorlie was a major mining centre. About 7.5% of the total population of the site identified as Aboriginal and Torres Strait Islander people in the 2006 Census (Table B24). The 2011 Census showed this reducing by approximately 0.6% with about 6.9 % identifying in 2011 (the actual population remained stable at around 2100 for both periods respectively) (Table B24). The neighbouring SLA to the west included the town of Coolgardie (town population <1000) and included a total population of about 4000 people82 who may access services in Kalgoorlie.
Health Service organisations and other key site characteristics
The DGP (Goldfields Esperance General Practice Network) and the AHS (Bega Garnbirringu Health Services Aboriginal Corporation) were key stakeholder organisations and were located within the site boundary. The AHS provided regular outreach services to towns and remote communities, including the collaborative Western Desert Kidney Health Project.83 The DGP covered a vast area of WA extending from the coast in the south (including the town of Esperance outside the site) to north of Kalgoorlie and east to the Western Australia/Northern Territory and Western Australia /South Australia borders. The area covered by the DGP now falls within part of the region of the Goldfields Midwest Medicare Local, which commenced on 1 January 2012.84
In addition to the AHS, there were a number of General Practices and a regional hospital within the site. The AHS patient population was covered by pharmaceutical S100 supply arrangements; including the town folk.
Kalgoorlie was classed as a district of workforce shortage for GPs during 2012, based on the information accessed in November 2012.85
The AHS participates in the Healthy for Life program.
Local Community Campaign to Promote Better Health activity occurred in the site during the evaluation period (Chapter 4, Table 4.1). The Bega Garnbirringu Aboriginal Health Service was funded late in the evaluation (September 2012) to establish a Mobile Community Engagement Vehicle, which aimed to deliver a range of themed health promotion activities to ten Aboriginal communities in the Goldfields region of WA, including Kalgoorlie.
80 City of Kalgoorlie-Boulder Council [website] (accessed 30 October 2012).81 Goldfields-Esperance Development Commission (accessed 30 October 2012).82 Ibid.83 Arts & Health Foundation (accessed 2 November 2012).84 Ibid.85 DoHA, Doctor Connect (accessed 5 November 2012).
144
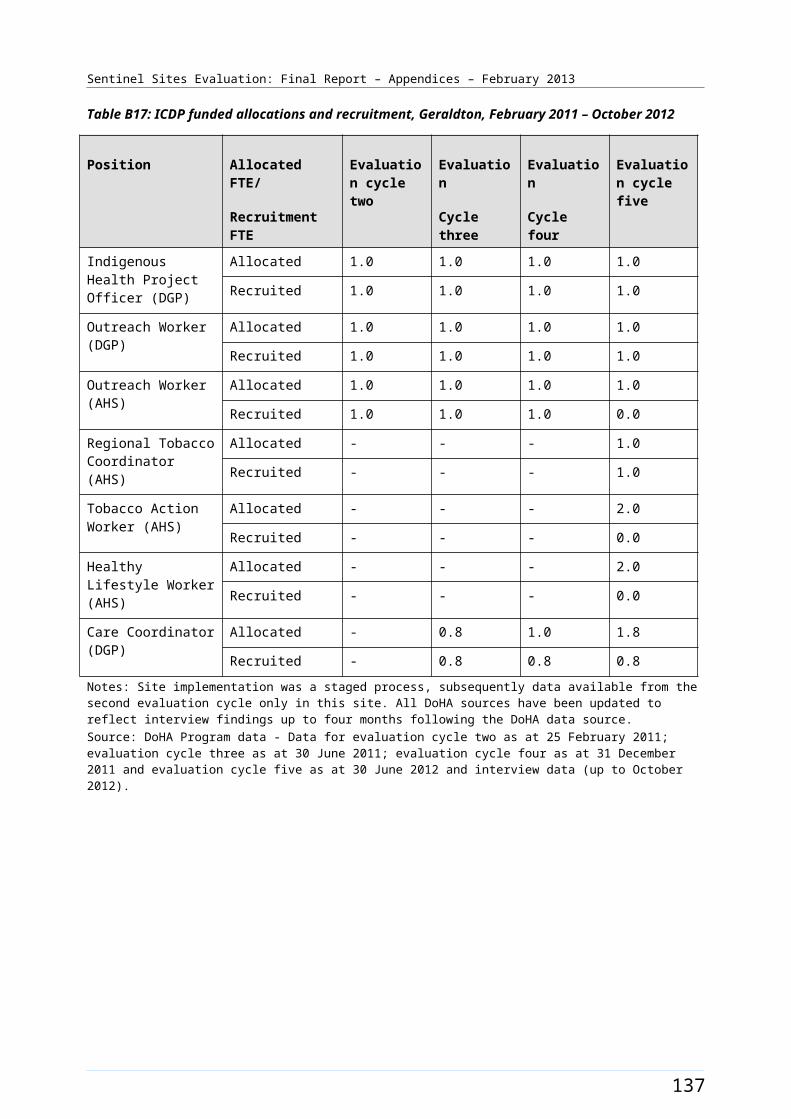
Sentinel Sites Evaluation: Final Report – Appendices – February 2013
Workforce expansion
Allocations for Regional Tackling Smoking and Healthy Lifestyle team positions were filled within the site during the evaluation period. These included up to three TAW positions, two HLW positions and one RTC position at the AHS. The allocation for TAW positions increased from 1.0 FTE to 3.0 FTE during the evaluation (Table B25). The pattern of recruitment to these allocations is shown in Table B25.
Workforce allocations for an additional health staff position and a Practice Manager position at the AHS were filled during the evaluation. Both positions were filled from the third evaluation cycle. Allocations for one OW, one IHPO position and a part-time (0.5 FTE) Care Coordinator position at the DGP were also filled from the third evaluation cycle. The OW DGP position was filled 0.5 FTE at the end of the evaluation. The pattern of allocations and recruitment to these allocations throughout the SSE is shown in Table B25.
The trends in administrative data for Kalgoorlie are displayed in Figure B43.
145
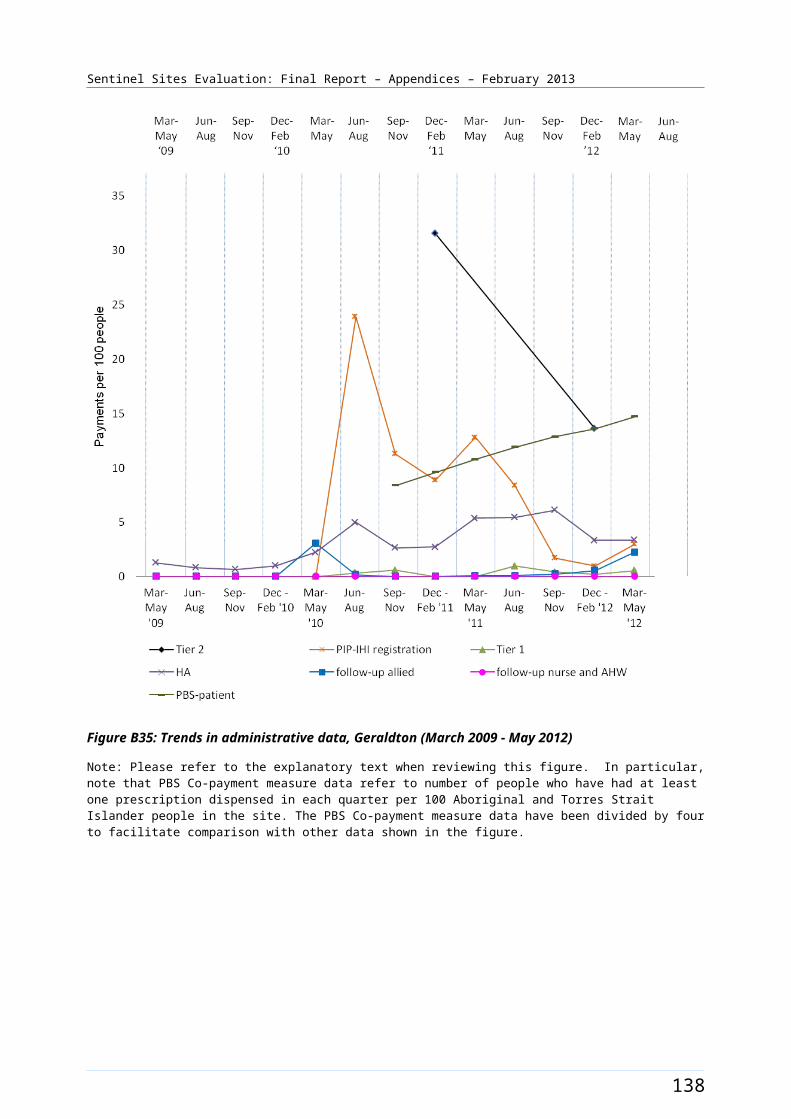
Sentinel Sites Evaluation: Final Report – Appendices – February 2013
Figure B42: Kalgoorlie site boundary map
146
Sentinel Sites Evaluation: Final Report – Appendices – February 2013
Kalgoorlie site characteristics
Kalgoorlie, Western Australia; tracking site, stage 2
Key stakeholder organisations
Bega Garnbirringu Health Services Aboriginal Corporation
Goldfields Esperance General Practice Network
Geographical characteristics
Site boundary Kalgoorlie site consists of 2 SLAs.
RuralityRegional
Geographic area95 575.9 km²
Postcode6430, 6431, 6432, 6434
Population characteristics
Population 2006 2011 Difference %
Total population 28 423 31 104 + 9.4
Aboriginal and Torres Strait Islander population 2135 2144 + 0.4
% of total population identified as Aboriginal and Torres Strait Islander people
7.5 6.9 - 0.6a
Workforce expansion
ICDP workforce Evaluation cycle Total FTE allocated Total FTE recruited
ICDP workforce allocation and recruitment per 10 000 Aboriginal and Torres Strait Islander population within the boundary of the DGP.
2 - -
3 4.8 4.8
4 4.8 4.8
5 4.8 3.8
ICDP workforce Role Total FTE allocated Total FTE recruited
ICDP workforce allocation and recruitment (for final evaluation cycle) – positions with responsibility of covering the Sentinel Site. Actual area of responsibility may be
Indigenous Health Project Officer
1 1
Outreach Worker 1 0.5 b
Regional Tobacco 1 1
147
Sentinel Sites Evaluation: Final Report – Appendices – February 2013
ICDP workforce Role Total FTE allocated Total FTE recruited
substantially larger than the Sentinel Site.
Coordinator
Tobacco Action Worker 3 2
Healthy Lifestyle Worker 2 2
Additional Health Staff 1 1
Care Coordinator 0.5 0.5 b
Practice manager 1 1
148
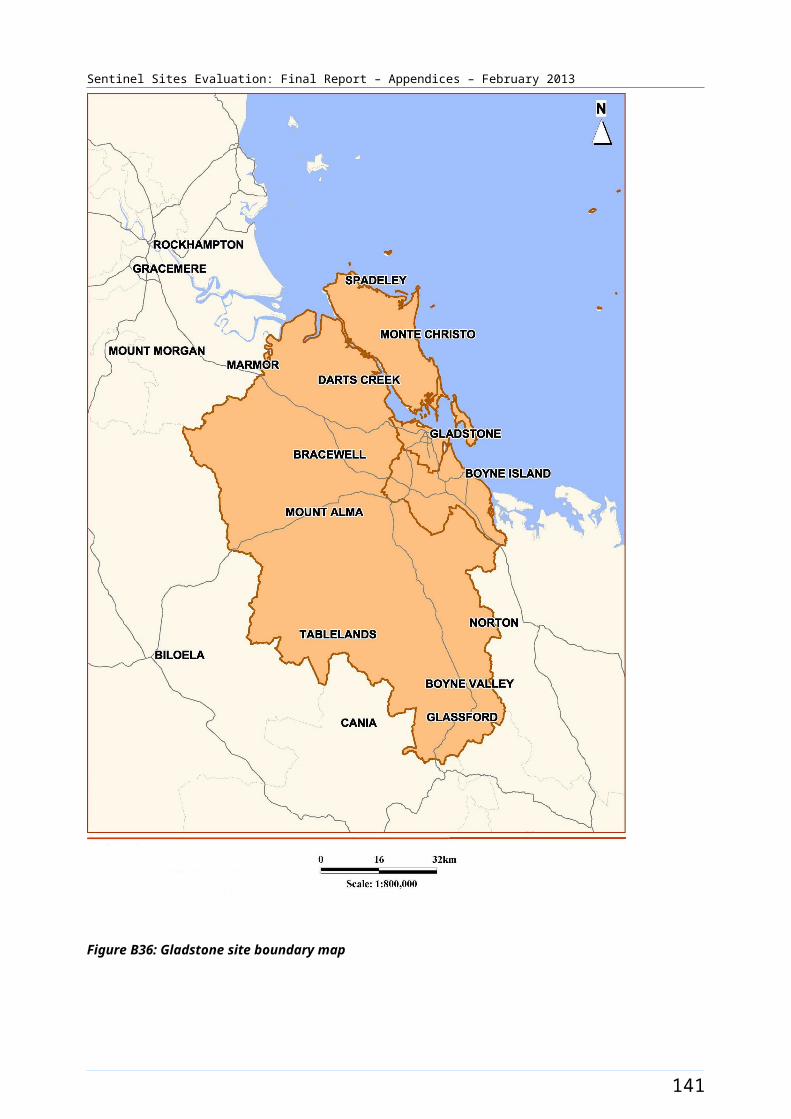
Sentinel Sites Evaluation: Final Report – Appendices – February 2013
General Practitioner characteristics for the whole Division of General Practice
Total number of General Practices19
Proportion of practices which are solo GP practices31.6%
Full-time working equivalent GP: population 2010 ratio1782
a The figures shown in the row for % of total population identified as Aboriginal and Torres Strait Islander people represent the difference in percentages between two census periods.b A second OW and Care Coordinator position was under recruitment at the Medicare Local at the time of the final evaluation visit.
149
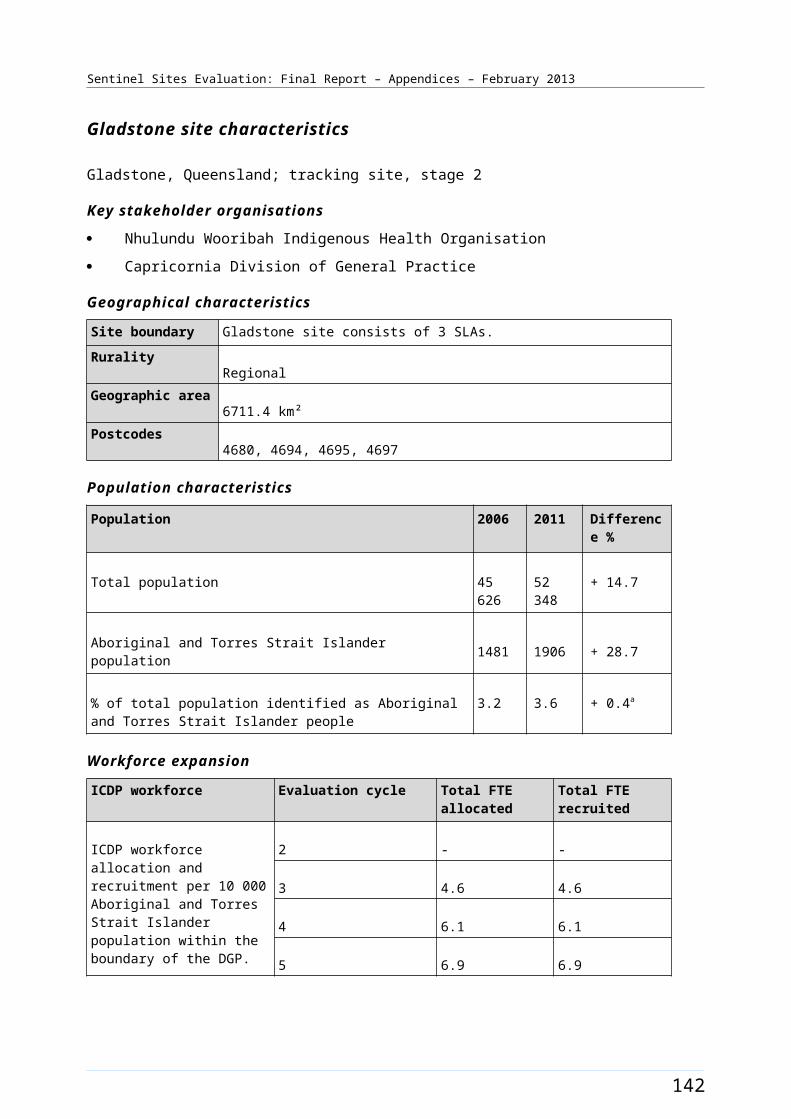
Sentinel Sites Evaluation: Final Report – Appendices – February 2013
Table B25: ICDP funded allocations and recruitment, Kalgoorlie, June 2011 - October 2012
Position Allocated FTE/
Recruitment FTE
Evaluation
cycle three
Evaluation
cycle four
Evaluation cycle five
Indigenous Health Project Officer (DGP)
Allocated 1.0 1.0 1.0
Recruited 1.0 1.0 1.0
Outreach Worker (DGP) Allocated 1.0 1.0 1.0
Recruited 1.0 1.0 0.5
Regional Tobacco Coordinator (AHS)
Allocated 1.0 1.0 1.0
Recruited 1.0 1.0 1.0
Tobacco Action Worker (AHS)
Allocated 1.0 2.0 3.0
Recruited 1.0 2.0 2.0
Healthy Lifestyle Worker (AHS)
Allocated 2.0 2.0 2.0
Recruited 2.0 2.0 2.0
Care Coordinator (DGP) Allocated 0.5 0.5 0.5
Recruited 0.5 0.5 0.5
Additional Health Staff (AHS)
Allocated 1.0 1.0 1.0
Recruited 1.0 1.0 1.0
Practice Manager (AHS) Allocated 1.0 1.0 1.0
Recruited 1.0 1.0 1.0
Notes: Site implementation was a staged process, subsequently data available from the third evaluation cycle only in this site. All DoHA sources have been updated to reflect interview findings up to four months following the DoHA data source.Source: DoHA Program data - Data for evaluation cycle three as at 30 June 2011; evaluation cycle four as at 31 December 2011 and evaluation cycle five as at 30 June 2012 and interview data (up to October 2012).
150

Sentinel Sites Evaluation: Final Report – Appendices – February 2013
Figure B43: Trends in administrative data, Kalgoorlie (March 2009 - May 2012)
Note: Please refer to the explanatory text when reviewing this figure. In particular, note that PBS Co-payment measure data refer to number of people who have had at least one prescription dispensed in each quarter per 100 Aboriginal and Torres Strait Islander people in the site. The PBS Co-payment measure data have been divided by four to facilitate comparison with other data shown in the figure.
151

Sentinel Sites Evaluation: Final Report – Appendices – February 2013
Katherine West [Case study site]
The Katherine West site in the Northern Territory covered the Katherine West region; extending south and west from outside the town of Katherine to the border of Western Australia (Figure B44). The township of Katherine was not included in the site, however had importance as the closest major centre.
The total population of the site was approximately 2800 in 2006 and increased by approximately 4% to 2900 in 2011 (Table B26). Around 76% of the total population of the site identified as Aboriginal and Torres Strait Islander people in the 2006 Census (a population of about 2100). The 2001 Census showed a decrease of about 5.2% with approximately 71% identifying in 2011 (a population of about 2000) (Table B26).
Health Service organisations and other key site characteristics and service developments
The Katherine West Health Board Aboriginal Corporation (KWHB) is a community-controlled organisation and was the only key stakeholder organisation in this site. The nearest DGP office was in Darwin, 300 kms to the north of Katherine. There were no private GPs in the region included in the site and no private pharmacist in the site; but there were a number in the township of Katherine. 86 The DGP was not involved as a key stakeholder in this site as it had a limited (if any) role in the Katherine West site during the evaluation period. The Katherine West site now falls within the region of the single Northern Territory Medicare Local, which commenced 1 July 2012.87
The community of Lajamanu were the focus of the interviews and community focus groups for this site. At the time of the evaluation, including Lajamanu, the KWHB operated seven Health Services in remote communities and small towns within the region. Lajamanu was approximately 500 kms from the town of Katherine. Programs and services for all Health Services were managed from the KWHB office in the town of Katherine. Under an existing service arrangement, Specialists Outreach NT was providing specialist assistance for site residents throughout the period of the evaluation.
There was a regional hospital in the town of Katherine and a tertiary level hospital in Darwin.
Katherine West was one of twenty-nine identified ‘Remote Service Delivery Sites’.88 Under the Remote Service Delivery National Partnership Agreement, post 2012 Lajamanu will receive funding for Health Service Delivery upgrades, to support provision of adequate health infrastructure and facilities including the development of a new category one health centre which would include appropriate access for men and areas for renal treatment and emergency evacuation.89
Wurli Wurlinjang Health Service, for Katherine based Aboriginal and Torres Strait Islander residents, and Sunrise Health Service, for East Katherine communities, are part of the wider Katherine area. These organisations are separate entities however negotiation had commenced during 2012 around collaboration in running an ICDP Regional Tobacco and Healthy Lifestyle team.90
86 Yellow Pages - Pharmacies in Katherine WA [website] (accessed 31 October 2012).87 DoHA, My Medicare Local [Website], op. cit. 88 Remote Service Delivery [website] NT Plan, Implementation Plan for National Partnership Agreement on Remote Service Delivery Between the Commonwealth of Australia and the Northern Territory (accessed 23 October 2012). 89 FAHCSIA, Priority Communities [website] op cit. (accessed 29 October 2012).90 SSE Site Evaluation visit - September 2012.
152
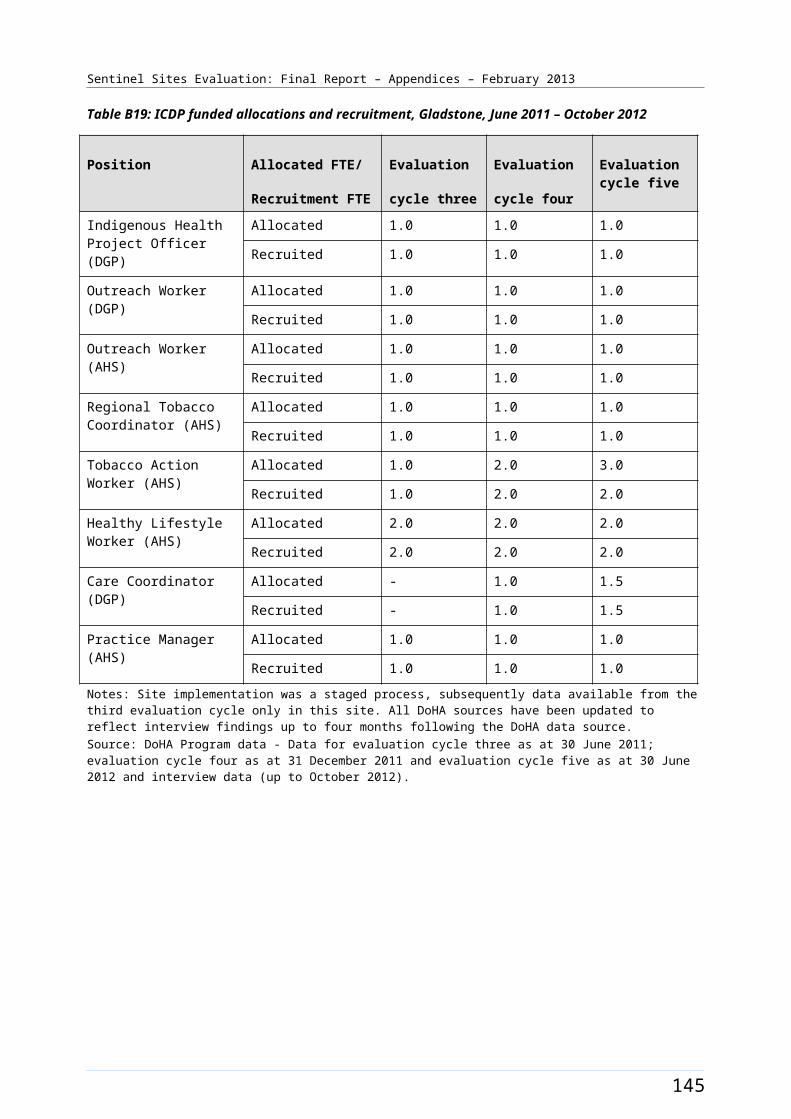
Sentinel Sites Evaluation: Final Report – Appendices – February 2013
Katherine West was classed as a district of workforce shortage for GPs during 2012, based on information accessed in April 2012 and October 2012.91 From mid 2012 Lajamanu had access five days a week to a state-based telephone GP consult service for clinical decision making.92
Pharmaceuticals in the KWHB region were supplied through the Pharmaceutical S100 supply arrangements).93
KWHB received funding under the Healthy for Life program.
Local Community Campaign to Promote Better Health activity occurred in the site during the evaluation (Chapter 4, Table 4.1). Red Dust Role Models held two health promotion events, the first one focusing on nutrition and the topic for the second one was no drink driving. Indigenous Hip Hop Projects created a video where the key messages were smoking education and prevention. The Yarralin Healthy Living Day was also conducted in Katherine West; one of the remote communities serviced by the KWHB. The timing of events and activity is presented in Figure B45.
Workforce expansion
Allocations to some Regional Tackling Smoking and Healthy Lifestyle team positions within the site had been partly filled during the evaluation period. These included one RTC position and part of the TAW allocation (1.5 FTE), which was used to support a health promotion coordinator and administration assistant. The RTC position was filled during the June – August 2011 quarter. Allocations for remaining TAW allocations were not filled. The Service Delivery model for this activity was under review across the region at the end of the evaluation period. The pattern of recruitment to these positions (where they had direct responsibility within the site) is displayed in Figure B45.
91 DoHA, Doctor Connect [website], op. cit. 92 SSE Site Evaluation visit - September 2012.93 DoHA, Section 100 [website] (accessed 1 October 2012).
153
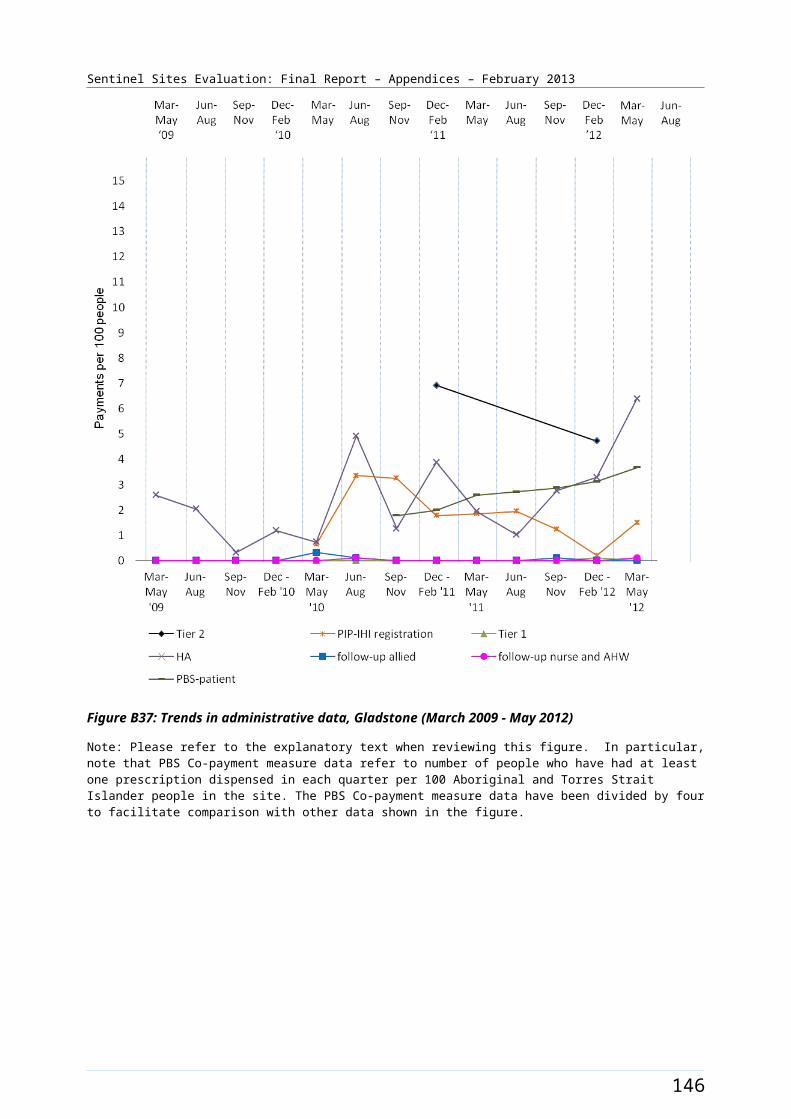
Sentinel Sites Evaluation: Final Report – Appendices – February 2013
Workforce allocations for two OW positions at the AHS had been partly filled during the evaluation. An OW AHS 0.5 FTE position was filled during the December 2010 – February 2011 quarter. Two other part-time positions were filled during the March - August 2012 period. These positions remained unfilled from this time until the end of the evaluation. Allocations for Practice Manager (0.8 FTE) (filled during the June – August 2010 quarter) and Care Coordinator positions at the AHS had also been filled (during March – May 2012 quarter). The Care Coordinator position had two incumbents during this time. An allocation for additional health staff (1.6 FTE) was also filled from September – November 2010 quarter, which was used to employ short-term registered nurses to undertake chronic disease work. Recruitment to these positions was commonly determined by availability of accommodation at the site. The pattern of recruitment to these allocations, where they had direct responsibility for the site, together with trends in the uptake of various measures (as reflected by administrative data) throughout
154
Sentinel Sites Evaluation: Final Report – Appendices – February 2013
the SSE, is shown in Figure B46.
Figure B44: Katherine West site boundary map
155
Sentinel Sites Evaluation: Final Report – Appendices – February 2013
Katherine West site characteristics
Katherine West, Northern Territory; case study site, stage 1
Key stakeholder organisation
Katherine West Health Board
Geographical characteristics
Site boundaryThe Sentinel Site boundary consists of 5 SLAs and follows the Katherine West Health Board’s region and the health centres of Lajamanu, Kalkarindji, Timber Creek, Yarralin, Pigeon Hole, Bulla and Mialuni that come under KWHB management.
The community focus groups were held in Lajamanu during the evaluation.Rurality
RemoteGeographic area
162 000 km²Postcodes
0852
Population characteristics
Population 2006 2011 Difference %
Total population 2795 2907 + 4.0
Aboriginal and Torres Strait Islander population 2126 2065 - 2.9
% of total population identified as Aboriginal and Torres Strait Islander people
76.1 71.0 - 5.1b
Workforce expansion
ICDP workforce Evaluation cycle Total FTE allocated Total FTE recruited
ICDP workforce allocation and recruitment per 10 000 Aboriginal and Torres Strait Islander population within the boundary of the DGP.e
2 9.4 9.4
3 9.4 9.4
4 14.1 7.1
5 14.1 7.1
ICDP workforce Role Total FTE allocated Total FTE recruited
ICDP workforce allocation and Outreach Workerc 2 0.5
156
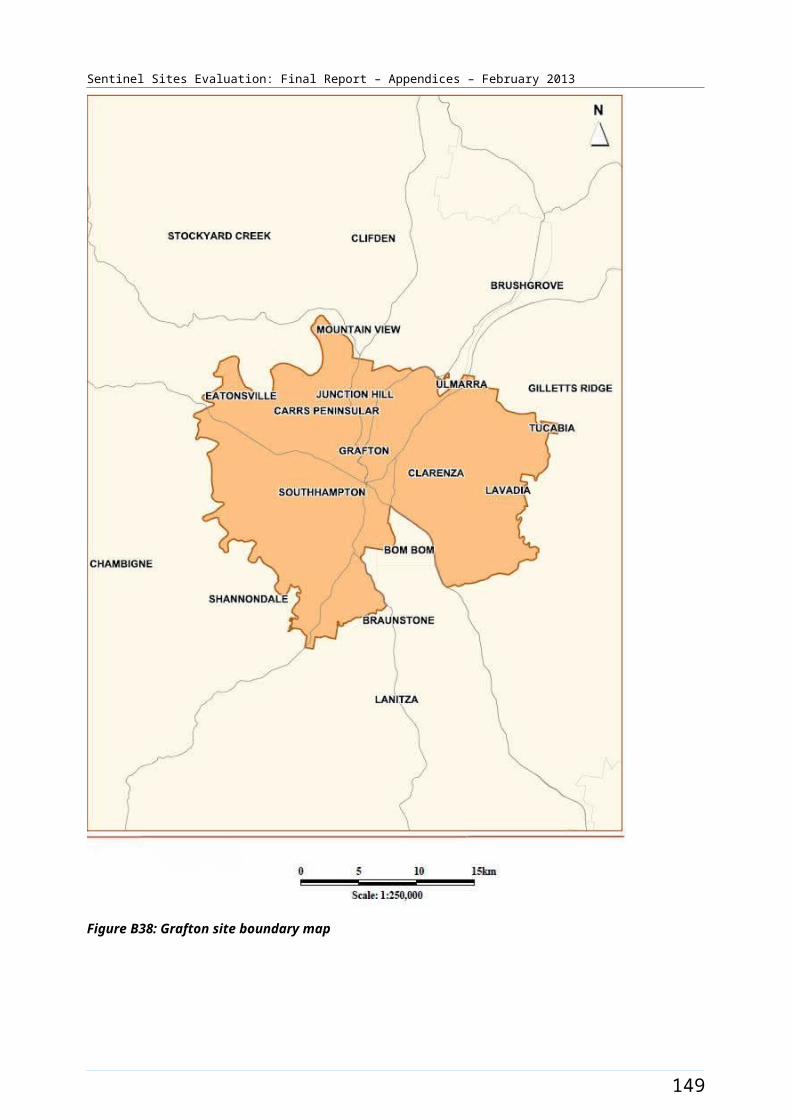
Sentinel Sites Evaluation: Final Report – Appendices – February 2013
ICDP workforce Role Total FTE allocated Total FTE recruited
recruitment (for final evaluation cycle) – positions with responsibility of covering the Sentinel Site. Actual area of responsibility may be substantially larger than the Sentinel Site.
Additional Health Staff 1.6 1.0
Practice manager 0.8 0.8
Regional Tobacco Coordinator
1 1
Tobacco Action Worker 3 1.5d
Healthy Lifestyle Worker 2 0
Care Coordinatore 1 1a Katherine West Health Board (accessed 15 October 2012). b The figures shown in the row for % of total population identified as Aboriginal and Torres Strait Islander people represent the difference in percentages between two census periods.c The DoHA data reports 2.0 FTE OWs allocated and recruited. Evaluation visit found 0.5 FTE position remained filled. d Health Promotion Coordinator and administration employed under this role. Service delivery model was under review across the region.e ICDP workforce allocation and recruitment per 10 000 Aboriginal and Torres Strait Islander population within the Sentinel Site is based on workforce allocated to and recruited by KWHB only as the DGP staff have not had a focus on the site.
157
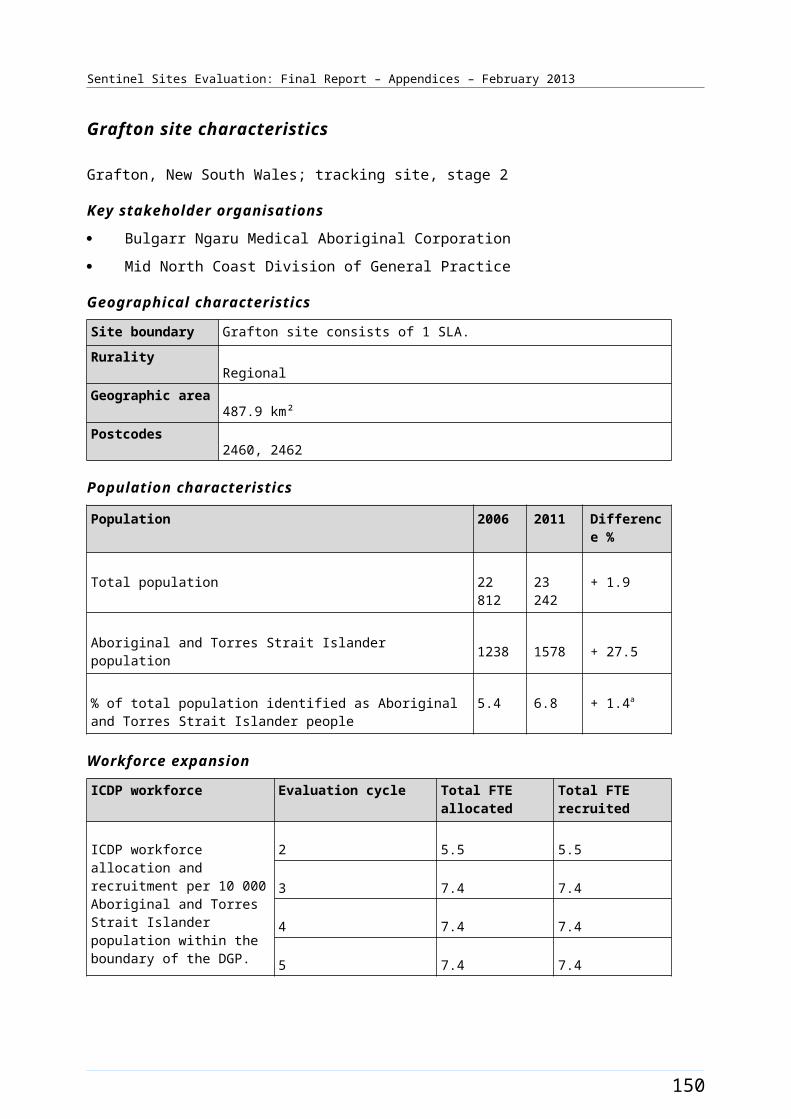
Sentinel Sites Evaluation: Final Report – Appendices – February 2013
Figure B45: ICDP funded health promotion positions, projects and events, Katherine West (March 2009 - August 2012)
158

Sentinel Sites Evaluation: Final Report – Appendices – February 2013
Figure B46: ICDP funded positions and service developments (March 2010 - August 2012) and trends in administrative data, Katherine West (March 2009 - May 2012)
Note: Please refer to the explanatory text when reviewing this figure. In particular, note that PBS Co-payment measure data refer to number of people who have had at least one prescription dispensed in each quarter per 100 Aboriginal and Torres Strait Islander people in the site. The PBS Co-payment measure data have been divided by four to facilitate comparison with other data shown in the figure.
159

Sentinel Sites Evaluation: Final Report – Appendices – February 2013
Logan/Woodridge [Case study site]
The Logan/Woodridge site covered the outer suburbs to the south of the city of Brisbane (and was adjacent to and south of the Brisbane South site) (Figure B47). The site covered 17 SLAs with a total population of about 173 300 in 2006 and 186 300 in 2011 (Table B27).
Between 2006 and 2011 the Aboriginal and Torres Strait Islander population increased by about 24% (a population of about 4400 increasing to 5400 respectively). Approximately 2.5% of the total site population identified as Aboriginal and Torres Strait Islander people in the 2006 Census. The 2011 Census showed this increasing by about 0.4% to approximately 2.9% identifying in 2011 (Table B27).
Health Service organisations and other key site characteristics and service developments
The key stakeholder organisations included a DGP (South East Primary Health Care Network), an AHS (Aboriginal and Torres Strait Islander Community Health Service Brisbane Ltd.) and the Institute for Urban Indigenous Health (IUIH). The IUIH provided support for Aboriginal and Torres Strait Islander Health Service development and coordination of health service delivery in South East Queensland, and also aimed to support effective implementation of COAG Closing the Gap initiatives and other strategic development in the region.94 There were a number of A Measure ICDP positions allocated to the IUIH whose area of responsibility included the region of the Logan/Woodridge site.
The area covered by the DGP now falls within the region covered by the Greater Metro South Brisbane Medicare Local, which commenced 1 July 2011.95
The AHS main office was located close to the Brisbane CBD, and outside the site boundary. The AHS had also operated a branch office health centre in Logan within the site area for some years. The services at the branch office were expanded with the opening of a new facility within the site, just prior to the start of the evaluation.96
There were a number of General Practices and one public hospital within the site boundary. A GP super clinic, Brisbane Southside GP Super Clinic, was established in the site around September 2011. This clinic operated two self-contained clinics, at Annerley (outside the site boundary) and at Meadowbrook (within the site boundary).
Within the Logan/Woodridge site area there was some increase in late 2012 in the number of SLAs classed as district of workforce shortage for GPs (from 9/17 SLAs in April 2012 to 11/17 SLAs in October 2012).97
The AHS participated in both the Healthy for Life and QUMAX programs.
Local Community Campaign to Promote Better Health activity occurred in the site during the evaluation (Chapter 4, Table 4.1). A community health day was held in the Woodridge community on 24 March 2012 and a Mental Health Expo was held at the Loganlea State High School on 14 October 2011. The Work it Out program was a rehabilitation and education program for chronic disease patients at Woodridge run through the AHS that started in December 2011. Two additional events The Murri Big
94 IUIH Vision/Mission [website] (accessed 5 November 2012).95 DoHA, My Medicare Local [website], op. cit. 96 ATSICH Brisbane (accessed 19 October 2012). 97 DoHA, Doctor Connect [website], op. cit.
160
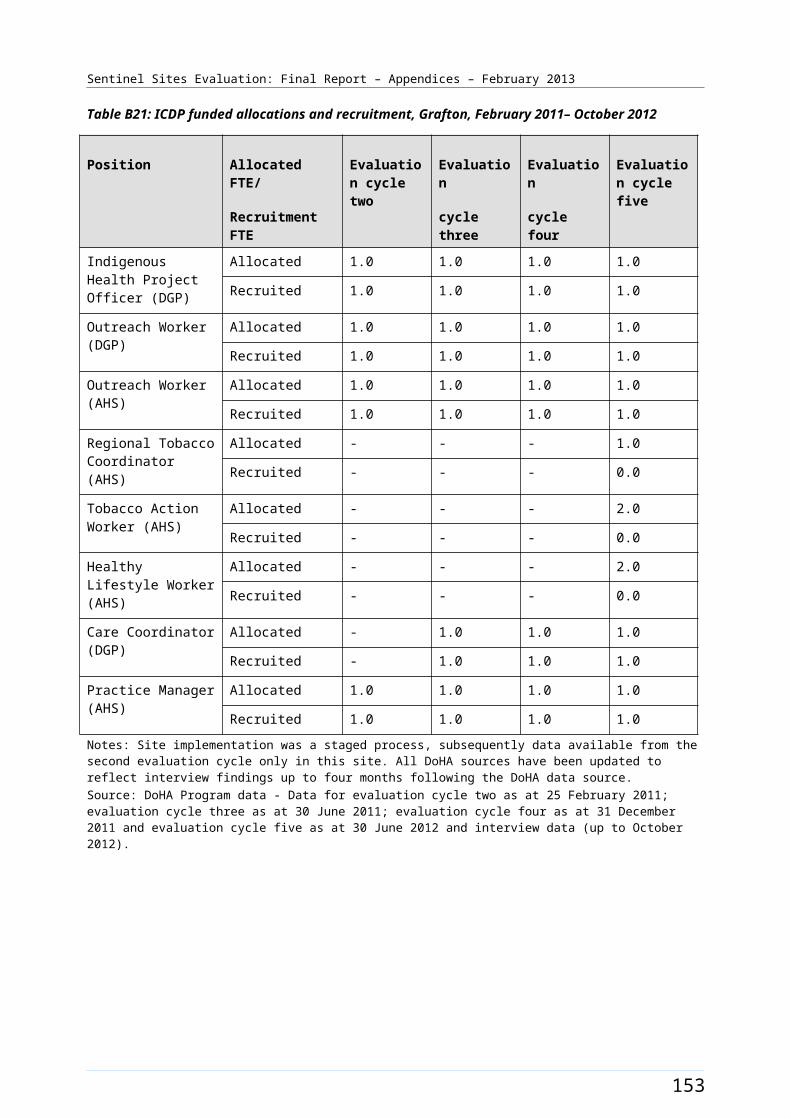
Sentinel Sites Evaluation: Final Report – Appendices – February 2013
Bash and The Murri Knockout Carnival (both run through the IUIH) were also held, targeting community members from Logan/Woodridge as well as those from other areas in South East Queensland. The timing of events and activities is depicted in Figure B48.
Workforce expansion
Workforce allocations for the Regional Tackling Smoking and Healthy Lifestyle teams (based at the IUIH) were filled during the evaluation which amounted to a team of 12 positions. This included three TAW positions, one RTC position, four HLW positions, three trainee HLW positions and a HLW team manager position. This team’s area of responsibility was all of South East Queensland, which included the Logan/Woodridge site. The IUIH team’s area of responsibility also included two other Sentinel Sites: Brisbane South and North Lakes/Caboolture. The TAW position 1 was filled from the March – May 2011 quarter until the end of the evaluation. It had two incumbents during this time. The TAW position 2 was filled from the December 2011 - February 2012 quarter and the TAW position 3 was filled from the March – May 2012 quarter. The HLW position 1 was filled from the June – August 2010 quarter, the position 2 was filled from the March – May 2011 quarter and positions 3 and 4 were filled from the June – August 2012 quarter. The HLW trainee position 1 had two incumbents. It was filled from the March – May 2011 quarter for twelve months, with a new incumbent commencing from June – August 2012. The HLW trainee position 2 was filled from March – May 2011 until June – August 2011, and again from June – August 2012. It had two incumbents over this time. The HLW position 3 was filled from June – August 2012. The HLW team manager position was filled from June – August 2010 and remained filled at the end of the evaluation. The pattern of recruitment for these allocations throughout the SSE is depicted in Figure B48.
Workforce allocations for two OW positions at the AHS had been filled during the evaluation (filled during the September – November 2010 quarter). An allocation (0.5 FTE) for a Care Coordinator position through the IUIH, which commenced in the latter part of the evaluation, was also filled (filled during the June – August 2012 quarter). Allocations for one OW and one IHPO position at the DGP had also been filled (both positions filled during the March – May 2010 quarter. The pattern of recruitment to these allocations, where they had direct responsibility for the site, together with trends in the uptake of various measures (as reflected by administrative data) throughout the SSE, is shown in Figure B49.
161
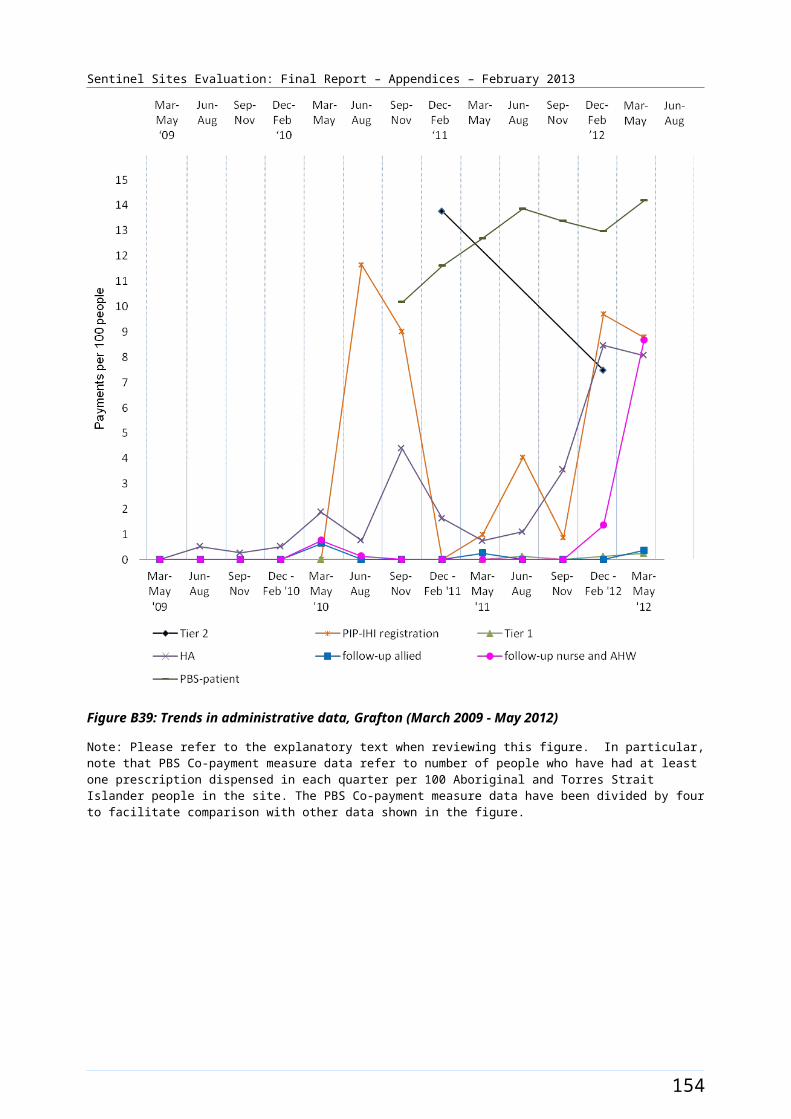
Sentinel Sites Evaluation: Final Report – Appendices – February 2013
Figure B47: Logan/Woodridge site boundary map
162
Sentinel Sites Evaluation: Final Report – Appendices – February 2013
Logan/Woodridge site characteristics
Logan/Woodridge, Queensland; case study site, stage 2
Key stakeholder organisations
Aboriginal and Torres Strait Islander Community Health Service Brisbane Ltd.
South East Primary Health Care Network
Institute for Urban Indigenous Health
Geographical characteristics
Site boundary There are 17 SLA within the Sentinel Site.Community focus groups were held in Woodridge.
RuralityUrban
Geographic area251.4 km²
Postcodes4114, 4117, 4118, 4119, 4123, 4124, 4127, 4128, 4129, 4130, 4131, 4132, 4133
Population characteristics
Population 2006 2011 Difference %
Total population 173 269 186 265 + 7.5
Aboriginal and Torres Strait Islander population 4376 5437 + 24.2
% of total population identified as Aboriginal and Torres Strait Islander people
2.5 2.9 + 0.4a
Workforce expansion
ICDP workforce Evaluation cycle Total FTE allocated Total FTE recruited
ICDP workforce allocation and recruitment per 10 000 Aboriginal and Torres Strait Islander population within the boundary of the DGP.
2 6.6 6.6
3 6.6 6.6
4 6.6 6.6
5 7.4 7.4
ICDP workforce Role Total FTE allocated Total FTE recruited
ICDP workforce allocation and recruitment (for final evaluation cycle) – positions with responsibility of covering the
Indigenous Health Project Officer
1 1
Outreach Workerb 3 3
163
Sentinel Sites Evaluation: Final Report – Appendices – February 2013
ICDP workforce Role Total FTE allocated Total FTE recruited
Sentinel Site. Actual area of responsibility may be substantially larger than the Sentinel Site.
Regional Tobacco Coordinator
2c 2c
Tobacco Action Worker 5c 4c
Healthy Lifestyle Worker 4c 4c
Care Coordinator 0.5 0.5d
164

Sentinel Sites Evaluation: Final Report – Appendices – February 2013
General Practitioner characteristics for the whole Division of General Practice
Total number of General Practices87
Proportion of practices which are solo GP practices13%
Full-time working equivalent GP: population 2010 ratio1000
a The figures shown in the row for % of total population identified as Aboriginal and Torres Strait Islander people represent the difference in percentages between two census periods.b The Outreach Workers are based at AHS and the Medicare Local. There are 4 OWs allocated to the AHS; only 2 OWs with responsibility for Logan/Woodridge.c The IUIH have a team of 11 Regional Tackling Smoking and Healthy Lifestyle workers that cover all of SE QLD. The same workers are attributed for three Sentinel Sites around Brisbane. d New allocation through IUIH since previous evaluation cycle.
165
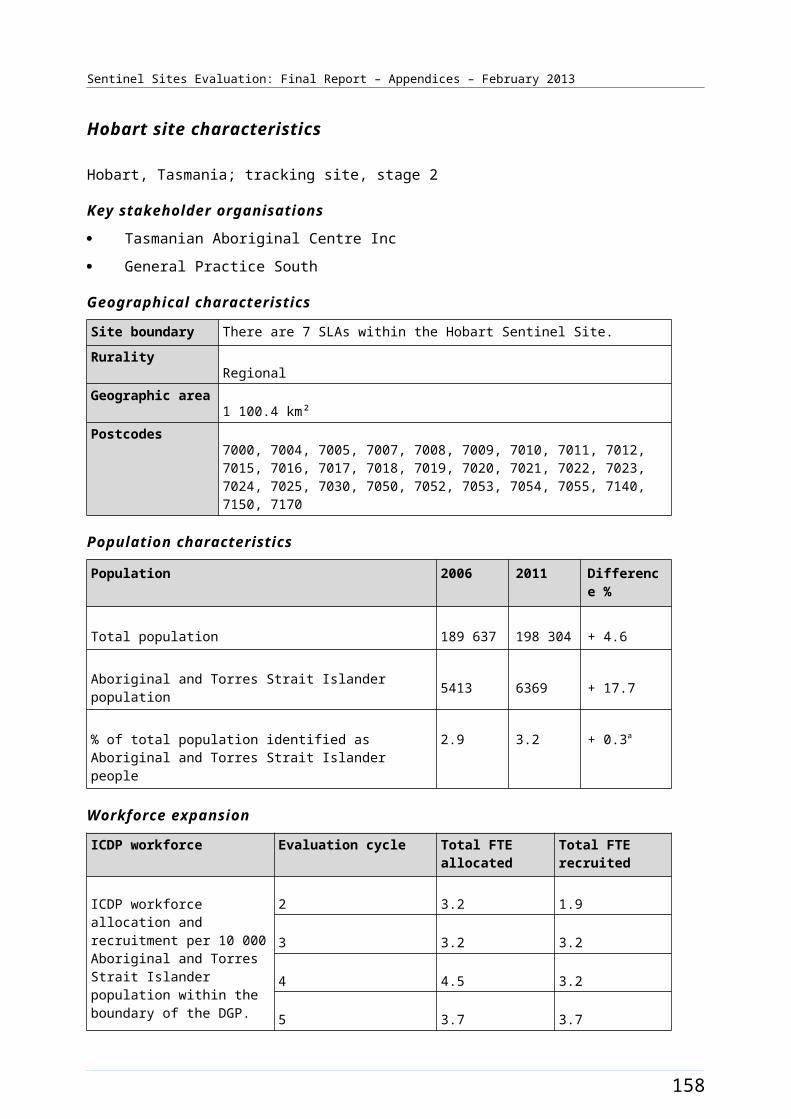
Sentinel Sites Evaluation: Final Report – Appendices – February 2013
Figure B48: ICDP funded health promotion positions, projects and events, Logan/Woodridge (March 2009 - August 2012)
166
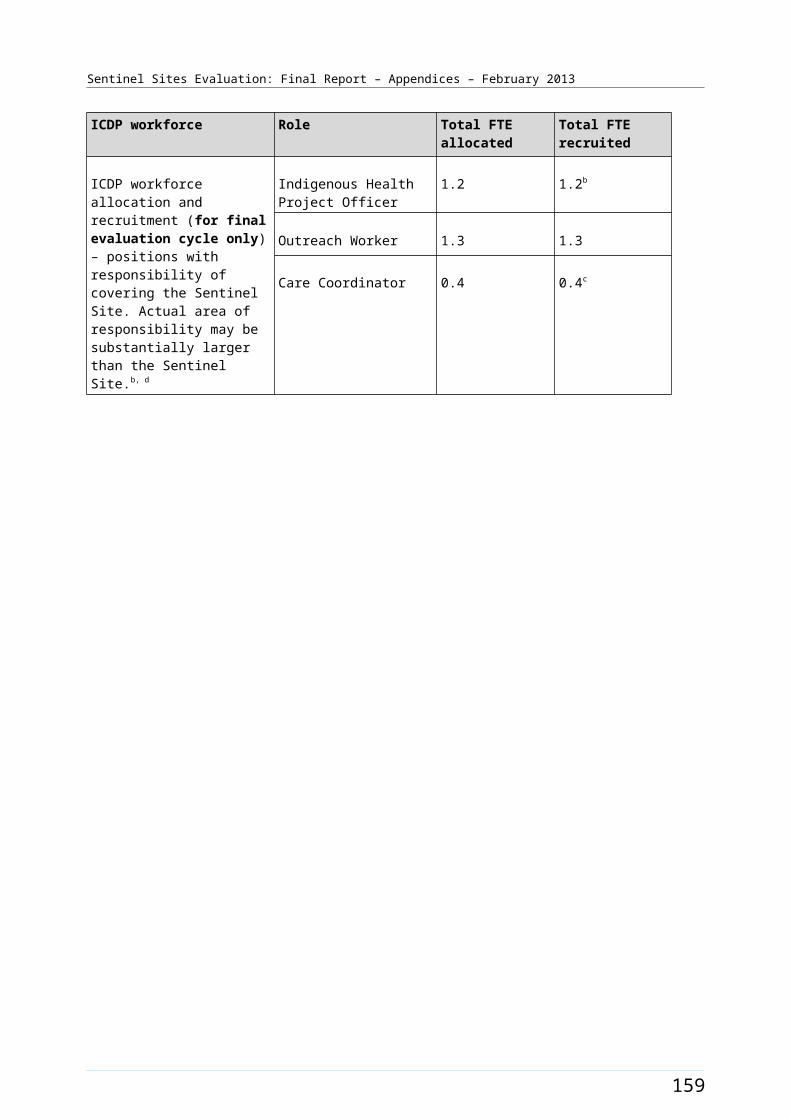
Sentinel Sites Evaluation: Final Report – Appendices – February 2013
Figure B49: ICDP funded positions and service developments (March 2010 - August 2012) and trends in administrative data, Logan/Woodridge (March 2009 - May 2012)
Note: Please refer to the explanatory text when reviewing this figure. In particular, note that PBS Co-payment measure data refer to number of people who have had at least one prescription dispensed in each quarter per 100 Aboriginal and Torres Strait Islander people in the site. The PBS Co-payment measure data have been divided by four to facilitate comparison with other data shown in the figure. The PIP Indigenous Health Incentive data for this site does not included AHS data.
167

Sentinel Sites Evaluation: Final Report – Appendices – February 2013
Newcastle [Enhanced tracking site]
The Newcastle site covered the urban areas and the inner regional areas of greater Newcastle (Figure B50). The site encompassed one Statistical Subdivision, comprising nine SLAs, with a total population of about 493 500 people in 2006 and 520 700 in 2011 (Table B28). The City of Newcastle itself was situated about 160 kms north of Sydney and had a population of almost 150 000 people in 2011.98
Between 2006 and 2011, the Aboriginal and Torres Strait Islander population increased by about 36% (a population of about 12 300 increasing to 16 700 respectively) (Table B28). Approximately 2.5% of the total site population identified as Aboriginal and Torres Strait Islander people in the 2006 Census. The 2011 Census showed an increase of approximately 0.7% with about 3.2% identifying in 2011 (Table B28).
Health Service organisations and other key site characteristics and service developments
The DGP (GP Access previously known as the Hunter Urban DGP) and the AHS (Awabakal Newcastle Aboriginal Cooperative Ltd) were located within the site boundary and were key stakeholder organisations. Part of the site (the SLA of Cessnock, with a population of about 50 000, 3.6% Aboriginal and Torres Strait islander in 2006) lay within the boundaries of a neighbouring DGP, originally the Hunter Rural DGP. This area, as well as the site, now falls within the region covered by the Hunter Medicare Local, which expanded its operations to include the Hunter Rural Medicare Local catchment region in 2012.99
In addition to the AHS, there were two GP super clinics, (Nelson Plaza Clinic – Port Stephens Super Clinic Nelson Bay, which began operating on 3 May 2010,100 and Lake Macquarie GP Super Clinic New South Wales, which opened December 2010), and a number of General Practices within the site boundary. There were nine hospitals within the site.
The majority of the Newcastle site boundary area was classed as a district of workforce shortage for GPs during 2012, based on the information accessed in November 2012; however, part of the site area, Newcastle (C) – Inner City SLA, was not classed as a district of workforce shortage in this period.101
The AHS was participating in the QUMAX program.
Local Community Campaign to Promote Better Health activity occurred in the site during the evaluation (Chapter 4, Table 4.1). The Awabakal Newcastle Aboriginal Cooperative Healthy Community Day was held 4 June 2011, and included live performance for hip hop bands and an Aboriginal theatre company. The importance of nutrition to live longer was promoted as a major focus of the event. The Lost and Found in the Smoke grant program commenced in June 2011. This was an anti-smoking play that travelled around the Hunter Newcastle region and then to Tasmania later in the evaluation, with plans for Western Australia. The Karuah Youth Music Festival was held in June 2011. The timing of these events and activities is depicted in Figure B51.
98 The City of Newcastle Council [website] (accessed 30 October 2012). 99 DoHA, My Medicare Local [website], op. cit. 100 DoHA GP Super Clinics [website], op. cit. 101 DoHA, Doctor Connect [website], op. cit.
168
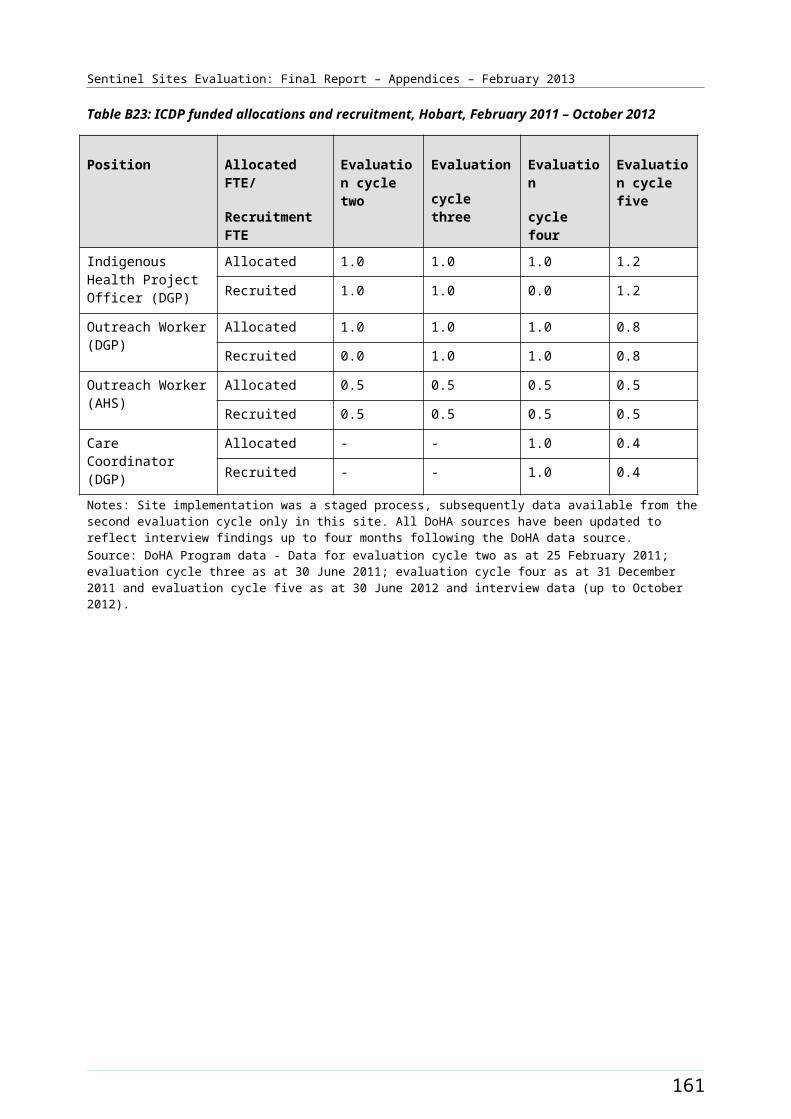
Sentinel Sites Evaluation: Final Report – Appendices – February 2013
Workforce expansion
Workforce allocations for the Regional Tackling Smoking and Healthy Lifestyle team were filled during the evaluation period. The allocations included up to three TAW positions, one RTC and two HLW positions. One full-time TAW allocation, as well as the RTC and HLW allocations were all filled during the June – August 2011 quarter. The pattern of recruitment to these positions throughout the SSE is shown in Figures B51.
A workforce allocation for one OW position at the AHS had been filled during the evaluation period. Allocations for full-time OW and IHPO positions at the DGP had also been filled. Both positions were filled during the March – May 2011 quarter and had had two incumbents during the evaluation period. A Care Coordinator allocation, also at the DGP (1.9 FTE), was also filled. The Care Coordinator position 1 was filled during the June – August 2011 quarter and the position 2 was filled from the March – May 2012 quarter. The pattern of recruitment to these allocations; where they had direct responsibility for the site, together with trends in the uptake of various measures (as reflected by administrative data) throughout the SSE, is shown in Figure B52.
169
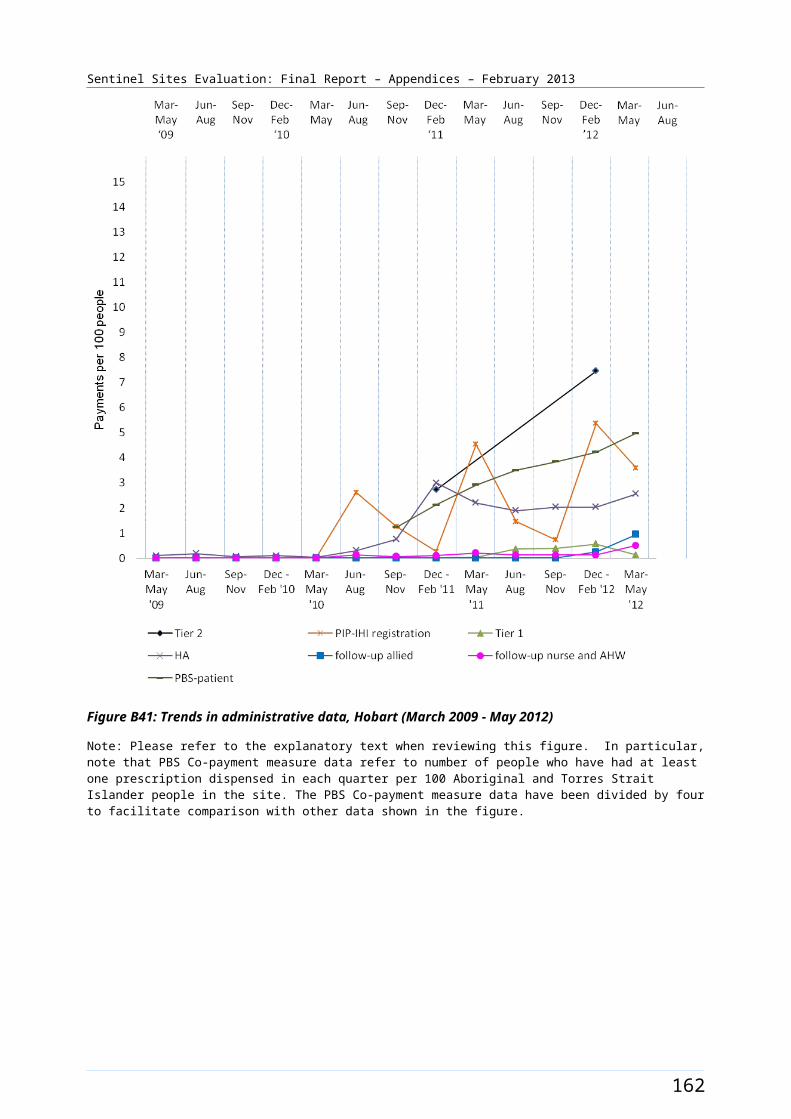
Sentinel Sites Evaluation: Final Report – Appendices – February 2013
Figure B50: Newcastle site boundary map
170
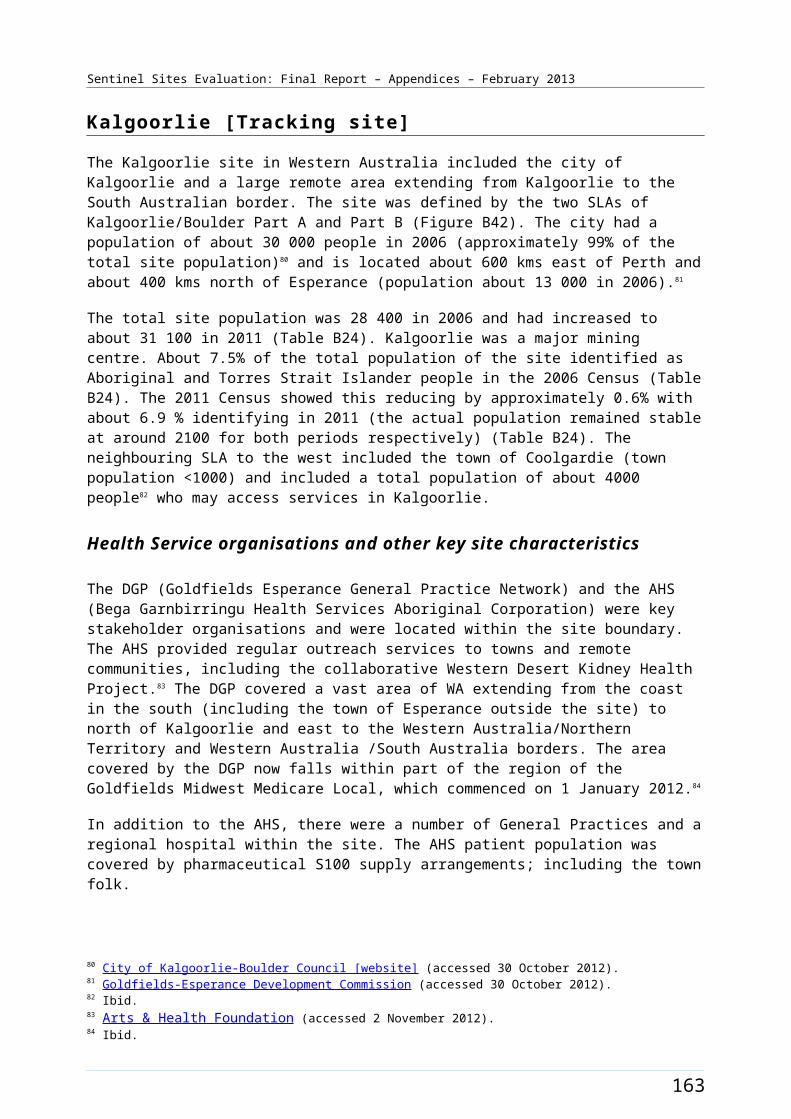
Sentinel Sites Evaluation: Final Report – Appendices – February 2013
Newcastle site characteristics
Newcastle, New South Wales; enhanced tracking site, stage 1
Key stakeholder organisations
Awabakal Newcastle Aboriginal Cooperative Ltd
GP Access (previously known as Hunter Urban Division of General Practice)
Geographical characteristics
Site boundary Newcastle site covers 1 Statistical Subdivision comprising a total of 9 SLAs cover the Sentinel Site boundaries for Newcastle.
Rurality Urban
Geographic area4052.3 km²
Postcodes2264, 2265, 2267, 2278, 2280, 2281, 2282, 2283, 2284, 2285, 2286, 2287, 2289, 2290, 2291, 2292, 2293, 2294, 2295, 2296, 2297, 2298, 2299, 2300, 2302, 2303, 2304, 2305, 2306, 2307, 2308, 2314, 2315, 2316, 2317, 2318, 2319, 2320, 2321, 2322, 2323, 2324, 2325, 2326, 2327, 2334, 2335
Population characteristics
Population 2006 2011 Difference %
Total population 493 466 520 666 + 5.5
Aboriginal and Torres Strait Islander population 12 285 16 666 + 35.7
% of total population identified as Aboriginal and Torres Strait Islander people
2.5 3.2 + 0.7a
Workforce expansion
ICDP workforce Evaluation cycle Total FTE allocated Total FTE recruited
ICDP workforce allocation and recruitment per 10 000 Aboriginal and Torres Strait Islander population within the boundary of the DGP
2 2.9 2.9
3 3.8 3.8
4 4.7 3.8
5 4.7 4.7
ICDP workforce Role Total FTE allocated Total FTE recruited
ICDP workforce allocation and recruitment (for final evaluation cycle) – positions with responsibility of covering
Indigenous Health Project Officer
1 1
Outreach Worker 2 2
171
Sentinel Sites Evaluation: Final Report – Appendices – February 2013
ICDP workforce Role Total FTE allocated Total FTE recruited
the Sentinel Site. Actual area of responsibility may be substantially larger than the Sentinel Site.
Regional Tobacco Coordinator
1 1
Tobacco Action Worker 3 1
Health Lifestyle Worker 2 2
Care Coordinator 1.9 1.9
172
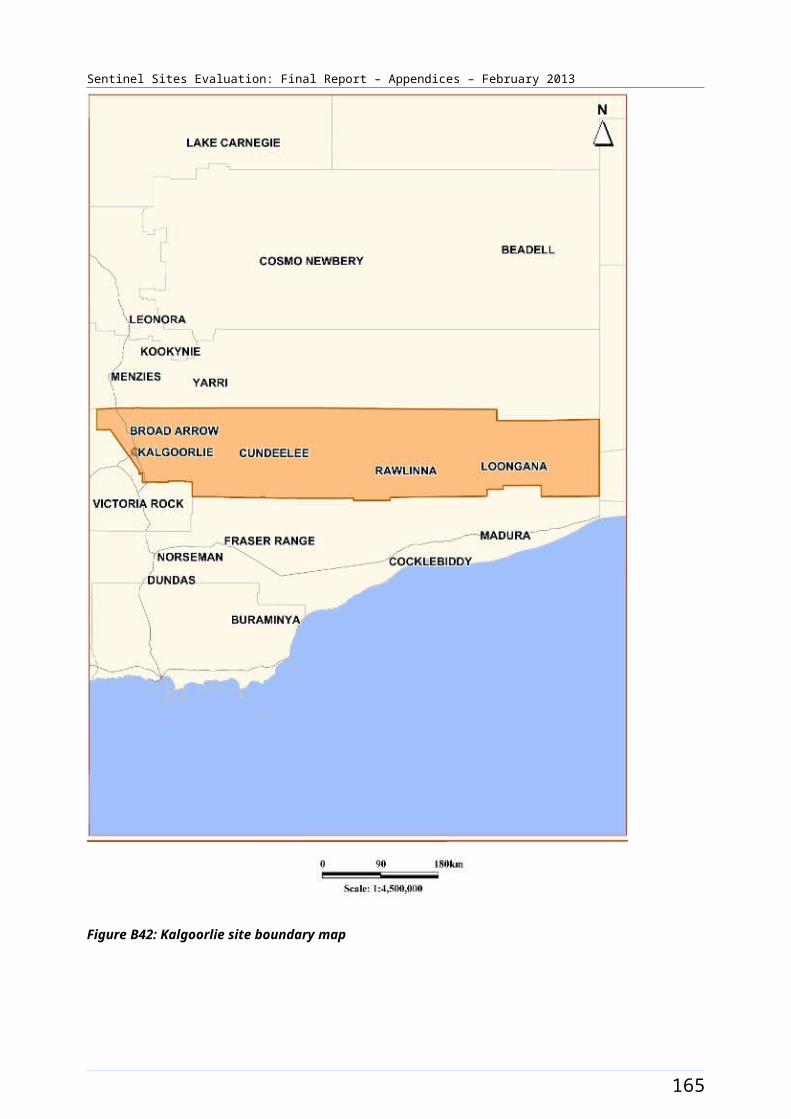
Sentinel Sites Evaluation: Final Report – Appendices – February 2013
GP characteristics for the whole Division of General Practice
Total number of General Practices152
Proportion of practices which are solo GP practices35%
Full-time working equivalent GP: population 2010 ratio1154
a The figures shown in the row for % of total population identified as Aboriginal and Torres Strait Islander represent the difference in percentages between two census periods.
173

Sentinel Sites Evaluation: Final Report – Appendices – February 2013
Figure B51: ICDP funded health promotion positions, projects and events, Newcastle (March 2009 - August 2012)
174

Sentinel Sites Evaluation: Final Report – Appendices – February 2013
Figure B52: ICDP funded positions and service developments (March 2010 - August 2012) and trends in administrative data, Newcastle (March 2009 - May 2012)
Note: Please refer to the explanatory text when reviewing this figure. In particular, note that PBS Co-payment measure data refer to number of people who have had at least one prescription dispensed in each quarter per 100 Aboriginal and Torres Strait Islander people in the site. The PBS Co-payment measure data have been divided by four to facilitate comparison with other data shown in the figure.
175
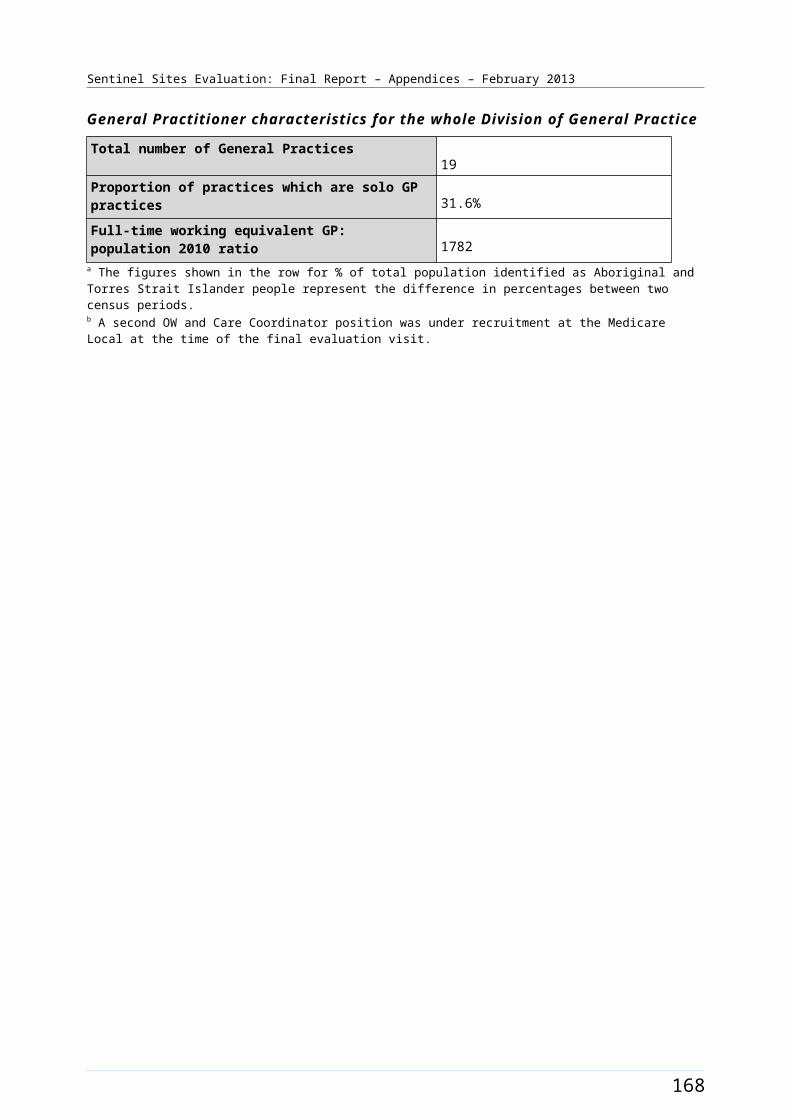
Sentinel Sites Evaluation: Final Report – Appendices – February 2013
North Lakes/Caboolture [Tracking site]
The North Lakes/Caboolture site extended from the northern suburbs of Brisbane city into the rural area to the north, including the town of Caboolture (Figure B53). The town is approximately 44 kms north of Brisbane CBD and had an estimated population of almost 55 000 in 2006.102
The site covered 15 SLAs and had a total population of about 216 300 in 2006 increasing to about 257 300 in 2011 (Table B29). Between 2006 and 2011 the Aboriginal and Torres Strait Islander population increased by about 48% (a population of about 4700 increasing to 6900 respectively). Approximately 2.2% of the total site population identified as Aboriginal and Torres Strait Islander in the 2006 Census. The 2011 Census showed this increasing by about 0.5% to approximately 2.7% identifying in 2011 (Table B29).
Health Service organisations and other key site characteristics and service developments
Two DGPs (Moreton Bay General Practice Network and GP Partners) were involved as key stakeholder organisations, one located within the site boundary. The Institute for Urban Indigenous Health (IUIH) was also a key stakeholder organisation in this site.
The area covered by the site now falls within the region covered by the Metro North Brisbane Medicare Local, which commenced 1 July 2011.103
The IUIH set up an AHS clinic in the site in the 2011/12 year. Prior to this, there was no AHS in the site. A GP super clinic commenced during January 2010 in the site.104 Also within the site was a not-for-profit, Aboriginal owned and operated bulk-billing medical centre, established in July 2011.105
The majority of the SLAs within North Lakes/Caboolture site (10/15) were not classed as a district of workforce shortage for GPs during 2012, based on the information accessed in November 2012.106
There were two public hospitals and two private hospitals within the site boundary.
Local Community Campaign to Promote Better Health activity occurred in the site during the evaluation period (Chapter 4, Table 4.1). The IUIH partnered with the new Aboriginal and Torres Strait Islander Community Health Service to host an event celebrating the launch of the new service (27 August 2011). The day involved a range of healthy activities and aimed to encourage kids to get active. The Murri Teilah Medical Service developed ‘passports’ for kids from a local state school to help them at the Live Right, Live Longer healthy community day (held 14 September 2011) hosted by the service. The ‘passports’ were designed to help them work through a range of educational activities aimed at increasing their awareness of the risk factors for chronic disease.
Workforce expansion
Workforce allocations for the Regional Tackling Smoking and Healthy Lifestyle teams (based at the IUIH) were filled during the evaluation, which amounted to a team of 12 positions. This included three TAW 102 Profile ID Community Profile (Moreton Bay Regional Council [website] (accessed 13 November 2012).103 DoHA, My Medicare Local [Website], op. cit. 104 Strathpine GP Super Clinic [website] (accessed 24 October 2012).105 Murri Teileah Medical [website] (accessed 10 October 2012).106 DoHA, Doctor Connect [website], op. cit.
176
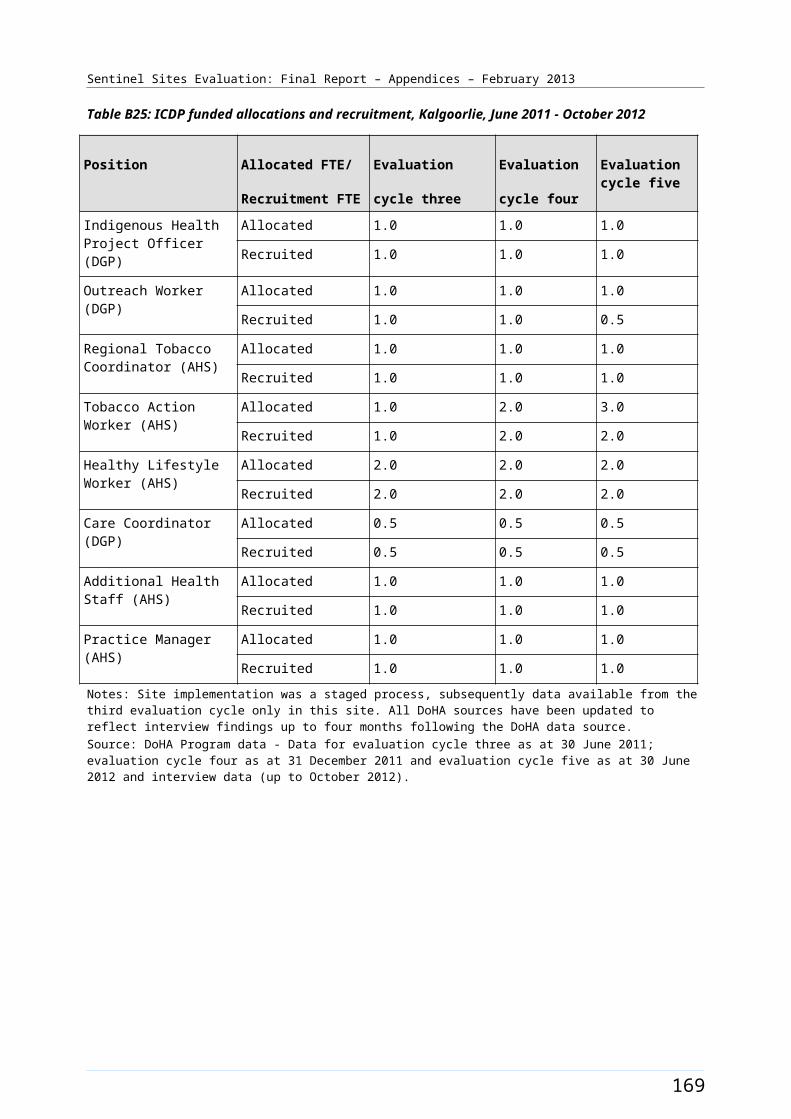
Sentinel Sites Evaluation: Final Report – Appendices – February 2013
positions, one RTC position, four HLW positions, three trainee HLW positions and a HLW team manager position. This team’s area of responsibility was all of South East Queensland, which included the North Lakes/Caboolture site. The IUIH team’s area of responsibility also included two other Sentinel Sites: Brisbane South and Logan/Woodridge. The TAW position 1 was filled from the March – May 2011 quarter until the end of the evaluation. It had two incumbents during this time. The TAW position 2 was filled from the December 2011 - February 2012 quarter and the TAW position 3 was filled from the March – May 2012 quarter. The HLW position 1 was filled from the June – August 2010 quarter, the position 2 was filled from the March – May 2011 quarter and positions 3 and 4 were filled from the June – August 2012 quarter. The HLW trainee position 1 had two incumbents. It was filled from the March – May 2011 quarter for 12 months, with a new incumbent commencing from June – August 2012. The HLW trainee position 2 was filled from March – May 2011 until June – August 2011, and again from June – August 2012. It had two incumbents over this time. The HLW position 3 was filled from June – August 2012. The HLW Team Manager position was filled from June – August 2010 and remained filled at the end of the evaluation period. The pattern of recruitment for these allocations throughout the SSE is depicted in Table B30.
A workforce allocation for a Practice Manager position, which was funded through the IUIH, had been filled towards the end of the evaluation period (during the evaluation cycle five). Allocations for two OW positions at the DGPs as well as two IHPO positions had also been filled (during evaluation cycle three). Two Care Coordinator allocations had also been filled towards the end of the evaluation (during the fourth Evaluation cycle). The pattern of recruitment to these allocations throughout the SSE is shown in Table B30.
The trends in administrative data for North Lakes/Caboolture are displayed in Figure B54.
177
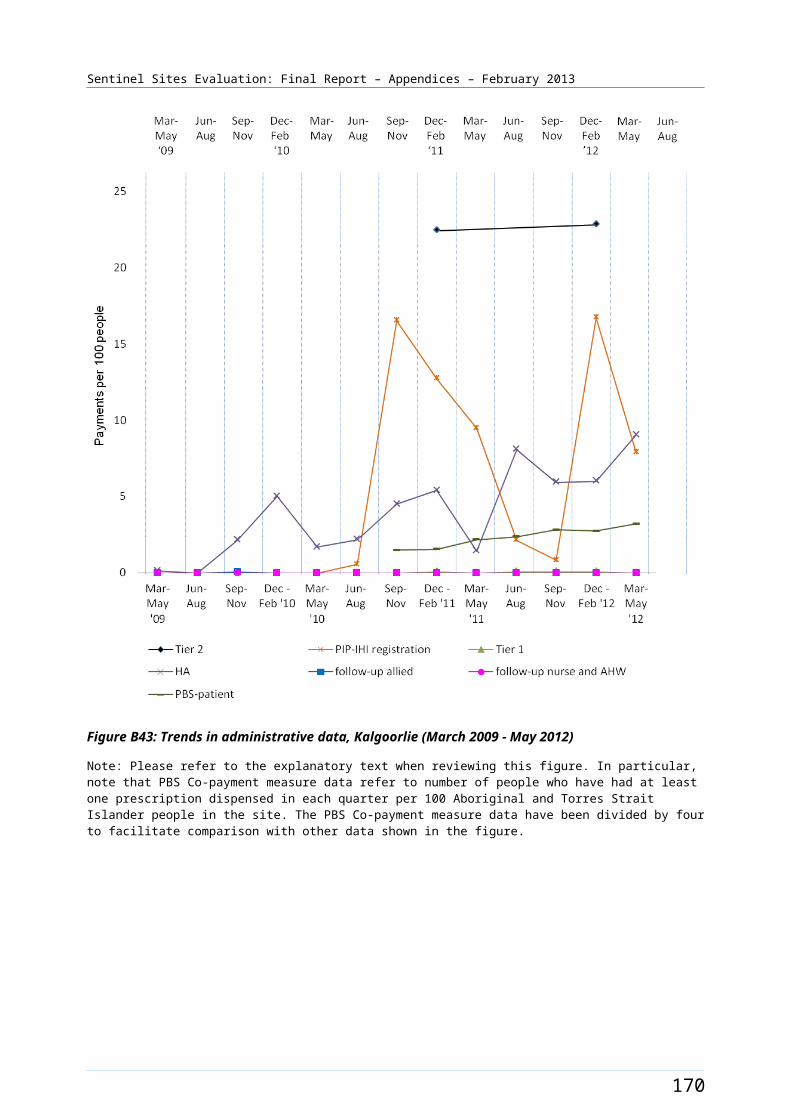
Sentinel Sites Evaluation: Final Report – Appendices – February 2013
Figure B53: North Lakes/Caboolture site boundary map
178
Sentinel Sites Evaluation: Final Report – Appendices – February 2013
North Lakes/Caboolture site characteristics
North Lakes/Caboolture, Queensland; tracking site, stage 2
Key stakeholder organisations
Institute for Urban Indigenous Health
Moreton Bay General Practice Network
GP Partners
Geographical characteristics
Site boundary There are 15 SLAs within the Sentinel Site.
Rurality Urban
Geographic area459.4 km²
Postcodes4019, 4020, 4021, 4022, 4500, 4501, 4502, 4503, 4504, 4505, 4506, 4508, 4509, 4510, 4511
Population characteristics
Population 2006 2011 Difference %
Total population 216 349 257 311 + 18.9
Aboriginal and Torres Strait Islander population 4682 6911 + 47.6
% of total population identified as Aboriginal and Torres Strait Islander people
2.2 2.7 + 0.5a
Workforce expansion
ICDP workforce Evaluation cycle Total FTE allocated Total FTE recruited
ICDP workforce allocation and recruitment per 10 000 Aboriginal and Torres Strait Islander population within the boundary of the DGP.
2 - -
3 3.6 3.6
4 5.4 4.5
5 5.4 5.4
ICDP workforce Role Total FTE allocated Total FTE recruited
ICDP workforce allocation and recruitment (for final evaluation cycle) – positions with responsibility of covering the
Indigenous Health Project Officer
2 2b
Outreach Worker 2 2
179
Sentinel Sites Evaluation: Final Report – Appendices – February 2013
ICDP workforce Role Total FTE allocated Total FTE recruited
Sentinel Site. Actual area of responsibility may be substantially larger than the Sentinel Site.
Practice Manager 1 1c
Regional Tobacco Coordinator
2 2d
Tobacco Action Worker 5 4d
Healthy Lifestyle Worker 4 4d
Care Coordinator 2 2
GP characteristics for the whole Division of General Practice e
Total number of General Practices267
Proportion of practices which are solo GP practices24%
Full-time working equivalent GP: population 2010 ratio1110
a The figures shown in the row for % of total population identified as Aboriginal and Torres Strait Islander people represent the difference in percentages between two census periods.b IUIH received contract to manage 2 IHPOs and 2 OWs from Brisbane Metro North Medicare Local (BMNML) since the middle of financial year 2011-2012 to cover north side of Brisbane (North Lakes/Caboolture Sentinel Site).c The IUIH ICDP funded practice manager is positioned in this site.d The IUIH have a team of 12 Regional Tackling Smoking and Healthy Lifestyle workers that cover all of SE QLD. The same workers are attributed for three Sentinel Sites around Brisbane.e Moreton Bay General Practice Network is no longer part of the site with new Medicare Local. Position arrangements occurred since previous report with Medicare Local formation.
180

Sentinel Sites Evaluation: Final Report – Appendices – February 2013
Table B30: ICDP funded allocations and recruitment, North Lakes/Caboolture, June 2011 - October 2012
Position Allocated FTE/
Recruitment FTE
Evaluation
cycle three
Evaluation
cycle four
Evaluation cycle five
Indigenous Health Project Officer (DGP)
Allocated 2.0 4.0 2.0
Recruited 2.0 2.0 2.0
Outreach Worker (DGP) Allocated 2.0 2.0 2.0
Recruited 2.0 1.0 2.0
Regional Tobacco Coordinator (IUIH/AHS)
Allocated 1.0 1.0 2.0
Recruited 1.0 1.0 2.0
Tobacco Action Worker (IUIH/AHS)
Allocated 1.0 2.0 5.0
Recruited 1.0 2.0 4.0
Healthy Lifestyle Worker (IUIH/AHS)
Allocated 2.0 2.0 4.0
Recruited 2.0 2.0 4.0
Care Coordinator (DGP) Allocated - 2.0 2.0
Recruited - 2.0 2.0
Practice Manager (IUIH) Allocated - - 1.0
Recruited - - 1.0
Notes: Site implementation was a staged process, subsequently data available from the third evaluation cycle only in this site. All DoHA sources have been updated to reflect interview findings up to four months following the DoHA data source.Source: DoHA Program data - Data for evaluation cycle three as at 30 June 2011; evaluation cycle four as at 31 December 2011 and evaluation cycle five as at 30 June 2012 and interview data (up to October 2012).
181
Sentinel Sites Evaluation: Final Report – Appendices – February 2013
Figure B54: Trends in administrative data, North Lakes/Caboolture (March 2009 - May 2012)
Note: Please refer to the explanatory text when reviewing this figure. In particular, note that PBS Co-payment measure data refer to number of people who have had at least one prescription dispensed in each quarter per 100 Aboriginal and Torres Strait Islander people in the site. The PBS Co-payment measure data have been divided by four to facilitate comparison with other data shown in the figure.
182
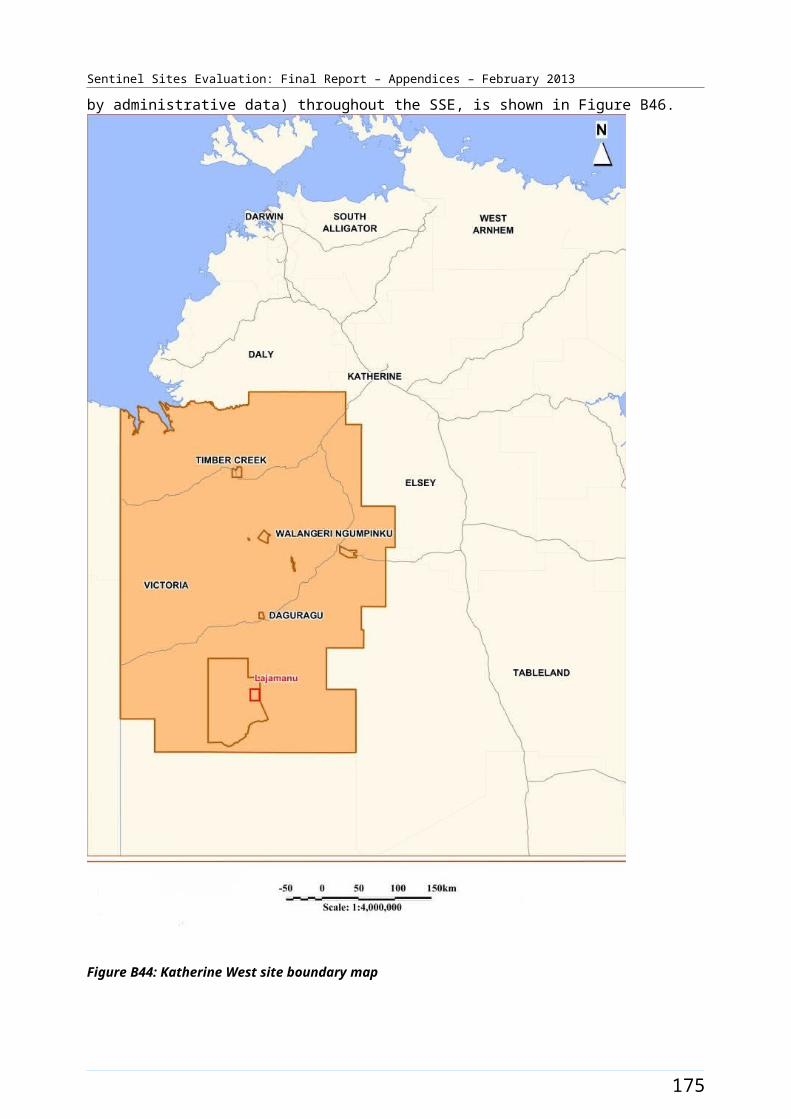
Sentinel Sites Evaluation: Final Report – Appendices – February 2013
Port Augusta [Case study site]
The Port Augusta site straddled the head of the Spencer Gulf which lies about 320 kms north of Adelaide (Figure B55). The site comprised one SLA covering the town of Port Augusta, which included a population of approximately 14 000 people in both 2006 and 2011 (Table B31).
In both the 2006 and 2011 Census, around 17% of the total site population identified as Aboriginal and Torres Strait Islander people (a population of 2300 and 2400 respectively) (Table B31).
Whyalla, the third largest city in South Australia (after Adelaide and Mount Gambier) with a population of over 20 000 in 2006, lay about 75 kms to the south west of the site.
Health Service organisations and other key site characteristics
The key stakeholder organisations in the site were the AHS (Pika Wiya Health Service Aboriginal Corporation) and the DGP (Flinders and Far North Division of General Practice). Both organisations were based in the town of Port Augusta. The DGP covered a large area extending to the north with a total population of about 28 000 people in 2010.107 The Port Augusta site now falls within the region of the Country North SA Medicare Local which commenced on 1 July 2011.108
The AHS transitioned from being a state-managed service to a community-controlled Health Service in July 2011. The AHS runs four clinics located in Port Augusta, Davenport, Copley and Nepabunna. The last two clinics sat outside the site boundaries. A state-funded GP/Medical Director was based at the AHS 0.6 FTE from about mid 2012. The site was also serviced by several General Practices and a state-funded Community Health Service. There was a regional hospital in the site that had an existing visiting specialist service.
A high proportion of international medical graduates are placed in Port Augusta. There was a history of partnerships between the AHS and the DGP for program delivery.109
Port Augusta was not classed as a district of workforce shortage for GPs during 2012, based on the information accessed in April 2012 and October 2012.110
The AHS participated in the Healthy for Life program and QUMAX.
A Regional Tackling Smoking and Healthy Lifestyle Program commenced in the site in July 2012, with the transfer from state to ICDP funding in July 2012.
107 PHCRIS [website] (accessed 6 November 2012).108 DoHA, My Medicare Local [website], op. cit. 109 Flinders and Far North Division of General Practice [website] (accessed 5 October 2012).110 DoHA, Doctor Connect [website], op. cit.
183
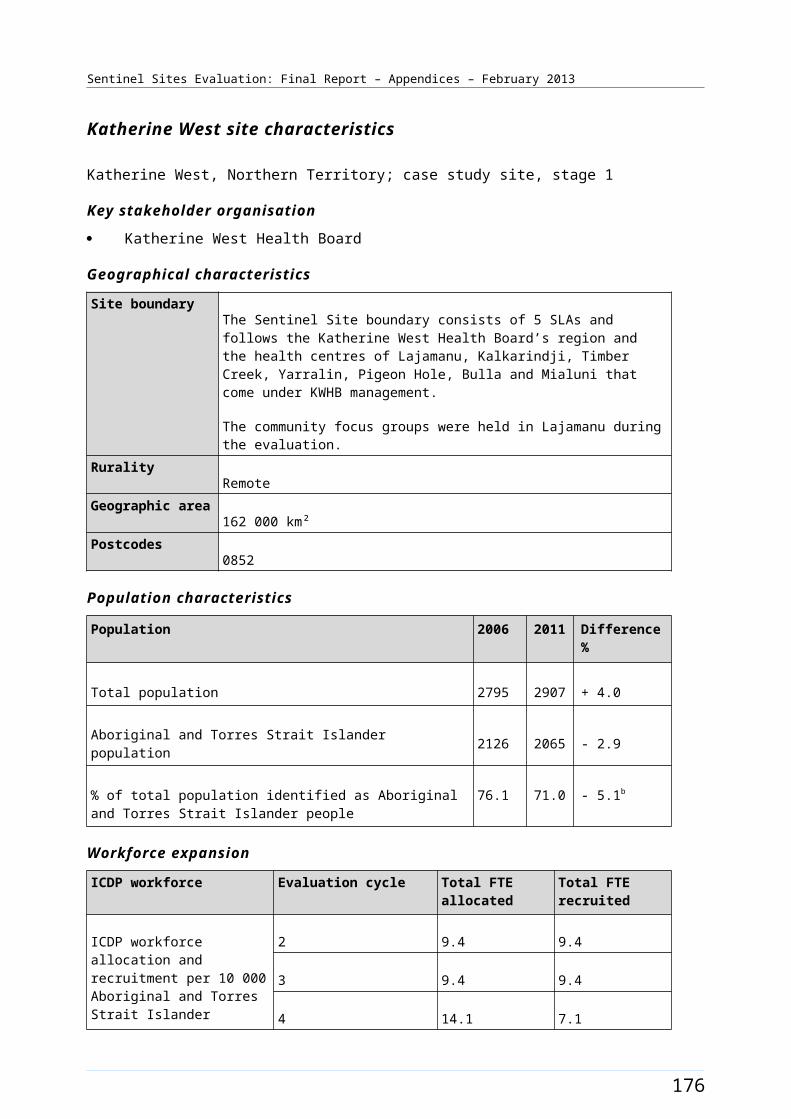
Sentinel Sites Evaluation: Final Report – Appendices – February 2013
Workforce expansion
Workforce allocations for the Regional Tackling Smoking and Healthy Lifestyle team were partly filled during the evaluation period. The allocations included three TAW, one RTC and two HLW positions. The RTC position was filled during the June – August 2011 quarter and used to employ a coordinator for the Port Augusta Regional Tackling Smoking and Healthy Lifestyle program; which originally was a state-based program but transferred to Commonwealth ICDP funding from 1 July 2012. The RTC was located at the Flinders Terrace Health Centre, as would further staff when recruited. A Regional Tackling Smoking and Healthy Lifestyle project commenced in July 2012 in the site, and staff for the TAW and HLW positions were being recruited during the end of the evaluation period. The pattern of recruitment to these allocations throughout the SSE is shown in Figure B56.
184
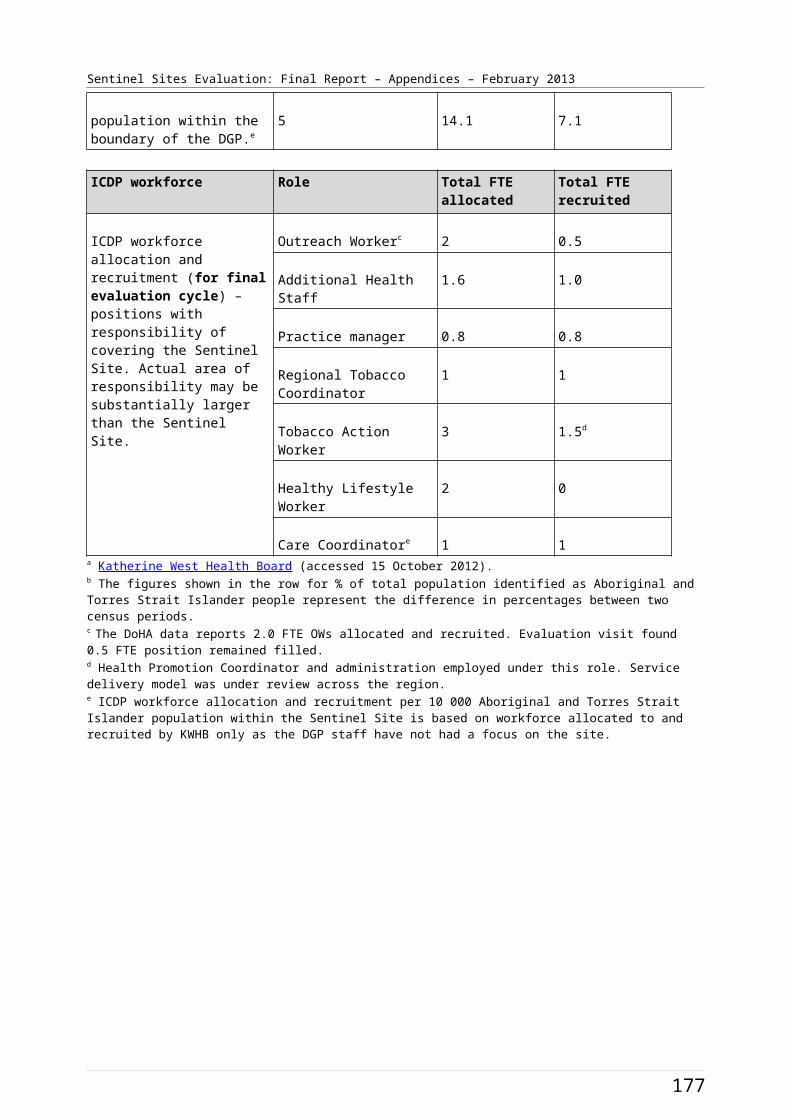
Sentinel Sites Evaluation: Final Report – Appendices – February 2013
A workforce allocation for one OW position at the AHS had been filled during the evaluation (commenced during the June – August 2012 quarter). Allocations for full-time OW and IHPO positions at the DGP had also been filled (commencing June – August 2011 and June – August 2010 respectively). A Care Coordination allocation, also at the DGP, had been filled (filled during June – August 2011 quarter) but was vacant in the June – August 2012 quarter. The pattern of recruitment to these allocations, where they had direct responsibility for the site, together with trends in the uptake of various measures
185
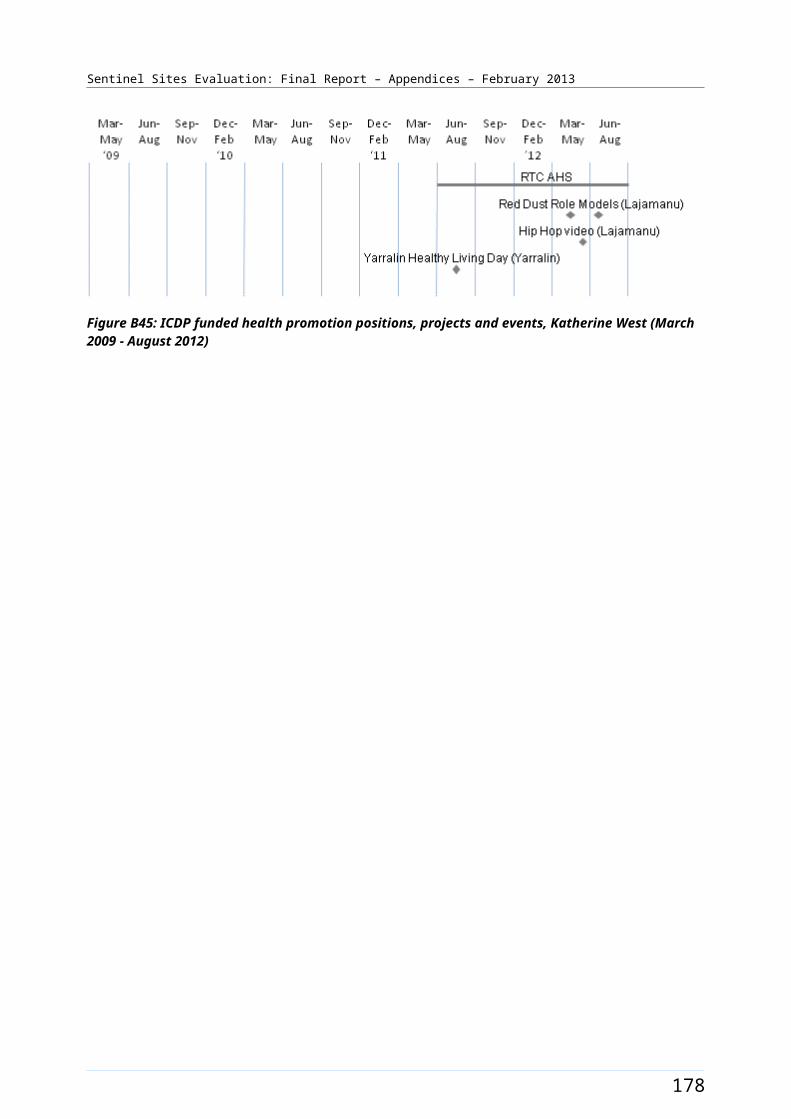
Sentinel Sites Evaluation: Final Report – Appendices – February 2013
(as reflected by administrative data) throughout the SSE, is shown in Figure B57.
Figure B55: Port Augusta site boundary map
186
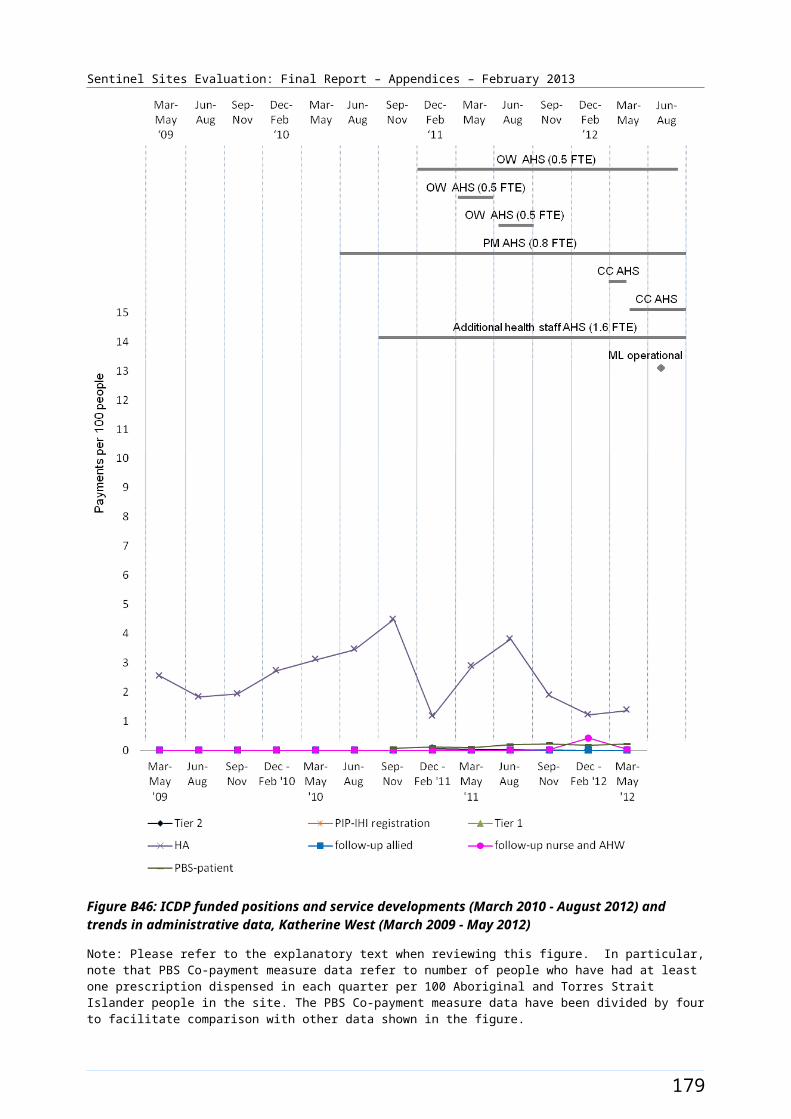
Sentinel Sites Evaluation: Final Report – Appendices – February 2013
Port Augusta site characteristics
Port Augusta, South Australia; case study site, stage 1
Key stakeholder organisations
Pika Wiya Health Service Aboriginal Corporation
Flinders and Far North Division of General Practice
Geographical characteristics
Site boundaryThe Sentinel Site boundary consists of 1 SLA.
RuralityRegional
Geographic area1153 km²
Postcodes5700, 5710
Population characteristics
Population 2006 2011 Difference %
Total population 13 874 13 985 + 0.8
Aboriginal and Torres Strait Islander population 2303 2361 + 2.5
% of total population identified as Aboriginal and Torres Strait Islander people
16.6 16.9 + 0.3a
Workforce expansion
ICDP workforce Evaluation cycle Total FTE allocated Total FTE recruited
ICDP workforce allocation and recruitment per 10 000 Aboriginal and Torres Strait Islander population within the boundary of the DGP.
2 8.1 2.7
3 10.9 8.1
4 10.9 8.1
5 10.9 8.1
ICDP workforce Role Total FTE allocated Total FTE recruited
ICDP workforce allocation and recruitment (for final evaluation cycle) – positions with responsibility of covering the
Indigenous Health Project Officer
1 1
Outreach Worker 2 2
187
Sentinel Sites Evaluation: Final Report – Appendices – February 2013
ICDP workforce Role Total FTE allocated Total FTE recruited
Sentinel Site. Actual area of responsibility may be substantially larger than the Sentinel Site.
Care Coordinator 1 0b
Regional Tobacco Coordinator
1 1
Tobacco Action Worker 3 0
Healthy Lifestyle Worker 2 0
188
Sentinel Sites Evaluation: Final Report – Appendices – February 2013
GP characteristics for the whole Division of General Practice
Total number of General Practices16
Proportion of practices which are solo GP practices44%
Full-time working equivalent GP: population 2010 ratio1098
a The figures shown in the row for % of total population identified as Aboriginal and Torres Strait Islander people represent the difference in percentages between two census periods.b Position recruited to, but vacant in final evaluation period for three months (evaluation visit October 2012).
189
Sentinel Sites Evaluation: Final Report – Appendices – February 2013
Figure B56: ICDP funded health promotion positions, projects and events, Port Augusta (March 2009 - August 2012)
190
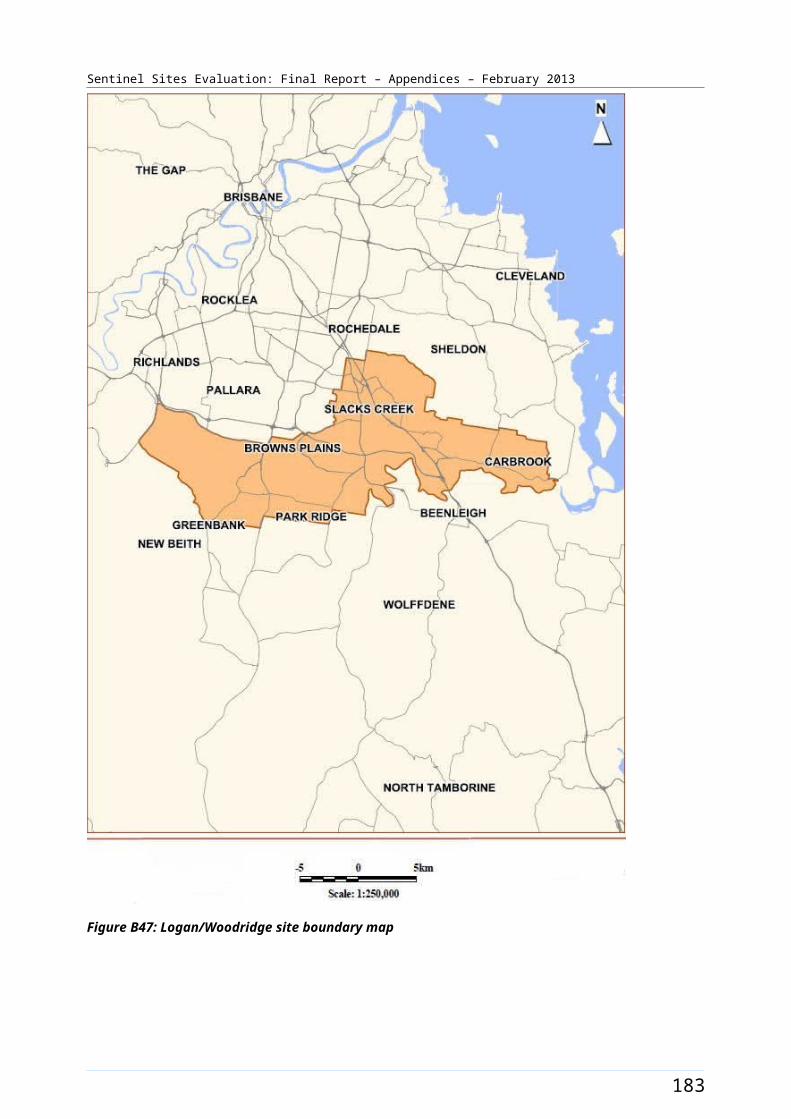
Sentinel Sites Evaluation: Final Report – Appendices – February 2013
Figure B57: ICDP funded positions and service developments (March 2009 - August 2012), and trends in administrative data, Port Augusta (March 2009 - May 2012)
Note: Please refer to the explanatory text when reviewing this figure. In particular, note that PBS Co-payment measure data refer to number of people who have had at least one prescription dispensed in each quarter per 100 Aboriginal and Torres Strait Islander people in the site. The PBS Co-payment measure data have been divided by four to facilitate comparison with other data shown in the figure.
191
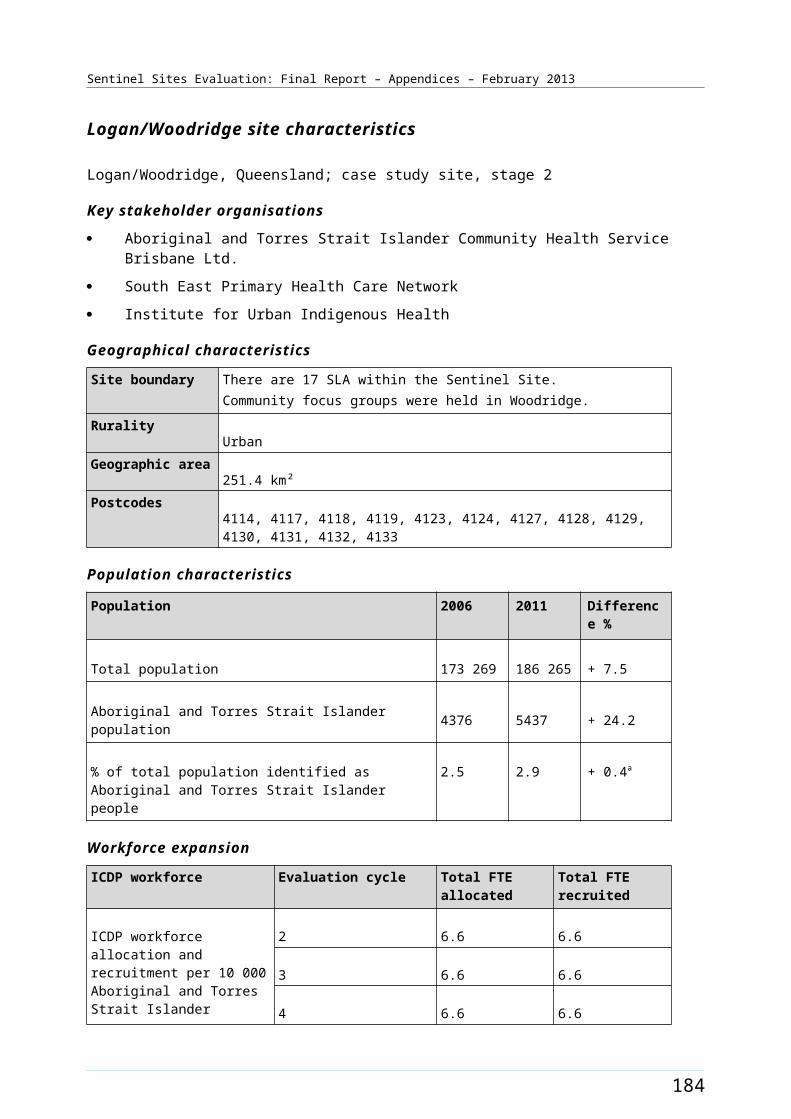
Sentinel Sites Evaluation: Final Report – Appendices – February 2013
Swan Hill/Mildura [Enhanced tracking site]
The Swan Hill/Mildura site spanned the cities of Mildura (approximate population 30 000 in 2009) and Swan Hill (approximate population 10 000 in 2006) and the town of Robinvale (approximate population 2200 in 2006) (Figure B58). Mildura is a regional city and a major agricultural centre that serviced northwest Victoria and small towns and communities across the Murray River in NSW. The site covered five SLAs in the northwest corner of Victoria including a large rural area between the Murray River and the South Australian border.
The total population of the site was about 70 500 in 2006 and about 71 400 in 2011 (Table B32). Around 3.2% of the total site population identified as Aboriginal and Torres Strait Islander people in the 2006 Census. The 2011 Census showed an increase of approximately 0.6% with about 3.8% identifying in 2011 (a population of 2200 and 2700 respectively) (Table B32). The nearest tertiary referral centres were the regional city of Bendigo (5 hours drive from Mildura) and the state’s capital city, Melbourne.
Health Service organisations and other key site characteristics and service developments
There were three AHSs and one DGP in the site. Two of the AHSs (Swan Hill Aboriginal Health Service and Mildura Aboriginal Corporation Inc) and the DGP (Mallee Division of General Practice) were key stakeholder organisations.
The three AHSs and three hospitals in the site primarily serviced the three main cities/towns in the site and surrounding communities. In addition to servicing people in northwest Victoria, the AHS in Mildura, and other Health Services, provided care to NSW residents from across the Murray River.
The DGP was located in Mildura. The area covered by the DGP now falls within part of the region covered by the Lower Murray Medicare Local; this includes the northwest corner of Victoria and the southwest corner of NSW. The remainder of the site area (including Swan Hill) now falls within the region covered by the Loddon-Mallee-Murray Medicare Local. Both Medicare Locals commenced 1 January 2012.
There were a number of General Practices in the site. Privately run bulk-billing medical clinics, operated as part of the Tristar Medical Group, opened in both Swan Hill and Mildura during the evaluation (November 2010 and June 2011 respectively). An e-health network, “Argus”, connected GPs, the DGP, AHS, hospital and community Health Services in Mildura.
The majority of the Swan Hill/Mildura site boundary area was not classed as a district of workforce shortage for GPs during 2012, based on the information accessed in November 2012, however, part of the site area, Mildura Part – B SLA, was classed a district of workforce shortage in this period.111
The two stakeholder AHSs participated in the Healthy for Life program (under a consortium) and in the QUMAX program.
An existing state-based program funded from 2011, the Aboriginal Health Promotion and Chronic Care Partnership program (AHPACC), also operated in the site throughout the evaluation period.112
Local Community Campaign to Promote Better Health activity occurred in the site during the evaluation period (Chapter 4, Table 4.1). Four Family Fun Days were held to promote non-smoking and a Flour Drum Cooking project was run for healthy eating. The timing of events and activities is depicted in
111 DoHA, Doctor Connect [website], op. cit. 112 AHPACC - Aboriginal Health Promotion and Chronic Care, [website]> (accessed 24 October 2012).
192
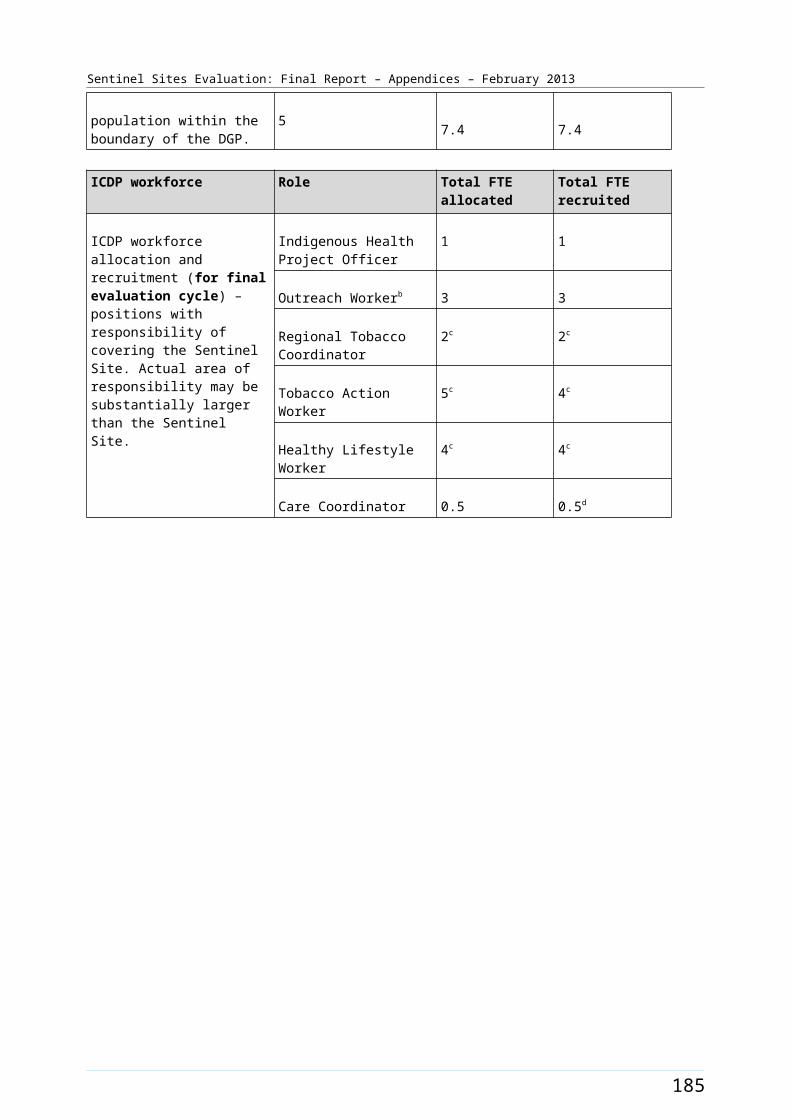
Sentinel Sites Evaluation: Final Report – Appendices – February 2013
Figure B59. The East End Health for East End Wealth project was funded late in the evaluation period (September 2012) to run after-school programs promoting exercise and use of the community garden and kitchen to create nutritious meals in Mildura. The Koori Family Lifestyle project was also funded from September 2012, to deliver comprehensive obesity awareness training programs to Aboriginal community health, lifestyle and early childhood professionals to raise awareness of the issue of obesity, encourage healthy behaviour change and promote the need for engagement with local Health Services in Mildura and Melbourne. In addition, until June 2012, the DGP ran an existing Aboriginal Lifestyle Modification Program (not ICDP funded). This included camps for men and women in December 2010 and April 2011 respectively and weekly educational sessions over several weeks.
Workforce expansion
Workforce allocations for the Regional Tackling Smoking and Healthy Lifestyle team were filled during the evaluation. The allocations included up to three TAW positions, one RTC and two HLW positions at the AHS. Two TAW positions were filled during the evaluation; during September – November 2010 and March – May 2012 quarters respectively. The RTC position was filled during the December 2010 – February 2011 quarter and the two HLW positions were filled during the June – August 2011 and September – November 2011 quarters respectively. The pattern of recruitment to these positions over the SSE is depicted in Figure B59.
Workforce allocations for one OW position and one Practice Manager (0.6 FTE) at the AHS had been filled during the evaluation. The OW AHS position was initially filled during the June – August 2010 quarter, and had three incumbents over the evaluation period. The Practice Manager position was filled during the March – May 2011 quarter. Allocations for full-time OW and IHPO positions at the DGP had also been filled. Only one DGP OW position was ICDP funded during the evaluation. This position was initially filled during the September – November 2010 quarter and had two incumbents over the evaluation period. A Care Coordination allocation, also at the DGP, was also filled (commencing during the September – November 2011 quarter). The pattern of recruitment to these allocations, where they had direct responsibility for the site, together with trends in the uptake of various measures (as reflected by administrative data) throughout the SSE, is shown in Figure B60.
193

Sentinel Sites Evaluation: Final Report – Appendices – February 2013
Figure B58: Swan Hill/Mildura site boundary map
194
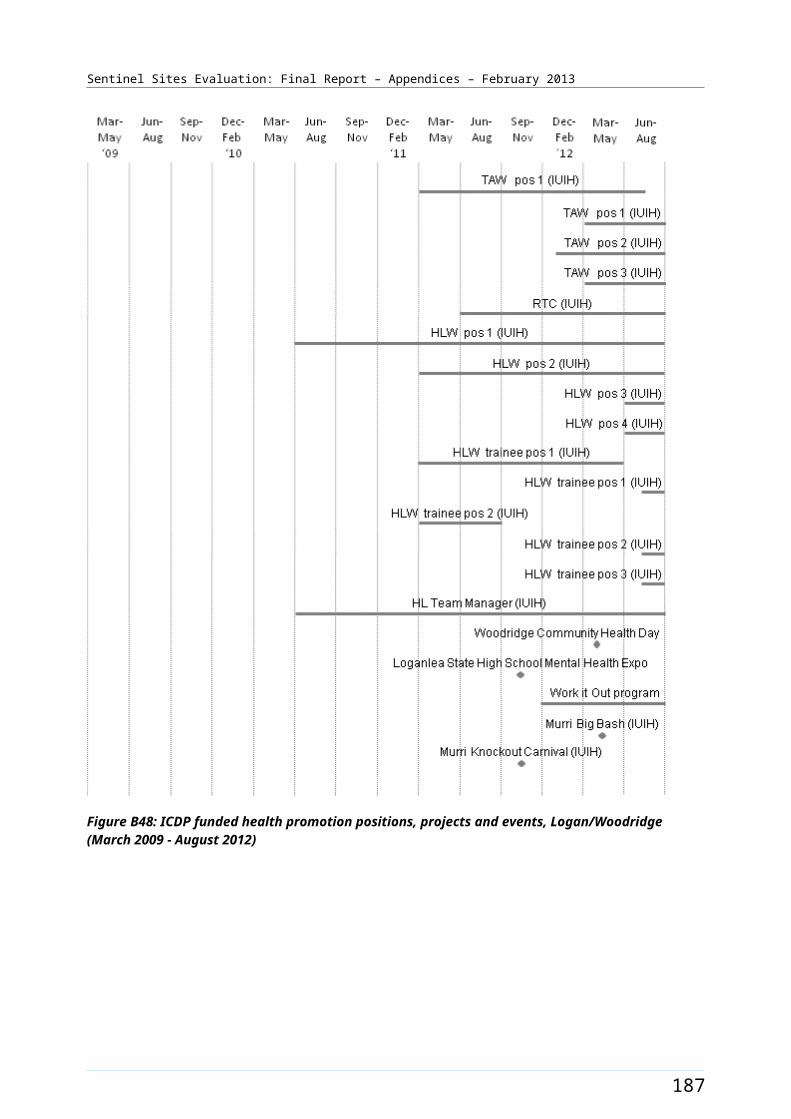
Sentinel Sites Evaluation: Final Report – Appendices – February 2013
Swan Hill/Mildura site characteristics
Swan Hill/Mildura, Victoria; enhanced tracking site, stage 1
Key stakeholder organisations
Swan Hill Aboriginal Health Service
Mildura Aboriginal Corporation Inc
Mallee Health Care Network (formerly known as Mallee Division of General Practice)
Geographical characteristics
Site boundary Swan Hill/Mildura site boundary consists of 5 SLAs
Rurality Regional
Geographic area28 203.3 km²
Postcodes3424, 3490, 3494, 3496, 3498, 3500, 3501, 3505, 3506, 3507, 3509, 3512, 3533, 3544, 3546, 3549, 3583, 3584, 3585, 3586, 3588, 3589, 3590, 3591, 3594, 3595, 3596, 3597,3599
Population characteristics
Population 2006 2011 Difference %
Total population 70 452 71 429 + 1.4
Aboriginal and Torres Strait Islander population 2238 2724 + 2.2
% of total population identified as Aboriginal and Torres Strait Islander people
3.2 3.8 + 0.6a
Workforce expansion
ICDP workforce Evaluation cycle Total FTE allocated Total FTE recruited
ICDP workforce allocation and recruitment per 10 000 Aboriginal and Torres Strait Islander population within the boundary of the DGP.
2 9.5 8.2
3 9.5 9.5
4 12.7 12.7
5 12.7 12.7
ICDP workforce Role Total FTE allocated Total FTE recruited
ICDP workforce allocation and recruitment (for final evaluation cycle) – positions with responsibility of covering
Indigenous Health Project Officer
1 1
Outreach Worker 2 2b
195
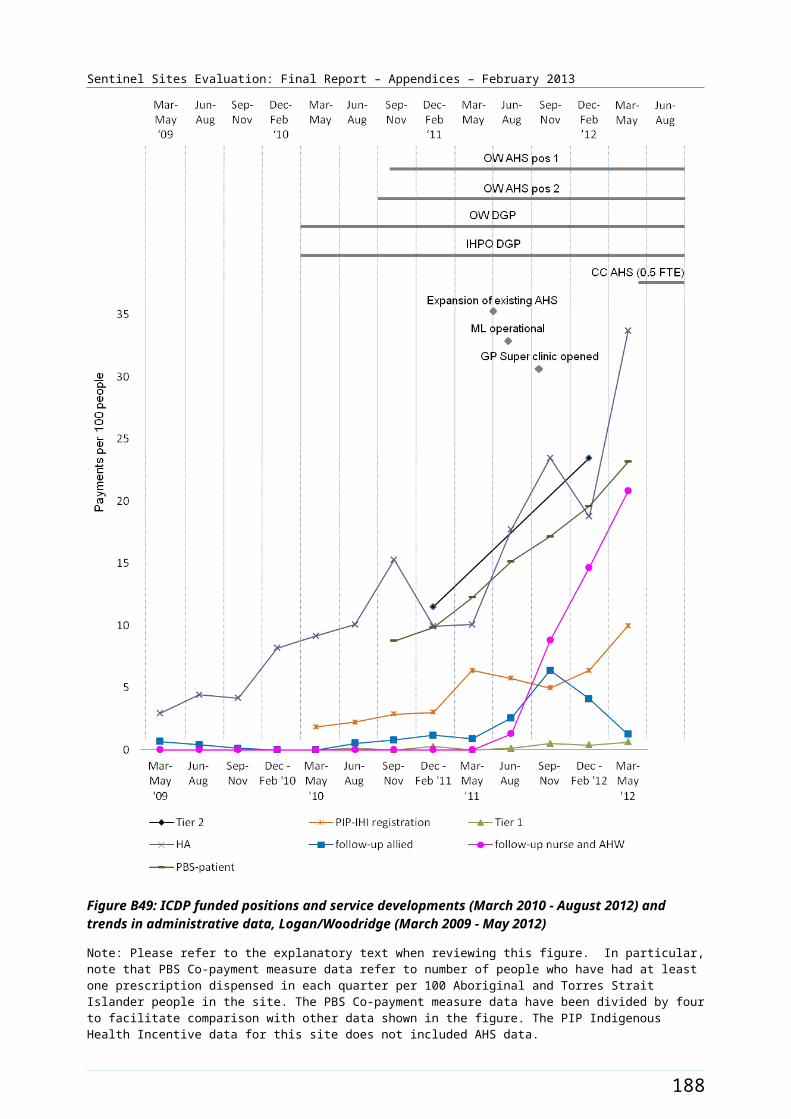
Sentinel Sites Evaluation: Final Report – Appendices – February 2013
ICDP workforce Role Total FTE allocated Total FTE recruited
the Sentinel Site. Actual area of responsibility may be substantially larger than the Sentinel Site.
Regional Tobacco Coordinator 1 1
Tobacco Action Worker 3 2
Healthy Lifestyle Worker 2 2
Practice Manager 0.6 0.6c
Care Coordinator 1 1
196
Sentinel Sites Evaluation: Final Report – Appendices – February 2013
General Practitioner characteristics for the whole Division of General Practice
Total number of General Practices30
Proportion of practices which are solo GP practices63%
Full-time working equivalent GP: population 2010 ratio1122
a The figures shown in the row for % of total population identified as Aboriginal and Torres Strait Islander people represent the difference in percentages between two census periods.b There are two OWs at the Medicare Local for this site – only one is ICDP funded.c This position relates to an AHS within the site that was not participating in the SSE. d There are two Medicare Locals covering this site and both are in tranche 2.
197
Sentinel Sites Evaluation: Final Report – Appendices – February 2013
Figure B59: ICDP funded health promotion positions, projects and events, Swan Hill/Mildura (March 2009 - August 2012)
198
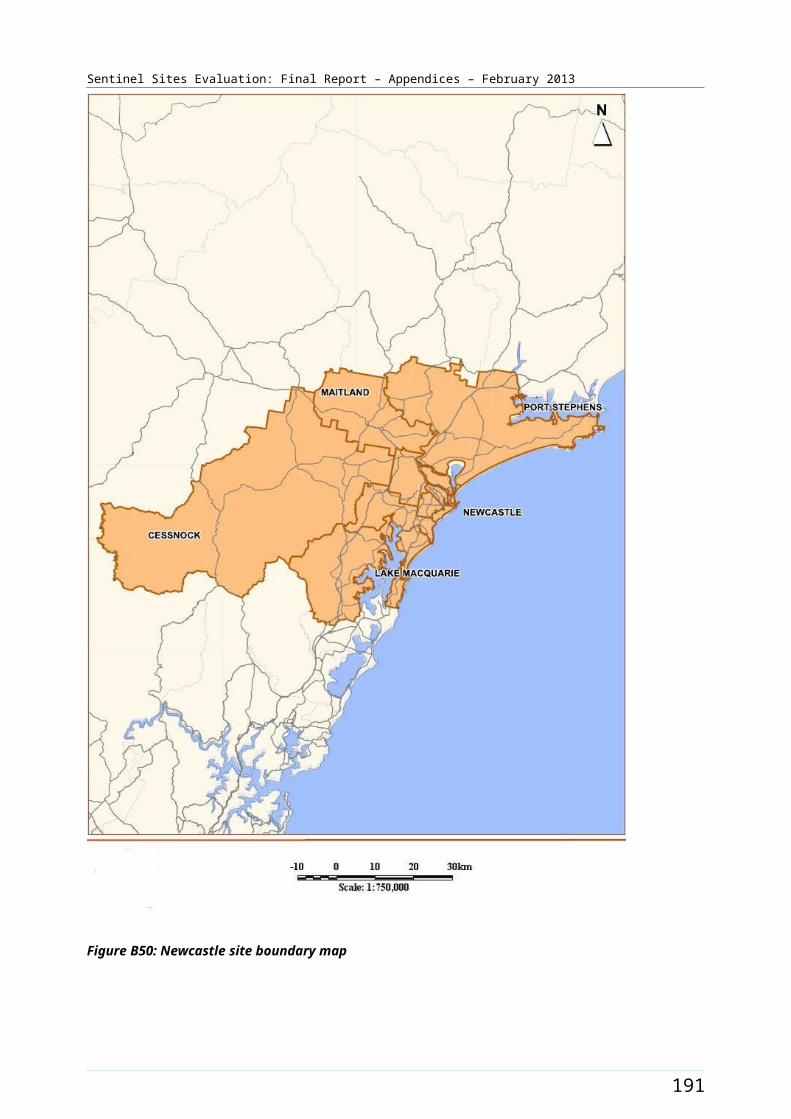
Sentinel Sites Evaluation: Final Report – Appendices – February 2013
Figure B60: ICDP funded positions and service developments (March 2010 - August 2012) and trends in administrative data, Swan Hill/Mildura (March 2009 - May 2012)
Note: Please refer to the explanatory text when reviewing this figure. In particular, note that PBS Co-payment measure data refer to number of people who have had at least one prescription dispensed in each quarter per 100 Aboriginal and Torres Strait Islander people in the site. The PBS Co-payment measure data have been divided by four to facilitate comparison with other data shown in the figure.
199
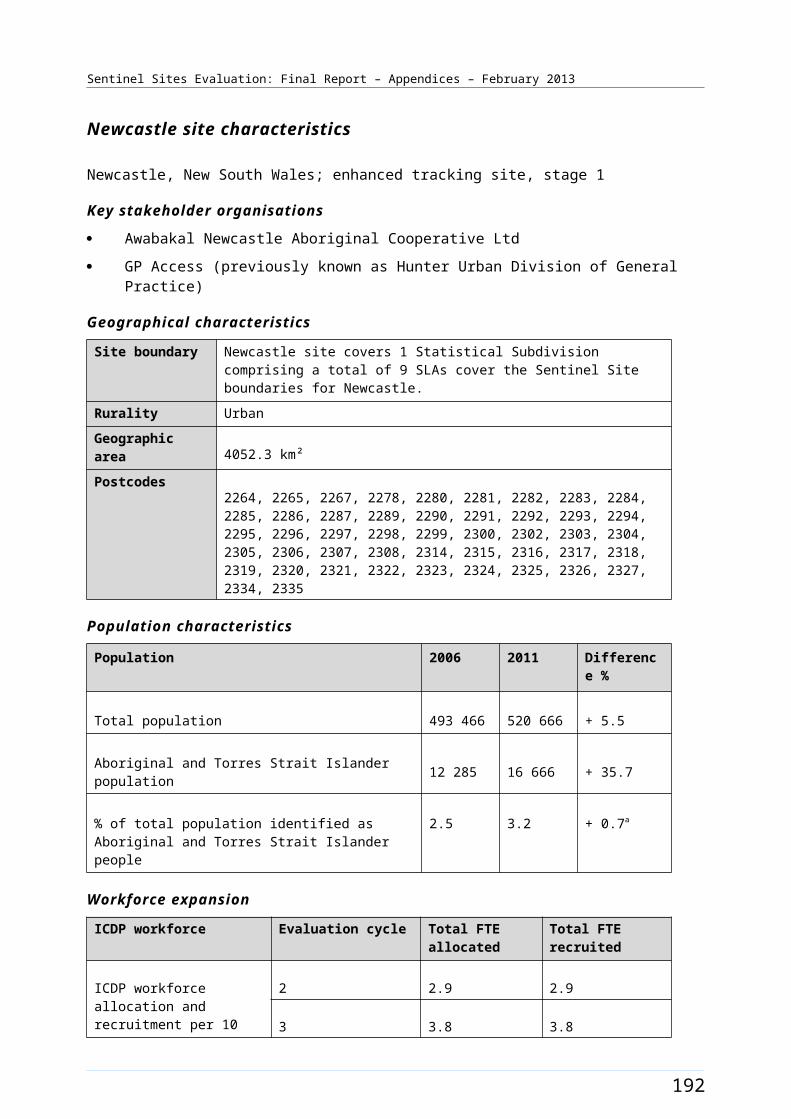
Sentinel Sites Evaluation: Final Report – Appendices – February 2013
Tamworth [Case study site]
The Tamworth site was in northern NSW approximately 420 kms from Sydney and 280 kms inland from Port Macquarie. The site covered two SLAs which included the town of Tamworth and surrounding areas (Figure B61). The town of Tamworth had a population of more than 50 000 in 2011113 and also serviced several thousand people living in the surrounding region.
The total population of the site was approximately 53 600 in 2006 and about 56 300 in 2011 (Table B33). Approximately 7.0% of the total site population identified as Aboriginal and Torres Strait Islander people in the 2006 Census (around 3700 people). The 2011 Census showed an increase of about 1.5% with about 8.4% identifying in 2011 (a population of about 4700) (Table B33).
Health Service organisations and other key site characteristics and service developments
Both the AHS (Tamworth Aboriginal Medical Service) and the DGP (North West Slopes Division of General Practice) were key stakeholder organisations. Both organisations were located in Tamworth. The DGP covered a population of over 60 000 people. The Tamworth site now falls within the region of the New England Medicare Local, which commenced 1 July 2011.114
There was a hospital located in Tamworth and more than 10 pharmacies.115 There were several General Practices in the site. The AHS was auspiced by the DGP until mid 2012 when the Wellington AHS (Wellington Aboriginal Corporation Health Service) began an auspice role (commenced around 1 July 2012). The AHS serviced a region within a radius of about 70 km from the town. The DGP was the managing entity for a not-for-profit Health Service with a large allied health professional workforce practicing from that service.
During 2012 Tamworth was classed as a district of workforce shortage for GPs, based on the information accessed in April 2012 and October 2012.116 The chronic shortage of GPs impacted on the availability of healthcare to the population of the area. The waiting period for appointments for existing patients was up to two weeks throughout the period of the evaluation.117 In general, most General Practice Health Services had their books closed to new patients throughout the evaluation period. The AHS had their books closed until mid 2012 but, with the transfer of auspice arrangements, opened their books.118
During the evaluation, the DGP managed a Healthy for Life program. The AHS participated in the QUMAX program.119
A funding agreement was executed in May 2011 with the then DGP for refurbishment of a property for use as a medical facility under the ICDP capital works funding. The AHS moved into this facility in 2012, which is located alongside the Medicare Local.
Local Community Campaign to Promote Better Health activity occurred in the site during the evaluation period (Chapter 4, Table 4.1). The Healthy Youth Healthy Futures Day (16 July 2011) aimed to increase
113 Tamworth Regional Council [Website] (accessed 6 November 2012). 114 DoHA, My Medicare Local [website], op. cit. 115 Directory [website] Yellow Pages - Chemists Tamworth (accessed 2 November 2012).116 DoHA, Doctor Connect [website], op. cit.117 PHCRIS, North West Slopes DGP Annual Report 2009-2010, [website] (accessed 5 October 2012).118 SSE Evaluation site visit - September 2012. 119 QUMAX [website] (accessed 5 October 2012).
200
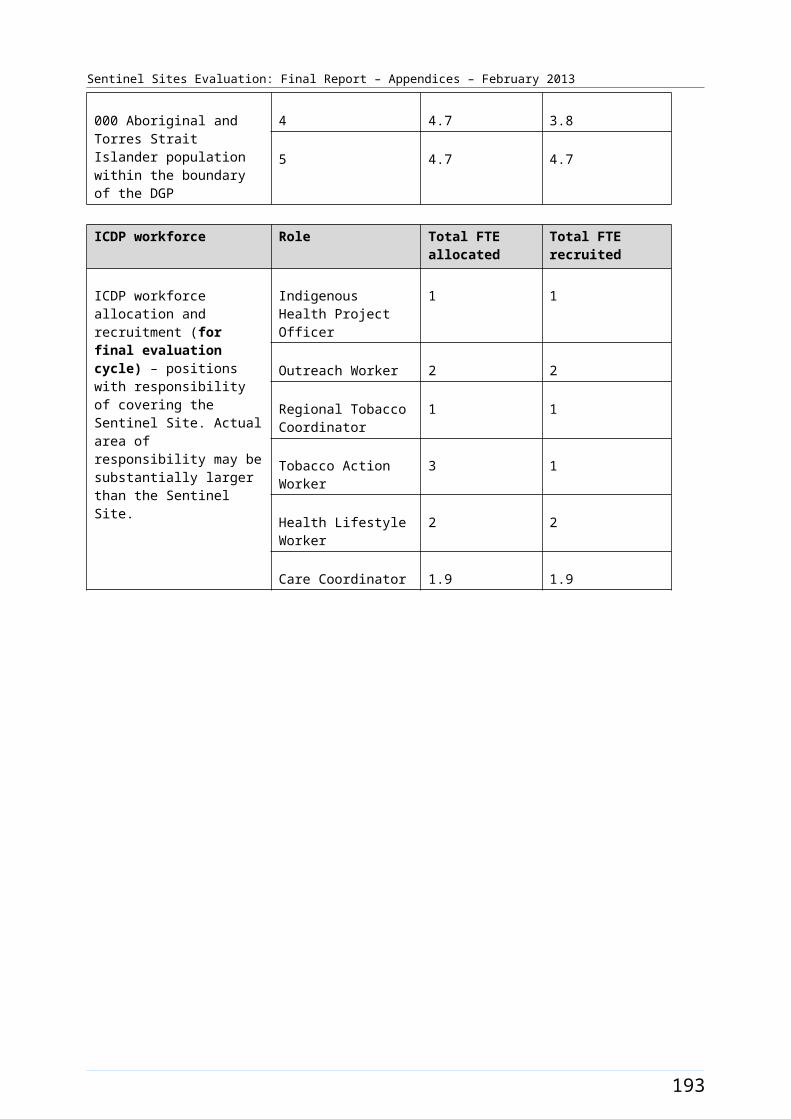
Sentinel Sites Evaluation: Final Report – Appendices – February 2013
awareness about chronic disease with local youth; focusing on the role they can play in prevention now and into the future (Figure B62).120
Workforce expansion
Workforce allocations for the Regional Tackling Smoking and Healthy Lifestyle team were filled during the evaluation period. The allocations included up to three TAW position, one RTC and two HLW positions at the AHS. Two TAW positions were filled during the June – August 2012 quarter. The RTC position was filled during the June – August 2011 quarter and the two HLW positions were filled in the September – November 2011 and the June – August 2012 quarters respectively. The pattern of recruitment to these allocations throughout the SSE is depicted in Figure B62.
Workforce allocations for one OW and one IHPO position at the DGP had been filled during the evaluation period. Both positions were filled during the March – May 2011 quarter. A Care Coordinator allocation (0.8 FTE), also located at the DGP, had been filled during the September – November 2011 quarter. The pattern of recruitment to these allocations, where they had direct responsibility for the site, together with trends in the uptake of various measures (as reflected by administrative data) throughout the SSE, is shown in Figure B63.
120 D0HA [A3 Report], Healthy Community Day events in Sentinel Sites, 1 September 2011.
201

Sentinel Sites Evaluation: Final Report – Appendices – February 2013
Figure B61: Tamworth site boundary map
202
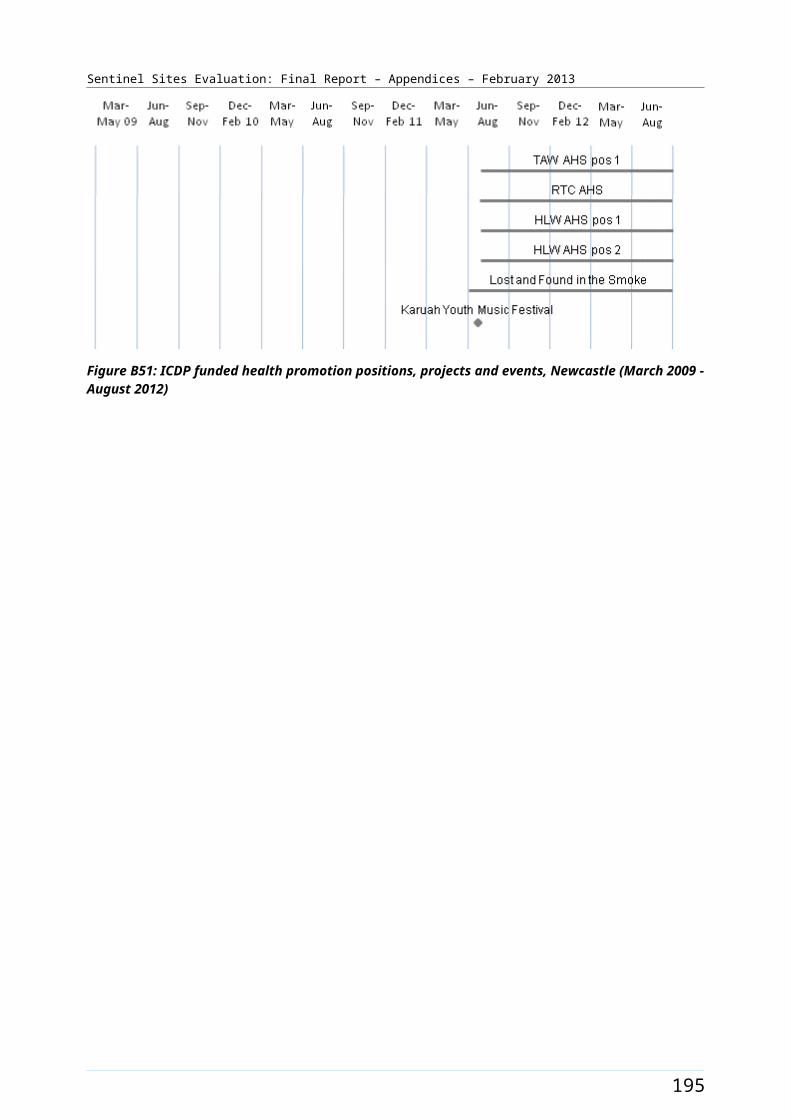
Sentinel Sites Evaluation: Final Report – Appendices – February 2013
Tamworth site characteristics
Tamworth, New South Wales; case study site, stage 2
Key stakeholder organisations
Tamworth Aboriginal Medical Service
North West Slopes Division of General Practice
Geographical characteristics
Site boundary There are 2 SLAs within the Tamworth site.
Rurality Regional
Geographic area 9892.3 km²
Postcodes 2340, 2344, 2345, 2346, 2347, 2352, 2353, 2354, 2355
Population characteristics
Population 2006 2011 Difference %
Total population 53 595 56 294 + 5.0
Aboriginal and Torres Strait Islander population 3710 4724 + 27.3
% of total population identified as Aboriginal and Torres Strait Islander people
6.9 8.4 + 1.5a
Workforce expansion
ICDP workforce Evaluation cycle Total FTE allocated Total FTE recruited
ICDP workforce allocation and recruitment per 10 000 Aboriginal and Torres Strait Islander population within the boundary of the DGP.
2 4.5 2.2
3 4.5 4.5
4 6.7 6.7
5 6.3 6.3
ICDP workforce Role Total FTE allocated Total FTE recruited
ICDP workforce allocation and recruitment (for final evaluation cycle) – positions with responsibility of covering the Sentinel Site. Actual area of responsibility may be substantially larger than the Sentinel Site.
Indigenous Health Project Officer
1 1
Outreach Worker 1 1
Regional Tobacco Coordinator
1 1
Tobacco Action Worker 3 2
Healthy Lifestyle Worker 2 2
Care Coordinator 0.8 0.8
203
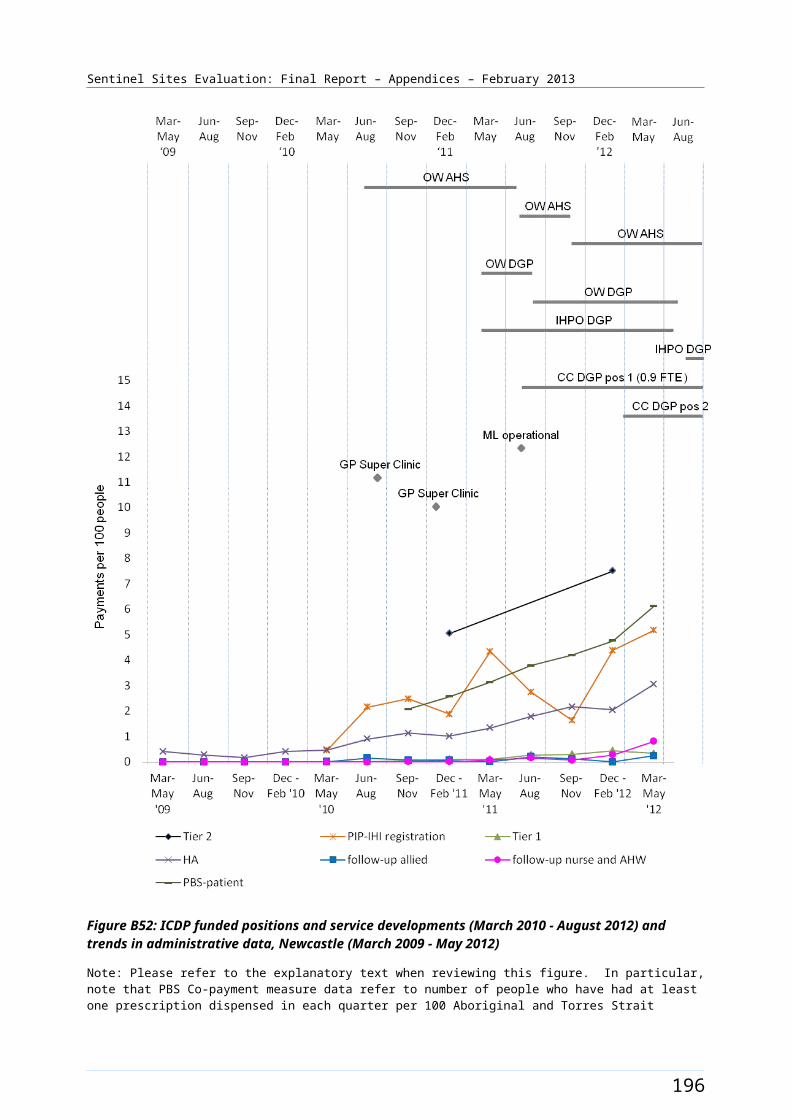
Sentinel Sites Evaluation: Final Report – Appendices – February 2013
General Practitioner characteristics for the whole Division of General Practice
Total number of General Practices 20
Proportion of practices which are solo GP practices 70%
Full-time working equivalent GP: population 2010 ratio 1908a The figures shown in the row for % of total population identified as Aboriginal and Torres Strait Islander people represent the difference in percentages between two census periods.
204

Sentinel Sites Evaluation: Final Report – Appendices – February 2013
Figure B62: ICDP funded health promotion positions, projects and events, Tamworth (March 2009 - August 2012)
205
Sentinel Sites Evaluation: Final Report – Appendices – February 2013
Figure B63: ICDP funded positions and service developments (March 2010 - August 2012) and trends in administrative data, Tamworth (March 2009 - May 2012)
Note: Please refer to the explanatory text when reviewing this figure. In particular, note that PBS Co-payment measure data refer to number of people who have had at least one prescription dispensed in each quarter per 100 Aboriginal and Torres Strait Islander people in the site. The PBS Co-payment measure data have been divided by four to facilitate comparison with other data shown in the figure.
206
Sentinel Sites Evaluation: Final Report – Appendices – February 2013
Appendix C. Evaluation process and methods
Introduction
This appendix outlines the evaluation methodology and processes for the SSE. Five sets of data sources were used for the SSE:
program data
administrative data
key informant interview data
community focus group data
clinical indicator data.
Each of these data sources is described below. In addition there is information about the population data used and the rurality classifications.
Program data
The program administrative data used for the SSE were based on reports provided to the DoHA by organisations contracted to provide services relevant to the ICDP, and from internal departmental reporting for Sentinel Sites. OATSIH was responsible for coordinating the provision of program administrative data to the SSE team. This includes ensuring the reports were available within the specified timeframe and in the agreed format. The program administrative data collected by the DoHA needed to be matched as closely as possible with the geographic boundaries of the Sentinel Sites.
The timeframes for the program data received varied, depending on the implementation stage for each measure and the availability of reports from fundholders.
Where appropriate, the SSE also draws on publicly available information to further expand the measure implementation description.
In the enhanced tracking sites and the case study sites, interviews with key informants in stakeholder organisations were used to assist in extending the accuracy and completeness of the program measure data provided through the DoHA. Where necessary, additional collection of program administrative data may have been undertaken at a local level within some Sentinel Sites.
This process of extraction of program data was negotiated with OATSIH prior to each evaluation cycle.
207
Sentinel Sites Evaluation: Final Report – Appendices – February 2013
Limitations
The SSE managed a number of challenges in obtaining program data in a form and in timeframes to meet the needs of the SSE. These included:
The periods of time for program data varied between measures, and these periods did not always match well with the evaluation cycles for the SSE.
The timeframes in which reports were provided to the DoHA did not always match well with the requirements for analysis and reporting for the SSE.
The data in the reports provided to the DoHA often did not match with the geographic area of specific Sentinel Sites, and generally covered a larger area than a Sentinel Site. This made it difficult to relate the program data to what was happening at a local level within a site.
The DoHA were cautious about placing additional requirements for reporting on the DoHA Measure Managers, or on service organisations that were required to provide reports to the DoHA.
The SSE team worked closely with the DoHA to develop and implement strategies to overcome these challenges.
The SSE team developed alternative strategies for obtaining the required data from a variety of other sources. These included websites, Divisions State Based Organisations, NACCHO affiliates, key informants within the sites, review of previous site specific reports and other documentation relating to the site. In some instances these strategies relied on the identification of individuals with the relevant depth of knowledge of the situation within a site and the development of relationships that enabled the SSE team to obtain the required information. The SSE team refined and enhanced these strategies over the course of the evaluation.
In order to ensure that the SSE was provided with relevant program data prior to each evaluation cycle, SSE requested program data from the DoHA a minimum of two months prior to the case study visits commencing for each cycle of evaluation. Teleconferences were held with DoHA Measure Managers prior to case study visits to ensure information on measures and implementation at site level was up to date.
Data discrepancies for workforce recruitment occurred each evaluation cycle requiring thorough cross checking between DoHA data and evaluation visit findings. The visits occurred up to 4 months after the DoHA data were received.
Administrative data
MBS, PBS Co-payment measure and PIP Indigenous Health Incentive data were collected to track the impact of the ICDP on program uptake and chronic disease prevention, or treatment items over time. The data were extracted from the Medicare, PIP and PBS databases.
Delays in the processing of administrative data meant that for each evaluation cycle there was a time lag between the administrative data provided to Menzies, available program data and interview data. For example, for analysis of factors that may have impacted on the MBS data reported we needed to draw on data relating to progress with implementation, and other factors operating in the Sentinel Sites covered by earlier evaluation cycles.
208
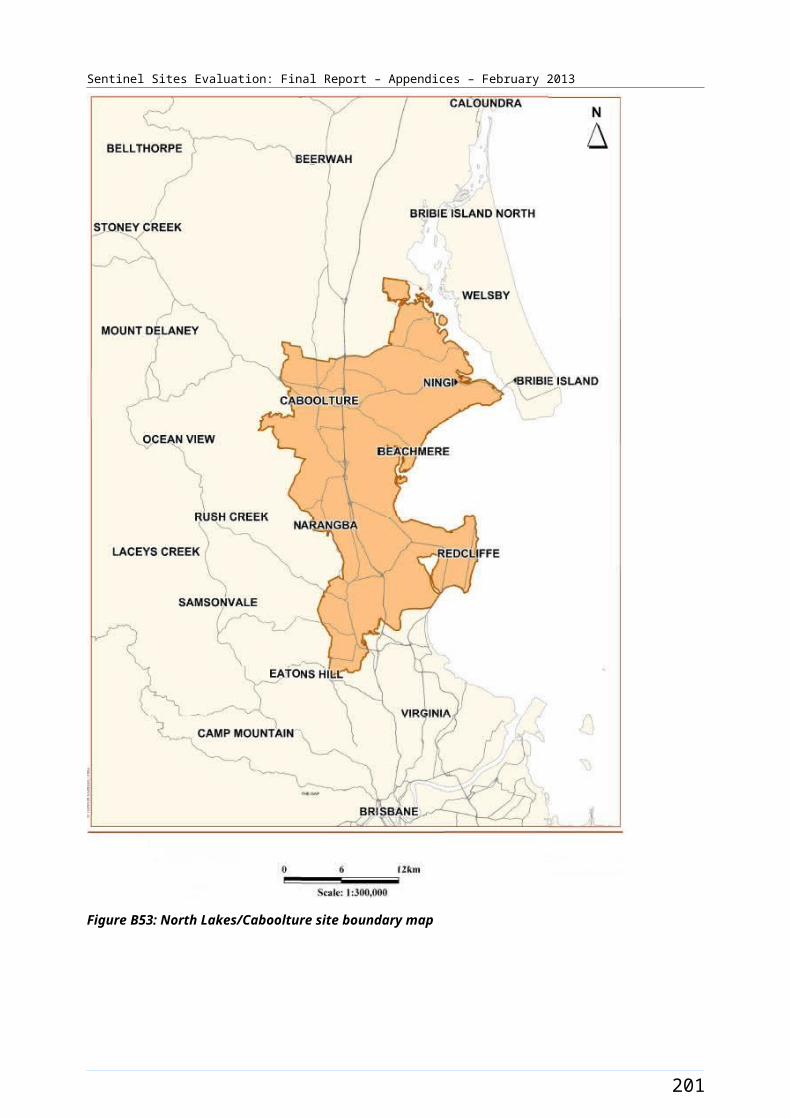
Sentinel Sites Evaluation: Final Report – Appendices – February 2013
Population and remoteness classification data
Data definition
The SSE required comparisons between areas over time. In order to make these comparisons meaningful we needed to take into account variations in the number of Aboriginal and Torres Strait Islander people living in each area. Sentinel Sites were defined by their geographic boundaries and geographic classification to link these to population data. Both Sentinel Sites and the rest of Australia were coded in terms of urban, regional or remote locations using the Australian Standard Geographical Classification - Remoteness Areas (ASGC-RA). Developed by the Australian Bureau of Statistics (ABS), the ASGC-RA gives a statistical geography structure that is suitable for categorising the Sentinel Sites according to remoteness. The five ASGC-RA categories (major city, inner regional, outer regional, remote and very remote) were reclassified into three categories for the purposes of the SSE (urban, regional and remote).
Rationale for the approach
The Aboriginal and Torres Strait Islander population data for the Sentinel Sites and the rest of Australia was based on population data and geographic classifications from the 2006 Census.121 It should be noted that the Australian Bureau of Statistics often revises the definitions of Statistical Local Areas (SLAs) between censuses. In the SSE we were interested in comparison between areas over time so it was important that the areas of interest were consistent throughout the analysis. The boundaries for each of the Sentinel Sites are shown in Appendix B – Site Descriptions and Maps. The boundaries used were all based on the 2006 Census definitions because these related directly to the population data.
Data transformation
We have adjusted the 2006 census population data for population growth by applying multipliers based on the Australian Bureau of Statistics 1991-2021 population projections for Aboriginal and Torres Strait Islander people to the population data for the Sentinel Sites and the rest of Australia. 122 See Table C1 for population estimates developed. Similar population projections were not available for the 2011 Census at the time of the evaluation. Projections based on 2006 census data were therefore used in all evaluation cycles to avoid any discontinuity in population estimates.
ICDP data have been analysed using population figures for Aboriginal and Torres Strait Islander people aged ≥15 years where relevant. In cases where the quarter being analysed spanned two calendar years the population estimate for the previous year was used. For example, the 2009 population data has been used for December 2009 - February 2010.
121 Australian Bureau of Statistics, Census 2006 [website] (accessed 6 December 2012).122 Ibid.
209
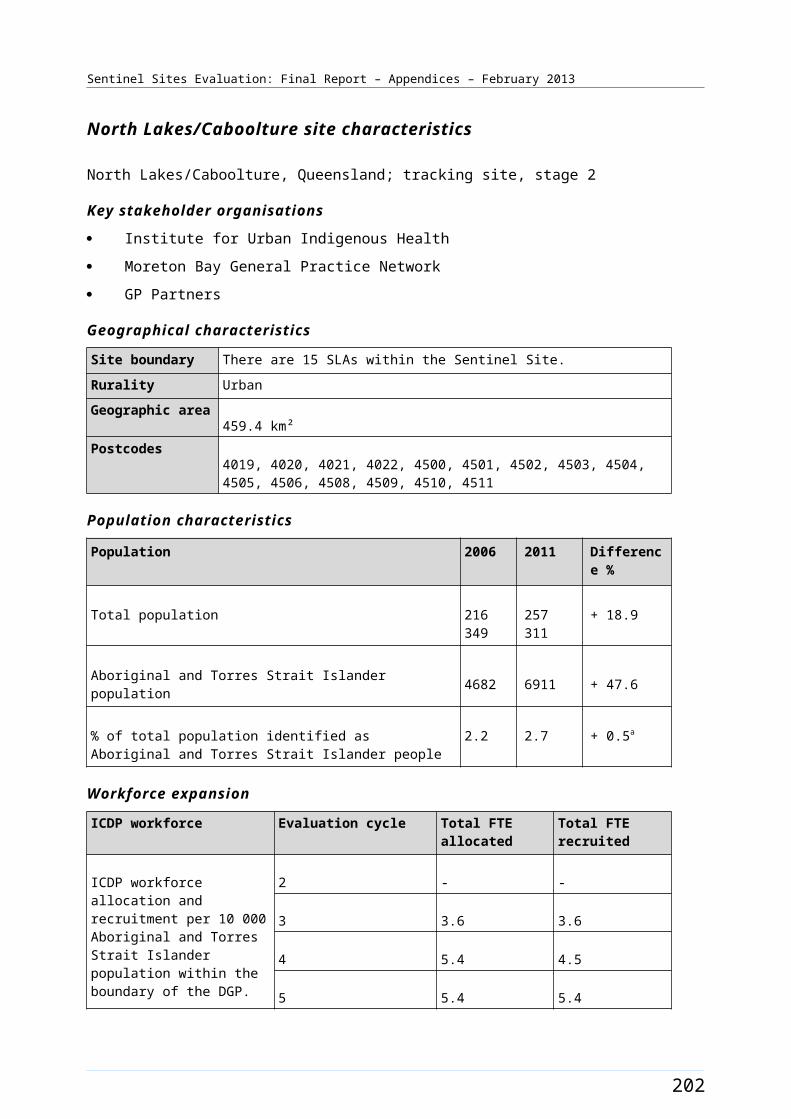
Sentinel Sites Evaluation: Final Report – Appendices – February 2013
Table C1: Population size projections for Sentinel Sites and the rest of Australia by age and gender and urban, regional and remote locations, 2009-2012
Sentinel Site / rest of Australia
Gender Age group Population 2009
Population 2010
Population 2011
Population 2012
Urban Sentinel Sites
F 15-54 10 711 10 918 11 125 11 334
M 15-54 10 454 10 656 10 857 11 061
F ≥55 1450 1479 1507 1536
M ≥55 1263 1288 1313 1338
Total - 23 879 24 340 24 802 25 269
Rest of urban Australia
F 15-54 33 066 33 752 34 439 35 133
M 15-54 32 311 32 981 33 652 34329
F ≥55 4894 4996 5097 5199
M ≥55 4247 4335 4423 4512
Total - 74 518 76 064 77 611 79 173
Regional Sentinel Sites
F 15-54 12 059 12 276 12 492 12 710
M 15-54 11 894 12 109 12 322 12 537
F ≥55 1687 1717 1747 1776
M ≥55 1645 1675 1705 1733
Total - 27 286 27 778 28 266 28 756
Rest of regional Australia
F 15-54 43 622 44 492 45 361 46 243
M 15-54 43 497 44 366 45233 46 113
F ≥55 7161 7303 7445 7588
M ≥55 6868 7004 7141 7280
Total - 101 148 103 165 105 179 107 224
Remote Sentinel Sites
F 15-54 3256 3313 3369 3424
M 15-54 3392 3452 3510 3567
F ≥55 472 480 488 496
M ≥55 607 618 628 638
Total - 7728 7863 7995 8125
Rest of remote Australia
F 15-54 27 887 28 431 28 964 29504
M 15-54 29 873 30457 31030 31609
F ≥55 4018 4097 4175 4252
M ≥55 4766 4860 4953 5046Note: Totals do not add up exactly due to rounding.
210
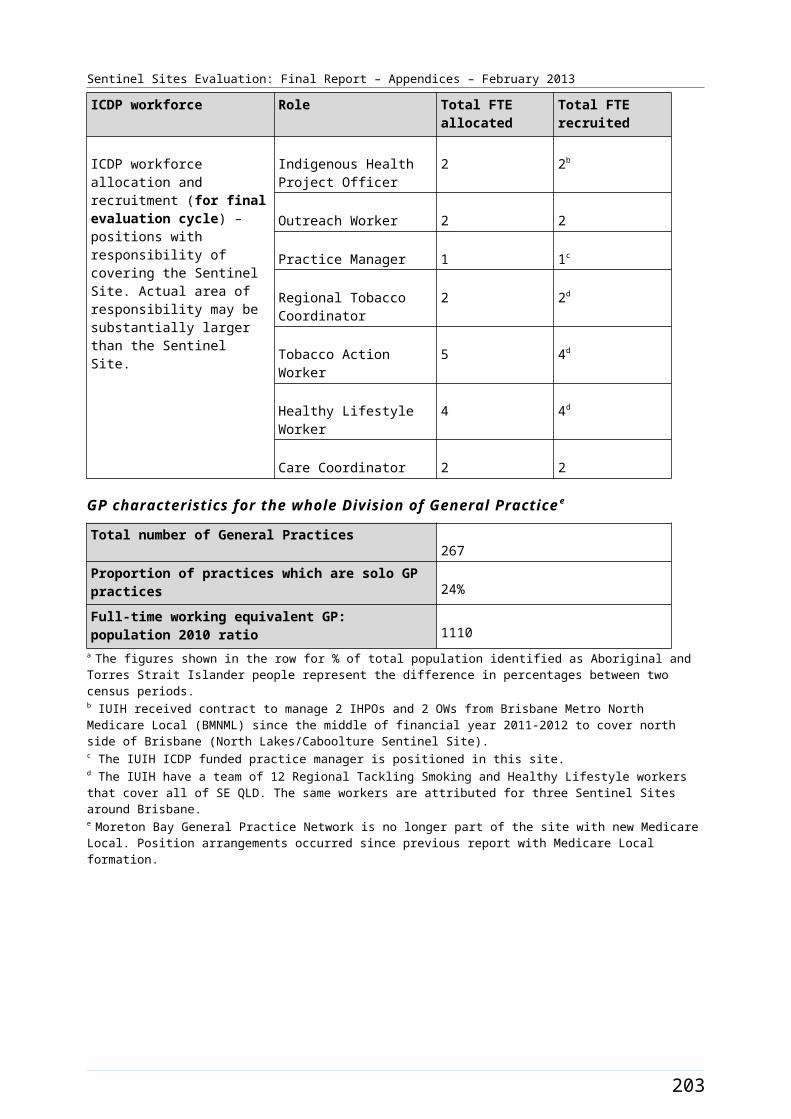
Sentinel Sites Evaluation: Final Report – Appendices – February 2013
Analysis
The annual population estimates developed as described were applied to the estimates of the population to Health Services data for 2009-2012.
The population estimates were used to adjust MBS, PBS Co-payment and PIP Indigenous Health Incentive data so that it represented the number of services provided per 100 Aboriginal and Torres Strait Islander people in each area. Details of these data are listed in the relevant sections below.
Limitations
The population growth estimates developed for Aboriginal and Torres Strait Islander people are developed at a State and Territory level. 123 This means that variation in growth within jurisdictions have not always been reflected in the estimates used in the analysis. It should be noted that population data used in all evaluation reports were based on forward projections of 2006 census data. A new census was conducted in 2011, but backward estimates from the 2011 census data were not available at the time of preparation of this report.
Comparisons between the 2011 Census and the 2006 Census showed particularly large increases in the percentage of the population identified as Aboriginal and Torres Strait Islander people in some sites, most notably in North Lakes/Caboolture (47.6% increase), East Pilbara (41.9% increase), Newcastle (35.7% increase), and Canberra (32.2% increase). Nine other sites showed increases of between 20 and 30% (see Appendix B on Site Characteristics). These increases may reflect relatively large increases in the Aboriginal and Torres Strait Islander population in these sites (as a result of movement into the site as well as natural growth), or relatively large increases in identification of Aboriginal and Torres Strait Islander people who were living in the site at the time of the 2006 Census. The large increases in population numbers in some sites may indicate relatively large undercounts in the 2006 ABS population projections, and this means that uptake of administrative items based on these population data may be overestimated to varying degrees in different sites (particularly in those with large undercounts of Aboriginal and Torres Strait Islander people in the census data).
Medicare Benefits Schedule data
Data definition
Medicare item indicators specified for the ICDP vary in terms of how Aboriginal and Torres Strait Islander status was recorded. These data included:
Aboriginal and Torres Strait Islander specific items
General items
Aboriginal and Torres Strait Islander MBS items included:
Health Assessment for Aboriginal and Torres Strait Islander people (MBS items 704, 706, 708, 710 to 1 May 2010 thereafter 715).
Follow-up allied health services for people of Aboriginal and Torres Strait Islander people (MBS items 81300-81360).
Follow-up health services provided by a practice nurse or registered Aboriginal Health Worker (MBS item 10987).
123 Ibid.
211
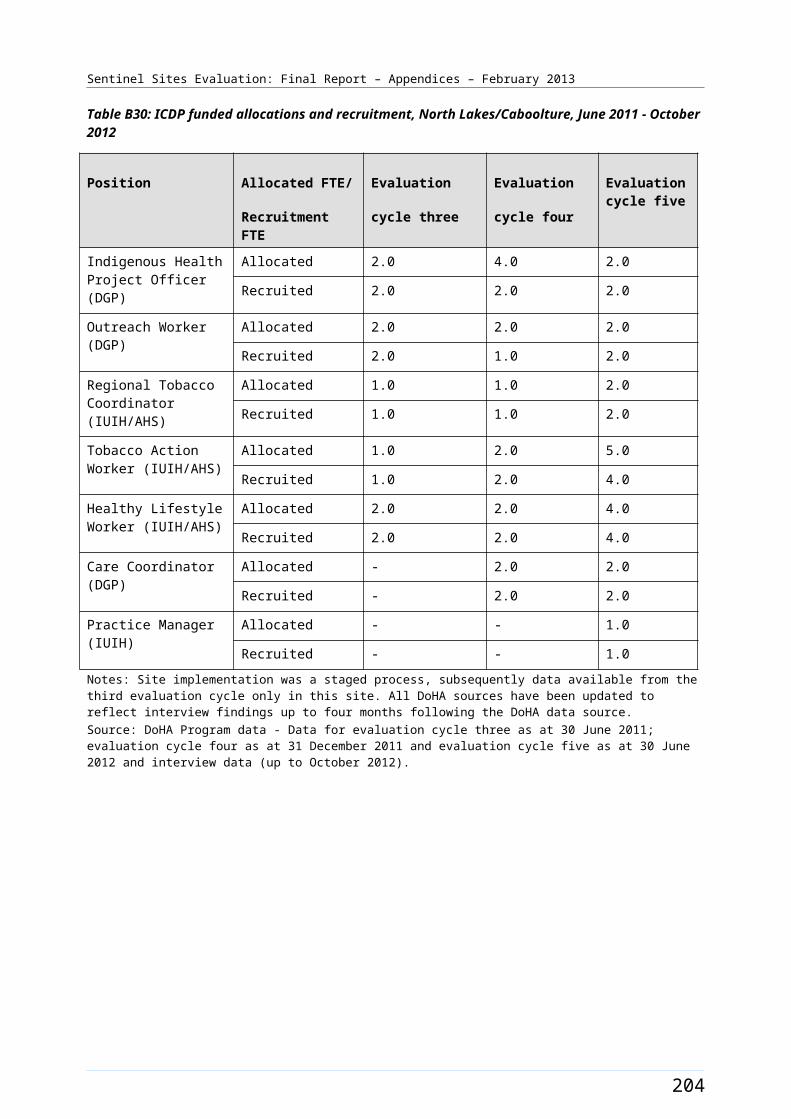
Sentinel Sites Evaluation: Final Report – Appendices – February 2013
General items included:
Chronic Disease Management Plans (CDMP) (MBS items 721, 723, 725, 727, 729, 731 following 1 May 2010 items 725 and 727 will be combined into 732).
CDMP allied health follow-up services (MBS items 10950, 10951, 10952, 10953, 10954, 10956, 10958, 10960, 10962, 10964, 10966, 10968, 10970).
General items were available for all Australians. This meant that the Voluntary Indigenous Identifier (VII) would have been needed to be used to extract data for Aboriginal and Torres Strait Islander patients. Data on these items were not included in the SSE because VII data was not suitable for local level analysis as required by the SSE.
MBS data extraction was based on date of service. Items were extracted by age (15-54, 55+ years), gender and by area where the service was provided; Sentinel Sites and the rest of Australia classified by State and ASGC-RA remoteness based on area of service.
Data transformation
MBS items (MBS items 704, 706, 710 to 1 May 2010 thereafter 715, 10987, 81300-81360) were provided by site and by state and urban, regional or remote locations for the rest of Australia. Data were aggregated by urban, regional or remote locations for Sentinel Sites and the rest of Australia by adding services across categories. Figures for the rest of Australia by urban, regional or remote locations were obtained by subtracting data for the Sentinel Sites from the total for Australia.
The MBS item data were updated in each evaluation cycle for all quarters presented to ensure that the data reflect the most complete information about services provided in each time period (see discussion in limitations).
Rationale for the approach
The MBS health assessment (MBS items 704, 706, 710 to 1 May 2010 thereafter 715) and follow-up items (MBS items 10987, 81300-81360) predated the introduction of the ICDP. The uptake of these items was expected to be affected by the introduction of the PIP Indigenous Health Incentive and the PBS Co-payment measure in May 2010. There would also be expected to be a degree of background seasonal variation in the number of items claimed. The analysis of these data tracked trends in item uptake throughout a baseline period defined as a year before the introduction of the ICDP (see definition below) throughout the period of implementation. The analysis focused on trends in uptake rather than a simple pre-post comparison in order to better inform the development of the intervention.
Analysis
The data available for analysis for the SSE for inclusion in this report were for a 39 month period between March 2009 and May 2012 inclusive. This included a 12 month ‘baseline’ period (March 2009 to February 2010 inclusive) that preceded the implementation of the ICDP and a twenty-seven month period (March 2010 to May 2012 inclusive) that covered a period coinciding with the early implementation of the ICDP. The inclusion of the baseline period allowed an assessment of levels and trends in uptake prior to the implementation of the ICDP.
The data presented in the report included both raw data and data adjusted by population size. This allowed for meaningful comparison between regions, sites and different population groups, where the number of people eligible to receive services may differ substantially. Direct comparison of numbers of items did not take account of differences in population size.
212
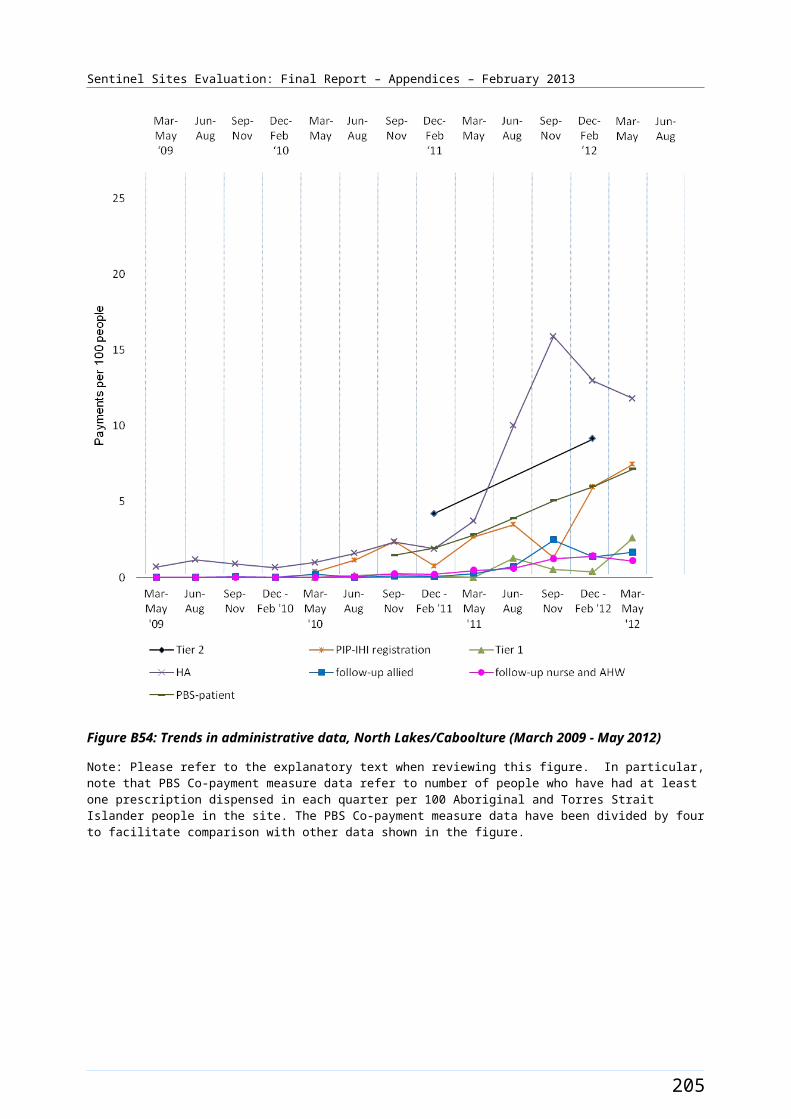
Sentinel Sites Evaluation: Final Report – Appendices – February 2013
The data presented for health assessments (MBS items 704, 706, 710 to 1 May 2010 thereafter 715) included both the raw data and the number of adult health assessments expressed as a function of the population in each area, that is health assessments per 100 Aboriginal and Torres Strait Islander people aged ≥15 years in Sentinel Sites compared to the rest of Australia. The analysis excluded 0-14 years from the MBS 715 claims. We also reported the number of GPs who were billing for adult health assessments and the average number of adult health assessments per GP, as comparing sites in relation to these patterns provided some insight into factors underlying the trends in various contexts.
Follow-up items by a practice nurse, registered Aboriginal Health Worker (MBS item 10987) or allied health professional (MBS items 81300-81360) were only available to people who had undergone an adult health assessment. The data presented for follow-up items included raw data and the number of items claimed per 100 adult health assessments provided in each area and per 100 Aboriginal and Torres Strait Islander people.
The focus of the analysis was on trends in the uptake of the above Medicare items for Aboriginal and Torres Strait Islander people aged ≥15 years over time in 1) Sentinel Sites compared to the rest of Australia, 2) between individual Sentinel Sites, and 3) between Sentinel Sites in urban, regional and remote locations, and corresponding areas for the rest of Australia. It was only possible to complete the full complement of analyses for adult health assessments because the take up of follow-up items had been relatively low.
We also reported on the uptake of the relevant MBS follow-up items for adult health assessments: follow-up services by a practice nurse or registered AHW (MBS item number 10987) and follow-up by allied health professionals (MBS item numbers 81300-81360). These were presented as absolute numbers and also as a proportion of adult health assessments.
Data reported derive from routinely available data sourced from Medicare claims for specified items, supplemented with explanatory data obtained from in-depth interviews and/or focus group discussions with key informants at case study sites, enhanced tracking sites, tracking sites and state-wide organisations. Discussions with key informants at site-level specifically sought to elicit informants’ views on reasons for the trends that were observed in uptake of the adult health assessment and the relevant follow-up items as outlined below.
Limitations
There was a time delay between MBS claims being made and the data becoming available. The time delay was compounded by the need to receive data at least three months before reports were due in order to complete the analysis and ensure appropriate quality control. MBS data extraction was based on the date of service. MBS data were only captured when a claim had been processed by Medicare, commonly known as the date of processing. Typically 99% of claims for the reference period were processed by the end of six months after the reference period. For example, not all MBS claims for 2009 were processed in 2009; however we expected that by 30 June 2010 we would know 99% of the activity in 2009 on a date of service basis. Consequently while data presented always reflected the most recent data available at the time the data were not completely up to date at the time of the report publication.
It should also be noted that with the introduction of the ICDP the timeframes for undertaking an adult health assessments increased from two years to one year among adults aged 15 to 54 years. Health assessments for adults aged 55 years and over were annual both before and after the introduction of the ICDP.
The SSE had initially also sought MBS item use by Health Service and sector. This would have required identification of services provided at organisations that fall under section 19(2) of the Health Insurance
213
Sentinel Sites Evaluation: Final Report – Appendices – February 2013
Act compared to other services. As there was a long delay in data being collected and released for section 19(2), (greater than 12 months), this process was not suitable for the SSE.
It is important to note the following:
Data represent the uptake of MBS items for all Health Services within the boundaries of each Sentinel Site and therefore reflect the overall activity of all services within the site. The data are not directly attributable to any specific Health Service. These data include services delivered to patients visiting from outside the site boundaries, and do not include services delivered to patients outside the site boundaries – therefore numbers per population may over- or under-estimate population coverage of service items depending on local patterns of service utilisation.
Data presented in this report reflect billing for MBS items and do not necessarily accurately reflect the provision of clinical care by providers. Some providers may be carrying out adult health assessments and follow-up health services or some components of these services without submission of relevant claims to Medicare.
In order to provide follow-up for allied health professionals (MBS items 81300-81360) under the MBS, allied health professionals must be registered with Medicare and issued with a provider number. DoHA does not collect data regarding the number of allied health professionals who are providing non-MBS services. The extent of follow-up services provided by allied health professionals is not accurately reflected in the Medicare claim data reported here.
Aboriginal and Torres Strait Islander people are also likely to be accessing MBS items in the same way as the general population. Care provided to Aboriginal and Torres Strait Islander people under general MBS items is not presented - these data were not available for the SSE purposes.
MBS data extraction is based on the date of service. However, MBS data are only captured when a claim has been processed by Medicare, commonly known as the date of processing. Typically 99% of claims for the reference period are processed within six months. For example, not all MBS claims for 2009 are processed in 2009, however, we would expect that by 30 June 2010 we would know 99% of the activity in 2009 on a date of service basis.
The data available for analysis for the SSE for inclusion in this report are for a 39 month period between March 2009 and May 2012 inclusive. This includes a 12 month ‘baseline’ period (March 2009 to February 2010 inclusive) which preceded the implementation of the ICDP and a 27 month period (March 2010 to May 2012 inclusive) which covered a period coinciding with the early implementation of the ICDP. The inclusion of the baseline period is to allow an assessment of levels and trends in uptake prior to the implementation of the ICDP.
As explained in relation to limitations of available population and remoteness classification data above, the population data used to derive uptake of MBS items per 100 Aboriginal and Torres Strait Islander people are based on the ABS projections from the 2006 Census. Comparisons between the 2011 Census and the 2006 Census showed particularly large increases in the percentage of the population identified as Aboriginal and Torres Strait Islander people in some sites. The large increases in population numbers in some sites may indicate relatively large undercounts in the 2006 ABS population projections, and this means that uptake of administrative items based on these population data may be overestimated to varying degrees in different sites.
214
Sentinel Sites Evaluation: Final Report – Appendices – February 2013
Provider data
Data definition
Data were collected on claiming by providers’ of the following MBS items:
Health assessment for Aboriginal and Torres Strait Islander people (MBS item 704, 706, 708, 710 to 1 May 2010 thereafter 715).
Follow-up allied health services for Aboriginal and Torres Strait Islander people (MBS items 81300-81360).
Follow-up health services provided by a practice nurse or registered Aboriginal Health Worker (MBS item 10987).
Items were extracted quarterly from March 2009 to May 2012. Items were extracted by age (0-14, 15-54, 55+, ≥15 years and total) and by area where the service was provided; Sentinel Sites and the rest of Australia classified by State and ASGC-RA remoteness based on area of service. It should be noted that additional age categorisations were required for this analysis to prevent double counting of providers.
Data transformation
Data on providers of MBS items (MBS items 704, 706, 710 to 1 May 2010 thereafter 715, 10987, 81300-81360) were included in the analysis, based on the date each service was provided. Data extraction included a number of age breakdowns (0-14, 15-54, 55+, ≥15 years and total) aggregated by urban, regional and remote locations for Sentinel Sites and the rest of Australia by adding services across categories. Figures for the rest of Australia by urban, regional or remote locations were obtained by subtracting data for the Sentinel Sites from the total for Australia.
Rationale for the approach
The analysis of data on providers of MBS health assessment (MBS items 704, 706, 710 to 1 May 2010 thereafter 715) and follow-up items (MBS 10987, 81300-81360) used the same approach as for the analysis of the items themselves. It was expected that the ICDP program would affect both the number of participating providers and would also impact on the number of items claimed by each provider. The extent to which any observed change in the uptake of MBS items was driven by these factors would be expected to vary between areas. Accordingly the analysis tracked trends in the number of providers making claims and the number of items claimed per provider throughout the baseline period (defined as a year before the introduction of the ICDP) and through the period of implementation. The analysis focused on trends in uptake rather than a simple pre-post comparison in order to better inform the development of the intervention.
Analysis
The introduction of MBS items health assessment and follow-up items predated the introduction of the ICDP. The uptake of these items was expected to be affected by the introduction of the PIP Indigenous Health Incentive and the PBS Co-payment measure in May 2010. The data extracted on MBS items included quarterly data from the March 2009-May 2012. The period from March 2009 -February 2010 is considered the baseline period. This final evaluation period includes data from March 2009 -May 2012.
The presentation of data on claiming providers included only the number of claiming GPs per 100 Aboriginal and Torres Strait Islander people and the average number of items (MBS item (704, 706, 708, 710 to 1 May 2010 thereafter 715) claimed per GP. The former were indices of the level of participation
215
Sentinel Sites Evaluation: Final Report – Appendices – February 2013
by GPs, while the latter were indicators of amount of work done by GPs in each area. Similar analysis of follow-up items (MBS items 81300-81360, 10987) was not possible because of limited take up.
For each of the indices described the analysis focused on trends over time in 1) Sentinel Sites compared to the rest of Australia, 2) between individual Sentinel Sites, and 3) between Sentinel Sites in urban, regional and remote locations and corresponding areas for the rest of Australia.
Limitations
Data on the number of GPs claiming MBS items had the same limitations that applied to the MBS items themselves.
It is important to note that the data presented may not have fully captured GPs’ activity because GPs may not always have claimed all relevant activity through Medicare, providers may have delivered services through MBS items not included in the data extraction and providers may have provided additional services to Aboriginal and Torres Strait Islander people outside the boundaries of the Sentinel Sites.
The analysis would have been enhanced if data about GP participation in ICDP measures could have been understood in the context of the overall GP workforce in each area. Accurate GP workforce figures were not available for the SSE.
PBS Co-payment measure data
Data definition
PBS Co-payment measure data specified for the SSE included:
number of people accessing PBS Co-payment measure prescriptions
the concessional status of people accessing PBS Co-payment prescriptions
PBS Co-payment measure prescriptions by Anatomical Therapeutic Chemical (ATC).124
Data were extracted by concessional status, age (0-14, 15-54, 55+ years) and by patient’s postcode; Sentinel Sites, and the rest of Australia classified by State and ASGC-RA. PBS Co-payment measure data were based on when a medicine was supplied. In a small number of cases there may have been time lags between the medicine being supplied and a claim being made for this service. As data were extracted at different times for evaluation cycle there may be discrepancies in PBS Co-payment measure data extracted at different times. For the SSE Final Report PBS Co-payment measure data were re-extracted for the whole evaluation period (September 2010 – May 2012), by Sentinel Sites and rest of Australia by remoteness with the date of processing of 11 September 2012.
Sentinel Sites postcodes are listed within the site description tables in Appendices B.
Data transformation
Data on the PBS Co-payment measure were included in the analysis by Sentinel Site and by urban, regional or remote locations and the rest of Australia. Figures for the rest of Australia by urban, regional or remote locations were obtained by subtracting data for the Sentinel Sites from the total for Australia. The ATC classifications were recoded into Diabetes, Cardiac conditions, Obstructive airway diseases, Antibacterial, Antipsychotic and Other. 124 Anatomical Therapeutic Chemical Classification [website] (accessed 6 December 2012).
216
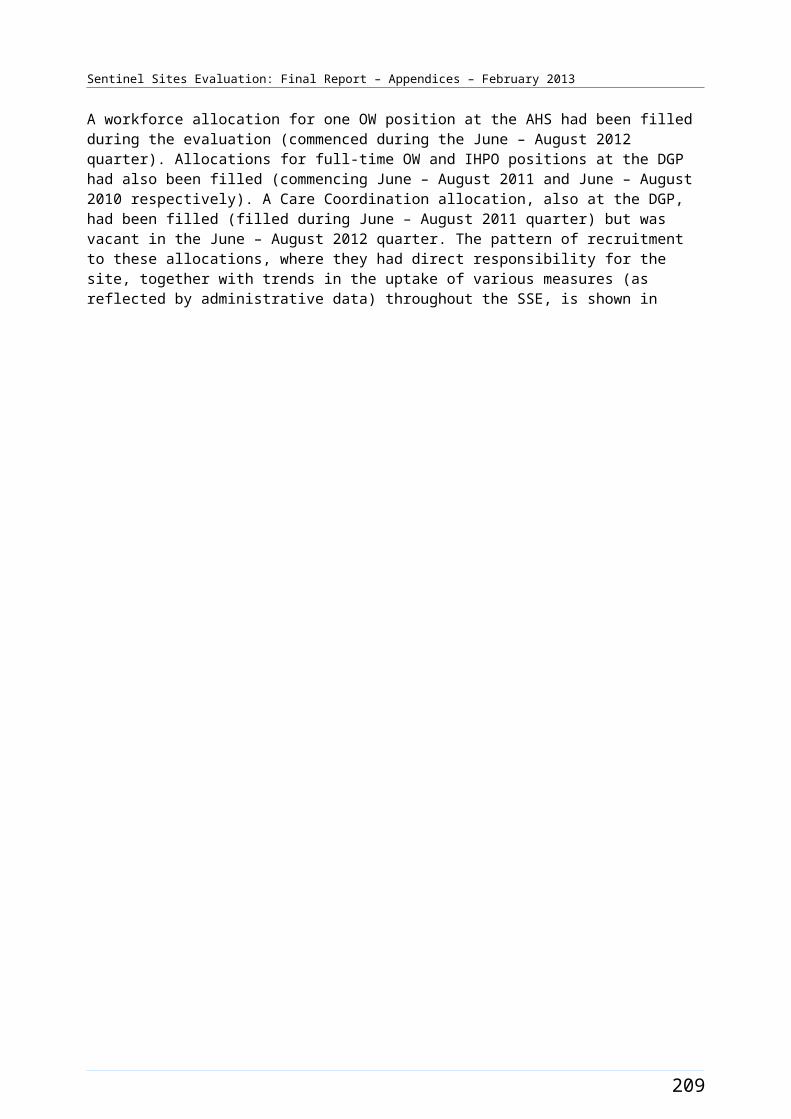
Sentinel Sites Evaluation: Final Report – Appendices – February 2013
Rationale for the analysis
The PBS Co-payment measure was introduced in July 2010. Data are presented for the period September 2010 – May 2012. The analysis of these data tracked trends over time in the uptake of this program following commencement of the PBS Co-payment measure. The analysis on trends in the concessional status of patients receiving medications through the PBS Co-payment measure aimed to assess the extent to which the program is reaching the most disadvantaged members of the Aboriginal and Torres Strait Islander community. It also tracked trends in the type of medicines supplied through the program. The ICDP was primarily intended to increase access to chronic disease medicines, although it would be expected to have incidental effects on improving access to other medicines that might have a role in improving health more generally or preventing the development of chronic disease (e.g. antibiotics). PBS data also included information on the uptake of Nicotine Replacement Therapy.
While the ICDP program was a new initiative it was preceded by and co-existed with other initiatives to improve access to medicines among Aboriginal and Torres Strait Islander people including Quality Use of Medicines Maximised for Aboriginal and Torres Strait Islander People (QUMAX) Program125 in urban and rural areas, and the supply of medicines to patients of remote area Aboriginal and Torres Strait Islander Health Services through Section 100 supply arrangement of the National Health Act (S100 supply arrangement). The analysis of PBS Co-payment measure data was considered in the context of these programs where relevant.
Analysis
Data on the raw number of prescriptions and the number of prescriptions per 100 Aboriginal and Torres Strait Islander people were analysed overall and for:
concessional and safety net status of patients
type of medicines dispensed.
The number of PBS Co-payment prescriptions by ATC classification and age (15-54, 55+ years) for Sentinel Sites and the rest of Australia were analysed. Data were also provided for the supply of Nicotine Replacement Therapy. The focus of the analysis was on the relationship between the following factors on the balance of people with different concessional status receiving medicines and the type of medicines dispensed:
Aboriginal and Torres Strait Islander people aged ≥15 years, and Health Services, in Sentinel Sites compared to Health Services in the rest of Australia
between individual Sentinel Sites
between Sentinel Sites in urban, regional and remote locations and corresponding areas for the rest of Australia (where possible).
Limitations
Data were not provided on the number of patients registered for the PBS Co-payment measure at an area level. This meant it was not possible to track trends in the number of patients accessing the measure as a proportion of the total number of eligible patients. However it should be noted that it would be difficult to interpret such data in the absence of data on the appropriateness of the medicines supplied. Data on the number of Aboriginal and Torres Strait Islander people in each area with specified conditions was also not available.
125 5th Community Pharmacy agreement, Program Specific Guidelines, June 2011 (accessed 6 December 2012).
217
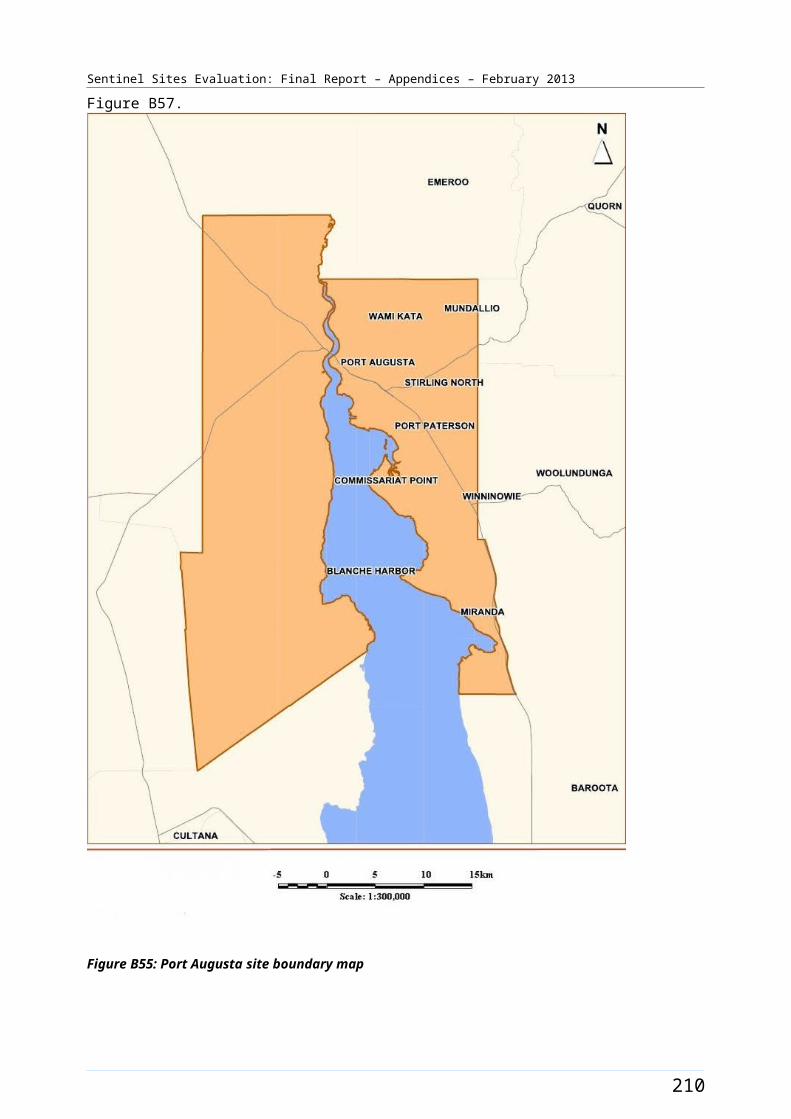
Sentinel Sites Evaluation: Final Report – Appendices – February 2013
PBS Co-payment measure prescriptions were assigned to Sentinel Sites and the rest of Australia using postcodes of the residence of patients receiving the medication (not the pharmacy postcode). This means that PBS used by patients who used services in Sentinel Sites but live outside those sites were not included.
Unlike the MBS data PBS Co-payment data could not be extracted by SLAs. To closely map the PBS data extraction by postcodes with the Sentinel sites SLA boundaries, the ABS provided, 2009 concordance for SLAs and postal areas, was used. Some postcodes were excluded considering the number of Aboriginal and Torres Strait Islander population or the vast geographical coverage within the postcodes concerned. Due to this limitation the extracted PBS Co-payment data did not exactly match the Sentinel Sites boundaries.
As explained in relation to limitations of available population and remoteness classification data above, the population data used to derive uptake of MBS items per 100 Aboriginal and Torres Strait Islander people are based on the ABS projections from the 2006 Census. Comparisons between the 2011 Census and the 2006 Census showed particularly large increases in the percentage of the population identified as Aboriginal and Torres Strait Islander people in some sites. The large increases in population numbers in some sites may indicate relatively large undercounts in the 2006 ABS population projections, and this means that uptake of administrative items based on these population data may be overestimated to varying degrees in different sites.
It should be noted that PBS Co-payment data describes the medicines dispensed to patients. The data were therefore not necessarily an exact reflection of how medicines were prescribed or used by patients.
The PBS Co-payment measure was a new program and as such it was not possible to track medication use over time from before implementation of the measure (at individual or population level) using the data from the program alone. Such an analysis would have been possible if data could be linked at the individual patient level for the PBS Co-payment and general PBS data.
Section 100 supply arrangement data
Data definition
Some of the Sentinel Sites were in remote locations and fall under the special provisions of Section 100 of the National Health Act 1953 (S100 supply arrangements). This allowed patients of approved remote area Aboriginal Health Services to receive PBS medicines directly from the Health Service at the time of medical consultation, without the need for a normal prescription form, and without charge. Reporting on the supply of medication for these sites without the S100 supply arrangement data would therefore be incomplete. S100 supply arrangements were not affected by PBS availability; there may have been medication usage increases due to the other ICDP measures (for example due to improved access to services). Accordingly S100 supply arrangement data were included in the report in order to provide a more comprehensive picture of the impacts of the program.
The data extraction protocols matched that for the analysis of the PBS Co-payment measure with the one major difference that the S100 supply arrangement data were bulk supplied so no data could be obtained on the characteristic of individuals to whom medicines were supplied. The extraction focused on medicines supplied by Anatomical Therapeutic Chemical Classification (ATC) (e.g., A10, C10, C01-04, C07-09, R03, J01).
218

Sentinel Sites Evaluation: Final Report – Appendices – February 2013
S100 supply arrangement data were not compared with the PBS Co-payment measure or any other data sets. PBS Co-payment data includes the supply of medicines to individuals while S100 supply arrangement data concerns the supply of medicines to Health Services. S100 supply arrangement data included medicines for people of all ages.
Data transformation
Data for S100 supply arrangement was coded into Sentinel Sites and the rest of Australia by DoHA based on the location of remote area Aboriginal Health Services. Data on the supply of medicines to patients of remote area Aboriginal and Torres Strait Islander Health Services through Section 100 supply arrangement was provided with PBS codes. These were coded into ATC classifications and recoded in the same manner as the PBS Co-payment measure data. A small number of items were provided with no valid PBS code and no description of the medicine provided. These data were not used in analysis.
Rationale for the approach
The S100 supply arrangements predate the introduction ICDP program. However in the SSE we were primarily interested in the impact of the ICDP measures. The inclusion of Section 100 supply arrangement data for remote areas was to improve the robustness of the analysis in remote areas. The analysis therefore tracks trends in the use of medicines through S100 following commencement of the implementation of the PBS Co-payment measure.
Analysis
The PBS Co-payment measure was introduced in July 2010. Data were presented for the period March 2009 – May 2012 in order to assess the impact of the PBS Co-payment measure on the supply of medicines through S100 supply arrangements. While this did not provide a complete picture of medicine use in remote areas it did provide examples of how the ICDP program interacted with the S100 supply arrangement to improve the management of adults with chronic disease.
The focus of the analysis was on trends over time in the supply of medicines to Aboriginal Health Services in Sentinel Sites compared to Health Services in the rest of Australia.
Limitations
The primary limitation of S100 supply arrangement data was that it did not include any data on the individuals to whom medicines were supplied. While it would be possible to link these data to type of Health Service this was not appropriate in the context of this analysis where the primary focus is on the PBS Co-payment measure where such links cannot be made.
PIP Indigenous Health Incentive data
Data definition
The PIP Indigenous Health Incentive had three components:
sign-on payment: a one-off payment of $1000 to Health Services that registered for this incentive
patient registration payment: an annual payment to Health Services of $250 for each registered Aboriginal and Torres Strait Islander patient aged 15 years and over, over the calendar year
outcomes payments:
219

Sentinel Sites Evaluation: Final Report – Appendices – February 2013
Tier 1 - $100 to Health Services for each registered patient for whom a target level of care was provided by the Health Service in a calendar year.126
Tier 2 - $150 to Health Services for each registered patient for whom the majority of care was provided by the Health Service within a calendar year.127
Medicare generated reports for the PIP Indigenous Health Incentive which commenced in May 2010. Medicare made payments to PIP practices in the last week of February, May, August and November each year. Analysed data became available from the PIP program manager between 2-4 weeks after the payments.
The PIP program required patients to re-register each year. Re-registration occurred each year from the first of November in the previous year. The data reported reflects a decrease in registrations early in the year because not all previously registered patients would have re-registered by the end of the calendar year if they intended on doing so.
The data referred to:
Number of registered Health Services, by Health Service type (Aboriginal Health Service and General Practice) and urban, regional, remote locations for Sentinel Sites and the rest of Australia.
Number of registered patients by Health Service type (Aboriginal Health Service and General Practice) and urban, regional, remote locations for Sentinel Sites and the rest of Australia.
Number of patients registered in the current year that were also registered in the previous year by Health Service type (Aboriginal Health Service and General Practice) and urban, regional, remote locations for Sentinel Sites and the rest of Australia.
Number of Tier 1 payments by Health Service type (Aboriginal Health Service and General Practice) and urban, regional, remote locations for Sentinel Sites and the rest of Australia.
Number of Tier 2 payments by Health Service type (Aboriginal Health Service and General Practice) and urban, regional, remote locations for Sentinel Sites and the rest of Australia.
Number of patients who received both Tier 1 and Tier 2 payments by Health Service type (Aboriginal Health Service and General Practice) and urban, regional, remote locations for Sentinel Sites and the rest of Australia.
Number of patients registered for both the PIP Indigenous Health Incentive who were also registered for the PBS Co-payment measure by Health Service type (Aboriginal Health Service/General Practice) and urban, regional, remote locations for Sentinel Sites and the rest of Australia.
The data extraction requested was by service type and by area where the service was provided; Sentinel Sites, and the rest of Australia classified by State and ASGC-RA remoteness. The data made available for the SSE did not include any data on patient characteristics.
126 DoHA, Practice Incentives Program Indigenous Health Incentive Guidelines – September 2010 (accessed 6 December 2012).127 DoHA, Supporting Primary Care Providers to Coordinate Chronic Disease Management – Fact sheet (accessed 6 December 2012).
220

Sentinel Sites Evaluation: Final Report – Appendices – February 2013
Data transformation
The PIP Indigenous Health Incentive data were presented by Sentinel Sites and urban, regional, remote locations and states analysed as provided by the DoHA with no additional transformation. Data were aggregated by urban, regional, remote locations for Sentinel sites and the rest of Australia by adding services across categories.
It should be noted that in a small number of cases PIP services were delivered within Sentinel Sites boundaries, but the payments were made to an organisation outside the boundary of the site (e.g. where the service located in a Sentinel Site was a branch office of a service where the central office was outside the site). This meant that PIP payments made underestimated services delivered in these Sentinel Sites. This may have affected some AHSs and perhaps larger corporate General Practices.
Rationale for the approach
The PIP Indigenous Health Incentive was a new program so there is no directly comparable data prior to implementation of the measure. The success of the PIP Indigenous Health Incentive depended on uptake by Health Services and by patients. The analysis accordingly tracks trends over time since commencement of the implementation period.
Analysis
The PIP Indigenous Health Incentive payments commenced in May 2010. Data for this Final Report were presented by quarter for the period March 2010 - May 2012.
Our analysis examined trends in the number of Health Services registering by quarter. No data were provided on the overall number of eligible Health Services (those accredited and eligible for PIP). Trends in registration were analysed by examining the number of registrations that occurred in each quarter by area as a proportion of the total number of registrations at the end of the evaluation period (Sentinel Sites compared to the rest of Australia), service type and urban, regional, and remote locations.
The analysis also examined trends in the number of patients registering by quarter in relation to the relevant population.
Trends in registration were analysed by cumulative registrations as a proportion of population in each quarter by area (Sentinel Sites compared to rest of Australia), service type, and urban, regional, and remote locations.
Trends in the number of Tier 1 payments were assessed in relation to the Aboriginal and Torres Strait Islander population aged over 15 years in each area. The analysis used three quarter rolling averages (the average of the quarter before and after the current quarter) to show trends in Tier 1 payments. This approach enabled seasonal differences in the uptake of these measures to be assessed by area (Sentinel Sites compared to the rest of Australia), service type, and urban, regional, and remote locations.
Annual trends in the number of Tier 2 payments were assessed in relation to the Aboriginal and Torres Strait Islander population aged over 15 years by area (Sentinel Sites compared to rest of Australia), service type, and urban, regional, and remote locations.
The relationship between PIP Indigenous Health Incentive registration and PBS Co-payment registration.
Annual trends in the percentage of registered Aboriginal and Torres Strait Islander people who received no payments, Tier 1 payments, Tier 2 payments and Tier 1 and 2 payments.
221
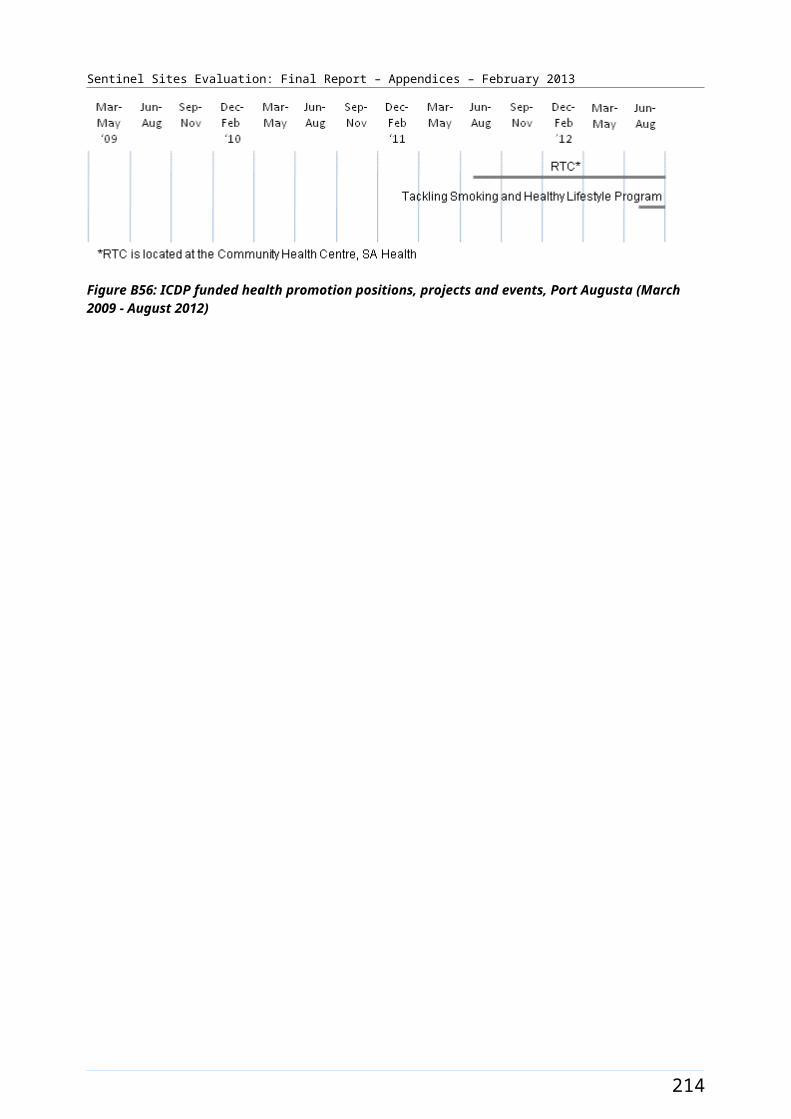
Sentinel Sites Evaluation: Final Report – Appendices – February 2013
Annual trends in the number of re-registrations for the PIP Indigenous Health Incentive and new registrations were assessed as at December 2010 - May 2011 compared to December 2011 - May 2012.
Limitations
The PIP program held no data on the demographic characteristics of the individuals who registered for the program and limited data on Health Services. In addition DoHA did not hold any data on the number of Health Services that may have been be eligible for the PIP Indigenous Health Incentive but had chosen not to sign up.
The trend analysis for different PIP Indigenous Health Incentive payments was based on different time periods. Tier 2 payments were only made once a calendar year. Registrations and Tier 1 payments occurred quarterly. This means that the impact of program activities across the three types of payments was difficult to establish.
The need to re-register patients means that there can be dramatic differences in the number of registrations from one quarter to the next particularly from the end of one calendar year to the beginning of the next. The PIP Indigenous Health Incentive payment data were presented as a function of the eligible population rather than the number of registrations to provide a more accurate picture of how the program was tracking over time.
As explained in relation to limitations of available population and remoteness classification data above, the population data used to derive uptake of MBS items per 100 Aboriginal and Torres Strait Islander people are based on the ABS projections from the 2006 Census. Comparisons between the 2011 Census and the 2006 Census showed particularly large increases in the percentage of the population identified as Aboriginal and Torres Strait Islander people in some sites. The large increases in population numbers in some sites may indicate relatively large undercounts in the 2006 ABS population projections, and this means that uptake of administrative items based on these population data may be overestimated to varying degrees in different sites.
Relationship between contextual variables, ICDP workers, and MBS, PBS Co-payment measure and PIP Indigenous Health Incentive data
Data definition
Contextual variables and number of ICDP workers were analysed in order to understand variations in trends in administrative data by Site. The contextual variables examined were:
SEIFA average of Relative Socio-Economic Disadvantage Index (2006)
percent of solo practices (2009-2010, 2010-2011)128
GP to population ratio (2010)129
rate per 100 000 of services claimed by GPs for Enhanced Primary Care items (2009-2010) 130
rate per 100 000 of practice nurse services claimed under MBS (2009-2010).131
128 Key Division of General Practice Characteristics 2010-2011 (accessed 3 September 2012).129 Ibid.130 Medicare Locals Population Health Profiles, July 2011. (accessed 3 September 2012).131 Ibid.
222
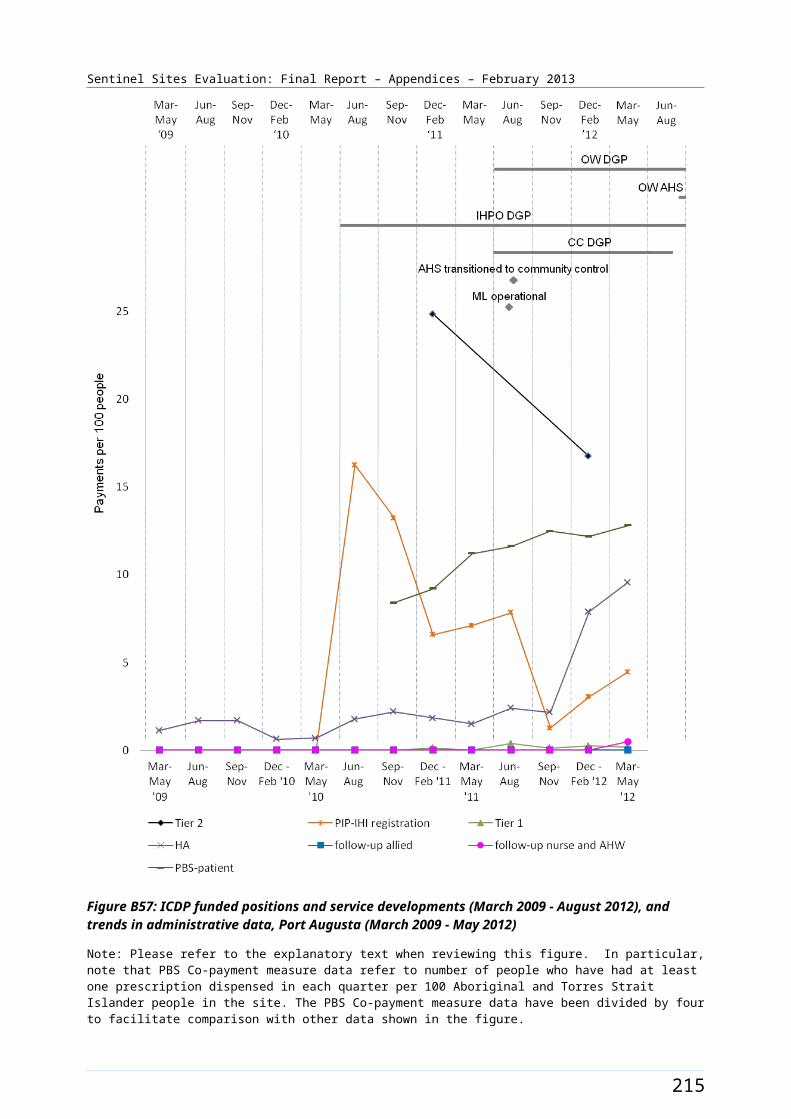
Sentinel Sites Evaluation: Final Report – Appendices – February 2013
The SEIFA index was included in the analysis to determine if socio-economic conditions in the site might have an influence on impact of the ICDP as reflected by the various impact variables included in the analysis. Similarly, the percent of solo practices in the DGP where the site was located was included in the analysis to determine if potential impact of the ICDP might have been affected by having a large proportion of solo practices. The percentage of solo practices also provided a proxy measure of the relative proportion of small practices as opposed to larger practices in the DGP. The GP to population ratio was included to measure the relative availability of GPs in each area. Use of Enhanced Primary Care Items was included to see the extent to which general care-co-ordination items were taken up more before the implementation of the ICDP. The percentage of practices using practice nurse services under the MBS was also used as a measure of the extent to which systems were in place which would assist the implementation of the ICDP program.
The types of ICDP workers included in the analysis included IHPOs in DGPs, OWs in DGPs and AHSs, and Care Coordinators in both sectors as these were the workers whose roles relate most directly to the impact variables identified above. This analysis was based on recruitment data provided by DoHA which have then been validated in most cases against the evaluation visit findings.
Data transformation
The data for contextual variables was provided by Sentinel Site location and analysed with minimal additional transformation. SEIFA Index data available from the Australian Bureau of Statistics websites by Statistical Local Areas (SLA) was compiled to closely map to the boundaries of Sentinel Sites. The data on claiming of GP services for Enhanced Primary Care items and practice nurse items per SLAs available from the Australian General Practice Network’s Medicare Local population health profiles were also compiled to map to the Sentinel Sites boundaries. The percentage of solo practices and GP to population rations was based on DGP boundaries, as data on GPs could not be mapped to the Sentinel Site boundaries.
Rationale for the approach
The rationale for the analysis was to identify which site level factors might be associated with the take up of the MBS, PBS Co-payment measure and PIP Indigenous Health Incentive components of the ICDP package. The analysis focused on the relationship between the number of ICDP workers per 100 population at 30 June 2011 and service use in the March 2012 - May 2012 quarter because it was expected that workers would need to have been active in a site for some time before their activities could influence patterns of service utilisation.
Analysis
The relationship between contextual variables and ICDP workers and service use variables were assessed using Spearman’s correlation. The service use variables included were:
PIP Indigenous Health Incentive registration per 100 Aboriginal and Torres Strait Islander people (March - May 2012 quarter)
Tier 1 payments per 100 Aboriginal and Torres Strait Islander people (between December 2011 - May 2012)
Tier 2 payments made in 2011 per 100 Aboriginal and Torres Strait Islander people
adult health assessments per 100 Aboriginal and Torres Strait Islander people (March - May 2012 quarter)
follow-up allied health services per 100 Aboriginal and Torres Strait Islander people (March - May 2012 quarter)
223
Sentinel Sites Evaluation: Final Report – Appendices – February 2013
follow-up services provided by a practice nurse or registered Aboriginal Health Worker per 100 Aboriginal and Torres Strait Islander people (March - May 2012 quarter)
patients accessing the PBS Co-payment measure per 100 Aboriginal and Torres Strait Islander people (March - May 2012 quarter).
Limitations
In addition to the limitations already listed in relation to the service use variables there were a number of limitations associated with the analysis of contextual variables. The variables used had to be drawn from data sources that did not always reflect the same time period and did not necessarily have a time frame that overlapped as discussed below.
As SEIFA Index is only a relative measure, not an absolute measure of socio-economic disadvantage and provides an average for the area for which the SEIFA data are reported. The data therefore did not reflect smaller pockets of disadvantage in a larger area where the majority of the population were relatively more advantaged.
The data sources used for SEIFA, Enhanced Primary Care and Health Services using practice nurse items were based on SLA boundaries existing in 2006. The data were presented by SLA and required to be mapped to Sentinel Site boundaries. For the majority of sites the mapping process of SLA to site boundary was straightforward. For some sites all of the site boundary and a variation to the data development were required. In some cases where SLAs had small populations, they had been grouped together to form larger populations. In these cases an average of the data for the total Medicare Local boundary had been used for the sites affected (for example, North Lakes/Caboolture, Brisbane South, Logan/Woodridge sites).
The numerators for the workforce recruitment data were based on information provided by DoHA. Where applicable other sources of information including personal communication with DGPs and AHSs and evaluation visit updates were also used to verify recruitment status of the workers.
Percent of solo practices and GP to population ratio were based on information available for the whole of the Division of General Practice 2010–2011 for all sites. There were no similarly comprehensive data available for the specific areas covered by the Sentinel Sites.
Community focus group data
Community focus groups were used to gather information on community awareness and perceptions of health system functioning, and if and how the various measures of the ICDP were contributing to change and improvements of the health system at the local level.
Evaluation processes
The SSE aimed to have at least two community focus groups in each case study site for each evaluation cycle. The key stakeholder organisations assisted with the organisation of these groups. The aim was to include people from different groups within the local community, ensuring that people with experience of chronic illness were included in at least one of the groups. The preferred number of participants to be included in a focus group was between eight and twelve people. Strategies used for obtaining the preferred number and type of participants in focus groups, included:
developing site plans prior to each site visit, which included details on engagement of key liaison person/s at each site who represented services and potential community groups
224
Sentinel Sites Evaluation: Final Report – Appendices – February 2013
ensuring clear and consistent communication with site stakeholders who had agreed to organise focus groups; and
gaining cooperation of local site stakeholders, including building relationships with key liaison people and decision makers, being sensitive to needs of local community organisations, and flexibility in how evaluation processes can fit with routines and resources of local organisations.
A focus group framework was developed specifically for the SSE to collect data on eight components (or themes) related to chronic disease and chronic illness care. These components were derived from the National Framework and were linked back to individual ICDP measures (or groups of measures) for reporting purposes (see Table C2).
Qualitative data were collected on each component through group discussion. A group perspective on individual components was assessed using a scoring range from 0-11 (higher scores suggest better functioning health systems). The score was used primarily as a group facilitation technique. This approach enabled the SSE to provide an assessment of community awareness and perceptions for each component, across sites and over time, using a standardised and systematic framework.
225
Sentinel Sites Evaluation: Final Report – Appendices – February 2013
Table C2: Components of the focus group framework
Priority Areas Component Measure Description
Part A: Fixing the gaps and improving the patient journey
Component 1
Measure C1 Workforce Support and Training
Measure C2 Outreach Worker in AHS
Measure C3 Outreach Worker and IHPO in DGP
Part B: Tackling chronic disease risk factors
Component 2 Measure A1 Tackling Smoking
Component 3 Measure A2 and B3 Healthy Lifestyle
Component 4 Measure B4 Self-management of Chronic Disease
Part C: Primary health care services that deliver improved chronic disease management and follow-up care
Component 5 Measure B3 Part A PIP Indigenous Health Incentive
Component 6 Measure B1 PBS Co-payment measure
Component 7Measure B5 Part A Urban Outreach – USOAP
Measure B5 Part B Rural Outreach – MSOAP ICD
Component 8 Measure B3 Part B Care Coordination and Supplementary Services
Community focus groups were conducted by a trained facilitator and an observer from the SSE team. The focus group framework was used as a guide to facilitate group discussion and elicit key points of agreement or difference amongst participants. The facilitator’s role was to encourage group consensus on a score for each component and gather detailed explanations for why the group decided on a particular score. The observer’s role was to note interactions and nuances in the group and to provide an independent interpretation of the groups’ discussion. The observer also scored the quality of aspects of the local health system based on his/her observations and explanations for their score. The intention of the observer score was to provide a moderated measure that is standardised across sites, groups and between reporting periods.
Written consent was obtained from individual participants before commencing the focus group process.
In order to recruit community members for focus groups, the SSE worked with local contacts at each case study site, where possible both at the DGP and AHS stakeholder organisations. This strategy ensured community participant privacy and confidentiality as the SSE did not have access to contact details of potential participants. It also supported stronger community engagement in this activity, because participation in the group was promoted and/or endorsed by a health professional known to the community members.
According to local preferences for various methods of communication, recruitment was via personal interaction and word of mouth. At times, focus group participants were drawn from existing community groups administered by the stakeholder organisation, e.g. a DGP community reference group, a diabetes support group, arts group or youth group.
The SSE promoted the principles of cultural safety, equity and beneficence being observed in the recruitment processes. Every effort was made to support engagement of participants from a range of backgrounds and regardless of literacy levels. In situations where it was necessary to support understanding and communication (e.g. in remote sites), group discussions were facilitated in the most appropriate language, where necessary with the assistance of a suitably skilled interpreter. Cultural
226
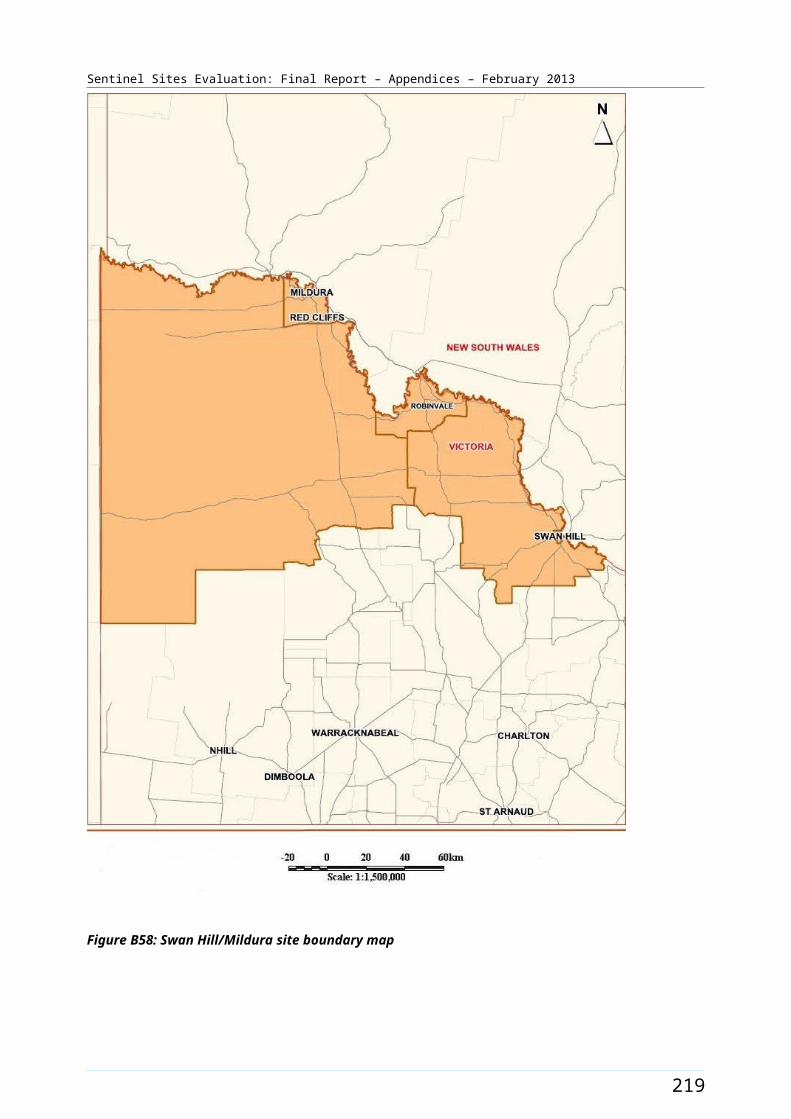
Sentinel Sites Evaluation: Final Report – Appendices – February 2013
protocols were observed, for example female SSE facilitators and observers provided for women's groups and male facilitators and observers provided for men's groups.
The following broad recruitment criteria were provided to local contacts involved in helping with recruitment as a guide to the identification of potential focus group participants. Focus group participants should:
be a member of Aboriginal or Torres Strait Islander community
have a diagnosed chronic condition or at risk of developing a chronic condition
have experience of using the Health Services operating in the site
have participated in previous SSE focus groups (not relevant to initial cycles of the evaluation)
consent to participate in a group discussion.
These criteria were guidelines rather than absolute requirements. Community members who did not meet all of these criteria, but who expressed interest in participating were not excluded.
In liaising with the local contacts who were facilitating the organisation of focus groups, the SSE team made it clear that in cases where community members may be prohibited from attending due to disability or impairment, efforts would be made to facilitate their participation, e.g. by providing transport, encouraging a family member to assist etc.
Community members who had recently experienced family bereavement were not approached for focus groups. However, if such a community member came forward with an interest to participate, they were welcome to attend.
The focus group discussions were of 90 minutes duration on average and each focus group was audio recorded for data translation purposes.
Management of data and analysis
After each focus group, the audio recordings were played back and used to supplement notes taken by both the observer and the facilitator at the time of the focus groups. The aim of this process was to ensure accuracy and completeness of information and to obtain verbatim quotes for each component across all focus groups. Members of the SSE team synthesised the key points and quotes from discussions and entered this information as text into a data management system (NVivo)132.
Data matrices were prepared for each measure and included verbatim quotes, discussion notes and the component scores given by the group participants and the observer.
Further analysis of the focus group data is described in more detail below in the section on interview data.
During a series of analysis workshops with all members of the SSE team, the focus group data were reviewed against the ICDP program logic indicators and evaluation questions relevant to the SSE. Through this process, the team identified key themes and patterns for each measure area, and barriers and enablers to implementation of ICDP measure activities at site levels. Verbatim quotes are used to illustrate the emerging themes and patterns. Observer and group component scores were used to identify points of difference over reporting periods and/or between sites and to identify areas for further analysis and development of plausible explanations for variations.
132 NVivo Research Software [website] (accessed 10 December 2012).
227
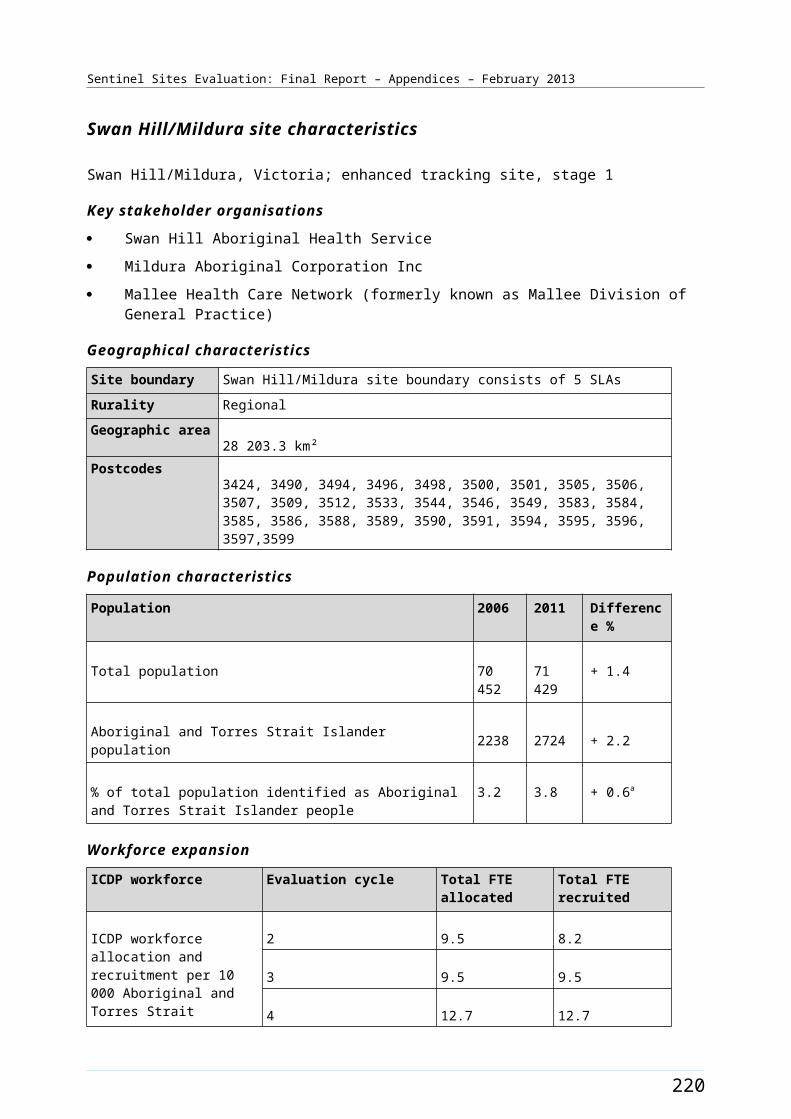
Sentinel Sites Evaluation: Final Report – Appendices – February 2013
Findings were considered in the context of any potential bias that might be related to the composition of the focus group.
Limitations
It is important to note that community member perceptions related to all individual ICDP measures were not gathered from all community focus groups across all case study sites. This was predominately due to group participants prioritising their group discussion on other areas of the ICDP because they felt there was no change since the previous reporting period. In some cases time constraints on the focus group also prevented discussions on some components of the ICDP measures. The approach of allowing the discussion to focus on priority issues of relevance at each specific site for each evaluation cycle enabled the team to explore selected priority issues in more depth with a particular focus on changes on the ground and barriers and enablers to change.
The SSE team reliance on the cooperation of staff of the key stakeholder organisations in assisting with organising the focus groups presented some challenges in organising the number of groups required at each site. It was an important principle of the ICDP related evaluations to not impose unnecessary demands on service organisations, and we needed to be sensitive in our approach to requesting assistance from local organisations.
In conducting focus groups, the SSE was also dependent on the goodwill of community members to take the time to participate and to engage actively in the discussion. All efforts were undertaken to ensure interactions were positive and constructive.
While the preferred number of participants in a focus group was between 8 and 12 people, in some instances we needed to work with smaller or larger groups. Reasons for focus groups having less than 8 people included people feeling more comfortable and more willing to engage in a smaller group (with the consequence that a smaller group may result in better quality data); difficulty finding a convenient time for larger numbers of people; difficulty identifying people who were willing and/or who had the time to participate. Reasons for focus groups having more than 12 participants in some instances included: large numbers of people wanting to be involved; people being more comfortable with participating in a larger group; larger numbers of people only being available at one specified time (with the consequence that if they were not included they would not be available to provide input at another time).
228
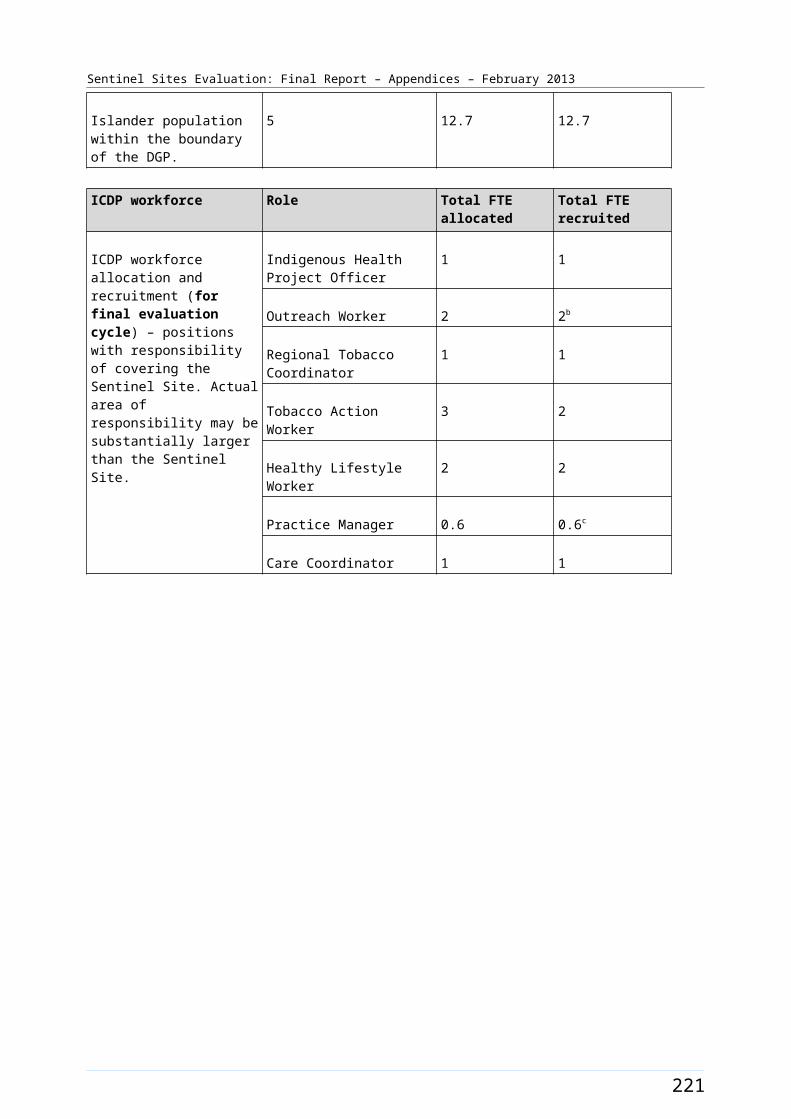
Sentinel Sites Evaluation: Final Report – Appendices – February 2013
Key informant interview data
Interviews were conducted with key informants to gain insight into stakeholder awareness and perceptions of issues relevant to the implementation of the ICDP in case study sites and also enhanced tracking sites.
Evaluation processes
Case study sites
There were a number of types of interview forms, each designed for use with a specific group of respondents depending on their role in relation to the ICDP and the information they may have been able to provide (see Table C3 for a listing of the SSE interview tools and respondent types). It is important to note that not all issues covered by the interview tools were relevant for all respondents. Prior to each interview the SSE team ascertained what areas of inquiry were relevant to the respondent based on an assessment of the respondents area of responsibility and the state of implementation of the measure at national, site and organisation level. The interview tools were used in the case study sites only. The interview data therefore relate to case study sites where relevant measures were implemented, and to respondents who had specific roles in relation to the relevant measures. The number of interviewees who provided data on specific issues varied, as reflected in the interview data tables.
Enhanced tracking sites
The SSE team visited and facilitated feedback sessions with key stakeholders at the enhanced tracking sites on an annual basis. Menzies provided information about the SSE and facilitated a feedback session on the administrative data relevant to each site as provided by the DoHA. Interviews and discussion groups in the enhanced tracking sites focused on key issues emerging from the general evaluation and key issues of relevance to the specific site. The data derived from interviews and discussion groups in enhanced tracking sites have been used to supplement the data from the case study sites.
Tracking sites
The tracking sites had one evaluation visit only during the SSE and the purpose of this visit was primarily for feedback to stakeholders on administrative data. During these feedback sessions staff of key stakeholder organisations often offered insights into reasons for the patterns in the administrative data, and this information was collated and used to supplement the data from case study and enhanced tracking sites.
229

Sentinel Sites Evaluation: Final Report – Appendices – February 2013
Table C3: Interview tools
SSE Interview Tools Respondent Type Organisation TypeSSE Managers and Project Officers interview
Chief Executive OfficerDeputy CEOProgram ManagerIndigenous Health Project Officer
Division State Based OrganisationNACCHO State or Territory AffiliateWorkforce AgencyAboriginal Health ServiceDivision of General Practice/Medicare Local
SSE Clinician interview General Practitioner/Medical OfficerPractice NurseSenior Aboriginal Health Worker
Aboriginal Health ServiceGeneral Practice
SSE Practice Manager interview Practice Manager Aboriginal Health ServiceGeneral Practice
SSE Healthy Lifestyle Worker interview
ICDP funded Healthy Lifestyle Worker
Aboriginal Health Service
SSE Tobacco Action Worker interview
ICDP funded Tobacco Action Worker
Aboriginal Health Service
SSE Regional Tobacco Coordinator interview
ICDP funded Regional Tobacco Coordinator
Aboriginal Health Service
SSE Outreach Worker interview ICDP funded Outreach Worker Aboriginal Health ServiceDivision of General Practice/Medicare Local
SSE Care Coordinator interview ICDP funded Care Coordinator Aboriginal Health ServiceDivision of General Practice/Medicare Local
SSE USOAP Specialist interview Health Professionals funded under USOAP
n/a
SSE MSOAP-ICD Specialist / Multidisciplinary interview
Health Professionals funded under MSOAP-ICD
n/a
SSE Pharmacist interview Pharmacist n/a
Note: Respondents are from a variety of stakeholder organisations such as Aboriginal Health Services, General Practice, Divisions of General Practice, NACCHO affiliates, Workforce agencies and Divisions State-Based Organisations.n/a = not applicable.
230
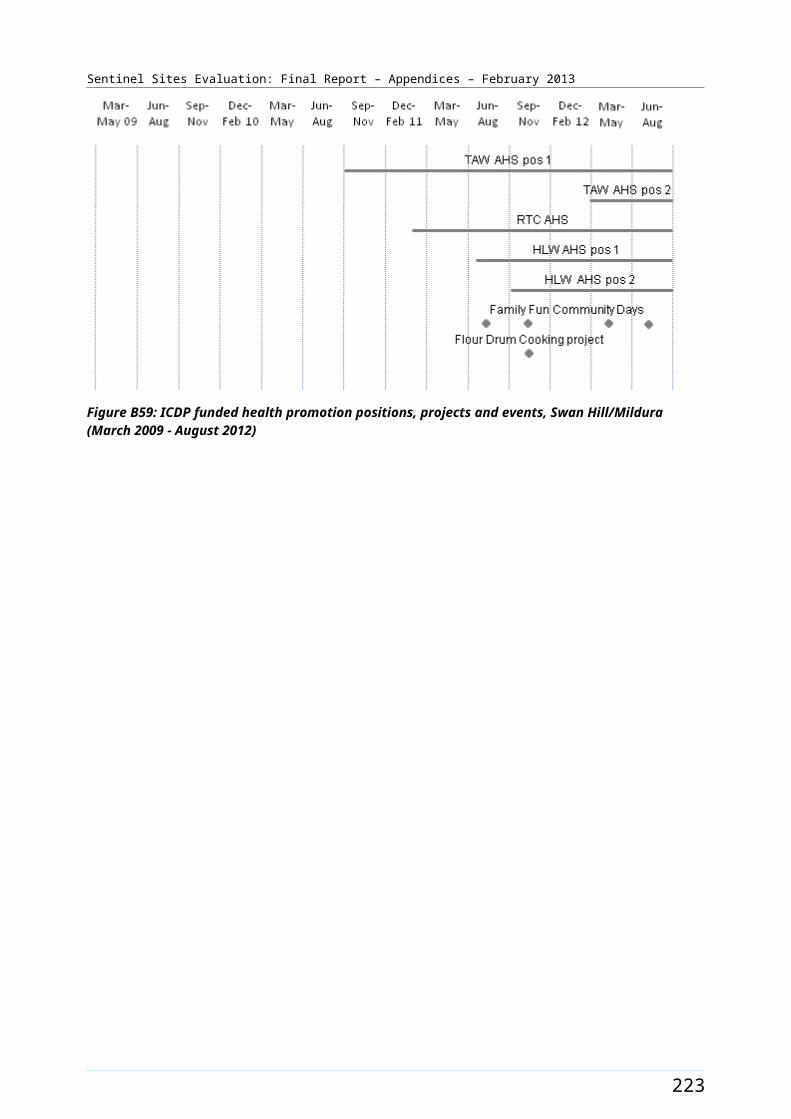
Sentinel Sites Evaluation: Final Report – Appendices – February 2013
A number of different interview forms were used in interviews. Each form was tailored to cover the topics of relevance to specific groups of interviewees. There was, however, substantial overlap in content between most interview forms allowing us to obtain responses to the same standard questions from the range of interviewees for whom specific questions were relevant. Table C4 provides a list of the different types of interview forms used for the purposes of the SSE and the acronyms used to describe each form.
Table C4: Types of key informant interviews
Name of interview form [describes type(s) of respondent] Acronym
Clinician CS
Manager and project officer MS
Pharmacist PS
Practice manager PM
Regional Tobacco Coordinator RTC
Tobacco Action Worker TAW
Healthy Lifestyle Worker HLW
Care Coordinator CC
Outreach Worker OW
Medical Specialist Outreach Assistance Program – Indigenous Chronic Disease Provider MSOAP
Urban Specialist Outreach Assistance Program Provider USOAP
Stakeholder consent was obtained prior to interviews. The stakeholder interviews were conducted by the SSE team during visits to case study sites. If stakeholders were unavailable at the time of the site visits, interviews were conducted over the phone either prior to or after the case study visit.
The interview tools include both closed statements and open-ended questions. The open-ended questions were designed to elicit explanatory type information relating to the various measures. A series of prompts were developed to facilitate open-ended enquiry by interviewers in relation to specific issues. The open-ended questions and prompts were refined on the basis of our experience from the evaluation cycles and in response to feedback from the DoHA following their review of the evaluation reports. The questions and prompts had a particular emphasis on collecting more in-depth data on changes on the ground, how and why changes have occurred and on barriers and enablers to change. The closed statements were designed to obtain responses on a four point Likert scale, from strongly agree to strongly disagree, with an additional option of ‘don’t know/can’t say’. This approach allowed us to use a standard response framework for almost all indicators. The response option of ‘don’t know/can’t say’ was used when respondents genuinely cannot decide on their response or if they feel uncomfortable with providing a response to the statement for any reason. It should be noted that the closed questions also ‘set the scene’ for the open ended questions to follow.
The interviewers were actively engaged in the process of refinement of the interview tools and participated in planning sessions that were designed to develop understanding and enhance skills, to ensure the collection of relevant data for the purposes of the SSE.
231
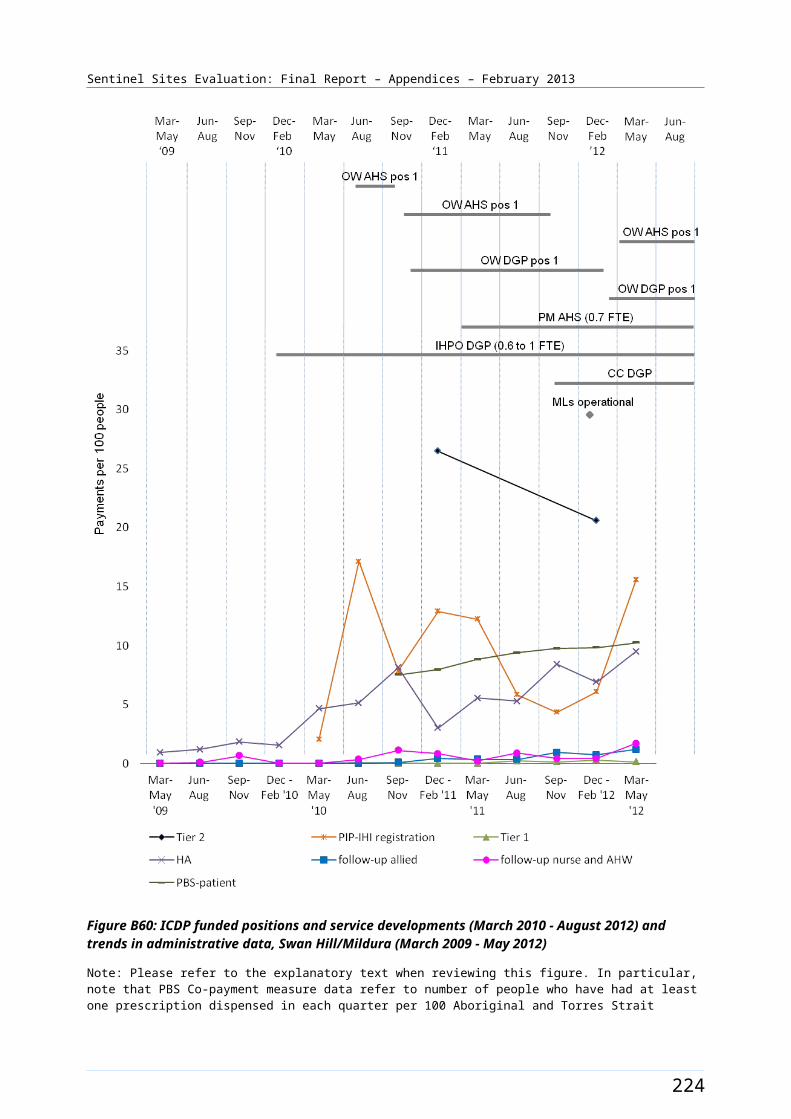
Sentinel Sites Evaluation: Final Report – Appendices – February 2013
In the enhanced tracking and tracking sites the SSE facilitators used more focused lines of enquiry in group discussions or individual interviews with key informants from the key stakeholder organisations.
Management and analysis of quantitative interview data
Following each case study visit, the quantitative interview data were entered into a database designed to support the analysis of interview data in relation to the range of specific evaluation questions and indicators relevant to the SSE. The database provided reports for all case study sites together as well as by various categories, for example rurality of site, service type (e.g. AHS, or General Practice), respondent type (e.g. clinician, manager, ICDP worker, etc).
Importantly, the quantitative interview data allowed us to make objective assessment of the balance of views in relation to various evaluation questions and indicators (for example the proportion of respondents holding strongly positive vs. strongly negative views on a specific issue). The meaning of these data were also interpreted in light of the qualitative data, which assisted in gaining insight into the reasons why particular views were held, as well as how widely certain perspectives reflected in the qualitative data were held.
The quantitative interview data also enabled a comparison of interview responses between sites, between various categories of respondents (e.g. responses from staff working in different types of service), and of trends in responses over time. This approach was designed to address an identified area of interest to the SSE, namely cross-site comparisons and comparisons between different types of respondents. From the third evaluation cycle and onwards, these data were used to undertake more explicit comparisons across sites and types of respondents in relation to priority issues.
Management and analysis of qualitative interview data
Following the case study site visits the qualitative data were entered into word document templates in a form suitable for qualitative analysis.
The process for analysis of the qualitative data was iterative. It commenced with the process of data collection (interviews and focus groups) and continued through the process of data analysis and interpretation (with the evaluation team and, towards the final stages of analysis, also with the DoHA representatives including Measure Managers) to the process of writing of the report. The analysis process for the SSE is discussed in more detail below.
The goal for the SSE qualitative data analysis was to identify themes in the data that helped to explain changes on the ground, how and why these changes had occurred and the barriers and enablers impacting on the implementation of the ICDP.
An early step in the process for analysis of the qualitative data involved identifying, coding and categorising patterns in the data. NVivo 9, a qualitative data management software program, was used to manage and organise the data.
Sources of qualitative data (interview and focus group) were imported into the NVivo software program. These sources were ‘labelled’ according to site, organisation type, interviewee type and focus group type. This allowed us to make connections across sites, across interview sets and focus groups in later stages of the analysis. This approach enabled us to make efficient cross-site comparisons of qualitative data.
Once imported, the qualitative text was initially coded (grouped) using descriptive exploratory methods. The interview questions (based on the program logic) were used as the data organising
232
Sentinel Sites Evaluation: Final Report – Appendices – February 2013
framework. Data were arranged within each measure according to factors that enable or present barriers to the implementation of the various ICDP measures.
From these measure specific data sets, text was re-coded using explanatory methods. The purpose of this process was to elicit themes and patterns that helped to understand questions of ‘how and why’ these factors impacted on the implementation of the ICDP. Special attention was given to capturing vignettes or stories and quotations that illustrated the emerging themes.
A summary of these emerging themes and patterns was presented and discussed with the evaluation team during a series of analysis workshops. The purpose of the workshop discussions was to confirm whether the documented themes had captured the key points emerging in the interviews and focus groups. The discussions with the SSE team were also used to confirm if the interview and focus group responses were appropriately represented by the themes (i.e. does the themes reflect the issue). Any necessary revisions and modifications to the themes were then made.
The work of the researchers who were primarily responsible for the qualitative data analysis was reviewed by other members of the SSE team during the process of analysis. The aim of this review process was to enhance the validity and dependability of the analysis by following the decision processes from the interpretations back to the raw data, and to determine whether the decisions and themes were logical and appropriate. This process also examined the possibility of researcher bias and the completeness and representativeness of the data.
In addition to the analysis of qualitative data arising from the interviews and focus groups, we paid particular attention to qualitative data relating to trends in administrative data. As discussed above, the data on uptake of various MBS, PBS Co-payment and PIP Indigenous Health Incentive items were used to facilitate enquiry regarding the uptake of various measures and associated changes in practice and systems. This enquiry was conducted through the use of open ended interviewing techniques, and it was agreed with the DoHA that this should be an important focus for the data collected through the enhanced tracking sites.
The inclusion of qualitative explanatory data from enhanced tracking sites (and to a lesser extent tracking sites), added to the data available from case study sites for the purpose of gaining an understanding of trends in the administrative data.
Limitations
It is important to recognise that the comparisons between different categories of interview data may be limited by the number of respondents to specific questions and by the number of categories for comparison. For example the limited number of interviewees in each site, particularly for some questions, limits the potential for cross-site comparison for some issues. However, where there were smaller number of categories, for example rurality, these comparisons were more feasible.
Similarly, meaningful analysis of trends in responses over time required data from at least three time periods for a comparable number of sites. Trends in these data provide insight into changes on the ground and perceptions of barriers and enablers to change.
The limited number of sites and early stage of implementation of many measures presented some challenges in relation to analysis and interpretation of the quantitative interview data for the early evaluation cycles. As the evaluation progressed the analysis of trends in the quantitative interview data became increasingly meaningful. For the Final Report we have data from five evaluation cycles for three case study sites, from four evaluation cycles for four case study sites and from three evaluation cycles from one further site.
233
Sentinel Sites Evaluation: Final Report – Appendices – February 2013
Clinical indicator data
The National Evaluation Framework includes reference to the use of clinical indicator data for assessment of outcomes of the ICDP. The purpose of collection and analysis of clinical indicator data for the SSE was to provide an indication of impact of the ICDP on clinical performance of primary health care services located in the Sentinel Sites and on clinical outcomes among Aboriginal and Torres Strait Islander people attending these services.
Evaluation processes
For the SSE purposes we focused on a priority set of clinical indicators that were considered to be of highest relevance and value, were most widely available from existing information systems and reports, and for which there were reasonably consistent definitions. We conducted a review of widely used clinical information systems and existing continuous quality improvement systems in order to identify suitable clinical indicators that might already be reported by Health Services.
Clinical indicators were extracted from a variety of existing clinical information, quality improvement systems or data reports prepared for other purposes in General Practice and Aboriginal Health Services. These indicators were categorised as service indicators, diabetes indicators, coronary heart disease indicators, hypertension indicators, and preventative care indicators.
Where necessary the SSE team provided support to Health Services to extract clinical indicator data, but we did not directly access any clinical information systems or patient level data ourselves. One of the following three processes was followed to obtain clinical indicator data from AHSs and General Practices in the Sentinel Sites:
The DGPs were requested to provide contact details of General Practices that had an interest in Aboriginal health and/or that may have been interested in providing clinical indicators for the SSE. The SSE team then contacted these General Practices with a request for them to provide the clinical indicators. The Health Services often required further support from the DGP staff (or advice from a member of the SSE team) to extract the clinical indicator data from their systems, before providing the data to the SSE team.
The DGP, through their practice support teams, worked directly with General Practices that were identified as having an interest in Aboriginal health and/or being likely to be willing to provide clinical indicator data for the purpose of the SSE. The DGP staff extracted the clinical indicator data and provided these to the SSE team.
The SSE team worked directly with the AHSs to obtain the clinical indicators.
Once Health Services had agreed to provide clinical indicators they were sent a participation agreement. The participation agreement set the payment, evaluation schedule and the proposed use of the information.
We used a two tiered fee structure for payments for provision of clinical indicator data: a payment for the basic set of clinical indicators plus an additional payment for a more extensive set of clinical indicators.
234
Sentinel Sites Evaluation: Final Report – Appendices – February 2013
Limitations
The experience with obtaining clinical indicator data showed that many services were unable to provide clinical indicator data of a standard that met the requirements of the SSE. Significant barriers to obtaining clinical indicators that met the SSE requirements included:
Lack of identification of Indigenous status in clinical information systems, and the consequent inability to produce data relating to Indigenous patients
Lack of clear and consistent definitions of regular patient status, and consequent inability to produce data relating to regular patients
Undeveloped clinical information systems, multiple co-existing clinical information systems in some services and inconsistent entry of data into clinical information systems, with a consequence that data for some services were incomplete and of poor quality
Inconsistencies in the specification of clinical indicators between the data systems and reports obtained from different services
Unwillingness of some services to provide data reports for the purpose of the SSE, possibly partly because they had concerns around any or several of the issues identified above.
Even where there were services within a site that provided adequate quality data, for privacy and confidentiality reasons these data could not be reported at a site level unless there were five or more such services providing adequate data for inclusion in the site level data. The reporting of clinical indicator data, and trends in clinical indicator data, in a form that may have been useful for assessing trends in clinical performance in relation to the implementation of the ICDP (i.e. meeting the purpose of the SSE) was only possible using aggregated data across all sites.
The fact that the data suitable for reporting were derived from a relatively small and select group of services means that findings on clinical performance derived from these data were not able to be generalised across all Sentinel Sites or across the country more widely.
235
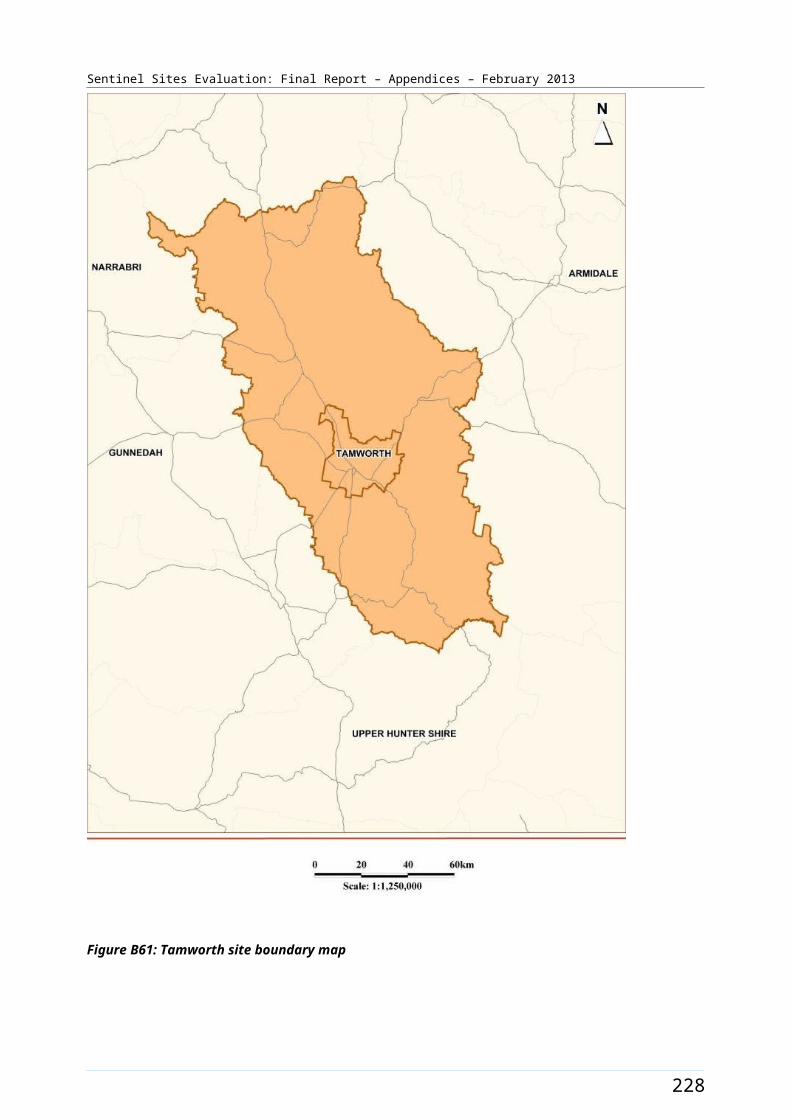
Sentinel Sites Evaluation: Final Report – Appendices – February 2013
SSE overall analysis processes
The data analysis processes for each cycle the SSE have been iterative and dynamic. The analysis for each cycle was conducted over two main phases, with an initial phase focused on analysis of data from each of the main data sources, followed by an analysis that drew together the data from different sources (see Figure C1).
Figure C1: Framework for data collection and analysis
Phase 1 of data analysis
The main focus of analysis in phase 1 differed for each data source as follows:
Administration data: focused on uptake of MBS, PBS, PIP, trends in uptake, and differences in trends between different groups or between sites.
Program data: focused on understanding progress with implementation, differences between sites in different situations.
Interview data: focused on perceptions of ICDP related issues, trends in perceptions, differences in trends between different groups or between sites.
Focus group data: focused on community perceptions of ICDP related issues, trends in perceptions, differences in trends between different groups or between sites.
236
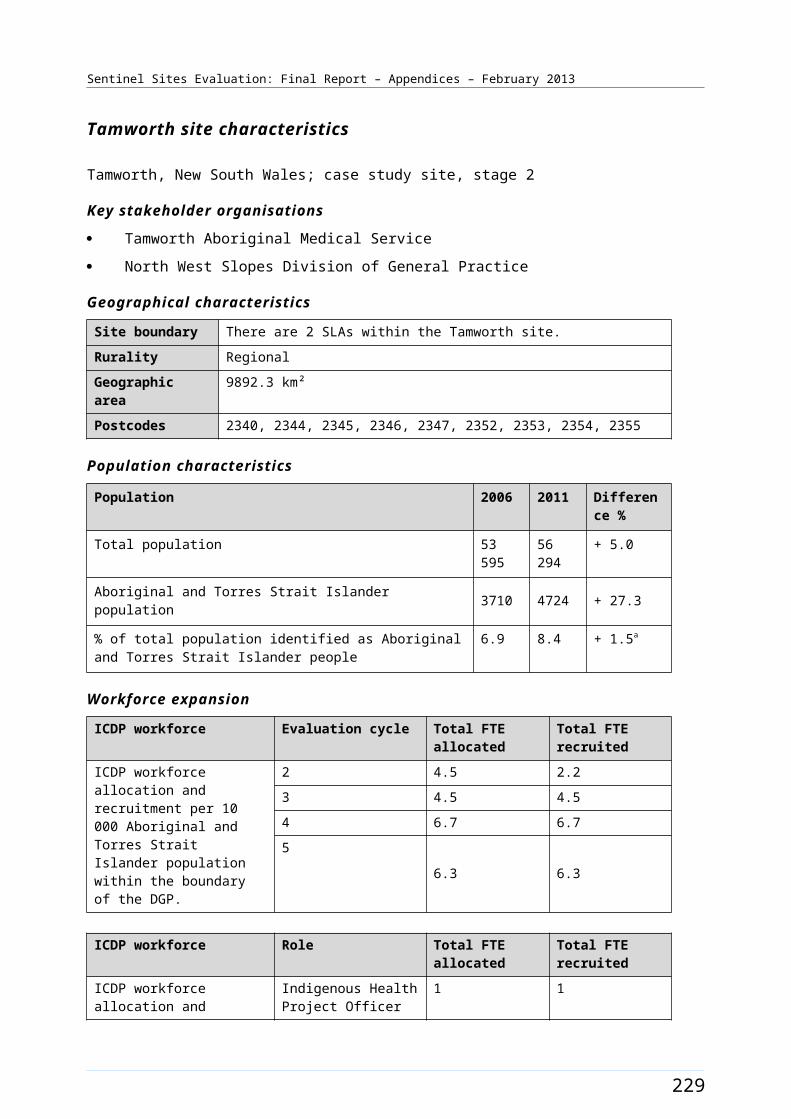
Sentinel Sites Evaluation: Final Report – Appendices – February 2013
Clinical indicator data: focused on availability and quality of clinical indicator data and, where availability and quality was adequate, on trends in clinical indicators over time and between different groups or between sites.
Phase 2 of data analysis
The second phase of analysis drew together data from each of the major data sources as relevant to the program logic and evaluation questions, as specified in the National Framework or in relation to themes that emerged during the evaluation and data analysis process.
Data analysis included the use of triangulation whereby patterns of convergence and divergence in the data were identified by comparing results between different sources of data (e.g. between interviewees, between different types of sites and between individual sites, between interview and program data, between interview and data on trends in uptake, between program data and trends in uptake, etc), and between evaluation findings and the program logic.
Thus data analysis involved:
multiple methods
multiple data sources
triangulation between data sources and between sites.
A number of other processes were used to ensure rigour in the evaluation process. These include:
peer review of methods by the expert consultants on the team and through an expert ethical oversight committee
purposive sampling of a range of key informants to ensure a diversity of relevant views were reflected in the data
peer debriefing and support
respondent validation through follow-up interviews and through feedback of findings to key stakeholder organisations and key informants, and iterative cycles of evaluation to progressively build and refine understanding of progress with, and impact on, the implementation of the ICDP.
Within these two main phases of data analysis there were processes built into each evaluation cycle to ensure rigour (see Figure C2).
237
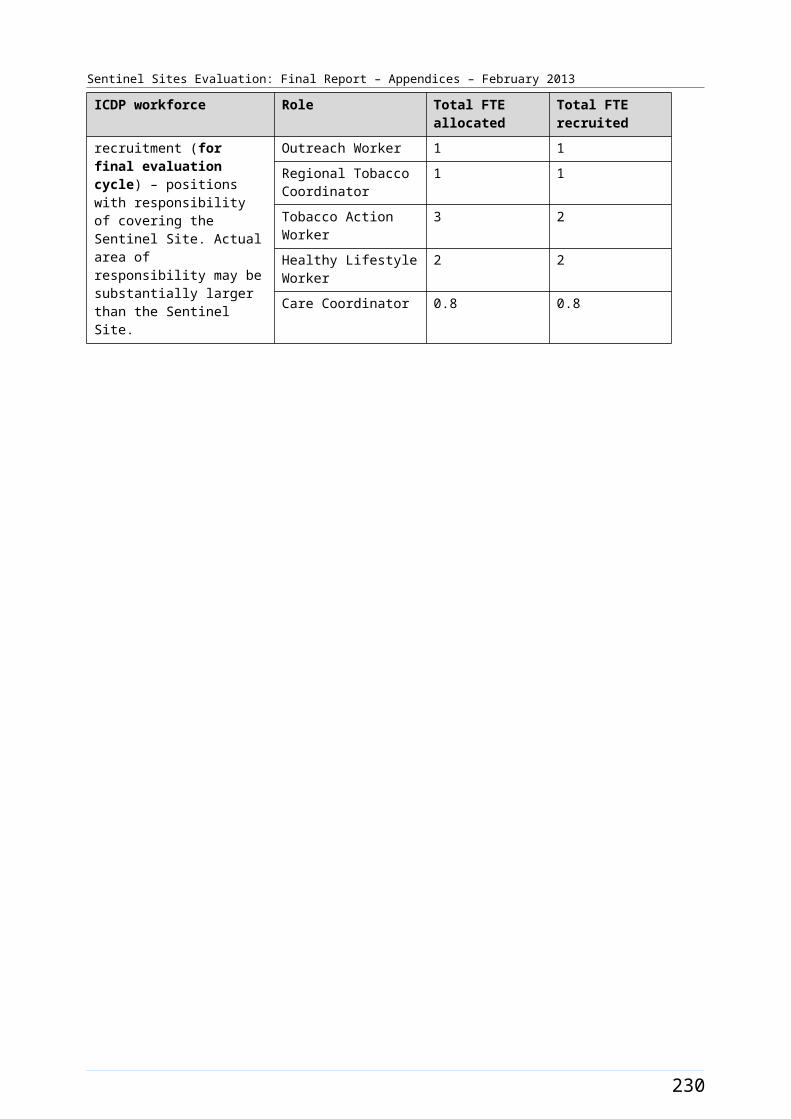
Sentinel Sites Evaluation: Final Report – Appendices – February 2013
Figure C2: Steps in the data collection and analysis process
Phase 1 -
Step 1: Focus of Enquiry for upcoming evaluation.
Focus of enquiry for upcoming evaluation cycle was developed by:
identifying themes and further areas of enquiry from previous report
feedback from Measure Managers at workshops and via correspondence
assessment of state of implementation of ICDP measures.
238

Sentinel Sites Evaluation: Final Report – Appendices – February 2013
The purpose of this was to ensure that the SSE had a focus on the priorities in each site at different stages of implementation. These were documented in an internal working document. Interview tools were reviewed for each evaluation cycle to reflect this focus. The information on state of implementation in each site was expanded and refined on the basis of further data collected during the site visit.
Step 2: Pre-visit meetings
Pre-visit workshops with the SSE team were held one week prior to the evaluation visits. At a site level the state of implementation, site specific reports and previous interviews and focus groups were reviewed and discussed with the aim of identifying the priority areas for enquiry at the site.
Step 3: Post-visit analysis workshops
Post-visit analysis workshops were held at key points during the evaluation cycle. These workshops brought together the entire SSE team to discuss initial findings at sites and to compare and contrast these with other sites already visited (including the enhanced tracking and tracking sites). This provided an opportunity to discuss and test emerging and major themes in relation to implementation of the ICDP at the site. Patterns of convergence and divergence were identified by comparing results between different sources of data (e.g. between interviewees, between different types of sites and between individual sites, between program and interview data, between interview and trends in uptake etc).
Further they provided an opportunity to determine priorities for focus of follow-up phone interviews to explore specific issues where more information was required or to gain the views of key informants (including key informants who were not available for interview over the course of the visit). The follow-up interviews also provided an opportunity for respondent validation. The discussions informed preparation for upcoming visits to other sites, including identification of important issues for in-depth enquiry and sharing ideas on interview techniques to elicit information. They were also an opportunity for peer support and debriefing.
Step 4: Entry and initial processing of data
The initial process of writing up the qualitative data included sifting of the qualitative data to capture the data that were of direct relevance to the SSE.
In enhanced tracking and tracking site visits the SSE team presented program and administrative data to key stakeholder organisations, obtained feedback from key informants about the factors that may have influenced patterns of uptake, and explored possible reasons behind the variation in uptake of ICDP measures. These feedback sessions provided an opportunity to validate key themes emerging in case study sites.
Step 5: Analysis of individual data sets
Analysis of individual data sets [clinical indicators, interview (both quantitative and qualitative), administrative data, program data and focus group data] by SSE team members used techniques outlined in the respective sections of the evaluation process document.
239
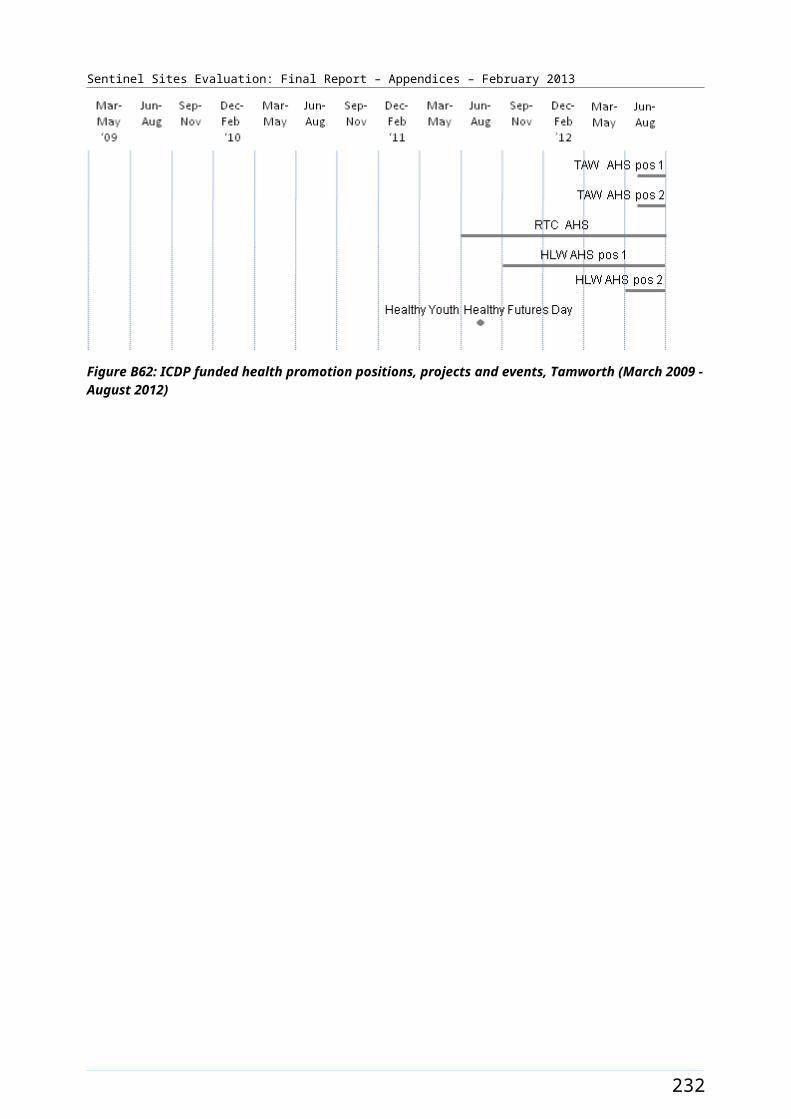
Sentinel Sites Evaluation: Final Report – Appendices – February 2013
Phase 2 -
Step 6: Comparative analysis workshop
Once all the data sets had been analysed individually [clinical indicators, interview (both quantitative and qualitative), administrative data, program data and focus group data] a final two day analysis workshop was held with the entire SSE team to discuss findings across all data sets and to triangulate between data sources and between sites.
Step 7: Measure Manager workshops
A series of ‘Measure Manager’ workshops were held with representatives for each ICDP measure area at the DoHA to present and test early findings against the program logic and to gain insights from the Measure Managers about factors that may underlie patterns in the data.
Step 8: Final analysis and write up
The final analysis and write up included integration of information obtained through the Measure Manager workshops.
An outline of the SSE evaluation process from commencement to finalisation of each report is presented in Figure C3.
240
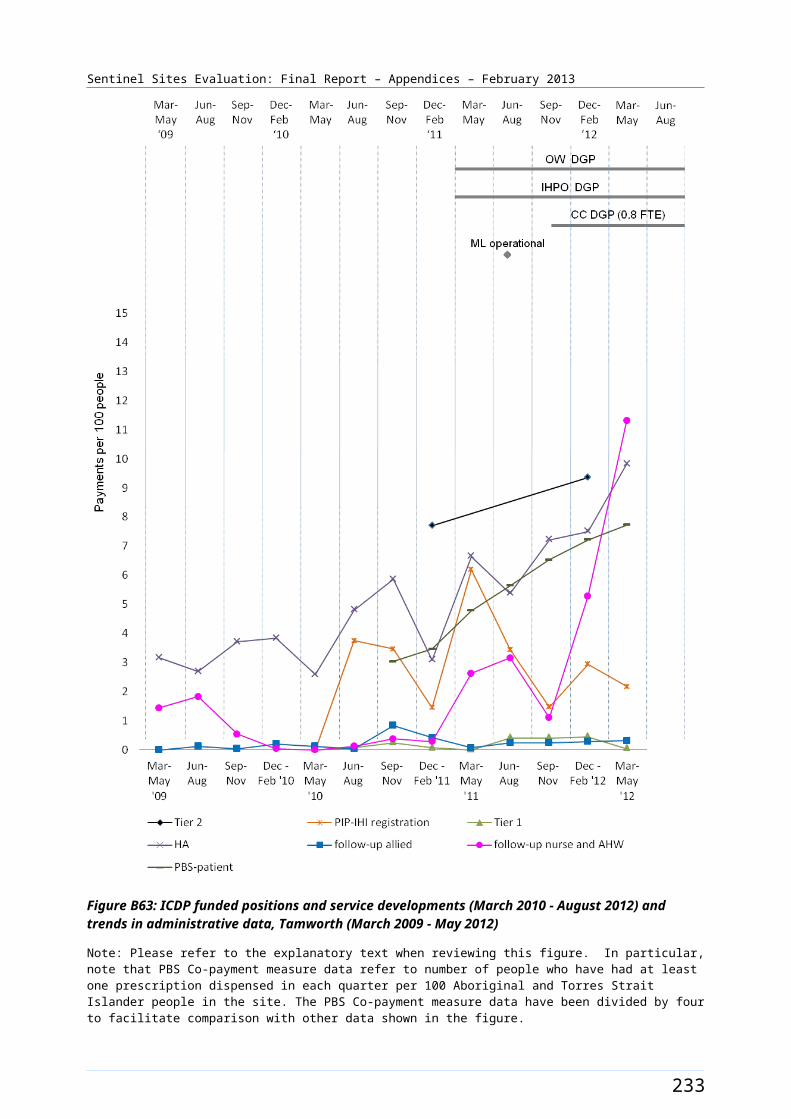
Sentinel Sites Evaluation: Final Report – Appendices – February 2013
SSE Interim reports
Site specific reports
Site plans
Interview tools
Request program
data
Request admin data
Descriptive update
Update site plans
Measure area
updates
Revised interview
tools
Evaluation of previous
cycle
Previous cycle informs next cycle
Admin data extraction
Admin data analysis
Interview data
collection
Focus group data collection
ETS data collection &
TS info
Clinical indicator collection
Site visits
Quantitative analysis
Post-visit analysis
workshop
Qualitative analysis
Analysis of clinical
indicators
Comparative analysis
workshop
Measure Manager
workshops
Final analysis
Clarify focus of enquiry
Collect data Iterative analysis, synthesis and key learnings identification
First report draft &
appendices
First draft site specific
reports
Interim report to OATSIH
Comparison & triangulation
Planning & training
of staff
Measure Manager phone conferences
Iterative process Site specific reports to
sites
Final interim report
Final site specific reports
Comments from DoHA & stakeholders
Revision
Figure C3: Outline of the Sentinel Sites evaluation process from commencement to finalisation of each report
241
Sentinel Sites Evaluation: Final Report – Appendices – February 2013
SSE analytic approach for the final report
Analysis of the data gathered during the evaluation period aimed to address the SSE objectives, including describing ICDP implementation, identifying and tracking change and identifying the barriers and enablers impacting on effective implementation of the ICDP at local level. The general approach to the data analysis for the SSE Final Report has been to continue to use standard case study methods, using methods of analysis that were most suited to the variety of quantitative and qualitative data that have been collected over successive cycles of the SSE for the purpose of addressing the specific evaluation objectives. Quantitative data (from administrative, program, interview and clinical indicator data sources) have generally been analysed using simple descriptive statistics. Qualitative data (from interview and focus group data sources) have been analysed through thematic analysis and thematic synthesis. These analyses have been designed to track the progress over time of the indicators that were specified in the National Framework, and to examine issues that have emerged over the course of the evaluation.
The case study approach was inherent to the design of the SSE, where there were multiple sources of evidence from a range of study sites. Comparative case study methods have been used over successive cycles of the evaluation to increase the understanding of how the ICDP measures have been implemented in different sites, why various approaches have been taken, and what has contributed to the variable progress between sites, and to the variable outcomes and results of implementation. The comparative case study analysis aimed to build an in-depth understanding of progress with implementation of the ICDP measures at a local level through the collection and analysis of data about each site from multiple sources over multiple cycles of the evaluation.
For the purpose of the SSE Final Report, and in order to specifically provide more in-depth understanding of the barriers and enablers to implementation for the purpose of informing ongoing and wider implementation, we have used a realist evaluation approach drawing on systems thinking 133 concepts. The realist evaluation approach aimed to provide insight into the interaction between contextual influences and mechanisms by which the ICDP measures were generating various outcomes across the diverse range of locations in which the ICDP was being implemented. The system thinking approach aimed to provide insight into how the different ICDP measures were designed to influence various aspects of the complex health system, the emerging patterns of interaction between the measures within the system, and how these interactions were achieving the intended outcomes of the ICDP. Attributing any observed change to specific interventions or influences within a complex intervention and in the context of a complex system is difficult, with inherent and unavoidable uncertainties.
Realist evaluation
This approach assumes that programs provide resources of various kinds in various ways, and that various social actors (or stakeholders, e.g. organisations, service providers, patients, community members) respond in different ways to these resources, and that their responses are influenced by the contexts in which they operate or live. Realist evaluation aims to determine what works for whom in what conditions.134 Westhorpe summarises the ideas of realist evaluation as outlined below (we refer here to ‘actors’ as people or organisations who may be affected by the program or whose actions may affect the implementation or outcomes of the program)135:
133 De Savigny and Adam. Systems thinking. WHO 2009.134 Pawson, R and Tilley, N. Realistic evaluation. SAGE publishing 1997.135 Westhorpe, G. Family by Family: Evaluation Report 2011 – 2012 (accessed 15 December 2012).
242
Sentinel Sites Evaluation: Final Report – Appendices – February 2013
Programs work by enabling actors to make different choices (although choice making is always constrained by actors’ previous experiences, beliefs and attitudes, opportunities and access to resources)
Making and sustaining different choices requires a change in the reasoning of actors (e.g. values, beliefs, attitudes or the logic they apply to a particular situation) and/or the resources (information, skills, material resources, support) they have available to them. This combination of reasoning and resources is what enables the program to work and is known as a program mechanism.
Programs work in different ways for different people and different organisations (that is programs can activate different change mechanism for different actors).
The contexts in which programs operate make a difference to the outcomes they achieve. Program contexts include features such as organisational or broader system context, program actors, staffing, geographical and historical context and so on.
Realist evaluation aims to elicit the ‘mechanisms’ by which programs achieve their intended outcomes, and describe the ‘contexts’ in which mechanisms are activated. Context-mechanism-outcome configurations are derived through the analysis of evaluation data to explain how, when and why a program does or does not work. ‘For whom’ is considered to be part of the context.
For each of the ICDP measures (or combinations of measures), we have used realist evaluation methods to describe what appear from the data to be the most important context-mechanism-outcome configurations. We have also described the higher-level context-mechanism-outcome configurations that appear to be most relevant to achievement of the general aims of the ICDP, and this provides an important basis for the analysis of the ICDP overall. The context-mechanism-outcome configurations have been developed through an iterative process of work-shopping and reviewing and reflecting on the data with the evaluation team.
The realist evaluation has built on the program logics that were presented in the ICDP evaluation framework to develop refined program theories for each of the measures and for the whole of the ICDP overall. These refined ‘mid-range’ program theories of ‘what works for whom under what conditions’ are reflected in Constraint and Enabler diagrams and in the text associated with these diagrams, as presented towards the end of each of the measure chapters and in the whole-of-ICDP section of the report. These diagrams and the text reflect what have emerged from the data as the most important context-mechanism-outcome configurations relevant to each measure and to the overall ICDP.
243
Sentinel Sites Evaluation Final Report – Appendices – February 2013
Appendix D. Interview and community focus group numbers
For more detailed outline of the methods and associated limitations please refer to Appendix C – Evaluation Process and Methods.
Interviews
Table D1: Number of evaluation visits to case study sites, overall and by rurality
EvaluationCycle
No. of visits overall Urban Regional Remote
One 3 1 1 1Two 7 2 3 2
Three 9 4a 3 2b
Four 10 3 3 4c
Five 8 3 3 2Totals 37 13 13 11
a Includes one additional visit to an urban site to conduct follow-up community focus groups.b Evaluation visits were conducted in both remote sites; but no focus groups were conducted in Katherine West due to unforeseen circumstances.c Includes two additional visits to remote sites to conduct follow-up community focus groups.
Table D2: Number of respondents to key informant interviews held in case study sites, by interview type, position, sector and evaluation cycle
EvaluationCycle
Number of interviews completed
M&PO
(IHPO)
Clinician
(GP)
OW/HLW/
TAW/RTC
Practice Manager Pharmacist CC
MSOAP-ICD Provider
DGP
Sector
GP Sector
AHS
Sector
One 46 18 (3)
16 (9) 1 6 5 - - 8 5 29
Two 102 38 (12)
33 (18) 7 10 13 1 - 24 20 46
Three 146 53 (15)
34 (22) 23 18 13 2 3 35 30 66
Four 145 52 (20)
32 (20) 28 15 11 4 3 39 23 71
Five 142 40 (15) 35 (23) 30 19 12 3 3 26 25 77
Total 581 201 (65) 150 (92) 89 68 54 10 9 132 103 289
Note: Site implementation was a three staged process, with all sites established by the third cycle. The counts include some workers who were interviewed twice in relation to work in different sites. The number of these workers ranged up to 16 respondents in one cycle. DGP sector includes interviewees from DGP & SBOs. AHS sector includes interviews from AHS and NACCHO Affiliates.
244
Sentinel Sites Evaluation Final Report – Appendices – February 2013
Table D3: Number of interviews held in case study sites, by rurality and evaluation cycle
Rurality Evaluation cycle 1
Evaluation cycle 2
Evaluation cycle 3
Evaluation cycle 4
Evaluation cycle 5 Total
Overall 46 102 146 145 142 581
Urban 17 35 65 66 68 251
Regional 18 49 50 53 49 219
Remote 11 18 31 26 25 111
Note: Site implementation was a three staged process, with all sites established by the third cycle.
Table D4: Interview implementation methods in case study sites, by evaluation cycle
Interview method Evaluation cycle 1
Evaluation cycle 2
Evaluation cycle 3
Evaluation cycle 4
Evaluation cycle 5 Total
Face-to-face 35 82 106 89 118 430
Over the phone 9 3 38 56 23 129
Self-administered 2 17 2 0 1 22
Total 46 102 146 145 142 581
Table D5: Number of Outreach Workers, Healthy Lifestyle Workers, Tobacco Action Workers and Regional Tobacco Coordinators interviewed, by rurality and positions recruited, across evaluation cycles
Cycle
Total number of
OW/HLW/TAW/RTCs
interviewed each round
Urban Regional Remote OW HLW TAW RTCTotal number of positions filleda
One 1 1 - - 1 - - - 1Two 7 5 1 1 8 3 2 2 15Three 23 15 4 4 13 7 3 5 28
Four 28 18 6 4 14 9 8 6 37Five 30 16 9 5 10 11 3 6 39Note: Number of interviewees may exceed allocations filled due to allocations filled through part-time appointments. a Total number of positions filled may include positions counted for multiple sites (e.g. IUIH - TAW, HLW, RTC).
245
Sentinel Sites Evaluation Final Report – Appendices – February 2013
Table D6: Number of individuals from case study sites interviewed over successive cycles
Number interviewed in successive cycles
All interviewees
OW/HLW/
TAW/RTCs
Managers & POs (IHPOs)
Clinicians (GPs)
Practice Managers
Care Coordinators Pharmacist MSOAP-
ICD
At least one cycle
298 47 104 (29) 75 (36) 29 5 34 4
More than one cycle
152 26 50 (14) 39 (22) 20 3 11 3
More than two cycles
82 14 26 (10) 20 (12) 14 - 5 2
More than three cycles
27 1 9 (6) 8 (7) 5 1 3 -
More than four cycles
1 - 1 (1) - - - - -
246
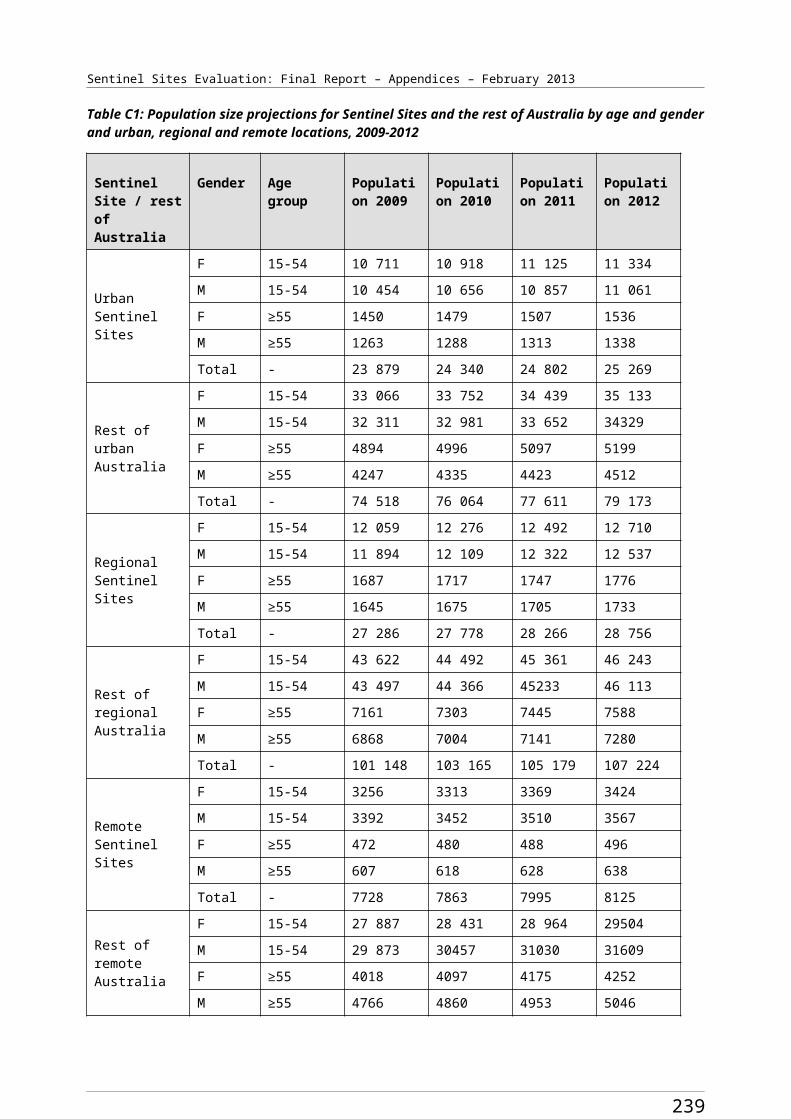
Sentinel Sites Evaluation Final Report – Appendices – February 2013
Community focus groups
Community focus group numbers
Table D7: Number of focus groups and participants from case study sites, overall and by rurality and gender
Cycle No. of groups
No of participants attending
Male Female Urban Regional Remote
One AHS 6 65 31 34 11 19 35Two 12 80 31 49 18 36 26Three 17 161 45 116 66 67 28Four 19 210 60 150 86 89 35Five 18 154 39 115 80 48 26Total 72 670 206 464 261 259 150
Table D8: Number of individual community focus group participants from case study sites over successive cycles
Number participants in successive cycles Total Male Female Urban Regional Remote
At least one cycle 535 174 361 207 197 131More than one cycle 94 25 69 34 42 18More than two cycles 26 5 21 7 18 1More than three cycles 9 2 7 6 3 -More than four cycles 3 1 2 3 - -Note: Individuals were only counted once per cycle, although several attended multiple focus groups in some cycles.
247
Sentinel Sites Evaluation Final Report – Appendices – February 2013
Table D9: Number of focus groups for each domain/ICDP measure, by evaluation cycle and rurality
ICDP measure Evaluation cycle 1
Evaluation cycle 2
Evaluation cycle 3
Evaluation cycle 4
Evaluation cycle 5
Total Urban Regional Remote
Access to Health Services (measures C1, C2 and C3)
6 12 17 19 15 69 25 29 15
Tackling smoking (measure A1)
6 11 14 15 13 59 26 18 15
Lifestyle modification (measures A2 and A3)
5 10 12 13 13 53 25 14 14
Self-manage chronic conditions (measure B4)
5 3 6 1 0 15 5 4 6
Patient registration at GPs (measure B3 part A)
5 9 16 17 16 63 25 27 11
Access to medications (measure B1)
6 9 16 18 18 67 28 25 14
Access to specialists (measure B5 Part A and B)
6 8 15 9 13 51 17 26 8
Care coordination (measure B3 Part B)
4 2 7 5 4 22 7 12 3
Total 43 64 103 97 92 399 158 155 86
Profile of community focus groups
Overall descriptions of community focus groups are presented below by urban, regional and remote location.
Urban
Over the evaluation, 13 evaluation visits were made to urban sites (Table D1) this included one additional visit to conduct follow-up focus groups. Twenty eight community focus groups were conducted in urban sites overall. Community focus groups were conducted at one urban case study site in the first evaluation cycle. In subsequent evaluation cycles, groups were conducted at all urban sites.
248
Sentinel Sites Evaluation Final Report – Appendices – February 2013
The number of groups undertaken at urban sites increased in the later evaluation cycles, with the majority of urban groups conducted in last three cycles. One focus group was conducted at three of the visits, two groups were conducted at four of the visits, three groups were conducted at three of the visits and four at two of the visits. Attendees at urban groups remained largely similar throughout evaluation cycles. Urban discussion groups usually ran for between 1- 2 hours. The greater proportion of urban groups (n=24) were organised by ICDP workers from AHS organisations. Four groups were organised by workers from DGP organisations with participants of these groups being mainly users of General Practice services. OWs based at sites often attended the groups. Participants from a majority of AHS groups commonly reported that they sometimes used General Practice services. Across all cycles, urban community focus groups were mainly mixed (included both male and female participants); although consistently a greater proportion of attendees were female. Two groups were conducted that had only female participants. Community Elders were present in several urban groups over the evaluation cycles. Participants were all adults and predominately in the older age range. Frequently, many participants reported having a chronic condition.
Regional
Over the evaluation, 13 evaluation visits were made to regional sites (Table D1) with 29 community focus groups conducted at regional sites overall. Community focus groups were conducted at one regional case study site in the first evaluation cycle. In subsequent evaluation cycles, groups were conducted at all regional case study sites. The number of groups conducted at regional sites in subsequent cycles ranged between one and three per site. Two focus groups were conducted at six of these visits, and three focus groups were conducted at five of these visits. One focus group was conducted at each of the remaining visits. Regional groups commonly ran for between 1- 1.5 hours. The greater proportion of regional groups (n=24) were organised by ICDP workers from AHS organisations, with four groups organised by workers from DGP organisations during the evaluation. OWs based at sites often attended the groups. Participants from AHS groups consistently reported that they sometimes used General Practice services. Regional focus groups were all mixed (included both male and female participants); although consistently a greater proportion of attendees at groups were female. A number of regional groups (n=10) were attended mainly by participants who were community Elders. Three groups with youth participants were held over the course of the evaluation in regional sites. Participants were all adults and predominately in the older age range.
Remote
Over the evaluation, 11 evaluation visits were made to remote sites (Table D1). These included two additional visits to conduct follow-up community focus groups. Fifteen community focus groups were conducted at remote sites overall. Community focus groups were conducted at one remote case study site in the first evaluation cycle. In subsequent evaluation cycles, with one exception due to community unavailability, groups were conducted at all remote case study sites. Two focus groups were conducted at five of these visits, three focus groups were conducted on one of the visits, one group was conducted at two of the visits and no groups were conducted at one site visit due to a death in the community. The attributes of attendees at remote groups remained largely consistent throughout evaluation cycles. Remote groups usually ran for about one hour and an interpreter was frequently used, as English was a 2nd or 3rd language for participants in many groups. All remote focus groups were organised by ICDP workers from AHS organisations. OWs based at sites and liaison workers supporting the SSE team often attended the groups. Five mixed groups were held at remote sites over the evaluation cycles, with the remaining groups being either all male or all female. Factors such as weather also impacted on conducting community focus groups when planned at remote sites. Two remote groups were conducted specifically with community Elders. Participants in remote groups often reported accessing both AHS General Practice services.
249
Sentinel Sites Evaluation Final Report – Appendices – February 2013
Appendix E. Clinical indicators
Introduction and methods
The purpose of collection and analysis of clinical indicator data as indicated in the ICDP National Framework was to assess the impact of the ICDP on clinical performance of primary health care services located in the Sentinel Sites and on clinical outcomes among Aboriginal and Torres Strait Islander people attending these services. It has been made clear in analyses of clinical indicator data from previous evaluation cycles that the clinical indicator data available from Health Services has not been of adequate quality to be used for the purposes specified in the National Framework. The analysis of clinical indicator data presented in this evaluation report aims to provide further insight into the trends in the quality of available clinical indicator data. This analysis is complemented by data on the reasons for variation in consistency and quality of data over time and between services.
Obtaining data from Health Services
As for the previous evaluation cycles, one of the following three processes was followed to obtain clinical indicator data from AHSs and General Practices in the Sentinel Sites:
The DGPs were requested to provide contact details of General Practices that had an interest in Aboriginal health and/or that may be interested in providing clinical indicators for the SSE. The SSE team then contacted these General Practices with a request for them to provide the clinical indicators. The practices often required further support from the DGP staff (or advice from a member of the SSE team) to extract the clinical indicator data from their systems, before providing the data to the SSE team.
The DGP, through their practice support teams, worked directly with General Practices that they identified as having an interest in Aboriginal health and/or being likely to be willing to provide clinical indicator data for the purpose of the SSE. The DGP staff extracted the clinical indicator data and provided these to the SSE team. Four DGPs provided data for 11 General Practices.
The SSE team worked directly with the AHSs to obtain the clinical indicators.
In the final evaluation cycle there was continued emphasis on working with practice support teams based within the DGPs to either collect clinical indicator data directly from General Practices or to provide contact details to the SSE team.
In this and the previous evaluation cycles the SSE team focused on encouraging Health Services to provide the standard Australian Primary Care Collaborative (APCC)136 reports that can be generated by the PEN CAT extraction tool.137 These APCC reports contain a number of clinical indicators of relevance to the SSE. These reports are a feature on the PEN CAT data extraction tool and provision of data by services through use of these reports is not an indication of participation in the APCC program.
Interviews with Health Service and DGP staff
After completion of clinical indicator data collection for the final evaluation cycle interviews were conducted with Health Service and DGP staff to gain more insight into the challenges experienced by services in producing good quality data. These interviews were conducted between October and
136 Australian Primary Care Collaborative [website] (accessed 23 January 2013).137 Clinical Audit Tool [website] (accessed 23 January 2013).
250
Sentinel Sites Evaluation Final Report – Appendices – February 2013
November 2012, and were designed and used to supplement information gathered through interviews with staff of AHSs, General Practices and DGPs over the course of the evaluation.
Interviewees were identified from a list of individuals and organisations that had provided the data to the SSE team. Half of the General Practices (11/22) had their data submitted by four DGPs that had provided the data on their behalf. Interviews were conducted with staff of the four DGPs referred to above (representing 11 General Practices), staff working at the other 11 General Practices and nine AHSs. In total 24 interviews were conducted representing 31 Health Services (9 AHSs and 22 General Practices). Twelve interviewees were from urban sites and 12 were from regional sites. All clinical indicator data provided from remote sites were from AHSs. There were no interviewees available from these remote site services.
Numbers of Health Services that provided clinical indicator data
In the final evaluation cycle the majority of the AHSs (12/14) and General Practices (24/27) approached provided clinical indicator data. Of these 36 Health Services that provided data, six AHSs and 12 General Practices were located within case study sites, with six AHSs and 12 General Practices within the enhanced tracking sites.
The number of AHSs providing clinical indicator data increased steadily over the first four cycles, with 12 AHSs providing data in cycles four and five (Table E1). The number of AHSs requested to provide data was highest in evaluation cycle three, when requests were made to 21 services. Only 15 and 14 AHSs were requested to provide data for evaluation cycles four and five respectively, as some AHSs made it clear that they were not willing or able to provide the required data. These 12 AHSs that provided data were located in 12 different sites. One AHS reported for the first time in the fifth evaluation cycle and 1 AHS that reported in the fourth evaluation cycle did not report in the fifth evaluation cycle. Of the 12 AHSs that provided clinical indicator data for the fifth evaluation cycle, 11 provided data in the fourth cycle and 10 provided data in the third cycle.
No General Practices provided clinical indicator data in the first evaluation cycle. The number of General Practices that provided data progressively increased over the remaining cycles, from five in evaluation cycle two to 24 in evaluation cycle five. The number of General Practices requested to provide data peaked at 32 in evaluation cycle three, decreasing to 27 in evaluation cycle five as it became clear that some practices were unwilling or unable to provide the required data (Table E1).
251
Sentinel Sites Evaluation Final Report – Appendices – February 2013
Table E1: Numbers of Health Services that provided clinical indicator data, and numbers of Aboriginal and/or Torres Strait Islander patients, overall and by sector
Indicator Cycle 1 GP
Cycle 1AHS
Cycle 1Total
Cycle 2GP
Cycle 2AHS
Cycle 2Total
Cycle 3GP
Cycle 3AHS
Cycle 3Total
Cycle 4GP
Cycle 4AHS
Cycle 4Total
Cycle 5GP
Cycle 5AHS
Cycle 5Total
No. of services requested to provide clinical indicator data
3 9 12 15 13 28 32 21 53 30 15 45 27 14 41
No. of services that provided clinical indicator data
0 4 4 5 8 13 17 10 27 22 12 34 24 12 36
No. of services with >50 patients identified as Aboriginal and/or Torres Strait Islander
0 4 4 3 8 11 10 10 20 16 12 29 17 12 29
No. of services with >100 patients identified as Aboriginal and/or Torres Strait Islander
0 4 4 2 8 10 7 10 17 12 12 24 16 12 28
No. of services with >200 patients identified as Aboriginal and/or Torres Strait Islander
0 4 4 2 8 10 5 10 15 10 12 22 9 12 21
No. of services where proportion of patients identified as Aboriginal and/or Torres Strait Islander is greater than proportion of Aboriginal and/or Torres Strait Islanders in site population
0 4 4 0 8 8 3 10 13 2 12 14 4 12 16
No. of services that report no. of patients on diabetes register
0 4 4 5 4 9 16 8 24 21 11 32 24 12 36
No. of services that report no. of patients on CHD register
0 4 4 5 4 9 16 9 25 21 4 25 24 8 32
No. of services with >10 Aboriginal and Torres Strait Islander patients on the diabetes register
0 4 4 2 4 6 4 8 15 9 11 20 8 12 20
No. of services with >10 Aboriginal and Torres Strait Islander patients
0 4 4 1 4 5 3 9 12 3 4 7 3 8 11
252
Sentinel Sites Evaluation Final Report – Appendices – February 2013
Indicator Cycle 1 GP
Cycle 1AHS
Cycle 1Total
Cycle 2GP
Cycle 2AHS
Cycle 2Total
Cycle 3GP
Cycle 3AHS
Cycle 3Total
Cycle 4GP
Cycle 4AHS
Cycle 4Total
Cycle 5GP
Cycle 5AHS
Cycle 5Total
on the CHD register
253
Sentinel Sites Evaluation Final Report – Appendices – February 2013
Twenty-four General Practices (11 urban, 13 regional) provided clinical indicator reports in the final evaluation cycle. These 24 practices were in 10 different Sentinel Sites. Fourteen General Practices were in case study sites and 10 in enhanced tracking sites. No General Practices from remote sites provided clinical indicator data, with very few General Practices being based in remote sites.
Overall, provision of data for evaluation cycles three, four and five was significantly better than for evaluation cycles one and two, as engagement progressed and the SSE team increasingly encouraged use of extraction tools for the purpose of providing clinical indicator data, particularly with AHSs.
Over the course of the evaluation 40 different Health Services provided clinical indicator data - 26 General Practices and 14 AHSs. AHSs tended to be more able or willing to provide clinical indicator data over successive cycles of the evaluation, with 11 of the 14 AHSs providing indicators for three or more cycles, compared to 13 of the 26 General Practices (Table E2). The higher proportion of AHSs that provided data is likely to be partly related to their previous history of working with members of the SSE team and previous engagement in research that involved provision of clinical indicator data.
Table E2: Number of individual Health Services that provided clinical indicator data over the course of the Sentinel Sites Evaluation, overall and by sector
Number of evaluation cycles General Practice
AHS Total
1 26 14 40
More than 1 22 12 34
More than 2 13 11 24
More than 3 5 3 8
More than 4 0 2 2
254
Sentinel Sites Evaluation Final Report – Appendices – February 2013
Types of reports/software systems used by Health Services
In early evaluation cycles the majority of AHSs provided clinical indicator data in the form of Healthy for Life program reports (Table E3). Following changes to reporting tools and requirements for Healthy for Life, the AHSs generally provided electronically extracted reports such as national Key Performance Indicator (nKPI) data or APCC reports. Many AHSs had access to the PEN CAT as a result of their involvement in the Healthy for Life program and the recent roll-out of this software funded by DoHA.
Twenty-two of the General Practices provided APCC reports generated by the PEN CAT and two provided reports that were generated directly from the practice information system by practice staff. Practices that provided APCC reports were generally not actively participating in the APCC, but were rather using the APCC report function on the PEN CAT in order to generate the clinical indicators for the specific purpose of the SSE.
Table E3: Report type, by sector and evaluation cycle
Report Type Cycle 1 GP
Cycle 1 AHS
Cycle 1 Total
Cycle 2 GP
Cycle 2AHS
Cycle 2 Total
Cycle 3GP
Cycle 3 AHS
Cycle 3 Total
Cycle 4 GP
Cycle 4 AHS
Cycle 4 Total
Cycle 5GP
Cycle 5 AHS
Cycle 5 Total
APCC 0 0 0 3 0 3 16 7 23 20 6 26 22 4 26
nKPI 0 0 0 0 0 0 0 1 1 0 3 3 0 6 6
Healthy for Life
0 4 4 0 6 6 0 2 2 0 0 0 0 0 0
One21seventy 0 0 0 0 0 0 0 2 2 0 2 2 0 0 0
Other 0 0 0 2 2 4 1 0 1 2 1 3 2 2 4
Total number provided
0 4 4 5 8 13 17 12 29 22 12 34 24 12 36
Healthy for Life reports were the most common report submitted by AHSs in evaluation cycles one and two. APCC reports were the most common form of report in evaluation cycles three and four, and nKPI reports were the most common in evaluation cycle five. APCC reports were the most common report provided by General Practices in all evaluation cycles. A number of other reports were provided throughout the evaluation period, including a manually completed template used specifically for the SSE, Excel spreadsheets, copies of clinical indicator data extracted directly from the clinical information system and One21seventy clinical audit reports generated for continuous quality improvement purposes.
Most of the reports, or reporting systems, that were used to provide data rely on electronic extraction of data from clinical information systems. The exception is the One21seventy clinical audit process, which uses manual audits to extract data from a sample of records from existing clinical information systems using standard protocols, and then runs these data through an automated analysis and reporting function.
Capability of services to provide clinical indicator data
Limitations on the information system capability of staff, as well as limited functionality of clinical information systems, were major constraints on the ability of Health Services to provide reliable clinical
255
Sentinel Sites Evaluation Final Report – Appendices – February 2013
indicator data. Competing demands on staff time were also a factor influencing ability of some services to provide data within the timeframes required for the SSE.
A majority of the reports received from AHSs in the earlier evaluation cycles were generated from the clinical information systems directly (e.g. Healthy for Life reports). In the later evaluation cycles most of the AHSs had installed an extraction tool and were sending reports (nKPIs or APCC) using this tool.
Over the course of the evaluation concerns were raised, especially by AHSs, that the clinical information systems were not adequately functional. It was clear this perception was at least partly due to limited capability amongst staff to use the clinical information systems to generate reports through electronic extraction and limited understanding of how to use clinical information for the purpose of monitoring and reporting of service level data.
Staff from a number of services expressed concerns that the data provided did not provide a fair reflection of clinical performance. One AHS decided not to submit any data for the final evaluation cycle due to concerns about the quality of data generated by the extraction tool. Of the nine AHSs in which a staff member was interviewed about their clinical indicator data, only one did not report difficulties with using the extraction tool during the previous 12 months.
Whilst it was reported that efforts were underway to resolve data quality issues by the software providers, a few services either changed software providers or simply accepted that some clinical information systems had deficiencies that they had to live with. Certain clinical information systems also appear to have better compatibility with the extraction tools available. Inconsistent entry of data into appropriate data fields by Health Service staff, and lack of entry of clinical data, are other likely explanations for poor quality service level data.
Staff expressed concerns about the significant numbers of patients who did not have a record of their Aboriginal and Torres Strait Islander status, meaning that the data reported through the electronic clinical information systems may not be a true reflection of the work done with Aboriginal and Torres Strait Islander patients.
Sixteen General Practices provided clinical indicator data through their DGP over the evaluation period. Because the DGP was the key contact point for some of these General Practices it was unclear how many had staff who could use the data extraction tools effectively.
The relationship between General Practices and the DGPs varied across sites, as did the responsibility for extraction and analysis of clinical indicator data. In some instances the DGP was heavily involved in the process but in other cases the DGP had expectations that General Practices were responsible for their own data and training of staff to use the clinical information systems and extraction tools.
The active role of the DGP staff in supporting practices to generate the reports was an important factor in the increased availability of clinical indicator data for both the final and previous cycles of the SSE. However three General Practices supported in this way did not provide data for evaluation cycle four. One other practice that normally had DGP support to extract data indicated that the support was no longer available due to the change to the Medicare Local. This particular practice was able to report in evaluation cycle five after finding useful information on the Royal Australian College of General Practitioners (RACGP) website.
256
Sentinel Sites Evaluation Final Report – Appendices – February 2013
Training in use of clinical information systems and data extraction tools
Almost all Health Services had the PEN CAT installed on their computer systems, but it was clear that staff within some of the Health Services did not know how to use the tool effectively.
Training to use the PEN CAT was not as widespread as training to use the clinical information system, although several staff commented that it was easy to learn. It was evident from the clinical indicator interviews that staff in only one in five Health Services (6/31) had received formal training on how to use the PENCAT despite the majority of services using this extraction tool to provide data for the SSE. Staff from one in four Health Services (8/31) indicated that they were not getting maximum benefit from using the extraction tools and that more training and networking to resolve issues, run high level queries and optimise the PENCAT’s potential would be useful. DGPs were providing support to use extraction tools and generally had some experience with extraction of clinical indicator data through their involvement in the APCC. The RACGP also provided resources on their website to support the use of PEN CAT.
Use of data cleaning processes
Interviews with Health Service and DGP staff indicated that almost all services (29/31) had conducted some form of data cleaning or auditing of the clinical information system and/or patient files in the last 12 months:
over half of all Health Services (18/31) reported they had regular, systematic data cleaning processes (both manual and electronic) in place at the service.
a quarter of all Health Services (8/31) were preparing for accreditation.
four of the Health Services had used the PEN CAT data cleaning functions.
two of the Health Services were involved in one of the APCC ‘Waves’.
two of the Health Services changed clinical information systems, which resulted in the updating of patient records.
Almost half of the Health Services, including services in both sectors and General Practices that had direct support from DGPs, appeared not to be undertaking data cleaning routinely or systematically. Data cleaning processes at a number of services were reported to be ad hoc, or were being conducted as part of a quality program that required updating of records (e.g. APCC Waves or accreditation).
To the extent that it was being done, data cleaning activity was usually dependent upon a few key individuals, and tended to be more reactive than planned and systematic. Those services that did have processes in place usually had a key staff member who took the lead in disseminating the results to the GPs and nursing staff. Only a small number of services indicated they knew how to use the automated data cleaning functions available in their clinical information systems or extraction tools.
Involvement in quality improvement programs
About half of the Health Services (15/31) indicated that they were involved in a quality improvement program; just under a third (9/31) used One21Seventy, four had used APCC processes within the previous 12 months (although only two appeared to be involved in current ‘waves’ of the APCC), and two used other programs.
257
Sentinel Sites Evaluation Final Report – Appendices – February 2013
About one in three Health Services (11/31; 3 AHSs and 8 GPs) had at some stage participated in the APCC. Two of these 11 Health Services (one AHS and one General Practice) reported that they were still submitting data to the APCC program. Of the eight General Practices involved in the APCC, only one had conducted an extensive audit of patient files in the last 12 months, with the remaining seven still having high numbers of patients whose Aboriginal and Torres Strait Islander status was not recorded. There was no discernable difference between the quality of the data provided by General Practices involved in the APCC and those that were not. Both groups had high numbers of patients whose status was not recorded.
A small number of Health Services commented on their involvement in the e-Collaborative (a program related to the APCC) and/or the introduction and impact of e-health in general and that this was now their focus. The DGPs were also promoting involvement in the e-Collaboratives. Involvement in e-Collaboratives generally was at an early stage.
One of the three AHSs that were no longer submitting data to the APCC indicated they used the extraction tool often. However, they used the filters incorrectly for one of the evaluation cycles, resulting in around 400 additional patients being included in the overall patient count. Two of the three AHSs thought that additional training would be valuable and that too few staff knew how to use the PEN CAT effectively.
The extent to which involvement in the APCC had any lasting or broader impact on the state of development and use of clinical information systems was unclear.
Two AHSs submitted only clinical audit data using One21Seventy tools in evaluation cycle three, and two different AHSs provided audit data using One21Seventy tools in evaluation cycle four. The four AHSs provided audit data only for diabetes type 2 or coronary heart disease patients. The data generated by the One21seventy tools were seen by service staff as a more accurate reflection of patient activity than those derived from either the clinical information system directly or using an extraction tool. One of the two AHSs that used the One21Seventy tools in evaluation cycle three voiced concerns about the validity of data provided in evaluation cycle four (using the PENCAT) and declined to submit data in evaluation cycle five using the PENCAT due to concerns over the accuracy of the data.
Use of clinical indicator data by services
DGPs indicated that clinical indicator data were being analysed and used for reporting to government and peak bodies as well as being reported back to practices. In comparison, six AHSs that had been involved in the Healthy for Life program and/or One21Seventy indicated that their involvement provided the necessary national and specific reports that could provide the basis for quality improvement activity. Only one General Practice reported that they regularly compared their performance with regional or national data. Apart from involvement in quality improvement programs as discussed above there was no other reference to use of clinical indicator data for the purpose of enhancing service quality at the local level.
Recording and reporting on Aboriginal and Torres Strait Islander status
Half of the AHSs (6/12) provided an nKPI report which did not disaggregate the number of Aboriginal and Torres Strait Islander patients and other patients. This meant there were limitations in the analysis for the evaluation cycles in which nKPI reports were used as a basis for reporting of clinical indicator data.
258
Sentinel Sites Evaluation Final Report – Appendices – February 2013
APCC reports received from Health Services recorded the Indigenous status of their patients (Aboriginal and Torres Strait Islander; non-Aboriginal or not recorded). Over half of the APCC reports received (14/26) in the final evaluation cycle indicated a higher number of patients whose status was ‘not recorded’ than the number of patients whose status was recorded. The high proportion of patients for whom Aboriginal and Torres Strait Islander patient status was not recorded was attributed by service staff to a range of factors, including:
recording of patient status has not been standard practice until recently (in the last 2 years)
a number of patients had not attended the service recently and therefore had not yet had their patient status updated
poor recording by staff of Aboriginal and Torres Strait Islander patient status in the clinical information system
extraction tools are not accurately picking up the records of Aboriginal and Torres Strait Islander patient status of patients.
Almost all (20/22) General Practices reported that there had been continuing effort over the last two years to update patient information and identification, some using culturally appropriate materials in the waiting room to alert Aboriginal and Torres Strait Islander patients to the ‘Closing the Gap’ initiatives. Generally AHSs had fewer issues with identification; however it was acknowledged by two AHSs that reporting of the status of patients in the clinical information system was not systematic and patient records were still being updated. Accreditation against the RACGP Standards for General Practice138 appears to be one of the motivating factors behind an improvement in identification in both sectors. Several General Practices also reported that the DGPs over recent years (and more recently the Medicare Locals) had been active in supporting them to improve identification.
There appeared to be recognition by all services of the need to improve patient identification and services generally appeared to be engaged in a continual process of updating patient information, in some cases supported by DGPs and underpinned by accreditation standards. However, in interviews about clinical indicator data and clinical information systems, few services indicated any cultural awareness training to support staff with identification (particularly reception staff who initially have contact with patients). The contrast between these data and those from other interviews conducted through the SSE with Health Service staff, where there was a more positive perception of engagement of staff in cultural awareness training, suggests that more attention may need to be given to some of the basic practical implications of cultural awareness training, including in relation to use of clinical information systems. Staff from a few services held the perception that a proportion of Aboriginal patients did not wish to identify, and therefore there would always be some under-recording of Aboriginal and Torres Strait Islander status.
During interviews with staff of General Practices and DGPs, about a third of General Practices (7/22) interviewees indicated that they were confident about the accuracy of the numbers of Aboriginal and Torres Strait Islander patients reported, although they were less confident about the total number of regular patients. Reasons for confidence about reported numbers included improved identification, recent review of the status of Aboriginal and Torres Strait Islander patients in the clinical information system, having processes in place to update patient records, and relatively small numbers of Aboriginal and Torres Strait Islander patients in some practices making the process of identification more manageable. However, interviewees also expressed surprise at the discrepancies that became evident in the data over successive evaluation cycles for several General Practices (particularly the large numbers of patients whose status is not recorded). It was clear in interviews that ICDP related activities
138 RACGP [website] (accessed 21 January 2013).
259
Sentinel Sites Evaluation Final Report – Appendices – February 2013
and accreditation requirements had stimulated efforts to improve identification of Aboriginal and Torres Strait Islander patients in clinical information systems.
Definition of regular patients and service populations
All the AHSs that reported clinical indicator data appeared to be using the RACGP standard definition of a regular patient being a patient who has had three visits in the past two years, although at least one key informant indicated this definition did not necessarily provide a good indication of workload for individual services. While the majority of General Practices appeared to use the RACGP standard definition of regular patient, interviews with General Practice and DGP staff indicated that at least four of the practices that reported on number of regular patients were using some other definition of ‘regular’ or ‘active’ patient.
Staff in 9 of the 10 regional General Practices that reported clinical indicator data indicated the Aboriginal and Torres Strait Islander people who attended their service regularly were generally resident within the site boundaries or nearby surrounding areas, with one exception (Cairns). For Cairns it was reported that there were substantial numbers of regular patients who lived outside the local area but who used some General Practices during visits to Cairns, apparently attracted by bulk-billing arrangements. One regional General Practice reported they had AHS doctors working at the practice, and that patients moved between services in order to see their regular GP. One regional Medicare Local indicated that Aboriginal patients were attracted by the ‘anonymity’ of the General Practice even though it meant more travel. Another regional General Practice also commented that their regular Aboriginal and Torres Strait Islander patients were likely to be ‘middle working class’, as the practice did not provide bulk-billing.
The AHS at Wellington commented that a new correctional centre within the Sentinel Site was attracting patients from outside the local area. Aside from interviews with staff of services in the Sentinel Sites of Cairns and Dubbo (which included staff from the Wellington AHS), staff interviewed in four other regional AHSs reported that most patients were resident within the site boundaries or nearby surrounding areas.
In contrast to regional sites, four out of the five urban AHSs that provided data indicated that they saw patients from remote, regional and urban locations. Interviews with Health Service staff showed a perception that patients who were visiting major cities tended to use the urban AHS (as opposed to General Practices), specifically including when their visit to the city was related to a hospital admission and they needed some follow-up care before returning to their place of residence.
Differences between sites in the definition of regular patient, and differences in service utilisation patterns by people who are normally resident within or outside of the site boundaries, need to be considered when comparing administrative data between sites. Changes in definitions of regular patients over time, and changes in service utilisation patterns, (for example, as a result of new facilities such as detention centres or health facilities), also need to be considered in comparing administrative data within and between sites over time.
Numbers of patients (overall, on disease registers, and identified as Aboriginal and Torres Strait Islanders) in Health Services
In the light of the above information on the origin of the clinical indicator data, the analysis presented below examines the data reported by services on numbers of regular patients and numbers of patients on diabetes and coronary heart disease (CHD) registers, and numbers of patients identified as Aboriginal or Torres Strait Islander people.
260
Sentinel Sites Evaluation Final Report – Appendices – February 2013
In addition to overall numbers of patients, numbers of regular patients and numbers identified as Aboriginal and Torres Strait Islander, the focus of the analysis presented below is on diabetes and CHD as these are among the most common and important chronic diseases, and the identification of people with these conditions on clinical information systems appeared to be more advanced than for other conditions.
Over three-quarters of AHSs (10/12) and almost all General Practices (22/24) could report on the total number of regular Aboriginal and Torres Strait Islander patients in the clinical information system. Data from AHSs and General Practices are presented separately below because of generally wide differences in numbers and proportions of Aboriginal and Torres Strait Islander patients between these two types of services.
The size of the Health Services that provided clinical indicator data (in terms of total numbers of patients and the number of patients identified as Aboriginal or Torres Strait Islander) varied widely, as did the number of patients on disease registers for different services.
By the final evaluation cycle, 16 out of the 27 General Practices that provided clinical indicator data reported they had more than 100 patients identified as Aboriginal or Torres Strait Islander (Table E1). This was an increase from seven out of 32 General Practices that provided clinical indicator data in evaluation cycle three.
Fewer Health Services were requested to provide clinical indicator data for the fourth and fifth evaluation cycles than for the third evaluation cycle. This was because some Health Services approached in the previous evaluation cycle had made it clear that they were not willing or able to provide clinical indicator data. Despite fewer services being requested to provide clinical indicator data there was a progressive increase in the overall number of Health Services that actually provided data over consecutive evaluation cycles, probably at least partly because of increased understanding by the SSE team and DGPs of the Health Services more likely to be willing and able to provide data, and partly because of improvement in the ability of service or DGP staff to provide the required data. The numbers of Health Services that provided clinical indicator data in the first two evaluation cycles was limited due to the early stage of establishment of sites, and to Health Services not having signed the required agreements prior to the collection date.
261
Sentinel Sites Evaluation Final Report – Appendices – February 2013
Assessment of data from Aboriginal Health Services
Reporting on regular patients
There was an increase in the number of AHSs that reported on the number of ‘regular’ patients. As indicated above, all the AHSs that reported clinical indicator data appeared to be using the RACGP standard definition of regular patient (three visits in the past two years). Of the 12 services that provided clinical indicator reports, eight reported the number of patients on the clinical information system identified as regular patients (compared to six in the previous evaluation cycle). Numbers of regular patients for each service ranged from 2905 to 9813.
Reporting on Aboriginal and Torres Strait Islander patients
Of the eight AHSs that did report the number of regular patients in the fifth evaluation cycle, all were able to report on the number of patients identified as Aboriginal and Torres Strait Islander patients as a proportion of all regular patients (Figures E1–E3). The proportion ranged from 42% (4097/9813) to 92% (2669/2905). Two other AHSs reported the number of patients identified as Aboriginal or Torres Strait Islander, but not the total number of all regular patients. Three of the eight AHSs that submitted data for all regular patients also reported the number of patients who did not have a record of Aboriginal and Torres Strait Islander status. For these three AHSs, the proportions of regular patients who did not have their Aboriginal and Torres Strait Islander status recorded were 2% (65/2905), 43% (2850/6679) and 57% (5545/9813). The other five services were not able to report on the numbers of regular patients who did not have their Aboriginal and Torres Strait Islander status recorded.
Thus, the actual number of regular patients who were Aboriginal or Torres Strait Islander is uncertain for most of these 12 AHSs, and this flows on to uncertainties for any indicators for their service populations. These uncertainties are made more evident in the substantial changes between SSE cycles in the reported numbers of patients identified as Aboriginal or Torres Strait Islander.
Of the two AHSs that reported over all five evaluation cycles, neither was able to report on the number of regular patients who were identified as Aboriginal and Torres Strait Islander over all the evaluation cycles.
Variation in numbers over time
Only one AHS reported on the number of regular patients that were identified as Aboriginal and Torres Strait Islander over evaluation cycles three, four and five.
For this AHS, the number of regular Aboriginal and Torres Strait Islander patients increased by 24% (from 1084 to 1339) from evaluation cycle three to evaluation cycle five.
Of the three AHSs that reported on the Aboriginal and Torres Strait Islander status of all regular patients for the final evaluation cycle, two reported large numbers with Aboriginal and Torres Strait Islander status ‘Not Recorded’; 43% (2850/6679) and 57% (5545/9813). The third AHS reported a very low number of patients whose status was not recorded (2%, 65/2905).
262
Sentinel Sites Evaluation Final Report – Appendices – February 2013
Reasons for variation in numbers over time
For AHSs that reported increases in numbers of patients identified as Aboriginal and Torres Strait Islander, the increases were most commonly attributed to new patients coming to the service, although three AHSs reported that some of the increase may be partly due to better identification of existing patients.
A third (3/9) of AHSs attributed discrepancies in reported patient numbers to a change of clinical information system between evaluation cycles. Most of the changes to clinical information systems appeared to be regarded positively, because of improving functionality (e.g. tools to clean up and extract disease registers, billing and clinical information on the one system). As expected with software upgrades, some services reported technical difficulties, some of which were hindering their ability to manage patients effectively. The reasons for switching clinical information systems were sometimes financial and sometimes based upon perceptions of better functionality of alternative systems (sometimes simply because the existing system was perceived to be outdated). In one AHS that had recently changed clinical information systems, the GPs indicated that there had been a loss of data during the data migration process, and that they were entering more free text rather than coding data as previously. Interestingly, comparison of the clinical indicator data provided by this service for this reporting period compared to the previous reporting period shows no clear evidence of loss of data between these periods.
One AHS reported a problem using the filters on the extraction tool that resulted in a decrease of over 300 Aboriginal or Torres Strait Islander patients between evaluation cycles (as distinct from over 400 patients overall, as referred to above). Another AHS reported an even greater variation between evaluation cycles, reporting a decrease in Aboriginal and Torres Strait Islander patients of over 3000. For this AHS, different reports were provided between cycles (APCC and nKPI), however both reports were produced using the same extraction tool. Staff acknowledged the variation, but were unable to provide a definitive answer as to the reason for the variation, other than an error in the data extraction process. They indicated that the lower number (nKPI report) was probably a more accurate reflection of the actual number of patients.
Diabetes register
All 12 AHSs that provided clinical indicator data in the final evaluation cycle reported the number of Aboriginal and Torres Strait Islander people on the diabetes register; this was an increase from 11 services in the fourth evaluation cycle and eight in the third evaluation cycle. The AHS that reported the largest number of patients with diabetes (over 700) was unable to provide the number of Aboriginal and Torres Strait Islander patients or number of all patients. Data from previous evaluation cycles for this AHS showed consistently high numbers of Aboriginal and Torres Strait Islanders with diabetes. In the final evaluation cycle, 10 AHSs were able to report on both the number of patients identified as Aboriginal or Torres Strait Islander and the number of all patients on the diabetes register (Table E1 and Figures E4-E6).
263
Sentinel Sites Evaluation Final Report – Appendices – February 2013
Table E4: Numbers of Aboriginal and Torres Strait Islander patients on diabetes registers, by Aboriginal Health Service and evaluation cycle
Aboriginal Health Service Cycle three Cycle four Cycle five
AHS 1 756 687 724
AHS 2 138 143 150
AHS 3 120 140 140
AHS 4 55 111 71
AHS 5 441 350 461
Eleven of the 12 AHSs reported more than 10 patients on the diabetes register in the fourth evaluation cycle, with all 12 AHSs reporting more than 10 patients on their diabetes registers in the final evaluation cycle. The number of patients on these diabetes registers ranged from 26 to 724 (Table E4).
Numbers of patients on diabetes register in relation to population prevalence of diabetes
The majority of AHSs (10/12) reported the number of Aboriginal and Torres Strait Islander people on the diabetes register as a percentage of all Aboriginal and Torres Strait Islander regular patients in evaluation cycle five, with a range from 5% to 25% (124/2669 to 461/1862).
The figures are generally lower than prevalence estimates of diabetes in Aboriginal and Torres Strait Islander people.139
Variation in numbers over time
Ten of the AHSs reported the number of Aboriginal and Torres Strait Islander patients on the diabetes register for both this evaluation cycle and the previous one. The total number of Aboriginal and Torres Strait Islander patients on the diabetes registers for these services increased by 5% between evaluation cycles four and five (2366 to 2488). Seven AHSs reported an increase in numbers on the diabetes register, with the largest increase being 32% (350 to 461). Two AHSs reported marked decreases: one of 29% (150 to 106) and the other of 36% (111 to 71). Significantly, all three AHSs used the same data extraction tool and provided the nKPI report.
Five AHSs (two urban, two regional, one remote) have reported numbers of Aboriginal and Torres Strait Islander patients on the diabetes register over three evaluation cycles. Four AHSs reported an increase in the proportion of patients with diabetes between cycles three and five of 5%, 9%, 17%, and 29%. However, only two of these four services reported increases in numbers for each of the two consecutive cycles. The percentage change in numbers for the four services was -21%, 4%, 17% and 102% between cycles three and four and 32%, 5%, 0% and -36% between cycles four and five respectively. One AHS reported a decrease in the proportion of patients with diabetes between cycles three and five of -8% with -9% reported between cycles three and four and 5% reported between cycles four and five (Table E4).
139 Minges, K.E., Zimmet, P., Magliano, D.J., Dunstan, D.W., Brown, A., Shaw, J.E., ‘Diabetes prevalence and determinants in Indigenous Australian populations: A systematic review’, Diabetes Research and Clinical Practice, August 2011 (Vol. 93, Issue 2, Pp 139-149).
264
Sentinel Sites Evaluation Final Report – Appendices – February 2013
The fluctuation between cycles in numbers of Aboriginal and Torres Strait Islander patients in a number of services is more than can reasonably be explained by new diagnoses, arrival of new patients, death of existing patients, or improved identification of Aboriginal and Torres Strait Islander status.
Over the course of the evaluation there was an increase in the number of AHSs reporting more than 10 patients identified as Aboriginal or Torres Strait Islander on their diabetes registers. In early evaluation cycles only one third to one half of AHSs reported more than 10 patients identified as Aboriginal or Torres Strait Islander on their diabetes registers, increasing to 12 out of 14 AHSs by the final evaluation cycle.
Reasons for variation in numbers over time
Variation in numbers reported for successive evaluation cycles appears to be due at least in part to changes in clinical information software systems, effective operation of extraction tools, the functional state of registers and in the capabilities of Health Service staff to use these registers.
Coronary Heart Disease register
Seven AHSs reported the total number of all patients (Aboriginal and Torres Strait Islander and non-Aboriginal and Torres Strait Islander) on the CHD register. An additional AHS could not report the total number of all patients on the CHD register but did report the number of Aboriginal and Torres Strait Islander patients on the CHD register, making a total of eight AHSs that could report the number of Aboriginal and Torres Strait Islander people on the CHD register in the final evaluation cycle. Five of these eight AHSs provided data on the number of Aboriginal and Torres Strait Islander people on the CHD register for both the fourth and final evaluation cycles.
For the eight AHSs that reported the number of Aboriginal and Torres Strait Islander patients on the CHD register, the number of patients on the CHD register per service for this reporting period ranged from 42 to 172 (Figure E7).
Numbers of patients on CHD register in relation to population prevalence of CHD
The percentage of Aboriginal and Torres Strait Islander people on the CHD register as a percentage of all Aboriginal and Torres Strait Islander regular patients ranged from 1.9% to 6.0%, with the average for the seven AHSs for which this proportion could be calculated being 3.3%. This is higher than published estimates of the prevalence of CHD among Aboriginal and Torres Strait Islander people.140
Variation in numbers over time
For the five AHSs that reported relevant data in both the fourth and final evaluation cycles, the overall number of Aboriginal and Torres Strait Islander patients with CHD reported for the final evaluation cycle was very similar to the fourth evaluation cycle (four patients less). One of the five AHSs reported a 19% decrease in number of Aboriginal and Torres Strait Islander patients on the CHD register (52 to 42), three AHSs reported slight increases (47 to 48; 86 to 89; and 50 to 52) and one AHSs reported no change. There were some more marked changes for some services between earlier evaluation cycles, with one service recording an increase of 79% (from 29 to 52) in the number of patients on the CHD register between evaluation cycles.
140 Australian Institute of Health and Welfare, Penm E (2008) Cardiovascular disease and its associated risk factors in Aboriginal and Torres Strait Islander peoples 2004-05. Australian Institute of Health and Welfare, Canberra.
265
Sentinel Sites Evaluation Final Report – Appendices – February 2013
Reasons for variation in numbers over time
Reporting by AHSs on the number of patients on the CHD register was less complete than for reporting on diabetes registers. This was due in part to the types of reports that were provided (Table E3) over the evaluation period, specifically the change from Healthy for Life reports to nKPI reports between evaluation cycles three and four, with nKPI reports not including data on patients with CHD.
Assessment of data from General Practices
Reporting on regular patients
All except two General Practices provided data on the number of all regular patients (Aboriginal and Torres Strait Islander and non- Aboriginal and Torres Strait Islander) of the practice. While the majority of General Practices appeared to use the RACGP standard definition of regular patient (3 visits in the past 2 years), interviews with General Practice and DGP staff indicated that at least four of the General Practices that reported on number of regular patients were using some other definition of ‘regular’ or ‘active’ patient.
The number of all regular patients in each General Practice ranged between 3524 and 42 666. Three practices had less than 5000 regular patients, 10 practices had between 5000 and 10 000 regular patients, five between 10 000 and 20 000 and four had over 20 000.
Variation in numbers over time
Nineteen of the General Practices that reported data for the final evaluation cycle also reported on the number of all regular patients for the fourth evaluation cycle. For 12 of these practices, the number reported for the final evaluation cycle varied by less than 10% of the number reported in the previous evaluation cycle. For the other seven practices, there were more marked differences between the number of all regular patients reported for the final evaluation cycle and the previous evaluation cycle. Two of the seven practices reported a decrease in the number of all regular patients of 13% (6965 to 6066) and 50% (7049 to 3524). Five of the seven practices reported increases of between 11% (19 937 to 22 215) and 24% (15 143 to 18 771).
The majority of practices that provided data for more than one evaluation cycle reported an increase in the number of regular patients over the evaluation period. Three General Practices reported significant decreases in the number of regular patient numbers over the whole evaluation period. One practice reported a decrease in the number of regular patients from cycle two to five of 39% (14 715 to 8946). Two practices that only reported for two evaluation cycles (reported above) recorded decreases of 13% and 50% between cycles three and four.
Reasons for variation in numbers over time
A number of services, particularly General Practices, reported that changes in numbers were related to efforts to improve the functional state of clinical information systems. Three General Practices reported significant variation in patient numbers that were directly attributed to staff conducting audits of their patient files either manually or electronically.
266
Sentinel Sites Evaluation Final Report – Appendices – February 2013
Reporting on Aboriginal and Torres Strait Islander patients
Twenty-two General Practices submitted data in the final evaluation cycle for the number of Aboriginal and Torres Strait Islander regular patients on the clinical information system. None of these practices reported that the Aboriginal and Torres Strait Islander status of all patients was recorded. Overall, for the 22 General Practices, the Aboriginal and Torres Strait Islander status of 62% (180 791/289 333) of patients was reported as ‘not recorded’. In one practice, nearly all 33 016 ‘active’ patients had Aboriginal and Torres Strait Islander status as ‘not recorded’. Two practices did not report on the number of all regular patients or the number of Aboriginal and Torres Strait Islander patients.
Numbers of patients identified as Aboriginal or Torres Strait Islander in relation to numbers of identified Aboriginal or Torres Strait Islander people in the site population
The number of regular patients identified in clinical information systems as Aboriginal and Torres Strait Islander people ranged from 0.4% (23/6348) to 2.3% (998/42 666). In the final evaluation cycle, 17 of the 22 General Practices had more than 50 patients identified as Aboriginal and Torres Strait Islander, 16 had more than 100, nine had more than 200, and four had more than 500 (Table E1 and Figures E8–E9). Practices in regional sites tended to have larger numbers of Aboriginal and Torres Strait Islander patients identified than those in urban sites.
For the four General Practices that reported more than 500 Aboriginal and Torres Strait Islander patients, the percentage of all regular patients of these practices who were identified as Aboriginal or Torres Strait Islander was equivalent to, or higher than, the percentage of Aboriginal and Torres Strait Islander people in the total population for the site. Conversely, for the majority of practices (18/22), Aboriginal and Torres Strait Islander people made up a smaller proportion of regular patients than the proportion of the total site population who were identified as Aboriginal and Torres Strait Islander.
Variation in numbers over time
Nineteen General Practices that reported data on number of all regular patients for the fifth and fourth evaluation cycles also reported on number of patients identified as Aboriginal and Torres Strait Islander for each of the evaluation cycles. Most of these practices showed substantial changes in numbers of patients identified as Aboriginal and Torres Strait Islander over the course of the evaluation period.
More specifically, 16 of these practices showed an increase and three showed a decrease. For 5 of these 19 General Practices, the number reported for the final evaluation cycle varied by less than 10% of the number reported in the fourth evaluation cycle. For 11 of these 19 practices, the proportional increase in the number of patients identified as Aboriginal and Torres Strait Islander was more marked between evaluation cycles four and five (between 13% (230 to 259) and 121% (19 to 42)), compared to the change between evaluation cycles three and four (between 4% (528 to 550) and 88% (26 to 49)). For the three practices that reported a decrease in the number of patients identified as Aboriginal and Torres Strait Islander between cycles four and five, the size of the decreases were 5% (111/106), 9% (527/480) and 58% (234/97). Only one of the three practices provided data for cycles three and four, and this practice reported an increase of 11% (100/111) between these cycles. For the General Practices that provided data on number of Aboriginal and Torres Strait Islander patients for both the fourth and fifth (final) evaluation cycles, there was an overall increase of 14% (from 5051 to 5766), compared to an overall increase of 10% (from 2848 to 3122) between evaluation cycles three and four.
Reasons for variation in numbers over time
For General Practices, increases in the number of patients identified as Aboriginal and Torres Strait Islander were most commonly attributed to a combination of better identification of existing patients
267

Sentinel Sites Evaluation Final Report – Appendices – February 2013
and increases in the number of new patients identified as Aboriginal or Torres Strait Islander. In four General Practices the increase was attributed largely to better identification of existing patients (including one practice that was not registering any new patients, so the increase could only be the result of improved identification). In one practice the increase was attributed to assistance with identification from the DGP Outreach Workers and more general pro-active work by the DGP in increasing identification. Two of the General Practices that reported large increases in the numbers of patients identified as Aboriginal or Torres Strait Islander attributed the increases largely to new patients coming to the service.
Two General Practices in urban Sentinel Sites that provided clinical indicator data were GP super clinics. Both clinics have shown significant growth in the numbers of all patients and in the number of Aboriginal and Torres Strait Islander patients over the evaluation period. Staff of one of the GP super clinics indicated that the Commonwealth funding for super clinics meant good clinical information systems and support could be made available and that as a result of the ICDP, Aboriginal and Torres Strait Islander patient care was being given greater priority than may have previously been the case. The numbers of patients identified as Aboriginal and Torres Strait Islander on the registers for these super clinics increased by 53% (255 to 389) and 304% (26 to 105) over the evaluation period. Only one other urban General Practice reported a comparable increase in Aboriginal and Torres Strait Islander patients of 194% (49 to 144). This practice also conducted a major audit between evaluation cycles three and four. The rise in Aboriginal and Torres Strait Islander patients may be due to better identification of existing patients following the audit.
One General Practice reported significant decreases in all categories (all patients, Aboriginal and Torres Strait Islander patients and disease registers). The practice carried out an audit of all patient files (electronically) between evaluation cycles. The number of all patients at this practice decreased by about 50% from 7049 to 3524. Only one other practice reported a notable decrease in the number of Aboriginal and Torres Strait Islander patients of 9% (527 to 480). This practice recorded a similar decrease in all patients, which may be the result of actively cleaning the database between evaluation cycles.
Diabetes registers
All of the 24 General Practices reported the number of patients identified as Aboriginal and Torres Strait Islander on the diabetes register (an increase from 21 General Practices in the fourth evaluation cycle). The numbers ranged between 1 and 96 per General Practice (Table E5 and Figures E10 - E11). Fourteen of the 24 practices had six or fewer patients identified as Aboriginal and Torres Strait Islander on the diabetes register. Less than half of the General Practices that reported number of Aboriginal and Torres Strait Islander patients on the diabetes register had more than 10 Aboriginal and Torres Strait Islander patients on the register. Regional practices generally had larger numbers of Aboriginal and Torres Strait Islander patients on their diabetes registers than urban practices, although the numbers varied widely between practices in both urban and regional locations.
268
Sentinel Sites Evaluation Final Report – Appendices – February 2013
Table E5: Number of Aboriginal and Torres Strait Islander patients on diabetes registers, by General Practice and evaluation cycle
General Practice Cycle three Cycle four Cycle five
GP 1 1 4 5
GP 2 1 3 4
GP 3 1 1 3
GP 4 34 37 41
GP 5 17 20 28
GP 6 63 88 96
GP 7 23 14 31
GP 8 4 4 6
GP 9 6 6 6
GP 10 4 7 7
GP 11 5 5 5
GP 12 6 6 6
GP 13 0 1 3
Numbers of patients on diabetes register in relation to population prevalence of diabetes
Twenty-two of the 24 General Practices could provide data for both the number of Aboriginal and Torres Strait Islander patients on the diabetes register and all Aboriginal and Torres Strait Islander regular patients. Two practices could only provide the number on the diabetes registers. The number of Aboriginal and Torres Strait Islander people on the diabetes register as a percentage of all Aboriginal and Torres Strait Islander regular patients ranged from 1.8% to 21.7%, with the average for 22 practices being 6.0%. For the eight practices with 10 or more Aboriginal and Torres Strait Islander patients on the diabetes register, the number of Aboriginal and Torres Strait Islander people on the diabetes register as a proportion of all patients identified as Aboriginal and Torres Strait Islander on the practice patient list was 6.8%. The figure of 6.8% is close to the lower limit of the range of prevalence estimates of diabetes in Aboriginal and Torres Strait Islander people.141
By way of comparison, for the 22 General Practices that provided relevant data, the number of all people on the diabetes register as a percentage of all regular patients, ranged from 1.7% to 7.4% with the average for the 22 practices being 3.5%. This figure is lower than national surveys of prevalence of self-reported diagnosis of diabetes in the general population (4.4%).142
141 Minges, K.E., Zimmet, P., Magliano, D.J., Dunstan, D.W., Brown, A., Shaw, J.E., ‘Diabetes prevalence and determinants in Indigenous Australian populations: A systematic review’, Diabetes Research and Clinical Practice - August 2011 (Vol. 93, Issue 2, Pp 139-149).142 AIHW 2011. Diabetes prevalence in Australia: detailed estimates for 2007-08. Diabetes series no. 17. Cat. no. CVD 56. Canberra: AIHW, (accessed 5 April 2012).
269
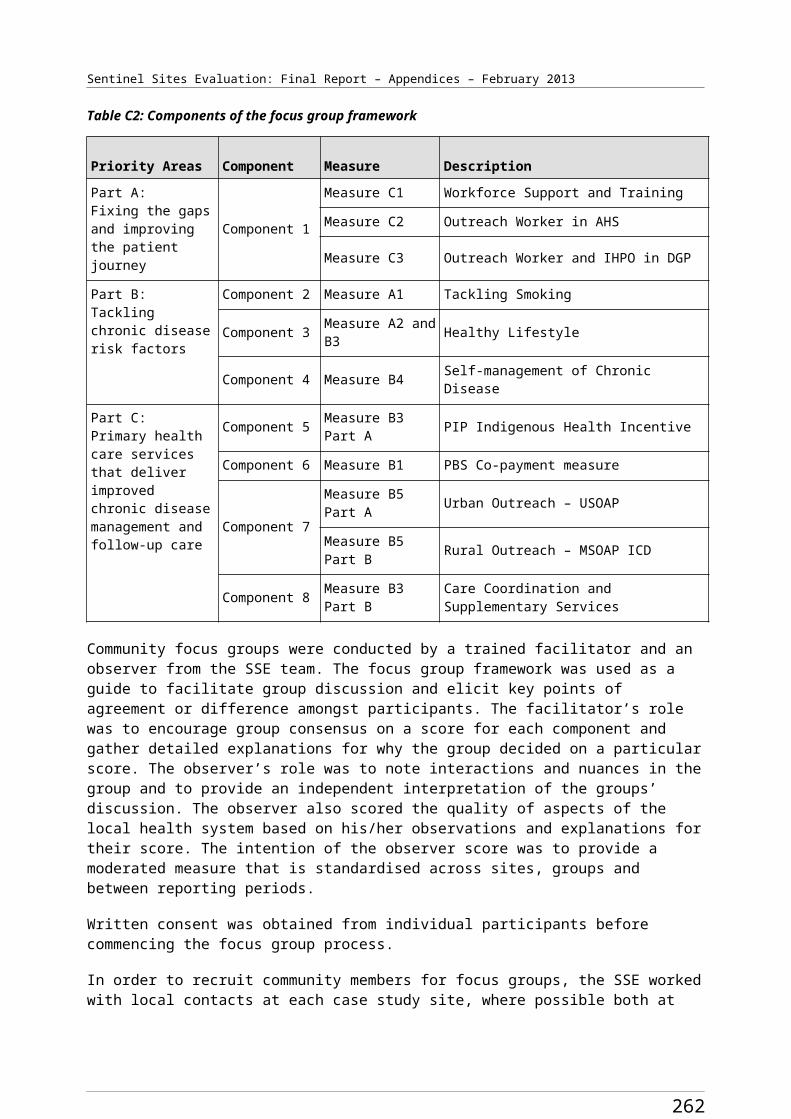
Sentinel Sites Evaluation Final Report – Appendices – February 2013
Variation in numbers over time
While eight General Practices that reported more than 10 patients on the diabetes register in the fourth evaluation cycle also reported more than 10 patients in the final evaluation cycle, there were substantial changes over successive evaluation cycles in the numbers of patients on the diabetes register for some practices.
Twenty practices reported the number of Aboriginal and Torres Strait Islander patients on their diabetes register for both the fourth and final evaluation cycle. For 17 General Practices, the reported number of Aboriginal and Torres Strait Islander patients on the diabetes register was higher for the final evaluation cycle compared to the fourth evaluation cycle, with an overall increase from 315 to 353 (12%). Four General Practices reported a variation of more than 10 Aboriginal and Torres Strait Islander patients on the diabetes register over the evaluation period – some increasing and some decreasing. The largest proportional changes were seen in practices with relatively small numbers of patients on the diabetes register (for example, from 2 to 1, from 5 to 2, from 25 to 3). The practice that showed the largest decrease (from 25 to 3) also reported a large decrease in all patients (7049 to 3524).
Thirteen General Practices reported on the number of Aboriginal and Torres Strait Islander patients on the diabetes registers over three successive evaluation cycles (Table E5).
The majority of General Practices showed steady increases or stable numbers apart from one practice that reported a decrease of 39% (23 to 14) from evaluation cycle three to four and then an increase of 120% (14 to 31) from evaluation cycle four to five.
Reasons for variation in numbers over time
The General Practice described above as reporting marked differences between cycles three, four and five reported a steady increase in overall numbers of Aboriginal and Torres Strait Islander patients over the evaluation period and little or no change in numbers of patients on the CHD register. Though small numbers are involved, it is unclear as to why the practice showed these variations in numbers of patients on the diabetes register.
All but one of the 13 General Practices that provided data on the number of Aboriginal and Torres Strait Islander patients with diabetes over these three evaluation cycles was able to extract a full APCC report from their clinical information system. The remaining practice extracted the data manually.
The changes in numbers of Aboriginal and Torres Strait Islander patients on diabetes registers appeared to be due to similar factors reported above in relation to the numbers of regular patients identified as Aboriginal and Torres Strait Islander people - changes in clinical information software systems, in ability to use the extraction tools, in the functional state of registers, and in the capabilities of Health Service staff to use the clinical information system for reporting on service population data.
Coronary Heart Disease register
All of the 24 General Practices reported the number of patients identified as Aboriginal and Torres Strait Islander on the CHD register, an increase from 21 General Practices in the fourth evaluation cycle. The numbers range between 0 and 34 per practice (Figures E12 – E13). Half of the practices (12/24) had three or fewer Aboriginal and Torres Strait Islander patients on the CHD register. Three of the 24 practices had 10 or more Aboriginal and Torres Strait Islander patients on the CHD register.
Regional practices tended to have larger numbers of Aboriginal and Torres Strait Islander patients on their CHD registers than urban practices.
270
Sentinel Sites Evaluation Final Report – Appendices – February 2013
Numbers of patients on CHD register in relation to population prevalence of CHD
The number of Aboriginal and Torres Strait Islander people on the CHD register as a percentage of all Aboriginal and Torres Strait Islander regular patients ranged from 0% to 5.7%, with the average for 22 practices that provided relevant data being 2.4%. While this average figure is higher than prevalence estimates of CHD in Aboriginal and Torres Strait Islander people, the majority of practices have fewer Aboriginal and Torres Strait Islander people diagnosed with CHD than would be expected in relation to the population prevalence of CHD among Aboriginal and Torres Strait Islander people (1.2%).143
The small number of Aboriginal and Torres Strait Islander patients in most General Practices is a limitation on making meaningful comparison with population estimates of CHD. Twenty-one of 24 practices reported they had less than 10 Aboriginal and Torres Strait Islander patients on the register in the final evaluation cycle.
For the three practices with 10 or more Aboriginal and Torres Strait Islander patients on the CHD register, the number of Aboriginal and Torres Strait Islander people on the CHD register as a proportion of all patients identified as Aboriginal and Torres Strait Islander on the practice patient list was 3.1% (70/2288).
Variation in numbers over time
Twenty practices reported the number of Aboriginal and Torres Strait Islander patients on their CHD register for both the final and fourth evaluation cycles. Two practices reported zero Aboriginal and Torres Strait Islander patients for the final and fourth evaluation cycles.
All three of the practices with more than 10 registered CHD patients reported a higher number of Aboriginal and Torres Strait Islander patients on the CHD register for the final evaluation cycle compared to the fourth evaluation cycle – more specifically, the increase in numbers for these practices was one, three and six (10%, 14% and 21% increase respectively over the number reported in the fourth evaluation cycle).
Twenty-two of the 24 General Practices could provide data for both the number of Aboriginal and Torres Strait Islander patients on the CHD register and all Aboriginal and Torres Strait Islander regular patients. Two practices could only provide the numbers on the CHD registers.
Reasons for variation in numbers over time
To the extent that the generally small numbers of Aboriginal and Torres Strait Islander patients on CHD registers of individual practices allowed any meaningful assessment of changes in numbers between cycles, the changes appeared to be due to similar factors reported above in relation to the numbers of regular patients identified as Aboriginal and Torres Strait Islander people and on numbers of patients identified as Aboriginal and Torres Strait Islander on diabetes registers.
Potential for use of clinical indicator data to monitor impact of ICDP on service performance
It is clear from the data presented above that for many Health Services that are willing and able to provide clinical indicator reports, the data on numbers of ‘regular’ patients and numbers of patients on disease registers are not sufficiently stable or consistent to support calculation and reporting of clinical indicator data that would provide a reliable basis for monitoring the quality of clinical care and health
143 Australian Institute of Health and Welfare, Penm E (2008) Cardiovascular disease and its associated risk factors in Aboriginal and Torres Strait Islander peoples 2004-05. Australian Institute of Health and Welfare, Canberra.
271
Sentinel Sites Evaluation Final Report – Appendices – February 2013
outcomes - including for the purpose of assessing the impact of the ICDP on clinical performance or on clinical outcomes.
The service population measures of numbers of regular patients, numbers of patients on chronic disease registers, and numbers of regular patients identified as Aboriginal or Torres Strait Islander and numbers on disease registers identified as Aboriginal or Torres Strait Islander, are the basis for the denominators for all indicators relevant to monitoring and improvement of clinical care at a service and population level, including indicators relevant to prevention and management of chronic illness. The accuracy of indicators that are generated from extraction of data from clinical information systems is dependent on a) consistent and accurate recording of relevant clinical data in patient records, and b) consistent and accurate identification and recording of patients as ‘regular’ patients, and inclusion of regular patients with diagnosed chronic disease on disease registers in order that numbers of regular patients and numbers of patients on chronic disease registers can be used as denominators for calculation of indicators as appropriate. For automated extraction of clinical indicator data from electronic clinical information systems, relevant clinical data need to be recorded in the correct format in the correct field in the electronic clinical record. This requires a high level of standardisation of clinical records and consistent and complete recording of specific clinical data by clinical staff in addition to consistent and accurate recording of ‘regular’ patient status and Indigenous status.
While some Health Services may have well functioning systems, it is clear that many Health Services currently have very limited capability to generate reasonably accurate service level data from their clinical information systems. Incompleteness of recording of Aboriginal and Torres Strait Islander status and variations in numbers over time show the data to be generally highly unreliable for the purposes of monitoring and evaluation of clinical performance and outcomes.
The limited state of development of clinical information systems is more remarkable in that many of the AHSs that provided clinical indicator data for the SSE are likely to be among the highest performing AHSs in the country, and that the General Practices that provided data were identified by their local DGPs as practices that had a relatively strong interest in Aboriginal and Torres Strait Islander health and ability to provide data.
It appears that capability of Health Service staff to use clinical information systems effectively for monitoring and improvement at a service level varies widely between Health Services and within services over time. This reflects a general limitation of clinical information system capability with regard to support for prevention and management of chronic disease in many Health Services, and is an indication of the type and scale of investment that is required to improve development of clinical information systems. There is a clear need for investment in the capability of Health Service staff to use clinical information systems effectively for service level monitoring, planning and improvement.
Possible impact of the ICDP on clinical information systems
There were some signs of improvement in the functional state of clinical information systems over the course of the evaluation. The recent increases in identification of Aboriginal and Torres Strait Islander status in both AHSs and General Practices are positive signs. There was also some evidence of improvement in chronic disease registers, with increases in the numbers of Aboriginal and Torres Strait Islander patients being included on these registers, likely to be related both to improved identification and improved recording of diagnoses in information systems. It appears likely that these improvements were stimulated at least partly by ICDP related activities.
272
Sentinel Sites Evaluation Final Report – Appendices – February 2013
Limitations of clinical information data of particular relevance to General Practice
There are a number of limitations on the data that are of particular relevance to General Practices. In the context of the General Practices being identified by the DGPs in the Sentinel Sites as practices with a strong interest and/or involvement in providing care for Aboriginal and Torres Strait Islander people, the general under-representation of Aboriginal and Torres Strait Islander people among the regular practice patients suggests that:
Aboriginal and Torres Strait Islander people attending these practices are frequently not consistently being identified as Aboriginal and Torres Strait Islander on the practice information systems.
Aboriginal and Torres Strait Islander people attending these practices tend to be a small, relatively select group of people within the local Aboriginal and Torres Strait Islander population.
In either case, the clinical indicator data from the majority of these practices are likely to be subject to significant selection bias and the data cannot be considered to be representative of Aboriginal and Torres Strait Islander people in the site population. Furthermore, the General Practices that provided clinical indicator data cannot be regarded as representative of General Practices in the Sentinel Sites or for Australia more widely. The selection bias in relation to practices that provided data, and in relation to the records from which clinical indicator data could be obtained, is an important limitation of the clinical indicator data.
In addition to the points made above regarding limited identification of Aboriginal and Torres Strait Islander patients in these practices and/or the patients identified as Aboriginal and Torres Strait Islander in these practices not being representative of the general Aboriginal and Torres Strait Islander population, the small number of these patients on the diabetes and CHD registers for most of these practices, and the low proportion of regular Aboriginal and Torres Strait Islander patients on the diabetes register relative to the prevalence of diabetes among Aboriginal and Torres Strait Islander people, provides further indication of selection bias in relation to the representativeness of patients on the practice registers. This presents limitations on the use of clinical indicator data provided by General Practices for the purpose of assessing the impact of the ICDP on clinical performance or outcomes for diabetes and CHD.
These findings suggest that diabetes registers are not being well maintained for regular patients of these General Practices in general, or for regular Aboriginal and Torres Strait Islander patients. In addition to the points made above regarding limited identification of Aboriginal and Torres Strait Islander patients in these practices and/or the patients identified as Aboriginal and Torres Strait Islander in these practices not being representative of the general Aboriginal and Torres Strait Islander population, the apparent deficiency in diabetes registers presents further limitation on the use of clinical indicator data provided by General Practices for the purpose of assessing impact of the ICDP on clinical performance or outcomes.
Conclusion
The identification of Aboriginal and Torres Strait Islander patients in clinical information systems and the inclusion of patients on diabetes or CHD registers, in both AHSs and General Practices, appears to be far from complete. The small number of AHSs that have provided clinical indicator data over successive rounds over the SSE to date makes it impossible to discern clear trends in identification of Aboriginal and Torres Strait Islander status or inclusion of patients on disease registers in AHSs. There were a larger number of General Practices that provided clinical indicator data over successive rounds
273
Sentinel Sites Evaluation Final Report – Appendices – February 2013
and these practices generally show some increase in the numbers of patients identified as Aboriginal or Torres Strait Islander. There is also some evidence of a trend towards increasing numbers of patients identified as Aboriginal and Torres Strait Islanders on diabetes and CHD registers in General Practices.
There are ongoing changes in the clinical software being used by primary health care services. It is clear that changes in software systems have an impact on the consistency and quality of reported clinical indicator data, with significant irregularities in the total number of regular patients and number of Aboriginal and Torres Strait Islander patients reported over the course of the evaluation. It is also clear that some variations in the consistency and quality of data are due to changes in the methods used to extract clinical indicator data and in auditing or ‘data cleaning’ activity conducted by some Health Services.
An important issue emerging from this analysis of the clinical indicator data continues to be the evidence on the poor state of development of clinical information systems and the lack of ability of Health Service staff to effectively use such systems. The poor state of development and use of clinical information systems and the resulting lack of clinical indicator data of reasonable quality, place serious constraints on the value of the clinical indicator data for the purpose of assessing impact of the ICDP on clinical performance and clinical outcomes (as was the intended purpose of the clinical indicator data reflected in the National Framework). The findings reported here demonstrate the serious inadequacies in the potential for currently available clinical information systems to provide meaningful data on the impact of the ICDP.
The poor state of development of clinical information systems places serious constraints on the effective implementation of a number of measures within the ICDP, specifically including any that require effective identification of any Aboriginal and Torres Strait Islander patients of primary health care services, as well as any Aboriginal and Torres Strait Islander patients who have a chronic illness or who have risk factors which predispose them to the development of chronic illness.
The data from this evaluation demonstrates the need for stronger and more strategic investment in development of clinical information systems within primary health care services in both AHSs and General Practices to support their effective engagement in chronic illness care and the ability of Health Service staff to use these systems to evaluate and improve the quality of chronic illness care. This needs to be done in a way that ensures these systems and the data that are generated by these systems are valued by the Health Service staff.
A small number of General Practices appear to be providing care to relatively large numbers of Aboriginal and Torres Strait Islander patients. The information on the numbers of patients identified as Aboriginal or Torres Strait Islander people in General Practice, together with other information about the challenges of implementing ICDP related programs in General Practices with small numbers of Aboriginal and Torres Strait Islander patients, suggests it may be appropriate to focus investment on a limited number of General Practices that have a strong orientation to providing care for Aboriginal and Torres Strait Islanded people rather than spreading investment across all General Practices, many of which have few Aboriginal and Torres Strait Islander patients and relatively little interest or potential to improve quality of care for significant numbers of Aboriginal and Torres Strait Islander people.
The quality of the clinical indicator data in these systems is critically dependent on the engagement of Health Service staff with the clinical information systems and with the data that can be generated by these systems. There is therefore a vital need for systematic approaches to support such engagement of Health Service staff. It is a critical requirement that, in addition to development of user-friendly information systems, such approaches include training of clinicians, managers and administrative staff in the effective implementation and use of clinical information systems in a way that directly supports provision of high quality clinical care and provides value to the local clinical and management staff.
274
Sentinel Sites Evaluation Final Report – Appendices – February 2013
There are continuous quality improvement models that are well suited to meet this need including models that have been designed to meet the specific needs of Aboriginal and Torres Strait Islander primary health care services.
Figure E1: Number of patients on clinical information systems identified as Aboriginal and Torres Strait Islander for remote Aboriginal Health Services (final evaluation cycle)
Figure E2: Number of patients on clinical information systems identified as Aboriginal and Torres Strait Islander for regional Aboriginal Health Services (final evaluation cycle)
275
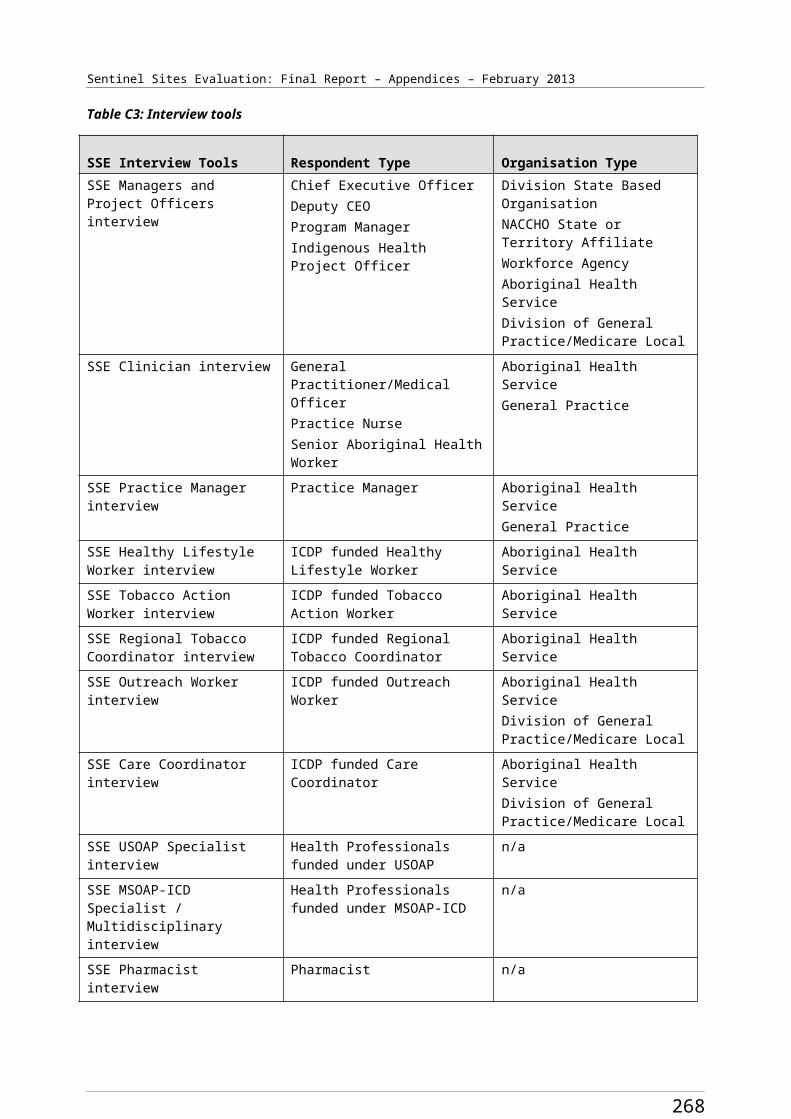
Sentinel Sites Evaluation Final Report – Appendices – February 2013
Figure E3: Number of patients on the clinical information systems identified as Aboriginal and Torres Strait Islander for urban Aboriginal Health Services (final evaluation cycle)
Figure E4: Number of Aboriginal and Torres Strait Islander people on the diabetes registers for remote Aboriginal Health Services (final evaluation cycle)
276
Sentinel Sites Evaluation Final Report – Appendices – February 2013
Figure E5: Number of Aboriginal and Torres Strait Islander people on the diabetes registers for regional Aboriginal Health Services (final evaluation cycle)
Figure E6: Number of Aboriginal and Torres Strait Islander people on the diabetes registers of urban Aboriginal Health Services (final evaluation cycle)
277
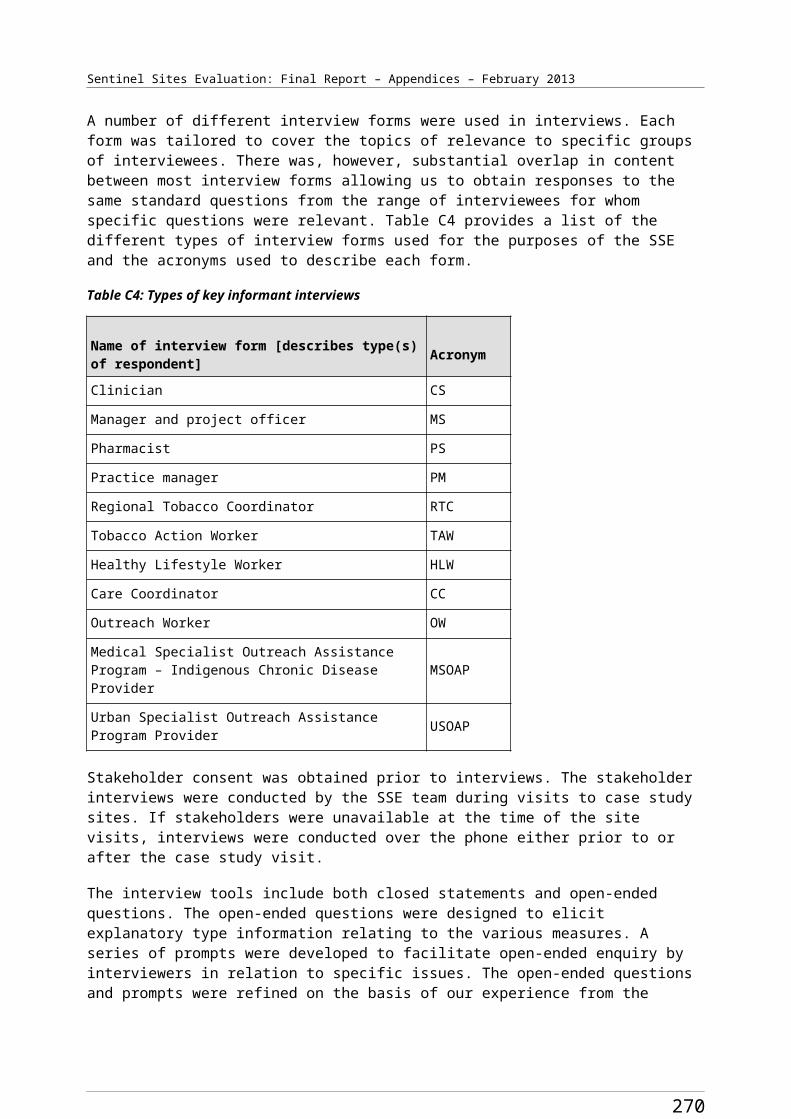
Sentinel Sites Evaluation Final Report – Appendices – February 2013
Figure E7: Number of Aboriginal and Torres Strait Islander people on the CHD registers in Aboriginal Health Services (final evaluation cycle)
Figure E8: Number of patients on the clinical information systems identified as Aboriginal and Torres Strait Islander for regional General Practices (final evaluation cycle)
278
Sentinel Sites Evaluation Final Report – Appendices – February 2013
Figure E9: Number of patients on the clinical information systems identified as Aboriginal and Torres Strait Islander for urban General Practices (final evaluation cycle)
Figure E10: Number of Aboriginal and Torres Strait Islander people on the diabetes registers for regional General Practices (final evaluation cycle)
279

Sentinel Sites Evaluation Final Report – Appendices – February 2013
Figure E11: Number of Aboriginal and Torres Strait Islander people on the diabetes registers for urban General Practices (final evaluation cycle)
Figure E12: Number of Aboriginal and Torres Strait Islander people on the CHD registers for regional General Practices (final evaluation cycle)
280
Sentinel Sites Evaluation Final Report – Appendices – February 2013
Figure E13: Number of Aboriginal and Torres Strait Islander people on the CHD registers for urban General Practices (final evaluation cycle)
281
Sentinel Sites Evaluation Final Report – Appendices – February 2013
Appendix F. PBS Co-payments
Table F1: Number of people aged ≥15 years accessing medicines through the PBS Co-payment measure for Aboriginal and Torres Strait Islander people aged ≥15 for Sentinel Sites and the rest of Australia, by age, September 2010 - May 2012
Sentinel Sites/ Rest of Australia
Age Group
Sep-Nov
2010
Dec 2010 - Feb 2011
Mar-May 2011
Jun-Aug 2011
Sep-Nov 2011
Dec 2011 - Feb 2012
Mar-May 2012
Total Sentinel Sites
15-54 4738 5611 7221 8323 9253 9926 12 340
≥55 2042 2342 2757 3280 3567 3827 4405
Total 6780 7953 9978 11 603 12 820 13 753 16 745
Total rest of Australia
15-54 17 082 19 621 24 895 28 616 31 228 30 608 36 906
≥55 8002 8632 10 230 12 313 13 168 12 948 14 742
Total 25 084 28 253 35 125 40 929 44 396 43 556 51 648
Urban Sentinel Sites
15-54 1751 2073 2712 3244 3736 4152 5231
≥55 716 803 936 1154 1255 1406 1673
Total 2467 2876 3648 4398 4991 5558 6904
Rest of urban Australia
15-54 4736 5721 7329 8527 9453 9090 11 409
≥55 2094 2389 2835 3383 3663 3548 4087
Total 6830 8110 10164 11910 13 116 12638 15 496
Regional Sentinel Sites
15-54 2961 3499 4451 5006 5418 5640 6913
≥55 1314 1517 1796 2093 2266 2369 2676
Total 4275 5016 6247 7099 7684 8009 9589
Rest of regional Australia
15-54 10 475 11 506 14 626 16 678 18 118 17 896 21 074
≥55 4794 4921 5800 6968 7413 7314 8316
Total 15 269 16 427 20 426 23 646 25 531 25 210 29 390
Remote Sentinel Sites
15-54 26 39 58 73 99 134 196
≥55 12 22 25 33 46 52 56
Total 38 61 83 106 145 186 252
Rest of remote Australia
15-54 1871 2394 2940 3411 3657 3622 4423
≥55 1114 1322 1595 1962 2092 2086 2339
Total 2985 3716 4535 5373 5749 5708 6762
282
Sentinel Sites Evaluation Final Report – Appendices – February 2013
Table F2: Number of people aged ≥15 years accessing medicines through the PBS Co-payment measure per 100 Aboriginal and Torres Strait Islander people aged ≥15 for Sentinel Sites and the rest of Australia, by age, September 2010 - May 2012
Sentinel Sites/ Rest of Australia
Age Group
Sep-Nov 2010
Dec 2010 - Feb 2011
Mar-May 2011
Jun-Aug 2011
Sep-Nov 2011
Dec 2011 - Feb 2012
Mar-May 2012
Total Sentinel Sites
15-54 9.0 10.6 13.5 15.5 17.2 18.5 22.6≥55 28.1 32.3 37.3 44.4 48.3 51.8 58.6Total 11.3 13.3 16.3 19.0 21.0 22.5 26.9
Rest of total Australia
15-54 8.0 9.1 11.4 13.1 14.3 14.0 16.6≥55 24.5 26.5 30.8 37.1 39.6 39.0 43.5Total 10.2 11.4 13.9 16.2 17.6 17.3 20.1
Urban Sentinel Sites
15-54 8.1 9.6 12.3 14.8 17.0 18.9 23.4≥55 25.9 29.0 33.2 40.9 44.5 49.9 58.2Total 10.1 11.8 14.7 17.7 20.1 22.4 27.3
Rest of urban Australia
15-54 7.1 8.6 10.8 12.5 13.9 13.3 16.4≥55 22.4 25.6 29.8 35.5 38.5 37.3 42.1Total 9.0 10.7 13.1 15.3 16.9 16.3 19.6
Regional Sentinel Sites
15-54 12.1 14.3 17.9 20.2 21.8 22.7 27.4≥55 38.7 44.7 52.0 60.6 65.6 68.6 76.3Total 15.4 18.1 22.1 25.1 27.2 28.3 33.3
Rest of regional Australia
15-54 11.8 12.9 16.1 18.4 20.0 19.8 22.8≥55 33.5 34.4 39.8 47.8 50.8 50.1 55.9Total 14.8 15.9 19.4 22.5 24.3 24.0 27.4
Remote Sentinel Sites
15-54 0.4 0.6 0.8 1.1 1.4 1.9 2.8≥55 1.1 2.0 2.2 3.0 4.1 4.7 4.9Total 0.5 0.8 1.0 1.3 1.8 2.3 3.1
Rest of remote Australia
15-54 3.2 4.1 4.9 5.7 6.1 6.0 7.2≥55 12.4 14.8 17.5 21.5 22.9 22.9 25.2Total 4.4 5.5 6.6 7.8 8.3 8.3 9.6
283
Sentinel Sites Evaluation Final Report – Appendices – February 2013
Table F3: Anatomical Therapeutic Chemical Classification
Code Title Classification in reportA01 Stomatological preparations OtherA02 Drugs for acid related disorders OtherA03 Drugs for functional gastrointestinal disorders OtherA04 Anti-emetics and anti-nauseants OtherA05 Bile and liver Therapy OtherA06 Laxatives OtherA07 Anti-diarrheal, intestinal anti-inflammatory/ anti-infective agents OtherA09 Digestives, incl. enzymes OtherA10 Drugs used in diabetes DiabetesA11 Vitamins OtherA12 Mineral supplements OtherA14 Anabolic agents for systemic use OtherB01 Antithrombotic agents OtherB02 Anti-hemorrhagics OtherB03 Anti-anaemic preparations OtherC01 Cardiac therapy CardiacC02 Antihypertensive CardiacC03 Diuretics CardiacC07 Beta blocking agents CardiacC08 Calcium channel blockers CardiacC09 Agents acting on the renin-angiotensin system CardiacC10 Lipid modifying agents CardiacD01 Anti-fungals for dermatological use OtherD02 Emollients OtherD05 Anti-psoriatic OtherD06 Antibiotics and chemotherapeutics for dermatological use OtherD07 Corticosteroids, dermatological preparations OtherD10 Anti-acne preparations OtherD11 Other dermatological preparations OtherG02 Other gynaecological OtherG03 Sex hormones and modulators of the genital system OtherG04 Urological OtherH01 Pituitary and hypothalamic hormones and analogues OtherH02 Corticosteroids for systemic use OtherH03 Thyroid therapy OtherH04 Pancreatic hormones OtherH05 Calcium homeostasis OtherJ01 Antibacterial for systemic use Anti-bacterialJ02 Anti-mycotics for systemic use OtherJ04 Anti-mycobacterials OtherJ05 Anti-virals for systemic use OtherJ07 Vaccines Other
284
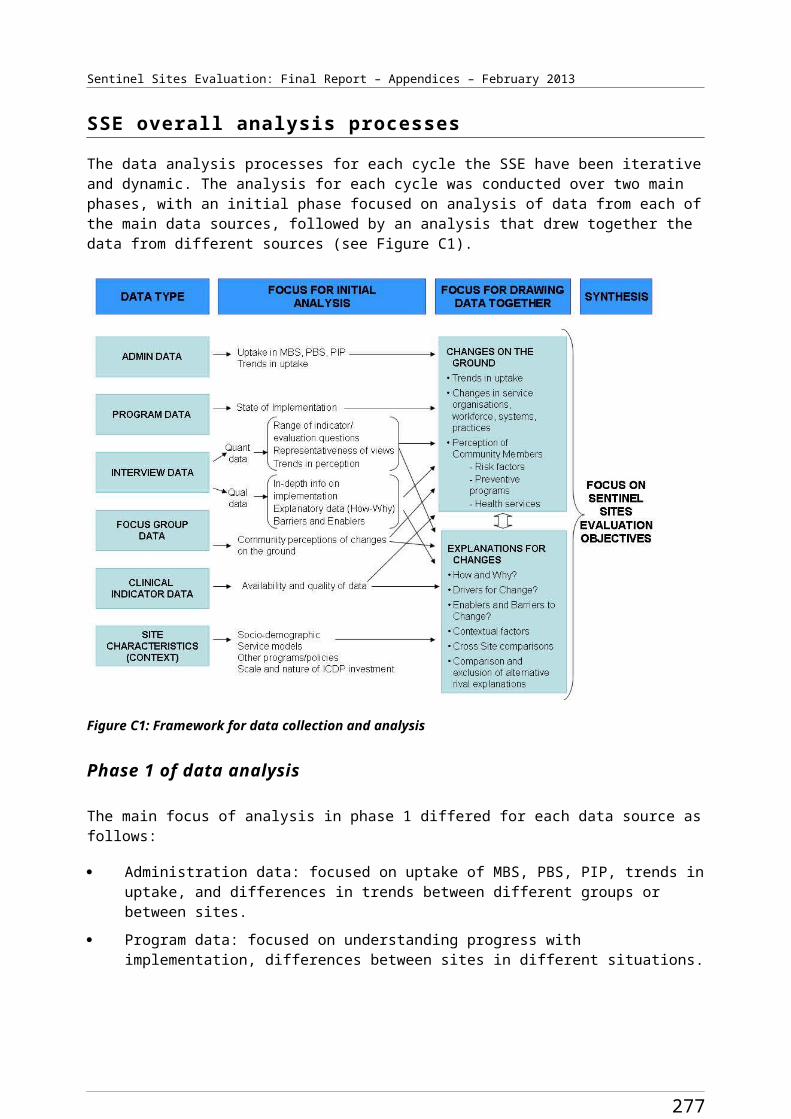
Sentinel Sites Evaluation Final Report – Appendices – February 2013
Code Title Classification in reportL01 Anti-neoplastic agents OtherL02 Endocrine therapy OtherL03 Immuno stimulants OtherL04 Immuno suppressants OtherM01 Anti-inflammatory and anti-rheumatic products OtherM03 Muscle relaxants OtherM04 Anti-gout preparations OtherM05 Drugs for treatment of bone diseases OtherN02 Analgesics OtherN03 Anti-epileptics OtherN04 Anti-Parkinson drugs OtherN05 Psycholeptics Anti-psychoticN06 Psychoanaleptics Anti-psychoticN07 Other nervous system drugs OtherP01 Antiprotozoals OtherP02 Anthelmintics OtherP03 Ectoparasiticides, incl. scabicides, insecticides and repellents OtherR01 Nasal preparations OtherR03 Drugs for obstructive airway diseases Obstructive airway diseasesR05 Cough and cold preparations OtherR06 Antihistamines for systemic use OtherS Sensory organs OtherS01 Ophthalmological OtherS02 Otologicals OtherS03 Ophthalmological and otological preparations OtherV01 Allergens OtherV03 All Other therapeutic products OtherV04 Diagnostic agents OtherV06 General nutrients OtherV07 All Other non-therapeutic products OtherZ Not Otherwise classified Other
285
Sentinel Sites Evaluation Final Report – Appendices – February 2013
Table F4: Number of prescriptions for Aboriginal and Torres Strait Islander people aged ≥15 years for medicines supplied through the PBS Co-payment measure for Sentinel Sites and the rest of Australia, by Anatomical Therapeutic Chemical category, September 2010 - May 2012
Sentinel Sites/
Rest of Australia
ATC
Group
Sep-Nov2010
Dec 2010 -
Feb 2011
Mar-May2011
Jun-Aug2011
Sep-Nov2011
Dec 2011 -
Feb 2012
Mar-May2012
Total Sentinel Sites
Anti-bacterial for systemic use 3494 4033 5757 7444 7505 7178 9914
Anti-psychotic 4610 6393 8842 10 279 11 747 13 394 16 200
Cardiac 12 784 17 464 22 682 26 466 29 205 32 258 35 995
Diabetes 3651 4875 6257 7107 7640 8322 9435
Obstructive airway disease 2627 3432 4694 5805 6071 6564 8247
Others 12 212 16 419 22 706 26 389 29 360 32 849 39 907
Total 39 378 52 616 70 938 83 490 91 528 100 565 119 698
Rest of total Australia
Anti-bacterial for systemic use 13 436 14 287 21 062 27 582 26 500 25 741 32 603
Anti-psychotic 16 843 22 076 31 194 36 767 41 722 46 573 54 198
Cardiac 45 236 62 170 83 888 95 864 104 400 112 490 123 734
Diabetes 12 804 17 733 23 456 26 692 28768 30 776 33 514
Obstructive airway disease 9573 12 404 18 159 23 126 23 540 23 898 28 767
Others 46 708 60 863 85 694 97 666 107 599 118 865 137 586
Total 144 600 189 533263 453 307 697 332 529 358 343 410 402
Urban Sentinel Sites
Anti-bacterial for systemic use 1304 1361 2169 2874 3010 2937 4287
Anti-psychotic 1938 2623 3680 4422 5325 6284 7748
Cardiac 4355 6060 7971 9326 10587 11 933 13 720
Diabetes 1235 1617 2128 2331 2568 2930 3298
Obstructive airway disease 1041 1328 1983 2458 2584 2905 3761
Others 4831 6307 8839 10 212 11 746 13 779 17 465
Total 14 704 19 296 26 770 31 623 35 820 40 768 50 279
Rest of urban Australia
Anti-bacterial for systemic use 3305 3828 5978 8103 7959 8032 10 370
Anti-psychotic 5542 7578 11 143 12 888 14 917 16 683 20 057
Cardiac 12 779 18 006 23 812 27 176 29 747 31 874 35 208
Diabetes 3697 5207 6893 7838 8546 8963 9737
Obstructive airway disease
3092 4042 5651 7422 7630 7800 9588
Others 13 500 18 699 26 647 29 595 33 004 36843 43 129
286
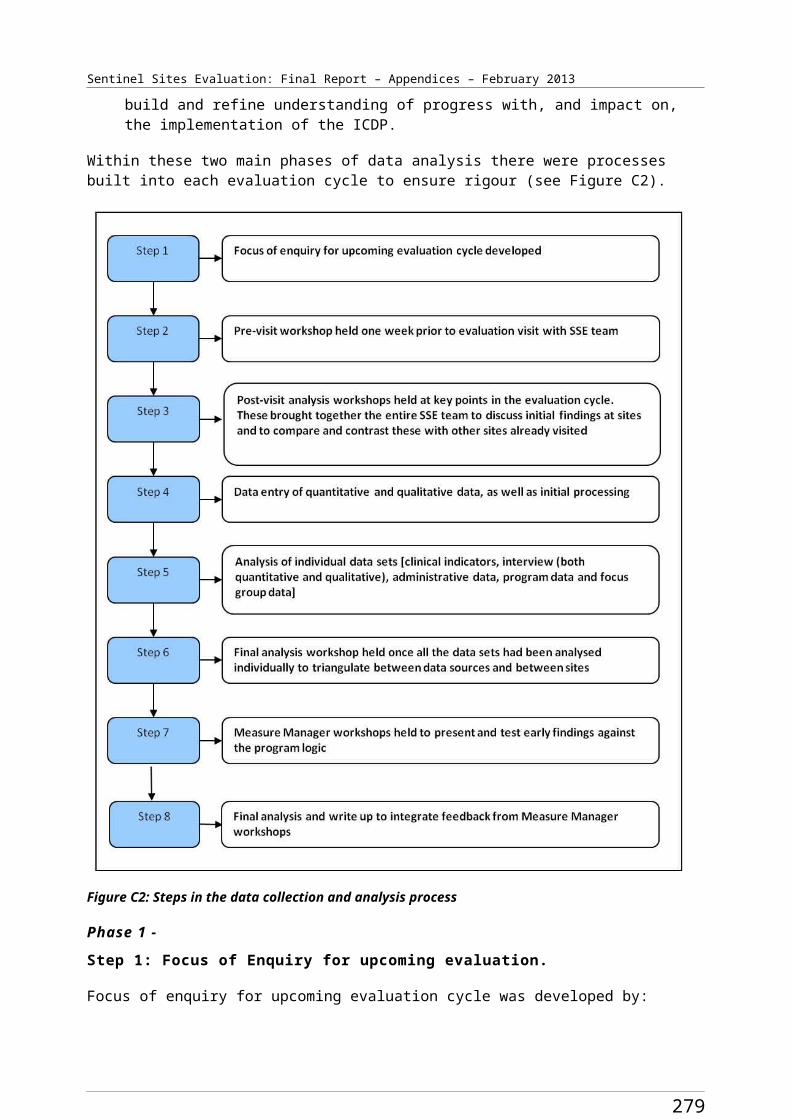
Sentinel Sites Evaluation Final Report – Appendices – February 2013
Sentinel Sites/
Rest of Australia
ATC
Group
Sep-Nov2010
Dec 2010 -
Feb 2011
Mar-May2011
Jun-Aug2011
Sep-Nov2011
Dec 2011 -
Feb 2012
Mar-May2012
Total 41 915 57 360 80 124 93 022 101 803 110 195 128 089
Regional Sentinel Sites
Anti-bacterial for systemic use 2176 2648 3551 4521 4432 4146 5527
Anti-psychotic 2661 3746 5127 5806 6370 7047 8354
Cardiac 8355 11 254 14 518 16 910 18 278 19 870 21 826
Diabetes 2391 3195 4068 4674 4919 5214 5936
Obstructive airway disease 1580 2097 2694 3327 3460 3637 4425
Others 7339 10 031 13 737 15 981 17 357 18 729 21 976
Total 24 502 32 971 43 695 51 219 54 816 58 643 68 044
Rest of regional Australia
Anti-bacterial for systemic use 8631 8600 12 458 16 081 15 326 14 702 18 346
Anti-psychotic 9988 12 569 17 276 20 403 22 920 25 722 29 392
Cardiac 26 089 35 010 47 254 53 600 58 822 63 586 69 886
Diabetes 7166 9695 12 782 14 386 15 644 16 746 18 324
Obstructive airway disease 5475 6987 10 325 12 905 13 312 13 479 16 078
Others 27 795 3 4673 48 217 55 449 61 182 67 163 77 551
Total 85 144 107 534148 312 172 824 187 206 201 398 229 577
Remote Sentinel Sites
Anti-bacterial for systemic use 14 24 37 49 63 95 100
Anti-psychotic 11 24 35 51 52 63 98
Cardiac 74 150 193 230 340 455 449
Diabetes 25 63 61 102 153 178 201
Obstructive airway disease 6 7 17 20 27 22 61
Others 42 81 130 196 257 341 466
Total 172 349 473 648 892 1154 1375
Rest of remote Australia
Anti-bacterial for systemic use 1500 1859 2626 3398 3215 3007 3887
Anti-psychotic 1313 1929 2775 3476 3885 4168 4749Cardiac 6368 9154 12 822 15 088 15 831 17 030 18 640Diabetes 1941 2831 3781 4468 4578 5067 5453
Obstructive airway disease 1006 1375 2183 2799 2598 2619 3101Others 5413 7491 10 830 12 622 13 413 14 859 16 906Total 17 541 24 639 35 017 41 851 43 520 46 750 52 736
287
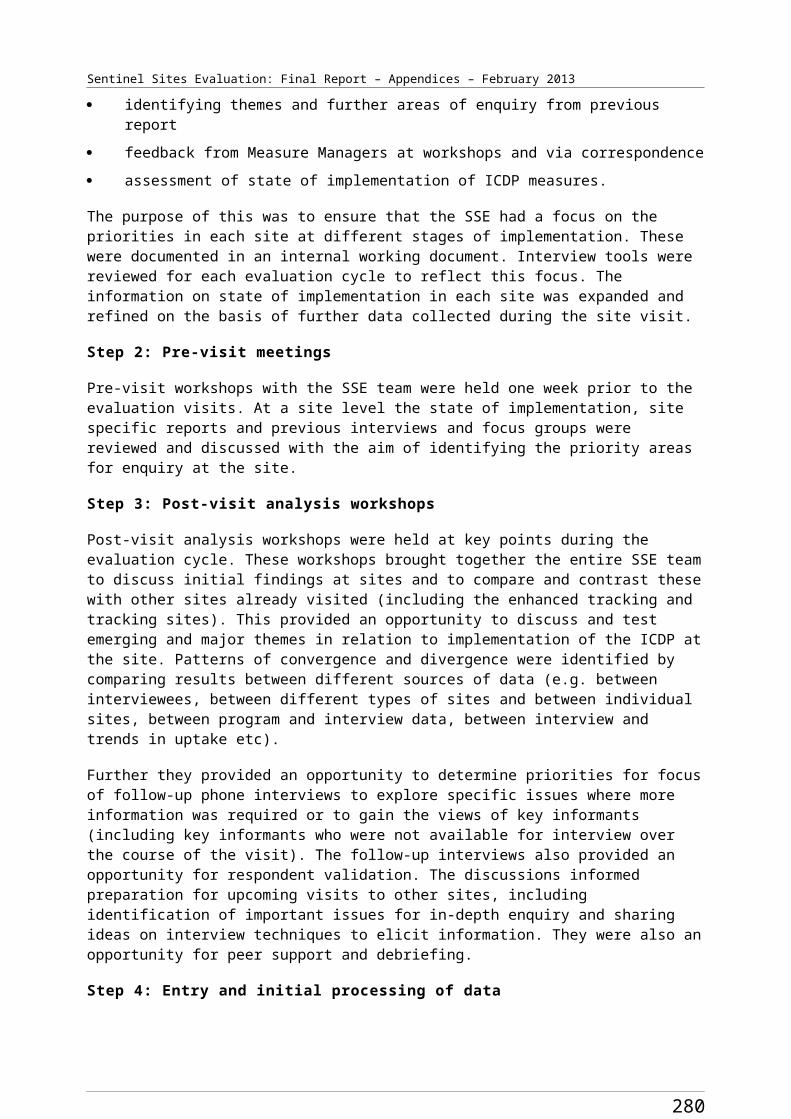
Sentinel Sites Evaluation Final Report – Appendices – February 2013
Table F5: Number of prescriptions for people aged ≥15 years for medicines supplied through the PBS Co-payment measure per 100 Aboriginal and Torres Strait Islander people aged ≥15 for Sentinel Sites and the rest of Australia, by Anatomical Therapeutic Chemical category, September 2010 - May 2012
Sentinel Sites/ Rest of Australia
ATC Group Sep-Nov 2010
Dec 2010 - Feb 2011
Mar-May 2011
Jun-Aug 2011
Sep-Nov 2011
Dec 2011 - Feb 2012
Mar-May 2012
Total Sentinel Sites
Anti-bacterial for systemic use 5.83 6.72 9.43 12.19 12.29 11.76 15.95Anti-psychotic 7.69 10.66 14.48 16.83 19.24 21.93 26.07Cardiac 21.31 29.12 37.15 43.34 47.83 52.83 57.92Diabetes 6.09 8.13 10.25 11.64 12.51 13.63 15.18
Obstructive airway disease 4.38 5.72 7.69 9.51 9.94 10.75 13.27Others 20.36 27.37 37.19 43.22 48.08 53.8 64.21Total 65.65 87.72 116.17 136.73 149.89 164.69 192.6
Rest of total Australia
Anti-bacterial for systemic use 5.44 5.78 8.36 10.95 10.52 10.22 12.7Anti-psychotic 6.82 8.93 12.38 14.6 16.56 18.49 21.1Cardiac 18.31 25.16 33.3 38.05 41.44 44.65 48.18Diabetes 5.18 7.18 9.31 10.6 11.42 12.22 13.05
Obstructive airway disease 3.87 5.02 7.21 9.18 9.34 9.49 11.2Others 18.9 24.63 34.02 38.77 42.71 47.19 53.58Total 58.52 76.71 104.58 122.15 132 142.25 159.81
Urban Sentinel Sites
Anti-bacterial for systemic use 5.36 5.59 8.75 11.59 12.14 11.84 16.97Anti-psychotic 7.96 10.78 14.84 17.83 21.47 25.34 30.66Cardiac 17.89 24.9 32.14 37.6 42.69 48.11 54.30Diabetes 5.07 6.64 8.58 9.40 10.35 11.81 13.05
Obstructive airway disease 4.28 5.46 8.00 9.91 10.42 11.71 14.88Others 19.85 25.91 35.64 41.17 47.36 55.56 69.12Total 60.41 79.28 107.94 127.5 144.43 164.38 198.98
Rest of urban Australia
Anti-bacterial for systemic use 4.35 5.03 7.70 10.44 10.26 10.35 13.10Anti-psychotic 7.29 9.96 14.36 16.61 19.22 21.50 25.33Cardiac 16.8 23.67 30.68 35.02 38.33 41.07 44.47Diabetes 4.86 6.85 8.88 10.10 11.01 11.55 12.30
Obstructive airway disease 4.06 5.31 7.28 9.56 9.83 10.05 12.11Others 17.75 24.58 34.33 38.13 42.53 47.47 54.47Total 55.1 75.41 103.24 119.86 131.17 141.98 161.78
Regional Sentinel Sites
Anti-bacterial for systemic 7.83 9.53 12.56 15.99 15.68 14.67 19.22
288
Sentinel Sites Evaluation Final Report – Appendices – February 2013
Sentinel Sites/ Rest of Australia
ATC Group Sep-Nov 2010
Dec 2010 - Feb 2011
Mar-May 2011
Jun-Aug 2011
Sep-Nov 2011
Dec 2011 - Feb 2012
Mar-May 2012
useAnti-psychotic 9.58 13.49 18.14 20.54 22.54 24.93 29.05Cardiac 30.08 40.51 51.36 59.83 64.67 70.30 75.90Diabetes 8.61 11.50 14.39 16.54 17.40 18.45 20.64
Obstructive airway disease 5.69 7.55 9.53 11.77 12.24 12.87 15.39Others 26.42 36.11 48.60 56.54 61.41 66.26 76.42Total 88.21 118.7 154.59 181.21 193.93 207.47 236.63
Rest of regional Australia
Anti-bacterial for systemic use 8.37 8.34 11.84 15.29 14.57 13.98 17.11Anti-psychotic 9.68 12.18 16.43 19.40 21.79 24.46 27.41Cardiac 25.29 33.94 44.93 50.96 55.93 60.46 65.18Diabetes 6.95 9.40 12.15 13.68 14.87 15.92 17.09
Obstructive airway disease 5.31 6.77 9.82 12.27 12.66 12.82 14.99Others 26.94 33.61 45.84 52.72 58.17 63.86 72.33Total 82.53 104.24 141.01 164.31 177.99 191.48 214.11
Remote Sentinel Sites
Anti-bacterial for systemic use 0.18 0.31 0.46 0.61 0.79 1.19 1.23Anti-psychotic 0.14 0.31 0.44 0.64 0.65 0.79 1.21Cardiac 0.94 1.91 2.41 2.88 4.25 5.69 5.53Diabetes 0.32 0.8 0.76 1.28 1.91 2.23 2.47
Obstructive airway disease 0.08 0.09 0.21 0.25 0.34 0.28 0.75Others 0.53 1.03 1.63 2.45 3.21 4.27 5.74Total 2.19 4.44 5.92 8.1 11.16 14.43 16.92
Rest of remote Australia
Anti-bacterial for systemic use 2.21 2.74 3.8 4.92 4.65 4.35 5.52Anti-psychotic 1.94 2.84 4.01 5.03 5.62 6.03 6.74Cardiac 9.39 13.49 18.55 21.83 22.9 24.64 26.47Diabetes 2.86 4.17 5.47 6.46 6.62 7.33 7.74
Obstructive airway disease 1.48 2.03 3.16 4.05 3.76 3.79 4.4Others 7.98 11.04 15.67 18.26 19.41 21.5 24.01Total 25.85 36.32 50.66 60.55 62.96 67.64 74.9
289
Sentinel Sites Evaluation Final Report – Appendices – February 2013
Table F6: Percentage of prescriptions for Aboriginal and Torres Strait Islander people aged ≥15 years for medicines supplied through the PBS Co-payment measure for Sentinel Sites and the rest of Australia, by Anatomical Therapeutic Chemical category, September 2010 - May 2012
Sentinel Sites/ Rest of Australia ATC Group Sep-Nov
2010
Dec 2010 - Feb 2011
Mar-May 2011
Jun-Aug 2011
Sep-Nov 2011
Dec 2011 - Feb 2012
Mar-May 2012
Total Sentinel Sites
Anti-bacterial for systemic use 9 8 8 9 8 7 8
Anti-psychotic 12 12 12 12 13 13 14
Cardiac 32 33 32 32 32 32 30
Diabetes 9 9 9 9 8 8 8
Obstructive airway disease 7 7 7 7 7 7 7
Other 31 31 32 32 32 33 33
Total 100 100 100 100 100 100 100
Rest of total Australia
Anti-bacterial for systemic use 9 8 8 9 8 7 8
Anti-psychotic 12 12 12 12 13 13 13
Cardiac 31 33 32 31 31 31 30
Diabetes 9 9 9 9 9 9 8
Obstructive airway disease 7 7 7 8 7 7 7
Other 32 32 33 32 32 33 34
Total 100 100 100 100 100 100 100
Urban Sentinel Sites
Anti-bacterial for systemic use 9 7 8 9 8 7 9
Anti-psychotic 13 14 14 14 15 15 15
Cardiac 30 31 30 29 30 29 27
Diabetes 8 8 8 7 7 7 7
Obstructive airway disease 7 7 7 8 7 7 7
Other 33 33 33 32 33 34 35
Total 100 100 100 100 100 100 100
Rest of urban Australia
Anti-bacterial for systemic use 8 7 7 9 8 7 8
Anti-psychotic 13 13 14 14 15 15 16
Cardiac 30 31 30 29 29 29 27
Diabetes 9 9 9 8 8 8 8
Obstructive airway disease 7 7 7 8 7 7 7
Other 32 33 33 32 32 33 34
Total 100 100 100 100 100 100 100Regional Sentinel Sites
Anti-bacterial for systemic 9 8 8 9 8 7 8
290
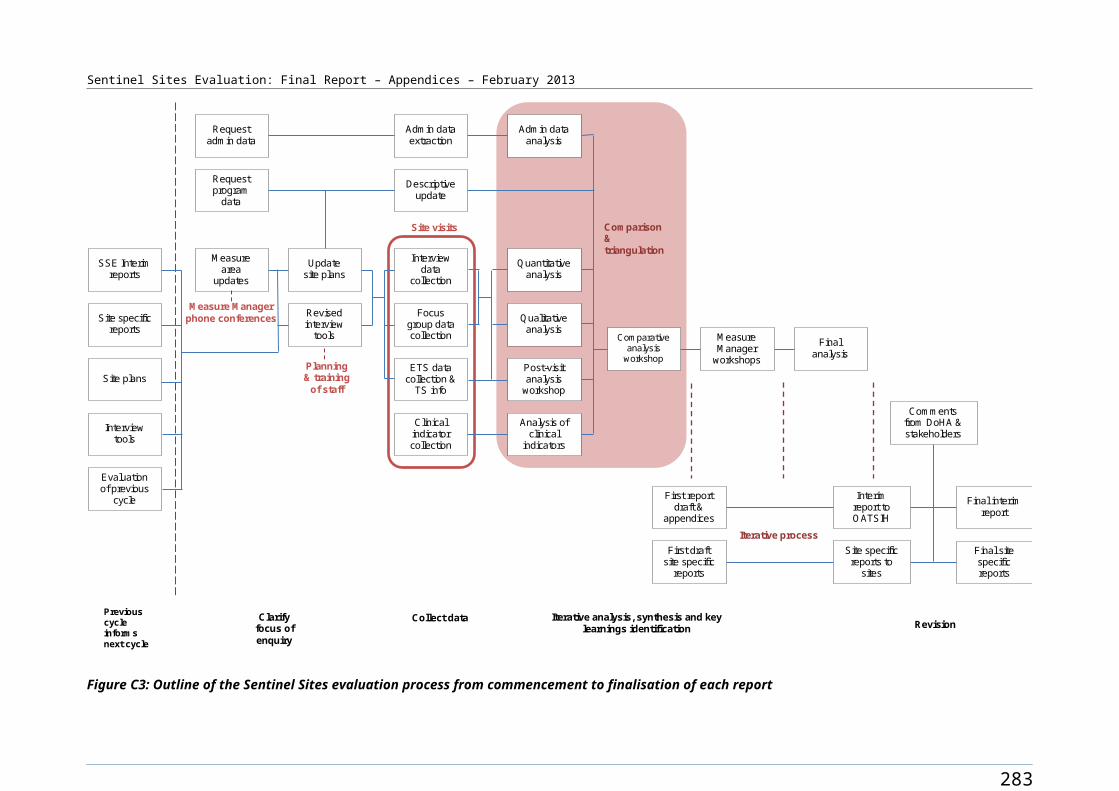
Sentinel Sites Evaluation Final Report – Appendices – February 2013
Sentinel Sites/ Rest of Australia ATC Group Sep-Nov
2010
Dec 2010 - Feb 2011
Mar-May 2011
Jun-Aug 2011
Sep-Nov 2011
Dec 2011 - Feb 2012
Mar-May 2012
useAnti-psychotic 11 11 12 11 12 12 12Cardiac 34 34 33 33 33 34 32Diabetes 10 10 9 9 9 9 9
Obstructive airway disease 6 6 6 6 6 6 7Others 30 30 31 31 32 32 32Total 100 100 100 100 100 100 100
Rest of regional Australia
Anti-bacterial for systemic use 10 8 8 9 8 7 8
Anti-psychotic 12 12 12 12 12 13 13
Cardiac 31 33 32 31 31 32 30
Diabetes 8 9 9 8 8 8 8
Obstructive airway disease 6 6 7 7 7 7 7
Other 33 32 33 32 33 33 34
Total 100 100 100 100 100 100 100
Remote Sentinel Sites
Anti-bacterial for systemic use 8 7 8 8 7 8 7Anti-psychotic 6 7 7 8 6 5 7Cardiac 43 43 41 35 38 39 33Diabetes 15 18 13 16 17 15 15Obstructive airway disease 3 2 4 3 3 2 4
Others 24 23 27 30 29 30 34
Total 100 100 100 100 100 100 100
Rest of remote Australia
Anti-bacterial for systemic use 9 8 7 8 7 6 7
Anti-psychotic 7 8 8 8 9 9 9
Cardiac 36 37 37 36 36 36 35
Diabetes 11 11 11 11 11 11 10Obstructive airway disease 6 6 6 7 6 6 6
Other 31 30 31 30 31 32 32
Total 100 100 100 100 100 100 100
291
Sentinel Sites Evaluation Final Report – Appendices – February 2013
Table F7: Percentage of people aged ≥15 years in Ordinary, Concessional and Repatriation Pharmaceutical Benefits Scheme categories accessing medicines through the PBS Co-payment measure for Sentinel Sites and the rest of Australia, by age, September 2010 - May 2012
Sentinel Sites/ rest of Australia
Age Group
General Ordinary
General Safety Net
Concessional Ordinary
Concessional Safety Net
RPBS Ordinary
RPBS Safety Net
Total Sentinel Sites
15-54 32 0 67 2 0 0≥55 19 1 71 8 1 0Total 28 0 68 3 0 0
Rest of total Australia
15-54 31 1 66 3 0 0≥55 18 1 66 14 1 0Total 27 1 66 6 0 0
Urban Sentinel Sites
15-54 34 0 64 1 0 0≥55 22 1 67 8 1 0Total 31 0 65 3 0 0
Rest of urban Australia
15-54 30 0 67 3 0 0≥55 20 2 65 12 1 0Total 27 1 67 5 0 0
Regional Sentinel Sites
15-54 30 0 68 2 0 0≥55 17 1 73 8 1 0Total 26 0 70 3 0 0
Rest of regional Australia
15-54 31 1 66 3 0 0≥55 17 1 66 15 1 0Total 27 1 66 6 0 0
Remote Sentinel Sites
15-54 37 1 63 0 0 0≥55 12 0 86 2 0 0Total 30 0 69 1 0 0
Rest of remote Australia
15-54 36 1 60 2 0 0≥55 19 2 67 11 1 0Total 30 1 63 5 0 0
292
Sentinel Sites Evaluation Final Report – Appendices – February 2013
0
5
10
15
20
25
30
35
Sep-Nov 2010
Dec-Feb Mar-May 2011
Jun-Aug Sep-Nov Dec-Feb Mar-May 2012
Quarters 2010-2012
Pres
crip
tions
per
100
peo
ple
SS Antips ychotic SS CardiacSS Di abetes SS Obstructive a i rway dis eas eRA Antipsychoti c RA CardiacRA Diabetes RA Obs tructive a irway dis eas e
Figure F1: PBS Co-payment measure prescriptions per 100 Aboriginal and Torres Strait Islander people aged 15-54 years in Sentinel Sites and the rest of Australia, by Anatomical Therapeutic Chemical category (anti-psychotic, cardiac, diabetes and obstructive airway disease) and quarter, September 2010 - May 2012
Figure F2: PBS Co-payment measure prescriptions per 100 Aboriginal and Torres Strait Islander people aged ≥55 years in Sentinel Sites and the rest of Australia, by Anatomical Therapeutic Chemical category (anti-psychotic, cardiac, diabetes and obstructive airway disease) and quarter, September 2010 - May 2012
293
Sentinel Sites Evaluation Final Report – Appendices – February 2013
Figure F3: PBS Co-payment measure prescriptions per 100 Aboriginal and Torres Strait Islander people aged 15-54 years in Sentinel Sites and the rest of Australia, by Anatomical Therapeutic Chemical category (anti-bacterial for systemic use and others) and quarter, September 2010 - May 2012
Figure F4: PBS Co-payment measure prescriptions per 100 Aboriginal and Torres Strait Islander people aged ≥55 years in Sentinel Sites and the rest of Australia, by Anatomical Therapeutic Chemical category (anti-bacterial for systemic use and others) and quarter, September 2010 - May 2012
294
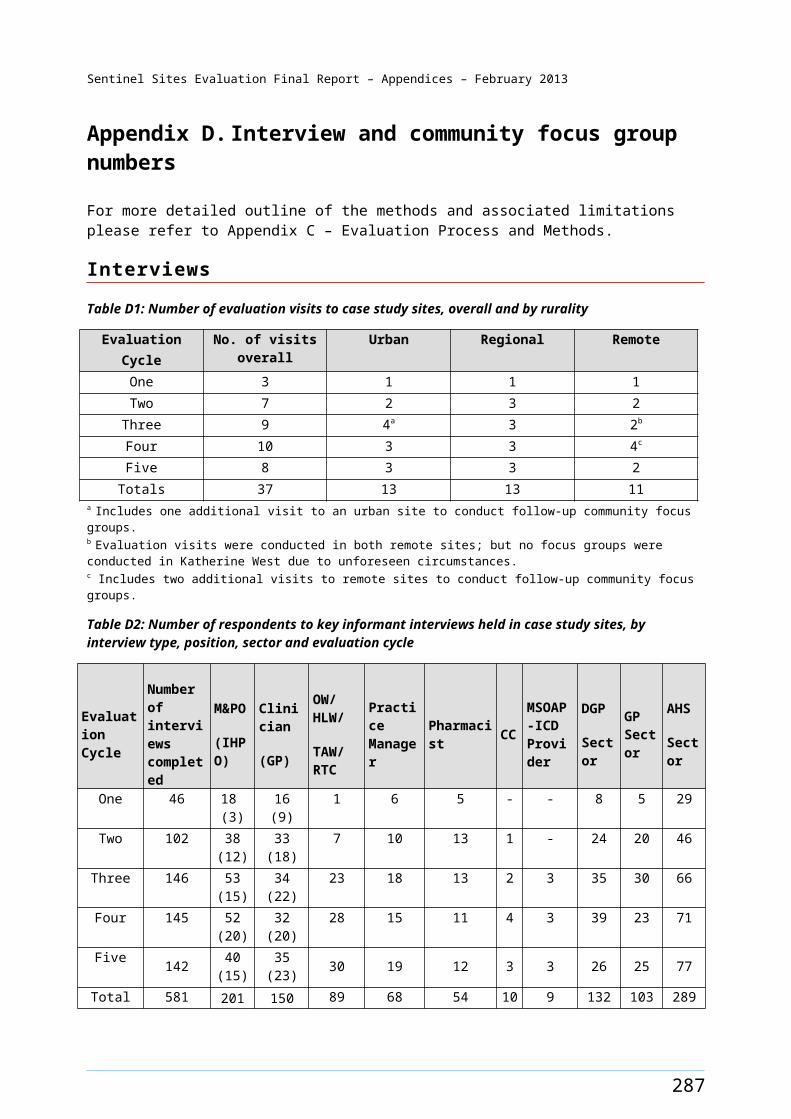
Sentinel Sites Evaluation Final Report – Appendices – February 2013
Appendix G. Medicare Benefits Schedule
Table G1: Adult health assessments (MBS items 704, 706, 710 to 1 May 2010 thereafter 715) claimed per 100 Aboriginal and Torres Strait Islander people aged ≥15 years for Sentinel Sites and the rest of Australia, by gender, age, rurality and quarter, March 2009 - May 2012
Sentinel Sites/Rest of Australia
Gender Age Group
Mar-May 2009
Jun-Aug 2009
Sep-Nov 2009
Dec 2009 – Feb 2010
Mar-May 2010
Jun-Aug 2010
Sep-Nov 2010
Dec 2010 – Feb 2011
Mar-May 2011
Jun-Aug 2011
Sep-Nov 2011
Dec 2011 – Feb 2012
Mar-May 2012
Urban Sentinel Sites
F 15-54 1.7 1.5 1.8 1.3 2.4 3.1 2.9 2.6 3.5 4.6 6.1 4.8 6.1M 15-54 1.0 1.3 1.3 1.2 1.6 2.2 2.3 1.9 2.2 3.9 4.8 3.7 4.4F ≥55 3.1 3.5 3.9 2.8 4.1 5.1 6.8 6.1 8.1 8.4 9.1 8.2 10.2M ≥55 2.1 2.1 2.7 1.9 4.1 4.7 4.7 3.5 5.8 6.2 6.9 6.2 6.7Total ≥15 1.5 1.5 1.8 1.4 2.2 2.9 3.0 2.6 3.3 4.6 5.8 4.6 5.6
Rest of urban Australia
F 15-54 1.2 1.4 1.3 1.3 1.5 2.4 2.6 2.0 2.6 2.4 2.8 3.0 3.7M 15-54 0.9 1.0 1.0 0.9 1.3 1.8 1.8 1.6 1.8 2.0 2.3 2.2 2.7F ≥55 2.4 2.6 2.9 3.0 3.6 5.3 6.1 5.0 5.9 4.9 6.8 6.6 7.5M ≥55 2.5 1.8 2.4 1.9 2.6 4.8 4.1 3.9 3.8 4.5 5.0 4.8 5.8Total ≥15 1.2 1.3 1.3 1.3 1.6 2.5 2.5 2.1 2.5 2.5 3.0 3.0 3.6
Regional Sentinel Sites
F 15-54 2.3 1.8 1.8 2.2 2.8 4.3 5.3 4.4 6.8 6.7 7.2 6.9 10.2M 15-54 1.6 1.6 1.5 1.7 2.0 3.2 3.5 3.0 4.7 5.3 5.6 4.9 6.4F ≥55 4.0 3.7 4.4 5.4 5.8 9.5 10.5 8.4 14.6 12.4 13.4 12.2 20.3M ≥55 2.8 2.3 2.5 2.1 3.6 7.8 8.1 6.3 9.9 10.7 10.9 8.7 14.5Total ≥15 2.1 1.9 1.8 2.2 2.7 4.4 5.0 4.2 6.6 6.7 7.1 6.4 9.4
Rest of regional Australia
F 15-54 2.5 2.4 2.7 2.2 3.0 3.8 4.3 4.0 5.5 5.1 5.9 5.9 7.4M 15-54 1.9 1.8 2.2 1.7 2.3 2.9 3.1 3.1 3.6 3.8 4.4 4.2 4.9F ≥55 4.3 4.0 4.4 3.4 5.7 6.3 7.5 6.6 8.1 8.2 9.1 9.1 11.4M ≥55 3.6 3.0 3.7 3.1 4.0 5.1 5.5 5.4 6.6 6.6 8.0 7.6 8.2Total ≥15 2.4 2.3 2.7 2.2 2.9 3.7 4.1 3.9 4.9 4.8 5.6 5.5 6.7
Remote Sentinel Sites
F 15-54 2.0 2.3 2.8 2.5 2.4 6.4 5.7 1.4 4.5 5.7 3.1 4.0 6.0M 15-54 2.8 1.7 1.8 3.5 2.1 6.3 5.5 1.0 4.5 6.6 2.5 1.8 3.0F ≥55 4.4 7.6 2.5 5.3 6.9 7.7 9.1 3.1 10.4 10.0 6.1 9.0 11.9M ≥55 4.9 3.5 3.5 2.8 5.3 7.4 4.9 1.3 6.0 7.8 3.7 4.1 7.1Total ≥15 2.7 2.5 2.4 3.1 2.8 6.5 5.7 1.3 5.0 6.5 3.1 3.4 5.1
Rest of remote Australia
F 15-54 3.1 3.3 3.5 3.1 4.4 4.6 5.6 4.5 6.1 5.5 6.1 5.6 5.9M 15-54 2.8 2.6 2.6 2.2 3.6 4.1 4.1 3.1 4.5 4.5 4.3 3.9 4.8F ≥55 5.4 6.9 6.7 6.3 7.9 9.2 10.2 7.4 9.9 9.8 9.2 10.1 11.9M ≥55 4.2 4.9 4.6 4.0 6.0 6.8 6.4 4.6 7.3 8.0 7.4 6.7 8.0Total ≥15 3.2 3.3 3.4 3.0 4.3 4.8 5.3 4.1 5.7 5.5 5.5 5.2 5.9
295
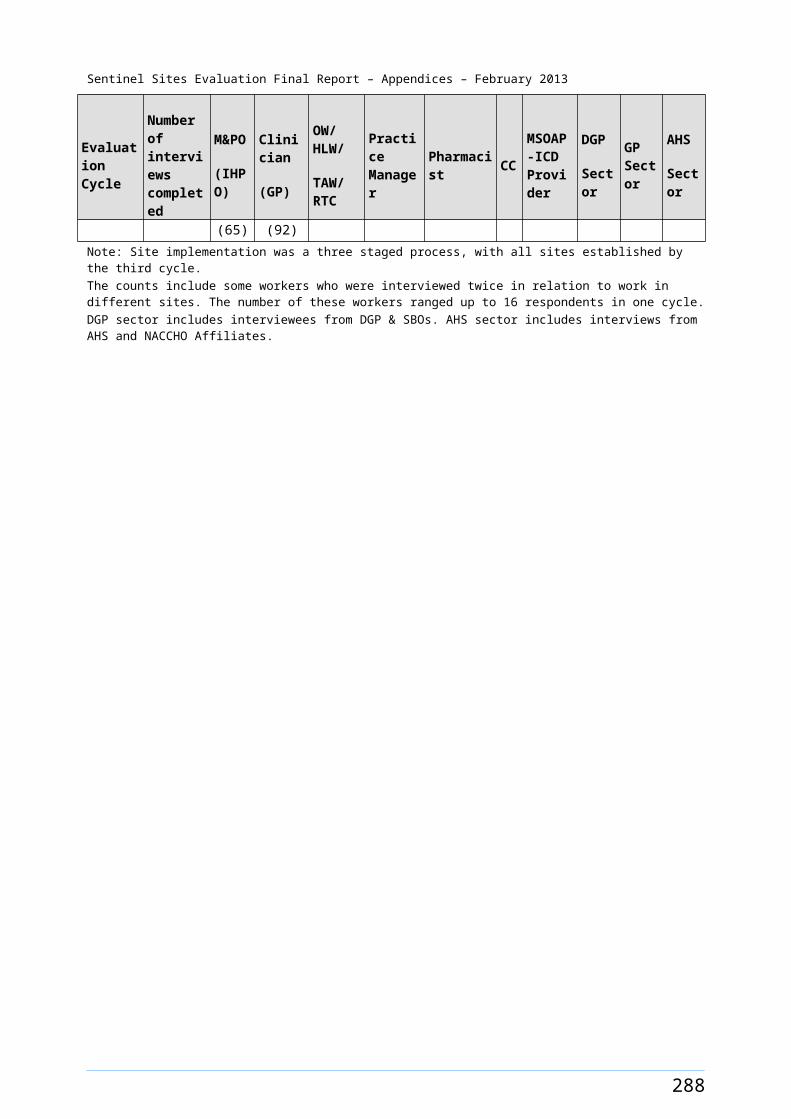
Sentinel Sites Evaluation Final Report – Appendices – February 2013
Table G2: Number of adult health assessments (MBS items 704, 706, 710 to 1 May 2010 thereafter 715) claimed for Aboriginal and Torres Strait Islander people aged ≥15 years, for Sentinel Site and the rest of Australia by, gender, age, rurality and quarter, March 2009 - May 2012
Sentinel Sites/ Rest of Australia
Gender Age Group
Mar-May 2009
Jun-Aug 2009
Sep-Nov 2009
Dec 2009 - Feb 2010
Mar-May 2010
Jun-Aug 2010
Sep-Nov 2010
Dec 2010 - Feb 2011
Mar-May 2011
Jun-Aug 2011
Sep-Nov 2011
Dec 2011 - Feb 2012
Mar-May 2012
Urban Sentinel Sites
F 15-54 180 156 194 142 258 341 320 287 389 514 681 538 689M 15-54 104 133 141 122 167 236 249 201 241 420 521 399 488F ≥55 45 50 57 40 60 75 100 90 122 127 137 123 156M ≥55 27 26 34 24 53 60 60 45 76 82 91 81 89Total ≥15 356 365 426 328 538 712 729 623 828 1143 1430 1141 1422
Rest of urban Australia
F 15-54 398 453 432 414 507 798 867 679 886 834 958 1045 1300M 15-54 301 318 324 301 416 601 585 523 614 679 777 752 917F ≥55 118 129 144 146 182 266 306 248 300 249 344 334 391M ≥55 105 78 100 82 111 209 178 171 167 197 220 214 261Total ≥15 922 978 1000 943 1216 1874 1936 1621 1967 1959 2299 2345 2869
Regional Sentinel Sites
F 15-54 273 217 213 271 343 529 645 538 850 836 901 858 1292M 15-54 193 196 176 197 238 390 424 368 577 653 689 601 806F ≥55 67 62 74 91 99 163 180 145 256 217 235 213 361M ≥55 46 38 41 35 60 131 136 106 169 182 186 148 251Total ≥15 579 513 504 594 740 1213 1385 1157 1852 1888 2011 1820 2710
Rest of regional Australia
F 15-54 1086 1054 1176 980 1322 1679 1900 1777 2480 2292 2671 2671 3418M 15-54 833 762 943 745 1003 1265 1389 1366 1625 1700 2007 1907 2271F ≥55 306 287 315 247 419 463 550 480 604 608 680 674 866M ≥55 246 208 256 216 280 359 382 375 473 473 573 542 597Total ≥15 2471 2311 2690 2188 3024 3766 4221 3998 5182 5073 5931 5794 7152
Remote Sentinel Sites
F 15-54 64 75 90 82 81 211 189 45 152 193 104 135 206M 15-54 94 59 60 119 71 216 189 34 159 232 88 64 108F ≥55 21 36 12 25 33 37 44 15 51 49 30 44 59M ≥55 30 21 21 17 33 46 30 8 38 49 23 26 45Total ≥15 209 191 183 243 218 510 452 102 400 523 245 269 418
Rest of remote Australia
F 15-54 860 916 985 874 1246 1321 1589 1285 1756 1593 1755 1613 1742M 15-54 841 771 785 670 1088 1250 1259 953 1397 1403 1332 1211 1518F ≥55 217 276 269 254 324 378 416 303 413 407 383 421 507M ≥55 201 232 218 189 290 330 313 225 364 398 365 333 404Total ≥15 2119 2195 2257 1987 2948 3279 3577 2766 3930 3801 3835 3578 4171
296
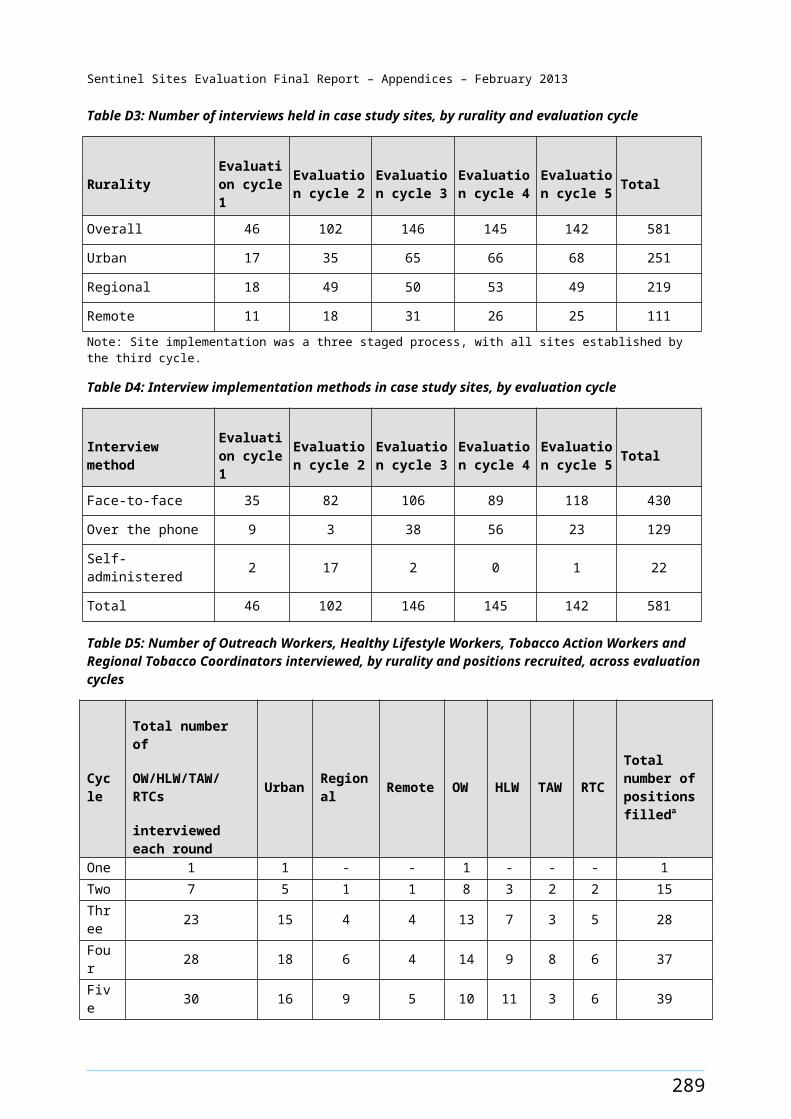
Sentinel Sites Evaluation Final Report – Appendices – February 2013
Table G3: Number of GPs who claimed an adult health assessment (MBS items 704, 706, 710 to 1 May 2010 thereafter 715) per 100 Aboriginal and Torres Strait Islander people aged ≥15 years for Sentinel Sites and the rest of Australia, by quarter, March 2009 - May 2012
Location
Mar-May 2009
Jun-Aug 2009
Sep-Nov 2009
Dec 2009 - Feb 2010
Mar-May 2010
Jun-Aug 2010
Sep-Nov 2010
Dec 2010 - Feb 2011
Mar-May 2011
Jun-Aug 2011
Sep-Nov 2011
Dec 2011 - Feb 2012
Mar-May 2012
Sentinel Site 0.3 0.3 0.3 0.4 0.4 0.5 0.6 0.5 0.7 0.7 0.8 0.8 0.9Rest of Australia 0.4 0.4 0.4 0.4 0.5 0.6 0.6 0.6 0.7 0.7 0.7 0.8 0.8
Table G4: Number of GPs who claimed an adult health assessment (MBS items 704, 706, 710 to 1 May 2010 thereafter 715) per 100 Aboriginal and Torres Strait Islander people aged ≥15 years for urban Sentinel Sites and the rest of urban Australia, by quarter, March 2009 - May 2012
Location
Mar-May 2009
Jun-Aug 2009
Sep-Nov 2009
Dec 2009 - Feb 2010
Mar-May 2010
Jun-Aug 2010
Sep-Nov 2010
Dec 2010 - Feb 2011
Mar-May 2011
Jun-Aug 2011
Sep-Nov 2011
Dec 2011 - Feb 2012
Mar-May 2012
Urban Sentinel Sites 0.3 0.3 0.3 0.3 0.4 0.6 0.7 0.6 0.8 0.9 1.0 0.9 1.2Rest of urban Australia 0.3 0.3 0.3 0.3 0.4 0.6 0.6 0.5 0.7 0.7 0.8 0.8 0.9
Table G5: Number of GPs who claimed an adult health assessment (MBS items 704, 706, 710 to 1 May 2010 thereafter 715) per 100 Aboriginal and Torres Strait Islander people aged ≥15 years for regional Sentinel Sites and the rest of regional Australia, by quarter, March 2009 - May 2012
Location
Mar-May 2009
Jun-Aug 2009
Sep-Nov 2009
Dec 2009 - Feb 2010
Mar-May 2010
Jun-Aug 2010
Sep-Nov 2010
Dec 2010 - Feb 2011
Mar-May 2011
Jun-Aug 2011
Sep-Nov 2011
Dec 2011 - Feb 2012
Mar-May 2012
Regional Sentinel Sites 0.3 0.4 0.3 0.4 0.4 0.5 0.5 0.5 0.6 0.7 0.7 0.8 0.9Rest of regional Australia 0.4 0.4 0.4 0.4 0.5 0.6 0.7 0.7 0.8 0.8 0.9 0.9 1.0
Table G6: Number of GPs who claimed an adult health assessment (MBS items 704, 706, 710 to 1 May 2010 thereafter 715) per 100 Aboriginal and Torres Strait Islander people aged ≥15 years for remote Sentinel Sites and the rest of remote Australia, by quarter, March 2009 - May 2012
Location
Mar-May 2009
Jun-Aug 2009
Sep-Nov 2009
Dec 2009 - Feb 2010
Mar-May 2010
Jun-Aug 2010
Sep-Nov 2010
Dec 2010 - Feb 2011
Mar-May 2011
Jun-Aug 2011
Sep-Nov 2011
Dec 2011 - Feb 2012
Mar-May 2012
Remote Sentinel Sites 0.3 0.4 0.3 0.3 0.3 0.4 0.4 0.3 0.4 0.5 0.4 0.4 0.5Rest of remote Australia 0.4 0.4 0.4 0.4 0.4 0.4 0.4 0.4 0.5 0.5 0.5 0.5 0.6
297
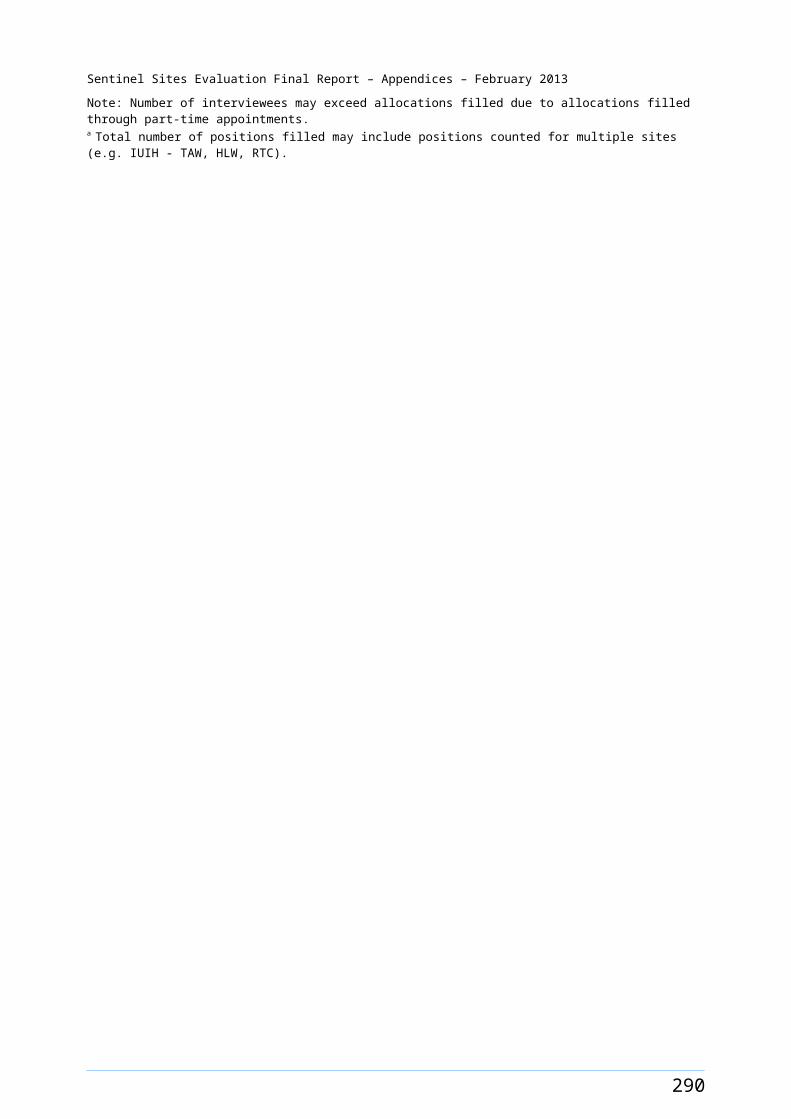
Sentinel Sites Evaluation Final Report – Appendices – February 2013
Table G7: Average number of adult health assessments (MBS items 704, 706, 710 to 1 May 2010 thereafter 715) claimed per GP in Sentinel Sites and the rest of Australia, by quarter, March 2009 - May 2012
Location
Mar-May 2009
Jun-Aug 2009
Sep-Nov 2009
Dec 2009 - Feb 2010
Mar-May 2010
Jun-Aug 2010
Sep-Nov 2010
Dec 2010 - Feb 2011
Mar-May 2011
Jun-Aug 2011
Sep-Nov 2011
Dec 2011 - Feb 2012
Mar-May 2012
Sentinel Site 6.4 5.2 6.1 5.5 5.8 7.5 7.3 5.8 7.5 7.8 7.9 6.7 7.8Rest of Australia 6.0 6.0 6.4 5.5 6.4 6.5 6.8 5.9 6.5 6.0 6.4 5.9 6.7
Table G8: Average number of adult health assessments (MBS items 704, 706, 710 to 1 May 2010 thereafter 715) claimed per GP in urban Sentinel Sites and the rest of urban Australia, by quarter, March 2009 - May 2012
Location
Mar-May 2009
Jun-Aug 2009
Sep-Nov 2009
Dec 2009 - Feb 2010
Mar-May 2010
Jun-Aug 2010
Sep-Nov 2010
Dec 2010 - Feb 2011
Mar-May 2011
Jun-Aug 2011
Sep-Nov 2011
Dec 2011 - Feb 2012
Mar-May 2012
Urban Sentinel Sites 4.9 4.7 6.1 4.2 4.9 5.1 4.3 4.2 4.2 5.0 5.8 4.9 4.9Rest of urban Australia 3.9 4.1 4.2 3.7 3.6 4.1 4.3 3.9 3.7 3.6 3.9 3.8 4.3
Table G9: Average number of adult health assessments (MBS items 704, 706, 710 to 1 May 2010 thereafter 715) claimed per GP in regional Sentinel Sites and the rest of regional Australia, by quarter, March 2009 - May 2012
Location
Mar-May 2009
Jun-Aug 2009
Sep-Nov 2009
Dec 2009 - Feb 2010
Mar-May 2010
Jun-Aug 2010
Sep-Nov 2010
Dec 2010 - Feb 2011
Mar-May 2011
Jun-Aug 2011
Sep-Nov 2011
Dec 2011 - Feb 2012
Mar-May 2012
Regional Sentinel Sites 6.7 5.3 5.9 5.6 6.0 8.1 9.4 7.9
10.2 10.0 10.4 8.3 10.7
Rest of regional Australia 5.5 5.5 6.3 5.0 5.7 6.1 6.3 5.7 6.3 5.7 6.4 5.9 6.8
Table G10: Average number of adult health assessments (MBS items 704, 706, 710 to 1 May 2010 thereafter 715) claimed per GP in remote Sentinel Sites and the rest of remote Australia, by quarter, March 2009 - May 2012
Location
Mar-May 2009
Jun-Aug 2009
Sep-Nov 2009
Dec 2009 - Feb 2010
Mar-May 2010
Jun-Aug 2010
Sep-Nov 2010
Dec 2010 - Feb 2011
Mar-May 2011
Jun-Aug 2011
Sep-Nov 2011
Dec 2011 - Feb 2012
Mar-May 2012
Remote Sentinel Sites 10.0 6.2 7.0 9.7 8.7 14.6 13.7 3.9 11.8 14.1 8.4 8.7 10.7Rest of remote Australia 9.0 8.6 8.7 8.0 11.2 11.3 11.7 9.2 11.5 10.0 10.4 9.7 10.5
298
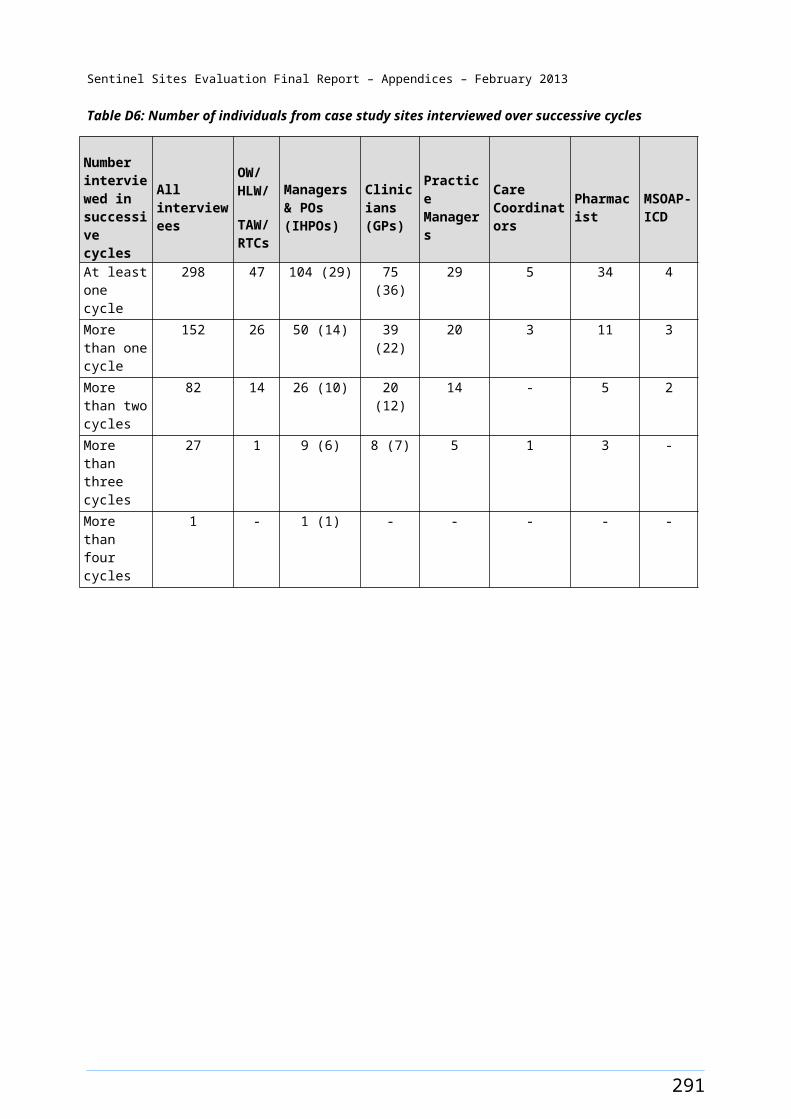
Sentinel Sites Evaluation Final Report – Appendices – February 2013
Table G11: Follow-up by a practice nurse or registered Aboriginal Health Worker (MBS item 10987) per 100 Aboriginal and Torres Strait Islander people aged ≥15 years, for Sentinel Site and the rest of Australia by, gender, age, rurality and quarter, March 2009 - May 2012
Sentinel Sites/ Rest of Australia
Gender
Age Group
Mar-May 2009
Jun-Aug 2009
Sep-Nov 2009
Dec 2009 - Feb 2010
Mar-May 2010
Jun-Aug 2010
Sep-Nov 2010
Dec 2010 - Feb 2011
Mar-May 2011
Jun-Aug 2011
Sep-Nov 2011
Dec 2011 - Feb 2012
Mar-May 2012
Urban Sentinel Sites
F 15-54 0.0 0.0 0.0 0.0 0.0 0.0 0.1 0.0 0.2 0.2 0.5 0.9 1.3M 15-54 0.0 0.0 0.0 0.0 0.0 0.0 0.0 0.0 0.1 0.2 0.4 0.4 0.6F ≥55 0.3 0.0 0.0 0.0 0.1 0.0 0.1 0.1 0.4 0.5 1.1 2.0 2.9M ≥55 0.0 0.0 0.0 0.0 0.1 0.0 0.2 0.1 0.3 0.5 0.8 1.9 2.4Total ≥15 0.0 0.0 0.0 0.0 0.0 0.0 0.0 0.0 0.2 0.3 0.5 0.8 1.2
Rest of urban Australia
F 15-54 0.0 0.0 0.1 0.0 0.0 0.0 0.2 0.3 0.3 0.4 0.5 0.6 0.9M 15-54 0.0 0.0 0.0 0.0 0.0 0.0 0.1 0.2 0.1 0.2 0.2 0.3 0.6F ≥55 0.3 0.1 0.1 0.1 0.2 0.3 0.7 0.7 1.4 2.4 1.8 2.3 3.2M ≥55 0.0 0.1 0.1 0.1 0.0 0.0 0.5 0.9 1.0 1.3 1.4 1.5 1.8Total ≥15 0.0 0.0 0.1 0.0 0.0 0.0 0.2 0.3 0.3 0.5 0.5 0.7 1.0
Regional Sentinel Sites
F 15-54 0.0 0.1 0.0 0.0 0.1 0.3 0.4 0.5 0.9 1.0 0.8 1.2 2.5M 15-54 0.1 0.1 0.1 0.0 0.0 0.2 0.4 0.3 0.4 0.5 0.5 0.7 1.2F ≥55 0.9 0.8 0.5 0.1 0.7 2.0 2.7 3.3 2.9 4.3 3.6 5.8 9.2M ≥55 0.2 0.5 0.2 0.0 0.1 0.8 0.8 1.4 1.9 2.1 3.6 3.9 8.3Total ≥15 0.1 0.2 0.1 0.0 0.1 0.4 0.6 0.6 0.8 1.1 1.0 1.4 2.7
Rest of regional Australia
F 15-54 0.1 0.1 0.1 0.4 0.5 0.6 0.6 0.8 1.3 1.7 1.6 1.6 1.9M 15-54 0.1 0.1 0.1 0.2 0.3 0.4 0.3 0.4 0.8 1.0 1.1 1.1 1.2F ≥55 0.3 0.2 0.2 0.8 1.2 1.5 1.3 1.6 2.9 3.7 3.6 4.0 4.8M ≥55 0.2 0.2 0.2 0.6 0.8 1.0 1.3 1.4 2.8 3.0 2.7 2.9 3.8Total ≥15 0.1 0.1 0.1 0.3 0.5 0.6 0.6 0.7 1.3 1.6 1.6 1.6 1.9
Remote Sentinel Sites
F 15-54 0.0 0.1 0.1 0.0 0.6 0.6 0.6 0.1 2.0 2.4 2.4 1.1 1.3M 15-54 0.3 0.4 0.1 0.0 1.9 2.7 1.1 1.1 3.2 1.1 2.6 0.8 0.5F ≥55 0.0 0.0 0.2 0.0 1.7 1.7 0.8 0.4 4.3 13.1 5.3 3.7 3.2M ≥55 1.3 1.0 0.5 0.5 5.2 7.6 2.8 3.9 10.3 3.7 2.9 1.6 1.4Total ≥15 0.2 0.3 0.1 0.1 1.6 2.1 1.0 0.9 3.3 2.6 2.7 1.2 1.1
Rest of remote Australia
F 15-54 0.2 0.4 0.6 0.6 0.8 1.3 1.8 2.5 2.9 3.5 4.4 3.4 3.8M 15-54 0.1 0.2 0.2 0.3 0.4 0.5 1.0 1.4 1.4 2.1 2.2 1.6 1.7F ≥55 0.4 0.9 1.3 2.1 2.3 3.0 4.9 5.6 7.5 8.6 11.1 7.3 8.5M ≥55 0.4 0.6 1.2 1.4 2.0 2.3 2.7 3.7 4.4 5.3 5.9 5.1 4.8Total ≥15 0.2 0.3 0.5 0.6 0.8 1.1 1.7 2.3 2.6 3.3 3.9 2.9 3.2
299
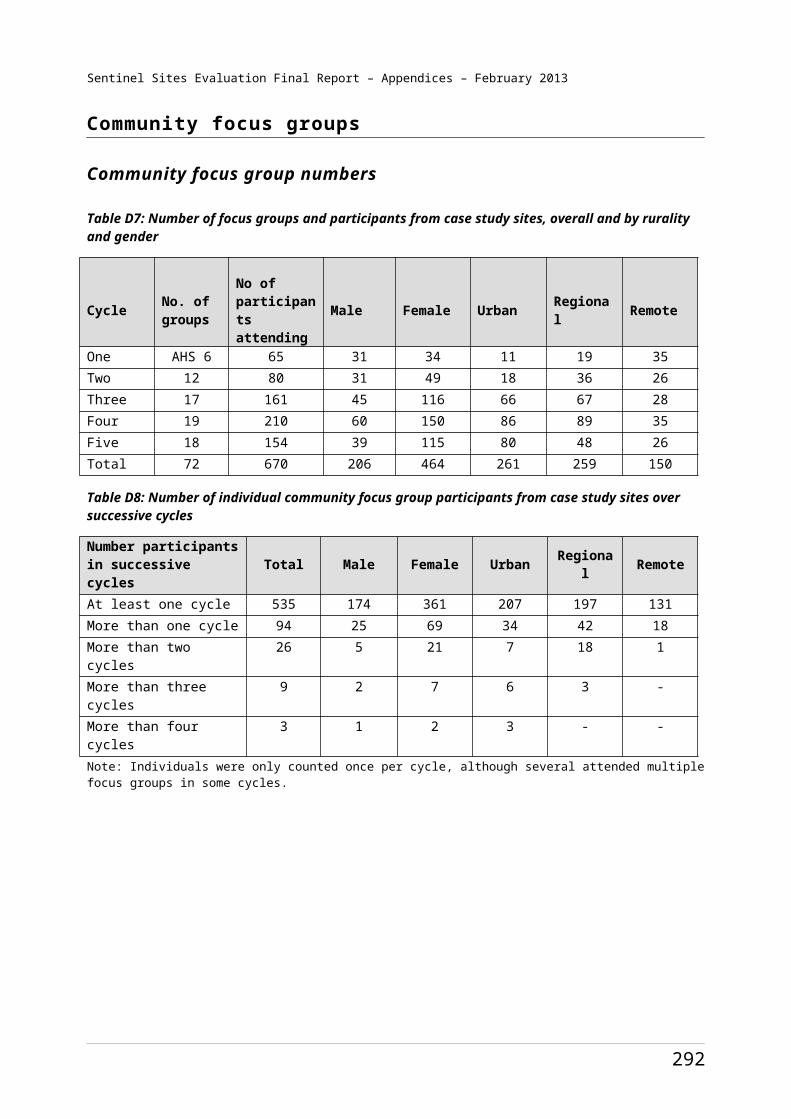
Sentinel Sites Evaluation Final Report – Appendices – February 2013
Table G12: Numbers of follow-up by a practice nurse or registered Aboriginal Health Worker (MBS item 10987), claimed for Aboriginal and Torres Strait Islander people aged ≥15 years, for Sentinel Site and the rest of Australia by, gender, age, rurality and quarter, March 2009 - May 2012
Sentinel Sites/ Rest of Australia
Gender Age Group Mar-
May 2009
Jun-Aug 2009
Sep-Nov 2009
Dec 2009-Feb 2010
Mar-May 2010
Jun-Aug 2010
Sep-Nov 2010
Dec 2010-Feb 2011
Mar-May 2011
Jun-Aug 2011
Sep-Nov 2011
Dec 2011-Feb 2012
Mar-May 2012
Urban Sentinel Sites
F 15-54 <5 <5 <5 <5 <5 <5 6 <5 18 23 58 100 153M 15-54 <5 <5 <5 <5 <5 <5 <5 <5 12 25 40 46 70F ≥55 <5 <5 <5 <5 <5 <5 <5 <5 6 8 16 30 45M ≥55 <5 <5 <5 <5 <5 <5 <5 <5 <5 7 10 25 32Total ≥15 <5 <5 <5 <5 <5 <5 10 10 40 63 124 201 300
Rest of urban Australia
F 15-54 11 11 19 13 10 16 67 89 98 122 167 220 316M 15-54 <5 <5 11 5 5 7 42 65 39 57 58 109 197F ≥55 13 <5 6 7 8 13 35 36 73 122 93 119 165M ≥55 <5 <5 6 <5 <5 <5 22 37 44 58 63 65 80Total ≥15 27 21 42 28 25 38 166 227 254 359 381 513 758
Regional Sentinel Sites
F 15-54 6 12 5 <5 13 41 52 59 111 125 100 151 321M 15-54 10 15 6 <5 <5 21 43 42 45 62 56 89 146F ≥55 16 14 8 <5 12 34 46 56 51 76 63 102 164M ≥55 <5 9 <5 <5 <5 13 14 23 32 36 62 66 144Total ≥15 36 50 22 <5 31 109 155 180 239 299 281 408 775
Rest of regional Australia
F 15-54 30 36 54 165 242 289 285 349 589 781 724 719 884M 15-54 32 32 36 67 143 166 155 182 373 457 505 504 535F ≥55 24 16 13 56 88 106 97 116 217 273 269 298 365M ≥55 13 15 15 44 55 71 88 101 199 215 196 209 279Total ≥15 99 99 118 332 528 632 625 748 1378 1726 1694 1730 2063
Remote Sentinel Sites
F 15-54 <5 <5 <5 <5 21 19 21 <5 69 82 81 36 45M 15-54 9 12 <5 <5 65 93 39 39 111 39 90 29 17F ≥55 <5 <5 <5 <5 8 8 <5 <5 21 64 26 18 16M ≥55 8 6 <5 <5 32 47 17 24 65 23 18 10 9Total ≥15 17 21 10 <5 126 167 81 69 266 208 215 93 87
Rest of remote Australia
F 15-54 67 105 168 160 235 370 500 709 832 1021 1288 977 1126M 15-54 18 46 74 76 122 143 312 419 445 637 671 487 537F ≥55 16 37 53 86 96 123 202 229 315 357 464 305 361M ≥55 17 30 56 67 96 114 129 178 220 264 291 252 243Total ≥15 118 218 351 389 549 750 1143 1535 1812 2279 2714 2021 2267
Note: <5 means that there were less than five claims and for confidentially reasons the data are not presented.
300
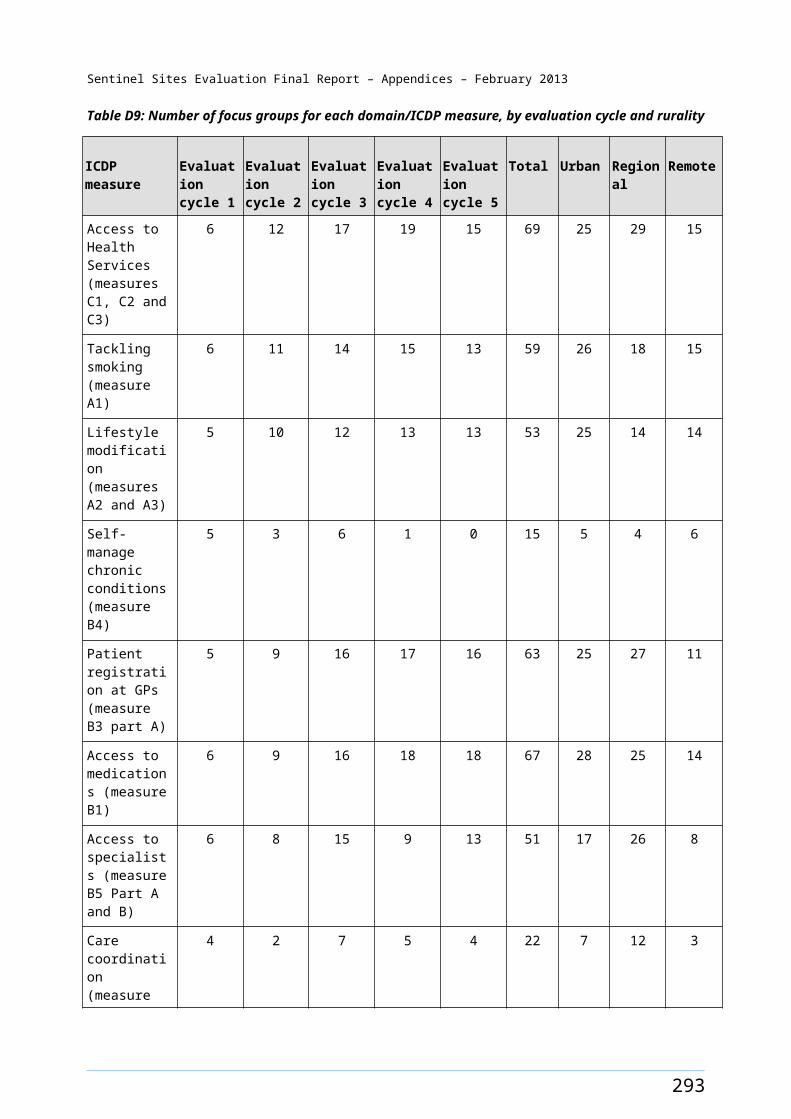
Sentinel Sites Evaluation Final Report – Appendices – February 2013
Table G13: Follow-up by allied health professionals (MBS items 81300–81360) per 100 Aboriginal and Torres Strait Islander people aged ≥15 years, for Sentinel Site and the rest of Australia by, gender, age, rurality and quarter, March 2009 - May 2012
Sentinel Sites/ Rest of Australia
Gender Age Group
Mar-May 2009
Jun -Aug 2009
Sep-Nov 2009
Dec 2009-Feb 2010
Mar-May 2010
Jun-Aug 2010
Sep-Nov 2010
Dec 2010-Feb 2011
Mar-May 2011
Jun-Aug 2011
Sep-Nov 2011
Dec 2011-Feb 2012
Mar-May 2012
Urban Sentinel Sites
F 15-54 0.0 0.0 0.0 0.0 0.0 0.2 0.2 0.1 0.2 0.5 1.0 0.5 0.7M 15-54 0.0 0.0 0.1 0.0 0.1 0.2 0.1 0.1 0.1 0.3 0.7 0.3 0.4F ≥55 0.6 0.1 0.1 0.1 0.1 0.7 0.7 0.3 0.5 0.6 2.7 2.4 2.7M ≥55 0.2 0.0 0.2 0.0 0.0 0.1 0.3 0.5 0.2 0.5 0.9 0.6 1.0Total ≥15 0.1 0.0 0.1 0.0 0.1 0.2 0.2 0.1 0.2 0.4 0.9 0.5 0.7
Rest of urban Australia
F 15-54 0.0 0.1 0.1 0.1 0.1 0.1 0.2 0.2 0.2 0.3 0.5 0.3 0.4M 15-54 0.0 0.1 0.0 0.1 0.1 0.0 0.1 0.2 0.2 0.2 0.3 0.3 0.3F ≥55 0.3 0.4 0.6 0.5 1.0 0.7 0.7 0.5 1.1 1.2 2.4 0.9 1.4M ≥55 0.1 0.1 0.4 0.3 0.6 0.2 0.7 0.3 0.9 1.0 1.4 0.9 1.3Total ≥15 0.1 0.1 0.1 0.1 0.2 0.1 0.2 0.2 0.3 0.4 0.6 0.4 0.5
Regional Sentinel Sites
F 15-54 0.1 0.0 0.1 0.1 0.4 0.1 0.2 0.3 0.7 0.9 0.8 1.0 1.4M 15-54 0.0 0.0 0.0 0.1 0.1 0.1 0.1 0.2 0.4 0.6 0.6 0.8 1.1F ≥55 0.1 0.6 0.6 0.5 1.3 0.9 0.6 1.6 2.9 3.7 3.8 5.5 8.5M ≥55 0.0 0.4 0.2 0.2 0.7 0.4 0.6 1.1 2.1 2.1 2.4 2.3 5.1Total ≥15 0.1 0.1 0.1 0.1 0.3 0.2 0.2 0.4 0.8 1.0 1.0 1.3 2.0
Rest of regional Australia
F 15-54 0.1 0.1 0.2 0.3 0.2 0.3 0.5 0.3 0.5 0.6 0.6 0.5 0.7M 15-54 0.0 0.1 0.1 0.1 0.1 0.1 0.3 0.2 0.3 0.3 0.3 0.3 0.5F ≥55 0.2 0.3 0.5 0.7 1.0 1.1 2.0 2.1 2.4 1.6 2.3 2.6 3.0M ≥55 0.1 0.2 0.3 0.7 0.6 0.7 1.4 1.5 1.7 1.2 1.9 1.4 1.9Total ≥15 0.1 0.1 0.2 0.3 0.2 0.3 0.6 0.5 0.7 0.6 0.7 0.6 0.9
Remote Sentinel Sites
F 15-54 0.0 0.0 0.0 0.0 0.2 0.0 0.0 0.0 0.0 0.1 0.1 0.1 0.1M 15-54 0.0 0.0 0.0 0.0 0.1 0.0 0.0 0.0 0.0 0.0 0.0 0.1 0.0F ≥55 0.0 0.0 0.0 0.0 0.6 0.2 0.0 0.0 0.0 0.0 0.0 0.0 0.0M ≥55 0.0 0.0 0.0 0.0 0.3 0.0 0.0 0.0 0.0 0.0 0.0 0.0 0.0Total ≥15 0.0 0.0 0.0 0.0 0.2 0.0 0.0 0.0 0.0 0.0 0.1 0.1 0.0
Rest of remote Australia
F 15-54 0.0 0.0 0.0 0.0 0.0 0.0 0.0 0.0 0.1 0.1 0.1 0.1 0.1M 15-54 0.0 0.0 0.0 0.0 0.0 0.0 0.0 0.0 0.0 0.0 0.1 0.0 0.0F ≥55 0.0 0.0 0.0 0.1 0.0 0.1 0.3 0.1 0.1 0.3 0.5 0.5 0.8M ≥55 0.1 0.0 0.0 0.0 0.0 0.0 0.2 0.1 0.1 0.2 0.2 0.1 0.3Total ≥15 0.0 0.0 0.0 0.0 0.0 0.0 0.0 0.0 0.1 0.1 0.1 0.1 0.1
301
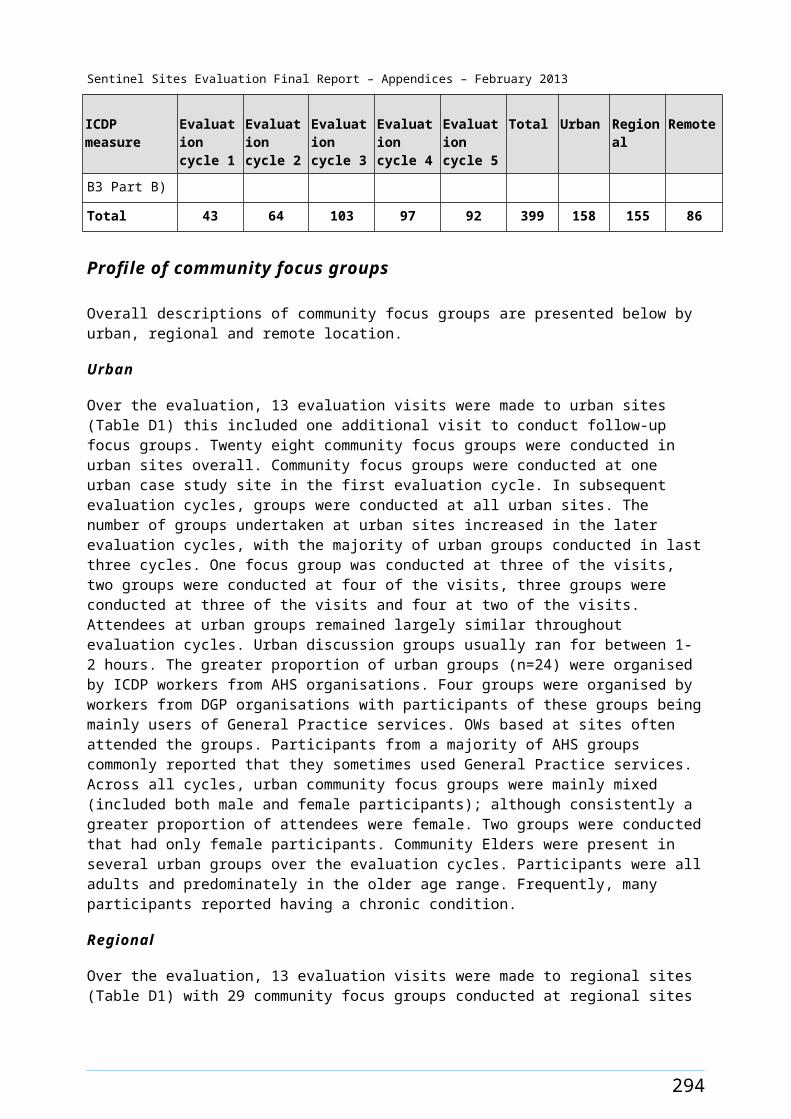
Sentinel Sites Evaluation Final Report – Appendices – February 2013
Table G14: Number of follow-up by allied health professionals (MBS items 81300–81360), claimed for Aboriginal and Torres Strait Islander people aged ≥15 years, for Sentinel Site and the rest of Australia by, gender, age, rurality and quarter, March 2009 - May 2012
Sentinel Sites/ Rest of Australia
Gender Age Group
Mar-May 2009
Jun-Aug 2009
Sep-Nov 2009
Dec 2009-Feb 2010
Mar-May 2010
Jun-Aug 2010
Sep-Nov 2010
Dec 2010-Feb 2011
Mar-May 2011
Jun-Aug 2011
Sep-Nov 2011
Dec 2011-Feb 2012
Mar-May 2012
Urban Sentinel Sites
F 15-54 5 <5 5 <5 <5 20 18 12 18 54 110 59 74M 15-54 <5 <5 7 5 10 21 12 9 15 34 71 31 39F ≥55 9 <5 <5 <5 <5 10 11 5 8 9 41 36 42M ≥55 <5 <5 <5 <5 <5 <5 <5 6 <5 6 12 8 13Total ≥15 17 5 15 8 14 52 45 32 44 103 234 134 168
Rest of urban Australia
F 15-54 12 22 20 22 43 46 64 54 70 120 171 113 152M 15-54 12 21 14 22 24 11 32 52 55 63 106 91 93F ≥55 15 19 27 25 51 33 33 23 56 60 124 45 72M ≥55 6 5 17 12 24 8 30 14 41 46 64 40 57Total ≥15 45 67 78 81 142 98 159 143 222 289 465 289 374
Regional Sentinel Sites
F 15-54 11 5 8 17 46 11 26 35 90 117 104 130 183M 15-54 <5 5 <5 11 15 11 12 27 53 73 73 101 144F ≥55 <5 10 10 8 22 16 11 28 51 65 66 96 151M ≥55 <5 6 <5 <5 11 7 10 19 35 36 41 39 88Total ≥15 16 26 25 39 94 45 59 109 229 291 284 366 566
Rest of regional Australia
F 15-54 38 43 90 114 78 134 219 151 245 255 288 211 337M 15-54 19 22 31 58 32 62 134 95 142 131 129 126 218F ≥55 15 24 37 48 72 77 148 153 181 116 174 193 228M ≥55 6 11 24 45 41 50 101 105 121 87 137 102 138Total ≥15 78 100 182 265 223 323 602 504 689 589 728 632 921
Remote Sentinel Sites
F 15-54 <5 <5 <5 <5 7 <5 <5 <5 <5 <5 <5 5 <5M 15-54 <5 <5 <5 <5 <5 <5 <5 <5 <5 <5 <5 <5 <5F ≥55 <5 <5 <5 <5 <5 <5 <5 <5 <5 <5 <5 <5 <5M ≥55 <5 <5 <5 <5 <5 <5 <5 <5 <5 <5 <5 <5 <5Total ≥15 <5 <5 <5 <5 15 <5 <5 <5 <5 <5 <5 7 <5
Rest of remote Australia
F 15-54 <5 <5 <5 <5 <5 <5 5 <5 19 43 34 19 26M 15-54 <5 <5 <5 <5 <5 <5 <5 <5 11 15 19 <5 11F ≥55 <5 <5 <5 <5 <5 <5 14 <5 5 12 19 22 33M ≥55 5 <5 <5 <5 <5 <5 9 <5 7 11 10 7 17Total ≥15 7 <5 7 8 5 7 29 12 42 81 82 49 87
Note: <5 means that there were less than five claims and for confidentially reasons the data are not presented.
302
Sentinel Sites Evaluation Final Report – Appendices – February 2013
Figure G1: Number of GPs who claimed an adult health assessment (MBS items 704, 706, 710 to 1 May 2010 thereafter 715) per 100 Aboriginal and Torres Strait Islander people aged ≥15 years for urban Sentinel Sites and the rest of urban Australia, by quarter, March 2009 - May 2012
Figure G2: Number of GPs who claimed an adult health assessment (MBS items 704, 706, 710 to 1 May 2010 thereafter 715) per 100 Aboriginal and Torres Strait Islander people aged ≥15 years in regional Sentinel Sites and the rest of regional Australia, by quarter, March 2009 - May 2012
303
Sentinel Sites Evaluation Final Report – Appendices – February 2013
Figure G3: Number of GPs who claimed an adult health assessment (MBS items 704, 706, 710 to 1 May 2010 thereafter 715) per 100 Aboriginal and Torres Strait Islander people aged ≥15 years for remote Sentinel Sites and the rest of remote Australia, by quarter, March 2009 - May 2012
Figure G4: Average number of adult health assessments (MBS items 704, 706, 710 to 1 May 2010 thereafter 715) claimed per GP in urban Sentinel Sites and the rest of urban Australia, by quarter, March 2009 - May 2012
304
Sentinel Sites Evaluation Final Report – Appendices – February 2013
Figure G5: Average number of adult health assessments (MBS items 704, 706, 710 to 1 May 2010 thereafter 715) claimed per GP in regional Sentinel Sites and the rest of regional Australia, by quarter, March 2009 - May 2012
Figure G6: Average number of adult health assessments (MBS items 704, 706, 710 to 1 May 2010 thereafter 715) claimed per GP in remote Sentinel Sites and the rest of remote Australia, by quarter, March 2009 - May 2012
305
Sentinel Sites Evaluation Final Report – Appendices – February 2013
Appendix H. PIP Indigenous Health Incentive
Table H1: Registration for the PBS Co-payment measure among PIP Indigenous Health Incentive registrants in 2010 for Sentinel Sites and the rest of Australia, by rurality, age and gender
Sentinel Sites and the rest of Australia
RegistrantsFemale 15-54 years
Female ≥55 years
Male 15-54 years
Male ≥55 years
Total
Urban Sentinel Sites
PBS and PIP registrants 2207 746 1476 482 4911Total PIP Indigenous Health Incentive registrants 2227 755 1483 484 4949
No. of PBS registrants as a % of PIP registrants 99.10 98.81 99.53 99.59 99.23
Rest of urban Australia
PBS and PIP registrants 6421 2196 4329 1498 14 444Total PIP Indigenous Health Incentive registrants 6464 2216 4357 1508 14545
No. of PBS registrants as a % of PIP registrants 99.33 99.10 99.36 99.34 99.31
Regional Sentinel Sites
PBS and PIP registrants 4562 1743 3305 1299 10 909Total PIP Indigenous Health Incentive registrants 4582 1757 3317 1306 10 962
No. of PBS registrants as a % of PIP registrants 99.56 99.2 99.64 99.46 99.52
Rest of regional Australia
PBS and PIP registrants 10 664 4190 8025 3110 25989Total PIP Indigenous Health Incentive registrants 10 750 4227 8090 3129 26 196
No. of PBS registrants as a % of PIP registrants 99.20 99.12 99.20 99.39 99.21
Remote Sentinel Sites
PBS and PIP registrants 94 59 46 21 220Total PIP Indigenous Health Incentive registrants 204 138 109 62 513
No. of PBS registrants as a % of PIP registrants 46.08 42.75 42.20 33.87 42.88
Rest of remote Australia
PBS and PIP registrants 3948 1781 2690 1340 9759Total PIP Indigenous Health Incentive registrants 4151 1852 2815 1405 10 223
No. of PBS registrants as a % of PIP registrants 95.11 96.17 95.56 95.37 95.46
306
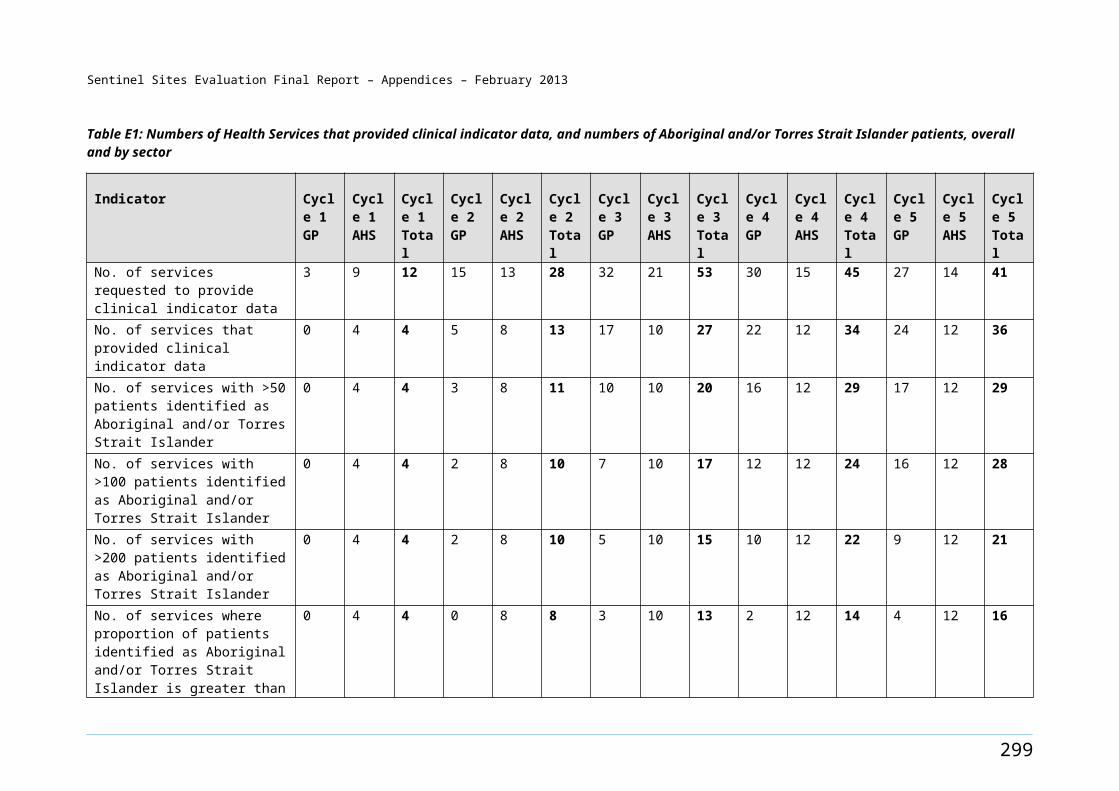
Sentinel Sites Evaluation Final Report – Appendices – February 2013
Table H2: Number of patients registered (PIP Indigenous Health Incentive patient registration payment) in the Sentinel Sites and the rest of Australia by rurality, sector and quarter, March 2010 - May 2012
Sentinel Sites/
Rest of Australia
Health Service
Mar - May 2010
Jun - Aug 2010
Sep - Nov 2010
Dec 2010 - Feb 2011
Mar - May 2011
Jun - Aug 2011
Sep - Nov 2011
Dec 2011 - Feb 2012
Mar - May 2012
Total
Urban Sentinel Sites
General Practice 64 121 200 200 386 391 254 650 680 2946AHS 61 702 518 423 532 288 182 427 522 3655Both 125 823 718 623 918 679 436 1077 1202 6601
Rest of urban Australia
General Practice 45 520 1392 976 1435 1094 687 1257 1456 8862AHS 235 1451 1928 985 1440 872 567 932 1446 9856Both 280 1971 3320 1961 2875 1966 1254 2189 2902 18718
Regional Sentinel Sites
General Practice 32 210 450 367 540 397 245 658 1193 4092AHS 331 1575 1601 1521 1669 1156 511 2035 1224 11623Both 363 1785 2051 1888 2209 1553 756 2693 2417 15715
Rest of regional Australia
General Practice 353 1658 2250 2149 3053 2254 1384 3902 3358 20361AHS 1321 2862 2031 2169 2273 1134 638 2407 2019 16854Both 1674 4520 4281 4318 5326 3388 2022 6309 5377 37215
Remote Sentinel Sites
General Practice <5 <5 <5 <5 9 <5 16 9 42 79AHS 169 <5 120 106 49 110 7 <5 50 611Both 169 <5 123 106 58 110 23 9 92 690
Rest of remote Australia
General Practice 171 410 592 758 576 397 167 995 691 4757AHS 145 721 1595 1327 961 1012 593 1912 1763 10029Both 316 1131 2187 2085 1537 1409 760 2907 2454 14786
Total Sentinel Sites
General Practice 96 331 653 567 935 788 515 1317 1915 7117AHS 561 2277 2239 2050 2250 1554 700 2462 1796 15889Both 657 2608 2892 2617 3185 2342 1215 3779 3711 23006
Rest of total Australia
General Practice 569 2588 4234 3883 5064 3745 2238 6154 5505 33980AHS 1701 5034 5554 4481 4674 3018 1798 5251 5228 36739Both 2270 7622 9788 8364 9738 6763 4036 11405 10733 70719
Note: <5 means that there were less than five claims, and for confidentially reasons the data are not presented.
307
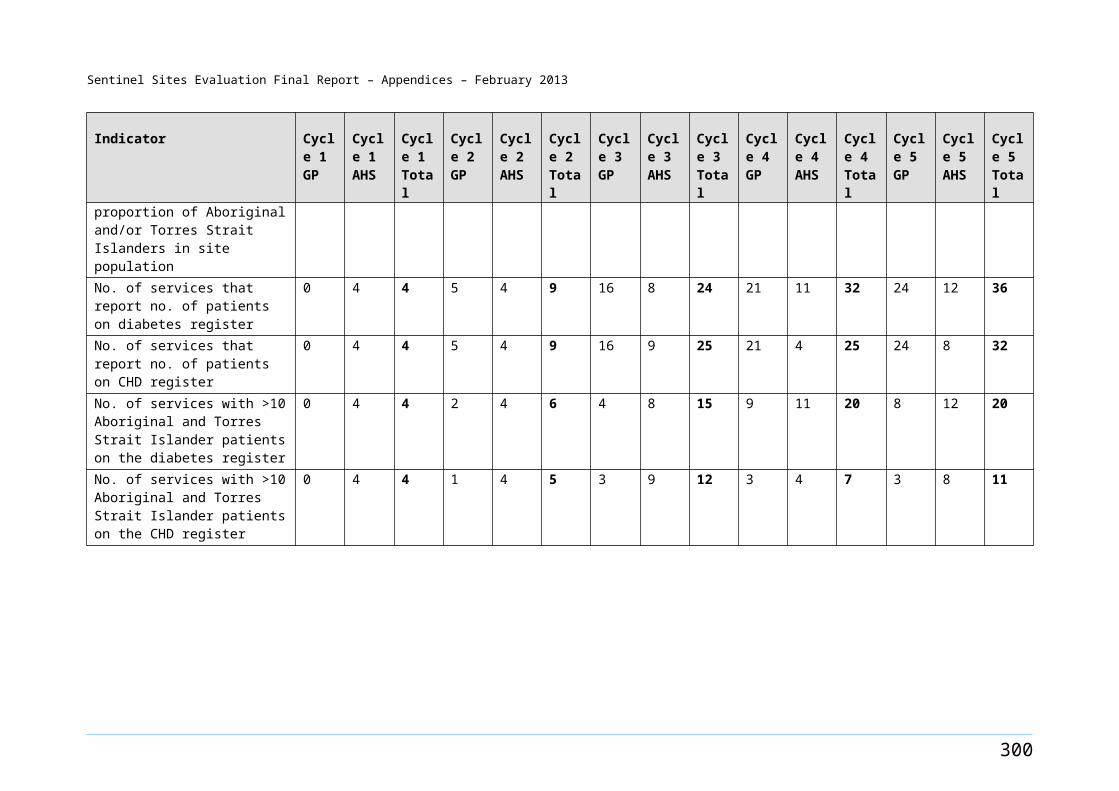
Sentinel Sites Evaluation Final Report – Appendices – February 2013
Table H3: Number of people registered (PIP Indigenous Health Incentive patient registration payment) per 100 Aboriginal and Torres Strait Islander people aged ≥15 years in the Sentinel Sites and the rest of Australia by rurality, sector and quarter, March 2010 - May 2012
Sentinel Sites/Rest of Australia
Health Service
Mar - May 2010
Jun - Aug 2010
Sep - Nov 2010
Dec 2010 - Feb 2011
Mar - May 2011
Jun - Aug 2011
Sep - Nov 2011
Dec 2011 - Feb 2012
Mar - May 2012
Urban Sentinel Sites
General Practice 0.26 0.50 0.82 0.82 1.56 1.58 1.02 2.62 2.69AHS 0.25 2.88 2.13 1.74 2.15 1.16 0.73 1.72 2.07Both 0.51 3.38 2.95 2.56 3.70 2.74 1.76 4.34 4.76
Rest of urban Australia
General Practice 0.06 0.68 1.83 1.28 1.85 1.41 0.89 1.62 1.84AHS 0.31 1.91 2.53 1.29 1.86 1.12 0.73 1.20 1.83Both 0.37 2.59 4.36 2.58 3.7 2.53 1.62 2.82 3.67
Regional Sentinel Sites
General Practice 0.12 0.76 1.62 1.32 1.91 1.40 0.87 2.33 4.15AHS 1.19 5.67 5.76 5.48 5.9 4.09 1.81 7.20 4.26Both 1.31 6.43 7.38 6.80 7.82 5.49 2.67 9.53 8.41
Rest of regional Australia
General Practice 0.34 1.61 2.18 2.08 2.90 2.14 1.32 3.71 3.13AHS 1.28 2.77 1.97 2.10 2.16 1.08 0.61 2.29 1.88Both 1.62 4.38 4.15 4.19 5.06 3.22 1.92 6.00 5.01
Remote Sentinel Sites
General Practice 0.00 0.00 0.04 0.00 0.11 0.00 0.20 0.11 0.52AHS 2.15 0.00 1.53 1.35 0.61 1.38 0.09 0.00 0.62Both 2.15 0.00 1.56 1.35 0.73 1.38 0.29 0.11 1.13
Rest of remote Australia
General Practice 0.25 0.60 0.87 1.12 0.83 0.57 0.24 1.44 0.98AHS 0.21 1.06 2.35 1.96 1.39 1.46 0.86 2.77 2.5Both 0.47 1.67 3.22 3.07 2.22 2.04 1.10 4.21 3.49
Total Sentinel Sites
General Practice 0.16 0.55 1.09 0.95 1.53 1.29 0.84 2.16 3.08AHS 0.94 3.80 3.73 3.42 3.68 2.54 1.15 4.03 2.89Both 1.10 4.35 4.82 4.36 5.22 3.84 1.99 6.19 5.97
Rest of total Australia
General Practice 0.23 1.05 1.71 1.57 2.01 1.49 0.89 2.44 2.14AHS 0.69 2.04 2.25 1.81 1.86 1.20 0.71 2.08 2.04Both 0.92 3.08 3.96 3.39 3.87 2.68 1.60 4.53 4.18
308
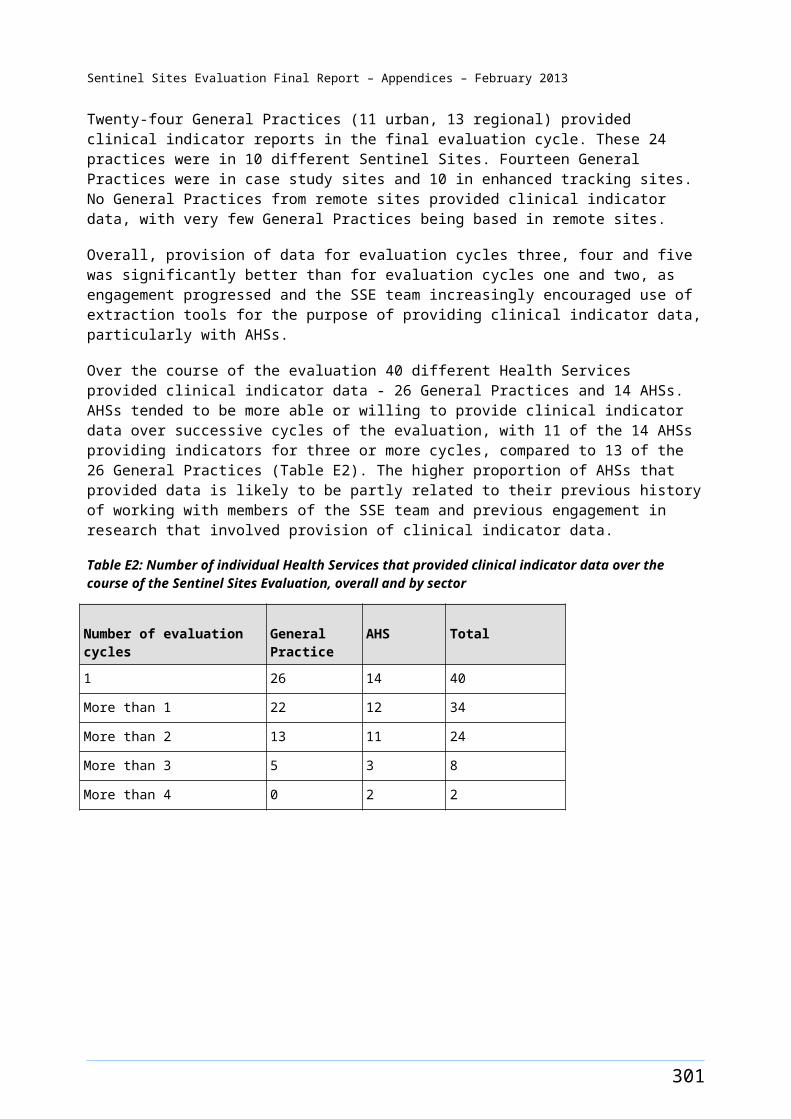
Sentinel Sites Evaluation Final Report – Appendices – February 2013
Table H4: Number of people for whom Tier 1 and Tier 2 PIP Indigenous Health Incentive payments were made, by sector in 2010 and 2011
Sentinel Sites/
Rest of Australia
Health Service
Neither Tier 1 or Tier 2 2010
Tier 1 only 2010
Tier 2 only 2010
Tier1 & Tier2 2010
Neither Tier 1 or Tier 2 2011
Tier 1 only 2011
Tier 2 only 2011
Tier 1 & Tier 2 2011
Urban Sentinel Sites
General Practice 97 <5 364 40 268 <5 974 207AHS 457 <5 960 54 548 <5 906 98Both 554 <5 1324 94 816 5 1880 305
Rest of urban Australia
General Practice 634 9 1636 176 1198 15 2926 538AHS 1397 <5 2876 73 1602 <5 2313 197Both 2031 11 4512 249 2800 18 5239 735
Regional Sentinel Sites
General Practice 177 <5 647 62 364 6 1060 273AHS 1488 <5 2804 85 1553 25 3075 441Both 1665 5 3451 147 1917 31 4135 714
Rest of regional Australia
General Practice 1304 11 3685 322 2464 45 5873 1496AHS 2265 9 4625 329 2312 22 3788 797Both 3569 20 8310 651 4776 67 9661 2293
Remote Sentinel Sites
General Practice <5 <5 <5 <5 9 <5 17 <5AHS 82 <5 240 30 157 <5 106 22Both 82 <5 243 30 166 <5 123 22
Rest of remote Australia
General Practice 428 6 911 165 685 <5 1202 352AHS 1075 <5 1847 260 1417 18 2331 555Both 1503 8 2758 425 2102 22 3533 907
Total Sentinel Sites
General Practice 274 <5 1014 102 641 9 2051 480AHS 2027 6 4004 169 2258 27 4087 561Both 2301 9 5018 271 2899 36 6138 1041
Rest of total Australia
General Practice 2366 26 6232 663 4347 64 10001 2386AHS 4737 13 9348 662 5331 43 8432 1549Both 7103 39 15580 1325 9678 107 18433 3935
Note: <5 means that there were less than five claims, and for confidentially reasons the data are not presented.
309
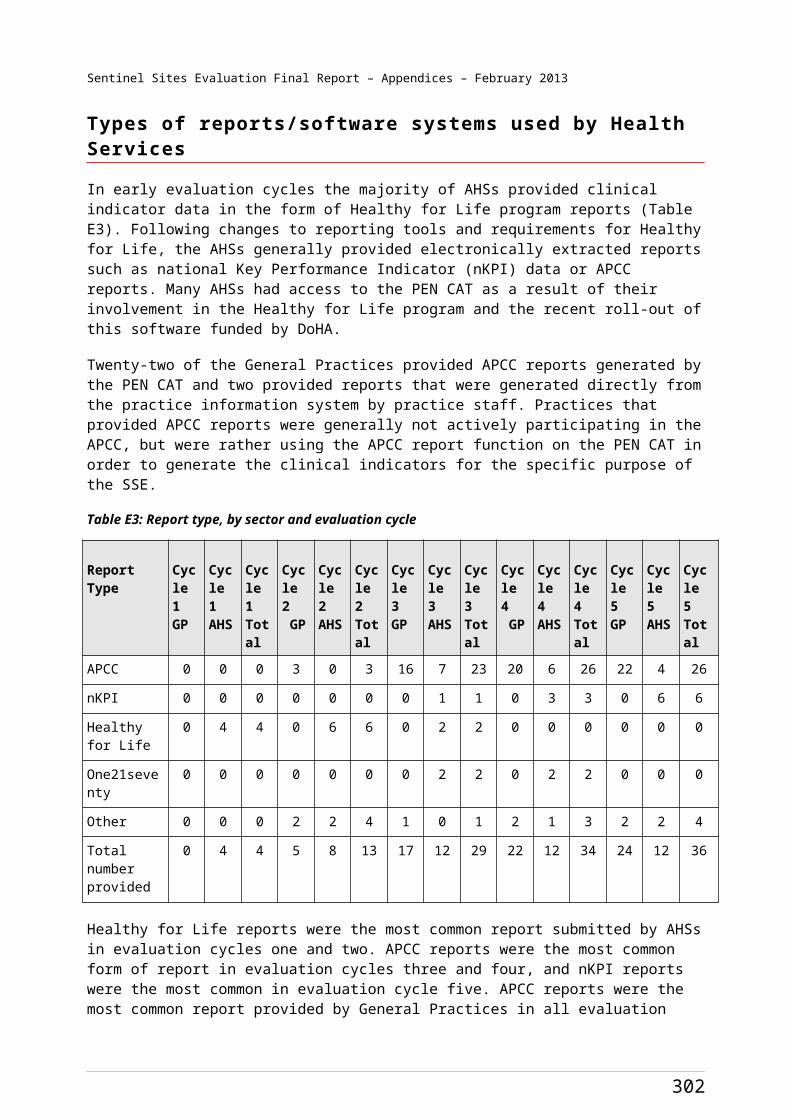
Sentinel Sites Evaluation Final Report – Appendices – February 2013
Table H5: Percentage of people for whom Tier 1 and Tier 2 PIP Indigenous Health Incentive payments were made by sector in 2010 and 2011
Sentinel Sites/
Rest of Australia
Health Service
Neither Tier 1 or Tier 2 2010
Tier 1 only in 2010
Tier 2 only in 2010
Tier1 & Tier2 in 2010
Neither Tier 1 or Tier 2 2011
Tier 1 only 2011
Tier 2 only 2011
Tier1 & Tier2 2011
Urban Sentinel Sites
General Practice 19.32 0.20 72.51 7.97 18.46 0.21 67.08 14.26AHS 31.03 0.14 65.17 3.67 35.26 0.13 58.30 6.31Both 28.05 0.15 67.04 4.76 27.15 0.17 62.54 10.15
Rest of urban Australia
General Practice 25.82 0.37 66.64 7.17 25.61 0.32 62.56 11.50AHS 32.13 0.05 66.15 1.68 38.93 0.07 56.21 4.79Both 29.85 0.16 66.32 3.66 31.85 0.20 59.59 8.36
Regional Sentinel Sites
General Practice 19.93 0.23 72.86 6.98 21.37 0.35 62.24 16.03AHS 33.97 0.07 64.02 1.94 30.49 0.49 60.37 8.66Both 31.61 0.09 65.51 2.79 28.20 0.46 60.84 10.50
Rest of regional Australia
General Practice 24.50 0.21 69.24 6.05 24.94 0.46 59.46 15.14AHS 31.34 0.12 63.99 4.55 33.42 0.32 54.75 11.52Both 28.44 0.16 66.22 5.19 28.43 0.40 57.52 13.65
Remote Sentinel Sites
General Practice 0.00 0.00 100.00 0.00 34.62 0.00 65.38 0.00AHS 23.23 0.28 67.99 8.50 55.09 0.00 37.19 7.72Both 23.03 0.28 68.26 8.43 53.38 0.00 39.55 7.07
Rest of remote Australia
General Practice 28.34 0.40 60.33 10.93 30.54 0.18 53.59 15.69AHS 33.76 0.06 58.01 8.17 32.79 0.42 53.95 12.84Both 32.02 0.17 58.76 9.05 32.02 0.34 53.82 13.82
Total Sentinel Sites
General Practice 19.67 0.22 72.79 7.32 20.15 0.28 64.48 15.09AHS 32.66 0.10 64.52 2.72 32.57 0.39 58.95 8.09Both 30.28 0.12 66.04 3.57 28.66 0.36 60.69 10.29
Rest of total Australia
General Practice 25.48 0.28 67.1 7.14 25.88 0.38 59.54 14.2AHS 32.09 0.09 63.33 4.49 34.72 0.28 54.91 10.09Both 29.54 0.16 64.79 5.51 30.10 0.33 57.33 12.24
310
Sentinel Sites Evaluation Final Report – Appendices – February 2013
Table H6: Three quarter rolling averages of Tier 1 payments for Sentinel Sites and the rest of Australia, by rurality and sector, 2010-2012
Sentinel Sites/Rest of Australia
Health Service
Sep - Nov 2010
Dec 2010 - Feb 2011
Mar - May 2011
Jun - Aug 2011
Sep - Nov 2011
Dec 2011 - Feb 2012
Mar - May 2012
Urban Sentinel Sites
General Practice 14 14 40 55 75 69 73
AHS 20 10 10 18 31 44 53Both 34 24 50 73 106 113 126
Rest of urban Australia
General Practice 68 64 110 153 202 163 147
AHS 29 22 22 38 58 49 33Both 97 86 132 191 260 212 180
Regional Sentinel Sites
General Practice 25 25 42 72 102 94 81
AHS 33 32 63 101 144 115 93Both 58 57 105 173 246 209 174
Rest of regional Australia
General Practice 128 99 251 412 563 485 432
AHS 122 57 139 194 256 239 254Both 250 156 390 606 819 724 686
Remote Sentinel Sites
General Practice <5 <5 <5 <5 <5 <5 <5AHS 11 7 11 7 7 <5 <5Both 11 7 11 7 7 <5 <5
Rest of remote Australia
General Practice 67 44 72 98 124 107 95AHS 100 83 94 133 183 175 169Both 167 127 166 231 307 282 264
Total Sentinel Sites
General Practice 39 38 82 127 178 163 154
AHS 64 49 83 126 182 160 147Both 103 87 165 253 360 323 301
Rest of total Australia
General Practice 263 208 433 664 889 755 675
AHS 251 162 255 366 497 463 456Both 514 370 688 1030 1386 1218 1131
Note: <5 means that there were less than five claims, and for confidentially reasons the data are not presented.
311
Sentinel Sites Evaluation Final Report – Appendices – February 2013
Table H7: Three quarter rolling averages of Tier 1 payments per 100 Aboriginal and Torres Strait Islander people for Sentinel Sites and the rest of Australia, by rurality and sector 2010-2012
Sentinel Sites/
Rest of Australia
Health Service
Sep - Nov 2010
Dec 2010 - Feb 2011
Mar - May 2011
Jun - Aug 2011
Sep - Nov 2011
Dec 2011 - Feb 2012
Mar - May 2012
Urban Sentinel Sites
General Practice 0.06 0.06 0.16 0.22 0.30 0.28 0.29AHS 0.08 0.04 0.04 0.07 0.12 0.18 0.21Both 0.14 0.10 0.20 0.29 0.43 0.46 0.50
Rest of urban Australia
General Practice 0.09 0.08 0.14 0.20 0.26 0.21 0.19AHS 0.04 0.03 0.03 0.05 0.07 0.06 0.04Both 0.13 0.11 0.17 0.25 0.34 0.27 0.23
Regional Sentinel Sites
General Practice 0.09 0.09 0.15 0.25 0.36 0.33 0.28AHS 0.12 0.12 0.22 0.36 0.51 0.41 0.32Both 0.21 0.21 0.37 0.61 0.87 0.74 0.61
Rest of regional Australia
General Practice 0.12 0.10 0.24 0.39 0.54 0.46 0.40AHS 0.12 0.06 0.13 0.18 0.24 0.23 0.24Both 0.24 0.15 0.37 0.58 0.78 0.69 0.64
Remote Sentinel Sites
General Practice 0.00 0.00 0.00 0.00 0.00 0.00 0.00AHS 0.14 0.09 0.14 0.09 0.09 0.01 0.01Both 0.14 0.09 0.14 0.09 0.09 0.01 0.01
Rest of remote Australia
General Practice 0.10 0.06 0.10 0.14 0.18 0.15 0.13AHS 0.15 0.12 0.14 0.19 0.26 0.25 0.24Both 0.25 0.19 0.24 0.33 0.44 0.41 0.37
Total Sentinel Sites
General Practice 0.07 0.06 0.13 0.21 0.29 0.27 0.25AHS 0.11 0.08 0.14 0.21 0.30 0.26 0.24Both 0.17 0.15 0.27 0.41 0.59 0.53 0.48
Rest of total Australia
General Practice 0.11 0.08 0.17 0.26 0.35 0.30 0.26AHS 0.10 0.07 0.10 0.15 0.20 0.18 0.18Both 0.21 0.15 0.27 0.41 0.55 0.48 0.44
312
Sentinel Sites Evaluation Final Report – Appendices – February 2013
Appendix I. Relationships between use of ICDP related services and intensity of intervention and contextual factors
Introduction and methods
The relationship between variables that reflect use of ICDP related services and the intensity of the intervention in terms of number of ICDP workers (per 10 000 Aboriginal and Torres Strait Islander people in the population) was examined using bivariate descriptive statistics. Specifically, we examined the relationships between the number of ICDP workers (end of June 2011) and service use variables at the March - May 2012 quarter (unless otherwise specified). We also examined associations between key contextual variables and service use variables at March - May 2012.
Service use variables were:
PIP Indigenous Health Incentive registration per 100 Aboriginal and Torres Strait Islander people (March - May 2012 quarter)
Tier 1 payments per 100 Aboriginal and Torres Strait Islander people (December 2011 - May 2012)
Tier 2 payments for services in 2011 per 100 Aboriginal and Torres Strait Islander people
adult health assessments (MBS items 704, 706, 710 to 1 May 2010 thereafter 715) per 100 Aboriginal and Torres Strait Islander people (March - May 2012 quarter)
follow-up allied health services (MBS items 81300-81360) per 100 Aboriginal and Torres Strait Islander people (March - May 2012 quarter)
follow-up services provided by a practice nurse or registered AHW (MBS item 10987) per 100 Aboriginal and Torres Strait Islander people (March – May 2012 quarter)
patients accessing the PBS Co-payment measure per 100 Aboriginal and Torres Strait Islander people (March - May 2012 quarter).
The types of ICDP workers included in the analysis included IHPOs in DGPs and OWs in DGPs and AHSs, as these are the workers whose roles relate most directly to the service use variables identified above. The analysis does not include workers who were recruited after June 2011, as workers employed later than this date are unlikely to have been in the positions long enough to influence health service use within the timeframes of available service use data.
Contextual variables examined were:
Socio-Economic Indexes for Areas (SEIFA) average
per cent of solo practices (2010-2011)
GP to population ratio (2010)
Enhanced Primary Care144 items as a proxy measure of use of pre-existing MBS items that have been designed to support preventive care and care for people with complex care needs
percentage of Health Services using practice nurse items.
144 DoHA, MBS Primary Care Items [website] (accessed 9 June 2012).
313
Sentinel Sites Evaluation Final Report – Appendices – February 2013
The SEIFA index was included in the analysis to determine if socio-economic conditions in the site might have an influence on impact of the ICDP as reflected by the various impact variables included in the analysis. Similarly, the percentage of solo practices in the DGP where the site is located was included in the analysis to determine if potential impact of the ICDP may be affected by having a large proportion of solo practices. The percentage of solo practices also provides a proxy measure of the relative proportion of small practices as opposed to larger practices in the DGP. The GP to population ratio is included to measure the relative availability of GPs in each area.
Findings and interpretation
Analysis of service use variables in relation to contextual variables
None of the contextual factors were significantly associated with the service use variables. The lack of statistically significant associations between the contextual variables and service use variables may be a consequence of the small numbers of sites and/or unmeasured and uncontrolled confounding factors.
Analysis of service use variables in relation to number of ICDP workers
There was a significant correlation between the number of ICDP workers at the end of June 2011 and:
the number of GPs relative to population in 2010 (rho=-0.44, p=0.03). Note that this is a negative correlation. The relatively greater allocation of new workers to sites with fewer GPs may reflect appropriate allocation of resources to bolster PHC services in locations of GP shortage, and to provide support to GPs working in these locations.
There was a negative correlation between the SEIFA index and ICDP workers in urban sites (i.e. more workers in lower socio-economic urban areas than in higher socio-economic urban areas), and a positive correlation in regional sites (i.e. fewer workers in lower socio-economic regional areas than in higher socio-economic regional areas). This suggests it may be useful to review the extent to which workers are being allocated to areas of need, particularly in regional sites.
the number of follow-up services provided by allied health professionals per 100 Aboriginal and Torres Strait Islander people in March - May 2012 (rho=0.55, p=0.005) (Figure I1). There was also a significant relationship between the number of follow-up services provided by allied health professionals per 100 Aboriginal and Torres Strait Islander people in September - November 2011 (rho=0.53, p=0.01) and the number of ICDP workers recruited at the end of February 2011.
the number of PIP Tier 1 payments made per 100 Aboriginal and Torres Strait Islander people in December 2011 - May 2012 (rho=0.46, p=0.03) (Figure I2). This relationship was not observed in earlier reports, possibly because of the low number of Tier 1 payments.
No other correlations between the intensity of the intervention (as reflected by number of ICDP workers) or any of the other service use variables were statistically significant. In earlier analyses there were significant relationships between the number of ICDP workers recruited at February 2011 and the number of adult health assessments in September – November 2011 (rho=0.46 p=0.02) and PBS Co-payment measure per 100 Aboriginal and Torres Strait Islander people in September - November 2011 compared to September – November 2010 (rho=0.45, p=0.03).
The limited number of sites and the lack of good data on potential confounding factors limit the potential for more sophisticated quantitative analysis and we cannot exclude the possibility that the observed associations are a result of confounding. Nevertheless, the results suggest that the IHPOs and
314

Sentinel Sites Evaluation Final Report – Appendices – February 2013
OWs may initially have had an influence on the uptake of adult health assessments and PBS Co-payment measure use, and more recently have had an influence on the uptake of measures that are designed to enhance access to and quality of multidisciplinary and team based approaches to chronic illness care (as reflected by Tier 1 payments).
Figure I1: Follow-up allied health services (MBS items 81300-81360) per 100 Aboriginal and Torres Strait Islander people aged ≥15 years March - May 2012 quarter in relation to the number of ICDP workers by end of June 2011
315
Sentinel Sites Evaluation Final Report – Appendices – February 2013
Figure I2: Tier 1 payments per 100 Aboriginal and Torres Strait Islander people (December 2011 - May 2012) in relation to the number of ICDP workers by end of June 2011
While there are some interesting and to some extent encouraging associations between the intensity of the intervention and the uptake of some Medicare items relevant to the ICDP, the timeframes within which the ICDP workers might be expected to influence these trends, the timing of increasing trends and the difficulty of identifying and accounting for confounding or contextual factors in this analysis mean we cannot be confident about the extent to which these associations may reflect causal relationships. The qualitative data and cross site comparative analysis presented in the main body of the report aims to provide further insight into these complex relationships.
An important limitation of the statistical analysis presented here is the probability that observed associations are at least partly the result of confounding by other variables. The allocation of new worker positions funded through the ICDP has not been random, rather it has been based on a variety of considerations including local needs and service performance and capability. Uptake/delivery of ICDP related services (as described above) is probably strongly related to service performance and capability and to local needs. The various factors that underlie service performance and capability and local needs are therefore almost certainly causing some degree of confounding in the associations that have been examined in the analysis presented here. Many of these factors are difficult to define and difficult to measure and therefore cannot be controlled for in a statistical analysis. Even for potential confounders that could be defined and measured, the numbers of Sentinel Sites for which we have data places serious constraints on the potential for multivariate analysis. It is also evident from the other sections of this report that the wide variation between use of ICDP related services between sites is due to local organisational factors, including organisational capability, teamwork, capability of individual staff members and relationships between service organisations and Aboriginal and Torres Strait Islander people in the site population. These are all factors that are difficult to define and measure and therefore difficult to account for in statistical models.
It is notable that none of the service use variables are associated with the contextual variables included in the above statistical analysis, indicating that the influence of these variables is not strong enough to show a statistically significant association, that measurement of these variables is not sufficiently precise, or because of confounding by other variables. It is particularly interesting that the GP to population ratio or the percentage of solo practices does not show a statistical association with the service use variables, as the supply of GPs and the presence of larger practices might be expected to be associated with higher uptake or delivery of relevant MBS items. Similarly, it might be expected that the use of Aboriginal and Torres Strait Islander specific MBS items would be higher among Health Services that are focused on delivering similar MBS items designed to support preventive care and care for all people with complex care needs and use of practice nurse items would be associated with higher use of similar. This expectation is also not reflected in the analysis presented here.
Analysis of the relationship between different service use variables
Table I1 shows the relationships between service use variables for the most recent quarter of available data. It is important to understand that this is an ‘ecological’ analysis, where the relationships being examined are at the site level, and are based on patterns of use of ICDP-related services for all Heath Services (and for all patients who receive such services) within each site. The data provided to the SSE was not in a form that allowed comparisons of use of ICDP-related services between individual services or between individual patients. This places important limitations on the interpretation of the data. The key points that emerge from the analysis include:
316
Sentinel Sites Evaluation Final Report – Appendices – February 2013
Billing for adult health assessments in the final quarter were not associated with any of the other types of payments or incentives in this quarter. It is notable that higher use of adult health assessments is not associated with higher use of follow-up items. This suggests that at a site level and at this stage of implementation delivery of adult health assessment is not in general being followed up to any substantial degree by follow-up care through delivery of MBS related follow-up items. It is also notable that higher use of adult health assessments is not associated with higher levels of Tier 2 payments, suggesting that delivery of adult health assessments are not substantially associated with higher levels of regular care accessed through a single provider (as reflected in Tier 2 payments).
Registrations for the PIP Indigenous Health Incentive showed statistically significant associations with Tier 1 and Tier 2 payments, and had borderline statistically significant associations with dispensing of PBS Co-payment measure prescriptions. The association between PIP registrations and Tier 1 and Tier 2 payments is as expected. However, the weak association between PIP Indigenous Health Incentive registrations and PBS Co-payments suggests that at a site level many patients are being registering for and accessing PBS Co-payments, but are not being registered for the PIP Indigenous Health Incentive – if all patients accessing the PBS Co-payment measure were also registered for the PIP Indigenous Health Incentive this association would be expected to be stronger.
Follow-up services by an allied health professional showed statistically significant associations with Tier 1 payments and with the PBS Co-payment measure, and showed borderline statistically significant associations with Tier 2 payments and with the PIP Indigenous Health Incentive registrations. These associations are consistent with expectations that patients who are more likely to receive care through the MBS item for follow-up allied health services are also more likely to be registered for the PIP Indigenous Health Incentive, to receive the type of care associated with Tier 1 and Tier 2 payments, and to access the benefits available through the PBS Co-payment measure. The associations indicate that in sites where more patients are accessing MBS items for follow-up services for allied health professionals, more patients are using primary care providers who are registering patients for the PIP Indigenous Health Incentive and providing other ICDP-related services.
Follow-up services by a nurse or registered AHW were associated only with the PBS Co-payment measure, and there was no association between follow-up services by nurse or registered AHW and follow-up services by an allied health professional. The lack of association between follow-up services by a nurse or registered AHW and registrations for the PIP Indigenous Health Incentive and Tier 1 or Tier 2 payments suggests these items are being used in sites where some services have a specific interest in such follow-up care, and relatively limited interest or capacity to make use of other ICDP-related benefits through the MBS.
Tier 2 payments were statistically significantly associated with the PBS Co-payment measure. This is as expected, with sites where patients are registered for the PIP Indigenous Health Incentive and who are accessing primary health care services more frequently for chronic illness care (reflected in Tier 2 payments) also have more patients accessing mediations regularly through the PBS Co-payment measure.
Tier 1 payments were not significantly association with Tier 2 or with the PBS Co-payment measure. The lack of association between these variables is not surprising, as Tier 1 payments reflect a particular approach to care and to billing for MBS items, while Tier 2 payments and access to the PBS Co-payment measure are simply reflective of relatively frequent use of services and medications.
317
Sentinel Sites Evaluation Final Report – Appendices – February 2013
Table I1: Correlations between services use variables
Number of services per 100 Aboriginal and Torres Strait Islander people
Correlation and significance
Adult health assessment (March - May 2012)
Follow-up allied health professional (March - May 2012)
Follow-up nurse or registered Aboriginal Health worker (March - May 2012)
PIP Indigenous Health Incentive registration (March - May 2012)
Tier 1 (Dec 2011 - May 2012)
Tier 2 2011 Patients accessing PBS Co-payment measure(March - May 2012)
Adult health assessment (March - May 2012)
rho 1.000 - - - - - -P . - - - - - -
Follow-up allied health professional(March - May 2012)
rho -.143 1.000 - - - - -P .505 . - - - - -
Follow-up nurse or registered Aboriginal Health Worker(March - May 2012)
rho .349 .296 1.000 - - - -P .143 .219 . - - - -
PIP Indigenous Health Incentive registration (March - May 2012)
rho -.134 .398 .443 1.000 - - -P .541 .060 .066 . - - -
Tier 1 (December 2011 - May 2012)
rho -.348 .552 -.102 .442 1.000 - -P .103 .006 .687 .035 . - -
Tier 2 2011rho -.214 .410 .278 .648 .343 1.000 -P .327 .052 .265 .001 .109 . -
Patients accessing PBS Co-payment measure(March - May 2012)
rho -.134 .485 .474 .398 .198 .542 1.000P .531 .016 .040 .060 .365 .008 -
Note: ‘rho’ - Spearman’s correlation co-efficient is the non-parametric association between two variables. A value of 1 indicates that the decrease or increase between the two variables is perfectly matched. A value of 0 indicates that there is no relationship. The sign indicates the direction of the relationship. ‘p’- is the probability of finding that there is a relationship between two variables when there actually is not.
318